Abiotic and Biotic TNT Transformations - Defense Technical ...
Upload
khangminh22Category
view
0download
0
Edited by
Study of the Influence of Abiotic and Biotic Stress Factors on Horticultural Plants
Agnieszka Hanaka, Jolanta Jaroszuk-Ściseł and Małgorzata Majewska
Printed Edition of the Special Issue Published in Horticulturae
www.mdpi.com/journal/horticulturae

Study of the Influence of Abioticand Biotic Stress Factors onHorticultural Plants


Study of the Influence of Abioticand Biotic Stress Factors onHorticultural Plants
Editors
Agnieszka Hanaka
Jolanta Jaroszuk-Sciseł
Małgorzata Majewska
MDPI • Basel • Beijing • Wuhan • Barcelona • Belgrade • Manchester • Tokyo • Cluj • Tianjin

Editors
Agnieszka Hanaka
Maria Curie-Skłodowska
University
Poland
Jolanta Jaroszuk-Sciseł
Maria Curie-Skłodowska
University
Poland
Małgorzata Majewska
Maria Curie-Skłodowska
University
Poland
Editorial Office
MDPI
St. Alban-Anlage 66
4052 Basel, Switzerland
This is a reprint of articles from the Special Issue published online in the open access journal
Horticulturae (ISSN 2311-7524) (available at: https://www.mdpi.com/journal/horticulturae/special
issues/Abiotic Biotic Stress Factors).
For citation purposes, cite each article independently as indicated on the article page online and as
indicated below:
LastName, A.A.; LastName, B.B.; LastName, C.C. Article Title. Journal Name Year, Volume Number,
Page Range.
ISBN 978-3-0365-3112-0 (Hbk)
ISBN 978-3-0365-3113-7 (PDF)
Cover image courtesy of Małgorzata Majewska and Agnieszka Hanaka
© 2022 by the authors. Articles in this book are Open Access and distributed under the Creative
Commons Attribution (CC BY) license, which allows users to download, copy and build upon
published articles, as long as the author and publisher are properly credited, which ensures maximum
dissemination and a wider impact of our publications.
The book as a whole is distributed by MDPI under the terms and conditions of the Creative Commons
license CC BY-NC-ND.
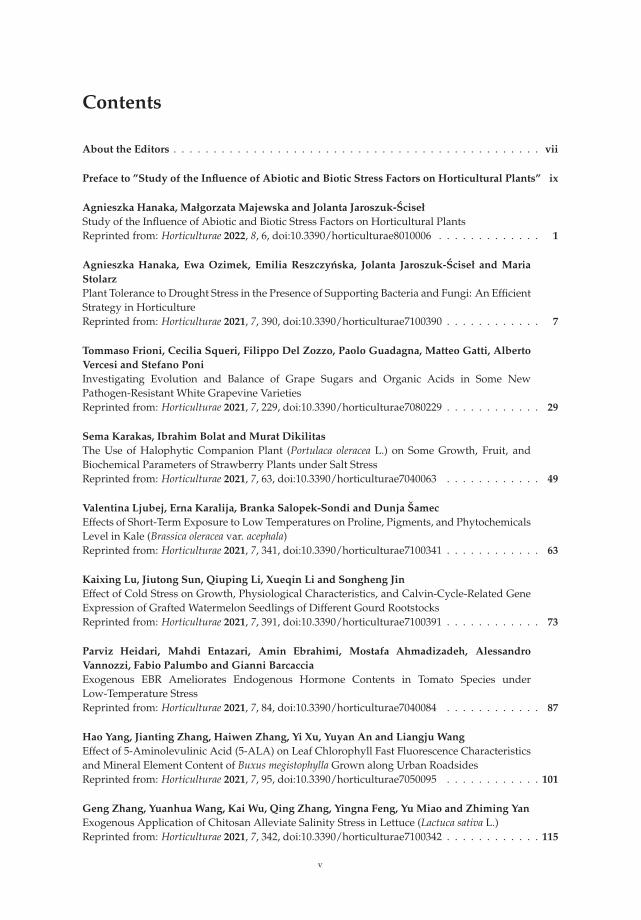
Contents
About the Editors . . . . . . . . . . . . . . . . . . . . . . . . . . . . . . . . . . . . . . . . . . . . . . vii
Preface to ”Study of the Influence of Abiotic and Biotic Stress Factors on Horticultural Plants” ix
Agnieszka Hanaka, Małgorzata Majewska and Jolanta Jaroszuk-Sciseł
Study of the Influence of Abiotic and Biotic Stress Factors on Horticultural PlantsReprinted from: Horticulturae 2022, 8, 6, doi:10.3390/horticulturae8010006 . . . . . . . . . . . . . 1
Agnieszka Hanaka, Ewa Ozimek, Emilia Reszczynska, Jolanta Jaroszuk-Sciseł and Maria
Stolarz
Plant Tolerance to Drought Stress in the Presence of Supporting Bacteria and Fungi: An EfficientStrategy in HorticultureReprinted from: Horticulturae 2021, 7, 390, doi:10.3390/horticulturae7100390 . . . . . . . . . . . . 7
Tommaso Frioni, Cecilia Squeri, Filippo Del Zozzo, Paolo Guadagna, Matteo Gatti, Alberto
Vercesi and Stefano Poni
Investigating Evolution and Balance of Grape Sugars and Organic Acids in Some NewPathogen-Resistant White Grapevine VarietiesReprinted from: Horticulturae 2021, 7, 229, doi:10.3390/horticulturae7080229 . . . . . . . . . . . . 29
Sema Karakas, Ibrahim Bolat and Murat Dikilitas
The Use of Halophytic Companion Plant (Portulaca oleracea L.) on Some Growth, Fruit, andBiochemical Parameters of Strawberry Plants under Salt StressReprinted from: Horticulturae 2021, 7, 63, doi:10.3390/horticulturae7040063 . . . . . . . . . . . . 49
Valentina Ljubej, Erna Karalija, Branka Salopek-Sondi and Dunja Samec
Effects of Short-Term Exposure to Low Temperatures on Proline, Pigments, and PhytochemicalsLevel in Kale (Brassica oleracea var. acephala)Reprinted from: Horticulturae 2021, 7, 341, doi:10.3390/horticulturae7100341 . . . . . . . . . . . . 63
Kaixing Lu, Jiutong Sun, Qiuping Li, Xueqin Li and Songheng Jin
Effect of Cold Stress on Growth, Physiological Characteristics, and Calvin-Cycle-Related GeneExpression of Grafted Watermelon Seedlings of Different Gourd RootstocksReprinted from: Horticulturae 2021, 7, 391, doi:10.3390/horticulturae7100391 . . . . . . . . . . . . 73
Parviz Heidari, Mahdi Entazari, Amin Ebrahimi, Mostafa Ahmadizadeh, Alessandro
Vannozzi, Fabio Palumbo and Gianni Barcaccia
Exogenous EBR Ameliorates Endogenous Hormone Contents in Tomato Species underLow-Temperature StressReprinted from: Horticulturae 2021, 7, 84, doi:10.3390/horticulturae7040084 . . . . . . . . . . . . 87
Hao Yang, Jianting Zhang, Haiwen Zhang, Yi Xu, Yuyan An and Liangju Wang
Effect of 5-Aminolevulinic Acid (5-ALA) on Leaf Chlorophyll Fast Fluorescence Characteristicsand Mineral Element Content of Buxus megistophylla Grown along Urban RoadsidesReprinted from: Horticulturae 2021, 7, 95, doi:10.3390/horticulturae7050095 . . . . . . . . . . . . 101
Geng Zhang, Yuanhua Wang, Kai Wu, Qing Zhang, Yingna Feng, Yu Miao and Zhiming Yan
Exogenous Application of Chitosan Alleviate Salinity Stress in Lettuce (Lactuca sativa L.)Reprinted from: Horticulturae 2021, 7, 342, doi:10.3390/horticulturae7100342 . . . . . . . . . . . . 115
v

Maria Maleva, Galina Borisova, Nadezhda Chukina, Olga Sinenko, Elena Filimonova,
Natalia Lukina and Margarita Glazyrina
Adaptive Morphophysiological Features of Neottia ovata (Orchidaceae) Contributing to ItsNatural Colonization on Fly Ash DepositsReprinted from: Horticulturae 2021, 7, 109, doi:10.3390/horticulturae7050109 . . . . . . . . . . . . 133
Richard Dormatey, Chao Sun, Kazim Ali, Tianyuan Qin, Derong Xu, Zhenzhen Bi and
Jiangping Bai
Influence of Phosphite Supply in the MS Medium on Root Morphological Characteristics, FreshBiomass and Enzymatic Behavior in Five Genotypes of Potato (Solanum tuberosum L.)Reprinted from: Horticulturae 2021, 7, 265, doi:10.3390/horticulturae7090265 . . . . . . . . . . . . 151
Sandra Afonso, Margarida Arrobas and Manuel Angelo Rodrigues
Twenty-Years of Hop Irrigation by Flooding the Inter-Row Did Not Cause a Gradient along theRow in Soil Properties, Plant Elemental Composition and Dry Matter YieldReprinted from: Horticulturae 2021, 7, 194, doi:10.3390/horticulturae7070194 . . . . . . . . . . . . 171
Chen Ru, Xiaotao Hu *, Wene Wang, Hui Ran, Tianyuan Song and Yinyin Guo
Signal Intensity of Stem Diameter Variation for the Diagnosis of Drip Irrigation Water Deficit inGrapevineReprinted from: Horticulturae 2021, 7, 154, doi:10.3390/horticulturae7060154 . . . . . . . . . . . . 189
vi
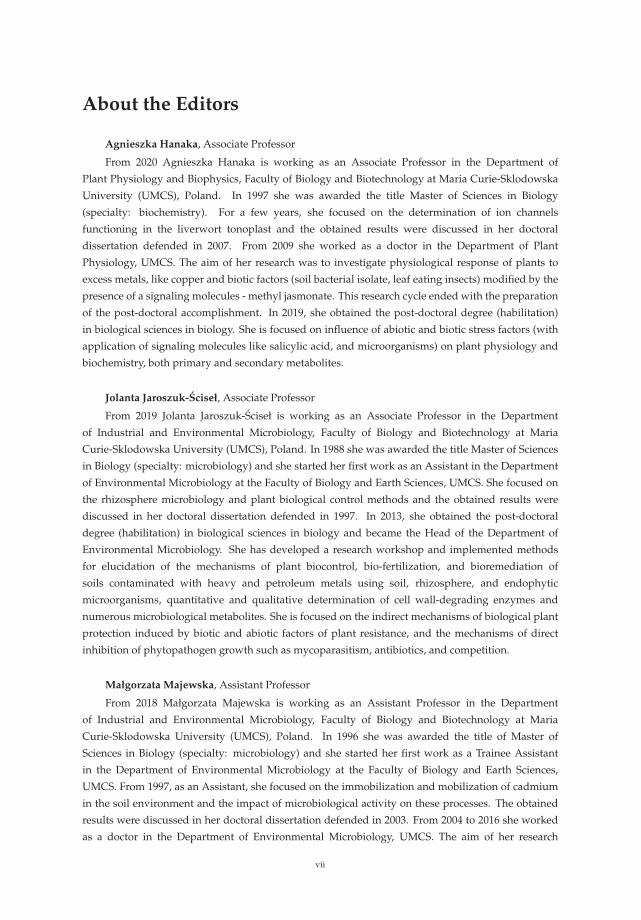
About the Editors
Agnieszka Hanaka, Associate Professor
From 2020 Agnieszka Hanaka is working as an Associate Professor in the Department of
Plant Physiology and Biophysics, Faculty of Biology and Biotechnology at Maria Curie-Sklodowska
University (UMCS), Poland. In 1997 she was awarded the title Master of Sciences in Biology
(specialty: biochemistry). For a few years, she focused on the determination of ion channels
functioning in the liverwort tonoplast and the obtained results were discussed in her doctoral
dissertation defended in 2007. From 2009 she worked as a doctor in the Department of Plant
Physiology, UMCS. The aim of her research was to investigate physiological response of plants to
excess metals, like copper and biotic factors (soil bacterial isolate, leaf eating insects) modified by the
presence of a signaling molecules - methyl jasmonate. This research cycle ended with the preparation
of the post-doctoral accomplishment. In 2019, she obtained the post-doctoral degree (habilitation)
in biological sciences in biology. She is focused on influence of abiotic and biotic stress factors (with
application of signaling molecules like salicylic acid, and microorganisms) on plant physiology and
biochemistry, both primary and secondary metabolites.
Jolanta Jaroszuk-Sciseł, Associate Professor
From 2019 Jolanta Jaroszuk-Sciseł is working as an Associate Professor in the Department
of Industrial and Environmental Microbiology, Faculty of Biology and Biotechnology at Maria
Curie-Sklodowska University (UMCS), Poland. In 1988 she was awarded the title Master of Sciences
in Biology (specialty: microbiology) and she started her first work as an Assistant in the Department
of Environmental Microbiology at the Faculty of Biology and Earth Sciences, UMCS. She focused on
the rhizosphere microbiology and plant biological control methods and the obtained results were
discussed in her doctoral dissertation defended in 1997. In 2013, she obtained the post-doctoral
degree (habilitation) in biological sciences in biology and became the Head of the Department of
Environmental Microbiology. She has developed a research workshop and implemented methods
for elucidation of the mechanisms of plant biocontrol, bio-fertilization, and bioremediation of
soils contaminated with heavy and petroleum metals using soil, rhizosphere, and endophytic
microorganisms, quantitative and qualitative determination of cell wall-degrading enzymes and
numerous microbiological metabolites. She is focused on the indirect mechanisms of biological plant
protection induced by biotic and abiotic factors of plant resistance, and the mechanisms of direct
inhibition of phytopathogen growth such as mycoparasitism, antibiotics, and competition.
Małgorzata Majewska, Assistant Professor
From 2018 Małgorzata Majewska is working as an Assistant Professor in the Department
of Industrial and Environmental Microbiology, Faculty of Biology and Biotechnology at Maria
Curie-Sklodowska University (UMCS), Poland. In 1996 she was awarded the title of Master of
Sciences in Biology (specialty: microbiology) and she started her first work as a Trainee Assistant
in the Department of Environmental Microbiology at the Faculty of Biology and Earth Sciences,
UMCS. From 1997, as an Assistant, she focused on the immobilization and mobilization of cadmium
in the soil environment and the impact of microbiological activity on these processes. The obtained
results were discussed in her doctoral dissertation defended in 2003. From 2004 to 2016 she worked
as a doctor in the Department of Environmental Microbiology, UMCS. The aim of her research
vii

was to identify the rate and efficiency of the mobilization of cadmium previously immobilized
in the root biomass of two plant species (Festuca ovina and Secale cereale) and Cd immobilization
by components of the soil. This research cycle ended with the preparation of the post-doctoral
accomplishment. In 2018, she obtained the post-doctoral degree (habilitation) in biological sciences in
biology. She is focused on metals bioavailability, bioremediation of the soil contaminated with heavy
metals, microbial interactions in the rhizosphere, and plant growth promoting microorganisms in
metal-induced stress.
viii

Preface to ”Study of the Influence of Abiotic
and Biotic Stress Factors on Horticultural Plants”
In the face of rapidly changing environment and anthropogenic pressure, plants must develop
mechanisms allowing them to survive in the adverse conditions. Understanding the alterations under
stress and relationships among different organisms or environmental elements can help create more
favorable conditions and holistic approach towards not only the survival of plants but also for their
optimal growth and development. This reprint book is dedicated to the scientists especially interested
in environmental sciences, involved in plant physiology and biochemistry, as well as horticultural and
microbiological issues.
Global climate change is expected to be critical over the century, leading to influences on different
parameters of the environment. First, biochemical, and physiological changes appear and affect plant
biomass and consequently limit the yield of crops. Instead of the up-to-date knowledge, deeper
approach about alleviating the stress effects is still vital in understanding the complexity of the
problem. Such direction of research may be the basics to obtain environmentally friendly methods
and tools to inhibit negative influence of stress agents on plants.
We have a great pleasure to present the scientists a set of studies entitled “Study of the Influence
of Abiotic and Biotic Stress Factors on Horticultural Plants”. The reprint book contains 12 papers
about the influence of the stress factors on the plant growth and soil parameters. The ideas of
the papers are gathered around five topics: (1) achieving better quality of plant material for food
production by changes made in the growth conditions, metabolic and genetic modifications; (2)
increasing the plant resistance to environmental stresses by application of exogenous compounds
of different chemical character; (3) reducing plant stress caused by anthropogenic activity applying
nonmodified and genetically modified plants (GMP); (4) mitigating drought stress by irrigation; and
(5) the positive effect of plant growth-promoting microorganisms on horticulture plants performance
during drought stress.
Agnieszka Hanaka, Jolanta Jaroszuk-Sciseł, Małgorzata Majewska
Editors
ix


Citation: Hanaka, A.; Majewska, M.;
Jaroszuk-Sciseł, J. Study of the
Influence of Abiotic and Biotic Stress
Factors on Horticultural Plants.
Horticulturae 2022, 8, 6. https://
doi.org/10.3390/horticulturae
8010006
Received: 3 November 2021
Accepted: 30 November 2021
Published: 22 December 2021
Publisher’s Note: MDPI stays neutral
with regard to jurisdictional claims in
published maps and institutional affil-
iations.
Copyright: © 2021 by the authors.
Licensee MDPI, Basel, Switzerland.
This article is an open access article
distributed under the terms and
conditions of the Creative Commons
Attribution (CC BY) license (https://
creativecommons.org/licenses/by/
4.0/).
horticulturae
Editorial
Study of the Influence of Abiotic and Biotic Stress Factors onHorticultural Plants
Agnieszka Hanaka 1,*, Małgorzata Majewska 2 and Jolanta Jaroszuk-Sciseł 2
1 Department of Plant Physiology and Biophysics, Institute of Biological Sciences, Faculty of Biology andBiotechnology, Maria Curie-Skłodowska University, Akademicka 19, 20-031 Lublin, Poland
2 Department of Industrial and Environmental Microbiology, Institute of Biological Sciences, Faculty of Biologyand Biotechnology, Maria Curie-Skłodowska University, Akademicka 19, 20-031 Lublin, Poland;[email protected] (M.M.); [email protected] (J.J.-S.)
* Correspondence: [email protected]
In changing environmental conditions, horticulture plants are affected by a vastrange of abiotic and biotic stresses which directly and indirectly influence plant condition.Moreover, biomass production or some of the plant metabolites are expected to steadilyincrease. Such expectations lead to research on the influence of different stressors andtheir potential modifiers. It is extremely important to have a holistic approach to theprocesses taking place in a plant that is affected by stress factors. At the same time, theplant can be affected by very diverse factors that mutually affect and shape the plantgrowth environment, such as the state of water supply—extremely low or, conversely, toohigh—the impact of low or high temperatures, which in turn cause a state of drought,increased osmotic pressure and salinity.
This Special Issue (SI) was planned with a structure to consider a large range of aspectson stress factors affecting horticultural plants. It is a research summary on the influence ofthe stress factors on plant growth and the soil parameters. The studies were investigatedat the cellular, tissue, organ and whole plant level. Authors described the impact of stresscaused by both climate change and human activity resulting in disorder of the optimumtemperature (low- and high-temperature stresses), water balance (water and drought stressand irrigation) and the subsequent disturbance of soil parameters. The SI gathers elevenresearch papers [1–11] and one review [12]. Three papers were dedicated to cold stress,two to salt stress, two to inorganic pollutants such as metals and phosphite (Phi), three toclimate change (i.e., high temperature, water and drought stress) and two to irrigation. Thesubject of the studies were different plant species, i.e., watermelon, lettuce, kale, potato,tomato, grapevine, hops, orchid, strawberry and Buxus megistophylla.
Among the classical parameters used as indicators of plant condition are morpho-logical, anatomical, physiological, biochemical and genetical ones [12]. Physiological,biochemical and anatomical changes occurring in the plant under the influence of stressfactors should be especially strongly noticed and analyzed.
In the presented SI, the most frequently applied morphological features were: seedgermination, plant growth, leaf and berry area, leaf number, stem diameter and plant dryweight [1–3,5,7–11]. Anatomical characteristics were based mainly on the evaluation ofepidermis and mesophyll quality and number of cells and chloroplasts [8]. Physiologicalaspects were focused on water content in leaves, mineral elements (nutritional elementsand heavy metals, e.g., N, P, K, Mg, Ca, Mn, Fe, Cu, Na, Cl, Co, Cr, Ni, Pb), photosyntheticpigments content (chlorophylls a and b, carotenoids), polyphenolic compounds content (e.g.,polyphenols, phenolic acids and flavonoids), soluble sugars, acids and proline contentsand plant growth regulators (e.g., abscisic acid, indole-3-acetic acid, gibberellin A3) [1–11].Biological traits were mostly lipid peroxidation (i.e., content of malondialdehyde; MDA),level of reactive oxygen species (ROS, e.g., H2O2 and O2−•), activity of antioxidative en-zymes (e.g., superoxide dismutase, peroxidase and catalase) and content of non-enzymatic
Horticulturae 2022, 8, 6. https://doi.org/10.3390/horticulturae8010006 https://www.mdpi.com/journal/horticulturae
1
Horticulturae 2022, 8, 6
compounds (e.g., vitamin C and lycopene) [2,4–11]. Additionally, expression of ethylene-responsive factor genes was analyzed [4]. Some of the papers studied soil properties [1,9].At the same time, attention was drawn to the close links between hormonal balance andinduction of plant immunity, in which regulatory functions are performed by signalingsubstances (such as salicylic acid, jasmonic acid, ethylene) produced in the pathways ofphenolic compounds transformation under the influence of marker enzymes of the phenyl-propanoid pathway [12]. Stress factors affect both the uptake of mineral compounds andthe process of photosynthesis, which can be monitored based on the biometric parametersand the level of photosynthetic pigments (chlorophyll and carotenoids).
All these elements have been taken into consideration in twelve publications presentedin this SI, providing meaningful results revealing a series of events occurring as a conse-quence of the influence of various environmental factors and explaining the operation ofplant defense mechanisms. In the largest number of works, the increase in polyphenols andphenolic acids content and the activity of antioxidant enzymes has been shown because ofthe action of the abiotic stress factors [1,2,4,9]. Accumulation of proline was observed insalinity stress after chitosan (CTS) application [2], in low temperature stress (kale, Brassicaoleracea var. acephala) [3] and in the Phi supply (potato, Solanum tuberosum) [4].
The ideas of the research papers gathered under the titled “Study of the Influence ofAbiotic and Biotic Stress Factors on Horticultural Plants” were divided into five sections.They were dedicated to the following fields: (1) achieving better quality of plant materialfor food production by changes made in the growth conditions, metabolic and geneticmodifications; (2) increasing the plant resistance to environmental stresses by application ofexogenous compounds of different chemical character; (3) reducing plant stress caused byanthropogenic activity applying non-genetically modified and genetically modified plants(GMP) and (4) mitigating drought stress by irrigation, whereas the main goal of the reviewpaper [12] was to discuss (5) the positive effect of plant growth-promoting microorganisms(PGPM) on horticulture plant performance during drought stress.
(1) Better quality of plant material for food production.
To achieve better plant material for food production, changes can be made in the plantgrowth conditions, its metabolism and genetic material [3,5–7].
Manipulations leading to an increase in the stress tolerance of a plant may not alwaysallow us to obtain new varieties with better parameters. Such an example was the researchon Vitis vinifera L. varieties [3] in the wine industry, it seems crucial to find the answers totwo questions: (1) do the new genotypes of the pathogen-resistant grapevines (new geno-types with low sensitivity to biotic stress) keep good qualities of fruit? and (2) how do thenew varieties react to global climate warming? Frioni et al. [3] proved that the productionand fruit composition traits during ripening of several new cross-bred pathogen-resistantgrapevine varieties (patented and admitted to cultivation) are significantly lower than twoV. vinifera traditional varieties, Ortrugo and Sauvignon Blanc. In these studies, five whitepathogen-resistant varieties (PRV) listed as UD 80-100, Soreli, UD 30-080, Sauvignon Rytosand Sauvignon Kretos were tested. All tested PRV exhibited an earlier onset of veraisonand faster sugar accumulation compared to Ortrugo and Sauvignon Blanc. Such effectscould suggest an earlier start of the harvest. Therefore, canopy and ripening managementstrategies must be significantly adjusted compared to the standard practice employed forthe parental Sauvignon Blanc. Overall, PRV could perform better in cooler climates, innorth-facing hillsides, or at higher altitudes, where their good resistance to mildews couldmatch an adequate grapes’ biochemical balance. Moreover, retaining adequate acidity atharvest is crucial to produce high-quality white wines [3].
Not only genetic manipulation leading to obtain the new varieties, using cold-tolerantrootstocks to efficient adaptation plantlets, or regulation of the growth temperature, butalso the nearness of other plants can improve growth parameters and fruit quality of thehorticultural plants in stress. Such a phenomenon was observed by Karakas et al. [5]. Theyshowed that strawberries, as salt-sensitive plants, reacted strongly to slight or moderatesalinity, reducing the crop yield and quality of fruits. Salt stress negatively affected the
2
Horticulturae 2022, 8, 6
growth, stomatal conductance, electrolyte leakage, contents of chlorophyll, proline, H2O2,MDA, activity of catalase and peroxidase and content of the health-related compounds suchas vitamin C and lycopene. On the other hand, when strawberry seedlings were grown incombination with Portulaca oleracea L. under NaCl stress condition, not only an increasein weight of the green parts of the plant and the total fruit yield of strawberry plants, butalso an improvement in physiological and biochemical parameters were observed. Thecultivation of strawberry plants with P. oleracea directly reduced the concentrations of stressmetabolites and antioxidant enzyme levels, as well as indirectly contributing to an increasein vitamin C and lycopene contents. Therefore, Karakas et al. [5] suggested the use of P.oleracea on the areas with significant salinity as an environmentally friendly method todiminish salt stress.
The plant struggle with stress may be manifested by changes in metabolism and theaccumulation of various compounds. For example, kale tolerance to low temperatures isassociated with the presence of specialized metabolites such as polyphenols, carotenoidsand glucosinolates, which can act not only as protective factors against environmental stressfor the plant, but they can also be a source of beneficial compounds for human health [6].Ljubej et al. [6] observed that a short (24 h) chilling period (8 ◦C) was beneficial for theaccumulation of phytochemicals in kale. However, freezing temperatures (−8 ◦C) causedsignificant stress and decrease in pigments and phytochemical compound levels. Thestudies suggested that the temperature of kale cultivation should be controlled by producersto achieve production of crops with a high content of health-related compounds [6].
Lu et al. [7] proved that using cold-tolerant rootstocks may be an efficient adaptationstrategy for improving stress tolerance in watermelon (Citrullus lanatus (Thunb.), cv. ZaoJia8424). It was demonstrated that the improved cold tolerance was associated with gourd-grafted watermelons compared to non-grafted (control) plants. Grafted plants accumulatedlower levels of ROS, consequently representing enhanced antioxidant activity. Undercold stress, higher chlorophyll and proline contents and lower MDA content were alsodetermined [7].
(2) Exogenous compounds in plant resistance to environmental stresses.
To mitigate stress, growth of horticultural plants can be supported with exogenoussubstances during agrotechnical treatments such as 24-epi-brassinolide (EBR) on tomato [4],5-aminolevulinic acids (5-ALA) on Buxus megistophylla [10] and CTS on lettuce (Lactucasativa L.) [11].
The exogenous EBR used by Heidari et al. [4] as analog of brassinosteroids eliminatedthe effects of oxidative stress induced by low temperature in cold-sensitive tomato species.24-epi-brassinolide decreased the ROS content, simultaneously increasing antioxidantenzymes activity, auxin and gibberellin contents, then improved the growth rate of thetomato.
Yang et al. [10] detected that 5-ALA promoted the growth of B. megistophylla, improvedplant survival, increased leaf color and enhanced the greening effect. The content of severalkinds of mineral nutrient elements, such as nitrogen, phosphate, calcium, magnesium, iron,copper and boron in leaves of B. megistophylla was strongly increased by 5-ALA treatment.Unfortunately, a negative effect was also observed. Under this treatment, accumulation ofcadmium, mercury, chromium and lead in roots increased. Luckily, these toxic elementswere intercepted in roots without translocation and accumulation in leaves. The activitiesof antioxidative enzymes and the stress resistance of plants were enhanced. Accordingto the results, 5-ALA, as a specific activator of biochemical pathways, can lead to bothfavorable and unfavorable alterations in metabolism. Therefore, Yang et al. [10] recommendapplication of this non-protein amino acid in urban landscapes to improve stress toleranceof ornamental plants.
It has been proven by Zhang et al. [11] that CTS, the classic, widely commercially usedelicitor of plant immunity protecting plants against phytopathogens, can be effective inprotecting the plant (Lactuca sativa) against the effects of the abiotic factor—excessive saltconcentration. Most likely, its direct protective effect under salinity condition was associated
3
Horticulturae 2022, 8, 6
with the regulation of intracellular ion concentration, controlling osmotic adjustment andincreasing antioxidant enzymatic activity (e.g., peroxidase and catalase) in lettuce leaves.Moreover, results of Zhang et al. [11] showed that exogenous CTS could improve plantgrowth and biomass under salt stress. There is significant evidence that CTS curbedthe accumulation of sodium but enhanced the accumulation of potassium in the leavesof NaCl-treated plants. This fact may be important for obtaining better-quality lettuceand supplementing the deficiencies of K in the human diet [11]. Chitosan, as naturalpolysaccharide, is a safe and cheap substance promoting plant growth and increasing thebiotic and abiotic stress tolerance of plants.
(3) Reduction of plant stress under anthropogenic activity by application of non-geneticallymodified plants and GMP.
Human beings create habitats unfavorable for the development of plants. This isthe result of industrial and agricultural activity. Fortunately, the plants have also learnedto deal with this kind of stress. For example, Maleva et al. [8] found the Neottia ovatagrowing in the young forest community formed during the natural revegetation of thefly ash deposits (fly ash dump of Verkhnetagil’skaya Thermal Power Station). In Russia,this orchid species is included in several regional Red Data Books, and it is especiallyinteresting to gather knowledge of the adaptive characteristics of orchids. The study oforchid adaptive responses to unfavorable factors by Maleva et al. [8] will help to run theprocess of the introduction of the N. ovata into new environments. The adaptive changesin the leaf mesostructure organization, such as an increase in epidermis thickness, thenumber of chloroplasts in the cell and the internal assimilating surface were found forthe first time by Maleva et al. [8]. The orchid population colonizing the fly ash depositswas characterized by a relatively favorable water balance and stable assimilation indexesfurther contributing to its high viability.
Crop production is expensive in the areas with low phosphorus (P) availability, andfor this reason Domatey et al. [2] were looking for other compounds that may serve asa useful source of assimilable P for Solanum tuberosum L. According to this paper, it ispossible to apply Phi as fertilizer, only when plants stay resistant to this phosphorus form.Like herbicides, Phi has an inhibitory effect on plant growth. The authors try to combinethese phenomena as a hypothetical advantage. Only if plant genotypes are resistant toPhi could it be used both as herbicide to weed control and the source of bioavailableP. Such a solution would be environmentally friendly. Furthermore, Domatey et al. [2]showed significant genotypic variation in tolerance indices among the five tested genotypes(Atlantic, Longshu3, Qingshu9, Longshu6 and Gannong2). Firstly, antioxidant enzymeactivities and proline content increased significantly under Phi treatments compared tocontrol without Phi. Secondly, potato genotypes with larger root systems such as Atlanticand Longshu3 were more tolerant to Phi stress than genotypes with smaller root systems(Qingshu9, Longshu6 and Gannong2) [2].
(4) Mitigation of drought stress by irrigation.
Plants require an adequate amount of water during the growing season. Nowadays,this is a rising problem because there is not enough water in many parts of the world, evenin areas where such shortages did not occur in the past. Luckily, water limitations can bepartially eliminated using various irrigation methods, e.g., by flooding the inter-row [1]or more precisely drip irrigation that supplies water directly to the place where the plantgrows out of the soil [9].
Flooding the inter-row is still the most frequently used irrigation method for hop(Humulus lupulus L.) in northern Portugal. Afonso et al. [1] showed that using this typeof irrigation to prevent drought stress can worsen the condition of the soil in inter-rows.The irrigation of the hop fields by flooding the inter-row for more than 20 years causeddecreased porosity and increased soil bulk density in the 0–10 cm soil layer in comparison tothe 10–20 cm layer. Fortunately, it did not damage the soil structure of ridges, which are theplace of nutrient accumulation’s gradual uptake by hop plants. Although irrigation and soil
4
Horticulturae 2022, 8, 6
tillage have damaged the soil structures, they did not create the negative nutrient gradientalong the row. Moreover, they refilled water deficiencies during plant development, and thequality of the hop cone yield was sufficient, but on the other hand, the water consumptionwas too high [1].
Limited water resources force more economical use of water by precise irrigationtechniques. It is important to accurately follow the plants’ water needs, and correctlypredict the moments of deficiency supplementation. New irrigation techniques based onbiological parameters and very precise calculations can serve as an adequate solution. It isimportant to follow exactly the first reactions of the plants to water restrictions to finally beable to use less water [9].
Ru et al. [9] devoted the article to the above topic. The authors searched a reliablemethod to easily quantify and monitor the grapevine water status to enable effectivemanipulation of the water stress of the plants. It was shown that the study on a dailystem diameter variation of grapevine planted in a greenhouse could be helpful to preciseirrigation management of plants. The relative daily variation of the grapevine stem diameterfrom the vegetative stage to the fruit stage was related to different irrigation levels. Bothsignal intensity calculation of maximum daily shrinkage (SIMDS) and daily increase (SIDI)can be applied as indicators of the moisture status of grapevine and soil. Ru et al. [9]concluded that SIDI was suitable as an indicator of water status of grapevine and soilduring the vegetative and flowering stages, whereas SIMDS was suitable as an indicatorof the moisture status of plant and soil during the fruit expansion and mature stages. Ingeneral, SIMDS and SIDI were very good predictors of the plant water status during thegrowth stage and their continuous recording can offer the promising possibility of theiruse in programming automatic drip irrigation of the grapevine [9].
(5) The positive effect of PGPM on plant performance during drought stress.
Trend towards temperature rise contributes to water evaporation and global warming,eventually leading to drought stress in plants. The review paper of Hanaka et al. [12]discussed the positive influence of PGPM on horticulture plant performance during droughtstress. Among mechanisms of plant protection by rhizospheric or plant surface-colonizingand endophytic bacteria and fungi are the production of phytohormones, antioxidants andxeroprotectants, and the induction of plant resistance. On one hand, application of variousbiopreparations containing PGPM seems to be a relatively cheap, easy to apply and efficientmethod of alleviating drought stress in plants, with implications in productivity and foodcondition. On the other hand, the vital problems of using biopreparations containing PGPMinclude limitations in introducing the microbial inoculum to the appropriate conditions andthe low repeatability of their activities. Microorganisms that promote plant growth and atthe same time induce physical and chemical alterations that result in enhanced tolerance toabiotic stresses, constitute an important separate group called “induced systemic tolerance”(IST). It should be strongly emphasized that a significant enhancement of the protectiveeffect in drought conditions is achieved by using a mixture of bacterial strains (e.g., fromgenus Bacillus and Serratia), which indicates the synergistic effect of IST strains. It is alsovery important to emphasize the special role of fungi in protecting plants against drought.Fungi are more tolerant to drought than bacteria and their abundance in soil increasesin water-limiting conditions. This is due to the specific fungal growth and traits whichallow an intensive soil and plant tissue exploration and colonization and taking water fromresources unavailable to other microorganisms.
Studies on the protection of horticultural plants influencing drought stress indicatedthat the application of well-selected microorganisms can be efficient [12]. Biopreparationsshould be multicomponent to achieve an appropriate level of microorganism cooperationand the final desired effect. Moreover, the combination of bacterial and fungal strains intoone preparation gives even better effectiveness and reliability. Crop specificity should alsobe taken into consideration.
5
Horticulturae 2022, 8, 6
Author Contributions: Conceptualization, A.H. and M.M.; writing—original draft preparation, A.H.,M.M. and J.J.-S.; and writing—review and editing, A.H., M.M. and J.J.-S. All authors have read andagreed to the published version of the manuscript.
Funding: This research received no external funding.
Acknowledgments: We gratefully acknowledge all the authors that participated in this Special Issue.
Conflicts of Interest: The authors declare no conflict of interest.
References
1. Afonso, S.; Arrobas, A.; Rodrgues, M.Â. Twenty-Years of Hop Irrigation by Flooding the Inter-Row Did Not Cause a Gradientalong the Row in Soil Properties, Plant Elemental Composition and Dry Matter Yield. Horticulturae 2021, 7, 194. [CrossRef]
2. Dormatey, R.; Sun, C.; Ali, K.; Qin, T.; Xu, D.; Bi, Z.; Bai, J. Influence of Phosphite Supply in the MS Medium on Root MorphologicalCharacteristics, Fresh Biomass and Enzymatic Behavior in Five Genotypes of Potato (Solanum tuberosum L.). Horticulturae 2021, 7,265. [CrossRef]
3. Frioni, T.; Squeri, C.; Del Zozzo, F.; Guadagna, P.; Gatti, M.; Vercesi, A.; Poni, S. Investigating Evolution and Balance of GrapeSugars and Organic Acids in Some New Pathogen-Resistant White Grapevine Varieties. Horticulturae 2021, 7, 229. [CrossRef]
4. Heidari, P.; Entazari, M.; Ebrahimi, A.; Ahmadizadeh, M.; Vannozzi, A.; Palumbo, F.; Barcaccia, G. Exogenous EBR AmelioratesEndogenous Hormone Contents in Tomato Species under Low-Temperature Stress. Horticulturae 2021, 7, 84. [CrossRef]
5. Karakas, S.; Bolat, I.; Dikilitas, M. The Use of Halophytic Companion Plant (Portulaca oleracea L.) on Some Growth, Fruit, andBiochemical Parameters of Strawberry Plants under Salt Stress. Horticulturae 2021, 7, 63. [CrossRef]
6. Ljubej, V.; Karalija, E.; Salopek-Sondi, B.; Šamec, D. Effects of Short-Term Exposure to Low Temperatures on Proline, Pigments,and Phytochemicals Level in Kale (Brassica oleracea var. acephala). Horticulturae 2021, 7, 341. [CrossRef]
7. Lu, K.; Sun, J.; Li, Q.; Li, X.; Jin, S. Effect of Cold Stress on Growth, Physiological Characteristics, and Calvin-Cycle-Related GeneExpression of Grafted Watermelon Seedlings of Different Gourd Rootstocks. Horticulturae 2021, 7, 391. [CrossRef]
8. Maleva, M.; Borisova, G.; Chikina, N.; Sinenko, O.; Filimonova, E.; Lukina, N.; Glazyrina, M. Adaptive MorphophysiologicalFeatures of Neottia ovata (Orchidaceae) Contributing to Its Natural Colonization on Fly Ash Deposits. Horticulturae 2021, 7, 109.[CrossRef]
9. Ru, C.; Hu, X.; Wang, W.; Ran, H.; Song, T.; Guo, Y. Signal Intensity of Stem Diameter Variation for the Diagnosis of Drip IrrigationWater Deficit in Grapevine. Horticulturae 2021, 7, 154. [CrossRef]
10. Yang, H.; Zhang, J.; Zhang, H.; Xu, Y.; An, Y.; Wang, L. Effect of 5-Aminolevulinic Acid (5-ALA) on Leaf Chlorophyll FastFluorescence Characteristics and Mineral Element Content of Buxus megistophylla Grown along Urban Roadsides. Horticulturae2021, 7, 95. [CrossRef]
11. Zhang, G.; Wang, Y.; Wu, K.; Zhang, Q.; Feng, Y.; Miao, Y.; Yan, Z. Exogenous Application of Chitosan Alleviate Salinity Stress inLettuce (Lactuca sativa L.). Horticulturae 2021, 7, 342. [CrossRef]
12. Hanaka, A.; Ozimek, E.; Reszczynska, E.; Jaroszuk-Sciseł, J.; Stolarz, M. Plant Tolerance to Drought Stress in the Presence ofSupporting Bacteria and Fungi: An Efficient Strategy in Horticulture 2021. Horticulturae 2021, 7, 390. [CrossRef]
6
horticulturae
Review
Plant Tolerance to Drought Stress in the Presence of SupportingBacteria and Fungi: An Efficient Strategy in Horticulture
Agnieszka Hanaka 1,*, Ewa Ozimek 2, Emilia Reszczynska 1, Jolanta Jaroszuk-Sciseł 2 and Maria Stolarz 1
Citation: Hanaka, A.; Ozimek, E.;
Reszczynska, E.; Jaroszuk-Sciseł, J.;
Stolarz, M. Plant Tolerance to
Drought Stress in the Presence of
Supporting Bacteria and Fungi: An
Efficient Strategy in Horticulture.
Horticulturae 2021, 7, 390. https://
doi.org/10.3390/horticulturae7100390
Academic Editor: Alessandra
Francini
Received: 1 September 2021
Accepted: 5 October 2021
Published: 11 October 2021
Publisher’s Note: MDPI stays neutral
with regard to jurisdictional claims in
published maps and institutional affil-
iations.
Copyright: © 2021 by the authors.
Licensee MDPI, Basel, Switzerland.
This article is an open access article
distributed under the terms and
conditions of the Creative Commons
Attribution (CC BY) license (https://
creativecommons.org/licenses/by/
4.0/).
1 Department of Plant Physiology and Biophysics, Faculty of Biology and Biotechnology,Institute of Biological Sciences, Maria Curie-Skłodowska University, Akademicka 19, 20-031 Lublin, Poland;[email protected] (E.R.); [email protected] (M.S.)
2 Department of Industrial and Environmental Microbiology, Faculty of Biology and Biotechnology,Institute of Biological Sciences, Maria Curie-Skłodowska University, Akademicka 19, 20-031 Lublin, Poland;[email protected] (E.O.); [email protected] (J.J.-S.)
* Correspondence: [email protected]
Abstract: Increasing temperature leads to intensive water evaporation, contributing to global warm-ing and consequently leading to drought stress. These events are likely to trigger modificationsin plant physiology and microbial functioning due to the altered availability of nutrients. Plantsexposed to drought have developed different strategies to cope with stress by morphological, physio-logical, anatomical, and biochemical responses. First, visible changes influence plant biomass andconsequently limit the yield of crops. The presented review was undertaken to discuss the impact ofclimate change with respect to drought stress and its impact on the performance of plants inoculatedwith plant growth-promoting microorganisms (PGPM). The main challenge for optimal performanceof horticultural plants is the application of selected, beneficial microorganisms which actively sup-port plants during drought stress. The most frequently described biochemical mechanisms for plantprotection against drought by microorganisms are the production of phytohormones, antioxidantsand xeroprotectants, and the induction of plant resistance. Rhizospheric or plant surface-colonizing(rhizoplane) and interior (endophytic) bacteria and fungi appear to be a suitable alternative fordrought-stress management. Application of various biopreparations containing PGPM seems toprovide hope for a relatively cheap, easy to apply and efficient way of alleviating drought stress inplants, with implications in productivity and food condition.
Keywords: climate change; drought stress; biopreparations; plant stimulation; plant growth-promotingmicroorganisms
1. Introduction
The horticulture system is affected by various abiotic and biotic stresses which directlyand indirectly influence soil fertility, plant health and crop yield [1–3]. These stresses resultin the loss of soil microbial diversity, soil fertility and availability of nutrients [4]. Thecondition of the soil under drought strictly corresponds to plant performance, showingconsequences in plant morphology, anatomy, physiology, and biochemistry. With reductionin seed germination and seedling growth, plant height, nutrition and biomass are weakenedresulting in yield limitation. The huge variety of changes taking place in horticulturalplants and the mechanisms of counteracting stress they produce result from a very widerange of horticultural plant species, including types of crops such as those distinguishedby the International Society for Horticultural Science (ISHS): (1) tree, bush and perennialfruits, (2) perennial bush and tree nuts, (3) vegetables (roots, tubers, shoots, stems, leaves,fruits and flowers of edible and mainly annual plants), (4) medicinal and aromatic plants,(5) ornamental plants, (6) trees, shrubs, turf and ornamental grasses propagated andproduced in nurseries for use in landscaping or for establishing fruit orchards or othercrop production units [5]. Facing the current, rapid climate changes, the cultivation of
Horticulturae 2021, 7, 390. https://doi.org/10.3390/horticulturae7100390 https://www.mdpi.com/journal/horticulturae
7
Horticulturae 2021, 7, 390
plants is strongly affected by abiotic stresses, which additionally intensify the influence ofbiotic factors such as pests causing serious plant infections [4]. In this dramatic situation,plant associations with rhizospheric [6,7] and endophytic [8,9] microorganisms colonizingthe rhizoplane, rhizosphere and plant tissues should be considered as the main stressrelievers [10–14]. Three types of effects of microorganisms associated with plants aredistinguished: beneficial, deleterious and neutral ones. Based on the positive effects ofmicrobes, two main groups are listed, plant growth-promoting rhizobacteria (PGPR) ormore generally, plant growth-promoting bacteria (PGPB) and plant growth-promotingfungi (PGPF) [14–19]. All mentioned groups of microorganisms can serve as biocontrolagents, biofertilizers, phytostimulators and phytoremediators [2,12,20–22].
The most frequently described biochemical mechanisms of plant protection againstdrought by microorganisms are the production of phytohormones, antioxidants and xero-protectants [23]. Trehalose can act as xeroprotectant triggering the plant-defense system tocounteract the damage caused by drought. It has been shown that microorganisms withtolerance to desiccation have the ability to protect some plants from drought. It seems tobe dependent on the microorganism’s ability to regulate the concentration of trehalose inthe plant as a signal of drying damage.
In horticultural production, plant–microbe interactions should be considered the mainfactor of plant growth, protection against abiotic stresses and resistance against adverseconditions [24,25] (e.g., in arid and semiarid areas), and these interactions could also bebeneficial in alleviating drought stress in plants [26]. Profound knowledge about themechanisms of plant–microbe interactions can offer several strategies to increase plantproductivity in an environmentally friendly manner [27]. Therefore, in the increasingmarket for plant growth-promoting products, it is important to develop a successfulstrategy for microorganism screening [28]. Furthermore, the European Green Deal (EGD),provided by the European Commission in December 2019, is currently focused on theapplication of natural products in agriculture and horticulture instead of chemical plant-protection products. To cope with this idea, new efficient biological ingredients in the faceof changing climate are desired. Nowadays, the most significant consequence of climatechange is drought stress [29].
To deal with severe drought stress in the near future, it is strictly necessary to de-termine the interactions, mechanisms and signaling pathways responsible for increaseddrought tolerance in terrestrial organisms. The concept of drought and water deficit isdifficult to define, but the literature data [30–32] indicate that drought can be defined as astate of the total water capacity being within the range of 12–20% for a period of 16 days.Moreover, the drought state can achieve at least two degrees—mild and severe [33]—whilethe water deficit [34] refers to the state of water capacity falling below 30%. To handle thedrought effect, plants can be supported by both microorganisms inhabiting the rhizoplane(i.e., those adhering to the surface of the roots) and rhizosphere (i.e., living at a further dis-tance within the root secretions) [34,35], as well as endophytic microorganisms inhabitingthe inside of the root [36]. The application of plant growth-promoting microorganismsseems to provide hope for a cheap, easy to apply and efficient way of alleviating droughtstress in plants with implications in productivity and food condition. The presented reviewwas undertaken to discuss the impact of climate change with respect to drought stress, andto emphasize that modifications in microorganisms composition and their traits shouldindicate new solutions in the search for efficient compounds of biopreparations supportingplant growth.
2. Climate Change
Global climate change is expected to be considerably critical over the century, leadingto influences on various parameters of the environment [17]. Not only atmospheric CO2concentrations derived from natural and anthropogenic sources, but also surface tempera-tures will be increasing gradually, likely from 1.0 to 5.7 ◦C by the end of this century [37].Moreover, some regions, such as the Eastern Mediterranean and Middle East (EMME),
8

Horticulturae 2021, 7, 390
have been classified as a climate “global hot-spot”. In the EMME, the temperature ispredicted to increase from 3.5 to 7 ◦C by the end of the century [38]. Additionally, it isanticipated that rising air temperatures will increase the frequency of extreme weatherdisasters such as heat waves, drought and heavy precipitation occurrence to a level thathas never been monitored before [37]. These strongly temperature-dependent climatechanges, combined with water scarcity, will lead to enhanced drought throughout theglobe, hurting whole ecosystems and different organisms, including the distribution ofplants and microorganisms [17].
In climate studies, calculations concerning crop evapotranspiration are also impor-tant [17]. For instance, in South East Europe, the mean annual crop evapotranspirationin the period 1991–2020 reached from 56 mm to 1297 mm, while averages for the future30 years (between 2021 and 2050), are expected to vary from 59 mm to 1410 mm [17]. Thesepredictions consider the impact of future climate warming. Global warming increaseswater evaporation and consequently leads to drought stress [39]. High temperature is thecrucial factor in melting glaciers and increasing the sea level [8]. The changes in polar andsubpolar climate zones also correspond with climate warming [40–42].
Climate change results in altered environmental conditions and negative effects onnatural ecosystems, which are likely to trigger modifications in plant physiology [43] andmicrobial functioning [44] based on the availability of nutrients [4] or signal compounds [2].It is certain that not only plants, but also plant-associated microorganisms might be remark-ably changed in abundance, diversity and activity [44,45]. Both increased temperature anddrought may activate correspondent adjustments in plants and microorganisms and theirmutual interactions [17]. The adaptational challenges of horticultural plants are not onlyassociated with long-term average climate change, but also with the short-term changesdriven by weather extremes and interannual fluctuations [46]. Drought-related cerealproduction losses are increasing by more than 3% yr−1 [46]. In the face of the continu-ous raise of the world population to an estimated nine billion by 2050 [47], withstandingdrought stress according to sustainable agriculture/horticulture is a challenge for the 21stcentury [48].
3. Plants under Drought Stress
Drought is an uncontrolled stress which affects almost all stages of plant growth anddevelopment directly or indirectly [43]. Most of the drought effects on plants are associatedwith high temperature. Physiological processes occur mostly in temperatures ranging from0 ◦C to 40 ◦C. However, the optimal temperatures for the different stages of growth anddevelopment are narrower and strongly depend on the species and ecological origin [1,49].
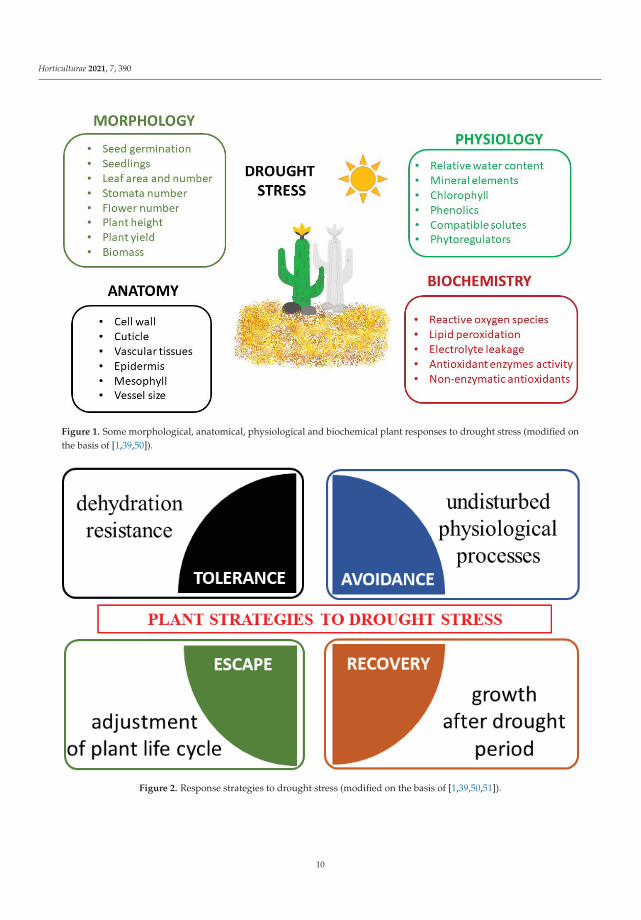
Plants exposed to drought stress develop numerous responses in different areas, frommorphological and physiological mechanisms to anatomical and biochemical or molecularones [1,39,50] (Figure 1).
Four types of morphological and physiological response strategies to drought stressare highlighted, i.e., tolerance, avoidance, escape and recovery [51] (Figure 2). Tolerance isdefined as the plant’s ability to resist dehydration using osmoprotectants [52]. Avoidance isbased on the undisturbed occurrence of physiological processes (such as stomata regulation,root system development). Escape is the adjustment of the plant’s life cycle by shorteningof the life cycle to avoid drought stress. Recovery is the ability of a plant to restart growthafter the exposure to the extreme drought stress [53].
The morphological features of drought stress include limited seed germination andseedling growth, reduced size, area and number of leaves, restricted number of stomata,reduced number of flowers, disturbed stem and root elongation, impaired plant height,growth, development and yield, and reduced fresh and dry biomass [7,39,50].
9
Horticulturae 2021, 7, 390
Figure 1. Some morphological, anatomical, physiological and biochemical plant responses to drought stress (modified onthe basis of [1,39,50]).
Figure 2. Response strategies to drought stress (modified on the basis of [1,39,50,51]).
10

Horticulturae 2021, 7, 390
In order to adapt to the adverse environment, avoid drought and improve wateravailability, plants increase the root length and their number [54]. Drought significantlyaffects the plant’s cell elongation and division, its growth and its development, which ismainly caused by the reduction in cellular differentiation, plant growth and yield [50]. Thenegative effect on the leaf area under the drought condition could be dependent on thereduction in the leaf number, size and longevity, combined with temperature, leaf turgorpressure and assimilation rate [55]. The reduction in plant height and shoot dry weightresults in a lower quality of yield [54].
The morphological responses are most frequently combined with anatomical changesin plants exposed to drought, e.g., thickening of cell walls, increased cuticle layer on theleaf surface and improved development of vascular tissues [8,56]. Drought stress resultsin anatomical changes in the lower and upper epidermis, mesophyll tissue and vascularbundle diameter of leaves [57]. The negative anatomical effects on the leaves are based ona shortage of water supply from the soil, limitations in nutrients uptake, and reductionin photosynthetic rate. Plant hydraulic conductivity is modulated during drought stressleading to the disruption of water flow in the xylem vessels (embolism) or modifications inthe vessel size and function [58]. Consequently, the reduced water flow from the root tothe shoot causes stomatal closure and transpiration disruption [50].
Drought affects the physiological traits such as the leaf relative water content andwater potential, stomatal conductance, transpiration and photosynthetic rates [59,60].Reduced water content and water conductivity are responsible for the loss of turgidity andlimited stomatal conductance resulting in restricted gaseous exchange (the rate of carbonassimilation) [8,61]. Furthermore, climatic conditions, e.g., higher temperature, droughtand soil aeration reduce the movement of nutrients in the soil, their uptake by roots andtransport in plant tissues [62].
Photosynthesis can be disrupted through the modulation of the electron transportchain and can increase the rate of biochemical reactions catalyzed by different enzymes.Above a certain temperature threshold, enzymes lose their function, influencing the planttissue tolerance to drought [1,63,64]. Drought stress also affects the translocation of nu-trients and the composition of minerals, antioxidants and proteins [39,52]. Under stressconditions, reactive oxygen species (ROS) are highly generated [65,66] causing cell damageand plant necrosis [67]. Additionally, plant hormones and primary and secondary metabo-lites are modified [1]. Drought is the elicitor that can increase the content of secondarymetabolites in plant tissues such as flavonoids, phenolics or more specific molecules, e.g.,glycosides and alkaloids [68,69].
Crosstalk between drought and salinity stresses results in secondary stresses such asoxidative and osmotic ones [66]. Drought stress is a major agricultural problem world-wide and almost all of the main agricultural lands are affected by drought stress. Thepotential mechanisms of drought tolerance include: (1) production of phytohormones(such as indole-3-acetic acid (IAA), cytokinins and abscisic acid (ABA)) (2) synthesis of ex-opolysaccharides (3) activity of 1-aminocyclopropane-1-carboxylic acid (ACC) deaminase(4) induced systemic tolerance [66,70].
4. Mechanisms of Resistance in Plants
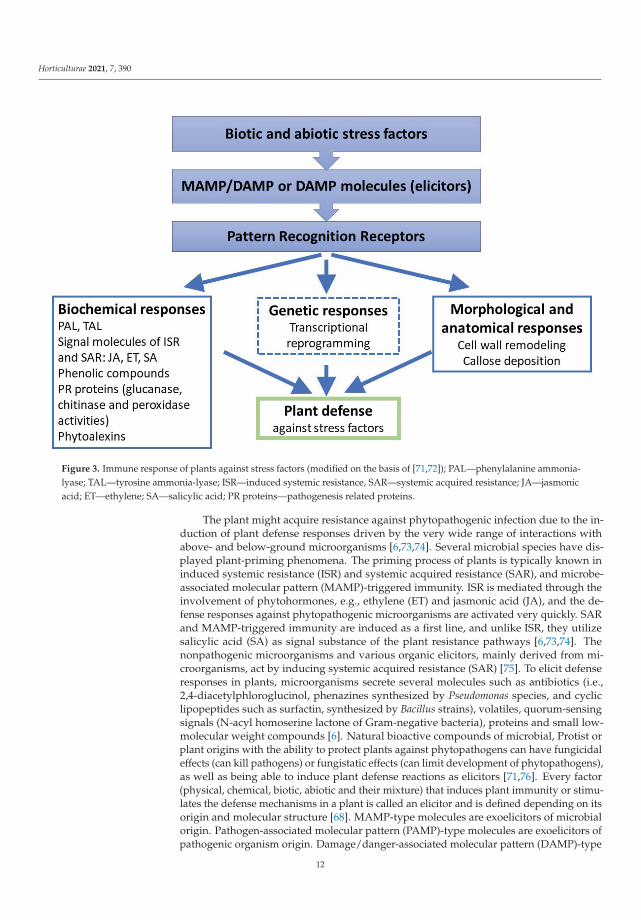
Plants are capable of defending themselves against numerous stress factors, bothbiotic and abiotic ones, by activating very effective pathways of immunity (Figure 3).
11
Horticulturae 2021, 7, 390
Figure 3. Immune response of plants against stress factors (modified on the basis of [71,72]); PAL—phenylalanine ammonia-lyase; TAL—tyrosine ammonia-lyase; ISR—induced systemic resistance, SAR—systemic acquired resistance; JA—jasmonicacid; ET—ethylene; SA—salicylic acid; PR proteins—pathogenesis related proteins.
The plant might acquire resistance against phytopathogenic infection due to the in-duction of plant defense responses driven by the very wide range of interactions withabove- and below-ground microorganisms [6,73,74]. Several microbial species have dis-played plant-priming phenomena. The priming process of plants is typically known ininduced systemic resistance (ISR) and systemic acquired resistance (SAR), and microbe-associated molecular pattern (MAMP)-triggered immunity. ISR is mediated through theinvolvement of phytohormones, e.g., ethylene (ET) and jasmonic acid (JA), and the de-fense responses against phytopathogenic microorganisms are activated very quickly. SARand MAMP-triggered immunity are induced as a first line, and unlike ISR, they utilizesalicylic acid (SA) as signal substance of the plant resistance pathways [6,73,74]. Thenonpathogenic microorganisms and various organic elicitors, mainly derived from mi-croorganisms, act by inducing systemic acquired resistance (SAR) [75]. To elicit defenseresponses in plants, microorganisms secrete several molecules such as antibiotics (i.e.,2,4-diacetylphloroglucinol, phenazines synthesized by Pseudomonas species, and cycliclipopeptides such as surfactin, synthesized by Bacillus strains), volatiles, quorum-sensingsignals (N-acyl homoserine lactone of Gram-negative bacteria), proteins and small low-molecular weight compounds [6]. Natural bioactive compounds of microbial, Protist orplant origins with the ability to protect plants against phytopathogens can have fungicidaleffects (can kill pathogens) or fungistatic effects (can limit development of phytopathogens),as well as being able to induce plant defense reactions as elicitors [71,76]. Every factor(physical, chemical, biotic, abiotic and their mixture) that induces plant immunity or stimu-lates the defense mechanisms in a plant is called an elicitor and is defined depending on itsorigin and molecular structure [68]. MAMP-type molecules are exoelicitors of microbialorigin. Pathogen-associated molecular pattern (PAMP)-type molecules are exoelicitors ofpathogenic organism origin. Damage/danger-associated molecular pattern (DAMP)-type
12

Horticulturae 2021, 7, 390
molecules are endoelicitors of plant origin released during phytopathogen infection or pro-duced under various stresses, [77–79]. Receptor proteins in the plasma membrane-patternrecognition receptors (PRRs) recognize particular molecular patterns of MAMP/PAMPand DAMP molecules [80,81]. The priming or PAMP-triggered, (PTI)-type local immunity,which arises in the absence of virulent pathogens, is due to the rapid onset of intracellular-signaling-pathway activation leading to a very fast and effective defense responses in theplant [82].
In plants, a range of abiotic and biotic elicitors can strengthen tolerance to droughtstress, including alginate-derived oligosaccharides, ketoconazole, 2-aminoethanol, ABA,brassinosteroids, and beneficial microorganisms such as Rhizobium strains, endo- and exo-mycorrhizal rhizospheric and endophytic nonpathogenic fungi. These elicitors reduced thecontent of monodehydroascorbate, prevented the accumulation of ROS, increased activitiesof antioxidant enzymes, and maintained fresh and dry weights, grain yield, and relativewater content in a variety of plants in response to drought stress [83]. The term “inducedsystemic tolerance” (IST) has been suggested for PGPB-induced physical and chemicalalterations that result in enhanced tolerance to abiotic stresses [70,84,85].
5. Bacteria Supporting Horticultural Crops
The most promising solution for the future of modern horticulture seems to be theskillful use of biopreparations in the conventional crops and not limiting their use to anarrow range of ecological or organic farming crops. Biopreparations include at least threetypes of products: (1) biocontrol, or biological plant protection inhibiting directly (antago-nism, competition) or indirectly (defense responses) the growth of phytopathogenic fungior bacteria and other pests such as insects and nematodes, (2) biostimulation, positivelyaffecting the plant development, increasing the plant biomass and yield, and (3) biofertil-ization, which provides nutrients and enhances plant nutrient uptake [6,29,71], (Table 1).The components of these biopreparations are very diverse, ranging from various inocu-lum types of microorganisms (either single or consortia of endophytic bacteria, fungi andProtista strains belonging to the plant growth-promoting group), through to metabolites,including phytohormonal and hormonelike substances or parts of microorganism cells,to various metabolites and structural compounds derived from microorganisms, Protistaand plants often acting as the plant resistance elicitors [6,86]. Interestingly, the componentsof biopreparations are composed in such a way that, while performing biocontrol, biofer-tilizer and biostimulant functions [87–91], they reduce the impact of stresses caused bythe numerous and dynamically changing environmental factors. Among these factors arerapid shifts in the temperature and humidity leading to the formation of drought, whichreduces the availability of nutrients.
A very common approach is the isolation and application of active microorganisms tosimilar or the same plant and conditions, e.g., a Pseudomonas IACRBru1 strain isolated fromEruca versicaria (rucola) tissues improved Lactuca sativa (lettuce) biomass (up to 30%) [92].One of the critical steps for the successful application of microorganisms is their survivaland development in the new environment. In drought-stressed soils, the highest efficiencyof this inoculation could be achieved using drought-tolerant bacteria isolated from arid soilsor drought-resistant plants [93–95]. Bacteria classified as Bacillus subtilis, Bacillus altitudinis,Brevibacillus laterosporus and Bacillus mojavensis were isolated from Cistanthe longiscapa, aplant native to Atacama Desert in Chile [94]. A consortium of these microorganisms, withvarious complementary properties such as phosphate solubilization, the ability to grow onN-free culture, IAA, ACC-deaminase, and exopolysaccharide (EPS) synthesis, were appliedonto tomato seeds, improving seedlings growth under drought stress.
13
Horticulturae 2021, 7, 390
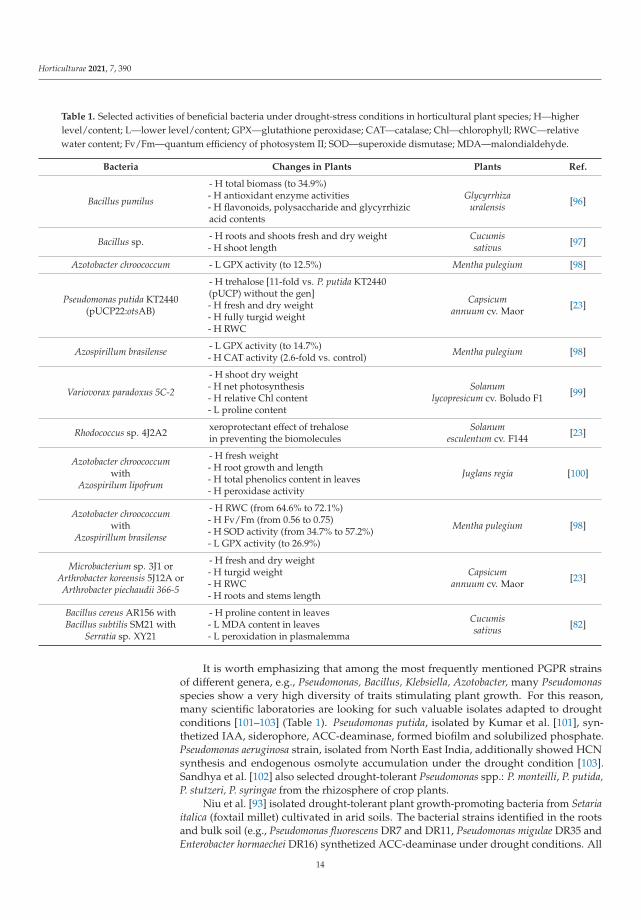
Table 1. Selected activities of beneficial bacteria under drought-stress conditions in horticultural plant species; H—higherlevel/content; L—lower level/content; GPX—glutathione peroxidase; CAT—catalase; Chl—chlorophyll; RWC—relativewater content; Fv/Fm—quantum efficiency of photosystem II; SOD—superoxide dismutase; MDA—malondialdehyde.
Bacteria Changes in Plants Plants Ref.
Bacillus pumilus
- H total biomass (to 34.9%)- H antioxidant enzyme activities- H flavonoids, polysaccharide and glycyrrhizicacid contents
Glycyrrhizauralensis [96]
Bacillus sp. - H roots and shoots fresh and dry weight- H shoot length
Cucumissativus [97]
Azotobacter chroococcum - L GPX activity (to 12.5%) Mentha pulegium [98]
Pseudomonas putida KT2440(pUCP22:otsAB)
- H trehalose [11-fold vs. P. putida KT2440(pUCP) without the gen]- H fresh and dry weight- H fully turgid weight- H RWC
Capsicumannuum cv. Maor [23]
Azospirillum brasilense - L GPX activity (to 14.7%)- H CAT activity (2.6-fold vs. control) Mentha pulegium [98]
Variovorax paradoxus 5C-2
- H shoot dry weight- H net photosynthesis- H relative Chl content- L proline content
Solanumlycopresicum cv. Boludo F1 [99]
Rhodococcus sp. 4J2A2 xeroprotectant effect of trehalosein preventing the biomolecules
Solanumesculentum cv. F144 [23]
Azotobacter chroococcumwith
Azospirilum lipofrum
- H fresh weight- H root growth and length- H total phenolics content in leaves- H peroxidase activity
Juglans regia [100]
Azotobacter chroococcumwith
Azospirillum brasilense
- H RWC (from 64.6% to 72.1%)- H Fv/Fm (from 0.56 to 0.75)- H SOD activity (from 34.7% to 57.2%)- L GPX activity (to 26.9%)
Mentha pulegium [98]
Microbacterium sp. 3J1 orArthrobacter koreensis 5J12A orArthrobacter piechaudii 366-5
- H fresh and dry weight- H turgid weight- H RWC- H roots and stems length
Capsicumannuum cv. Maor [23]
Bacillus cereus AR156 withBacillus subtilis SM21 with
Serratia sp. XY21
- H proline content in leaves- L MDA content in leaves- L peroxidation in plasmalemma
Cucumissativus [82]
It is worth emphasizing that among the most frequently mentioned PGPR strainsof different genera, e.g., Pseudomonas, Bacillus, Klebsiella, Azotobacter, many Pseudomonasspecies show a very high diversity of traits stimulating plant growth. For this reason,many scientific laboratories are looking for such valuable isolates adapted to droughtconditions [101–103] (Table 1). Pseudomonas putida, isolated by Kumar et al. [101], syn-thetized IAA, siderophore, ACC-deaminase, formed biofilm and solubilized phosphate.Pseudomonas aeruginosa strain, isolated from North East India, additionally showed HCNsynthesis and endogenous osmolyte accumulation under the drought condition [103].Sandhya et al. [102] also selected drought-tolerant Pseudomonas spp.: P. monteilli, P. putida,P. stutzeri, P. syringae from the rhizosphere of crop plants.
Niu et al. [93] isolated drought-tolerant plant growth-promoting bacteria from Setariaitalica (foxtail millet) cultivated in arid soils. The bacterial strains identified in the rootsand bulk soil (e.g., Pseudomonas fluorescens DR7 and DR11, Pseudomonas migulae DR35 andEnterobacter hormaechei DR16) synthetized ACC-deaminase under drought conditions. All
14
Horticulturae 2021, 7, 390
the isolates produced EPS, but IAA activity was confirmed only in DR35 culture. Similarly,Pseudomonas sp. isolated from Californian soil exposed to frequent drought also showedsignificant production of EPS in response to desiccation [104].
Belonging to the PGPR family, Azospirillum spp. (Table 1) are a group of free-livingsoil bacteria mainly known for their ability to fix atmospheric nitrogen but also for re-leasing phytohormones, enhancing root growth, water and mineral uptake and plantresistance to drought stress [105,106] (Table 1). As a microbial inoculant, Azospirillum spp.could be crucial to improve fruit-tree acclimatization when transferred to the post-vitroenvironment [106].
Mariotti et al. [105] revealed that Azospirillum baldaniorum cells and their metabolitespromote Ocimum basilicum cv. Red Rubin (purple basil) growth under the water stresscondition. This action was attributed to the synthesis and transport of phytohormonesthat promoted plant growth and conferred tolerance to the abiotic stress. The plant leavestreated with a relevantly high dose of the filtered culture supernatants of A. baldaniorumcontained significantly higher concentration of chlorophyll a and b, total chlorophyll,carotenoids, and anthocyanins. In the presence of these bacteria, in the tissues of purplebasil, the concentration of stress-related phytohormones, ABA, JA and SA were higher.Azospirillum brasilence accompanied by Pseudomonas sp. and Bacillus lentus also caused ahigher level of chlorophyll content in Ocimum basilicum grown under drought stress [107].
Moreover, at the end of the growing season, certain soil species, including soil-borneendophytic microorganisms promoting plant growth (e.g., including Bacillus, Clostridiumand Sporolactobacillus genera), form endospores capable of remaining dormant in the soil.It is extremely important that in adverse environmental conditions (e.g., drought, veryhigh or low temperature or higher amounts of incoming solar radiation) [1,108,109], whenspores encounter the appropriate conditions (for example in the next growing season),they survive, germinate and the vegetative cells develop in the soil and are able to inhabitplants [109].
A mixture of three PGPR strains (Bacillus cereus AR156, Bacillus subtilis SM21, andSerratia sp. XY21) (Table 1) stimulated IST in drought stress in cucumber plants by main-taining the root recovery intensity, reducing plasmalemma peroxidation, stabilizing theosmotic potential, increasing photosynthesis efficiency and activities of SOD and cyto-plasmic ascorbate peroxidase (APX) in the leaves, without involving the action of ACCdeaminase to the lower plant ethylene levels [83].
5.1. Bacillus Species in Drought Stress
Among the features of the soil-aerobic, rod-shaped cells of Bacillus species (Table 1)contributing to the biocontrol mechanism is the synthesis and secretion of various an-timicrobial peptides and very diverse antibiotics, enzymes, other proteins and organiccompounds [110,111]. Inoculation of Cucumis sativus (cucumber) with Bacillus cereus andBacillus subtilis strains along with Serratia sp. induced systemic tolerance to drought stressin plants by maintaining photosynthetic efficiency, root vigor, increasing proline contentand enhanced SOD and CAT activities in the leaves [83]. In another experiment, to enhanceLycopersicon esculentum (tomato) drought tolerance, Bacillus cereus AR156 supernatant wasapplied. In the treated plants, chlorophyll a and b contents, as well as the activities of SOD,POD and CAT were increased markedly after culture supernatant application [112].
Plant small heat shock proteins (sHSPs) act as molecular chaperones that preventirreversible aggregation of denatured proteins [85]. During drought stress, pepper plantsinoculated with Bacillus licheniformis K11 exhibited enhanced transcription of Cadhn, VA,sHSP, and CaPR-10 genes [113,114]. In the study of Lim and Kim [113], the Capsicumannuum (pepper) seedlings were treated with a Bacillus licheniformis strain originated fromKorean soil. Plants inoculated with drought-tolerant bacteria achieved higher shoot lengthand dry weight, and the analysis of gene expression in pepper roots indicated higher levelsof expression of four genes related to drought and cold stresses. Bacillus sp. selected forhigh levels of cytokine synthesis was introduced into 12-day old L. sativa grown in dry soil.
15

Horticulturae 2021, 7, 390
After 3 weeks of seedlings inoculation, the increased amount of cytokinin and higher freshand dry weights of shoots were confirmed [115].
At the beginning of vegetative season, higher temperature induces microbial metabolism(including releasing of inorganic available P to the soil solution by phosphate solubilizingmicroorganisms (PSM)) [116]. Gradually, the lack of adequate precipitation, insufficientsoil moisture and high temperature decreased the soil microbial activity and the movementof nutrients in the soil [62]. Bacillus strains are commonly known to be great phosphatesolubilizers [110]. Ying et al. [18] revealed high phosphatase activity of Bacillus megatheriumand inorganic phosphate solubilization of Bacillus saryghattati strains under drought stress.Bacillus spp. (B. cultidtuctinus, B. subtilis, B. polymyxa and B. mojavensis) isolated fromthe Cistanthe longiscapa rhizosphere grown in the Atacama Desert (Chile) also exhibitedphosphate-solubilizing activity [94].
It is worth noting that the activity of phosphate-solubilizing Bacillus strains supportvery energy-consuming processes of nitrogen fixation. Available P is a crucial ingredient ofthe energy source ATP. It can also replace conventional fertilization. An effective action on Nand P uptake by the Vicia faba (faba bean) seeds and straws was confirmed after inoculationwith the well-known phosphate-solubilizing bacterium Bacillus megatherium [117]. Afterinoculation of the apple trees cv. ‘Topaz’ with ‘Mycostat’ (containing Bacillus subtilis amongstrains promoting plant growth) the P root content was the same as in the tissues treatedwith chemical NPK fertilizer [89]. In addition, when soil moisture declined, the limiteddiffusion rate of nutrients, particularly P, from the soil matrix into the absorbing surfacenegatively affected nodulation and biological nitrogen fixation [118].
Plants with symptoms of potassium deficiency show accelerated wilting and loweryield, causing the loss of control of turgor-driven leaf movements [119]. Bacillus strains cansecrete acidic metabolites (e.g., oxalic, fumaric, lemon, tartaric acids) that dissolve variousminerals. Avakyan [120] demonstrated the ability to produce a thick EPS envelope by thestrain Bacillus mucilaginosus. Secretion of the acidic metabolites by B. mucilaginosus cellscreates a zone of strong acidification at the soil minerals’ surface and allows the dissolutionof mineral compounds. The polysaccharides secreted by these microorganisms additionallystrongly adsorb SiO3
−2 leaving bioavailable K cations for plants in the soil solution [121].The plant root is involved in the perception and transduction of stress signals via
phytoregulators such as ET [122]. The increased level of ET causes premature agingof fruits and vegetables; wilting of flowers and leafy vegetables and defoliation of themature leaves. Additionally, higher concentrations of ET in the rhizosphere inhibitsarbuscular mycorrhizal fungi colonization and the root nodulation of legumes. A Bacillussubtilis (LDR2) strain isolated from the rhizosphere of drought-stressed plants, synthetizesACC deaminase-regulating ET concentration. In the experiment, a LDR2 strain revealedprotective mechanisms against the low water availability in soil, and improved Trigonellaplants’ weights (by 56%). Barnawall et al. [122] also demonstrated the enhanced nodulationand arbuscular mycorrhizal fungi colonization in the plants, which caused better nutrientuptake after inoculation of plants with B. subtilis.
In the face of climate change, certain future adaptations can be predicted by observingthe functioning of organisms in extreme environments. In addition, in natural adverseecosystems, except for the ability to form spores, microorganisms support plant growthand simultaneously provide an optimal environment for the development of plants tis-sues [111,117,123], e.g., Bacillus mojavensis was isolated from the very extreme environmentof the Mojave Desert in California [111]. All the strains belonging to this group are de-scribed as endophytic and antagonistic to fungi [124]. The endophytic microorganisms(including both obligate and facultative species) are microbial symbionts residing withinplants, mostly influencing host physiology [36,111].
The B. mojavensis strain isolated from the soybean plant rhizosphere was a very antag-onistic strain, effectively controlling Rhizoctonia solani, a pathogenic fungus causing hugeharvest losses of horticultural crops [125,126]. The presence of endophytic microorganismswith the biocontrol actions of soil-borne pathogens and the ability to stimulate the growth
16

Horticulturae 2021, 7, 390
of cultivated plants from the early stages of its development seems to be a crucial solutionfor plants under unfavorable climate conditions. The inoculation of soybean seeds with theBacillus mojavensis PB 35(R11) strain enhanced the growth of plant inoculated with R. solani(about 30% higher plant fresh weight and over 100% higher plant dry weight) [111]. More-over, quantitative assays of the PB-35(R11) strain showed HCN, ammonia and siderophoreproduction, as well as phosphate solubilization and chitinase activity. The treatment ofseeds gives several advantages for the control of pathogenic fungi as a promising alterna-tive to the use of synthetic pesticides. The endophytic Bacillus inoculants are also knownfor controlling Fusarium species, especially Fusarium verticillioides [124,127].
5.2. Actinomycetes Species in Drought Stress
A more advantageous strategy is the selection of microorganisms adapted to function-ing in the conditions of temporary lack of water, drought, or rapid changes in temperature,because the metabolically active forms of microorganisms may support the growth ofsensitive horticultural crops. Actinomycetes are Gram-positive, mostly aerobic, saprotrophicbacteria of diverse phenotypes (from cocci to highly differentiated mycelia).
Tangles of filaments grow similarly to filamentous fungi. This pseudomycelial growth(surface, plunge or air) provides penetration of a larger soil volume and into pores ofsoil, easing access to valuable minerals and simultaneously making them available toplants [128].
The main place of Actinomycetes occurrence is the soil (warm and humid or dry), butthey are also identified in desert sands, on leaves and in plant tissues [129]. Reproductionof these bacteria occurs by fragmentation of pseudomycelium and spore formation. Thisgroup of microorganisms are mostly chemoorganotrophs with the ability to break downdifficult decomposing substrates, e.g., cellulose, chitin, steroids, higher fatty acids oraromatic compounds. These activities allow them to survive and outcompete the nativemicroflora in various ecological niches [130]. Lawlor et al. [131] revealed a higher numberof Actinomycetes colony forming units (CFU) (about 106 to 107 g−1 of dry weight of soil)than CFU of fungi (104 to 105 g−1 of dry weight of soil).
Actinomycetes are known to be producers of bioactive compounds (antibacterial, an-tifungal), exhibiting great potential in promoting plant growth [129]. Sousa et al. [3]investigated that the Streptomyces strains produce siderophores, phytohormones (IAA),and solubilizing phosphate compounds, and exhibit chitinase, xylanase, cellulase, amylaseand lipase activities. Additionally, the number of plant growth-promoting Actinobacteria is1.3 times higher than that of the other bacteria [132].
Khamna et al. [133] identified about 30 Streptomyces isolates in Thai soil samplescollected from the rhizospheres of plants such as Curcuma magga, Zingiber officinale (ginger),Ocimum sanctum (holy basil), and Cumbopogon citratus (lemongrass). After 3-day incu-bation, the Streptomyces CMU-H009 strain synthetized the highest concentration of IAA(about 144 μg · mL−1) and its culture filtrates stimulated Vigna unguiculata (cowpea) seedgermination. El-Tarabily [134] isolated over 60 Streptomyces spp. strains from a tomatorhizosphere in the United Arab Emirates and some of them revealed ACC-deaminase andIAA synthesis. The most efficient Streptomyces filipinensis 15, Streptomyces atrovirens 26 andStreptomyces albovinaceus 41 strains increased Lycopersicon esculentum (tomato) root andshoot length and dry weight. A higher level of endogenous IAA in the roots and shoots inthese plants was also confirmed. Actinomycetes exhibited great potential in promoting rice,sorghum [135], tomato [134], maize [136] and soybean seedling growth [137].
It is worth emphasizing that some Actinomycetes (e.g., Frankia sp.) function in asymbiosis with higher plants, fixing nitrogen, while the plant provides the bacteria withsugars and minerals [136]. Such a favorable relationship has been observed in soybeans,peas, Elaeagnus umbellata and Eleangus angustifolia (Russian olive) [138].
A variety of activities improving plant development have been indicated in the Acit-nomycetes species, and their efficiency obtained by adapting to adverse climatic conditionsenables them to receive commercial products containing PGPA (plant growth-promoting
17

Horticulturae 2021, 7, 390
actinobacteria), such as Streptomyces lydicus strains. Acitnomycetes species (Streptomyceskasugaensis, Streptomyces griseus and Streptomyces cacoi var. asoensis) producing antibacterialand antifungal bioactive compounds are components of biocontrol products applied againstplant pathogens [129]. Actinomycetes synthesize enzymes such as lysozyme, glucanases,peptide–peptide hydrolases, mannanase and chitinase, which are involved in the lysis ofthe cell walls of other microorganisms [128]. El Tarabily et al. [134] investigated the promo-tion and biological control of seedlings and the mature plants of C. sativus using endophyticActinomycetes (Actinoplanes campanulatus, Micromonospora chalcea and Streptomyces spiralis).Pythium aphanidermatum (oospore-producing soil-borne pathogen) causes seedling and rootdiseases of cucumber, causing damage to horticultural crops. This experiment proved thatActinomycetes colonize the roots of inoculated plants, promoted their growth and reducedthe impact of P. aphanidermatum. Furthermore, El Tarabily et al. [134] compared the impactof Actinomycetes with chemical fungicide (metalaxyl) and demonstrated the possibility ofreplacing fungicide with plant inoculation with endophytic Actinomycetes.
6. Plant Growth-Promoting Fungi in Horticultural Crops
Among microorganisms, fungi can be much more drought-tolerant than bacteria [139]due to a number of mechanisms to overcome drought stress, including osmolytes, thickcell walls, and melanin [140]. Yeast cells are encased in a protective cell wall and cells offilamentous fungi can be connected, allowing water and solutes to flow between them. Thefilamentous fungi produce extremally long hypha, enabling the extraction of water fromremote sites in the soil. Fungal abundance in the soil can increase under drought. They canremain active and even grow under extremely dry conditions. Their resistance to droughtallows them to conduct the basic processes of decomposition of polymer compounds andthe circulation of C and N [139]. Fungi, bacteria, seaweeds and plants are able to accumu-late osmoprotectants, for instance amino acids (e.g., proline, glutamate), carbohydrates(trehalose), sugar alcohols (inositol, mannitol), quaternary ammonium compounds (glycinebetaine) and tertiary sulphonium compounds (e.g., dimethylsulphoniopropionate) [141].
Plants use various mechanisms to protect against water deficiency, but some of themare associated with the presence of fungi with special activities (Table 2). Eukaryotic plantendophytes belong mainly to the fungi kingdom [142,143] and the most numerous amongthese endophytes are Glomeromycota (40%), Ascomycota (31%), Basidiomycota (20%),Zygomycota (0.1%) and unidentified phylla (8%). The Glomeromycota phyllum includesonly arbuscular mycorrhizal fungi (AMF), whose species protect against phytopathogens,promote plant growth and counteract diverse stresses (mainly drought and salinity) byactivating stress responsive/induced genes in plants. AMF are able to create a symbiosiswith many horticultural plants belonging to various families, e.g., Alliaceae, Apiaceae,Asteraceae, Fabaceae, Solanaceae, Rosaceae, and Oleaceae [144–146]. Arbuscular mycorrhiza(AM) is the endomycorrhizal symbiotic association improving the nutrient uptake andgrowth of plants which may protect the host plants from pathogens and the harmful effectsof drought [144,146,147]. Interactions with AMF, through an extensive network of hyphae,supply the plant with water from distant places. Studies have shown that AMF mainlyuse plant-derived carbohydrates in symbiosis with plants, and the plant receives access tothe bioavailable minerals absorbed by the fungus from the soil (especially phosphorus).Moreover, the hyphae of fungal strains can uptake phosphorus and ammonium ions muchmore efficiently than the plant roots [148].
Moreover, fungi may influence the hormonal balance of plants by producing phytohor-mones (auxins, gibberellins) and through tolerance and resistance pathways, which protectthe plant against biotic and abiotic factors. Both ectomycorrhizal (EMF, e.g., Laccaria spp.)-and endomycorrhizal-AMF fungi (e.g., belonging to the Glomus, Rhizophagus, Funneliformisgenera) are capable of inducing the ISR resistance pathways involving JA as a signaling sub-stance, or SAR, in which signaling occurs thanks to the SA molecules [149]. The productionof auxins by the fungal endophytes increases the growth of plants under stress [150]. Afterthe plant under stress is colonized by endophytes, stress-induced levels of ABA and some
18
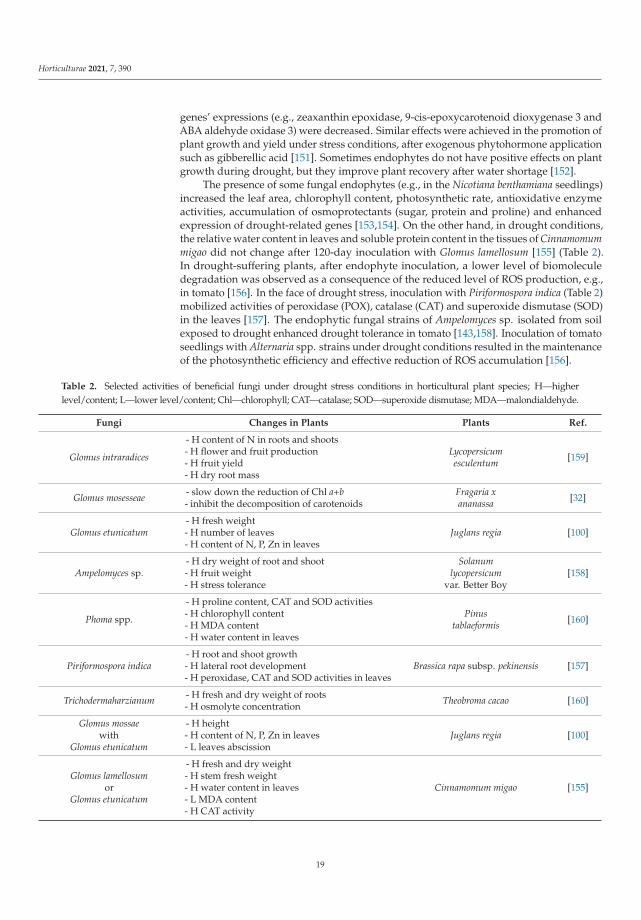
Horticulturae 2021, 7, 390
genes’ expressions (e.g., zeaxanthin epoxidase, 9-cis-epoxycarotenoid dioxygenase 3 andABA aldehyde oxidase 3) were decreased. Similar effects were achieved in the promotion ofplant growth and yield under stress conditions, after exogenous phytohormone applicationsuch as gibberellic acid [151]. Sometimes endophytes do not have positive effects on plantgrowth during drought, but they improve plant recovery after water shortage [152].
The presence of some fungal endophytes (e.g., in the Nicotiana benthamiana seedlings)increased the leaf area, chlorophyll content, photosynthetic rate, antioxidative enzymeactivities, accumulation of osmoprotectants (sugar, protein and proline) and enhancedexpression of drought-related genes [153,154]. On the other hand, in drought conditions,the relative water content in leaves and soluble protein content in the tissues of Cinnamomummigao did not change after 120-day inoculation with Glomus lamellosum [155] (Table 2).In drought-suffering plants, after endophyte inoculation, a lower level of biomoleculedegradation was observed as a consequence of the reduced level of ROS production, e.g.,in tomato [156]. In the face of drought stress, inoculation with Piriformospora indica (Table 2)mobilized activities of peroxidase (POX), catalase (CAT) and superoxide dismutase (SOD)in the leaves [157]. The endophytic fungal strains of Ampelomyces sp. isolated from soilexposed to drought enhanced drought tolerance in tomato [143,158]. Inoculation of tomatoseedlings with Alternaria spp. strains under drought conditions resulted in the maintenanceof the photosynthetic efficiency and effective reduction of ROS accumulation [156].
Table 2. Selected activities of beneficial fungi under drought stress conditions in horticultural plant species; H—higherlevel/content; L—lower level/content; Chl—chlorophyll; CAT—catalase; SOD—superoxide dismutase; MDA—malondialdehyde.
Fungi Changes in Plants Plants Ref.
Glomus intraradices
- H content of N in roots and shoots- H flower and fruit production- H fruit yield- H dry root mass
Lycopersicumesculentum [159]
Glomus mosesseae - slow down the reduction of Chl a+b- inhibit the decomposition of carotenoids
Fragaria xananassa [32]
Glomus etunicatum- H fresh weight- H number of leaves- H content of N, P, Zn in leaves
Juglans regia [100]
Ampelomyces sp.- H dry weight of root and shoot- H fruit weight- H stress tolerance
Solanumlycopersicum
var. Better Boy[158]
Phoma spp.
- H proline content, CAT and SOD activities- H chlorophyll content- H MDA content- H water content in leaves
Pinustablaeformis [160]
Piriformospora indica- H root and shoot growth- H lateral root development- H peroxidase, CAT and SOD activities in leaves
Brassica rapa subsp. pekinensis [157]
Trichodermaharzianum - H fresh and dry weight of roots- H osmolyte concentration Theobroma cacao [160]
Glomus mossaewith
Glomus etunicatum
- H height- H content of N, P, Zn in leaves- L leaves abscission
Juglans regia [100]
Glomus lamellosumor
Glomus etunicatum
- H fresh and dry weight- H stem fresh weight- H water content in leaves- L MDA content- H CAT activity
Cinnamomum migao [155]
19
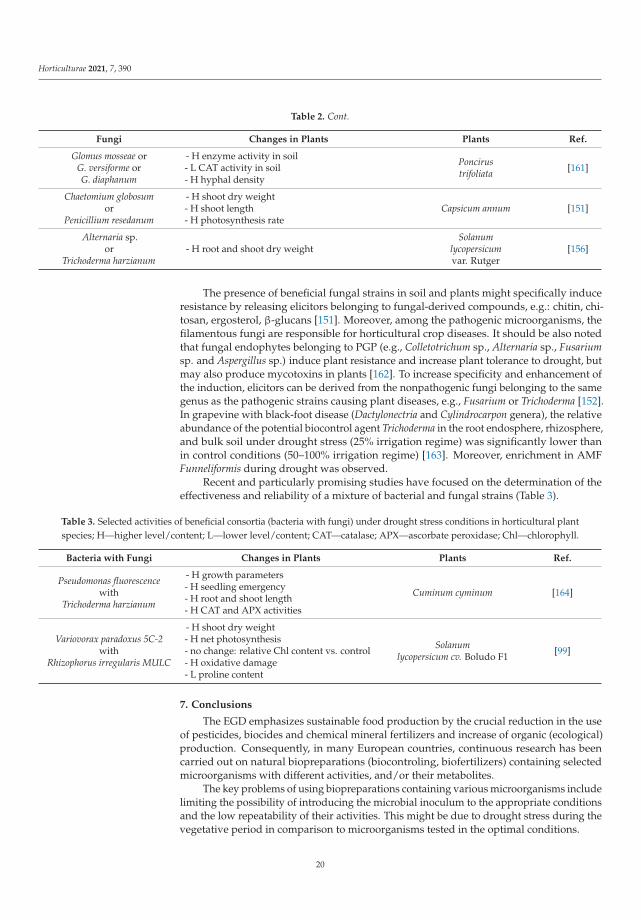
Horticulturae 2021, 7, 390
Table 2. Cont.
Fungi Changes in Plants Plants Ref.
Glomus mosseae orG. versiforme orG. diaphanum
- H enzyme activity in soil- L CAT activity in soil- H hyphal density
Poncirustrifoliata [161]
Chaetomium globosumor
Penicillium resedanum
- H shoot dry weight- H shoot length- H photosynthesis rate
Capsicum annum [151]
Alternaria sp.or
Trichoderma harzianum- H root and shoot dry weight
Solanumlycopersicumvar. Rutger
[156]
The presence of beneficial fungal strains in soil and plants might specifically induceresistance by releasing elicitors belonging to fungal-derived compounds, e.g.: chitin, chi-tosan, ergosterol, β-glucans [151]. Moreover, among the pathogenic microorganisms, thefilamentous fungi are responsible for horticultural crop diseases. It should be also notedthat fungal endophytes belonging to PGP (e.g., Colletotrichum sp., Alternaria sp., Fusariumsp. and Aspergillus sp.) induce plant resistance and increase plant tolerance to drought, butmay also produce mycotoxins in plants [162]. To increase specificity and enhancement ofthe induction, elicitors can be derived from the nonpathogenic fungi belonging to the samegenus as the pathogenic strains causing plant diseases, e.g., Fusarium or Trichoderma [152].In grapevine with black-foot disease (Dactylonectria and Cylindrocarpon genera), the relativeabundance of the potential biocontrol agent Trichoderma in the root endosphere, rhizosphere,and bulk soil under drought stress (25% irrigation regime) was significantly lower thanin control conditions (50–100% irrigation regime) [163]. Moreover, enrichment in AMFFunneliformis during drought was observed.
Recent and particularly promising studies have focused on the determination of theeffectiveness and reliability of a mixture of bacterial and fungal strains (Table 3).
Table 3. Selected activities of beneficial consortia (bacteria with fungi) under drought stress conditions in horticultural plantspecies; H—higher level/content; L—lower level/content; CAT—catalase; APX—ascorbate peroxidase; Chl—chlorophyll.
Bacteria with Fungi Changes in Plants Plants Ref.
Pseudomonas fluorescencewith
Trichoderma harzianum
- H growth parameters- H seedling emergency- H root and shoot length- H CAT and APX activities
Cuminum cyminum [164]
Variovorax paradoxus 5C-2with
Rhizophorus irregularis MULC
- H shoot dry weight- H net photosynthesis- no change: relative Chl content vs. control- H oxidative damage- L proline content
Solanumlycopersicum cv. Boludo F1 [99]
7. Conclusions
The EGD emphasizes sustainable food production by the crucial reduction in the useof pesticides, biocides and chemical mineral fertilizers and increase of organic (ecological)production. Consequently, in many European countries, continuous research has beencarried out on natural biopreparations (biocontroling, biofertilizers) containing selectedmicroorganisms with different activities, and/or their metabolites.
The key problems of using biopreparations containing various microorganisms includelimiting the possibility of introducing the microbial inoculum to the appropriate conditionsand the low repeatability of their activities. This might be due to drought stress during thevegetative period in comparison to microorganisms tested in the optimal conditions.
20

Horticulturae 2021, 7, 390
The resistance of plants that interact with microorganisms in drought conditions isenhanced because it is induced by both abiotic (stress factor) and the biotic (microorganism)elicitors. In drought conditions, many cultivated horticultural plants use their own numer-ous mechanisms (morphological, physiological, anatomical, biochemical or molecular) tocounteract the negative effects and are supported by endophytes that constantly inhabitthem, and rhizospheric microorganisms existing in the vicinity of roots.
The use of preparations containing fungal strains, which are more tolerant to droughtthan bacteria, provides many tolerance mechanisms, and their abundance increases inwater-limiting conditions. Fungi, through their specific growth and traits, allow intensivesoil exploration, water extraction and penetration of plant tissues influencing the plant andmight be more effective compared to bacteria with the same activity.
Studies on the influence of drought stress on horticultural plants have indicated thatthe application of various microorganisms allows efficient protection of plants, despite ourrestricted knowledge about these mechanisms of action. Due to such a high variability of theenvironment, biopreparations should be multicomponent in order to achieve appropriatelevels of microorganism cooperation and the final desired effect. The combination of fungaland bacterial strains into one preparation gives even better effectiveness and reliability,allowing us to consider higher crop-specificity, and seems to be particularly promising.
Author Contributions: Conceptualization, A.H.; E.O. and J.J.-S.; writing—original draft preparation,E.O.; A.H.; E.R. and J.J.-S.; writing—review and editing, A.H.; E.O.; E.R. and M.S.; visualization, A.H.;E.O.; E.R. and M.S. All authors have read and agreed to the published version of the manuscript.
Funding: This research received no external funding.
Institutional Review Board Statement: Not applicable.
Informed Consent Statement: Not applicable.
Conflicts of Interest: The authors declare no conflict of interest.
References
1. Moretti, C.L.; Mattos, L.M.; Calbo, A.G.; Sargent, S.A. Climate changes and potential impacts on postharvest quality of fruit andvegetable crops: A review. Food Res. Int. 2010, 43, 1824–1832. [CrossRef]
2. Hamid, B.; Zaman, M.; Farooq, S.; Fatima, S.; Sayyed, R.Z.; Baba, Z.A.; Sheikh, T.A.; Reddy, M.S.; El Enshasy, H.; Gafur, A.; et al.Bacterial plant biostimulants: A sustainable way towards improving growth, productivity, and health of crops. Sustainability2021, 13, 2856. [CrossRef]
3. Sousa, C.S.; Soares, A.C.F.; Garrido, M.S. Characterization of Streptomycetes with potential to promote plant growth and biocontrol.Sci. Agric. 2008, 65, 50–55. [CrossRef]
4. Shah, A.; Nazari, M.; Antar, M.; Msimbira, L.A.; Naamala, J.; Lyu, D.; Rabileh, M.; Zajonc, J.; Smith, D.L. PGPR in agriculture:A sustainable approach to increasing climate change resilience. Front. Sustain. Food Syst. 2021, 5, 1–22. [CrossRef]
5. International Society for Horticultural Science. Available online: https://www.ishs.org/defining-horticulture (accessed on27 September 2021).
6. Vishwakarma, K.; Kumar, N.; Shandilya, C.; Mohapatra, S.; Bhayana, S.; Varma, A. Revisiting plant-microbe interactions andmicrobial consortia application for enhancing sustainable agriculture: A review. Front. Microbiol. 2020, 11, 560406. [CrossRef]
7. Khan, N.; Ali, S.; Shahid, M.A.; Mustafa, A.; Sayyed, R.Z.; Curá, J.A. Insights into the interactions among roots, rhizosphere, andrhizobacteria for improving plant growth and tolerance to abiotic stresses: A review. Cells 2021, 10, 1551. [CrossRef]
8. Ullah, A.; Nisar, M.; Ali, H.; Hazrat, A.; Hayat, K.; Keerio, A.A.; Ihsan, M.; Laiq, M.; Ullah, S.; Fahad, S.; et al. Drought toleranceimprovement in plants: An endophytic bacterial approach. Appl. Microbiol. Biotechnol. 2019, 103, 7385–7397. [CrossRef]
9. Yan, L.; Zhu, J.; Zhao, X.; Shi, J.; Jiang, C.; Shao, D. Beneficial effects of endophytic fungi colonization on plants. Appl. Microbiol.Biotechnol. 2019, 103, 3327–3340. [CrossRef]
10. Cheng, Y.T.; Zhang, L.; He, S.Y. Plant-microbe interactions facing environmental challenge. Cell Host Microbe 2019, 26, 183–192.[CrossRef]
11. Kavadia, A.; Omirou, M.; Fasoula, D.; Ioannides, I.M. The importance of microbial inoculants in a climate-changing agriculture inEastern Mediterranean region. Atmosphere 2020, 11, 1136. [CrossRef]
12. Malik, A.; Mor, V.S.; Tokas, J.; Punia, H.; Malik, S.; Malik, K.; Sangwan, S.; Tomar, S.; Singh, P.; Singh, N.; et al. Biostimulant-treatedseedlings under sustainable agriculture: A global perspective facing climate change. Agronomy 2021, 11, 14. [CrossRef]
13. Porter, S.S.; Bantay, R.; Friel, C.A.; Garoutte, A.; Gdanetz, K.; Ibarreta, K.; Moore, B.M.; Shetty, P.; Siler, E.; Friesen, M.L. Beneficialmicrobes ameliorate abiotic and biotic sources of stress on plants. Funct. Ecol. 2020, 34, 2075–2086. [CrossRef]
21
Horticulturae 2021, 7, 390
14. Fincheira, P.; Quiroz, A.; Tortella, G.; Diez, M.C.; Rubilar, O. Current advances in plant-microbe communication via volatileorganic compounds as an innovative strategy to improve plant growth. Microbiol. Res. 2021, 247, 126726. [CrossRef] [PubMed]
15. Hanaka, A.; Ozimek, E.; Majewska, M.; Rysiak, A.; Jaroszuk-Sciseł, J. Physiological diversity of Spitsbergen soil microbialcommunities suggests their potential as plant growth-promoting bacteria. Int. J. Mol. Sci. 2019, 20, 1207. [CrossRef] [PubMed]
16. Hanaka, A.; Nowak, A.; Plak, A.; Dresler, S.; Ozimek, E.; Jaroszuk-Sciseł, J.; Wójciak-Kosior, M.; Sowa, I. Bacterial isolateinhabiting Spitsbergen soil modifies the physiological response of Phaseolus coccineus in control conditions and under exogenousapplication of methyl jasmonate and copper excess. Int. J. Mol. Sci. 2019, 20, 1909. [CrossRef] [PubMed]
17. Compant, S.; Van Der Heijden, M.G.A.; Sessitsch, A. Climate change effects on beneficial plant-microorganism interactions. FEMSMicrobiol. Ecol. 2010, 73, 197–214. [CrossRef]
18. Ma, Y.; Vosátka, M.; Freitas, H. Editorial: Beneficial microbes alleviate climatic stresses in plants. Front. Plant Sci. 2019, 10, 595.[CrossRef] [PubMed]
19. Vimal, S.R.; Singh, J.S.; Arora, N.K.; Singh, S. Soil-plant-microbe interactions in stressed agriculture management: A review.Pedosphere 2017, 27, 177–192. [CrossRef]
20. Gupta, S.; Seth, R.; Sharma, A. Plant Growth-Promoting Rhizobacteria Play a Role as Phytostimulators for Sustainable Agriculture;Choudhary, D., Varma, A., Tuteja, N., Eds.; Springer: Singapore, 2016.
21. Ma, Y.; Oliveira, R.S.; Freitas, H.; Zhang, C. Biochemical and molecular mechanisms of plant-microbe-metal interactions:Relevance for phytoremediation. Front. Plant Sci. 2016, 7, 918. [CrossRef]
22. Pirttilä, A.M.; Tabas, H.M.P.; Baruah, N.; Koskimäki, J.J. Biofertilizers and biocontrol agents for agriculture: How to identify anddevelop new potent microbial strains and traits. Microorganisms 2021, 9, 817. [CrossRef]
23. Vílchez, J.I.; García-Fontana, C.; Román-Naranjo, D.; González-López, J.; Manzanera, M. Plant drought tolerance enhancement bytrehalose production of desiccation-tolerant microorganisms. Front. Microbiol. 2016, 7, 1577. [CrossRef]
24. Finkel, O.M.; Castrillo, G.; Herrera Paredes, S.; Salas González, I.; Dangl, J.L. Understanding and exploiting plant beneficialmicrobes. Curr. Opin. Plant Biol. 2017, 38, 155–163. [CrossRef] [PubMed]
25. Meena, K.K.; Sorty, A.M.; Bitla, U.M.; Choudhary, K.; Gupta, P.; Pareek, A.; Singh, D.P.; Prabha, R.; Sahu, P.K.; Gupta, V.K.; et al.Abiotic stress responses and microbe-mediated mitigation in plants: The omics strategies. Front. Plant Sci. 2017, 8, 172. [CrossRef][PubMed]
26. Anjum, S.A.; Ashraf, U.; Zohaib, A.; Tanveer, M.; Naeem, M.; Ali, I.; Tabassum, T.; Nazir, U. Growth and developmental responsesof crop plants under drought stress: A review. Zemdirb. Agric. 2017, 104, 267–276. [CrossRef]
27. Sharma, M.; Sudheer, S.; Usmani, Z.; Rani, R.; Gupta, P. Deciphering the omics of plant-microbe interaction: Perspectives andnew insights. Curr. Genom. 2020, 21, 343–362. [CrossRef]
28. Vasseur-Coronado, M.; du Boulois, H.D.; Pertot, I.; Puopolo, G. Selection of plant growth promoting rhizobacteria sharing suitablefeatures to be commercially developed as biostimulant products. Microbiol. Res. 2021, 245, 1–10. [CrossRef]
29. Pylak, M.; Oszust, K.; Frac, M. Review report on the role of bioproducts, biopreparations, biostimulants and microbial inoculantsin organic production of fruit. Rev. Environ. Sci. Biotechnol. 2019, 18, 597–616. [CrossRef]
30. Kränzlein, M.; Geilfus, C.-M.; Franzisky, B.L.; Zhang, X.; Wimmer, M.A.; Zörb, C. Physiological responses of contrasting maize(Zea mays L.) hybrids to repeated drought. J. Plant Growth Regul. 2021. [CrossRef]
31. Jamil, M.; Ahamd, M.; Anwar, F.; Zahir, Z.A.; Kharal, M.A.; Nazli, F. Inducing drought tolerance in wheat through combined useof L-tryptophan and Pseudomonas fluorescens. Pak. J. Agric. Sci. 2018, 55, 331–337. [CrossRef]
32. Yin, B.; Wang, Y.; Liu, P.; Hu, J.; Zhen, W. Effects of vesicular-arbuscular mycorrhiza on the protective system in strawberry leavesunder drought stress. Front. Agric. China 2010, 4, 165–169. [CrossRef]
33. Hone, H.; Mann, R.; Yang, G.; Kaur, J.; Tannenbaum, I.; Li, T.; Spangenberg, G.; Sawbridge, T. Profiling, isolation and characterisa-tion of beneficial microbes from the seed microbiomes of drought tolerant wheat. Sci. Rep. 2021, 11, 11916. [CrossRef]
34. Zapata, T.; Galindo, D.M.; Corrales-Ducuara, A.R.; Ocampo-Ibáñez, I.D. The diversity of culture-dependent gram-negativeRhizobacteria associated with manihot esculenta crantz plants subjected to water-deficit stress. Diversity 2021, 13, 366. [CrossRef]
35. Mustafa, S.; Kabir, S.; Shabbir, U.; Batool, R. Plant growth promoting rhizobacteria in sustainable agriculture: From theoretical topragmatic approach. Symbiosis 2019, 78, 115–123. [CrossRef]
36. Ozimek, E.; Hanaka, A. Mortierella species as the plant growth-promoting fungi present in the agricultural soils. Agriculture 2021,11, 7. [CrossRef]
37. IPCC Climate Change. The Physical Science Basis 2021; IPCC Climate Change: Geneva, Switzerland, 2021.38. Lelieveld, J.; Hadjinicolaou, P.; Kostopoulou, E.; Chenoweth, J.; El Maayar, M.; Giannakopoulos, C.; Hannides, C.; Lange, M.A.;
Tanarhte, M.; Tyrlis, E.; et al. Climate change and impacts in the Eastern Mediterranean and the Middle East. Clim. Chang. 2012,114, 667–687. [CrossRef] [PubMed]
39. Ilyas, M.; Nisar, M.; Khan, N.; Hazrat, A.; Khan, A.H.; Hayat, K.; Fahad, S.; Khan, A.; Ullah, A. Drought tolerance strategies inplants: A mechanistic approach. J. Plant Growth Regul. 2021, 40, 926–944. [CrossRef]
40. Hanaka, A.; Plak, A.; Zagórski, P.; Ozimek, E.; Rysiak, A.; Majewska, M.; Jaroszuk-Sciseł, J. Relationships between the propertiesof Spitsbergen soil, number and biodiversity of rhizosphere microorganisms, and heavy metal concentration in selected plantspecies. Plant Soil 2019, 436, 49–69. [CrossRef]
41. Medrek, K.; Gluza, A.; Siwek, K.; Zagórski, P. The meteorological conditions on the Calypsobyen in summer 2014 on thebackground of multiyear 1986–2011. Probl. Klim. Polar. 2014, 24, 37–50. (In Polish)
22
Horticulturae 2021, 7, 390
42. Franczak, Ł.; Kociuba, W.; Gajek, G. Runoff variability in the Scott River (SW Spitsbergen) in summer seasons 2012–2013 incomparison with the period 1986–2009. QuaGeo 2016, 35, 39–50. [CrossRef]
43. Hu, Y.; Xie, G.; Jiang, X.; Shao, K.; Tang, X.; Gao, G. The relationships between the free-living and particle-attached bacterialcommunities in response to elevated eutrophication. Front. Microbiol. 2020, 11, 423. [CrossRef]
44. Schimel, J.P. Life in dry soils: Effects of drought on soil microbial communities and processes. Annu. Rev. Ecol. Evol. Syst. 2018,49, 409–432. [CrossRef]
45. Manzanera, M. Dealing with water stress and microbial preservation. Environ. Microbiol. 2021, 23, 3351–3359. [CrossRef]46. Brás, T.A.; Seixas, J.; Carvalhais, N.; Jagermeyr, J. Severity of drought and heatwave crop losses tripled over the last five decades
in Europe. Environ. Res. Lett. 2021, 16, 065012. [CrossRef]47. Singh, R.; Parihar, P.; Singh, M.; Bajguz, A.; Kumar, J.; Singh, S.; Singh, V.P.; Prasad, S.M. Uncovering potential applications of
cyanobacteria and algal metabolites in biology, agriculture and medicine: Current status and future prospects. Front. Microbiol.2017, 8, 515. [CrossRef]
48. Camaille, M.; Fabre, N.; Clément, C.; Barka, E.A. Advances in wheat physiology in response to drought and the role of plantgrowth promoting rhizobacteria to trigger drought tolerance. Microorganisms 2021, 9, 687. [CrossRef]
49. Rysiak, A.; Dresler, S.; Hanaka, A.; Hawrylak-Nowak, B.; Strzemski, M.; Kovácik, J.; Sowa, I.; Latalski, M.; Wójciak, M. Hightemperature alters secondary metabolites and photosynthetic efficiency in Heracleum sosnowskyi. Int. J. Mol. Sci. 2021, 22, 4756.[CrossRef]
50. Abdelaal, K.; Alkahtani, M.; Attia, K.; Hafez, Y.; Király, L.; Künstler, A. The role of plant growth-promoting bacteria in alleviatingthe adverse effects of drought on plants. Biology 2021, 10, 520. [CrossRef] [PubMed]
51. Fang, Y.; Xiong, L. General mechanisms of drought response and their application in drought resistance improvement in plants.Cell. Mol. Life Sci. 2015, 72, 673–689. [CrossRef] [PubMed]
52. Luo, W.; Xu, C.; Ma, W.; Yue, X.; Liang, X.; Zuo, X.; Knapp, A.K.; Smith, M.D.; Sardans, J.; Dijkstra, F.A.; et al. Effects of extremedrought on plant nutrient uptake and resorption in rhizomatous vs bunchgrass-dominated grasslands. Oecologia 2018, 188,633–643. [CrossRef] [PubMed]
53. Manavalan, L.P.; Guttikonda, S.K.; Phan Tran, L.S.; Nguyen, H.T. Physiological and molecular approaches to improve droughtresistance in soybean. Plant Cell Physiol. 2009, 50, 1260–1276. [CrossRef] [PubMed]
54. Shao, H.B.; Chu, L.Y.; Jaleel, C.A.; Zhao, C.X. Water-deficit stress-induced anatomical changes in higher plants. Comptes RendusBiol. 2008, 331, 215–225. [CrossRef]
55. Reddy, A.R.; Chaitanya, K.V.; Vivekanandan, M. Drought-induced responses of photosynthesis and antioxidant metabolism inhigher plants. J. Plant Physiol. 2004, 161, 1189–1202. [CrossRef]
56. Abdelaal, K.A.A.; Hafez, Y.M.; El-Afry, M.M.; Tantawy, D.S.; Alshaal, T. Effect of some osmoregulators on photosynthesis, lipidperoxidation, antioxidative capacity, and productivity of barley (Hordeum vulgare L.) under water deficit stress. Environ. Sci.Pollut. Res. 2018, 25, 30199–30211. [CrossRef] [PubMed]
57. Hafez, Y.; Attia, K.; Alamery, S.; Ghazy, A.; Al-Doss, A.; Ibrahim, E.; Rashwan, E.; El-Maghraby, L.; Awad, A.; Abdelaal, K.Beneficial effects of biochar and chitosan on antioxidative capacity, osmolytes accumulation, and anatomical characters ofwater-stressed barley plants. Agronomy 2020, 10, 630. [CrossRef]
58. Hargravei, K.R.; Kolb, K.J.; Ewers, F.W.; Davis, S.D. Conduit diameter and drought-induced embolism in Salvia mellifera Greene(Labiatae). New Phytol. 1994, 126, 695–705. [CrossRef]
59. Liu, F.; Jensen, C.R.; Shahanzari, A.; Andersen, M.N.; Jacobsen, S.E. ABA regulated stomatal control and photosynthetic wateruse efficiency of potato (Solanum tuberosum L.) during progressive soil drying. Plant Sci. 2005, 168, 831–836. [CrossRef]
60. Ullah, A.; Mushtaq, H.; Fahad, S.; Hakim; Shah, A.; Chaudhary, H.J. Plant growth promoting potential of bacterial endophytes innovel association with Olea ferruginea and Withania coagulans. Microbiology 2017, 86, 119–127. [CrossRef]
61. Hussain, H.A.; Hussain, S.; Khaliq, A.; Ashraf, U.; Anjum, S.A.; Men, S.; Wang, L. Chilling and drought stresses in crop plants:Implications, cross talk, and potential management opportunities. Front. Plant Sci. 2018, 9, 393. [CrossRef]
62. Ragel, P.; Raddatz, N.; Leidi, E.O.; Quintero, F.J.; Pardo, J.M. Regulation of K+ nutrition in plants. Front. Plant Sci. 2019, 10, 281.[CrossRef]
63. Wang, Z.; Li, G.; Sun, H.; Ma, L.; Guo, Y.; Zhao, Z.; Gao, H.; Mei, L. Effects of drought stress on photosynthesis and photosyntheticelectron transport chain in young apple tree leaves. Biol. Open 2018, 7. [CrossRef]
64. Zhang, Y.B.; Yang, S.L.; Dao, J.M.; Deng, J.; Shahzad, A.N.; Fan, X.; Li, R.D.; Quan, Y.J.; Bukhari, S.A.H.; Zeng, Z.H. Drought-induced alterations in photosynthetic, ultrastructural and biochemical traits of contrasting sugarcane genotypes. PLoS ONE 2020,15, e0235845. [CrossRef]
65. Cruz de Calvadio, M.H. Drought stress and reactive oxygen species. Plant Signal. Behav. 2008, 3, 156–165. [CrossRef]66. Verma, G.; Srivastava, D.; Tiwari, P.; Chakrabarty, D. Reactive oxygen, nitrogen and sulfur species in plants: Production,
metabolism, signaling and defense mechanisms. ROS modulation in crop plants under drought stress. In Reactive Oxygen,Nitrogen and Sulfur Species in Plants: Production, Metabolism, Signaling and Defense Mechanisms; Hasanuzzaman, M., Fotopoulos, V.,Nahar, K., Fujita, M., Eds.; Wiley: Hoboken, NJ, USA, 2019; pp. 311–336.
67. Petrov, V.; Hille, J.; Mueller-Roeber, B.; Gechev, T.S. ROS-mediated abiotic stress-induced programmed cell death in plants. Front.Plant Sci. 2015, 6, 1–16. [CrossRef]
23
Horticulturae 2021, 7, 390
68. Thakur, M.; Sohal, B.S. Role of elicitors in inducing resistance in plants against pathogen infection: A review. ISRN Biochem. 2013,2013, 1–10. [CrossRef]
69. Ali, S.; Khan, N. Delineation of mechanistic approaches employed by plant growth promoting microorganisms for improvingdrought stress tolerance in plants. Microbiol. Res. 2021, 249, 126771. [CrossRef] [PubMed]
70. Vardharajula, S.; Ali, S.Z.; Grover, M.; Reddy, G.; Bandi, V. Drought-tolerant plant growth promoting Bacillus spp.: Effect ongrowth, osmolytes, and antioxidant status of maize under drought stress. J. Plant Interact. 2011, 6, 1–14. [CrossRef]
71. Jamiołkowska, A. Natural compounds as elicitors of plant resistance against diseases and new biocontrol strategies. Agronomy2020, 10, 173. [CrossRef]
72. Walters, D.; Newton, A.; Lyon, G. (Eds.) Induced Resistance for Plant Defence. A Sustainable Approach to Crop Protection; BlackwellPublishing: Oxford, UK, 2007; ISBN 978-1-4051-3447-7.
73. Conrath, U.; Beckers, G.J.; Flors, V.; Garcia-Augustin, P.; Jakab, G.; Mauch, F.; Newman, M.-A.; Pieterse, C.M.J.; Poinssot, B.;Pozo, M.J.; et al. Priming: Getting ready for battle. Mol. Plant Microbe Interact. 2006, 19, 1062–1071. [CrossRef] [PubMed]
74. Martinez-Medina, A.; Flors, V.; Heil, M.; Mauch-Mani, B.; Pieterse, C.M.; Pozo, M.J.; Ton, J. Recognizing plant defense priming.Trends Plant Sci. 2016, 21, 818–822. [CrossRef]
75. Koziara, W.; Sulewska, H.; Panasiewicz, K. Effect of resistance stimulator application to some agricultural crops. J. Res. Appl.Agric. Eng. 2006, 51, 82–86.
76. Babosha, A.V. Changes in lectin activity in plants treated with resistance inducers. Plant Physiol. 2004, 31, 51–55. [CrossRef]77. Jones, J.D.G.; Dangl, J.L. The plant immune system. Nature 2006, 444, 323–329. [CrossRef] [PubMed]78. Boller, T.; Felix, G. A renaissance of elicitors: Perception of microbe-associated molecular patterns and danger signals by
pattern-recognition receptors. Annu. Rev. Plant Biol. 2009, 60, 379–407. [CrossRef] [PubMed]79. Henry, G.; Thonart, P.; Ongena, M. PAMPs, MAMPs, DAMPs and others: An update on the diversity of plant immunity elicitors.
Biotechnol. Agron. Soc. Environ. 2012, 16, 257–268.80. Schwessinger, B.; Ronald, P.C. Plant innate immunity: Perception of conserved microbial signatures. Annu. Rev. Plant Biol. 2012,
63, 451–482. [CrossRef]81. Ranf, S. Sensing of molecular patterns through cell surface immune receptors. Curr. Opin. Plant Biol. 2017, 38, 68–77. [CrossRef]82. Bigeard, J.; Colcombet, J.; Hirt, H. Signaling mechanisms in pattern-triggered immunity (PTI). Mol. Plant 2015, 8, 521–539.
[CrossRef]83. Wang, C.J.; Yang, W.; Wang, C.; Gu, C.; Niu, D.D.; Liu, H.X.; Wang, Y.P.; Guo, J.H. Induction of drought tolerance in cucumber
plants by a consortium of three plant growth-promoting Rhizobacterium strains. PLoS ONE 2012, 7, e52565. [CrossRef]84. Shrivastava, P.; Kumar, R. Soil salinity: A serious environmental issue and plant growth promoting bacteria as one of the tools for
its alleviation. Saudi J. Biol. Sci. 2015, 22, 123–131. [CrossRef]85. Singh, H.B.; Keswani, C.; Reddy, M.S.; Sansinenea, E.; García-Estrada, C. Secondary Metabolites of Plant Growth Promoting
Rhizomicroorganisms: Discovery and Applications; Springer: Singapore, 2019; ISBN 9789811358623.86. Oszust, K.; Pylak, M.; Frac, M. Trichoderma-based biopreparation with prebiotics supplementation for the naturalization of
raspberry plant rhizosphere. J. Mol. Sci. 2021, 22, 6356. [CrossRef]87. Timmusk, S.; Behers, L.; Muthoni, J.; Muraya, A.; Aronsson, A.C. Perspectives and challenges of microbial application for crop
improvement. Front. Plant Sci. 2017, 8, 49. [CrossRef]88. Sokolova, M.G.; Akimova, G.; Vaishlya, O.; Vedernikova, A. Physiological research of efficiency of biologically safe bacterial
fertilizers. J. Manuf. Technol. Manag. 2010, 21, 956–970. [CrossRef]89. Abd El-Gleel Mosa, W.F.; Paszt, L.S.; Frac, M.; Trzcinski, P.; Treder, W.; Klamkowski, K. The role of biofertilizers in improving
vegetative growth, yield and fruit quality of apple. Hortic. Sci. 2018, 45, 173–180. [CrossRef]90. Anli, M.; Baslam, M.; Tahiri, A.; Raklami, A.; Symanczik, S.; Boutasknit, A.; Ait-El-Mokhtar, M.; Ben-Laouane, R.; Toubali, S.;
Ait Rahou, Y.; et al. Biofertilizers as strategies to improve photosynthetic apparatus, growth, and drought stress tolerance in thedate palm. Front. Plant Sci. 2020, 11, 516818. [CrossRef] [PubMed]
91. Aseri, G.K.; Jain, N.; Panwar, J.; Rao, A.V.; Meghwal, P.R. Biofertilizers improve plant growth, fruit yield, nutrition, metabolismand rhizosphere enzyme activities of pomegranate (Punica granatum L.) in Indian Thar Desert. Sci. Hortic. 2008, 117, 130–135.[CrossRef]
92. Cipriano, M.A.P.; Lupatini, M.; Lopes-Santos, L.; da Silva, M.J.; Roesch, L.F.W.; Destéfano, S.A.L.; Freitas, S.S.; Kuramae, E.E.Lettuce and rhizosphere microbiome responses to growth promoting Pseudomonas species under field conditions. FEMS Microbiol.Ecol. 2016, 92, fiw197. [CrossRef]
93. Niu, X.; Song, L.; Xiao, Y.; Ge, W. Drought-tolerant plant growth-promoting rhizobacteria associated with foxtail millet in asemi-arid and their potential in alleviating drought stress. Front. Microbiol. 2018, 8, 2580. [CrossRef] [PubMed]
94. Astorga-Eló, M.; Gonzalez, S.; Acuña, J.J.; Sadowsky, M.J.; Jorquera, M.A. Rhizobacteria from ‘flowering desert’ events contributeto the mitigation of water scarcity stress during tomato seedling germination and growth. Sci. Rep. 2021, 11, 13745. [CrossRef]
95. Milet, A.; Chaouche, N.K.; Dehimat, L.; Kaki, A.A.; Mounira, K.A.; Philippe, T. Flow cytometry approach for studying theinteraction between Bacillus mojavensis and Alternaria alternata. Afr. J. Biotechnol. 2016, 15, 1417–1428. [CrossRef]
96. Xie, Z.; Chu, Y.; Zhang, W.; Lang, D.; Zhang, X. Bacillus pumilus alleviates drought stress and increases metabolite accumulationin Glycyrrhiza uralensis Fisch. Environ. Exp. Bot. 2019, 158, 99–106. [CrossRef]
24

Horticulturae 2021, 7, 390
97. Li, Y.; Shi, H.; Zhang, H.; Chen, S. Amelioration of drought effects in wheat and cucumber by the combined application of superabsorbent polymer and potential biofertilizer. PeerJ 2019, 7, e6073. [CrossRef]
98. Asghari, B.; Khademian, R.; Sedaghati, B. Plant growth promoting rhizobacteria (PGPR) confer drought resistance and stimulatebiosynthesis of secondary metabolites in pennyroyal (Mentha pulegium L.) under water shortage condition. Sci. Hortic. 2020,263, 109132. [CrossRef]
99. Calvo-Polanco, M.; Sánchez-Romera, B.; Aroca, R.; Asins, M.J.; Declerck, S.; Dodd, I.C.; Martínez-Andújar, C.; Albacete, A.;Ruiz-Lozano, J.M. Exploring the use of recombinant inbred lines in combination with beneficial microbial inoculants (AM fungusand PGPR) to improve drought stress tolerance in tomato. Environ. Exp. Bot. 2016, 131, 47–57. [CrossRef]
100. Behrooz, A.; Vahdati, K.; Rejali, F.; Lotfi, M.; Sarikhani, S.; Leslie, C. Arbuscular mycorrhiza and plant growth-promoting bacteriaalleviate drought stress in walnut. HortScience 2019, 54, 1087–1092. [CrossRef]
101. Kumar, M.; Mishra, S.; Dixit, V.; Kumar, M.; Agarwal, L.; Chauhan, P.S.; Nautiyal, C.S. Synergistic effect of Pseudomonas putidaand Bacillus amyloliquefaciens ameliorates drought stress in chickpea (Cicer arietinum L.). Plant Signal. Behav. 2016, 11. [CrossRef][PubMed]
102. Sandhya, V.; Ali, S.Z.; Grover, M.; Reddy, G.; Venkateswarlu, B. Effect of plant growth promoting Pseudomonas spp. on compatiblesolutes, antioxidant status and plant growth of maize under drought stress. Plant Growth Regul. 2010, 62, 21–30. [CrossRef]
103. Sarma, R.K.; Saikia, R. Alleviation of drought stress in mung bean by strain Pseudomonas aeruginosa GGRJ21. Plant Soil 2014, 377,111–126. [CrossRef]
104. Roberson, E.B.; Firestone, M.K. Relationship between desiccation and exopolysaccharide production in a soil Pseudomonas sp.Appl. Environ. Microbiol. 1992, 58, 1284–1291. [CrossRef] [PubMed]
105. Mariotti, L.; Scartazza, A.; Curadi, M.; Picciarelli, P.; Toffanin, A. Azospirillum baldaniorum sp245 induces physiological responsesto alleviate the adverse effects of drought stress in purple basil. Plants 2021, 10, 1141. [CrossRef]
106. Vettori, L.; Russo, A.; Felici, C.; Fiaschi, G.; Morini, S.; Toffanin, A. Improving micropropagation: Effect of Azospirillum brasilenseSp245 on acclimatization of rootstocks of fruit tree. J. Plant Interact. 2010, 5, 249–259. [CrossRef]
107. Heidari, M.; Mousavinik, S.M.; Golpayegani, A. Plant growth promoting Rhizobacteria (PGPR) effect on physiological parametersand mineral uptake in basil (Ociumum basilicum L.) under water stress. ARPN J. Agric. Biol. Sci. 2011, 6, 6–11.
108. Jones, P.D.; Lister, D.H.; Jaggard, K.W.; Pidgeon, J.D. Future climate impact on the productivity of sugar beet (Beta vulgaris L.) inEurope. Clim. Chang. 2003, 58, 98–103. [CrossRef]
109. Gauvry, E.; Mathot, A.-G.; Leguérinel, I.; Couvert, O.; Postollec, F.; Broussolle, V.; Coroller, L. Knowledge of the physiology ofspore-forming bacteria can explain the origin of spores in the food environment. Res. Microbiol. 2016, 168, 369–378. [CrossRef]
110. Radhakrishnan, R.; Hashem, A.; Abd Allah, E.F. Bacillus: A biological tool for crop improvement through bio-molecular changesin adverse environments. Front. Physiol. 2017, 8, 667. [CrossRef] [PubMed]
111. Prajakta, B.M.; Suvarna, P.P.; Raghvendra, S.P.; Alok, R.R. Potential biocontrol and superlative plant growth promoting activity ofindigenous Bacillus mojavensis PB-35 (R11) of soybean (Glycine max) rhizosphere. SN Appl. Sci. 2019, 1, 1143. [CrossRef]
112. Wang, C.; Guo, Y.; Wang, C.; Liu, H.; Niu, D.; Wang, Y.; Guo, J. Enhancement of tomato (Lycopersicon esculentum) tolerance todrought stress by plant-growth-promoting rhizobacterium (PGPR) Bacillus cereus AR. J. Agric. Biotechnol. 2012, 20, 1097–1105.
113. Lim, J.H.; Kim, S.D. Induction of drought stress resistance by multi-functional PGPR Bacillus licheniformis K11 in pepper. PlantPathol. J. 2013, 29, 201–208. [CrossRef]
114. Kaushal, M.; Wani, S.P. Plant-growth-promoting rhizobacteria: Drought stress alleviators to ameliorate crop production indrylands. Ann. Microbiol. 2016, 66, 35–42. [CrossRef]
115. Arkhipova, T.N.; Prinsen, E.; Veselov, S.U.; Martinenko, E.V.; Melentiev, A.I.; Kudoyarova, G.R. Cytokinin producing bacteriaenhance plant growth in drying soil. Plant Soil 2007, 292, 305–315. [CrossRef]
116. Kramer, S.; Green, D.M. Acid and alkaline phosphatase dynamics and their relationship to soil microclimate in a semiaridwoodland. Soil Biol. Biochem. 2000, 32, 179–188. [CrossRef]
117. Omer, A.M. Bioformulations of Bacillus spores for using as biofertilizer biovalorization of olive mill waste water for the productionof natural biofertilizers and antioxidants view project isolation and identification of fungi and bacteria from different Egyptian e.Life Sci. J. 2010, 7, 1097–8135.
118. O’Hara, G.W.; Boonkerd, N.; Dilworth, M.J. Mineral constraints to nitrogen fixation. Plant Soil 1988, 108, 93–110. [CrossRef]119. Xu, X.; Du, X.; Wang, F.; Sha, J.; Chen, Q.; Tian, G.; Zhu, Z.; Ge, S.; Jiang, Y. Effects of potassium levels on plant growth,
accumulation and distribution of carbon, and nitrate metabolism in apple Dwarf Rootstock seedlings. Front. Plant Sci. 2020,11, 904. [CrossRef] [PubMed]
120. Avakyan, Z.A. Silicon compounds in solution bacteria quartz degradation. Mikrobiologiya 1984, 54, 301–307.121. Malinovskaya, I.M.; Kosenko, L.V.; Votselko, S.K.; Podgorsky, V.S. The role of Bacillus mucilaginosus polysaccharide in the
destruction of silicate minerals. Mikrobiologiya 1990, 59, 70–78.122. Barnawal, D.; Maji, D.; Bharti, N.; Chanotiya, C.S.; Kalra, A. ACC deaminase-containing Bacillus subtilis reduces stress ethylene-
induced damage and improves mycorrhizal colonization and rhizobial nodulation in Trigonella foenum-graecum under droughtstress. J. Plant Growth Regul. 2013, 32, 809–822. [CrossRef]
123. Malusá, E.; Sas-Paszt, L.; Ciesielska, J. Technologies for beneficial microorganisms inocula used as biofertilizers. Sci. World J. 2012,1–12. [CrossRef]
25

Horticulturae 2021, 7, 390
124. Roberts, M.S.; Nakamura, L.K.; Cohan, F.M. Bacillus mojavensis sp. nov., distinguishable from Bacillus subtilis by sexual isolation,divergence in DNA sequence, and differences in fatty acid composition. Int. J. Syst. Bacteriol. 1994, 44, 256–264. [CrossRef][PubMed]
125. Cao, L.; Qiu, Z.; You, J.; Tan, H.; Zhou, S. Isolation and characterization of endophytic Streptomyces strains from surface-sterilizedtomato (Lycopersicon esculentum) roots. Lett. Appl. Microbiol. 2004, 39, 425–430. [CrossRef]
126. Moussa, T.A. Studies on biological control of sugar beet pathogen Rhizoctonia solani Kühn. J. Biol. Sci. 2002, 2, 800–804.127. Snook, M.E.; Mitchell, T.; Hinton, D.M.; Bacon, C.W. Isolation and characterization of Leu 7-surfactin from the endophytic
bacterium Bacillus mojavensis RRC 101, a biocontrol agent for Fusarium verticillioides. J. Agric. Food Chem. 2009, 57, 4287–4292.[CrossRef]
128. Romano-Armada, N.; Yañez-Yazlle, M.F.; Irazusta, V.P.; Rajal, V.B.; Moraga, N.B. Potential of bioremediation and PGP traits inStreptomyces as strategies for bio-reclamation of salt-affected soils for agriculture. Pathogens 2020, 9, 117. [CrossRef] [PubMed]
129. Hamedi, J.; Mohammadipanah, F. Biotechnological application and taxonomical distribution of plant growth promoting acti-nobacteria. J. Ind. Microbiol. Biotechnol. 2015, 42, 157–171. [CrossRef]
130. Chitraselvi, R.P.E. Actinomycetes: Dependable tool for sustainable agriculture. Curr. Investig. Agric. Curr. Res. 2018, 1, 128–130.[CrossRef]
131. Lawlor, K.; Knight, B.P.; Barbosa-Jefferson, V.L.; Lane, P.W.; Lilley, A.K.; Paton, G.I.; McGrath, S.P.; O’Flaherty, S.M.; Hirsch, P.R.Comparison of methods to investigate microbial populations in soils under different agricultural management. FEMS Microbiol.Ecol. 2000, 33, 129–137. [CrossRef] [PubMed]
132. Pierzynski, G.M.; Vance, G.F.; Sims, J.T. Soils and Environmental Quality; Taylor and Francis: Boca Raton, FL, USA, 2005.133. Khamna, S.; Yokota, A.; Peberdy, J.F.; Lumyong, S. Indole-3-acetic acid production by Streptomyces sp. isolated from some Thai
medicinal plant rhizosphere soils. Eur. Asian J. Biosci. 2010, 4, 23–32. [CrossRef]134. El-Tarabily, K.A. Promotion of tomato (Lycopersicon esculentum Mill.) plant growth by rhizosphere competent 1-aminocyclopropane-
1-carboxylic acid deaminase-producing Streptomycete Actinomycetes. Plant Soil 2008, 308, 161–174. [CrossRef]135. Gopalakrishnan, S.; Srinivas, V.; Vidya, M.S.; Rathore, A. Plant growth-promoting activities of Streptomyces spp. in sorghum and
rice. Springerplus 2013, 2, 1–8. [CrossRef]136. El-Sayed, S.F.; Hassan, H.A.; El-Mogy, M.M. Impact of bio- and organic fertilizers on potato yield, quality and tuber weight loss
after harvest. Potato Res. 2015, 58, 67–81. [CrossRef]137. Wahyudi, A.T.; Priyanto, J.A.; Afrista, R.; Kurniati, D.; Astuti, R.I.; Akhdiya, A. Plant growth promoting activity of Actinomycetes
isolated from soybean rhizosphere. Online J. Biol. Sci. 2019, 19, 1–8. [CrossRef]138. Tredici, P. Del Nitrogen fixation: The story of the Frankia symbiosis. Arnold Arbor. 1995, 55, 26–31.139. Treseder, K.K.; Berlemont, R.; Allison, S.D.; Martiny, A.C. Drought increases the frequencies of fungal functional genes related to
carbon and nitrogen acquisition. PLoS ONE 2018, 13, e0206441. [CrossRef] [PubMed]140. Treseder, K.K.; Lennon, J.T. Fungal traits that drive ecosystem dynamics on land. Microbiol. Mol. Biol. Rev. 2015, 79, 243–262.
[CrossRef] [PubMed]141. Jiménez-Arias, D.; García-Machado, F.J.; Morales-Sierra, S.; García-García, A.L.; Herrera, A.J.; Valdés, F.; Luis, J.C.; Borges, A.A.
A beginner’s guide to osmoprotection by biostimulants. Plants 2021, 10, 363. [CrossRef] [PubMed]142. Hardoim, P.R.; van Overbeek, L.S.; Berg, G.; Pirttilä, A.M.; Compant, S.; Campisano, A.; Döring, M.; Sessitsch, A. The hidden
world within plants: Ecological and evolutionary considerations for defining functioning of microbial endophytes. Microbiol. Mol.Biol. Rev. 2015, 79, 293–320. [CrossRef]
143. Verma, H.; Kumar, D.; Kumar, V.; Kumari, M.; Singh, S.K.; Sharma, V.K.; Droby, S.; Santoyo, G.; White, J.F.; Kumar, A.The potential application of endophytes in management of stress from drought and salinity in crop plants. Microorganisms 2021,9, 1729. [CrossRef]
144. Bizos, G.; Papatheodorou, E.M.; Chatzistathis, T.; Ntalli, N.; Aschonitis, V.G.; Monokrousos, N. The role of microbial inoculantson plant protection, growth stimulation, and crop productivity of the olive tree (Olea europea L.). Plants 2020, 9, 743. [CrossRef]
145. Bona, E.; Lingua, G.; Manassero, P.; Cantamessa, S.; Marsano, F.; Todeschini, V.; Copetta, A.; D’Agostino, G.; Massa, N.;Avidano, L.; et al. AM fungi and PGP Pseudomonads increase flowering, fruit production, and vitamin content in strawberrygrown at low nitrogen and phosphorus levels. Mycorrhiza 2015, 25, 181–193. [CrossRef]
146. Adamec, S.; Andrejiová, A. Mycorrhiza and stress tolerance of vegetables: A review. Acta Hortic. Regiotect. 2018, 21, 30–35.[CrossRef]
147. Marulanda, A.; Barea, J.M.; Azcón, R. Stimulation of plant growth and drought tolerance by native microorganisms (AM fungiand bacteria) from dry environments: Mechanisms related to bacterial effectiveness. J. Plant Growth Regul. 2009, 28, 115–124.[CrossRef]
148. Matias, S.R.; Pagano, M.C.; Muzzi, F.C.; Oliveira, C.A.; Carneiro, A.A.; Horta, S.N.; Scotti, M.R. Effect of rhizobia, mycorrhizalfungi and phosphate-solubilizing microorganisms in the rhizosphere of native plants used to recover an iron ore area in Brazil.Eur. J. Soil Biol. 2009, 45, 259–266. [CrossRef]
149. Dreischhoff, S.; Das, I.S.; Jakobi, M.; Kasper, K.; Polle, A. Local responses and systemic induced resistance mediated byectomycorrhizal fungi. Front. Plant Sci. 2020, 11, 590063. [CrossRef] [PubMed]
150. De Battista, J.P.; Bacon, C.W.; Severson, R.; Plattner, R.D. Indole acetic acid production by the fungal endophyte of Tall Fescue.Agron. J. 1990, 82, 878–880. [CrossRef]
26
Horticulturae 2021, 7, 390
151. Khan, A.L.; Waqas, M.; Khan, A.R.; Hussain, J.; Kang, S.M.; Gilani, S.A.; Hamayun, M.; Shin, J.H.; Kamran, M.; Al-Harrasi, A.;et al. Fungal endophyte Penicillium janthinellum LK5 improves growth of ABA-deficient tomato under salinity. World J. Microbiol.Biotechnol. 2013, 29, 2133–2144. [CrossRef] [PubMed]
152. Ren, A.; Clayy, K. Impact of a horizontally transmitted endophyte, Balansia henningsiana, on growth and drought tolerance ofPanicum rigidulum. Int. J. Plant Sci. 2009, 170, 599–608. [CrossRef]
153. Dastogeer, K.M.G.; Li, H.; Sivasithamparam, K.; Jones, M.G.K.; Wylie, S.J. Fungal endophytes and a virus confer drought toleranceto Nicotiana benthamiana plants through modulating osmolytes, antioxidant enzymes and expression of host drought responsivegenes. Environ. Exp. Bot. 2018, 149, 95–108. [CrossRef]
154. Davies, F.T.; Potter, J.R.; Linderman Davies, R.G.; Ft, R.; Linderman, R. Drought resistance of mycorrhizal pepper plantsindependent of leaf P concentration-response in gas exchange and water relations. Physiol. Plant. 1993, 87, 45–53. [CrossRef]
155. Liao, X.; Chen, J.; Guan, R.; Liu, J.; Sun, Q. Two arbuscular mycorrhizal fungi alleviates drought stress and improves plant growthin Cinnamomum migao seedlings. Mycobiology 2021, 49, 396–405. [CrossRef]
156. Azad, K.; Kaminskyj, S. A fungal endophyte strategy for mitigating the effect of salt and drought stress on plant growth. Symbiosis2016, 68, 73–78. [CrossRef]
157. Sun, C.; Johnson, J.M.; Cai, D.; Sherameti, I.; Oelmüller, R.; Lou, B. Piriformospora indica confers drought tolerance in Chinesecabbage leaves by stimulating antioxidant enzymes, the expression of drought-related genes and the plastid-localized CASprotein. J. Plant Physiol. 2010, 167, 1009–1017. [CrossRef]
158. Morsy, M.; Cleckler, B.; Armuelles-Millican, H. Fungal endophytes promote tomato growth and enhance drought and salttolerance. Plants 2020, 9, 877. [CrossRef]
159. Subramanian, K.S.; Santhanakrishnan, P.; Balasubramanian, P. Responses of field grown tomato plants to arbuscular mycorrhizalfungal colonization under varying intensities of drought stress. Sci. Hortic. 2006, 107, 245–253. [CrossRef]
160. Bae, H.; Sicher, R.C.; Kim, M.S.; Kim, S.H.; Strem, M.D.; Melnick, R.L.; Bailey, B.A. The beneficial endophyte Trichoderma hamatumisolate DIS 219b promotes growth and delays the onset of the drought response in Theobroma cacao. J. Exp. Bot. 2009, 60, 3279–3295.[CrossRef]
161. Wu, Q.S.; Xia, R.X.; Zou, Y.N. Improved soil structure and citrus growth after inoculation with three arbuscular mycorrhizal fungiunder drought stress. Eur. J. Soil Biol. 2008, 44, 122–128. [CrossRef]
162. Thirumalai, E.; Venkatachalam, A.; Suryanarayanan, T.S. Fungal endophytes of betel leaves: The need to study mycotoxin-producing endophytes in leafy vegetables. Sydowia 2020, 73, 83–88. [CrossRef]
163. Carbone, M.J.; Alaniz, S.; Mondino, P.; Gelabert, M.; Eichmeier, A.; Tekielska, D.; Bujanda, R.; Gramaje, D. Drought influencesfungal community dynamics in the grapevine rhizosphere and root microbiome. J. Fungi 2021, 7, 686. [CrossRef]
164. Piri, R.; Moradi, A.; Balouchi, H.; Salehi, A. Improvement of cumin (Cuminum cyminum) seed performance under drought stressby seed coating and biopriming. Sci. Hortic. 2019, 257, 108667. [CrossRef]
27


horticulturae
Article
Investigating Evolution and Balance of Grape Sugars andOrganic Acids in Some New Pathogen-Resistant WhiteGrapevine Varieties
Tommaso Frioni *, Cecilia Squeri, Filippo Del Zozzo, Paolo Guadagna, Matteo Gatti, Alberto Vercesi
and Stefano Poni
Citation: Frioni, T.; Squeri, C.; Del
Zozzo, F.; Guadagna, P.; Gatti, M.;
Vercesi, A.; Poni, S. Investigating
Evolution and Balance of Grape
Sugars and Organic Acids in Some
New Pathogen-Resistant White
Grapevine Varieties. Horticulturae
2021, 7, 229. https://doi.org/
10.3390/horticulturae7080229
Academic Editors: Agnieszka
Hanaka, Jolanta Jaroszuk-Sciseł
and Małgorzata Majewska
Received: 13 July 2021
Accepted: 2 August 2021
Published: 6 August 2021
Publisher’s Note: MDPI stays neutral
with regard to jurisdictional claims in
published maps and institutional affil-
iations.
Copyright: © 2021 by the authors.
Licensee MDPI, Basel, Switzerland.
This article is an open access article
distributed under the terms and
conditions of the Creative Commons
Attribution (CC BY) license (https://
creativecommons.org/licenses/by/
4.0/).
Department of Sustainable Crops Production, Università Cattolica del Sacro Cuore, 29122 Piacenza, Italy;[email protected] (C.S.); [email protected] (F.D.Z.); [email protected] (P.G.);[email protected] (M.G.); [email protected] (A.V.); [email protected] (S.P.)* Correspondence: [email protected]; Tel.: +39-05-2359-9384
Abstract: Breeding technologies exploiting marker-assisted selection have accelerated the selectionof new cross-bred pathogen-resistant grapevine varieties. Several genotypes have been patentedand admitted to cultivation; however, while their tolerance to fungal diseases has been the object ofseveral in vitro and field studies, their productive and fruit composition traits during ripening are stillpoorly explored, especially in warm sites. In this study, five white pathogen-resistant varieties (PRV)listed as UD 80–100, Soreli, UD 30–080, Sauvignon Rytos, Sauvignon Kretos were tested over twoconsecutive seasons in a site with a seasonal heat accumulation of about 2000 growing degree days(GDDs), and their performances were compared to two Vitis vinifera L. traditional varieties, Ortrugoand Sauvignon Blanc. Berries were weekly sampled from pre-veraison until harvest to determinetotal soluble solids (TSS) and titratable acidity (TA) dynamics. All tested PRV exhibited an earlieronset of veraison and a faster sugar accumulation, as compared to Ortrugo and Sauvignon Blanc,especially in 2019. At harvest, Sauvignon Blanc was the cultivar showing the highest titratable acidity(8.8 g/L). Ortrugo and PRV showed very low TA (about 4.7 g/L), with the exception of SauvignonRytos (6.5 g/L). However, data disclose that Sauvignon Rytos higher acidity at harvest relies onhigher tartrate (+1.1 to +2.2 g/L, as compared to other PRV), whereas in Sauvignon Blanc, high TA atharvest is due to either tartaric (+1 g/L, compared to PRV) and malic (+2.5 g/L, compared to PRV)acid retention. Overall, Sauvignon Rytos is the most suited PRV to be grown in a warm climate, whereretaining adequate acidity at harvest is crucial to produce high-quality white wines. Nevertheless,canopy and ripening management strategies must be significantly adjusted, as compared to thestandard practice employed for the parental Sauvignon Blanc.
Keywords: Vitis spp.; piwi cultivars; disease-resistant varieties; malic acid; ripening; fruit composi-tion; downy mildew
1. Introduction
Warming trends are severely endangering viticulture and its sustainability [1,2]. Inmany wine regions, the incidence of drought and the rise of temperature are affectingvineyard performances by compromising vine physiology, compressing phenology, andboosting grapes’ metabolism. In white varieties, especially when intended for sparklingwine, accelerated ripening leads to excessive sugars and inadequate acidity and aromasat harvest, resulting in unbalanced wines [1,3]. Moreover, the advancement of veraisonincreases the susceptibility of grapes to sunburn and dehydration phenomena by exposingripening berries to the hottest days of the year, when the evaporative demand is maxi-mum [2]. As a consequence, several wine regions are seeking either new cultural practicesviable to decompress sugar accumulation and acidity decrease, or late-ripening cultivars,especially when the target hits white and/or sparkling wines [1,4–6]. In addition, contrary
Horticulturae 2021, 7, 229. https://doi.org/10.3390/horticulturae7080229 https://www.mdpi.com/journal/horticulturae
29

Horticulturae 2021, 7, 229
to what one might think, fungal diseases are a serious issue also in warm and hot regions.Pathogen spread varies according to the seasonal weather evolution; the increase of averagetemperatures broadens the time window available for pathogens to complete additionalbiological cycles within one year [7]. Consequently, numerous pesticides applications arestill frequently needed during the season to control downy mildew (DM) and powderymildew (PM), even in warm climates. For instance, in northern Italy, where average heat ac-cumulation easily exceeds >2000 growing degree days (GDDs), several pesticides residueshave been detected in the groundwater [8].
Pathogen-resistant grapevine varieties (PRV) are complex interspecific hybrids ob-tained by multiple crossings of resistant Vitis spp. accessions (mostly V. amurensis, V.rupestris, and V. berlandieri) with selected cultivars of Vitis vinifera which, conversely, lacksgenetic resistance towards Plasmopara viticola (Pv) and Erisyphae necator (En). In mostMediterranean grape growing regions, adoption of PRV has been hindered for manydecades. Hindrance to PRV was not merely due to their botanical origins, yet to the factthat non-vinifera genotypes often carry undesired or atypical flavour, and wines are notappreciated [9–12].
Over the last decades, however, the increasing concerns of consumers about ecologicalissues and product safety, the rapid surge of organic (or environmentally certified) wines,and the spread of new awareness and values in modern society, have led to a renovatedinterest in PRV. Moreover, new breeding technologies have opened up new frontiers [9,11].For instance, in Italy, a few breeding programmes have originated new pathogen-resistantvarieties by marker-assisted selection (MAS) sorted out within progenies obtained bycrossing Vitis vinifera cultivars with complex hybrids having genetic resistance to DM andPM. MAS has considerably shortened the time needed to identify the crossings carrying oneor more quantitative trait loci (QTL), inducing higher tolerance to Pv and En. Within thispool of individuals, the genotypes having the most similar must biochemical compositionto the V. vinifera parentals were identified. Currently, several selected resistant cultivars areavailable for growers [11,13–15]. At the same time, also national and European regulationschanged and, from 2009 to date, many hybrids PRV have been admitted for cultivation.
A fairly high number of papers have described the tolerance to DM and PM of thesenew PRV under various environmental conditions. Depending upon the number and typesof QTLs, these PRV exhibit a different degree of tolerance to Pv and En; nonetheless, thesevarieties have been confirmed to be more tolerant than traditional V. vinifera [9,14–19].
Conversely, the literature shows a paucity of scientific papers evaluating the produc-tive performances and fruit composition of such new PRV. Poni et al. [20] have reported thatpotted vines of the red resistant accession UD 72–096 (Sangiovese x Bianca) had comparableyield with a standard susceptible Sangiovese clone but, when harvested on the same date,UD 72–096 showed significantly higher TSS and TA than Sangiovese. Moreover, UD 72–096grapes had higher concentrations of skin acylated and coumarated anthocyanins, lowermono-glucosidic, and higher di-glucosidic anthocyanin forms, as well as lower quercetin3-O-glucoside concentration, as compared to the susceptible Sangiovese. In north-easternSpain, the resistant genotype Sauvignon Kretos(Sauvignon Blanc x Kozma 20-3) exhibited a similar yield and must composition to theparental Sauvignon Blanc. In this case, the two varieties were picked at different dates, butthe date of harvest of Sauvignon Blanc was not provided [21].
To the best of our knowledge, no other scientific papers have tested fruit ripeningkinetics or enological parameters of new PRV. Several technical reports suggest that thesevarietals are poor in di-glucoside anthocyanin forms and free from furaneol and otherundesired volatile compounds typical of non-vinifera cultivars [22,23]. Analytical andsensorial traits of musts and wines are overall promising and confirm that these varietals,if adequately managed in the field and the winery, can produce wines comparable to thoseobtained from the V. vinifera parentals [22–25].
A shared result of these technical reports is the earlier annual cycle of PRV [22].The high heritability of earliness traits, when crossing grapevine cultivars, is something
30

Horticulturae 2021, 7, 229
well known, and some PRV originating from pioneer breeding programmes, such asBronner, Solaris, or Souvignier Gris, show accelerated ripening and fast sugar accumu-lation [9,22,26–31]. This can be linked to the locations and the times of the selection ofthese genotypes, obtained by breeding programmes set in cool climates, and well beforewarming trends affected Mediterranean wine regions. PRV introduction in warm regions,where global warming has already caused a significant compression of the annual growthcycle and a consistent advancement of phenological stages, seems to be an additionalmatter of concern.
The aim of this work was to evaluate vine performances and fruit-ripening dynamicsof five new white PRV, in a region where local viticulture is suffering the negative effects ofwarming trends on grape biochemical balance. The resistant genotypes were compared toSauvignon Blanc and Ortrugo, two of the most cultivated white Vitis vinifera genotypesin the area. Our hypothesis was that the tested PRV might have a different degree ofsuitability to warm and hot sites according to three specific traits, namely, (i) onset ofveraison time, (ii) malic acid degradation rates, and(iii) maintenance of a minimum acidpool at harvest.
2. Materials and Methods
2.1. Experimental Site and Treatment Layout
The study was carried out for two years (2019–2020) in a varietal collection locatedat Vicobarone (Ziano Piacentino, Italy, 44◦59′31.7” N 9◦21′27.8” E, 268 m a.s.l.). In thevineyard, 5 recently obtained white PRV were planted in 2016. The PRV present in thecollection were obtained by crossing a V. vinifera parental (namely Sauvignon Blanc orFriulano) with an interspecific Vitis hybrid (namely, Kozma 20-3 or Bianca) able to conferresistance to PM and DM [32,33]. The five PRV were UD 80–100 (Friulano x Bianca),Soreli (Friulano x Kozma 20-3), UD 30–080 (Sauvignon Blanc x Kozma 20-3), SauvignonKretos (Sauvignon Blanc x Kozma 20-3), and Sauvignon Rytos (Sauvignon Blanc x Bianca)(Figure S1). To date, Sauvignon Rytos, Sauvignon Kretos, and Soreli are already admittedfor cultivation in Italy, whereas UD 80–100 and UD 30–080 are still under evaluation.Ortrugo (VCR245) and Sauvignon Blanc (R3) vines, planted in the same year nearby these 5PRV, were selected as V. vinifera references. Ortrugo was chosen since it is the most commonwhite variety in the region and also is susceptible to summer temperatures in terms of fastacidity loss [6]. Sauvignon Blanc was instead included in the study since it was one of theparentals of three PRV among the five planted in the vineyard. All the cultivars, graftedon SO4 rootstock, were planted at 2.4 m × 0.8 m spacing (between row and within rowdistance, respectively) for a resulting density of 5125 plants/hectare. The vineyard has asoft slope (about 6◦) and an east-facing aspect, with rows following E–W orientation. Vineswere trained to a unilateral Guyot with about 10 nodes on the primary horizontal cane andtwo more on a spur left for annual cane renewal.
Each cultivar was present in one row of 80 m, encompassing 100 vines. The vineyardwas divided into three uniform blocks along the rows. Nine test vines per varietal (threevines per cultivar per block) were randomly chosen in 2019, tagged, and then maintainedalso for the following season. These selected vines were used for detailed assessment ofvegetative growth, yield components, and grape composition at harvest. The vineyard istypically non-irrigated, whereas fertilisation was uniform across all the vineyard surfacesand conducted based on local sustainable practices. Vines were trimmed once shootsoutgrew 20 cm above the top wire. In order to prevent the spread of pathogens on bothPRV and reference varieties, control of diseases was differentiated based on the degree oftolerance of the different genotypes. Details of pest management layout are provided inTable S1. In both seasons, none of the experimental vines showed symptoms of DM andPM at harvest. The minimum, mean, and maximum daily air temperature (◦C) and dailyrainfall (mm) from 1 January (DOY 1) to 31 December (DOY 365) were recorded in eachseason by a nearby weather station. Cumulative GDDs were then calculated according toWinkler [34].
31
Horticulturae 2021, 7, 229
2.2. Phenological Stages, Vegetative Growth, and Yield Components
In both years, bud break (BBCH09) and the onset of veraison (BBCH81) were assessedon each tagged vine according to Lorenz et al. [35]. Each season, in late spring (end ofMay–beginning of June), the number of inflorescences bore on each shoot was recordedaccording to the position of the shoot onto the horizontal cane. Total vine fruitfulness wasthen calculated as total inflorescences/total shoots ratio for the entire vine and for basalnodes (base node + count nodes 1 and 2).
All the experimental vines were picked on the same day, when a berry total solublesolids concentration of about 20 ◦Brix was achieved for Ortrugo, according to the optimalripening threshold for this cultivar identified by Gatti et al. [36]. At harvest, tagged vineswere individually picked, the mass of grapes was weighed, and the total bunch numberper vine was counted. The average bunch weight was then calculated. Concurrently,three representative bunches per vine, usually inserted on basal, median, and apical caneportions, were taken to the laboratory. On each bunch, the number of berries was counted,and the mass of berries was weighed. Rachis length was measured, and bunch compactnesswas expressed as the ratio of total berry mass to rachis length. Berries were crushed, and theobtained must was then used for technological maturity and organic acids determination(see next paragraphs).
At harvest, the leaves inserted at nodes 3, 6, 9, 12, 15, 18, and 21 of the distal shootof each tagged vine were collected with all the leaves from two lateral shoots developingbelow the trimming cut. The area of each leaf was measured with an LI-3000A leaf areameter (LI-COR Biosciences, Lincoln, NE, USA). Immediately after leaf fall, the numberof nodes per cane and the number of nodes of each lateral cane were counted. The finalleaf area was then estimated from the main and lateral shoots per vine on the basis ofnode counts and leaf-blade areas. Total vine leaf area was calculated as a sum of the twocomponents. Leaf area to yield ratio (LA/Y) was finally calculated by dividing the totalleaf area and yield of each tagged vine.
2.3. Grape Composition
Each year, from veraison (TSS ~4.5 to 5 ◦Brix) until harvest, three 100-berry sampleswere taken weekly from untagged vines of each varietal. These samples were not takenfrom the tagged vines so that the natural dynamic of grape ripening would not be altereddue to the progressive reduction of the pending yield. During sampling, it was assured thatthe removed berries were taken from bunches located on both sides of the row and, withineach bunch, the top, median, and bottom portions were also represented. In 2020, untaggedOrtrugo and Sauvignon Blanc were not picked, and two additional post-harvest samplingswere conducted. Sampled berries were brought to the laboratory, weighed, and crushed toobtain a must. Musts were analysed immediately for TSS using a temperature-compensateddesk refractometer, whereas pH and TA were measured by titration with 0.1 N NaOH to apH 8.2 end point and expressed as g/L of tartaric acid equivalents. TSS/TA ratio at harvestwas then calculated.
TSS accumulation rates (◦Brix day−1) were calculated from pre-veraison to harvestdividing the difference in TSS between two subsequent samplings by the number of elapseddays. The same procedure was carried out based on malic acid concentration in order tocalculate degradation rates (g/L day−1).
For better readability of data, when appropriate, seasonal trends and correlationsof specific parameters were graphed separately for PRV having Sauvignon Blanc asV. vinifera parental (UD 30–080, Sauvignon Kretos, and Sauvignon Rytos, compared withSauvignon Blanc) and for PRV obtained crossing Friulano (UD 80–100 and Soreli, comparedwith Ortrugo).
2.4. HPLC Analysis
To assess tartaric and malic acid concentrations in all samples taken seasonally andat harvest, an aliquot of the must was diluted four times, then filtered through a 0.22 μm
32
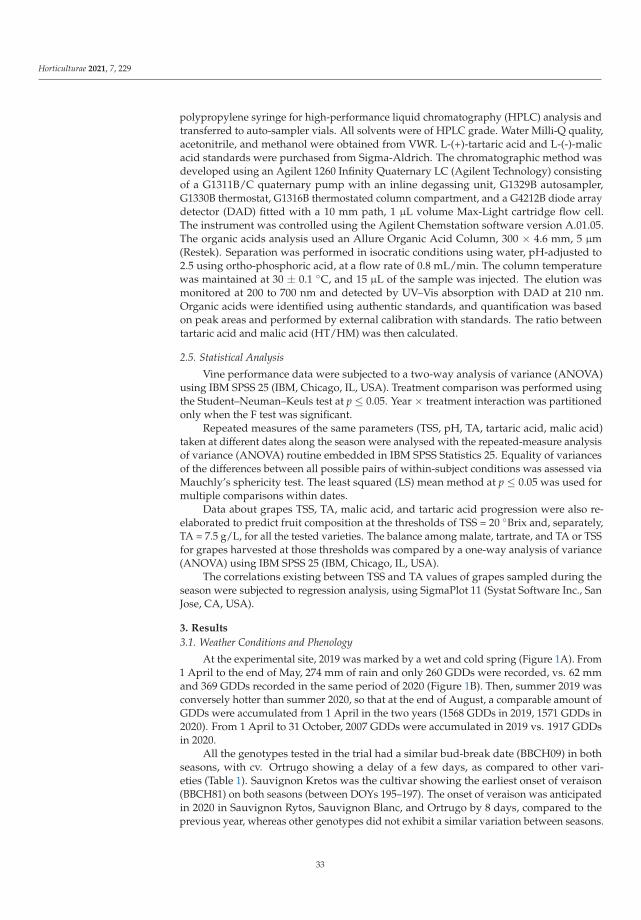
Horticulturae 2021, 7, 229
polypropylene syringe for high-performance liquid chromatography (HPLC) analysis andtransferred to auto-sampler vials. All solvents were of HPLC grade. Water Milli-Q quality,acetonitrile, and methanol were obtained from VWR. L-(+)-tartaric acid and L-(-)-malicacid standards were purchased from Sigma-Aldrich. The chromatographic method wasdeveloped using an Agilent 1260 Infinity Quaternary LC (Agilent Technology) consistingof a G1311B/C quaternary pump with an inline degassing unit, G1329B autosampler,G1330B thermostat, G1316B thermostated column compartment, and a G4212B diode arraydetector (DAD) fitted with a 10 mm path, 1 μL volume Max-Light cartridge flow cell.The instrument was controlled using the Agilent Chemstation software version A.01.05.The organic acids analysis used an Allure Organic Acid Column, 300 × 4.6 mm, 5 μm(Restek). Separation was performed in isocratic conditions using water, pH-adjusted to2.5 using ortho-phosphoric acid, at a flow rate of 0.8 mL/min. The column temperaturewas maintained at 30 ± 0.1 ◦C, and 15 μL of the sample was injected. The elution wasmonitored at 200 to 700 nm and detected by UV–Vis absorption with DAD at 210 nm.Organic acids were identified using authentic standards, and quantification was basedon peak areas and performed by external calibration with standards. The ratio betweentartaric acid and malic acid (HT/HM) was then calculated.
2.5. Statistical Analysis
Vine performance data were subjected to a two-way analysis of variance (ANOVA)using IBM SPSS 25 (IBM, Chicago, IL, USA). Treatment comparison was performed usingthe Student–Neuman–Keuls test at p ≤ 0.05. Year × treatment interaction was partitionedonly when the F test was significant.
Repeated measures of the same parameters (TSS, pH, TA, tartaric acid, malic acid)taken at different dates along the season were analysed with the repeated-measure analysisof variance (ANOVA) routine embedded in IBM SPSS Statistics 25. Equality of variancesof the differences between all possible pairs of within-subject conditions was assessed viaMauchly’s sphericity test. The least squared (LS) mean method at p ≤ 0.05 was used formultiple comparisons within dates.
Data about grapes TSS, TA, malic acid, and tartaric acid progression were also re-elaborated to predict fruit composition at the thresholds of TSS = 20 ◦Brix and, separately,TA = 7.5 g/L, for all the tested varieties. The balance among malate, tartrate, and TA or TSSfor grapes harvested at those thresholds was compared by a one-way analysis of variance(ANOVA) using IBM SPSS 25 (IBM, Chicago, IL, USA).
The correlations existing between TSS and TA values of grapes sampled during theseason were subjected to regression analysis, using SigmaPlot 11 (Systat Software Inc., SanJose, CA, USA).
3. Results
3.1. Weather Conditions and Phenology
At the experimental site, 2019 was marked by a wet and cold spring (Figure 1A). From1 April to the end of May, 274 mm of rain and only 260 GDDs were recorded, vs. 62 mmand 369 GDDs recorded in the same period of 2020 (Figure 1B). Then, summer 2019 wasconversely hotter than summer 2020, so that at the end of August, a comparable amount ofGDDs were accumulated from 1 April in the two years (1568 GDDs in 2019, 1571 GDDs in2020). From 1 April to 31 October, 2007 GDDs were accumulated in 2019 vs. 1917 GDDsin 2020.
All the genotypes tested in the trial had a similar bud-break date (BBCH09) in bothseasons, with cv. Ortrugo showing a delay of a few days, as compared to other vari-eties (Table 1). Sauvignon Kretos was the cultivar showing the earliest onset of veraison(BBCH81) on both seasons (between DOYs 195–197). The onset of veraison was anticipatedin 2020 in Sauvignon Rytos, Sauvignon Blanc, and Ortrugo by 8 days, compared to theprevious year, whereas other genotypes did not exhibit a similar variation between seasons.
33
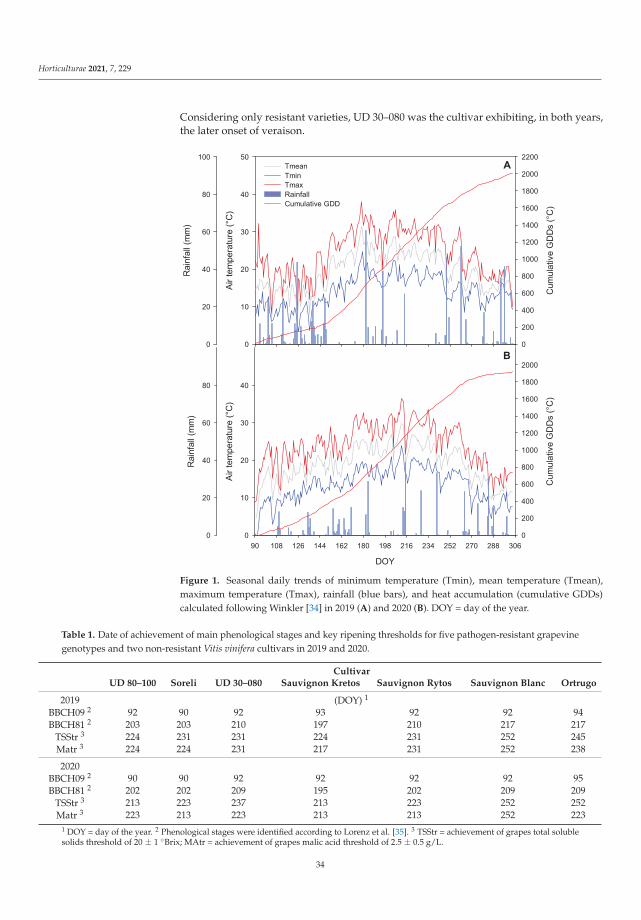
Horticulturae 2021, 7, 229
Considering only resistant varieties, UD 30–080 was the cultivar exhibiting, in both years,the later onset of veraison.
Figure 1. Seasonal daily trends of minimum temperature (Tmin), mean temperature (Tmean),maximum temperature (Tmax), rainfall (blue bars), and heat accumulation (cumulative GDDs)calculated following Winkler [34] in 2019 (A) and 2020 (B). DOY = day of the year.
Table 1. Date of achievement of main phenological stages and key ripening thresholds for five pathogen-resistant grapevinegenotypes and two non-resistant Vitis vinifera cultivars in 2019 and 2020.
CultivarUD 80–100 Soreli UD 30–080 Sauvignon Kretos Sauvignon Rytos Sauvignon Blanc Ortrugo
2019 (DOY) 1
BBCH09 2 92 90 92 93 92 92 94BBCH81 2 203 203 210 197 210 217 217
TSStr 3 224 231 231 224 231 252 245Matr 3 224 224 231 217 231 252 238
2020BBCH09 2 90 90 92 92 92 92 95BBCH81 2 202 202 209 195 202 209 209
TSStr 3 213 223 237 213 223 252 252Matr 3 223 213 223 213 213 252 223
1 DOY = day of the year. 2 Phenological stages were identified according to Lorenz et al. [35]. 3 TSStr = achievement of grapes total solublesolids threshold of 20 ± 1 ◦Brix; MAtr = achievement of grapes malic acid threshold of 2.5 ± 0.5 g/L.
34
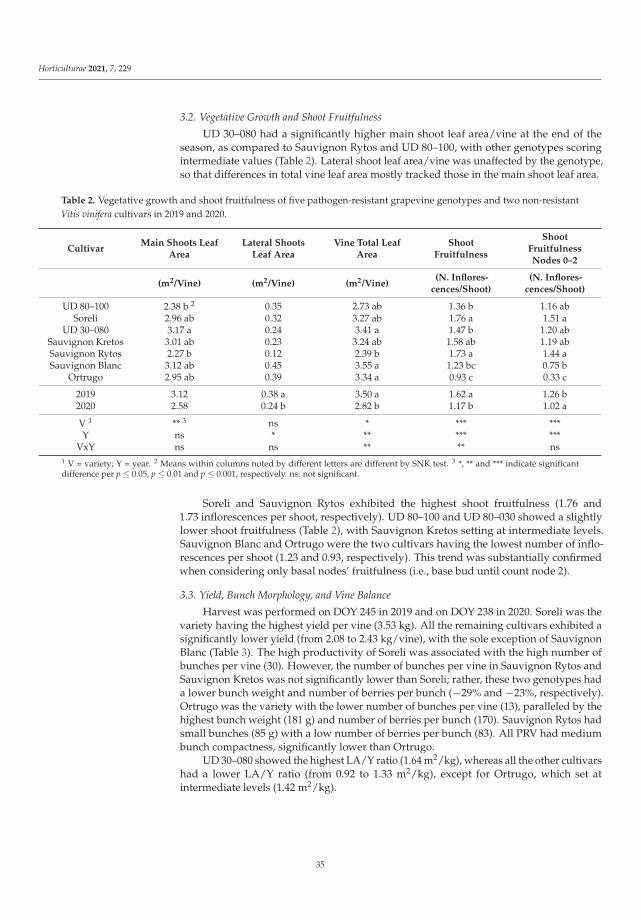
Horticulturae 2021, 7, 229
3.2. Vegetative Growth and Shoot Fruitfulness
UD 30–080 had a significantly higher main shoot leaf area/vine at the end of theseason, as compared to Sauvignon Rytos and UD 80–100, with other genotypes scoringintermediate values (Table 2). Lateral shoot leaf area/vine was unaffected by the genotype,so that differences in total vine leaf area mostly tracked those in the main shoot leaf area.
Table 2. Vegetative growth and shoot fruitfulness of five pathogen-resistant grapevine genotypes and two non-resistantVitis vinifera cultivars in 2019 and 2020.
CultivarMain Shoots Leaf
AreaLateral Shoots
Leaf AreaVine Total Leaf
AreaShoot
Fruitfulness
ShootFruitfulnessNodes 0–2
(m2/Vine) (m2/Vine) (m2/Vine)(N. Inflores-
cences/Shoot)(N. Inflores-
cences/Shoot)
UD 80–100 2.38 b 2 0.35 2.73 ab 1.36 b 1.16 abSoreli 2.96 ab 0.32 3.27 ab 1.76 a 1.51 a
UD 30–080 3.17 a 0.24 3.41 a 1.47 b 1.20 abSauvignon Kretos 3.01 ab 0.23 3.24 ab 1.58 ab 1.19 abSauvignon Rytos 2.27 b 0.12 2.39 b 1.73 a 1.44 aSauvignon Blanc 3.12 ab 0.45 3.55 a 1.23 bc 0.75 b
Ortrugo 2.95 ab 0.39 3.34 a 0.93 c 0.33 c
2019 3.12 0.38 a 3.50 a 1.62 a 1.26 b2020 2.58 0.24 b 2.82 b 1.17 b 1.02 a
V 1 ** 3 ns * *** ***Y ns * ** *** ***
VxY ns ns ** ** ns1 V = variety; Y = year. 2 Means within columns noted by different letters are different by SNK test. 3 *, ** and *** indicate significantdifference per p ≤ 0.05, p ≤ 0.01 and p ≤ 0.001, respectively. ns: not significant.
Soreli and Sauvignon Rytos exhibited the highest shoot fruitfulness (1.76 and1.73 inflorescences per shoot, respectively). UD 80–100 and UD 80–030 showed a slightlylower shoot fruitfulness (Table 2), with Sauvignon Kretos setting at intermediate levels.Sauvignon Blanc and Ortrugo were the two cultivars having the lowest number of inflo-rescences per shoot (1.23 and 0.93, respectively). This trend was substantially confirmedwhen considering only basal nodes’ fruitfulness (i.e., base bud until count node 2).
3.3. Yield, Bunch Morphology, and Vine Balance
Harvest was performed on DOY 245 in 2019 and on DOY 238 in 2020. Soreli was thevariety having the highest yield per vine (3.53 kg). All the remaining cultivars exhibited asignificantly lower yield (from 2.08 to 2.43 kg/vine), with the sole exception of SauvignonBlanc (Table 3). The high productivity of Soreli was associated with the high number ofbunches per vine (30). However, the number of bunches per vine in Sauvignon Rytos andSauvignon Kretos was not significantly lower than Soreli; rather, these two genotypes hada lower bunch weight and number of berries per bunch (−29% and −23%, respectively).Ortrugo was the variety with the lower number of bunches per vine (13), paralleled by thehighest bunch weight (181 g) and number of berries per bunch (170). Sauvignon Rytos hadsmall bunches (85 g) with a low number of berries per bunch (83). All PRV had mediumbunch compactness, significantly lower than Ortrugo.
UD 30–080 showed the highest LA/Y ratio (1.64 m2/kg), whereas all the other cultivarshad a lower LA/Y ratio (from 0.92 to 1.33 m2/kg), except for Ortrugo, which set atintermediate levels (1.42 m2/kg).
35

Horticulturae 2021, 7, 229
Table 3. Yield, vine balance, and bunch morphology of five pathogen-resistant grapevine genotypes and two non-resistantVitis vinifera cultivars in 2019 and 2020.
Cultivar YieldBunches Per
vineLeaf Area toYield Ratio
BunchWeight
Berry MassBerries Per
BunchBunch Com-
pactness
(kg/vine) (n.) (m2/kg) (g) (g) (n.) (g/cm)
UD 80–100 2.31 b 2 22 b 1.18 b 110 ab 1.17 ab 106 b 12.4 bSoreli 3.53 a 30 a 0.92 b 120 ab 1.15 ab 104 b 11.1 b
UD 30–080 2.08 b 22 b 1.64 a 103 bc 1.36 a 76 c 10.4 bSauvignon
Kretos 2.43 b 25 ab 1.33 b 107 ab 1.33 ab 80 c 10.1 b
Sauvignon Rytos 2.41 b 29 a 0.99 b 85 c 1.02 b 83 c 9.3 bSauvignon Blanc 2.86 ab 20 b 1.24 b 143 ab 1.45 a 99 bc 13.5 ab
Ortrugo 2.35 b 13 c 1.42 ab 181 a 1.06 b 170 a 17.1 a
2019 2.28 b 25 a 1.61 92 b 1.11 a 83 b 10.1 b2020 2.82 a 20 b 1.40 141 a 1.32 b 126 a 13.3 a
V 1 *** 3 *** ** *** *** *** ***Y *** *** ns *** * *** *
VxY ns ns ns ** ** * ns1 V = variety; Y = year. 2 Means within columns noted by different letters are different by SNK test. 3 *, ** and *** indicate significantdifference per p ≤ 0.05, p ≤ 0.01 and p ≤ 0.001, respectively. ns: not significant.
3.4. Grapes’ TSS, pH, and TA during Ripening
All PRV showed earlier berry sugar accumulation than Ortrugo and Sauvignon Blanc(Figure 2). In both years, Sauvignon Kretos had a significantly higher TSS than any of theother genotypes at any sampling date. UD 30–080 and Sauvignon Rytos had lower sugarsthan the other PRV right after veraison. However, later on, both genotypes showed a fasterTSS accumulation rate, reducing the gap with other PRV. The threshold of 20 ◦Brix wasachieved much earlier by the PRV in both years (Table 1). Overall, Sauvignon Blanc andOrtrugo lagged behind PRV by 15 days in 2019, and by approximately 10 days in 2020.
Similarly, must pH in PRV was constantly higher in both years (Figure 2C,D). InSauvignon Rytos, only the dynamic of pH was more similar to the one of Ortrugo andSauvignon Blanc, especially in 2020.
Figure 2E,F shows the early loss of TA by UD 80–100, Soreli and Sauvignon Kretos.In both years, Sauvignon Rytos maintained higher TA than other PRV until the end of theseason. Ortrugo and Sauvignon Blanc showed a delayed acidity loss than Sauvignon Rytos,especially in 2019; however, Ortrugo crossed values lower than 5 g/L (on DOY 245 in 2019,on DOY 230 in 2020), whilst Sauvignon Blanc maintained a TA higher than 8 g/L until theend of the season. Over the last sampling dates, in 2019, Sauvignon Rytos tracked Ortrugoin terms of TA, whereas, in 2020, it set at intermediate levels between Ortrugo (and PRV)and Sauvignon Blanc.
All correlations between TSS and TA fit a quadratic model for any of the testedcultivars (Figure 3). The model shows that in 2019 Sauvignon Blanc, Sauvignon Kretos andUD 30–080 had similar TA for any TSS level, up to the threshold of 15 ◦Brix (Figure 3A).At higher TSS, Sauvignon Kretos and UD 30–080 had a TA lower than Sauvignon Rytosand Sauvignon Blanc. In 2020 (Figure 3B), conversely, Sauvignon Blanc had lower TA forany TSS below 15 ◦Brix, whereas, above this threshold, Sauvignon Blanc, Sauvignon Rytos,and Sauvignon Kretos grouped together and only UD 30–080 had lower TA. In both years,Ortrugo and Soreli had quite low TA for any TSS level, whereas, conversely, UD 80–100exhibited the opposite behaviour (Figure 3C,D).
36
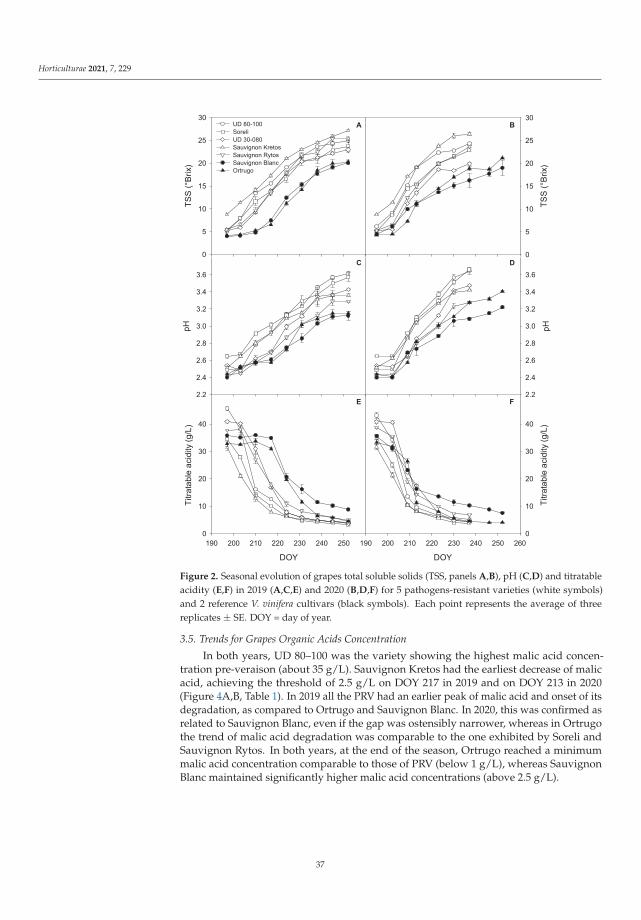
Horticulturae 2021, 7, 229
Figure 2. Seasonal evolution of grapes total soluble solids (TSS, panels A,B), pH (C,D) and titratableacidity (E,F) in 2019 (A,C,E) and 2020 (B,D,F) for 5 pathogens-resistant varieties (white symbols)and 2 reference V. vinifera cultivars (black symbols). Each point represents the average of threereplicates ± SE. DOY = day of year.
3.5. Trends for Grapes Organic Acids Concentration
In both years, UD 80–100 was the variety showing the highest malic acid concen-tration pre-veraison (about 35 g/L). Sauvignon Kretos had the earliest decrease of malicacid, achieving the threshold of 2.5 g/L on DOY 217 in 2019 and on DOY 213 in 2020(Figure 4A,B, Table 1). In 2019 all the PRV had an earlier peak of malic acid and onset of itsdegradation, as compared to Ortrugo and Sauvignon Blanc. In 2020, this was confirmed asrelated to Sauvignon Blanc, even if the gap was ostensibly narrower, whereas in Ortrugothe trend of malic acid degradation was comparable to the one exhibited by Soreli andSauvignon Rytos. In both years, at the end of the season, Ortrugo reached a minimummalic acid concentration comparable to those of PRV (below 1 g/L), whereas SauvignonBlanc maintained significantly higher malic acid concentrations (above 2.5 g/L).
37

Horticulturae 2021, 7, 229
Figure 3. Seasonal variation of titratable acidity expressed as a function of total solu-ble solids (TSS) in 2019 (A,C), and 2020 (B,D), for 5 pathogens-resistant varieties (whitesymbols) and 2 reference V. vinifera cultivars (black symbols). Data were fit to thefollowing equations: UD 30–080 2019 y = 70.07 − 5.62x + 0.12x2, R2 = 0.994; UD 30–0802020 y = 60.68 − 4.10x + 0.06x2, R2 = 0.996; Sauvignon Kretos 2019 y = 67.86 − 5.21x + 0.11x2,R2 = 0.976; Sauvignon Kretos 2020 y = 63.80 − 4.54x + 0.08x2, R2 = 0.991; Sauvignon Rytos2019 y = 58.94 − 4.03x + 0.08x2, R2 = 0.991; Sauvignon Rytos 2020 y = 59.89 − 4.39x + 0.09x2,R2 = 0.993; Sauvignon Blanc 2019 y = 49.32 − 2.53x + 0.02x2, R2 = 0.971; Sauvignon Blanc 2020y = 53.47 − 4.20x + 0.09x2, R2 = 0.980; UD 80–100 2019 y = 72.20 − 5.60x + 0.12x2, R2 = 0.989; UD 80–100 2020 y = 73.80 − 5.53x + 0.11x2, R2 = 0.992; Soreli 2019 y = 57.47.86 − 4.91x + 0.11x2, R2 = 0.966;Soreli 2020 y = 56.61 − 4.66x + 0.10x2, R2 = 0.989; Ortrugo 2019 y = 49.13 − 4.00x + 0.09x2,R2 = 0.983; Ortrugo 2020 y = 50.06 − 4.23x + 0.10x2, R2 = 0.991. All the correlations listed were sig-nificant per p < 0.05.
In both years, Sauvignon Rytos had the highest grapes tartaric acid concentrationduring ripening, if considering only PRV (Figure 4C,D). In 2019, Ortrugo and SauvignonBlanc had lower tartaric acid than Sauvignon Rytos after veraison, even if later in the seasonSauvignon Blanc maintained significantly higher tartaric acid than Ortrugo and SauvignonRytos (approximately +3 g/L). In 2020, conversely, Sauvignon Blanc had a similar decreaseof tartaric acid to the one exhibited by Ortrugo, whereas in Sauvignon, Rytos tartaric acidconcentration was consistently higher (+3.3 g/L on DOY 237).
3.6. Sugar Accumulation and Malic Acid Degradation Rates
In 2019, UD-30–080, Sauvignon Kretos and Sauvignon Rytos exhibited relatively highTSS accumulation rates (Figure 5A), ranging between 0.40 and 0.65 ◦Brix day−1 until DOY231. Conversely, Sauvignon Blanc jumped from 0.1 to 0.4 TSS day−1 on DOY 217 and,after peaking at 0.65 TSS day−1 on DOY 224, it decreased, together with the PRV. Onthe other hand, Ortrugo did not exceed 0.6 ◦Brix day−1, although it maintained highersugar accumulation rates late in the season (Figure 5C). In 2020 (Figure 5B,D), PRV had ahigher peak of TSS accumulation rates (0.8–1.0 ◦Brix day−1), as compared to the previousyear, yet occurring approximately at the same DOYs (209–223). Conversely, in Sauvignon
38

Horticulturae 2021, 7, 229
Blanc and Ortrugo, maximum TSS accumulation rates occurred much earlier than in 2019(approximately 15–20 days). Moreover, in Ortrugo, the maximum TSS accumulation rate,recorded on DOY 214, reached the peak of 1.4 ◦Brix day−1, before declining to valuescomprised between 0.2 and 0.4 ◦Brix day−1 for the rest of the season.
Figure 4. Seasonal evolution of grapes malic acid (panels A,B) and tartaric acid (C,D) in 2019 (A,C)and 2020 (B,D) for 5 pathogens-resistant varieties (white symbols) and 2 reference V. vinifera cultivars(black symbols). Each point represents the average of three replicates ± SE. DOY = day of year.
Sauvignon Kretos was also the cultivar showing the earliest peak of malic acid degra-dation rate, in both years (Figure 5G,H). In 2019, Sauvignon Blanc was the variety showingthe most delayed onset of malic acid degradation, with a sudden peak of 2.1 g/L day−1
occurring only on DOY 224. UD 30–080 and Sauvignon Rytos set at intermediate levelsbetween Sauvignon Blanc and Sauvignon Kretos, in terms of timing and magnitude ofmalic acid degradation rates increase.
In 2020, UD 30–080 and Sauvignon Rytos had a dynamic of the degradation of malicacid comparable to the one exhibited by Sauvignon Blanc, even if this latter peaked at2.4 g/L day−1 vs. 1.6–2.0 g/L day−1 exhibited by UD 30–080 and Sauvignon Rytos. UD80–100 and Soreli had a malic-acid-degradation-rate dynamic comparable to other PRV(Figure 5I,J). In 2020, UD 80–100 scored, on DOY 209, the highest malic acid degradationrate recorded during the experiment (3.1 g/L day−1).
39
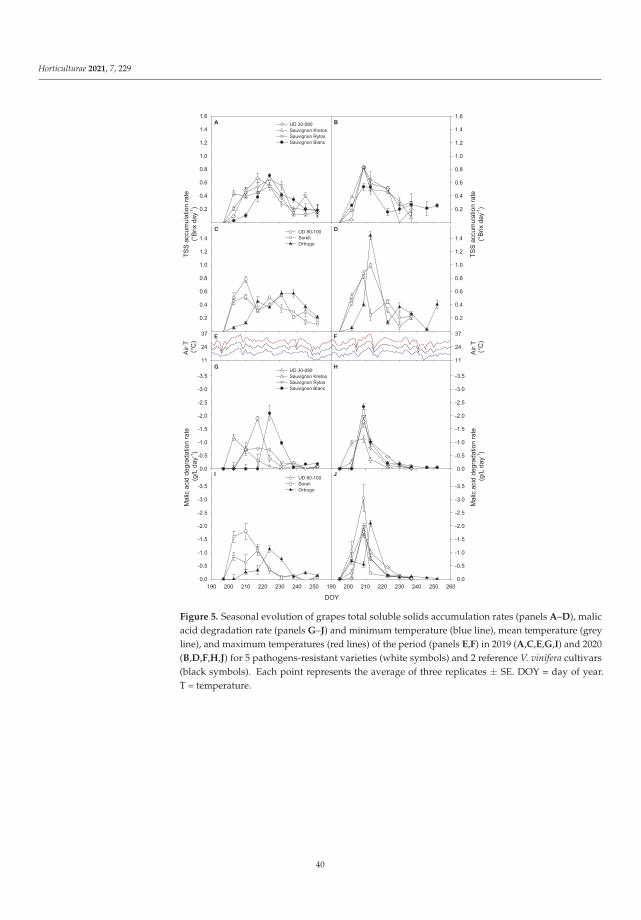
Horticulturae 2021, 7, 229
Figure 5. Seasonal evolution of grapes total soluble solids accumulation rates (panels A–D), malicacid degradation rate (panels G–J) and minimum temperature (blue line), mean temperature (greyline), and maximum temperatures (red lines) of the period (panels E,F) in 2019 (A,C,E,G,I) and 2020(B,D,F,H,J) for 5 pathogens-resistant varieties (white symbols) and 2 reference V. vinifera cultivars(black symbols). Each point represents the average of three replicates ± SE. DOY = day of year.T = temperature.
40

Horticulturae 2021, 7, 229
3.7. Fruit Composition at Harvest
At harvest, all the PRV had higher TSS than Ortrugo and Sauvignon Blanc (from+2.5 ◦Brix in Soreli to +5.5 ◦Brix in Sauvignon Kretos), with the sole exception of UD30–080 (Table 4). Sauvignon Blanc was the variety showing the higher TA at harvest(8.81 g/L). Ortrugo, UD 30–080, Soreli, UD 80–100 had quite low TA, comprised between4.08 and 5.07 g/L. By contrast, Sauvignon Rytos maintained a TA of 6.50 g/L, halfwaybetween this group of cultivars and Sauvignon Blanc. The high TA of Sauvignon Blancis linked to a high malic acid concentration (3.45 g/L). Conversely, in Sauvignon Rytos,the malic acid concentration at harvest was similar to those of cultivars having low TA.Sauvignon Rytos had, instead, the highest tartaric acid concentration (7.44 g/L), togetherwith Sauvignon Blanc.
Table 4. Fruit composition at harvest of five pathogen-resistant grapevine genotypes and two non-resistant Vitis viniferacultivars in 2019 and 2020.
Cultivar TSS pH TA TSS/TA Malic Acid Tartaric Acid HT/HM
(◦Brix) (g/L) (g/L) (g/L)
UD 80–100 22.6 ab 2 3.43 a 5.07 c 4.46 a 1.38 b 5.34 bc 3.87 dSoreli 22.0 b 3.42 a 4.08 d 5.39 a 0.90 c 4.67 c 5.19 c
UD 30–080 20.1 bc 3.32 ab 4.66 cd 4.29 ab 1.04 bc 5.35 bc 5.14 cSauvignon
Kretos 24.5 a 3.33 ab 5.07 c 4.83 a 0.75 c 6.36 b 8.48 a
SauvignonRytos 23.4 ab 3.23 b 6.50 b 3.60 b 0.89 c 7.44 a 8.36 a
SauvignonBlanc 19.0 c 3.06 c 8.81 a 2.16 c 3.45 a 7.61 a 2.21 e
Ortrugo 19.5 c 3.15 bc 4.95 cd 3.94 b 0.81 c 5.61 bc 6.93 b
2019 21.6 3.26 4.56 4.74 1.24 6.15 4.962020 21.4 3.35 5.59 3.83 1.39 5.92 4.26
V 1 *** 3 *** *** *** *** *** ***Y ns ns ns ns ns ns ns
VxY ns ns ns ns ns ns ns1 V = variety; Y = year. 2 Means within columns noted by different letters are different by SNK test. 3 *, ** and *** indicate significantdifference per p ≤ 0.05, p ≤ 0.01 and p ≤ 0.001, respectively. ns: not significant.
Sauvignon Blanc was the variety scoring the lowest TSS/TA and HT/HM ratio (2.16and 2.21, respectively). Sauvignon Rytos had a TSS/TA ratio of 3.60, comparable to Ortrugo,and an HT/HM of 8.36, similar to Sauvignon Kretos (8.48). Ortrugo had a lower HT/HMthan Sauvignon Rytos and Sauvignon Kretos (6.93), yet higher than all the other PRV.
Figure 6A shows that, if the tested varieties had been harvested at TSS = 20 ◦Brix, theacid pool of Sauvignon Rytos would be mostly contributed by tartaric acid, whereas theacidity of Sauvignon Blanc would be also driven by higher malic acid. Sauvignon Kretosand UD 30–080 would exhibit comparable tartaric acid to Sauvignon Blanc but lower malicacid, resulting in a lower TA. Figure 6B shows the low TA of Ortrugo and Soreli at 20◦Brix, linked to a very low malic acid concentration and relatively low tartaric acid level.Conversely, UD 80–100 would have retained a good balance between organic acids andtotal acids.
Simulated harvest at TA of 7 g/L reveals that both Sauvignon Kretos and SauvignonRytos would have shown higher TSS than Sauvignon Blanc, but the TA would be againlinked to high tartaric acid and low malic acid, compared to Sauvignon Blanc (Figure 6C).Ortrugo and Soreli would exhibit instead very low TSS, whereas UD 80–100 shows again agood balance among TSS, malic acid, and tartaric acid (Figure 6D).
41
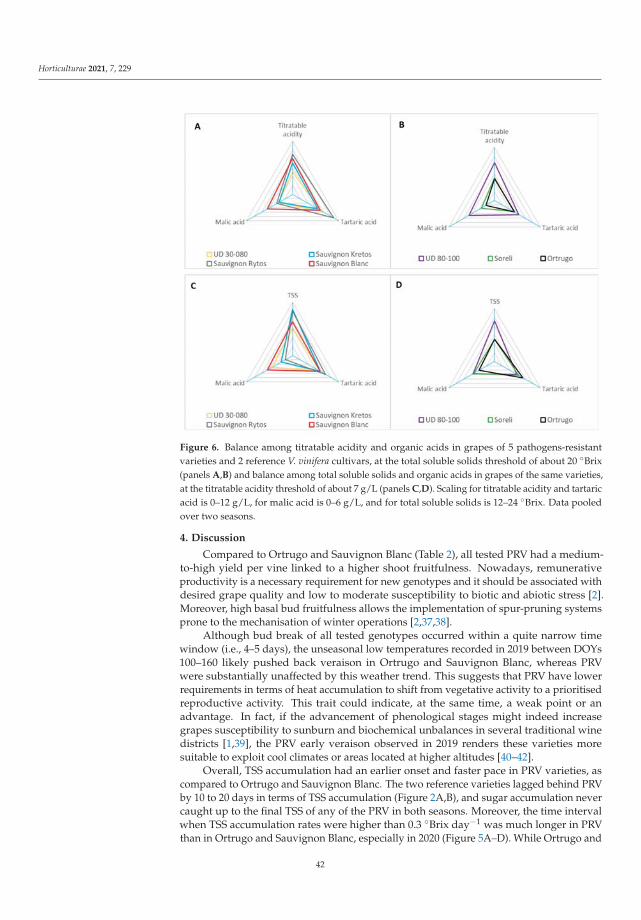
Horticulturae 2021, 7, 229
Figure 6. Balance among titratable acidity and organic acids in grapes of 5 pathogens-resistantvarieties and 2 reference V. vinifera cultivars, at the total soluble solids threshold of about 20 ◦Brix(panels A,B) and balance among total soluble solids and organic acids in grapes of the same varieties,at the titratable acidity threshold of about 7 g/L (panels C,D). Scaling for titratable acidity and tartaricacid is 0–12 g/L, for malic acid is 0–6 g/L, and for total soluble solids is 12–24 ◦Brix. Data pooledover two seasons.
4. Discussion
Compared to Ortrugo and Sauvignon Blanc (Table 2), all tested PRV had a medium-to-high yield per vine linked to a higher shoot fruitfulness. Nowadays, remunerativeproductivity is a necessary requirement for new genotypes and it should be associated withdesired grape quality and low to moderate susceptibility to biotic and abiotic stress [2].Moreover, high basal bud fruitfulness allows the implementation of spur-pruning systemsprone to the mechanisation of winter operations [2,37,38].
Although bud break of all tested genotypes occurred within a quite narrow timewindow (i.e., 4–5 days), the unseasonal low temperatures recorded in 2019 between DOYs100–160 likely pushed back veraison in Ortrugo and Sauvignon Blanc, whereas PRVwere substantially unaffected by this weather trend. This suggests that PRV have lowerrequirements in terms of heat accumulation to shift from vegetative activity to a prioritisedreproductive activity. This trait could indicate, at the same time, a weak point or anadvantage. In fact, if the advancement of phenological stages might indeed increasegrapes susceptibility to sunburn and biochemical unbalances in several traditional winedistricts [1,39], the PRV early veraison observed in 2019 renders these varieties moresuitable to exploit cool climates or areas located at higher altitudes [40–42].
Overall, TSS accumulation had an earlier onset and faster pace in PRV varieties, ascompared to Ortrugo and Sauvignon Blanc. The two reference varieties lagged behind PRVby 10 to 20 days in terms of TSS accumulation (Figure 2A,B), and sugar accumulation nevercaught up to the final TSS of any of the PRV in both seasons. Moreover, the time intervalwhen TSS accumulation rates were higher than 0.3 ◦Brix day−1 was much longer in PRVthan in Ortrugo and Sauvignon Blanc, especially in 2020 (Figure 5A–D). While Ortrugo and
42
Horticulturae 2021, 7, 229
Sauvignon Blanc are well known for their slow sugar accumulation and low maximumsugar thresholds [42,43], such fast sugar accumulation dynamic exhibited especially bySauvignon Kretos and UD 80–100 could easily lead to excessive wine alcohol content andunbalanced aroma, especially in white wines [1]. Our results are overall similar to thefindings of Poni et al. [20], who compared Sangiovese and UD 72–096 (a Sangiovese xBianca PRV).
Interestingly, the fostered sugar accumulation found in Sauvignon Kretos and someothers PRV was not associated with a higher LA/Y ratio when compared to SauvignonBlanc and Ortrugo. The only variety showing a higher LA/Y ratio was UD 30–080(1.64 m2/kg) that, concurrently, was the PRV having the most delayed TSS pattern inboth years and the lowest TSS at harvest (Figure 2A,B and Table 3). Therefore, the fastsugar accumulation observed in PRV was likely due to the actual genotype efficiency in ac-cumulating sugars and not to differential source/sink relations among cultivars. Moreover,our data suggest that canopy management of PRV should substantially differ from that of V.vinifera cultivars such as Ortrugo and Sauvignon Blanc. For instance, Gatti et al. [44] demon-strated the effectiveness of bunch thinning in promoting faster sugar accumulation makingit possible to target the enological standards required for producing Ortrugo sparklingwines (TSS of 20–21 ◦Brix and TA of 6.5 g/L). Accordingly, if, in the two reference cultivars,a good choice could be increasing the LA/Y ratio in order to promote TSS concentrationcorresponding to optimal TA, then in the PRV tested in this trial, the best strategy should be,on the contrary, to reduce LA/Y ratio trying to slow down sugar accumulation rates [37].
In ripening fruits, acidity is driven by the relative changes in the abundance of organicacids [4]. Malic acid is one of the main substrates for respiration in grapevine berries, andit is maximum pre-veraison and minimum at the end of the season [45,46]. Malic acidrespiration rates are mainly driven by temperatures and the abundance of the substrate [47].However, each genotype has a specific pattern in malic acid degradation rates and, perhapsmore importantly, a different maximum and minimum organic acid concentration [48,49].For instance, our study shows that UD 80–100 boasts the highest pre-veraison malic acidconcentration among the tested varieties and that all PRV retain very low malic acid at highTSS concentrations (Figure 4A,B). The dynamic of malate degradation rates (Figure 5G–J)reveals that daily loss of malic acid is a complex function of the onset of veraison time, thepool of pre-veraison malic acid, and air temperature. In fact, in 2019, Sauvignon Blanc andOrtrugo grapes, due to their later onset of veraison, somewhat mitigated the loss of malicacid under the high temperatures recorded between DOYs 200 and 210. Contrariwise, onthe same dates, all PRV had already crossed veraison and suffered a drastic malic acid loss.However, in 2019, maximum malic acid loss per day was exhibited by Sauvignon Blancimmediately after veraison, confirming that air temperature is not the only factor drivingdegradation rates. In 2020, when the onset of veraison time was similar for all testedcultivars, a stronger role was likely played by the availability of malate for respiration.In fact, genotypes showing the highest malic acid degradation rates corresponded withthose varieties showing the highest pre-veraison malic acid pool (Figures 4B and 5H,J).Moreover, our data demonstrate that malic acid degradation rates are not the main factordetermining final malic acid at the end of the season. Sauvignon Blanc was indeed thevariety that exhibited in both years the more intense malic acid degradation rates and thehighest minimum malic acid concentration rates at the end of the season (Figure 4A,B andFigure 5G,H).
If the primary goal is screening for varieties capable to maintain adequate acidity ina hot region, two cultivars seem to be of some interest among the five tested PRV: UD80–100 and Sauvignon Rytos. UD 80–100 shows adequate acidity at high TSS levels andoptimal balance between malic and tartaric acid (Figure 3C,D and Figure 6C,D, and Table 4);however, its sugar accumulation is excessively fast, and grapes should be harvested veryearly (Figure 2A,B and Figure 5C,D). Sauvignon Rytos was the only PRV showing higherTA than Ortrugo in 2020, whereas, in 2019, these two varieties showed very similar malateconcentration from DOY 208 to the end of the season (Figure 2A,B). Ortrugo is a variety
43

Horticulturae 2021, 7, 229
that suffers a fast acidity loss after veraison to very low values, often not compatiblewith white and sparkling wine-making standards [6,44]. This is also confirmed by ourdata, showing poor balance among sugars, acidity, and malic vs. tartaric acid in Ortrugo,either if harvested at optimal TSS or at optimal TA thresholds (Figure 6B,D). However,Table 1 and Figure 2 show that in 2019, Ortrugo had a delayed veraison and TA loss,together with higher minimum acidity, compared to data recorded in the subsequentseason. Notably, in Sauvignon Rytos, as compared to Ortrugo, optimal acidity matchedhigher TSS concentration, meaning that harvest might be anticipated with no detrimentaleffects on sugars (Table 4 and Figure 6C,D). However, data also support that SauvignonRytos acidity cannot be even close to that of Sauvignon Blanc, a variety that is known for thehigh acidity retained late in the season [50], a trait confirmed by our results (Figure 2E,F).If our data suggest that, in our conditions, Sauvignon Rytos was the PRV more capableto retain some acidity, Figure 4 reveals a relevant difference between Sauvignon Rytosand its parental Sauvignon Blanc: the former holds high acidity mostly due to the highconcentration of tartaric acid, with a very limited contribution of malic acid; SauvignonBlanc acidity at harvest relies instead on both malate and tartrate high concentration late atthe end of the season (Figure 4A,B and Table 4). Different from malic acid, tartaric acid is notsubjected to respiration, and changes in its abundance are mainly due to dilution and saltsformation with K+ [4,45,47]. Interestingly, QTL, responding to grapes’ cation mobility andorganic acid metabolism, and catabolism have been identified, and today, several breedingprogrammes based on MAS or new breeding technologies are in progress to obtain newvarieties less responsive to organic acid depletion under high temperatures [51–55].
Comparing balance between organic acids at optimal TSS or TA confirms that the dif-ference in the ratio between organic acid concentration in Sauvignon Rytos and SauvignonBlanc grapes is consistent, either choosing optimal TSS or optimal TA as the key param-eter for placing harvest time (Figure 6A,C). This is quite essential information because itsuggests that acidity preservation in these two varieties should be pursued based uponcontrasting strategies: in Sauvignon Blanc, in order to preserve malic acid from respiration,grapes should be protected from excessive radiation and temperature, choosing trellissystem shielding bunches from direct radiation and selecting appropriate aspects andlocations [42,56–58]. Contrariwise, in Sauvignon Rytos actions should aim at limiting berrydilution, for instance, by calibrating adequate competition for water and nutrients, andby carefully managing K+ availability and nutrition in order to contrast potassium saltsformation [47].
5. Conclusions
To the best of our knowledge, ripening patterns and organic acid depletion ratesin new PRV were never studied in detail. Even if many technical reports suggest thatwines obtained from these varieties could have similar aromatic traits to their Vitis viniferaparentals, our data demonstrate that, in regions with significant heat summation during thesummer (~2000 GDDs), PRV exhibit anticipated veraison, as compared to early ripeningV. vinifera cultivars, and that their organic acids balance and sugar accumulation rateslargely differ from those observed in vinifera genotypes. Sauvignon Kretos, SauvignonRytos, Soreli, and UD 80–100 exhibited an early and fast grape sugar accumulation. Amongthe tested PRV genotypes, Sauvignon Rytos was the only one capable of maintaininghigher titratable acidity at harvest, due to a significant tartaric acid pool. Conversely, in theSauvignon Blanc parental, the high acidity at harvest was linked to high final malic acidconcentration, resulting in a different acidic balance.
Our work also suggests that all new PRV should be subjected to different canopy andripening management strategies, as compared to the two reference V. vinifera cultivars,given the faster sugar accumulation rates at comparable levels of LA/Y ratio.
Overall, our data indicate that PRV could perform better in north-facing hillsides, incooler climates, or at higher altitudes, where their good resistance to mildews could matchan adequate grapes’ biochemical balance.
44
Horticulturae 2021, 7, 229
Supplementary Materials: The following are available online at https://www.mdpi.com/article/10.3390/horticulturae7080229/s1, Table S1: Integrated pest management protocol applied for pathogen-resistant varieties (PRV) and non-resistant cultivars, Figure S1: Ripe clusters of the five resistantcultivars evaluated in the study and their parentals with respective pedigree.
Author Contributions: Conceptualisation, T.F. and S.P.; methodology, S.P. and M.G.; investigation,T.F., C.S., F.D.Z. and P.G.; resources, S.P.; data curation, T.F.; writing—original draft preparation,T.F.; writing—review and editing, M.G., S.P., A.V., C.S, F.D.Z. and P.G.; funding acquisition, S.P. Allauthors have read and agreed to the published version of the manuscript.
Funding: Research partially supported by the ValorInVitis project, funded by the Emilia RomagnaRegion under the RDP program (PSR Emilia Romagna 2014–2020 Mis. 16.1.01 FA 2A), Grant No.5004320, and by Catholic University of Sacred Heart D1 funds.
Institutional Review Board Statement: Not applicable.
Informed Consent Statement: Not applicable.
Data Availability Statement: The data presented in this study are available on request from thecorresponding author.
Acknowledgments: The authors would like to thank Cantina Sociale di Vicobarone, Vivai Coopera-tivi Rauscedo, and Roberto Miravalle, for establishing the experimental vineyard; Stefano Carrà andLuca Ampeli, for the technical support in the vineyard; Maria Giulia Parisi, Lily Ronney, and Alessan-dra Garavani, for the technical help; Alice Richards, for revising the written English manuscript;Roberto Miravalle, Marco Profumo, Mauro Mazzocchi, Claudio Gazzola, Andrea Pradelli, andAndrea Illari, for topic discussion.
Conflicts of Interest: The authors declare no conflict of interest.
References
1. Palliotti, A.; Tombesi, S.; Silvestroni, O.; Lanari, V.; Gatti, M.; Poni, S. Changes in vineyard establishment and canopy managementurged by earlier climate-related grape ripening: A review. Sci. Hortic. 2014, 178, 43–54. [CrossRef]
2. Poni, S.; Gatti, M.; Palliotti, A.; Dai, Z.; Duchêne, E.; Truong, T.T.; Ferrara, G.; Matarrese, A.M.S.; Gallotta, A.; Bellincontro, A.;et al. Grapevine quality: A multiple choice issue. Sci. Hortic. 2018, 234, 445–462. [CrossRef]
3. Bernardo, S.; Dinis, L.T.; Machado, N.; Moutinho-Pereira, J. Grapevine abiotic stress assessment and search for sustainableadaptation strategies in Mediterranean-like climates. A review. Agron. Sustain. Dev. 2018, 38, 66. [CrossRef]
4. Duchêne, E.; Huard, F.; Dumas, V.; Schneider, C.; Merdinoglu, D. The challenge of adapting grapevine varieties to climate change.Clim. Res. 2010, 41, 193–204. [CrossRef]
5. Moran, M.A.; Sadras, V.O.; Petrie, P.R. Late pruning and carry-over effects on phenology, yield components and berry traits inShiraz. Aust. J. Grape Wine Res. 2017, 23, 390–398. [CrossRef]
6. Frioni, T.; Bertoloni, G.; Squeri, C.; Garavani, A.; Ronney, L.; Poni, S.; Gatti, M. Biodiversity of Local Vitis vinifera L. Germplasm: APowerful Tool Toward Adaptation to Global Warming and Desired Grape Composition. Front. Plant Sci. 2020, 11, 608. [CrossRef][PubMed]
7. Garrett, K.A.; Nita, M.; De Wolf, E.D.; Esker, P.D.; Gomez-Montano, L.; Sparks, A.H. Plant pathogens as indicators of climatechange. In Climate Change; Elsevier: Amsterdam, The Netherlands, 2021; pp. 499–513.
8. Zambito Marsala, R.; Capri, E.; Russo, E.; Bisagni, M.; Colla, R.; Lucini, L.; Gallo, A.; Suciu, N.A. First evaluation of pesticidesoccurrence in groundwater of Tidone Valley, an area with intensive viticulture. Sci. Total Environ. 2020, 736, 139730. [CrossRef][PubMed]
9. Pedneault, K.; Provost, C. Fungus resistant grape varieties as a suitable alternative for organic wine production: Benefits, limits,and challenges. Sci. Hortic. 2016, 208, 57–77. [CrossRef]
10. Töpfer, R.; Hausmann, L.; Harst, M.; Maul, E.; Zyprian, E.; Eibach, R. New horizons for grapevine breeding. Fruit Veg. Cereal Sci.Biotechnol. 2011, 5, 79–100.
11. Montaigne, E.; Coelho, A.; Khefifi, L. Economic issues and perspectives on innovation in new resistant grapevine varieties inFrance. Wine Econ. Policy 2016, 5, 73–77. [CrossRef]
12. Pertot, I.; Caffi, T.; Rossi, V.; Mugnai, L.; Hoffmann, C.; Grando, M.S.; Gary, C.; Lafond, D.; Duso, C.; Thiery, D.; et al. A criticalreview of plant protection tools for reducing pesticide use on grapevine and new perspectives for the implementation of IPM inviticulture. Crop Prot. 2017, 97, 70–84. [CrossRef]
13. Bavaresco, L.; Gardiman, M.; Brancadoro, L.; Espen, L.; Failla, O.; Scienza, A.; Vezzulli, S.; Zulini, L.; Velasco, R.; Stefanini, M.;et al. Grapevine breeding programs in Italy. In Grapevine Breeding Programs for the Wine Industry; Elsevier Inc.: Amsterdam, TheNetherlands, 2015; pp. 135–157. ISBN 978-1-78242-080-4.
45
Horticulturae 2021, 7, 229
14. Di Gaspero, G.; Foria, S. Molecular grapevine breeding techniques. In Grapevine Breeding Programs for the Wine Industry; ElsevierInc.: Amsterdam, The Netherlands, 2015; pp. 23–37. ISBN 978-1-78242-080-4.
15. Vezzulli, S.; Dolzani, C.; Migliaro, D.; Banchi, E.; Stedile, T.; Zatelli, A.; Dallaserra, M.; Clementi, S.; Dorigatti, C.; Velasco, R.;et al. The Fondazione Edmund Mach grapevine breeding program for downy and powdery mildew resistances: Toward a greenviticulture. Acta Hortic. 2019, 1248, 109–113. [CrossRef]
16. Bove, F.; Bavaresco, L.; Caffi, T.; Rossi, V. Assessment of Resistance Components for Improved Phenotyping of Grapevine VarietiesResistant to Downy Mildew. Front. Plant Sci. 2019, 10, 1559. [CrossRef]
17. Casagrande, K.; Falginella, L.; Castellarin, S.D.; Testolin, R.; Di Gaspero, G. Defence responses in Rpv3-dependent resistance tograpevine downy mildew. Planta 2011, 234, 1097–1109. [CrossRef] [PubMed]
18. Vezzulli, S.; Vecchione, A.; Stefanini, M.; Zulini, L. Downy mildew resistance evaluation in 28 grapevine hybrids promising forbreeding programs in Trentino region (Italy). Eur. J. Plant Pathol. 2018, 150, 485–495. [CrossRef]
19. Zanghelini, J.A.; Bogo, A.; Dal Vesco, L.L.; Gomes, B.R.; Mecabô, C.V.; Herpich, C.H.; Welter, L.J. Response of PIWI grapevinecultivars to downy mildew in highland region of southern Brazil. Eur. J. Plant Pathol. 2019, 154, 1051–1058. [CrossRef]
20. Poni, S.; Chiari, G.; Caffi, T.; Bove, F.; Tombesi, S.; Moncalvo, A.; Gatti, M. Canopy physiology, vine performance and host-pathogen interaction in a fungi resistant cv. Sangiovese x Bianca accession vs. a susceptible clone. Sci. Rep. 2017, 7, 1–14.[CrossRef]
21. Casanova-Gascón, J.; Ferrer-Martín, C.; Bernad-Eustaquio, A.; Elbaile-Mur, A.; Ayuso-Rodríguez, J.M.; Torres-Sánchez, S.;Jarne-Casasús, A.; Martín-Ramos, P. Behavior of vine varieties resistant to fungal diseases in the Somontano region. Agronomy2019, 9, 738. [CrossRef]
22. Zambon, Y.; Khavizova, A.; Colautti, M.; Georgofili, E.S. Varietà di Vite Resistenti Alle Malattie e Rame: Opportunità e Limiti. InRiflessioni Sull’uso del Rame per la Protezione Delle Piante; Accademia dei Georgofili, Quaderni 2019-III, Società Editrice Fiorentina:Firenze, Italy, 2020.
23. Gratl, V.; Sturm, S.; Zini, E.; Letschka, T.; Stefanini, M.; Vezzulli, S.; Stuppner, H. Comprehensive polyphenolic profiling inpromising resistant grapevine hybrids including 17 novel breeds in northern Italy. J. Sci. Food Agric. 2021, 101, 2380–2388.[CrossRef]
24. Gelmetti, A.; Roman, T.; Bottura, M.; Stefanini, M.; Pedò, S. Performance agronomiche di viti resistenti. Primi risultati di unprogetto poliennale. Vite e Vino 2019, 2, 54–61.
25. Nicolini, G.; Barp, L.; Roman, T.; Larcher, R.; Malacarne, M.; Bottura, M.; Tait, F.; Battisti, F.; Mereles, M.S.; Battistella, R. Resistentibianchi e rossi: Primi dati da esperienze trentine sulla concentrazione nei vini di shikimico e flavonoidi. L’Enologo 2018, 3, 89–93.
26. Ruehl, E.; Schmid, J.; Eibach, R.; Töpfer, R. Grapevine breeding programmes in Germany. In Grapevine Breeding Programs for theWine Industry; Elsevier Inc.: Amsterdam, The Netherlands, 2015; pp. 77–101. ISBN 978-1-78242-080-4.
27. Frioni, T.; Green, A.; Emling, J.E.; Zhuang, S.; Palliotti, A.; Sivilotti, P.; Falchi, R.; Sabbatini, P. Impact of spring freeze on yield,vine performance and fruit quality of Vitis interspecific hybrid Marquette. Sci. Hortic. 2017, 219, 302–309. [CrossRef]
28. Teissedre, P.L. Composition of grape and wine from resistant vine varieties. OENO One 2018, 52, 197–203. [CrossRef]29. Pedò, S.; Bottura, M.; Porro, D. Development, yield potential and nutritional aspects of resistant grapevine varieties in Trentino
Alto Adige. BIO Web Conf. 2019, 13, 02004. [CrossRef]30. Smith, M.S.; Centinari, M. Young grapevines exhibit interspecific differences in hydraulic response to freeze stress but not in
recovery. Planta 2019, 250, 495–505. [CrossRef]31. Hed, B.; Centinari, M. Gibberellin application improved bunch rot control of vignoles grape, but response to mechanical
defoliation varied between training systems. Plant Dis. 2021, 105, 339–345. [CrossRef]32. Tóth-Lencsés, A.K.; Kozma, P.; Szoke, A.; Kerekes, A.; Veres, A.; Kiss, E. Parentage analysis in Hungarian grapevine cultivars of
“Seibel’-’Seyve-Villard” origin. Vitis 2015, 54, 27–29.33. Venuti, S.; Copetti, D.; Foria, S.; Falginella, L.; Hoffmann, S.; Bellin, D.; Cindric, P.; Kozma, P.; Scalabrin, S.; Morgante, M.; et al.
Historical Introgression of the Downy Mildew Resistance Gene Rpv12 from the Asian Species Vitis amurensis into GrapevineVarieties. PLoS ONE 2013, 8, e61228. [CrossRef] [PubMed]
34. Winkler, A. General Viticulture; University of California Press: Berkeley, CA, USA, 1965.35. Lorenz, D.H.; Eichhorn, K.W.; Bleiholder, H.; Klose, R.; Meier, U.; Weber, E. Growth Stages of the Grapevine: Phenological growth
stages of the grapevine (Vitis vinifera L. ssp. vinifera)—Codes and descriptions according to the extended BBCH scale. Aust. J.Grape Wine Res. 1995, 1, 100–103. [CrossRef]
36. Gatti, M.; Garavani, A.; Krajecz, K.; Ughini, V.; Parisi, M.G.; Frioni, T.; Poni, S. Mechanical mid-shoot leaf removal on ortrugo(Vitis vinifera L.) at pre-or mid-veraison alters fruit growth and maturation. Am. J. Enol. Vitic. 2019, 70, 88–97. [CrossRef]
37. Kliewer, W.M.; Dokoozlian, N.K. Leaf Area/Crop Weight Ratios of Grapevines: Influence on Fruit Composition and Wine Quality.Am. J. Enol. Vitic. 2005, 56, 170–181.
38. Poni, S.; Tombesi, S.; Palliotti, A.; Ughini, V.; Gatti, M. Mechanical winter pruning of grapevine: Physiological bases andapplications. Sci. Hortic. 2016, 204, 88–98. [CrossRef]
39. Jarvis, C.; Darbyshire, R.; Goodwin, I.; Barlow, E.W.R.; Eckard, R. Advancement of winegrape maturity continuing for winegrow-ing regions in Australia with variable evidence of compression of the harvest period. Aust. J. Grape Wine Res. 2018, 25, 101–108.[CrossRef]
40. Gladstones, J. Viticulture and Environment; Winetitles: Adelaide, Australia, 1992.
46
Horticulturae 2021, 7, 229
41. Kemp, B.; Pedneault, K.; Pickering, G.; Usher, K.; Willwerth, J. Red Winemaking in Cool Climates. In Red Wine Technology; Elsevier:Amsterdam, The Netherlands, 2018; pp. 341–356. ISBN 978-0-12814-400-8.
42. Frioni, T.; Bronzoni, V.; Moncalvo, A.; Poni, S.; Gatti, M. Evaluation of local minor cultivars and marginal areas to improve winesand increase the sustainability of the district ‘Colli Piacentini’. Acta Hortic. 2020, 1276, 111–118. [CrossRef]
43. Nistor, E.; Dobrei, A.G.; Dobrei, A.; Camen, D. Growing Season Climate Variability and its Influence on Sauvignon Blanc andPinot Gris Berries and Wine Quality: Study Case in Romania (2005–2015). S. Afr. J. Enol. Vitic. 2018, 39, 196–207. [CrossRef]
44. Gatti, M.; Garavani, A.; Cantatore, A.; Parisi, M.G.; Bobeica, N.; Merli, M.C.; Vercesi, A.; Poni, S. Interactions of summer pruningtechniques and vine performance in the white Vitis vinifera cv. Ortrugo. Aust. J. Grape Wine Res. 2015, 21, 80–89. [CrossRef]
45. Hale, C.R. Synthesis of Organic Acids in the Fruit of the Grape. Nature 1962, 195, 917–918. [CrossRef]46. Sweetman, C.; Deluc, L.G.; Cramer, G.R.; Ford, C.M.; Soole, K.L. Regulation of malate metabolism in grape berry and other
developing fruits. Phytochemistry 2009, 70, 1329–1344. [CrossRef]47. Ford, C.M. The Biochemistry of organic acids in the Grape. In The Biochemistry of the Grape Berry; Geròs, H., Chaves, M.M., Delrot,
S., Eds.; Bentham Books: Dubai, United Arab Emirates, 2012; pp. 67–88.48. Famiani, F.; Farinelli, D.; Frioni, T.; Palliotti, A.; Battistelli, A.; Moscatello, S.; Walker, R.P. Malate as substrate for catabolism and
gluconeogenesis during ripening in the pericarp of different grape cultivars. Biol. Plant. 2016, 60, 155–162. [CrossRef]49. Famiani, F.; Battistelli, A.; Moscatello, S.; Cruz-Castillo, J.G.; Walker, R.P. The organic acids that are accumulated in the flesh
of fruits: Occurrence, metabolism and factors affecting their contents—A review. Rev. Chapingo. Ser. Hortic. 2015, 21, 97–128.[CrossRef]
50. Ewart, A.J.W.; Gawel, R.; Thistlewood, S.P.; McCarthy, M.G. Evaluation of must composition and wine quality of six clones ofVitis vinifera cv. Sauvignon Blanc. J. Exp. Agric. 1993, 33, 945–951. [CrossRef]
51. Costantini, L.; Battilana, J.; Lamaj, F.; Fanizza, G.; Grando, M.S. Berry and phenology-related traits in grapevine (Vitis vinifera L.):From Quantitative Trait Loci to underlying genes. BMC Plant Biol. 2008, 8, 1–17. [CrossRef]
52. Duchêne, É. How can grapevine genetics contribute to the adaptation to climate change? OENO One 2016, 50, 113–124. [CrossRef]53. Bayo-Canha, A.; Costantini, L.; Fernández-Fernández, J.I.; Martínez-Cutillas, A.; Ruiz-García, L. QTLs Related to Berry Acidity
Identified in a Wine Grapevine Population Grown in Warm Weather. Plant Mol. Biol. Report. 2019, 37, 157–169. [CrossRef]54. Bigard, A.; Berhe, D.T.; Maoddi, E.; Sire, Y.; Boursiquot, J.M.; Ojeda, H.; Péros, J.P.; Doligez, A.; Romieu, C.; Torregrosa, L. Vitis
vinifera L. fruit diversity to breed varieties anticipating climate changes. Front. Plant Sci. 2018, 9, 455. [CrossRef]55. Bigard, A.; Romieu, C.; Sire, Y.; Torregrosa, L. Vitis vinifera L. Diversity for Cations and Acidity Is Suitable for Breeding Fruits
Coping With Climate Warming. Front. Plant Sci. 2020, 11, 1175. [CrossRef] [PubMed]56. Bernizzoni, F.; Gatti, M.; Civardi, S.; Poni, S. Long-term Performance of Barbera Grown under Different Training Systems and
Within-Row Vine Spacings. Am. J. Enol. Vitic. 2009, 60, 339–348.57. Reynolds, A.G.; Vanden Heuvel, J.E. Influence of Grapevine Training Systems on Vine Growth and Fruit Composition: A Review.
Am. J. Enol. Vitic. 2009, 60, 251–268.58. Dinis, L.T.; Malheiro, A.C.; Luzio, A.; Fraga, H.; Ferreira, H.; Gonçalves, I.; Pinto, G.; Correia, C.M.; Moutinho-Pereira, J.
Improvement of grapevine physiology and yield under summer stress by kaolin-foliar application: Water relations, photosynthesisand oxidative damage. Photosynthetica 2018, 56, 641–651. [CrossRef]
47

horticulturae
Article
The Use of Halophytic Companion Plant (Portulaca oleracea L.)on Some Growth, Fruit, and Biochemical Parameters ofStrawberry Plants under Salt Stress
Sema Karakas 1,*, Ibrahim Bolat 2 and Murat Dikilitas 3
Citation: Karakas, S.; Bolat, I.;
Dikilitas, M. The Use of Halophytic
Companion Plant (Portulaca oleracea
L.) on Some Growth, Fruit, and
Biochemical Parameters of Strawberry
Plants under Salt Stress. Horticulturae
2021, 7, 63. https://doi.org/10.3390/
horticulturae7040063
Academic Editors: Agnieszka Hanaka,
Jolanta Jaroszuk-Sciseł and
Małgorzata Majewska
Received: 10 February 2021
Accepted: 23 March 2021
Published: 26 March 2021
Publisher’s Note: MDPI stays neutral
with regard to jurisdictional claims in
published maps and institutional affil-
iations.
Copyright: © 2021 by the authors.
Licensee MDPI, Basel, Switzerland.
This article is an open access article
distributed under the terms and
conditions of the Creative Commons
Attribution (CC BY) license (https://
creativecommons.org/licenses/by/
4.0/).
1 Department of Soil Science and Plant Nutrition, Faculty of Agriculture, Harran University,Sanliurfa 63300, Turkey
2 Department of Horticulture, Faculty of Agriculture, Harran University, Sanliurfa 63300, Turkey;[email protected]
3 Department of Plant Protection, Faculty of Agriculture, Harran University, Sanliurfa 63300, Turkey;[email protected]
* Correspondence: [email protected]
Abstract: Strawberry is a salt-sensitive plant adversely affected by slightly or moderately saline con-ditions. The growth, fruit, and biochemical parameters of strawberry plants grown under NaCl (0, 30,60, and 90 mmol L−1) conditions with or without a halophytic companion plant (Portulaca oleracea L.)were elucidated in a pot experiment. Salt stress negatively affected the growth, physiological (stom-atal conductance and electrolyte leakage), and biochemical parameters such as chlorophyll contents(chl-a and chl-b); proline, hydrogen peroxide, malondialdehyde, catalase, and peroxidase enzymeactivities; total soluble solids; and lycopene and vitamin C contents, as well as the mineral uptake, ofstrawberry plants. The companionship of P. oleracea increased fresh weight, dry weight, and fruitaverage weight, as well as the total fruit yield of strawberry plants along with improvements ofphysiological and biochemical parameters. This study showed that the cultivation of P. oleracea withstrawberry plants under salt stress conditions effectively increased strawberry fruit yield and quality.Therefore, we suggest that approaches towards the use of P. oleracea could be an environmentallyfriendly method that should be commonly practiced where salinity is of great concern.
Keywords: abiotic stress; strawberry; companion plants; phytoremediation
1. Introduction
Salinity is one of the most devastating environmental problems limiting crop produc-tivity and quality in many regions of the world. This problem is more prevalent in aridand semi-arid climatic regions. It affects approximately 20% of the cultivated and 50% ofirrigated agricultural lands [1,2]. It has now been estimated that 1.5 million hectares oflands have been lost every year due to salinity problems. If salinization goes with thistrend, nearly 50% of cultivable lands will be lost by the mid-point of this century [3,4].
Salinity negatively affects plant growth in terms of osmotic, ionic, and nutrient im-balance [5]. These disorders cause oxidative stress on plants. If plants cannot get enoughwater under high salt stress, turgor pressure significantly decreases, and thus the closure ofthe stomata of plants becomes inevitable to conserve water [6]. This significantly affectsthe photosynthetic capacity of plants. Ionic toxicity, on the other hand, inhibits cellularmetabolism and biochemical pathways. For example, Na+ ions at the root cell disturbenzymatic activities and inhibit the uptake of other minerals such as K+ and Ca++ [7].The high accumulation of Na+ and Cl− ions result in many morphological, physiological,molecular, and biochemical pathways in plants. Due to disturbed mechanisms in plants,NaCl stress leads to the development of leaf chlorosis and necrosis, as well as the loss ofquality in crops. As a consequence, the assimilation of carbohydrates and sugars allocated
Horticulturae 2021, 7, 63. https://doi.org/10.3390/horticulturae7040063 https://www.mdpi.com/journal/horticulturae
49
Horticulturae 2021, 7, 63
for fruit development is significantly reduced due to stress development and defensemechanisms [8,9].
Plants can be divided into halophytes and glycophytes as responses to salinity stress.Most glycophytes are salt-sensitive, even at low concentrations, while halophytes arehighly salt-tolerant plants, which enables them to survive and thrive in extremely salineenvironments [10,11]. Salt ions have to be taken up by halophytes and deposited in thevacuoles of leaf or root tissues or in separate organelles. In general, salt secretion takesplace through the shedding of salty leaves and salt glands or specialized leaf cells [12].Most halophytes are able to survive by maintaining negative water potential under extremesalt concentrations. Therefore, a true halophyte is considered to maintain its viability andcomplete the life cycle at NaCl levels between 200 and 1000 mmol L−1. These concentrationsare very close to the concentrations of seawater level. Some halophytes, on the other hand,tolerate much higher concentrations of NaCl [10,13]. Halophytes such as Atriplex spp.,Chenopodium spp., Portulaca spp., Suaeda spp., and Salsola spp. uptake salt ions throughtheir roots and store them in their leaves. It is quite possible that these plants could be usedas companion plants with crop plants, especially salt-sensitive glycophytes, to reduce thenegative effects of NaCl through the uptake of toxic ions [14,15]. For example, Portulacaoleracea L. (purslane) (which is a member of Portulacaceae), is a drought- and salt-tolerantannual plant. The plant is a promising crop species in saline–alkali soils [16,17]. Moreover,P. oleracea could effectively absorb salts from soil media to remediate saline–alkali soils [18].Previous studies have investigated the effects of salinity on P. oleracea growth. For example,Grieve and Suarez [19] evaluated P. oleracea responses with saline irrigation, and theyshowed that the plant could survive at a salinity of 28.5 dS m−1. The authors furtherelucidated the performances of salt-tolerant halophyte species of P. oleracea and Salsolasoda against increasing NaCl levels. They reported that P. oleracea and S. soda seeds wereeffectively germinated between 250 and 350 mmol L−1 NaCl levels [20].
Strawberry is an economically important fruit crop that is globally cultivated. Itbelongs to the Fragaria genus in Rosaceae family, which contains 23 species [21,22]. Thepopularity of strawberry fruit crops is increasing in the world due to increasing con-sumption. Its popularity is also increasing along with the generation of new varieties.Strawberry cultivation has therefore become an important greenhouse and open field cropin the Mediterranean area, although drought and salinity have played significant roles inlimiting crop production [23,24].
Strawberry is considered to be sensitive to NaCl salinity due to increased osmoticpressure and Na+ or Cl− ion toxicity. NaCl salinity not only reduces the crop yield but alsodeteriorates the quality parameters in many crops, including strawberries [25,26].
In the present study, we elucidated the effects of different NaCl concentrations onstrawberry plants grown with or without the halophytic companion plant P. oleracea L. toremediate the physiological and biochemical parameters of strawberry plants.
2. Materials and Methods
2.1. Experimental Design and the Growth of Plants
The experiment was performed between September 2018 and January 2019 in a semi-controlled greenhouse at the University of Harran, Sanliurfa, Turkey. Fresh strawberry(Rubygem variety) plants were grown alone or in combination with P. oleracea seedlingsin 8-L pots containing peat (Klasmann TS 1) under natural light conditions. Peat is a veryporous substrate with an excellent water capacity. Its slow degradation rate, high porosity,and high-water holding capacity makes it one of the most commonly used growth medium,especially for saline-related studies in vegetables and ornamental plants [27,28]. It haslow nutrient values, so it is highly unlikely to affect the mineral uptake of macro andmicronutrient elements.
The average temperatures for day and night were 35 ± 2/28 ± 2 ◦C during thecourse of the experiment. The trial was carried out in a randomized block design. Thefirst group of strawberry plants grown under differing NaCl conditions (0, 30, 60, and
50

Horticulturae 2021, 7, 63
90 mmol L−1) was designated as S0, S30, S60, and S90; the second group of plants grownwith P. oleracea under the same NaCl conditions was designated as SP0, SP30, SP60, andSP90. Treatments in each group were replicated five times. Seedlings were individuallytransplanted to the pots. Strawberry seedlings following one week of establishment growthin pots were accompanied with P. oleracea seeds that were sown and germinated at a rate of25 companion plants per pot. After germinations (five weeks), the pots were irrigated withor without salt to the full pot capacity throughout the treatment period (twelve weeks). Theplants were fertigated with Hoagland’s nutrient solution once a week. The experimentaltrial from the very beginning of obtaining strawberry seedlings to the end of harvest tookfive months. The plants were harvested at the optimum stage of physiological maturity forthe evaluation of salinity responses (Figure 1).
Figure 1. Strawberry plants were grown with or without Portulaca oleracea under differentNaCl conditions.
2.2. Plant Growth and Fruit Properties
Strawberry fruits were harvested when 90% of the fruit surface had reached a fullyred color. At the end of the experimental period, total fruit weights were determined andthe average fruit yield was calculated.
Plant crown and root fresh weight (Fwt) were analyzed immediately after the harvest.The dry weight (Dwt) of plant organs was determined following the drying of plantsamples at 70 ◦C until a constant weight.
Total soluble solids (TSS) were assessed from the fruit juice with a hand refractometer.The results are expressed in percent (%) Catania et al. [29].
The lycopene content of strawberry fruits was assessed according to the method ofBarrett and Anthon [30] with minor modifications [31]. One gram of strawberry fruitwas homogenized with 10 mL of an ethanol:hexane solution (4:3). The mixture was then
51
Horticulturae 2021, 7, 63
centrifuged at 10,000× g for 10 min at room temperature. The supernatant (100 μL) wasadded to 7 mL of the ethanol:hexane solution (4:3) mixture and vortexed. After 1 h ofincubation at room temperature, 1 mL of H2O was added to the tubes and vortexed. Thetubes were incubated in the dark to form two different phases. The top phase was takenand read at 503 nm against a hexane blank with a UV microplate spectrophotometer (Epoch,SN: 1611187, Winooski, VT, USA). The lycopene content was calculated according to thefollowing formula (Equation (1)).
μg Lycopene g−1 Fwt =A503 × 2.7172 × 0.1
× 537 (1)
where 537 g/mole is the molecular weight of lycopene, 2.7 mL is the volume of the hexanelayer, 172 mmol−1 is the extinction coefficient for lycopene in hexane, and 0.1 g is theweight of the strawberry.
The vitamin C content of strawberry fruits was assessed according to the method ofOz [32] with small modifications [31]. Strawberry fruits (5 g) were extracted with 25 mLof oxalic acid. The mixture was centrifuged at 10,000× g for 10 min. Then, 1 mL of thismixture was added to 7 mL of a 1% oxalic acid solution and 8 mL of a dye reagent. Thedye reagent was prepared according to the recipe of [31]. The mixture was filtered throughWhatman No.2 filter paper and diluted to 100 mL with deionized H2O. Then, 25 mL ofthis solution were taken and diluted to 500 mL with deionized H2O, vortexed, and keptat 4 ◦C until use. The mixture was once more vortexed before measurement at 518 nmagainst the oxalic acid and dye mixture with a UV microplate spectrophotometer (Epoch,SN: 1611187, Winooski, VT, USA).
Electrolyte leakage (EL) was assessed following the method of Lutts et al. [33] usingleaf discs for each treatment. Fully expanded young leaves were cleaned three times withdeionized H2O to remove dust and surface-adhered electrolytes. Leaf discs were placedin closed vials containing 10 mL of H2O and incubated at 25 ◦C on a rotary shaker for24 h; subsequently, the electrical conductivity of the solution (EC1) was measured. Thefinal electrical conductivity (EC2) was determined following the autoclaving of the leafsamples at 120 ◦C for 20 min. Leaf samples were then equilibrated at 25 ◦C, and the ELwas calculated as follows (Equation (2)).
EL (%) =EC1EC2
× 100 (2)
Stomatal conductivity (SC) was determined on the youngest fully expanded leaveson the upper branches of the strawberry plants with a leaf promoter (SC−1) at midday.Measurements were performed by clamping the leaves in the leaf chamber. The actualvapor flux from the leaf through the stomata is expressed as mmol m−2 s−1, following thework of Karlidag et al. [34].
2.3. Biochemical Parameters
Strawberry plant leaf chlorophyll content (Chl-a and Chl-b) was extracted followingthe method of Arnon [35] with minor modifications [31]. A sample of the fresh leaf (0.5 g)was homogenized with 10 mL of an acetone:water (80/20, v/v) mixture and filtered throughWhatman No.2 filter paper and then put into the dark tubes. The Chl-a and Chl-b contentsof the filtrate was measured with a UV microplate spectrophotometer (Epoch, SN: 1611187,Winooski, VT, USA) at 663 and 645 nm, respectively, against an 80% acetone blank. Thefindings were expressed as mg L−1 and calculated as mg g−1 Fwt.
The proline concentration was determined following the method of Bates et al. [36]with minor modifications [31]. Leaf samples (0.5 g) were extracted with 10 mL of 3% w/vsulphosalicylic acid using a mortar and a pestle. The extract was filtered through WhatmanNo.2 filter paper. Then, the 2 mL filtrate was mixed with 2 mL of acid–ninhydrin in a testtube and boiled at 100 ◦C for 1 h. The reaction was terminated in an ice bath. Then, themixture was extracted using 5 mL of toluene. The tubes were vortexed for 20 s and then
52
Horticulturae 2021, 7, 63
left for 20 min at room temperature to achieve two layers of separation. The organic phasewas collected, and the absorbance of the extracts was read at 515 nm using a toluene blank.Proline concentration was made from a standard curve using L-proline (Sigma-Aldrich,Taufkirchen-Germany). The results are expressed as μmol g−1 Fwt.
Hydrogen peroxide (H2O2) levels were assessed following the method ofVelikova et al. [37] with small modifications [38]. Leaf samples (0.5 g) were extractedwith 5 mL of 0.1% (w:v) trichloroacetic acid (TCA). The extract was centrifuged at 12,000× gat 4 ◦C for 15 min, and the supernatant (0.5 mL) was added to 0.5 mL of a 10 mmol L−1
potassium phosphate buffer (pH 7.0) and 1 mL of a 1 mol L−1 potassium iodide. Theabsorbance was read at 390 nm in a UV microplate spectrophotometer (Epoch, SN: 1611187,Winooski, VT, USA). The H2O2 content was expressed as μmol g−1 Fwt.
The malondialdehyde (MDA) content was assessed following the method of Sairamand Sexena [39] with minor modifications [38]. The leaf samples (0.5 g) were extractedwith 10 mL of a 0.1% (w/v) TCA solution. The extract was centrifuged at 10,000× g for5 min. Four milliliters of 20% v/v TCA containing 0.5% v/v thiobarbituric acid (TBA) wasadded to 1 mL of the supernatant. The mixture was kept in boiling water for 30 min, andthen the reaction was stopped in an ice bath. The mixture was once more centrifugedat 10,000× g for 5 min and then read in a UV microplate spectrophotometer (Epoch, SN:1611187, Winooski, VT, USA) at 532 and 600 nm. The MDA content was calculated andexpressed as nmol g−1 Fwt (Equation (3)).
MDA(
nmol g−1)=
Extract volume (ml) ×[(A532 − A600)/
(155 mM−1 cm−1
)]
Sample amaunt (g)× 103 (3)
Catalase enzyme activity (CAT; Enzyme Code. 1.11.1.6) was determined followingthe method of Milosevic and Slusarenko [40] with minor modifications [38]. Leaf samples(0.5 g) were extracted with 10 mL of a 50 mmol L−1 Na-phosphate buffer solution, and then50 mL of the extract were added to a 2.95 mL reaction mixture (50 mmol L−1 Na-phosphatebuffer, 10 mmol L−1 H2O2, and 4 mmol L−1 Na2EDTA) and read with a UV microplatespectrophotometer (Epoch, SN: 1611187, Winooski, VT, USA) at 240 nm for 30 s. One CATunit (U) was defined as an increase in absorbance of 0.1 at 240 nm. The activity is expressedas enzyme unite mg−1 Fwt.
Peroxidase enzyme activity (POX; Enzyme Code. 1.11.1.7) was assayed following themethod of Cvikrova et al. [41] with minor modifications [38]. For the analysis, 100 mL of thehomogenate (obtained as above) was added to 3 mL of the reaction mixture (50 mmol L−1
Na-phosphate, 5 mmol L−1 H2O2, 13 mmol L−1 guaiacols, and pH 6.5). Activity wasdefined by the range of change in absorbance at 470 nm with a UV microplate spectropho-tometer (Epoch, SN: 1611187, Winooski, VT, USA). One unit of POX was defined as achange of 0.1 absorbance unit per minute at 470 nm. Activity is expressed as enzymeunit mg−1 Fwt.
Leaf mineral (K+, Na+, Ca2+, Mg2+, and Cl−) contents were determined accordingto the procedure made by Chapman and Pratt [42] with minor modifications [31]. Dryplant samples (0.5 g) were ground in porcelain crucibles. The porcelain crucibles wereplaced into a muffle furnace, and the temperature was gradually increased up to 500 ◦C.Following cooling, the ash was dissolved in 5 mL of 2 N hydrochloric acid. After 30 min,the volume was made up to 50 mL with distilled H2O, and the supernatant was filteredthrough Whatman No.42 filter paper. The resulting supernatant containing Na+, K+, Ca+2,and Mg+2 ions were assessed by Inductively Coupled Plasma (ICP, Perkin Elmer). Chloridewas determined using ion chromatography after the filtration through Whatman No.42filter paper.
Duncan’s multiple range test (DMRT) was used to evaluate the data using SPSS 22(ANOVA test) at a significance level of p ≤ 0.05 using. Data are presented as a mean value± with standard error.
53

Horticulturae 2021, 7, 63
3. Results
Strawberry plant growth, fruit properties, biochemical parameters, and mineral con-tents were significantly affected by all salinity levels. The crown fresh and dry weights ofstrawberry plants in saline conditions were significantly lower in plants grown alone insaline conditions when compared to those of plants grown in combination with P. oleraceaunder the same conditions. For example, the crown fresh weights of the plants were 55.16,37.62, and 35.16 g plant−1 grown alone in S30, S60, and S90 mmol L−1 NaCl conditions,respectively. When plants were grown in combinations with P. oleracea, their conditionswere significantly improved at all NaCl conditions. The fresh weights of plants increasedto 64.38, 44.76, and 44.49 plant−1 at the SP30, SP60, and SP90 mmol L−1 NaCl conditions,respectively (Table 1). Similar improvements were recorded for the dry weights of plants(Table 1). In general, the combination of companion plants (P. oleracea) was found to beeffective in increasing the Fwt and Dwt under each NaCl condition.
Table 1. Growth and physiological parameters of strawberry plants grown alone or in combination with P. oleracea atdiffering NaCl levels.
Treatments Crown Fwt (g Plant−1) Crown Dwt (g Plant−1) EL (%) SC (mmol m−2 s−1)
S0 85.32 ± 4.17 a 18.39 ± 0.70 a 11.90 ± 0.77 e 241.98 ± 4.29 a
S30 55.16 ± 5.30 b 12.71 ± 1.40 b 15.61 ± 0.57 c 183.26 ± 8.19 c
S60 37.62 ± 2.70 d 10.00 ± 1.07 d 21.84 ± 1.06 b 127.64 ± 8.39 d
S90 35.16 ± 1.90 d 9.39 ± 0.69 d 25.34 ± 0.92 a 94.10 ± 3.83 e
SP0 85.57 ± 4.46 a 19.09 ± 0.91 a 11.07 ± 0.45 e 260.38 ± 8.81 a
SP30 64.38 ± 5.01 b 14.77 ± 1.08 b 11.10 ± 0.95 e 230.80 ± 5.48 b
SP60 44.76 ± 1.67 c 11.23 ± 0.22 c 13.84 ± 1.04 d 181.60 ± 4.65 c
SP90 44.49 ± 2.69 c 11.16 ± 0.59 c 15.32 ± 1.03 c 131.08 ± 5.51 c
Significance level at p ≤ 0.05 was determined for the salt treatment using Duncan’s multiple range test. Different letters in each columnindicate statistical differences. S: a strawberry grown alone; SP: the strawberry and P. oleracea companionship; EL: electrolyte leakage; SC:stomatal conductivity.
EL is considered an important criterion for salt stress parameters. EL was increasedwith increasing levels of salt. For example, leaf EL was found to be 11.90 and 11.07% at S0and SP0, respectively. Increases of EL were trended from 15.61 to 25.34% with respect toconditions from S30 to S90, respectively. When P. oleracea was accompanied with strawberryplants in the NaCl conditions, the increase of EC was so minimal that only 11.10 and 15.32%were recorded at SP30 and SP90, respectively; see Table 1.
Stomatal conductivity in saline conditions was gradually decreased as the concentra-tion of NaCl increased in plants grown alone in saline conditions (Table 1). However, thecultivation of P. oleracea improved the SC of strawberry plants under all NaCl conditionswhen compared to those grown alone in saline conditions. The improvement of SC wasevident in that the increases were from 183.26 to 230.80% from S30 to SP30 cultivationconditions, respectively. At the higher NaCl concentrations of S90 and SP90, the SC was stillimproved with a lesser efficiency from 94.10 to 131.08%, respectively.
The average fruit weight and yield of strawberry plants under NaCl conditions werereduced in plants grown alone, but the co-cultivation of strawberry plants with P. oleraceaincreased the average and total fruit weight (Table 2).
The employment of P. oleracea not only increased the crop yield and physiologicalparameters but also improved the quality of fruits in terms of lycopene and vitamin Ccontents. Lycopene and vitamin C contents were gradually decreased as the concentrationof NaCl increased. Again, the employment of P. oleracea increased the lycopene and vitaminC at all NaCl levels (Table 2). For example, the remarkable effect was more evident atthe 90 mmol L−1 NaCl conditions, as the both lycopene and vitamin C contents wereincreased when grown with P. oleracea as compared to those of plants grown alone insaline conditions.
54

Horticulturae 2021, 7, 63
Table 2. Yield and some fruit properties of strawberry plants grown alone or in combination with P. oleracea at differingNaCl levels.
TreatmentsAverage Fruit
Weight (g Plant−1)Yield (g Plant−1) Lycopene (mg kg−1 Fwt) Vitamin C (mg kg−1 Fwt) TSS (%)
S0 18.53 ± 0.24 a 214.76 ± 25.26 a 37.98 ± 1.61 a 49.87 ± 2.48 a 8.80 ± 0.22 a
S30 14.96 ± 0.58 c 132.85 ± 19.44 c 35.27 ± 1.29 a 45.07 ± 2.55 c 6.80 ± 0.25 b
S60 9.80 ± 1.25 e 83.76 ± 15.20 d 27.52 ± 1.13 b 36.79 ± 1.30 d 5.80 ± 0.24 d
S90 5.60 ± 0.58 f 31.53 ± 5.40 e 16.56 ± 1.61 c 32.53 ± 0.81 e 5.20 ± 0.25 e
SP0 19.09 ± 0.52 a 229.40 ± 17.46 a 37.20 ± 1.45 a 51.88 ± 1.89 a 9.00 ± 0.20 a
SP30 16.94 ± 0.54 b 164.80 ± 23.99 b 34.87 ± 1.95 a 47.19 ± 1.04 a 7.40 ± 0.17 b
SP60 15.74 ± 0.53 c 147.57 ± 25.67 c 33.93 ± 1.82 a 41.36 ± 1.70 c 5.90 ± 0.20 c
SP90 12.65 ± 0.73 d 94.00 ± 8.91 d 28.55 ± 1.31 b 43.12 ± 2.51 c 5.60 ± 0.19 c
Significance level at p ≤ 0.05 was determined for the salt treatment using Duncan’s multiple range test. Different letters in each columnindicate statistical differences. S: a strawberry grown alone; SP: the strawberry and P. oleracea companionship; TSS: total soluble solids.
Unlike other parameters, the TSS contents of the fruits in saline conditions weresignificantly lowered. The co-cultivation of P. oleracea did not significantly improve theconditions of strawberry plants (Table 2).
Chl-a and Chl-b were significantly affected by salinity at the S60 and S90 mmol L−1
NaCl levels (p ≤ 0.05). For example, the Chl-a and Chl-b were determined as 0.70 and0.36 mg g−1 Fwt, respectively, at S90 mmol L−1 NaCl levels in strawberry plants. Thepositive effects of P. oleracea on the Chl-a and Chl-b contents at SP90 mmol L−1 NaCl wereevident, as the Chl-a and Chl-b contents were 1.01 and 0.51 mg g−1 Fwt, respectively, instrawberry plants (Figure 2A,B).
(A)
(B)
Figure 2. Leaf Chl-a (A) and Chl-b (B) contents of strawberry plants grown alone or in combinationwith P. oleracea at differing NaCl levels (0, 30, 60, and 90 mmol L−1). S: a strawberry grown alone; SP:the strawberry and P. oleracea companionship; TSS: total soluble solids.
55

Horticulturae 2021, 7, 63
Leaf proline content significantly increased as the concentration of NaCl levels in-creased as a response to salinity stress. (p ≤ 0.05); see Figure 3A. The highest proline levelwas determined as 13.77 μmol g−1 Fwt with the S90 mmol L−1 NaCl treatment, whereas atthe SP90 condition, the proline level decreased to 4.40 μmol g−1. Therefore, the combinationof P. oleracea not only improved the physiological and biochemical conditions of strawberryplants but also reduced the stress metabolite levels.
Figure 3. Proline (A), H2O2 (B), and malondialdehyde (MDA) (C) contents; peroxidase enzyme activity (POX) (D) andcatalase enzyme activity (CAT) (E) antioxidant enzyme contents of strawberry plants grown alone or in combination withP. oleracea at differing NaCl levels (0, 30, 60, and 90 mmol L−1). S: a strawberry grown alone; SP: the strawberry andP. oleracea companionship; TSS: total soluble solids.
56
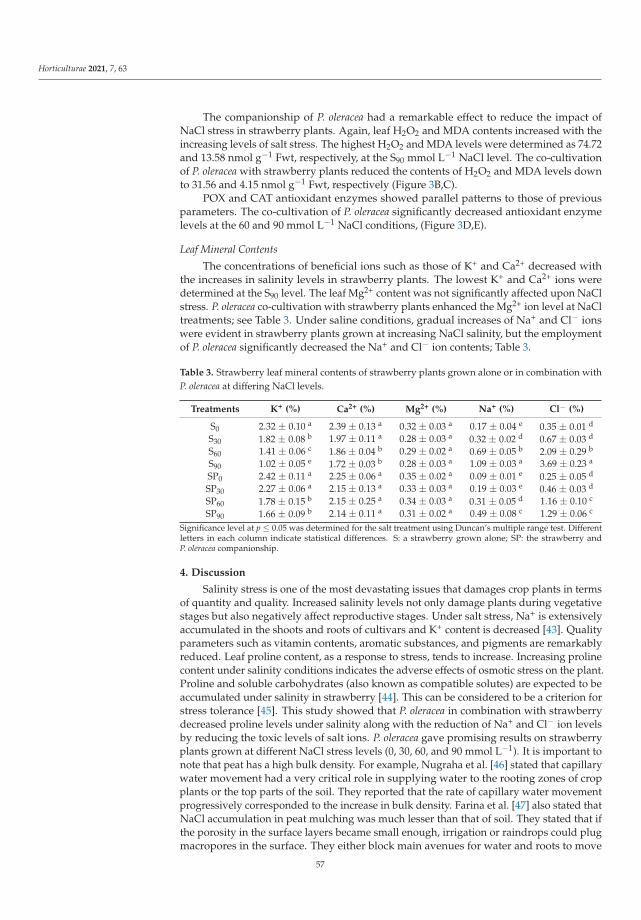
Horticulturae 2021, 7, 63
The companionship of P. oleracea had a remarkable effect to reduce the impact ofNaCl stress in strawberry plants. Again, leaf H2O2 and MDA contents increased with theincreasing levels of salt stress. The highest H2O2 and MDA levels were determined as 74.72and 13.58 nmol g−1 Fwt, respectively, at the S90 mmol L−1 NaCl level. The co-cultivationof P. oleracea with strawberry plants reduced the contents of H2O2 and MDA levels downto 31.56 and 4.15 nmol g−1 Fwt, respectively (Figure 3B,C).
POX and CAT antioxidant enzymes showed parallel patterns to those of previousparameters. The co-cultivation of P. oleracea significantly decreased antioxidant enzymelevels at the 60 and 90 mmol L−1 NaCl conditions, (Figure 3D,E).
Leaf Mineral Contents
The concentrations of beneficial ions such as those of K+ and Ca2+ decreased withthe increases in salinity levels in strawberry plants. The lowest K+ and Ca2+ ions weredetermined at the S90 level. The leaf Mg2+ content was not significantly affected upon NaClstress. P. oleracea co-cultivation with strawberry plants enhanced the Mg2+ ion level at NaCltreatments; see Table 3. Under saline conditions, gradual increases of Na+ and Cl− ionswere evident in strawberry plants grown at increasing NaCl salinity, but the employmentof P. oleracea significantly decreased the Na+ and Cl− ion contents; Table 3.
Table 3. Strawberry leaf mineral contents of strawberry plants grown alone or in combination withP. oleracea at differing NaCl levels.
Treatments K+ (%) Ca2+ (%) Mg2+ (%) Na+ (%) Cl− (%)
S0 2.32 ± 0.10 a 2.39 ± 0.13 a 0.32 ± 0.03 a 0.17 ± 0.04 e 0.35 ± 0.01 d
S30 1.82 ± 0.08 b 1.97 ± 0.11 a 0.28 ± 0.03 a 0.32 ± 0.02 d 0.67 ± 0.03 d
S60 1.41 ± 0.06 c 1.86 ± 0.04 b 0.29 ± 0.02 a 0.69 ± 0.05 b 2.09 ± 0.29 b
S90 1.02 ± 0.05 e 1.72 ± 0.03 b 0.28 ± 0.03 a 1.09 ± 0.03 a 3.69 ± 0.23 a
SP0 2.42 ± 0.11 a 2.25 ± 0.06 a 0.35 ± 0.02 a 0.09 ± 0.01 e 0.25 ± 0.05 d
SP30 2.27 ± 0.06 a 2.15 ± 0.13 a 0.33 ± 0.03 a 0.19 ± 0.03 e 0.46 ± 0.03 d
SP60 1.78 ± 0.15 b 2.15 ± 0.25 a 0.34 ± 0.03 a 0.31 ± 0.05 d 1.16 ± 0.10 c
SP90 1.66 ± 0.09 b 2.14 ± 0.11 a 0.31 ± 0.02 a 0.49 ± 0.08 c 1.29 ± 0.06 c
Significance level at p ≤ 0.05 was determined for the salt treatment using Duncan’s multiple range test. Differentletters in each column indicate statistical differences. S: a strawberry grown alone; SP: the strawberry andP. oleracea companionship.
4. Discussion
Salinity stress is one of the most devastating issues that damages crop plants in termsof quantity and quality. Increased salinity levels not only damage plants during vegetativestages but also negatively affect reproductive stages. Under salt stress, Na+ is extensivelyaccumulated in the shoots and roots of cultivars and K+ content is decreased [43]. Qualityparameters such as vitamin contents, aromatic substances, and pigments are remarkablyreduced. Leaf proline content, as a response to stress, tends to increase. Increasing prolinecontent under salinity conditions indicates the adverse effects of osmotic stress on the plant.Proline and soluble carbohydrates (also known as compatible solutes) are expected to beaccumulated under salinity in strawberry [44]. This can be considered to be a criterion forstress tolerance [45]. This study showed that P. oleracea in combination with strawberrydecreased proline levels under salinity along with the reduction of Na+ and Cl− ion levelsby reducing the toxic levels of salt ions. P. oleracea gave promising results on strawberryplants grown at different NaCl stress levels (0, 30, 60, and 90 mmol L−1). It is important tonote that peat has a high bulk density. For example, Nugraha et al. [46] stated that capillarywater movement had a very critical role in supplying water to the rooting zones of cropplants or the top parts of the soil. They reported that the rate of capillary water movementprogressively corresponded to the increase in bulk density. Farina et al. [47] also stated thatNaCl accumulation in peat mulching was much lesser than that of soil. They stated that ifthe porosity in the surface layers became small enough, irrigation or raindrops could plugmacropores in the surface. They either block main avenues for water and roots to move
57
Horticulturae 2021, 7, 63
through the soil or they form a cement-like surface layer when the soil dries. The rock-solidupper layer or salt crust then restricts water movement and plant emergence. In our study,evaporation in the greenhouse was not high enough to build up NaCl accumulation inthe top part of the soil. Therefore, no salt crust formation, which would have affected theresults of our experimental findings, was observed.
Mozafari et al. [48] stated that salinity negatively affected the growth parameters,pigment content, and membrane stability, as well as disturbing the ionic balance in plants.For example, Saied et al. [49] stated that strawberry was considered to be a saline-sensitiveplant. Many physiological and biochemical parameters deteriorated. This both directly andindirectly led to diminished productivity in plants [50]. We determined that fresh weight,dry weight, stomatal conductance, fruit average weight, fruit total yield, chlorophyll (Chl-aand Chl-b), total soluble solids, lycopene content, vitamin C content, and leaf mineralcontent (K+ and Ca2+) of strawberry plants significantly decreased with increasing NaCllevels. Strawberry plants grown in companionship with P. oleracea improved the conditionof plants, and much lesser reductions in terms of total yield and quality were evident. Thepositive effect on strawberry growth was quite remarkable. The leaf electrolyte, proline,malondialdehyde, H2O2 contents, catalase enzyme activities, nd peroxidase enzyme ac-tivities, and leaf mineral contents (Na+ and Cl−) of strawberry plants increased with anincreasing level of salinity. The companion plants helped strawberry plants by reducingtoxic ion levels, antioxidant enzyme levels, and stress metabolites. With the improvementof those parameters, electrolyte leakage and stomatal conductance were also improved,and this was reflected in the quality of fruits in terms of lycopene and vitamin C contents.This study proved that mixed planting with P. oleracea in saline conditions was an effectivephytoremediation technique that might significantly increase the yield production andquality of strawberry. Similar findings were also made for S. soda plants by Karakas [51]who suggested that the improvement of tomato plants via companion plants under saltstress (1.3 and 6.5 dS m−1) was achieved with the synthesis of substances used for fruitdevelopment instead of building up substances for mechanisms of stress tolerance. It isimportant to note that synthesizing stress metabolites and antioxidant enzymes is quitecostly for plants to cope with abiotic or biotic stress factors [17]. Instead of generating cropplants that can combat stress factors, the strategy that involves removing stress factorswould be much appreciated. Any genetic modifications or biochemical approaches thatincrease the removing capacity of toxic ions or compounds from the soil habitat wouldbe an environmentally friendly approach and a safe strategy. For example, Grafienberget al. [52] and Karakas et al. [51] stated that reductions in stress metabolites and the uptakeof toxic ions enabled tomato plants to use more energy to build up organic componentssuch as lycopene and proteins instead of producing substances for defense mechanisms. Inthis study, salinity stress resulted in a reduction in vitamin C content and lycopene contentsin strawberry. Jamalian et al. [53] showed that salinity reduced the vitamin C contentof strawberries, which was in line with the results of the present study. The decrease inthe vitamin C content of fruits at high salinity levels can be attributed to the decrease incarbohydrate (sugar) production caused by the decrease in photosynthesis required forvitamin C biosynthesis.
Yaghubi et al. [44] reported that MDA concentration was also high in strawberry plantsat salt stress conditions. They reported that reactive oxygen species (ROS) production wasmuck higher than the scavenging capacity of antioxidant enzymes. The dismutation of O2
–2
into H2O2 and O2 was reported to increase H2O2 concentration [54]. This was observedby a higher H2O2 content in salt-stressed strawberry plants than in control plants. SinceH2O2 was accompanied by an increase in the key antioxidant enzymes such as CAT, POD,and superoxide dismutase (SOD), a reduction of H2O2 was achieved. In our methodology,we achieved the decrease of stress metabolites while suppressing the antioxidant enzymesvia the use of P. oleracea plants. Though antioxidant enzymes such as CAT, POD, and SODare known to substantially reduce the levels of O2
- and H2O2 in plants and play a vitalrole in plant defense against oxidative stress [55], the increase of these enzymes might
58
Horticulturae 2021, 7, 63
interfere with the chemical compounds involved in quality parameters such as lycopeneand vitamin C. With the use of P. oleracea, we were able to reduce stress metabolites andtoxic ions, reduced further damages to cell components, and increased the quality-relatedcompounds without increasing defense-related antioxidant compounds. This saved theenergy to be used for defense responses, and this saved energy could be used to increasemetabolic functions and quality parameters.
5. Conclusions
Strawberry cultivation has become popular recently, and this has led to an increasein cultivated areas. These areas have become saline-polluted, saline-prone, and saline-prevalent. Since strawberry is a salt-sensitive plant, it is easily affected by a mild ormoderate level of salinity. A very low level of NaCl could reduce crop yield and reduce thequality of fruits.
In this study, strawberry seedlings were grown alone or in combination with P. oler-acea under differing NaCl concentrations. Strawberry seedlings under increasing NaClsalinity were negatively affected in terms of physiological, morphological, and biochemicalparameters. Defending plants synthesized various stress metabolites such as proline, MDA,H2O2, and antioxidant enzymes to ease the negative effects of NaCl toxicity. However,increases of these metabolites were negatively correlated with quality-related metabolitessuch as vitamin C and lycopene. The cultivation of strawberry plants with P. oleracea plantsreduced the concentrations of stress metabolites and antioxidant enzyme levels, as well asindirectly contributing to increases of vitamin C and lycopene contents.
We suggest that the employment of P. oleracea would remediate the conditions ofstrawberry parameters by accumulating Na+ and Cl− ions, thus causing reductions in thesynthesis of stress metabolites. The use of P. oleracea is a quite practical and environmentallyfriendly approach where salinity is prevalent. P. oleracea has a high potential that could beused in high saline and in other environmental stress conditions.
Author Contributions: Conceptualization, S.K., M.D. and I.B.; methodology, S.K., I.B. and M.D.;software, S.K. and M.D.; validation, S.K., I.B. and M.D.; formal analysis, S.K. and M.D.; investigation,S.K., I.B. and M.D.; resources, S.K., I.B. and M.D.; data curation, S.K.; writing—original draftpreparation, S.K.; writing—review and editing, M.D. and I.B.; visualization, S.K., I.B. and M.D.;supervision, S.K.; project administration, S.K.; funding acquisition, S.K. All authors have read andagreed to the published version of the manuscript.
Funding: This research was funded by Harran University Scientific Research Project (HUBAP), grantnumber 17247.
Institutional Review Board Statement: Not applicable.
Informed Consent Statement: Not applicable.
Conflicts of Interest: The authors declare no conflict of interest.
References
1. Zhao, G.M.; Han, Y.; Sun, X.; Li, S.H.; Shi, Q.M.; Wang, C.H. Salinity increases secondary metabolites and enzyme activity insafflower. Ind. Crop. Prod. 2015, 64, 175–181.
2. Zhou, Y.; Tang, N.; Huang, L.; Zhao, Y.; Tang, X.; Wang, K. Effects of Salt Stress on Plant Growth, Antioxidant Capacity, GlandularTrichome Density, and Volatile Exudates of Schizonepeta tenuifolia Briq. Int. J. Mol. Sci. 2018, 19, 252. [CrossRef]
3. Hasanuzzaman, M.; Nahar, K.; Alam, M.M.; Bhowmik, P.C.; Hossain, M.A.; Rahman, M.M.; Prasad, M.N.V.; Ozturk, M.; Fujita, M.Potential use of halophytes to remediate saline soils. BioMed Res. Int. 2014, 2014, 589341. [CrossRef] [PubMed]
4. Menason, E.; Betty, T.; Vijayan, K.K.; Anbudurai, P.R. Modification of fatty acid composition in salt adopted Synechocystis 6803cells. Ann. Biol. Res. 2015, 6, 4–9.
5. Flowers, T.J.; Colmer, T.D. Salinity tolerance in halophytes. New Phytol. 2008, 179, 945–963. [CrossRef] [PubMed]6. Kader, M.A.; Lindberg, S. March Cytosolic calcium and pH signaling in plants under salinity. Plant. Signal. Behav. 2010, 5, 233–238.
[CrossRef]7. Hossain, M.D.; Inafuku, M.; Iwasaki, H.; Taira, N.; Mostofa, M.G.; Oku, H. Differential enzymatic defense mechanisms in leaves
and root of two true mangrove species under long-term salt. Aquat. Bot. 2017, 142, 32–40. [CrossRef]
59
Horticulturae 2021, 7, 63
8. Munns, R. Comparative physiology of salt and water stress. Plant Cell Environ. 2002, 25, 239–250. [CrossRef]9. Acosta-Motos, J.R.; Ortuño, M.F.; Bernal-Vicente, A.; Diaz-Vivancos, P.; Sanchez-Blanco, M.J.; Hernandez, J.A. Plant Responses to
Salt Stress: Adaptive Mechanisms. Agronomy 2017, 7, 18. [CrossRef]10. Cheeseman, J. The evolution of halophytes, glycophytes and crops, and its implications for food security under saline conditions.
New Phytol. 2014, 206. [CrossRef]11. Meng, X.; Sui, J.Z.N. Mechanisms of salt tolerance in halophytes: Current understanding and recent advances. Open Life Sci. 2018,
13, 149–154. [CrossRef]12. Aslam, R.; Bostan, N.; Amen, N.; Maria, M.; Safdar, W. A critical review on halophytes: Salt tolerant plants. J. Med. Plants Res.
2011, 5, 7108–7118.13. Flowers, T.J.; Galal, H.K.; Bromham, L. Evolution of halophytes: Multiple originsof salt tolerance in land plants. Funct. Plant. Biol.
2010, 37, 604–612. [CrossRef]14. Qadir, M.; Qureshi, R.H.; Ahmad, N. Amelioration of calcareous saline sodic soils through phytoremediation and chemical
strategies. Soil Use Manag. 2002, 18, 381–385. [CrossRef]15. Dikilitas, M.; Karakas, S. Salt as potential environmental Pollutants, their types, effects on plants, and approaches for their phytore-
mediation. In Plant Adaptation and Phytoremediation; Ashraf, M., Ozturk, M., Ahmad, M.S.A., Eds.; Springer: Berlin/Heidelberg,Germany, 2010; pp. 357–383.
16. Xing, J.C.; Dong, J.; Wang, M.V.; Liu, C.; Zhao, B.Q.; Wen, Z.G.; Zhu, X.M.; Ding, H.R.; Zhao, X.H.; Hong, L.Z. Effects of NaClstress on growth of Portulaca oleracea and underlying mechanisms. Braz. J. Bot. 2019, 42, 217–226. [CrossRef]
17. Karakas, S.; Dikilitas, M.; Tıpırdamaz, R. Phytoremediation of Salt-Affected Soils Using Halophytes. In: Grigore MN. (eds)Handbook of Halophytes. Springercham 2020, 1–18. [CrossRef]
18. De Lacerda, L.P.; Lange, L.C.; Costa França, M.G.; Diniz Leão, M.M. Growth and differential salinity reduction between Portulacaoleracea and Eichhornia crassipes in experimental hydroponic units. Env. Technol. 2018, 22, 1–9. [CrossRef]
19. Grieve, C.M.; Suarez, D.L. Purslane (Portulaca oleracea L.): A halophytic crop for drainage water reuse systems. Plant. Soil 1997,192, 277–283. [CrossRef]
20. Karakas, S.; Çullu, M.A.; Dikilitas, M. In Vitro kosullarda halofit bitkilerden Salsola soda ve Portulaca oleracea’ nın NaCl stresinekarsı çimlenme ve gelisim durumları. Harran Tarım Ve Gıda Bilimleri Derg. 2015, 19, 66–74.
21. Folta, K.M.; Davis, T.M. Strawberry genes and genomics. Crit. Rev. Plant. Sci. 2006, 25, 399–415. [CrossRef]22. Shulaev, V.; Korban, S.S.; Sosinski, B.; Abbott, A.G.; Aldwinckle, H.S.; Folta, K.M.; Iezzoni, A.; Main, D.; Arús, P.; Dandekar, A.M.;
et al. Multiple models for rosaceae genomics. Plant. Physiol. 2008, 147, 985–1003. [CrossRef] [PubMed]23. Neocleous, D.; Vasilakakis, M. Effects of NaCl stress on red raspberry (Rubus idaeus L. ‘Autumn Bliss’). Sci. Hortic. 2007, 112,
282–289. [CrossRef]24. Keutgen, A.; Pawelzik, E. Quality and nutritional value of strawberry fruit under long term salt stress. Food Chem. 2008, 107,
1413–1420. [CrossRef]25. Jamalian, S.; Gholami, M.; Esna-Ashari, M. Abscisic acid-mediated leaf phenolic compounds, plant growth and yield is strawberry
under different salt stress regimes. Theor. Exp. Plant. Physiol. 2013, 25, 291–299.26. Garriga, M.; Muñoz, C.A.; Caligari, P.D.; Retamales, J.B. Effect of salt stress on genotypes of commercial (Fragaria x ananassa) and
Chilean strawberry (F. chiloensis). Sci. Hortic. 2015, 195, 37–47. [CrossRef]27. Bohlin, C.; Holmberg, P. Peat dominating growing medium in Swedish horticulture. Acta Hortic. 2004, 644, 177–181. [CrossRef]28. Bin Mohamad, H.; Zainorabidin, A.; Razali, S.; Zolkefle, S. Assessment for applicability of microwave oven in rapid determination
of moisture content in peat soil. J. Eng. Sci. Technol. 2020, 15, 2110–2118.29. Catania, P.; Comparetti, A.; De Pasquale, C.; Morello, G.; Vallone, M. Effects of the Extraction Technology on Pomegranate Juice
Quality. Agronomy 2020, 10, 1483. [CrossRef]30. Barrett, D.M.; Anthon, G. Lycopene content of calıfornıa-grown tomato varıetıes. Acta Hortic. 2001, 542, 165–174. [CrossRef]31. Karakas, S. Development of Tomato Growing in Soil Differing in Salt Levels and Effects of Companion Plants on Same Physiolog-
ical Parameters and Soil Remediation. Ph.D. Thesis, University of Harran, Sanlıurfa, Turkey, 2013.32. Oz, A.T. Effects of two differrent temperatures on l-ascorbic acid content (Vıtamın C), lenght of storage time and fruit quality.
Bahce 2002, 31, 51–57.33. Lutts, S.; Kinet, J.M.; Bouharmont, J. NaCl-induced senescence in leaves of rice (Oryza sativa L.) cultivars differing in salinity
resistance. Ann. Bot. 1996, 78, 389–398. [CrossRef]34. Karlidag, H.; Yildirim, E.; Turan, M. Role of 24-epibrassinolide in mitigating the adverse effects of salt stress on stomatal
conductance, membrane permeability, and leaf water content, ionic composition in salt stressed strawberry (Fragaria × ananassa).Sci. Hortic. 2011, 130, 133–140. [CrossRef]
35. Arnon, D.L. A copper enzyme is isolated chloroplast polyphenol oxidase in Beta vulgaris. Plant. Physiol. 1949, 24, 1–15. [CrossRef][PubMed]
36. Bates, L.S.; Waldren, R.P.; Teare, I.D. Rapid determination of free proline for water-stress studies. Plant. Soil 1973, 39, 205–207.[CrossRef]
37. Velikova, V.; Yordanov, I.; Edreva, A. Oxidative stress and some antioxidant systems in acid raintreated bean plants: Protectiverole of exogenous polyamines. Plant. Sci. 2000, 151, 59–66. [CrossRef]
60
Horticulturae 2021, 7, 63
38. Karakas, S.; Dikilitas, M.; Tıpırdamaz, R. Biochemical and molecular tolerance of Carpobrotus acinaciformis L. halophyte plantsexposed to high level of NaCl stress. Harran J. Agric. Food Sci. 2019, 23, 99–107.
39. Sairam, R.K.; Sexena, D. Oxidative stress and antioxidants in wheat genotypes: Possible mechanism of water stress tolerance. J.Agron. Crop. Sci. 2000, 184, 55–61. [CrossRef]
40. Milosevic, N.; Slusarenko, A.J. Active Oxygen Metabolism and Lignifications in The Hypersensitive Response in Bean. Physiol.Mol. Plant. Pathol. 1996, 49, 143–158. [CrossRef]
41. Cvikrova, M.; Hrubcova, M.; Vagner, M.; Machackova, I.; Eder, J. Phenolic acids and peroxidase activity in Alfalfa (Medicagosativa) embryogenic cultures after ethephon treatment. Plant. Physiol. 1994, 91, 226–233. [CrossRef]
42. Chapman, H.D.; Pratt, P.F. Methods of Analysis for Soils, Plants, and Waters; University of California, Division of AgriculturalSciences: Riverside, CA, USA, 1961.
43. Saidimoradi, D.; Ghaderi, N.; Javadi, T. Salinity stress mitigation by humic acid application in strawberry (Fragaria x ananassaDuch.). Sci. Hortic. 2019, 256, 594. [CrossRef]
44. Yaghubi, K.; Ghaderi, N.; Vafaee, Y.; Javadi, T. Potassium silicate alleviates deleterious effects of salinity on two strawberrycultivars grown under soilless pot culture. Sci. Hortic. 2016, 213, 87–95. [CrossRef]
45. Munns, R.; Tester, M. Mechanisms of salinity tolerance. Annu. Rev. Plant. Biol. 2008, 59, 651–681. [CrossRef] [PubMed]46. Nugraha, M.I.; Annisa, W.; Syaufina, L.; Anwar, S. Capillary water rise ın peat soil as affected by various groundwater levels.
Indones. J. Agric. Sci. 2016, 17, 75–83. [CrossRef]47. Farina, E.; Allera, C.; Paterniani, T.; Palagi, M. Mulching as a technique to reduce salt accumulation in soilless culture. Acta Hortic.
2003, 609, 459–466. [CrossRef]48. Mozafari, A.A.; Dedejani, S.; Ghaderi, N. Positive responses of strawberry (Fragaria×ananassa Duch.) explants to salicylic an iron
nanoparticle application undersalinity conditions. Plant. Celltissue Organ. Cult. 2018, 134, 267–275. [CrossRef]49. Saied, A.S.; Keutgen, A.J.; Noga, G. The influence of NaCl salinity on growth, yield and fruit quality of strawberry cvs.
‘Elsanta’and ‘Korona’. Sci. Hortic. 2005, 103, 289–303. [CrossRef]50. Joseph, B.; Jini, D.; Sujatha, S. Insight into the role of exogenous salicylic acid on plants grown under salt environment. Asian J.
Crop. Sci. 2010, 2, 226–235. [CrossRef]51. Karakas, S.; Cullu, M.A.; Kaya, C.; Dikilitas, M. Halophytic companion plants improve growth and physiological parameters of
tomato plants grown under salinity. Pak. J. Bot. 2016, 48, 21–28.52. Grafienberg, A.; Botrini, L.; Giustiniani, L.; Filippi, F.; Curadi, M. Tomato growing in saline conditions with biodesalinating
plants: Salsola soda and Portulaca oleracea. Acta Hortic. 2003, 609, 301–305. [CrossRef]53. Jamalian, S.; Tehranifar, A.; Tafazoli, E.; Eshghi, S.; Davarynejad, G.H. Paclobutrazol application ameliorates the negative effect of
salt stress on reproductive growth, yield, and fruit quality of strawberry plants. Hortic. Environ. Biotechnol. 2008, 49, 1–6.54. Singh, R.; Flowers, T. Physiology and molecular biology of the effects of salinity on rice. Handb. Plant. Crop. Stress 2010, 901–942.55. Ashraf, M. Biotechnological approach of improving plant salt tolerance using antioxidants as markers. Biotechnol. Adv. 2009, 27,
84. [CrossRef] [PubMed]
61

horticulturae
Communication
Effects of Short-Term Exposure to Low Temperatures on Proline,Pigments, and Phytochemicals Level in Kale (Brassica oleraceavar. acephala)
Valentina Ljubej 1, Erna Karalija 2, Branka Salopek-Sondi 1 and Dunja Šamec 1,3,*
Citation: Ljubej, V.; Karalija, E.;
Salopek-Sondi, B.; Šamec, D. Effects
of Short-Term Exposure to Low
Temperatures on Proline, Pigments,
and Phytochemicals Level in Kale
(Brassica oleracea var. acephala).
Horticulturae 2021, 7, 341. https://
doi.org/10.3390/horticulturae7100341
Academic Editors:
Agnieszka Hanaka,
Jolanta Jaroszuk-Sciseł,
Małgorzata Majewska and
Alessandra Francini
Received: 6 September 2021
Accepted: 22 September 2021
Published: 24 September 2021
Publisher’s Note: MDPI stays neutral
with regard to jurisdictional claims in
published maps and institutional affil-
iations.
Copyright: © 2021 by the authors.
Licensee MDPI, Basel, Switzerland.
This article is an open access article
distributed under the terms and
conditions of the Creative Commons
Attribution (CC BY) license (https://
creativecommons.org/licenses/by/
4.0/).
1 Department of Molecular Biology, Ruder Boškovic Institute, Bijenicka Cesta 54, 10000 Zagreb, Croatia;[email protected] (V.L.); [email protected] (B.S.-S.)
2 Department for Biology, Faculty of Science, University of Sarajevo, Zmaja od Bosne 33-35,71000 Sarajevo, Bosnia and Herzegovina; [email protected]
3 Department of Food Technology, University North, Trg dr. Žarka Dolinara 1, 48000 Koprivnica, Croatia* Correspondence: [email protected]
Abstract: Kale (Brassica oleracea var. acephala) is known as a vegetable with good tolerance of en-vironmental stress and numerous beneficial properties for human health, which are attributed todifferent phytochemicals. In the present study, investigation of how low temperatures affect proline,pigments and specialized metabolites content was performed using 8-weeks old kale plants subjectedto chilling (at 8 ◦C, for 24 h) followed by short freezing (at −8 ◦C, for 1 h after previous acclimationat 8 ◦C, for 23 h). Plants growing at 21 ◦C served as a control. In both groups of plants (exposed tolow temperatures and exposed to short freezing) a significant increase in proline content (14% and49%, respectively) was recorded. Low temperatures (8 ◦C) induced an increase of pigments (totalchlorophylls 7%) and phytochemicals (phenolic acids 3%; flavonoids 5%; carotenoids 15%; glucosino-lates 21%) content, while exposure to freezing showed a different trend dependent upon observedparameter. After freezing, the content of chlorophylls, carotenoids, and total phenolic acids retainedsimilar levels as in control plants and amounted to 14.65 ± 0.36 mg dw g−1, 2.58 ± 0.05 mg dw g−1
and 13.75 ± 0.07 mg dw CEA g−1, respectively. At the freezing temperature, total polyphenol contentincreased 13% and total flavonoids and glucosinolates content decreased 21% and 54%, respectively.Our results suggest that acclimatization (23 h at 8 ◦C) of kale plants can be beneficial for the accumu-lation of pigments and phytochemicals, while freezing temperatures affect differently specializedmetabolite synthesis. The study suggests that growing temperature during kale cultivation must beconsidered as an important parameter for producers that are orientated towards production of cropswith an increasing content of health-related compounds.
Keywords: Brassica oleracea var. acephala; short-term cold stress; phytochemicals; pigments
1. Introduction
Climate changes that generally cause global warming can cause sudden, low tempera-ture episodes. These types of events can significantly reduce crop production and quality.According to the review article by Ritonga and Chen [1], low temperature is one of themost harmful environmental stresses that higher plants face, along with drought stress.Low temperature stress significantly limits the geographical distribution of plants, but withclimate changes and climate disturbances, crops can experience periods of extremely lowtemperatures uncommon for the region [2]. Crops that experience low-temperature stresssuffer impaired growth, which affects and delays essential processes in their developmentsuch as flowering, development and fruiting. That may cause loss in crop yields andquality, and in extreme cases, the plant freezes, wilts and dies [2]. Plants differ in theirtolerance to chilling (0–15 ◦C) and freezing (<0 ◦C) temperatures, and resistance is species-or cultivar-dependent. Chilling tolerant plants often grow in temperate climatic regions,
Horticulturae 2021, 7, 341. https://doi.org/10.3390/horticulturae7100341 https://www.mdpi.com/journal/horticulturae
63
Horticulturae 2021, 7, 341
and they can increase their freezing tolerance by being exposed to chilling, non-freezingtemperatures, a process known as cold acclimation [3]. Plant tolerance to low temperaturemay involve mechanisms related to carbohydrates, specialized metabolites and energymetabolism, transcription, signal transduction, protein transport and degradation [3–5].
The family Brassicaceae, often called Cruciferae or mustard family, represents a mono-phyletic group distributed worldwide, except for Antarctica, comprising of approximately341 genera and 3977 species. The number of genera and species changes frequently inparallel with development of new methods that dissect the genetic diversity of the familyin a greater detail [6]. One of the important members is the genus Brassica, which includessignificant crop plants such as rapeseed and some commonly used vegetables with a longhistory of agricultural use around the world [7]. One of the key species is Brassica oler-acea that includes vegetables with significant morphological diversity of plant organs andgood adaptation to adverse environmental conditions [8]. According to the morphologyand other characteristics B. oleracea includes several cultivar groups (Acephala, Botrytis,Capitata group, etc.). Among these groups, plants from Acephala group include leafy, non-heading cabbage varieties with common names of kale and collards. Kale (B.oleracea var.acephala) is known for its good tolerance of environmental stress such as salt, drought andfrost hardiness and resistance [8–14]. Kale is easy and cheap for cultivation and productionsignificantly increased from 3994 to 6256 harvested acres in US, in the time from 2007 to2012, respectively [15]. In recent years, kale has been marked as a superfood [8] due to itsbeneficial effects on human health, which are related to the presence of specialized metabo-lites from the group of polyphenols, carotenoids and glucosinolates, but also importantminerals, vitamins and dietary fibres [8,11,13,14]. Kale and collards have higher content ofCa, folate, riboflavin, vitamin C, K and A content than other cruciferous vegetables whiletheir phytochemical content is comparable with other Brassica vegetables [8]. Kale pos-sesses biological activities such as antioxidant and anticarcinogens activity, and protectiveproperties in cases of cardiovascular and gastrointestinal system diseases (reviewed byŠamec et al. [8]). Kale tolerates both high summer temperatures and low winter temper-atures, even freezing temperatures for a short period of time. Improved understandingof mechanisms related to kale low temperature tolerance can introduce improved coldresistance varieties, better equipped to deal with unusually low temperatures that mightarise during the growth season. Low temperatures during kale cultivation have beenreported to affect polyphenolic compounds [16,17], soluble sugars and glucosinolates [18],but most of these studies were conducted in the field where it is difficult to control otherenvironmental parameters.
Tolerance of low temperatures in kale is associated with the content of specializedmetabolites that can serve not only as a protective mechanism against environmentalstressors for the plant, but also as a source of benefit compounds for human health. Wehypothesize that phytochemicals and pigments may play a significant role in kale stressadaptation capability and that short term low temperature exposure affects specializedmetabolite content. In the present study, we investigated cold induced changes in special-ized metabolite content: polyphenols, glucosinolates and carotenoids, under short termchilling temperatures (8 ◦C and −8 ◦C) compared with the control (21 ◦C). In addition,we determined the effect of short cold stress on basic growth physiological parameters(chlorophyll a, chlorophyll b, total chlorophylls) and stress markers (proline content).
2. Materials and Methods
2.1. Plant Growing and Stress Experiments
Seeds were purchased from the family farm “Srdan Franic”, Vrgorac, Croatia. Seedswere sterilized and germinated as we have previously reported [13]. Approximately20 seeds per plate were transferred to Petri dishes containing 1% agar (w/v). Plates werefirst stored in dark at 4 ◦C for 48 h, then transferred to the growth chamber and maintainedat 21 ◦C for three days with a 16/8 h photoperiod. Seedlings were then placed in pots(diameter 55–73 mm; height 105 mm) containing Stender A240 substrate (Stender GmbH,
64
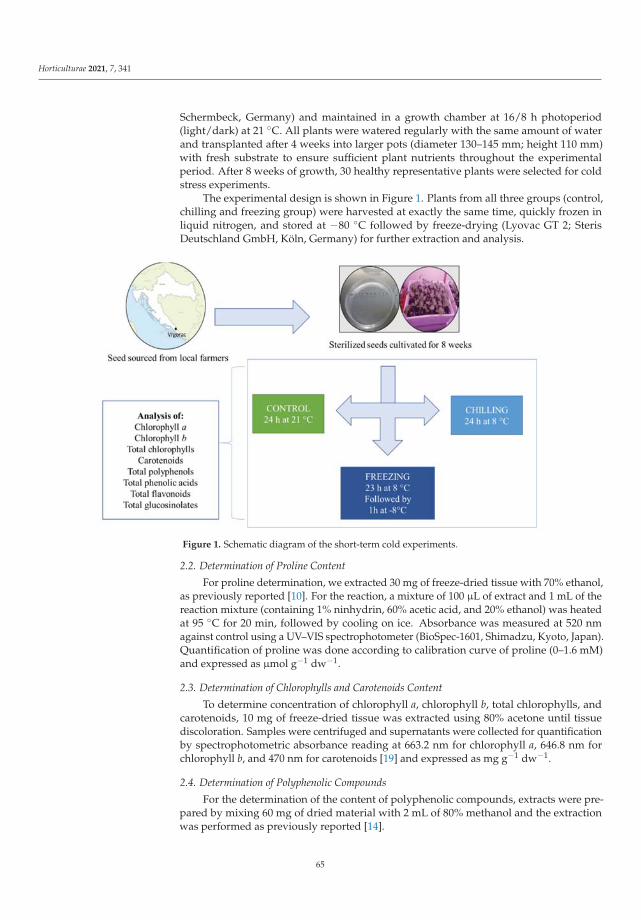
Horticulturae 2021, 7, 341
Schermbeck, Germany) and maintained in a growth chamber at 16/8 h photoperiod(light/dark) at 21 ◦C. All plants were watered regularly with the same amount of waterand transplanted after 4 weeks into larger pots (diameter 130–145 mm; height 110 mm)with fresh substrate to ensure sufficient plant nutrients throughout the experimentalperiod. After 8 weeks of growth, 30 healthy representative plants were selected for coldstress experiments.
The experimental design is shown in Figure 1. Plants from all three groups (control,chilling and freezing group) were harvested at exactly the same time, quickly frozen inliquid nitrogen, and stored at −80 ◦C followed by freeze-drying (Lyovac GT 2; SterisDeutschland GmbH, Köln, Germany) for further extraction and analysis.
Figure 1. Schematic diagram of the short-term cold experiments.
2.2. Determination of Proline Content
For proline determination, we extracted 30 mg of freeze-dried tissue with 70% ethanol,as previously reported [10]. For the reaction, a mixture of 100 μL of extract and 1 mL of thereaction mixture (containing 1% ninhydrin, 60% acetic acid, and 20% ethanol) was heatedat 95 ◦C for 20 min, followed by cooling on ice. Absorbance was measured at 520 nmagainst control using a UV–VIS spectrophotometer (BioSpec-1601, Shimadzu, Kyoto, Japan).Quantification of proline was done according to calibration curve of proline (0–1.6 mM)and expressed as μmol g−1 dw−1.
2.3. Determination of Chlorophylls and Carotenoids Content
To determine concentration of chlorophyll a, chlorophyll b, total chlorophylls, andcarotenoids, 10 mg of freeze-dried tissue was extracted using 80% acetone until tissuediscoloration. Samples were centrifuged and supernatants were collected for quantificationby spectrophotometric absorbance reading at 663.2 nm for chlorophyll a, 646.8 nm forchlorophyll b, and 470 nm for carotenoids [19] and expressed as mg g−1 dw−1.
2.4. Determination of Polyphenolic Compounds
For the determination of the content of polyphenolic compounds, extracts were pre-pared by mixing 60 mg of dried material with 2 mL of 80% methanol and the extractionwas performed as previously reported [14].
65

Horticulturae 2021, 7, 341
For the determination of total polyphenols, total phenolic acids and total flavonoids,we used well-established methods suitable for small-scale volumes and for Brassicaceaplants [20]. For the determination of total phenols content, Folin–Ciocâlteu method wasused and the calibration curve was constructed using gallic acid as the standard. Resultsare expressed as milligrams of gallic acid equivalents per gram of dry weight (mg GAEg−1dw−1). For the determination of phenolic acids, a mixture of sodium nitrite and sodiummolybdate was used and caffeic acid was used to construct the calibration curve. Resultsare expressed as caffeic acid equivalents per gram of dry weight (mg CAE g−1dw−1).Flavonoids were determined using Al2O3 method, catechin was used as the standard toconstruct the calibration curve, and results are expresses as catechin equivalents per gramof dry weight (mg CE g−1 dw−1).
2.5. Determination of Total Glucosinolates
For the determination of total glucosinolates, an established method based on thereaction with sodium tetrachloropalladate II (Na2PdCl4) [21] was adapted as previouslyreported [14]. Sinigrin standard was used to construct the calibration curve and the resultsare expressed as sinigrin equivalents per gram of dry weight (mg g−1 dw−1).
2.6. Statistical Analysis
All analyses were performed in at least three replicates and results are expressed asmean ± standard deviation (SD). All statistical analyses were performed using the free soft-ware PAST [22]. One-way ANOVA and post hoc multiple mean comparison (Tukey’s HSDtest) were performed and differences between measurements were considered significantat p < 0.05.
3. Results
3.1. Effect of Cold Stress on Proline Content in Kale
Increase in proline content was noticed after exposure to cold stress was stronglyrelated to the drop of the temperature (Figure 2). After 24 h at chilling temperatures (8 ◦C),proline content was 14% higher than in the control plants, with additional increase to 49%in kale exposed to −8 ◦C for 1 h after 23 h of acclimation. The rise of proline, as one of coldstress markers, is a clear indication that kale plants perceive the administered temperaturesas cold stress.
Figure 2. The proline content in kale plants exposed to cold stress. Value marked with differentletters are significantly different at p < 0.05.
66

Horticulturae 2021, 7, 341
3.2. Effect of Cold Stress on Content of Chlorophylls and Carotenoids in Kale
Concentration of chlorophylls in chilled plants showed a significant increase in contentof chlorophyll a, b and total chlorophylls (Figure 3), indicating that cold stressed plantsincreased the rate of synthesis of chlorophylls. In case of previous acclimatization ofplants to chilling temperatures followed by exposure for freezing temperatures, the plant’sphotosynthetic apparatus was less affected and the content of photosynthetic pigmentsremained similar to the levels recorded for stress free control plants.
Figure 3. The content of chlorophyl a (a), chlorophyl b (b) and total chlorophylls (c) in kale exposed to low temperatures.Value marked with different letters are significantly different at p < 0.05.
The content of carotenoids in kale under low temperatures is shown in Figure 4. Inthe control, the content of carotenoids was 2.71 ± 0.06 mg g−1 and their amount followedthe same trend as that of chlorophylls—under 8 ◦C increase, but their content in plantssubjected to freezing temperature was comparable with those in the control plants.
Figure 4. The content of carotenoids in kale exposed to low temperatures. Value marked withdifferent letters are significantly different at p < 0.05.
67
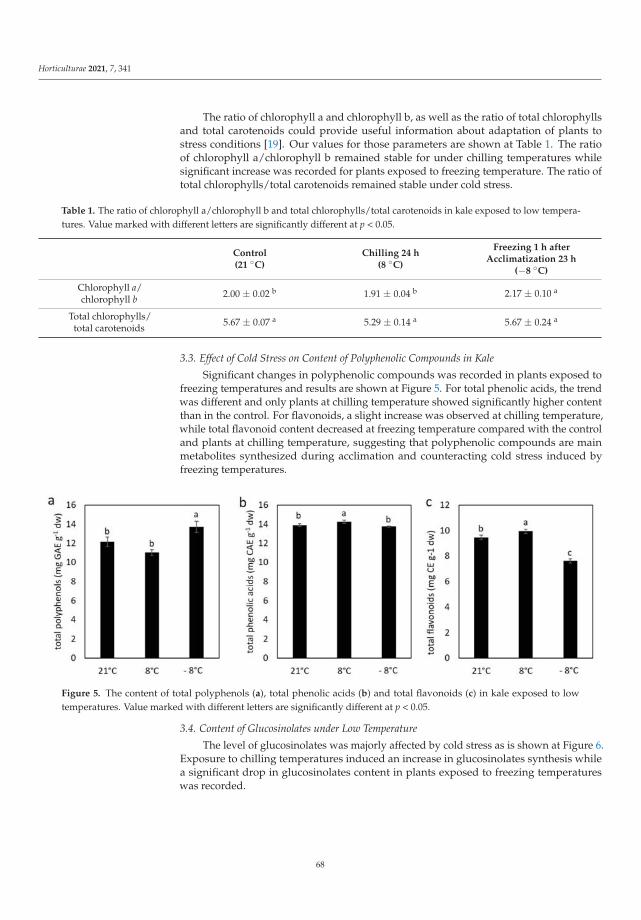
Horticulturae 2021, 7, 341
The ratio of chlorophyll a and chlorophyll b, as well as the ratio of total chlorophyllsand total carotenoids could provide useful information about adaptation of plants tostress conditions [19]. Our values for those parameters are shown at Table 1. The ratioof chlorophyll a/chlorophyll b remained stable for under chilling temperatures whilesignificant increase was recorded for plants exposed to freezing temperature. The ratio oftotal chlorophylls/total carotenoids remained stable under cold stress.
Table 1. The ratio of chlorophyll a/chlorophyll b and total chlorophylls/total carotenoids in kale exposed to low tempera-tures. Value marked with different letters are significantly different at p < 0.05.
Control(21 ◦C)
Chilling 24 h(8 ◦C)
Freezing 1 h afterAcclimatization 23 h
(−8 ◦C)
Chlorophyll a/chlorophyll b 2.00 ± 0.02 b 1.91 ± 0.04 b 2.17 ± 0.10 a
Total chlorophylls/total carotenoids 5.67 ± 0.07 a 5.29 ± 0.14 a 5.67 ± 0.24 a
3.3. Effect of Cold Stress on Content of Polyphenolic Compounds in Kale
Significant changes in polyphenolic compounds was recorded in plants exposed tofreezing temperatures and results are shown at Figure 5. For total phenolic acids, the trendwas different and only plants at chilling temperature showed significantly higher contentthan in the control. For flavonoids, a slight increase was observed at chilling temperature,while total flavonoid content decreased at freezing temperature compared with the controland plants at chilling temperature, suggesting that polyphenolic compounds are mainmetabolites synthesized during acclimation and counteracting cold stress induced byfreezing temperatures.
Figure 5. The content of total polyphenols (a), total phenolic acids (b) and total flavonoids (c) in kale exposed to lowtemperatures. Value marked with different letters are significantly different at p < 0.05.
3.4. Content of Glucosinolates under Low Temperature
The level of glucosinolates was majorly affected by cold stress as is shown at Figure 6.Exposure to chilling temperatures induced an increase in glucosinolates synthesis whilea significant drop in glucosinolates content in plants exposed to freezing temperatureswas recorded.
68

Horticulturae 2021, 7, 341
Figure 6. The content of total glucosinolates in kale exposed to low temperatures. Value markedwith different letters are significantly different at p < 0.05.
4. Discussion
Proline is an amino acid that plays an important role in plant metabolism and develop-ment. Its accumulation is associated with plant stress response where it acts as an osmolyte,metal chelator, antioxidant defence molecule and signalling molecule (reviewed by Hayatet al. [23]. In the presented study, proline also acted as a protective molecule against coldstress with recorded increase in content correlating to the temperature drop (Figure 2).Similar results were reported for frost-resistant mutants of cauliflower (Brassica oleraceavar. botrytis) by Hady et al. [24] and Fuller et al. [25] Proline accumulation is reported to beassociated with cold stress tolerance in many other crops such as beans [26], sorghum [27],and rice as well [28]. Stressful environment cause changes in a variety of physiological,biochemical, and molecular processes in plants, which is evident from the proline levelsmentioned above, but it can also affect photosynthesis, the most fundamental and compli-cated physiological process in all green plants [29]. Photosynthesis is an essential processfor plants, and it is very sensitive to changes in environmental conditions [30]. Chlorophyllsplay important role in photosynthesis in harvesting and converting light energy in theantenna systems and charge separation and electron transport in the reaction centres [31].Therefore, chlorophyll content is an important parameter to evaluate photosynthetic ca-pacity. The level of chlorophyll a, b, and total chlorophylls and carotenoids was decreasedafter exposure to chilling temperature, while staying stable under freezing temperaturein similar concentration as in control plants. Freezing temperatures normally cause adecrease in the ratio of total chlorophyll to carotenoids [12], but the acclimatization periodin chilling period was much longer, so decrease in chlorophylls can also be a response tolong exposure to chilling rather than freezing itself.
The ratio of total chlorophylls and carotenoids is an indicator of the plant green-ness [19] and in our experiment chilling temperatures did not change significantly the ratio.The ratio of chlorophyll a/chlorophyll b may be an indicator of the functional pigmentendowment and light adaptation of the photosynthetic apparatus [19]. Under stress condi-tions in plants, both chlorophyll a and chlorophyll b tend to decrease while, the chlorophylla/b ratio tends to increase due to greater reduction in chlorophyll b compared to chlorophylla [29]. Accordingly, our results indicate notable stress under freezing temperatures.
Kale is also considered a good source of carotenoids [32]. Carotenoids are essential pig-ments in photosynthetic organs along with chlorophylls where they act as photoprotectors,antioxidants, colour attractants, and precursors of plant hormones in non-photosyntheticorgans of plants [33]. In addition, they play important roles in humans such as pre-cursors of vitamin A, photoprotectants, antioxidants, enhancers of immunity, and oth-
69

Horticulturae 2021, 7, 341
ers [33]. Under our experimental conditions, in control plants, total carotenoid contentwas 2.71 ± 0.06 μg g−1, increased to 3.10 ± 0.13 μg g−1 under 8 ◦C and decreased to2.58 ± 0.05 μg g−1 under −8 ◦C. Similarly, Hwang et al. [34] reported a gradual increase intotal carotenoid content of kale during cold acclimatizationon for 3 days. They noted anincrease in zeaxanthin content under cold stress. Mageney et al. [32] also reported highzeaxanthin contents in kale under traditional harvest conditions consistent with low tem-peratures. Consistent with reported papers, our results show that cold acclimatization maybe beneficial for carotenoid content accumulation. According to our previously publishedwork comparing the carotenoid content in kale with that of white cabbage and Chinesecabbage, kale tends to accumulate a higher amount of carotenoids, which may be relatedto its better tolerance to low temperatures [10,11].
Polyphenol compounds are considered an important player in the response of plantsto abiotic stress, including low temperature stress [35]. The content of total polyphenols,phenolic acids and flavonoids in our experiments is shown in Figure 6. Polyphenolcontent differed between chilling and freezing where decrease and significant increase wasrecorded, respectively. Jurkow et al. [36] also reported increased levels of polyphenols inkale after moderate (−5 ◦C) and severe (−15 ◦C) frost compared to the pre-freezing (>0 ◦C)period. Similarly, Lee and Oh [16] reported increased levels of polyphenolic compounds in3 weeks old kale exposed to 4 ◦C for 3 days. They also reported an increase in the content ofphenolic acids, caffeic acid and ferulic acid, and flavonoid kaempferol after low temperaturetreatment at 4 ◦C. The same authors in another study [17] observed no differences in totalflavonoid content in kale grown at 10 ◦C compared to the control. Our results for totalflavonoids content are consistent with these findings; we found no significant changesin total flavonoids and phenolic acids at 8 ◦C, but a decrease in flavonoids at freezing(−8 ◦C) temperature was observed. The duration of exposure to low temperature andprior acclimatization may have an influence on the level of phenolic compounds underlow temperature stress [18], and probably this is the reason for different trends publishedin different papers. In addition, individual phenolic compounds, or their conformation(e.g., conjugates, etc.) may change at low temperatures, which cannot always be observedby measuring total phenolic compounds content [37]. Low temperatures induce changesin cellular ultrastructure and localization of phenolic compounds, as has been reported forrapeseed (B. napus var. oleifera) leaves [38] and this may also affect polyphenolic compoundsextraction and their detection.
Glucosinolates are well-known specialized metabolites characteristic for Brassicaceaplants. Their contents in plants exposed to low temperatures compared to the control in ourexperiments are shown in Figure 6, where we observed an interesting trend. Under chillingtemperature their content increased, while under additional freezing temperature theircontent decreased significantly. This trend is different from the one we reported previously,where the content of glucosinolates increases under chilling and freezing temperatures [12].This different trend may be due to different experimental conditions and age of plants asreported in our previous work [12], where we exposed plants to freezing temperature for1 h after 1 week of acclimation. Differences in glucosinolates trend reported in differentpapers are probably due to different experimental conditions, e.g., temperatures, durationof acclimation, etc., which may influence accumulation of different phytochemicals or berelated to the kale variety.
5. Conclusions
In a present study, 8 weeks old kale plants were exposed to short-term low tem-perature stress (chilling and freezing) to study changes in proline, phytochemicals andpigments content under low temperature. Increases in proline content indicate that stressprotective mechanisms were activated in plants at low temperatures and confirmed prolineas a reliable stress marker for low temperature stress. Compared to the control, plantsexposed to 8 ◦C (chilling temperatures) for 24 h accumulated significantly higher content ofchlorophyll a, b, total chlorophylls, and carotenoid as well as content of total polyphenols,
70
Horticulturae 2021, 7, 341
flavonoids and glucosinolates. This may indicate that short term (24 h) chilling temperatureis beneficial for the accumulation of phytochemicals in kale. However, our results alsosuggest that freezing temperatures (−8 ◦C) may cause significant stress and decrease inpigments and phytochemical levels. Changes in measured phytochemicals indicate thatthey play significant role in chilling and freezing tolerance in used kale variant, but futuremore advanced metabolomics and transcriptomic studies will explain the mechanisms inmore detail.
Author Contributions: Conceptualization, D.Š.; methodology, D.Š.; formal analysis, D.Š.; V.L.;investigation, V.L., D.Š., B.S.-S.; writing—original draft preparation, D.Š.; writing—review andediting, D.Š.; B.S.-S., B.S.-S., E.K.; visualization, D.Š.; supervision, D.Š.; project administration, D.Š.;B.S.-S.; funding acquisition, D.Š.; B.S.-S. All authors have read and agreed to the published version ofthe manuscript.
Funding: This research was funded by Unity through Knowledge Fund, grant number 12/17, and bythe Operational Programme Competitiveness and Cohesion 2014–2020 and the Croatian Europeanregional fund under a specific scheme to strengthen applied research in proposing actions for climatechange adaptation (Project No. KK.05.1.1.02.0005).
Institutional Review Board Statement: Not Applicable.
Informed Consent Statement: Not Applicable.
Data Availability Statement: Additional data are available upon request.
Acknowledgments: We thank Srdan Franic for providing the seeds used in the experiment.
Conflicts of Interest: The authors declare no conflict of interest.
References
1. Ritonga, F.N.; Chen, S. Physiological and Molecular Mechanism Involved in Cold Stress Tolerance in Plants. Plants 2020, 9, 560.[CrossRef]
2. Hussain, H.A.; Hussain, S.; Khaliq, A.; Ashraf, U.; Anjum, S.A.; Men, S.; Wang, L. Chilling and Drought Stresses in Crop Plants:Implications, Cross Talk, and Potential Management Opportunities. Front. Plant Sci. 2018, 9, 393. [CrossRef]
3. Sanghera, G.S.; Wani, S.H.; Hussain, W.; Singh, N.B. Engineering Cold Stress Tolerance in Crop Plants. Curr. Genom. 2011, 12,30–43. [CrossRef]
4. Carvajal, F.; Rosales, R.; Palma, F.; Manzano, S.; Cañizares, J.; Jamilena, M.; Garrido, D. Transcriptomic changes in Cucurbita pepofruit after cold storage: Differential response between two cultivars contrasting in chilling sensitivity. BMC Genom. 2018, 19, 125.[CrossRef] [PubMed]
5. Yang, L.; Wen, K.-S.; Ruan, X.; Zhao, Y.-X.; Wei, F.; Wang, Q. Response of Plant Secondary Metabolites to Environmental Factors.Molecules 2018, 23, 762. [CrossRef] [PubMed]
6. Franzke, A.; Lysak, M.A.; Al-Shehbaz, I.A.; Koch, M.A.; Mummenhoff, K. Cabbage family affairs: The evolutionary history ofBrassicaceae. Trend. Plant Sci. 2011, 16, 108–116. [CrossRef]
7. Šamec, D.; Salopek-Sondi, B. Cruciferous (Brassicaceae) vegetables. In Nonvitamin and Nonmineral Nutritional Supplements; Nabavi,S.M., Sanches Silva, T., Eds.; Academic Press: Cambridge, MA, USA, 2019; pp. 195–202.
8. Šamec, D.; Urlic, B.; Salopek-Sondi, B. Kale (Brassica oleracea var. acephala) as a superfood: Review of the scientific evidence behindthe statement. Crit. Rev. Food Sci. Nutr. 2019, 59, 2411–2422. [CrossRef] [PubMed]
9. Pavlovic, I.; Petrík, I.; Tarkowska, D.; Lepeduš, H.; Vujcic Bok, V.; Radic Brkanac, S.; Novák, O.; Salopek Sondi, B. Correlationsbetween Phytohormones and Drought Tolerance in Selected Brassica Crops: Chinese Cabbage, White Cabbage and Kale. Int. J.Mol. Sci. 2018, 19, 2866. [CrossRef]
10. Linic, I.; Šamec, D.; Grúz, J.; Vujcic Bok, V.; Strnad, M.; Salopek Sondi, B. Involvement of Phenolic Acids in Short-Term Adaptationto Salinity Stress is Species-Specific among Brassicaceae. Plants 2019, 8, 155. [CrossRef]
11. Šamec, D.; Linic, I.; Salopek-Sondi, B. Salinity Stress as an Elicitor for Phytochemicals and Minerals Accumulation in SelectedLeafy Vegetables of Brassicaceae. Agronomy 2021, 11, 361. [CrossRef]
12. Ljubej, V.; Radojcic Redovnikovic, I.; Salopek-Sondi, B.; Smolko, A.; Roje, S.; Šamec, D. Chilling and Freezing Temperature StressDifferently Influence Glucosinolates Content in Brassica oleracea var. acephala. Plants 2021, 10, 1305. [CrossRef]
13. Šamec, D.; Pavlovic, I.; Radojcic Redovnikovic, I.; Salopek-Sondi, B. Comparative analysis of phytochemicals and activity ofendogenous enzymes associated with their stability, bioavailability and food quality in five Brassicaceae sprouts. Food Chem. 2018,269, 96–102. [CrossRef]
14. Šamec, D.; Kruk, V.; Ivaniševic, P. Influence of Seed Origin on Morphological Characteristics and Phytochemicals Levels inBrassica oleracea var. acephala. Agronomy 2019, 9, 502. [CrossRef]
71
Horticulturae 2021, 7, 341
15. USDA, National Agricultural Statistics Service. 2012; Census of Agriculture. Available online: https://www.agcensus.usda.gov/Publications/2012/Full_Report/Volume_1,_Chapter_1_US/st99_1_038_038.pdf (accessed on 18 September 2021).
16. Lee, J.-H.; Oh, M.-M. Short-term Low Temperature Increases Phenolic Antioxidant Levels in Kale. Hortic. Environ. Biotechnol.2015, 56, 588–596. [CrossRef]
17. Lee, J.-H.; Kwon, M.C.; Jung, E.S.; Lee, C.H.; Oh, M.-M. Physiological and Metabolomic Responses of Kale to Combined Chillingand UV-A Treatment. Int. J. Mol. Sci. 2019, 20, 4950. [CrossRef] [PubMed]
18. Steindal, A.L.H.; Rødven, R.; Hansen, E.; Mølmann, J. Effects of photoperiod, growth temperature and cold acclimatisation onglucosinolates, sugars and fatty acids in kale. Food Chem. 2015, 174, 44–51. [CrossRef] [PubMed]
19. Lichtenthaler, H.K.; Buschmann, C. Chlorophylls and carotenoids: Measurement and characterization by UV–VIS spectroscopy.In Current Protocols in Food Analytical Chemistry; John Wiley & Sons, Inc.: Hoboken, NJ, USA, 2001; pp. F4.3.1–F4.3.8.
20. Šamec, D.; Bogovic, M.; Vincek, D.; Martincic, J.; Salopek-Sondi, B. Assessing the authenticity of the white cabbage (Brassicaoleracea var. capitata f. alba) cv. ‘Varaždinski’ by molecular and phytochemical markers. Food Res. Int. 2014, 60, 266–272. [CrossRef]
21. Aghajanzadeh, T.; Hawkesford, M.J.; Kok, L.J. The significance of glucosinolates for sulfur storage in Brassicaceae seedlings.Front. Plant Sci. 2014, 5, 704. [CrossRef] [PubMed]
22. Hammer, O.; Harper, A.A.T.; David, A.T.; Ryan, P.D. PAST: Paleontological Statistics Software Package for Education and DataAnalysis. Palaeontol. Electron 2001, 4, 1–9.
23. Hayat, S.; Hayat, Q.; Alyemeni, M.N.; Wani, A.S.; Pichtel, J.; Ahmad, A. Role of proline under changing environments. PlantSignal. Behav. 2012, 7, 1456–1466. [CrossRef]
24. Hadi, F.; Gilpin, M.; Fuller, M.P. Identification and expression analysis of CBF/DREB1 and COR15 genes in mutants of Brassicaoleracea var. botrytis with enhanced proline production and frost resistance. Plant Physiol. Biochem. 2011, 49, 1323–1332.[CrossRef] [PubMed]
25. Fuller, M.P.; Metwali, E.M.R.; Eed, M.H.; Jellings, A.J. Evaluation of Abiotic Stress Resistance in Mutated Populations ofCauliflower (Brassica oleracea var. botrytis). Plant Cell Tissue Organ. Cult. 2006, 86, 239. [CrossRef]
26. Neto, N.B.M.; Custódio, C.C.; Gatti, A.B.; Priolli, M.R.; Cardoso, V.J.M. Proline: Use as an indicator of temperature stress in beanseeds. Crop Breed. Appl. Biotechnol. 2004, 4, 330–337. [CrossRef]
27. Vera-Hernández, P.; Ramírez, M.A.O.; Núñez, M.M.; Ruiz-Rivas, M.; Rosas-Cárdenas, F.F. Proline as a probable biomarker of coldstress tolerance in Sorghum (Sorghum bicolor). Mex. J. Biotechnol. 2018, 3, 77–86. [CrossRef]
28. de Freitas, G.M.; Thomas, J.; Liyanage, R.; Lay, J.O.; Basu, S.; Ramegowda, V.; do Amaral, M.N.; Benitez, L.C.; Braga, E.J.B.;Pereira, A. Cold tolerance response mechanisms revealed through comparative analysis of gene and protein expression inmultiple rice genotypes. PLoS ONE 2019, 14, e0218019. [CrossRef]
29. Ashraf, M.; Harris, P.J.C. Photosynthesis under stressful environments: An overview. Photosynthetica 2013, 51, 163–190. [CrossRef]30. Ensminger, I.; Busch, F.; Huner, N.P.A. Photostasis and cold acclimation: Sensing low temperature through photosynthesis.
Phisiol. Plant. 2006, 126, 28–44. [CrossRef]31. Zhao, Y.; Han, Q.; Ding, C.; Huang, Y.; Liao, J.; Tao Chen, T.; Feng, S.; Zhou, L.; Zhang, Z.; Chen, Y.; et al. Effect of Low
Temperature on Chlorophyll Biosynthesis and Chloroplast Biogenesis of Rice Seedlings during Greening. Int. J. Mol. Sci. 2020,21, 1390. [CrossRef]
32. Mageney, V.; Baldermann, S.; Albach, D.C. Intraspecific Variation in Carotenoids of Brassica oleracea var. sabellica. J. Agric. FoodChem. 2016, 64, 3251–3257. [CrossRef] [PubMed]
33. Maoka, T. Carotenoids as natural functional pigments. J. Nat. Med. 2020, 74, 1–16. [CrossRef] [PubMed]34. Hwang, S.-J.; Chun, J.-H.; Kim, S.-J. Effect of Cold Stress on Carotenoids in Kale Leaves (Brassica oleracea). Korean J. Environ. Agric.
2017, 36, 106–112. [CrossRef]35. Šamec, D.; Karalija, E.; Šola, I.; Vujcic-Bok, V.; Salopek-Sondi, B. The Role of Polyphenols in Abiotic Stress Response: The Influence
of Molecular Structure. Plants 2021, 10, 118. [CrossRef] [PubMed]36. Jurkow, R.; Wurst, A.; Kalisz, A.; Sekara, A.; Cebula, S. Cold stress modifies bioactive compounds of kale cultivars during
fall–winter harvests. Acta Agrobot. 2019, 72, 1761. [CrossRef]37. Schmidt, S.; Zietz, M.; Schreiner, M.; Rohn, S.; Kroh, L.W.; Krumbein, A. Genotypic and climatic influences on the concentration
and composition of flavonoids in kale (Brassica oleracea var. sabellica). Food. Chem. 2010, 119, 1293–1299. [CrossRef]38. Stefanowska, M.; Kuras, M.; Kacperska, A. Low Temperature-induced Modifications in Cell Ultrastructure and Localization of
Phenolics in Winter Oilseed Rape (Brassica napus L. var. oleifera L.) Leaves. Ann Bot. 2002, 90, 637–645. [CrossRef]
72

horticulturae
Article
Effect of Cold Stress on Growth, Physiological Characteristics,and Calvin-Cycle-Related Gene Expression of GraftedWatermelon Seedlings of Different Gourd Rootstocks
Kaixing Lu 1, Jiutong Sun 1, Qiuping Li 1, Xueqin Li 2,* and Songheng Jin 2,*
Citation: Lu, K.; Sun, J.; Li, Q.; Li, X.;
Jin, S. Effect of Cold Stress on Growth,
Physiological Characteristics, and
Calvin-Cycle-Related Gene
Expression of Grafted Watermelon
Seedlings of Different Gourd
Rootstocks. Horticulturae 2021, 7, 391.
https://doi.org/10.3390/
horticulturae7100391
Academic Editors:
Agnieszka Hanaka,
Jolanta Jaroszuk-Sciseł and
Małgorzata Majewska
Received: 23 August 2021
Accepted: 30 September 2021
Published: 11 October 2021
Publisher’s Note: MDPI stays neutral
with regard to jurisdictional claims in
published maps and institutional affil-
iations.
Copyright: © 2021 by the authors.
Licensee MDPI, Basel, Switzerland.
This article is an open access article
distributed under the terms and
conditions of the Creative Commons
Attribution (CC BY) license (https://
creativecommons.org/licenses/by/
4.0/).
1 College of Science & Technology, Ningbo University, Ningbo 315211, China; [email protected] (K.L.);[email protected] (J.S.); [email protected] (Q.L.)
2 Jiyang College, Zhejiang A&F University, Zhuji 311800, China* Correspondence: [email protected] (X.L.); [email protected] (S.J.)
Abstract: Recently, grafting has been used to improve abiotic stress resistance in crops. Here, usingwatermelon ‘Zaojia 8424’ (Citrullus lanatus) as scions, three different gourds (Lagenaria siceraria, 0526,2505, and 1226) as rootstocks, and non-grafted plants as controls (different plants were abbreviatedas 0526, 2505, 1226, and 8424), the effect of cold stress on various physiological and molecular param-eters was investigated. The results demonstrate that the improved cold tolerance of gourd-graftedwatermelon was associated with higher chlorophyll and proline content, and lower malondialdehyde(MDA) content, compared to 8424 under cold stress. Furthermore, grafted watermelons accumu-lated fewer reactive oxygen species (ROS), accompanied by enhanced antioxidant activity and ahigher expression of enzymes related to the Calvin cycle. In conclusion, watermelons with 2505 and0526 rootstocks were more resilient compared to 1226 and 8424. These results confirm that usingtolerant rootstocks may be an efficient adaptation strategy for improving abiotic stress tolerance inwatermelon.
Keywords: watermelon; rootstock; cold stress; antioxidant enzymes; gene expression
1. Introduction
Cold stress is one of the key environmental factors that severely affect plant growthand development, especially for watermelon (Citrullus lanatus). Watermelon is an importantglobal fruit due to its economic importance and nutritional qualities, it contains a greatquantity of antioxidants and may mitigate oxidative damage in tissues. Originating fromAfrica and tropical regions in Asia, watermelon is sensitive to low temperatures. The bestgrowing conditions for watermelon are between 21 and 29 ◦C. When the temperaturedrops to 10 ◦C, watermelon stops growing and it even dies at temperatures below 1 ◦C [1].Extreme weather frequently occurs in China, especially during the seedling stage, suchas winter, late autumn, and early spring, in which watermelon usually suffers cold stress.Thus, it is hard to grow the fruit and obtain high yields. Therefore, the study of how toimprove cold resistance in watermelon has become a vital part of watermelon breedingprojects. One way to improve cold tolerance is to graft plants onto rootstocks with highercold tolerance [2–7].
Grafting originated in Japan in the late 1920s and was initially used to improveresistance to soil pathogens [8]. Since then, the use of grafting has spread around the world.In Korea and Japan, approximately 95% and 92% of the land area, respectively, is cultivatedwith grafted watermelon [9]. Recently, grafting was proposed as a promising approach toimprove tolerance to abiotic stress and can represent an efficient technique for reducingor eliminating losses in production. Over the years, many studies have demonstrated theability of grafting to enhance salt tolerance in different plants, such as melon (Cucumis meloL.) [10], pumpkin (Cucurbita moschata D.) [4], cucumber (Cucumis sativus L.) [11], grapevines
Horticulturae 2021, 7, 391. https://doi.org/10.3390/horticulturae7100391 https://www.mdpi.com/journal/horticulturae
73
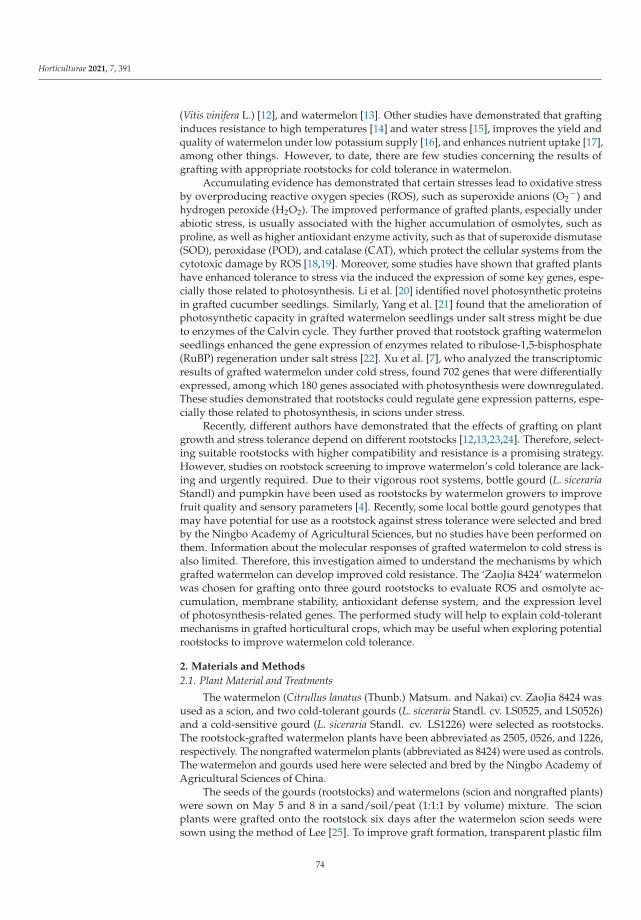
Horticulturae 2021, 7, 391
(Vitis vinifera L.) [12], and watermelon [13]. Other studies have demonstrated that graftinginduces resistance to high temperatures [14] and water stress [15], improves the yield andquality of watermelon under low potassium supply [16], and enhances nutrient uptake [17],among other things. However, to date, there are few studies concerning the results ofgrafting with appropriate rootstocks for cold tolerance in watermelon.
Accumulating evidence has demonstrated that certain stresses lead to oxidative stressby overproducing reactive oxygen species (ROS), such as superoxide anions (O2
−) andhydrogen peroxide (H2O2). The improved performance of grafted plants, especially underabiotic stress, is usually associated with the higher accumulation of osmolytes, such asproline, as well as higher antioxidant enzyme activity, such as that of superoxide dismutase(SOD), peroxidase (POD), and catalase (CAT), which protect the cellular systems from thecytotoxic damage by ROS [18,19]. Moreover, some studies have shown that grafted plantshave enhanced tolerance to stress via the induced the expression of some key genes, espe-cially those related to photosynthesis. Li et al. [20] identified novel photosynthetic proteinsin grafted cucumber seedlings. Similarly, Yang et al. [21] found that the amelioration ofphotosynthetic capacity in grafted watermelon seedlings under salt stress might be dueto enzymes of the Calvin cycle. They further proved that rootstock grafting watermelonseedlings enhanced the gene expression of enzymes related to ribulose-1,5-bisphosphate(RuBP) regeneration under salt stress [22]. Xu et al. [7], who analyzed the transcriptomicresults of grafted watermelon under cold stress, found 702 genes that were differentiallyexpressed, among which 180 genes associated with photosynthesis were downregulated.These studies demonstrated that rootstocks could regulate gene expression patterns, espe-cially those related to photosynthesis, in scions under stress.
Recently, different authors have demonstrated that the effects of grafting on plantgrowth and stress tolerance depend on different rootstocks [12,13,23,24]. Therefore, select-ing suitable rootstocks with higher compatibility and resistance is a promising strategy.However, studies on rootstock screening to improve watermelon’s cold tolerance are lack-ing and urgently required. Due to their vigorous root systems, bottle gourd (L. sicerariaStandl) and pumpkin have been used as rootstocks by watermelon growers to improvefruit quality and sensory parameters [4]. Recently, some local bottle gourd genotypes thatmay have potential for use as a rootstock against stress tolerance were selected and bredby the Ningbo Academy of Agricultural Sciences, but no studies have been performed onthem. Information about the molecular responses of grafted watermelon to cold stress isalso limited. Therefore, this investigation aimed to understand the mechanisms by whichgrafted watermelon can develop improved cold resistance. The ‘ZaoJia 8424’ watermelonwas chosen for grafting onto three gourd rootstocks to evaluate ROS and osmolyte ac-cumulation, membrane stability, antioxidant defense system, and the expression levelof photosynthesis-related genes. The performed study will help to explain cold-tolerantmechanisms in grafted horticultural crops, which may be useful when exploring potentialrootstocks to improve watermelon cold tolerance.
2. Materials and Methods
2.1. Plant Material and Treatments
The watermelon (Citrullus lanatus (Thunb.) Matsum. and Nakai) cv. ZaoJia 8424 wasused as a scion, and two cold-tolerant gourds (L. siceraria Standl. cv. LS0525, and LS0526)and a cold-sensitive gourd (L. siceraria Standl. cv. LS1226) were selected as rootstocks.The rootstock-grafted watermelon plants have been abbreviated as 2505, 0526, and 1226,respectively. The nongrafted watermelon plants (abbreviated as 8424) were used as controls.The watermelon and gourds used here were selected and bred by the Ningbo Academy ofAgricultural Sciences of China.
The seeds of the gourds (rootstocks) and watermelons (scion and nongrafted plants)were sown on May 5 and 8 in a sand/soil/peat (1:1:1 by volume) mixture. The scionplants were grafted onto the rootstock six days after the watermelon scion seeds weresown using the method of Lee [25]. To improve graft formation, transparent plastic film
74

Horticulturae 2021, 7, 391
was used to cover the seedlings. All grafted seedlings were kept in the shade for 72 h.To ensure the stability of relative humidity, the plastic film was opened every day andcompletely removed 7 days after grafting. Then, all different seedlings were grown underthe following conditions in the greenhouse: approximately 28/23 ± 1 ◦C (D/N) with 60%relative humidity, a 12 h photoperiod, and a photosynthetic photon flux density (PPFD) of300 μmol·m−2 · s−. After the third true leaves had fully unfolded, 12 plants of uniform sizefrom each group were transplanted into different pots (one seedling per pot) and cultivatedin an illuminating incubator under the controlled environment described above. Afteranother two days of acclimation, the plants were randomly distributed to two identicalilluminating incubators; one was a control group, and the other was a cold stress group.The control group remained in the same conditions, while the experimental group wassubjected to cultivation for two days with a temperature of 20/15 ◦C (D/N) and then forfive days under 10/6 ◦C (D/N). Samples were collected at the same time, i.e., after oneweek from both control and cold-stressed plants (2-day acclimation period and 5 daysunder cold exposure). The third leaves from the tops of different groups were harvestedand used for H2O2 and O2
− detection, each replicated three times. The remaining leaveswere also sampled immediately and frozen in liquid N2 before being kept at −80 ◦C. Leavesfrom the same position were used to measure the same parameter.
2.2. Chlorophyll Content and Plant Growth Measurements
Chlorophyll content was measured spectrophotometrically according to Porra et al. [26].The height and stem diameter of seedlings from each treatment were measured using aruler and vernier caliper, respectively. The dry weights were determined after drying at105 ◦C for 10 min and then at 70 ◦C for 72 h. The total number of leaves was counted oneach plant.
2.3. Measurements of ROS, MDA, and Proline Content
Histochemical staining of O2− was performed using nitroblue tetrazolium (NBT) [27].
Leaf stalks were immediately combined with 0.1% NBT (w/v) in 25 mmol L−1 K-HEPESbuffer (pH7.8) and kept at 25 ◦C in the dark for 4 h. After the leaves were boiled in 95%ethanol, they were photographed. The different staining colors indicated the differentdegrees of lipid peroxidation.
Detection of H2O2 in the leaves and measurements of O2− generation, H2O2, and
MDA content were all carried out according to our previous methods [28]. Proline contentwas analyzed according to the method of Bates et al. [29].
2.4. Antioxidant Enzyme Analysis
The extraction of antioxidant enzymes and the determination of those enzyme activ-ities (SOD, CAT, and POD) were all carried out according to our previous methods [18],while the activity of GPX was measured following Huang et al. [30]. Electrophoretic sepa-ration of POD and CAT bands was performed as described by Lu et al. [18] and Woodburyet al. [31].
2.5. Gene Expression Analysis
Leaves of different watermelons were used to extract total RNA using the TRI Reagent(Takara Bio Inc. Dalian, China) according to the manufacturer’s protocol. Reverse tran-scription reactions were performed using a PrimeScript RT Reagent Kit with genomicDNA Eraser (Takara Bio Inc. Dalian, China). Suitable primers were designed based onthe National Center for Biotechnology Information (NCBI) and the watermelon genomesequence in the cucurbit genomics database. All primers used in this study are providedin Table 1. Quantitative gene expression analysis was performed using a Light Cycler 480II, Roche Real Time PCR System (Roche Diagnostics Ltd., Basel, Switzerland). qPCR wascarried out in a 20 μL reaction mixture containing 1 μL diluted first-strand cDNA, 125 nMof each primer, and 10 μL Lightcycler 480 SYBR Green I Master (Roche Diagnostics GmbH,
75
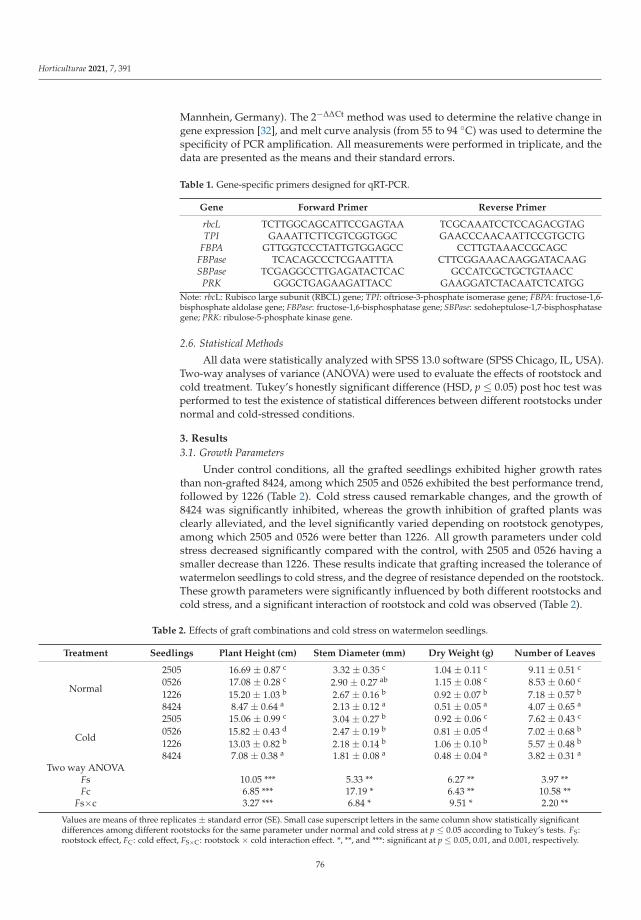
Horticulturae 2021, 7, 391
Mannhein, Germany). The 2−ΔΔCt method was used to determine the relative change ingene expression [32], and melt curve analysis (from 55 to 94 ◦C) was used to determine thespecificity of PCR amplification. All measurements were performed in triplicate, and thedata are presented as the means and their standard errors.
Table 1. Gene-specific primers designed for qRT-PCR.
Gene Forward Primer Reverse Primer
rbcL TCTTGGCAGCATTCCGAGTAA TCGCAAATCCTCCAGACGTAGTPI GAAATTCTTCGTCGGTGGC GAACCCAACAATTCCGTGCTG
FBPA GTTGGTCCCTATTGTGGAGCC CCTTGTAAACCGCAGCFBPase TCACAGCCCTCGAATTTA CTTCGGAAACAAGGATACAAGSBPase TCGAGGCCTTGAGATACTCAC GCCATCGCTGCTGTAACC
PRK GGGCTGAGAAGATTACC GAAGGATCTACAATCTCATGGNote: rbcL: Rubisco large subunit (RBCL) gene; TPI: oftriose-3-phosphate isomerase gene; FBPA: fructose-1,6-bisphosphate aldolase gene; FBPase: fructose-1,6-bisphosphatase gene; SBPase: sedoheptulose-1,7-bisphosphatasegene; PRK: ribulose-5-phosphate kinase gene.
2.6. Statistical Methods
All data were statistically analyzed with SPSS 13.0 software (SPSS Chicago, IL, USA).Two-way analyses of variance (ANOVA) were used to evaluate the effects of rootstock andcold treatment. Tukey’s honestly significant difference (HSD, p ≤ 0.05) post hoc test wasperformed to test the existence of statistical differences between different rootstocks undernormal and cold-stressed conditions.
3. Results
3.1. Growth Parameters
Under control conditions, all the grafted seedlings exhibited higher growth ratesthan non-grafted 8424, among which 2505 and 0526 exhibited the best performance trend,followed by 1226 (Table 2). Cold stress caused remarkable changes, and the growth of8424 was significantly inhibited, whereas the growth inhibition of grafted plants wasclearly alleviated, and the level significantly varied depending on rootstock genotypes,among which 2505 and 0526 were better than 1226. All growth parameters under coldstress decreased significantly compared with the control, with 2505 and 0526 having asmaller decrease than 1226. These results indicate that grafting increased the tolerance ofwatermelon seedlings to cold stress, and the degree of resistance depended on the rootstock.These growth parameters were significantly influenced by both different rootstocks andcold stress, and a significant interaction of rootstock and cold was observed (Table 2).
Table 2. Effects of graft combinations and cold stress on watermelon seedlings.
Treatment Seedlings Plant Height (cm) Stem Diameter (mm) Dry Weight (g) Number of Leaves
Normal
2505 16.69 ± 0.87 c 3.32 ± 0.35 c 1.04 ± 0.11 c 9.11 ± 0.51 c
0526 17.08 ± 0.28 c 2.90 ± 0.27 ab 1.15 ± 0.08 c 8.53 ± 0.60 c
1226 15.20 ± 1.03 b 2.67 ± 0.16 b 0.92 ± 0.07 b 7.18 ± 0.57 b
8424 8.47 ± 0.64 a 2.13 ± 0.12 a 0.51 ± 0.05 a 4.07 ± 0.65 a
Cold
2505 15.06 ± 0.99 c 3.04 ± 0.27 b 0.92 ± 0.06 c 7.62 ± 0.43 c
0526 15.82 ± 0.43 d 2.47 ± 0.19 b 0.81 ± 0.05 d 7.02 ± 0.68 b
1226 13.03 ± 0.82 b 2.18 ± 0.14 b 1.06 ± 0.10 b 5.57 ± 0.48 b
8424 7.08 ± 0.38 a 1.81 ± 0.08 a 0.48 ± 0.04 a 3.82 ± 0.31 a
Two way ANOVAFs 10.05 *** 5.33 ** 6.27 ** 3.97 **Fc 6.85 *** 17.19 * 6.43 ** 10.58 **
Fs×c 3.27 *** 6.84 * 9.51 * 2.20 **
Values are means of three replicates ± standard error (SE). Small case superscript letters in the same column show statistically significantdifferences among different rootstocks for the same parameter under normal and cold stress at p ≤ 0.05 according to Tukey’s tests. FS:rootstock effect, FC: cold effect, FS×C: rootstock × cold interaction effect. *, **, and ***: significant at p ≤ 0.05, 0.01, and 0.001, respectively.
76

Horticulturae 2021, 7, 391
3.2. Chlorophyll Content
Photosynthetic pigments play a significant role in plant photosynthesis. Under controlconditions, the chlorophyll content of grafted watermelon was significantly higher than thatof non-grafted 8424 (Table 3). Under cold stress conditions, chlorophyll content decreasedsignificantly, and the reduction was greater in 8424 (37%) and 1226 (34%) than in 2505 (26%)and 0526 (25%) compared with normal conditions (Table 3). No significant changes werefound in the ratios of Chl a/b under normal conditions, while the ratio of Chl a/b in graftedseedlings was significantly higher than that in non-grafted 8424 under cold stress.
Table 3. Variability of total chlorophyll content and ratio of Chl a/b between different graft combina-tions after cold stress.
Treatment SeedlingsChlorophyll(mg g−1 FW)
Chl a/b
Normal
2505 1.84 ± 0.04 b 3.46 ± 0.10 a
0526 1.86 ± 0.02 b 3.41 ± 0.03 a
1226 1.71 ± 0.07 b 3.39 ± 0.08 a
8424 1.46 ± 0.13 a 3.29 ± 0.10 a
Cold
2505 1.36 ± 0.03 c 2.44 ± 0.03 c
0526 1.39 ± 0.03 b 2.35 ± 0.02 c
1226 1.13 ± 0.07 ab 2.28 ± 0.04 b
8424 0.92 ± 0.09 a 2.03 ± 0.02 a
Two-way ANOVAFs 10.15 ** 8.14 **Fc 13.24 ** 6.82 **
Fs×c 12.49 * 9.37 *Values are means of three replicates ± standard error (SE). Small case superscript letters in the same column showstatistically significant differences among different rootstocks for the same parameter under normal and coldstress at p ≤ 0.05 according to Tukey’s tests. FS: rootstock effect, FC: cold effect, FS×C: rootstock × cold interactioneffect. *, **, and ***: significant at p ≤ 0.05, 0.01, and 0.001, respectively.
3.3. Oxidative Stress Evaluation
The accumulation of H2O2 in leaves was reflected by necrotic lesions, which wereeasily detected by chlorophyll bleaching. Obviously, under control conditions (Figure 1A),the accumulation of H2O2 in grafted 1226 and non-grafted 8424 was higher than in grafted2505 and 0526. Necrotic lesions were mainly located on the leaf base and main veins in2505 and 0526 leaves, while in 1226 and 8424 leaves, even the small veins had brown spots.Furthermore, significant brown spot accumulation was observed in 1226 and 8424 leavesunder cold stress conditions, while this phenomenon was slight in 2505 and 0526 leaves(Figure 1A). The measurement of H2O2 content (Figure 1C) matched the effects of H2O2accumulation in leaves. Under control conditions, no significant difference was found inH2O2 content between grafted and non-grafted watermelons, whereas cold stress noticeablyincreased the H2O2 content in 8424 and 1226, which, compared with the controls, increasedby 56.3% and 21.1%, respectively.
Figure 1B shows the results of O2− generation and accumulation in the inoculated
leaves by nitroblue tetrazolium staining. The trend in O2− concentration was similar to that
of H2O2. Under control conditions, more dark blue staining was detected in 8424, followedby 1226, whereas very little dark blue staining was found in 2505 and 0526. Cold stressimproved the accumulation of O2
−, which was reflected in greater NBT staining spots,especially in 8424, where the blue color was sinificantly deepened. The influence of coldstress on the O2
− production rates of different seedlings was also measured (Figure 1D).Under control conditions, no significant difference was observed between grafted seedlingsin terms of O2
− production rate, whereas in 8424, the O2− production rate was significantly
higher. Furthermore, cold stress induced a sharp increase in the O2− production rate
in 8424 (34.0%), while a lower increase was observed in 2505, 0526, and 1226, the rates
77
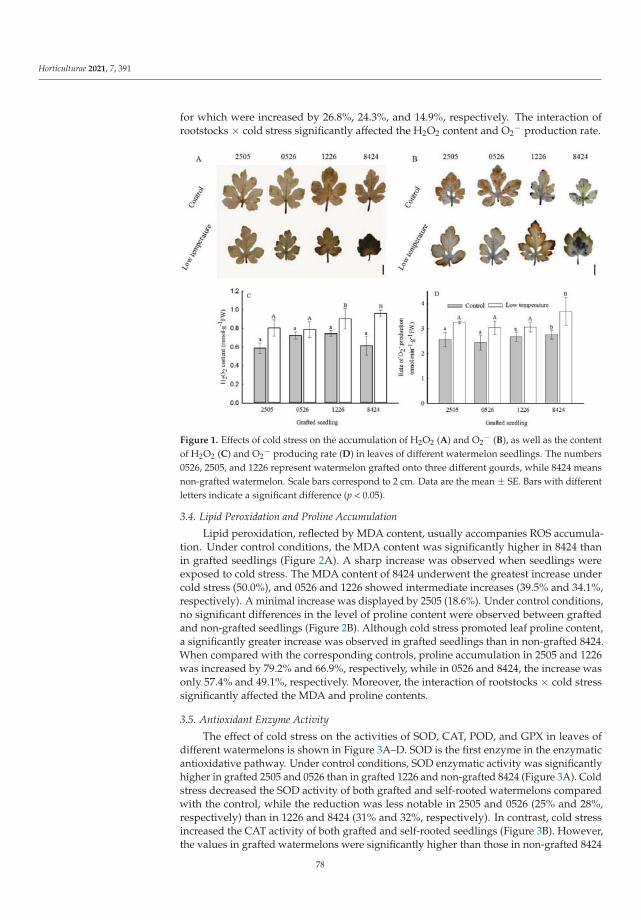
Horticulturae 2021, 7, 391
for which were increased by 26.8%, 24.3%, and 14.9%, respectively. The interaction ofrootstocks × cold stress significantly affected the H2O2 content and O2
− production rate.
Figure 1. Effects of cold stress on the accumulation of H2O2 (A) and O2− (B), as well as the content
of H2O2 (C) and O2− producing rate (D) in leaves of different watermelon seedlings. The numbers
0526, 2505, and 1226 represent watermelon grafted onto three different gourds, while 8424 meansnon-grafted watermelon. Scale bars correspond to 2 cm. Data are the mean ± SE. Bars with differentletters indicate a significant difference (p < 0.05).
3.4. Lipid Peroxidation and Proline Accumulation
Lipid peroxidation, reflected by MDA content, usually accompanies ROS accumula-tion. Under control conditions, the MDA content was significantly higher in 8424 thanin grafted seedlings (Figure 2A). A sharp increase was observed when seedlings wereexposed to cold stress. The MDA content of 8424 underwent the greatest increase undercold stress (50.0%), and 0526 and 1226 showed intermediate increases (39.5% and 34.1%,respectively). A minimal increase was displayed by 2505 (18.6%). Under control conditions,no significant differences in the level of proline content were observed between graftedand non-grafted seedlings (Figure 2B). Although cold stress promoted leaf proline content,a significantly greater increase was observed in grafted seedlings than in non-grafted 8424.When compared with the corresponding controls, proline accumulation in 2505 and 1226was increased by 79.2% and 66.9%, respectively, while in 0526 and 8424, the increase wasonly 57.4% and 49.1%, respectively. Moreover, the interaction of rootstocks × cold stresssignificantly affected the MDA and proline contents.
3.5. Antioxidant Enzyme Activity
The effect of cold stress on the activities of SOD, CAT, POD, and GPX in leaves ofdifferent watermelons is shown in Figure 3A–D. SOD is the first enzyme in the enzymaticantioxidative pathway. Under control conditions, SOD enzymatic activity was significantlyhigher in grafted 2505 and 0526 than in grafted 1226 and non-grafted 8424 (Figure 3A). Coldstress decreased the SOD activity of both grafted and self-rooted watermelons comparedwith the control, while the reduction was less notable in 2505 and 0526 (25% and 28%,respectively) than in 1226 and 8424 (31% and 32%, respectively). In contrast, cold stressincreased the CAT activity of both grafted and self-rooted seedlings (Figure 3B). However,the values in grafted watermelons were significantly higher than those in non-grafted 8424
78

Horticulturae 2021, 7, 391
under both control and cold stress conditions. Conversely, the activity of POD was severelyinhibited in both grafted and non-grafted seedlings when they were exposed to cold stress(Figure 3C). A lesser decrease was observed in plants grafted onto 0526 (17.7%), 1226(23.4%), and 2505 (24.5%) than in non-grafted 8424 (30.3%). The GPX activity was reducedby cold stress in non-grafted 8424 (25.2%) (Figure 3D), while in grafted seedlings, coldstress led to a considerable increase in GPX activity (5.5%, 16.8%, and 21.3% for 0526, 2505,and 1226, respectively). Moreover, the activities of those enzymes were all significantlyaffected by the interaction of rootstocks × cold.
Figure 2. Effects of low temperature on MDA (A) and proline (B) content in leaves of different grafted seedlings. Data arethe mean ± SE. Bars with different letters indicate a significant difference (p < 0.05).
Figure 3. Effect of low temperature on activities of SOD, CAT, POD, and GPX (A–D) in leaves of different grafted seedlings.Data are the mean ± SE. Bars with different letters indicate a significant difference (p < 0.05).
To evaluate the enzyme activity as stimulated by cold stress, polyacrylamide gel elec-trophoresis analysis of enzyme isoform patterns was performed. No significant differenceswere found in POD and GPX isoforms (data not shown), but there was a significant differ-
79

Horticulturae 2021, 7, 391
ence in SOD and CAT isoforms (Figures 4 and 5). At least five isoforms were detected inthe leaves of different watermelon seedlings under both control and cold stress conditions,while CAT 6 was only found under cold stress conditions. The cold-induced increase inCAT enzyme activity coincided with the increased expression of CAT isoforms. Underboth control and stress conditions, the expression of CAT isoforms in grafted watermelonswas much higher than that in non-grafted 8424 (Figure 4). Conversely, the expression ofSOD isoforms was downregulated by cold stress (Figure 5). Under control conditions, atleast nine isoforms were detected in different seedlings, with SOD1–3 and 6–8 being themajor ones, while under cold stress conditions, the expression of these isoforms was greatlydiminished. Similar to CAT isoforms, the expression of SOD isoforms in grafted water-melons was also much stronger than in non-grafted 8424, among which 0526 displayedthe highest expression, followed by 2505 and 1226. The differences observed in the SODisoform patterns match the changes in total SOD activity described above.
Figure 4. CAT isozymes in leaves of different grafted seedlings (different numbers represent differentbands).
Figure 5. SOD isozymes in leaves of different grafted seedlings (different numbers represent differentbands).
3.6. Gene Expression
Quantitative expression analyses were used to evaluate the association of the selectedgenes with cold resistance, as well as their differential expression under stress conditions indifferent watermelon seedlings, and the results are shown in Figure 6. Grafting increased
80
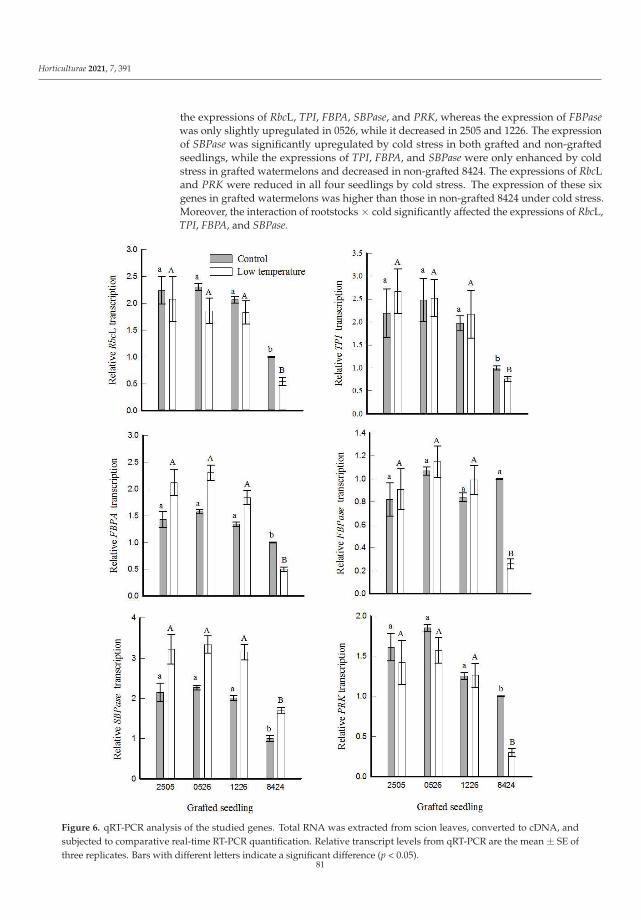
Horticulturae 2021, 7, 391
the expressions of RbcL, TPI, FBPA, SBPase, and PRK, whereas the expression of FBPasewas only slightly upregulated in 0526, while it decreased in 2505 and 1226. The expressionof SBPase was significantly upregulated by cold stress in both grafted and non-graftedseedlings, while the expressions of TPI, FBPA, and SBPase were only enhanced by coldstress in grafted watermelons and decreased in non-grafted 8424. The expressions of RbcLand PRK were reduced in all four seedlings by cold stress. The expression of these sixgenes in grafted watermelons was higher than those in non-grafted 8424 under cold stress.Moreover, the interaction of rootstocks × cold significantly affected the expressions of RbcL,TPI, FBPA, and SBPase.
Figure 6. qRT-PCR analysis of the studied genes. Total RNA was extracted from scion leaves, converted to cDNA, andsubjected to comparative real-time RT-PCR quantification. Relative transcript levels from qRT-PCR are the mean ± SE ofthree replicates. Bars with different letters indicate a significant difference (p < 0.05).
81

Horticulturae 2021, 7, 391
4. Discussion
Grafting is a widely used technique in plants for improving tolerance to abioticstress [10–13]. The results of the present study showed that grafted plant growth wassignificantly better than that of non-grafted 8424, especially under cold stress (Table 1).Furthermore, plants grafted on 2505 and 0526 rootstocks showed better tolerance to coldstress than the plants grafted onto 1226. The results demonstrate that grafting improvedwatermelon tolerance to cold stress, but the inhibition level varied depending on rootstockgenotypes. Similarly, Ramón et al. [17] reported that sweet pepper (Capsicum annuum L.),when grafted with appropriate rootstocks, could overcome the negative effects of heatstress conditions. Yan et al. [13] also stated that the use of ‘Kaijia No.1’ rather than ‘JingxinNo.2’ or ‘Quanneng Tiejia’ improved watermelon salt tolerance. In the present study, thesuperior performances of 2505 and 0526 under cold stress conditions were attributed to theuse of an appropriate rootstock, which can absorb more water and nutrients than 8424 and1226. Our results indicate that rootstock genotypes might play a crucial role in resistance toabiotic stress.
The chlorophyll content reflects the physiological status of plants and is closely relatedto photosynthetic potential and primary production. The present study shows that thechlorophyll content increased significantly in grafted plants under normal conditions(Table 2), while no significant difference was found in the ratio of Chl a/b. Under coldstress conditions, a reduction in chlorophyll content was observed in 8424 and graftedwatermelons, whereas these values were higher in the latter, indicating that the graftedwatermelon alleviated the photosynthetic inhibition induced by cold stress. Similarly, Yanet al. [13] showed that the chlorophyll content increased in grafted watermelons undersalt stress conditions, and Tao et al. [33] also indicated that cucumber plants grafted ontobitter melon (Momordica charantia L.) had higher chlorophyll contents than self-graftedplants. The reduced chlorophyll content in stressed plants could be attributed to decreasedchlorophyll synthesis, faster chlorophyll degradation, or both.
Environmental stress leads to the accumulation of ROS, which are highly toxic toplants, causing necrotic symptoms [34]. The ROS concentration is a good indicator ofoxidative stress. Our results show the greater accumulation of H2O2 and O2
− in non-grafted 8424 (Figure 1), whereas in gourd-grafted plants, this accumulation was relativelylower, indicating that gourd grafting alleviated the inhibition of oxidative stress. Thisdifference was even clearer under cold stress conditions. Cold stress induced more severeoxidative stress in non-grafted 8424 plants than in grafted plants, as manifested by theirhigh ROS accumulation. Among the three rootstocks, 2505 and 0526 were consideredmore cold-resistant than 1226, which suggests that the different degrees of oxidative stressinduced by cold stress were closely related to the rootstock genotype. Similar observationsfor cold tolerance in grafted grapevines (Vitis vinifera L.) [35] and salt tolerance in graftedwatermelons [13] have been reported, whereby plants using tolerant rootstocks displayedlower ROS accumulation than those using sensitive rootstocks.
An increase in ROS accumulation under abiotic stress parallels increased lipid per-oxidation. MDA, as the final product of peroxidation, is responsible for cell membranedamage [36]. Our results show that, under control conditions, the degree of lipid peroxi-dation in 8424 and 1226 was significantly higher than that in 0526 and 2505, while uponexposure to cold stress, the MDA content in 8424 increased more pronouncedly than that ingrafted watermelons (Figure 2A), indicating that the damage caused by cold injury in 8424was more serious than that in grafted watermelons. Among the tested rootstocks, 2505showed the lowest increase. The results confirm that rootstock grafting enhanced the coldtolerance of watermelon, but this was genotype dependent. These findings validate theresults of previous investigations, wherin chilling injury increased MDA accumulation [19].
As a compatible solute, proline plays an important role in protecting enzymes fromdenaturation in order to stabilize the machinery of protein synthesis [37]. Proline accumu-lation during stress conditions was also thought to be correlated with tolerance. Our resultsalso showed that cold stress promoted the accumulation of proline (Figure 2B), especially
82
Horticulturae 2021, 7, 391
in grafted seedlings, indicating that grafting improvs the cold tolerance of watermelonby promoting proline accumulation. These results are also similar to those of Krasenskyand Jonak [38], who found that proline was accumulated under abiotic stress conditions inmany plant species.
To alleviate oxidative damage under stress conditions, plants have developed a se-ries of effective detoxification mechanisms, among which antioxidant enzymes play animportant role [15,35]. In the present research, the activities of these antioxidant enzymes(SOD, CAT, POD, and GPX) were higher in grafted seedlings than in the non-grafted 8424(Figure 3), which indicates that grafted seedlings counteracted oxidative stress by elevationthe antioxidant enzyme activity so as to scavenge ROS and protected the membrane fromdamage. Compared to normal conditions, the CAT and GPX activities increased whenplants were exposed to low temperatures, while the POD and SOD activities decreased.Among the three different rootstocks, 2505 and 0526 showed higher increments and lowerreductions. This suggests that CAT and GPX might play a crucial role in antioxidantdefense. The cold-induced increase in CAT enzyme activity was likely due to the enhancedexpression of CAT isoforms (Figure 4), while the decrease in SOD enzyme activity wasalso correlated with the decreased expression of SOD isoforms (Figure 5). Similar resultswere also obtained in other studies, which reported that CAT played an important rolein alleviating the oxidative injuries induced by low temperatures [39,40]. Other studiesfound that SOD activity [39] and POD activity [41] increased under cold stress conditions.Recently, Yan et al. [13] reported that SOD activity, as well as CAT, POD, and APX activity,were increased in watermelon grafted onto P2, which suggests this grafted seedling hada higher H2O2 scavenging capacity than those using other rootstocks. These contrastingreports indicate that different plants might employ different pathways to cope with ox-idative stress. Here, CAT and GPX might play a more important role in impeding theaccumulation of ROS under cold stress.
Abiotic stress is known to influence gene expression. As the last rate-limiting stepin carbon fixation, the carboxylated activity of Rubisco is closely related to the Rubiscolarge subunit (RBCL) and RuBP [42]. In this study, the transcript levels of the Rubisco largesubunit (RbcL) and enzymes involved in RuBP regeneration were analyzed (Figure 6). Asshown in Figure 6, the higher transcript level of RbcL in grafted plants, especially understress conditions, implies the existence of a correlation between cold tolerance and RbcLexpression, while the latter ameliorates the photosynthetic capacity. As the main genesencoding enzymes required for RuBP regeneration, triose-3-phosphate isomerase (TPI) andfructose-1,6-bisphosphate aldolase (FBPA) catalyze two triose-3-phosphates to fructose-1,6-bisphosphate (FBP). Fructose-1,6-bisphosphatase (FBPase) catalyzes the hydrolysis of FBPto fructose-6-bisphosphatase (Fru6P), while sedoheptulose-1,7-bisphosphatase (SBPase)catalyzes the conversion of sedoheptulose-1,7-bisphosphate (SBP) to sedoheptulose 7-phosphate (Sed7P). Ribulose phosphate epimerase (RuPE) and ribulose-5-phosphate kinase(PRK) are the last rate-limiting enzymes in RuBP synthesis. Except for RuPE, whichwas almost unchanged between different gourd-grafted and non-grafted plants (data notshown), and FBPase, in which there was no significant difference between plants undercontrol conditions, the other genes of gourd-grafted plants were expressed much morehighly than those of non-grafted plants, especially under cold stress. These results implythat gourd-grafted watermelons could sense cold-induced changes early, and reponse withquick regulations at the transcript level so as to guarantee greater RuBP regeneration, whichwould activate the carboxylated activity of Rubisco and result in higher carboxylationefficiency.
5. Conclusions
The selection of stress-tolerant rootstocks might be a promising approach to alleviatethe detrimental effects of abiotic stress on watermelon productivity. In the present study,the results show that the cold-induced inhibition of growth was significantly amelioratedin gourd-grafted watermelons, as manifested by physiological indices, such as much better
83
Horticulturae 2021, 7, 391
growth parameters; much higher chlorophyll and proline contents; lower levels of ROSand lipid peroxidation; higher antioxidant enzyme activities, especially CAT and GPX;and higher expression levels of enzymes related to the Calvin cycle. Overall, as evidencedby the presented data, watermelon grafted with 2505 and 0526 rootstocks showed betterresilience than those grafted with 1226 and 8424.
Author Contributions: K.L. performed the experiments. K.L. and J.S. wrote the manuscript. Q.L.participated in the low temperature stress treatment and the determination of physiological char-acteristics. X.L. participated in organization and discussion regarding the manuscript. X.L. and S.J.designed the research. All authors have read and agreed to the published version of the manuscript.
Funding: This research was funded by the National Key Research and Development Program ofChina, grant number 2019YFE0118900, the Zhejiang Provincial Natural Science Foundation of China,grant number LY18C06000, and Ningbo Natural Science Foundation, grant number 2017A610293.
Institutional Review Board Statement: Not applicable.
Informed Consent Statement: Not applicable.
Data Availability Statement: All datasets generated for this study are included in the article.
Acknowledgments: We thank the National Key Research and Development Program of China(2019YFE0118900), the Zhejiang Provincial Natural Science Foundation of China (LY18C06000) andNingbo Natural Science Foundation (2017A610293) for supporting this work.
Conflicts of Interest: The authors declare no conflict of interest.
References
1. Noh, J.; Kim, J.M.; Sheikh, S.; Lee, S.G.; Lim, J.H.; Seong, M.H.; Jung, G.T. Effect of heat treatment around the fruit set region ongrowth and yield of watermelon [Citrullus lanatus (Thunb.) Matsum. and Nakai]. Physiol. Mol. Biol. Plants 2013, 19, 509–514.[CrossRef]
2. Hao, J.; Gu, F.; Zhu, J.; Lu, S.; Liu, Y.; Li, Y.; Chen, W.; Wang, L.; Fan, S.; Xian, C.J. Low night temperature affects the phloemultrastructure of lateral branches and Raffinose Family Oligosaccharide (RFO) accumulation in RFO-Transporting plant Melon(Cucumismelo, L.) during fruit expansion. PLoS ONE 2016, 11, e0160909. [CrossRef]
3. Machado, D.F.S.P.; Ribeiro, R.V.; da Silveira, J.A.G.; Filho, J.R.M.; Machado, E.C. Rootstocks induce contrasting photosyn-theticresponses of orange plants to low night temperature without affecting the antioxidant metabolism. Theor. Exp. Plant Phys. 2013,25, 26–35. [CrossRef]
4. Niu, M.; Xie, J.; Sun, J.; Huang, Y.; Kong, Q.; Nawaz, M.A.; Bie, Z. A shoot based Na+ tolerance mechanism observed inpumpkin—An important consideration for screening salt tolerant rootstocks. Sci. Hortic. 2017, 218, 38–47. [CrossRef]
5. Ntatsi, G.; Savvas, D.; Kläring, H.-P.; Schwarz, D. Growth, Yield, and metabolic responses of temperature-stressed tomato tografting onto rootstocks differing in cold tolerance. J. Am. Soc. Hortic. Sci. 2014, 139, 230–243. [CrossRef]
6. Wang, Z.M.; Chai, F.M.; Zhu, Z.F.; Elias, G.K.; Xin, H.P.; Liang, Z.C.; Li, S.H. The inheritance of cold tolerance in sevenin-terspecifific grape populations. Sci. Hortic. 2020, 266, 109260. [CrossRef]
7. Xu, J.H.; Zhang, M.; Liu, G.; Yang, X.P.; Hou, X.L. Comparative transcriptome profifiling of chilling stress responsiveness ingrafted watermelon seedlings. Plant Physiol. Biochem. 2016, 109, 561e570. [CrossRef]
8. Kawaide, T. Utilization of rootstocks in cucurbits production in Japan. Jpn. Agric. Res. Q. 1985, 18, 284–289.9. Lee, J.-M.; Kubota, C.; Tsao, S.J.; Bie, Z.; Echevarria, P.H.; Morra, L.; Oda, M. Current status of vegetable grafting: Diffusion,
grafting techniques, automation. Sci. Hortic. 2010, 127, 93–105. [CrossRef]10. Yarsi, G.; Altuntas, O.; Sivaci, A.; Dasgan, H.Y. Effects of salinity stress on plant growth and mineral composition of grafted and
un-grafted Galia C8 melon cultivar. Pak. J. Bot. 2017, 49, 819–822.11. Xu, Y.; Guo, S.-R.; Li, H.; Sun, H.-Z.; Na, L.; Shu, S.; Sun, J. Resistance of cucumber grafting rootstock pumpkin cultivars to
chilling and salinity stresses. Hort. Sci. Technol. 2017, 35, 220–231. [CrossRef]12. Lo’ay, A.A.; Abo EL-Ezz, S.F. Performance of ‘Flame seedless’ grapevines grown on different rootstocks in response to soil salinity
stress. Sci. Hortic. 2021, 275, 109704. [CrossRef]13. Yan, Y.; Wang, S.; Wei, M.; Gong, B.; Shi, Q. Effect of different rootstocks on the salt stress tolerance in watermelon seedlings.
Hortic. Plant J. 2018, 4, 239–249. [CrossRef]14. Li, H.; Liu, S.S.; Yi, C.Y.; Wang, F.; Zhou, J.; Xia, X.J.; Shi, K.; Zhou, Y.H.; Yu, J.Q. Hydrogen peroxide mediates abscisic acid-induced
HSP 70 accumulation and heat tolerance in grafted cucumber plants. Plant Cell Environ. 2014, 37, 2768–2780. [CrossRef]15. Sánchez-Rodríguez, E.; Romero, L.; Ruiz, J. Accumulation of free polyamines enhances the antioxidant response in fruits of
grafted tomato plants under water stress. J. Plant Physiol. 2016, 190, 72–78. [CrossRef] [PubMed]
84

Horticulturae 2021, 7, 391
16. Zhong, Y.Q.; Chen, C.; Nawaz, M.A.; Jiao, Y.Y.; Zheng, Z.H.; Shi, X.F.; Xie, W.T.; Yu, Y.G.; Guo, J.; Zhu, S.H.; et al. Using rootstockto increase watermelon fruit yield and quality at low potassium supply: A comprehensive analysis from agronomic, physiologicaland transcriptional perspective. Sci. Hortic. 2018, 241, 144–151. [CrossRef]
17. Ramón, G.-M.; Yaiza, G.P.; Mary-Rus, M.-C.; Salvador, L.-G.; Ángeles, C. Suitable rootstocks can alleviate the effects of heat stresson pepper plants. Sci. Hortic. 2021, 290, 110529.
18. Chen, S.; Yi, L.; Korpelainen, H.; Yu, F.; Liu, M. Roots play a key role in drought-tolerance of poplars as suggested by reciprocalgrafting between male and female clones. Plant Physiol. Biochem. 2020, 153, 81–91. [CrossRef]
19. Kumar, P.; Rouphael, Y.; Cardarelli, M.; Colla, G. Vegetable grafting as a tool to improve drought resistance and water useefficiency. Front. Plant Sci. 2017, 8, 1–4. [CrossRef]
20. Li, Y.J.; Liang, G.Y.; Liu, X.J.; Liu, D.C.; Fang, C. Proteomic study on grafted and non-grafted cucumber (Cucumis sativus L.). Acta.Hortic. Sin. 2009, 36, 1147–1152.
21. Yang, Y.; Wang, L.; Tian, J.; Li, J.; Sun, J.; He, L.; Guo, S.; Tezuka, T. Proteomic study participating the enhancement of growth andsalt tolerance of bottle gourd rootstock-grafted watermelon seedlings. Plant Physiol. Biochem. 2012, 58, 54–65. [CrossRef]
22. Yang, Y.; Yu, L.; Wang, L.; Guo, S. Bottle gourd rootstock-grafting promotes photosynthesis by regulating the stomata andnon-stomata performances in leaves of watermelon seedlings under NaCl stress. J. Plant Physiol. 2015, 186, 50–58. [CrossRef]
23. Han, Q.; Guo, Q.; Korpelainen, H.; Niinemets, Ü.; Li, C. Rootstock determines the drought resistance of poplar graftingcom-binations. Tree Physiol. 2019, 39, 1855–1866. [CrossRef]
24. Usanmaz, S.; Abak, K. Plant growth and yield of cucumber plants grafted on different commercial and local rootstocks grownunder salinity stress. Saudi J. Biol. Sci. 2019, 26, 1134–1139. [CrossRef] [PubMed]
25. Lee, J.-M. Cultivation of grafted vegetables, I. current status, grafting methods, and benefits. HortScience 1994, 29, 235–239.[CrossRef]
26. Porra, R.J.; Thompson, W.A.; Kriedemann, P.E. Determination of accurate extinction coefficients and simultaneous equations forassaying chlorophylls a and b extracted with four different solvents: Verification of the concentration of chlorophyll standards byatomic absorption spectroscopy. Biochim. Biophys. Acta Bioenerg. 1989, 975, 384–394. [CrossRef]
27. Airaki, M.; Leterrier, M.; Mateos, R.M.; Valderrama, R.; Chaki, M.; Barroso, J.B.; Delrío, L.A.; Palma, J.M.; Corpas, F.J. Metabolismof reactive oxygen species and reactive nitrogen species in pepper (Capsicum annuum L.) plants under low temperature stress.Plant Cell Environ. 2012, 35, 281–295. [CrossRef] [PubMed]
28. Lu, K.; Ding, W.; Zhu, S.; Jiang, D. Salt-induced difference between Glycine cyrtoloba and G. max in anti-oxidative ability and K+vs. Na+ selective accumulation. Crop. J. 2016, 4, 129–138. [CrossRef]
29. Bates, L.S.; Waldren, R.P.; Teare, I.D. Rapid determination of free proline for water-stress studies. Plant Soil 1973, 39, 205–207.[CrossRef]
30. Huang, Z.A.; Jiang, D.A.; Yang, Y.; Sun, J.W.; Jin, S.H. Effects of nitrogen deficiency on gas exchange, chlorophyll fluorescence,and antioxidant enzymes in leaves of rice plants. Photosynthetica 2004, 42, 357–364. [CrossRef]
31. Woodbury, W.; Spencer, A.; Stahmann, M. An improved procedure using ferricyanide for detecting catalase isozymes. Anal.Biochem. 1971, 44, 301–305. [CrossRef]
32. Livak, K.J.; Schmittgen, T.D. Analysis of relative gene expression data using real-time quantitative PCR and the 2−ΔΔCT method.Methods 2001, 25, 402–408. [CrossRef] [PubMed]
33. Tao, M.-Q.; Jahan, M.S.; Hou, K.; Shu, S.; Wang, Y.; Sun, J.; Guo, S.-R. Bitter melon (Momordica charantia L.) rootstock improves theheat tolerance of cucumber by regulating photosynthetic and antioxidant defense pathways. Plants 2020, 9, 692. [CrossRef]
34. Soares, C.; Carvalho, M.; Azevedo, R.A.; Fidalgo, F. Plants facing oxidative challenges—A little help from the antioxidantnetworks. Environ. Exp. Bot. 2019, 161, 4–25. [CrossRef]
35. Lo’ay, A.A.; Doaa, M.H. The potential of vine rootstocks impacts on ‘Flame Seedless’ bunches behavior under cold storage andantioxidant enzyme activity performance. Sci. Hortic. 2020, 260, 108844. [CrossRef]
36. Wakeel, A.; Xu, M.; Gan, Y. Chromium-induced reactive oxygen species accumulation by altering the enzymatic antioxidantsystem and associated cytotoxic, genotoxic, ultrastructural, and photosynthetic changes in plants. Int. J. Mol. Sci. 2020, 21, 728.[CrossRef] [PubMed]
37. Szabados, L.; Savouré, A. Proline: A multifunctional amino acid. Trends Plant Sci. 2010, 15, 89–97. [CrossRef]38. Krasensky, J.; Jonak, C. Drought, salt, and temperature stress-induced metabolic rearrangements and regulatory networks. J. Exp.
Bot. 2012, 63, 1593–1608. [CrossRef]39. Petric, M.; Jevremovic, S.; Trifunovic, M.; Tadic, V.; Miloševic, S.; Dragicevic, M.; Subotic, A. The effect of low temperature and
GA3 treatments on dormancy breaking and activity of antioxidant enzymes in Fritillaria meleagris bulblets cultured in vitro. ActaPhysiol. Plant. 2013, 35, 3223–3236. [CrossRef]
40. Xu, S.-C.; Li, Y.-P.; Hu, J.; Guan, Y.-J.; Ma, W.-G.; Zheng, Y.-Y.; Zhu, S.-J. Responses of Antioxidant enzymes to chilling stress intobacco seedlings. Agric. Sci. China 2010, 9, 1594–1601. [CrossRef]
41. Song, G.; Hou, W.; Wang, Q.; Wang, J.; Jin, X. Effect of low temperature on eutrophicated waterbody restoration by Spirodelapolyrhiza. Bioresour. Technol. 2006, 97, 1865–1869. [CrossRef] [PubMed]
42. Whitney, S.M.; Houtz, R.L.; Alonso, H. Advancing our understanding and capacity to engineer nature’s CO2-sequesteringenzyme, Rubisco. Plant Physiol. 2011, 155, 27–35. [CrossRef] [PubMed]
85

horticulturae
Article
Exogenous EBR Ameliorates Endogenous Hormone Contents inTomato Species under Low-Temperature Stress
Parviz Heidari 1,*, Mahdi Entazari 1, Amin Ebrahimi 1, Mostafa Ahmadizadeh 2, Alessandro Vannozzi 3,
Fabio Palumbo 3 and Gianni Barcaccia 3
Citation: Heidari, P.; Entazari, M.;
Ebrahimi, A.; Ahmadizadeh, M.;
Vannozzi, A.; Palumbo, F.; Barcaccia,
G. Exogenous EBR Ameliorates
Endogenous Hormone Contents in
Tomato Species under
Low-Temperature Stress.
Horticulturae 2021, 7, 84. https://
doi.org/10.3390/horticulturae7040084
Academic Editors: Agnieszka
Hanaka, Jolanta Jaroszuk-Sciseł and
Małgorzata Majewska
Received: 9 March 2021
Accepted: 12 April 2021
Published: 17 April 2021
Publisher’s Note: MDPI stays neutral
with regard to jurisdictional claims in
published maps and institutional affil-
iations.
Copyright: © 2021 by the authors.
Licensee MDPI, Basel, Switzerland.
This article is an open access article
distributed under the terms and
conditions of the Creative Commons
Attribution (CC BY) license (https://
creativecommons.org/licenses/by/
4.0/).
1 Faculty of Agriculture, Shahrood University of Technology, Shahrood 3619995161, Iran;[email protected] (M.E.); [email protected] (A.E.)
2 Minab Higher Education Center, University of Hormozgan, Bandar Abbas 7981634314, Iran;[email protected]
3 Laboratory of Genomics for Breeding, DAFNAE, Campus of Agripolis, University of Padova,35030 Legnaro, Italy; [email protected] (A.V.); [email protected] (F.P.);[email protected] (G.B.)
* Correspondence: [email protected]; Tel.: +98-912-0734-034
Abstract: Low-temperature stress is a type of abiotic stress that limits plant growth and production inboth subtropical and tropical climate conditions. In the current study, the effects of 24-epi-brassinolide(EBR) as analogs of brassinosteroids (BRs) were investigated, in terms of hormone content, antioxi-dant enzyme activity, and transcription of several cold-responsive genes, under low-temperaturestress (9 ◦C) in two different tomato species (cold-sensitive and cold-tolerant species). Results in-dicated that the treatment with exogenous EBR increases the content of gibberellic acid (GA3) andindole-3-acetic acid (IAA), whose accumulation is reduced by low temperatures in cold-sensitivespecies. Furthermore, the combination or contribution of BR and abscisic acid (ABA) as a synergeticinteraction was recognized between BR and ABA in response to low temperatures. The contentof malondialdehyde (MDA) and proline was significantly increased in both species, in responseto low-temperature stress; however, EBR treatment did not affect the MDA and proline content.Moreover, in the present study, the effect of EBR application was different in the tomato speciesunder low-temperature stress, which increased the catalase (CAT) activity in the cold-tolerant speciesand increased the glutathione peroxidase (GPX) activity in the cold-sensitive species. Furthermore,expression levels of cold-responsive genes were influenced by low-temperature stress and EBRtreatment. Overall, our findings revealed that a low temperature causes oxidative stress whileEBR treatment may decrease the reactive oxygen species (ROS) damage into increasing antioxidantenzymes, and improve the growth rate of the tomato by affecting auxin and gibberellin content. Thisstudy provides insight into the mechanism by which BRs regulate stress-dependent processes intomatoes, and provides a theoretical basis for promoting cold resistance of the tomato.
Keywords: cold stress; cold-responsive genes; anti-oxidants; proline; malondialdehyde;hormone profiling
1. Introduction
Low-temperature stress in plants, categorized as freezing stress or chilling stress,is one of the main environmental stresses that adversely affects plant production acrossthe world, especially in subtropical and tropical climate conditions. This environmentalextreme is escalating due to global climate change and is, therefore, threatening sustainablecrop production [1,2]. Cold stress impacts the photosynthetic system, impairing the cycleof carbon reduction, the thylakoid electron transport, and the stomatal control of CO2,providing enhanced accumulation of sugars, lipids peroxidation, and water balance distur-bance [3–6]. Moreover, a low temperature negatively impacted plants, especially in regardsto macromolecules activity, altering the fluidity of the membrane, and reducing osmotic
Horticulturae 2021, 7, 84. https://doi.org/10.3390/horticulturae7040084 https://www.mdpi.com/journal/horticulturae
87
Horticulturae 2021, 7, 84
potential of the cell [7]. Regarding the metabolic processes and pathways—cold stressaffects antioxidant enzyme activities, membrane fatty acid compositions, and adjusting ofthe redox state and gene expression [8].
Once plants are exposed to stresses, such as cold stress, different kinds of reactiveoxygen species (ROS) are generated, which can undertake a series of oxidation–reductionreactions. Plants defend themselves by enzymatic and non-enzymatic antioxidants [9]. Analternative defense strategy could be supplementing hormones, which could enhance an-tioxidant and detoxification ability in order to cope and tolerate stressful conditions [10,11].Previous studies identified numerous hormones and signaling molecules associated withplant responses to particular stress. For instance: ethylene engaged in red light-induced an-thocyanin biosynthesis in cabbage [12], the antioxidant system, and ABA in brassinosteroid-induced water stress tolerance of grapevines [13]. Coordination of signaling molecules andhormones positively influences the plant’s responses to stress and ultimately its preser-vation in unfavorable conditions [14–16]. Moreover, brassinosteroids (BRs) as steroidalhormones are involved in an array of physiological and developmental processes viatheir active engagement in processes, such as antioxidant metabolism [4,17,18], photo-synthesis [4,19], nitrogen metabolism [20,21], plant–water relations [22], and osmolyteaccumulation [23] in various conditions [1,24–26]. Treatment with 24-epi-brassinolide(EBR) regulates the ascorbate–glutathione (AsA–GSH) component cycle in low-temperaturestress on a temporal basis, leading to increased low-temperature tolerance in grapevines atthe seedling stage [7]. Transcriptome analysis revealed that treatment with EBR in coldconditions raises the transcript levels of genes related to photosynthesis and chlorophyllbiosynthesis, including those encoding for photosystem II (PSII) oxygen-evolving enhancerprotein, photosystem I (PSI) subunit, light-harvesting chlorophyll protein complexes I andII, and ferredoxin [27].
Furthermore, BRs illustrated engagement in the regulation of ROS metabolism throughthe expression of many antioxidant genes that enhance the activity of antioxidant enzymes,such as catalase (CAT), superoxide dismutase (SOD), and peroxidase (POX) [17]. Underlow-temperature conditions, plants, by active BR signaling and accumulation of the acti-vate Brassinazole resistant 1 (BZR1) (a BR signaling positive regulator protein), elevate therespiratory burst oxidase homolog 1 (RBOH1) transcript levels and the apoplastic H2O2 pro-duction [28]. The RBOH1 encodes NADPH oxidase that is involved in ROS in the apoplast,mainly for signaling purposes [25] Moreover, crosstalk between the alternative oxidase(AOX) pathway and BR plays a pivotal role in ameliorating plant tolerance to cold stress,and it has been shown that BR-induced AOX synthesis protects photosystems by boundingROS synthesis exposed to low-temperature stress [29]. In young grapevine seedlings, foliarapplication of 24-epi-brassinolide adjusted proteins, free proline contents, and solublesugars activates the antioxidant machinery to increase chilling stress tolerance [30].
Tomato is a popular garden fruit worldwide because of its edible fruits, rich in an-tioxidants, and capable of fighting against ROS. Overexpression of DWARF or exogenousEBR application enhances low-temperature tolerance by diminishing oxidative damagein tomato plants [31]. It is worth noting that ROS may also act as a signal in mediatingBR-adjusted responses in low-temperature tolerance [32]. A previous study showed that,to protect the plants from oxidative damage, glutaredoxin (GRX), 2-cysteine peroxire-doxin (2-Cys Prx), and RBOH1 participate in a signaling cascade to mediate BR-inducedlow-temperature tolerance in tomatoes [31]. It was shown that BRs can interact withauxin, salicylic acid, cytokinin, abscisic acid, jasmonic acid, gibberellin, and ethylene, incontrolling several morpho-physiological processes in plants [33]. The objective of thecurrent study was to evaluate the effects of 24-epi-brassinolide (EBR) treatment on hormonecontent, antioxidant activity, the content of malondialdehyde (MDA) and proline, andgene expression of cold-responsive genes on the tomato species under low-temperaturestress. This study provides insight into the mechanisms by which BRs regulate stress-dependent processes in tomatoes and provides a theoretical basis for promoting coldresistance in tomato.
88
Horticulturae 2021, 7, 84
2. Materials and Methods
2.1. Plant Materials and Growth Condition
In this study, seeds of the two contrasting tomato species, cold-sensitive(Solanum lycopersicum cv. ‘Moneymaker’) and cold-tolerant (S. habrochaites, Accession‘LA1777’) [34], were selected to investigate the effects of BR on tomato seedlings under low-temperature stress. Firstly, seeds were sterilized using 2% sodium hypochlorite solutionfor 12 min and then washed with double distilled water and dried. The three sterilizedseeds of each species were sown in plates containing 50% vermicompost and 50% perlite.In this study, 30 plates were used for each tomato species. The plates were maintainedin a growth chamber at 23 ± 2 ◦C with the 16 h light/8 h dark cycling. After 40 days,tomato plates of each species were divided two groups; half of them were sprayed with5 mg/L of 24-epi-brassinolide (EBR) and repeated after 6 h. After 3 h from the last spraying,each treatment was divided into two groups; the first group was transferred to a growthchamber at 9 ± 1 ◦C and the second group was maintained at 23 ± 1 ◦C. After three days,the leaves of each sample were cut and stored in liquid nitrogen and transferred to −80 ◦Cfor the next analysis. In the present study, control plants were cultivated at 23 ◦C andwithout spraying EBR.
2.2. Hormone Profiling
To analyze the free forms of the hormones, including abscisic acid (ABA), indole-3-acetic acid (IAA), and gibberellin (GA3), the young leaves (2.0 g) of each treatment werewell-powdered using liquid nitrogen and then samples were crushed by cold methanol.The extract was achieved using 30 mL of 80% cold aqueous methanol in darkness at 4 ◦C.To determine the hormone content, 10 μL of the extract was injected. The concentrationof each hormone was determined using HPLC (Unicam, Cambridge, UK) with a C18reverse-phase column (4.6 × 250 mm Diamonsic C18, 5 μm, PerkinElmer, Ohio, USA) andcolumn temperature was 35 ◦C, gradient elution, mobile phase in methanol, and 1 mL/minflow rate at a wavelength of 254 nm. The peak area of the standard was considered todetermine the sample concentration. Moreover, the standards of ABA, IAA, and GA3were received from Sigma–Aldrich (Steinheim, Germany). The content of IAA and GA3was measured based on the method defined by Tang et al. [35]. The content of ABA wasdetermined according to the method characterized by Li et al. [36].
2.3. Lipid Peroxidation Assay and Proline Content
The malondialdehyde (MDA) content has been identified as a marker of lipid peroxi-dation rate associated with oxidative stress. In the current study, 200 mg of fresh leaveswere homogenized using 1% TCA (w/v). The MDA content was measured according tothe method defined by Campos et al. [37]. Moreover, 0.5 g of leaves were homogenizedby 10 mL of 3% sulfosalicylic acid to determine the proline content in each sample. In thecurrent study, the free proline content was analyzed using a method described by Zhangand Huang [38].
2.4. Enzyme Activity
The tomato leaves (300 mg) were ground to a powder in liquid nitrogen and mixedin 3 mL of 0.1 M extraction phosphate buffer (pH 7.5) and the mixed sample was shortlyvortexed. The homogenized samples were centrifuged at 13,000 rpm for 15 min at 4 ◦C.The supernatant of each sample was transferred to determine the enzyme activities. Theglutathione peroxidase (GPX; EC 1.11.1.9) activity was distinguished using a methoddescribed by Mittova et al. [39], and catalase (CAT; EC 1.11.1.6) activity was measured asdescribed by Aebi [40].
2.5. RNA Extraction and Real Time PCR
The leaves of tomato seedlings were well powdered in liquid nitrogen and the totalRNA of each sample was extracted using RNX TM-Plus (SinaClon, Tehran, Iran), based on
89
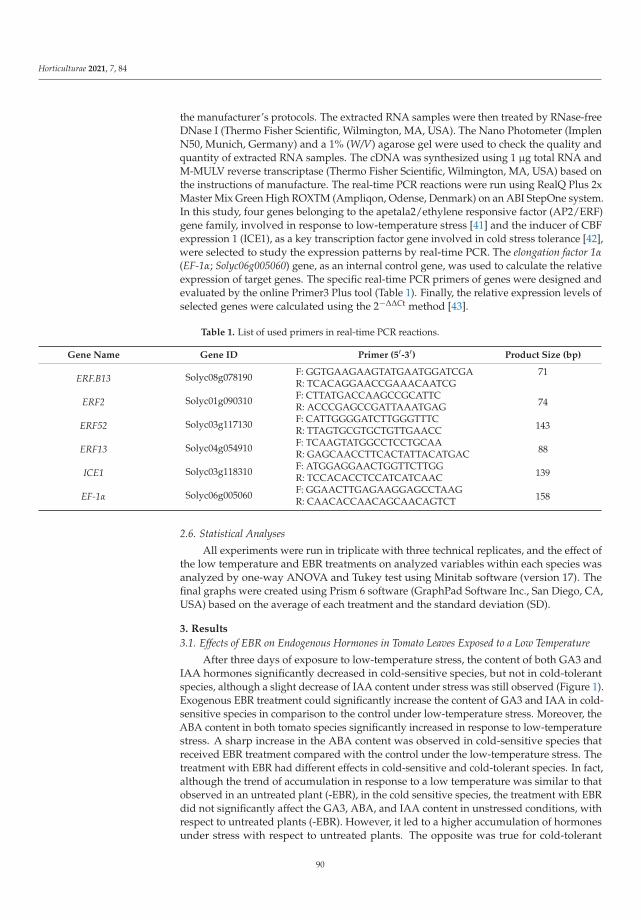
Horticulturae 2021, 7, 84
the manufacturer’s protocols. The extracted RNA samples were then treated by RNase-freeDNase I (Thermo Fisher Scientific, Wilmington, MA, USA). The Nano Photometer (ImplenN50, Munich, Germany) and a 1% (W/V) agarose gel were used to check the quality andquantity of extracted RNA samples. The cDNA was synthesized using 1 μg total RNA andM-MULV reverse transcriptase (Thermo Fisher Scientific, Wilmington, MA, USA) based onthe instructions of manufacture. The real-time PCR reactions were run using RealQ Plus 2xMaster Mix Green High ROXTM (Ampliqon, Odense, Denmark) on an ABI StepOne system.In this study, four genes belonging to the apetala2/ethylene responsive factor (AP2/ERF)gene family, involved in response to low-temperature stress [41] and the inducer of CBFexpression 1 (ICE1), as a key transcription factor gene involved in cold stress tolerance [42],were selected to study the expression patterns by real-time PCR. The elongation factor 1α(EF-1α; Solyc06g005060) gene, as an internal control gene, was used to calculate the relativeexpression of target genes. The specific real-time PCR primers of genes were designed andevaluated by the online Primer3 Plus tool (Table 1). Finally, the relative expression levels ofselected genes were calculated using the 2−ΔΔCt method [43].
Table 1. List of used primers in real-time PCR reactions.
Gene Name Gene ID Primer (5′-3′) Product Size (bp)
ERF.B13 Solyc08g078190 F: GGTGAAGAAGTATGAATGGATCGA 71R: TCACAGGAACCGAAACAATCG
ERF2 Solyc01g090310 F: CTTATGACCAAGCCGCATTC74R: ACCCGAGCCGATTAAATGAG
ERF52 Solyc03g117130 F: CATTGGGGATCTTGGGTTTC143R: TTAGTGCGTGCTGTTGAACC
ERF13 Solyc04g054910 F: TCAAGTATGGCCTCCTGCAA88R: GAGCAACCTTCACTATTACATGAC
ICE1 Solyc03g118310 F: ATGGAGGAACTGGTTCTTGG139R: TCCACACCTCCATCATCAAC
EF-1α Solyc06g005060 F: GGAACTTGAGAAGGAGCCTAAG158R: CAACACCAACAGCAACAGTCT
2.6. Statistical Analyses
All experiments were run in triplicate with three technical replicates, and the effect ofthe low temperature and EBR treatments on analyzed variables within each species wasanalyzed by one-way ANOVA and Tukey test using Minitab software (version 17). Thefinal graphs were created using Prism 6 software (GraphPad Software Inc., San Diego, CA,USA) based on the average of each treatment and the standard deviation (SD).
3. Results
3.1. Effects of EBR on Endogenous Hormones in Tomato Leaves Exposed to a Low Temperature
After three days of exposure to low-temperature stress, the content of both GA3 andIAA hormones significantly decreased in cold-sensitive species, but not in cold-tolerantspecies, although a slight decrease of IAA content under stress was still observed (Figure 1).Exogenous EBR treatment could significantly increase the content of GA3 and IAA in cold-sensitive species in comparison to the control under low-temperature stress. Moreover, theABA content in both tomato species significantly increased in response to low-temperaturestress. A sharp increase in the ABA content was observed in cold-sensitive species thatreceived EBR treatment compared with the control under the low-temperature stress. Thetreatment with EBR had different effects in cold-sensitive and cold-tolerant species. In fact,although the trend of accumulation in response to a low temperature was similar to thatobserved in an untreated plant (-EBR), in the cold sensitive species, the treatment with EBRdid not significantly affect the GA3, ABA, and IAA content in unstressed conditions, withrespect to untreated plants (-EBR). However, it led to a higher accumulation of hormonesunder stress with respect to untreated plants. The opposite was true for cold-tolerant
90
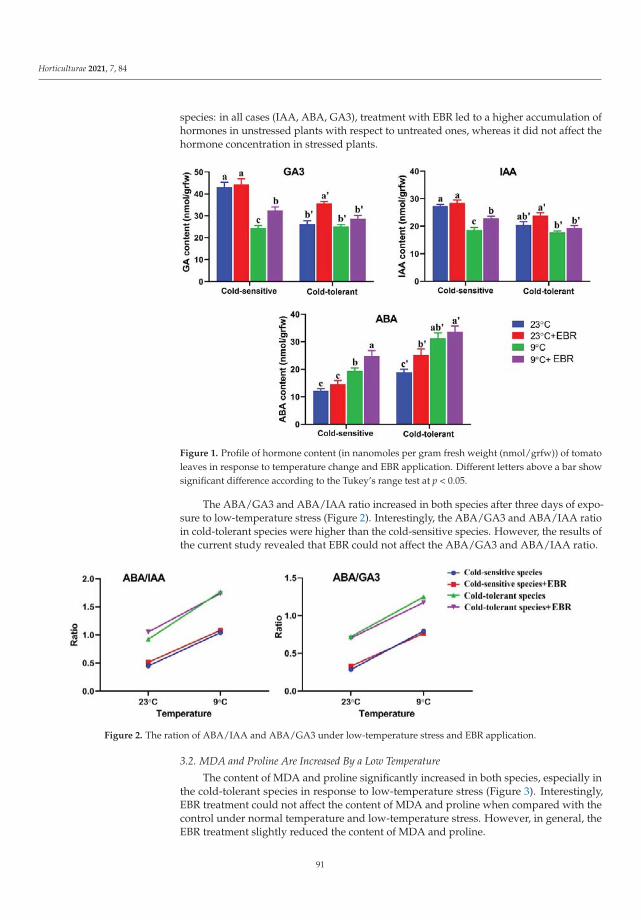
Horticulturae 2021, 7, 84
species: in all cases (IAA, ABA, GA3), treatment with EBR led to a higher accumulation ofhormones in unstressed plants with respect to untreated ones, whereas it did not affect thehormone concentration in stressed plants.
Figure 1. Profile of hormone content (in nanomoles per gram fresh weight (nmol/grfw)) of tomatoleaves in response to temperature change and EBR application. Different letters above a bar showsignificant difference according to the Tukey’s range test at p < 0.05.
The ABA/GA3 and ABA/IAA ratio increased in both species after three days of expo-sure to low-temperature stress (Figure 2). Interestingly, the ABA/GA3 and ABA/IAA ratioin cold-tolerant species were higher than the cold-sensitive species. However, the results ofthe current study revealed that EBR could not affect the ABA/GA3 and ABA/IAA ratio.
Figure 2. The ration of ABA/IAA and ABA/GA3 under low-temperature stress and EBR application.
3.2. MDA and Proline Are Increased By a Low Temperature
The content of MDA and proline significantly increased in both species, especially inthe cold-tolerant species in response to low-temperature stress (Figure 3). Interestingly,EBR treatment could not affect the content of MDA and proline when compared with thecontrol under normal temperature and low-temperature stress. However, in general, theEBR treatment slightly reduced the content of MDA and proline.
91
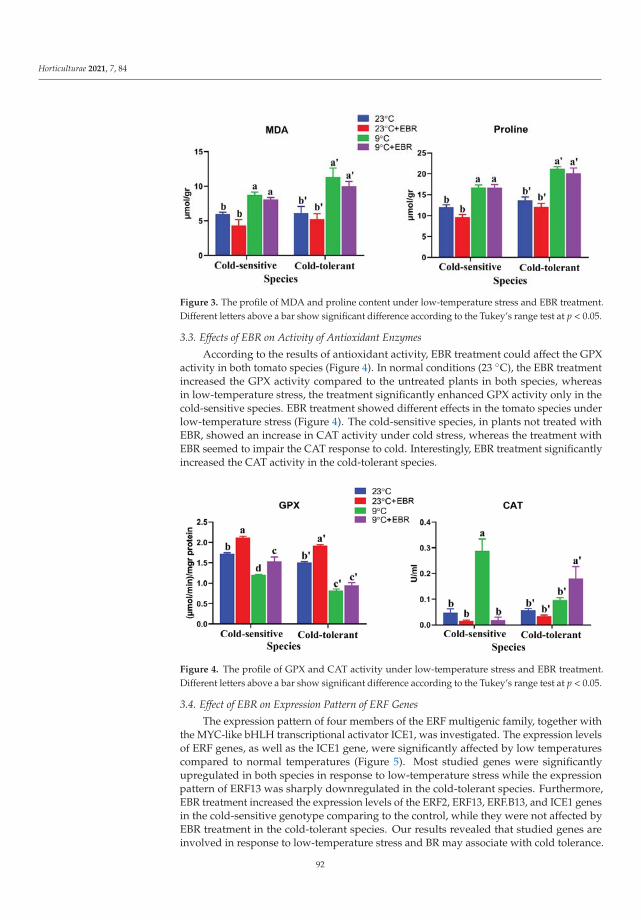
Horticulturae 2021, 7, 84
Figure 3. The profile of MDA and proline content under low-temperature stress and EBR treatment.Different letters above a bar show significant difference according to the Tukey’s range test at p < 0.05.
3.3. Effects of EBR on Activity of Antioxidant Enzymes
According to the results of antioxidant activity, EBR treatment could affect the GPXactivity in both tomato species (Figure 4). In normal conditions (23 ◦C), the EBR treatmentincreased the GPX activity compared to the untreated plants in both species, whereasin low-temperature stress, the treatment significantly enhanced GPX activity only in thecold-sensitive species. EBR treatment showed different effects in the tomato species underlow-temperature stress (Figure 4). The cold-sensitive species, in plants not treated withEBR, showed an increase in CAT activity under cold stress, whereas the treatment withEBR seemed to impair the CAT response to cold. Interestingly, EBR treatment significantlyincreased the CAT activity in the cold-tolerant species.
Figure 4. The profile of GPX and CAT activity under low-temperature stress and EBR treatment.Different letters above a bar show significant difference according to the Tukey’s range test at p < 0.05.
3.4. Effect of EBR on Expression Pattern of ERF Genes
The expression pattern of four members of the ERF multigenic family, together withthe MYC-like bHLH transcriptional activator ICE1, was investigated. The expression levelsof ERF genes, as well as the ICE1 gene, were significantly affected by low temperaturescompared to normal temperatures (Figure 5). Most studied genes were significantlyupregulated in both species in response to low-temperature stress while the expressionpattern of ERF13 was sharply downregulated in the cold-tolerant species. Furthermore,EBR treatment increased the expression levels of the ERF2, ERF13, ERF.B13, and ICE1 genesin the cold-sensitive genotype comparing to the control, while they were not affected byEBR treatment in the cold-tolerant species. Our results revealed that studied genes areinvolved in response to low-temperature stress and BR may associate with cold tolerance.
92

Horticulturae 2021, 7, 84
Figure 5. Expression patterns of studied genes under a low temperature (CS) and EBR treatment application; * and ** abovea bar shows a significant difference between the applied treatments and normal temperature treatments as control (C) atp-value < 0.05 and p-value < 0.01, respectively (according to Student’s t-test).
4. Discussion
4.1. EBR Improves Cold Tolerance by Affecting ABA Content
Various interactions between plant hormones induce a heterogeneous network ofplant responses that make it challenging to predict plant performance in response toadverse conditions [44,45]. Moreover, BR can regulate stress responses by cross-talkingwith other phytohormones [33,46]. In this study, the synergetic interaction was observedbetween BR and ABA in response to low-temperature stress, where endogenous ABAcontent significantly increased in the cold-sensitive species under low-temperature stressand EBR treatment. However, the ABA/GA3 and ABA/IAA ratios were not influencedby EBR application. Abscisic acid (ABA) is known as a stress hormone that is influencedby stress and raises plant durability during abiotic stresses, such as drought and coldstress [47]. Moreover, ABA can decrease the damage of dehydration by closing the stomatalpore and maintaining the cellular water [48,49]. However, several antagonistic effectshave been observed between signaling components of BRs and ABA under different stressconditions [47,50]. One well-known case of crosstalk occurs at the GSK3-like kinase BIN2(BRASSINOSTEROID-INSENSITIVE 2), which inhibits the signaling components of the BRpathway, but can be activated by ABA [51]. Moreover, it was stated that ABA negativelycontrols the BR signaling pathway via phosphorylation of BES1 (bri1-EMS-SUPPRESSOR 1)as a BR signaling positive regulator [52]. Furthermore, Divi et al. found that BR effects aremasked by ABA in Arabidopsis responses to heat stress, and only in the ABA-deficient aba1-1mutant, BR application could make the positive effect [53]. On the other hand, Bajguzstated that BR can enhance the ABA content in Chlorella vulgaris under stress conditions [54].Overall, it seems that the interaction between ABA and BR plays important role in increas-ing stress tolerance through controlling the synthesizing antioxidants, photosynthesis,and expression of stress response genes [55]. Our results indicated that application of BRis involved in low-temperature stress tolerance by directly/indirectly affecting the ABAcontent of the tomato species.
4.2. EBR Application Affects the Auxin and GA Content under Low-Temperature Stress
The synergetic interactions are stated between BR and auxin in regulating the cel-lular processes related to growth, such as cell proliferation and cell expansion [53,56,57].Furthermore, it was defined that BR and GA are involved in several common cellular
93
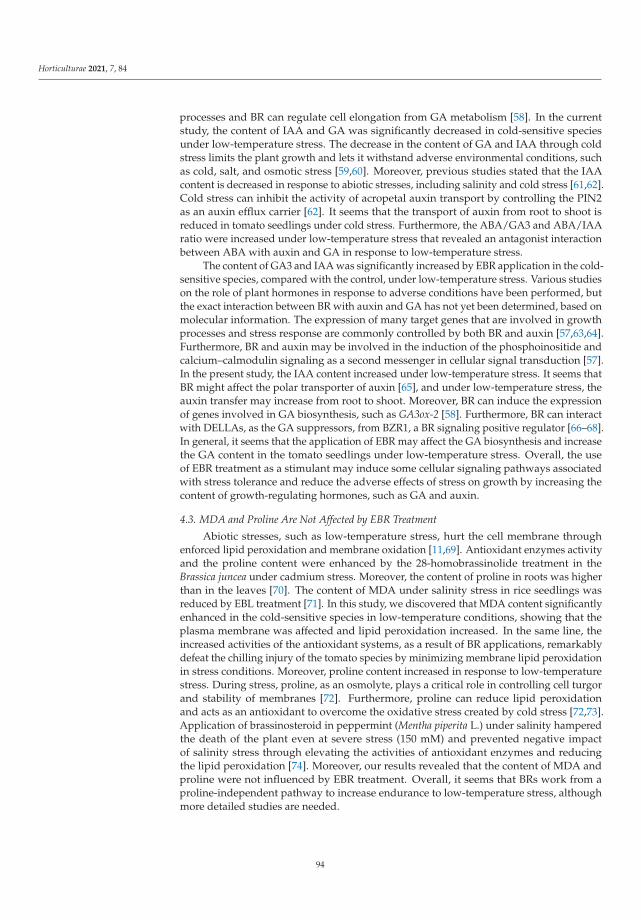
Horticulturae 2021, 7, 84
processes and BR can regulate cell elongation from GA metabolism [58]. In the currentstudy, the content of IAA and GA was significantly decreased in cold-sensitive speciesunder low-temperature stress. The decrease in the content of GA and IAA through coldstress limits the plant growth and lets it withstand adverse environmental conditions, suchas cold, salt, and osmotic stress [59,60]. Moreover, previous studies stated that the IAAcontent is decreased in response to abiotic stresses, including salinity and cold stress [61,62].Cold stress can inhibit the activity of acropetal auxin transport by controlling the PIN2as an auxin efflux carrier [62]. It seems that the transport of auxin from root to shoot isreduced in tomato seedlings under cold stress. Furthermore, the ABA/GA3 and ABA/IAAratio were increased under low-temperature stress that revealed an antagonist interactionbetween ABA with auxin and GA in response to low-temperature stress.
The content of GA3 and IAA was significantly increased by EBR application in the cold-sensitive species, compared with the control, under low-temperature stress. Various studieson the role of plant hormones in response to adverse conditions have been performed, butthe exact interaction between BR with auxin and GA has not yet been determined, based onmolecular information. The expression of many target genes that are involved in growthprocesses and stress response are commonly controlled by both BR and auxin [57,63,64].Furthermore, BR and auxin may be involved in the induction of the phosphoinositide andcalcium–calmodulin signaling as a second messenger in cellular signal transduction [57].In the present study, the IAA content increased under low-temperature stress. It seems thatBR might affect the polar transporter of auxin [65], and under low-temperature stress, theauxin transfer may increase from root to shoot. Moreover, BR can induce the expressionof genes involved in GA biosynthesis, such as GA3ox-2 [58]. Furthermore, BR can interactwith DELLAs, as the GA suppressors, from BZR1, a BR signaling positive regulator [66–68].In general, it seems that the application of EBR may affect the GA biosynthesis and increasethe GA content in the tomato seedlings under low-temperature stress. Overall, the useof EBR treatment as a stimulant may induce some cellular signaling pathways associatedwith stress tolerance and reduce the adverse effects of stress on growth by increasing thecontent of growth-regulating hormones, such as GA and auxin.
4.3. MDA and Proline Are Not Affected by EBR Treatment
Abiotic stresses, such as low-temperature stress, hurt the cell membrane throughenforced lipid peroxidation and membrane oxidation [11,69]. Antioxidant enzymes activityand the proline content were enhanced by the 28-homobrassinolide treatment in theBrassica juncea under cadmium stress. Moreover, the content of proline in roots was higherthan in the leaves [70]. The content of MDA under salinity stress in rice seedlings wasreduced by EBL treatment [71]. In this study, we discovered that MDA content significantlyenhanced in the cold-sensitive species in low-temperature conditions, showing that theplasma membrane was affected and lipid peroxidation increased. In the same line, theincreased activities of the antioxidant systems, as a result of BR applications, remarkablydefeat the chilling injury of the tomato species by minimizing membrane lipid peroxidationin stress conditions. Moreover, proline content increased in response to low-temperaturestress. During stress, proline, as an osmolyte, plays a critical role in controlling cell turgorand stability of membranes [72]. Furthermore, proline can reduce lipid peroxidationand acts as an antioxidant to overcome the oxidative stress created by cold stress [72,73].Application of brassinosteroid in peppermint (Mentha piperita L.) under salinity hamperedthe death of the plant even at severe stress (150 mM) and prevented negative impactof salinity stress through elevating the activities of antioxidant enzymes and reducingthe lipid peroxidation [74]. Moreover, our results revealed that the content of MDA andproline were not influenced by EBR treatment. Overall, it seems that BRs work from aproline-independent pathway to increase endurance to low-temperature stress, althoughmore detailed studies are needed.
94
Horticulturae 2021, 7, 84
4.4. Effects of EBR on Activity of Antioxidant Enzymes
To enhance uncontrolled free radicals, plants respond by non-enzymatic and enzy-matic antioxidants to regulate cellular homeostasis and mitigate oxidants [75,76]. Moreover,maintenance and regulation of redox homeostasis seem to be crucial to elevate chillingtolerance in tomato plants [77,78]. Thus, adjustment of the antioxidant system is remarkedas a significant mechanism for increasing tomato chilling tolerance. It was demonstratedthat using BRs induces antioxidant enzyme activity as well as non-enzymatic antioxidants.For instance, maize seedlings treated by brassinolide (BL) increased the activities of SOD,CAT, APX, carotenoid content, and ascorbic acid [10]. Antioxidative enzymes activityand mRNA expression of Cat A, Mn-SOD, Cat B, Cu/Zn-SOD, GR, and APX remarkablyenhanced with EBL treatment under heavy metal stress in Oryza sativa L. [79]. In thepresent study, the effect of EBR application on the antioxidant activity, CAT, and GPX, inthe tomato species, was different under low-temperature stress. Different behaviors of CATwere observed in both cold sensitive and cold tolerant species, or, in other words, the coldstress led to an increase in CAT activity in both species. However, the enhancement wasmuch higher in cold sensitive compared to the cold tolerant species (Figure 4). There weresubstantial differences based on the genotype considered in BR treated plants; the CAT ac-tivity in the cold-tolerant species was increased by EBR treatment compared with untreatedplants under low-temperature stress. In fact, cold tolerant plants treated with EBR showedan increase in CAT activity, which was higher than untreated plants. In cold sensitivegenotypes the EBR treatment seem to impair the CAT activity, whereas in cold-sensitivespecies, the GPX activity was more influenced by EBR application (Figure 4). It seems thatthe effect of BR on the activity of antioxidant enzymes depends on the plant species, likelydepending on the amount of stress received, the tomato species uses different mechanismsto reduce the induced oxidants. Previous studies on the effect of BR on elevated tolerance ofresistant and susceptible tomato species in low temperatures indicated that EBR treatmentenhanced the activities of the enzymes in pepper [80], cucumber [81], and eggplant [82] inlow temperatures. It seems that oxidative stress is induced by low-temperature stress in thetomato species. Antioxidant enzymes, CAT, and GPX are induced to reduce the oxidantsand keep cellular redox. From these results, it could be concluded that BR treatment couldplay a significant role in the alleviation of ROS damage by increasing antioxidant thedefense system, resulting in elevating the tolerance of the tomato species to chilling stress.
4.5. Effects of Low-Temperature Stress on Cold-Related Genes
Ethylene responsive factor (ERF) genes belong to the AP2/ERF gene family, known as alarge gene family of transcription factors [83,84]. The ERF gene family, as a key regulator,plays an important role in response to adverse conditions, such as cold stress in plantspecies [85,86]. In this study, the expression level of cold-responsive genes, ERF genes,and ICE1, selected based on previous studies [41,42], was significantly induced by low-temperature stress. ICE1 as an upstream transcription factor can regulate cold-responsivegenes, such as CBF genes [42]. Interestingly under EBR application in a cold-tolerant species,expression patterns of ERF genes and ICE1 reversed to normal temperature conditions.However, Kagale et al. indicated that the EBL application could induce the expression ofcold-related genes [87]. Extensive studies were performed on the role of AP2/ERF genefamily in response to abiotic and biotic stresses as well as hormone treatments, but theeffect of BR on this gene family has not yet been investigated. Recently, Xie et al. statedthat TINY, an AP2/ERF transcription factor, may negatively affect the expression of BR-responsive genes while it positively controls drought-responsive genes in Arabidopsis [88].In addition, previously, it has been revealed that EBR treatment increases the basic thermo-tolerance of Brassica napus [89]. The merit of EBR to grant tolerance in plants to differentstresses was corroborated via expression analysis of a subset of cold and drought stressmarker genes [87]. Brassinosteroid induced auxin-related genes and cell wall-modifying insoybeans, contrarily, transcriptome analysis demonstrated the twisted BR roles in variousbiological processes by suppressing some WRKY genes engaged in senescence and stress
95

Horticulturae 2021, 7, 84
responses [90]. Overall, our results disclosed that exogenous EBR application might interactwith endogenous hormones and reduce the negative effects of low temperatures that inducethe expression of cold-responsive genes, ERFs and ICE1, to return to a state similar to thatwithout stress.
5. Conclusions
In the current study, the effect of the EBR application was investigated in two tomatospecies under low-temperature stress. The results depicted that low-temperature stresscan create oxidative stress and reduce the content of growth-regulatory hormones, IAAand GA3. Moreover, the EBR application increased the content of endogenous ABA, and asynergetic interaction was observed between BR and ABA in response to low-temperaturestress. Furthermore, our findings indicated that ABA/GA3 and ABA/IAA ratios are notaffected by EBR treatment. In the current study, we found that EBR treatment could notaffect the content of MDA and proline under low-temperature stress, but could increasethe content of antioxidant enzymes to reduce ROS induced by low-temperature stress.Overall, we concluded that EBR diminishes the adverse effect of low-temperature stress byincreasing the content of endogenous phytohormones, increasing the content of antioxidantenzymes, and controlling the gene expression. Furthermore, it seems that BR effects aredependent on the tomato species.
Author Contributions: P.H., M.E. and A.E. designed the study. P.H. and M.E. conducted the exper-iments and analyzed the data. P.H. and M.A. investigated. All authors contributed to writing themanuscript. A.V., F.P. and G.B. contributed to the interpretation, presentation, and discussion ofthe data. All authors contributed to writing and editing the manuscript. All authors have read andagreed to the published version of the manuscript.
Funding: This research received no external funding.
Institutional Review Board Statement: Not applicable.
Informed Consent Statement: Not applicable.
Data Availability Statement: All datasets generated or analyzed during this study are included inthe manuscript.
Conflicts of Interest: The authors declare no conflict of interest.
References
1. Ahammed, G.J.; Xia, X.-J.; Li, X.; Shi, K.; Yu, J.-Q.; Zhou, Y.-H. Role of brassinosteroid in plant adaptation to abiotic stresses andits interplay with other hormones. Curr. Protein Pept. Sci. 2015, 16, 462–473. [CrossRef]
2. Heidari, P. Comparative analysis of C-repeat binding factors (CBFs) in tomato and arabidopsis. Braz. Arch. Biol. Technol. 2019,62. [CrossRef]
3. Jiang, Y.; Huang, L.; Cheng, F.; Zhou, Y.; Xia, X.; Mao, W.; Shi, K.; Yu, J. Brassinosteroids accelerate recovery of photosyntheticapparatus from cold stress by balancing the electron partitioning, carboxylation and redox homeostasis in cucumber. Physiol.Plant 2013, 148, 133–145. [CrossRef]
4. Fariduddin, Q.; Yusuf, M.; Ahmad, I.; Ahmad, A. Brassinosteroids and their role in response of plants to abiotic stresses. Biol.Plant 2014, 58, 9–17. [CrossRef]
5. Ahammed, G.J.; Li, X.; Liu, A.; Chen, S. Brassinosteroids in Plant Tolerance to Abiotic Stress. J. Plant Growth Regul. 2020,1–14. [CrossRef]
6. Faraji, S.; Ahmadizadeh, M.; Heidari, P. Genome-wide comparative analysis of Mg transporter gene family between Triticumturgidum and Camelina sativa. BioMetals 2021, 4, 1–22.
7. Chen, Z.-Y.; Wang, Y.-T.; Pan, X.-B.; Xi, Z.-M. Amelioration of cold-induced oxidative stress by exogenous 24-epibrassinolidetreatment in grapevine seedlings: Toward regulating the ascorbate–glutathione cycle. Sci. Hortic. 2019, 244, 379–387. [CrossRef]
8. Khan, T.A.; Yusuf, M.; Ahmad, A.; Bashir, Z.; Saeed, T.; Fariduddin, Q.; Hayat, S.; Mock, H.-P.; Wu, T. Proteomic and physiologicalassessment of stress sensitive and tolerant variety of tomato treated with brassinosteroids and hydrogen peroxide underlow-temperature stress. Food Chem. 2019, 289, 500–511. [CrossRef] [PubMed]
9. Bajguz, A.; Hayat, S. Effects of brassinosteroids on the plant responses to environmental stresses. Plant Physiol. Biochem. 2009, 47,1–8. [CrossRef]
10. Sun, Y.; He, Y.; Irfan, A.R.; Liu, X.; Yu, Q.; Zhang, Q.; Yang, D. Exogenous Brassinolide Enhances the Growth and Cold Resistanceof Maize (Zea mays L.) Seedlings under Chilling Stress. Agronomy 2020, 10, 488. [CrossRef]
96
Horticulturae 2021, 7, 84
11. Huang, X.; Chen, M.-H.; Yang, L.-T.; Li, Y.-R.; Wu, J.-M. Effects of exogenous abscisic acid on cell membrane and endogenoushormone contents in leaves of sugarcane seedlings under cold stress. Sugar Tech. 2015, 17, 59–64. [CrossRef]
12. Wang, F.; Ahammed, G.J.; Li, G.; Bai, P.; Jiang, Y.; Wang, S.; Chen, S. Ethylene is involved in red light-induced anthocyaninbiosynthesis in cabbage (Brassica oleracea). Int. J. Agric. Biol. 2019, 21, 955–963.
13. Wang, Y.-T.; Chen, Z.-Y.; Jiang, Y.; Duan, B.-B.; Xi, Z.-M. Involvement of ABA and antioxidant system in brassinosteroid-inducedwater stress tolerance of grapevine (Vitis vinifera L.). Sci. Hortic. 2019, 256, 108596. [CrossRef]
14. Ahmadizadeh, M.; Chen, J.-T.; Hasanzadeh, S.; Ahmar, S.; Heidari, P. Insights into the genes involved in the ethylene biosynthesispathway in Arabidopsis thaliana and Oryza sativa. J. Genet. Eng. Biotechnol. 2020, 18, 1–20. [CrossRef]
15. Rezaee, S.; Ahmadizadeh, M.; Heidari, P. Genome-wide characterization, expression profiling, and post- transcriptional study ofGASA gene family. Gene Rep. 2020, 20, 100795. [CrossRef]
16. Heidari, P.; Mazloomi, F.; Nussbaumer, T.; Barcaccia, G. Insights into the SAM synthetase gene family and its roles in tomatoseedlings under abiotic stresses and hormone treatments. Plants 2020, 9, 586. [CrossRef]
17. Ogweno, J.O.; Song, X.S.; Shi, K.; Hu, W.H.; Mao, W.H.; Zhou, Y.H.; Yu, J.Q.; Nogués, S. Brassinosteroids alleviate heat-induced inhibition of photosynthesis by increasing carboxylation efficiency and enhancing antioxidant systems in Lycopersiconesculentum. J. Plant Growth Regul. 2008, 27, 49–57. [CrossRef]
18. Hayat, S.; Hasan, S.A.; Yusuf, M.; Hayat, Q.; Ahmad, A. Effect of 28-homobrassinolide on photosynthesis, fluorescence andantioxidant system in the presence or absence of salinity and temperature in Vigna radiata. Environ. Exp. Bot. 2010, 69,105–112. [CrossRef]
19. Yu, J.Q.; Huang, L.F.; Hu, W.H.; Zhou, Y.H.; Mao, W.H.; Ye, S.F.; Nogués, S. A role for brassinosteroids in the regulation ofphotosynthesis in Cucumis sativus. J. Exp. Bot. 2004, 55, 1135–1143. [CrossRef]
20. Yuan, L.; Yuan, Y.; Du, J.; Sun, J.; Guo, S. Effects of 24-epibrassinolide on nitrogen metabolism in cucumber seedlings under Ca(NO3) 2 stress. Plant Physiol. Biochem. 2012, 61, 29–35. [CrossRef]
21. Yusuf, M.; Fariduddin, Q.; Ahmad, I.; Ahmad, A. Brassinosteroid-mediated evaluation of antioxidant system and nitrogenmetabolism in two contrasting cultivars of Vigna radiata under different levels of nickel. Physiol. Mol. Biol. Plants 2014, 20,449–460. [CrossRef]
22. Yuan, G.-F.; Jia, C.-G.; Li, Z.; Sun, B.; Zhang, L.-P.; Liu, N.; Wang, Q.-M. Effect of brassinosteroids on drought resistance andabscisic acid concentration in tomato under water stress. Sci. Hortic. 2010, 126, 103–108. [CrossRef]
23. Yusuf, M.; Fariduddin, Q.; Ahmad, A. 24-Epibrassinolide modulates growth, nodulation, antioxidant system, and osmolyte intolerant and sensitive varieties of Vigna radiata under different levels of nickel: A shotgun approach. Plant Physiol. Biochem. 2012,57, 143–153. [CrossRef] [PubMed]
24. Ahanger, M.A.; Ashraf, M.; Bajguz, A.; Ahmad, P. Brassinosteroids regulate growth in plants under stressful environments andcrosstalk with other potential phytohormones. J. Plant Growth Regul. 2018, 37, 1007–1024. [CrossRef]
25. Choudhary, S.P.; Yu, J.-Q.; Yamaguchi-Shinozaki, K.; Shinozaki, K.; Tran, L.-S.P. Benefits of brassinosteroid crosstalk. Trends PlantSci. 2012, 17, 594–605. [CrossRef]
26. Heidari, P.; Ahmadizadeh, M.; Izanlo, F.; Nussbaumer, T. In silico study of the CESA and CSL gene family in Arabidopsis thalianaand Oryza sativa: Focus on post-translation modifications. Plant Gene 2019, 19, 100189. [CrossRef]
27. Zhao, M.; Yuan, L.; Wang, J.; Xie, S.; Zheng, Y.; Nie, L.; Zhu, S.; Hou, J.; Chen, G.; Wang, C. Transcriptome analysis reveals apositive effect of brassinosteroids on the photosynthetic capacity of wucai under low temperature. BMC Genom. 2019, 20, 1–19.[CrossRef] [PubMed]
28. Fang, P.; Yan, M.; Chi, C.; Wang, M.; Zhou, Y.; Zhou, J.; Shi, K.; Xia, X.; Foyer, C.H.; Yu, J. Brassinosteroids act as a positiveregulator of photoprotection in response to chilling stress. Plant Physiol. 2019, 180, 2061–2076. [CrossRef]
29. Deng, X.-G.; Zhu, T.; Zhang, D.-W.; Lin, H.-H. The alternative respiratory pathway is involved in brassinosteroid-inducedenvironmental stress tolerance in Nicotiana benthamiana. J. Exp. Bot. 2015, 66, 6219–6232. [CrossRef]
30. Xi, Z.; Wang, Z.; Fang, Y.; Hu, Z.; Hu, Y.; Deng, M.; Zhang, Z. Effects of 24-epibrassinolide on antioxidation defense andosmoregulation systems of young grapevines (V. vinifera L.) under chilling stress. Plant Growth Regul. 2013, 71, 57–65. [CrossRef]
31. Xia, X.; Fang, P.; Guo, X.; Qian, X.; Zhou, J.; Shi, K.; Zhou, Y.; Yu, J. Brassinosteroid-mediated apoplastic H2O2-glutaredoxin 12/14cascade regulates antioxidant capacity in response to chilling in tomato. Plant Cell Environ. 2018, 41, 1052–1064. [CrossRef]
32. Cui, J.; Zhou, Y.; Ding, J.; Xia, X.; Shi, K.A.I.; Chen, S.; Asami, T.; Chen, Z.; Yu, J. Role of nitric oxide in hydrogen peroxide-dependent induction of abiotic stress tolerance by brassinosteroids in cucumber. Plant Cell Environ. 2011, 34, 347–358. [CrossRef]
33. Ahmad, F.; Singh, A.; Kamal, A. Crosstalk of brassinosteroids with other phytohormones under various abiotic stresses. J. Appl.Biol. Biotech. 2018, 6, 56–62.
34. Ntatsi, G.; Savvas, D.; Ntatsi, G.; Kläring, H.P.; Schwarz, D. Growth, yield, and metabolic responses of temperature-stressedtomato to grafting onto rootstocks differing in cold tolerance. J. Am. Soc. Hortic. Sci. 2014, 139, 230–243. [CrossRef]
35. Tang, Y.; Wang, L.; Ma, C.; Liu, J.; Liu, B.; Li, H. The use of HPLC in determination of endogenous hormones in anthers of bittermelon. J. Life Sci. 2011, 5, 139–142.
36. Li, X.-J.; Yang, M.-F.; Chen, H.; Qu, L.-Q.; Chen, F.; Shen, S.-H. Abscisic acid pretreatment enhances salt tolerance of rice seedlings:Proteomic evidence. Biochim. Biophys. Acta (BBA) Proteins Proteom. 2010, 1804, 929–940. [CrossRef] [PubMed]
37. Campos, P.S.; nia Quartin, V.; chicho Ramalho, J.; Nunes, M.A. Electrolyte leakage and lipid degradation account for coldsensitivity in leaves ofCoffea sp. plants. J. Plant Physiol. 2003, 160, 283–292. [CrossRef] [PubMed]
97

Horticulturae 2021, 7, 84
38. Zhang, Z.; Huang, R. Analysis of malondialdehyde, chlorophyll proline, soluble sugar, and glutathione content in Arabidopsisseedling. Bio-Protocol 2013, 3, e817. [CrossRef]
39. Mittova, V.; Volokita, M.; Guy, M.; Tal, M. Activities of SOD and the ascorbate-glutathione cycle enzymes in subcellularcompartments in leaves and roots of the cultivated tomato and its wild salt-tolerant relative Lycopersicon pennellii. Physiol. Plant2000, 110, 42–51. [CrossRef]
40. Aebi, H. [13] Catalase in vitro. In Methods in Enzymology; Elsevier: Amsterdam, The Netherlands, 1984; Volume105, pp. 121–126.ISBN 0076-6879.
41. Sharma, M.K.; Kumar, R.; Solanke, A.U.; Sharma, R.; Tyagi, A.K.; Sharma, A.K. Identification, phylogeny, and transcript profiling ofERF family genes during development and abiotic stress treatments in tomato. Mol. Genet. Genom. 2010, 284, 455–475. [CrossRef]
42. Chinnusamy, V.; Ohta, M.; Kanrar, S.; Lee, B.; Hong, X.; Agarwal, M.; Zhu, J.-K. ICE1: A regulator of cold-induced transcriptomeand freezing tolerance in Arabidopsis. Genes Dev. 2003, 17, 1043–1054. [CrossRef] [PubMed]
43. Livak, K.J.; Schmittgen, T.D. Analysis of relative gene expression data using real-time quantitative PCR and the 2−ΔΔCT method.methods 2001, 25, 402–408. [CrossRef] [PubMed]
44. Peleg, Z.; Blumwald, E. Hormone balance and abiotic stress tolerance in crop plants. Curr. Opin. Plant Biol. 2011, 14,290–295. [CrossRef]
45. Eremina, M.; Rozhon, W.; Poppenberger, B. Hormonal control of cold stress responses in plants. Cell Mol. Life Sci. 2016, 73,797–810. [CrossRef] [PubMed]
46. Krishna, P. Brassinosteroid-mediated stress responses. J. Plant Growth Regul. 2003, 22, 289–297. [CrossRef] [PubMed]47. Kuromori, T.; Seo, M.; Shinozaki, K. ABA transport and plant water stress responses. Trends Plant Sci. 2018, 23, 513–522. [CrossRef]48. Xue-Xuan, X.; Hong-Bo, S.; Yuan-Yuan, M.; Gang, X.; Jun-Na, S.; Dong-Gang, G.; Cheng-Jiang, R. Biotechnological implications
from abscisic acid (ABA) roles in cold stress and leaf senescence as an important signal for improving plant sustainable survivalunder abiotic-stressed conditions. Crit. Rev. Biotechnol. 2010, 30, 222–230. [CrossRef]
49. Ku, Y.-S.; Sintaha, M.; Cheung, M.-Y.; Lam, H.-M. Plant hormone signaling crosstalks between biotic and abiotic stress responses.Int. J. Mol. Sci. 2018, 19, 3206. [CrossRef]
50. Hu, Y.; Yu, D. BRASSINOSTEROID INSENSITIVE2 interacts with ABSCISIC ACID INSENSITIVE5 to mediate the antagonism ofbrassinosteroids to abscisic acid during seed germination in Arabidopsis. Plant Cell 2014, 26, 4394–4408. [CrossRef]
51. An, B.; Wang, Q.; Zhang, X.; Zhang, B.; Luo, H.; He, C. Comprehensive transcriptional and functional analyses of HbGASA genesreveal their roles in fungal pathogen resistance in Hevea brasiliensis. Tree Genet. Genomes 2018, 14, 41. [CrossRef]
52. Zhang, S.; Cai, Z.; Wang, X. The primary signaling outputs of brassinosteroids are regulated by abscisic acid signaling. Proc. Natl.Acad. Sci. USA 2009, 106, 4543–4548. [CrossRef]
53. Divi, U.K.; Rahman, T.; Krishna, P. Brassinosteroid-mediated stress tolerance in Arabidopsis shows interactions with abscisic acid,ethylene and salicylic acid pathways. BMC Plant Biol. 2010, 10, 151. [CrossRef]
54. Bajguz, A. Brassinosteroid enhanced the level of abscisic acid in Chlorella vulgaris subjected to short-term heat stress. J. PlantPhysiol. 2009, 166, 882–886. [CrossRef] [PubMed]
55. Tanveer, M.; Shahzad, B.; Sharma, A.; Khan, E.A. 24-Epibrassinolide application in plants: An implication for improving droughtstress tolerance in plants. Plant Physiol. Biochem. 2019, 135, 295–303. [CrossRef] [PubMed]
56. Anwar, A.; Liu, Y.; Dong, R.; Bai, L.; Yu, X.; Li, Y. The physiological and molecular mechanism of brassinosteroid in response tostress: A review. Biol. Res. 2018, 51, 46. [CrossRef] [PubMed]
57. Hardtke, C.S.; Dorcey, E.; Osmont, K.S.; Sibout, R. Phytohormone collaboration: Zooming in on auxin–brassinosteroid interactions.Trends Cell Biol. 2007, 17, 485–492. [CrossRef]
58. Tong, H.; Xiao, Y.; Liu, D.; Gao, S.; Liu, L.; Yin, Y.; Jin, Y.; Qian, Q.; Chu, C. Brassinosteroid regulates cell elongation by modulatinggibberellin metabolism in rice. Plant Cell 2014, 26, 4376–4393. [CrossRef]
59. Kurepin, L.V.; Dahal, K.P.; Savitch, L.V.; Singh, J.; Bode, R.; Ivanov, A.G.; Hurry, V.; Huener, N. Role of CBFs as integra-tors of chloroplast redox, phytochrome and plant hormone signaling during cold acclimation. Int. J. Mol. Sci. 2013, 14,12729–12763. [CrossRef]
60. Colebrook, E.H.; Thomas, S.G.; Phillips, A.L.; Hedden, P. The role of gibberellin signalling in plant responses to abiotic stress. J.Exp. Biol. 2014, 217, 67–75. [CrossRef]
61. Albacete, A.; Ghanem, M.E.; Martínez-Andújar, C.; Acosta, M.; Sánchez-Bravo, J.; Martínez, V.; Lutts, S.; Dodd, I.C.;Pérez-Alfocea, F. Hormonal changes in relation to biomass partitioning and shoot growth impairment in salinized tomato(Solanum lycopersicum L.) plants. J. Exp. Bot. 2008, 59, 4119–4131. [CrossRef]
62. Shibasaki, K.; Uemura, M.; Tsurumi, S.; Rahman, A. Auxin response in Arabidopsis under cold stress: Underlying molecularmechanisms. Plant Cell 2009, 21, 3823–3838. [CrossRef]
63. Sun, L.; Feraru, E.; Feraru, M.I.; Waidmann, S.; Wang, W.; Passaia, G.; Wang, Z.-Y.; Wabnik, K.; Kleine-Vehn, J. PIN-LIKEScoordinate brassinosteroid signaling with nuclear auxin input in Arabidopsis thaliana. Curr. Biol. 2020, 30, 1579–1588. [CrossRef]
64. Goda, H.; Sawa, S.; Asami, T.; Fujioka, S.; Shimada, Y.; Yoshida, S. Comprehensive comparison of auxin-regulated andbrassinosteroid-regulated genes in Arabidopsis. Plant Physiol. 2004, 134, 1555–1573. [CrossRef] [PubMed]
65. KIM, T.; Lee, S.M.; JOO, S.; Yun, H.S.; Lee, Y.E.W.; Kaufman, P.B.; Kirakosyan, A.R.A.; KIM, S.; Nam, K.H.; Lee, J.S. Elongationand gravitropic responses of Arabidopsis roots are regulated by brassinolide and IAA. Plant Cell Environ. 2007, 30, 679–689.[CrossRef] [PubMed]
98
Horticulturae 2021, 7, 84
66. Bai, M.-Y.; Shang, J.-X.; Oh, E.; Fan, M.; Bai, Y.; Zentella, R.; Sun, T.; Wang, Z.-Y. Brassinosteroid, gibberellin and phytochromeimpinge on a common transcription module in Arabidopsis. Nat. Cell Biol. 2012, 14, 810–817. [CrossRef]
67. Gallego-Bartolomé, J.; Minguet, E.G.; Grau-Enguix, F.; Abbas, M.; Locascio, A.; Thomas, S.G.; Alabadí, D.; Blázquez, M.A.Molecular mechanism for the interaction between gibberellin and brassinosteroid signaling pathways in Arabidopsis. Proc. Natl.Acad. Sci. USA 2012, 109, 13446–13451. [CrossRef] [PubMed]
68. Li, Q.-F.; Wang, C.; Jiang, L.; Li, S.; Sun, S.S.M.; He, J.-X. An interaction between BZR1 and DELLAs mediates direct signalingcrosstalk between brassinosteroids and gibberellins in Arabidopsis. Sci. Signal. 2012, 5, ra72. [CrossRef]
69. Iseri, Ö.D.; Körpe, D.A.; Sahin, F.I.; Haberal, M. Hydrogen peroxide pretreatment of roots enhanced oxidative stress response oftomato under cold stress. Acta Physiol. Plant 2013, 35, 1905–1913. [CrossRef]
70. Hayat, S.; Ali, B.; Hasan, S.A.; Ahmad, A. Brassinosteroid enhanced the level of antioxidants under cadmium stress in Brassicajuncea. Environ. Exp. Bot. 2007, 60, 33–41. [CrossRef]
71. Sharma, I.; Ching, E.; Saini, S.; Bhardwaj, R.; Pati, P.K. Exogenous application of brassinosteroid offers tolerance to salinity byaltering stress responses in rice variety Pusa Basmati-1. Plant Physiol. Biochem. 2013, 69, 17–26. [CrossRef] [PubMed]
72. Hayat, S.; Hayat, Q.; Alyemeni, M.N.; Wani, A.S.; Pichtel, J.; Ahmad, A. Role of proline under changing environments: A review.Plant Signal. Behav. 2012, 7, 1456–1466. [CrossRef] [PubMed]
73. Posmyk, M.M.; Janas, K.M. Effects of seed hydropriming in presence of exogenous proline on chilling injury limitation in Vignaradiata L. seedlings. Acta Physiol. Plant 2007, 29, 509–517. [CrossRef]
74. Çoban, Ö.; Baydar, N.G. Brassinosteroid effects on some physical and biochemical properties and secondary metabolite accumu-lation in peppermint (Mentha piperita L.) under salt stress. Ind. Crops Prod. 2016, 86, 251–258. [CrossRef]
75. Öktem, H.A.; Eyidoðan, F.; Demirba, D.; Bayraç, A.T.; Öz, M.T.; Özgür, E.; Selçuk, F.; Yücel, M. Antioxidant responses of lentil tocold and drought stress. J. plant Biochem. Biotechnol. 2008, 17, 15–21. [CrossRef]
76. Kamran, M.; Parveen, A.; Ahmar, S.; Malik, Z.; Hussain, S.; Chattha, M.S.; Saleem, M.H.; Adil, M.; Heidari, P.; Chen, J.-T.An Overview of Hazardous Impacts of Soil Salinity in Crops, Tolerance Mechanisms, and Amelioration through SeleniumSupplementation. Int. J. Mol. Sci. 2020, 21, 148. [CrossRef]
77. Duan, M.; Feng, H.-L.; Wang, L.-Y.; Li, D.; Meng, Q.-W. Overexpression of thylakoidal ascorbate peroxidase shows enhancedresistance to chilling stress in tomato. J. Plant Physiol. 2012, 169, 867–877. [CrossRef] [PubMed]
78. Hu, Y.; Wu, Q.; Sprague, S.A.; Park, J.; Oh, M.; Rajashekar, C.B.; Koiwa, H.; Nakata, P.A.; Cheng, N.; Hirschi, K.D. Tomato express-ing Arabidopsis glutaredoxin gene AtGRXS17 confers tolerance to chilling stress via modulating cold responsive components.Hortic. Res. 2015, 2, 1–11. [CrossRef]
79. Sharma, P.; Kumar, A.; Bhardwaj, R. Plant steroidal hormone epibrassinolide regulate–Heavy metal stress tolerance in Oryzasativa L. by modulating antioxidant defense expression. Environ. Exp. Bot. 2016, 122, 1–9. [CrossRef]
80. Wang, Q.; Ding, T.; Gao, L.; Pang, J.; Yang, N. Effect of brassinolide on chilling injury of green bell pepper in storage. Sci. Hortic.2012, 144, 195–200. [CrossRef]
81. Hu, W.H.; Wu, Y.; Zeng, J.Z.; He, L.; Zeng, Q.M. Chill-induced inhibition of photosynthesis was alleviated by 24-epibrassinolidepretreatment in cucumber during chilling and subsequent recovery. Photosynthetica 2010, 48, 537–544. [CrossRef]
82. Wu, X.X.; He, J.; Zhu, Z.W.; Yang, S.J.; Zha, D.S. Protection of photosynthesis and antioxidative system by 24-epibrassinolide inSolanum melongena under cold stress. Biol. Plant 2014, 58, 185–188. [CrossRef]
83. Riechmann, J.L.; Heard, J.; Martin, G.; Reuber, L.; Jiang, C.-Z.; Keddie, J.; Adam, L.; Pineda, O.; Ratcliffe, O.J.; Samaha, R.R.Arabidopsis transcription factors: Genome-wide comparative analysis among eukaryotes. Science 2000, 290, 2105–2110. [CrossRef]
84. Faraji, S.; Filiz, E.; Kazemitabar, S.K.; Vannozzi, A.; Palumbo, F.; Barcaccia, G.; Heidari, P. The AP2/ERF Gene Family inTriticum durum: Genome-Wide Identification and Expression Analysis under Drought and Salinity Stresses. Genes 2020, 11, 1464.[CrossRef] [PubMed]
85. Nakano, T.; Suzuki, K.; Fujimura, T.; Shinshi, H. Genome-wide analysis of the ERF gene family in Arabidopsis and rice. PlantPhysiol. 2006, 140, 411–432. [CrossRef]
86. Ahmadizadeh, M.; Heidari, P. Bioinformatics study of transcription factors involved in cold stress. Biharean Biol. 2014, 8, 83–86.87. Kagale, S.; Divi, U.K.; Krochko, J.E.; Keller, W.A.; Krishna, P. Brassinosteroid confers tolerance in Arabidopsis thaliana and
Brassica napus to a range of abiotic stresses. Planta 2007, 225, 353–364. [CrossRef] [PubMed]88. Xie, Z.; Nolan, T.; Jiang, H.; Tang, B.; Zhang, M.; Li, Z.; Yin, Y. The AP2/ERF transcription factor TINY modulates brassinosteroid-
regulated plant growth and drought responses in Arabidopsis. Plant Cell 2019, 31, 1788–1806. [CrossRef] [PubMed]89. Dhaubhadel, S.; Chaudhary, S.; Dobinson, K.F.; Krishna, P. Treatment with 24-epibrassinolide, a brassinosteroid, increases the
basic thermotolerance of Brassica napus and tomato seedlings. Plant Mol. Biol. 1999, 40, 333–342. [CrossRef]90. Yin, W.; Dong, N.; Niu, M.; Zhang, X.; Li, L.; Liu, J.; Liu, B.; Tong, H. Brassinosteroid-regulated plant growth and development
and gene expression in soybean. Crop. J. 2019, 7, 411–418. [CrossRef]
99


horticulturae
Article
Effect of 5-Aminolevulinic Acid (5-ALA) on Leaf ChlorophyllFast Fluorescence Characteristics and Mineral Element Contentof Buxus megistophylla Grown along Urban Roadsides
Hao Yang 1, Jianting Zhang 1, Haiwen Zhang 1, Yi Xu 2, Yuyan An 1 and Liangju Wang 1,*
Citation: Yang, H.; Zhang, J.; Zhang,
H.; Xu, Y.; An, Y.; Wang, L. Effect of
5-Aminolevulinic Acid (5-ALA) on
Leaf Chlorophyll Fast Fluorescence
Characteristics and Mineral Element
Content of Buxus megistophylla Grown
along Urban Roadsides. Horticulturae
2021, 7, 95. https://doi.org/10.3390/
horticulturae7050095
Academic Editor: Douglas
D. Archbold
Received: 8 March 2021
Accepted: 26 April 2021
Published: 2 May 2021
Publisher’s Note: MDPI stays neutral
with regard to jurisdictional claims in
published maps and institutional affil-
iations.
Copyright: © 2021 by the authors.
Licensee MDPI, Basel, Switzerland.
This article is an open access article
distributed under the terms and
conditions of the Creative Commons
Attribution (CC BY) license (https://
creativecommons.org/licenses/by/
4.0/).
1 College of Horticulture, Nanjing Agricultural University, Nanjing 210095, China;[email protected] (H.Y.); [email protected] (J.Z.); [email protected] (H.Z.);[email protected] (Y.A.)
2 Changzhou Park Management Center, Changzhou 213001, China; [email protected]* Correspondence: [email protected]; Tel.: +86-25-84395265
Abstract: It is well known that trees grown on roadsides suffer from stressful environments, includ-ing poor soils, bad weather, and harmful gases from automobile exhaust. Improving the adaptabilityof roadside trees to adverse environments is important for urban management. An experiment wascarried out with six-year-old Buxus megistophylla Levl. hedgerows, where 20 mg/L 5-aminolevulinicacids (5-ALA) solution was sprayed on the blade surface at the end of April. Three months later,plant morphology, chlorophyll fast fluorescence characteristics, antioxidant enzyme activities andthe mineral element content were investigated. The results showed that leaf size and thickness weresignificantly greater with 5-ALA treatment, and the leaf color was also greener than those of thecontrol. 5-ALA treatment significantly promoted the electron transfer activity of the PSII reactioncenter on the donor side, the reaction center itself and the receptor side. It reduced energy dissipa-tion through the heat with increased photochemical quantum yields. The activities of antioxidantenzymes, including superoxide dismutase (SOD), catalase (CAT) and peroxidase (POD) in leavesand roots, were stimulated by 5-ALA treatment. The content of soluble sugars and free proline inleaves was significantly increased by 5-ALA treatment, as were the absorption and accumulation ofseveral kinds of mineral nutrient elements, such as nitrogen, phosphate, calcium, magnesium, iron,copper and boron. Additionally, 5-ALA application significantly increased the content of cadmium,mercury, chromium and lead in the roots but decreased them in the leaves. This implies that 5-ALAmay induce a mechanism in B. megistophylla in which toxic elements were intercepted in roots toavoid accumulation in leaves, which ensured healthy growth of the aboveground tissues. 5-ALAmay regulate the absorption and utilization of mineral nutrient elements in soil with the intercep-tion of toxic heavy metal elements in roots, promote leaf photosynthetic performance, induce theaccumulation of soluble sugars and free proline, and improve the antioxidant enzyme systems forplants to adapt to the stressful environment of urban roads. These results provide a basis for 5-ALAapplications alongside city roads.
Keywords: 5-aminolevulinic acid; Buxus megistophylla; chlorophyll fast fluorescence characteristics;mineral nutrition; urban road greening
1. Introduction
Road greening, or landscapes alongside roads, is an important part of urban gardenmanagement. The cultivation and maintenance of vibrant roadside green landscape beltshave become an important feature of modern social civilization [1]. However, the soil usedin road greening is often mixed with engineering construction waste, and even the foreignsoil transported by large machinery is often deep subsoil, which lacks aggregate structureand has little fertility. East China is located in a subtropical monsoon climate, cold in winterand hot in summer, with four distinct seasons. The highest temperature in summer often
Horticulturae 2021, 7, 95. https://doi.org/10.3390/horticulturae7050095 https://www.mdpi.com/journal/horticulturae
101
Horticulturae 2021, 7, 95
exceeds 40 ◦C, and the minimum temperature in winter can drop to −10 ◦C. In summer, itrains almost throughout the whole month of June and most of July, which floods the asphaltroads and the roadside trees for lengthy periods. In winter, it often snows, and a great dealof industrial salt (NaCl) is sprinkled on the road to prevent traffic accidents, which resultsin the salination of soils and underground water. Additionally, the plants are exposed toexhaust fumes from heavy traffic. Such severe environments subject the roadside plantsto multiple stresses, including heat, cold, excess rain, stagnant water, drought, acid orsaline–alkali soils, and air and/or soil pollution [2]. How to improve plants alongsideheavily traffic roads to resist these multiple stresses and beautify modern cities has becomean important problem to be solved in the process of developing a civilized society.
5-Aminolevulinic acid (5-ALA) is a δ-amino acid that does not participate in proteinsynthesis. It is the key biosynthetic precursor of all porphyrin compounds, such as chloro-phyll, heme, cytochrome and so on [3,4]. At the same time, it is also effective at improvingplant stress tolerance as a new natural, nontoxic, biodegradable and environmentallyfriendly plant growth regulator [5]. In agriculture, 5-ALA has been known to promoteplant growth and improve the yield of many crops, such as rice, radish, barley, potato,garlic, broad bean and so on [6]. Under salt stress, 5-ALA promoted the growth of spinachseedlings [7]. Under low temperature and low light, 5-ALA improved the photosyntheticcapacity of melon seedlings and promoted plant growth [8]. In addition, 5-ALA improvedplant tolerance to biotic and abiotic stresses, such as high temperature [9], strong light [10],UV-B [11], drought [12], waterlogging [13], alkaline soil [14], heavy metal pollution [15],pesticides [16], herbicide damage [17], and fungal infection [18]. In garden plants, 5-ALAimproved cold tolerance of camphor and rhododendron [19] and heat tolerance of Ligus-trum japonicum and Spiraea japonica [20]. However, to date, there are no reports of 5-ALAapplications to urban road greening tree or shrub species.
Buxus megistophylla is an evergreen shrub species [21], which is widely planted alongroadsides in urban and rural public green spaces, roadside hedgerows, ecological ditches,and other related landscape constructions in many regions of China [22]. It has beenproposed that the species is moderately sensitive to drought [23], chilling injury [24] and airpollution [25]. Yet, no attempts to improve its stress tolerance have been reported. In thisstudy, hedgerows of B. megistophylla grown on the roadsides of the main transport highwaywere sprayed with exogenous 5-ALA solutions in the spring at the early stage of plantgrowth. The 5-ALA treatment significantly improved the growth of these hedgerow plants.Therefore, analyses were carried out to clarify the possible mechanisms contributing to theimproved growth to provide a theoretical basis for applying this nonprotein amino acid tourban road greening plants.
2. Materials and Methods
2.1. Materials and Treatment
The materials selected in this experiment were Buxus megistophylla Levl. hedgerows,which were planted on both sides of Nenjiang Road, Changzhou City, Jiangsu Provincein 2014. The planting density was 64 plantlet cuttings per m2, and the hedgerows werepruned monthly to maintain a 70–80 cm height during the growing season. Our visualassessment was that the plants were growing poorly, exhibiting weak annual growth,which is why they were selected for this study.
5-Aminolevulinic acid (5-ALA) solution at a dosage of 20 mg/L was sprayed onthe leaf surface of plants on 28 April 2020. Control plants were sprayed with the samevolume of water. The width of the hedge was 1.8 m, and the length of one plot was about100 m. There were 3 plots per treatment, arranged randomly. Ninety days after treatment,plant growth and morphology of the control and 5-ALA treated plants were investigated.Because the hedgerows were dense, it was difficult to dig a single plant with a completeroot system. In addition, monthly pruning did not permit measurements of shoot growth.Therefore, leaf morphology and rapid chlorophyll fluorescence were measured in theroadside plants. Then, 5–8 plants with partial roots were randomly dug up from each
102

Horticulturae 2021, 7, 95
plot. Mature leaf and fine root tissues were collected and prepared for physiological andbiochemical analysis, rinsed in water, quickly frozen in liquid nitrogen, and then drivenback to the lab and stored at −80 ◦C until analysis.
2.2. Determination of Leaf Morphology and Relative Chlorophyll Content
The length, width and thickness of fresh plant leaves were measured with a ruler orvernier caliper. The relative chlorophyll content was determined with a SPAD-502 Plusproduced by Konica Minolta. For these measurements, fifteen mature leaves of the controland the treated plants were randomly selected from different plants from each plot, and anaverage value was obtained from 45 observations.
2.3. Rapid Fluorescence Determination of Chlorophyll in Leaves and Analysis ofFluorescence Parameters
The fast fluorescence OKJIP curve and 820 nm reflection fluorescence absorption curveof the chlorophyll of leaves of B. megistophylla were measured in vivo with a Multifunc-tional plant efficiency analyzer (M-PEA, Hansatech Instrument Ltd., Norfolk, UK). Beforedetermination, the leaves were dark-adapted for 30 min and then exposed to saturatedpulsed light (3000 μmol m−2 s−1) for 1 s. Fifteen leaves were measured repeatedly in thetreatment and the control, respectively. The O-phase fluorescence (Fo) of the fast fluores-cence curve was the initial fluorescence when the PSII reaction center was completely open.The fluorescence of the K phase (Fk), J phase (Fj), and I phase were measured at 300 μs,2 ms, and 30 ms, respectively. Fm was the maximum fluorescence when the PSII reactioncenter was completely closed, and the time was about 300 ms. The absorption of modulatedreflection fluorescence at 820 nm was expressed by its relative value, where the relativefluorescence MR/MRo = 1 at 0.7 ms was set. The fluorescence parameters were calculatedaccording to the method described previously [19,20]. The control and 5-ALA treatmentmeasurements were both replicated 15 times from randomly selected plants, 5 per plot.
2.4. Determination of Soluble Sugars and Free Proline in Leaves
Frozen leaf samples were used for the measurements, where the content of solublesugars was determined by anthrone colorimetry [26], while the free proline content wasdetermined by the acid ninhydrin method [27]. Three biological repeats were conducted,and the average value was taken.
2.5. Determination of the Activities of Antioxidant Enzymes in Leaves and Roots
The frozen tissues were extracted according to the method described by Tan et al. [28].The activities of superoxide dismutase (SOD), peroxidase (POD) and catalase (CAT) weredetermined in the crude extract according to the methods described by Zhang et al. [29] andChange and Maehly [30], respectively. All extractions were biologically repeated 3 times,and the average value was taken.
2.6. Determination of Mineral Nutrient Elements in Leaves and Roots
The mature leaves and fine roots of B. megistophylla, allowed to equilibrate at ambienttemperature, were rinsed thoroughly with tap water and then deionized water, respec-tively, then dried and ground to a fine powder to pass a 100-mesh sieve. One hundredmilligrams of the powdered samples were digested with concentrated nitric acid at 100 ◦Cfor 90 min. After complete clarification, the volume of the solution was fixed to 20 mL.The content of mineral elements, including phosphorus, potassium, calcium, magnesium,iron, copper, zinc, manganese, sodium, aluminum, cadmium, mercury, chromium andlead, were determined using an ICP-OES2100 system. For the nitrogen content, 0.2 g of drypowder was combined with 3 g potassium sulfate, and 5 mL concentrated sulfuric acid.After the solution was clarified, 5 mL of 4% NaOH (w/v) and 30 mL 30% boric acid (w/v)were added and determined using a Kjeldahl nitrogen meter. There were 3 biologicallyreplicates, 1 per plot, and the average value was taken.
103
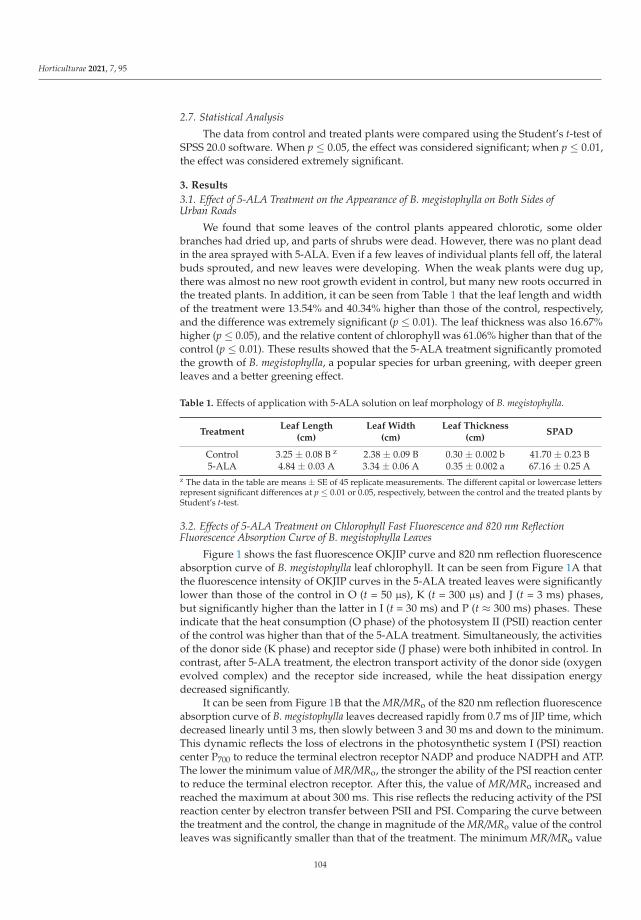
Horticulturae 2021, 7, 95
2.7. Statistical Analysis
The data from control and treated plants were compared using the Student’s t-test ofSPSS 20.0 software. When p ≤ 0.05, the effect was considered significant; when p ≤ 0.01,the effect was considered extremely significant.
3. Results
3.1. Effect of 5-ALA Treatment on the Appearance of B. megistophylla on Both Sides ofUrban Roads
We found that some leaves of the control plants appeared chlorotic, some olderbranches had dried up, and parts of shrubs were dead. However, there was no plant deadin the area sprayed with 5-ALA. Even if a few leaves of individual plants fell off, the lateralbuds sprouted, and new leaves were developing. When the weak plants were dug up,there was almost no new root growth evident in control, but many new roots occurred inthe treated plants. In addition, it can be seen from Table 1 that the leaf length and widthof the treatment were 13.54% and 40.34% higher than those of the control, respectively,and the difference was extremely significant (p ≤ 0.01). The leaf thickness was also 16.67%higher (p ≤ 0.05), and the relative content of chlorophyll was 61.06% higher than that of thecontrol (p ≤ 0.01). These results showed that the 5-ALA treatment significantly promotedthe growth of B. megistophylla, a popular species for urban greening, with deeper greenleaves and a better greening effect.
Table 1. Effects of application with 5-ALA solution on leaf morphology of B. megistophylla.
TreatmentLeaf Length
(cm)Leaf Width
(cm)Leaf Thickness
(cm)SPAD
Control 3.25 ± 0.08 B z 2.38 ± 0.09 B 0.30 ± 0.002 b 41.70 ± 0.23 B5-ALA 4.84 ± 0.03 A 3.34 ± 0.06 A 0.35 ± 0.002 a 67.16 ± 0.25 A
z The data in the table are means ± SE of 45 replicate measurements. The different capital or lowercase lettersrepresent significant differences at p ≤ 0.01 or 0.05, respectively, between the control and the treated plants byStudent’s t-test.
3.2. Effects of 5-ALA Treatment on Chlorophyll Fast Fluorescence and 820 nm ReflectionFluorescence Absorption Curve of B. megistophylla Leaves
Figure 1 shows the fast fluorescence OKJIP curve and 820 nm reflection fluorescenceabsorption curve of B. megistophylla leaf chlorophyll. It can be seen from Figure 1A thatthe fluorescence intensity of OKJIP curves in the 5-ALA treated leaves were significantlylower than those of the control in O (t = 50 μs), K (t = 300 μs) and J (t = 3 ms) phases,but significantly higher than the latter in I (t = 30 ms) and P (t ≈ 300 ms) phases. Theseindicate that the heat consumption (O phase) of the photosystem II (PSII) reaction centerof the control was higher than that of the 5-ALA treatment. Simultaneously, the activitiesof the donor side (K phase) and receptor side (J phase) were both inhibited in control. Incontrast, after 5-ALA treatment, the electron transport activity of the donor side (oxygenevolved complex) and the receptor side increased, while the heat dissipation energydecreased significantly.
It can be seen from Figure 1B that the MR/MRo of the 820 nm reflection fluorescenceabsorption curve of B. megistophylla leaves decreased rapidly from 0.7 ms of JIP time, whichdecreased linearly until 3 ms, then slowly between 3 and 30 ms and down to the minimum.This dynamic reflects the loss of electrons in the photosynthetic system I (PSI) reactioncenter P700 to reduce the terminal electron receptor NADP and produce NADPH and ATP.The lower the minimum value of MR/MRo, the stronger the ability of the PSI reaction centerto reduce the terminal electron receptor. After this, the value of MR/MRo increased andreached the maximum at about 300 ms. This rise reflects the reducing activity of the PSIreaction center by electron transfer between PSII and PSI. Comparing the curve betweenthe treatment and the control, the change in magnitude of the MR/MRo value of the controlleaves was significantly smaller than that of the treatment. The minimum MR/MRo value
104
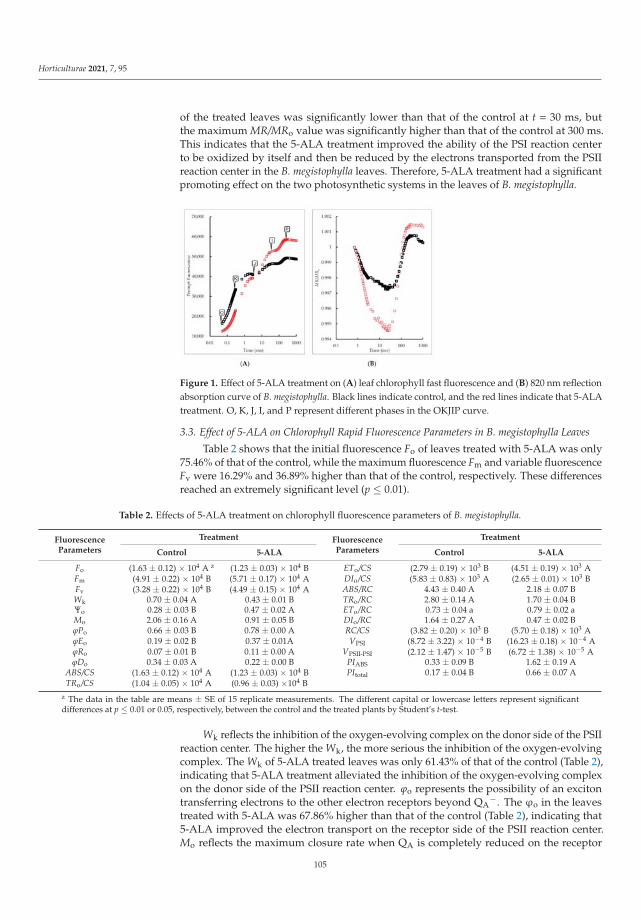
Horticulturae 2021, 7, 95
of the treated leaves was significantly lower than that of the control at t = 30 ms, butthe maximum MR/MRo value was significantly higher than that of the control at 300 ms.This indicates that the 5-ALA treatment improved the ability of the PSI reaction centerto be oxidized by itself and then be reduced by the electrons transported from the PSIIreaction center in the B. megistophylla leaves. Therefore, 5-ALA treatment had a significantpromoting effect on the two photosynthetic systems in the leaves of B. megistophylla.
Figure 1. Effect of 5-ALA treatment on (A) leaf chlorophyll fast fluorescence and (B) 820 nm reflectionabsorption curve of B. megistophylla. Black lines indicate control, and the red lines indicate that 5-ALAtreatment. O, K, J, I, and P represent different phases in the OKJIP curve.
3.3. Effect of 5-ALA on Chlorophyll Rapid Fluorescence Parameters in B. megistophylla Leaves
Table 2 shows that the initial fluorescence Fo of leaves treated with 5-ALA was only75.46% of that of the control, while the maximum fluorescence Fm and variable fluorescenceFv were 16.29% and 36.89% higher than that of the control, respectively. These differencesreached an extremely significant level (p ≤ 0.01).
Table 2. Effects of 5-ALA treatment on chlorophyll fluorescence parameters of B. megistophylla.
FluorescenceParameters
Treatment FluorescenceParameters
Treatment
Control 5-ALA Control 5-ALA
Fo (1.63 ± 0.12) × 104 A z (1.23 ± 0.03) × 104 B ETo/CS (2.79 ± 0.19) × 103 B (4.51 ± 0.19) × 103 AFm (4.91 ± 0.22) × 104 B (5.71 ± 0.17) × 104 A DIo/CS (5.83 ± 0.83) × 103 A (2.65 ± 0.01) × 103 BFv (3.28 ± 0.22) × 104 B (4.49 ± 0.15) × 104 A ABS/RC 4.43 ± 0.40 A 2.18 ± 0.07 BWk 0.70 ± 0.04 A 0.43 ± 0.01 B TRo/RC 2.80 ± 0.14 A 1.70 ± 0.04 BΨo 0.28 ± 0.03 B 0.47 ± 0.02 A ETo/RC 0.73 ± 0.04 a 0.79 ± 0.02 aMo 2.06 ± 0.16 A 0.91 ± 0.05 B DIo/RC 1.64 ± 0.27 A 0.47 ± 0.02 BϕPo 0.66 ± 0.03 B 0.78 ± 0.00 A RC/CS (3.82 ± 0.20) × 103 B (5.70 ± 0.18) × 103 AϕEo 0.19 ± 0.02 B 0.37 ± 0.01A VPSI (8.72 ± 3.22) × 10−4 B (16.23 ± 0.18) × 10−4 AϕRo 0.07 ± 0.01 B 0.11 ± 0.00 A VPSII-PSI (2.12 ± 1.47) × 10−5 B (6.72 ± 1.38) × 10−5 AϕDo 0.34 ± 0.03 A 0.22 ± 0.00 B PIABS 0.33 ± 0.09 B 1.62 ± 0.19 A
ABS/CS (1.63 ± 0.12) × 104 A (1.23 ± 0.03) × 104 B PItotal 0.17 ± 0.04 B 0.66 ± 0.07 ATRo/CS (1.04 ± 0.05) × 104 A (0.96 ± 0.03) ×104 B
z The data in the table are means ± SE of 15 replicate measurements. The different capital or lowercase letters represent significantdifferences at p ≤ 0.01 or 0.05, respectively, between the control and the treated plants by Student’s t-test.
Wk reflects the inhibition of the oxygen-evolving complex on the donor side of the PSIIreaction center. The higher the Wk, the more serious the inhibition of the oxygen-evolvingcomplex. The Wk of 5-ALA treated leaves was only 61.43% of that of the control (Table 2),indicating that 5-ALA treatment alleviated the inhibition of the oxygen-evolving complexon the donor side of the PSII reaction center. ϕo represents the possibility of an excitontransferring electrons to the other electron receptors beyond QA
−. The ϕo in the leavestreated with 5-ALA was 67.86% higher than that of the control (Table 2), indicating that5-ALA improved the electron transport on the receptor side of the PSII reaction center.Mo reflects the maximum closure rate when QA is completely reduced on the receptor
105
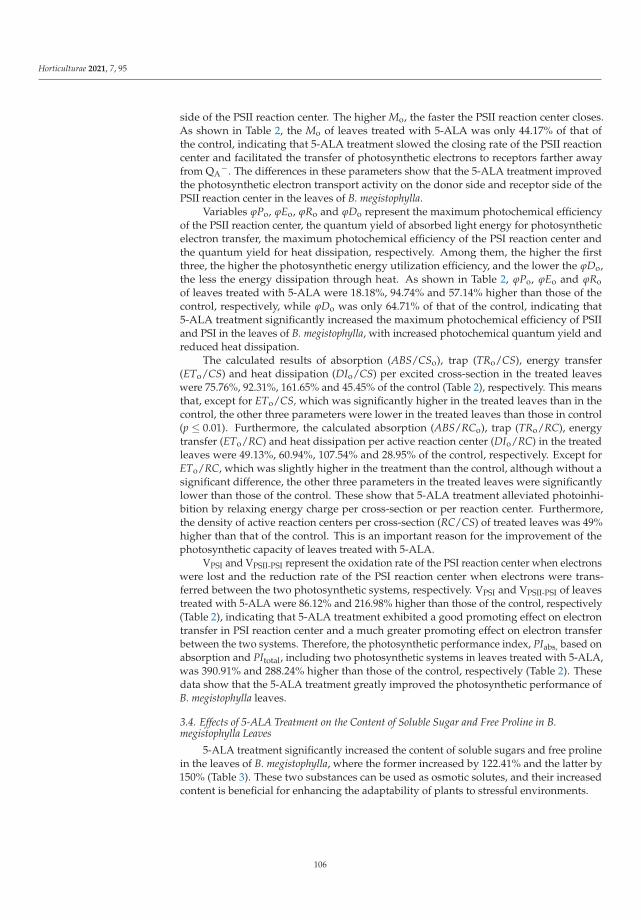
Horticulturae 2021, 7, 95
side of the PSII reaction center. The higher Mo, the faster the PSII reaction center closes.As shown in Table 2, the Mo of leaves treated with 5-ALA was only 44.17% of that ofthe control, indicating that 5-ALA treatment slowed the closing rate of the PSII reactioncenter and facilitated the transfer of photosynthetic electrons to receptors farther awayfrom QA
−. The differences in these parameters show that the 5-ALA treatment improvedthe photosynthetic electron transport activity on the donor side and receptor side of thePSII reaction center in the leaves of B. megistophylla.
Variables ϕPo, ϕEo, ϕRo and ϕDo represent the maximum photochemical efficiencyof the PSII reaction center, the quantum yield of absorbed light energy for photosyntheticelectron transfer, the maximum photochemical efficiency of the PSI reaction center andthe quantum yield for heat dissipation, respectively. Among them, the higher the firstthree, the higher the photosynthetic energy utilization efficiency, and the lower the ϕDo,the less the energy dissipation through heat. As shown in Table 2, ϕPo, ϕEo and ϕRoof leaves treated with 5-ALA were 18.18%, 94.74% and 57.14% higher than those of thecontrol, respectively, while ϕDo was only 64.71% of that of the control, indicating that5-ALA treatment significantly increased the maximum photochemical efficiency of PSIIand PSI in the leaves of B. megistophylla, with increased photochemical quantum yield andreduced heat dissipation.
The calculated results of absorption (ABS/CSo), trap (TRo/CS), energy transfer(ETo/CS) and heat dissipation (DIo/CS) per excited cross-section in the treated leaveswere 75.76%, 92.31%, 161.65% and 45.45% of the control (Table 2), respectively. This meansthat, except for ETo/CS, which was significantly higher in the treated leaves than in thecontrol, the other three parameters were lower in the treated leaves than those in control(p ≤ 0.01). Furthermore, the calculated absorption (ABS/RCo), trap (TRo/RC), energytransfer (ETo/RC) and heat dissipation per active reaction center (DIo/RC) in the treatedleaves were 49.13%, 60.94%, 107.54% and 28.95% of the control, respectively. Except forETo/RC, which was slightly higher in the treatment than the control, although without asignificant difference, the other three parameters in the treated leaves were significantlylower than those of the control. These show that 5-ALA treatment alleviated photoinhi-bition by relaxing energy charge per cross-section or per reaction center. Furthermore,the density of active reaction centers per cross-section (RC/CS) of treated leaves was 49%higher than that of the control. This is an important reason for the improvement of thephotosynthetic capacity of leaves treated with 5-ALA.
VPSI and VPSII-PSI represent the oxidation rate of the PSI reaction center when electronswere lost and the reduction rate of the PSI reaction center when electrons were trans-ferred between the two photosynthetic systems, respectively. VPSI and VPSII-PSI of leavestreated with 5-ALA were 86.12% and 216.98% higher than those of the control, respectively(Table 2), indicating that 5-ALA treatment exhibited a good promoting effect on electrontransfer in PSI reaction center and a much greater promoting effect on electron transferbetween the two systems. Therefore, the photosynthetic performance index, PIabs, based onabsorption and PItotal, including two photosynthetic systems in leaves treated with 5-ALA,was 390.91% and 288.24% higher than those of the control, respectively (Table 2). Thesedata show that the 5-ALA treatment greatly improved the photosynthetic performance ofB. megistophylla leaves.
3.4. Effects of 5-ALA Treatment on the Content of Soluble Sugar and Free Proline in B.megistophylla Leaves
5-ALA treatment significantly increased the content of soluble sugars and free prolinein the leaves of B. megistophylla, where the former increased by 122.41% and the latter by150% (Table 3). These two substances can be used as osmotic solutes, and their increasedcontent is beneficial for enhancing the adaptability of plants to stressful environments.
106
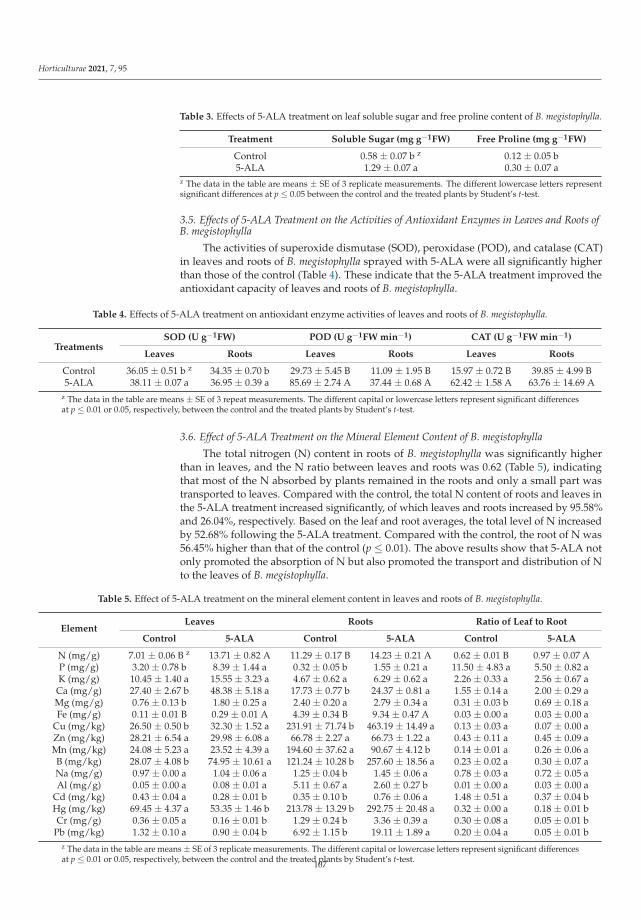
Horticulturae 2021, 7, 95
Table 3. Effects of 5-ALA treatment on leaf soluble sugar and free proline content of B. megistophylla.
Treatment Soluble Sugar (mg g−1FW) Free Proline (mg g−1FW)
Control 0.58 ± 0.07 b z 0.12 ± 0.05 b5-ALA 1.29 ± 0.07 a 0.30 ± 0.07 a
z The data in the table are means ± SE of 3 replicate measurements. The different lowercase letters representsignificant differences at p ≤ 0.05 between the control and the treated plants by Student’s t-test.
3.5. Effects of 5-ALA Treatment on the Activities of Antioxidant Enzymes in Leaves and Roots ofB. megistophylla
The activities of superoxide dismutase (SOD), peroxidase (POD), and catalase (CAT)in leaves and roots of B. megistophylla sprayed with 5-ALA were all significantly higherthan those of the control (Table 4). These indicate that the 5-ALA treatment improved theantioxidant capacity of leaves and roots of B. megistophylla.
Table 4. Effects of 5-ALA treatment on antioxidant enzyme activities of leaves and roots of B. megistophylla.
TreatmentsSOD (U g−1FW) POD (U g−1FW min−1) CAT (U g−1FW min−1)
Leaves Roots Leaves Roots Leaves Roots
Control 36.05 ± 0.51 b z 34.35 ± 0.70 b 29.73 ± 5.45 B 11.09 ± 1.95 B 15.97 ± 0.72 B 39.85 ± 4.99 B5-ALA 38.11 ± 0.07 a 36.95 ± 0.39 a 85.69 ± 2.74 A 37.44 ± 0.68 A 62.42 ± 1.58 A 63.76 ± 14.69 A
z The data in the table are means ± SE of 3 repeat measurements. The different capital or lowercase letters represent significant differencesat p ≤ 0.01 or 0.05, respectively, between the control and the treated plants by Student’s t-test.
3.6. Effect of 5-ALA Treatment on the Mineral Element Content of B. megistophylla
The total nitrogen (N) content in roots of B. megistophylla was significantly higherthan in leaves, and the N ratio between leaves and roots was 0.62 (Table 5), indicatingthat most of the N absorbed by plants remained in the roots and only a small part wastransported to leaves. Compared with the control, the total N content of roots and leaves inthe 5-ALA treatment increased significantly, of which leaves and roots increased by 95.58%and 26.04%, respectively. Based on the leaf and root averages, the total level of N increasedby 52.68% following the 5-ALA treatment. Compared with the control, the root of N was56.45% higher than that of the control (p ≤ 0.01). The above results show that 5-ALA notonly promoted the absorption of N but also promoted the transport and distribution of Nto the leaves of B. megistophylla.
Table 5. Effect of 5-ALA treatment on the mineral element content in leaves and roots of B. megistophylla.
ElementLeaves Roots Ratio of Leaf to Root
Control 5-ALA Control 5-ALA Control 5-ALA
N (mg/g) 7.01 ± 0.06 B z 13.71 ± 0.82 A 11.29 ± 0.17 B 14.23 ± 0.21 A 0.62 ± 0.01 B 0.97 ± 0.07 AP (mg/g) 3.20 ± 0.78 b 8.39 ± 1.44 a 0.32 ± 0.05 b 1.55 ± 0.21 a 11.50 ± 4.83 a 5.50 ± 0.82 aK (mg/g) 10.45 ± 1.40 a 15.55 ± 3.23 a 4.67 ± 0.62 a 6.29 ± 0.62 a 2.26 ± 0.33 a 2.56 ± 0.67 aCa (mg/g) 27.40 ± 2.67 b 48.38 ± 5.18 a 17.73 ± 0.77 b 24.37 ± 0.81 a 1.55 ± 0.14 a 2.00 ± 0.29 aMg (mg/g) 0.76 ± 0.13 b 1.80 ± 0.25 a 2.40 ± 0.20 a 2.79 ± 0.34 a 0.31 ± 0.03 b 0.69 ± 0.18 aFe (mg/g) 0.11 ± 0.01 B 0.29 ± 0.01 A 4.39 ± 0.34 B 9.34 ± 0.47 A 0.03 ± 0.00 a 0.03 ± 0.00 a
Cu (mg/kg) 26.50 ± 0.50 b 32.30 ± 1.52 a 231.91 ± 71.74 b 463.19 ± 14.49 a 0.13 ± 0.03 a 0.07 ± 0.00 aZn (mg/kg) 28.21 ± 6.54 a 29.98 ± 6.08 a 66.78 ± 2.27 a 66.73 ± 1.22 a 0.43 ± 0.11 a 0.45 ± 0.09 aMn (mg/kg) 24.08 ± 5.23 a 23.52 ± 4.39 a 194.60 ± 37.62 a 90.67 ± 4.12 b 0.14 ± 0.01 a 0.26 ± 0.06 aB (mg/kg) 28.07 ± 4.08 b 74.95 ± 10.61 a 121.24 ± 10.28 b 257.60 ± 18.56 a 0.23 ± 0.02 a 0.30 ± 0.07 aNa (mg/g) 0.97 ± 0.00 a 1.04 ± 0.06 a 1.25 ± 0.04 b 1.45 ± 0.06 a 0.78 ± 0.03 a 0.72 ± 0.05 aAl (mg/g) 0.05 ± 0.00 a 0.08 ± 0.01 a 5.11 ± 0.67 a 2.60 ± 0.27 b 0.01 ± 0.00 a 0.03 ± 0.00 a
Cd (mg/kg) 0.43 ± 0.04 a 0.28 ± 0.01 b 0.35 ± 0.10 b 0.76 ± 0.06 a 1.48 ± 0.51 a 0.37 ± 0.04 bHg (mg/kg) 69.45 ± 4.37 a 53.35 ± 1.46 b 213.78 ± 13.29 b 292.75 ± 20.48 a 0.32 ± 0.00 a 0.18 ± 0.01 bCr (mg/g) 0.36 ± 0.05 a 0.16 ± 0.01 b 1.29 ± 0.24 b 3.36 ± 0.39 a 0.30 ± 0.08 a 0.05 ± 0.01 b
Pb (mg/kg) 1.32 ± 0.10 a 0.90 ± 0.04 b 6.92 ± 1.15 b 19.11 ± 1.89 a 0.20 ± 0.04 a 0.05 ± 0.01 bz The data in the table are means ± SE of 3 replicate measurements. The different capital or lowercase letters represent significant differencesat p ≤ 0.01 or 0.05, respectively, between the control and the treated plants by Student’s t-test.
107
Horticulturae 2021, 7, 95
5-ALA treatment also significantly increased the content of phosphorus (P) in theleaves and roots of B. megistophylla. The content of P in the leaves of the control was10 times higher than that in the roots (Table 5), indicating that most of the P absorbedby roots was transported to the shoot. After 5-ALA treatment, the P content in leavesincreased by 162.19%, and the root content increased by 384.38%. After the average of thewhole plant, the P level of the 5-ALA treatment was 182.39% higher than that of the control.5-ALA treatment had no effect on the ratio of P in leaves to roots. These results showedthat 5-ALA treatment promoted P uptake and accumulation but had no significant effecton P distribution.
The 5-ALA treatment had no significant effect on the level of potassium (K) in B. megisto-phylla. In addition, the K content in the leaves of B. megistophylla was 2.26 times higher thanthat in the roots, indicating that the K absorbed by the plants was mainly transported to theshoot. 5-ALA treatment had no significant effect on this allocation characteristic.
Calcium (Ca) and magnesium (Mg) are both essential medium elements for plantgrowth. In B. megistophylla, the leaf–root ratio of Ca in the control plant was 1.55, indicatingthat Ca mainly accumulated in leaves. 5-ALA treatment did not significantly affect thischaracteristic but increased the Ca content in leaves and roots by 76.57% and 37.45%,respectively. This indicates that 5-ALA treatment promoted the absorption and transportof Ca but did not affect the distribution in leaves and roots. Different from Ca, the leaf–rootratio of Mg in the control plant of B. megistophylla was 0.31, indicating that most of themagnesium was distributed in the root system. 5-ALA treatment significantly increased Mgcontent in leaves (by 136.84%) but had no effect on roots. Compared with the control, theleaf–root ratio of Mg in 5-ALA treatment increased by 122.58% (p ≤ 0.05), indicating that5-ALA promoted the absorption of Mg by the roots of B. megistophylla and the distributionof Mg to the leaves.
Iron (Fe), copper (Cu), zinc (Zn), manganese (Mn) and boron (B) are essential traceelements for plant growth. The content of Fe in roots of B. megistophylla was much higherthan that in leaves, and the ratio of leaf to root was 0.03 (Table 5). With 5-ALA treatment, theFe of leaves was 156.45% higher than that of the control, and that in the roots also increasedby 113.10% (p ≤ 0.01), but the leaf–root ratio of Fe did not change, indicating that 5-ALAsignificantly promoted the absorption and transport of Fe, but did not affect the distributionratio. The leaf–root ratio of Cu in the control plant of B. megistophylla was 0.13, indicatingthat Cu was mainly distributed in the roots. 5-ALA treatment significantly promoted thecontent of Cu in leaves and doubled the content in roots but had no significant effect on thedistribution ratio of Cu in leaves and roots. Zn of B. megistophylla was mainly distributedin the roots, and the leaf content was less than half of the roots (43–45%); 5-ALA had nosignificant effect on Cu content and distribution. Mn was mainly distributed in the roots ofB. megistophylla, and the leaf–root ratio was only 0.14 in the control. 5-ALA treatment had nosignificant effect on leaf content but significantly decreased root Mn content (about half ofthe control). B was also mainly distributed in the roots of B. megistophylla. In the control andtreatment, the leaf–root ratio of B was 0.23–0.30. 5-ALA treatment significantly increased Bcontent in leaves and roots but had no significant effect on leaf root distribution (Table 5).
Sodium (Na) and aluminum (Al) are often regarded as harmful elements. If the Nacontent is too high, the soil may be salinized. If the Al content is too high, the soil tendsto be acidified. The Na content in roots of B. megistophylla was higher than that in leaves,and the content in leaves and roots increased after 5-ALA treatment, but only the rootincrement reached a significant level. These indicate that 5-ALA promoted Na uptake butmainly retained in the roots, without a significant increase in the leaves. For Al, 5-ALAtreatment reduced the Al content in roots of B. megistophylla by about half and had noeffect on leaves. These suggest that 5-ALA treatment reduced the absorption of Al by B.megistophylla as a whole.
Cadmium (Cd), mercury (Hg), chromium (Cr) and lead (Pb) are considered to be toxicheavy metal elements. In the control plant, Cd was mainly distributed in the leaves, andthe leaf–root ratio was 1.48, while the other three elements were mainly distributed in the
108
Horticulturae 2021, 7, 95
roots, with the leaf–root ratios from 0.20 to 0.32. 5-ALA treatment reduced the leaf–rootratio of Cd to 0.37, which was only 25% of that of the control. For Hg, Cr and Pb, 5-ALAtreatment significantly decreased the leaf content but increased the root content, so theleaf–root ratio decreased significantly. These results show that 5-ALA treatment can inducemore toxic element storage in roots to avoid leaf accumulation. This effect is consistentwith these four toxic heavy metal elements as a whole.
4. Discussion
Road greening is not only an important part of urban greening systems but also animportant symbol of modern urban civilization. A good road greening system is conduciveto driving safety, enjoyment of city landscapes, and environment protection [31]. However,while road traffic brings speed and convenience to people’s lives, it also exerts new coercivefactors on the growth of roadside plants. In addition to the conventional high or lowtemperatures, drought or waterlogging, salinization, and acid–alkali stress, automobileexhaust is a typical harmful factor on plant growth [32]. This is something rarely encoun-tered by plants grown in a quiet garden. It has been proposed that the main characteristicsof automobile exhaust were damage to cell membranes, decreased chlorophyll contentand photosynthesis, leaf discoloration, leaf shedding and even death [33]. The plants ofB. megistophylla used in this study were planted on both sides of the main road. However,automobile exhaust was not detected in the air. Traffic throughout the country was notparticularly busy in the first half of 2020 due to the COVID-19 epidemic, so the exhaustlevels were likely lower than usual. Even so, the growth of B. megistophylla on both sides ofthe road was restricted, and occasional death of shrubs occurred in the experimental site.In addition to the B. megistophylla reported in this paper, leaf yellowing, growth inhibitionand plant death of another road greening species, Gardenia jasminoides Ellis, were also quitesignificant (data not listed). Therefore, improving the adaptability of plants used for roadgreening in such adverse environments, promoting plant growth, reducing mortality, andenhancing the greening effect has important practical significance.
5-Aminolevulinic acid (5-ALA) is a natural δ-amino acid commonly found in animals,plants, and microorganisms. It is not used to synthesize proteins but is a key biosyntheticprecursor of porphyrin compounds, such as chlorophyll, heme, and cytochrome [3]. There-fore, it is closely related to plant photosynthesis and respiration [5]. A large number ofstudies have shown that 5-ALA can improve the resistance of plants to high temperature [9],low temperature [8], strong light [10], weak light [8], drought [12], waterlogging [13],salinization [7], heavy metal pollution [15], pesticide [16], herbicide toxicity [17], fungaldiseases [18] and other biotic and abiotic stresses and has broad application potential inagricultural production [5]. However, whether 5-ALA can be used on urban road greeningplants to improve environmental adaptability has never been reported. Buxus megistophyllais sensitive to automobile exhaust [34]. In urban roads with high concentrations of NO2and CO, the pH of leaf cell sap decreased, and the content of malondialdehyde (MDA),a product of membrane peroxidation, increased significantly. The results of the presentwork showed that 5-ALA promoted leaf growth of B. megistophylla (Table 1), promotedthe occurrence of new roots, reduced the probability of plant death, and significantlyimproved urban road greening, indicating that it has an important application prospect inroad greening.
5-ALA is the precursor of chlorophyll biosynthesis in plants. Exogenous applicationof 5-ALA increased the content of chlorophyll in leaves of B. megistophylla (Table 1). Chloro-phyll a is the main pigment in the reaction center of the photosynthetic system (includingPSI and PSII). It forms antenna pigment with chlorophyll b, carotenoids and lutein. Aphotosynthetic reaction center consists of about 300 chlorophyll molecules [35]. 5-ALAcan increase the number of photosynthetic reaction centers by increasing the content ofchlorophyll in the leaves of B. megistophylla. The active reaction center density (RC/CS) percross-section increased significantly (Table 4).
109
Horticulturae 2021, 7, 95
The fast fluorescence OKJIP curve and 820 nm reflection fluorescence absorption curveof leaf chlorophyll were detected by M-PEA. The results showed that the O, K and J phasefluorescence of B. megistophylla in the leaves sprayed with 5-ALA was significantly lowerthan that of the control, while the I and P phase fluorescence was higher than that of thecontrol (Figure 1A). These results showed that 5-ALA treatment increased the donor sideactivity, reaction center itself activity and receptor-side electron-transport activity of thePSII reaction center in leaves. Simultaneously, the minimum value of MR/MRo decreasedsignificantly at t = 30 ms, and the maximum value of MR/MRo increased significantlyat t ≈ 300 ms after 5-ALA treatment (Figure 1B). This means that the activity of the PSIreaction center and the ability to reduce terminal electron receptor NADP were promoted.Fluorescence parameter analysis (Table 2) showed that Wk and Mo decreased in the 5-ALAtreated leaves, suggesting that 5-ALA alleviated the photoinhibition at the donor-sideoxygen evolved complex and the receptor side, leading to a decrease in the maximumclosure rate of the PSII reaction center. The increase of ϕo represents an increase in theprobability of excitons transferring electrons to other electron receptors downstream ofQA. 5-ALA treatment significantly promoted the activity of the PSII reaction center in B.megistophylla leaves (Table 2). VPSI and VPSII-PSI represent the rate at which the PSI itselfloses electrons when it is oxidized and the rate at which the PSI reaction center is reducedby electrons transferred by PSII [19,20]. After 5-ALA treatment, both VPSI and VPSII-PSIincreased significantly, indicating that 5-ALA significantly promoted electron transferin PSI reaction centers and between PSII and PSI reaction centers. Furthermore, 5-ALAhad a significant promoting effect on the absorption-based photosynthetic performanceindex PIabs and the total photosynthetic performance index PItotal, including two photo-synthetic systems (Table 2). These results are similar to the effects of 5-ALA treatment atlow temperatures [19] or high temperatures [20]. In addition, from the point of view ofphotochemical energy conversion, the quantum yield (ϕEo) and energy transfer per excitedcross-section (ETo/CS) of B. megistophylla leaves treated with 5-ALA were significantlyincreased. Although the promoting effect of energy transfer (ETo/RC) based on unit reac-tion center did not reach a significant level, energy absorption (ABS/CS or ABS/RC), trap(TRo/CS or TRo/RC), and heat dissipation (DIo/CS or DIo/RC) decreased significantly.These indicate that 5-ALA treatment can reduce the energy charge pressure of the reactioncenter and reduce the possibility of photoinhibition. Recently, it was reported that 5-ALAtreatment could upregulate the expression of core proteins D1 and D2 of the PSII reactioncenter in potato leaves [36]. This may be an important reason why the core proteins ofthe PSII reaction center maintain higher activity. Perhaps due to the improvement of leafphotosynthetic performance, the soluble sugars in the leaves of B. megistophylla treatedwith 5-ALA increased significantly (Table 3).
Soluble sugars can be used as osmotic solutes, which are related to plant stressresistance. However, more studies have shown that proline accumulation induced by5-ALA can improve plant stress resistance [37]. In this experiment, it was observed that5-ALA treatment increased the proline content in the leaves of B. megistophylla (Table 3).This may be one of the reasons for its resistance to environmental stress on urban roads.In addition, the increases in antioxidant enzyme activities induced by 5-ALA are alsoimportant reasons for the improvement of stress resistance. In this experiment, 5-ALAsignificantly increased the activities of superoxide dismutase (SOD), peroxidase (POD) andcatalase (CAT) in leaves and roots of B. megistophylla (Table 4). These results are similar toprevious reports [3,4], indicating that the increase of antioxidant enzyme activity is relatedto plant stress resistance.
There is currently no consensus on the effect of 5-ALA on the content of mineralelements in plants. Naeem et al. [38] suggested that 5-ALA alleviated the decrease of N,P, Ca, Mg, Zn and Fe content in rape (Brassica napus L.) leaves and roots under salt stressbut had no effect on Mn and Cu contents. Zhang et al. [39] proposed that 5-ALA couldincrease Ca, Mg, Cu, Fe and Zn in apple (Malus domestica Borkh.) leaves but decrease thecontent of P, K and Na. Anwar et al. [40] observed that the content of N, P, K, Ca, Mg, Cu,
110
Horticulturae 2021, 7, 95
Fe, Mn and Zn in roots and leaves of cucumber (Cucumis sativus L.) seedlings increasedsignificantly when 5-ALA alleviated the inhibition of low temperature on the growth ofcucumber seedlings. It seems that the improvement of cold resistance of plants by 5-ALAis related to the maintenance of nutrient balance. However, Liu et al. [14] did not observean increase of K, Fe and Mg content in leaves when they studied the improvement ofalkaline tolerance of Swiss chard (Beta vulgaris L.) treated with 5-ALA. Therefore, the effectof 5-ALA on the content of mineral elements in plants may be related to species and typesof stress. In the present work, it was observed that 5-ALA increased the level of N in leavesand roots of B. megistophylla. This effect was shown not only in the increase of N contentin roots and leaves but also in the transport and distribution of N from roots to leaves(Table 5). It has been suggested that nitrate reductase (NR) activity and its coding geneexpression was significantly upregulated in pakchoi (Brassica campestris ssp. chinensis var.communis Tsen et Lee) plants treated with 5-ALA, and the content of total N, amino acidand protein in leaves increased, while the content of nitrate nitrogen decreased [41]. Theauthors deduced that 5-ALA promoted N absorption and assimilation. Our result here isconsistent with the previous report, indicating that 5-ALA can promote the absorption,transport, distribution and utilization of N in plants.
It was observed that 5-ALA increased P, Ca, Cu, Fe and B in roots and leaves of B.megistophylla. This is similar to the result of Naeem et al. [38]. However, 5-ALA treatmentonly increased leaf Mg content, had no significant effect on K and Zn content, and decreasedroot Mn content (Table 5). The reason for these differences is not clear. Yao et al. [42]reported that 5-ALA promoted the absorption and distribution of P in rice (Oryza sativa L.).We also observed that 5-ALA increased the P content of B. megistophylla plants (Table 5),indicating that the promoting effect of 5-ALA on P was universal. The transport of Caby plants mainly depends on transpiration flow [43], while 5-ALA can promote stomatalopening [44] and increase transpiration rate. Therefore, it may also be common for 5-ALA treatment to promote the absorption and transport of Ca. For Mg, 5-ALA treatmentled to an increase in leaf content (Table 5). This may be one reason for the increase ofchlorophyll content in leaves (Table 1). For Cu, Naeem et al. [38] suggested that 5-ALAhad no alleviating effect on the decrease of Cu content in rape plants under salt stress,but Anwar et al. [40] thought that 5-ALA could alleviate the decrease of Cu in cucumberinduced by low temperature. Our results were similar to those of the latter. 5-ALA couldsignificantly increase the Cu content in leaves and roots of B. megistophylla (Table 5). Lackof Fe will lead to leaf chlorosis. In this experiment, the leaves of the control plants weregenerally yellowing, while the leaves of the treated plants were green. This could not onlybe related to the higher N and Mg content mentioned above but to the 5-ALA treatmentpromoting an increase of Fe content in B. megistophylla. The content of Fe in both roots andleaves treated with 5-ALA was more than twice as high as that of the control. Such a hugeincrease is rarely reported. Similarly, 5-ALA induced a more than double increase in Bcontent in leaves and roots of B. megistophylla (Table 5). These phenomena have rarely beenreported before and are worthy of our attention and further study of the mechanism.
Na and Al are not essential elements for plant growth and development. Excessiveaccumulation will cause plant toxicity. The results showed that 5-ALA treatment increasedthe Na content of B. megistophylla, but mainly in the root system. This is similar to a previousreport [45] that found 5-ALA upregulated expressions of genes, including SOS1, NHX1 andHKT1 in strawberry (Fragaria × ananassa Duch.) roots to intercept salt ions in root vacuolesand depress transport to the aboveground parts, avoiding leaf ion damage. The relationshipbetween Al content and 5-ALA has not been reported before. In this experiment, the Alcontent in leaves was not affected by 5-ALA treatment, but it was decreased significantlyin the roots, suggesting that 5-ALA treatment reduced the absorption of Al by plants. Dueto the soil acidity of the experimental region, a decrease in Al content induced by 5-ALAmay be related to the increase of acid tolerance of plants.
Cd, Hg, Cr and Pb are all toxic elements. Crops grown on both sides of roads are oftenpoisoned by these heavy metal elements [46]. 5-ALA improved the tolerance of plants to
111

Horticulturae 2021, 7, 95
Pb [15] and Cr [47]. Recently, Xu et al. [48] proposed a mechanism of 5-ALA improvingplant Cd tolerance, which is related to the upregulation of cellular antioxidant enzymesand metal carrier protein gene expression. In the present work, we observed that 5-ALApromoted the accumulation of heavy metals in the roots of B. megistophylla and decreasedthe content of leaves (Table 5). This mechanism is similar to that proposed by Wu et al. [45]that 5-ALA induces Na interception in strawberry roots under salt stress to reduce upwardtransport. Obviously, this mechanism is more ingenious, and it has yet to be proven. Ithas been reported that arbuscular mycorrhizal fungi (AMF) could improve plant toleranceagainst heavy metal pollution [49], where AMF can chelate part of metal elements in therhizosphere soil [50]. Whether 5-ALA treatment improves the tolerance mediated by AMFhas never been reported, but this deserves study in the future.
To sum up, 5-ALA promoted the growth of B. megistophylla, a road greening plant,improved plant survival, increased leaf color and enhanced the greening effect. The reasonmay be related to the increase of plant antioxidant enzyme activities, the improvement ofplant mineral nutrition levels, and the inhibition of toxic and harmful heavy metal elementaccumulation in leaves. The toxic elements, such as Cd, Hg, Cr and Pb absorbed by theroots were trapped in the roots, the accumulation in leaves was reduced, the content ofN, P, Ca, Mg, Cu, Fe and B in leaves were increased, and the nutritional status of plantswas generally improved. The photosynthetic capacity of leaves also improved following5-ALA treatment, the accumulation of soluble sugars and free proline was promoted, theactivities of antioxidant enzymes were increased, and the stress resistance of plants wasenhanced. Therefore, this nonprotein amino acid can use in urban landscapes to improveplant stress tolerance.
Author Contributions: Conceptualization, L.W. and Y.A.; methodology, H.Y. and J.Z.; validation,H.Y. and J.Z.; formal analysis, H.Y. and H.Z.; investigation, L.W., H.Y., J.Z. and Y.X.; data curation,L.W. and H.Y.; writing—original draft preparation, H.Y. and L.W.; writing—review and editing, L.W.and Y.A. All authors have read and agreed to the published version of the manuscript.
Funding: This research was supported by the National Natural Science Foundation of China(31772253), the Fundamental Research Funds for the Central Universities (KYYJ202004), a ProjectFunded by the Priority Academic Program Development of Jiangsu Higher Education Institutions(130-809005) and Jiangsu Agricultural Science and Technology Innovation Fund (CX (20)2023). Thefunders had no role in study design, data collection and analysis, decision to publish, or preparationof the manuscript.
Institutional Review Board Statement: Not applicable.
Informed Consent Statement: Not applicable.
Data Availability Statement: Data is contained within the article.
Acknowledgments: The authors thank YH Ma (Central Lab of College of Horticulture, NanjingAgricultural University) for assistance in manipulating ICP-OES for mineral analysis.
Conflicts of Interest: The authors declare no conflict of interest.
References
1. Ma, J.; Luo, W. Importance and design method of urban road greening. World Build. Mater. 2013, 34, 50–52.2. Gao, Y.D.; Liu, H.R. Physiological responses of road greening plants to traffic pollution. Heilongjiang Agric. Sci. 2016, 3, 93–97.3. Wu, Y.; Liao, W.; Dawuda, M.M.; Hu, L.; Yu, J. 5-Aminolevulinic acid (ALA) biosynthetic and metabolic pathways and its role in
higher plants: A review. Plant Growth Regul. 2019, 87, 357–374. [CrossRef]4. Akram, N.A.; Ashraf, M. Regulation in plant stress tolerance by a potential plant growth regulator, 5-aminolevulinic acid. J. Plant
Growth Regul. 2013, 32, 663–679. [CrossRef]5. Wang, L.J.; Jiang, W.B.; Zhang, Z.; Yao, Q.H.; Matsui, H.; Ohara, H. Biosynthesis and physiological activity of 5-aminolevulinic
acid and its potential application in agriculture. Plant Physiol. Commun. 2003, 39, 185–192.6. Hotta, Y.; Tanaka, T.; Takaoka, H.; Takeuchi, Y.; Konnai, M. New physiological effects of 5-aminolevulinic acid in plants: The
increase of photosynthesis, chlorophyll content, and plant growth. Biosci. Biotechnol. Biochem. 1997, 61, 2025–2028. [CrossRef][PubMed]
112
Horticulturae 2021, 7, 95
7. Nishihara, E.; Kondo, K.; Parvez, M.M.; Takahashi, K.; Watanabe, K.; Tanaka, K. Role of 5-aminolevulinic acid (ALA) on activeoxygen-scavenging system in NaCl-treated spinach (Spinacia oleracea). J. Plant Physiol. 2003, 160, 1085–1091. [CrossRef]
8. Wang, L.J.; Jiang, W.B.; Huang, B.J. Promotion of 5-aminolevulinic acid on photosynthesis of melon (Cucumis melo) seedlingsunder low light and chilling stress conditions. Physiol. Plant 2004, 121, 258–264. [CrossRef]
9. Ma, N.; Qi, L.; Gao, J.; Chao, K.C.; Hu, Q.F.; Jiang, H.G.; Wang, L.J. Effects of 5-ALA on growth and chlorophyll fluorescence ofFicus carica cutting seedlings under high temperature. J. Nanjing Agric. Univ. 2015, 38, 546–553.
10. Liu, W.Q.; Kang, L.; Wang, L.J. Effect of ALA on photosynthesis of strawberry and its relationship with antioxidant enzymes.Acta Bot. Boreal. Occident. Sin. 2006, 26, 57–62.
11. Aksakal, O.; Algur, O.F.; Icoglu, A.F.; Aysin, F. Exogenous 5-aminolevulinic acid alleviates the detrimental effects of UV-B stresson lettuce (Lactuca sativa L.) seedlings. Acta Physiol. Plant 2017, 39, 55. [CrossRef]
12. Cai, C.Y.; He, S.S.; An, Y.Y.; Wang, L.J. Exogenous 5-aminolevulinic acid improves strawberry tolerance to osmotic stress and itspossible mechanisms. Physiol. Plant 2020, 168, 948–962. [CrossRef]
13. An, Y.Y.; Qi, L.; Wang, L.J. ALA pretreatment improves waterlogging tolerance of fig plants. PLoS ONE 2016, 11, e0147202.[CrossRef]
14. Liu, L.Y.; El-Shemy, H.A.; Saneoka, H. Effects of 5-aminolevulinic acid on water uptake, ionic toxicity, and antioxidant capacity ofSwiss chard (Beta vulgaris L.) under sodic-alkaline conditions. J. Plant Nutr. Soil Sci. 2017, 180, 535–543.
15. Singh, R.; Kesavan, A.K.; Landi, M.; Kaur, S.; Thakur, S.; Zheng, B.S.; Bhardwaj, R.; Sharma, A. 5-Aminolevulinic acid regulatesKrebs cycle, antioxidative system and gene expression in Brassica juncea L. to confer tolerance against lead toxicity. J. Biotechnol.2020, 323, 283–292. [CrossRef]
16. Taspinar, M.S.; Aydin, M.; Arslan, E.; Yaprak, M.; Agar, G. 5-Aminolevulinic acid improves DNA damage and DNA methylationchanges in deltamethrin-exposed Phaseolus vulgaris seedlings. Plant Physiol. Biochem. 2017, 118, 267–273. [CrossRef]
17. Xu, L.; Islam, F.; Zhang, W.F.; Ghani, M.A.; Ali, B. 5-Aminolevulinic acid alleviates herbicide-induced physiological andultrastructural changes in Brassica napus. J. Integr. Agric. 2018, 17, 579–592. [CrossRef]
18. Elansary, H.O.; El-Ansary, D.O.; Al-Mana, F.A. 5-Aminolevulinic acid and soil fertility enhance the resistance of rosemary toAlternaria dauci and Rhizoctonia solani and modulate plant biochemistry. Plants 2019, 8, 585. [CrossRef]
19. Chen, H.; Xu, L.; Li, X.; Wang, D.Y.; An, Y.Y.; Wang, L.J. Effect of 5-aminolevulinic acid on cold tolerance of Rhododendron simsiiand Cinnamomum camphora leaves. Plant Physiol. J. 2017, 53, 2103–2113.
20. Wang, D.Y.; Li, X.; Xu, L.; An, Y.Y.; Wang, L.J. Effect of 5-aminolevulinic acid on leaf heat tolerance in Ligustrum japonicum andSpiraea japonica. Bot. Res. 2018, 7, 350–365.
21. Qiu, M.H.; Li, D.Z. Study on chemotaxonomy of Buxaceae. Chin. J. Appl. Environ. Biol. 2002, 8, 387–391.22. Shen, Y.M.; Ma, G.S. Occurrence regularity and ecological control technology of diseases of hedgerow commonly used in greening
in five cities of southern Jiangsu. J. Landsc. Res. 2019, 11, 141–144.23. Tian, B. Effects of drought stress on protective enzymes and osmotic substances of Buxus megistophylla Levl. Shandong For. Sci.
Technol. 2019, 4, 64–67.24. Hou, L.Q. Effects of sustained low temperature stress on physiological characteristics of Buxus megistophylla Levl. Shandong For.
Sci. Technol. 2019, 4, 68–71.25. Li, J.X.; He, J.; Sun, Y.M.; Zhao, A.; Tain, Q. Physiological and ecological responses of ten garden plant functional traits to air
pollution. Ecol. Environ. Sci. 2020, 29, 1205–1214.26. Li, H.S. Principles and Techniques of Plant Physiological and Biochemical Experiments; Higher Education Press: Beijing, China, 2020.27. Zhang, D.Z.; Wang, P.H.; Zhao, H.X. Determination of free proline content in wheat leaves. Plant Physiol. Commun. 1990, 4, 62–65.28. Tan, W.; Liu, J.; Dai, T.; Jing, Q.; Cao, W.; Jiang, D. Alterations in photosynthesis and antioxidant enzyme activity in winter wheat
subjected to post-anthesis water-logging. Photosynthetica 2008, 46, 21–27. [CrossRef]29. Zhang, W.F.; Zhang, F.; Raziuddin, R.; Gong, H.J.; Yang, Z.M.; Lu, L.; Ye, Q.F.; Zhou, W.J. Effects of 5-aminolevulinic acid on
oilseed rape seeding growth under herbicide toxicity stress. J. Plant Growth Regul. 2008, 27, 159–169. [CrossRef]30. Change, B.; Maehly, A.C. Assay of catalases and peroxidase. Methods Enzym. 1995, 2, 764–775.31. Wang, J.B. The role of urban road greening. New Silk Road Horiz. 2011, 8, 88–90.32. Yang, X.X.; Feng, L.H.; Wei, P. Automobile exhaust pollution and its harm. Front. Sci. 2012, 6, 10–22.33. Ling, Q.Y. Physiological response and resistance of landscape plants to automobile exhaust. Green Technol. 2015, 6, 206–207.34. Chen, J.N.; Yuan, X.W.; Xiang, X.Z.; Yuan, X.H.; Li, H. Evaluation on the resistance of fourteen ground cover plants to automobile
exhaust. Resour. Environ. Arid Areas 2018, 32, 176–181.35. Li, L.B.; Kuang, T.Y. An Overview of Primary Light Energy Conversion in Photosynthesis, Principle and Regulation of Primary Energy
Transformation Process of Photosynthesis; Kuang, T.Y., Ed.; Jiangsu Science and Technology Press: Nanjing, China, 2003; pp. 3–21.36. Li, M.A.; Ma, L.; Hao, Q.; An, Y.Y.; Wang, L.J. Effect of 5-aminolevulinic acid on leaf photosynthetic characteristics, yield and
quality of potato. China Veg. 2020, 11, 43–52.37. Ou, C.; Yao, X.M.; Yao, X.J.; Ji, J.; Wang, W.G.; Guo, J. Effects of exogenous 5-aminolevulinic acid and PEG on photosynthetic and
antioxidant characteristics of Gardenia jasminoides seedlings. Agric. Res. Arid Areas 2016, 34, 235–242.38. Naeem, M.S.; Jin, Z.L.; Wan, G.L.; Liu, D.; Liu, H.B.; Yoneyama, K.; Zhou, W.J. 5-Aminolevulinic acid improves photosynthetic gas
exchange capacity and ion uptake under salinity stress in oilseed rape (Brassica napus L.). Plant Soil 2010, 332, 405–415. [CrossRef]
113

Horticulturae 2021, 7, 95
39. Zhang, L.Y.; Feng, X.X.; Gao, J.J.; An, Y.Y.; Tian, F.; Li, J.; Zhang, Z.P.; Wang, L.J. Effects of ALA solution on leaf physiologicalcharacteristics and fruit quality of apple under rhizosphere irrigation. Jiangsu J. Agric. Sci. 2015, 1, 158–165.
40. Anwar, A.; Yan, Y.; Liu, Y.; Li, Y.; Yu, X. 5-Aminolevulinic acid improves nutrient uptake and endogenous hormone accumulation,enhancing low-temperature stress tolerance in cucumbers. Int. J. Mol. Sci. 2018, 19, 3379. [CrossRef]
41. Wei, Z.Y.; Zhang, Z.P.; Lee, M.R.; Sun, Y.P.; Wang, L.J. Effect of 5-aminolevulinic acid on leaf senescence and nitrogen metabolismof pakchoi under different nitrates. J. Plant Nutr. 2012, 35, 49–63. [CrossRef]
42. Yao, S.M.; Wang, W.J.; Chen, G.X. Effects of 5-aminolevulinic acid on the uptake and distribution of 32P in rice plants. ActaPhytonutri Fertil 2006, 12, 70–75.
43. Montanaro, G.; Dichio, B.; Lang, A.; Mininni, A.; Xiloyannis, C. Fruit calcium accumulation coupled and uncoupled from itstranspiration in kiwifruit. J. Plant Physiol. 2015, 181, 67–74. [CrossRef]
44. An, Y.; Xiong, L.J.; Hu, S.; Wang, L.J. PP2A and microtubules function in 5-aminolevulinic acid-mediated H2O2 signaling inArabidopsis guard cells. Physiol. Plant 2020, 168, 709–724. [CrossRef] [PubMed]
45. Wu, W.W.; He, S.S.; An, Y.Y.; Cao, R.X.; Sun, Y.P.; Tang, Q.; Wang, L.J. Hydrogen peroxide as a mediator of 5-aminolevulinicacid-induced Na+ retention in roots for improving salt tolerance of strawberries. Physiol. Plant 2019, 167, 5–20. [CrossRef][PubMed]
46. Chen, B. Study on Heavy Metal Distribution and Pollution Characteristics of Crops in Highway Area—Taking Xisan and XiyanExpressways as Examples. Master’s Thesis, Chang’an University, Xi’an, China, 2012.
47. Ali, B.; Wang, B.; Ali, S.; Ghani, M.A.; Hayat, M.T.; Yang, C.; Xu, L.; Zhou, W.J. 5-Aminolevulinic acid ameliorates the growth,photosynthetic gas exchange capacity, and ultrastructural changes under cadmium stress in Brassica napus L. J. Plant Growth Regul.2013, 32, 604–614. [CrossRef]
48. Xu, L.; Li, J.J.; Najee, U.; Li, X.; Pan, J.M.; Huang, Q.; Zhou, W.J.; Liang, Z.S. Synergistic effects of EDDS and ALA onphytoextraction of cadmium as revealed by biochemical and ultrastructural changes in sunflower (Helianthus annuus L.) tissues. J.Hazard. Mater. 2020, 407, 124764. [CrossRef]
49. Zhang, X.H.; Guo, Y.L.; Lin, A.J.; Huang, Y.Z. Effects of arbuscular mycorrhizal fungi colonization on toxicity of soil contaminatedby heavy metals to Vicia faba. Chin. J. Environ. Eng. 2008, 2, 274–278.
50. Wang, H.X.; Han, L.L.; Li, Y.; Zhang, L.L.; Li, X.; Yuan, Z.L. Study on mitigation of cadmium stress in wheat seedlings byinoculation with arbuscular mycorrhizal fungi. J. Henan Agric. Univ. 2021, 55, 29–34.
114
horticulturae
Article
Exogenous Application of Chitosan Alleviate Salinity Stress inLettuce (Lactuca sativa L.)
Geng Zhang 1,2,†, Yuanhua Wang 1,2,†, Kai Wu 3, Qing Zhang 1,2, Yingna Feng 1,2, Yu Miao 1 and Zhiming Yan 1,2,*
Citation: Zhang, G.; Wang, Y.; Wu,
K.; Zhang, Q.; Feng, Y.; Miao, Y.; Yan,
Z. Exogenous Application of
Chitosan Alleviate Salinity Stress in
Lettuce (Lactuca sativa L.).
Horticulturae 2021, 7, 342. https://
doi.org/10.3390/horticulturae7100342
Academic Editors:
Agnieszka Hanaka,
Jolanta Jaroszuk-Sciseł and
Małgorzata Majewska
Received: 24 August 2021
Accepted: 22 September 2021
Published: 24 September 2021
Publisher’s Note: MDPI stays neutral
with regard to jurisdictional claims in
published maps and institutional affil-
iations.
Copyright: © 2021 by the authors.
Licensee MDPI, Basel, Switzerland.
This article is an open access article
distributed under the terms and
conditions of the Creative Commons
Attribution (CC BY) license (https://
creativecommons.org/licenses/by/
4.0/).
1 Department of Agronomy and Horticulture, Jiangsu Vocational College of Agriculture and Forestry,Jurong 212400, China; [email protected] (G.Z.); [email protected] (Y.W.);[email protected] (Q.Z.); [email protected] (Y.F.); [email protected] (Y.M.)
2 Engineering and Technical Center for Modern Horticulture, Jiangsu Vocational College of Agricultureand Forestry, Jurong 212400, China
3 China Agriculture Press, Beijing 100125, China; [email protected]* Correspondence: [email protected]† These authors contributed equally to this work.
Abstract: Soil salinity is one of the major factors that affect plant growth and decrease agriculturalproductivity worldwide. Chitosan (CTS) has been shown to promote plant growth and increasethe abiotic stress tolerance of plants. However, it still remains unknown whether the applicationof exogenous CTS can mitigate the deleterious effects of salt stress on lettuce plants. Therefore, thecurrent study investigated the effect of foliar application of exogenous CTS to lettuce plants grownunder 100 mM NaCl saline conditions. The results showed that exogenous CTS increased the lettucetotal leaf area, shoot fresh weight, and shoot and root dry weight, increased leaf chlorophyll a, proline,and soluble sugar contents, enhanced peroxidase and catalase activities, and alleviated membranelipid peroxidation, in comparison with untreated plants, in response to salt stress. Furthermore, theapplication of exogenous CTS increased the accumulation of K+ in lettuce but showed no significanteffect on the K+/Na+ ratio, as compared with that of plants treated with NaCl alone. These resultssuggested that exogenous CTS might mitigate the adverse effects of salt stress on plant growth andbiomass by modulating the intracellular ion concentration, controlling osmotic adjustment, andincreasing antioxidant enzymatic activity in lettuce leaves.
Keywords: antioxidant enzymes; chitosan (CTS); lettuce; proline; salinity; soluble sugars
1. Introduction
Saline stress is a harmful form of abiotic stress that restricts the growth and function ofplants and thus can cause a 10%–25% decrease in the yield of many agricultural crops [1].More than 20% of global farmland is affected by various degrees of salinity, and thefarmland area (approximately 20,000 km2 per year) affected by salinity is increasing eachyear, which severely limits agricultural productivity [2,3]. Salinity in soils can occurnaturally or as a result of human activities. Weathering of rock minerals and floodingby seawater causes inherent soil salinity. Irrigation water with a high salt concentration,excessive chemical fertilization, and poor soil management are the main reasons for anincrease in the area of saline–alkali land [4,5]. In some semi-arid and arid areas (e.g., Saharain North Africa, Saudi Arabia, large parts of Iran and Iraq, parts of Asia, California in theUSA, South Africa, and most of Australia), high temperatures and uneven distributionof rainfall result in higher evapotranspiration rates than the size of the leaching fraction,which causes an accumulation of soluble salts in the plough layer [6]. To increase theoutput of salinized agricultural land, the salt tolerance of plants must be increased and theconditions of saline–alkali land must be improved.
Salt stress negatively influences several processes in plant growth and productionby causing ion toxicity, hyperosmotic stress, nutritional imbalance, oxidative damage,
Horticulturae 2021, 7, 342. https://doi.org/10.3390/horticulturae7100342 https://www.mdpi.com/journal/horticulturae
115

Horticulturae 2021, 7, 342
metabolic disorders, and photoinhibition [4,7]. Because of their sessile nature, plants mustevolve several mechanisms to adapt to high-salinity environments. The various physio-logical and biochemical processes that plants use to adapt to salt stress can be groupedinto three categories: Osmotic stress, ionic stress, and detoxification responses [8]. Plants’primary response to salt stress is osmotic stress. Plants adjust their osmotic balance byaccumulating organic and inorganic osmolytes, such as proline, glycine betaine, solu-ble sugar, soluble protein, and sodium (Na+) and potassium (K+) ions, to maintain cellturgor [2,9,10]. Na+ and chloride (Cl−) enter the root system through nonselective cationchannels, K+ transporters, and Cl− transporters [11]. The excessive accumulation of Na+
and Cl− in plant cells and tissues can adversely affect the growth and development ofplants by disturbing the water structure, inhibiting enzymes, and creating nutritionalimbalance [12,13]. Plants usually maintain a balanced cytosolic Na+/K+ ratio through Na+
and K+ transporters and channels [12]. Salt stress also causes the accumulation of reactiveoxygen species (ROS), which results in oxidative-stress-induced toxic effects in plants.ROS sources, such as superoxide radical (O2
−), hydrogen peroxide (H2O2), and hydroxylradical (·OH), are generated by plants’ photosynthetic and respiratory electron transportchains, xanthine oxidase, and nicotinamide adenine dinucleotide phosphate oxidase [14].Normally, cellular ROS levels are regulated by enzymatic (e.g., ROS scavenging enzymes)and nonenzymatic scavengers (e.g., ascorbic acid [AsA], glutathione, and carotenoids)to mitigate the ROS-induced damage caused by salt stress [15,16]. However, althoughplants adopt these strategies to reduce the harmful effect of salt stress, survival in a saltyenvironment is difficult, let alone producing a good yield.
Chitosan (poly[1,4]-2-amino-2-deoxy-D-glucose; CTS) is a biopolymer obtained throughthe deacetylation of nontoxic and biofunctional chitin from the exoskeleton of crustaceans [17].Chitosan has three types of functional groups on its backbone: The amino/acetamidogroup, and primary and secondary hydroxyl groups, which enhance its affinity for ionsand various pollutants [18]. CTS is a natural, low-toxicity, biodegradable, environmentallyfriendly, renewable, and inexpensive resource and has many applications in the agriculturesector [19]. Since the discovery of CTS by Rouget in 1859 [20], several studies have provenits role in enhancing plant growth and increasing plants’ abiotic stress tolerance [21], in-cluding rice [19], maize [22], safflower and sunflower [23], and creeping bentgrass [24].The beneficial role of CTS in stress mitigation is broadly attributable to the alleviation of ox-idative stress [25] and the increase in water use efficiency [26], mineral nutrient uptake [27],chlorophyll (Chl) content, and photosynthesis [28] caused by CTS. The application ofexogenous CTS increases plants’ tolerance to several forms of stress, such as drought, salt,osmotic, and low-temperature stress [19,22,23,29]. Certain concentrations of exogenousCTS have been used to increase plants’ resistance to several biotic and abiotic stresses byincreasing water use efficiency, enhancing antioxidant activity, and regulating the contentof osmotic regulation substances and defense gene expression [17,26,30–32].
Lettuce (Lactuca sativa L.) is a leafy vegetable mainly consumed raw and in saladmixes [33]. The production and cultivation area of lettuce has increased because of itsmarketability, sensory characteristics, and health-promoting properties [5,34]. Accordingto the last available FAO data (http://www.fao.org/faostat/en/#data/QC, accessed on19 September 2021), the global cultivation area and yield of lettuce were 243.97 thousandhectares and 16.31 million tonnes in 2019, an increase of 0.54% and 2.3% over 2018, re-spectively. The majority of lettuce comes from China, the United States, and India—theworld’s top three lettuce producers. Lettuce is a moderately to highly salt-sensitive veg-etable [35]. Salinity reduces the seed germination rate, leaf number, photosynthesis, and cellgrowth and increases the accumulation of ROS, which negatively affects lettuce growth andyield [36,37]. Although the negative effects of salinity on lettuce have been studied [36,38],information regarding the effects of CTS on lettuce growth and production under salineconditions is lacking. Therefore, the present study evaluated the effectiveness of exogenousCTS in mitigating the adverse effects of salinity on the growth and physiological attributesof lettuce plants. In addition, this study identified the effects of exogenous CTS on the
116

Horticulturae 2021, 7, 342
accumulation of osmolytes, the biosynthesis of antioxidants, and the activity of antioxidantenzymes in lettuce under saline conditions.
2. Materials and Methods
2.1. Plant Materials and Treatments
Romaine lettuce (Lactuca sativa var. longifolia L. cv. Romana, Takii seed, Japan) wasused as the test material, and an experiment was conducted from November 2020 to January2021. Lettuce seeds were sown in urethane cubes (2.3 × 2.3 × 2.7 cm3), and the seedlingswere cultivated in a 22 ◦C growth chamber at 200 ± 10 μmol·m−2·s−1 photosyntheticphoton flux for 12 h by using cool white fluorescent lamps (Figure 1A). At 21 days aftersowing (DAS), uniform seedlings were selected and transplanted into a cultivation room ofthe Engineering and Technical Center for Modern Horticulture in Jurong. The plants weregrown in a deep-flow hydroponic system in an Enshi formula nutrient solution (electricalconductivity [EC]: 1.5 ± 0.2, pH: 6.9 ± 0.2) [39]. Air pumps were used to oxygenate thenutrient solution and supply a constant stream of oxygen. The lighting for plant cultivationwas provided by light-emitting diode lights (Figure 1B). The photosynthetic photon fluxdensity of the light was 200 ± 10 μmol·m−2·s−1, and its photoperiod was 16 h. The airtemperature was maintained as 25 ◦C during the day and 20 ◦C at night, with the relativehumidity being maintained as 65% ± 5%.
Figure 1. The relative spectral photon flux of (A) cool white fluorescent lamps and (B) LED lights.The wavelengths of light sources were recorded at 380–800 nm with a spectrometer.
All treatments were performed at 7 days after transplanting (28 DAS) into the cul-tivation room, so that the lettuce seedlings were well adapted to the environment of thecultivation room. The treatments were divided into four groups: (1) The control group, inwhich the plants were grown in a nutrient solution with water sprayed on the leaf surface;(2) the CTS group, in which the plants were grown under the same conditions as those ofthe control group and 100 mg/L of CTS (instead of water) was sprayed on the leaf surface;(3) the NaCl group, in which the plants were grown in a nutrient solution containing100 mM NaCl and water was sprayed on the leaf surface; and (4) the NaCl + CTS group, inwhich the plants were grown under the same conditions as those of the NaCl group and100 mg/L of CTS (instead of water) was sprayed on the leaf surface. CTS or water wassprayed on the leaves of the hydroponically grown lettuce continuously for 5 days from
117
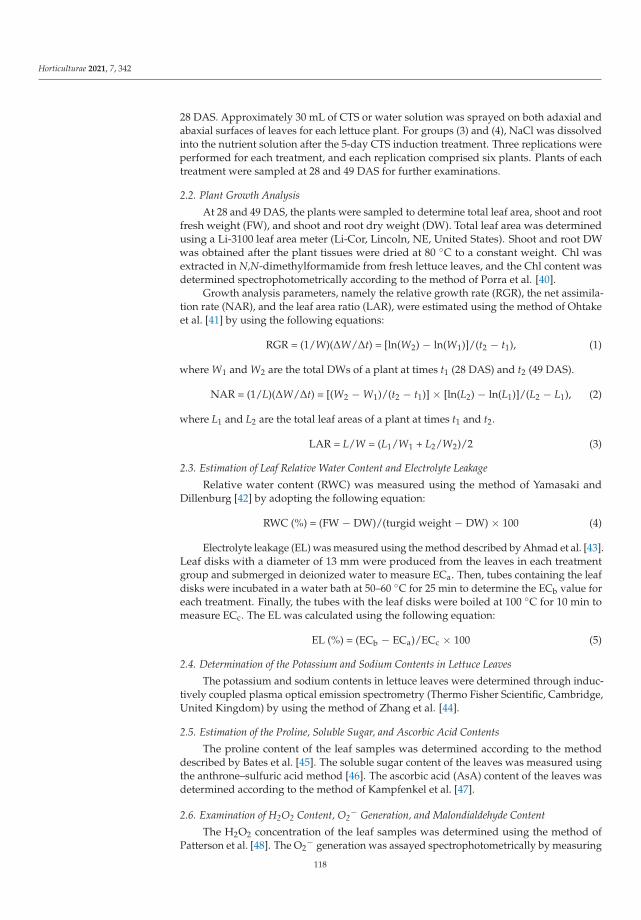
Horticulturae 2021, 7, 342
28 DAS. Approximately 30 mL of CTS or water solution was sprayed on both adaxial andabaxial surfaces of leaves for each lettuce plant. For groups (3) and (4), NaCl was dissolvedinto the nutrient solution after the 5-day CTS induction treatment. Three replications wereperformed for each treatment, and each replication comprised six plants. Plants of eachtreatment were sampled at 28 and 49 DAS for further examinations.
2.2. Plant Growth Analysis
At 28 and 49 DAS, the plants were sampled to determine total leaf area, shoot and rootfresh weight (FW), and shoot and root dry weight (DW). Total leaf area was determinedusing a Li-3100 leaf area meter (Li-Cor, Lincoln, NE, United States). Shoot and root DWwas obtained after the plant tissues were dried at 80 ◦C to a constant weight. Chl wasextracted in N,N-dimethylformamide from fresh lettuce leaves, and the Chl content wasdetermined spectrophotometrically according to the method of Porra et al. [40].
Growth analysis parameters, namely the relative growth rate (RGR), the net assimila-tion rate (NAR), and the leaf area ratio (LAR), were estimated using the method of Ohtakeet al. [41] by using the following equations:
RGR = (1/W)(ΔW/Δt) = [ln(W2) − ln(W1)]/(t2 − t1), (1)
where W1 and W2 are the total DWs of a plant at times t1 (28 DAS) and t2 (49 DAS).
NAR = (1/L)(ΔW/Δt) = [(W2 − W1)/(t2 − t1)] × [ln(L2) − ln(L1)]/(L2 − L1), (2)
where L1 and L2 are the total leaf areas of a plant at times t1 and t2.
LAR = L/W = (L1/W1 + L2/W2)/2 (3)
2.3. Estimation of Leaf Relative Water Content and Electrolyte Leakage
Relative water content (RWC) was measured using the method of Yamasaki andDillenburg [42] by adopting the following equation:
RWC (%) = (FW − DW)/(turgid weight − DW) × 100 (4)
Electrolyte leakage (EL) was measured using the method described by Ahmad et al. [43].Leaf disks with a diameter of 13 mm were produced from the leaves in each treatmentgroup and submerged in deionized water to measure ECa. Then, tubes containing the leafdisks were incubated in a water bath at 50–60 ◦C for 25 min to determine the ECb value foreach treatment. Finally, the tubes with the leaf disks were boiled at 100 ◦C for 10 min tomeasure ECc. The EL was calculated using the following equation:
EL (%) = (ECb − ECa)/ECc × 100 (5)
2.4. Determination of the Potassium and Sodium Contents in Lettuce Leaves
The potassium and sodium contents in lettuce leaves were determined through induc-tively coupled plasma optical emission spectrometry (Thermo Fisher Scientific, Cambridge,United Kingdom) by using the method of Zhang et al. [44].
2.5. Estimation of the Proline, Soluble Sugar, and Ascorbic Acid Contents
The proline content of the leaf samples was determined according to the methoddescribed by Bates et al. [45]. The soluble sugar content of the leaves was measured usingthe anthrone–sulfuric acid method [46]. The ascorbic acid (AsA) content of the leaves wasdetermined according to the method of Kampfenkel et al. [47].
2.6. Examination of H2O2 Content, O2− Generation, and Malondialdehyde Content
The H2O2 concentration of the leaf samples was determined using the method ofPatterson et al. [48]. The O2
− generation was assayed spectrophotometrically by measuring
118

Horticulturae 2021, 7, 342
the reduction of nitroblue tetrazolium by using the method of Averina et al. [49]. Themalondialdehyde (MDA) concentration of the leaf samples was estimated using the methodof Heath et al. [50]. The absorbance of the leaf samples was measured at 450, 532, and600 nm by using a spectrophotometer.
2.7. Enzyme Assays
The fresh leaf samples were homogenized in phosphate buffer saline (50 mM, pH 7.8),and the homogenate was centrifuged at 10,000 × g and 4 ◦C for 15 min. The supernatantswere collected to determine the superoxide dismutase (SOD; EC: 1.15.1.1), peroxidase(POD; EC: 1.11.1.7), and catalase (CAT; EC: 1.11.1.6) activity [51]. Protein content wasdetermined using the method of Bradford [52]. The activity of the enzymes was expressedin units per milligram of protein.
2.8. Statistical Analysis
The data are presented as the means ± standard errors (SEs) of the three replicationsfor each treatment. Statistical analysis was performed using one-way analysis of variancewith Tukey’s HSD test (SPSS v. 18.0, IBM Inc., Chicago, IL, USA). p values of ≤0.05 wereconsidered significant.
3. Results
3.1. Exogenous CTS Improved the Growth and Biomass of Lettuce under NaCl Stress
Compared with the control plants, the lettuce plants exposed to NaCl stress exhibitedconsiderably inhibited plant growth in terms of a lower total leaf area, shoot FW, and shootDW (Table 1). The total leaf area, shoot FW, root FW, shoot DW, and root DW of the NaClgroup were 67.3%, 60.3%, 73.8%, 66.5%, and 51.6% lower, respectively, than those of thecontrol group (Table 1). The application of 100 mg/L of exogenous CTS mitigated thelettuce growth inhibition caused by the salinity stress (Figure 2A). The total leaf area, shootFW, root FW, shoot DW, and root DW of the NaCl + CTS group were 141.2%, 127.3%, 72.3%,95.0%, and 60.0% higher, respectively, than those of the NaCl group (Table 1). The total leafarea, shoot FW, root FW, shoot DW, and root DW of the NaCl + CTS group were 21.2%,40.4%, 31.5%, 34.7%, and 22.6% lower, respectively, than those of the control group (Table 1).However, no significant change in the aforementioned growth parameters was observedbetween the CTS and control groups (Table 1). The Chl a, Chl b, and total Chl contents ofthe NaCl group were 14.4%, 20.6%, and 16.1% lower, respectively, than those of the controlgroup (Table 1). The Chl a and total Chl contents of the NaCl + CTS group were 10.1% and8.6% higher, respectively, than those of the NaCl group (Table 1). The Chl b and total Chlcontents of the NaCl + CTS group were 17.3% and 8.9% lower, respectively, than those of thecontrol group (Table 1). In addition, the Chl a content of the plants subjected to exogenousCTS treatment alone were significantly higher than that of the control group (Table 1).
Plant biomass is strongly and positively correlated to RGR, and plant growth anal-ysis decomposes RGR into NAR and LAR. In order to determine how physiological andmorphological traits contribute to the plant biomass of each group, the growth analysisparameters of each group were estimated using total plant DW and total leaf area as de-scribed in the aforementioned text. The RGR of the NaCl group was significantly lowerthan that of the control group and corresponded to the lowest DW (Figure 2B, Table 1).The decrease in the RGR of the NaCl group was mitigated by the application of 100 mg/Lof exogenous CTS (Figure 2B). A similar trend was observed in NAR, and the lowestNAR was observed for the NaCl group. Moreover, an insignificant difference in NAR wasobserved between the NaCl + CTS and NaCl groups (Figure 2C). No significant differencein LAR was observed among all the groups (Figure 2D). Similar to the growth parameters,no significant changes in the aforementioned growth analysis parameters were observedbetween the CTS and control groups.
119
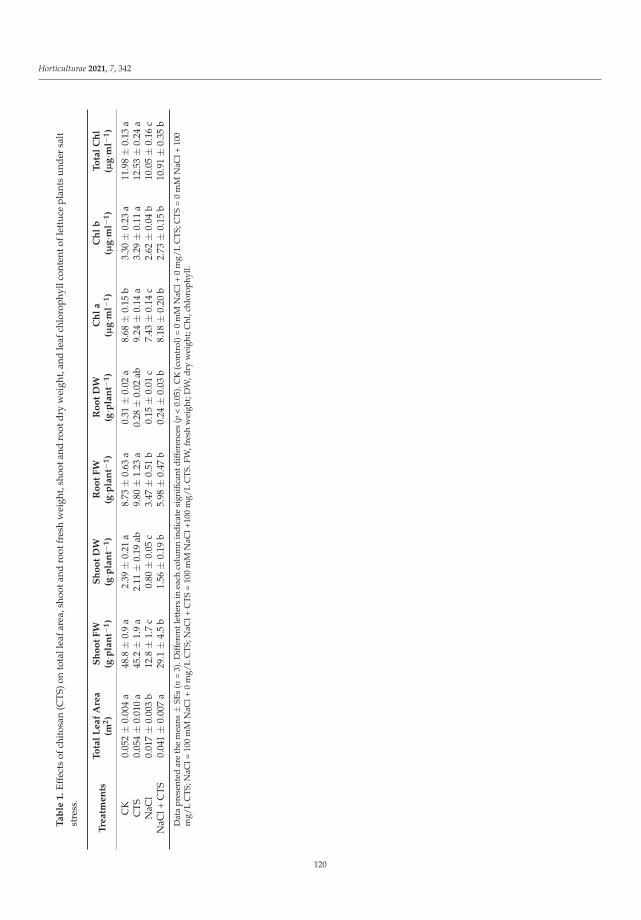
Horticulturae 2021, 7, 342T
ab
le1
.Ef
fect
sof
chit
osan
(CT
S)on
tota
llea
fare
a,sh
oota
ndro
otfr
esh
wei
ght,
shoo
tand
root
dry
wei
ght,
and
leaf
chlo
roph
yllc
onte
ntof
lett
uce
plan
tsun
der
salt
stre
ss.
Tre
atm
en
tsT
ota
lL
ea
fA
rea
(m2)
Sh
oo
tF
W(g·p
lan
t−1)
Sh
oo
tD
W(g·p
lan
t−1)
Ro
ot
FW
(g·p
lan
t−1)
Ro
ot
DW
(g·p
lan
t−1)
Ch
la
(μg·m
l−1)
Ch
lb
(μg·m
l−1)
To
tal
Ch
l(μ
g·m
l−1)
CK
0.05
2±
0.00
4a
48.8±
0.9
a2.
39±
0.21
a8.
73±
0.63
a0.
31±
0.02
a8.
68±
0.15
b3.
30±
0.23
a11
.98±
0.13
aC
TS0.
054±
0.01
0a
45.2±
1.9
a2.
11±
0.19
ab9.
80±
1.23
a0.
28±
0.02
ab9.
24±
0.14
a3.
29±
0.11
a12
.53±
0.24
aN
aCl
0.01
7±
0.00
3b
12.8±
1.7
c0.
80±
0.05
c3.
47±
0.51
b0.
15±
0.01
c7.
43±
0.14
c2.
62±
0.04
b10
.05±
0.16
cN
aCl+
CTS
0.04
1±
0.00
7a
29.1±
4.5
b1.
56±
0.19
b5.
98±
0.47
b0.
24±
0.03
b8.
18±
0.20
b2.
73±
0.15
b10
.91±
0.35
b
Dat
apr
esen
ted
are
the
mea
ns±
SEs
(n=
3).D
iffer
entl
ette
rsin
each
colu
mn
indi
cate
sign
ifica
ntdi
ffer
ence
s(p
<0.
05).
CK
(con
trol
)=0
mM
NaC
l+0
mg/
LC
TS;C
TS=
0m
MN
aCl+
100
mg/
LC
TS;N
aCl=
100
mM
NaC
l+0
mg/
LC
TS;N
aCl+
CTS
=10
0m
MN
aCl+
100
mg/
LC
TS.F
W,f
resh
wei
ght;
DW
,dry
wei
ght;
Chl
,chl
orop
hyll.
120
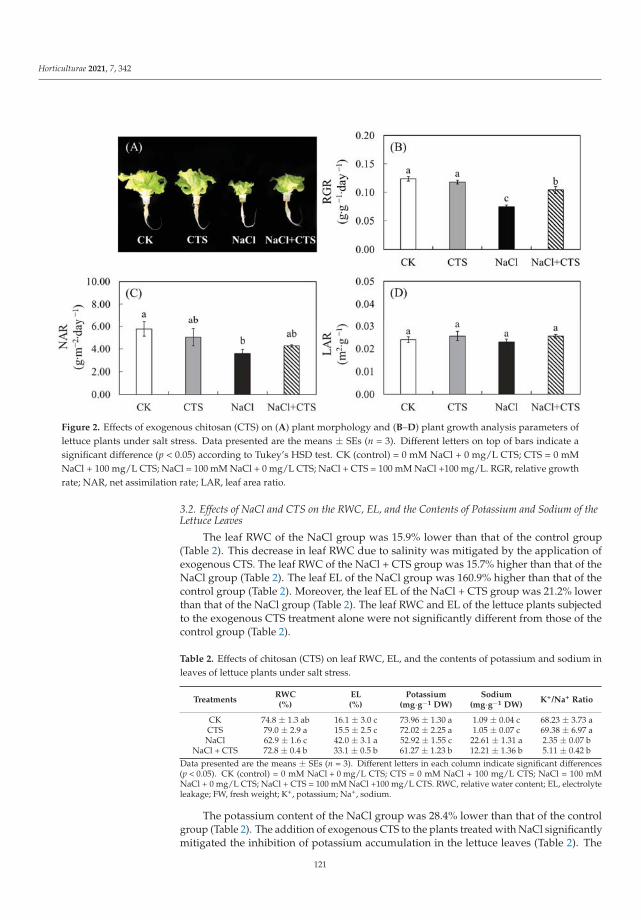
Horticulturae 2021, 7, 342
Figure 2. Effects of exogenous chitosan (CTS) on (A) plant morphology and (B–D) plant growth analysis parameters oflettuce plants under salt stress. Data presented are the means ± SEs (n = 3). Different letters on top of bars indicate asignificant difference (p < 0.05) according to Tukey’s HSD test. CK (control) = 0 mM NaCl + 0 mg/L CTS; CTS = 0 mMNaCl + 100 mg/L CTS; NaCl = 100 mM NaCl + 0 mg/L CTS; NaCl + CTS = 100 mM NaCl +100 mg/L. RGR, relative growthrate; NAR, net assimilation rate; LAR, leaf area ratio.
3.2. Effects of NaCl and CTS on the RWC, EL, and the Contents of Potassium and Sodium of theLettuce Leaves
The leaf RWC of the NaCl group was 15.9% lower than that of the control group(Table 2). This decrease in leaf RWC due to salinity was mitigated by the application ofexogenous CTS. The leaf RWC of the NaCl + CTS group was 15.7% higher than that of theNaCl group (Table 2). The leaf EL of the NaCl group was 160.9% higher than that of thecontrol group (Table 2). Moreover, the leaf EL of the NaCl + CTS group was 21.2% lowerthan that of the NaCl group (Table 2). The leaf RWC and EL of the lettuce plants subjectedto the exogenous CTS treatment alone were not significantly different from those of thecontrol group (Table 2).
Table 2. Effects of chitosan (CTS) on leaf RWC, EL, and the contents of potassium and sodium inleaves of lettuce plants under salt stress.
TreatmentsRWC(%)
EL(%)
Potassium(mg·g−1 DW)
Sodium(mg·g−1 DW)
K+/Na+ Ratio
CK 74.8 ± 1.3 ab 16.1 ± 3.0 c 73.96 ± 1.30 a 1.09 ± 0.04 c 68.23 ± 3.73 aCTS 79.0 ± 2.9 a 15.5 ± 2.5 c 72.02 ± 2.25 a 1.05 ± 0.07 c 69.38 ± 6.97 aNaCl 62.9 ± 1.6 c 42.0 ± 3.1 a 52.92 ± 1.55 c 22.61 ± 1.31 a 2.35 ± 0.07 b
NaCl + CTS 72.8 ± 0.4 b 33.1 ± 0.5 b 61.27 ± 1.23 b 12.21 ± 1.36 b 5.11 ± 0.42 bData presented are the means ± SEs (n = 3). Different letters in each column indicate significant differences(p < 0.05). CK (control) = 0 mM NaCl + 0 mg/L CTS; CTS = 0 mM NaCl + 100 mg/L CTS; NaCl = 100 mMNaCl + 0 mg/L CTS; NaCl + CTS = 100 mM NaCl +100 mg/L CTS. RWC, relative water content; EL, electrolyteleakage; FW, fresh weight; K+, potassium; Na+, sodium.
The potassium content of the NaCl group was 28.4% lower than that of the controlgroup (Table 2). The addition of exogenous CTS to the plants treated with NaCl significantlymitigated the inhibition of potassium accumulation in the lettuce leaves (Table 2). The
121
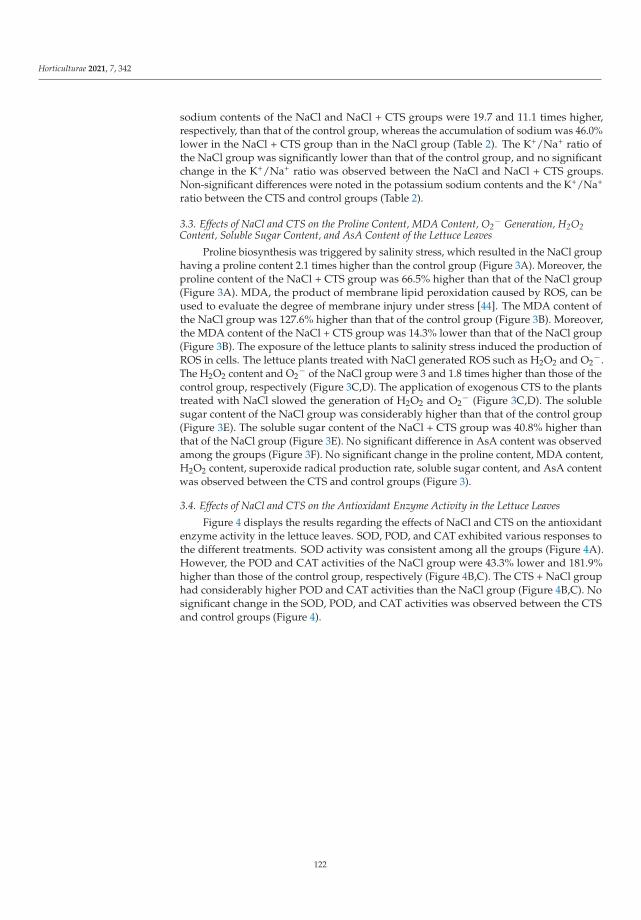
Horticulturae 2021, 7, 342
sodium contents of the NaCl and NaCl + CTS groups were 19.7 and 11.1 times higher,respectively, than that of the control group, whereas the accumulation of sodium was 46.0%lower in the NaCl + CTS group than in the NaCl group (Table 2). The K+/Na+ ratio ofthe NaCl group was significantly lower than that of the control group, and no significantchange in the K+/Na+ ratio was observed between the NaCl and NaCl + CTS groups.Non-significant differences were noted in the potassium sodium contents and the K+/Na+
ratio between the CTS and control groups (Table 2).
3.3. Effects of NaCl and CTS on the Proline Content, MDA Content, O2− Generation, H2O2
Content, Soluble Sugar Content, and AsA Content of the Lettuce Leaves
Proline biosynthesis was triggered by salinity stress, which resulted in the NaCl grouphaving a proline content 2.1 times higher than the control group (Figure 3A). Moreover, theproline content of the NaCl + CTS group was 66.5% higher than that of the NaCl group(Figure 3A). MDA, the product of membrane lipid peroxidation caused by ROS, can beused to evaluate the degree of membrane injury under stress [44]. The MDA content ofthe NaCl group was 127.6% higher than that of the control group (Figure 3B). Moreover,the MDA content of the NaCl + CTS group was 14.3% lower than that of the NaCl group(Figure 3B). The exposure of the lettuce plants to salinity stress induced the production ofROS in cells. The lettuce plants treated with NaCl generated ROS such as H2O2 and O2
−.The H2O2 content and O2
− of the NaCl group were 3 and 1.8 times higher than those of thecontrol group, respectively (Figure 3C,D). The application of exogenous CTS to the plantstreated with NaCl slowed the generation of H2O2 and O2
− (Figure 3C,D). The solublesugar content of the NaCl group was considerably higher than that of the control group(Figure 3E). The soluble sugar content of the NaCl + CTS group was 40.8% higher thanthat of the NaCl group (Figure 3E). No significant difference in AsA content was observedamong the groups (Figure 3F). No significant change in the proline content, MDA content,H2O2 content, superoxide radical production rate, soluble sugar content, and AsA contentwas observed between the CTS and control groups (Figure 3).
3.4. Effects of NaCl and CTS on the Antioxidant Enzyme Activity in the Lettuce Leaves
Figure 4 displays the results regarding the effects of NaCl and CTS on the antioxidantenzyme activity in the lettuce leaves. SOD, POD, and CAT exhibited various responses tothe different treatments. SOD activity was consistent among all the groups (Figure 4A).However, the POD and CAT activities of the NaCl group were 43.3% lower and 181.9%higher than those of the control group, respectively (Figure 4B,C). The CTS + NaCl grouphad considerably higher POD and CAT activities than the NaCl group (Figure 4B,C). Nosignificant change in the SOD, POD, and CAT activities was observed between the CTSand control groups (Figure 4).
122
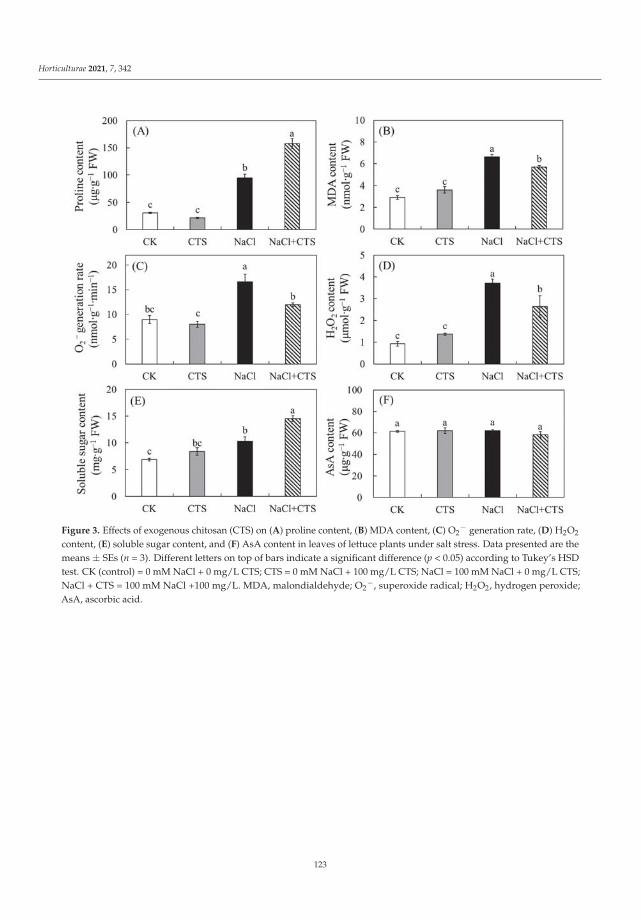
Horticulturae 2021, 7, 342
Figure 3. Effects of exogenous chitosan (CTS) on (A) proline content, (B) MDA content, (C) O2− generation rate, (D) H2O2
content, (E) soluble sugar content, and (F) AsA content in leaves of lettuce plants under salt stress. Data presented are themeans ± SEs (n = 3). Different letters on top of bars indicate a significant difference (p < 0.05) according to Tukey’s HSDtest. CK (control) = 0 mM NaCl + 0 mg/L CTS; CTS = 0 mM NaCl + 100 mg/L CTS; NaCl = 100 mM NaCl + 0 mg/L CTS;NaCl + CTS = 100 mM NaCl +100 mg/L. MDA, malondialdehyde; O2
−, superoxide radical; H2O2, hydrogen peroxide;AsA, ascorbic acid.
123
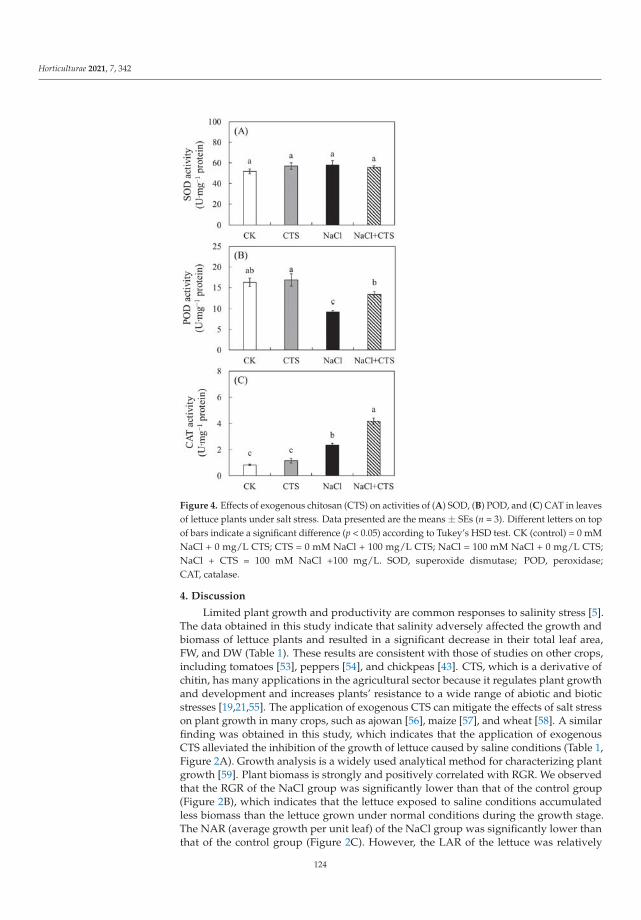
Horticulturae 2021, 7, 342
Figure 4. Effects of exogenous chitosan (CTS) on activities of (A) SOD, (B) POD, and (C) CAT in leavesof lettuce plants under salt stress. Data presented are the means ± SEs (n = 3). Different letters on topof bars indicate a significant difference (p < 0.05) according to Tukey’s HSD test. CK (control) = 0 mMNaCl + 0 mg/L CTS; CTS = 0 mM NaCl + 100 mg/L CTS; NaCl = 100 mM NaCl + 0 mg/L CTS;NaCl + CTS = 100 mM NaCl +100 mg/L. SOD, superoxide dismutase; POD, peroxidase;CAT, catalase.
4. Discussion
Limited plant growth and productivity are common responses to salinity stress [5].The data obtained in this study indicate that salinity adversely affected the growth andbiomass of lettuce plants and resulted in a significant decrease in their total leaf area,FW, and DW (Table 1). These results are consistent with those of studies on other crops,including tomatoes [53], peppers [54], and chickpeas [43]. CTS, which is a derivative ofchitin, has many applications in the agricultural sector because it regulates plant growthand development and increases plants’ resistance to a wide range of abiotic and bioticstresses [19,21,55]. The application of exogenous CTS can mitigate the effects of salt stresson plant growth in many crops, such as ajowan [56], maize [57], and wheat [58]. A similarfinding was obtained in this study, which indicates that the application of exogenousCTS alleviated the inhibition of the growth of lettuce caused by saline conditions (Table 1,Figure 2A). Growth analysis is a widely used analytical method for characterizing plantgrowth [59]. Plant biomass is strongly and positively correlated with RGR. We observedthat the RGR of the NaCl group was significantly lower than that of the control group(Figure 2B), which indicates that the lettuce exposed to saline conditions accumulatedless biomass than the lettuce grown under normal conditions during the growth stage.The NAR (average growth per unit leaf) of the NaCl group was significantly lower thanthat of the control group (Figure 2C). However, the LAR of the lettuce was relatively
124
Horticulturae 2021, 7, 342
consistent between the saline and normal conditions (Figure 2D). These results indicatethat the decrease in the RGR of the lettuce under salt stress was mainly associated withNAR and less associated with LAR. The exogenous application of CTS markedly increasedthe RGR of the lettuce under salt stress (Figure 2B), which proves that exogenous CTScan mitigate the inhibition of plant growth caused by salinity. However, we observedonly a minor variation in NAR between the NaCl + CTS and NaCl groups (Figure 2C).Thus, the increase in the RGR of the NaCl + CTS group may have been related to bothNAR and LAR. The Chl content of leaves is commonly considered a reliable predictorof the health and photosynthesis capacity of plants during growth [60,61]. Chlorophylldegradation under salt stress is usually related to the accumulation of ROS, which causeslipid peroxidation of chloroplast membranes [62]. In this study, the Chl content of theNaCl group was considerably lower than that of the control group (Table 1), which is inagreement with previous findings [63]. This result might be ascribable to the impairedbiosynthesis or accelerated degradation of Chl pigment under saline conditions [43,64]. Theapplication of exogenous CTS to the lettuce under saline conditions increased the Chl a andtotal Chl contents (Table 1). Similarly, Zou et al. [62] found that exogenous polysaccharidesincreased the Chl a content in wheat seedling leaves under salt stress. Chl a is responsiblefor the absorption of light and the initiation of photosynthesis. Excessive amounts of saltaccumulated in chloroplasts can exert a direct toxic effect on photosynthesis through thedestruction of pigment–protein complexes [65]. Thus, the increases in Chl a content inNaCl + CTS group are possibly because exogenous CTS protected Chl a from degradationin salt-stressed lettuce leaves, leading to high efficiency in photosynthesis. Moreover, theNaCl + CTS group did not exhibit a significantly higher Chl b content than the NaCl grouppossibly because Chl b tends to transform into Chl a when plants are subjected to salineconditions [66].
Leaf RWC is an accurate measure of the status of water in plants and indicatesthe water content of a leaf relative to the maximum amount of water that the leaf cancontain under full turgidity [67]. Our study indicates that salinity decreased leaf RWCsubstantially; however, the exogenous application of CTS positively affected the leaf RWCof the lettuce exposed to saline conditions (Table 2). Geng et al. [24] also found thatexogenous CTS application significantly increased the leaf RWC and water use efficiencyin creeping bentgrass under salt stress, which contributes to maintaining a better waterstatus in plants exposed to salinity stress. Thus, the results obtained from the currentstudy were possibly due to the regulation of the balance between the water supply and leaftranspiration in the lettuce of the NaCl + CTS group. Under normal conditions, the Na+
content was very low in lettuce leaves, and no significant change was observed between theCK and CTS groups (Table 2). Salt stress significantly increased Na+ content but decreasedthe K+ content in lettuce leaves (Table 2). The application of exogenous CTS increasedthe K+ content and decreased the Na+ content in the leaves of lettuce exposed to salineconditions, but the K+ content in leaves was still lower than that of the control group(Table 2). A similar trend was also found in salt-stressed wheat seedlings applied withpolysaccharides [62]. The accumulation of high levels of Na+ in plant tissues subjected tosaline conditions has a devastating effect on the metabolism of cytoplasm and organelles.As cytosolic Na+ is noxious to cells, so too is chloroplastic Na+ accumulation [12]. ExcessNa+ will cause an imbalance in cellular Na+ and K + homeostasis, which often leads toa low K+/Na+ ratio [68]. Hereafter, plants will suffer from K+ deficiencies stemmingfrom the competitive inhibition of its uptake by Na+ in plants exposed to salt stress.Potassium is an essential nutrient for plant growth and production, it is involved inthe balance of osmotic pressure and the regulation of stomatal closure, and it affectsphotosynthesis and enzymatic activity [44]. Maintaining a high shoot K+/Na+ ratio is animportant trait of plant salt tolerance [69]. In the current study, the shoot K+/Na+ ratiodecreased dramatically under saline conditions due to excessive Na+ accumulation inleaves. However, K+ accumulation in NaCl + CTS-group plants was accompanied by ahigher K+/Na+ ratio but not a significant difference compared to that of the NaCl group.
125
Horticulturae 2021, 7, 342
These results, combined with the mitigation of growth inhibition, suggest that exogenousCTS might facilitate plant growth by regulating the nutritional balance and reducing iontoxicity. A previous study has shown that polysaccharides enhanced salt tolerance in wheatby maintaining a high K+/Na+ ratio through regulation of several Na+/K+ transportergenes, coordinating the efflux and compartmentation of Na+ [58]. The study of Genget al. [24] found that CTS enhanced salt overly sensitive pathways and upregulated theexpression of AsHKT1 and genes encoding Na+/H+ exchangers under saline conditions,thus inhibiting Na+ transport to the photosynthetic tissues. In the present study, althoughthe lower Na+ content in leaves was observed in the NaCl + CTS group at harvest time,the Na+ levels in shoot and root were not evaluated in a time-response manner, and thegene expressions related to Na+ transport still have to be analyzed. To further understandthe CTS-induced salt tolerance in lettuce, future studies need to focus on examining theaccumulation pattern of Na+ in shoot and root and investigating the gene expressionsinvolved in Na+ transport.
Osmotic regulation is a major adaptation mechanism for plants to resist salt stress.High levels of osmolytes, such as proline, soluble sugars, and soluble proteins, are accu-mulated in the cytosol and other organelles to adjust osmotic pressure [17,44]. The highaccumulation of proline in the NaCl group indicated the crucial nature of this osmolyte inthe osmotic adjustment under saline conditions (Figure 3A). Under salt stress, proline canregulate osmotic potential, stabilize the cellular structure, reduce damage to the photosyn-thetic apparatus, and induce the expression of salt stress-responsive genes, consequentlyenhancing the adaption of the plant to saline conditions [58]. The application of exogenousCTS increased the proline level and Chl a content of the lettuce leaves subjected to salineconditions (Figure 3A), which suggests that exogenous CTS not only balances osmosisin cells but also protects their photosynthetic machinery. It had been proved that prolineaccumulation might be a result of a salt-induced increase in N metabolism [70]. A previousstudy found in wheat that exogenous CTS could effectively enhance N metabolism [71].Thus, it is interesting to further study whether CTS increases proline levels by modulatingN metabolism in lettuce plants during salt stress. The quantity of another vital osmolyte,namely soluble sugar, increased in the lettuce under saline conditions regardless of whetherthe leaves were treated with exogenous CTS; however, the soluble sugar levels of lettuceleaves treated with exogenous CTS were considerably higher than those of lettuce leavestreated with NaCl alone (Figure 3E). Because soluble sugar plays a key role in many physi-ological and biochemical processes, including photosynthesis, ROS scavenging, and theinduction of adaptive pathway destructive conditions, a substantial increase in the totalsoluble sugar content may effectively protect lettuce plants exposed to NaCl stress [72,73].
Salt stress triggers the generation of a large number of ROS, such as O2−, H2O2,
and ·OH, which poses challenges to plant cells [74,75]. The excessive generation of ROScauses the oxidation of lipids and proteins and the breakage of nucleic acids and limitsthe effectiveness of enzymes, which results in abnormalities at the cellular level and thusthe inhibition of plant growth [43,76]. MDA, which is the final product of membrane lipidperoxidation caused by ROS, is generally an indicator of the degree of cell membranedamage in plants subjected to stress [77,78]. The results of our experiment reveal thatthe O2
−, H2O2, MDA contents, and EL of the NaCl group were considerably higher thanthose of the control group, which indicates that the integrity and stability of the cellmembrane decreased due ROS-induced oxidative damage (Figure 3B–D; Table 2). The O2
−,H2O2, and MDA contents and EL of the CTS + NaCl group were lower than those of theNaCl group (Figure 3B–D; Table 2). These results suggest that CTS can mitigate oxidativedamage and regulate the stability of the cell membrane system under saline conditions.Moreover, the observed significant increases in Chl a content and reductions in the MDAlevel in lettuce leaves of NaCl + CTS group also proved that exogenous CTS reduced lipidperoxidation and mitigated the salt-induced reduction in chlorophyll content (Figure 3B;Table 1). Similarly, Turk [57] reported that the application of exogenous CTS decreases ROSlevels and lipid peroxidation in peppers under salt stress.
126
Horticulturae 2021, 7, 342
Plants possess a wide range of radical scavenging systems to manage oxidativedamage, including antioxidative enzymes, such as SOD, POD, and CAT, and nonenzymaticcompounds, such as proline and AsA [44,79–81]. SOD is a major O2
− scavenger thatcatalyzes O2
− to H2O2 and O2 [82]. Thereafter, the toxic H2O2 can be removed by POD,CAT, or ascorbate peroxidase [83,84]. In the current study, the O2
−, H2O2, and MDAcontents of the NaCl group were considerably higher than those of the control group(Figure 3B–D). Moreover, the CAT and POD activities of the NaCl group were lower andhigher, respectively, than those of the control group (Figure 4). The exogenous applicationof CTS significantly decreased the O2
−, H2O2, and MDA levels and considerably increasedthe POD and CAT activities (Figure 3B–D and Figure 4). These results are consistent withthose of studies on maize [57] and suggest that the exogenous application of CTS canmitigate the damage to the cell membrane system by salt stress by increasing the PODand CAT activities in lettuce leaves. The enzymatic activities of POD and CAT may haveplayed a more crucial role than that of SOD in scavenging the overproduction of ROS inthe plants treated with NaCl alone because no significant difference was observed in SODactivity among all the groups (Figure 4). However, the current study did not investigatethe expression patterns of SOD, CAT, and POD genes, and additional studies should beconducted on this topic. In addition, studies have indicated that proline and AsA are potentantioxidants that can scavenge various types of ROS and shield the cell from oxidativedamage [85,86]. In the current study, the application of exogenous CTS significantlyincreased the proline content of the lettuce leaves (Figure 3A), indicating that lettucemay accumulate high levels of proline to scavenge ROS, decrease oxidative damage, andsafeguard cell membranes from the adverse effects of salt stress. No significant differencewas observed in the AsA contents of the CTS + NaCl and NaCl groups (Figure 3F), whichsuggests that AsA may not play an important role in maintaining the strong antioxidantcapacity of lettuce under saline conditions. A current study also found that exogenousoligo-alginate in NaCl-treated plants did not change the AsA content [87].
5. Conclusions
CTS, a natural polysaccharide, has many applications in the agriculture sector asan exogenous additive substance, being both safe and cheap. In the present study, theeffects of exogenous CTS on lettuce plants under salt stress were investigated. The re-sults showed that exogenous CTS could improve plant growth and biomass under saltstress. Exogenous CTS application increased proline and soluble sugar accumulationsand enhanced peroxidase and catalase activities, thereby reducing oxidative damage toleaves. The CTS also curbed the accumulation of sodium but enhanced the accumulationof potassium in the leaves of NaCl-treated plants. These outcomes may help optimizethe production technology of lettuce under saline conditions. However, the mechanismof CTS on alleviating salinity damage is still not fully understood. Future studies shouldfocus on analyzing Na+/K+ transporter gene expressions and possible signal transductionpathways involved in CTS-regulated increased tolerance of lettuce plants to salt stress. Asa biopolymer, the presence of amine and hydroxyl groups in CTS may also prevent Na+
from reaching the photosynthetic tissue by chelating part of it at the root/lower tissuelevel, which needs further exploration depending on the CTS application method.
Author Contributions: Conceptualization, G.Z. and Y.W.; methodology, G.Z., Z.Y. and Y.W.; valida-tion, Q.Z. and Y.F.; data analysis, G.Z., Y.W. and Q.Z.; writing—original draft preparation, G.Z. andY.M.; writing—review and editing, K.W. All authors have read and agreed to the published versionof the manuscript.
Funding: This research was funded by the Natural Science Foundation of the Jiangsu HigherEducation Institutions of China, 19KJB210011; Innovation Training Program for College Students ofJiangsu Vocational College of Agriculture and Forestry, 202113103005y.
Institutional Review Board Statement: Not applicable.
Informed Consent Statement: Not applicable.
127

Horticulturae 2021, 7, 342
Data Availability Statement: The data presented in this study are available on request from thecorresponding author.
Acknowledgments: The authors would like to thank Cullen Pitney and Randy Johnson for manyhelpful comments and suggestions.
Conflicts of Interest: The authors declare no conflict of interest.
References
1. Shahid, S.A.; Zaman, M.; Heng, L. Introduction to Soil Salinity, Sodicity and Diagnostics Techniques. In Guideline for SalinityAssessment, Mitigation and Adaptation Using Nuclear and Related Techniques; Springer Nature: Vienna, Switzerland, 2018.
2. Deinlein, U.; Stephan, A.B.; Horie, T.; Luo, W.; Schroeder, J.I. Plant salt-tolerance mechanisms. Trends Plant Sci. 2014, 19, 371–379.[CrossRef]
3. Ke, Q.; Wang, Z.; Ji, C.Y.; Jeong, J.C.; Lee, H.S.; Li, H.; Xu, B.; Deng, X.; Kwak, S.S. Transgenic poplar expressing codA exhibitsenhanced growth and abiotic stress tolerance. Plant Physiol. Biochem. 2016, 100, 75–84. [CrossRef]
4. Chen, M.; Yang, Z.; Liu, J.; Zhu, T.; Wei, X.; Fan, H.; Wang, B. Adaptation mechanism of salt excluders under saline conditionsand its applications. Int. J. Mol. Sci. 2018, 19, 3668. [CrossRef]
5. Azarmi-Atajan, F.; Sayyari-Zohan, M.H. Alleviation of salt stress in lettuce (Lactuca sativa L.) by plant growth-promotingrhizobacteria. J. Hortic. Postharvest Res. 2020, 3, 67–78.
6. Sohaid, M.; Zahir, Z.; Khan, M.; Ans, M.; Asghar, H.; Yasin, S.; Al-Barakah, F. Comparative evaluation of different carrier-basedmulti-strain bacterial formulations to mitigate the salt stress in wheat. Saudi J. Biol. Sci. 2020, 27, 777–787.
7. Zhu, J.K. Regulation of ion homeostasis under salt stress. Curr. Opin. Plant Biol. 2003, 6, 441–445. [CrossRef]8. Yang, Y.; Guo, Y. Unraveling salt stress signaling in plants. J. Integr. Plant Biol. 2018, 60, 58–66. [CrossRef] [PubMed]9. Hasegawa, P.M. Plant cellular and molecular responses to high salinity. Annu. Rev. Plant Physiol. Plant Mol. Biol. 2000, 51, 463–499.
[CrossRef]10. Wu, G.Q.; Shui, Q.Z.; Wang, C.M.; Zhang, J.L.; Yuan, H.J.; Li, S.J.; Liu, Z.J. Characteristics of Na+ uptake in sugar beet
(Beta vulgaris L.) seedlings under mild salt conditions. Acta Physiol. Plant. 2015, 37, 70. [CrossRef]11. Zhang, J.L.; Wetson, A.M.; Wang, S.M.; Gurmani, A.R.; Bao, A.K.; Wang, C.M. Factors associated with determination of root
22Na+ influx in the salt accumulation halophyte Suaeda maritima. Biol. Trace Elem. Res. 2011, 139, 108–117. [CrossRef] [PubMed]12. Assaha, D.V.M.; Ueda, A.; Saneoka, H.; Al-Yahyai, R.; Yaish, M.W. The role of Na+ and K+ transporters in salt stress adaptation in
glycophytes. Front. Physiol. 2017, 8, 509. [CrossRef] [PubMed]13. Isayenkov, S.V.; Maathuis, F.J.M. Plant salinity stress: Many unanswered questions remain. Front. Plant Sci. 2019, 10, 80.
[CrossRef]14. Lv, X.; Chen, S.; Wang, Y. Advances in understanding the physiological and molecular responses of sugar beet to salt stress.
Front. Plant Sci. 2019, 10, 1431. [CrossRef] [PubMed]15. Li, J.; Liu, J.; Wang, G.; Cha, J.Y.; Li, G.; Chen, S.; Li, Z.; Guo, J.; Zhang, C.; Yang, Y.; et al. A chaperone function of NO CATALASE
ACTIVITY1 is required to maintain catalase activity and for multiple stress responses in Arabidopsis. Plant Cell 2015, 27, 908–925.[CrossRef]
16. Del, L.A.D.; López-Huertas, E. ROS generation in peroxisomes and its role in cell signaling. Plant Cell Physiol. 2016, 57, 1364–1376.[CrossRef]
17. Zhao, J.; Pan, L.; Zhou, M.; Yang, Z.; Meng, Y.; Zhang, X. Comparative physiological and transcriptomic analyses revealmechanisms of improved osmotic stress tolerance in annual ryegrass by exogenous chitosan. Genes 2019, 10, 853. [CrossRef][PubMed]
18. Betchem, G.; Johnson, N.; Wang, Y. The application of chitosan in the control of post-harvest diseases: A review. J. Plant Dis.Protect. 2019, 126, 495–507. [CrossRef]
19. Pongprayoon, W.; Roytrakul, S.; Pichayangkura, R.; Chadchawan, S. The role of hydrogen peroxide in chitosan-induced resistanceto osmotic stress in rice (Oryza sativa L.). Plant Growth Regul. 2013, 70, 159–173. [CrossRef]
20. Morin-Crini, N.; Lichtfouse, E.; Torri, G.; Crini, G. Applications of chitosan in food, pharmaceuticals, medicine, cosmetics,agriculture, textiles, pulp and paper, biotechnology, and environmental chemistry. Environ. Chem. Lett. 2019, 17, 1667–1692.[CrossRef]
21. Malerba, M.; Cerana, R. Chitosan effects on plant systems. Int. J. Mol. Sci. 2016, 17, 996. [CrossRef]22. Guan, Y.J.; Hu, J.; Wang, X.J.; Shao, C.X. Seed priming with chitosan improves maize germination and seedling growth in relation
to physiological changes under low temperature stress. J. Zhejiang Univ. Sci. B 2009, 10, 427–433. [CrossRef]23. Jabeen, N.; Ahmad, R. The activity of antioxidant enzymes in response to salt stress in safflower (Carthamus tinctorius L.) and
sunflower (Helianthus annuus L.) seedlings raised from seed treated with chitosan. J. Sci. Food Agric. 2012, 93, 1699–1705.[CrossRef]
24. Geng, W.; Li, Z.; Hassan, M.; Peng, Y. Chitosan regulates metabolic balance, polyamine accumulation, and Na+ transportcontributing to salt tolerance in creeping bentgrass. BMC Plant Biol. 2020, 20, 506. [CrossRef] [PubMed]
25. Cho, M.H.; No, H.K.; Prinyawiwatkul, W. Chitosan treatments affect growth and selected quality of sunflower sprouts. J. Food Sci.2010, 73, S70–S77. [CrossRef] [PubMed]
128
Horticulturae 2021, 7, 342
26. Bittelli, M.; Flury, M.; Campbell, G.S.; Nichols, E.J. Reduction of transpiration through foliar application of chitosan. Agric. For.Meteorol. 2001, 107, 167–175. [CrossRef]
27. Dzung, N.A. Chitosan and their derivatives as prospective biosubstances for developing sustainable eco-agriculture. Adv. ChitinSci. 2007, 10, 453–459.
28. Dzung, N.A.; Thang, N.T. Effect of oligoglucosamine on the growth and development of peanut (Arachis hypogea L.). InProceedings of the 6th Asia-Pacific on Chitin, Chitosan Symposium, Singapore, 23–26 May 2004; Khor, E., Hutmacher, D., Yong,L.L., Eds.; ISBN 981-05r-r0904-9.
29. Li, Z.; Zhang, Y.; Zhang, X.; Merewitz, E.; Peng, Y.; Ma, X.; Huang, L.; Yan, Y. Metabolic pathways regulated by chitosancontributing to drought resistance in white clover. J. Proteome Res. 2017, 16, 3039–3052. [CrossRef]
30. Yang, F.; Hu, J.; Li, J.; Wu, X.; Qian, Y. Chitosan enhances leaf membrane stability and antioxidant enzyme activities in appleseedlings under drought stress. Plant Growth Regul. 2009, 58, 131–136. [CrossRef]
31. Hadwiger, L.A. Anatomy of a nonhost disease resistance response of pea to Fusarium solani: PR gene elicitation via DNase,chitosan and chromatin alterations. Front. Plant Sci. 2015, 6, 373. [CrossRef]
32. Aleksandrowicz-Trzcinska, M.; Bogusiewicz, A.; Szkop, M.; Drozdowski, S. Effect of chitosan on disease control and growth ofscots pine (Pinus sylvestris L.) in a forest nursery. Forests 2015, 6, 3165–3176. [CrossRef]
33. Viacava, G.E.; Gonzalez-Aguilar, G.G.; Roura, S.I. Determination of phytochemicals and antioxidant activity in butterhead lettucerelated to leaf age and position. J. Food Biochem. 2014, 38, 352–362. [CrossRef]
34. Aksakal, O.; Tabay, D.; Esringu, A.; Icoglu, A.F.; Esim, N. Effect of proline on biochemical and molecular mechanisms in lettuce(Lactuca sativa L.) exposed to UV-B radiation. Photochem. Photobiol. Sci. 2017, 16, 246–254. [CrossRef] [PubMed]
35. Yildirim, E.; Ekinci, M.; Turan, M.; Dursun, A.; Kul, R.; Parlakova, F. Roles of glycine betaine in mitigating deleterious effect ofsalt stress on lettuce (Lactuca sativa L.). Arch. Agron. Soil Sci. 2015, 61, 1673–1689. [CrossRef]
36. Fernández, J.A.; Niirola, D.; Ochoa, J.; Orsini, F.; Pennisi, G.; Gianquinto, G.; Egea-Gilabert, C. Root adaptation and ion selectivityaffects the nutritional value of salt-stressed hydroponically grown baby-leaf Nasturtium officinale and Lactuca sativa. Agr. Food Sci.2016, 25, 230–239. [CrossRef]
37. Ahmed, S.; Ahmed, S.; Roy, S.K.; Woo, S.H.; Sonawane, K.D.; Shohael, A.M. Effect of salinity on the morphological, physiologicaland biochemical properties of lettuce (Lactuca sativa L.) in Bangladesh. Open Agric. 2019, 4, 361–373. [CrossRef]
38. Garrido, Y.; Tudela, J.A.; Marín, A.; Mestre, T.; Martínez, V.; Gil, M.I. Physiological, phytochemical and structural changes ofmulti-leaf lettuce caused by salt stress. J. Sci. Food Agric. 2014, 94, 1592–1599. [CrossRef] [PubMed]
39. Joshi, J.; Zhang, G.; Shen, S.; Supaibulwatana, K.; Watanabe, C.K.A.; Yamori, W. A combination of downward lighting andsupplemental upward lighting improves plant growth in a closed plant factory with artificial lighting. HortScience 2017, 52,831–835. [CrossRef]
40. Porra, R.J.; Thompson, W.A.; Kriedemann, P.E. Determination of accurate extinction coefficients and simultaneous equations forassaying chlorophylls a and b extracted with four different solvents: Verification of the concentration of chlorophyll standards byatomic absorption spectroscopy. BBA Bioenerg. 1989, 975, 384–394. [CrossRef]
41. Ohtake, N.; Ishikura, M.; Suzuki, H.; Yamori, W.; Goto, E. Continuous irradiation with alternating red and blue light enhancesplant growth while keeping nutritional quality in lettuce. HortScience 2018, 53, 1804–1809. [CrossRef]
42. Yamasaki, S.; Dillenburg, L.R. Measurements of leaf relative water content in Araucaria angustifolia. Rev. Bras. Fisiol. Veg. 1999, 11,69–75.
43. Ahmad, P.; Latef, A.A.A.; Hashem, A.; Abd_Allah, E.F.; Gucel, S.; Tran, L.P. Nitric oxide mitigates salt stress by regulating levelsof osmolytes and antioxidant enzymes in chickpea. Front. Plant Sci. 2016, 7, 347. [CrossRef]
44. Zhang, G.; Yan, Z.; Wang, Y.; Feng, Y.; Yuan, Q. Exogenous proline improve the growth and yield of lettuce with low potassiumcontent. Sci. Hortic. 2020, 271, 109469. [CrossRef]
45. Bates, L.S.; Waldren, R.P.; Teare, I.D. Rapid determination of free proline for water-stress studies. Plant Soil 1973, 39, 205–207.[CrossRef]
46. Yemm, E.W.; Willis, A.J. The estimation of carbohydrates in plant extracts by anthrone. Biochem. J. 1954, 57, 508–514. [CrossRef][PubMed]
47. Kampfenkel, K.; Van Montagu, M.; Inzé, D. Extraction and determination of ascorbate and dehydroascorbate from plant tissue.Anal. Biochem. 1995, 225, 165–167. [CrossRef]
48. Patterson, B.D.; MacRae, E.A.; Ferguson, I.B. Estimation of hydrogen peroxide in plant extracts using titanium (IV). Anal. Biochem.1984, 139, 487–492. [CrossRef]
49. Averina, N.G.; Nedved, E.L.; Shcherbakov, R.A.; Vershilovskaya, I.V.; Yaronskaya, E.B. Role of 5-aminolevulinic acid in theformation of winter rape resistance to sulfonylurea herbicides. Russ. J. Plant Physiol. 2014, 61, 679–687. [CrossRef]
50. Heath, R.L.; Packer, L. Photoperoxidation in isolated chloroplasts: I. Kinetics and stoichiometry of fatty acid peroxidation.Arch. Biophys. Biophys. 1968, 125, 189–198. [CrossRef]
51. Jin, P.; Wang, H.; Zhang, Y.; Huang, Y.; Wang, L.; Zheng, Y. UV-C enhances resistance against gray mold decay caused by Botrytiscinerea in strawberry fruit. Sci. Hortic. 2017, 225, 106–111. [CrossRef]
52. Bradford, M.M. A rapid and sensitive method for the quantitation of microgram quantities of protein utilizing the principaldyebinding. Anal. Biochem. 1976, 72, 248–254. [CrossRef]
129
Horticulturae 2021, 7, 342
53. Latef, A.A.H.A.; Chaoxing, H. Effect of arbuscular mycorrhizal fungi on growth, mineral nutrition, antioxidant enzymes activityand fruit yield of tomato grown under salinity stress. Sci. Hortic. 2011, 127, 228–233. [CrossRef]
54. Latef, A.A.H.A.; Chaoxing, H. Does the inoculation with Glomus mosseae improve salt tolerance in pepper plants? J. PlantGrowth Regul. 2014, 33, 644–653. [CrossRef]
55. Hemantaranjan, A.; Deepmala, K.; Bharti, S.; Nishant, B.A. A future perspective in crop protection: Chitosan and its oligosaccha-rides. Adv. Plants Agric. Res. 2014, 1, 00006. [CrossRef]
56. Mahdavi, B.; Rahimi, A. Seed priming with chitosan improves the germination and growth performance of ajowan (Carumcopticum) under salt stress. Eurasia. J. Biosci. 2013, 7, 69–76. [CrossRef]
57. Turk, H. Chitosan-induced enhanced expression and activation of alternative oxidase confer tolerance to salt stress in maizeseedlings. Plant Physiol. Bioch. 2019, 141, 415–422. [CrossRef]
58. Zou, P.; Li, K.C.; Liu, S.; Xing, R.G.; Qin, Y.K.; Yu, H.H.; Zhou, M.M.; Li, P.C. Effect of chitooligosaccharides with different degreesof acetylation on wheat seedlings under salt stress. Carbohydr. Polym. 2015, 126, 62–69. [CrossRef]
59. Hoffmann, W.A.; Poorter, H. Avoiding bias in calculations of relative growth rate. Ann. Bot. 2002, 80, 37–42. [CrossRef]60. Rady, M.M.; El-Shewy, A.A.; El-Yazal, M.A.; Abdelaal, K.E.S. Response of salt-stressed common bean plant performances to foliar
application of phosphorus (MAP). Int. Lett. Nat. Sci. 2018, 72, 7–20. [CrossRef]61. Qi, H.; Wu, Z.; Zhang, L.; Li, J.; Zhou, J.; Jun, Z.; Zhu, B. Monitoring of peanut leaves chlorophyll content based on drone-based
multispectral image feature extraction. Comput. Electron. Agr. 2021, 187, 106292. [CrossRef]62. Zou, P.; Lu, X.; Jing, C.; Yuan, Y.; Lu, Y.; Zhang, C.; Meng, L.; Zhao, H.; Li, Y. Low-molecular-weightt polysaccharides from Pyropia
yezoensis enhance tolerance of wheat seedlings (Triticum aestivum L.) to Salt Stress. Front. Plant Sci. 2018, 9, 427. [CrossRef]63. Sen, S.; Chouhan, D.; Das, D.; Ghosh, R.; Mandal, P. Improvisation of salinity stress response in mung bean through solid matrix
priming with normal and nano-sized chitosan. Int. J. Biol. Macromol. 2020, 145, 108–123. [CrossRef] [PubMed]64. Rasool, S.; Ahmad, A.; Siddiqi, T.O.; Ahmad, P. Changes in growth, lipid peroxidation and some key antioxidant enzymes in
chickpea genotypes under salt stress. Acta Physiol. Plant. 2013, 35, 1039–1050. [CrossRef]65. Negrão, S.; Schmöckel, S.M.; Tester, M. Evaluating physiological responses of plants to salinity stress. Ann. Bot. 2017, 119, 1–11.
[CrossRef] [PubMed]66. Eckardt, N.A. A new chlorophyll degradation pathway. Plant Cell 2009, 21, 700. [CrossRef] [PubMed]67. Suriya-arunroj, D.; Supapoj, N.; Toojinda, T.; Vanavichit, A. Relative leaf water content as an efficient method for evaluating rice
cultivars for tolerance to salt stress. ScienceAsia 2004, 30, 411–415. [CrossRef]68. Mekawy, A.M.; Assaha, D.V.; Yahagi, H.; Tada, Y.; Ueda, A.; Saneoka, H. Growth, physiological adaptation, and gene expression
analysis of two Egyptian rice cultivars under salt stress. Plant Physiol. Biochem. 2015, 87, 17–25. [CrossRef]69. Cuin, T.A.; Betts, S.A.; Chalmandrier, R.; Shabala, S. A root’s ability to retain K+ correlates with salt tolerance in wheat. J. Exp. Bot.
2008, 59, 2697–2706. [CrossRef]70. Rocha, I.M.A.; Vitorello, V.A.; Silva, J.S.; Ferreira-Silva, S.L.; Viegas, R.A.; Silva, E.N.; Silveira, J.A.G. Exogenous ornithine is
an effective precursor and the delta-ornithine amino transferase pathway contributes to proline accumulation under high Nrecycling in salt-stressed cashew leaves. J. Plant Physiol. 2012, 169, 41–49. [CrossRef]
71. Zhang, X.Q.; Li, K.C.; Xing, R.G.; Liu, S.; Li, P.C. Metabolite profiling of wheat seedlings induced by chitosan: Revelation of theenhanced carbon and nitrogen metabolism. Front. Plant Sci. 2017, 8, 13. [CrossRef]
72. Gupta, A.K.; Kaur, N. Sugar signalling and gene expression in relation to carbohydrate metabolism under abiotic stresses inplants. J. Biosci. 2005, 30, 761–776. [CrossRef]
73. Bolouri-Moghaddam, M.R.; Le, R.K.; Xiang, L.; Rolland, F.; Van den Ende, W. Sugar signalling and antioxidant networkconnections in plant cells. FEBS J. 2010, 277, 2022–2037. [CrossRef]
74. Hayat, S.; Yadav, S.; Wani, A.S.; Irfan, M.; Alyemini, M.N.; Ahmad, A. Impact of sodium nitroprusside on nitrate reductase, prolineand antioxidant systemin Solanum lycopersicum under salinity stress. Hort. Environ. Biotechnol. 2012, 53, 362–367. [CrossRef]
75. Butt, M.; Ayyub, C.M.; Amjad, M.; Ah-mad, R. Proline application enhances growth of chilli by improving physiological andbiochemical attributes under salt stress. Pak. J. Agr. Sci. 2016, 53, 43–49.
76. Miller, G.; Suzuki, N.; Ciftci-Yilmaz, S.; Mittler, R. Reactive oxygen species homeostasis and signalling during drought andsalinity stresses. Plant Cell Environ. 2010, 33, 453–467. [CrossRef] [PubMed]
77. Li, J.T.; Qiu, Z.B.; Zhang, X.W.; Wang, L.S. Exogenous hydrogen peroxide can enhance tolerance of wheat seedlings to salt stress.Acta Physiol. Plant. 2011, 33, 835–842. [CrossRef]
78. Wu, G.Q. Exogenous application of proline alleviates salt-induced toxicity in sainfoin seedlings. J. Anim. Plant Sci. 2017, 27,246–251.
79. Asada, K. Ascorbate peroxidase—A hydrogen peroxide-scavenging enzyme in plants. Physiol. Plant. 1992, 85, 235–241. [CrossRef]80. Alscher, R.G.; Donahue, J.L.; Cramer, C.L. Reactive oxygen species and antioxidants: Relationships in green cells. Physiol. Plant.
1997, 100, 224–233. [CrossRef]81. Orsini, F.; Pennisi, G.; Mancarella, S.; Nayef, M.A.; Sanoubar, R.; Nicola, S.; Gianquinto, G. Hydroponic lettuce yields are
improved under salt stress by utilizing white plastic film and exogenous applications of proline. Sci. Hortic. 2018, 233, 283–293.[CrossRef]
82. Apel, K.; Hirt, H. Reactive oxygen species: Metabolism, oxidative stress, and signal transduction. Annu. Rev. Plant Biol. 2004, 55,373–399. [CrossRef]
130

Horticulturae 2021, 7, 342
83. Foyer, C.H.; Noctor, G. Oxidant and antioxidant signalling in plants: A re-evaluation of the concept of oxidative stress in aphysiological context. Plant Cell Environ. 2005, 28, 1056–1071. [CrossRef]
84. Kusvuran, S.; Bayat, R.; Ustun, A.S.; Ellialtioglu, S.S. Exogenous proline improves osmoregulation, physiological and biochemicalresponses of eggplant under salt stress. Fresenius Environ. Bull. 2020, 29, 152–161.
85. Thomas, C.E.; Mclean, L.R.; Parkar, R.A.; Ohleweiler, D.F. Ascorbate and phenolic antioxidant interactions in prevention ofliposomal oxidation. Lipids 1992, 27, 543–550. [CrossRef]
86. Iqbal, N.; Umar, S.; Khan, N.A.; Khan, M.I.R. A new perspective of phytohormones in salinity tolerance: Regulation of prolinemetabolism. Environ. Exp. Bot. 2014, 100, 34–42. [CrossRef]
87. Piotr, S.; Monika, G.; Edward, M.; Marcin, S. Oligo-alginate with low molecular mass improves growth and physiological activityof eucomis autumnalis under salinity stress. Molecules 2018, 23, 812.
131


horticulturae
Article
Adaptive Morphophysiological Features of Neottia ovata(Orchidaceae) Contributing to Its Natural Colonization on FlyAsh Deposits
Maria Maleva 1,*,†, Galina Borisova 1,†, Nadezhda Chukina 1, Olga Sinenko 1, Elena Filimonova 2, Natalia Lukina 2
and Margarita Glazyrina 2
Citation: Maleva, M.; Borisova, G.;
Chukina, N.; Sinenko, O.; Filimonova,
E.; Lukina, N.; Glazyrina, M.
Adaptive Morphophysiological
Features of Neottia ovata
(Orchidaceae) Contributing to Its
Natural Colonization on Fly Ash
Deposits. Horticulturae 2021, 7, 109.
https://doi.org/10.3390/
horticulturae7050109
Academic Editors: Jolanta
Jaroszuk-Sciseł, Małgorzata
Majewska and Agnieszka Hanaka
Received: 7 April 2021
Accepted: 4 May 2021
Published: 11 May 2021
Publisher’s Note: MDPI stays neutral
with regard to jurisdictional claims in
published maps and institutional affil-
iations.
Copyright: © 2021 by the authors.
Licensee MDPI, Basel, Switzerland.
This article is an open access article
distributed under the terms and
conditions of the Creative Commons
Attribution (CC BY) license (https://
creativecommons.org/licenses/by/
4.0/).
1 Department of Experimental Biology and Biotechnology, Ural Federal University,620002 Ekaterinburg, Russia; [email protected] (G.B.); [email protected] (N.C.);[email protected] (O.S.)
2 Laboratory of Anthropogenic Dynamics of Ecosystems, Ural Federal University, 620002 Ekaterinburg, Russia;[email protected] (E.F.); [email protected] (N.L.); [email protected] (M.G.)
* Correspondence: [email protected]† Equal contribution by both the authors.
Abstract: In previous decades, some species of the Orchidaceae family have been found growingin man-made habitats. Neottia ovata is one of the most widespread orchids in Europe, however it isquite rare in Russia and is included in several regional Red Data Books. The purpose of this studywas to compare the chemical composition and morphophysiological parameters of N. ovata fromtwo forest communities of the Middle Urals, Russia: natural and transformed (fly ash dump ofVerkhnetagil’skaya Thermal Power Station) for determining orchid adaptive features. The content ofmost of the studied metals in the underground parts (rhizome + roots) of N. ovata was considerablyhigher than in the leaves, which diminished the harmful effect of toxic metals on the abovegroundorgans. The adaptive changes in the leaf mesostructure of N. ovata such as an increase in epidermisthickness, the number of chloroplasts in the cell, and the internal assimilating surface were foundfor the first time. The orchids from the fly ash deposits were characterized by a higher content ofchlorophyll b and carotenoids than plants from the natural forest community that evidenced thecompensatory response on the decrease in chlorophyll a. The ability of N. ovata from the transformedhabitat to maintain a relatively favorable water balance and stable assimilation indexes furthercontribute to its high viability. The study of orchid adaptive responses to unfavorable factors isnecessary for their successful naturalization and introduction into a new environment.
Keywords: orchid; transformed ecosystems; fly ash; metals; adaptive responses; water exchange;leaf mesostructure; photosynthetic pigments; photosynthesis; plant introduction
Highlights
Neottia ovata successfully colonize the fly ash dump (FAD) due to less phytocoenotic stress.N. ovata plants from transformed habitat demonstrate high viability.Sequestration of metals mainly in underground organs reduced harmful effect on
orchid plants.Natural orchid colonization of FAD was facilitated by adaptive structural and func-
tional changes.The FAD plants were characterized by the higher chlorophyll b and carotenoids content.N. ovata from FAD maintained a relatively favorable water balance and stable assimi-
lation indexes.
1. Introduction
The Orchidaceae family has a broad variety of more than 28,000 species distributedin about 763 genera and widespread from the Arctic tundra to tropical Brazilian rain-forests [1,2]. It includes species with complex adaptations to pollination by specific insect
Horticulturae 2021, 7, 109. https://doi.org/10.3390/horticulturae7050109 https://www.mdpi.com/journal/horticulturae
133
Horticulturae 2021, 7, 109
species and very different life strategies: from epiphytic to terrestrial, from evergreen tocompletely chlorophyll-free [3,4]. Studies have been conducted on orchids’ taxonomy,morphology, ecology, breeding [5–7], pollination [8–10], genetics [11,12], mycorrhizal asso-ciation [13–15], etc. At the same time, the physiological parameters of Orchidaceae speciesare still less studied and need much more attention [16].
Changing natural habitats have caused the extinction of many orchid species [17].However, some orchids, especially in temperate regions of Europe and North America,have been found in anthropogenically disturbed territories, such as industrial dumpsformed after the excavation and extraction of coal, iron, and some trace elements, and thefly ash dumps of thermal power plants [13,14,18–21].
The monitoring of vegetation restoration on disturbed lands in the Middle Urals, Rus-sia, has shown that dumps from mining and processing industries are often colonized bysome rare orchid species at the initial stages of the forest phytocoenoses formation [22–24].Low competition in man-made habitats contributes to the conservation of the gene poolof Orchidaceae species. The local populations of Neottia ovata (L.) Bluff and Fingerh. (syn.Listera ovata (L.) R. Br. or Common twayblade) are of particular interest, as they havebeen found in recent years in disturbed territories of the Middle Urals, including fly ashdumps [22].
Common twayblade is one of the widespread orchids in Europe, especially in theBritish Isles [25]. However, this species is quite seldom encountered in Russia and hasthe status of a “rare species” in many regional Red Data Books, including the Red Bookof Sverdlovsk Region [26]. This is a short-rhizome herbaceous perennial, mesophyte,European–West Asian, boreal-immoral species [3,25,27]. Like other orchids, N. ovata ischaracterized by low competitiveness. N. ovata grow on both fertile and poor soils. Some-times it is found in disturbed habitats, along roadsides and railways, and in abandonedlimestone quarries [4]. The N. ovata is a typical entomophile, the spectrum of pollinators isvery wide [9]. This species reproduces well both by seeds and vegetatively [28]. For thegermination of seeds in the first years of life, the presence of mycorrhiza is necessary [4].
Fly ash is considered a problematic form of solid waste throughout the world [29,30].It is well known that fly ash substrates are characterized by low microbiological activity,an insufficient supply of nutrients, especially nitrogen, and adverse physicochemicalproperties [31]. Moreover, fly ash may also contain toxic concentrations of As, Cd, Cr, Pb,Co, Cu, etc. [29–31].
Different plant species growing in stressful environments show great variation intheir tolerance mechanisms [29]. Unfavorable abiotic factors affect photosynthesis, res-piration, water regime, and mineral nutrition, leading to impaired growth and devel-opment [21–24]. Photosynthesis is the main fundamental process that determines theproductivity of plants [32,33]. The leaves are the primary photosynthetic organs, servingas key sites where the absorption of light and CO2 assimilation take place. The internalorganization of the leaf is influenced by environmental factors such as the chemical proper-ties of soil substrates, light, temperature, and water availability. Leaf structure is knownto be highly plastic in response to growing conditions, varying greatly in morphology,anatomy, and physiology [32–34]. The investigation of plant leaf traits and its responses toenvironmental change has increasingly gained more attention in recent decades [34–37].Maintaining the functional activity of the photosynthetic apparatus in stressful conditionsis one of the essential prerequisites that allow plants to colonize transformed territories.
The purpose of this study was a comparative analysis of the chemical composition andthe structural and functional parameters of N. ovata from natural and transformed (fly ashdump) habitats. This will allow us to identify the adaptive morphophysiological characteristicsof this species that contribute to its colonization on infertile technogenic substrates.
134

Horticulturae 2021, 7, 109
2. Materials and Methods
2.1. Study Area
The research was conducted in the Middle Urals, Russia (subzone of the southerntaiga). The southern taiga subzone is characterized as moderately cold in terms of heatsupply and over-humidified in terms of moisture availability. The average annual tempera-ture is 1.9 ◦C, the annual precipitation is almost 570 mm, and the hydrothermal coefficientis about 1.5 [32]. The fly ash dump formed by brown coal ash is located on an area of1.25 km2. The fly ash deposits formed after mining (1968–1970) were left for colonization bynatural forest [22,31,38]. The investigation was carried out in the vicinity of Verkhniy Tagiltown (Sverdlovsk region) during the period of orchid blooming (mid-July 2018–2019). Allsamples were collected during the same period (from 15 to 18 July) under similar weatherconditions (temperature during the daytime was 23 ± 3 ◦C and the relative humidity wasabout 60%). Two naturally growing orchid populations were studied: P-1 (57◦20′13” N60◦01′43” E) from the natural forest community (NFC) near Belorechka village and P-2(57◦20′45” N 59◦56′46” E) from the fly ash dump (FAD) near Verkhnetagil’skaya ThermalPower Station, VTTPS (Figures 1 and 2). The studied area of each site was about 400 m2.
Figure 1. Map of Sverdlovsk region, Russia. Detailed presentation of the locations of studied N. ovata populations: P-1—fromnatural forest community near Belorechka village; P-2—from the fly ash dump near Verkhnetagil’skaya Thermal PowerStation (VTTPS).
The natural forest community was represented by a mixed forest. The soil of thissite was is sod-podzolic. The age of trees was between 80 and 100 years and the treecrown density was between 0.5 and 0.6. The height of the first layer of trees was 10–24 mand the second layer was 6–12 m. Coniferous species (Picea obovata Ledeb., Larix sibiricaLedeb., Pinus sylvestris L.) predominated in this forest. N. ovata individuals in P-1 grewmainly under the deciduous species Betula pendula Roth and B. pubescens Ehrh., as wellas in small glades and meadows. The total projective shrub cover was 30–50% andcontained Tilia cordata Mill., Sorbus aucuparia L., Padus avium Mill., Rosa majalis Herm.,R. acicularis Lindl., and Rubus idaeus L. The total projective herbaceous cover was 70–80%,which reached up to 100% in the glades. Dominant among the herbaceous species were
135
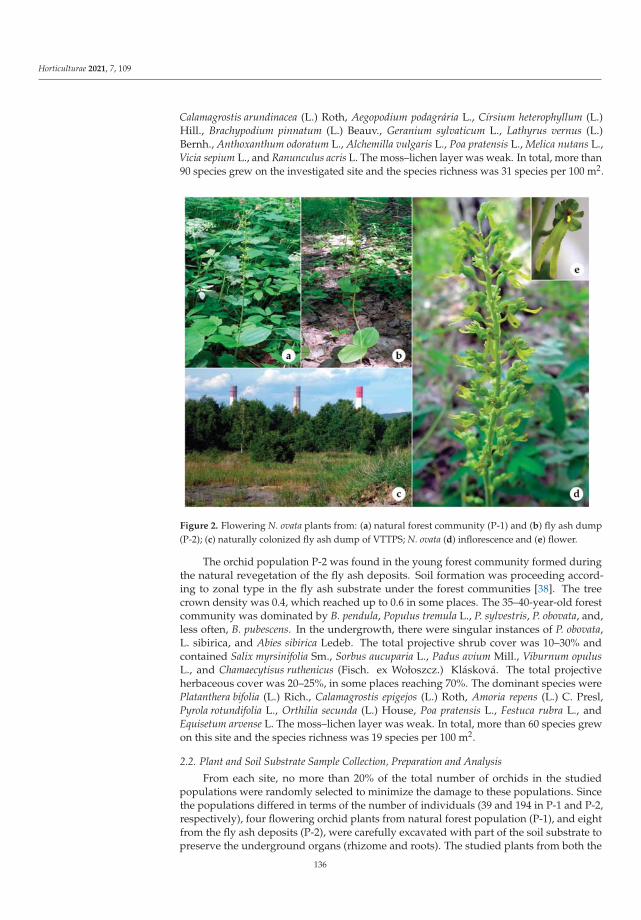
Horticulturae 2021, 7, 109
Calamagrostis arundinacea (L.) Roth, Aegopodium podagrária L., Círsium heterophyllum (L.)Hill., Brachypodium pinnatum (L.) Beauv., Geranium sylvaticum L., Lathyrus vernus (L.)Bernh., Anthoxanthum odoratum L., Alchemilla vulgaris L., Poa pratensis L., Melica nutans L.,Vicia sepium L., and Ranunculus acris L. The moss–lichen layer was weak. In total, more than90 species grew on the investigated site and the species richness was 31 species per 100 m2.
Figure 2. Flowering N. ovata plants from: (a) natural forest community (P-1) and (b) fly ash dump(P-2); (c) naturally colonized fly ash dump of VTTPS; N. ovata (d) inflorescence and (e) flower.
The orchid population P-2 was found in the young forest community formed duringthe natural revegetation of the fly ash deposits. Soil formation was proceeding accord-ing to zonal type in the fly ash substrate under the forest communities [38]. The treecrown density was 0.4, which reached up to 0.6 in some places. The 35–40-year-old forestcommunity was dominated by B. pendula, Populus tremula L., P. sylvestris, P. obovata, and,less often, B. pubescens. In the undergrowth, there were singular instances of P. obovata,L. sibirica, and Abies sibirica Ledeb. The total projective shrub cover was 10–30% andcontained Salix myrsinifolia Sm., Sorbus aucuparia L., Padus avium Mill., Viburnum opulusL., and Chamaecytisus ruthenicus (Fisch. ex Wołoszcz.) Klásková. The total projectiveherbaceous cover was 20–25%, in some places reaching 70%. The dominant species werePlatanthera bifolia (L.) Rich., Calamagrostis epigejos (L.) Roth, Amoria repens (L.) C. Presl,Pyrola rotundifolia L., Orthilia secunda (L.) House, Poa pratensis L., Festuca rubra L., andEquisetum arvense L. The moss–lichen layer was weak. In total, more than 60 species grewon this site and the species richness was 19 species per 100 m2.
2.2. Plant and Soil Substrate Sample Collection, Preparation and Analysis
From each site, no more than 20% of the total number of orchids in the studiedpopulations were randomly selected to minimize the damage to these populations. Sincethe populations differed in terms of the number of individuals (39 and 194 in P-1 and P-2,respectively), four flowering orchid plants from natural forest population (P-1), and eightfrom the fly ash deposits (P-2), were carefully excavated with part of the soil substrate topreserve the underground organs (rhizome and roots). The studied plants from both the
136
Horticulturae 2021, 7, 109
sites were in the range of 50–60 cm in length. The samples were placed into separate sterile10 L bags to minimize dehydration and transferred to the laboratory for further analysis.
The soil substrate samples (about 2 kg) were taken from each orchid root zone at adepth of 0–15 cm, and a composite sample was formed for analysis. Subsequently, the soilsamples were air dried, homogenized, passed through a sieve (<2 mm), and preservedfor physicochemical analysis (pH, electrical conductivity, total dissolved solids, total andavailable metal concentrations).
Before chemical analysis, the plants were carefully washed by ultrasonication (UM-4,Unitra Unima, Olsztyn, Poland) and finally with deionized water (Milli-Q system, MilliporeSAS, Molsheim, France). The leaves, rhizome, and roots from each individual plant wereseparated and then dried for 24 h at 75 ◦C along with soil samples. Afterwards, the driedsamples were weighed and digested with concentrated HNO3 (analytical grade) using aMARS 5 Digestion Microwave System (CEM, Matthews, NC, USA). The available formof metals was analyzed by extracting the soil sample (5 g) with 10 mL of 0.5 M nitricacid solution as described earlier [24]. All the samples were prepared using deionizedMillipore water. The concentrations of K, Ca, Mg, Fe, Zn, Mn, Pb, Cu, Ni, Cr, and Co in allthe samples were determined using an atomic absorption spectrometer AA240FS (VarianAustralia Pty Ltd., Mulgrave, Victoria, Australia) [24]. Standard reference materials (JSCUral Chemical Reagents Plant, Verkhnyaya Pishma, Russia) were used for the preparationand calibration of each analytical batch. The calibration coefficients were maintained at ahigh level of no less than 0.99.
The bioconcentration factor (BCF) was calculated as the ratio of the metal concentrationin the underground/aboveground organs to the available concentration in the soil. Thetranslocation factor (TF) was calculated as the ratio of metal concentration in the leaves tothe concentration in the rhizome + roots.
The pH, electrical conductivity (EC), and total dissolved solids (TDS) of the soil–watersuspensions (1:2.5; w/v) were measured using a portable multivariable analyzer HI98129Combo (Hanna Instruments GmbH, Graz, Austria). The total nitrogen and phosphoruscontent in the N. ovata leaves and rhizome + roots were measured spectrophotometrically at440 and 640 nm, respectively, after wet digestion with an acid mixture of HClO4 and H2SO4(1:10; v/v). The total nitrogen was measured after the reaction with Nessler’s reagent [39],whereas the total phosphorus was determined by standard method using ammoniummolybdate in the acid medium [40].
2.3. Morphological, Anatomical Parameters and Mycorrhiza Assay
Twenty flowering plants from each population were used to study shoot and inflo-rescence length, the number of flowers, and the total leaf area under in situ conditions.To calculate the leaf area, each leaf was photographed on graph paper and digital imageanalysis was performed using special MesoPlant software (OOO SIAMS, Ekaterinburg,Russia). From the lower leaf of 10 plants about 30 leaf discs (0.7 cm diameter) were fixedin 3.5% glutaraldehyde solution in a phosphate buffer (pH 7.0, v/v) in order to study themesostructural parameters: leaf mesophyll and epidermis thickness (μm), number of cellsper unit leaf area (thousand cm−2), chloroplasts per mesophyll cell (pieces), and cell andchloroplast volumes (μm3). The transverse sections of the leaf discs were obtained using afreezing microtome MZ-2 (JSC Kharkov plant “Tochmedpribor”, Kharkov, Ukraine). Allmeasurements were carried out in 30 replicates using a Meiji MT 4300 L light microscope(Meiji Techno, San Jose, CA, USA). The quantitative parameters of the mesophyll weredetermined with a computer-assisted protocol based on MesoPlant software (OOO SIAMS,Ekaterinburg, Russia). The number of cells per unit of leaf surface area was counted in aGoryaev cytometer after tissue maceration in a 20% KOH solution (v/v) with heating at80–90 ◦C. All other measurements were carried out on leaf discs preliminarily maceratedwith 5% chromic acid dissolved in 1 N HCl (v/v) [34].
The quantitative indices of the leaf mesophyll were determined according to Mokro-nosov [31], modified by Ivanova and P’yankov [34]. The cell volume per chloroplast (CVC,
137

Horticulturae 2021, 7, 109
μm3) was calculated as the ratio of cell volume to the number of chloroplasts per cell.The chloroplast membrane index (CMI, cm2 cm−2) was calculated as the ratio of the totalsurface area of the outer membranes of chloroplasts to the unit of leaf surface area [35].
Fresh roots of N. ovata from both the studied sites were used for investigating mycor-rhizal association. Root tips up to 1.5 cm were cut into 20 μm cross sections with a freezingmicrotome and analyzed under a Meiji MT 4300 L light microscope (Meiji Techno, San Jose,CA, USA) [24].
2.4. Physiological and Biochemical Parameters Assay
To measure photosynthesis and transpiration, freshly dug-up plants with bulk soil (asdescribed earlier in Section 2.2) were transported to the laboratory and studied no laterthan 3 h after collection to minimize the dehydration.
The gas exchange (μM CO2 m−2 s−1) and transpiration rate (mM H2O m−2 s−1)were measured with the lower leaf of four plants using a LI-6400XT portable infrared gasanalyzer (LI-COR, Lincoln, NE, USA) with a LED Light Source chamber (3 × 4 cm). Thefollowing parameters were set: operating at an ambient concentration of CO2 and humidity,the temperature was +23 ◦C and the saturating light intensity of 1600 μM m−2 s−1. Thisvalue of light intensity was experimentally established earlier by constructing averagelight curves. The CO2 uptake was recalculated to mg of CO2 per unit leaf area (dm2), permg of chlorophyll (Chl a + b), and per chloroplast (108) per hour; the transpiration ratewas recalculated to g of H2O per unit leaf area (dm2) per hour. Subsequently, fresh leafcuttings (0.7 cm diameter) from these leaves were used to measure the water exchange andphotosynthetic pigment content.
The relative water content (RWC, %) and water saturation deficit (WSD, %) of the planttissue were measured by floating disc method and calculated according to Hellmuth [41].The fresh leaf cutting was immediately weighed to obtain FW and then saturated bysubmerging the sample in distilled water for 3 h. Afterwards, the surface water wasblotted carefully, the discs were weighed to obtain the saturated weight, and later dried24 h at 75 ◦C to determine the dry weight. The fresh weight (FW) to dry weight (DW)ratios were used for further calculations. Simultaneously, the part of the leaf discs wasimmediately used for photosynthetic pigment determination. Three discs from each plant(about 40–50 mg of FW) were homogenized in 2 mL of a cold 80% acetone solution (v/v)with addition of a small amount of CaCO3 to protect the pigments from oxidation, andcentrifuged at 8000× g for 10 min. The homogenate was decanted, acetone solution wasadded to the precipitate and stirred again; this procedure was repeated threefold until theprecipitate was completely discolored. The content of chlorophyll a (Chl a), chlorophyllb (Chl b), and carotenoids (CAR) was determined spectrophotometrically (“APEL” PD-303 UV) at wavelengths of 470, 647, and 663 nm, respectively, and calculated accordingto Lichtenthaler [42], and expressed as mg g−1 DW. The physiological and biochemicalparameters were determined in four biological and three analytical replicates.
2.5. Statistical Analysis
The values are presented as mean values of 5 replicates for the physicochemical anal-ysis of the soil and the elemental analysis of plant samples, 30 replicates for structuralcharacteristics, and 12 replicates for physiological and biochemical plant parameters withstandard error (SE). After checking the normality by Shapiro–Wilk test and the homogeneityof variance by Levene’s test, the differences between the studied orchid populations were de-termined with the nonparametric Mann–Whitney U-test, p < 0.05. The relationship betweendifferent parameters was determined by Spearman’s rank correlation coefficient. Asterisksin the tables and figures indicate significant differences between the studied populations.
138

Horticulturae 2021, 7, 109
3. Results
3.1. Brief Description of Studied Populations
In NFC, N. ovata plants were found both as single individuals and in groups of upto three individuals. The total number of N. ovata plants in P-1 was 39, with a density of0.10 individuals per 1 m2; the age spectrum was dominated by flowering plants (71%).
The distribution of N. ovata plants in P-2 was uneven. The orchid population fromFAD was young and vegetatively oriented, with pregenerative individuals predominating(78%). The total number of N. ovata plants in P-2 was 194 individuals and the density was0.49 individuals per 1 m2.
Orchid mycorrhiza, represented by pelotons, were found in the root cells of N. ovatafrom both studied populations. The intensity of mycorrhizal association was high andranged from 96 to 98%.
3.2. Soil and Plant Composition
3.2.1. Physicochemical Characteristics and Metal Content in Soil Substrates
The pH of the soil substrates varied between acidic and slightly acidic for both sites.At the same time, the pH of the fly ash substrate was slightly higher than that of the naturalforest soil (Table 1). The EC and TDS values in the soil substrate from NFC were higher(1.7-fold on average) than in FAD.
Table 1. The pH (water solution), electrical conductivity and total dissolved solids in soil substrates(0–15 cm depth) from the natural forest community (NFC) and the fly ash dump (FAD).
Site pH (H2O)Electrical Conductivity
(EC), μS cm−1Total Dissolved Solids
(TDS), mg L−1
NFC5.80 ± 0.04 1 162.8 ± 11.3 89.9 ± 6.1(5.62–6.34) 2 (108.0–280.0) (51.0–145.0)
FAD 6.19 ± 0.03 *(5.79–6.32)
96.6 ± 7.2 *(46.0–146.0)
48.0 ± 3.7 *(23.0–73.0)
1 Data is presented as mean ± SE (n = 5); 2 In the brackets are the minimum and maximum values. Asterisks(*) indicate significant differences between the studied habitats according to Mann–Whitney U-test (p < 0.05).
The total metal contents in the NFC soil were found in the following order: Fe > Ca> Mg > Mn > K > Zn > Pb > Cu > Cr > Ni > Co (Table 2). A similar trend was noted inthe metal content distribution in the FAD substrate, with the exception of Mn and K thatswitched places. The largest difference between the two sites was found for Mn; its totaland available content in the NFC soil exceeded its concentration in the FAD substrate by3.3 times on average. The total contents of Ca, Mg, Zn, and Cu were also higher in thesoil of the natural habitat than in the disturbed one, but the differences between the siteswere less noticeable (1.3–2.0 times). Whereas, for K, Pb, and Cr, their content (both totaland available) was higher in the FAD substrate (on average by 1.4 times). At the sametime, there were no significant differences between the total Fe, Ni, and Co contents in bothsites. The available concentration of most of the studied metals (namely, Ca, Mg, Fe, Zn,Mn, Cu, and Ni) in the NFC soil was higher compared to the FAD substrate (on average2.0 times, Table 2). As for Co, there were no significant differences in the content betweenthe sites studied.
139

Horticulturae 2021, 7, 109
Table 2. Total and available metal content in the soil substrates (0–15 cm depth) from the natural forest community (NFC)and the fly ash dump (FAD).
MetalTotal Content, mg kg−1 DW Available Content, mg kg−1 DW
NFC FAD NFC FAD
K948.8 ± 87.1 1 1256.2 ± 75.8 * 211.6 ± 5.6 310.9 ± 3.8 *
(735.8–1162.1) 2 (1080.8–1450.6) (198.0–225.4) (290.6–326.3)
Ca16,779.6 ± 856.1 8369.1 ± 437.2 * 6644.8 ± 534.3 4439.9 ± 480.9 *
(14,690.2–18,876.0) (7286.3–10676.0) (5395.9–7823.9) (3098.7–6351.4)
Mg 5321.0 ± 329.9 2708.0 ± 602.6 * 1264.1 ± 47.2 792.4 ± 139.6 *(4515.1–6127.2) (999.8–4368.0) (1149.0–1379.2) (411.7–1243.8)
Fe36,273.4 ± 1472.1 33,087.7 ± 3008.1 4810.1 ± 214.8 2592.9 ± 358.0 *(32,670.0–39877.8) (24,256.6–41777.9) (4288.5–5332.0) (1601.5–3705.0)
Zn269.9 ± 25.4 192.1 ± 10.2 * 158.4 ±14.4 92.7 ± 4.7 *(208.8–332.6) (159.0–224.1) (123.3–193.3) (77.8–111.6)
Mn2043.4 ± 153.4 572.7 ± 114.6 * 1388.2 ± 123.8 439.9 ± 93.0 *(1694.0–2393.2) (270.8–957.0) (1086.4–1690.2) (166.6–712.5)
Pb152.6 ± 7.8 180.0 ± 5.1 * 69.8 ± 7.2 86.2 ± 3.0 *
(133.8–171.3) (158.8–196.7) (58.2–81.3) (74.3–98.2)
Cu110.3 ± 5.4 69.2 ± 8.4 * 83.1 ± 5.4 39.5 ± 3.7 *(98.1–122.4) (42.1–98.2) (70.2–96.5) (26.8–51.9)
Ni26.2 ± 4.1 22.9 ± 4.9 8.5 ± 0.6 4.5 ± 0.6 *(16.8–35.5) (9.1–37.5) (6.9–10.0) (2.8–7.8)
Cr41.7 ± 1.9 63.3 ± 3.1 * 4.8 ± 0.4 8.1 ± 0.5 *(37.6–45.9) 49.5–72.8 (4.1–5.6) (5.9–10.1)
Co5.4 ± 0.5 7.5 ± 0.9 3.4 ± 0.4 4.5 ± 0.4(3.9–7.2) (4.3–11.5) (2.3–4.3) (3.1–6.1)
1 Data is presented as mean ± SE (n = 5); 2 In the brackets are the minimum and maximum values. Asterisks (*) indicate significantdifferences between studied habitats according to Mann–Whitney U-test (p < 0.05).
3.2.2. Macronutrient and Metal Content in N. ovata
The leaves of N. ovata from P-2 contained a smaller amount of total nitrogen, whilethe content of total phosphorus was higher than in the P-1 plants (by 1.2 times, Table 3).
Table 3. Macronutrient content in the aboveground and underground organs of N. ovata from thenatural forest community (P-1) and the fly ash dump (P-2).
MacronutrientLeaves, mg g−1 DW Rhizome + Roots, mg g−1 DW
P-1 P-2 P-1 P-2
N 42.84 ± 1.30 1 23.08 ± 2.32 * 29.05 ± 3.92 28.15 ± 3.13P 4.48 ± 0.04 5.48 ± 0.15 * 3.96 ± 0.03 2.92 ± 0.25 *K 33.00 ± 0.61 46.97 ± 0.73 * 9.13 ± 0.36 12.70 ± 1.37 *Ca 19.17 ± 0.28 18.13 ± 0.98 16.41 ± 0.62 15.57 ± 0.85Mg 2.22 ± 0.08 1.54 ± 0.08 * 1.58 ± 0.09 1.32 ± 0.05
1 Data is presented as mean ± SE (n = 5). Asterisks (*) indicate significant differences between the studiedpopulations according to Mann–Whitney U-test (p < 0.05).
As for content of these nutrients in the N. ovata rhizome + roots, there were no signifi-cant differences in the nitrogen content between the studied orchid populations, althoughlower phosphorus content was noted in the plants growing on the fly ash substrate.
As expected, among the studied metals the N. ovata plants accumulated K, Ca, andMg in the greatest amounts (Table 3). The potassium content in the both the abovegroundand underground organs of N. ovata was 1.4 times higher than in the plants from the FADwhile the studied populations did not significantly differ in terms of Ca and Mg content.
As for the other metals, they accumulated to the greatest extent in the N. ovata under-ground organs (Figure 3). The content of toxic elements such as Pb and Cr was higher in therhizome + roots of the plants colonizing FAD (by 43 and 26%, respectively). In contrast, thecontent of essential Cu and Fe was lower (1.3 and 5.8 times, respectively). A similar tendency
140
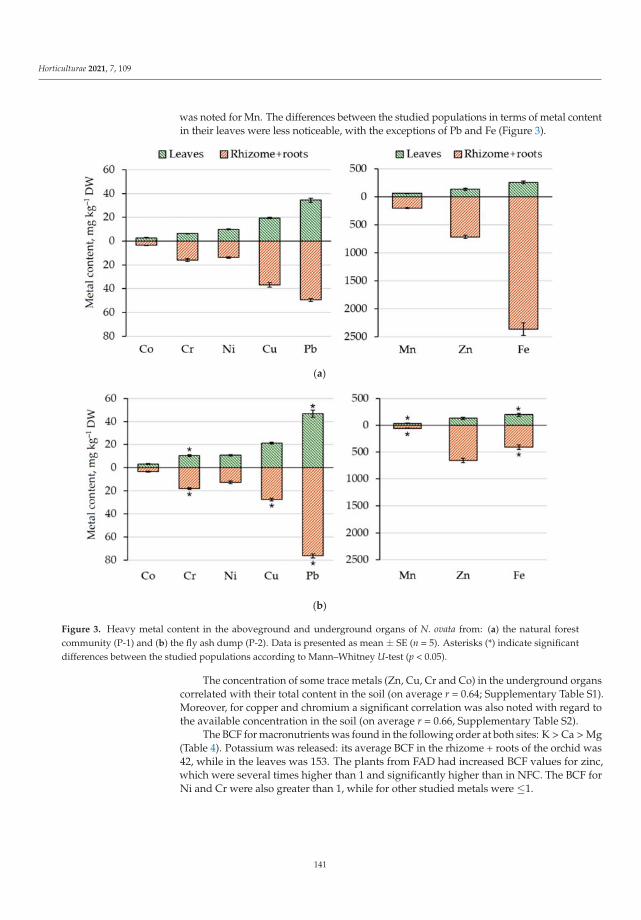
Horticulturae 2021, 7, 109
was noted for Mn. The differences between the studied populations in terms of metal contentin their leaves were less noticeable, with the exceptions of Pb and Fe (Figure 3).
(a)
(b)
Figure 3. Heavy metal content in the aboveground and underground organs of N. ovata from: (a) the natural forestcommunity (P-1) and (b) the fly ash dump (P-2). Data is presented as mean ± SE (n = 5). Asterisks (*) indicate significantdifferences between the studied populations according to Mann–Whitney U-test (p < 0.05).
The concentration of some trace metals (Zn, Cu, Cr and Co) in the underground organscorrelated with their total content in the soil (on average r = 0.64; Supplementary Table S1).Moreover, for copper and chromium a significant correlation was also noted with regard tothe available concentration in the soil (on average r = 0.66, Supplementary Table S2).
The BCF for macronutrients was found in the following order at both sites: K > Ca > Mg(Table 4). Potassium was released: its average BCF in the rhizome + roots of the orchid was42, while in the leaves was 153. The plants from FAD had increased BCF values for zinc,which were several times higher than 1 and significantly higher than in NFC. The BCF forNi and Cr were also greater than 1, while for other studied metals were ≤1.
141

Horticulturae 2021, 7, 109
Table 4. Bioconcentration factors (BCF) and translocation factor (TF) from underground to above-ground organs of N. ovata from natural forest community (P-1) and fly ash dump (P-2).
MetalBCF(Aboveground) BCF(Underground) TF(Aboveground/Underground)
P-1 P-2 P-1 P-2 P-1 P-2
K 155.94 151.09 43.13 40.86 3.62 3.70Ca 2.89 4.08 2.47 3.51 1.17 1.16Mg 1.75 1.95 1.25 1.67 1.41 1.17Fe 0.05 0.08 0.49 0.16 0.11 0.48Zn 0.85 1.39 4.50 7.11 0.19 0.20Mn 0.04 0.08 0.15 0.13 0.31 0.62Pb 0.49 0.54 0.71 0.82 0.70 0.66Cu 0.23 0.54 0.44 0.70 0.53 0.77Ni 1.17 2.40 1.62 2.87 0.72 0.84Cr 1.34 1.30 2.99 2.24 0.45 0.58Co 0.84 0.82 1.04 0.94 0.81 0.88
3.3. Morphological and Anatomical Characteristics of N. ovata
The orchid plants growing on the fly ash substrate (P-2) had a lower shoot andinflorescence length, and number of flowers (by 30, 27, and 20%, respectively) compared toP-1, but at the same time they had a 1.4-fold larger leaf area (Table 5).
Table 5. Morphological characteristics of the flowering individuals of the N. ovata populations fromthe natural forest community (P-1) and the fly ash dump (P-2).
ParametersPopulations
P-1 P-2
Shoot length, cm 60.2 ± 7.2 1 45.0 ± 2.1 *(46.0–69.5) 2 (23.0–69.0)
Inflorescence length, cm 18.8 ± 4.9 14.8 ± 1.1(13.0–28.5) (7.2–30.0)
Number of flowers, pcs. 29.0 ± 8.3 23.7 ± 2.1(17.0–45.0) (7.0–46.0)
Upper leaf area, cm2 38.9 ± 8.7 48.1 ± 5.8(12.9–60.6) (22.8–87.5)
Lower leaf area, cm2 33.7 ± 11.9 53.6 ± 7.2(15.1–63.6) (24.1–101.4)
1 Data is presented as mean ± SE (n = 20); 2 In the brackets are the minimum and maximum values. Asterisks(*) indicate significant differences between the studied populations according to Mann–Whitney U-test (p < 0.05).
The N. ovata leaves have a homogeneous mesophyll structure. The study showed thatthe orchids colonizing the fly ash substrate were distinguished by a thicker epidermis (by14%) and lower mesophyll thickness (by 6%), compared to individuals from the naturalhabitat (Figure 4a,b).
There were no significant differences between the studied populations in terms of thenumber of mesophyll cells (Figure 4c), and their surface area and volume (SupplementaryTable S5), whereas an increased number of chloroplasts both per cell (by 18%) and per unitcell area (by 13%), was noted for P-2 plants, compared to their P-1 counterparts (Figure 4d;Supplementary Table S5). The cell volume per chloroplast in the leaves of N. ovata fromFAD was lower (Figure 4e) than in plants from NFC, while the reverse trend was observedfor the chloroplast membrane index (Figure 4f).
142

Horticulturae 2021, 7, 109
(a) (b)
(c) (d)
(e) (f)
Figure 4. The mesostructure parameters of the lower leaf of N. ovata from the natural forest community (P-1) and the fly ashdump (P-2): (a) epidermis thickness; (b) mesophyll thickness; (c) number of cells; (d) number of chloroplasts per cell; (e) cellvolume per chloroplast (CVC); (f) chloroplast membrane index (CMI). The small solid square indicates mean values (n = 30);boxes present mean ± SE; the whiskers are the minimum and maximum values. Asterisks (*) indicate significant differencesbetween the studied populations according to Mann–Whitney U-test (p < 0.05).
3.4. Physiological and Biochemical Parameters of N. ovata
As shown in Figure 5a, the leaves of N. ovata from the natural habitat contained2.5 times higher Chl a than Chl b. The Chl a content in the P-2 plants was 1.6 times lowerthan in the P-1 plants. In contrast, the Chl b and carotenoid content in the orchids on the flyash substrates was higher (14% and 33%, respectively). A 1.9-fold decrease in Chl a/b and
143
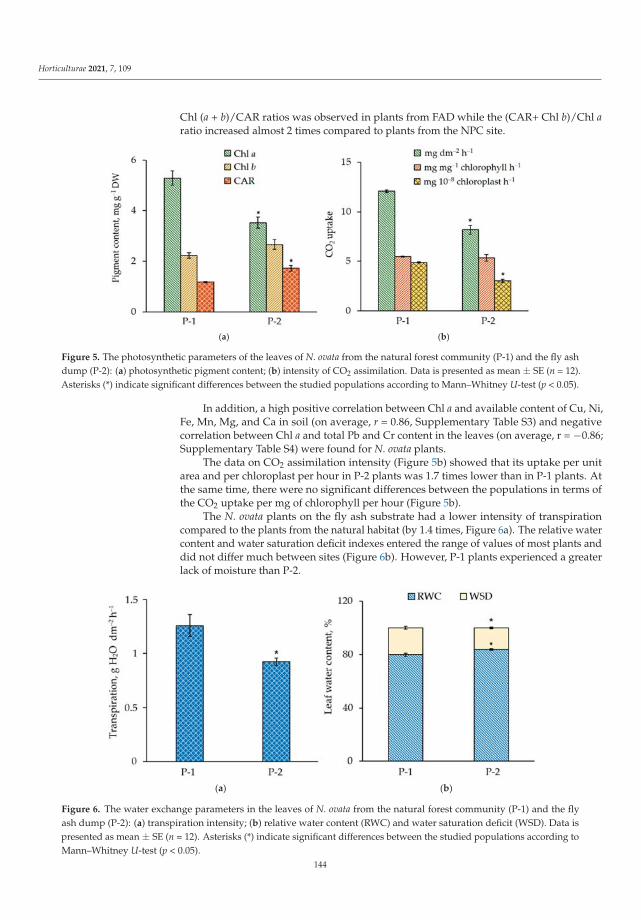
Horticulturae 2021, 7, 109
Chl (a + b)/CAR ratios was observed in plants from FAD while the (CAR+ Chl b)/Chl aratio increased almost 2 times compared to plants from the NPC site.
(a) (b)
Figure 5. The photosynthetic parameters of the leaves of N. ovata from the natural forest community (P-1) and the fly ashdump (P-2): (a) photosynthetic pigment content; (b) intensity of CO2 assimilation. Data is presented as mean ± SE (n = 12).Asterisks (*) indicate significant differences between the studied populations according to Mann–Whitney U-test (p < 0.05).
In addition, a high positive correlation between Chl a and available content of Cu, Ni,Fe, Mn, Mg, and Ca in soil (on average, r = 0.86, Supplementary Table S3) and negativecorrelation between Chl a and total Pb and Cr content in the leaves (on average, r = −0.86;Supplementary Table S4) were found for N. ovata plants.
The data on CO2 assimilation intensity (Figure 5b) showed that its uptake per unitarea and per chloroplast per hour in P-2 plants was 1.7 times lower than in P-1 plants. Atthe same time, there were no significant differences between the populations in terms ofthe CO2 uptake per mg of chlorophyll per hour (Figure 5b).
The N. ovata plants on the fly ash substrate had a lower intensity of transpirationcompared to the plants from the natural habitat (by 1.4 times, Figure 6a). The relative watercontent and water saturation deficit indexes entered the range of values of most plants anddid not differ much between sites (Figure 6b). However, P-1 plants experienced a greaterlack of moisture than P-2.
(a) (b)
Figure 6. The water exchange parameters in the leaves of N. ovata from the natural forest community (P-1) and the flyash dump (P-2): (a) transpiration intensity; (b) relative water content (RWC) and water saturation deficit (WSD). Data ispresented as mean ± SE (n = 12). Asterisks (*) indicate significant differences between the studied populations according toMann–Whitney U-test (p < 0.05).
144
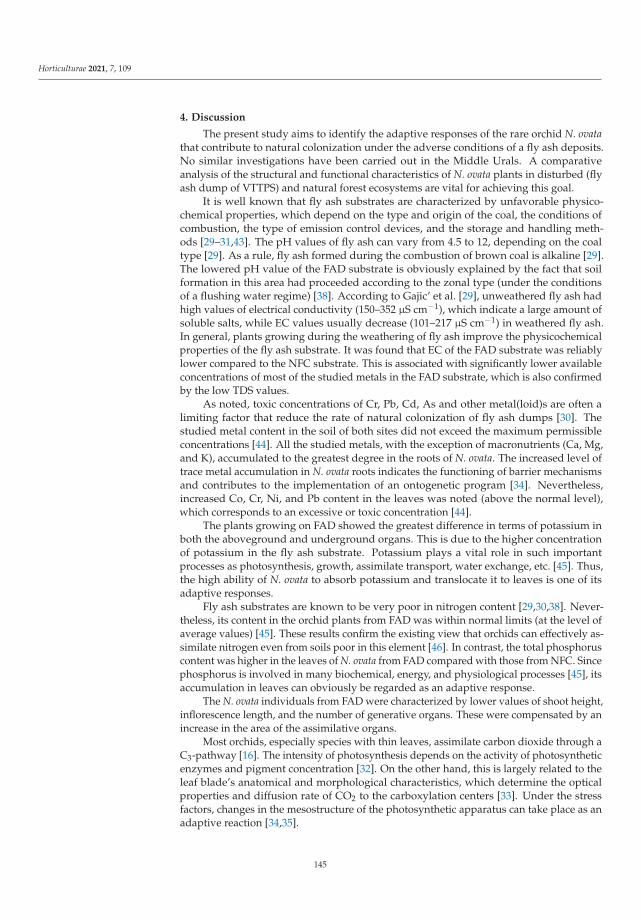
Horticulturae 2021, 7, 109
4. Discussion
The present study aims to identify the adaptive responses of the rare orchid N. ovatathat contribute to natural colonization under the adverse conditions of a fly ash deposits.No similar investigations have been carried out in the Middle Urals. A comparativeanalysis of the structural and functional characteristics of N. ovata plants in disturbed (flyash dump of VTTPS) and natural forest ecosystems are vital for achieving this goal.
It is well known that fly ash substrates are characterized by unfavorable physico-chemical properties, which depend on the type and origin of the coal, the conditions ofcombustion, the type of emission control devices, and the storage and handling meth-ods [29–31,43]. The pH values of fly ash can vary from 4.5 to 12, depending on the coaltype [29]. As a rule, fly ash formed during the combustion of brown coal is alkaline [29].The lowered pH value of the FAD substrate is obviously explained by the fact that soilformation in this area had proceeded according to the zonal type (under the conditionsof a flushing water regime) [38]. According to Gajic’ et al. [29], unweathered fly ash hadhigh values of electrical conductivity (150–352 μS cm−1), which indicate a large amount ofsoluble salts, while EC values usually decrease (101–217 μS cm−1) in weathered fly ash.In general, plants growing during the weathering of fly ash improve the physicochemicalproperties of the fly ash substrate. It was found that EC of the FAD substrate was reliablylower compared to the NFC substrate. This is associated with significantly lower availableconcentrations of most of the studied metals in the FAD substrate, which is also confirmedby the low TDS values.
As noted, toxic concentrations of Cr, Pb, Cd, As and other metal(loid)s are often alimiting factor that reduce the rate of natural colonization of fly ash dumps [30]. Thestudied metal content in the soil of both sites did not exceed the maximum permissibleconcentrations [44]. All the studied metals, with the exception of macronutrients (Ca, Mg,and K), accumulated to the greatest degree in the roots of N. ovata. The increased level oftrace metal accumulation in N. ovata roots indicates the functioning of barrier mechanismsand contributes to the implementation of an ontogenetic program [34]. Nevertheless,increased Co, Cr, Ni, and Pb content in the leaves was noted (above the normal level),which corresponds to an excessive or toxic concentration [44].
The plants growing on FAD showed the greatest difference in terms of potassium inboth the aboveground and underground organs. This is due to the higher concentrationof potassium in the fly ash substrate. Potassium plays a vital role in such importantprocesses as photosynthesis, growth, assimilate transport, water exchange, etc. [45]. Thus,the high ability of N. ovata to absorb potassium and translocate it to leaves is one of itsadaptive responses.
Fly ash substrates are known to be very poor in nitrogen content [29,30,38]. Never-theless, its content in the orchid plants from FAD was within normal limits (at the level ofaverage values) [45]. These results confirm the existing view that orchids can effectively as-similate nitrogen even from soils poor in this element [46]. In contrast, the total phosphoruscontent was higher in the leaves of N. ovata from FAD compared with those from NFC. Sincephosphorus is involved in many biochemical, energy, and physiological processes [45], itsaccumulation in leaves can obviously be regarded as an adaptive response.
The N. ovata individuals from FAD were characterized by lower values of shoot height,inflorescence length, and the number of generative organs. These were compensated by anincrease in the area of the assimilative organs.
Most orchids, especially species with thin leaves, assimilate carbon dioxide through aC3-pathway [16]. The intensity of photosynthesis depends on the activity of photosyntheticenzymes and pigment concentration [32]. On the other hand, this is largely related to theleaf blade’s anatomical and morphological characteristics, which determine the opticalproperties and diffusion rate of CO2 to the carboxylation centers [33]. Under the stressfactors, changes in the mesostructure of the photosynthetic apparatus can take place as anadaptive reaction [34,35].
145
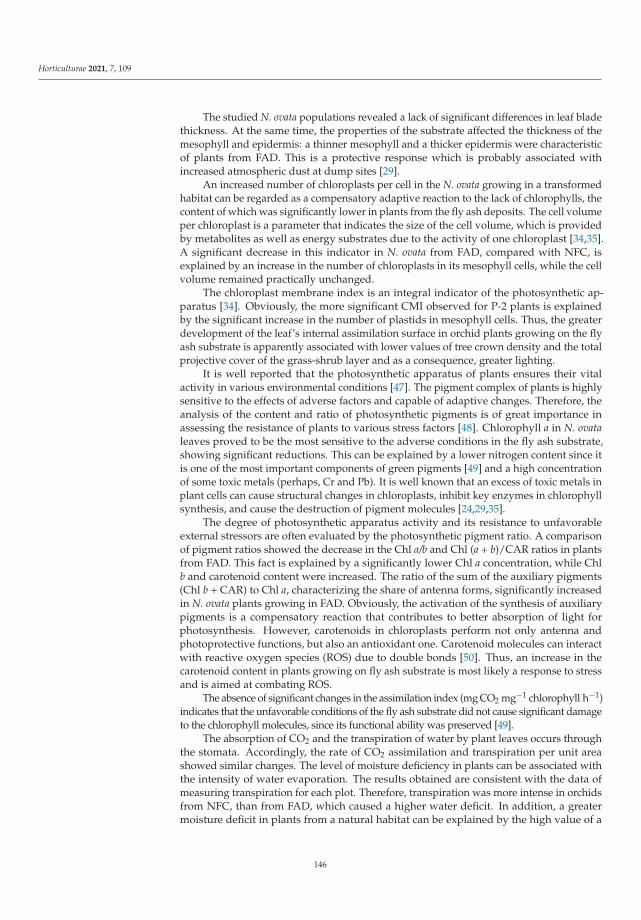
Horticulturae 2021, 7, 109
The studied N. ovata populations revealed a lack of significant differences in leaf bladethickness. At the same time, the properties of the substrate affected the thickness of themesophyll and epidermis: a thinner mesophyll and a thicker epidermis were characteristicof plants from FAD. This is a protective response which is probably associated withincreased atmospheric dust at dump sites [29].
An increased number of chloroplasts per cell in the N. ovata growing in a transformedhabitat can be regarded as a compensatory adaptive reaction to the lack of chlorophylls, thecontent of which was significantly lower in plants from the fly ash deposits. The cell volumeper chloroplast is a parameter that indicates the size of the cell volume, which is providedby metabolites as well as energy substrates due to the activity of one chloroplast [34,35].A significant decrease in this indicator in N. ovata from FAD, compared with NFC, isexplained by an increase in the number of chloroplasts in its mesophyll cells, while the cellvolume remained practically unchanged.
The chloroplast membrane index is an integral indicator of the photosynthetic ap-paratus [34]. Obviously, the more significant CMI observed for P-2 plants is explainedby the significant increase in the number of plastids in mesophyll cells. Thus, the greaterdevelopment of the leaf’s internal assimilation surface in orchid plants growing on the flyash substrate is apparently associated with lower values of tree crown density and the totalprojective cover of the grass-shrub layer and as a consequence, greater lighting.
It is well reported that the photosynthetic apparatus of plants ensures their vitalactivity in various environmental conditions [47]. The pigment complex of plants is highlysensitive to the effects of adverse factors and capable of adaptive changes. Therefore, theanalysis of the content and ratio of photosynthetic pigments is of great importance inassessing the resistance of plants to various stress factors [48]. Chlorophyll a in N. ovataleaves proved to be the most sensitive to the adverse conditions in the fly ash substrate,showing significant reductions. This can be explained by a lower nitrogen content since itis one of the most important components of green pigments [49] and a high concentrationof some toxic metals (perhaps, Cr and Pb). It is well known that an excess of toxic metals inplant cells can cause structural changes in chloroplasts, inhibit key enzymes in chlorophyllsynthesis, and cause the destruction of pigment molecules [24,29,35].
The degree of photosynthetic apparatus activity and its resistance to unfavorableexternal stressors are often evaluated by the photosynthetic pigment ratio. A comparisonof pigment ratios showed the decrease in the Chl a/b and Chl (a + b)/CAR ratios in plantsfrom FAD. This fact is explained by a significantly lower Chl a concentration, while Chlb and carotenoid content were increased. The ratio of the sum of the auxiliary pigments(Chl b + CAR) to Chl a, characterizing the share of antenna forms, significantly increasedin N. ovata plants growing in FAD. Obviously, the activation of the synthesis of auxiliarypigments is a compensatory reaction that contributes to better absorption of light forphotosynthesis. However, carotenoids in chloroplasts perform not only antenna andphotoprotective functions, but also an antioxidant one. Carotenoid molecules can interactwith reactive oxygen species (ROS) due to double bonds [50]. Thus, an increase in thecarotenoid content in plants growing on fly ash substrate is most likely a response to stressand is aimed at combating ROS.
The absence of significant changes in the assimilation index (mg CO2 mg−1 chlorophyll h−1)indicates that the unfavorable conditions of the fly ash substrate did not cause significant damageto the chlorophyll molecules, since its functional ability was preserved [49].
The absorption of CO2 and the transpiration of water by plant leaves occurs throughthe stomata. Accordingly, the rate of CO2 assimilation and transpiration per unit areashowed similar changes. The level of moisture deficiency in plants can be associated withthe intensity of water evaporation. The results obtained are consistent with the data ofmeasuring transpiration for each plot. Therefore, transpiration was more intense in orchidsfrom NFC, than from FAD, which caused a higher water deficit. In addition, a greatermoisture deficit in plants from a natural habitat can be explained by the high value of a
146
Horticulturae 2021, 7, 109
projective vegetation cover. Consequently, there was probably competition between theplants for resources, including water.
5. Conclusions
The present study revealed those adaptive structural and functional features of Neottiaovata that contribute to its survival strategies in a transformed habitat. Despite the adverseedaphic conditions of the fly ash dump, the population size of this species was noticeablyhigher than that in natural forest community. This is due to less phytocoenotic stress onthe fly ash deposits while the population of N. ovata in its natural habitat experienceshigher level of competition. Moreover, the natural colonization of N. ovata on the fly ashsubstrate was facilitated by adaptive changes in the mesostructure parameters of the leaves,such as an increase in epidermis thickness, the number of chloroplasts in the cell, andthe internal assimilating surface. The N. ovata plants colonizing the fly ash dump werecharacterized by the higher chlorophyll b and carotenoids content compared to plantsgrowing in the natural forest community that evidenced the compensatory response on thedecrease in chlorophyll a. Furthermore, N. ovata growing on the fly ash substrate retained arelatively favorable water balance, which also contributed to its high resistance to adverseenvironmental conditions.
The content of most of the studied metals in the underground parts (rhizome + roots)of N. ovata was considerably higher than in the leaves, which diminished the harmful effectof toxic metals on the aboveground organs, including the generative ones. Despite thelower content of most of the macro- and micronutrients in the fly ash substrate and thehigher concentration of some toxic heavy metals (lead and chromium), the plants from thetransformed ecosystem showed high viability.
The study of the morphophysiological features of orchids in technologically disturbedhabitats is necessary for developing measures to protect the gene pool of rare plant speciesand to solve applied problems associated with identifying optimal conditions for natural-ization and introduction into a new environment.
Supplementary Materials: The following are available online at https://www.mdpi.com/article/10.3390/horticulturae7050109/s1, Table S1: Spearman’s correlation between total metal content inthe soil with metals in leaves and rhizome + roots of N. ovata from the natural forest communityand the fly ash dump; Table S2: Spearman’s correlation between available metal content in the soilwith metals in leaves and rhizome + roots of N. ovata from the natural forest community and the flyash dump; Table S3: Spearman’s correlation between total and available metal content in the soilwith physiological parameters of N. ovata from the natural forest community and the fly ash dump;Table S4: Spearman’s correlation between metal content in the leaves and rhizome + roots withphysiological parameters of N. ovata from the natural forest community and the fly ash dump; TableS5: The mesostructure parameters of the lower leaf of N. ovata from the natural forest community(P-1) and the fly ash dump (P-2).
Author Contributions: Conceptualization, M.M., G.B. and E.F.; methodology, M.M., G.B., N.C., O.S.,E.F., N.L. and M.G.; software, M.M. and O.S.; validation, M.M., G.B. and E.F.; formal analysis, M.M.,G.B., E.F., N.L. and M.G.; investigation, M.M., G.B., N.C., O.S., E.F., N.L. and M.G.; resources, M.M.,E.F. and O.S.; data curation, M.M., G.B. and E.F.; writing—original draft preparation, M.M., G.B. andN.C.; writing—review and editing, M.M. and G.B.; visualization, M.M. and G.B.; supervision, M.M.and G.B.; project administration, M.M., G.B. and E.F.; funding acquisition, M.M., G.B., N.C., O.S., E.F.,N.L. and M.G. All authors have read and agreed to the published version of the manuscript.
Funding: The reported study was partly funded by RFBR and the Government of Sverdlovsk region,project number 20-44-660011 and the Ministry of Science and Higher Education of the RussianFederation as part of state task of the Ural Federal University, FEUZ-2020-0057.
Informed Consent Statement: Informed consent was obtained from all subjects involved in the study.
147
Horticulturae 2021, 7, 109
Acknowledgments: The authors are very grateful to Tripti and Adarsh Kumar (UrFU, Ekaterin-burg, Russia) for their constructive comments, and also Regional Center for Linguistic Supportof Scientific and Publication Activity of Academic and Administrative Staff of UrFU. Two anony-mous reviewers gave valuable comments for the improvement of this paper and we also gratefullyacknowledged them.
Conflicts of Interest: The authors declare no conflict of interest.
References
1. Chase, M.W.; Cameron, K.M.; Freudenstein, J.V.; Pridgeon, A.M.; Salazar, G.A.; van den Berg, C.; Schuiteman, A. An updatedclassification of Orchidaceae. Bot. J. Linn. Soc. 2015, 177, 151–174. [CrossRef]
2. Christenhusz, M.J.M.; Byng, J.W. The number of known plants species in the world and its annual increase. Phytotaxa2016, 261, 201–217. [CrossRef]
3. Vakhrameeva, M.G.; Tatarenko, I.V. Ecological characteristics of orchids of European Part of Russia. Acta Univ. Wratislav.2001, 79, 49–54.
4. Vakhrameeva, M.G.; Tatarenko, I.V.; Varlygina, T.I.; Torosyan, G.K.; Zagulskii, M.N. Orchids of Russia and Adjacent Countries(within the Borders of the Former USSR); A.R.G. Gantner Verlag: Ruggell, Liechtenstein, 2008.
5. Kindlmann, P.; Jersakova, J. Floral display, reproductive success, and conservation of terrestrial orchids. Selbyana 2005, 26, 136–144.[CrossRef]
6. Sasamori, M.H.; Endres, D.J.; Droste, A. Asymbiotic culture of Cattleya intermedia Graham (Orchidaceae): The influence ofmacronutrient salts and sucrose concentrations on survival and development of plantlets. Acta Bot. Bras. 2015, 29, 292–298.[CrossRef]
7. Einzmann, H.J.R.; Schickenberg, N.; Zotz, G. Variation in root morphology of epiphytic orchids along small–scale and large–scalemoisture gradients. Acta Bot. Bras. 2020, 34, 66–73. [CrossRef]
8. Brodmann, J.; Twele, R.; Francke, W.; Hölzler, G.; Zhang, Q.H.; Ayasse, M. Orchids mimic green–leaf volatiles to attractprey–hunting wasps for pollination. Curr. Biol. 2008, 18, 740–744. [CrossRef] [PubMed]
9. Brys, R.; Jacquemyn, H.; Hermy, M. Pollination efficiency and reproductive patterns in relation to local plant density, populationsize, and floral display in the rewarding Listera ovata (Orchidaceae). Bot. J. Linn. Soc. 2008, 157, 713–721. [CrossRef]
10. Jakubska–Busse, A.; Kadej, M. The pollination of Epipactis Zinn, 1757 (Orchidaceae) species in central Europe—the significanceof chemical attractants, floral morphology and concomitant insects. Acta Soc. Bot. Pol. 2011, 80, 49–57. [CrossRef]
11. Ehlers, B.K.; Pedersen, H. Genetic variation in three species of Epipactis (Orchidaceae): Geographic scale and evolutionaryinferences. Biol. J. Linn. Soc. 2000, 69, 411–430. [CrossRef]
12. Hens, H.; Jäkäläniemi, A.; Tali, K.; Efimov, P.; Kravchenko, A.V.; Kvist, L. Genetic structure of a regionally endangered orchid, thedark red helleborine (Epipactis atrorubens) at the edge of its distribution. Genetica 2017, 145, 209–221. [CrossRef]
13. Jurkiewicz, A.; Turnau, K.; Mesjasz–Przybylowicz, J.; Przybylowicz, W.; Godzik, B. Heavy metal localisation in mycorrhizas ofEpipactis atrorubens (Hoffm.) Besser (Orchidaceae) from zink mine tailings. Protoplasma 2001, 218, 117–124. [CrossRef]
14. Shefferson, R.; Kull, T.; Tali, K. Mycorrhizal interactions of orchids colonizing Estonian mine tailings hills. Am. J. Bot.2008, 95, 156–164. [CrossRef]
15. Tešitelová, T.; Tešitel, J.; Jersáková, J.; Ríhová, G.; Selosse, M.S. Symbiotic germination capability of four Epipactis species(Orchidaceae) is broader than expected from adult ecology. Am. J. Bot. 2012, 99, 1020–1032. [CrossRef]
16. Zhang, S.; Yang, Y.; Li, J.; Qin, J.; Zhang, W.; Hu, H. Physiological diversity of orchids. Plant Divers. 2018, 40, 196–208. [CrossRef]17. Swarts, D.N.; Dixon, W.D. Terrestrial orchid conservation in the age of extinction. Ann. Bot. 2009, 104, 543–556. [CrossRef]
[PubMed]18. Adamowski, W. Expansion of native Orchids in anthropogenous habitats. Pol. Bot. Stud. 2006, 22, 35–44.19. Jermakowicz, E.; Brzosko, E. Demographic responses of boreal–montane orchid Malaxis monophyllos (L.) Sw. populations to
contrasting environmental conditions. Acta Soc. Bot. Pol. 2016, 85, 1–17. [CrossRef]20. Rewicz, A.; Bomanowska, A.; Shevera, M.; Kurowski, J.; Krason, K.; Zielinska, K. Cities and disturbed areas as man–made
shelters for orchid communities. Not. Bot. Horti Agrobot. Cluj Napoca 2017, 45, 126–139. [CrossRef]21. Agostini, A.; Caltagirone, C.; Caredda, A.; Cicatelli, A.; Cogoni, A.; Farci, D.; Guarino, F.; Garau, A.; Labra, M.; Lussu, M.;
et al. Heavy metal tolerance of orchid populations growing on abandoned mine tailings: A case study in Sardinia Island (Italy).Ecotoxicol. Environ. Saf. 2020, 189, 110018. [CrossRef] [PubMed]
22. Filimonova, E.I.; Lukina, N.V.; Glazyrina, M.A. Orchidaceae in the technogenic ecosystems of the Urals. Ecosystems 2014, 11, 68–75.(In Russian)
23. Filimonova, E.I.; Lukina, N.V.; Glazyrina, M.A.; Borisova, G.G.; Maleva, M.G.; Chukina, N.V. Endangered orchid plant Epipactisatrorubens on serpentine and granite outcrops of Middle Urals, Russia: A comparative morphophysiological study. AIP Conf. Proc.2019, 040016. [CrossRef]
24. Filimonova, E.; Lukina, N.; Glazyrina, M.; Borisova, G.; Tripti; Kumar, A.; Maleva, M. A comparative study of Epipactis atrorubensin two different forest communities of the Middle Urals, Russia. J. For. Res. 2020, 31, 2111–2120. [CrossRef]
25. Kotilínek, M.; Tešitelová, T.; Jersáková, J. Biological Flora of the British Isles: Neottia ovata. J. Ecol. 2015, 103, 1354–1366. [CrossRef]
148
Horticulturae 2021, 7, 109
26. Vladimir Nikolaevich, B.; Nikolai Sergeevich, K. Red Book of the Sverdlovsk Region: Animals, Plants, Mushrooms; Mir LLC:Yekaterinburg, Russia, 2018. (In Russian)
27. Wiegand, K.M.A. Revision of the Genus Listera. J. Torrey Bot. Soc. 1899, 26, 157–171. [CrossRef]28. Brzosko, E. The dynamics of Listera ovata populations on mineral islands in the Biebrza National Park. Acta Soc. Bot. Pol.
2002, 71, 243–251. [CrossRef]29. Gajic´, G.; Djurdjevic´, L.; Kostic, O.; Jaric´, S.; Mitrovic´, M.; Pavlovic, P. Ecological potential of plants for phytoremediation and
ecorestoration of fly ash deposits and mine wastes. Front. Environ. Sci. 2018, 6, 124. [CrossRef]30. Pandey, V.C.; Prakash, P.; Bajpai, O.; Kumar, A.; Singh, N. Phytodiversity on fly ash deposits: Evaluation of naturally colonized
species for sustainable phytorestoration. Environ. Sci. Pollut. Res. 2015, 22, 2776–2787. [CrossRef]31. Filimonova, E.I.; Lukina, N.V.; Glazyrina, M.A.; Veselkin, D.V.; Chibrik, T.S.; Stephanovich, G.S. Morphological features of
juvenile Pinus sylvestris L. on the ash dumps in the Middle Urals. AIP Conf. Proc. 2019, 030008. [CrossRef]32. Mokronosov, A.T. Mesotructure and functional activity of the photosynthetic apparatus. In Mesotructure and Functional Activity of
the Photosynthetic Apparatus; Mokronosov, A.T., Ed.; Ural. Gos. Univ.: Sverdlovsk, Russia, 1978; pp. 5–15. (In Russian)33. Mokronosov, A.T.; Gavrilenko, V.F.; Zhigalova, T.V. Photosynthesis. Physiological and Environmental and Biochemical Aspects;
Academia: Moscow, Russia, 2006. (In Russian)34. Ivanova, L.A.; P’yankov, V.I. Structural adaptation of the leaf mesophyll to shading. Russ. J. Plant Physiol. 2002, 49, 419–431.
[CrossRef]35. Ivanova, L.A. Adaptive features of leaf structure in plants of different ecological groups. Russ. J. Ecol. 2014, 45, 107–115. [CrossRef]36. Terashima, I.; Miyazawa, S.; Hanba, Y.T. Why are sun leaves thicker than shade leaves?—Consideration based on analyses of CO2
diffusion in the leaf. J. Plant Res. 2001, 114, 93–105. [CrossRef]37. Slaton, M.R.; Smith, W.K. Mesophyll architecture and cell exposure to intercellular air space in alpine, desert, and forest species.
Int. J. Plant Sci. 2002, 163, 937–948. [CrossRef]38. Nekrasova, O.; Radchenko, T.; Filimonova, E.; Lukina, N.; Glazyrina, M.; Dergacheva, M.; Uchaev, A.; Betekhtina, A. Natural
forest colonisation and soil formation on ash dump in southern taiga. Folia For. Pol. Ser. A For. 2020, 62, 306–316. [CrossRef]39. Polley, J.R. Colorimetric determination of nitrogen in biological materials. Anal. Chem. 1954, 26, 1523–1524. [CrossRef]40. Fiske, C.H.; Subbarow, Y. The colorimetric determination of phosphorus. J. Biol. Chem. 1925, 66, 375–400. [CrossRef]41. Hellmuth, E.O. Measurement of Leaf Water Deficit with Particular Reference to the Whole Leaf Method. J. Ecol. 1970, 58, 409–417.
[CrossRef]42. Lichtenthaler, H.K. [34] Chlorophylls and carotenoids: Pigments of photosynthetic biomembranes. Methods Enzymol. 1987, 148, 350–382.
[CrossRef]43. Pandey, V.C.; Abhilashb, P.C.; Upadhyaya, R.N.; Tewari, D.D. Application of fly ash on the growth performance and translocation
of toxic heavy metals within Cajanus cajan L.: Implication for safe utilization of fly ash for agricultural production. J. Hazard. Mater.2009, 166, 255–259. [CrossRef]
44. Kabata–Pendias, A.; Mukherjee, A.B. Trace Elements from Soil to Human; Springer: Berlin/Heidelberg, Germany, 2007.45. Marschner, H. Mineral Nutrition of Higher Plants, 2nd ed.; Academic Press: San Diego, CA, USA, 1995.46. Hejcman, M.; Schellberg, J.; Pavlu, V. Dactylorhiza maculata, Platanthera bifolia and Listera ovata survive N application under P
limitation. Acta Oecol. 2010, 36, 684–688. [CrossRef]47. Van Arendonk, J.J.C.M.; Poorter, H. The chemical composition and anatomical structure of leaves of grass species differing in
relative growth rate. Plant Cell Environ. 1994, 17, 963–970. [CrossRef]48. Ashraf, M.; Harris, P.J.C. Photosynthesis under stressful environments: An overview. Photosynthetica 2013, 51, 163–190. [CrossRef]49. Golovko, T.; Tabalenkova, G. Pigments and productivity of the crop plants. In Photosynthetic Pigments: Chemical Structure, Biological
Function and Ecology; Golovko, T.K., Gruszecki, W.I., Prasad, M.N.V., Strzalka, K.J., Eds.; Komi Scientific Centre of the Ural Branchof the Russian Academy of Sciences: Syktyvkar, Russia, 2014; pp. 207–220.
50. Gruszecki, W.; Szymanska, R.; Fiedor, L. Carotenoids as photoprotectors. In Photosynthetic Pigments: Chemical Structure, BiologicalFunction and Ecology; Golovko, T.K., Gruszecki, W.I., Prasad, M.N.V., Strzalka, K.J., Eds.; Komi Scientific Centre of the Ural Branchof the Russian Academy of Sciences: Syktyvkar, Russia, 2014; pp. 161–170.
149


horticulturae
Article
Influence of Phosphite Supply in the MS Medium on RootMorphological Characteristics, Fresh Biomass and EnzymaticBehavior in Five Genotypes of Potato (Solanum tuberosum L.)
Richard Dormatey 1,2,†, Chao Sun 1,2,†, Kazim Ali 1,3, Tianyuan Qin 1,2, Derong Xu 1,2, Zhenzhen Bi 1,2
and Jiangping Bai 1,2,*
Citation: Dormatey, R.; Sun, C.; Ali, K.;
Qin, T.; Xu, D.; Bi, Z.; Bai, J. Influence of
Phosphite Supply in the MS Medium
on Root Morphological Characteristics,
Fresh Biomass and Enzymatic
Behavior in Five Genotypes of Potato
(Solanum tuberosum L.). Horticulturae
2021, 7, 265. https://doi.org/
10.3390/horticulturae7090265
Academic Editors:
Agnieszka Hanaka,
Jolanta Jaroszuk-Sciseł and
Małgorzata Majewska
Received: 11 July 2021
Accepted: 23 August 2021
Published: 26 August 2021
Publisher’s Note: MDPI stays neutral
with regard to jurisdictional claims in
published maps and institutional affil-
iations.
Copyright: © 2021 by the authors.
Licensee MDPI, Basel, Switzerland.
This article is an open access article
distributed under the terms and
conditions of the Creative Commons
Attribution (CC BY) license (https://
creativecommons.org/licenses/by/
4.0/).
1 Department of Crop Genetics and Breeding, College of Agronomy, Gansu Agricultural University,Lanzhou 730070, China; [email protected] (R.D.); [email protected] (C.S.);[email protected] (K.A.); [email protected] (T.Q.); [email protected] (D.X.);[email protected] (Z.B.)
2 Gansu Provincial Key Laboratory of Aridland Crop Science, Lanzhou 730070, China3 National Institute for Genomics and Advanced Biotechnology, National Agricultural Research Centre,
Park Road, Islamabad 45500, Pakistan* Correspondence: [email protected]† Richard Dormatey and Chao Sun contributed equally to this work.
Abstract: Crop production is threatened by low phosphorus (P) availability and weed interference.Obtaining plant genotypes that can utilize Phosphite (Phi) as fertilizer can supplement phosphates(Pi) while providing an environmentally friendly means of weed control. The study was conductedto determine the tolerance and enzymatic behavior of five potato genotypes to PO3. Explantswere regenerated in vitro from two nodal cuttings and cultured on Murashige and Skoog (MS)medium under controlled conditions for 30 days. Matured plantlets were subcultured for 20 daysin MS medium containing (0.25, 0.5 mM) Phi and Pi and No-P (-Phi + -Pi). The results showedsignificant genotypic variation in tolerance indices among the five genotypes. Atlantic showed greatertolerance to Phi, with highest total root length (50.84%), root projected area (75.09%), root surfacearea (68.94%), root volume (33.49%) and number of root forks (75.66%). Phi induced an increasingtrend in the levels of hydrogen peroxide in the genotypes with the least effect in Atlantic. Thecomprehensive evaluation analysis confirmed the tolerance of Atlantic genotype with this ranking;Atlantic, Longshu3, Qingshu9, Longshu6 and Gannong2. Antioxidant enzyme activities and prolinecontent also increased significantly under Phi and No-P treatments. The results suggested thatpotato genotypes with larger root systems may be more tolerant to Phi than genotypes with smallerroot systems.
Keywords: phosphite stress; antioxidant enzyme; hydrogen peroxide; root morphology; potato; genotypes
1. Introduction
Phosphorus (P) is an important macronutrient required by all living organisms anda very important cellular component that plays a crucial role in biological activities [1,2].Phosphorus is involved in the signaling of target proteins through phosphorylation and de-phosphorylation that determine various cellular performances for optimal plant growth [3].The major P forms include phosphate and phosphite, which are used in agriculture [4].Phosphate anions (H2PO4
−, HPO42− and PO4
3−) are certainly the main forms of P usedby plants for metabolic processes and development, while phosphite is a reduced formof Pi that can be readily taken up by plants through Pi transporters [3]. More than 90%of the Pi required by plants is supplied by the soil, which provides adequate storage [5].However, an estimated 80% of Pi fertilizer applied to soil worldwide is lost through immo-bilization and conversion to inorganic forms that plants cannot utilize directly [6]. SincePi is highly reactive and rapidly transformed by soil microbes, only 20–30% is effectively
Horticulturae 2021, 7, 265. https://doi.org/10.3390/horticulturae7090265 https://www.mdpi.com/journal/horticulturae
151
Horticulturae 2021, 7, 265
utilized by plants [7]. According to Gianessi [8], in most soils, weeds and crops competefor the available Pi, resulting in Pi deficiency to meet plant growth requirements. Asglobal demand for food increases, the overuse of PO4 fertilizers and herbicides has becomeinevitable [9]. This can accelerate the depletion of non-renewable phosphorus reserves,and increase production costs and prices of agricultural products; it also has significantenvironmental impacts, such as runoff into water bodies, leading to algal blooms, eu-trophication, etc. [10,11]. Overuse of herbicides in cultivation has led to the emergence ofherbicide-resistant superweeds in recent years [12]. Thus, low soil phosphorus availabilityand herbicide-resistant weeds have been identified as major threats to the long-term sustain-ability of agriculture [7,12,13], for which an effective long-term solution is urgently needed.
Phosphite anions (H2PO3− and HPO3
2−) have high solubility and low soil reactivity.Although plants and various microorganisms cannot utilize Phi, it can be used as a potentialtarget to enhance germplasm for phosphorus utilization by plants [14,15]. Phosphite has aninhibitory effect on plant growth with similar properties to herbicides [16]. The phosphitesalt does not pose any risk to human and animal health and is therefore massively usedas an effective fungicide in crop production [2]. Thus, phosphite has a direct effect onphytopathogenic fungi by inhibiting mycelial proliferation and reducing conidiogenesis ofFusarium sp. isolated from the rhizosphere of plants [17]. In addition, Phi can act indirectlyby stimulating the inherent defense mechanisms of plants to limit pathogen growth [18],and also activate host defense genes that help plants defend against disease [19] anddirectly suppress the growth of pathogens such as Phytophthora [20–22]. According toMehta et al. [23] and Thao and Yamakawa [24], Phi anions cannot be utilized by plants as aphosphorus nutrient, although Phi is well taken up by plant leaves and roots. The supplyof Phi to plants as a sole source of P fertilizer can hinder plant growth and a higher dose cancompletely destroy plants [25,26]. Moreover, McDonald, Grant and Plaxton [16] claimedthat Phi-treated plants accumulate Phi rapidly in their cells. Phosphite is phloem-mobileand accumulates in sink tissues [27]. Since Phi is not metabolized by plants, it remains intissues for a long time and consequently disrupts the signal transduction chain that allowsplants to detect and respond to Pi deficiency at the molecular level, thereby amplifying thenegative effects of Phi [23,28].
On the contrary, the stimulatory effect of Phi mediates structural and biochemicalchanges in potato periderm and rind [29]. Phi application improved fruit set and yieldof Persea americana (avocado) and also restored optimal growth of Pi deficient Citrusspecies [20]. Again, several reports indicated impressive results of Phi on plant P nutrition,which ultimately increased crop yields [25,30]. When Phi is added to the soil, it comes intocontact with microorganisms that help Phi to oxidize to Pi [2]. Thus, following microbialoxidation reactions, Phi may become available to the plant as a P nutrient through thisindirect pathway. Interestingly, efforts to generate transgenic plants with microbial genes(ptxD) that allow plants to use Phi as a sole P source have opened new possibilities for theuse of this P-containing compound for plant nutrition [30]. In contemporary agriculture,Phi is emerging as a unique biostimulant that improves crop productivity and quality,through direct antibiotic effects on microorganisms and inhibition via enhanced plantdefense responses. In addition, Phi induces a variety of abiotic stress tolerance mecha-nisms, including heat tolerance [31,32]. Obtaining a potato genotype that is tolerant to Phiwill enable us to conduct more advanced genetic studies to understand gene functionsfor subsequent molecular work. In this experiment, we investigated the effects of Phiconcentrations, MS medium without P nutrient (No-P) and sufficient Pi under in vitrocultures to determine the tolerance of potato genotypes. Nevertheless, there is insufficientinformation to test the assumption that Phi can stimulate antioxidant enzyme activitiesand hydrogen peroxide levels. Therefore, the experiment aims to: (1) determine the tol-erance of five potato genotypes to Phi stress using tolerance indices and (2) evaluate theresponses of antioxidant enzymes in Solanum tuberosum L. plantlets grown in differentconcentrations of Phi.
152
Horticulturae 2021, 7, 265
2. Materials and Methods
2.1. Place of the Experiment and Materials
The experiment was conducted in Gansu Providential key laboratory of AridlandCrop Science, College of Agronomy, Gansu Agricultural University Lanzhou, China(36◦03′ N; 103◦40′ E). Potato genotypes; Qingshu9, Longshu6, Longshu3, Atlantic andGannong2, were used in this experiment. The Atlantic genotype is reported to be drought-susceptible [33,34], the Longshu6 genotype is classified as moderately drought-tolerant [35],while Qingshu9 and Longshu3 were designated as drought-tolerant genotypes.
2.2. Source of Genotypes and Preparation of In Vitro Explants
The five potato genotypes were obtained from the laboratory of Crop Improvementand Germplasm Enhancement, Gansu Agricultural University, Lanzhou. Two years of fieldtrials have yielded a wealth of germplasm traits with a large number of sterile tissue cultureseedlings for genetic screening. Uniform explants from two nodal cuttings were culturedon the potato growth medium of Murashige and Skoog [36], which contained sucrose30 gL−1 and agar 5 gL−1. The pH was adjusted to 5.8 and the medium was autoclaved at121 ◦C at 15 1b psi for 25 min. Cultures were maintained in a growth room at 25 ± 1 ◦C,16 h photoperiod, active photosynthetic radiation of 45 μmol photons m−2s−1, and relativehumidity of 55–66% for a 30-day growth period. Plantlets were harvested after 30 days andused for subsequent experiments. Uniform cuttings of each with two axillary buds weresubcultured in an ethanol-sterilized chamber with laminar air flow and propagated in MSmedium supplemented with final concentrations of (0.25, 0.5 mM) Phi and Pi and No-Psupply, in sterilized glass vials (120 × 50 mm). Five cuttings of explants were cultured ineach vial, which was tightly sealed with the lids and kept at 25 ± 1 ◦C in the growth room.
2.3. Experimental Design and Treatments
A 5 × 5 factorial trial in a completely randomized design with 3 replicates wasconducted in a controlled growth room. Treatments included five potato genotypes, twoconcentrations (0.25 and 0.5 mM) each of phosphite and phosphate, and a medium withoutP fertilizer, representing (No-P). We used 0.5 mM Pi as a control. Fifty vials per genotypewere cultured, with each vial containing five explants. After 20 days, the plantlets wereexamined for physio-morphological indices. The rest of the plantlets were plunged intoliquid nitrogen and immediately preserved at −80 ◦C for biochemical analysis.
2.4. Measurements of Data2.4.1. Physio-Morphological Parameters
Physiological parameters, such as shoot and root length (cm), were determined witha ruler by randomly selecting three plants from each replication and averaging thesedata. The number of roots and leaves were counted on each selected plant. Fresh stemweight, fresh root weight and total plant weight (g) were also measured using an electronicbalance, with subsequent calculation of root to shoot ratio and tolerance biomass index foreach genotype.
The roots of the sampled plantlets were carefully detached from the stems, washedin distilled water and scanned using a root scanner (STD) 4800, EPSON, Quebec City, QC,Canada and the root morphological indices such as total root length (TRL), root projectedarea (RPA), root surface area (RSA), root volume (RV), number of root tips (NRT), numberof root forks (NRF) were calculated using root image analysis software Win RHIZO version5.0 (Regent Instruments, Inc., Quebec City, QC, Canada).
2.4.2. Tolerance Indexes Determination
Based on the formula of Wilkins [37], the Phi tolerance indices (TIs) of the root system,which clearly indicate the tolerance of the root systems to Phi stress, were calculatedaccording to the modifications of Dawuda et al. [38]. Since Phi uptake has direct effects onthe different measured root morphological indices and plant tolerance to Phi stress, Phi TI
153
Horticulturae 2021, 7, 265
was determined at the end of the experiment for each root index. Considering the score ofTI, we classified the genotype with the largest TI for most of the calculated indices as themost tolerant genotype among the five potato genotypes studied. The formula of TI is asfollows: TI = index under Phi stress/index without Phi stress × 100.
2.4.3. Determination of Hydrogen Peroxide and Malonaldehyde Contents in Samples
The content of hydrogen peroxide (H2O2) in the shoot samples was determined asdescribed by Junglee et al. [39], with minor modifications. A 0.1 g fresh shoot sample wascrushed using a mortar and pestle in liquid nitrogen. The homogenate was transferred to a2 mL centrifuge tube and kept in an ice bath. An amount of 1.5 mL of 0.1% Trichloroaceticacid (TCA) was added and the uniform mixture was centrifuged at 12,000× g for 15 min at4 ◦C. The supernatant 0.5 mL was carefully mixed with 0.5 mL Phosphate Buffer Saline (PBS)and 1 mL KI (1M) at 7.0 pH. The mixture was kept at 28 ◦C for one hour. The absorbancewas measured using a spectrophotometer (model U-5100, Seya-Namioka, Hitachi High-technologies, Minato-ku, Tokyo, Japan) at 390 nm. The contents of H2O2 were determinedwith reference to the standard curve (0, 1, 2, 3, 4 and 5 mmol−1). Malonaldehyde (MDA)Content Assessment Lipid peroxidation was measured by calculating the amount of MDAemitted using the technique for thiobarbituric acid (TBA) as presented in Hodges et al. [40].Preserved fresh shoot samples of 0.15 g were crushed using a mortar and pestle and4.5 mL of 10% TCA was added. Then, the homogenized substance was centrifuged at500× g for 15 min at 4 ◦C. The supernatant was transferred to a centrifuge bottle and thevolume (V) was recorded. Two mL of the supernatant was then mixed with 2 mL of 0.6%TBA. The homogenized mixture was warmed in boiling water for 20 min, the reactionstopped in an ice bath, and centrifuged at 5000× g for 10 min. The supernatant (2 mL)of V1 was transferred to a cuvette. The absorbance of the supernatant was measured at450, 532, and 600 nm, respectively. The MDA content was estimated according to thefollowing formula: MDA concentration (μmol/L) = 6.45 × (A532 – A600) − 0.56 × A450.MDA content (μmol/g FW) = C (μmol/L) × V (L) × V1 (mL)/2 mL × M (g FW).
2.4.4. Determination of Antioxidant Enzymes Activities and Proline Contents in Shoots
Enzyme samples were prepared from frozen tissue preserved at −80 ◦C. Each shootsample (approximately 0.5 g) was crushed in liquid nitrogen using a mortar and pestle andhomogenized in 5 mL of 0.1 M phosphate buffer (pH 7.8) containing 0.5 mM ethylenedi-amine tetraacetic acid (EDTA). Each homogenate was centrifuged at 12,000× g for 15 min at4 ◦C. The supernatant was collected for determination of enzymatic activity. The activitiesof catalase (CAT), peroxidase (POD) and superoxide dismutase (SOD) in the shoot ho-mogenate were determined using a reagent kit (Nanjing Jiancheng Bioengineering Institute,Nanjing, China) following the manufacturer’s instructions. The principles of these kits aresummarized as follows:
Catalase activity was determined by the spectrophotometric ammonium molybdatemethod, in which ammonium molybdate rapidly stops the H2O2 degradation reaction,catalyzed CAT, as the remaining H2O2 reaction produces a yellow compound that can beexamined by absorbance at 405 nm. A catalase unit activity was classified as the amount ofenzyme in 1 g of fresh tissue that reduces 1μmol of H2O2 per minute at 37 ◦C.
SOD activity was calculated according to the method of Dhindsa et al. [41]. Themethod is based on photochemical reduction of SOD-motivated Nitrotetrazolium BlueChloride (NBT) at 560 nm. A unit of SOD activity was well defined as the amount ofenzyme that inhibits 50% of the oxidation.
Peroxidase activity was determined by catalysis of hydrogen peroxide by POD, ob-serving absorbance changes at 420 nm and estimating the activity of POD. One unit ofPOD activity was defined as the amount of enzyme in 1 g of fresh plant tissue reducing1 μg of H2O2 at 37 ◦C per min. Proline content was determined according to the methodof Bates et al. [42]. Fresh shoot samples weighing 0.15 g were crushed with 4.5 mL of 3%(w/v) sulfosalicylic acid homogenization and the homogenate was heated in boiling water
154
Horticulturae 2021, 7, 265
for 30 min. This was then filtered through 0.2 μm filter paper. The extract and the volumeof extract were designated as Vt. The supernatant was used to determine the amount ofproline. The reaction mixture consisted of 2 mL of plant extract and an appropriate amountof ninhydrin glacial acetic acid. The test tubes containing the substance were heated inboiling water for 30 min. The reaction was quenched with the addition of toluene in anice bath. The substance was shaken vigorously on vortex mixer for 15–30 s and dividedinto two phases (upper and lower chromophase). The upper chromophase (toluene) wascarefully aspirated with a pipette, and absorbance was taken at 520 nm. The amounts ofproline were measured from the standard curve and expressed as μg·g−1FW. The amountof proline was calculated as: Proline content (μg/gFW) = C × Vt/(V × W).
2.5. Analyses of Data
All data collected were analyzed using SPSS software 22.0 version (IBM Corp., Chicago,IL, USA). Means of treatments were separated by Duncan’s multiple range tests with aprobability of 5%. The distribution of means was presented in the figures using standarddeviations. All graphs were created using GraphPad Prism version 8.0 (GraphPad Software,Inc., San Diego, CA, USA). Principal component analysis (PCA) was performed using thesoftware PAST-PAlaeontological Statistics, version 1.34. To confirm the tolerance status ofpotato genotypes to Phi, comprehensive evaluation analysis based on PCA was carried outusing R software package Statistics, version 3.5.3, considering the following formula:
μ(Xi) = (Xi − Xmin)/(Xmax − Xmin) i = 1, 2, 3 . . . n (1)
In Formula (1), μ(Xi) refers to the membership function value of the i-th comprehensiveindex, and Xi refers to the i-th. Comprehensive index value, Xmax refers to the maximumvalue of the i-th, comprehensive index, Xmin refers to the i-th, the minimum value of acomprehensive index. Calculation of the weighting of each comprehensive index:
Wi =Pi
∑mi=1 Pi
i = 1, 2, 3 . . . n (2)
In Formula (2), Wi represents the importance of the i-th comprehensive index in allcomprehensive indices. In terms of degree and weight, Pi is the contribution rate of the i-thcomprehensive index of each genotype. Calculation of comprehensive evaluation value (D).
D =m
∑i=1
[μ(Xi)xWi] i = 1, 2, 3 . . . n (3)
In Formula (3), D represents the phosphite tolerance of different potato genotypes.The D value is obtained by calculating the weighted membership function value. Thelarger the value of D, the more the Phi tolerance.
3. Results
3.1. Influence of Phosphite and Phosphate on Physiological Parameters of Five Potato Genotypesafter 20 Days’ Growth Period
The results showed significant (p < 0.01) genotype x phosphorus source and ratesinteraction effect on all physiological parameters (Figure 1a–d). Phosphite stress signif-icantly reduced the growth of potato genotypes in this study. Reduction in growth wasobserved in both roots and shoots resulting in reduction in fresh biomass and fresh root toshoot ratio. Mostly all physiological indices across all genotypes were decreased by PO3(0.25 and 0.5 mM) and No-P, but Atlantic genotype was least affected. At Phi 0.5 mM, thedecrease in leaf number was least (40.67%) in Longshu6 and greatest (57.16%) in Qingshu9.The least (61.93%) and greatest (81.73%) decrease in the number of roots occurred in At-lantic and Gannong2, respectively. The least (58.18, 6.22%) and greatest (69.95, 91.33%)decrease in shoot and root length was observed in Atlantic and Gannong2 genotypes,respectively. Moreover, similar results were observed among the five genotypes with
155

Horticulturae 2021, 7, 265
respect to PO3 (0.25 mM), but the decrease in physiological parameters due to Phi stresswas more pronounced at 0.5 compared to 0.25 mM. In the treatment without P supply,physiological growth was also decreased in all the five potato genotypes except Atlanticand Longshu3, which recorded increase in root length as compared to their respectivecontrol. Compared to the control, the application of PO3 at (0.25 and 0.5 mM) and No-Phad a negative effect on the fresh biomass indices of the genotypes (Table 1). Applicationof PO3 (0.25 mM) to genotype Gannong2 caused greater reductions in FRW (80.95%), FSW(82.48%) and TPW (82.00%). In addition, smaller reductions were observed in FSW (43.24%)and TPW (30.20%), and there was a slight increase in FRW (7.41%) of Atlantic genotype.The application of Phi (0.5 mM) gave similar results with a slight difference in severitycompared to the results obtained with 0.25 mM. Thus, application of higher rates of Phicould be lethal to potato plantlets. Maximum decrease in FRW (87.21%), FSW (83.94%) andTPW (80.50%) and minimum decrease in FRW (14.81%), FSW (60.81%) and TPW (48.51%)were observed in potato genotypes Gannong2 and Atlantic, respectively.
Figure 1. Effect of Phi, Pi and No-P on (a) number of leaves, (b) number of roots, (c) shoot length (cm), and (d) root length(cm) of five potato genotypes grown in modified MS media containing 0.25 and 0.5 mM Phi and Pi and No-P supply for20 days. Values denote the mean of 3 replicates, ±standard deviation (SD). Means obtained with the same letter in theminuscule do not differ by Duncan Multiple range’s test (p ≤ 0.05).
156
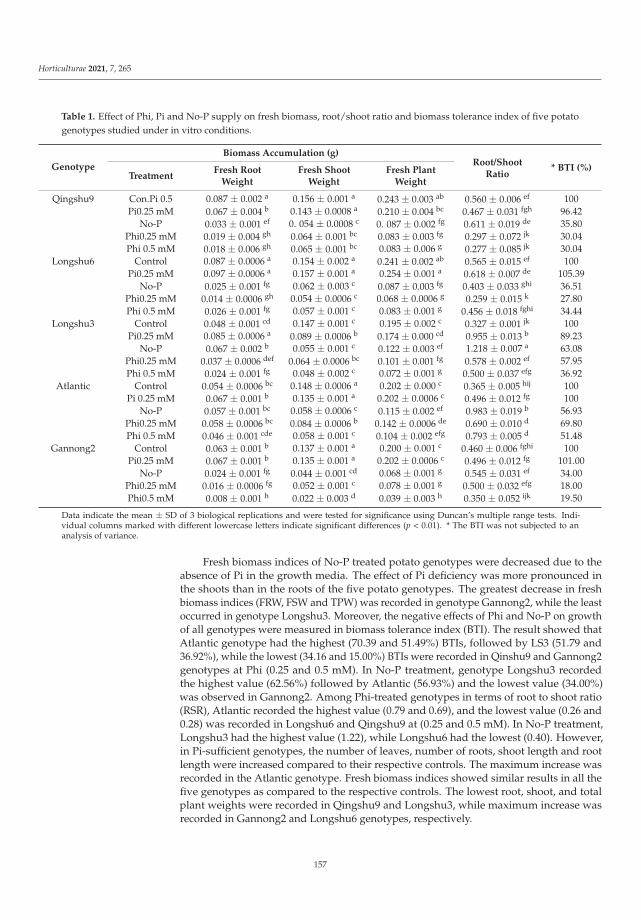
Horticulturae 2021, 7, 265
Table 1. Effect of Phi, Pi and No-P supply on fresh biomass, root/shoot ratio and biomass tolerance index of five potatogenotypes studied under in vitro conditions.
Genotype
Biomass Accumulation (g)Root/Shoot
Ratio* BTI (%)
TreatmentFresh Root
WeightFresh Shoot
WeightFresh Plant
Weight
Qingshu9 Con.Pi 0.5 0.087 ± 0.002 a 0.156 ± 0.001 a 0.243 ± 0.003 ab 0.560 ± 0.006 ef 100Pi0.25 mM 0.067 ± 0.004 b 0.143 ± 0.0008 a 0.210 ± 0.004 bc 0.467 ± 0.031 fgh 96.42
No-P 0.033 ± 0.001 ef 0. 054 ± 0.0008 c 0. 087 ± 0.002 fg 0.611 ± 0.019 de 35.80Phi0.25 mM 0.019 ± 0.004 gh 0.064 ± 0.001 bc 0.083 ± 0.003 fg 0.297 ± 0.072 jk 30.04Phi 0.5 mM 0.018 ± 0.006 gh 0.065 ± 0.001 bc 0.083 ± 0.006 g 0.277 ± 0.085 jk 30.04
Longshu6 Control 0.087 ± 0.0006 a 0.154 ± 0.002 a 0.241 ± 0.002 ab 0.565 ± 0.015 ef 100Pi0.25 mM 0.097 ± 0.0006 a 0.157 ± 0.001 a 0.254 ± 0.001 a 0.618 ± 0.007 de 105.39
No-P 0.025 ± 0.001 fg 0.062 ± 0.003 c 0.087 ± 0.003 fg 0.403 ± 0.033 ghi 36.51Phi0.25 mM 0.014 ± 0.0006 gh 0.054 ± 0.0006 c 0.068 ± 0.0006 g 0.259 ± 0.015 k 27.80Phi 0.5 mM 0.026 ± 0.001 fg 0.057 ± 0.001 c 0.083 ± 0.001 g 0.456 ± 0.018 fghi 34.44
Longshu3 Control 0.048 ± 0.001 cd 0.147 ± 0.001 c 0.195 ± 0.002 c 0.327 ± 0.001 jk 100Pi0.25 mM 0.085 ± 0.0006 a 0.089 ± 0.0006 b 0.174 ± 0.000 cd 0.955 ± 0.013 b 89.23
No-P 0.067 ± 0.002 b 0.055 ± 0.001 c 0.122 ± 0.003 ef 1.218 ± 0.007 a 63.08Phi0.25 mM 0.037 ± 0.0006 def 0.064 ± 0.0006 bc 0.101 ± 0.001 fg 0.578 ± 0.002 ef 57.95Phi 0.5 mM 0.024 ± 0.001 fg 0.048 ± 0.002 c 0.072 ± 0.001 g 0.500 ± 0.037 efg 36.92
Atlantic Control 0.054 ± 0.0006 bc 0.148 ± 0.0006 a 0.202 ± 0.000 c 0.365 ± 0.005 hij 100Pi 0.25 mM 0.067 ± 0.001 b 0.135 ± 0.001 a 0.202 ± 0.0006 c 0.496 ± 0.012 fg 100
No-P 0.057 ± 0.001 bc 0.058 ± 0.0006 c 0.115 ± 0.002 ef 0.983 ± 0.019 b 56.93Phi0.25 mM 0.058 ± 0.0006 bc 0.084 ± 0.0006 b 0.142 ± 0.0006 de 0.690 ± 0.010 d 69.80Phi 0.5 mM 0.046 ± 0.001 cde 0.058 ± 0.001 c 0.104 ± 0.002 efg 0.793 ± 0.005 d 51.48
Gannong2 Control 0.063 ± 0.001 b 0.137 ± 0.001 a 0.200 ± 0.001 c 0.460 ± 0.006 fghi 100Pi0.25 mM 0.067 ± 0.001 b 0.135 ± 0.001 a 0.202 ± 0.0006 c 0.496 ± 0.012 fg 101.00
No-P 0.024 ± 0.001 fg 0.044 ± 0.001 cd 0.068 ± 0.001 g 0.545 ± 0.031 ef 34.00Phi0.25 mM 0.016 ± 0.0006 fg 0.052 ± 0.001 c 0.078 ± 0.001 g 0.500 ± 0.032 efg 18.00Phi0.5 mM 0.008 ± 0.001 h 0.022 ± 0.003 d 0.039 ± 0.003 h 0.350 ± 0.052 ijk 19.50
Data indicate the mean ± SD of 3 biological replications and were tested for significance using Duncan’s multiple range tests. Indi-vidual columns marked with different lowercase letters indicate significant differences (p < 0.01). * The BTI was not subjected to ananalysis of variance.
Fresh biomass indices of No-P treated potato genotypes were decreased due to theabsence of Pi in the growth media. The effect of Pi deficiency was more pronounced inthe shoots than in the roots of the five potato genotypes. The greatest decrease in freshbiomass indices (FRW, FSW and TPW) was recorded in genotype Gannong2, while the leastoccurred in genotype Longshu3. Moreover, the negative effects of Phi and No-P on growthof all genotypes were measured in biomass tolerance index (BTI). The result showed thatAtlantic genotype had the highest (70.39 and 51.49%) BTIs, followed by LS3 (51.79 and36.92%), while the lowest (34.16 and 15.00%) BTIs were recorded in Qinshu9 and Gannong2genotypes at Phi (0.25 and 0.5 mM). In No-P treatment, genotype Longshu3 recordedthe highest value (62.56%) followed by Atlantic (56.93%) and the lowest value (34.00%)was observed in Gannong2. Among Phi-treated genotypes in terms of root to shoot ratio(RSR), Atlantic recorded the highest value (0.79 and 0.69), and the lowest value (0.26 and0.28) was recorded in Longshu6 and Qingshu9 at (0.25 and 0.5 mM). In No-P treatment,Longshu3 had the highest value (1.22), while Longshu6 had the lowest (0.40). However,in Pi-sufficient genotypes, the number of leaves, number of roots, shoot length and rootlength were increased compared to their respective controls. The maximum increase wasrecorded in the Atlantic genotype. Fresh biomass indices showed similar results in all thefive genotypes as compared to the respective controls. The lowest root, shoot, and totalplant weights were recorded in Qingshu9 and Longshu3, while maximum increase wasrecorded in Gannong2 and Longshu6 genotypes, respectively.
157
Horticulturae 2021, 7, 265
3.2. Effects of Phosphite, Phosphate and No-P Supply on Root Morphological Characteristics ofFive Potato Genotypes for 20 Days Growth Period
There were significant (p < 0.01) genotype x phosphite interaction effects on totalroot length (TRL), root projected area (RPA), root surface area (RSA), root volume (RV),number of root tips (NRT), and number of root forks (NRF) (Figure 2). In general, rootmorphological indices were decreased in all five genotypes, with the Atlantic genotypebeing the least affected. The decrease in TRL due to Phi effects was least (32.86 and 43.17%)in Atlantic and greatest (80.85 and 80.93%) in Longshu6 and Gannong2 at Phi (0.25 and0.5 mM), respectively. The least decrease in RPA (15.62 and 24.81%) was recorded in Atlanticwhile the greatest (68.57 and 75.85%) was observed in Gannong2 at (0.25 and 0.5 mM).Moreover, the least (16.86 and 30.85%) and greatest (85.57 and 84.50%) decrease in RSA wasobserved in Atlantic, Longshu3 and Longshu6 and Gannong2 genotypes, respectively. Theleast (53.85 and 66.51%) decrease in RV occurred in Atlantic, while the greatest (82.08 and84.70%) was observed in Longshu6 and Gannong2. Moreover, the least decrease (29.49 and24.34%) of NRT occurred in Atlantic and Longshu3 genotypes, while the greatest (85.02and 89.86%) was observed in Longshu6 and Gannong2, at 0.25 and 0.5 mM, respectively.The least (16.57 and 31.06%) decrease in NRF was observed in Atlantic, while the greatest(83.94 and 80.01%) was measured in Longshu6 and Gannong2, at Phi 0.25 and 0.5 mM,respectively. The decrease in root morphological parameters observed in the five genotypeswas due to Phi effects, which caused a decrease in the size of the root and shoot systemsof the genotypes. The root morphological indices of the treatment without P supply werealso decreased in all five genotypes. Mainly due to the absence of Pi in the No-P treatment,this reduced the root growth of the susceptible genotypes, while the tolerant genotypesdeveloped longer root systems. The least decrease in morphological indices was observedin Longshu3 and Atlantic, while the greatest decrease was observed in Gannong2 andLongshu6 genotypes. However, Pi-sufficient potato genotypes exhibited much higher rootmorphological indices than genotypes grown under Phi and No-P. Root morphologicalindices were slightly increased in Pi-sufficient plants of the five potato genotypes. Amongthe genotypes: Longshu3 and Longshu6 recorded the highest increase, while Atlantic andQingshu9 had the least increase in all root morphological indices.
158

Horticulturae 2021, 7, 265
Figure 2. Effect of PO3, PO4 and No-P on (a) Total root length (b) Root projected area (c) Root surface area (d) Root volume(e) Number of root tips and (f) Number of root forks of five potato genotypes grown for 20 days in medium containingconcentrations of 0.25, 0.5 mM PO3 and PO4 and No-P. Values symbolize the mean of 3 replicates ± standard deviation (SD).Means followed by the same lowercase letter do not differ among treatments by Duncan Multiple range’s test (p ≤ 0.05).
3.3. Tolerance of the Five Potato Genotypes to Phosphite Stress
There were significant differences (p < 0.01) in the tolerance indices (TIs) among thefive potato genotypes at 0.25, 0.5 mM and No-P (Figure 3). The result showed that after theplantlets were grown for 20 days in the Phi media, Atlantic had the highest TI for majorityof the measured indices such as TRL (56.84%), RPA (75.09%), RSA (68.94%), RV (33.49%)and NRF (75.66%) at Phi (0.5 mM). Considering this result, among the five potato genotypestested, the Atlantic genotype proved to be the most tolerant, except TI for NRT, whichwas highest in Longshu3 (69.16%). However, compared to Atlantic, the other genotypesobtained lower TI values and were found to be susceptible to PO3 stress.
159

Horticulturae 2021, 7, 265
Figure 3. Root PO3 tolerance indexes (%) of five potato genotypes under 0.5 mM Phi treatment.Qingshu9 = QS9; Longshu6 = LS6; Longshu3 = LS3; Atlantic = ATL and Gannong2 = GN2. Total rootlength = TRL; Root projected area = RPA; Root surface area = RSA; Root volume = RV; Number of roottips = NRT and Number of root forks = NRF. Values represent the mean of 3 replicates ± standarddeviation (SD). Bars associated with different lowercase letters show significant differences by DuncanMultiple Range’s test (p ≤ 0.05).
3.4. Content of H2O2 and MDA in the Shoots
There was a significant (p < 0.001) genotype x phosphite x rate effect on H2O2 andMDA content in shoots of potato genotypes (Figure 4). Compared to the control plants, Phiincreased H2O2 and MDA content in the shoots of the five genotypes by 50.96 to 68.84% and43.63 to 70.17% at 0.25 mM, 56.01 to 71.64% and 48.32 to 71.48% at 0.5 mM, respectively. Thehighest H2O2 and MDA values were observed in GN2, followed by genotypes Longshu6,Qingshu9 and Longshu3. The lowest H2O2 and MDA levels were observed in Atlanticgenotypes at Phi 0.25 and 0.5 mM, respectively. Moreover, similar results were obtainedwith respect to treatment without P supply in the five potato genotypes. However, Pi-sufficient plants in all five potato genotypes exhibited low H2O2 and MDA contents,compared to genotypes under Phi stress.
Figure 4. Effects of Phi, Pi and No-P on H2O2 and MDA content; (a) Shows H2O2 content and (b) shows MDA content inthe shoots of potato genotypes. Values denote the mean of 3 replicates ± standard deviation (SD). Duncan multiple rangetest (p ≤ 0.05) shows large differences between bars assigned to different lowercase letters.
160
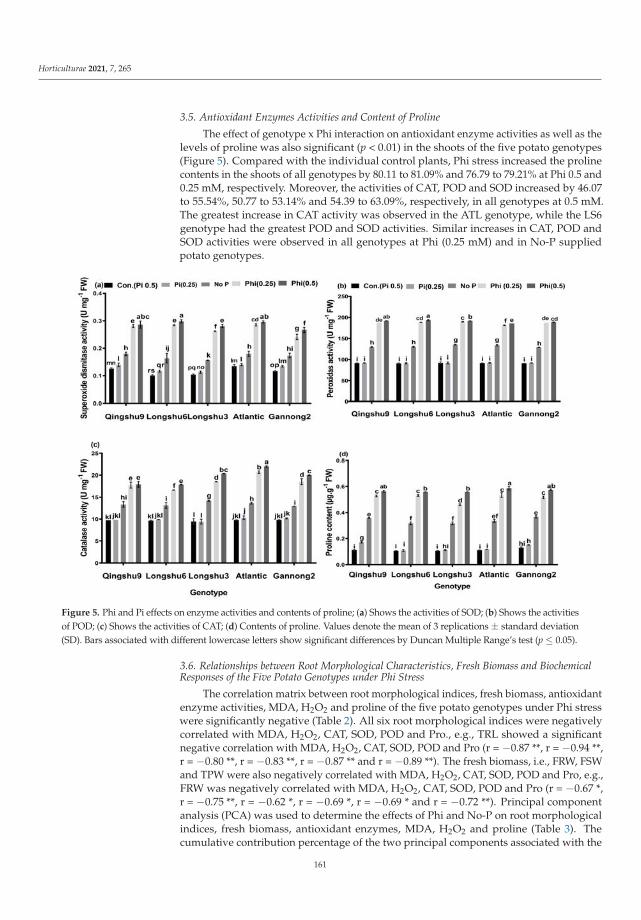
Horticulturae 2021, 7, 265
3.5. Antioxidant Enzymes Activities and Content of Proline
The effect of genotype x Phi interaction on antioxidant enzyme activities as well as thelevels of proline was also significant (p < 0.01) in the shoots of the five potato genotypes(Figure 5). Compared with the individual control plants, Phi stress increased the prolinecontents in the shoots of all genotypes by 80.11 to 81.09% and 76.79 to 79.21% at Phi 0.5 and0.25 mM, respectively. Moreover, the activities of CAT, POD and SOD increased by 46.07to 55.54%, 50.77 to 53.14% and 54.39 to 63.09%, respectively, in all genotypes at 0.5 mM.The greatest increase in CAT activity was observed in the ATL genotype, while the LS6genotype had the greatest POD and SOD activities. Similar increases in CAT, POD andSOD activities were observed in all genotypes at Phi (0.25 mM) and in No-P suppliedpotato genotypes.
Figure 5. Phi and Pi effects on enzyme activities and contents of proline; (a) Shows the activities of SOD; (b) Shows the activitiesof POD; (c) Shows the activities of CAT; (d) Contents of proline. Values denote the mean of 3 replications ± standard deviation(SD). Bars associated with different lowercase letters show significant differences by Duncan Multiple Range’s test (p ≤ 0.05).
3.6. Relationships between Root Morphological Characteristics, Fresh Biomass and BiochemicalResponses of the Five Potato Genotypes under Phi Stress
The correlation matrix between root morphological indices, fresh biomass, antioxidantenzyme activities, MDA, H2O2 and proline of the five potato genotypes under Phi stresswere significantly negative (Table 2). All six root morphological indices were negativelycorrelated with MDA, H2O2, CAT, SOD, POD and Pro., e.g., TRL showed a significantnegative correlation with MDA, H2O2, CAT, SOD, POD and Pro (r = −0.87 **, r = −0.94 **,r = −0.80 **, r = −0.83 **, r = −0.87 ** and r = −0.89 **). The fresh biomass, i.e., FRW, FSWand TPW were also negatively correlated with MDA, H2O2, CAT, SOD, POD and Pro, e.g.,FRW was negatively correlated with MDA, H2O2, CAT, SOD, POD and Pro (r = −0.67 *,r = −0.75 **, r = −0.62 *, r = −0.69 *, r = −0.69 * and r = −0.72 **). Principal componentanalysis (PCA) was used to determine the effects of Phi and No-P on root morphologicalindices, fresh biomass, antioxidant enzymes, MDA, H2O2 and proline (Table 3). Thecumulative contribution percentage of the two principal components associated with the
161

Horticulturae 2021, 7, 265
response is 90.16%, the eigenvalue of PC1 is 8.818 and the contribution percentage is 62.98%.The eigenvectors include TRL, FRW, RPA, RSA, FRSR, NRF, RV and NRT. The eigenvalue ofPC2 is 3.971, which corresponds to 27.18%, where the higher charges are CAT, SOD, MDA,POD and Pro show significant separations between the treatments. Genotype LS3 had thehighest score followed by ATL, QS9, LS6 and GN2 at No-P, along PC1. On the other hand,ATL recorded the highest score followed by LS3, while GN2 had the lowest score at Phi(0.25 and 0.5 mM), along PC2. The treatments No-P and Phi (0.25 and 0.5) were far from theorigin, implying that Phi and No-P strongly affected the root morphological characteristicsand fresh biomass of potato genotypes (Figure 6). The comprehensive evaluation accordingto the principal component analysis of Phi tolerance was calculated using Formula (1) tocalculate different products based on the two independent comprehensive indicators toobtain the membership function value μ(Xi) of each comprehensive index. Table 4 showsthat, using the higher concentration of Phi (0.5 mM) treatment, in the same comprehensiveindex CI(1), Atlantic μ(X1) is the largest, with 0.937, indicating that Atlantic has the highestPhi tolerance on the CI(1) comprehensive index. According to the contribution rate ofeach comprehensive index, the weights of the two comprehensive indicators in termsof Phi tolerance were calculated using Formula (2) as follows: 0.699, 0.301. In addition,Formula (3) was used to calculate the Phi tolerance value according to the D value, and thePhi tolerance among the five genotypes was ranked as: Atlantic > Longshu3 > Qingshu9 >Longshu6 > Ganannong 2, respectively.
Table 2. Correlation matrix describing the relationship between root morphological characteristics, fresh biomass andactivities of antioxidant enzymes, MDA, H2O2 and proline in potato plants under Phi stress at 20 days after treatments.
Index TRL RPA RSA RV NRT NRF FRW FSW TPW
MDA −0.87 ** −0.77 ** −0.81 ** −0.74 ** −0.78 ** −0.78 ** −0.67 * −0.75 ** −0.84 **H2O2 −0.94 ** −0.90 ** −0.92 ** −0.86 ** −0.90 ** −0.91 ** −0.75 ** −0.79 ** −0.92 **CAT −0.80 ** −0.71 ** −0.74 ** −0.68 ** −0.70 ** −0.70 ** −0.62 * −0.74 ** −0.81 **SOD −0.83 ** −0.71 ** −0.75 ** −0.71 ** −0.71 ** −0.73 ** −0.69 * −0.72 ** −0.78 **POD −0.87 ** −0.77 ** −0.82 ** −0.75 ** −0.77 ** −0.80 ** −0.69 * −0.76 ** −0.85 **Pro −0.89 ** −0.80 ** −0.84 ** −0.77 ** −0.80 ** −0.82 ** −0.72 ** −0.81 ** −0.89 **
MDA = Malonaldehyde; H2O2 = Hydrogen peroxide; CAT = Catalase; SOD = Superoxide dismutase; POD = Peroxidase; Pro = Proline;TRL = Total root length; RPA = Root projected area; RSA = Root surface area; RV = root volume; NRT = Number of root tips;NRF = Number of root forks; FRW = Fresh root weight; FSW = Fresh shoot weight and TPW = Total plant weight. * = significantdifference at 5% probability level; ** = significant difference at 1% probability level.
Table 3. Principal Component, loadings related to Phi treatments variable and explained variance forfinal sampling.
Principal Component PC 1 PC 2
Total root length 0.323 0.098Root projected area 0.284 0.234Root surface area 0.290 0.235Root volume 0.260 0.224Number of root tips 0.259 0.266Number of root forks 0.270 0.279Fresh root weight 0.298 0.044Fresh root/shoot ratio 0.295 0.095Malonaldehyde −0.232 0.353Hydrogen peroxide −0.319 0.044Catalase −0.162 0.409Superoxide dismutase −0.229 0.374Peroxidases −0.238 0.348Proline −0.245 0.339Eigenvalue 8.818 3.805Contribution rate % 62.98 27.18Cumulative contribution rate % 62.98 90.16
162
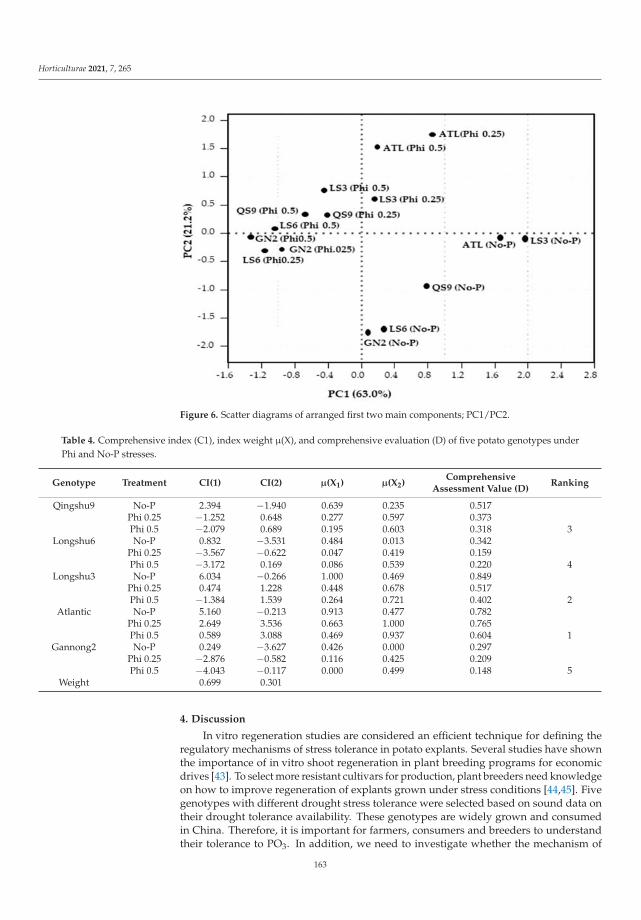
Horticulturae 2021, 7, 265
Figure 6. Scatter diagrams of arranged first two main components; PC1/PC2.
Table 4. Comprehensive index (C1), index weight μ(X), and comprehensive evaluation (D) of five potato genotypes underPhi and No-P stresses.
Genotype Treatment CI(1) CI(2) μ(X1) μ(X2)Comprehensive
Assessment Value (D)Ranking
Qingshu9 No-P 2.394 −1.940 0.639 0.235 0.517Phi 0.25 −1.252 0.648 0.277 0.597 0.373Phi 0.5 −2.079 0.689 0.195 0.603 0.318 3
Longshu6 No-P 0.832 −3.531 0.484 0.013 0.342Phi 0.25 −3.567 −0.622 0.047 0.419 0.159Phi 0.5 −3.172 0.169 0.086 0.539 0.220 4
Longshu3 No-P 6.034 −0.266 1.000 0.469 0.849Phi 0.25 0.474 1.228 0.448 0.678 0.517Phi 0.5 −1.384 1.539 0.264 0.721 0.402 2
Atlantic No-P 5.160 −0.213 0.913 0.477 0.782Phi 0.25 2.649 3.536 0.663 1.000 0.765Phi 0.5 0.589 3.088 0.469 0.937 0.604 1
Gannong2 No-P 0.249 −3.627 0.426 0.000 0.297Phi 0.25 −2.876 −0.582 0.116 0.425 0.209Phi 0.5 −4.043 −0.117 0.000 0.499 0.148 5
Weight 0.699 0.301
4. Discussion
In vitro regeneration studies are considered an efficient technique for defining theregulatory mechanisms of stress tolerance in potato explants. Several studies have shownthe importance of in vitro shoot regeneration in plant breeding programs for economicdrives [43]. To select more resistant cultivars for production, plant breeders need knowledgeon how to improve regeneration of explants grown under stress conditions [44,45]. Fivegenotypes with different drought stress tolerance were selected based on sound data ontheir drought tolerance availability. These genotypes are widely grown and consumedin China. Therefore, it is important for farmers, consumers and breeders to understandtheir tolerance to PO3. In addition, we need to investigate whether the mechanism of
163
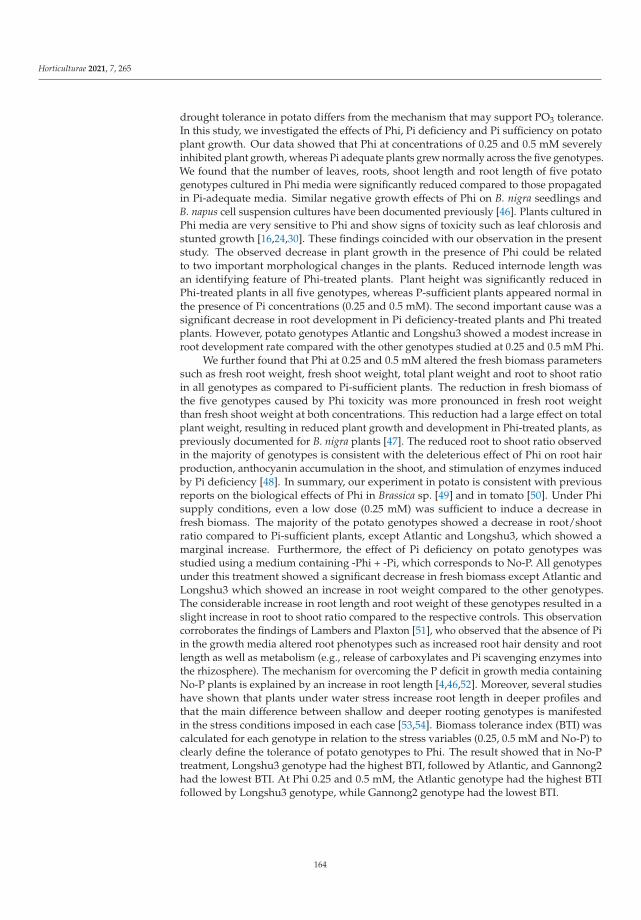
Horticulturae 2021, 7, 265
drought tolerance in potato differs from the mechanism that may support PO3 tolerance.In this study, we investigated the effects of Phi, Pi deficiency and Pi sufficiency on potatoplant growth. Our data showed that Phi at concentrations of 0.25 and 0.5 mM severelyinhibited plant growth, whereas Pi adequate plants grew normally across the five genotypes.We found that the number of leaves, roots, shoot length and root length of five potatogenotypes cultured in Phi media were significantly reduced compared to those propagatedin Pi-adequate media. Similar negative growth effects of Phi on B. nigra seedlings andB. napus cell suspension cultures have been documented previously [46]. Plants cultured inPhi media are very sensitive to Phi and show signs of toxicity such as leaf chlorosis andstunted growth [16,24,30]. These findings coincided with our observation in the presentstudy. The observed decrease in plant growth in the presence of Phi could be relatedto two important morphological changes in the plants. Reduced internode length wasan identifying feature of Phi-treated plants. Plant height was significantly reduced inPhi-treated plants in all five genotypes, whereas P-sufficient plants appeared normal inthe presence of Pi concentrations (0.25 and 0.5 mM). The second important cause was asignificant decrease in root development in Pi deficiency-treated plants and Phi treatedplants. However, potato genotypes Atlantic and Longshu3 showed a modest increase inroot development rate compared with the other genotypes studied at 0.25 and 0.5 mM Phi.
We further found that Phi at 0.25 and 0.5 mM altered the fresh biomass parameterssuch as fresh root weight, fresh shoot weight, total plant weight and root to shoot ratioin all genotypes as compared to Pi-sufficient plants. The reduction in fresh biomass ofthe five genotypes caused by Phi toxicity was more pronounced in fresh root weightthan fresh shoot weight at both concentrations. This reduction had a large effect on totalplant weight, resulting in reduced plant growth and development in Phi-treated plants, aspreviously documented for B. nigra plants [47]. The reduced root to shoot ratio observedin the majority of genotypes is consistent with the deleterious effect of Phi on root hairproduction, anthocyanin accumulation in the shoot, and stimulation of enzymes inducedby Pi deficiency [48]. In summary, our experiment in potato is consistent with previousreports on the biological effects of Phi in Brassica sp. [49] and in tomato [50]. Under Phisupply conditions, even a low dose (0.25 mM) was sufficient to induce a decrease infresh biomass. The majority of the potato genotypes showed a decrease in root/shootratio compared to Pi-sufficient plants, except Atlantic and Longshu3, which showed amarginal increase. Furthermore, the effect of Pi deficiency on potato genotypes wasstudied using a medium containing -Phi + -Pi, which corresponds to No-P. All genotypesunder this treatment showed a significant decrease in fresh biomass except Atlantic andLongshu3 which showed an increase in root weight compared to the other genotypes.The considerable increase in root length and root weight of these genotypes resulted in aslight increase in root to shoot ratio compared to the respective controls. This observationcorroborates the findings of Lambers and Plaxton [51], who observed that the absence of Piin the growth media altered root phenotypes such as increased root hair density and rootlength as well as metabolism (e.g., release of carboxylates and Pi scavenging enzymes intothe rhizosphere). The mechanism for overcoming the P deficit in growth media containingNo-P plants is explained by an increase in root length [4,46,52]. Moreover, several studieshave shown that plants under water stress increase root length in deeper profiles andthat the main difference between shallow and deeper rooting genotypes is manifestedin the stress conditions imposed in each case [53,54]. Biomass tolerance index (BTI) wascalculated for each genotype in relation to the stress variables (0.25, 0.5 mM and No-P) toclearly define the tolerance of potato genotypes to Phi. The result showed that in No-Ptreatment, Longshu3 genotype had the highest BTI, followed by Atlantic, and Gannong2had the lowest BTI. At Phi 0.25 and 0.5 mM, the Atlantic genotype had the highest BTIfollowed by Longshu3 genotype, while Gannong2 genotype had the lowest BTI.
164
Horticulturae 2021, 7, 265
Root growth and shoot growth are correlated with each other. According toPolania et al. [55], shoot growth supplies carbon and some hormones to the roots, whileroot growth supplies water, nutrients and hormones to the shoot. Despite the fact that noprevious study has explicitly investigated the utility of root morphological traits for plantperformance under Phi stress, the results of the current study suggest that Phi interferencereduces root morphological traits in all genotypes except the Atlantic genotype. It has beensuggested that the ability of Phi to limit Arabidopsis development is due to the competitiveinhibition of Pi uptake and the inability of plants to readily utilize Phi through oxidation toPi [46]. Phi cannot enter P metabolic pathways unless it is converted to Pi [16,56]. Moreover,the growth of plants cultivated in the Phi treatments was comparable to that of plantsgrown under the No-P supply treatment in terms of root morphological indices. Theseresults confirm the findings of Lee et al. [57] for Ulva lactuca, Schroetter et al. [58] forZea mays, Thao et al. [59] for Brassica rapa, Avila et al. [60] for Zea mays, Zambrosi et al. [61]for Citrus spp., and Hirosse et al. [62] for Ipomoea batatas. These researchers observed thatPhi anion does not replace Pi anion in P nutrition of plants. They added that the use of Phias the sole source of P resulted in a significant reduction in plant development compared totreatments with insufficient Pi fertilization. Root morphological traits such as architecture,branching, root volume, root hair length and density were found to have reflective effectson nutrient uptake from nutrient sources, which could be used to determine plant toleranceunder stress conditions. According to Dawuda et al. [38], the size of root system of lettuceplants influenced their tolerance to cadmium stress in nutrient solution. The results of thisstudy showed that the addition of Phi (0.25 and 0.5 mM) to MS media decreased the TRL,RPA, RSA, RV, NRT and NRF of all potato genotypes studied. This consequently reducedthe size of root systems of most genotypes except Atlantic. Other researchers have foundthat plant uptake of P and other nutrients depends on root surface area, root system lengthand lateral roots to capture a large volume of nutrients in the soil/growth medium [63–65].In addition, our results show that the Atlantic genotype, which had the larger root system,had root tolerance indices to Phi stress at both concentrations compared with the rest ofthe genotypes, which had the smallest root systems. The tolerance of the Atlantic genotypeto Phi stress was confirmed by the largest tolerance indices for TRL, RPA, RSA, RV, andNRF. The larger root system possessed by Atlantic probably enhanced the uptake of othertrace nutrients in the growth media, which contributed to its tolerance. The results ofthis study are in agreement with those of Wang et al. [66], who postulated that soybeangenotypes with larger root systems are more tolerant to cadmium stress. Pandey et al. [67]also reported that genotype PDM-139, a green Gram genotype, with larger root surface areaand root volume was the more tolerant genotype to low P compared to those with smallerroot surface area and root volume. Several other reports suggest that larger root surfacearea, root volume, and root hair length of plants under P-stressed growth conditions arecharacteristics of tolerant genotypes [68,69].
In addition, plant tolerance to Phi-stress was also determined by the hydrogen per-oxide (H2O2) content formed during stress exposure. Increased formation of reactiveoxygen species (ROS) such as H2O2 induces oxidative stress due to the toxicity of Phi [70].Zhang et al. [71] postulated that Vicia sativa, which had the lowest H2O2 content was moretolerant than Phaseolus aureus which had higher H2O2 content when both were exposedto cadmium stress. According to Oyarburo et al. [72], H2O2 accumulation in leaves isreduced, antioxidant enzyme activities are increased, gene expression is upregulated andaccumulation of glucanases and chitinases is induced, which correlates positively withstress tolerance of the plant. In our current study, Phi interference was observed to increasethe hydrogen peroxide content in the shoots of the five potato genotypes. Nevertheless, theAtlantic genotype had the lowest increase in H2O2 content, indicating that Atlantic is moretolerant to Phi stress than the other genotypes tested. These results indicate that potatogenotypes with larger root systems are more tolerant to Phi stress than genotypes withsmaller root systems. Antioxidant enzymes play a critical role in plant cell defense againststress-induced cell damage caused by the formation of free radicals, mainly in the form of
165
Horticulturae 2021, 7, 265
ROS. As a result, it has been suggested that increasing antioxidant enzyme activity mayimprove plant growth and yield. This result is in agreement with Ramos et al. [73], whoindicated that increased SOD and CAT activity induced by low selenium concentrationsincreased leaf yield of Lactuca sativa L. Avila et al. [4] noted that CAT activity was lowin Pi-sufficient plants but high by 71% in Phi-treated plants. Our current experimentprovided similar results: the activities of antioxidant enzymes (e.g., SOD, POD and CAT)increased in all five genotypes in the presence of Phi and No-P treated plants, but decreasedin Pi-sufficient plants. These antioxidant enzymes are involved in the detoxification ofreactive oxygen species. Recent research has shown that Phi-anion can induce molecularchanges that promote stress tolerance, such as activation of guaiacol peroxidase activity andlignin biosynthesis in maize [60], and structural and biochemical changes in periderm andcortex of potato tubers [20]. On the other hand, studies on the effects of Phi on antioxidantenzymes are still rare. All morphological variables of roots were significantly negativelycorrelated with antioxidant enzyme activities, MDA, H2O2 and Pro. Fresh biomass indicesalso showed significant negative correlation with antioxidant enzyme activity, MDA, H2O2and Pro. The negative correlations observed under Phi stress indicated that Phi had a dele-terious effect on potato root morphology and fresh biomass indices. To further confirm thetolerant potato genotype to Phi stress, a comprehensive evaluation analysis was conductedbased on principal component analysis. The results evaluated the genotypes in this order:Atlantic, Longshu3, Qingshu9, Longshu6 and Gannong2.
5. Conclusions
Roots are responsible for the uptake of water and inorganic nutrients and are theprimary organs affected by phosphite stress. Therefore, adaptation of roots to phosphitestress affects shoot response, physiological functions and plant growth. In the presentstudy, the responses of five potato genotypes to 0.25, 0.5 mM Phi and Pi, and No-P wereinvestigated. The results showed that Phi stress and No-P supply significantly reducedthe size of root and shoot systems of the five potato genotypes tested. Nevertheless, theAtlantic genotype with the largest root system showed the highest tolerance to Phi stress byexhibiting the highest tolerance index values for total root length, root projected area, rootsurface area, root volume, number of root forks, and fresh biomass tolerance. H2O2 andMDA levels increased in shoots of all genotypes, but Atlantic genotype showed the leastincrease, indicating greater tolerance to Phi stress. Major antioxidant enzymes such as CAT,POD and SOD activities and proline content increased under stress conditions. Greatertolerance parameters and lower H2O2 contents were obtained from the Atlantic potatogenotype under Phi stress, suggesting that potato genotypes with larger root systemsmay be more tolerant to Phi stress. The tolerance character of the Atlantic genotype wasconfirmed by comprehensive evaluation analysis using principal component analysis. Theobtained results may be very useful for the selection of the genetically modified potatoplants using the ptxD selection marker gene. However, the concentration and accumulationof P in shoot and root of Pi starved plants were not determined in the present study. Thedetermination of this index will contribute to a better understanding of the mechanism ofthe negative effect of Phi anion on the physiological and morphological growth of potatogenotypes. Therefore, future research should focus on the concentration and accumulationof P in shoot and root of plants grown under Phi stress and also determine the details ofthe molecular and genetic mechanisms of Phi tolerance in potato genotypes, especially ingenotypes with relatively large root systems.
Author Contributions: Conceptualization, R.D. and C.S.; methodology, R.D. and C.S.; soft-ware,T.Q. and D.X.; validation, K.A. and Z.B.; formal analysis, R.D. and C.S.; investigation, R.D. andC.S.; resources, J.B.; data curation, D.X.; writing—original draft preparation, R.D., K.A. and C.S.;writing—review and editing, R.D., K.A. and C.S.; visualization, Z.B.; supervision, J.B.; projectadministration, J.B.; funding acquisition, J.B. All authors have read and agreed to the publishedversion of the manuscript.
166
Horticulturae 2021, 7, 265
Funding: This work was supported by the National Natural Science Foundation of China (GrantNo. 32060502 and 31960442), the Special Fund for Discipline Construction of Gansu AgriculturalUniversity (GAU-XKJS-2018-085, GAU-XKJS -2018-084), the special Fund for Talents of Gansuagricultural University (Grant No. 2017RCZX-44) and the Gansu Provincial Department of EducationFund (2019B-073).
Data Availability Statement: Not applicable.
Conflicts of Interest: The authors declare no conflict of interest.
References
1. Kalayu, G. Phosphate solubilizing microorganisms: Promising approach as biofertilizers. Int. J. Agron. 2019, 2019, 1–7. [CrossRef]2. Achary, V.M.M.; Ram, B.; Manna, M.; Datta, D.; Bhatt, A.; Reddy, M.K.; Agrawal, P.K. Phosphite: A novel P fertilizer for weed
management and pathogen control. Plant Biotech. J. 2017, 15, 1493–1508. [CrossRef] [PubMed]3. Manna, M.; Achary, V.M.M.; Islam, T.; Agrawal, P.K.; Reddy, M.K. The development of a phosphite-mediated fertilization and
weed control system for rice. Sci. Rep. 2016, 6, 24941. [CrossRef] [PubMed]4. Ávila, F.W.; Faquin, V.; da Silva Lobato, A.K.; Ávila, P.A.; Marques, D.J.; Silva Guedes, E.M.; Tan, D.K.Y. Effect of phosphite
supply in nutrient solution on yield, phosphorus nutrition and enzymatic behavior in common bean (‘Phaseolus vulgaris’ L.)Plants. Aust. J. Crop Sci. 2013, 7, 713.
5. Heuer, S.; Gaxiola, R.; Schilling, R.; Herrera-Estrella, L.; López-Arredondo, D.; Wissuwa, M.; Delhaize, E.; Rouached, H. Improvingphosphorus use efficiency: A complex trait with emerging opportunities. Plant J. 2017, 90, 868–885. [CrossRef] [PubMed]
6. Yang, L.; Yang, Z.; Zhong, X.; Xu, C.; Lin, Y.; Fan, Y.; Wang, M.; Chen, G.; Yang, Y. Decreases in soil P availability are associatedwith soil organic P declines following forest conversion in subtropical China. CATENA 2021, 205, 105459. [CrossRef]
7. Brödlin, D.; Kaiser, K.; Kessler, A.; Hagedorn, F. Drying and rewetting foster phosphorus depletion of forest soils. Soil Biol.Biochem. 2019, 128, 22–34. [CrossRef]
8. Gianessi, L.P. The increasing importance of herbicides in worldwide crop production. Pest Manag. Sci. 2013, 69, 1099–1105.[CrossRef] [PubMed]
9. Parry, M.A.; Hawkesford, M.J. Food security: Increasing yield and improving resource use efficiency. Proc. Nutr. Soc. 2010, 69,592–600. [CrossRef]
10. Haque, S.E. How Effective Are Existing Phosphorus Management Strategies in Mitigating Surface Water Quality Problems in theUS? Sustainability 2021, 13, 6565. [CrossRef]
11. Peng, L.; Dai, H.; Wu, Y.; Peng, Y.; Lu, X. A comprehensive review of the available media and approaches for phosphorus recoveryfrom wastewater. Water Air Soil Pollut. 2018, 229, 1–28. [CrossRef]
12. Powles, S.B.; Yu, Q. Evolution in action: Plants resistant to herbicides. Annu. Rev. Plant Biol. 2010, 61, 317–347. [CrossRef][PubMed]
13. Asaduzzaman, M.; Pratley, J.E.; Luckett, D.; Lemerle, D.; Wu, H. Weed management in canola (Brassica napus L): A review ofcurrent constraints and future strategies for Australia. Archives Agron. Soil Sci. 2020, 66, 427–444. [CrossRef]
14. Guo, M.; Li, B.; Xiang, Q.; Wang, R.; Liu, P.; Chen, Q. Phosphite translocation in soybean and mechanisms of Phytophthora sojaeinhibition. Pest. Biochem. Physiol. 2021, 172, 104757. [CrossRef] [PubMed]
15. García-Gaytán, V.; Hernández-Mendoza, F.; Coria-Téllez, A.V.; García-Morales, S.; Sánchez-Rodríguez, E.; Rojas-Abarca, L.;Daneshvar, H. Fertigation: Nutrition, stimulation and bioprotection of the root in high performance. Plants 2018, 7, 88. [CrossRef]
16. McDonald, A.E.; Grant, B.R.; Plaxton, W.C. Phosphite (phosphorous acid): Its relevance in the environment and agriculture andinfluence on plant phosphate starvation response. J. Plant Nutr. 2001, 24, 1505–1519. [CrossRef]
17. Solis-Palacios, R.; Hernández-Ramírez, G.; Salinas-Ruiz, J.; Hidalgo-Contreras, J.V.; Gómez-Merino, F.C. Effect and Compatibilityof Phosphite with Trichoderma sp. Isolates in the Control of the Fusarium Species Complex Causing Pokkah Boeng in Sugarcane.Agronomy 2021, 11, 1099. [CrossRef]
18. Cerqueira, A.; Alves, A.; Berenguer, H.; Correia, B.; Gómez-Cadenas, A.; Diez, J.J.; Monteiro, P.; Pinto, G. Phosphite shiftsphysiological and hormonal profile of Monterey pine and delays Fusarium circinatum progression. Plant Physiol. Biochem. 2017,114, 88–99. [CrossRef]
19. Rampersad, S.N. Pathogenomics and management of Fusarium diseases in plants. Pathogens 2020, 9, 340. [CrossRef]20. Olivieri, F.P.; Feldman, M.L.; Machinandiarena, M.F.; Lobato, M.C.; Caldiz, D.O.; Daleo, G.R.; Andreu, A.B. Phosphite applications
induce molecular modifications in potato tuber periderm and cortex that enhance resistance to pathogens. Crop Protect. 2012,32, 1–6. [CrossRef]
21. Silva, O.; Santos, H.; Dalla Pria, M.; May-De Mio, L. Potassium phosphite for control of downy mildew of soybean. Crop Protect.2011, 30, 598–604. [CrossRef]
22. Huang, Z.; Carter, N.; Lu, H.; Zhang, Z.; Wang-Pruski, G. Translocation of phosphite encourages the protection againstPhytophthora infestans in potato: The efficiency and efficacy. Pest. Biochem. Physiol. 2018, 152, 122–130. [CrossRef] [PubMed]
23. Mehta, D.; Ghahremani, M.; Pérez-Fernández, M.; Tan, M.; Schläpfer, P.; Plaxton, W.C.; Uhrig, R.G. Phosphate and phosphitehave a differential impact on the proteome and phosphoproteome of Arabidopsis suspension cell cultures. Plant J. 2021, 105,924–941. [CrossRef] [PubMed]
167
Horticulturae 2021, 7, 265
24. Thao, H.T.B.; Yamakawa, T. Phosphite (phosphorous acid): Fungicide, fertilizer or bio-stimulator? Soil Sci. Plant Nutr. 2009, 55,228–234. [CrossRef]
25. César Bachiega Zambrosi, F.; Mattos, D.J.; Syvertsen, J.P. Plant growth, leaf photosynthesis, and nutrient-use efficiency of citrusrootstocks decrease with phosphite supply. J. Plant Nutr. Soil Sci. 2011, 174, 487–495. [CrossRef]
26. Xi, Y.; Han, X.; Zhang, Z.; Joshi, J.; Borza, T.; Aqa, M.M.; Zhang, B.; Yuan, H.; Wang-Pruski, G. Exogenous phosphite applicationalleviates the adverse effects of heat stress and improves thermotolerance of potato (Solanum tuberosum L.) seedlings. Ecotoxicol.Environ. Saf. 2020, 190, 110048. [CrossRef]
27. Leong, S.J.; Lu, W.-C.; Chiou, T.-J. Phosphite-mediated suppression of anthocyanin accumulation regulated by mitochondrialATP synthesis and sugars in Arabidopsis. Plant Cell Physiol. 2018, 59, 1158–1169. [CrossRef]
28. Trejo-Téllez, L.I.; Estrada-Ortiz, E.; Gómez-Merino, F.C.; Becker, C.; Krumbein, A.; Schwarz, D. Flavonoid, nitrate and glucosino-late concentrations in Brassica species are differentially affected by photosynthetically active radiation, phosphate and phosphite.Front. Plant Sci. 2019, 10, 371. [CrossRef] [PubMed]
29. Burra, D.D. Defence Related Molecular Signalling in Potato. Acta Univ. Agric. Sueciae 2016, 7, 1652–6880.30. Gómez-Merino, F.C.; Trejo-Téllez, L.I. Biostimulant activity of phosphite in horticulture. Sci. Hort. 2015, 196, 82–90. [CrossRef]31. Han, X.; Xi, Y.; Zhang, Z.; Mohammadi, M.A.; Joshi, J.; Borza, T.; Wang-Pruski, G. Effects of phosphite as a plant biostimulant on
metabolism and stress response for better plant performance in Solanum tuberosum. Ecotoxicol. Environ. Saf. 2021, 210, 111873.[CrossRef]
32. Gómez-Merino, F.C.; Trejo-Téllez, L.I. Conventional and novel uses of phosphite in horticulture: Potentialities and challenges.Italus Hortus 2016, 23, 1–13.
33. Quandahor, P.; Lin, C.; Gou, Y.; Coulter, J.A.; Liu, C. Leaf morphological and biochemical responses of three potato(Solanum tuberosum L.) cultivars to drought stress and aphid (Myzus persicae Sulzer) infestation. Insects 2019, 10, 435. [CrossRef]
34. Jia, H.; Wang, Q.; Tao, Q.; Xue, W. Analysis and circuit implementation for the fractional-order Chen system. In Proceedings ofthe 8th CHAOS Conference Proceedings, Paris, France, 26–29 May 2015.
35. Cabello, R.; De Mendiburu, F.; Bonierbale, M.; Monneveux, P.; Roca, W.; Chujoy, E. Large-scale evaluation of potato improvedvarieties, genetic stocks and landraces for drought tolerance. Am. J. Potato Res. 2012, 89, 400–410. [CrossRef]
36. Murashige, T.; Skoog, F. A revised medium for rapid growth and bio assays with tobacco tissue cultures. Physiol. Plant. 1962, 15,473–497. [CrossRef]
37. Wilkins, D. The measurement of tolerance to edaphic factors by means of root growth. New Phytol. 1978, 80, 623–633. [CrossRef]38. Dawuda, M.M.; Liao, W.; Hu, L.; Yu, J.; Xie, J.; Calderón-Urrea, A.; Jin, X.; Wu, Y. Root tolerance and biochemical response of
Chinese lettuce (Lactuca sativa L.) genotypes to cadmium stress. PeerJ 2019, 7, e7530. [CrossRef]39. Junglee, S.; Urban, L.; Sallanon, H.; Lopez-Lauri, F. Optimized assay for hydrogen peroxide determination in plant tissue using
potassium iodide. Am. J. Analyt. Chem. 2014, 5, 730. [CrossRef]40. Hodges, D.M.; DeLong, J.M.; Forney, C.F.; Prange, R.K. Improving the thiobarbituric acid-reactive-substances assay for estimating
lipid peroxidation in plant tissues containing anthocyanin and other interfering compounds. Planta 1999, 207, 604–611. [CrossRef]41. Dhindsa, R.S.; Plumb-Dhindsa, P.; Thorpe, T.A. Leaf senescence: Correlated with increased levels of membrane permeability and
lipid peroxidation, and decreased levels of superoxide dismutase and catalase. J. Exp. Bot. 1981, 32, 93–101. [CrossRef]42. Bates, L.S.; Waldren, R.P.; Teare, I. Rapid determination of free proline for water-stress studies. Plant Soil 1973, 39, 205–207.
[CrossRef]43. Pocketbook, F.S. World Food and Agriculture; Food and Agriculture Organization: Rome, Italy, 2015.44. Vinocur, B.; Altman, A. Recent advances in engineering plant tolerance to abiotic stress: Achievements and limitations. Curr.
Opin. Biotech. 2005, 16, 123–132. [CrossRef]45. Zhu, J.-K. Plant salt tolerance. Trends Plant Sci. 2001, 6, 66–71. [CrossRef]46. Ticconi, C.A.; Delatorre, C.A.; Abel, S. Attenuation of phosphate starvation responses by phosphite in Arabidopsis. Plant Physiol.
2001, 127, 963–972. [CrossRef] [PubMed]47. Ram, B.; Fartyal, D.; Sheri, V.; Varakumar, P.; Borphukan, B.; James, D.; Yadav, R.; Bhatt, A.; Agrawal, P.K.; Achary, V.M.M.
Characterization of phoA, a Bacterial Alkaline Phosphatase for Phi Use Efficiency in Rice Plant. Front. Plant Sci. 2019, 10, 37.[CrossRef] [PubMed]
48. Plaxton, W.C.; Carswell, M.C. Metabolic aspects of the phosphate starvation response in plants. In Plant Responses to EnvironmentalStresses; Routledge: Oxfordshire, UK, 2018; pp. 349–372.
49. Carswell, M.C.; Grant, B.R.; Plaxton, W.C. Disruption of the phosphate-starvation response of oilseed rape suspension cells bythe fungicide phosphonate. Planta 1997, 203, 67–74. [CrossRef] [PubMed]
50. Vinas, M.; Mendez, J.C.; Jiménez, V.M. Effect of foliar applications of phosphites on growth, nutritional status and defenseresponses in tomato plants. Sci. Hort. 2020, 265, 109200. [CrossRef]
51. Lambers, H.; Plaxton, W.C. Phosphorus: Back to the roots. Annu. Plant Rev. 2015, 48, 3–22.52. Devaiah, B.N.; Karthikeyan, A.S.; Raghothama, K.G. WRKY75 transcription factor is a modulator of phosphate acquisition and
root development in Arabidopsis. Plant Physiol. 2007, 143, 1789–1801. [CrossRef]53. Correa, J.; Postma, J.A.; Watt, M.; Wojciechowski, T. Soil compaction and the architectural plasticity of root systems. J. Exp. Bot.
2019, 70, 6019–6034. [CrossRef]
168

Horticulturae 2021, 7, 265
54. Vanhees, D.J.; Loades, K.W.; Bengough, A.G.; Mooney, S.J.; Lynch, J.P. The ability of maize roots to grow through compacted soilis not dependent on the amount of roots formed. Field Crop. Res. 2021, 264, 108013. [CrossRef]
55. Polania, J.; Rao, I.M.; Cajiao, C.; Grajales, M.; Rivera, M.; Velasquez, F.; Raatz, B.; Beebe, S.E. Shoot and root traits contribute todrought resistance in recombinant inbred lines of MD 23–24× SEA 5 of common bean. Front. Plant Sci. 2017, 8, 296. [CrossRef]
56. Varadarajan, D.K.; Karthikeyan, A.S.; Matilda, P.D.; Raghothama, K.G. Phosphite, an analog of phosphate, suppresses thecoordinated expression of genes under phosphate starvation. Plant Physiol. 2002, 129, 1232–1240. [CrossRef] [PubMed]
57. Lee, T.M.; Tsai, P.F.; Shyu, Y.T.; Sheu, F. The Effects of Phosphite on Phosphate Starvation Responses of Ulva Lactuca (Ulvales,Chlorophyta) 1. J. Phycol. 2005, 41, 975–982. [CrossRef]
58. Schroetter, S.; Angeles-Wedler, D.; Kreuzig, R.; Schnug, E. Effects of phosphite on phosphorus supply and growth of corn(Zea mays). Landbauforsch. Volkenrode 2006, 56, 87.
59. Thao, H.T.B.; Yamakawa, T.; Myint, A.K.; Sarr, P.S. Effects of phosphite, a reduced form of phosphate, on the growth andphosphorus nutrition of spinach (Spinacia oleracea L.). Soil Sci. Plant Nutrit. 2008, 54, 761–768. [CrossRef]
60. Avila, F.W.; Faquin, V.; Araujo, J.L.; Marques, D.J.; Júnior, P.M.R.; da Silva Lobato, A.K.; Ramos, S.J.; Baliza, D.P. Phosphite supplyaffects phosphorus nutrition and biochemical responses in maize plants. Aust. J. Crop Sci. 2011, 5, 646–653.
61. Zambrosi, F.C.B.; Mattos, D., Jr.; Quaggio, J.A.; Cantarella, H.; Boaretto, R.M. Phosphorus uptake by young citrus trees in low-Psoil depends on rootstock varieties and nutrient management. Commun. Soil Sci. Plant Anal. 2013, 44, 2107–2117. [CrossRef]
62. Hirosse, E.H.; Creste, J.E.; Custódio, C.C.; Machado-Neto, N.B. In vitro growth of sweet potato fed with potassium phosphite.Acta Scient. Agron. 2012, 34, 85–91. [CrossRef]
63. Balemi, T.; Negisho, K. Management of soil phosphorus and plant adaptation mechanisms to phosphorus stress for sustainablecrop production: A review. J. Soil Sci. Plant Nutrit. 2012, 12, 547–562. [CrossRef]
64. Richardson, A.E.; Barea, J.-M.; McNeill, A.M.; Prigent-Combaret, C. Acquisition of phosphorus and nitrogen in the rhizosphereand plant growth promotion by microorganisms. Plant Soil 2009, 321, 305–339. [CrossRef]
65. Lambers, H.; Clode, P.L.; Hawkins, H.J.; Laliberté, E.; Oliveira, R.S.; Reddell, P.; Shane, M.W.; Stitt, M.; Weston, P. Metabolicadaptations of the non-mycotrophic Proteaceae to soils with low phosphorus availability. Annu. Plant Rev. Phosphorus Metab.Plants 2015, 48, 289.
66. Wang, Y.; Yang, R.; Zheng, J.; Shen, Z.; Xu, X. Exogenous foliar application of fulvic acid alleviate cadmium toxicity in lettuce(Lactuca sativa L.). Ecotoxico. Environ. Saf. 2019, 167, 10–19. [CrossRef] [PubMed]
67. Pandey, R.; Meena, S.K.; Krishnapriya, V.; Ahmad, A.; Kishora, N. Root carboxylate exudation capacity under phosphorus stressdoes not improve grain yield in green gram. Plant Cell Rep. 2014, 33, 919–928. [CrossRef]
68. Gahoonia, T.S.; Nielsen, N.E. Root traits as tools for creating phosphorus efficient crop varieties. Plant Soil 2004, 260, 47–57.[CrossRef]
69. Wu, P.; Ma, X.; Tigabu, M.; Wang, C.; Liu, A.; Oden, P.C. Root morphological plasticity and biomass production of two Chinese firclones with high phosphorus efficiency under low phosphorus stress. Can. J. For. Res. 2011, 41, 228–234. [CrossRef]
70. Tripathi, D.K.; Singh, S.; Singh, V.P.; Prasad, S.M.; Dubey, N.K.; Chauhan, D.K. Silicon nanoparticles more effectively alleviatedUV-B stress than silicon in wheat (Triticum aestivum) seedlings. Plant Physiol. Biochem. 2017, 110, 70–81. [CrossRef] [PubMed]
71. Zhang, F.; Zhang, H.; Wang, G.; Xu, L.; Shen, Z. Cadmium-induced accumulation of hydrogen peroxide in the leaf apoplastof Phaseolus aureus and Vicia sativa and the roles of different antioxidant enzymes. J. Haz. Mat. 2009, 168, 76–84. [CrossRef][PubMed]
72. Oyarburo, N.S.; Machinandiarena, M.F.; Feldman, M.L.; Daleo, G.R.; Andreu, A.B.; Olivieri, F.P. Potassium phosphite increasestolerance to UV-B in potato. Plant Physiol. Biochem. 2015, 88, 1–8. [CrossRef]
73. Ramos, S.; Faquin, V.; Guilherme, L.; Castro, E.; Ávila, F.; Carvalho, G.; Bastos, C.; Oliveira, C. Selenium biofortification andantioxidant activity in lettuce plants fed with selenate and selenite. Plant Soil Environ. 2010, 56, 584–588. [CrossRef]
169


horticulturae
Article
Twenty-Years of Hop Irrigation by Flooding the Inter-Row DidNot Cause a Gradient along the Row in Soil Properties, PlantElemental Composition and Dry Matter Yield
Sandra Afonso 1,2, Margarida Arrobas 1 and Manuel Ângelo Rodrigues 1,*
Citation: Afonso, S.; Arrobas, M.;
Rodrigues, M.Â. Twenty-Years of
Hop Irrigation by Flooding the
Inter-Row Did Not Cause a Gradient
along the Row in Soil Properties,
Plant Elemental Composition and
Dry Matter Yield. Horticulturae 2021,
7, 194. https://doi.org/10.3390/
horticulturae7070194
Academic Editors: Jolanta
Jaroszuk-Sciseł, Małgorzata
Majewska and Agnieszka Hanaka
Received: 18 June 2021
Accepted: 13 July 2021
Published: 15 July 2021
Publisher’s Note: MDPI stays neutral
with regard to jurisdictional claims in
published maps and institutional affil-
iations.
Copyright: © 2021 by the authors.
Licensee MDPI, Basel, Switzerland.
This article is an open access article
distributed under the terms and
conditions of the Creative Commons
Attribution (CC BY) license (https://
creativecommons.org/licenses/by/
4.0/).
1 Centro de Investigação de Montanha, Instituto Politécnico de Bragança, Campus de Santa Apolónia,5300-253 Bragança, Portugal; [email protected] (S.A.); [email protected] (M.A.)
2 Faculdade de Ciências, Universidade do Porto, Rua do Campo Alegre, s/n, 4169-007 Porto, Portugal* Correspondence: [email protected]; Tel.: +351-273303260
Abstract: In hops (Humulus lupulus L.), irrigation by flooding the inter-row can carry away suspendedparticles and minerals, causing gradients in soil fertility. The effect of more than 20 years of floodingirrigation on soil and plants was evaluated in two hop fields by measuring soil and plant variablesin multiple points along the rows. In a second experiment 1000 kg ha−1 of lime was applied andincorporated into the soil to assess whether liming could moderate any gradient created by theirrigation. At different sampling points along the rows, significant differences were recorded in soilproperties, plant elemental composition and dry matter yield, but this was not found to exist over acontinuous gradient. The variations in cone yield were over 50% when different sampling pointswere compared. However, this difference cannot be attributed to the effect of irrigation, but ratherto an erratic spatial variation in some of the soil constituents, such as sand, silt and clay. Floodingirrigation and frequent soil tillage resulted in lower porosity and higher soil bulk density in the0.0–0.10 m soil layer in comparison to the 0.10–0.20 m layer. In turn, porosity and bulk density wererespectively positively and negatively associated with crop productivity. Thus, irrigation and soiltillage may have damaged the soil condition but did not create any gradient along the row. Theridge appeared to provide an important pool of nutrients, probably caused by mass flow due to theevaporation from it and a regular supply of irrigation water to the inter-row. Liming raised the soilpH slightly, but had a relevant effect on neither soil nor plants, perhaps because of the small amountsof lime applied.
Keywords: Humulus lupulus L.; soil porosity; soil bulk density; liming; hop ridges
1. Introduction
Hop plants (Humulus lupulus L.) require an adequate supply of water during thegrowing season to sustain their huge canopy [1]. In most of the hop producing regionsof the world, the crop needs to be irrigated, particularly in lower latitudes of reducedprecipitation in summer. Although hop fields have started to be drip irrigated all overthe world, there is a long tradition of surface watering of this crop, by flooding the spacebetween rows [1,2]. In this kind of surface or furrow irrigation system, water is applied atthe top end of each furrow (in hops to the inter-row space) and flows down the field underthe influence of gravity [3]. This is still the most commonly used irrigation method for hopsin northern Portugal [4]. The water use efficiency with this irrigation technique is highlydependent on the field gradient and water infiltration rate, which can vary considerably,inducing spatial and temporal variability in the main soil properties [5]. In addition, floodirrigation can affect the spatial distribution of soil physicochemical properties which mayexacerbate the spatial variability in crop growth and yield [6].
Flood irrigation can have a major impact on soil properties by varying salinity, re-dox potential, compaction and/or porosity [7–10]. Furthermore, hop fields which are
Horticulturae 2021, 7, 194. https://doi.org/10.3390/horticulturae7070194 https://www.mdpi.com/journal/horticulturae
171
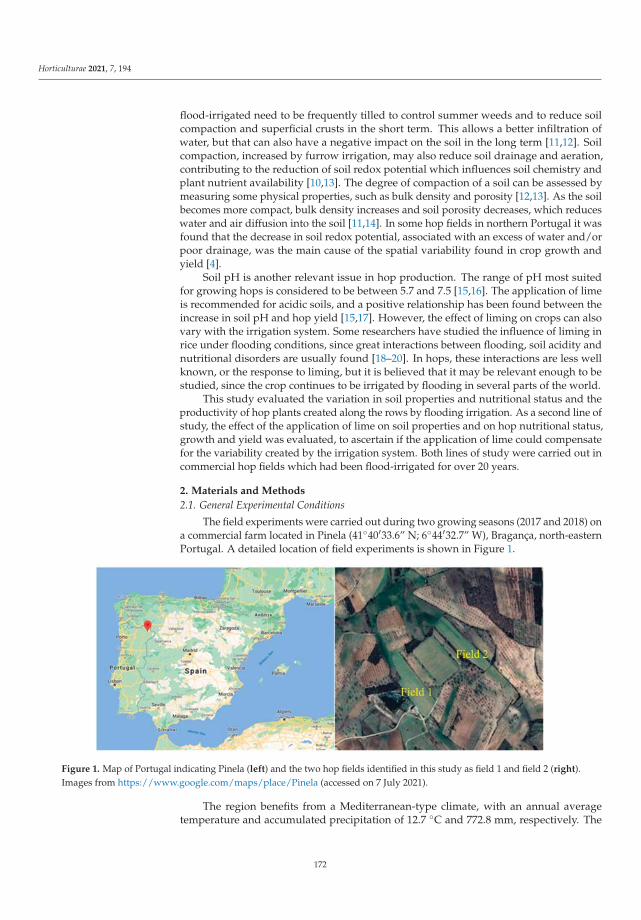
Horticulturae 2021, 7, 194
flood-irrigated need to be frequently tilled to control summer weeds and to reduce soilcompaction and superficial crusts in the short term. This allows a better infiltration ofwater, but that can also have a negative impact on the soil in the long term [11,12]. Soilcompaction, increased by furrow irrigation, may also reduce soil drainage and aeration,contributing to the reduction of soil redox potential which influences soil chemistry andplant nutrient availability [10,13]. The degree of compaction of a soil can be assessed bymeasuring some physical properties, such as bulk density and porosity [12,13]. As the soilbecomes more compact, bulk density increases and soil porosity decreases, which reduceswater and air diffusion into the soil [11,14]. In some hop fields in northern Portugal it wasfound that the decrease in soil redox potential, associated with an excess of water and/orpoor drainage, was the main cause of the spatial variability found in crop growth andyield [4].
Soil pH is another relevant issue in hop production. The range of pH most suitedfor growing hops is considered to be between 5.7 and 7.5 [15,16]. The application of limeis recommended for acidic soils, and a positive relationship has been found between theincrease in soil pH and hop yield [15,17]. However, the effect of liming on crops can alsovary with the irrigation system. Some researchers have studied the influence of liming inrice under flooding conditions, since great interactions between flooding, soil acidity andnutritional disorders are usually found [18–20]. In hops, these interactions are less wellknown, or the response to liming, but it is believed that it may be relevant enough to bestudied, since the crop continues to be irrigated by flooding in several parts of the world.
This study evaluated the variation in soil properties and nutritional status and theproductivity of hop plants created along the rows by flooding irrigation. As a second line ofstudy, the effect of the application of lime on soil properties and on hop nutritional status,growth and yield was evaluated, to ascertain if the application of lime could compensatefor the variability created by the irrigation system. Both lines of study were carried out incommercial hop fields which had been flood-irrigated for over 20 years.
2. Materials and Methods
2.1. General Experimental Conditions
The field experiments were carried out during two growing seasons (2017 and 2018) ona commercial farm located in Pinela (41◦40′33.6” N; 6◦44′32.7” W), Bragança, north-easternPortugal. A detailed location of field experiments is shown in Figure 1.
Figure 1. Map of Portugal indicating Pinela (left) and the two hop fields identified in this study as field 1 and field 2 (right).Images from https://www.google.com/maps/place/Pinela (accessed on 7 July 2021).
The region benefits from a Mediterranean-type climate, with an annual averagetemperature and accumulated precipitation of 12.7 ◦C and 772.8 mm, respectively. The
172
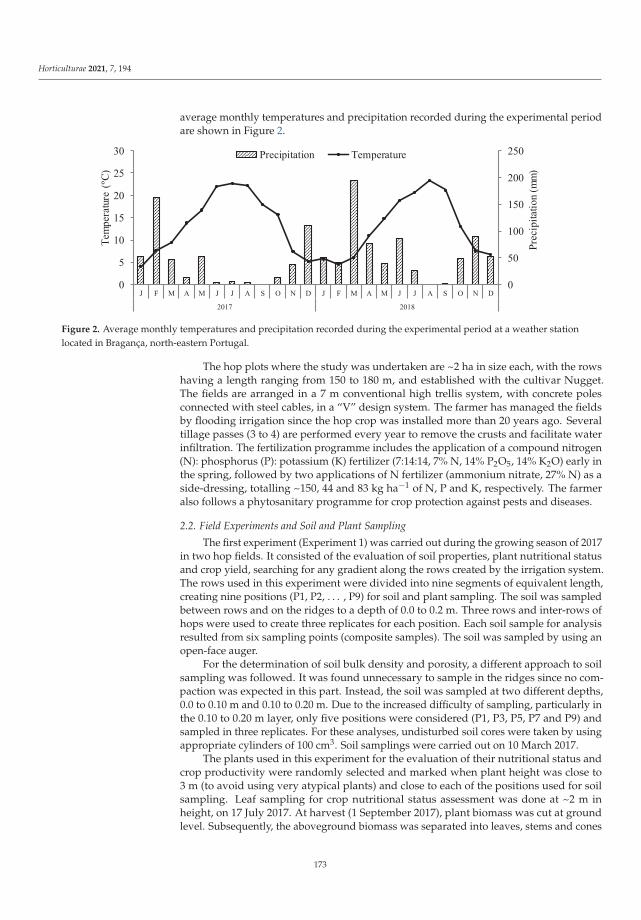
Horticulturae 2021, 7, 194
average monthly temperatures and precipitation recorded during the experimental periodare shown in Figure 2.
Figure 2. Average monthly temperatures and precipitation recorded during the experimental period at a weather stationlocated in Bragança, north-eastern Portugal.
The hop plots where the study was undertaken are ~2 ha in size each, with the rowshaving a length ranging from 150 to 180 m, and established with the cultivar Nugget.The fields are arranged in a 7 m conventional high trellis system, with concrete polesconnected with steel cables, in a “V” design system. The farmer has managed the fieldsby flooding irrigation since the hop crop was installed more than 20 years ago. Severaltillage passes (3 to 4) are performed every year to remove the crusts and facilitate waterinfiltration. The fertilization programme includes the application of a compound nitrogen(N): phosphorus (P): potassium (K) fertilizer (7:14:14, 7% N, 14% P2O5, 14% K2O) early inthe spring, followed by two applications of N fertilizer (ammonium nitrate, 27% N) as aside-dressing, totalling ~150, 44 and 83 kg ha−1 of N, P and K, respectively. The farmeralso follows a phytosanitary programme for crop protection against pests and diseases.
2.2. Field Experiments and Soil and Plant Sampling
The first experiment (Experiment 1) was carried out during the growing season of 2017in two hop fields. It consisted of the evaluation of soil properties, plant nutritional statusand crop yield, searching for any gradient along the rows created by the irrigation system.The rows used in this experiment were divided into nine segments of equivalent length,creating nine positions (P1, P2, . . . , P9) for soil and plant sampling. The soil was sampledbetween rows and on the ridges to a depth of 0.0 to 0.2 m. Three rows and inter-rows ofhops were used to create three replicates for each position. Each soil sample for analysisresulted from six sampling points (composite samples). The soil was sampled by using anopen-face auger.
For the determination of soil bulk density and porosity, a different approach to soilsampling was followed. It was found unnecessary to sample in the ridges since no com-paction was expected in this part. Instead, the soil was sampled at two different depths,0.0 to 0.10 m and 0.10 to 0.20 m. Due to the increased difficulty of sampling, particularly inthe 0.10 to 0.20 m layer, only five positions were considered (P1, P3, P5, P7 and P9) andsampled in three replicates. For these analyses, undisturbed soil cores were taken by usingappropriate cylinders of 100 cm3. Soil samplings were carried out on 10 March 2017.
The plants used in this experiment for the evaluation of their nutritional status andcrop productivity were randomly selected and marked when plant height was close to3 m (to avoid using very atypical plants) and close to each of the positions used for soilsampling. Leaf sampling for crop nutritional status assessment was done at ~2 m inheight, on 17 July 2017. At harvest (1 September 2017), plant biomass was cut at groundlevel. Subsequently, the aboveground biomass was separated into leaves, stems and cones
173

Horticulturae 2021, 7, 194
and weighed fresh. Subsamples of each plant part were weighed fresh again and thenoven-dried at 70 ◦C and weighed dry for determination of dry matter yield.
The second experiment (Experiment 2) consisted of the application of 1000 kg ha−1 oflime (55% CaCO3, 28% CaO and 20% MgO) in February 2017, to assess the liming effects onsoil properties and plants in comparison to the untreated control. This experiment was alsocarried out in two hop plots. The general methodology for soil and plant sampling wassimilar to that reported for Experiment 1, consisting of marking nine positions along therows. The soil was sampled on 4 January 2019, only between the rows, at 0.0–0.20 m soildepth, using an open-face auger. Leaf samples were taken at ~2 m in height, on 17 July 2017and 18 July 2018. At harvest (1 September 2017 and 31 August 2018), plant biomass wascut at ground level and treated as reported for Experiment 1.
2.3. Laboratory Analyses
The undisturbed soil samples from Experiment 1 were oven-dried at 105 ◦C andweighed. Soil bulk density was estimated from the weight of dry soil divided by thevolume of the cylinder. Soil porosity was determined as the ratio of nonsolid volume (soilparticle density—bulk density) to the total volume of soil (soil particle density) [21]. Theother soil samples from Experiments 1 and 2 were oven-dried at 40 ◦C and sieved in amesh of 2 mm. The samples were analysed for pH (H2O and KCl), electrical conductivity(soil:solution, 1:2.5), exchangeable complex (ammonium acetate, pH 7.0) and organic car-bon (C) (Walkley−Black method). Extractable P and K were determined by a combinationof ammonium lactate and acetic acid buffered at pH 3.7. Soil boron (B) was extracted byhot water and the extracts analysed by the azomethine-H method. More details of these an-alytical procedures are given in Van Reeuwijk [22]. Other micronutrients [copper (Cu), iron(Fe), zinc (Zn), and manganese (Mn)] were determined by atomic absorption spectrometryafter extraction with ammonium acetate and EDTA, following the methodology reportedby Lakanen and Erviö [23].
Tissue samples (leaves, stems and cones) from both experiments were oven-dried at70 ◦C and ground. Elemental tissue analyses were performed by Kjeldahl (N), colorimetry(B and P), flame emission spectrometry (K) and atomic absorption spectrophotometry(calcium (Ca), magnesium (Mg), Cu, Fe, Zn and Mn) methods after nitric digestion of thesamples [24].
2.4. Data Analysis
Data was subjected to analysis of variance, according to the experimental designs,using SPSS program version 25. When significant differences were found between theexperimental treatments, the means were separated by the Tukey HSD (sampling position)and Student’s-t (field, sampling site, lime treatment) tests (α = 0.05). Linear regressionanalysis was performed to understand the effects of gradient on soil properties and plantnutritional status and productivity in Experiment 1 and the relationship between soil pHand plant variables in Experiment 2. The relation between the variables was obtainedthrough correlation analysis with the Pearson coefficient, when the assumption of normalityand linearity was accomplished; when this was not the case, the Spearman coefficientwas used.
3. Results
3.1. Gradients in Soil and Plants along the Rows3.1.1. Soil Properties
The silt and sand contents varied significantly between the sampling positions (Table 1).The two fields also differed significantly in clay and sand content. The soil bulk densityand soil porosity varied significantly between the sampling positions and fields but inthe opposite way. The interaction between sampling position and field was significant forsoil porosity, which means that the effect of the irrigation on this variable depended onthe field.
174

Horticulturae 2021, 7, 194
Table 1. Soil separates and soil bulk density and porosity from samples collected at 0.0–0.20 m depth, in March 2017, asa function of sampling position (1, . . . , 9), and field. Means followed by the same letter are not significantly different byTukey HSD (sampling position) or Student’s t (field) tests (α = 0.05).
Clay Silt Sand Bulk Density Porosity(%) (kg dm−3) (%)
Sampling position (P)Lowest value 15.6 a 34.5 a 59.7 a 1.26 a 52.1 aHighest value 11.8 a 28.5 b 49.9 b 1.18 b 48.0 b
Field (F)Field 1 16.0 a 33.2 a 50.8 b 1.25 a 49.1 bField 2 11.5 b 32.1 a 56.4 a 1.21 b 50.8 a
Prob (P) 0.2770 0.0386 0.0307 0.0143 0.0020Prob (F) 0.0005 0.3741 0.0072 0.0260 0.0259
Prob (P × F) 0.8998 0.0432 0.1221 0.0874 0.0256
The soil bulk density was higher in the soil surface (0.0–0.1 m) when compared to thedeeper (0.1–0.2 m) layer (Figure 3). The soil bulk density did not vary significantly alongthe rows for both soil depths. The soil porosity, in turn, was lower in the surface layer, andthe gradient found along the rows was not significant for any of the soil layers. The soilbulk density and porosity varied significantly between the two fields, but the gradientsfound along the rows were not statistically significant.
y (D1) = 0.0022x + 1.2723R² = 0.0058; P = 0.6890
y (D2) = 0.0091x + 1.2198R² = 0.1080; P = 0.0763
0.00.20.40.60.81.01.21.41.61.8
Bulk
den
sity
(kg
dm3 )
Depth
y (F1) = 0.0056x + 1.277R² = 0.0229; P = 0.4252
y (F2) = 0.0013x + 1.2151R² = 0.002; P = 0.8166
0.00.20.40.60.81.01.21.41.61.8
0 1 2 3 4 5 6 7 8 9
Field
y (D1) = 0.1136x + 48.655R² = 0.0066; P = 0.6692
y (D2) = 0.294x + 50.305R² = 0.058; P = 0.2000
01020304050607080
Poro
sity
(%)
Sampling position
Depth
y (F1) = 0.1274x + 48.462R² = 0.0056; P = 0.6947
y (F2)= 0.053x + 50.497R² = 0.0023; P = 0.8006
01020304050607080
0 1 2 3 4 5 6 7 8 9Sampling position
Field
Figure 3. Soil bulk density and porosity from soil samples taken at different sampling positions along the gradient ofirrigation (1, . . . , 9), as a function of depth (D1, 0.0–0.10 m; D2, 0.10–0.20 m) and field (F1, field 1; F2, field 2).
Some other soil properties determined from the samples collected at 0.0–0.20 mdepth varied significantly between sampling sites, sampling positions and fields (Table 2).Extractable P and K, conductivity, organic C, CEC and extractable Zn and B showedsignificantly higher values in the samples collected in the ridges. However, soil pH (H2Oand KCl), base saturation and extractable Mn were significantly higher in the samplescollected in the inter-rows. Most of the soil properties varied significantly between thesampling positions, the exceptions being soil pH, conductivity and extractable K. Soilproperties also differed significantly between fields, except for soil conductivity. Significant
175
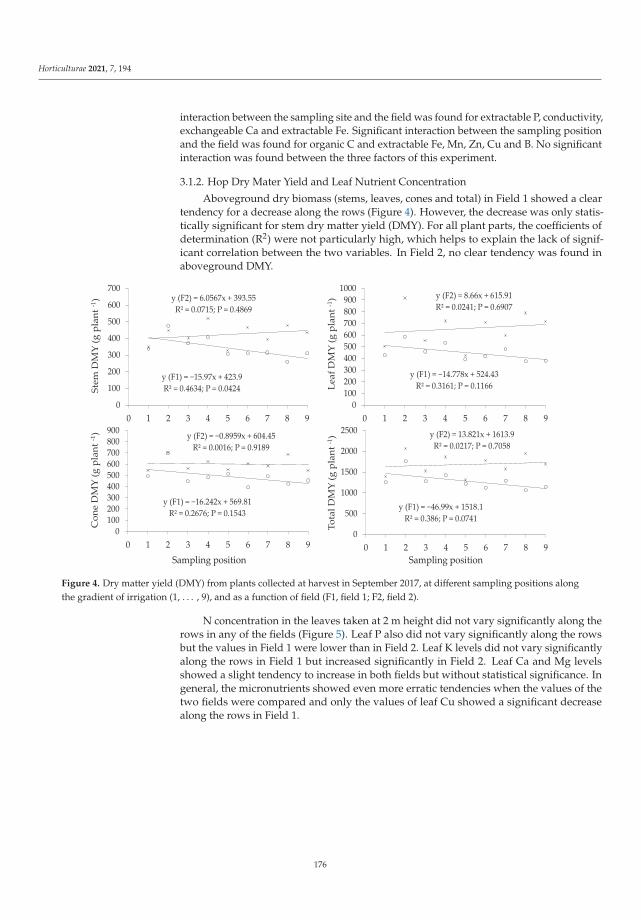
Horticulturae 2021, 7, 194
interaction between the sampling site and the field was found for extractable P, conductivity,exchangeable Ca and extractable Fe. Significant interaction between the sampling positionand the field was found for organic C and extractable Fe, Mn, Zn, Cu and B. No significantinteraction was found between the three factors of this experiment.
3.1.2. Hop Dry Mater Yield and Leaf Nutrient Concentration
Aboveground dry biomass (stems, leaves, cones and total) in Field 1 showed a cleartendency for a decrease along the rows (Figure 4). However, the decrease was only statis-tically significant for stem dry matter yield (DMY). For all plant parts, the coefficients ofdetermination (R2) were not particularly high, which helps to explain the lack of signif-icant correlation between the two variables. In Field 2, no clear tendency was found inaboveground DMY.
y (F1) = 15.97x + 423.9R² = 0.4634; P = 0.0424
y (F2) = 6.0567x + 393.55R² = 0.0715; P = 0.4869
0
100
200
300
400
500
600
700
0 1 2 3 4 5 6 7 8 9
Stem
DM
Y (g
pla
nt -1
)
y (F1) = 14.778x + 524.43R² = 0.3161; P = 0.1166
y (F2) = 8.66x + 615.91R² = 0.0241; P = 0.6907
0100200300400500600700800900
1000
0 1 2 3 4 5 6 7 8 9
Leaf
DM
Y (g
pla
nt -1
)
y (F1) = 16.242x + 569.81R² = 0.2676; P = 0.1543
y (F2) = 0.8959x + 604.45R² = 0.0016; P = 0.9189
0100200300400500600700800900
0 1 2 3 4 5 6 7 8 9
Con
e D
MY
(g p
lant
-1)
Sampling position
y (F1) = 46.99x + 1518.1R² = 0.386; P = 0.0741
y (F2) = 13.821x + 1613.9R² = 0.0217; P = 0.7058
0
500
1000
1500
2000
2500
0 1 2 3 4 5 6 7 8 9
Tota
l DM
Y (g
pla
nt -1
)
Sampling position
Figure 4. Dry matter yield (DMY) from plants collected at harvest in September 2017, at different sampling positions alongthe gradient of irrigation (1, . . . , 9), and as a function of field (F1, field 1; F2, field 2).
N concentration in the leaves taken at 2 m height did not vary significantly along therows in any of the fields (Figure 5). Leaf P also did not vary significantly along the rowsbut the values in Field 1 were lower than in Field 2. Leaf K levels did not vary significantlyalong the rows in Field 1 but increased significantly in Field 2. Leaf Ca and Mg levelsshowed a slight tendency to increase in both fields but without statistical significance. Ingeneral, the micronutrients showed even more erratic tendencies when the values of thetwo fields were compared and only the values of leaf Cu showed a significant decreasealong the rows in Field 1.
176
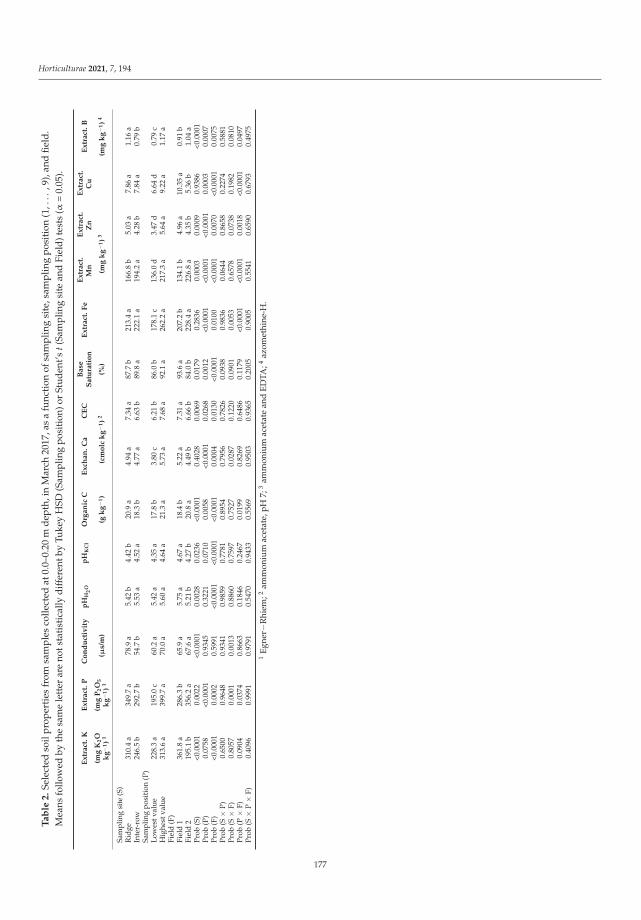
Horticulturae 2021, 7, 194
Ta
ble
2.
Sele
cted
soil
pro
per
ties
from
sam
ple
sco
llect
edat
0.0–
0.20
md
epth
,in
Mar
ch20
17,a
sa
func
tion
ofsa
mp
ling
site
,sam
plin
gp
osit
ion
(1,.
..,9
),an
dfi
eld
.M
eans
follo
wed
byth
esa
me
lett
erar
eno
tsta
tist
ical
lydi
ffer
entb
yTu
key
HSD
(Sam
plin
gpo
siti
on)o
rSt
uden
t’st(
Sam
plin
gsi
tean
dFi
eld)
test
s(α
=0.
05).
Ex
tra
ct.
KE
xtr
act
.P
Co
nd
uct
ivit
yp
HH
2O
pH
KC
lO
rga
nic
CE
xch
an
.C
aC
EC
Ba
seS
atu
rati
on
Ex
tra
ct.
Fe
Ex
tra
ct.
Mn
Ex
tra
ct.
Zn
Ex
tra
ct.
Cu
Ex
tra
ct.
B
(mg
K2O
kg−1
)1
(mg
P2O
5
kg−1
)1
(μs/
m)
(gk
g−1
)(c
mo
lck
g−1
)2
(%)
(mg
kg−1
)3
(mg
kg−1
)4
Sam
plin
gsi
te(S
)R
idge
310.
4a
349.
7a
78.9
a5.
42b
4.42
b20
.9a
4.94
a7.
34a
87.7
b21
3.4
a16
6.8
b5.
03a
7.86
a1.
16a
Inte
r-ro
w24
6.5
b29
2.7
b54
.7b
5.53
a4.
52a
18.3
b4.
77a
6.63
b89
.8a
222.
1a
194.
2a
4.28
b7.
84a
0.79
bSa
mpl
ing
posi
tion
(P)
Low
estv
alue
228.
3a
195.
0c
60.2
a5.
42a
4.35
a17
.8b
3.80
c6.
21b
86.0
b17
8.1
c13
6.0
d3.
47d
6.64
d0.
79c
Hig
hest
valu
e31
3.6
a39
9.7
a70
.0a
5.60
a4.
64a
21.3
a5.
73a
7.68
a92
.1a
262.
2a
217.
3a
5.64
a9.
22a
1.17
aFi
eld
(F)
Fiel
d1
361.
8a
286.
3b
65.9
a5.
75a
4.67
a18
.4b
5.22
a7.
31a
93.6
a20
7.2
b13
4.1
b4.
96a
10.3
5a
0.91
bFi
eld
219
5.1
b35
6.2
a67
.6a
5.21
b4.
27b
20.8
a4.
49b
6.66
b84
.0b
228.
4a
226.
8a
4.35
b5.
36b
1.04
aPr
ob(S
)<0
.000
10.
0022
<0.0
001
0.00
280.
0236
<0.0
001
0.40
280.
0069
0.01
790.
2836
0.00
030.
0009
0.93
86<0
.000
1Pr
ob(P
)0.
0758
<0.0
001
0.93
450.
3221
0.07
100.
0058
<0.0
001
0.02
680.
0012
<0.0
001
<0.0
001
<0.0
001
0.00
030.
0007
Prob
(F)
<0.0
001
0.00
020.
5991
<0.0
001
<0.0
001
<0.0
001
0.00
040.
0130
<0.0
001
0.01
00<0
.000
10.
0070
<0.0
001
0.00
75Pr
ob(S
×P)
0.65
000.
9648
0.93
410.
9859
0.77
810.
8954
0.79
560.
7826
0.09
380.
9836
0.06
440.
8658
0.22
740.
5881
Prob
(S×
F)0.
8057
0.00
010.
0013
0.88
600.
7597
0.75
270.
0287
0.12
200.
0901
0.00
530.
6578
0.07
380.
1982
0.08
10Pr
ob(P
×F)
0.09
040.
0374
0.86
630.
1846
0.24
670.
0199
0.82
690.
6486
0.11
79<0
.000
1<0
.000
10.
0018
<0.0
001
0.04
97Pr
ob(S
×P×
F)0.
4096
0.99
910.
9791
0.54
700.
9433
0.55
690.
9503
0.93
650.
2005
0.90
050.
5541
0.65
900.
6793
0.49
75
1Eg
ner−
Rhi
em;2
amm
oniu
mac
etat
e,pH
7;3
amm
oniu
mac
etat
ean
dED
TA;4
azom
ethi
ne-H
.
177
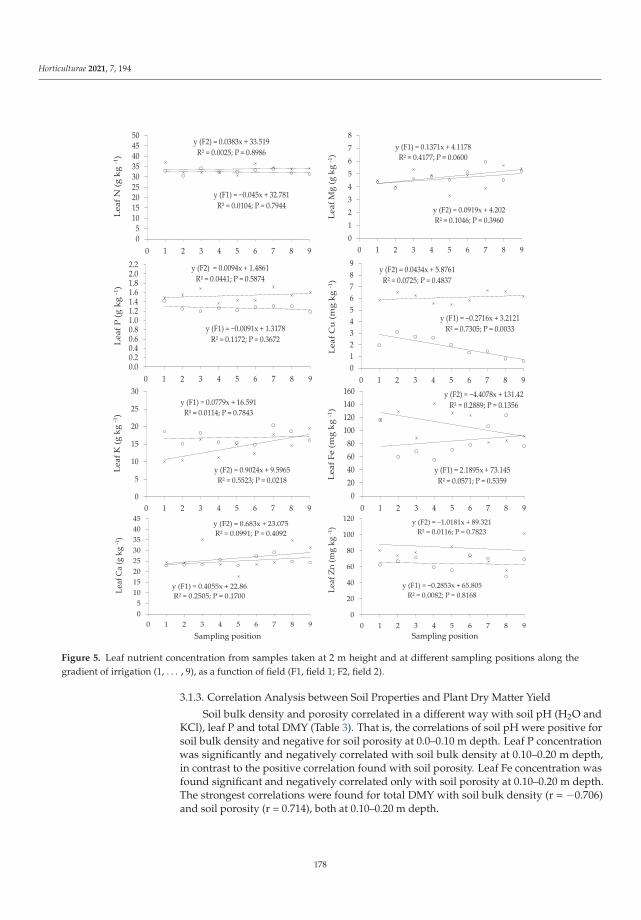
Horticulturae 2021, 7, 194
y (F1) = 0.045x + 32.781R² = 0.0104; P = 0.7944
y (F2) = 0.0383x + 33.519R² = 0.0025; P = 0.8986
05
101520253035404550
0 1 2 3 4 5 6 7 8 9
Lea
f N (g
kg
-1)
y (F1) = 0.1371x + 4.1178R² = 0.4177; P = 0.0600
y (F2) = 0.0919x + 4.202R² = 0.1046; P = 0.3960
012345678
0 1 2 3 4 5 6 7 8 9
Leaf
Mg
(g k
g -1
)y (F1) = 0.0091x + 1.3178
R² = 0.1172; P = 0.3672
y (F2) = 0.0094x + 1.4861R² = 0.0441; P = 0.5874
0.00.20.40.60.81.01.21.41.61.82.02.2
0 1 2 3 4 5 6 7 8 9
Lea
f P (g
kg
-1)
y (F1) = 0.2716x + 3.2121R² = 0.7305; P = 0.0033
y (F2) = 0.0434x + 5.8761R² = 0.0725; P = 0.4837
0123456789
0 1 2 3 4 5 6 7 8 9
Lea
f Cu
(mg
kg -1
)
y (F1) = 0.0779x + 16.591R² = 0.0114; P = 0.7843
y (F2) = 0.9024x + 9.5965R² = 0.5523; P = 0.0218
0
5
10
15
20
25
30
0 1 2 3 4 5 6 7 8 9
Leaf
K (g
kg
-1)
y (F1) = 2.1895x + 73.145R² = 0.0571; P = 0.5359
y (F2) = 4.4078x + 131.42R² = 0.2889; P = 0.1356
020406080
100120140160
0 1 2 3 4 5 6 7 8 9
Lea
f Fe
(mg
kg -1
)
y (F1) = 0.4055x + 22.86R² = 0.2505; P = 0.1700
y (F2) = 0.683x + 23.075R² = 0.0991; P = 0.4092
05
1015202530354045
0 1 2 3 4 5 6 7 8 9
Leaf
Ca
(g k
g -1
)
Sampling position
y (F1) = 0.2853x + 65.805R² = 0.0082; P = 0.8168
y (F2) = 1.0181x + 89.321R² = 0.0116; P = 0.7823
0
20
40
60
80
100
120
0 1 2 3 4 5 6 7 8 9
Leaf
Zn
(mg
kg -1
)
Sampling position
Figure 5. Leaf nutrient concentration from samples taken at 2 m height and at different sampling positions along thegradient of irrigation (1, . . . , 9), as a function of field (F1, field 1; F2, field 2).
3.1.3. Correlation Analysis between Soil Properties and Plant Dry Matter Yield
Soil bulk density and porosity correlated in a different way with soil pH (H2O andKCl), leaf P and total DMY (Table 3). That is, the correlations of soil pH were positive forsoil bulk density and negative for soil porosity at 0.0–0.10 m depth. Leaf P concentrationwas significantly and negatively correlated with soil bulk density at 0.10–0.20 m depth,in contrast to the positive correlation found with soil porosity. Leaf Fe concentration wasfound significant and negatively correlated only with soil porosity at 0.10–0.20 m depth.The strongest correlations were found for total DMY with soil bulk density (r = −0.706)and soil porosity (r = 0.714), both at 0.10–0.20 m depth.
178
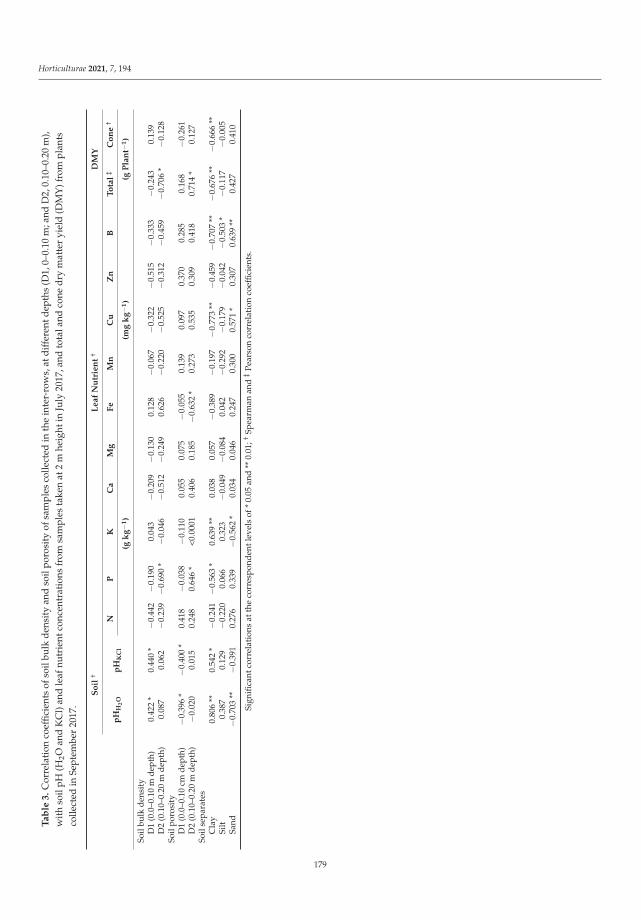
Horticulturae 2021, 7, 194
Ta
ble
3.
Cor
rela
tion
coef
ficie
nts
ofso
ilbu
lkde
nsit
yan
dso
ilpo
rosi
tyof
sam
ples
colle
cted
inth
ein
ter-
row
s,at
diff
eren
tdep
ths
(D1,
0–0.
10m
;and
D2,
0.10
–0.2
0m
),w
ith
soil
pH(H
2Oan
dK
Cl)
and
leaf
nutr
ient
conc
entr
atio
nsfr
omsa
mpl
esta
ken
at2
mhe
ight
inJu
ly20
17,a
ndto
tala
ndco
nedr
ym
atte
ryi
eld
(DM
Y)f
rom
plan
tsco
llect
edin
Sept
embe
r20
17.
So
il†
Le
af
Nu
trie
nt
†D
MY
pH
H2
Op
HK
Cl
NP
KC
aM
gF
eM
nC
uZ
nB
To
tal
‡C
on
e†
(gk
g−1
)(m
gk
g−1
)(g
Pla
nt−
1)
Soil
bulk
dens
ity
D1
(0.0
–0.1
0m
dept
h)0.
422
*0.
440
*−0
.442
−0.1
900.
043
−0.2
09−0
.130
0.12
8−0
.067
−0.3
22−0
.515
−0.3
33−0
.243
0.13
9D
2(0
.10–
0.20
mde
pth)
0.08
70.
062
−0.2
39−0
.690
*−0
.046
−0.5
12−0
.249
0.62
6−0
.220
−0.5
25−0
.312
−0.4
59−0
.706
*−0
.128
Soil
poro
sity
D1
(0.0
–0.1
0cm
dept
h)−0
.396
*−0
.400
*0.
418
−0.0
38−0
.110
0.05
50.
075
−0.0
550.
139
0.09
70.
370
0.28
50.
168
−0.2
61D
2(0
.10–
0.20
mde
pth)
−0.0
200.
015
0.24
80.
646
*<0
.000
10.
406
0.18
5−0
.632
*0.
273
0.53
50.
309
0.41
80.
714
*0.
127
Soil
sepa
rate
sC
lay
0.80
6**
0.54
2*
−0.2
41−0
.563
*0.
639
**0.
038
0.05
7−0
.389
−0.1
97−0
.773
**−0
.459
−0.7
07**
−0.6
76**
−0.6
66**
Silt
0.38
70.
129
−0.2
200.
066
0.32
3−0
.049
−0.0
840.
042
−0.2
92−0
.179
−0.0
42−0
.503
*−0
.117
−0.0
05Sa
nd−0
.703
**−0
.391
0.27
60.
339
−0.5
62*
0.03
40.
046
0.24
70.
300
0.57
1*
0.30
70.
639
**0.
427
0.41
0
Sign
ifica
ntco
rrel
atio
nsat
the
corr
espo
nden
tlev
els
of*
0.05
and
**0.
01;†
Spea
rman
and
‡Pe
arso
nco
rrel
atio
nco
effic
ient
s.
179

Horticulturae 2021, 7, 194
Significant correlations were found for soil clay content, positive for soil pH and leafK, and negative for leaf P, leaf Cu, total DMY and cone DMY. In contrast, soil sand contentcorrelated significantly and negatively with soil pH (H2O) and leaf K, and positively withleaf Cu and B. Soil silt content correlated significantly and negatively with leaf B.
3.2. Liming Experiment3.2.1. Soil Properties
Most soil properties, such as extractable K, P, Mn, Zn, Cu, B, conductivity and pHpresented significantly higher values in the limed plot in comparison to the untreatedcontrol (Table 4). Exchangeable Ca and CEC showed higher values in the limed plot butnot significantly different to those observed in the control. Significant differences betweenthe two fields used in this experiment were also found for most of the soil properties, thevalues of extractable K, P, Zn, Cu and B, conductivity, pH, exchangeable Ca, CEC andbase saturation being significantly higher in Field 1. Only extractable Fe was significantlyhigher in Field 2. The interaction between liming and field was significant for extractableK, conductivity, and pH.
3.2.2. Plant Response to Liming
The concentration of nutrients in the leaves taken at 2 m height showed significantdifferences between treatments for leaf P in 2017 and for leaf Fe and B in 2018 (Table 5). Thevalues reported for P and Fe were significantly higher in the limed plots, and those reportedfor B were significantly higher in the control. Total and cone DMY were significantly lowerin the limed plots with the exception of total DMY in 2017, whose differences betweentreatments were not statistically significant. When comparing fields, significant differenceswere found for some nutrients and total and cone DMY. However, only leaf concentrationsof K, Cu and B, and total and cone DMY, maintained the same trend in both years andfields. In 2017, significant interaction between the liming treatment and the field was onlyfound for leaf N and Mn and in 2018 for leaf P and total DMY.
3.2.3. Correlation Analysis between Soil pH and Plant Variables
Significant correlations between the soil pH (H2O and KCl) and leaf nutrient concen-tration were found for several nutrients, but a similar trend over the two years was foundonly for leaf Cu and B, both presenting negative correlations with soil pH (Table 6). SoilpH and leaf P, for instance, showed a negative correlation in 2017 and a positive correlationin 2018. Significant and negative relations between soil pH and total and cone DMY werealso found for the first year of plant sampling.
180
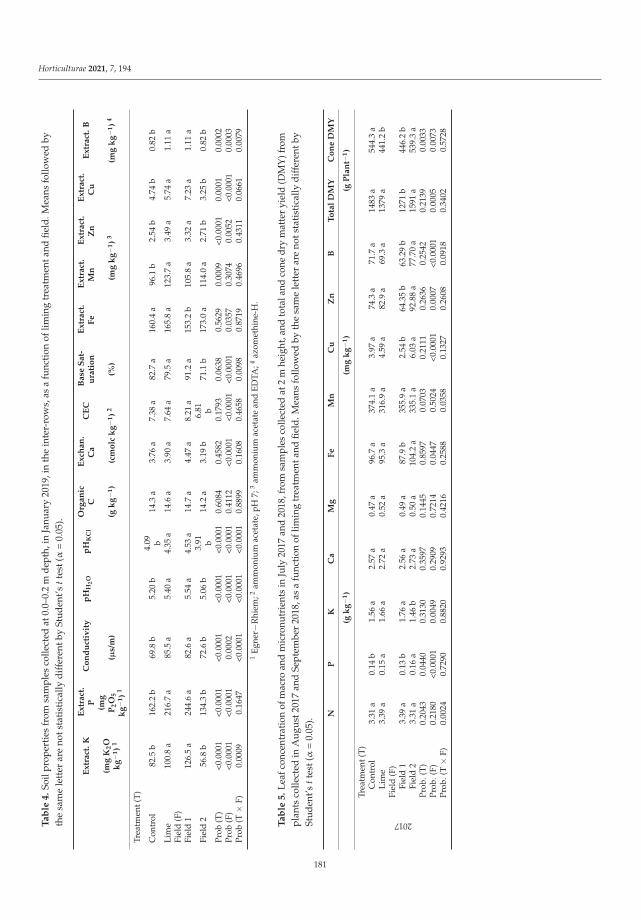
Horticulturae 2021, 7, 194
Ta
ble
4.
Soil
prop
erti
esfr
omsa
mpl
esco
llect
edat
0.0–
0.2
mde
pth,
inJa
nuar
y20
19,i
nth
ein
ter-
row
s,as
afu
ncti
onof
limin
gtr
eatm
enta
ndfie
ld.M
eans
follo
wed
byth
esa
me
lett
erar
eno
tsta
tist
ical
lydi
ffer
entb
ySt
uden
t’stt
est(α
=0.
05).
Ex
tra
ct.
KE
xtr
act
.P
Co
nd
uct
ivit
yp
HH
2O
pH
KC
lO
rga
nic
CE
xch
an
.C
aC
EC
Ba
seS
at-
ura
tio
nE
xtr
act
.F
eE
xtr
act
.M
nE
xtr
act
.Z
nE
xtr
act
.C
uE
xtr
act
.B
(mg
K2O
kg−1
)1
(mg
P2O
5
kg−1
)1
(μs/
m)
(gk
g−1
)(c
mo
lck
g−1
)2
(%)
(mg
kg−1
)3
(mg
kg−1
)4
Trea
tmen
t(T)
Con
trol
82.5
b16
2.2
b69
.8b
5.20
b4.
09 b14
.3a
3.76
a7.
38a
82.7
a16
0.4
a96
.1b
2.54
b4.
74b
0.82
b
Lim
e10
0.8
a21
6.7
a85
.5a
5.40
a4.
35a
14.6
a3.
90a
7.64
a79
.5a
165.
8a
123.
7a
3.49
a5.
74a
1.11
aFi
eld
(F)
Fiel
d1
126.
5a
244.
6a
82.6
a5.
54a
4.53
a14
.7a
4.47
a8.
21a
91.2
a15
3.2
b10
5.8
a3.
32a
7.23
a1.
11a
Fiel
d2
56.8
b13
4.3
b72
.6b
5.06
b3.
91 b14
.2a
3.19
b6.
81 b71
.1b
173.
0a
114.
0a
2.71
b3.
25b
0.82
b
Prob
(T)
<0.0
001
<0.0
001
<0.0
001
<0.0
001
<0.0
001
0.60
840.
4582
0.17
930.
0638
0.56
290.
0009
<0.0
001
0.00
010.
0002
Prob
(F)
<0.0
001
<0.0
001
0.00
02<0
.000
1<0
.000
10.
4112
<0.0
001
<0.0
001
<0.0
001
0.03
570.
3074
0.00
52<0
.000
10.
0003
Prob
(T×
F)0.
0009
0.16
47<0
.000
1<0
.000
1<0
.000
10.
8899
0.16
080.
4658
0.00
980.
8719
0.46
960.
4311
0.06
610.
0079
1Eg
ner−
Rhi
em;2
amm
oniu
mac
etat
e,pH
7;3
amm
oniu
mac
etat
ean
dED
TA;4
azom
ethi
ne-H
.
Ta
ble
5.
Leaf
conc
entr
atio
nof
mac
roan
dm
icro
nutr
ient
sin
July
2017
and
2018
,fro
msa
mpl
esco
llect
edat
2m
heig
ht,a
ndto
tala
ndco
nedr
ym
atte
ryi
eld
(DM
Y)f
rom
plan
tsco
llect
edin
Aug
ust2
017
and
Sept
embe
r20
18,a
sa
func
tion
oflim
ing
trea
tmen
tand
field
.Mea
nsfo
llow
edby
the
sam
ele
tter
are
nots
tati
stic
ally
diff
eren
tby
Stud
ent’s
ttes
t(α
=0.
05).
NP
KC
aM
gF
eM
nC
uZ
nB
To
tal
DM
YC
on
eD
MY
(gk
g−1
)(m
gk
g−1
)(g
Pla
nt−
1)
2017
Trea
tmen
t(T)
Con
trol
3.31
a0.
14b
1.56
a2.
57a
0.47
a96
.7a
374.
1a
3.97
a74
.3a
71.7
a14
83a
544.
3a
Lim
e3.
39a
0.15
a1.
66a
2.72
a0.
52a
95.3
a31
6.9
a4.
59a
82.9
a69
.3a
1379
a44
1.2
bFi
eld
(F)
Fiel
d1
3.39
a0.
13b
1.76
a2.
56a
0.49
a87
.9b
355.
9a
2.54
b64
.35
b63
.29
b12
71b
446.
2b
Fiel
d2
3.31
a0.
16a
1.46
b2.
73a
0.50
a10
4.2
a33
5.1
a6.
03a
92.8
8a
77.7
0a
1591
a53
9.3
aPr
ob.(
T)0.
2043
0.04
400.
3130
0.35
970.
1445
0.85
970.
0703
0.21
110.
2636
0.25
420.
2139
0.00
33Pr
ob.(
F)0.
2180
<0.0
001
0.00
490.
2909
0.72
140.
0447
0.50
24<0
.000
10.
0007
<0.0
001
0.00
050.
0073
Prob
.(T×
F)0.
0024
0.72
900.
8820
0.92
930.
4216
0.25
880.
0358
0.13
270.
2608
0.09
180.
3402
0.57
28
181
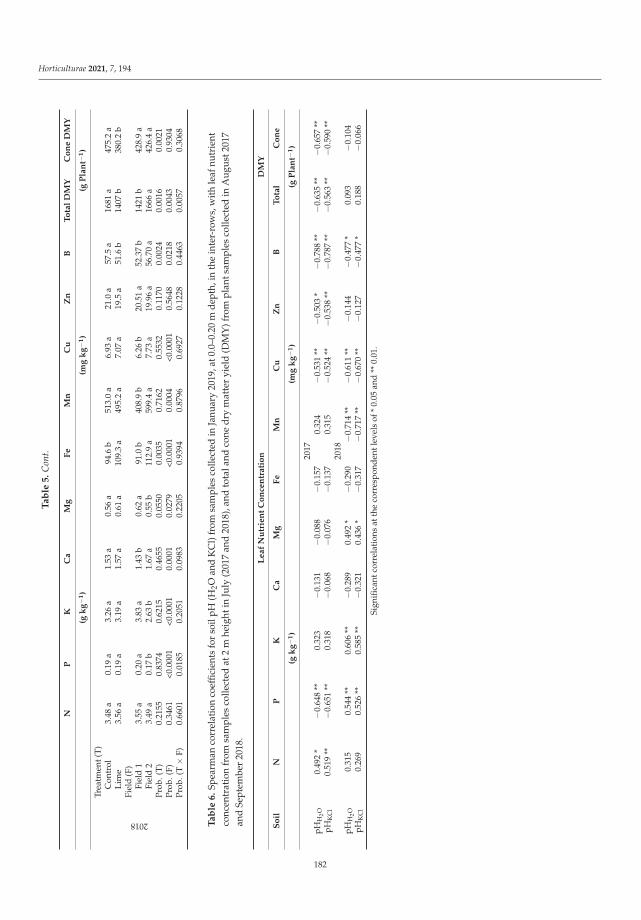
Horticulturae 2021, 7, 194
Ta
ble
5.
Con
t.
NP
KC
aM
gF
eM
nC
uZ
nB
To
tal
DM
YC
on
eD
MY
(gk
g−1
)(m
gk
g−1
)(g
Pla
nt−
1)
2018Tr
eatm
ent(
T)C
ontr
ol3.
48a
0.19
a3.
26a
1.53
a0.
56a
94.6
b51
3.0
a6.
93a
21.0
a57
.5a
1681
a47
5.2
aLi
me
3.56
a0.
19a
3.19
a1.
57a
0.61
a10
9.3
a49
5.2
a7.
07a
19.5
a51
.6b
1407
b38
0.2
bFi
eld
(F)
Fiel
d1
3.55
a0.
20a
3.83
a1.
43b
0.62
a91
.0b
408.
9b
6.26
b20
.51
a52
.37
b14
21b
428.
9a
Fiel
d2
3.49
a0.
17b
2.63
b1.
67a
0.55
b11
2.9
a59
9.4
a7.
73a
19.9
6a
56.7
0a
1666
a42
6.4
aPr
ob.(
T)0.
2155
0.83
740.
6215
0.46
550.
0550
0.00
350.
7162
0.55
320.
1170
0.00
240.
0016
0.00
21Pr
ob.(
F)0.
3461
<0.0
001
<0.0
001
0.00
010.
0279
<0.0
001
0.00
04<0
.000
10.
5648
0.02
180.
0043
0.93
04Pr
ob.(
T×
F)0.
6601
0.01
850.
2051
0.09
830.
2205
0.93
940.
8796
0.69
270.
1228
0.44
630.
0057
0.30
68
Ta
ble
6.
Spea
rman
corr
elat
ion
coef
ficie
nts
for
soil
pH(H
2Oan
dK
Cl)
from
sam
ples
colle
cted
inJa
nuar
y20
19,a
t0.0
–0.2
0m
dept
h,in
the
inte
r-ro
ws,
with
leaf
nutr
ient
conc
entr
atio
nfr
omsa
mpl
esco
llect
edat
2m
heig
htin
July
(201
7an
d20
18),
and
tota
land
cone
dry
mat
ter
yiel
d(D
MY
)fro
mpl
ants
ampl
esco
llect
edin
Aug
ust2
017
and
Sept
embe
r20
18.
Le
af
Nu
trie
nt
Co
nce
ntr
ati
on
DM
Y
So
ilN
PK
Ca
Mg
Fe
Mn
Cu
Zn
BT
ota
lC
on
e
(gk
g−1
)(m
gk
g−1
)(g
Pla
nt−
1)
2017
pHH
2O0.
492
*−0
.648
**0.
323
−0.1
31−0
.088
−0.1
570.
324
−0.5
31**
−0.5
03*
−0.7
88**
−0.6
35**
−0.6
57**
pHK
Cl
0.51
9**
−0.6
51**
0.31
8−0
.068
−0.0
76−0
.137
0.31
5−0
.524
**−0
.538
**−0
.787
**−0
.563
**−0
.590
**20
18pH
H2O
0.31
50.
544
**0.
606
**−0
.289
0.49
2*
−0.2
90−0
.714
**−0
.611
**−0
.144
−0.4
77*
0.09
3−0
.104
pHK
Cl
0.26
90.
526
**0.
585
**−0
.321
0.43
6*
−0.3
17−0
.717
**−0
.670
**−0
.127
−0.4
77*
0.18
8−0
.066
Sign
ifica
ntco
rrel
atio
nsat
the
corr
espo
nden
tlev
els
of*
0.05
and
**0.
01.
182
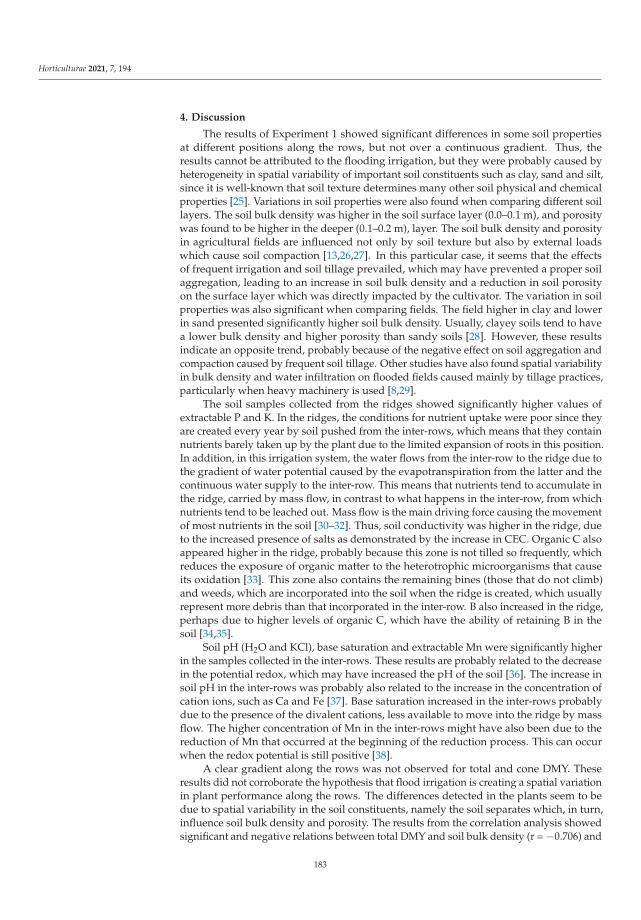
Horticulturae 2021, 7, 194
4. Discussion
The results of Experiment 1 showed significant differences in some soil propertiesat different positions along the rows, but not over a continuous gradient. Thus, theresults cannot be attributed to the flooding irrigation, but they were probably caused byheterogeneity in spatial variability of important soil constituents such as clay, sand and silt,since it is well-known that soil texture determines many other soil physical and chemicalproperties [25]. Variations in soil properties were also found when comparing different soillayers. The soil bulk density was higher in the soil surface layer (0.0–0.1 m), and porositywas found to be higher in the deeper (0.1–0.2 m), layer. The soil bulk density and porosityin agricultural fields are influenced not only by soil texture but also by external loadswhich cause soil compaction [13,26,27]. In this particular case, it seems that the effectsof frequent irrigation and soil tillage prevailed, which may have prevented a proper soilaggregation, leading to an increase in soil bulk density and a reduction in soil porosityon the surface layer which was directly impacted by the cultivator. The variation in soilproperties was also significant when comparing fields. The field higher in clay and lowerin sand presented significantly higher soil bulk density. Usually, clayey soils tend to havea lower bulk density and higher porosity than sandy soils [28]. However, these resultsindicate an opposite trend, probably because of the negative effect on soil aggregation andcompaction caused by frequent soil tillage. Other studies have also found spatial variabilityin bulk density and water infiltration on flooded fields caused mainly by tillage practices,particularly when heavy machinery is used [8,29].
The soil samples collected from the ridges showed significantly higher values ofextractable P and K. In the ridges, the conditions for nutrient uptake were poor since theyare created every year by soil pushed from the inter-rows, which means that they containnutrients barely taken up by the plant due to the limited expansion of roots in this position.In addition, in this irrigation system, the water flows from the inter-row to the ridge due tothe gradient of water potential caused by the evapotranspiration from the latter and thecontinuous water supply to the inter-row. This means that nutrients tend to accumulate inthe ridge, carried by mass flow, in contrast to what happens in the inter-row, from whichnutrients tend to be leached out. Mass flow is the main driving force causing the movementof most nutrients in the soil [30–32]. Thus, soil conductivity was higher in the ridge, dueto the increased presence of salts as demonstrated by the increase in CEC. Organic C alsoappeared higher in the ridge, probably because this zone is not tilled so frequently, whichreduces the exposure of organic matter to the heterotrophic microorganisms that causeits oxidation [33]. This zone also contains the remaining bines (those that do not climb)and weeds, which are incorporated into the soil when the ridge is created, which usuallyrepresent more debris than that incorporated in the inter-row. B also increased in the ridge,perhaps due to higher levels of organic C, which have the ability of retaining B in thesoil [34,35].
Soil pH (H2O and KCl), base saturation and extractable Mn were significantly higherin the samples collected in the inter-rows. These results are probably related to the decreasein the potential redox, which may have increased the pH of the soil [36]. The increase insoil pH in the inter-rows was probably also related to the increase in the concentration ofcation ions, such as Ca and Fe [37]. Base saturation increased in the inter-rows probablydue to the presence of the divalent cations, less available to move into the ridge by massflow. The higher concentration of Mn in the inter-rows might have also been due to thereduction of Mn that occurred at the beginning of the reduction process. This can occurwhen the redox potential is still positive [38].
A clear gradient along the rows was not observed for total and cone DMY. Theseresults did not corroborate the hypothesis that flood irrigation is creating a spatial variationin plant performance along the rows. The differences detected in the plants seem to bedue to spatial variability in the soil constituents, namely the soil separates which, in turn,influence soil bulk density and porosity. The results from the correlation analysis showedsignificant and negative relations between total DMY and soil bulk density (r = −0.706) and
183
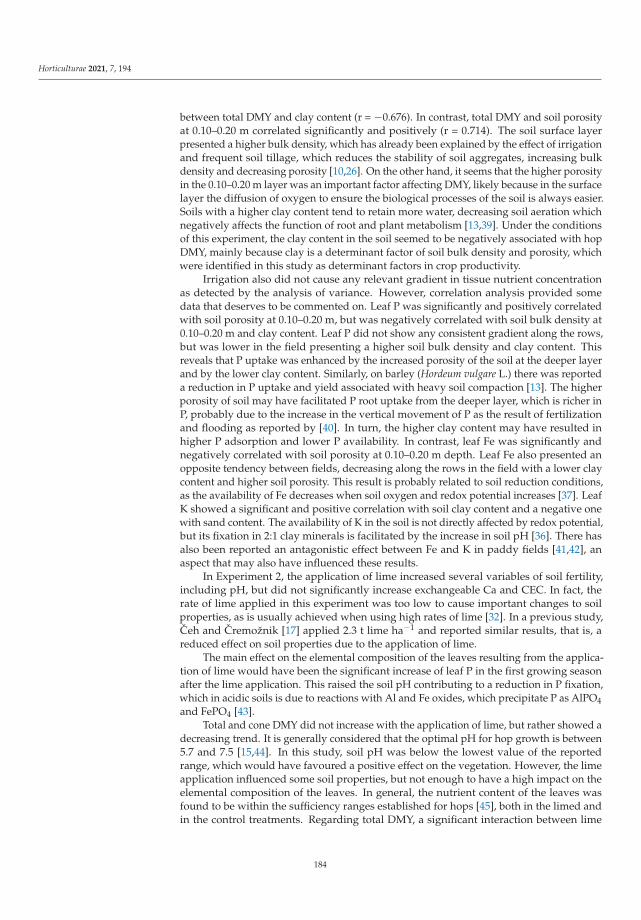
Horticulturae 2021, 7, 194
between total DMY and clay content (r = −0.676). In contrast, total DMY and soil porosityat 0.10–0.20 m correlated significantly and positively (r = 0.714). The soil surface layerpresented a higher bulk density, which has already been explained by the effect of irrigationand frequent soil tillage, which reduces the stability of soil aggregates, increasing bulkdensity and decreasing porosity [10,26]. On the other hand, it seems that the higher porosityin the 0.10–0.20 m layer was an important factor affecting DMY, likely because in the surfacelayer the diffusion of oxygen to ensure the biological processes of the soil is always easier.Soils with a higher clay content tend to retain more water, decreasing soil aeration whichnegatively affects the function of root and plant metabolism [13,39]. Under the conditionsof this experiment, the clay content in the soil seemed to be negatively associated with hopDMY, mainly because clay is a determinant factor of soil bulk density and porosity, whichwere identified in this study as determinant factors in crop productivity.
Irrigation also did not cause any relevant gradient in tissue nutrient concentrationas detected by the analysis of variance. However, correlation analysis provided somedata that deserves to be commented on. Leaf P was significantly and positively correlatedwith soil porosity at 0.10–0.20 m, but was negatively correlated with soil bulk density at0.10–0.20 m and clay content. Leaf P did not show any consistent gradient along the rows,but was lower in the field presenting a higher soil bulk density and clay content. Thisreveals that P uptake was enhanced by the increased porosity of the soil at the deeper layerand by the lower clay content. Similarly, on barley (Hordeum vulgare L.) there was reporteda reduction in P uptake and yield associated with heavy soil compaction [13]. The higherporosity of soil may have facilitated P root uptake from the deeper layer, which is richer inP, probably due to the increase in the vertical movement of P as the result of fertilizationand flooding as reported by [40]. In turn, the higher clay content may have resulted inhigher P adsorption and lower P availability. In contrast, leaf Fe was significantly andnegatively correlated with soil porosity at 0.10–0.20 m depth. Leaf Fe also presented anopposite tendency between fields, decreasing along the rows in the field with a lower claycontent and higher soil porosity. This result is probably related to soil reduction conditions,as the availability of Fe decreases when soil oxygen and redox potential increases [37]. LeafK showed a significant and positive correlation with soil clay content and a negative onewith sand content. The availability of K in the soil is not directly affected by redox potential,but its fixation in 2:1 clay minerals is facilitated by the increase in soil pH [36]. There hasalso been reported an antagonistic effect between Fe and K in paddy fields [41,42], anaspect that may also have influenced these results.
In Experiment 2, the application of lime increased several variables of soil fertility,including pH, but did not significantly increase exchangeable Ca and CEC. In fact, therate of lime applied in this experiment was too low to cause important changes to soilproperties, as is usually achieved when using high rates of lime [32]. In a previous study,Ceh and Cremožnik [17] applied 2.3 t lime ha−1 and reported similar results, that is, areduced effect on soil properties due to the application of lime.
The main effect on the elemental composition of the leaves resulting from the applica-tion of lime would have been the significant increase of leaf P in the first growing seasonafter the lime application. This raised the soil pH contributing to a reduction in P fixation,which in acidic soils is due to reactions with Al and Fe oxides, which precipitate P as AlPO4and FePO4 [43].
Total and cone DMY did not increase with the application of lime, but rather showed adecreasing trend. It is generally considered that the optimal pH for hop growth is between5.7 and 7.5 [15,44]. In this study, soil pH was below the lowest value of the reportedrange, which would have favoured a positive effect on the vegetation. However, the limeapplication influenced some soil properties, but not enough to have a high impact on theelemental composition of the leaves. In general, the nutrient content of the leaves wasfound to be within the sufficiency ranges established for hops [45], both in the limed andin the control treatments. Regarding total DMY, a significant interaction between lime
184

Horticulturae 2021, 7, 194
treatment and field was recorded, which may also have contributed to difficulties in theinterpretation of these results.
Correlation analysis, in turn, also did not show coherent trends over the two years ofthe study. Perhaps the most relevant result was the negative correlation between soil pHand biomass production in the first year, which again refers to diverse interactions whichmay have occurred between environmental variables (year) and factors under study (fieldand liming). The effect of environmental variables on the performance of the hop plant iswell known [46–48], although in this study it was not possible to clarify the isolated effectsof any of them.
5. Conclusions
Irrigation by flooding the space between rows over more than 20 years was notresponsible for any gradient in soil properties, plant elemental composition and plantperformance, although variations in those variables were found at different positions inthe row caused by erratic spatial variability of some constituents of the soil, such as sand,silt and clay. However, irrigation followed by soil tillage on repeated occasions during thegrowing season seems to have reduced soil porosity and increased soil bulk density in thesurface 0.0–0.1 m soil layer. These variables were found to be related to crop productivityin positive and negative ways, respectively.
This study also showed that the ridge is a point of nutrient accumulation, particularlyfor those that move more easily in the soil by mass flow, thereby showing also higher con-ductivity and CEC. The reduced water potential in the ridge created by evapotranspirationis the driving force causing the water flow from the inter-row. Organic C was also higherin the ridge in comparison with the inter-row, probably due to the annual incorporationof weeds and weaker hop bines (those that did not climb) when the ridge is created inearly spring.
Although the original soil was acidic, and the application of 1000 kg ha−1 of limecaused a small increase in pH, this did not lead to other relevant changes in soil properties,nor in plant nutrition status or total and cone DMY. The liming effect might not havebeen enough to nullify the effects of the interaction between factors that always occur infield experiments.
Author Contributions: Conceptualization, M.Â.R.; methodology, M.A. and S.A.; formal analysis,S.A.; investigation, S.A.; resources, M.Â.R. and M.A.; data curation, S.A.; writing—original draftpreparation, S.A.; writing—review and editing, M.Â.R.; supervision, M.Â.R. and M.A.; projectadministration, M.Â.R.; funding acquisition, M.Â.R. and M.A. All authors have read and agreed tothe published version of the manuscript.
Funding: The authors are grateful to the Foundation for Science and Technology (FCT, Portugal)for financial support from national funds FCT/MCTES, to CIMO (UIDB/AGR/00690/2020) and forSandra Afonso’s doctoral scholarship (BD/116593/2016).
Institutional Review Board Statement: Not applicable.
Informed Consent Statement: Not applicable.
Data Availability Statement: No new data were created or analyzed in this study. Data sharing isnot applicable to this article.
Conflicts of Interest: The authors declare no conflict of interest.
References
1. Turner, S.F.; Benedict, C.A.; Darby, H.; Hoagland, L.A.; Simonson, P.; Sirrine, J.R.; Murphy, K.M. Challenges and Opportunities forOrganic Hop Production in the United States. Agron J. 2011, 103, 1645–1654. [CrossRef]
2. Rossini, F.; Virga, G.; Loreti, P.; Iacuzzi, N.; Ruggeri, R.; Provenzano, M.E. Hops (Humulus lupulus L.) as a Novel MultipurposeCrop for the Mediterranean Region of Europe: Challenges and Opportunities of Their Cultivation. Agriculture 2021, 11, 484.[CrossRef]
3. Hoque, M. The Way Ahead. In Biotechnology for Sustainable Agriculture; Singh, R.L., Mondal, S., Eds.; Woodhead Publishing:Cambridge, UK, 2018; pp. 375–397. [CrossRef]
185

Horticulturae 2021, 7, 194
4. Afonso, S.; Arrobas, M.; Rodrigues, M.Â. Soil and Plant Analyses to Diagnose Hop Fields Irregular Growth. J. Soil Sci. Plant Nutr.2020, 20, 1999–2013. [CrossRef]
5. Hedley, C.B.; Knox, J.W.; Raine, S.R.; Smith, R. Water: Advanced Irrigation Technologies. In Encyclopedia of Agriculture and FoodSystems; Van Alfen, N.K., Ed.; Academic Press: Oxford, UK, 2014; pp. 378–406. [CrossRef]
6. Simmonds, M.B.; Plant, R.E.; Peña-Barragán, J.M.; van Kessel, C.; Hill, J.; Linquist, B.A. Underlying Causes of Yield SpatialVariability and Potential for Precision Management in Rice Systems. Precis. Agric. 2013, 14, 512–540. [CrossRef]
7. Cox, C.; Jin, L.; Ganjegunte, G.; Borrok, D.; Lougheed, V.; Ma, L. Soil Quality Changes Due to Flood Irrigation in AgriculturalFields Along The Rio Grande in Western Texas. Appl. Geochem. 2018, 90, 87–100. [CrossRef]
8. Cerdà, A.; Daliakopoulos, I.N.; Terol, E.; Novara, A.; Fatahi, Y.; Moradi, E.; Salvati, L.; Pulido, M. Long-Term Monitoring of SoilBulk Density and Erosion Rates in Two Prunus persica (L) Plantations Under Flood Irrigation and Glyphosate Herbicide Treatmentin La Ribera District, Spain. J. Environ. Manag. 2021, 282, 111965. [CrossRef] [PubMed]
9. González-Méndez, B.; Webster, R.; Fiedler, S.; Siebe, C. Changes in Soil Redox Potential in Response to Flood Irrigation withWaste Water in Central Mexico. Eur. J. Soil Sci. 2017, 68, 886–896. [CrossRef]
10. Batey, T. Soil Bompaction and Soil Management—A Review. Soil Use Manag. 2009, 25, 335–345. [CrossRef]11. Shapiro, C.A.; Elmore, R.W. Agricultural Crops. In Encyclopedia of Applied Plant Sciences, 2nd ed.; Thomas, B., Murray, B.G.,
Murphy, D.J., Eds.; Academic Press: Oxford, UK, 2017; pp. 1–8. [CrossRef]12. Arriaga, F.J.; Guzman, J.; Lowery, B. Conventional Agricultural Production Systems and Soil Functions. In Soil Health and
Intensification of Agroecosytems; Al-Kaisi, M.M., Lowery, B., Eds.; Academic Press: Cambridge, MA, USA, 2017; pp. 109–125.[CrossRef]
13. Nawaz, M.F.; Bourrié, G.; Trolard, F. Soil Compaction Impact and Modelling. A Review. Agron. Sustain. Dev. 2013, 33, 291–309.[CrossRef]
14. Indoria, A.K.; Sharma, K.L.; Reddy, K.S. Hydraulic properties of soil under warming climate. In Climate Change and Soil Interactions;Prasad, M.N.V., Pietrzykowski, M., Eds.; Elsevier: Amsterdam, The Netherlands, 2020; pp. 473–508. [CrossRef]
15. Sirrine, J.R.; Rothwell, N.; Lizotte, E.; Goldy, R.; Marquie, S.; Brown-Rytlewski, D. Sustainable Hop Production in the Great LakesRegion. Ext. Bull. E-3083 2010. Available online: https://www.uvm.edu/sites/default/files/media/Sirrine-Sustainable-Hop-Production-in-the-Great-Lakes-Region.pdf (accessed on 13 April 2019).
16. Gent, D.H.; Sirrine, J.R.; Darby, H.M. Nutrient Management and Imbalances. In Field Guide for Integrated Pest Management in Hops;Washington Hop Commission: Moxee, WA, USA, 2015; pp. 98–100.
17. Ceh, B.; Cremožnik, B. Soil pH and Hop (Humulus lupulus) Yield Related to Liming Material Rate. Hmelj. Bilt. 2015, 22, 49–57.18. Seng, V.; Bell, R.W.; Willett, I.R. Effect of Lime and Flooding on Phosphorus Availability and Rice Growth on Two Acidic Lowland
Soils. Commun. Soil Sci Plant Anal. 2006, 37, 313–336. [CrossRef]19. Sadiq, A.A.; Babagana, U. Influence of Lime Materials to Ameliorate Acidity on Irrigated Paddy Fields: A Review. Acad. Res. Int.
2012, 3, 413.20. Shi, L.; Guo, Z.; Liang, F.; Xiao, X.; Peng, C.; Zeng, P.; Feng, W.; Ran, H. Effect of Liming with Various Water Regimes on Both
Immobilization of Cadmium and Improvement of Bacterial Communities in Contaminated Paddy: A Field Experiment. Int. J.Environ. Res. Public Health 2019, 16, 498. [CrossRef] [PubMed]
21. Rowell, D.L. Soil Science: Methods & Applications, 1st ed.; Longman Group UK Ltd.: Harlow, UK, 1994; p. 368. [CrossRef]22. Van Reeuwijk, L. Procedures for soil analysis (International Soil Reference and Information Centre). Tech. Pap. 2002, 9, 120.23. Lakanen, E.; Erviö, R. A Comparison of Eight Extractants for the Determination of Plant Available Micronutrients in Soils. Acta
Agric. Fenn. 1971, 123, 223–232.24. Walinga, I.; Van Vark, W.; Houba, V.; Van der Lee, J. Soil and Plant Analysis, Part 7: Plant Analysis Procedures; Wageningen
Agricultural University: Wageningen, The Netherlands, 1989.25. Delgado, A.; Gómez, J.A. The Soil. Physical, Chemical and Biological Properties. In Principles of Agronomy for Sustainable
Agriculture; Villalobos, F.J., Fereres, E., Eds.; Springer International Publishing: Cham, Switzerland, 2016; pp. 15–26. [CrossRef]26. Hamza, M.A.; Al-Adawi, S.S.; Al-Hinai, K.A. Effect of Combined Soil Water and External Load on Soil Compaction. Soil Res.
2011, 49, 135–142. [CrossRef]27. Alaoui, A.; Rogger, M.; Peth, S.; Blöschl, G. Does Soil Compaction Increase Floods? A Review. J. Hydrol. 2018, 557, 631–642.
[CrossRef]28. Chaudhari, P.R.; Ahire, D.V.; Ahire, V.D.; Chkravarty, M.; Maity, S. Soil Bulk Density as Related to Soil Texture, Organic Matter
Content and Available Total Nutrients of Coimbatore Soil. Int. J. Sci. Res. Publ. 2013, 3, 1–8.29. Green, T.R.; Ahuja, L.R.; Benjamin, J.G. Advances and Challenges in Predicting Agricultural Management Effects on Soil
Hydraulic Properties. Geoderma 2003, 116, 3–27. [CrossRef]30. Lambers, H.; Chapin, F.S.; Pons, T.L. Mineral Nutrition. In Plant Physiological Ecology; Lambers, H., Chapin, F.S., Pons, T.L., Eds.;
Springer: New York, NY, USA, 2008; pp. 255–320. [CrossRef]31. Comerford, N.B. Soil Factors Affecting Nutrient Bioavailability. In Nutrient Acquisition by Plants: An Ecological Perspective;
BassiriRad, H., Ed.; Springer: Berlin/Heidelberg, Germany, 2005; pp. 1–14. [CrossRef]32. Weil, R.R.; Brady, N.C. The Nature and Properties of Soils, 15th ed.; Global Edition: London, UK, 2017.33. Liu, X.; Herbert, S.; Hashemi, A.; Zhang, X.; Ding, G. Effects of Agricultural Management on Soil Organic Matter and Carbon
Transformation—A Review. Plant. Soil Environ. 2006, 52, 531. [CrossRef]
186
Horticulturae 2021, 7, 194
34. Goldberg, S. Reactions of Boron with Soils. Plant Soil 1997, 193, 35–48. [CrossRef]35. Das, A.K.; Purkait, A. Boron Dynamics in Soil: Classification, Sources, Factors, Fractions, and Kinetics. Commun. Soil Sci. Plant
Anal. 2020, 51, 2778–2790. [CrossRef]36. Husson, O. Redox Potential (Eh) and pH as Drivers of Soil/Plant/Microorganism Systems: A Transdisciplinary Overview
Pointing to Integrative Opportunities for Agronomy. Plant Soil 2013, 362, 389–417. [CrossRef]37. Osman, K.T. Soils: Principles, Properties and Management, 1st ed.; Springer: Dordrecht, The Netherlands, 2013.38. George, E.; Horst, W.J.; Neumann, E. Adaptation of Plants to Adverse Chemical Soil Conditions. In Marschner’s Mineral Nutrition
of Higher Plants; Marschner, P., Ed.; Elsevier: Amsterdam, The Netherlands, 2012; pp. 409–472.39. Pezeshki, S.R.; DeLaune, R.D. Soil Oxidation-Reduction in Wetlands and its Impact on Plant Functioning. Biology 2012, 1, 196–221.
[CrossRef]40. Tian, J.; Dong, G.; Karthikeyan, R.; Li, L.; Harmel, R. Phosphorus Dynamics in Long-Term Flooded, Drained, and Reflooded Soils.
Water 2017, 9, 531. [CrossRef]41. Chen, J.; Xuan, J.; Du, C.; Xie, J. Effect of Potassium Nutrition of Rice on Rhizosphere Redox Status. Plant Soil 1997, 188, 131–137.
[CrossRef]42. Kundu, D.; Neue, H.; Singh, R. Iron and Potassium Availability to Rice in Tropudalf and Sulfaquept as Influenced by Water
Regime. J. Indian Soc. Soil Sci. 2001, 49, 130–134.43. Havlin, J.L.; Tisdale, S.L.; Nelson, W.L.; Beaton, J.D. Soil Fertility and Fertilizers: An Introduction to Nutrient Management, 8th ed.;
Pearson: Boston, MA, USA, 2014.44. Gingrich, C.; Hart, J.; Christensen, N. Fertilizer Guide 79; Oregon State University, Extension Service: Corvallis, OR, USA, 1994.45. Bryson, G.; Mills, H.; Sasseville, D.; Jones, J.B., Jr.; Barker, A. Plant. Analysis Handbook III: A Guide to Sampling, Preparation, Analysis
and Interpretation for Agronomic and Horticultural Crops; Micro-Macro Publishing: Athens, GA, USA, 2014.46. Marceddu, R.; Carrubba, A.; Sarno, M. Cultivation Trials of Hop (Humulus lupulus L.) in Semi-Arid Environments. Heliyon 2020,
6, e05114. [CrossRef]47. MacKinnon, D.; Viljem, P.; Ceh, B.; Naglic, B.; Pavlovic, M. The Impact of Weather Conditions on Alpha-Acid Content in Hop
(Humulus lupulus L.) cv. Aurora. Plant. Soil Environ. 2020, 66, 519–525. [CrossRef]48. Rossini, F.; Virga, G.; Loreti, P.; Provenzano, M.E.; Danieli, P.P.; Ruggeri, R. Beyond Beer: Hop Shoot Production and Nutritional
Composition under Mediterranean Climatic Conditions. Agronomy 2020, 10, 1547. [CrossRef]
187

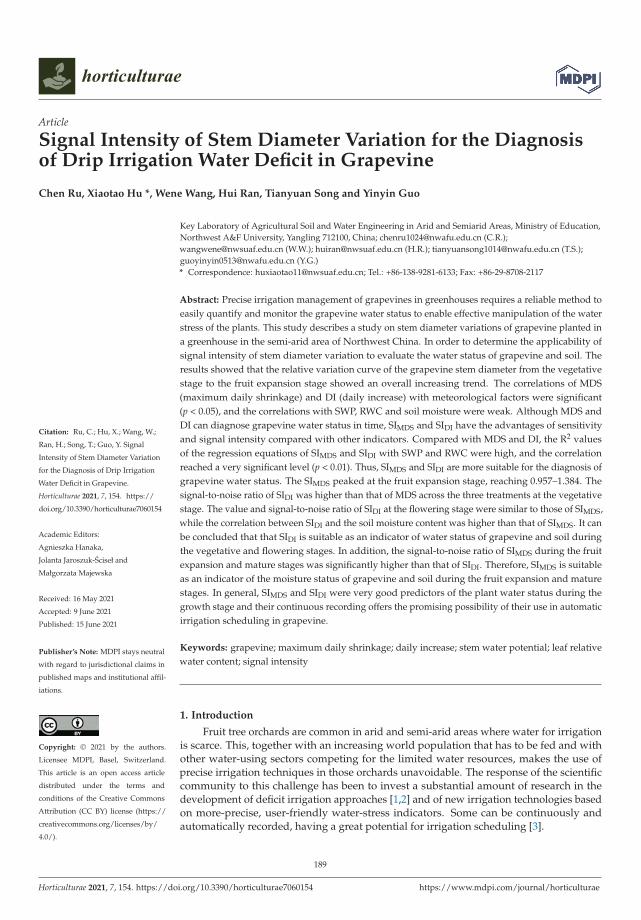
horticulturae
Article
Signal Intensity of Stem Diameter Variation for the Diagnosisof Drip Irrigation Water Deficit in Grapevine
Chen Ru, Xiaotao Hu *, Wene Wang, Hui Ran, Tianyuan Song and Yinyin Guo
Citation: Ru, C.; Hu, X.; Wang, W.;
Ran, H.; Song, T.; Guo, Y. Signal
Intensity of Stem Diameter Variation
for the Diagnosis of Drip Irrigation
Water Deficit in Grapevine.
Horticulturae 2021, 7, 154. https://
doi.org/10.3390/horticulturae7060154
Academic Editors:
Agnieszka Hanaka,
Jolanta Jaroszuk-Sciseł and
Małgorzata Majewska
Received: 16 May 2021
Accepted: 9 June 2021
Published: 15 June 2021
Publisher’s Note: MDPI stays neutral
with regard to jurisdictional claims in
published maps and institutional affil-
iations.
Copyright: © 2021 by the authors.
Licensee MDPI, Basel, Switzerland.
This article is an open access article
distributed under the terms and
conditions of the Creative Commons
Attribution (CC BY) license (https://
creativecommons.org/licenses/by/
4.0/).
Key Laboratory of Agricultural Soil and Water Engineering in Arid and Semiarid Areas, Ministry of Education,Northwest A&F University, Yangling 712100, China; [email protected] (C.R.);[email protected] (W.W.); [email protected] (H.R.); [email protected] (T.S.);[email protected] (Y.G.)* Correspondence: [email protected]; Tel.: +86-138-9281-6133; Fax: +86-29-8708-2117
Abstract: Precise irrigation management of grapevines in greenhouses requires a reliable method toeasily quantify and monitor the grapevine water status to enable effective manipulation of the waterstress of the plants. This study describes a study on stem diameter variations of grapevine planted ina greenhouse in the semi-arid area of Northwest China. In order to determine the applicability ofsignal intensity of stem diameter variation to evaluate the water status of grapevine and soil. Theresults showed that the relative variation curve of the grapevine stem diameter from the vegetativestage to the fruit expansion stage showed an overall increasing trend. The correlations of MDS(maximum daily shrinkage) and DI (daily increase) with meteorological factors were significant(p < 0.05), and the correlations with SWP, RWC and soil moisture were weak. Although MDS andDI can diagnose grapevine water status in time, SIMDS and SIDI have the advantages of sensitivityand signal intensity compared with other indicators. Compared with MDS and DI, the R2 valuesof the regression equations of SIMDS and SIDI with SWP and RWC were high, and the correlationreached a very significant level (p < 0.01). Thus, SIMDS and SIDI are more suitable for the diagnosis ofgrapevine water status. The SIMDS peaked at the fruit expansion stage, reaching 0.957–1.384. Thesignal-to-noise ratio of SIDI was higher than that of MDS across the three treatments at the vegetativestage. The value and signal-to-noise ratio of SIDI at the flowering stage were similar to those of SIMDS,while the correlation between SIDI and the soil moisture content was higher than that of SIMDS. It canbe concluded that that SIDI is suitable as an indicator of water status of grapevine and soil duringthe vegetative and flowering stages. In addition, the signal-to-noise ratio of SIMDS during the fruitexpansion and mature stages was significantly higher than that of SIDI. Therefore, SIMDS is suitableas an indicator of the moisture status of grapevine and soil during the fruit expansion and maturestages. In general, SIMDS and SIDI were very good predictors of the plant water status during thegrowth stage and their continuous recording offers the promising possibility of their use in automaticirrigation scheduling in grapevine.
Keywords: grapevine; maximum daily shrinkage; daily increase; stem water potential; leaf relativewater content; signal intensity
1. Introduction
Fruit tree orchards are common in arid and semi-arid areas where water for irrigationis scarce. This, together with an increasing world population that has to be fed and withother water-using sectors competing for the limited water resources, makes the use ofprecise irrigation techniques in those orchards unavoidable. The response of the scientificcommunity to this challenge has been to invest a substantial amount of research in thedevelopment of deficit irrigation approaches [1,2] and of new irrigation technologies basedon more-precise, user-friendly water-stress indicators. Some can be continuously andautomatically recorded, having a great potential for irrigation scheduling [3].
Horticulturae 2021, 7, 154. https://doi.org/10.3390/horticulturae7060154 https://www.mdpi.com/journal/horticulturae
189
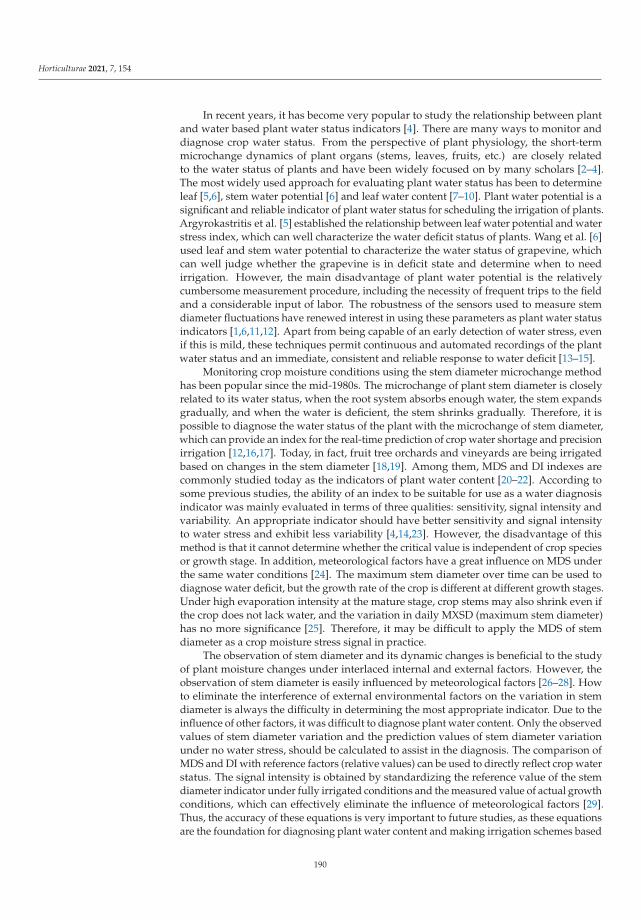
Horticulturae 2021, 7, 154
In recent years, it has become very popular to study the relationship between plantand water based plant water status indicators [4]. There are many ways to monitor anddiagnose crop water status. From the perspective of plant physiology, the short-termmicrochange dynamics of plant organs (stems, leaves, fruits, etc.) are closely relatedto the water status of plants and have been widely focused on by many scholars [2–4].The most widely used approach for evaluating plant water status has been to determineleaf [5,6], stem water potential [6] and leaf water content [7–10]. Plant water potential is asignificant and reliable indicator of plant water status for scheduling the irrigation of plants.Argyrokastritis et al. [5] established the relationship between leaf water potential and waterstress index, which can well characterize the water deficit status of plants. Wang et al. [6]used leaf and stem water potential to characterize the water status of grapevine, whichcan well judge whether the grapevine is in deficit state and determine when to needirrigation. However, the main disadvantage of plant water potential is the relativelycumbersome measurement procedure, including the necessity of frequent trips to the fieldand a considerable input of labor. The robustness of the sensors used to measure stemdiameter fluctuations have renewed interest in using these parameters as plant water statusindicators [1,6,11,12]. Apart from being capable of an early detection of water stress, evenif this is mild, these techniques permit continuous and automated recordings of the plantwater status and an immediate, consistent and reliable response to water deficit [13–15].
Monitoring crop moisture conditions using the stem diameter microchange methodhas been popular since the mid-1980s. The microchange of plant stem diameter is closelyrelated to its water status, when the root system absorbs enough water, the stem expandsgradually, and when the water is deficient, the stem shrinks gradually. Therefore, it ispossible to diagnose the water status of the plant with the microchange of stem diameter,which can provide an index for the real-time prediction of crop water shortage and precisionirrigation [12,16,17]. Today, in fact, fruit tree orchards and vineyards are being irrigatedbased on changes in the stem diameter [18,19]. Among them, MDS and DI indexes arecommonly studied today as the indicators of plant water content [20–22]. According tosome previous studies, the ability of an index to be suitable for use as a water diagnosisindicator was mainly evaluated in terms of three qualities: sensitivity, signal intensity andvariability. An appropriate indicator should have better sensitivity and signal intensityto water stress and exhibit less variability [4,14,23]. However, the disadvantage of thismethod is that it cannot determine whether the critical value is independent of crop speciesor growth stage. In addition, meteorological factors have a great influence on MDS underthe same water conditions [24]. The maximum stem diameter over time can be used todiagnose water deficit, but the growth rate of the crop is different at different growth stages.Under high evaporation intensity at the mature stage, crop stems may also shrink even ifthe crop does not lack water, and the variation in daily MXSD (maximum stem diameter)has no more significance [25]. Therefore, it may be difficult to apply the MDS of stemdiameter as a crop moisture stress signal in practice.
The observation of stem diameter and its dynamic changes is beneficial to the studyof plant moisture changes under interlaced internal and external factors. However, theobservation of stem diameter is easily influenced by meteorological factors [26–28]. Howto eliminate the interference of external environmental factors on the variation in stemdiameter is always the difficulty in determining the most appropriate indicator. Due to theinfluence of other factors, it was difficult to diagnose plant water content. Only the observedvalues of stem diameter variation and the prediction values of stem diameter variationunder no water stress, should be calculated to assist in the diagnosis. The comparison ofMDS and DI with reference factors (relative values) can be used to directly reflect crop waterstatus. The signal intensity is obtained by standardizing the reference value of the stemdiameter indicator under fully irrigated conditions and the measured value of actual growthconditions, which can effectively eliminate the influence of meteorological factors [29].Thus, the accuracy of these equations is very important to future studies, as these equationsare the foundation for diagnosing plant water content and making irrigation schemes based
190

Horticulturae 2021, 7, 154
on plant stem diameter variations. Currently, existent studies concentrate mostly on thegrapevine stem diameter variations in outdoor conditions and seldom did it to grapevinesplanted in a greenhouse [22,30,31]. In addition, the past research on the variation in stemdiameter has mainly focused on the feasibility of moisture diagnosis, maximum dailyshrinkage, daily increase, and other stem diameter indicators, which have been verified foruse in the moisture status diagnosis of different crops [11,24,32–34]. The variation in stemdiameter is influenced by environmental factors and the crop growth characteristics. Thedifference in crop growth at different growth stages may significantly affect the potentialof stem diameter variation indicators for use in determining irrigation regimes. Therefore,different indicators should be applied in different growth stages [26]. There have been fewreports on this topic, and further research is needed.
For these reasons above mentioned, this research selected the greenhouse grapevineas the study object. Because of its rich nutrition and delicious taste, grapevine has becomea kind of world major fruit. In China, grapevines have been widely cultivated as well, anda considerable part among them are planted in sunlight greenhouses. Due to the presentwater shortage in the Northwest China, it is important to acquire accurate crop watercontent information and timely plan water-saving irrigation schemes, which benefit thesustainable development of local agriculture. Thus, the main aims of this study were asfollows: (1) to explore the relative variation in the changes in MDS and DI in stem diameterduring different stages; (2) to clarify the correlation of microchanges in stem diameter withstem water potential, leaf relative water content, and soil water content; (3) to evaluatewhether SIMDS and SIDI can be applied to diagnose grapevine moisture and soil moisturestatus; (4) to analyze the sensitivity of signal intensity indicators and to determine thesuitability of SIMDS and SIDI under different stages.
2. Materials and Methods
2.1. Study Area
The experiment was carried out in greenhouse of Yuhe Farm, Shaanxi Province,from March to July 2018 (108.58◦ E, 37.49◦ N). The annual average rainfall in this area is365.7 mm, the annual average temperature is 8.3 ◦C, the annual relative humidity is 69.37%,and the annual average duration of sunshine is 2893.5 h, which is representative of thetypical continental marginal monsoon climate of the area. Table 1 shows the meteorologicaldata (cultivation stage averages) recorded over the experimental year. The test soil was anaeolian sandy soil. The chemical properties of the soil were as follows: the soil ammoniumnitrogen was 7.48 mg·kg−1, the nitrate nitrogen was 22.91 mg·kg−1, the available phos-phorus was 4.07 mg·kg−1, and the available potassium was 163.47 mg·kg−1. The physicalproperties of the soil are shown in Table 2.
2.2. Experimental Design
Six-year-old grapevine (early-maturing variety 6–12, which was selected from thescarlet bud transformation in 1998) were planted in greenhouse, and grapevines withgood growth and similar shapes were selected for the experiments. The entire growthperiod of grapevines can be divided into four main growth stages: the vegetative stage, theflowering stage, the fruit expansion stage, and the coloring mature stage, the cultivationperiod was 121 days during the growth season. The greenhouse was oriented east-west andwas 70 m long and 9 m wide. The grapevine row width and row spacing were 0.8 m and1.5 m, respectively, and the plant spacing was 0.6 m, with 14 grapevines per row. Artificialwarming was carried out in greenhouse to ensure the growth temperature of grapevineson 11 March 2018. Drip irrigation was used in the experiment. A single-wing labyrinthdrip irrigation belt (produced by Xinjiang Dayu Water Saving Company, Xinjiang, China)was adopted. The inner diameter and wall thickness of drip irrigation belt was 0.02 m and0.018 m, respectively. the distance between the drippers was 0.3 m, the design flow of thedripper was 4.0 L·h−1, and the laying mode of the drip belt was one row of two pipes.
191
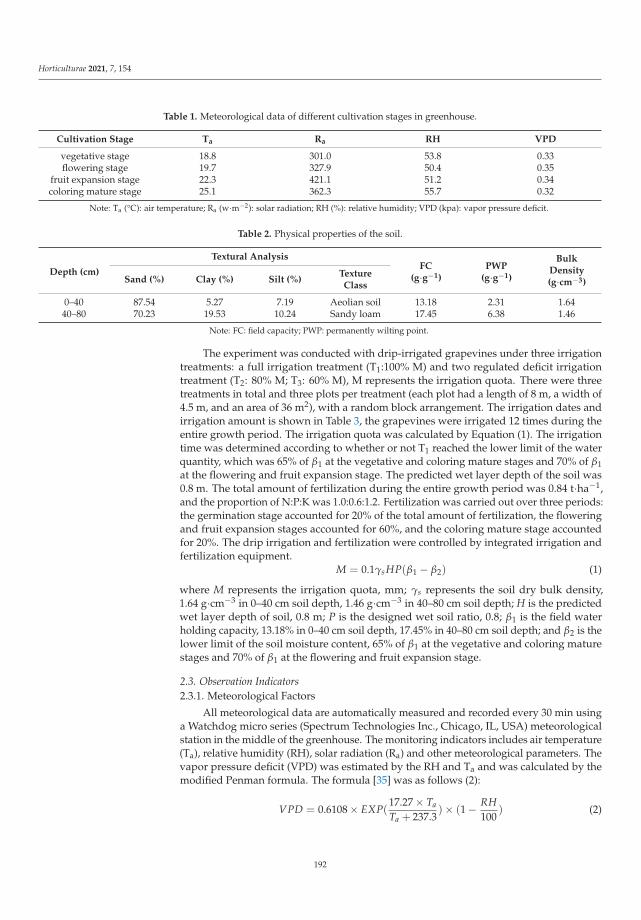
Horticulturae 2021, 7, 154
Table 1. Meteorological data of different cultivation stages in greenhouse.
Cultivation Stage Ta Ra RH VPD
vegetative stage 18.8 301.0 53.8 0.33flowering stage 19.7 327.9 50.4 0.35
fruit expansion stage 22.3 421.1 51.2 0.34coloring mature stage 25.1 362.3 55.7 0.32
Note: Ta (°C): air temperature; Ra (w·m−2): solar radiation; RH (%): relative humidity; VPD (kpa): vapor pressure deficit.
Table 2. Physical properties of the soil.
Depth (cm)
Textural AnalysisFC
(g·g−1)PWP
(g·g−1)
BulkDensity(g·cm−3)Sand (%) Clay (%) Silt (%)
TextureClass
0–40 87.54 5.27 7.19 Aeolian soil 13.18 2.31 1.6440–80 70.23 19.53 10.24 Sandy loam 17.45 6.38 1.46
Note: FC: field capacity; PWP: permanently wilting point.
The experiment was conducted with drip-irrigated grapevines under three irrigationtreatments: a full irrigation treatment (T1:100% M) and two regulated deficit irrigationtreatment (T2: 80% M; T3: 60% M), M represents the irrigation quota. There were threetreatments in total and three plots per treatment (each plot had a length of 8 m, a width of4.5 m, and an area of 36 m2), with a random block arrangement. The irrigation dates andirrigation amount is shown in Table 3, the grapevines were irrigated 12 times during theentire growth period. The irrigation quota was calculated by Equation (1). The irrigationtime was determined according to whether or not T1 reached the lower limit of the waterquantity, which was 65% of β1 at the vegetative and coloring mature stages and 70% of β1at the flowering and fruit expansion stage. The predicted wet layer depth of the soil was0.8 m. The total amount of fertilization during the entire growth period was 0.84 t·ha−1,and the proportion of N:P:K was 1.0:0.6:1.2. Fertilization was carried out over three periods:the germination stage accounted for 20% of the total amount of fertilization, the floweringand fruit expansion stages accounted for 60%, and the coloring mature stage accountedfor 20%. The drip irrigation and fertilization were controlled by integrated irrigation andfertilization equipment.
M = 0.1γsHP(β1 − β2) (1)
where M represents the irrigation quota, mm; γs represents the soil dry bulk density,1.64 g·cm−3 in 0–40 cm soil depth, 1.46 g·cm−3 in 40–80 cm soil depth; H is the predictedwet layer depth of soil, 0.8 m; P is the designed wet soil ratio, 0.8; β1 is the field waterholding capacity, 13.18% in 0–40 cm soil depth, 17.45% in 40–80 cm soil depth; and β2 is thelower limit of the soil moisture content, 65% of β1 at the vegetative and coloring maturestages and 70% of β1 at the flowering and fruit expansion stage.
2.3. Observation Indicators2.3.1. Meteorological Factors
All meteorological data are automatically measured and recorded every 30 min usinga Watchdog micro series (Spectrum Technologies Inc., Chicago, IL, USA) meteorologicalstation in the middle of the greenhouse. The monitoring indicators includes air temperature(Ta), relative humidity (RH), solar radiation (Ra) and other meteorological parameters. Thevapor pressure deficit (VPD) was estimated by the RH and Ta and was calculated by themodified Penman formula. The formula [35] was as follows (2):
VPD = 0.6108 × EXP(17.27 × Ta
Ta + 237.3)× (1 − RH
100) (2)
192
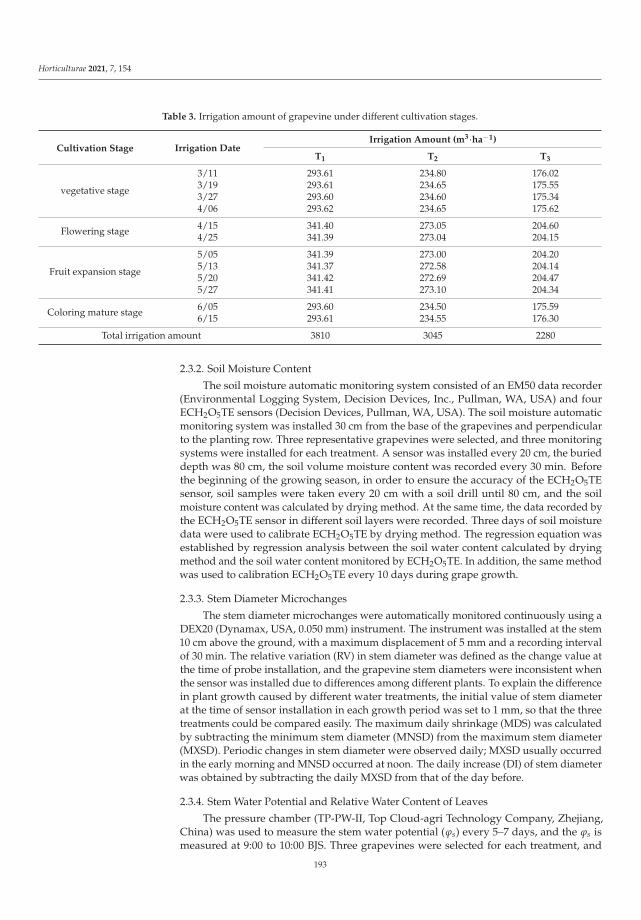
Horticulturae 2021, 7, 154
Table 3. Irrigation amount of grapevine under different cultivation stages.
Cultivation Stage Irrigation DateIrrigation Amount (m3·ha−1)
T1 T2 T3
vegetative stage
3/11 293.61 234.80 176.023/19 293.61 234.65 175.553/27 293.60 234.60 175.344/06 293.62 234.65 175.62
Flowering stage 4/15 341.40 273.05 204.604/25 341.39 273.04 204.15
Fruit expansion stage
5/05 341.39 273.00 204.205/13 341.37 272.58 204.145/20 341.42 272.69 204.475/27 341.41 273.10 204.34
Coloring mature stage 6/05 293.60 234.50 175.596/15 293.61 234.55 176.30
Total irrigation amount 3810 3045 2280
2.3.2. Soil Moisture Content
The soil moisture automatic monitoring system consisted of an EM50 data recorder(Environmental Logging System, Decision Devices, Inc., Pullman, WA, USA) and fourECH2O5TE sensors (Decision Devices, Pullman, WA, USA). The soil moisture automaticmonitoring system was installed 30 cm from the base of the grapevines and perpendicularto the planting row. Three representative grapevines were selected, and three monitoringsystems were installed for each treatment. A sensor was installed every 20 cm, the burieddepth was 80 cm, the soil volume moisture content was recorded every 30 min. Beforethe beginning of the growing season, in order to ensure the accuracy of the ECH2O5TEsensor, soil samples were taken every 20 cm with a soil drill until 80 cm, and the soilmoisture content was calculated by drying method. At the same time, the data recorded bythe ECH2O5TE sensor in different soil layers were recorded. Three days of soil moisturedata were used to calibrate ECH2O5TE by drying method. The regression equation wasestablished by regression analysis between the soil water content calculated by dryingmethod and the soil water content monitored by ECH2O5TE. In addition, the same methodwas used to calibration ECH2O5TE every 10 days during grape growth.
2.3.3. Stem Diameter Microchanges
The stem diameter microchanges were automatically monitored continuously using aDEX20 (Dynamax, USA, 0.050 mm) instrument. The instrument was installed at the stem10 cm above the ground, with a maximum displacement of 5 mm and a recording intervalof 30 min. The relative variation (RV) in stem diameter was defined as the change value atthe time of probe installation, and the grapevine stem diameters were inconsistent whenthe sensor was installed due to differences among different plants. To explain the differencein plant growth caused by different water treatments, the initial value of stem diameterat the time of sensor installation in each growth period was set to 1 mm, so that the threetreatments could be compared easily. The maximum daily shrinkage (MDS) was calculatedby subtracting the minimum stem diameter (MNSD) from the maximum stem diameter(MXSD). Periodic changes in stem diameter were observed daily; MXSD usually occurredin the early morning and MNSD occurred at noon. The daily increase (DI) of stem diameterwas obtained by subtracting the daily MXSD from that of the day before.
2.3.4. Stem Water Potential and Relative Water Content of Leaves
The pressure chamber (TP-PW-II, Top Cloud-agri Technology Company, Zhejiang,China) was used to measure the stem water potential (ϕs) every 5–7 days, and the ϕs ismeasured at 9:00 to 10:00 BJS. Three grapevines were selected for each treatment, and
193

Horticulturae 2021, 7, 154
one branch under good growth conditions was selected as the sample on the sunny sideoutside the crown. The sample was put into a plastic bag containing moist gauze andquickly brought into the laboratory. The sample was clamped in a pressure chamber andpressurized by gas (compressed nitrogen), the pressure used for exudation of tissue fluidwas observed. At this time, the pressure value was the stem water potential.
The relative water content (RWC) of leaves was determined by the drying method.The selection and determination of leaves were the same as those used for leaf waterpotential measurement. After weighing the fresh weight, the leaves were immersed inwater for 12 h and then taken out. The water on the surface of the leaves was wiped withabsorbent paper and weighed. Then, the leaves were immersed in water for 1 h, taken out,wiped dry and weighed until reaching a consistent weight. After 0.5 h of dehumidificationat 105 °C for 0.5 h, the leaves were dried to constant weight at 80 °C. Leaf relative watercontent (RWC) = (initial fresh weight − dry weight)/(saturated fresh weight − dry weight)× 100%.
2.3.5. Signal Intensity Calculation of Stem Diameter Indicator
The reference value is usually calculated by the stem diameter indicator under non-water stressed conditions or by substituting the meteorological indicator into the referenceequation [21]. The calculation formulas of SIMDS and SIDI are as follows:
SIMDS = Measured MDS/Reference MD (3)
SIDI = Measured DI/Reference DI (4)
In this study, the regression equation between the MDS and DI of stem diameterand meteorological factors showed that the correlation between the MDS and DI of threetreatments and Ta was the best. The soil moisture of the W1 treatment always remainedabove 65% of the field capacity at the vegetative and mature stages and 70% of the fieldcapacity at the flowering stage and fruit expansion stage. The reference equation for stemdiameter was established between the MDS and DI values of the W1 and Ta to calculatethe reference value of MDS and DI for each growth stage.
2.3.6. Flexible Evaluation of Signal Intensity
High variability indicators need to be measured many times to reduce error, whichincreases the costs of such methods. Therefore, the intensity and variability (coefficientof variance, CV) of indicators should also be considered. When soil moisture changes,the ratio of signal intensity (SI) to noise is greater in the short term, indicating that theindicator is more suitable for moisture status diagnosis [36]. The formula for calculatingthe signal-to-noise ratio is shown in formula (5).
Signal-to-noise ratio = signal intensity/coefficient of variation (5)
2.4. Data Analysis
The correlation and regression analysis were carried out using SPSS 21.0 software(SPSS Inc., Chicago, IL, USA). Multiple comparisons were performed by least significantdifference tests, with a significance level of 0.05. Microsoft Excel 2010 Software wasused for processing data. The graphs were created by using Origin 2018. Correlationanalysis was conducted between MDS, DI, SIDI, SIMDS and meteorological factors; Therelationships between MDS, DI, SIDI, SIMDS and SWP, RWC as well as between MDS,DI, SIDI, SIMDS and soil water content were analyzed through regression analyses. In allcases, the coefficient of determination (R2) was used to assess the goodness of fit of theassociations among variables.
194
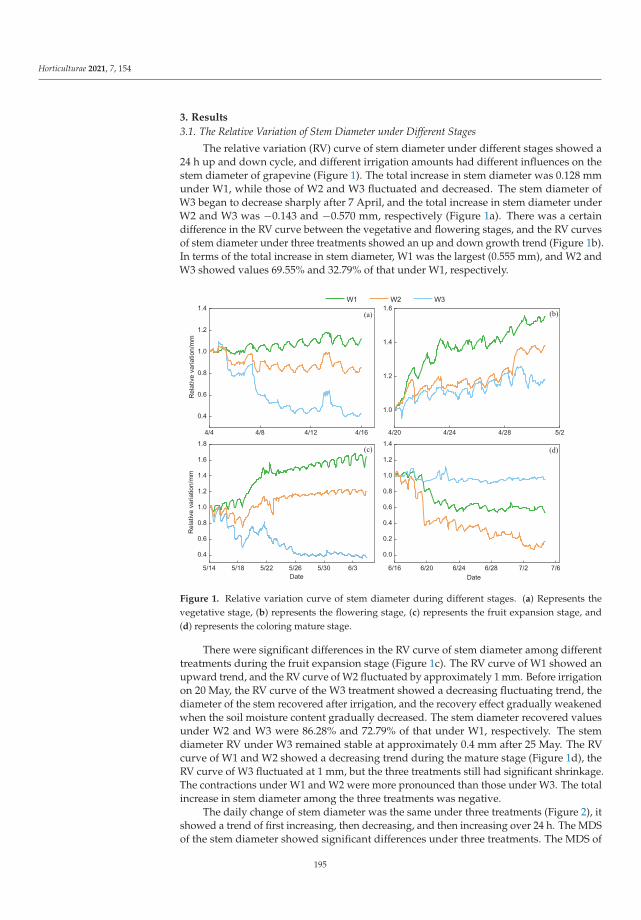
Horticulturae 2021, 7, 154
3. Results
3.1. The Relative Variation of Stem Diameter under Different Stages
The relative variation (RV) curve of stem diameter under different stages showed a24 h up and down cycle, and different irrigation amounts had different influences on thestem diameter of grapevine (Figure 1). The total increase in stem diameter was 0.128 mmunder W1, while those of W2 and W3 fluctuated and decreased. The stem diameter ofW3 began to decrease sharply after 7 April, and the total increase in stem diameter underW2 and W3 was −0.143 and −0.570 mm, respectively (Figure 1a). There was a certaindifference in the RV curve between the vegetative and flowering stages, and the RV curvesof stem diameter under three treatments showed an up and down growth trend (Figure 1b).In terms of the total increase in stem diameter, W1 was the largest (0.555 mm), and W2 andW3 showed values 69.55% and 32.79% of that under W1, respectively.
Figure 1. Relative variation curve of stem diameter during different stages. (a) Represents thevegetative stage, (b) represents the flowering stage, (c) represents the fruit expansion stage, and(d) represents the coloring mature stage.
There were significant differences in the RV curve of stem diameter among differenttreatments during the fruit expansion stage (Figure 1c). The RV curve of W1 showed anupward trend, and the RV curve of W2 fluctuated by approximately 1 mm. Before irrigationon 20 May, the RV curve of the W3 treatment showed a decreasing fluctuating trend, thediameter of the stem recovered after irrigation, and the recovery effect gradually weakenedwhen the soil moisture content gradually decreased. The stem diameter recovered valuesunder W2 and W3 were 86.28% and 72.79% of that under W1, respectively. The stemdiameter RV under W3 remained stable at approximately 0.4 mm after 25 May. The RVcurve of W1 and W2 showed a decreasing trend during the mature stage (Figure 1d), theRV curve of W3 fluctuated at 1 mm, but the three treatments still had significant shrinkage.The contractions under W1 and W2 were more pronounced than those under W3. The totalincrease in stem diameter among the three treatments was negative.
The daily change of stem diameter was the same under three treatments (Figure 2), itshowed a trend of first increasing, then decreasing, and then increasing over 24 h. The MDSof the stem diameter showed significant differences under three treatments. The MDS of
195
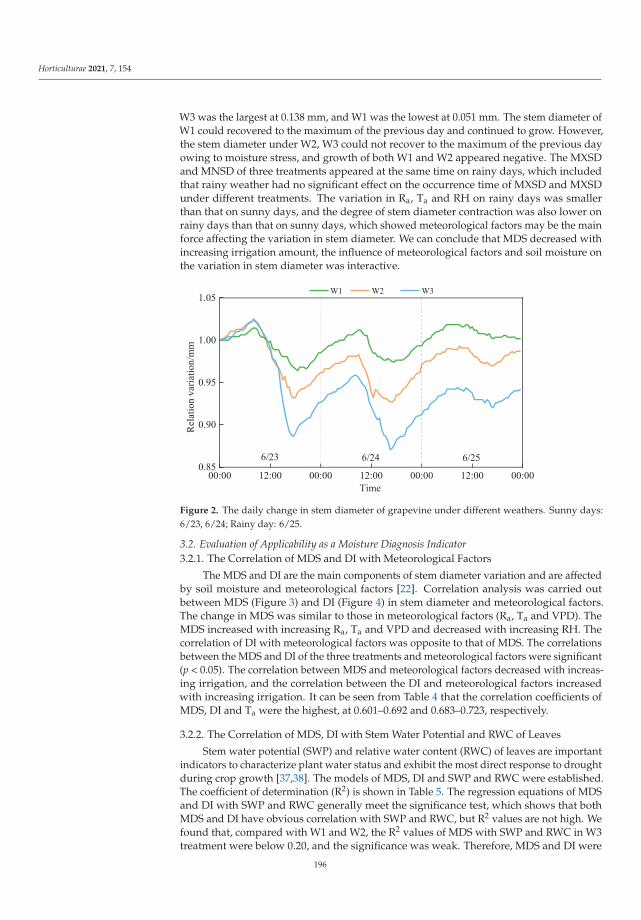
Horticulturae 2021, 7, 154
W3 was the largest at 0.138 mm, and W1 was the lowest at 0.051 mm. The stem diameter ofW1 could recovered to the maximum of the previous day and continued to grow. However,the stem diameter under W2, W3 could not recover to the maximum of the previous dayowing to moisture stress, and growth of both W1 and W2 appeared negative. The MXSDand MNSD of three treatments appeared at the same time on rainy days, which includedthat rainy weather had no significant effect on the occurrence time of MXSD and MXSDunder different treatments. The variation in Ra, Ta and RH on rainy days was smallerthan that on sunny days, and the degree of stem diameter contraction was also lower onrainy days than that on sunny days, which showed meteorological factors may be the mainforce affecting the variation in stem diameter. We can conclude that MDS decreased withincreasing irrigation amount, the influence of meteorological factors and soil moisture onthe variation in stem diameter was interactive.
Figure 2. The daily change in stem diameter of grapevine under different weathers. Sunny days:6/23, 6/24; Rainy day: 6/25.
3.2. Evaluation of Applicability as a Moisture Diagnosis Indicator3.2.1. The Correlation of MDS and DI with Meteorological Factors
The MDS and DI are the main components of stem diameter variation and are affectedby soil moisture and meteorological factors [22]. Correlation analysis was carried outbetween MDS (Figure 3) and DI (Figure 4) in stem diameter and meteorological factors.The change in MDS was similar to those in meteorological factors (Ra, Ta and VPD). TheMDS increased with increasing Ra, Ta and VPD and decreased with increasing RH. Thecorrelation of DI with meteorological factors was opposite to that of MDS. The correlationsbetween the MDS and DI of the three treatments and meteorological factors were significant(p < 0.05). The correlation between MDS and meteorological factors decreased with increas-ing irrigation, and the correlation between the DI and meteorological factors increasedwith increasing irrigation. It can be seen from Table 4 that the correlation coefficients ofMDS, DI and Ta were the highest, at 0.601–0.692 and 0.683–0.723, respectively.
3.2.2. The Correlation of MDS, DI with Stem Water Potential and RWC of Leaves
Stem water potential (SWP) and relative water content (RWC) of leaves are importantindicators to characterize plant water status and exhibit the most direct response to droughtduring crop growth [37,38]. The models of MDS, DI and SWP and RWC were established.The coefficient of determination (R2) is shown in Table 5. The regression equations of MDSand DI with SWP and RWC generally meet the significance test, which shows that bothMDS and DI have obvious correlation with SWP and RWC, but R2 values are not high. Wefound that, compared with W1 and W2, the R2 values of MDS with SWP and RWC in W3treatment were below 0.20, and the significance was weak. Therefore, MDS and DI were
196
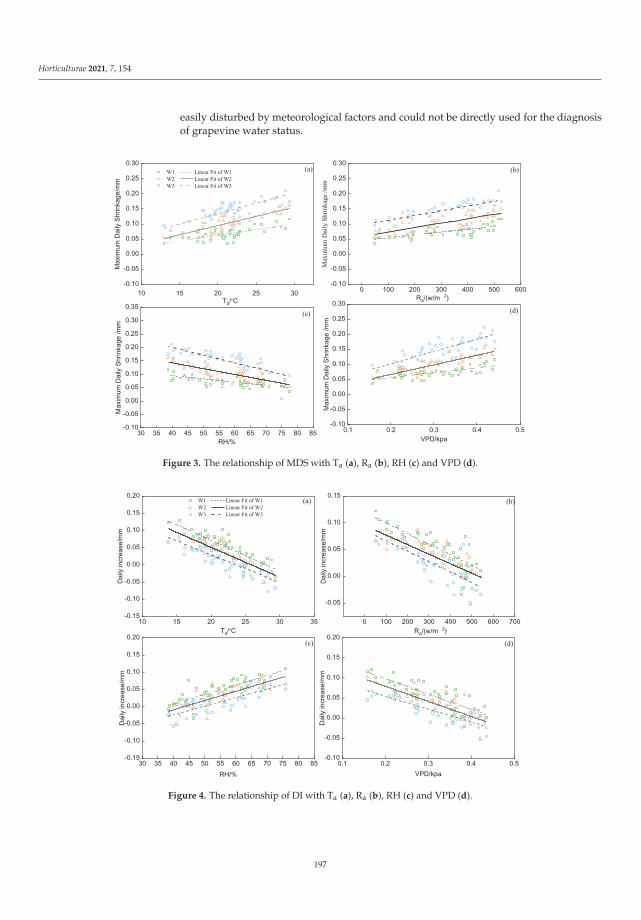
Horticulturae 2021, 7, 154
easily disturbed by meteorological factors and could not be directly used for the diagnosisof grapevine water status.
°
(a) (b)
(c) (d)
Figure 3. The relationship of MDS with Ta (a), Ra (b), RH (c) and VPD (d).
°
Figure 4. The relationship of DI with Ta (a), Ra (b), RH (c) and VPD (d).
197
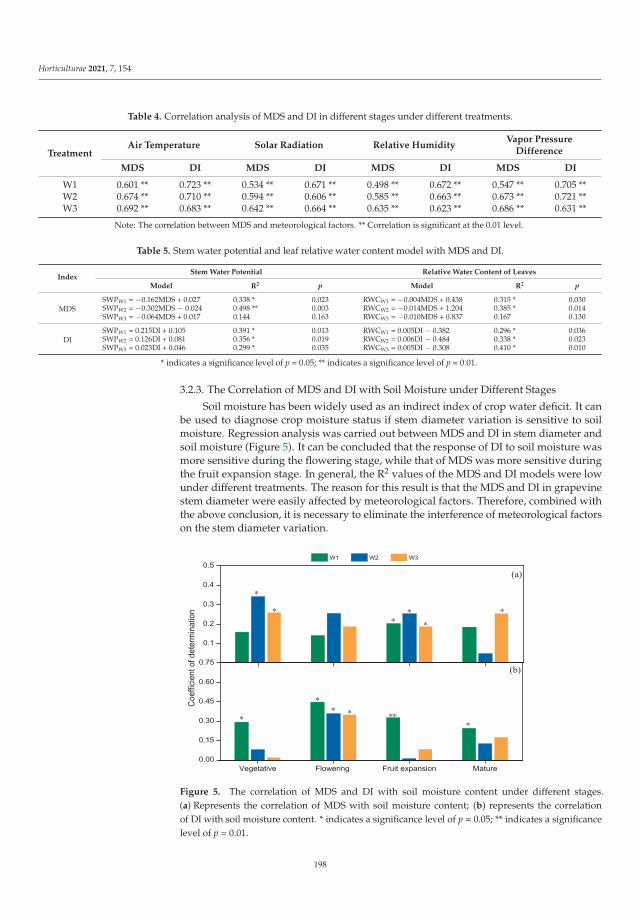
Horticulturae 2021, 7, 154
Table 4. Correlation analysis of MDS and DI in different stages under different treatments.
TreatmentAir Temperature Solar Radiation Relative Humidity
Vapor PressureDifference
MDS DI MDS DI MDS DI MDS DI
W1 0.601 ** 0.723 ** 0.534 ** 0.671 ** 0.498 ** 0.672 ** 0.547 ** 0.705 **W2 0.674 ** 0.710 ** 0.594 ** 0.606 ** 0.585 ** 0.663 ** 0.673 ** 0.721 **W3 0.692 ** 0.683 ** 0.642 ** 0.664 ** 0.635 ** 0.623 ** 0.686 ** 0.631 **
Note: The correlation between MDS and meteorological factors. ** Correlation is significant at the 0.01 level.
Table 5. Stem water potential and leaf relative water content model with MDS and DI.
IndexStem Water Potential Relative Water Content of Leaves
Model R2 p Model R2 p
MDSSWPW1 = −0.162MDS + 0.027 0.338 * 0.023 RWCW1 = −0.004MDS + 0.438 0.315 * 0.030SWPW2 = −0.302MDS − 0.024 0.498 ** 0.003 RWCW2 = −0.014MDS + 1.204 0.385 * 0.014SWPW3 = −0.064MDS + 0.017 0.144 0.163 RWCW3 = −0.010MDS + 0.837 0.167 0.130
DISWPW1 = 0.215DI + 0.105 0.391 * 0.013 RWCW1 = 0.005DI − 0.382 0.296 * 0.036SWPW2 = 0.126DI + 0.081 0.356 * 0.019 RWCW2 = 0.006DI − 0.484 0.338 * 0.023SWPW3 = 0.023DI + 0.046 0.299 * 0.035 RWCW3 = 0.005DI − 0.308 0.410 * 0.010
* indicates a significance level of p = 0.05; ** indicates a significance level of p = 0.01.
3.2.3. The Correlation of MDS and DI with Soil Moisture under Different Stages
Soil moisture has been widely used as an indirect index of crop water deficit. It canbe used to diagnose crop moisture status if stem diameter variation is sensitive to soilmoisture. Regression analysis was carried out between MDS and DI in stem diameter andsoil moisture (Figure 5). It can be concluded that the response of DI to soil moisture wasmore sensitive during the flowering stage, while that of MDS was more sensitive duringthe fruit expansion stage. In general, the R2 values of the MDS and DI models were lowunder different treatments. The reason for this result is that the MDS and DI in grapevinestem diameter were easily affected by meteorological factors. Therefore, combined withthe above conclusion, it is necessary to eliminate the interference of meteorological factorson the stem diameter variation.
Figure 5. The correlation of MDS and DI with soil moisture content under different stages.(a) Represents the correlation of MDS with soil moisture content; (b) represents the correlationof DI with soil moisture content. * indicates a significance level of p = 0.05; ** indicates a significancelevel of p = 0.01.
198
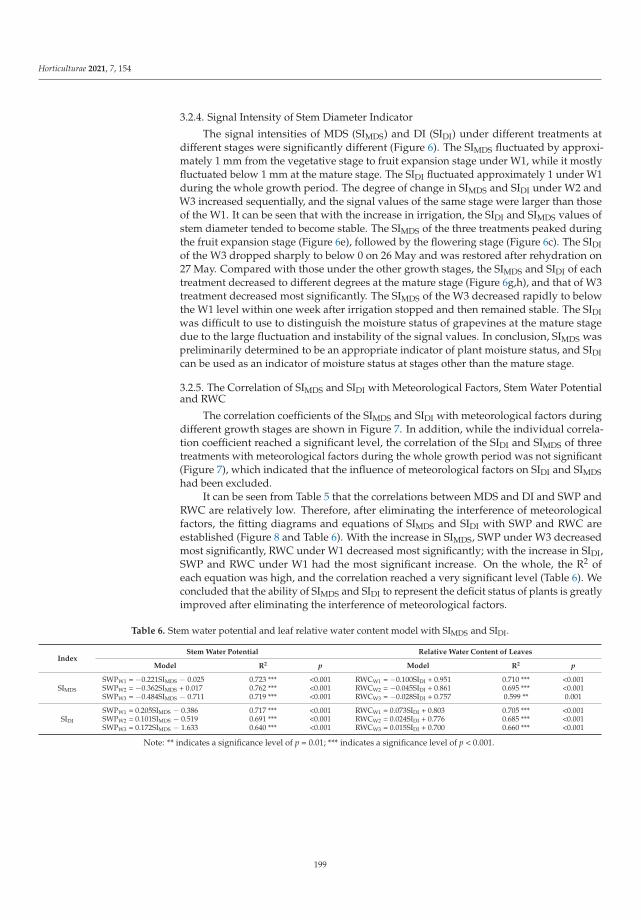
Horticulturae 2021, 7, 154
3.2.4. Signal Intensity of Stem Diameter Indicator
The signal intensities of MDS (SIMDS) and DI (SIDI) under different treatments atdifferent stages were significantly different (Figure 6). The SIMDS fluctuated by approxi-mately 1 mm from the vegetative stage to fruit expansion stage under W1, while it mostlyfluctuated below 1 mm at the mature stage. The SIDI fluctuated approximately 1 under W1during the whole growth period. The degree of change in SIMDS and SIDI under W2 andW3 increased sequentially, and the signal values of the same stage were larger than thoseof the W1. It can be seen that with the increase in irrigation, the SIDI and SIMDS values ofstem diameter tended to become stable. The SIMDS of the three treatments peaked duringthe fruit expansion stage (Figure 6e), followed by the flowering stage (Figure 6c). The SIDIof the W3 dropped sharply to below 0 on 26 May and was restored after rehydration on27 May. Compared with those under the other growth stages, the SIMDS and SIDI of eachtreatment decreased to different degrees at the mature stage (Figure 6g,h), and that of W3treatment decreased most significantly. The SIMDS of the W3 decreased rapidly to belowthe W1 level within one week after irrigation stopped and then remained stable. The SIDIwas difficult to use to distinguish the moisture status of grapevines at the mature stagedue to the large fluctuation and instability of the signal values. In conclusion, SIMDS waspreliminarily determined to be an appropriate indicator of plant moisture status, and SIDIcan be used as an indicator of moisture status at stages other than the mature stage.
3.2.5. The Correlation of SIMDS and SIDI with Meteorological Factors, Stem Water Potentialand RWC
The correlation coefficients of the SIMDS and SIDI with meteorological factors duringdifferent growth stages are shown in Figure 7. In addition, while the individual correla-tion coefficient reached a significant level, the correlation of the SIDI and SIMDS of threetreatments with meteorological factors during the whole growth period was not significant(Figure 7), which indicated that the influence of meteorological factors on SIDI and SIMDShad been excluded.
It can be seen from Table 5 that the correlations between MDS and DI and SWP andRWC are relatively low. Therefore, after eliminating the interference of meteorologicalfactors, the fitting diagrams and equations of SIMDS and SIDI with SWP and RWC areestablished (Figure 8 and Table 6). With the increase in SIMDS, SWP under W3 decreasedmost significantly, RWC under W1 decreased most significantly; with the increase in SIDI,SWP and RWC under W1 had the most significant increase. On the whole, the R2 ofeach equation was high, and the correlation reached a very significant level (Table 6). Weconcluded that the ability of SIMDS and SIDI to represent the deficit status of plants is greatlyimproved after eliminating the interference of meteorological factors.
Table 6. Stem water potential and leaf relative water content model with SIMDS and SIDI.
IndexStem Water Potential Relative Water Content of Leaves
Model R2 p Model R2 p
SIMDS
SWPW1 = −0.221SIMDS − 0.025 0.723 *** <0.001 RWCW1 = −0.100SIDI + 0.951 0.710 *** <0.001SWPW2 = −0.362SIMDS + 0.017 0.762 *** <0.001 RWCW2 = −0.045SIDI + 0.861 0.695 *** <0.001SWPW3 = −0.484SIMDS − 0.711 0.719 *** <0.001 RWCW3 = −0.028SIDI + 0.757 0.599 ** 0.001
SIDI
SWPW1 = 0.205SIMDS − 0.386 0.717 *** <0.001 RWCW1 = 0.073SIDI + 0.803 0.705 *** <0.001SWPW2 = 0.101SIMDS − 0.519 0.691 *** <0.001 RWCW2 = 0.024SIDI + 0.776 0.685 *** <0.001SWPW3 = 0.172SIMDS − 1.633 0.640 *** <0.001 RWCW3 = 0.015SIDI + 0.700 0.660 *** <0.001
Note: ** indicates a significance level of p = 0.01; *** indicates a significance level of p < 0.001.
199
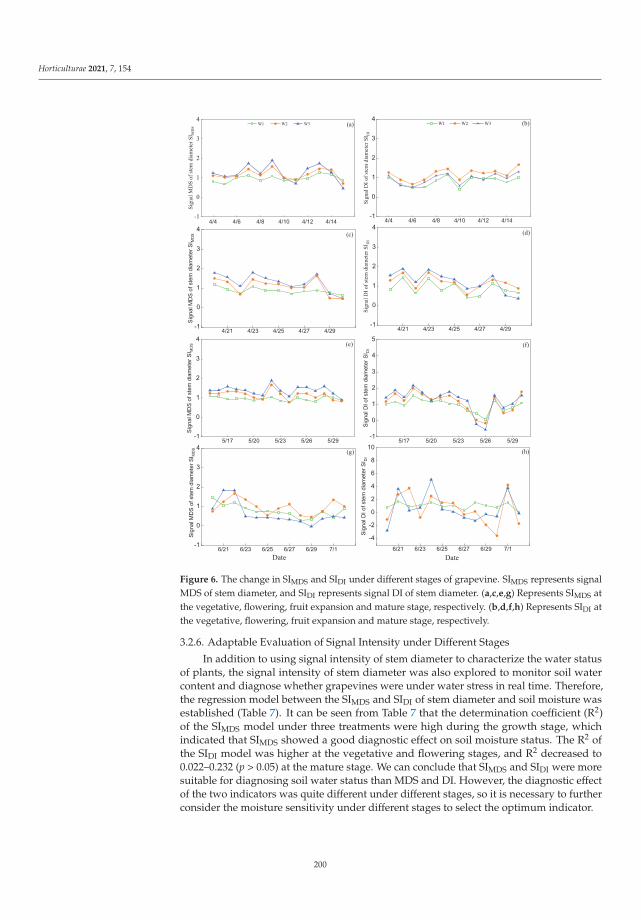
Horticulturae 2021, 7, 154
(a) (b)
(c) (d)
(e)
Date
(f)
(g) (h)
Date
Figure 6. The change in SIMDS and SIDI under different stages of grapevine. SIMDS represents signalMDS of stem diameter, and SIDI represents signal DI of stem diameter. (a,c,e,g) Represents SIMDS atthe vegetative, flowering, fruit expansion and mature stage, respectively. (b,d,f,h) Represents SIDI atthe vegetative, flowering, fruit expansion and mature stage, respectively.
3.2.6. Adaptable Evaluation of Signal Intensity under Different Stages
In addition to using signal intensity of stem diameter to characterize the water statusof plants, the signal intensity of stem diameter was also explored to monitor soil watercontent and diagnose whether grapevines were under water stress in real time. Therefore,the regression model between the SIMDS and SIDI of stem diameter and soil moisture wasestablished (Table 7). It can be seen from Table 7 that the determination coefficient (R2)of the SIMDS model under three treatments were high during the growth stage, whichindicated that SIMDS showed a good diagnostic effect on soil moisture status. The R2 ofthe SIDI model was higher at the vegetative and flowering stages, and R2 decreased to0.022–0.232 (p > 0.05) at the mature stage. We can conclude that SIMDS and SIDI were moresuitable for diagnosing soil water status than MDS and DI. However, the diagnostic effectof the two indicators was quite different under different stages, so it is necessary to furtherconsider the moisture sensitivity under different stages to select the optimum indicator.
200
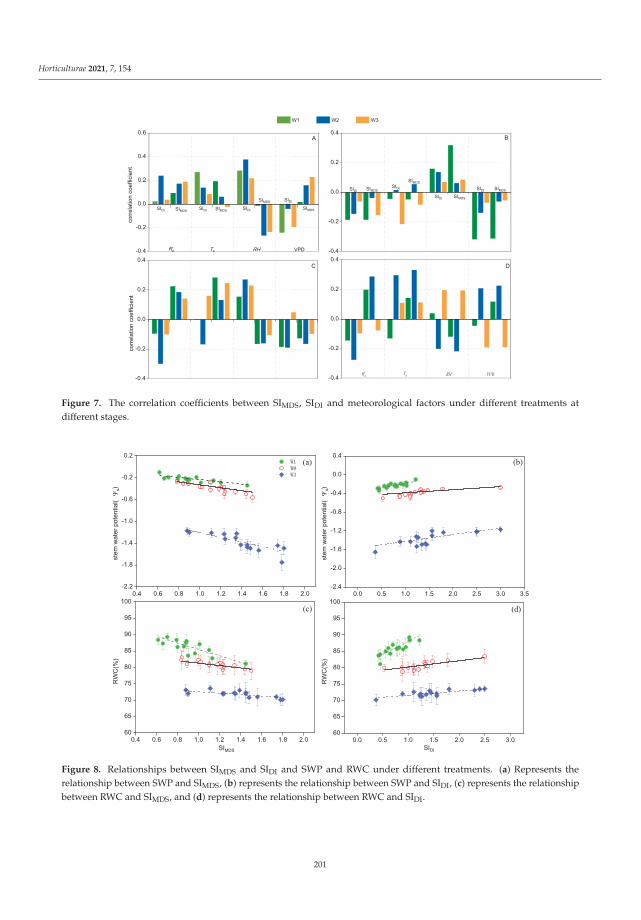
Horticulturae 2021, 7, 154
Figure 7. The correlation coefficients between SIMDS, SIDI and meteorological factors under different treatments atdifferent stages.
(a) (b)
(c) (d)
Figure 8. Relationships between SIMDS and SIDI and SWP and RWC under different treatments. (a) Represents therelationship between SWP and SIMDS, (b) represents the relationship between SWP and SIDI, (c) represents the relationshipbetween RWC and SIMDS, and (d) represents the relationship between RWC and SIDI.
201

Horticulturae 2021, 7, 154
Table 7. The model of SIDI and SIMDS with soil water content at different growth stages.
Stage Treatment SIMDS R2 p SIDI R2 p
Vegetative stageW1 SIMDS = −39.485θ + 6.304 0.688 *** <0.001 SIDI = 39.961θ − 4.286 0.739 *** <0.001W2 SIMDS = −36.246θ + 5.848 0.566 *** <0.001 SIDI = 187.96θ − 22.077 0.448 * 0.023W3 SIMDS = −53.413θ + 7.639 0.358 0.067 SIDI = 162.48θ − 19.697 0.451 * 0.019
Flowering stageW1 SIMDS = −45.420θ + 7.095 0.514 *** <0.001 SIDI = 83.604θ − 9.626 0.631 *** <0.001W2 SIMDS = −37.140θ + 5.382 0.652 *** <0.001 SIDI = 72.731θ − 7.0531 0.762 *** <0.001W3 SIMDS= −18.224θ + 3.042 0.565 *** <0.001 SIDI = 137.85θ − 14.041 0.676 *** <0.001
Fruit expansion stageW1 SIMDS = −37.788θ + 5.795 0.589 *** <0.001 SIDI = 37.116θ − 3.687 0.389 * 0.038W2 SIMDS = −34.848θ + 4.983 0.560 *** <0.001 SIDI = 27.010θ − 3.140 0.313 0.087W3 SIMDS = −53.532θ − 8.870 0.575 *** <0.001 SIDI = 74.046θ − 8.738 0.495 * 0.016
Mature stageW1 SIMDS = −13.717θ + 2.259 0.409 * 0.027 SIDI = 80.714θ − 7.368 0.022 0.433W2 SIMDS = −94.494θ + 12.967 0.621 *** <0.001 SIDI = 143.48θ − 15.637 0.148 0.121W3 SIMDS = −18.736θ+ 2.387 0.646 *** <0.001 SIDI = 146.91θ − 16.031 0.232 0.885
Note: θ represents the soil moisture content. * indicates a significance level of P0.05; *** indicates a significance level of p < 0.001.
The signal intensity of MDS and DI (SIMDS, SIDI) and the coefficient of variation ofsignal intensity under different stages are shown in Figure 9. The signal-to-noise ratio ofSIMDS and SIDI under different treatments at different stages can be seen in Figure 10. TheSIMDS and SIDI increased first and then decreased over the whole growth stage (Figure 9).We found that the average values of SIMDS and SIDI under different treatments were similarat the vegetative stage, but the variability of SIMDS was greater than that of SIDI (Figure 10),so SIDI was a more suitable diagnostic indicator of grapevine water status and soil waterstatus during the vegetative stage. The average signal intensity, sensitivity and signal-to-noise ratio were similar at the flowering stage, but SIDI had a better correlation with soilmoisture at the flowering stage (Table 7); thus, SIDI should be selected as the diagnosticindicator of grapevine water status and soil water status at the flowering stage. The signal-to-noise ratio of SIMDS during the fruit expansion and the mature stages was higher thanthose of SIDI (Figure 10), and the sensitivity of SIMDS to soil moisture was better than thatof SIDI. Therefore, SIMDS was selected as the most suitable indicator of grapevine waterstatus and soil water status during the fruit expansion and the mature stages.
Figure 9. The average value of SIMDS and SIDI and coefficient of variation of signal strength underdifferent growth stages. (a) Represents the vegetative stage, (b) represents the flowering stage,(c) represents the fruit expansion stage, and (d) represents the mature stage. Different lowercaseletters indicate that there is a statistical difference at P0.05 under different treatments.
202

Horticulturae 2021, 7, 154
a
b
c
a
b
c
(d)(c)
(b)
b
c
a
a
a
b
bc
c
a
a
b
a
SIDISIMDSSIDI
bc
c
a
c
b
a
SIMDS
(a)
Figure 10. The signal-to-noise ratio of SIMDS and SIDI under different treatments at differentstages. (a) Represents the vegetative stage, (b) represents the flowering stage, (c) represents the fruitexpansion stage, and (d) represents the mature stage. Different lowercase letters indicate that there isa statistical difference of signal-to-noise ratio at P0.05 in the same column.
4. Discussion
4.1. Relative Variation in Grapevine Stem Diameter
To achieve sustainable water use and efficient cultivation of crops, the moisturecondition of crops is an important factor. Under both high and low soil moisture conditions,the grapevine stems shrunk in the daytime and recovered or expanded at night, and themicrochange in stem diameter was closely related to the water status of the plant [39,40].The present study showed that the stem diameter under the W3 treatment began to decreasesharply after 7 April, and the total increase in stem diameter was −0.570 mm. Because thegrowth of new shoots mainly depends on the absorption of soil moisture and nutrients bythe root system and transport of these nutrients to the new shoots, the soil moisture underthe W3 treatment was low. When transpiration stopped at night, the moisture absorbed bythe root system was not sufficient to make up for the transpiration loss during the day, sothe increase in stem diameter stopped or stems even exhibited negative growth, similar tothe results of Xiong [41].
The difference in the MDS among the three treatments was not significant during thevegetative and flowering stages. The reason for this phenomenon is that the rapid growthrate conceals the short-term variation in stem diameter caused by water deficit, whichindicates that MDS is not a suitable indicator of moisture status during early grapevinedevelopment [42]. During the mature stage, the growth of the stems slowed with theseasonal process. At the fruit growth stage, the stems also ceased growth or shrunk withoutwater stress [43,44]. The results showed that the relative variations in stem diameter amongthe three treatments decreased gradually, similar to the results of Intrigliolo and Castel [44]and Girón et al. [44]. With the increase in water stress, the MDS under the W3 treatmentwas the lowest at the flowering and fruit expansion stages. This effect may be the result ofthe combination of the degree of water stress on the plant and the ability of the tissue tohold water against the water potential gradient [12]. Further research is needed to moreaccurately explain these findings.
4.2. The Correlations of MDS and DI with Meteorological Factors
Numerous studies have shown that MDS is sensitive to soil and plant moisturestatus, and this measure has been applied in production as a key indicator to guide fruittree irrigation [31,45–47]. The DI reflects the growth rate of the stem, which is affectedby the water supply in the root zone and the intensity of transpiration. The DI is also
203
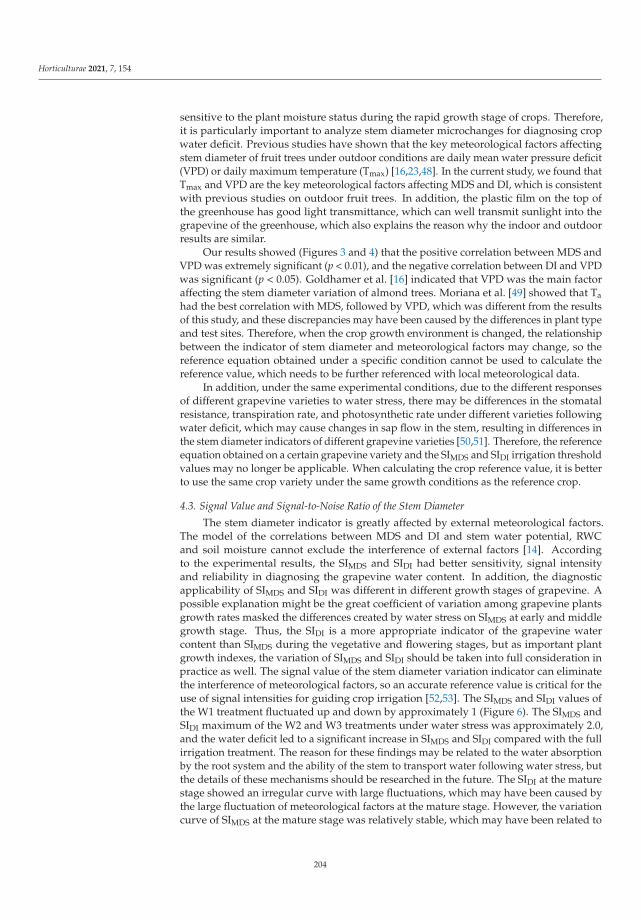
Horticulturae 2021, 7, 154
sensitive to the plant moisture status during the rapid growth stage of crops. Therefore,it is particularly important to analyze stem diameter microchanges for diagnosing cropwater deficit. Previous studies have shown that the key meteorological factors affectingstem diameter of fruit trees under outdoor conditions are daily mean water pressure deficit(VPD) or daily maximum temperature (Tmax) [16,23,48]. In the current study, we found thatTmax and VPD are the key meteorological factors affecting MDS and DI, which is consistentwith previous studies on outdoor fruit trees. In addition, the plastic film on the top ofthe greenhouse has good light transmittance, which can well transmit sunlight into thegrapevine of the greenhouse, which also explains the reason why the indoor and outdoorresults are similar.
Our results showed (Figures 3 and 4) that the positive correlation between MDS andVPD was extremely significant (p < 0.01), and the negative correlation between DI and VPDwas significant (p < 0.05). Goldhamer et al. [16] indicated that VPD was the main factoraffecting the stem diameter variation of almond trees. Moriana et al. [49] showed that Tahad the best correlation with MDS, followed by VPD, which was different from the resultsof this study, and these discrepancies may have been caused by the differences in plant typeand test sites. Therefore, when the crop growth environment is changed, the relationshipbetween the indicator of stem diameter and meteorological factors may change, so thereference equation obtained under a specific condition cannot be used to calculate thereference value, which needs to be further referenced with local meteorological data.
In addition, under the same experimental conditions, due to the different responsesof different grapevine varieties to water stress, there may be differences in the stomatalresistance, transpiration rate, and photosynthetic rate under different varieties followingwater deficit, which may cause changes in sap flow in the stem, resulting in differences inthe stem diameter indicators of different grapevine varieties [50,51]. Therefore, the referenceequation obtained on a certain grapevine variety and the SIMDS and SIDI irrigation thresholdvalues may no longer be applicable. When calculating the crop reference value, it is betterto use the same crop variety under the same growth conditions as the reference crop.
4.3. Signal Value and Signal-to-Noise Ratio of the Stem Diameter
The stem diameter indicator is greatly affected by external meteorological factors.The model of the correlations between MDS and DI and stem water potential, RWCand soil moisture cannot exclude the interference of external factors [14]. Accordingto the experimental results, the SIMDS and SIDI had better sensitivity, signal intensityand reliability in diagnosing the grapevine water content. In addition, the diagnosticapplicability of SIMDS and SIDI was different in different growth stages of grapevine. Apossible explanation might be the great coefficient of variation among grapevine plantsgrowth rates masked the differences created by water stress on SIMDS at early and middlegrowth stage. Thus, the SIDI is a more appropriate indicator of the grapevine watercontent than SIMDS during the vegetative and flowering stages, but as important plantgrowth indexes, the variation of SIMDS and SIDI should be taken into full consideration inpractice as well. The signal value of the stem diameter variation indicator can eliminatethe interference of meteorological factors, so an accurate reference value is critical for theuse of signal intensities for guiding crop irrigation [52,53]. The SIMDS and SIDI values ofthe W1 treatment fluctuated up and down by approximately 1 (Figure 6). The SIMDS andSIDI maximum of the W2 and W3 treatments under water stress was approximately 2.0,and the water deficit led to a significant increase in SIMDS and SIDI compared with the fullirrigation treatment. The reason for these findings may be related to the water absorptionby the root system and the ability of the stem to transport water following water stress, butthe details of these mechanisms should be researched in the future. The SIDI at the maturestage showed an irregular curve with large fluctuations, which may have been caused bythe large fluctuation of meteorological factors at the mature stage. However, the variationcurve of SIMDS at the mature stage was relatively stable, which may have been related to
204
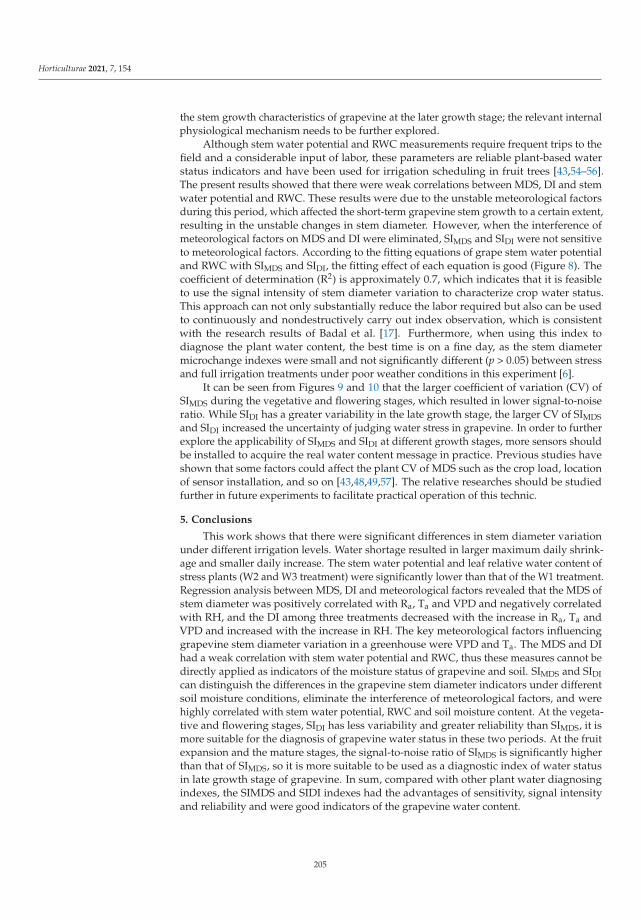
Horticulturae 2021, 7, 154
the stem growth characteristics of grapevine at the later growth stage; the relevant internalphysiological mechanism needs to be further explored.
Although stem water potential and RWC measurements require frequent trips to thefield and a considerable input of labor, these parameters are reliable plant-based waterstatus indicators and have been used for irrigation scheduling in fruit trees [43,54–56].The present results showed that there were weak correlations between MDS, DI and stemwater potential and RWC. These results were due to the unstable meteorological factorsduring this period, which affected the short-term grapevine stem growth to a certain extent,resulting in the unstable changes in stem diameter. However, when the interference ofmeteorological factors on MDS and DI were eliminated, SIMDS and SIDI were not sensitiveto meteorological factors. According to the fitting equations of grape stem water potentialand RWC with SIMDS and SIDI, the fitting effect of each equation is good (Figure 8). Thecoefficient of determination (R2) is approximately 0.7, which indicates that it is feasibleto use the signal intensity of stem diameter variation to characterize crop water status.This approach can not only substantially reduce the labor required but also can be usedto continuously and nondestructively carry out index observation, which is consistentwith the research results of Badal et al. [17]. Furthermore, when using this index todiagnose the plant water content, the best time is on a fine day, as the stem diametermicrochange indexes were small and not significantly different (p > 0.05) between stressand full irrigation treatments under poor weather conditions in this experiment [6].
It can be seen from Figures 9 and 10 that the larger coefficient of variation (CV) ofSIMDS during the vegetative and flowering stages, which resulted in lower signal-to-noiseratio. While SIDI has a greater variability in the late growth stage, the larger CV of SIMDSand SIDI increased the uncertainty of judging water stress in grapevine. In order to furtherexplore the applicability of SIMDS and SIDI at different growth stages, more sensors shouldbe installed to acquire the real water content message in practice. Previous studies haveshown that some factors could affect the plant CV of MDS such as the crop load, locationof sensor installation, and so on [43,48,49,57]. The relative researches should be studiedfurther in future experiments to facilitate practical operation of this technic.
5. Conclusions
This work shows that there were significant differences in stem diameter variationunder different irrigation levels. Water shortage resulted in larger maximum daily shrink-age and smaller daily increase. The stem water potential and leaf relative water content ofstress plants (W2 and W3 treatment) were significantly lower than that of the W1 treatment.Regression analysis between MDS, DI and meteorological factors revealed that the MDS ofstem diameter was positively correlated with Ra, Ta and VPD and negatively correlatedwith RH, and the DI among three treatments decreased with the increase in Ra, Ta andVPD and increased with the increase in RH. The key meteorological factors influencinggrapevine stem diameter variation in a greenhouse were VPD and Ta. The MDS and DIhad a weak correlation with stem water potential and RWC, thus these measures cannot bedirectly applied as indicators of the moisture status of grapevine and soil. SIMDS and SIDIcan distinguish the differences in the grapevine stem diameter indicators under differentsoil moisture conditions, eliminate the interference of meteorological factors, and werehighly correlated with stem water potential, RWC and soil moisture content. At the vegeta-tive and flowering stages, SIDI has less variability and greater reliability than SIMDS, it ismore suitable for the diagnosis of grapevine water status in these two periods. At the fruitexpansion and the mature stages, the signal-to-noise ratio of SIMDS is significantly higherthan that of SIMDS, so it is more suitable to be used as a diagnostic index of water statusin late growth stage of grapevine. In sum, compared with other plant water diagnosingindexes, the SIMDS and SIDI indexes had the advantages of sensitivity, signal intensityand reliability and were good indicators of the grapevine water content.
205
Horticulturae 2021, 7, 154
Author Contributions: C.R., X.H., W.W. and H.R. designed the experiments, C.R., Y.G. and T.S.performed research and date analysis, C.R. wrote the manuscript with contributions from all authors.All authors have read and agreed to the published version of the manuscript.
Funding: This work was supported by the National Key Research and Development Program ofChina (2017YFD0201508), the National Natural Science Foundation of China (51179163), Shaanxi KeyScience and Technology Innovation Team Project (2016KTZDNY-01–05).
Institutional Review Board Statement: Not applicable.
Informed Consent Statement: Not applicable.
Data Availability Statement: Data is available upon request to the corresponding author.
Acknowledgments: The authors would like to acknowledge all the team members of key Laboratoryof Agricultural Soil and Water Engineering in Arid and Semiarid Areas, Ministry of Education.
Conflicts of Interest: The authors declare that they have no conflict of interest.
References
1. Goodwin, I.; Boland, A.M. Scheduling deficit irrigation of fruit trees for optimizing water use efficiency. In Deficit IrrigationPractices, Water Reports; FAO: Quebec City, QC, Canada, 2002; Volume 22, p. 109.
2. Naor, A.; Gal, Y.; Peres, M. The inherent variability of water stress indicators in apple, nectarine and pear orchards, and thevalidity of a leaf-selection procedure for water potential measurements. Irrig. Sci. 2005, 24, 129–135. [CrossRef]
3. Jones, H.G. Irrigation scheduling: Advantages and pitfalls of plant-based methods. J. Exp. Bot. 2004, 407, 2427. [CrossRef]4. Fernández, J.E.; Cuevas, M.V. Irrigation scheduling from stem diameter variations: A review. Agric. For. Meteorol. 2010, 150,
135–151. [CrossRef]5. Argyrokastritis, I.G.; Papastylianou, P.T.; Alexandris, S. Leaf Water Potential and Crop Water Stress Index variation for full and
deficit irrigated cotton in Mediterranean conditions. Agric. Agric. Sci. Procedia 2015, 4, 463–470. [CrossRef]6. Wang, X.; Meng, Z.; Chang, X.; Deng, Z.; Li, Y.; Lv, M. Determination of a suitable indicator of tomato water content based on
stem diameter variation. Sci. Hortic. 2017, 215, 142–148. [CrossRef]7. Ojeda, H.; Deloire, A.; Carbonneau, A. Influence of water deficits on grape berry growth. Vitis 2001, 40, 141–145. [CrossRef]8. González-Fernández, A.B.; Rodríguez-Pérez, J.R.; Marcelo, V.; Valenciano, J.B. Using field spectrometry and a plant probe
accessory to determine leaf water content in commercial vineyards. Agric. Water Manag. 2015, 156, 43–50. [CrossRef]9. Gao, Y.; Qiu, J.W.; Miao, Y.L.; Qiu, R.C.; Li, H.; Zhang, M. Prediction of Leaf Water Content in Maize Seedlings Based on
Hyperspectral Information. IFAC-Pap. 2019, 52, 263–269. [CrossRef]10. Li, B.; Zhao, X.T.; Zhang, Y.; Zhang, S.J.; Luo, B. Prediction and monitoring of leaf water content in soybean plants using terahertz
time-domain spectroscopy. Comput. Electron. Agric. 2020, 170, 105239. [CrossRef]11. Jiménez, M.N.; Navarro, F.B.; Sánchez-Miranda, A.; Ripoll, M.A. Using stem diameter variations to detect and quantify growth
and relationships with climatic variables on a gradient of thinned Aleppo pines. For. Ecol. Manag. 2019, 442, 53–62. [CrossRef]12. Ortuño, M.F.; García-Orellana, Y.; Conejero, W.; Ruiz-Sanchez, M.C.; Mounzer, O.; Alarcon, J.J.; Torrecillas, A. Relationships
Between Climatic Variables and Sap Flow, Stem Water Potential and Maximum Daily Trunk Shrinkage in Lemon Trees. Plant Soil2006, 279, 229–242. [CrossRef]
13. Leperen, W.V.; Volkov, V.S.; Meeteren, U.V. Distribution of xylem hydraulic resistance in fruiting truss of tomato influenced bywater stress. J. Exp. Bot. 2003, 54, 317–324. [CrossRef]
14. Ortuño, M.F.; Conejero, W.; Moreno, F.; Moriana, A.; Intrigliolo, D.S.; Biel, C.; Mellisho, C.D.; Pérez-Pastor, A.; Domingo, R.;Ruiz-Sánchez, M.C.; et al. Could trunk diameter sensors be used in woody crops for irrigation scheduling? A review of currentknowledge and future perspectives. Agric. Water Manag. 2010, 97, 1–11. [CrossRef]
15. Schepper, V.D.; Dusschoten, D.V.; Copini, P.; Jahnke, S.; Steppe, K. MRI links stem water content to stem diameter variations intranspiring trees. J. Exp. Bot. 2012, 63, 2645–2653. [CrossRef]
16. Goldhamer, D.A.; Fereres, E. Irrigation scheduling of almond trees with trunk diameter sensors. Irrig. Sci. 2004, 23, 11–19.[CrossRef]
17. Badal, E.; Buesa, I.; Guerra, D.; Bonet, L.; Ferrer, P.; Intrigliolo, D.S. Maximum diurnal trunk shrinkage is a sensitive indicator ofplant water, stress in Diospyros kaki (Persimmon) trees. Agric. Water Manag. 2010, 98, 143–147. [CrossRef]
18. Doltra, J.; Oncins, J.A.; Bonany, J.; Cohen, M. Evaluation of plant-based water status indicators in mature apple trees under fieldconditions. Irrig. Sci. 2007, 25, 351–359. [CrossRef]
19. Velez, J.E.; Intrigliolo, D.S.; Castel, J.R. Scheduling deficit irrigation of citrus trees with maximum daily trunk shrinkage. Agric.Water Manag. 2007, 90, 197–204. [CrossRef]
20. Moriana, A.; Fereres, E. Plant indicators for scheduling irrigation of young olive trees. Irrig. Sci. 2002, 21, 83–90. [CrossRef]21. Fereres, E.; Goldhamer, D.A. Suitability of stem diameter vriations and water potential as indicators for irrigation scheduling of
almond trees. J. Hortic. Sci. Biotechnol. 2003, 78, 139–144. [CrossRef]
206
Horticulturae 2021, 7, 154
22. Intrigliolo, D.S.; Castel, J.R. Continuous measurement of plant and soil water status for irrigation scheduling in plum. Irrig. Sci.2004, 23, 93–102. [CrossRef]
23. Ortuño, M.F.; García-Orellana, Y.; Conejero, W.; Pérez-Sarmiento, F.; Torrecillas, A. Assessment of maximum daily trunk shrinkagesignal intensity threshold values for deficit irrigation in lemon trees. Agric. Water Manag. 2008, 96, 80–86. [CrossRef]
24. Katerji, N.; Itier, B.; Ferreira, I. Etude de quelques criteres indicateurs de l’etat hydrique d’une culture de tomate en regionsemi-aride. Agronomie 1988, 8, 425–433. [CrossRef]
25. Rötzer, T.; Biber, P.; Moser, A.; Schäfer, C.; Pretzsch, H. Stem and root diameter growth of European beech and Norway spruceunder extreme drought. For. Ecol. Manag. 2017, 406, 184–195. [CrossRef]
26. Matimati, I.; Musil, C.F.; Raitt, L.; February, E.C. Diurnal stem diameter variations show CAM and C3 photosynthetic modes andCAM-C3 switches in arid South African succulent shrubs. Agric. For. Meteorol. 2012, 161, 72–79. [CrossRef]
27. Tognetti, R.; Giovannelli, A.; Lavini, A.; Morelli, G.; Fragnito, F.; d’Andria, R. Assessing environmental controls over conductancesthrough the soil-plant-atmosphere continuum in an experimental olive tree plantation of southern Italy. Agric. For. Meteorol. 2009,149, 1229–1243. [CrossRef]
28. Devine, W.D.; Harrington, C.A. Factors affecting diurnal stem contraction in young Douglas-fir. Agric. For. Meteorol. 2011, 151,414–419. [CrossRef]
29. Du, S.Q.; Tong, L.; Zhang, X.T.; Kang, S.Z.; Du, T.S.; Li, S.; Ding, R.S. Signal intensity based on maximum daily stem shrinkage canreflect the water status of apple trees under alternate partial root-zone irrigation. Agric. Water Manag. 2017, 190, 21–30. [CrossRef]
30. Tuccio, L.; Piccolo, E.L.; Battelli, R.; Matteoli, S.; Remorini, D. Physiological indicators to assess water status in potted grapevine(Vitis vinifera L.). Sci. Hortic. 2019, 255, 8–13. [CrossRef]
31. Conesa, M.R.; Torres, R.; Domingo, R.; Navarro, H.; Soto, F.; Pérez-Pastor, A. Maximum daily trunk shrinkage and stem waterpotential reference equations for irrigation scheduling in table grapes. Agric. Water Manag. 2016, 172, 51–61. [CrossRef]
32. Gallardo, M.; Thompson, R.B.; Valdez, L.C.; Fernandez, M.D. Use of stem diameter variations to detect plant water stress intomato. Irrig. Sci. 2006, 24, 241–255. [CrossRef]
33. Goldhamer, D.A.; Fereres, E. Irrigation scheduling protocols using continuously recorded trunk diameter measurements. Irrig.Sci. 2001, 20, 115–125. [CrossRef]
34. Miralles, J.; Franco, J.A.; Sánchez-Blanco, M.J.; Bañón, S. Effects of pot-in-pot production system on water consumption 0034,stem diameter variations and photochemical efficiency of spindle tree irrigated with saline water. Agric. Water Manag. 2016, 170,167–175. [CrossRef]
35. Allen, R.G. Using the FAO-56 dual crop coefficient method over an irrigated region as part of an evapotranspiration intercompari-son study. J. Hydrol. 2000, 229, 27–41. [CrossRef]
36. Abdelfatah, A.; Aranda, X.; Savé, R.; Herralde, F.D.; Biel, C. Evaluation of the response of maximum daily shrinkage in youngcherry trees submitted to water stress cycles in a greenhouse. Agric. Water Manag. 2013, 118, 150–158. [CrossRef]
37. Kramer, P.J. Water Relations of Plants; Academic Press: New York, NY, USA, 1983.38. Turner, N.C. Techniques and experimental approaches for the measurement of plant water status. Plant Soil 1981, 58, 339–366.
[CrossRef]39. Zhang, J.G.; He, Q.Y.; Shi, W.Y.; Otsuki, K.; Yamanaka, N.; Du, S. Radial variations in xylem sap flow and their effect on whole-tree
water use estimates. Hydrol. Process. 2015, 29, 4993–5002. [CrossRef]40. Irvine, J.; Grace, J. Continuous measurements of water tensions in the xylem of trees based on the elastic properties of wood.
Planta 1997, 202, 455–461. [CrossRef]41. Xiong, W.; Wang, Y.H.; Yu, P.T.; Liu, H.L.; Shi, Z.J.; Guan, W. Growth in stem diameter of Larix principis-rupprechtii and its response
to meteorological factors in the south of Liupan Mountain, China. Acta Ecol. Sin. 2007, 27, 432–440. [CrossRef]42. Zhang, J.Y.; Duan, A.W.; Meng, Z.J.; Liu, Z.G. Stem diameter variations of cotton under different water conditions. Trans. Chin.
Soc. Agric. Eng. 2005, 21, 7–11.43. Intrigliolo, D.S.; Castel, J.R. Evaluation of grapevine water status from trunk diameter variations. Irrig. Sci. 2007, 26, 49–59.
[CrossRef]44. Girón, I.F.; Corell, M.; Martín-Palomo, M.J.; Galindo, A.; Torrecillas, A.; Moreno, F.; Moriana, A. Feasibility of trunk diameter
fluctuations in the scheduling of regulated deficit irrigation for table olive trees without reference trees. Agric. Water Manag. 2015,161, 114–126. [CrossRef]
45. De la Rosa, J.M.; Conesa, M.R.; Domingo, R.; Torres, R.; Pérez-Pastor, A. Feasibility of using trunk diameter fluctuation andstem water potential reference lines for irrigation scheduling of early nectarine trees. Agric. Water Manag. 2013, 126, 133–141.[CrossRef]
46. Kanai, S.; Adu-Gymfi, J.; Lei, K.; Lto, J.; Ohkura, K.; Moghaieb, R.E.A.; El-shemy, H.; Mohapatra, R.; Mohapatra, P.K.; Saneoka,H.; et al. N-deficiency damps out circadian rhythmic changes of stem diameter dynamics in tomato plant. Plant Sci. 2008, 174,183–191. [CrossRef]
47. Swaef, T.D.; Steppe, K.; Lemeur, R. Raoul Lemeur. Determining reference values for stem water potential and maximum dailytrunk shrinkage in young apple trees based on plant responses to water deficit. Agric. Water Manag. 2009, 96, 541–550. [CrossRef]
48. Conejero, W.; Mellisho, C.D.; Ortuo, M.F.; Moriana, A.; Moreno, F.; Torrecillas, A. Using trunk diameter sensors for regulateddeficit irrigation scheduling in early maturing peach trees-ScienceDirect. Environ. Exp. Bot. 2011, 71, 409–415. [CrossRef]
207

Horticulturae 2021, 7, 154
49. Moriana, A.; Moreno, F.; Girón, I.F.; Conejero, W.; Ortuño, M.F.; Morales, D.; Corell, M.; Torrecillas, A. Seasonal changes ofmaximum daily shrinkage reference equations for irrigation scheduling in olive trees: Influence of fruit load. Agric. Water Manag.2011, 99, 121–127. [CrossRef]
50. King, G.; Fonti, P.; Nievergelt, D.; Büntgen, U.; Frank, D. Climatic drivers of hourly to yearly tree radius variations along a 6 ◦Cnatural warming gradient. Agric. For. Meteorol. 2013, 168, 36–46. [CrossRef]
51. Janbek, B.M.; Stockie, J.M. Asymptotic and numerical analysis of a porous medium model for transpiration-driven sap flow intrees. Siam J. Appl. Math. 2017, 78, 2028–2056. [CrossRef]
52. De la Rosa, J.M.; Conesa, M.R.; Domingo, R.; Pérez-Pastor, A. A new approach to ascertain the sensitivity to water stress ofdifferent plant water indicators in extra-early nectarine trees. Sci. Hortic. 2014, 169, 147–153. [CrossRef]
53. De la Rosa, J.M.; Domingo, R.; Gómez-Montiel, J.; Pérez-Pastor, A. Implementing deficit irrigation scheduling through plantwater stress indicators in early nectarine trees. Agric. Water Manag. 2015, 152, 207–216. [CrossRef]
54. Shackel, K.A.; Ahmadi, H.; Biasi, W.; Buchner, R.; Goldhamer, D.; Gurusinghe, S.; Hasey, J.; Kester, D.; Krueger, B.; Lampinen, B.;et al. Plant water status as an index of irrigation need in deciduous fruit trees. HortTechnology 1997, 7, 23–29. [CrossRef]
55. Naor, A. Midday stem water potential as a plant water stress indicator for irrigation scheduling in fruit trees. Acta Hortic. 2000,537, 447–454. [CrossRef]
56. Choné, X.; Cornelis, V.L.; Denis, D.; Gaudillère, J.P. Stem Water Potential is a Sensitive Indicator of Grapevine Water Status. Ann.Bot. 2001, 4, 477–483. [CrossRef]
57. Cuevas, M.V.; Torres-Ruiz, J.M.; Álvarez, R.; Jiménez, M.D.; Cuerva, J.; Fernández, J.E. Assessment of trunk diameter variationderived indices as water stress indicators in mature olive trees. Agric. Water Manag. 2010, 97, 1293–1302. [CrossRef]
208

MDPISt. Alban-Anlage 66
4052 BaselSwitzerland
Tel. +41 61 683 77 34Fax +41 61 302 89 18
www.mdpi.com
Horticulturae Editorial OfficeE-mail: [email protected]
www.mdpi.com/journal/horticulturae


MDPI St. Alban-Anlage 66 4052 Basel Switzerland
Tel: +41 61 683 77 34 Fax: +41 61 302 89 18
www.mdpi.com
Copyright © 2022 FDOKUMEN