
Study of 3D cell morphology and effect on light scattering distribution
7
Study of 3D cell morphology and effect on light scattering distribution Andrew E. Ekpenyong 1 , Junhua Ding 2 , Li V. Yang 3 , Nancy R. Leffler 3 , Jun Q. Lu 1 , R. Scott Brock 4 , Xin-Hua Hu 1 * 1 Department of Physics, East Carolina University, Greenville, NC 27858, U.S.A. 2 Department of Computer Science, East Carolina University, Greenville, NC 27858, U.S.A. 3 Department of Internal Medicine, Brody School of Medicine, East Carolina University, Greenville, NC 27858, U.S.A. 4 Department of Radiation Oncology, School of Medicine, Virginia Commonwealth University, Richmond, VA 23298, U.S.A. ABSTRACT We have acquired and reconstructed the 3D structures of B16F10 mouse melanoma cells to study morphology changes in response to gene variations. The 3D structure can be imported into a parallel FDTD code to model light scattering distribution and determine morphological parameters such as volumes of cytoplasm, nucleus and mitochondria. We found that the measured parameters agree with the light scatter data obtained with a flow cytometer, showing significant differences between the genetically modified and the unmodified melanoma cells. Keywords: cell morphology, 3D reconstruction, confocal imaging, light scattering, melanoma cell. 1. INTRODUCTION Structural study of biological cells is essential to understand their functions and classification of biological cells according to their morphological features is highly desired for cell biology research. Because of the inherent correlation between light scattering signals and cell morphology [1-4], accurate modeling of light scattering by biological cells can be very useful to develop new methods and instrumentation for rapid assay of biological cells in their natural states [5, 6]. To achieve this goal, it is necessary to employ realistic cell structures in modeling of light scattering for investigation of correlation between the morphological features of cells and spatial distribution of scattered light signals. Previously, we have developed a confocal imaging method to reconstruct 3D structures with nucleus and cytoplasm for modeling of light scattering by B-cells [3]. On the other hand, mitochondria make an important type of intracellular organelles to the structure and function of cells such as melanoma cells. For this purpose, we adopted a mouse melanoma B16F10 cell line for our morphology study which was derived from a spontaneous melanoma of C57BL/6 mouse [7]. The B16F10 cells contain large numbers of mitochondria and melanin particles which can have significant effect on distribution of scattered light. Furthermore, genetic modification of B16 cells can lead to cell morphological change and a 4-fold increase of melanin content in the cells (L.V. Yang, et al. unpublished data), providing an interesting experimental model for investigation of light scattering distribution with cell morphology and changes. In this report we present new development in 3D reconstruction to include mitochondria and alignment of confocal images before 3D reconstruction that significantly improve the accuracy of the reconstructed cell structures. With 3D structures various morphological parameters can be quantitatively extracted and their effect, together with assigned refractive indices, on light scattering can be thoroughly investigated. We have applied these tools to study the morphology changes due to genetic variation of mouse melanoma B16F10 cells. * e-mail: [email protected] Advanced Microscopy Techniques, edited by Paul J. Campagnola, Ernst H. K. Stelzer, Gert von Bally, Proc. of SPIE-OSA Biomedical Optics, SPIE Vol. 7367, 73671J · © 2009 SPIE-OSA · CCC code: 1605-7422/09/$18 · doi: 10.1117/12.831510 SPIE-OSA/ Vol. 7367 73671J-1
-
Upload
independent -
Category
Documents
-
view
3 -
download
0
Transcript of Study of 3D cell morphology and effect on light scattering distribution
Study of 3D cell morphology and effect on light scattering distribution
Andrew E. Ekpenyong1, Junhua Ding2, Li V. Yang3, Nancy R. Leffler3,
Jun Q. Lu1, R. Scott Brock4, Xin-Hua Hu1*
1Department of Physics, East Carolina University, Greenville, NC 27858, U.S.A. 2Department of Computer Science, East Carolina University, Greenville, NC 27858, U.S.A.
3Department of Internal Medicine, Brody School of Medicine, East Carolina University, Greenville, NC 27858, U.S.A.
4Department of Radiation Oncology, School of Medicine, Virginia Commonwealth University, Richmond, VA 23298, U.S.A.
ABSTRACT
We have acquired and reconstructed the 3D structures of B16F10 mouse melanoma cells to study morphology changes in response to gene variations. The 3D structure can be imported into a parallel FDTD code to model light scattering distribution and determine morphological parameters such as volumes of cytoplasm, nucleus and mitochondria. We found that the measured parameters agree with the light scatter data obtained with a flow cytometer, showing significant differences between the genetically modified and the unmodified melanoma cells.
Keywords: cell morphology, 3D reconstruction, confocal imaging, light scattering, melanoma cell.
1. INTRODUCTION
Structural study of biological cells is essential to understand their functions and classification of biological cells according to their morphological features is highly desired for cell biology research. Because of the inherent correlation between light scattering signals and cell morphology [1-4], accurate modeling of light scattering by biological cells can be very useful to develop new methods and instrumentation for rapid assay of biological cells in their natural states [5, 6]. To achieve this goal, it is necessary to employ realistic cell structures in modeling of light scattering for investigation of correlation between the morphological features of cells and spatial distribution of scattered light signals. Previously, we have developed a confocal imaging method to reconstruct 3D structures with nucleus and cytoplasm for modeling of light scattering by B-cells [3]. On the other hand, mitochondria make an important type of intracellular organelles to the structure and function of cells such as melanoma cells. For this purpose, we adopted a mouse melanoma B16F10 cell line for our morphology study which was derived from a spontaneous melanoma of C57BL/6 mouse [7]. The B16F10 cells contain large numbers of mitochondria and melanin particles which can have significant effect on distribution of scattered light. Furthermore, genetic modification of B16 cells can lead to cell morphological change and a 4-fold increase of melanin content in the cells (L.V. Yang, et al. unpublished data), providing an interesting experimental model for investigation of light scattering distribution with cell morphology and changes. In this report we present new development in 3D reconstruction to include mitochondria and alignment of confocal images before 3D reconstruction that significantly improve the accuracy of the reconstructed cell structures. With 3D structures various morphological parameters can be quantitatively extracted and their effect, together with assigned refractive indices, on light scattering can be thoroughly investigated. We have applied these tools to study the morphology changes due to genetic variation of mouse melanoma B16F10 cells. * e-mail: [email protected]
Advanced Microscopy Techniques, edited by Paul J. Campagnola, Ernst H. K. Stelzer, Gert von Bally, Proc. of SPIE-OSABiomedical Optics, SPIE Vol. 7367, 73671J · © 2009 SPIE-OSA · CCC code: 1605-7422/09/$18 · doi: 10.1117/12.831510
SPIE-OSA/ Vol. 7367 73671J-1
2. METHODS 2. 1 Confocal Imaging B16F10 cells originally from the American Type Culture Collection (ATCC) were cultured in DMEM medium with 10% fetal bovine serum in a tissue culture incubator. Genetic modification of B16F10 cells was done by stably transducing the cells with the GPR4 gene (termed as B16/GPR4 in the following) or the GPR4 R115A mutant gene in the MSCV-IRES-GFP expression vector (B16/vector). The B16F10 cells were double stained with Syto 61 dye (Invitrogen) for nuclei and MitoTracker Orange dye (Invitrogen) for mitochondria. Several mitochondria dyes haven been tested such as mitotracker red and LDS-751 and MitoTracker Orange was selected for its fluorescence intensity and resistance to photobleaching. After incubation in culture media with the two dyes for 30 minutes, B16F10 cells between glass slides were brought to a confocal microscope (LSM510, Zeiss) for imaging.
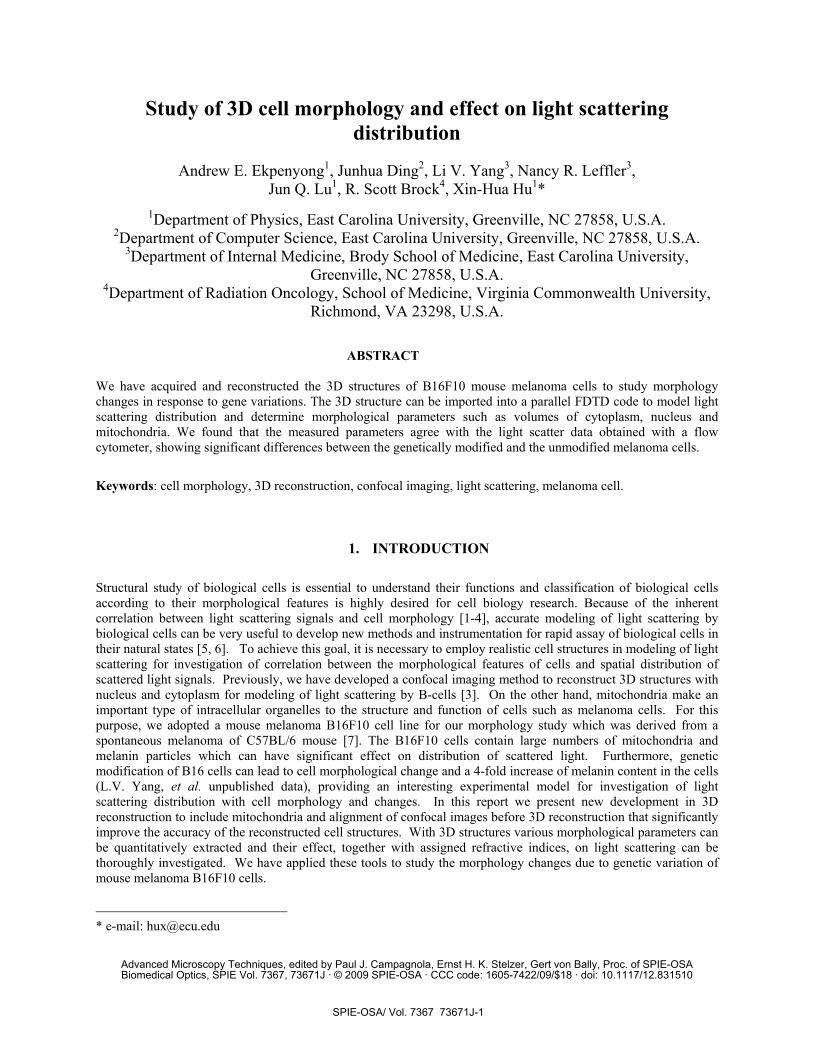
Two representative z-stacks of confocal images of B16F10 and B16/GPR4 cells are presented in Fig. 1 with double staining of Syto-61 (fluorescence light is recorded in the red channel of the color slice images) and MitoTracker Orange (fluorescence is recorded in the green chanel). One can easily see that in this cell line the concentration of mitochondria outside the nucleus is fairly high and is expected to play an important role in light scattering.
2.2 Image Alignment Among each of the three cell types, B16F10, B16/GPR4 and B16/vector, z-stacks of confocal images were acquired from 30 cells randomly selected to study their morphology features and distributions. Care was taken to ensure the cells were stably suspended in the culture media between depressed slide and glass cover before the image stacks were taken to reduce possible cell motion. Since each stack may require up to 60 slices being acquired, image stack acquisition time may be up to several minutes. For some cells with relative low fluorescence intensity, exposure time has to be increased so the stack acquisition time could be as long as 10 minutes. Imaged cell could move up to 30 pixels between slice images of 512x512 pixels. Without correction, the cell translation can introduce severe distortion in the reconstructed 3D structures.
Fig. 1 Confocal images of two B16 cells. Each panel is a z-stack with step size of 0.5μm for z-scan and a field-of-view of 35.8μm: left panel: B16F10 cell, right panel: B16/GPR4 cell.
SPIE-OSA/ Vol. 7367 73671J-2
An image alignment algorithm has been developed to correct the above problem by maximizing the image correlation between consecutive slices using a center slice image as the reference. An image correlation coefficient COC between the reference image of A1 and a to-be-aligned image of A2 is defined here as [8]
,
2 2
, ,
{ 1( , ) 1 }{ 2( , ) 2 }( , )
{ 1( , ) 1 } { 2( , ) 2 }
m mi j
m mi j i j
A i j A A i I j J ACOC I J
A i j A A i j A
− + + −=
− −
∑
∑ ∑, (1)
where (i, j) are pixel indices, (I, J) is a 2D translation vector, and A1m or A2m is the mean pixel value of either image in a selected color, red or green, channel, respectively. We found that image alignment can be achieved efficiently by converting the green channel of selected A1, A2 images into binary images since the MitoTracker Orange dye stains both mitochondria (strong binding) and cytoplasm (weak binding). Using a simulated annealing algorithm, the search for an optimized 2D translation vector can be quickly completed, less than 30s on an Intel 2GHz core 2 CPU, to align the two consecutive confocal images. The search procedure is repeated until all slices are aligned.
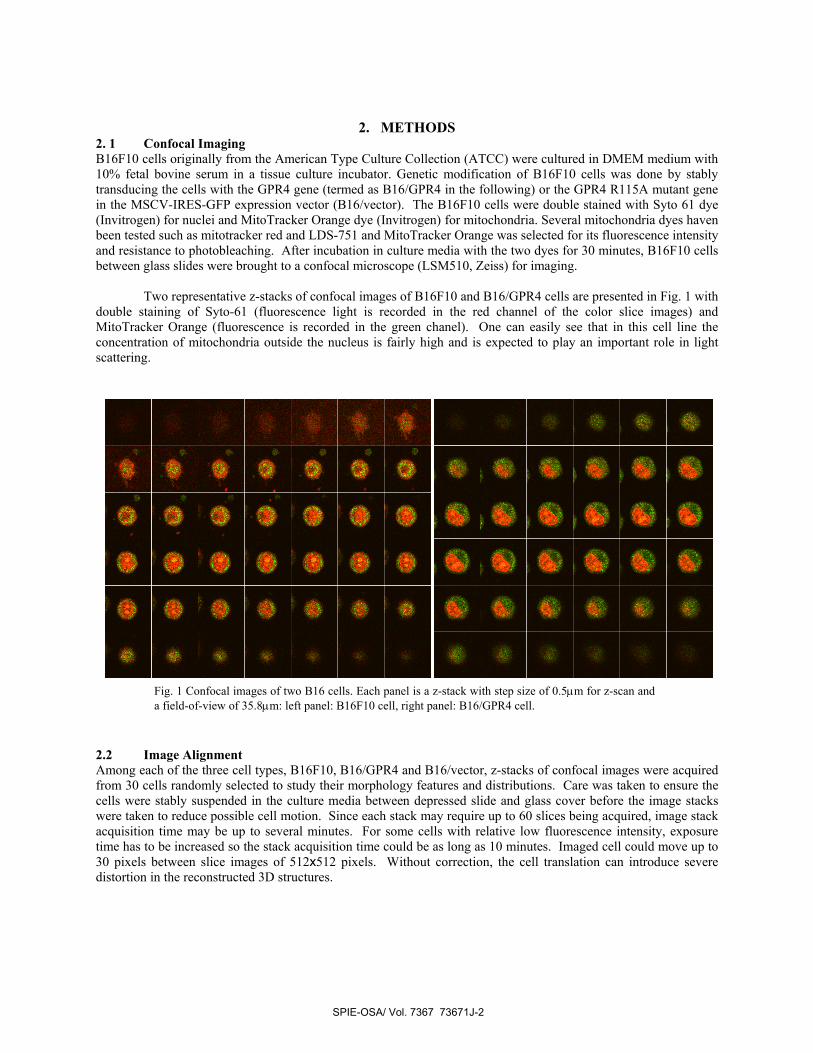
The automated image alignment procedure was tested on a z-scan stack of confocal images acquired from a B-cell (NAM-6 cell line) and selected images before and after alignment are shown in Fig. 2. In this example, the values of I and J for the translation vector of image alignment can be as large as 50 for images of 512 x 512 pixels.
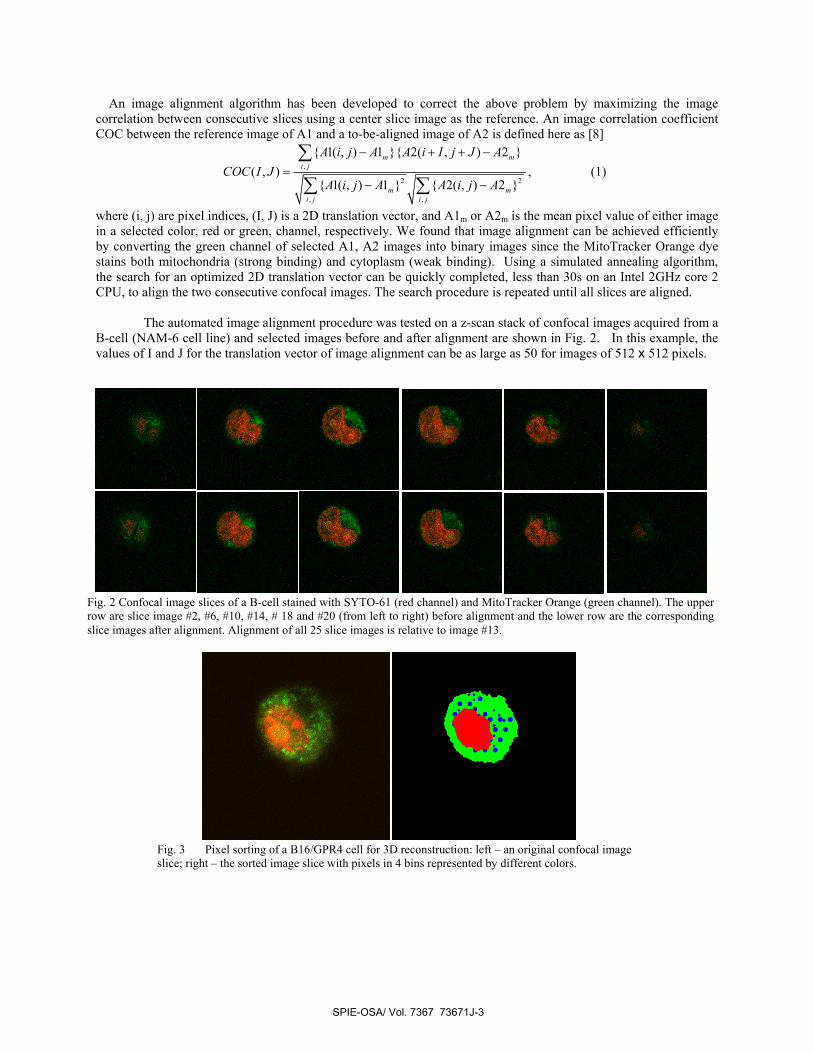
Fig. 3 Pixel sorting of a B16/GPR4 cell for 3D reconstruction: left – an original confocal image slice; right – the sorted image slice with pixels in 4 bins represented by different colors.
Fig. 2 Confocal image slices of a B-cell stained with SYTO-61 (red channel) and MitoTracker Orange (green channel). The upper row are slice image #2, #6, #10, #14, # 18 and #20 (from left to right) before alignment and the lower row are the corresponding slice images after alignment. Alignment of all 25 slice images is relative to image #13.
SPIE-OSA/ Vol. 7367 73671J-3
2.3 Digital Reconstruction After alignment, the confocal image slices were taken by an in-house developed software for image pixel sorting and 3D reconstruction. Pixels in each confocal slice image were separated into four bins of background, cytoplasm, nucleus and mitochondria based on a histogram analysis. In addition to their fluorescence light intensity in either the red channel of Syto-61 or the green channel of MitoTracker Orange, pixels were sorted also according to their spatial correlations to reduce effect of noise. Fig. 3 shows the image slices before and after the pixel sorting on one confocal image slice (#18) of the z-stack for a B16/GPR4 cell (cell49). The background is represented by the dark pixels, the cytoplasm by green, the mitochondria by blue and the nucleus by red. A cursory look at the original image may not may not show the exact contour of the boundaries among intracellular organisms but our in-house developed 3D reconstruction code consisting of the pattern recognition algorithm to ensure correct separation of pixels into each of the 4 bins.
After pixel sorting of all confocal slices, the 3D structure of cells with nucleus and mitochondria were obtained by connecting slice images through interpolation. The 3D structure data files, in a zipped format, can be either converted into the stl format for 3D viewing or imported into our parallel Finite-Difference-Time-Domain (FDTD) code (after assignment of refractive indices) for light scattering modeling. The algorithm and details of parallel FDTD modeling have been discussed in our previous publications [1-3]. 2.4 Validation and scaling of Z-step size In addition to image misalignment, other sources of human and systematic errors in confocal microscopy include aberrations due to refractive index mismatch between the sample and immersion fluid, attenuation of light with sample depth and heterogeneity of intensity across image layers. Image processing methods have been reported for correcting some of these errors [9]. We found that the distance between consecutive confocal image slices is significantly different from the step size used to translate the sample stage which is caused by the refractive index mismatches along the pathlength from the imaged cell to the microscope objective used in the confocal system. To correct the z-scan step size, we employed commercially available polystyrene spheres of 3µm radius to determine the stepping size difference in the z-axis translation. Essentially, we measured the diameters of each confocal image slice of the sphere along x and y directions for those slices with well defined boundaries between background and the circular image, plotted these diameters against the nominal z-scan position for each slice and then determined the z-positions which correspond to the zero diameters by extrapolation. The correction factor for z-scan was obtained by dividing the z-position difference according to the nominal z-scan step size by the known sphere diameter. The z-scan correction factor was found to be 1.48 and used later for all 3D reconstruction.
3. RESULTS
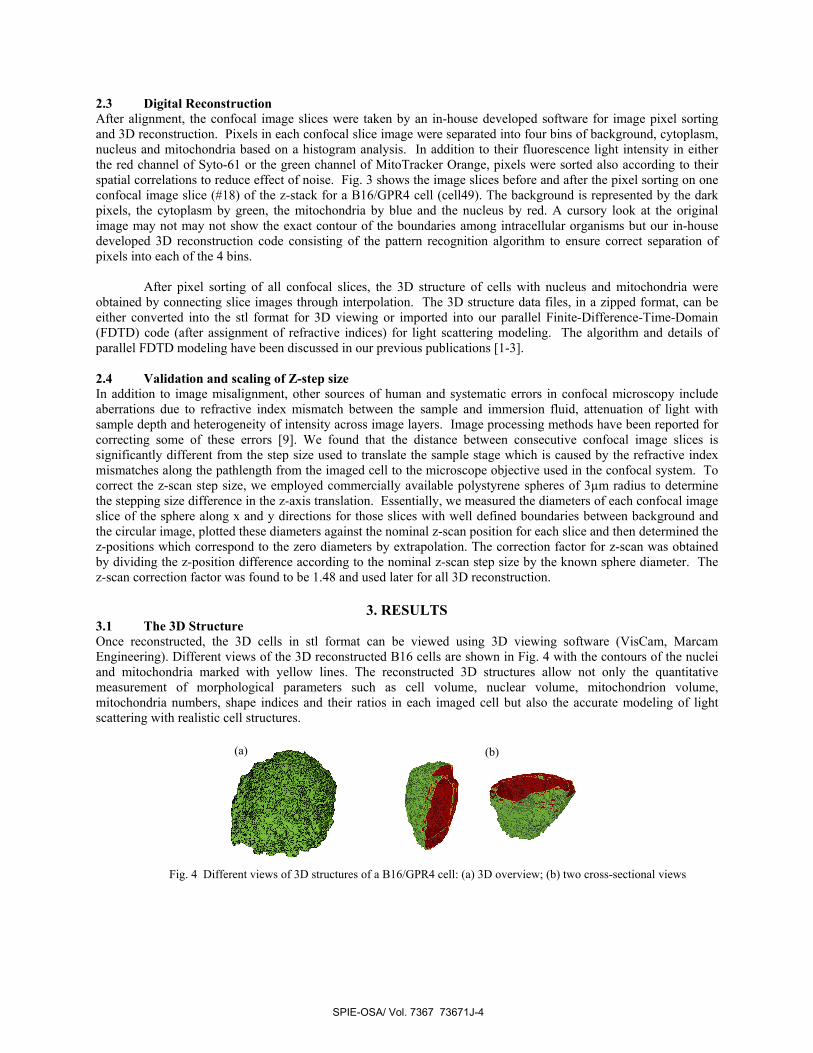
3.1 The 3D Structure Once reconstructed, the 3D cells in stl format can be viewed using 3D viewing software (VisCam, Marcam Engineering). Different views of the 3D reconstructed B16 cells are shown in Fig. 4 with the contours of the nuclei and mitochondria marked with yellow lines. The reconstructed 3D structures allow not only the quantitative measurement of morphological parameters such as cell volume, nuclear volume, mitochondrion volume, mitochondria numbers, shape indices and their ratios in each imaged cell but also the accurate modeling of light scattering with realistic cell structures.
Fig. 4 Different views of 3D structures of a B16/GPR4 cell: (a) 3D overview; (b) two cross-sectional views
(a) (b)
SPIE-OSA/ Vol. 7367 73671J-4
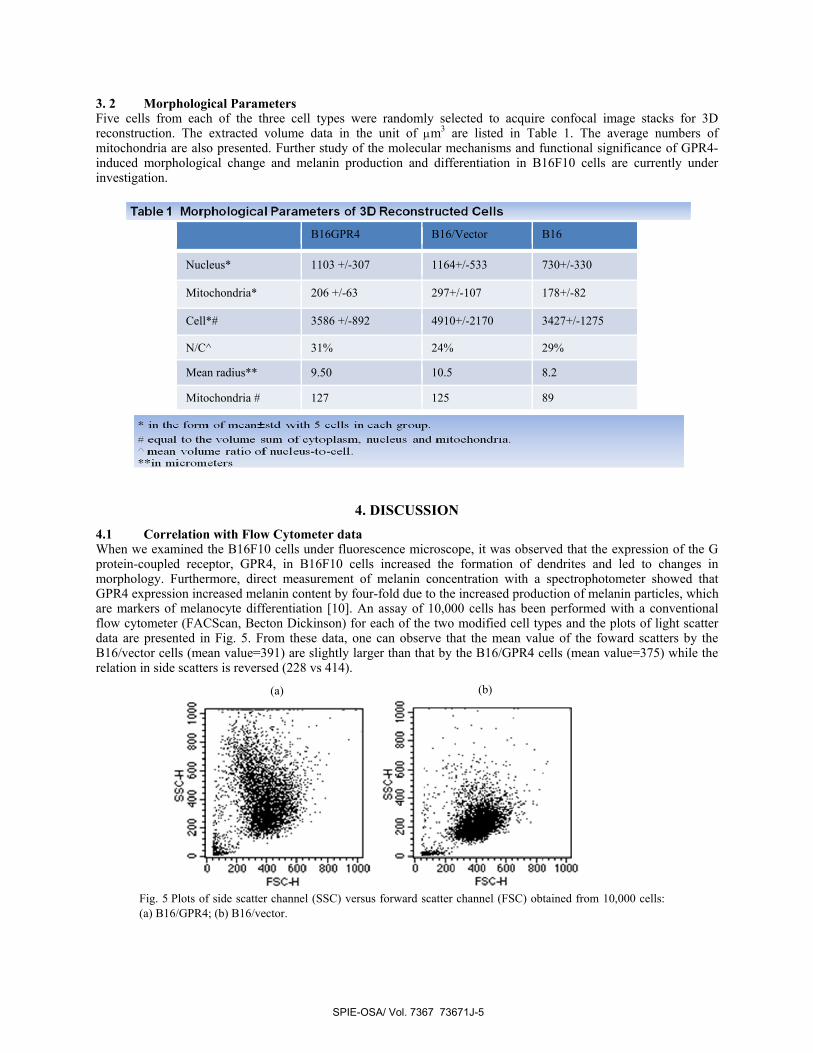
3. 2 Morphological Parameters Five cells from each of the three cell types were randomly selected to acquire confocal image stacks for 3D reconstruction. The extracted volume data in the unit of μm3 are listed in Table 1. The average numbers of mitochondria are also presented. Further study of the molecular mechanisms and functional significance of GPR4-induced morphological change and melanin production and differentiation in B16F10 cells are currently under investigation.
B16GPR4 B16/Vector B16
Nucleus* 1103 +/-307 1164+/-533 730+/-330
Mitochondria* 206 +/-63 297+/-107 178+/-82
Cell*# 3586 +/-892 4910+/-2170 3427+/-1275
N/C^ 31% 24% 29%
Mean radius** 9.50 10.5 8.2
Mitochondria # 127 125 89
4. DISCUSSION 4.1 Correlation with Flow Cytometer data When we examined the B16F10 cells under fluorescence microscope, it was observed that the expression of the G protein-coupled receptor, GPR4, in B16F10 cells increased the formation of dendrites and led to changes in morphology. Furthermore, direct measurement of melanin concentration with a spectrophotometer showed that GPR4 expression increased melanin content by four-fold due to the increased production of melanin particles, which are markers of melanocyte differentiation [10]. An assay of 10,000 cells has been performed with a conventional flow cytometer (FACScan, Becton Dickinson) for each of the two modified cell types and the plots of light scatter data are presented in Fig. 5. From these data, one can observe that the mean value of the foward scatters by the B16/vector cells (mean value=391) are slightly larger than that by the B16/GPR4 cells (mean value=375) while the relation in side scatters is reversed (228 vs 414).
(a) (b)
Fig. 5 Plots of side scatter channel (SSC) versus forward scatter channel (FSC) obtained from 10,000 cells: (a) B16/GPR4; (b) B16/vector.
SPIE-OSA/ Vol. 7367 73671J-5
The morphological parameters of 3D reconstructed cells allow us to study the changes induced by the genetic modification of B16 cells quantitatively. The data in Table 1 show that the cytoplasm volumes of the B16/GPR4 and the B16/vector appear to be different while the volumes of the nucleus and mitochondria between the two types are close in value. The fact that B16/vector cells have larger cytoplasm volume may be used to explain the features revealed by the plots of light scatters in Fig. 5 where the higher forward scatter for B16/vector implies larger cell sizes due to larger cytoplasm. Conversely, the higher side scatter for B16/GPR4 compared with B16/vector implies that the B16GPR4 have greater heterogeneity. That is, the B16/vector cells having larger cell volume end up with less intracellular heterogeneity. Furthermore, the variation in cytoplasm volume, induced by the GPR4 receptor, may suggest a significant difference between the cytoskeletons of these cells which can have important consequences in cells’ ability for adhesion and migration. While a conventional flow cytometer can be used to acquire light scattering data as shown in Fig. 5, one can clearly see that these data provide very limited quantitative information on 3D morphology. In contrast, the 3D reconstructed images and morphological parameters presented in this report demonstrate substantial differences between genetically modified and unmodified B16 cell lines and can be used to study genetic variation as we discussed in the introduction. A study of different B16F10 cell populations with a diffraction imaging flow cytometer in conjuction with 3D reconstructed images and comparison with FDTD numerical modelling is in preparation and results are expected to appear soon.
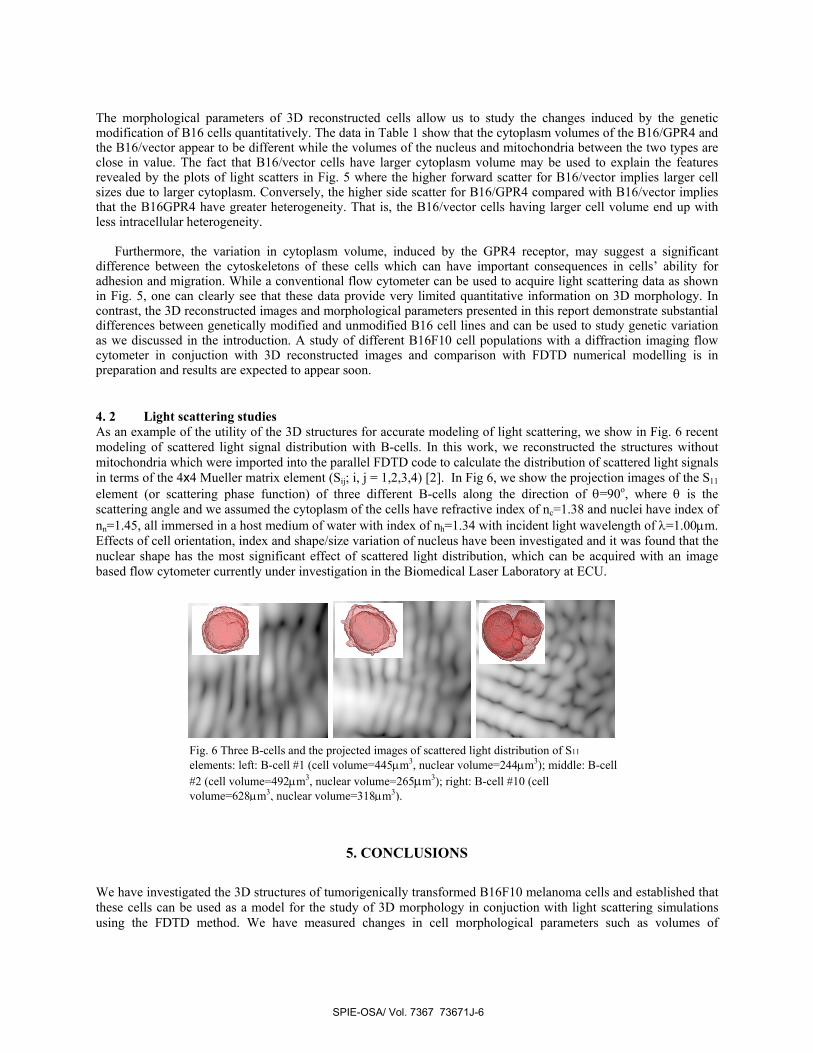
4. 2 Light scattering studies As an example of the utility of the 3D structures for accurate modeling of light scattering, we show in Fig. 6 recent modeling of scattered light signal distribution with B-cells. In this work, we reconstructed the structures without mitochondria which were imported into the parallel FDTD code to calculate the distribution of scattered light signals in terms of the 4x4 Mueller matrix element (Sij; i, j = 1,2,3,4) [2]. In Fig 6, we show the projection images of the S11 element (or scattering phase function) of three different B-cells along the direction of θ=90o, where θ is the scattering angle and we assumed the cytoplasm of the cells have refractive index of nc=1.38 and nuclei have index of nn=1.45, all immersed in a host medium of water with index of nh=1.34 with incident light wavelength of λ=1.00μm. Effects of cell orientation, index and shape/size variation of nucleus have been investigated and it was found that the nuclear shape has the most significant effect of scattered light distribution, which can be acquired with an image based flow cytometer currently under investigation in the Biomedical Laser Laboratory at ECU.
5. CONCLUSIONS We have investigated the 3D structures of tumorigenically transformed B16F10 melanoma cells and established that these cells can be used as a model for the study of 3D morphology in conjuction with light scattering simulations using the FDTD method. We have measured changes in cell morphological parameters such as volumes of
Fig. 6 Three B-cells and the projected images of scattered light distribution of S11 elements: left: B-cell #1 (cell volume=445μm3, nuclear volume=244μm3); middle: B-cell #2 (cell volume=492μm3, nuclear volume=265μm3); right: B-cell #10 (cell volume=628μm3, nuclear volume=318μm3).
SPIE-OSA/ Vol. 7367 73671J-6

mitochondria, nucleus and cytoplasm for various cell lines. From data analysed so far, the B16/vector cell line shows the greatest increase in cytoplasm volume with a nucleus-to-cytoplasm volume ratio, N/C, to be 0.24 while the B16/GPR4 as well as the B16F10 have N/C values of 0.31 and 0.29 respectively. Our 3D reconstruction algorithm is currently being optimized and more cells are being reconstructed. Further study of the molecular mechanisms and functional significance of GPR4-induced morphological changes and melanin production and differentiation in B16F10 cells are also currently under investigation.
ACKNOWLEDGMENTS We thank Dr. D.A. Weidner for assistance on confocal imaging and Dr. R. S. Brock for 3D reconstruction. This research was supported in part by a NIH grant (1R15GM70798-01).
REFERENCES [1] R. S. Brock, X. H. Hu, P. Yang, and J. Q. Lu, Evaluation of a parallel FDTD code and application to modeling of light scattering by
deformed red blood cells, Opt. Express, 13, 5279-5292 (2005). [2] J. Q. Lu, P. Yang, and X. H. Hu, Simulations of Light Scattering from a Biconcave Red Blood Cell Using the FDTD method, J. Biomed.
Opt., 10, 024022 (2005). [3] R. S. Brock, X. H. Hu, D. A. Weidner, J. R. Mourant, and J. Q. Lu, Effect of Detailed Cell Structure on Light Scattering Distribution:
FDTD study of a B-cell with 3D Structure Constructed from Confocal Images, J. Quant. Spectrosc. Radiat. Transfer, 102, 25-36 (2006). [4] H. Ding, J. Q. Lu, R. S. Brock, T. J. McConnell, J. F. Ojeda, K. M. Jacobs, and X. H. Hu, Angle-resolved Mueller Matrix Study of Light
Scattering by B-Cells at Three Wavelengths of 442, 633 and 850nm, J. Biomed. Opt., 12, 034032 (2007). [5] K. M. Jacobs, J. Q. Lu, and X. H. Hu, Development of a diffraction imaging flow cytometer, submitted to Opt. Lett. [6] K. M. Jacobs, L. V. Yang, J. Ding, A. E. Ekpenyong, R. Castellone, J. Q. Lu, and X. H. Hu, Diffraction imaging of spheres and melanoma
cells with a microscope objective, to be published in Journal of Biophotonics [7] I. J. Fidler, Selection of successive tumour lines for metastasis, Nat. New Biol., 242, 148-149 (1973). [8] W. H. Peters and W. F. Ranson, Digital imaging techniques in experimental mechanics, Opt. Eng. , 21, 427–431 (1982). [9] S. Ko and S. Gunasekaran, Error correction of confocal microscopy images for in situ food microstructure evaluation J. Food Engr., 79,
935-944 (2007). [10] R. Busca, C. Bertolotto, P. Abbe, W. Englaro, T. Ishizaki, S. Narumiya, P. Boquet, J. P. Ortonne, and R. Ballotti, Inhibition of Rho is
required for cAMP-induced melanoma cell differentiation, Mol Biol Cell, 9, 1367-1378 (1998).
SPIE-OSA/ Vol. 7367 73671J-7