STUDIES ON DISTURBED SHOLA FORESTS FOR ... - KFRI
114
KFRI Research Report 196 STUDIES ON DISTURBED SHOLA FORESTS FOR EVOLVING STRATERGIES FOR THE CONSERVATION AND MANAGEMENT U.M. Chandrashekara P.K. Muraleedharan KERALA FOREST RESEARCH INSTITUTE PEECHI, THRISSUR January 2001 Pages: 110
-
Upload
khangminh22 -
Category
Documents
-
view
1 -
download
0
Transcript of STUDIES ON DISTURBED SHOLA FORESTS FOR ... - KFRI
KFRI Research Report 196
STUDIES ON DISTURBED SHOLA FORESTS FOR EVOLVING
STRATERGIES FOR THE CONSERVATION AND MANAGEMENT
U.M. Chandrashekara P.K. Muraleedharan
KERALA FOREST RESEARCH INSTITUTE PEECHI, THRISSUR
January 2001 Pages: 110
CONTENTS
Page File
Abstract 1 r.196.2
1 Introduction 3 r.196.3
2 Methodology 4 r.196.4
3 Result and Discussion 14 r.196.5
4 Strategy for Conservation of Shola 53 r.196.6
5 Recommendations 56 r.196.7
6 References 57 r.196.8
7 Appendices 62 r.196.9
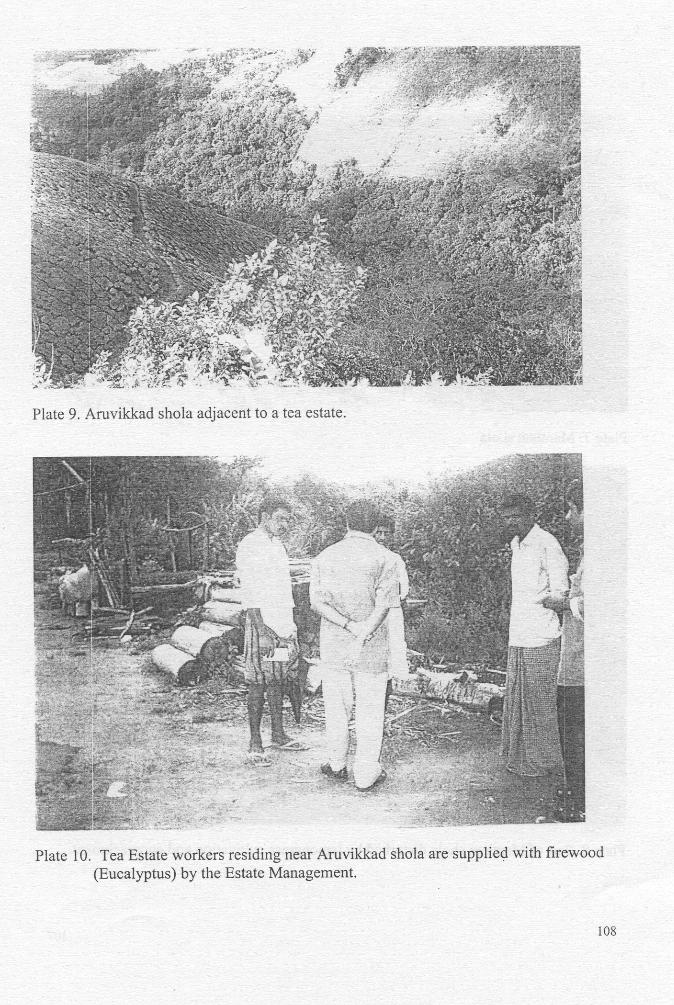
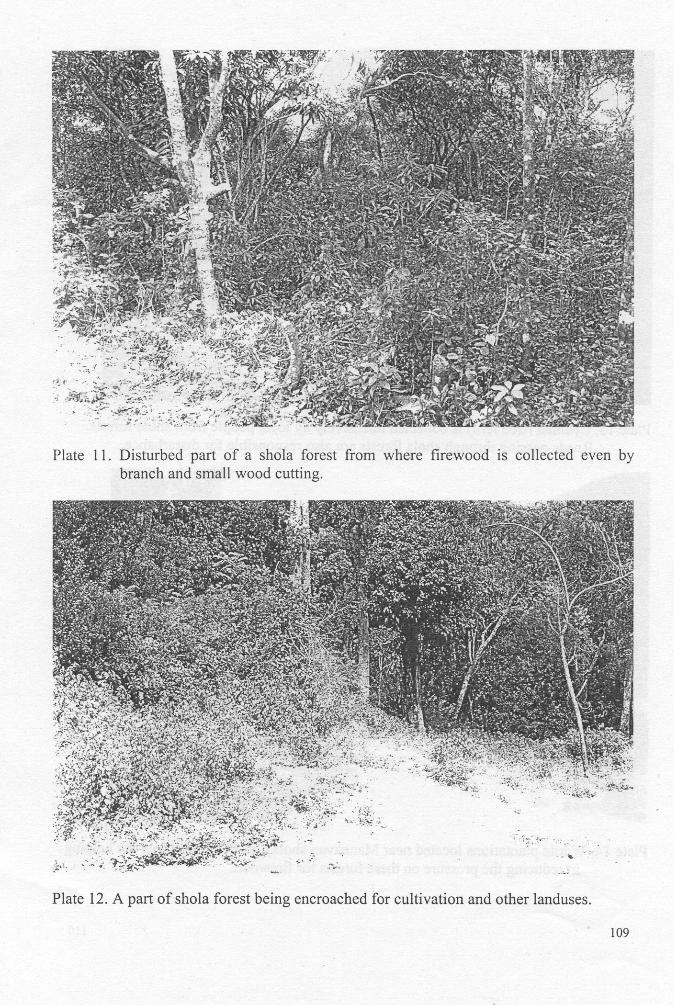
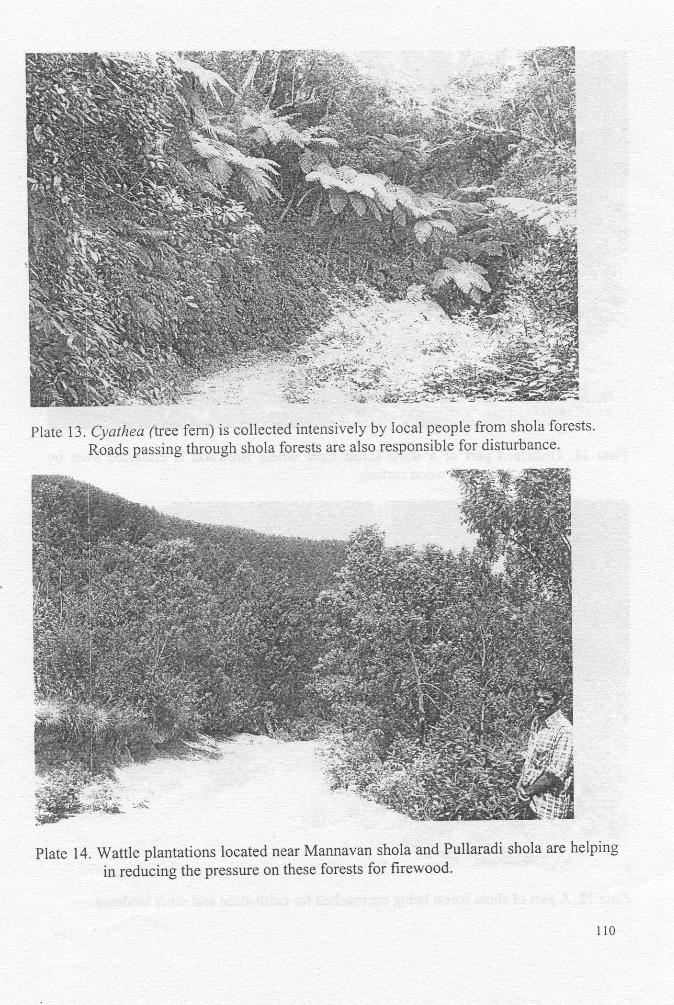
8 Plates 104 r.196.10
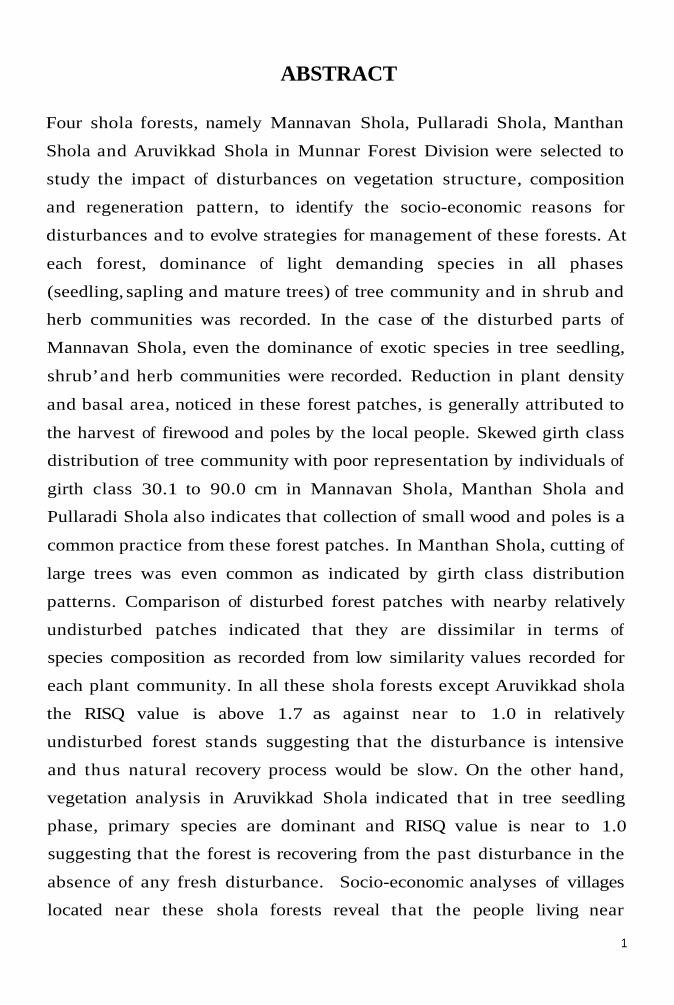
ABSTRACT
Four shola forests, namely Mannavan Shola, Pullaradi Shola, Manthan
Shola and Aruvikkad Shola in Munnar Forest Division were selected to
study the impact of disturbances on vegetation structure, composition
and regeneration pattern, to identify the socio-economic reasons for
disturbances and to evolve strategies for management of these forests. At
each forest, dominance of light demanding species in all phases
(seedling, sapling and mature trees) of tree community and in shrub and
herb communities was recorded. In the case of the disturbed parts of
Mannavan Shola, even the dominance of exotic species in tree seedling,
shrub’ and herb communities were recorded. Reduction in plant density
and basal area, noticed in these forest patches, is generally attributed to
the harvest of firewood and poles by the local people. Skewed girth class
distribution of tree community with poor representation by individuals of
girth class 30.1 to 90.0 cm in Mannavan Shola, Manthan Shola and
Pullaradi Shola also indicates that collection of small wood and poles is a
common practice from these forest patches. In Manthan Shola, cutting of
large trees was even common as indicated by girth class distribution
patterns. Comparison of disturbed forest patches with nearby relatively
undisturbed patches indicated that they are dissimilar in terms of
species composition as recorded from low similarity values recorded for
each plant community. In all these shola forests except Aruvikkad shola
the RISQ value is above 1.7 as against near to 1.0 in relatively
undisturbed forest stands suggesting that the disturbance is intensive
and thus natural recovery process would be slow. On the other hand,
vegetation analysis in Aruvikkad Shola indicated that in tree seedling
phase, primary species are dominant and RISQ value is near to 1.0
suggesting that the forest is recovering from the past disturbance in the
absence of any fresh disturbance. Socio-economic analyses of villages
located near these shola forests reveal that the people living near
1
Mannavan Shola, Pullaradi Shola and Manthan Shola depend heavily on
forests for their livelihood. Quantity of wood collection increased due to
lemongrass cultivation and at present about 65 percent of the firewood
collected from shola forests is used for oil distillation. Among the threats
to the management of shola forests firewood collection ranks first
followed by grazing and revival of shifting cultivation. Thus the crux and
the success of future management and conservation strategy depends on
how one can reduce the dependency of people on the shola vegetation.
Enrichment planting in disturbed parts of sholas, enhancement of
firewood availability by raising energy plantations as well as developing
lemongrass and firewood based agroforestry systems, reduction of
grazing pressure by developing silvopastoral systems, suspension of
shifting cultivation and prevention of encroachment are the major
strategies identified for conservation of these shola forests. These
strategies may be implemented through eco-development programmes
aiming at overall development of the shola as well as people living
nearby. This study also revealed the fact that Aruvikkad' Shola is at
present free from disturbance due to supply of firewood from the Tea
Estate Company and due to the different socio-economic background of
the Estate workers. However, if the present system of firewood supply by
the Estate to its workers is discontinued due to policy changes then
Aruvikkad shola would face severe threat.
2
3
1.0 Introduction
The Western Ghats located in the Indian sub-continent, is one of the biologically
and bio -geographically richest tracts in the world (Nair, 1997) and is considered as a
mega-centre of biodiversity. Being a part of such an important region, the Kerala
State is endowed with unique forest wealth with a forest cover 10,336 km2 represented
by several major forest types found in India. Apart from tropical wet evergreen, semi-
evergreen, moist deciduous and dry deciduous forests, montane forests are also seen
in the State (Chandrasekharan, 1960; Karunakaran, 1995). The montane forests found
at an altitude above 1800 m possess a distinct vegetation type, called shola forests
(Ranganathan, 1938; Nair, 1991). According to Champion and Seth (1968) shola
forests are Southern Wet Montane Temperate closed evergreen forests with stunted
growth of species occupying valleys, depressions, and especially in folds, pockets and
the slopes of the hills and in water courses, which is usually surrounded by grass
lands. These forests are of high ecological significance in protecting headwaters of
rivers and conserving rare and endemic flora and fauna (Blasco, 1970). Studies
conducted by several workers (Fischer, 1921; Gupta, 1962; Aiyar, 1932; Ganeshaiah
et.al., 1997; Noble, 1967; Srivasthava, 1994 Jose et.al., 1994; Swarupanandan et.al.,
1998) not only confirmed the ecological importance shola forests but also provided
information on the structural, floristic and edaphic attributes of these forests in the
Western Ghats. Even though these forests are generally located in relatively
inaccessible hilly areas, many of these forests have been cleared and converted into
plantations and for agricultural use. Thus, in the Western Ghat part of the Kerala
State only about 70 km2 forest area (0.74% of the total forest area of the State) is now
left with under shola forests (Nair, 1991). However, conversion of these forests was
discontinued in the recent past, once their ecological functions were realised to some
extent. Even then these forests are still under anthropogenic pressure leading to
continued habitat degradation and loss of biomass and biodiversity (Rangarajan,
1997). However, the type, degree and intensity as well as causative factors of
disturbance may not be similar in all shola forests of the State. Since a range of
ecological, socio-economic situations are responsible for human-induced changes in
the shola forests one single approach for management is not enough and instead many
approaches are to be identified. Therefore, a systematic analysis of vegetation
4
structure and regeneration patterns as well as the socio-economic dimensions of
habitat degradation and restoration processes is necessary to develop a cafeteria of
strategies for management and restoration of impacted ecosystems. Thus the
objectives of the study were to:
a) analyse the impact of the type and level of disturbance on vegetation structure,
composition, regeneration and ecosystem recovery processes in the shola forests,
b) investigate socio-economic issues responsible for the degradation of forests, and
c) evolve location-specific strategies for conservation and management.
2.0 Methodology
2.1 Site Selection
As already mentioned shola forests represent montane forests located at an
altitude of 1800 m above mean sea level. A list of shola forests of the State was
prepared based on available literature including Forest Working Plans and
Management Plans. A reconnaissance survey was conducted to know the status of the
shola forest whether they are disturbed or not. After personal observation, discussions
with forest officials and literature survey, all shola forests of the State were
categorised into disturbed and undisturbed forest (Table 1).
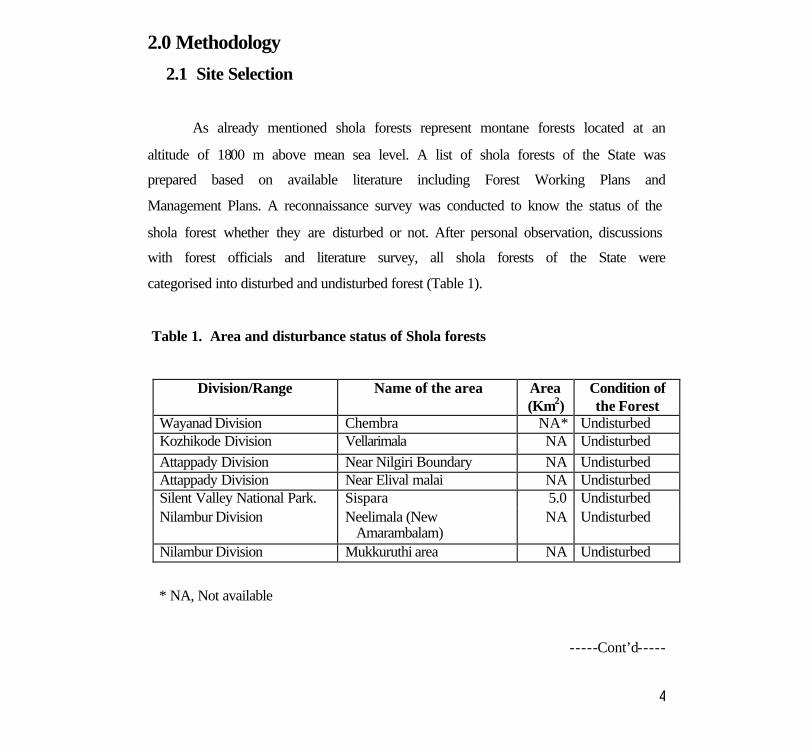
Table 1. Area and disturbance status of Shola forests
Division/Range Name of the area Area (Km2)
Condition of the Forest
Wayanad Division Chembra NA* Undisturbed Kozhikode Division Vellarimala NA Undisturbed Attappady Division Near Nilgiri Boundary NA Undisturbed Attappady Division Near Elival malai NA Undisturbed Silent Valley National Park. Sispara 5.0 Undisturbed Nilambur Division Neelimala (New
Amarambalam) NA Undisturbed
Nilambur Division Mukkuruthi area NA Undisturbed
* NA, Not available
-----Cont’d-----
4
structure and regeneration patterns as well as the socio-economic dimensions of
habitat degradation and restoration processes is necessary to develop a cafeteria of
strategies for management and restoration of impacted ecosystems. Thus the
objectives of the study were to:
a) analyse the impact of the type and level of disturbance on vegetation structure,
composition, regeneration and ecosystem recovery processes in the shola forests,
b) investigate socio-economic issues responsible for the degradation of forests, and
c) evolve location-specific strategies for conservation and management.
2.0 Methodology
2.1 Site Selection
As already mentioned shola forests represent montane forests located at an
altitude of 1800 m above mean sea level. A list of shola forests of the State was
prepared based on available literature including Forest Working Plans and
Management Plans. A reconnaissance survey was conducted to know the status of the
shola forest whether they are disturbed or not. After personal observation, discussions
with forest officials and literature survey, all shola forests of the State were
categorised into disturbed and undisturbed forest (Table 1).
Table 1. Area and disturbance status of Shola forests
Division/Range Name of the area Area (Km2)
Condition of the Forest
Wayanad Division Chembra NA* Undisturbed Kozhikode Division Vellarimala NA Undisturbed Attappady Division Near Nilgiri Boundary NA Undisturbed Attappady Division Near Elival malai NA Undisturbed Silent Valley National Park. Sispara 5.0 Undisturbed Nilambur Division Neelimala (New
Amarambalam) NA Undisturbed
Nilambur Division Mukkuruthi area NA Undisturbed
* NA, Not available
-----Cont’d-----
5
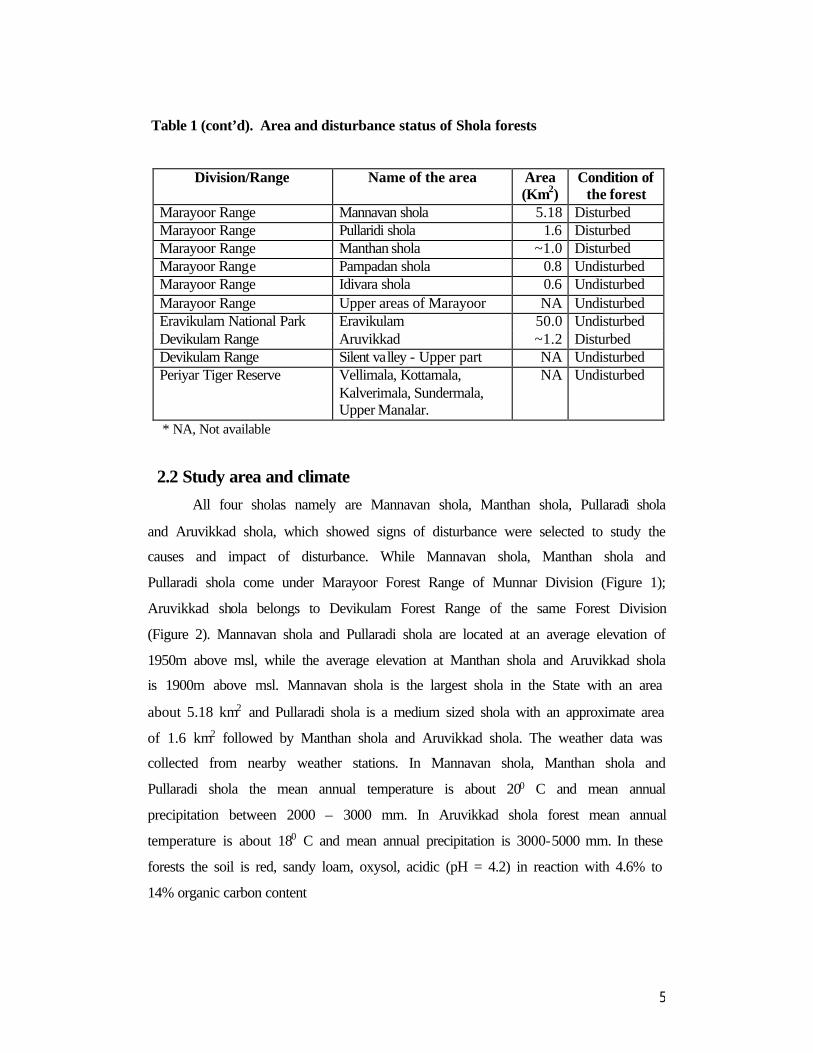
Table 1 (cont’d). Area and disturbance status of Shola forests
Division/Range Name of the area Area (Km2)
Condition of the forest
Marayoor Range Mannavan shola 5.18 Disturbed Marayoor Range Pullaridi shola 1.6 Disturbed Marayoor Range Manthan shola ~1.0 Disturbed Marayoor Range Pampadan shola 0.8 Undisturbed Marayoor Range Idivara shola 0.6 Undisturbed Marayoor Range Upper areas of Marayoor NA Undisturbed Eravikulam National Park Eravikulam 50.0 Undisturbed Devikulam Range Aruvikkad ~1.2 Disturbed Devikulam Range Silent valley - Upper part NA Undisturbed Periyar Tiger Reserve Vellimala, Kottamala,
Kalverimala, Sundermala, Upper Manalar.
NA Undisturbed
* NA, Not available
2.2 Study area and climate
All four sholas namely are Mannavan shola, Manthan shola, Pullaradi shola
and Aruvikkad shola, which showed signs of disturbance were selected to study the
causes and impact of disturbance. While Mannavan shola, Manthan shola and
Pullaradi shola come under Marayoor Forest Range of Munnar Division (Figure 1);
Aruvikkad shola belongs to Devikulam Forest Range of the same Forest Division
(Figure 2). Mannavan shola and Pullaradi shola are located at an average elevation of
1950m above msl, while the average elevation at Manthan shola and Aruvikkad shola
is 1900m above msl. Mannavan shola is the largest shola in the State with an area
about 5.18 km2 and Pullaradi shola is a medium sized shola with an approximate area
of 1.6 km2 followed by Manthan shola and Aruvikkad shola. The weather data was
collected from nearby weather stations. In Mannavan shola, Manthan shola and
Pullaradi shola the mean annual temperature is about 200 C and mean annual
precipitation between 2000 – 3000 mm. In Aruvikkad shola forest mean annual
temperature is about 180 C and mean annual precipitation is 3000-5000 mm. In these
forests the soil is red, sandy loam, oxysol, acidic (pH = 4.2) in reaction with 4.6% to
14% organic carbon content
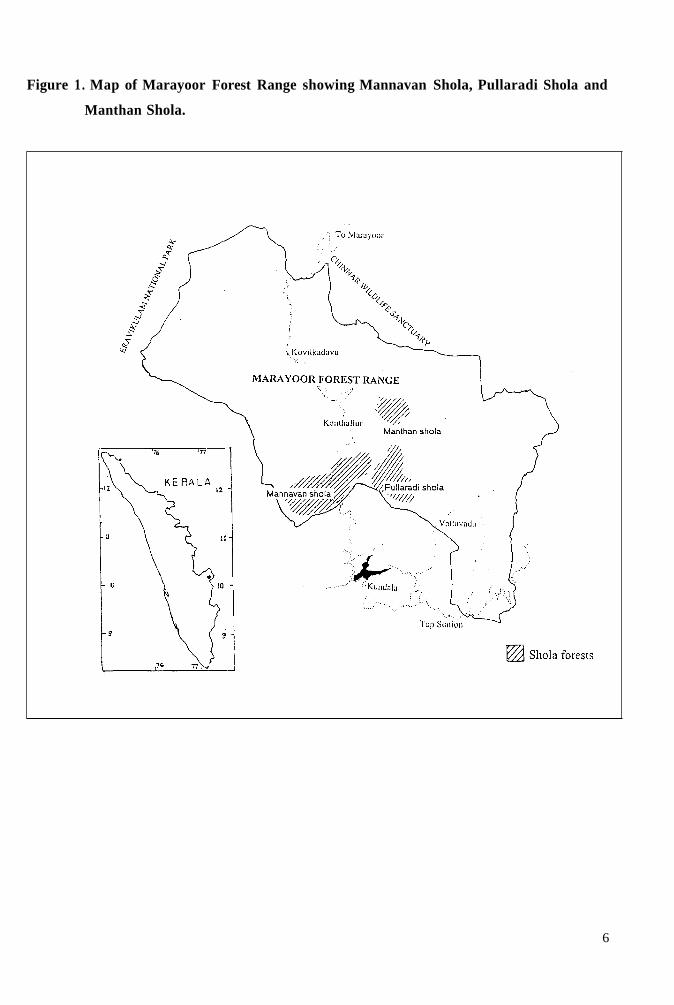
Figure 1. Map of Marayoor Forest Range showing Mannavan Shola, Pullaradi Shola and
Manthan Shola.
6
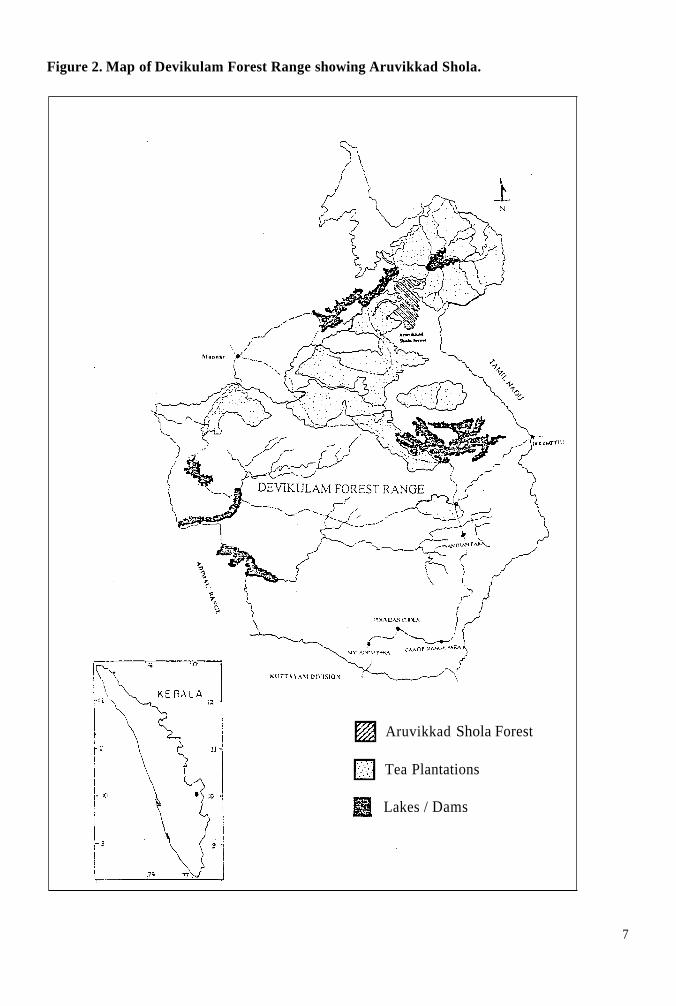
Figure 2. Map of Devikulam Forest Range showing Aruvikkad Shola.
e 5, z
Aruvikkad Shola Forest
Tea Plantations
Lakes / Dams
7
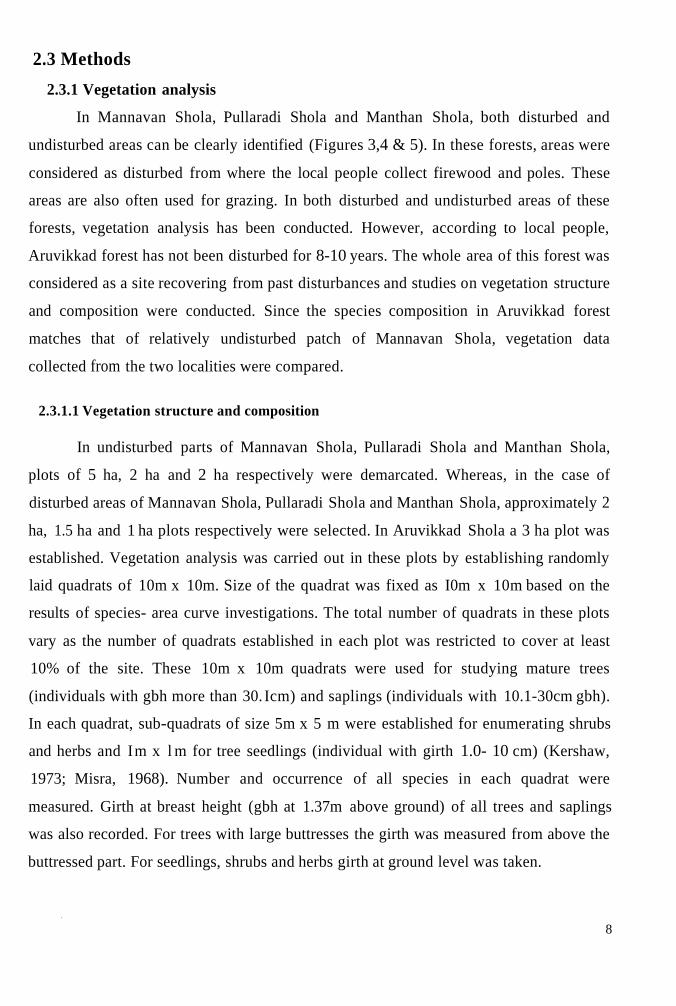
2.3 Methods
2.3.1 Vegetation analysis
In Mannavan Shola, Pullaradi Shola and Manthan Shola, both disturbed and
undisturbed areas can be clearly identified (Figures 3,4 & 5). In these forests, areas were
considered as disturbed from where the local people collect firewood and poles. These
areas are also often used for grazing. In both disturbed and undisturbed areas of these
forests, vegetation analysis has been conducted. However, according to local people,
Aruvikkad forest has not been disturbed for 8-10 years. The whole area of this forest was
considered as a site recovering from past disturbances and studies on vegetation structure
and composition were conducted. Since the species composition in Aruvikkad forest
matches that of relatively undisturbed patch of Mannavan Shola, vegetation data
collected from the two localities were compared.
2.3.1.1 Vegetation structure and composition
In undisturbed parts of Mannavan Shola, Pullaradi Shola and Manthan Shola,
plots of 5 ha, 2 ha and 2 ha respectively were demarcated. Whereas, in the case of
disturbed areas of Mannavan Shola, Pullaradi Shola and Manthan Shola, approximately 2
ha, 1.5 ha and 1 ha plots respectively were selected. In Aruvikkad Shola a 3 ha plot was
established. Vegetation analysis was carried out in these plots by establishing randomly
laid quadrats of 10m x 10m. Size of the quadrat was fixed as I0m x 10m based on the
results of species- area curve investigations. The total number of quadrats in these plots
vary as the number of quadrats established in each plot was restricted to cover at least
10% of the site. These 10m x 10m quadrats were used for studying mature trees
(individuals with gbh more than 30. Icm) and saplings (individuals with 10.1-30cm gbh).
In each quadrat, sub-quadrats of size 5m x 5 m were established for enumerating shrubs
and herbs and Im x l m for tree seedlings (individual with girth 1.0- 10 cm) (Kershaw,
1973; Misra, 1968). Number and occurrence of all species in each quadrat were
measured. Girth at breast height (gbh at 1.37m above ground) of all trees and saplings
was also recorded. For trees with large buttresses the girth was measured from above the
buttressed part. For seedlings, shrubs and herbs girth at ground level was taken.
8
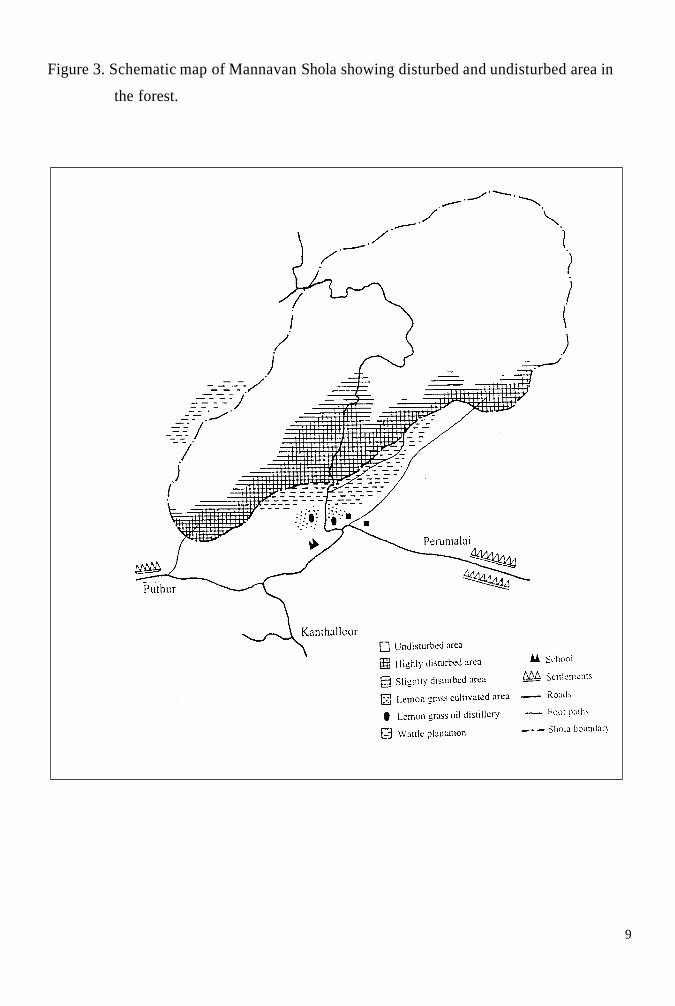
Figure 3. Schematic map of Mannavan Shola showing disturbed and undisturbed area in
the forest.
9
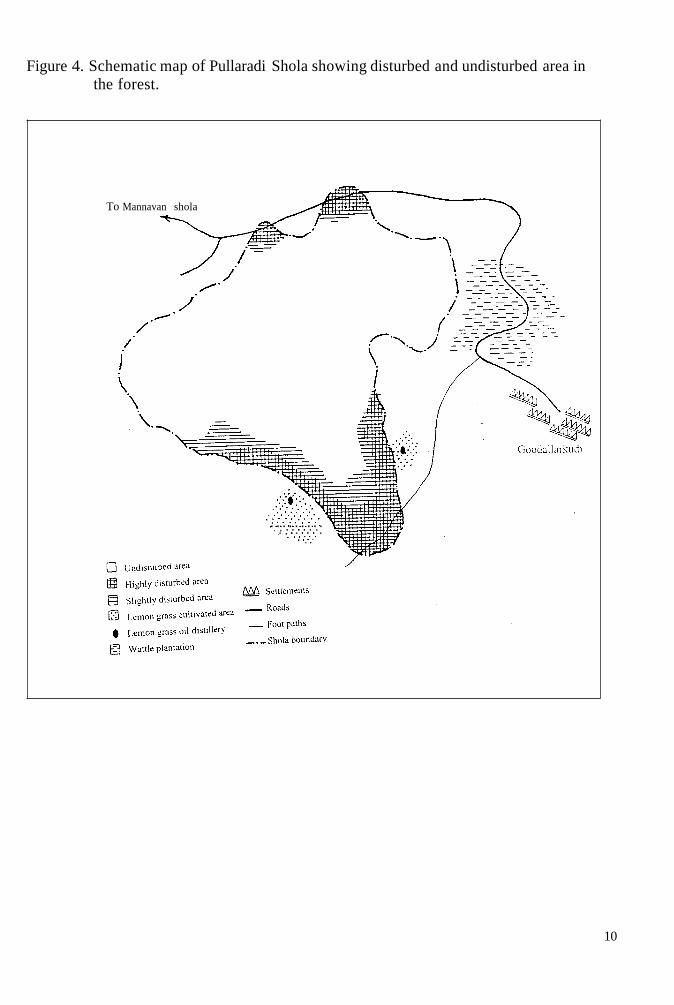
Figure 4. Schematic map of Pullaradi Shola showing disturbed and undisturbed area in the forest.
To Mannavan shola
/
i
. . . . . . . . . , , . . . . . . . , . . . . . .
10
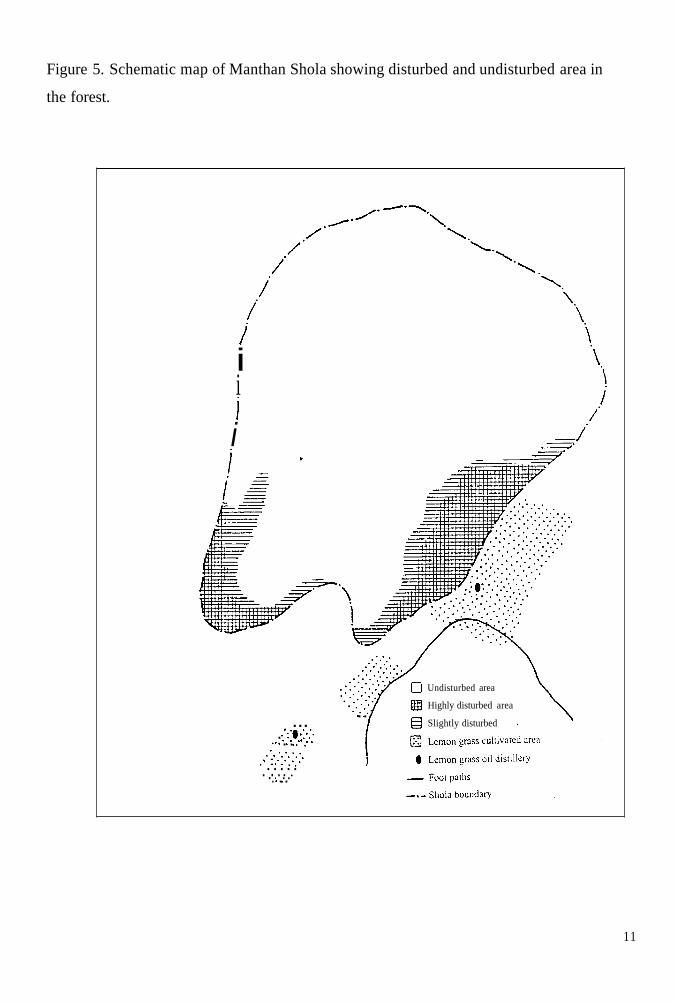
Figure 5. Schematic map of Manthan Shola showing disturbed and undisturbed area in
the forest.
i / i i i i i i
/ \
... . :::.::: .) . . * . .. . ;: :. .. *::. .' : :::: ... . . . . .. . . * .. . .. ..
0 Undisturbed area
@ Highly disturbed area
@ Slightly disturbed area ..
11
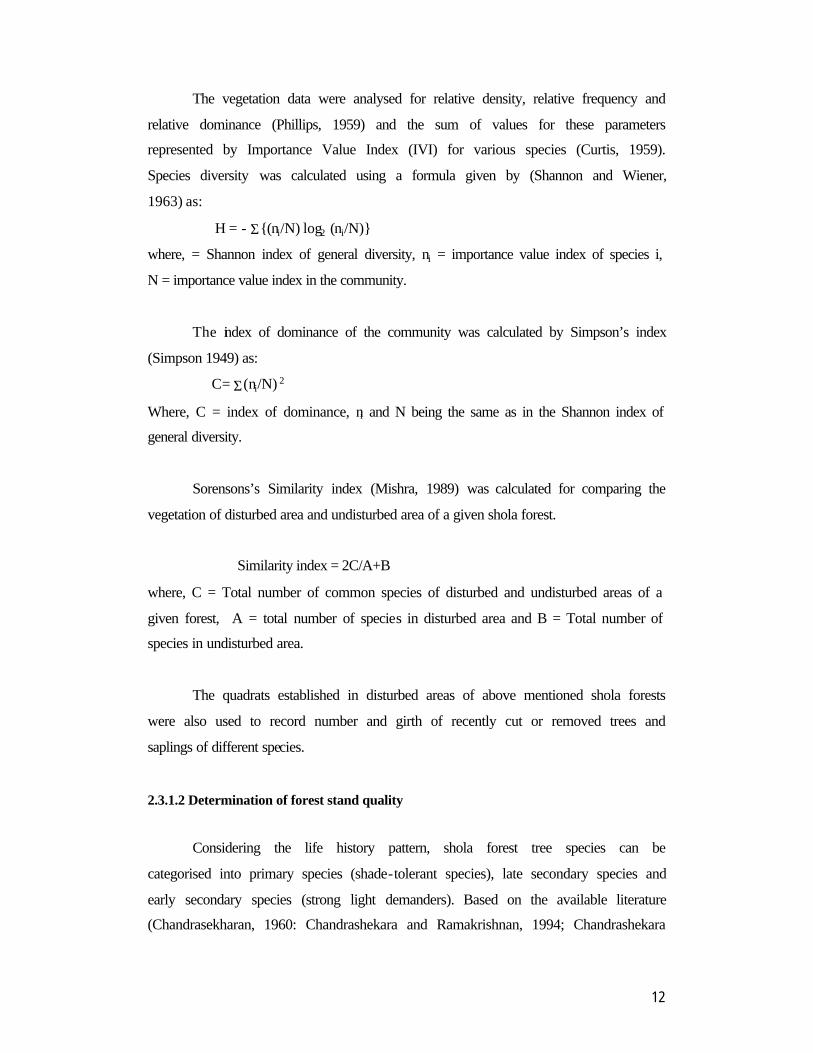
12
The vegetation data were analysed for relative density, relative frequency and
relative dominance (Phillips, 1959) and the sum of values for these parameters
represented by Importance Value Index (IVI) for various species (Curtis, 1959).
Species diversity was calculated using a formula given by (Shannon and Wiener,
1963) as:
H = - Σ{(ni/N) log2 (ni/N)}
where, = Shannon index of general diversity, ni = importance value index of species i,
N = importance value index in the community.
The index of dominance of the community was calculated by Simpson’s index
(Simpson 1949) as:
C= Σ(ni/N) 2
Where, C = index of dominance, ni and N being the same as in the Shannon index of
general diversity.
Sorensons’s Similarity index (Mishra, 1989) was calculated for comparing the
vegetation of disturbed area and undisturbed area of a given shola forest.
Similarity index = 2C/A+B
where, C = Total number of common species of disturbed and undisturbed areas of a
given forest, A = total number of species in disturbed area and B = Total number of
species in undisturbed area.
The quadrats established in disturbed areas of above mentioned shola forests
were also used to record number and girth of recently cut or removed trees and
saplings of different species.
2.3.1.2 Determination of forest stand quality
Considering the life history pattern, shola forest tree species can be
categorised into primary species (shade-tolerant species), late secondary species and
early secondary species (strong light demanders). Based on the available literature
(Chandrasekharan, 1960: Chandrashekara and Ramakrishnan, 1994; Chandrashekara
13
and Sankar, 1998a; Gamble, 1928; Pascal, 1988; Rai, 1979; Rai and Proctor, 1986),
species encountered in study area were categorised into three groups. Each group is
given an index number, its pioneer index 1 for the group requiring a small gap for
regeneration, and 3 for the group of strong light demanders with a strong canopy
disturbance requirement. The procedure to determine the stand quality
(Chandrashekara, 1998) followed is as given below:
RISQ = Σ{(ni/N) x species pioneer index}
Where, RISQ = Ramakrishnan Index of Stand Quality; ni and N being same as in the
Shannon index of general diversity. Pioneer index is 1 for the species whose seedlings
establish in closed canopy area but need small canopy gaps to grow up. Pioneer index
is 2 for the species whose seedlings establish in small gaps but need small to medium
size gaps to grow up. Pioneer index is 3 for the species whose seedlings need larger
canopy gaps for both establishment and growth.
The RISQ of a given site can vary from 1.0 (all stems, group 1 species; forest
stand is undisturbed) to 3.0 (all stems, group 3 species; forest stand is highly
disturbed).
2.3.2 Socio-economic analysis
The study relied on both primary and secondary data. For generating primary
data a few villages, which are proximal to the selected areas were identified and
subjected to a detailed study. The villages dependent on Mannavan shola are
Kanthallur, Perumala, Puthur and Kolachavayil. A sample of 100 households, 25
households each from Perumala, Kanthallur, Puthur, and Kolachavayil respectively,
were selected randomly for studying the problems of Mannavan shola. The village
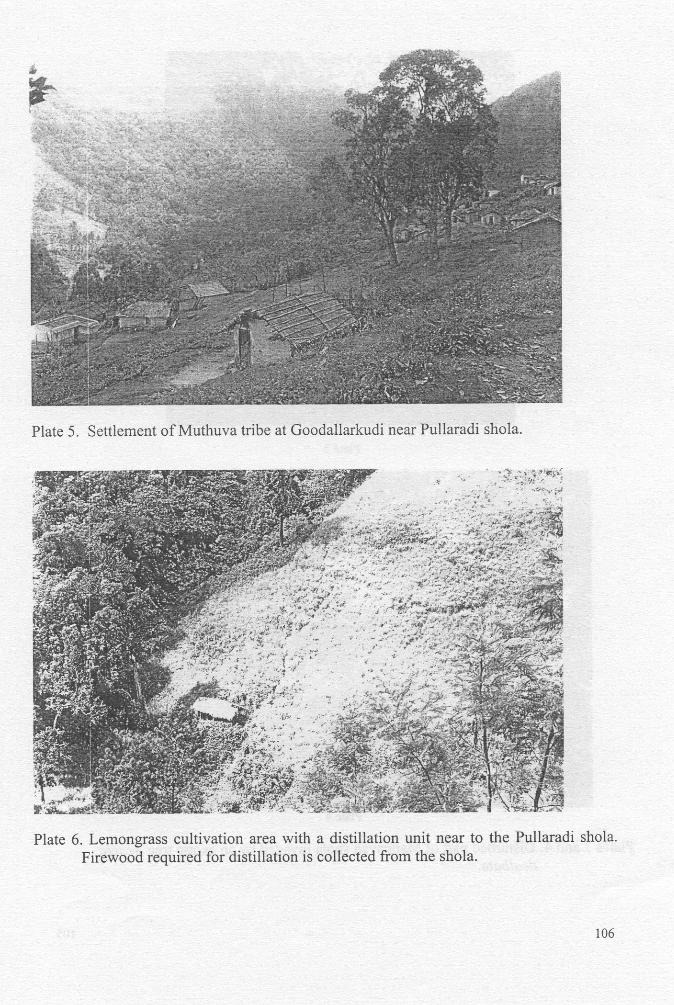
Goodallarkudi (Pillayarkudi) with totally 80 households is highly dependent on
Pullaradi Shola area. Here 25 households were randomly selected. Manthan shola,
which was included in the ecological study, was excluded from the socio-economic
study because the socio-economic conditions in this area found similar to that in
Pullaradi shola and year round visit to this area for data collection was difficult.
Aruvikkad shola, which is under the Forest Department holding, is located near Tata
Tea Estate, Madupetty in Munnar Panchayath. The Tea Estate, consisted of three
14
Divisions, viz. Central, East and West in which 380 households (143, 138 and 99
households respectively in Central, East and West Divisions respectively) are located.
This shola is situated near The Central Division of the Estate and therefore, household
samples were drawn only from this Division. Of the total of 143 households, 80
numbers were randomly selected for detailed investigation study. Besides 10 aged
respondents from above areas were selected for collecting historical data regarding
migration, socio-cultural tradition of the people, destruction of shola, etc.
The primary data were collected using a structured questionnaire. Participatory
Rural Appraisals were also conducted among the people to know the major problems
of the shola area. In addition to primary data, secondary data collected from the
Government Offices such as the Forest Department, Panchayath Offices, etc. have
been used in this study.
3.0 Results and Discussion
3.1 Analysis of vegetation structure and composition
3.1.1 Mannavan shola
Phyto-sociological studies revealed that due to disturbances the vegetation
structure has altered remarkably with changes in the dominance of species (Appendix
1). Hydnocarpus alpina, Isonandra stocksii and Gomphandra coriacea dominate in
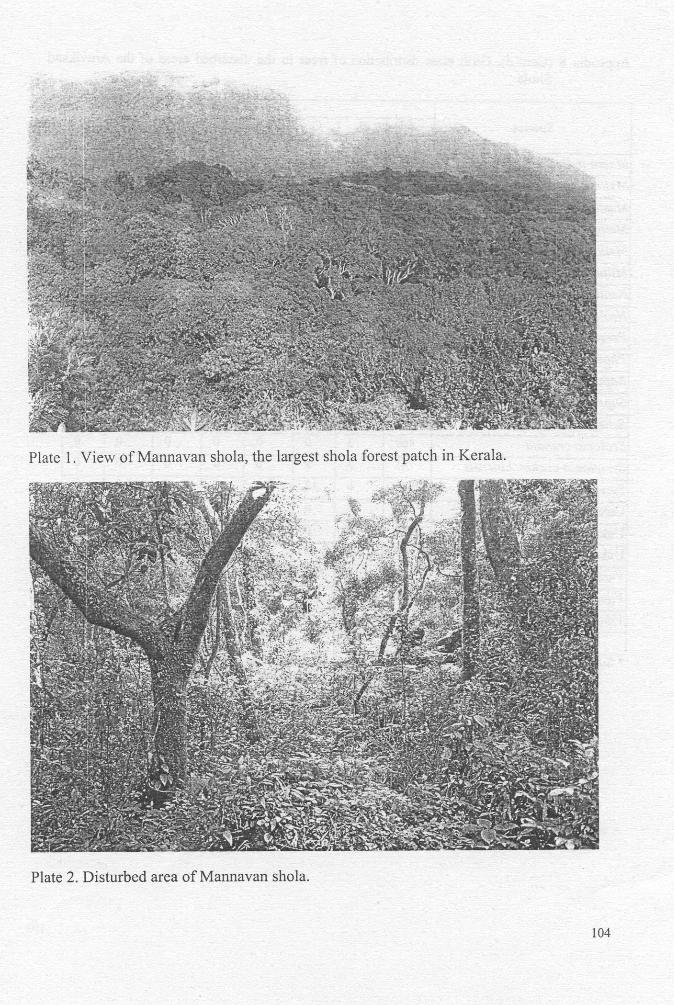
the mature tree phase in undisturbed areas (Plate 1). Whereas in disturbed areas, light
demanding species like Symplocos cochinchinensis and Daphniphyllum neilgherrense
dominate contributing about 50 % to the total IVI of the mature trees. When the
sapling phase is considered, Mastixia arborea, Hydnocarpus alpina and Chionanthus
ramiflorus are the dominant species in the undisturbed forest area. However, in
disturbed forest area light demanding species such as Symplocos cochinchinensis,
Maesa indica and Daphniphyllum neilgherrense are dominant. These three species
contribute about 60% of total IVI of the sapling population. In the case of seedling
population of undisturbed plots, Beilschmiedia wightii and Chionanthus ramiflorus
were co-dominant species followed by Hydnocarpus alpina. Apart from Symplocos
cochinchinensis and Daphniphyllum neilgherrense, exotic Acacia dealbata is
14
Divisions, viz. Central, East and West in which 380 households (143, 138 and 99
households respectively in Central, East and West Divisions respectively) are located.
This shola is situated near The Central Division of the Estate and therefore, household
samples were drawn only from this Division. Of the total of 143 households, 80
numbers were randomly selected for detailed investigation study. Besides 10 aged
respondents from above areas were selected for collecting historical data regarding
migration, socio-cultural tradition of the people, destruction of shola, etc.
The primary data were collected using a structured questionnaire. Participatory
Rural Appraisals were also conducted among the people to know the major problems
of the shola area. In addition to primary data, secondary data collected from the
Government Offices such as the Forest Department, Panchayath Offices, etc. have
been used in this study.
3.0 Results and Discussion
3.1 Analysis of vegetation structure and composition
3.1.1 Mannavan shola
Phyto-sociological studies revealed that due to disturbances the vegetation
structure has altered remarkably with changes in the dominance of species (Appendix
1). Hydnocarpus alpina, Isonandra stocksii and Gomphandra coriacea dominate in
the mature tree phase in undisturbed areas (Plate 1). Whereas in disturbed areas, light
demanding species like Symplocos cochinchinensis and Daphniphyllum neilgherrense
dominate contributing about 50 % to the total IVI of the mature trees. When the
sapling phase is considered, Mastixia arborea, Hydnocarpus alpina and Chionanthus
ramiflorus are the dominant species in the undisturbed forest area. However, in
disturbed forest area light demanding species such as Symplocos cochinchinensis,
Maesa indica and Daphniphyllum neilgherrense are dominant. These three species
contribute about 60% of total IVI of the sapling population. In the case of seedling
population of undisturbed plots, Beilschmiedia wightii and Chionanthus ramiflorus
were co-dominant species followed by Hydnocarpus alpina. Apart from Symplocos
cochinchinensis and Daphniphyllum neilgherrense, exotic Acacia dealbata is
15
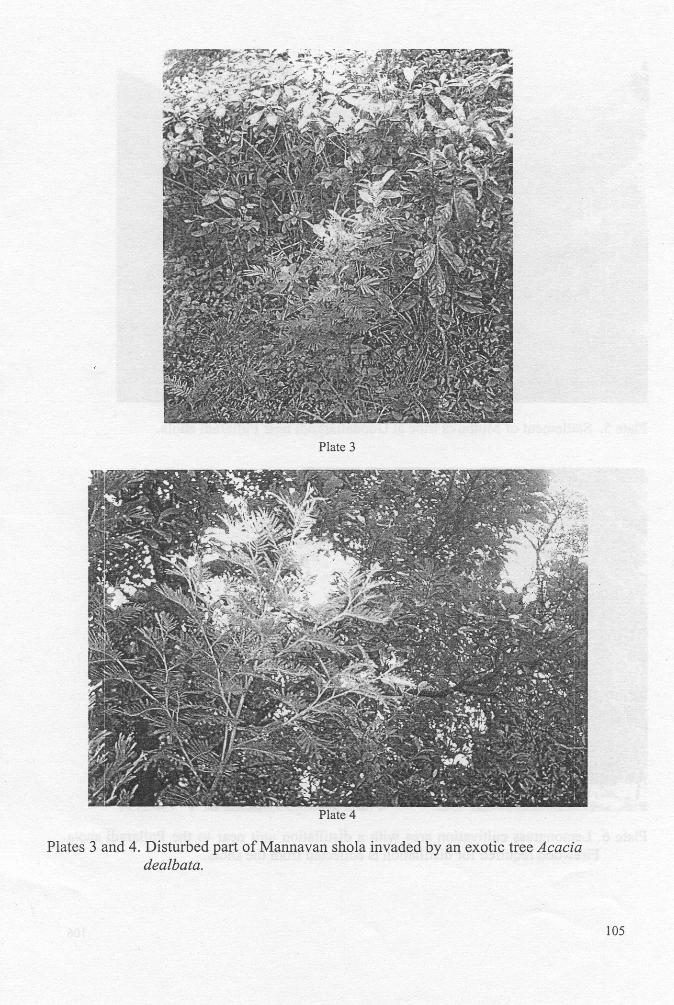
dominant in the seedling phase of disturbed forest plots (Plate2). This suggests that
disturbance in the Mannavan shola is leading to the invasion of exotic Acacias such as
Acacia dealbata and also Acacia melanoxylon. However, these species have not been
recorded in the sapling and mature phase not because they are not recruiting to these
phases but because they are prone to be cut by the local people. The impact of
disturbance is so high that some dominant species of undisturbed plots viz.,
Beilschmiedia wightii and Isonandra stocksii are completely absent in the disturbed
plots. In the disturbed area, Hydnocarpus alpina is represented only in seedling stage.
In the undisturbed forest plots, native species of herbs and shrubs such as Lasianthus
accuminatus, Strobilanthes homotropa and Ardisia rhombifolia are in plenty. On the
other hand in the disturbed plots apart from native species such as Oplismenus sp.,
Vigna trilobata and an exotic weed Ageratina adenophora are dominate . It may also
be pointed out that Oplismenus sp. and Vigna trilobata are light demanding species,
where as Lasianthus accuminatus, Strobilanthes homotropa and Ardisia rhombifolia
are comparatively shade tolerant.
Disturbance in Mannavan shola also led to the reduction in the density and basal
area of trees particularly in the sapling phase (Table 2). Even the understorey shrubs
and herb community showed a drastic reduction in the stem density and basal area.
Such low values for density and basal area in disturbed plots can be attributed to the
collection of poles and stems of shrubs like Strobilanthes homotropa by the local
people from these plots. However, both density and basal area of tree seedlings in
disturbed area are more than those in undisturbed regions. This is due to the fact that
early secondary native species and exotic species have a tendency to recruit well
when canopy gaps are created. For example, it is noted that in the disturbed plot light
demanding species like Symplocos cochinchinensis, Daphniphyllum neilgherrense
and Acacia dealbata contributed 64% of the total basal area of seedlings. Canopy
openings formed by human disturbances are known to offer favourable
microenvironment for establishment and growth of such early secondary species
(Denslow, 1980).
The disturbed plot in Mannavan shola is different from undisturbed plot in terms
of tree species diversity. In the disturbed area, the total number of tree species was
very less than in undisturbed location (Table 2). However, the number of species of
16
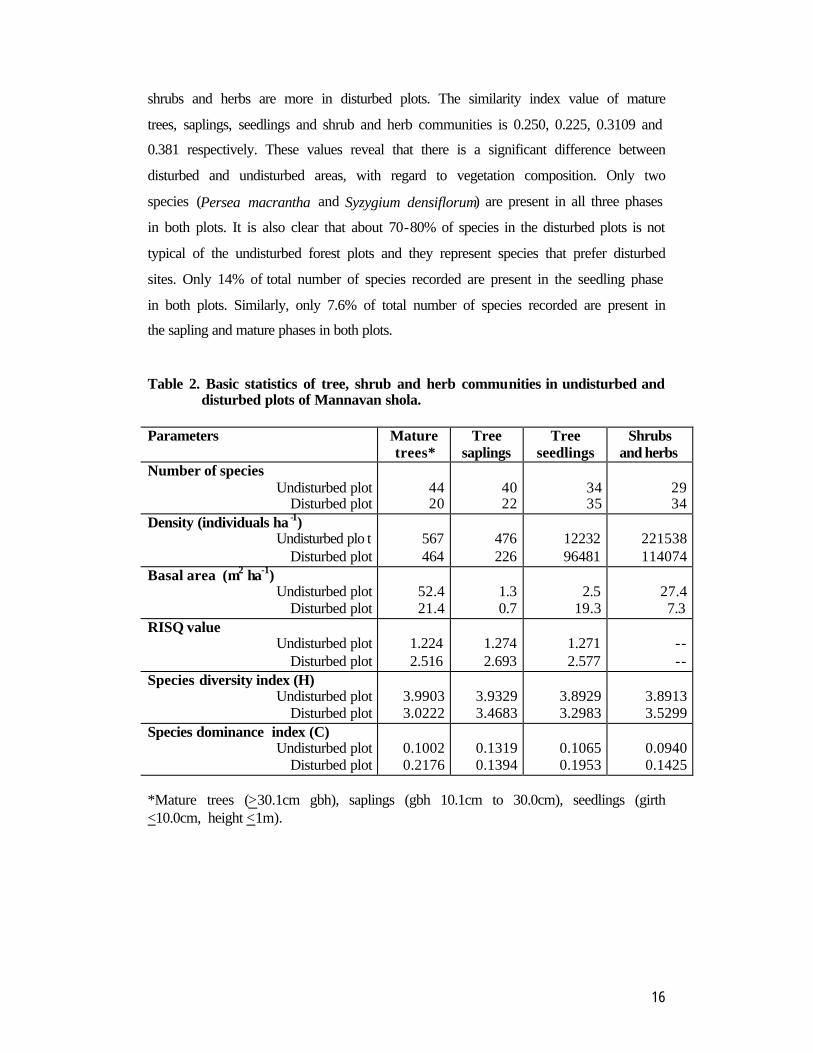
shrubs and herbs are more in disturbed plots. The similarity index value of mature
trees, saplings, seedlings and shrub and herb communities is 0.250, 0.225, 0.3109 and
0.381 respectively. These values reveal that there is a significant difference between
disturbed and undisturbed areas, with regard to vegetation composition. Only two
species (Persea macrantha and Syzygium densiflorum) are present in all three phases
in both plots. It is also clear that about 70-80% of species in the disturbed plots is not
typical of the undisturbed forest plots and they represent species that prefer disturbed
sites. Only 14% of total number of species recorded are present in the seedling phase
in both plots. Similarly, only 7.6% of total number of species recorded are present in
the sapling and mature phases in both plots.
Table 2. Basic statistics of tree, shrub and herb communities in undisturbed and disturbed plots of Mannavan shola.
Parameters Mature
trees* Tree
saplings Tree
seedlings Shrubs
and herbs Number of species
Undisturbed plot Disturbed plot
44 20
40 22
34 35
29 34
Density (individuals ha -1) Undisturbed plo t
Disturbed plot
567 464
476 226
12232 96481
221538 114074
Basal area (m2 ha-1) Undisturbed plot
Disturbed plot
52.4 21.4
1.3 0.7
2.5
19.3
27.4 7.3
RISQ value Undisturbed plot
Disturbed plot
1.224 2.516
1.274 2.693
1.271 2.577
-- --
Species diversity index (H) Undisturbed plot
Disturbed plot
3.9903 3.0222
3.9329 3.4683
3.8929 3.2983
3.8913 3.5299
Species dominance index (C) Undisturbed plot
Disturbed plot
0.1002 0.2176
0.1319 0.1394
0.1065 0.1953
0.0940 0.1425
*Mature trees (>30.1cm gbh), saplings (gbh 10.1cm to 30.0cm), seedlings (girth <10.0cm, height <1m).
17
The undisturbed plot of Mannavan shola can be considered as a mixed forest
patch with no major dominance of any one species as indicated by high species
diversity and low species dominance values. In all phases in the undisturbed area,
species diversity was more or less same which indicates the maintenance of
equilibrium in diversity in this area unlike in disturbed sites, where diversity varies
phase to phase. The disturbed plot of this forest shows a tendency towards the over-
dominance of one or a few number of species as indicated by the low species diversity
and high species dominance values.
To determine the level and intensity of disturbance in the forest,
Ramakrishnan Index of Stand Quality (RISQ) was estimated. The RISQ values
obtained for mature trees, saplings and seedlings were much higher in the disturbed
patch than the benchmark undisturbed area (Table 2) indicating the intensity of
disturbance is high and thus leading to changes both in species composition and stand
structure of the forest. This analysis also reveals that since the RISQ value obtained
for the disturbed site is much higher than the expected value for an undisturbed site,
the rate of recovery by the forest will be slow. These values also indicate that further
and repeated disturbances can lead to the arrested succession due to the dominance of
exotic weeds and trees.
Detailed comparison of girth classes of all species in both the areas indicated
that dominant species were represented in all the girth classes (Appendix 2). About
54% of species in the undisturbed plot do not have representation in seedling stage.
On the other hand, in the disturbed plot only 27% of tree species do not have
representation in seedling phase. This suggests that the closed canopy nature of
undisturbed forest plots does not provide suitable microsites for many species to
regenerate and recruit, whereas moderate disturbance alters the microenvironment
which favours the regeneration of more number of species (Aiyar, 1932). It may be
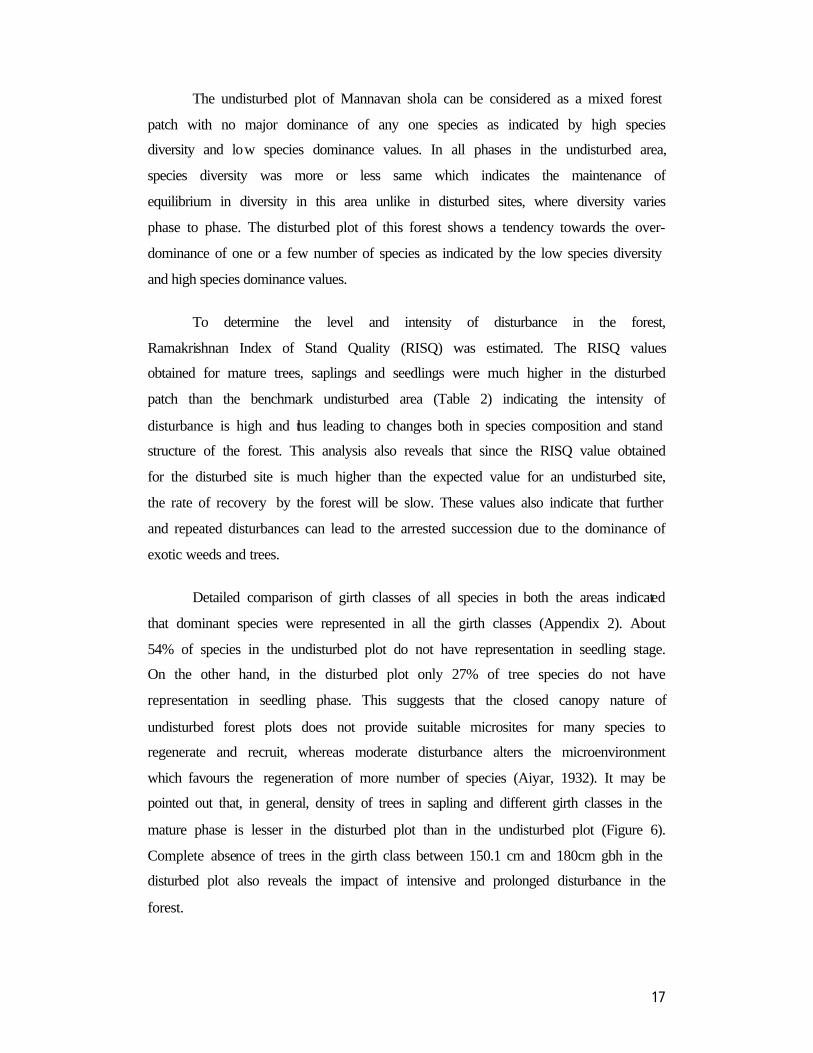
pointed out that, in general, density of trees in sapling and different girth classes in the
mature phase is lesser in the disturbed plot than in the undisturbed plot (Figure 6).
Complete absence of trees in the girth class between 150.1 cm and 180cm gbh in the
disturbed plot also reveals the impact of intensive and prolonged disturbance in the
forest.
18
1
10
100
1000
10000
100000
A B C D E F G H
Girth Classes
Indi
vidu
als
ha-1
UndisturbedplotDisturbedplot
Figure 6. Density (individuals ha-1, given in log scale) of trees in different girth classes in undisturbed and disturbed plots in Mannavan shola.
(A : Seedlings; girth < 10.0 cm and height < 1.0m , B: Saplings; 10.1-30 cm gbh, C- H : mature trees - C: 30.1-60 cm, D : 60.1-90 cm, E: 90.1-120
cm, F: 120.1-150 cm, G: 150.1-180 cm, H: above 180.1 cm gbh. )
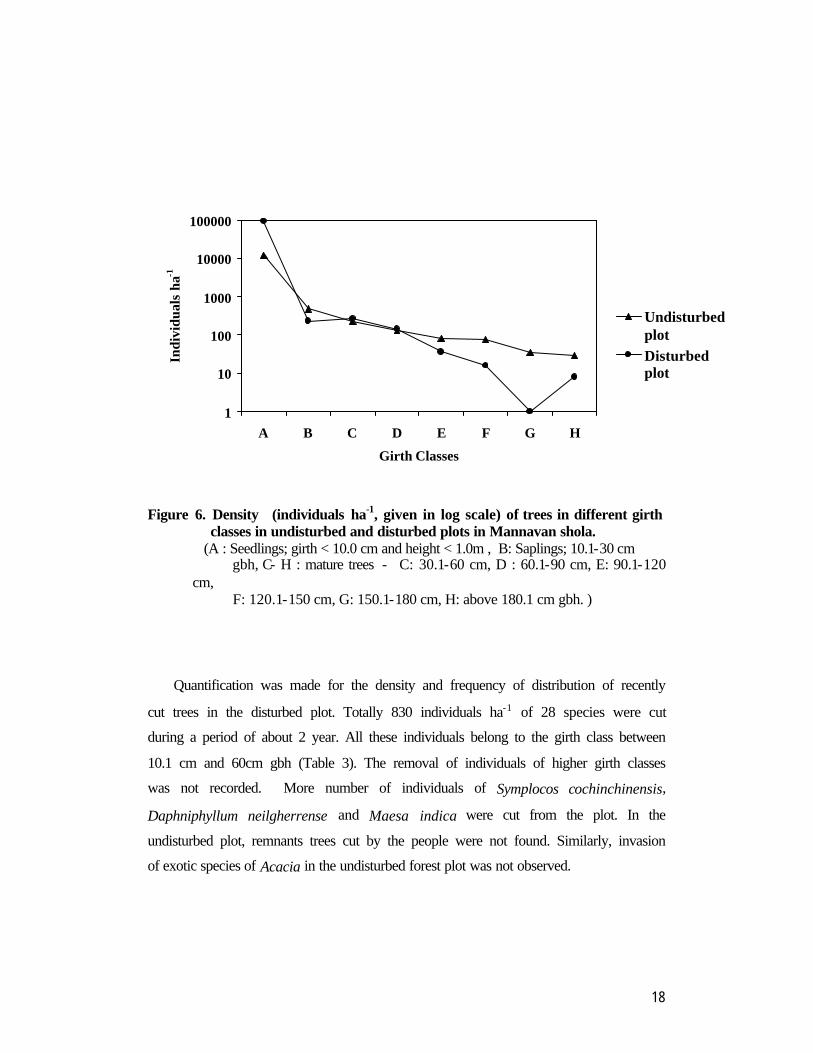
Quantification was made for the density and frequency of distribution of recently
cut trees in the disturbed plot. Totally 830 individuals ha-1 of 28 species were cut
during a period of about 2 year. All these individuals belong to the girth class between
10.1 cm and 60cm gbh (Table 3). The removal of individuals of higher girth classes
was not recorded. More number of individuals of Symplocos cochinchinensis,
Daphniphyllum neilgherrense and Maesa indica were cut from the plot. In the
undisturbed plot, remnants trees cut by the people were not found. Similarly, invasion
of exotic species of Acacia in the undisturbed forest plot was not observed.
19
Table 3. Density and frequency of distribution of cut trees in the disturbed plot of Mannavan shola.
Species Frequency (%) of
distribution of cut trees
Density (individuals ha-1) of cut trees
10-30 cm gbh 30.1-60 cm gbh
Symplocos cochinchinensis 80 225 95 Daphniphyllum neilgherrense 45 85 15 Maesa indica 30 50 0 Syzygium cumini 30 40 0 Litsea wightiana 25 35 5 Alstonia venulata 20 10 0 Glochidion neilgherrense 20 20 0 Acacia dealbata 15 15 0 Photinia integrifolia 15 10 10 Strobilanthes homotropa 15 30 0 Acronychia pedunculata 10 10 0 Alseodaphne semecarpifolia 10 20 10 Eurya nitida 10 10 0 Mastixia arborea 10 20 0 Persea macrantha 10 15 10 Syzygium caryophyllatum 10 10 0 Turpinia cochinchinensis 10 15 0 Viburnum coriaceum 10 10 0 Beilschmiedia wightii 5 10 0 Celtis tetrandra 5 5 0 Chionanthus linocieroides 5 5 0 Cyathea nilgiriensis 5 0 5 Neolitsea cassia 5 5 0 Rapanea wightiana 5 5 0 Saprosma foetens 5 5 0 Sarcococca coriacea 5 5 0 Syzygium densiflorum 5 5 0 Vaccinium leschenaultii 5 5 0
Total 680 150
20
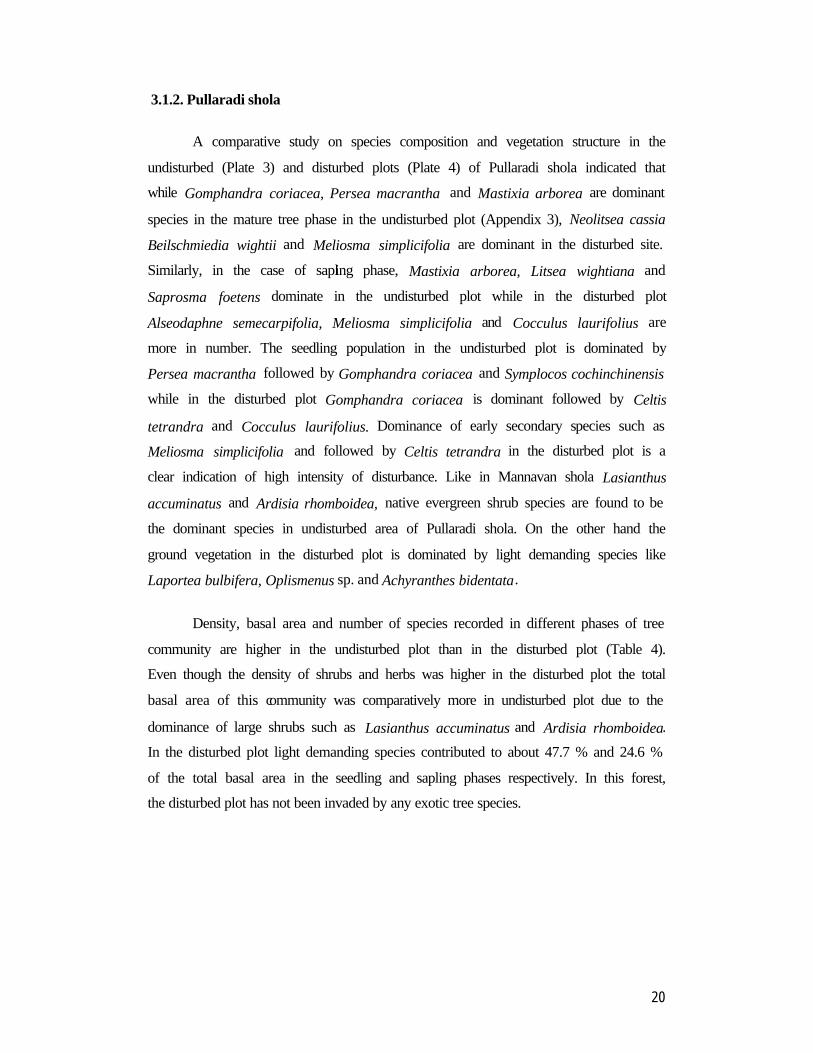
3.1.2. Pullaradi shola
A comparative study on species composition and vegetation structure in the
undisturbed (Plate 3) and disturbed plots (Plate 4) of Pullaradi shola indicated that
while Gomphandra coriacea, Persea macrantha and Mastixia arborea are dominant
species in the mature tree phase in the undisturbed plot (Appendix 3), Neolitsea cassia
Beilschmiedia wightii and Meliosma simplicifolia are dominant in the disturbed site.
Similarly, in the case of sapling phase, Mastixia arborea, Litsea wightiana and
Saprosma foetens dominate in the undisturbed plot while in the disturbed plot
Alseodaphne semecarpifolia, Meliosma simplicifolia and Cocculus laurifolius are
more in number. The seedling population in the undisturbed plot is dominated by
Persea macrantha followed by Gomphandra coriacea and Symplocos cochinchinensis
while in the disturbed plot Gomphandra coriacea is dominant followed by Celtis
tetrandra and Cocculus laurifolius. Dominance of early secondary species such as
Meliosma simplicifolia and followed by Celtis tetrandra in the disturbed plot is a
clear indication of high intensity of disturbance. Like in Mannavan shola Lasianthus
accuminatus and Ardisia rhomboidea, native evergreen shrub species are found to be
the dominant species in undisturbed area of Pullaradi shola. On the other hand the
ground vegetation in the disturbed plot is dominated by light demanding species like
Laportea bulbifera, Oplismenus sp. and Achyranthes bidentata.
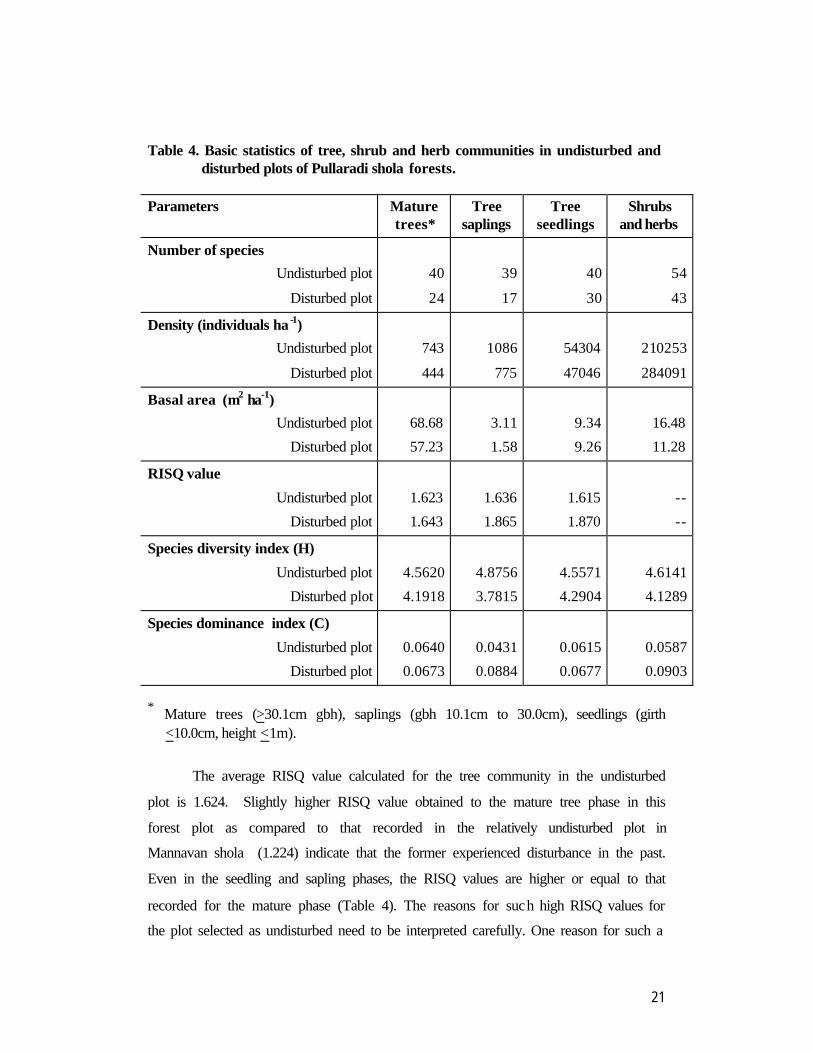
Density, basal area and number of species recorded in different phases of tree
community are higher in the undisturbed plot than in the disturbed plot (Table 4).
Even though the density of shrubs and herbs was higher in the disturbed plot the total
basal area of this community was comparatively more in undisturbed plot due to the
dominance of large shrubs such as Lasianthus accuminatus and Ardisia rhomboidea.
In the disturbed plot light demanding species contributed to about 47.7 % and 24.6 %
of the total basal area in the seedling and sapling phases respectively. In this forest,
the disturbed plot has not been invaded by any exotic tree species.
21
Table 4. Basic statistics of tree, shrub and herb communities in undisturbed and disturbed plots of Pullaradi shola forests.
Parameters Mature
trees* Tree
saplings Tree
seedlings Shrubs
and herbs
Number of species
Undisturbed plot
Disturbed plot
40
24
39
17
40
30
54
43
Density (individuals ha -1)
Undisturbed plot
Disturbed plot
743
444
1086
775
54304
47046
210253
284091
Basal area (m2 ha-1)
Undisturbed plot
Disturbed plot
68.68
57.23
3.11
1.58
9.34
9.26
16.48
11.28
RISQ value
Undisturbed plot
Disturbed plot
1.623
1.643
1.636
1.865
1.615
1.870
--
--
Species diversity index (H)
Undisturbed plot
Disturbed plot
4.5620
4.1918
4.8756
3.7815
4.5571
4.2904
4.6141
4.1289
Species dominance index (C)
Undisturbed plot
Disturbed plot
0.0640
0.0673
0.0431
0.0884
0.0615
0.0677
0.0587
0.0903 * Mature trees (>30.1cm gbh), saplings (gbh 10.1cm to 30.0cm), seedlings (girth
<10.0cm, height <1m).
The average RISQ value calculated for the tree community in the undisturbed
plot is 1.624. Slightly higher RISQ value obtained to the mature tree phase in this
forest plot as compared to that recorded in the relatively undisturbed plot in
Mannavan shola (1.224) indicate that the former experienced disturbance in the past.
Even in the seedling and sapling phases, the RISQ values are higher or equal to that
recorded for the mature phase (Table 4). The reasons for such high RISQ values for
the plot selected as undisturbed need to be interpreted carefully. One reason for such a
22
high value could be the small size of the forest, which can slow down the progressive
succession subsequent to disturbances in the past. In fact, there are a few small areas
randomly distributed in the plot where the ground vegetation appeared to be cleared
for the reasons unknown. In addition, stray incidences of grazing have been reported.
Such a small-scale random and infrequent disturbance to the ground vegetation may
also be responsible for the slightly higher values for the RISQ of seedling and sapling
communities in the plot. RISQ value obtained for the disturbed plot is comparatively
higher than in undisturbed plot. However, such a difference is not as prominent as
seen in Mannavan shola. Even the similarity index values obtained for the mature
trees (0.625), seedlings (0.743) and shrub and herb community (0.508) in Pullaradi
shola indicate that there is no sharp difference between the plots selected as
undisturbed and disturbed. Even in the disturbed plot, a difference among mature tree
phase, sapling phase and seedling phase was recorded for the RISQ values. RISQ
value obtained for the mature tree phase (1.643) is much lower than those of seedling
and sapling communities indicating the fact that the disturbance is a recent action that
affected only the vegetation structure of the seedlings, saplings, shrubs and herbs
communities.
Undisturbed plot in Pullaradi shola can be considered as a mixed forest patch
with no major dominance of any one species as indicated by high species diversity
and low species dominance values (Table 4). Contrary to this, the disturbed plot of
this forest shows a tendency towards the over-dominance of one or few species as
indicated by the low species diversity and high species dominance values.
Detailed comparison of girth class distribution of all species in both plots
indicated that dominant species are represented in all girth classes (Appendix 4). In
the undisturbed plot about 38% of tree species represented in all three phases i.e.
seedling, sapling and mature phases. On the other hand in the disturbed plot, only
15% of tree species represented in all three phases. While 33% of species are not
represented in the seedling stage in the undisturbed plot as many as only 25% species
in the disturbed plot are absent in the seedling phase. This observation confirms the
view that the closed canopy nature of undisturbed forest plots do not provide suitable
microsites for many species to regenerate and recruit seedling, whereas moderate
disturbance alter the microenvironment which favour the regeneration more number
23
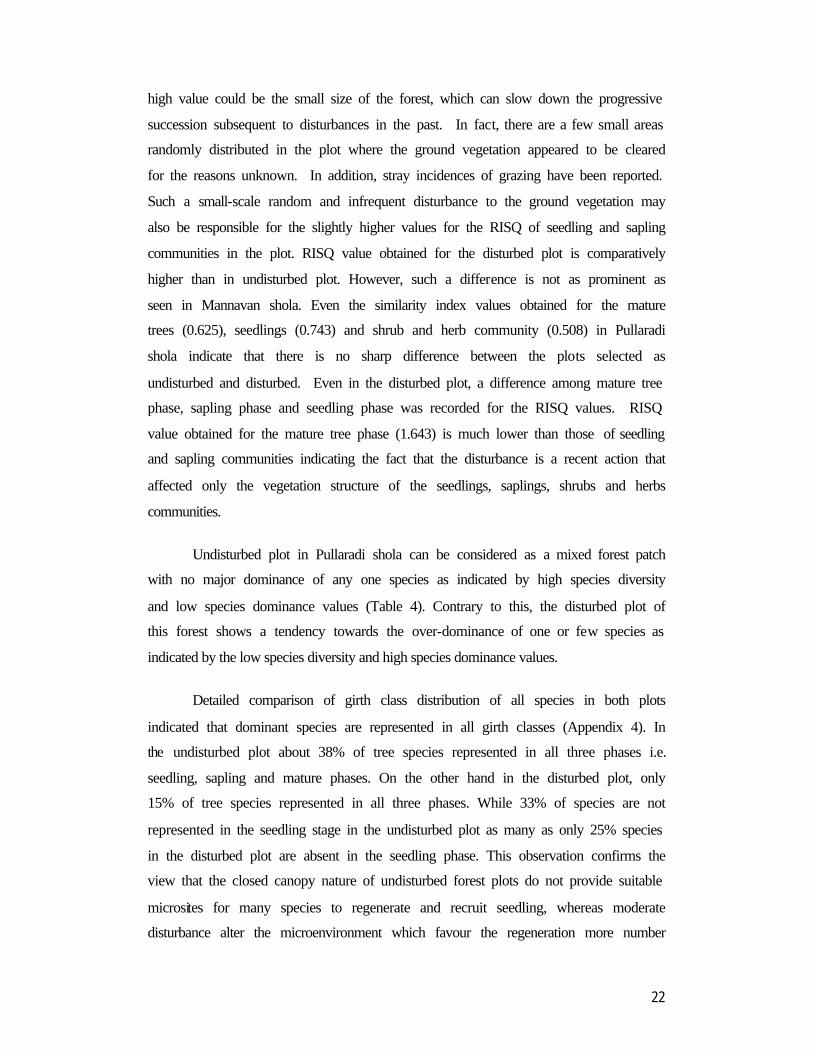
species. It may be pointed out that, in general, density of trees in sapling and different
girth classes in the mature phase is lesser in the disturbed plot than in the undisturbed
plot (Figure 7).
1
10
100
1000
10000
100000
A B C D E F G H
Girth classes
Indi
vidu
als
ha-1
UndisturbedplotDisturbedplot
Figure 7. Density (individuals ha-1, given in log scale) of trees in different girth classes in undisturbed and disturbed plots in Pullaradi shola.
(A : Seedlings; girth < 10.0 cm and height < 1.0m , B: Saplings; 10.1-30 cm gbh, C- H : mature trees - C: 30.1-60 cm, D : 60.1-90 cm, E: 90.1-120
cm, F: 120.1-150 cm, G: 150.1-180 cm, H: above 180.1 cm gbh. )
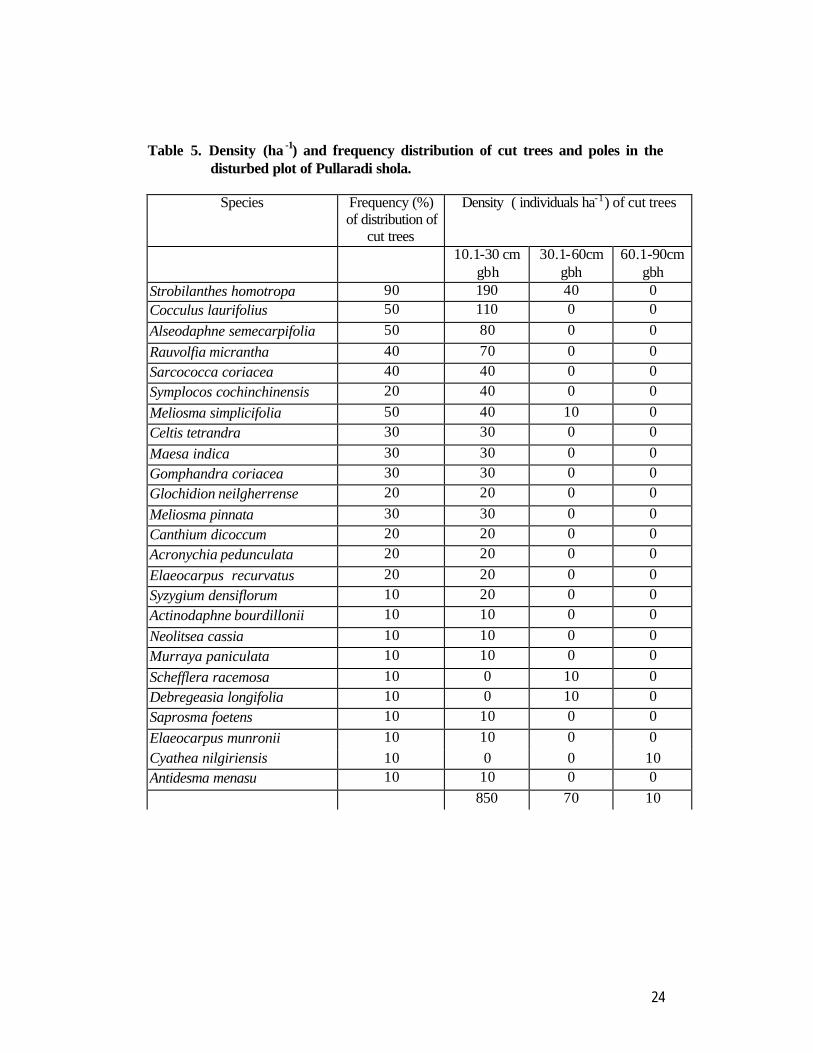
Density and frequency of distribution of cut trees and poles in the disturbed
plot were quantified. Totally 930 individuals ha -1 belonging to 25 species cut during
two year period were recorded (Table 5). All these individuals come under the girth
class 10.1cm to 90.0 cm gbh. Removal of individuals of higher girth classes was not
noted. In the undisturbed plot there were no signs of cut trees and poles indicating that
there is no disturbance to this patch of forests in the recent past.
24
Table 5. Density (ha -1) and frequency distribution of cut trees and poles in the disturbed plot of Pullaradi shola.
Species Frequency (%)
of distribution of cut trees
Density ( individuals ha-1) of cut trees
10.1-30 cm gbh
30.1-60cm gbh
60.1-90cm gbh
Strobilanthes homotropa 90 190 40 0 Cocculus laurifolius 50 110 0 0 Alseodaphne semecarpifolia 50 80 0 0 Rauvolfia micrantha 40 70 0 0 Sarcococca coriacea 40 40 0 0 Symplocos cochinchinensis 20 40 0 0 Meliosma simplicifolia 50 40 10 0 Celtis tetrandra 30 30 0 0 Maesa indica 30 30 0 0 Gomphandra coriacea 30 30 0 0 Glochidion neilgherrense 20 20 0 0 Meliosma pinnata 30 30 0 0 Canthium dicoccum 20 20 0 0 Acronychia pedunculata 20 20 0 0 Elaeocarpus recurvatus 20 20 0 0 Syzygium densiflorum 10 20 0 0 Actinodaphne bourdillonii 10 10 0 0 Neolitsea cassia 10 10 0 0 Murraya paniculata 10 10 0 0 Schefflera racemosa 10 0 10 0 Debregeasia longifolia 10 0 10 0 Saprosma foetens 10 10 0 0 Elaeocarpus munronii 10 10 0 0 Cyathea nilgiriensis 10 0 0 10 Antidesma menasu 10 10 0 0
850 70 10
25
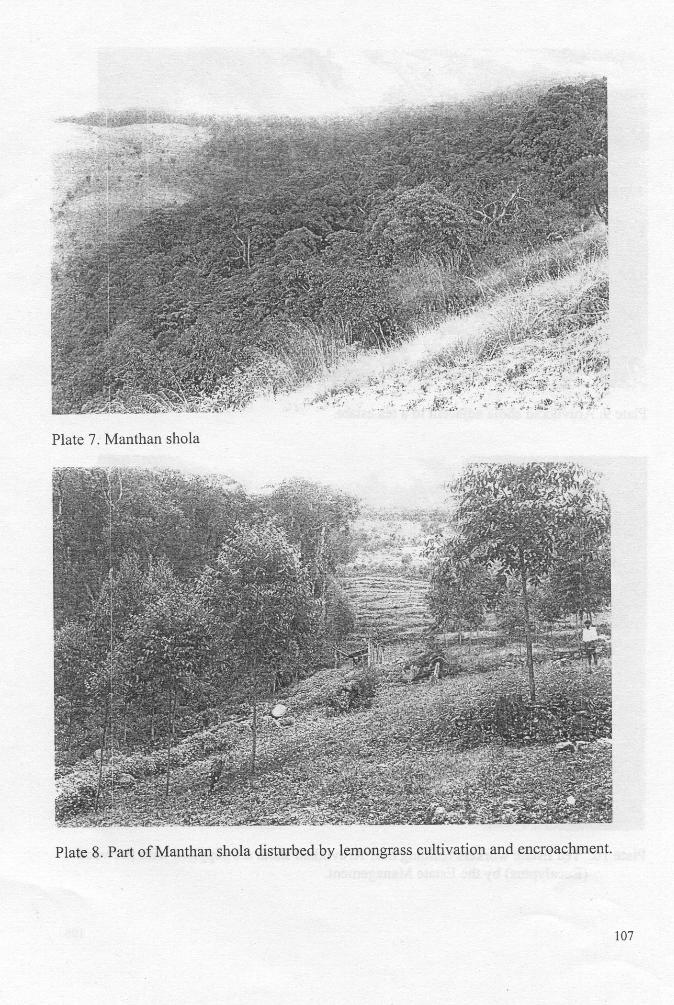
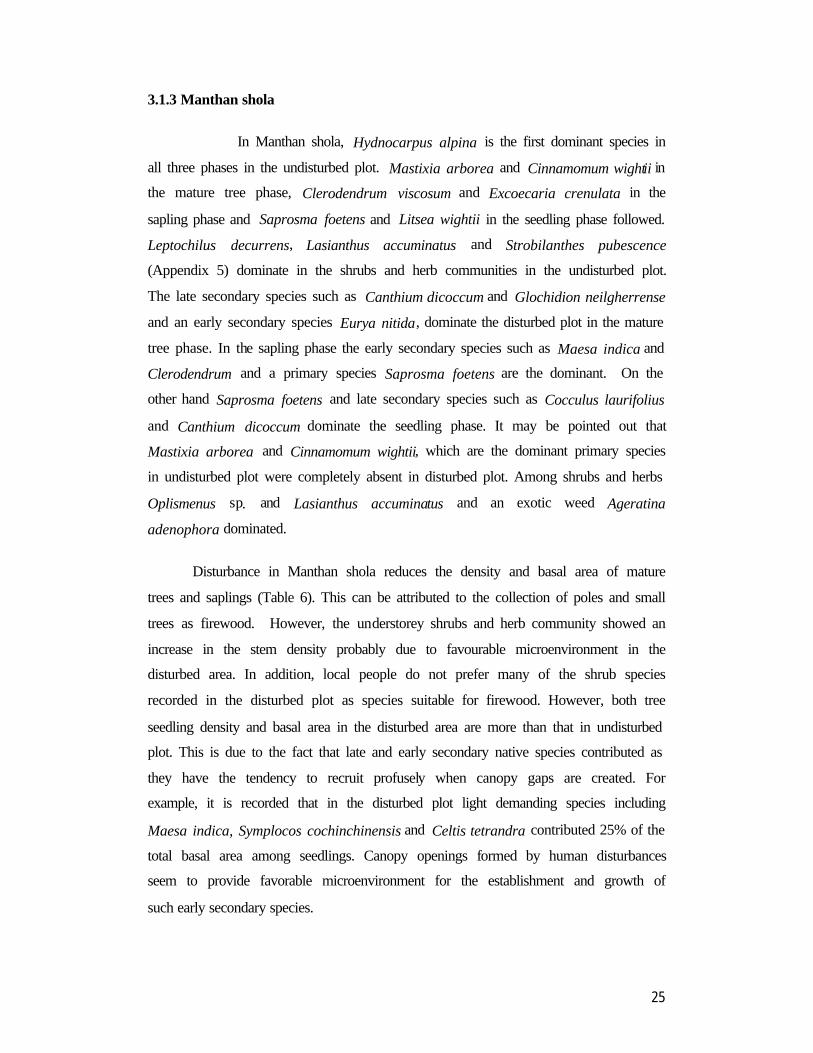
3.1.3 Manthan shola
In Manthan shola, Hydnocarpus alpina is the first dominant species in
all three phases in the undisturbed plot. Mastixia arborea and Cinnamomum wightii in
the mature tree phase, Clerodendrum viscosum and Excoecaria crenulata in the
sapling phase and Saprosma foetens and Litsea wightii in the seedling phase followed.
Leptochilus decurrens, Lasianthus accuminatus and Strobilanthes pubescence
(Appendix 5) dominate in the shrubs and herb communities in the undisturbed plot.
The late secondary species such as Canthium dicoccum and Glochidion neilgherrense
and an early secondary species Eurya nitida, dominate the disturbed plot in the mature
tree phase. In the sapling phase the early secondary species such as Maesa indica and
Clerodendrum and a primary species Saprosma foetens are the dominant. On the
other hand Saprosma foetens and late secondary species such as Cocculus laurifolius
and Canthium dicoccum dominate the seedling phase. It may be pointed out that
Mastixia arborea and Cinnamomum wightii, which are the dominant primary species
in undisturbed plot were completely absent in disturbed plot. Among shrubs and herbs
Oplismenus sp. and Lasianthus accuminatus and an exotic weed Ageratina
adenophora dominated.
Disturbance in Manthan shola reduces the density and basal area of mature
trees and saplings (Table 6). This can be attributed to the collection of poles and small
trees as firewood. However, the understorey shrubs and herb community showed an
increase in the stem density probably due to favourable microenvironment in the
disturbed area. In addition, local people do not prefer many of the shrub species
recorded in the disturbed plot as species suitable for firewood. However, both tree
seedling density and basal area in the disturbed area are more than that in undisturbed
plot. This is due to the fact that late and early secondary native species contributed as
they have the tendency to recruit profusely when canopy gaps are created. For
example, it is recorded that in the disturbed plot light demanding species including
Maesa indica, Symplocos cochinchinensis and Celtis tetrandra contributed 25% of the
total basal area among seedlings. Canopy openings formed by human disturbances
seem to provide favorable microenvironment for the establishment and growth of
such early secondary species.
26
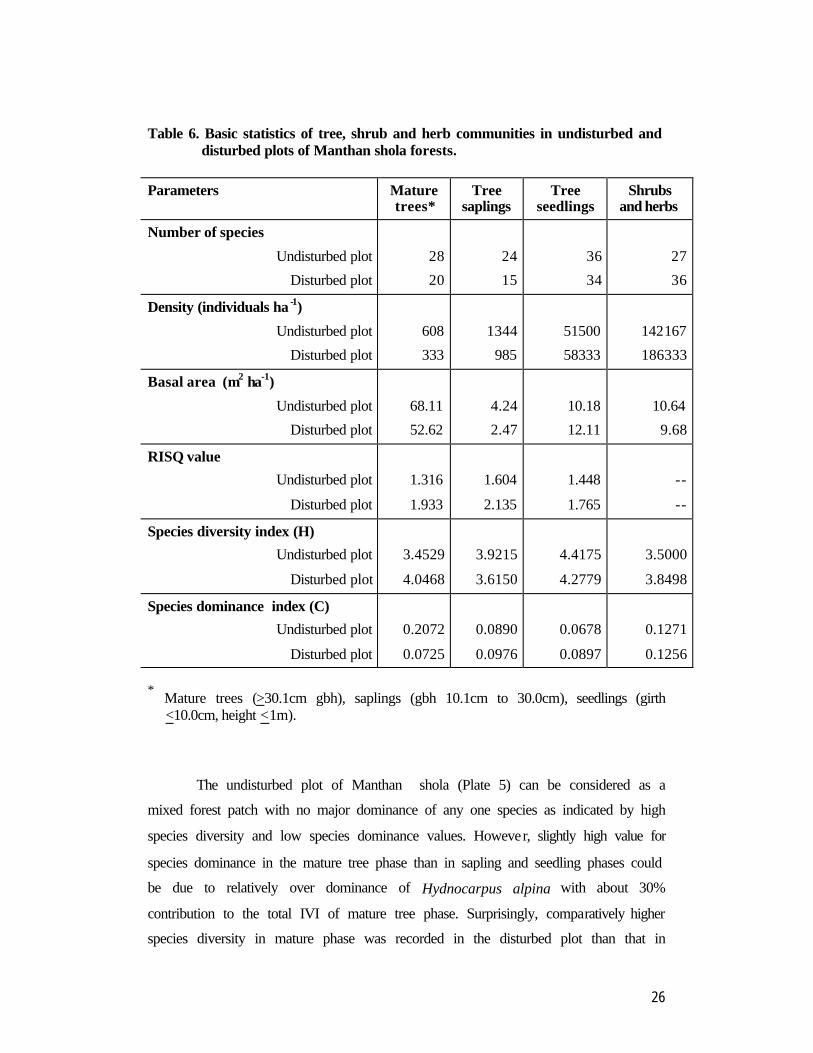
Table 6. Basic statistics of tree, shrub and herb communities in undisturbed and
disturbed plots of Manthan shola forests.
Parameters Mature trees*
Tree saplings
Tree seedlings
Shrubs and herbs
Number of species
Undisturbed plot
Disturbed plot
28
20
24
15
36
34
27
36
Density (individuals ha -1)
Undisturbed plot
Disturbed plot
608
333
1344
985
51500
58333
142167
186333
Basal area (m2 ha-1)
Undisturbed plot
Disturbed plot
68.11
52.62
4.24
2.47
10.18
12.11
10.64
9.68
RISQ value
Undisturbed plot
Disturbed plot
1.316
1.933
1.604
2.135
1.448
1.765
--
--
Species diversity index (H)
Undisturbed plot
Disturbed plot
3.4529
4.0468
3.9215
3.6150
4.4175
4.2779
3.5000
3.8498
Species dominance index (C)
Undisturbed plot
Disturbed plot
0.2072
0.0725
0.0890
0.0976
0.0678
0.0897
0.1271
0.1256 * Mature trees (>30.1cm gbh), saplings (gbh 10.1cm to 30.0cm), seedlings (girth
<10.0cm, height <1m).
The undisturbed plot of Manthan shola (Plate 5) can be considered as a
mixed forest patch with no major dominance of any one species as indicated by high
species diversity and low species dominance values. However, slightly high value for
species dominance in the mature tree phase than in sapling and seedling phases could
be due to relatively over dominance of Hydnocarpus alpina with about 30%
contribution to the total IVI of mature tree phase. Surprisingly, comparatively higher
species diversity in mature phase was recorded in the disturbed plot than that in
27
undisturbed plot. This may be due to the reduction in the dominance of Hydnocarpus
alpina and no significant dominance of any late secondary species in the plot. The
disturbed plot of this forest shows a tendency towards the over-dominance of one or
few species in the seedling and sapling phase as indicated by the low species diversity
and high species dominance values.
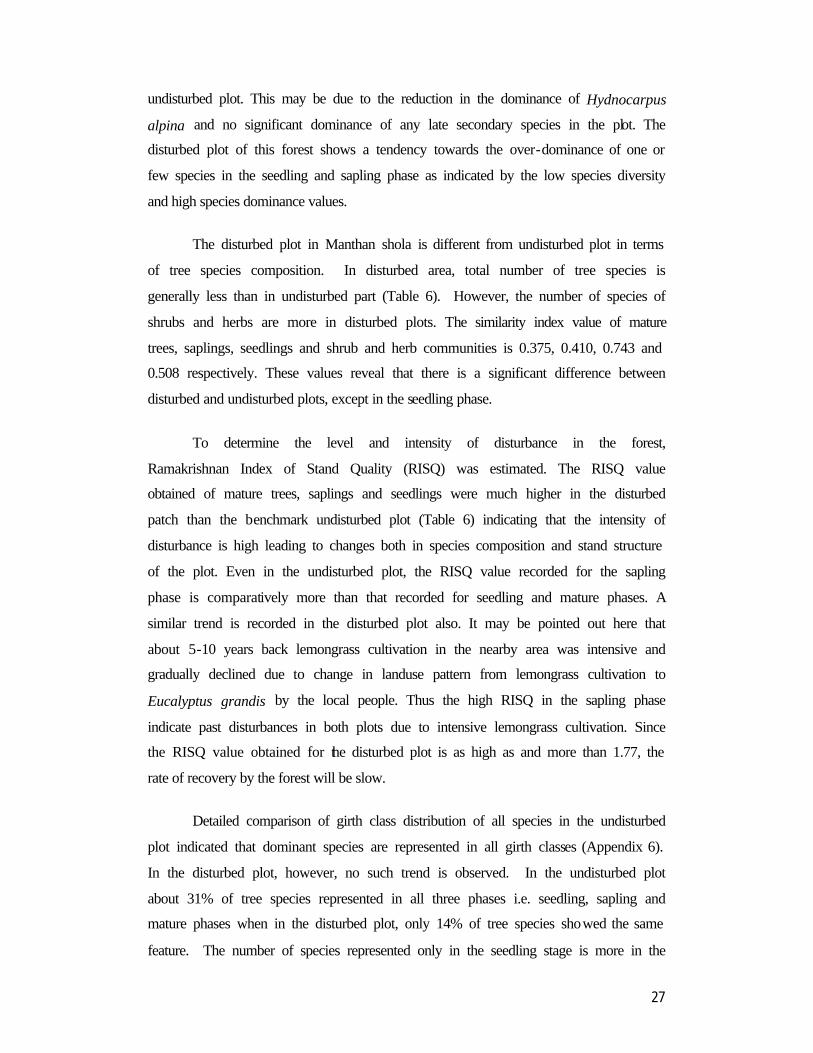
The disturbed plot in Manthan shola is different from undisturbed plot in terms
of tree species composition. In disturbed area, total number of tree species is
generally less than in undisturbed part (Table 6). However, the number of species of
shrubs and herbs are more in disturbed plots. The similarity index value of mature
trees, saplings, seedlings and shrub and herb communities is 0.375, 0.410, 0.743 and
0.508 respectively. These values reveal that there is a significant difference between
disturbed and undisturbed plots, except in the seedling phase.
To determine the level and intensity of disturbance in the forest,
Ramakrishnan Index of Stand Quality (RISQ) was estimated. The RISQ value
obtained of mature trees, saplings and seedlings were much higher in the disturbed
patch than the benchmark undisturbed plot (Table 6) indicating that the intensity of
disturbance is high leading to changes both in species composition and stand structure
of the plot. Even in the undisturbed plot, the RISQ value recorded for the sapling
phase is comparatively more than that recorded for seedling and mature phases. A
similar trend is recorded in the disturbed plot also. It may be pointed out here that
about 5-10 years back lemongrass cultivation in the nearby area was intensive and
gradually declined due to change in landuse pattern from lemongrass cultivation to
Eucalyptus grandis by the local people. Thus the high RISQ in the sapling phase
indicate past disturbances in both plots due to intensive lemongrass cultivation. Since
the RISQ value obtained for the disturbed plot is as high as and more than 1.77, the
rate of recovery by the forest will be slow.
Detailed comparison of girth class distribution of all species in the undisturbed
plot indicated that dominant species are represented in all girth classes (Appendix 6).
In the disturbed plot, however, no such trend is observed. In the undisturbed plot
about 31% of tree species represented in all three phases i.e. seedling, sapling and
mature phases when in the disturbed plot, only 14% of tree species showed the same
feature. The number of species represented only in the seedling stage is more in the
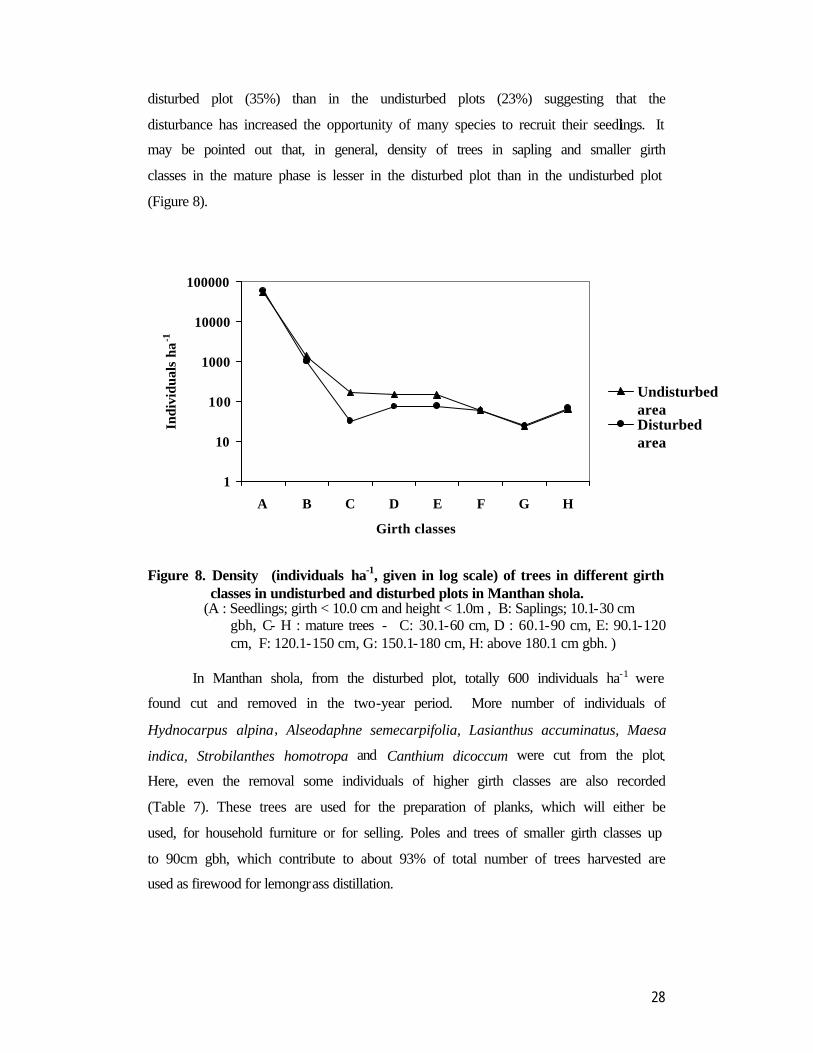
28
disturbed plot (35%) than in the undisturbed plots (23%) suggesting that the
disturbance has increased the opportunity of many species to recruit their seedlings. It
may be pointed out that, in general, density of trees in sapling and smaller girth
classes in the mature phase is lesser in the disturbed plot than in the undisturbed plot
(Figure 8).
1
10
100
1000
10000
100000
A B C D E F G H
Girth classes
Indi
vidu
als
ha-1
UndisturbedareaDisturbedarea
Figure 8. Density (individuals ha-1, given in log scale) of trees in different girth
classes in undisturbed and disturbed plots in Manthan shola. (A : Seedlings; girth < 10.0 cm and height < 1.0m , B: Saplings; 10.1-30 cm
gbh, C- H : mature trees - C: 30.1-60 cm, D : 60.1-90 cm, E: 90.1-120 cm, F: 120.1-150 cm, G: 150.1-180 cm, H: above 180.1 cm gbh. )
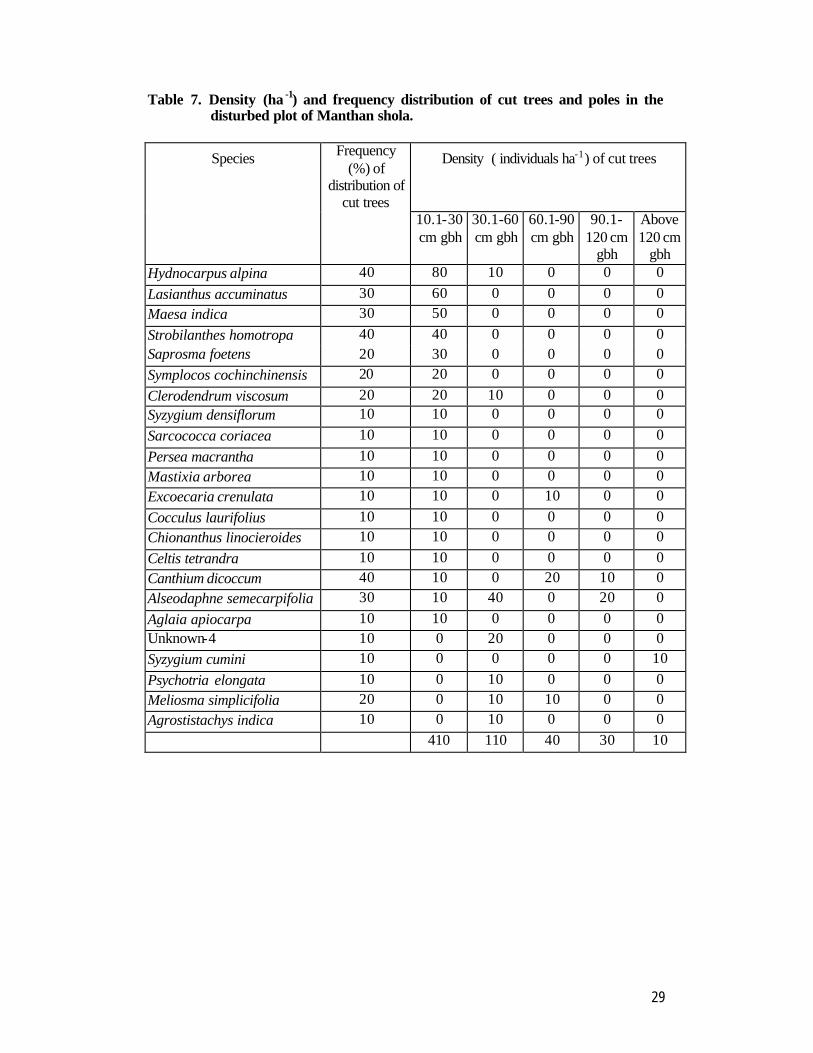
In Manthan shola, from the disturbed plot, totally 600 individuals ha-1 were
found cut and removed in the two-year period. More number of individuals of
Hydnocarpus alpina, Alseodaphne semecarpifolia, Lasianthus accuminatus, Maesa
indica, Strobilanthes homotropa and Canthium dicoccum were cut from the plot.
Here, even the removal some individuals of higher girth classes are also recorded
(Table 7). These trees are used for the preparation of planks, which will either be
used, for household furniture or for selling. Poles and trees of smaller girth classes up
to 90cm gbh, which contribute to about 93% of total number of trees harvested are
used as firewood for lemongrass distillation.
29
Table 7. Density (ha -1) and frequency distribution of cut trees and poles in the disturbed plot of Manthan shola.
Species Frequency (%) of
distribution of cut trees
Density ( individuals ha-1) of cut trees
10.1-30 cm gbh
30.1-60 cm gbh
60.1-90 cm gbh
90.1-120 cm
gbh
Above 120 cm
gbh Hydnocarpus alpina 40 80 10 0 0 0 Lasianthus accuminatus 30 60 0 0 0 0 Maesa indica 30 50 0 0 0 0 Strobilanthes homotropa 40 40 0 0 0 0 Saprosma foetens 20 30 0 0 0 0 Symplocos cochinchinensis 20 20 0 0 0 0 Clerodendrum viscosum 20 20 10 0 0 0 Syzygium densiflorum 10 10 0 0 0 0 Sarcococca coriacea 10 10 0 0 0 0 Persea macrantha 10 10 0 0 0 0 Mastixia arborea 10 10 0 0 0 0 Excoecaria crenulata 10 10 0 10 0 0 Cocculus laurifolius 10 10 0 0 0 0 Chionanthus linocieroides 10 10 0 0 0 0 Celtis tetrandra 10 10 0 0 0 0 Canthium dicoccum 40 10 0 20 10 0 Alseodaphne semecarpifolia 30 10 40 0 20 0 Aglaia apiocarpa 10 10 0 0 0 0 Unknown-4 10 0 20 0 0 0 Syzygium cumini 10 0 0 0 0 10 Psychotria elongata 10 0 10 0 0 0 Meliosma simplicifolia 20 0 10 10 0 0 Agrostistachys indica 10 0 10 0 0 0
410 110 40 30 10
30
3.1.4 Aruvikkad shola
As already mentioned in the section Methodology, since there are no undisturbed
forest plots near to Aruvikkad shola, its floristic structure and composition was
compared with those of undisturbed plots of Mannavan shola. The mature tree phase
of Aruvikkad shola is dominated by light demanding species Clerodendrum viscosum
and Syzygium densiflorum followed by a primary species Phoebe lanceolata
(Appendix 7). Even in the sapling phase Clerodendrum viscosum is dominant
followed by Phoebe lanceolata and Actinodaphne bourdillonii. When the tree
seedling phase is considered, Elaeocarpus munronii, Litsea wightiana and
Gomphandra coriacea- all primary species are dominant. Contribution of the early
secondary species to the total IVI is more in the sapling (38%) and mature (24%)
phases indicating past disturbances in the plot. There is a significant difference
between Mannavan shola undisturbed plot and the Aruvikkad plot as evidence by
similarity index values for mature trees (0.442), saplings ((0.361), seedlings (0.455)
and shrubs and herb categories (0.444). This also reveals that the disturbance in this
shola forest has led to change in the species composition. The dominance of early
secondary shrubs such as Strobilanthes homotropa and Laportea bulbifera and herb
Elatostema lineolatum in Aruvikkad plot is also an indicator of disturbance. On the
other hand, low contribution by early secondary tree species (18%) to the total IVI of
seedling phase may suggest the fact that this forest plot is free from disturbance in
recent days and is recovering. It may be pointed out that the density and basal area of
all categories of trees in Aruvikkad shola are comparable with those of undisturbed
Mannavan shola plot (Table 8). Higher density and basal area of tree community in
the Aruvikkad plot is again an evidence for no extraction of poles and other biomass
from this forest recently as well as of the forest recovery from past disturbance.
Comparatively poor density and basal area of understorey shrubs and herb community
in the Aruvikkad plot may be an indication of the closing up of canopy by over-storey
saplings and trees.
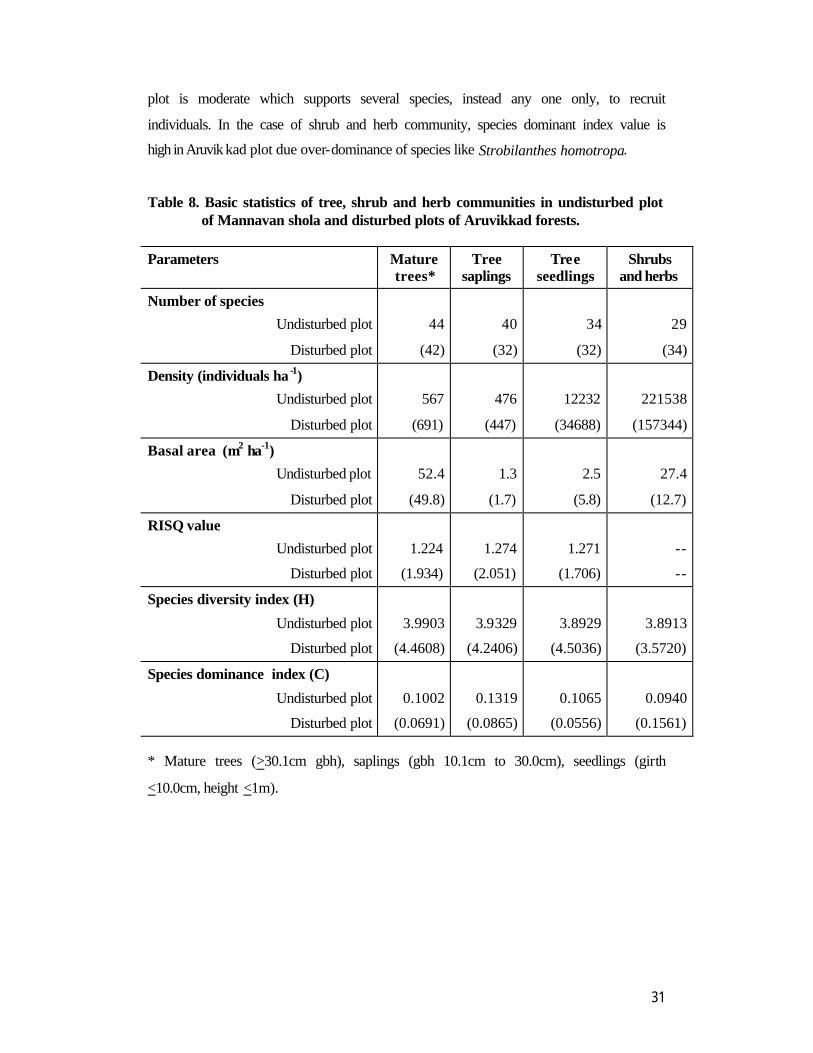
When compared the species diversity value for different categories of trees are
higher in Aruvikkad than at Mannavan shola, plot (Table 8). Contrary to this, species
dominance value is less in Aruvikkad plot. High species diversity and low species
dominance in Aruvikkad plot may be due to the fact the level of disturbance in this
31
plot is moderate which supports several species, instead any one only, to recruit
individuals. In the case of shrub and herb community, species dominant index value is
high in Aruvik kad plot due over-dominance of species like Strobilanthes homotropa.
Table 8. Basic statistics of tree, shrub and herb communities in undisturbed plot of Mannavan shola and disturbed plots of Aruvikkad forests.
Parameters Mature trees*
Tree saplings
Tree seedlings
Shrubs and herbs
Number of species
Undisturbed plot
Disturbed plot
44
(42)
40
(32)
34
(32)
29
(34)
Density (individuals ha -1)
Undisturbed plot
Disturbed plot
567
(691)
476
(447)
12232
(34688)
221538
(157344)
Basal area (m2 ha-1)
Undisturbed plot
Disturbed plot
52.4
(49.8)
1.3
(1.7)
2.5
(5.8)
27.4
(12.7)
RISQ value
Undisturbed plot
Disturbed plot
1.224
(1.934)
1.274
(2.051)
1.271
(1.706)
--
--
Species diversity index (H)
Undisturbed plot
Disturbed plot
3.9903
(4.4608)
3.9329
(4.2406)
3.8929
(4.5036)
3.8913
(3.5720)
Species dominance index (C)
Undisturbed plot
Disturbed plot
0.1002
(0.0691)
0.1319
(0.0865)
0.1065
(0.0556)
0.0940
(0.1561) * Mature trees (>30.1cm gbh), saplings (gbh 10.1cm to 30.0cm), seedlings (girth
<10.0cm, height <1m).
32
The level of disturbance and the present condition of the ecosystem recovery
processes can be further analysed by estimating the RISQ values for mature trees,
saplings and seedling phases individually. In Aruvikkad plot, the RISQ obtained for
all three phases is more than those of undisturbed plot of Mannavan shola (RISQ=
near 1.0) suggesting that the former plot is disturbed. The value obtained for the
saplings is comparatively more than that recorded for mature trees and seedlings
(Table 8). Higher RISQ values for saplings and mature trees suggest that the plot
might have been disturbed in the past i.e., about more than 5 years ago. On the other
hand reduction in the RISQ from sapling to seedling phase indicates that the forest is
recovering from the past disturbance. This also suggests that there is no anthropogenic
disturbance in recent days.
Girth class distribution of Aruvikkad shola forest shows that 40% of species was
represented in all the three phases (Appendix 8). However, about 39% of the species
occur in sapling and/or mature phase but absent in seedling phase. Species such as
Macaranga indica, Mallotus ferrugineus, Rapanea wightiana, Scolopia crenata and
Viburnum sp. are well represented in the seedling phase but their recruitment to
sapling phase is generally poor suggesting the closure of canopy due to absence of
recent disturbance.
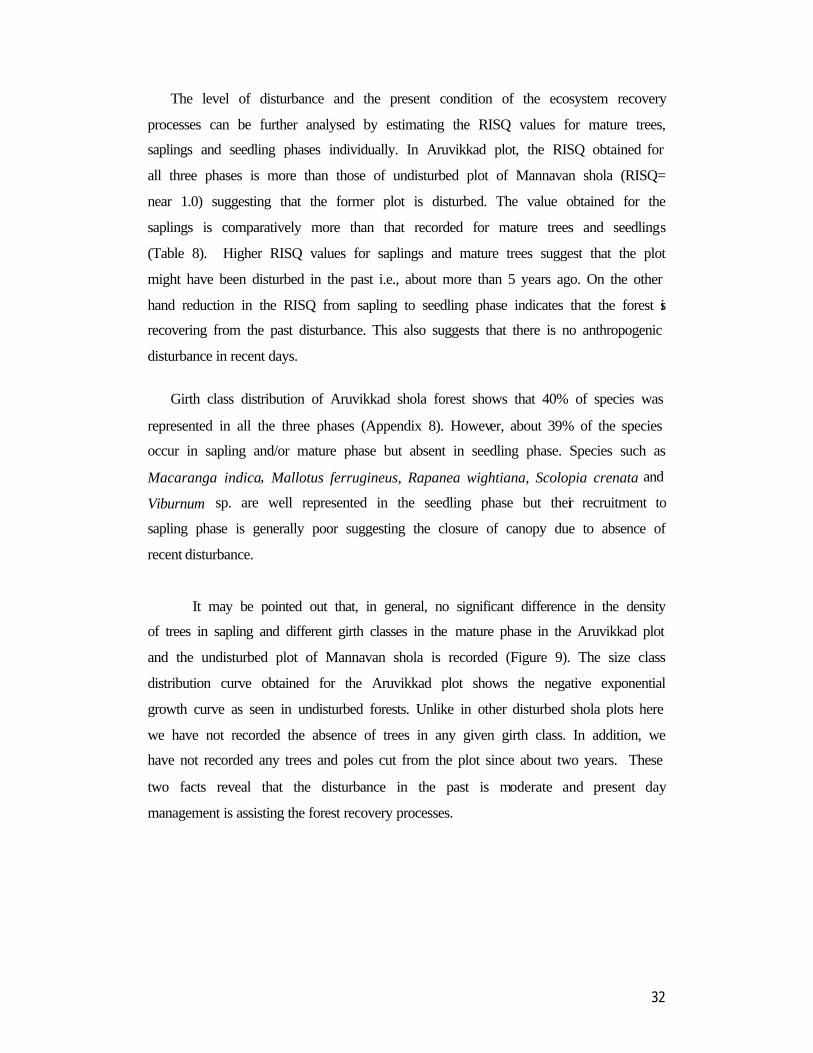
It may be pointed out that, in general, no significant difference in the density
of trees in sapling and different girth classes in the mature phase in the Aruvikkad plot
and the undisturbed plot of Mannavan shola is recorded (Figure 9). The size class
distribution curve obtained for the Aruvikkad plot shows the negative exponential
growth curve as seen in undisturbed forests. Unlike in other disturbed shola plots here
we have not recorded the absence of trees in any given girth class. In addition, we
have not recorded any trees and poles cut from the plot since about two years. These
two facts reveal that the disturbance in the past is moderate and present day
management is assisting the forest recovery processes.
33
1
10
100
1000
10000
100000
A B C D E F G H
Girth classes
Indi
vidu
als
ha-1
Mannavan shola- UndisturbedplotAruvikkad sholaplot
Figure 9. Density (individuals ha-1, given in log scale) of trees in different girth classes in disturbed plots of Aruvikkad shola and undisturbed plots of Mannavan shola.
(A : Seedlings; girth < 10.0 cm and height < 1.0m , B: Saplings; 10.1-30 cm gbh, C- H : mature trees - C: 30.1-60 cm, D : 60.1-90 cm, E: 90.1-120 cm, F: 120.1-150 cm, G: 150.1-180 cm, H: above 180.1 cm gbh. )
34
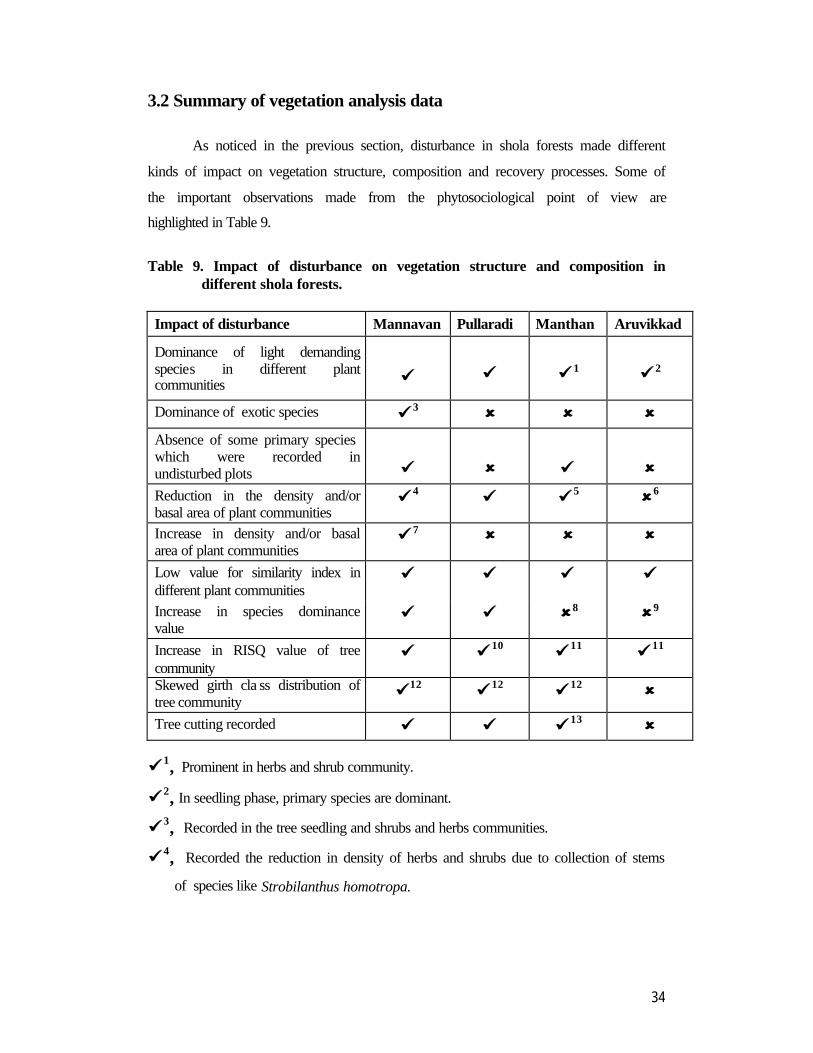
3.2 Summary of vegetation analysis data
As noticed in the previous section, disturbance in shola forests made different
kinds of impact on vegetation structure, composition and recovery processes. Some of
the important observations made from the phytosociological point of view are
highlighted in Table 9.
Table 9. Impact of disturbance on vegetation structure and composition in
different shola forests.
Impact of disturbance Mannavan Pullaradi Manthan Aruvikkad
Dominance of light demanding species in different plant communities
üü
üü
üü 1
üü 2
Dominance of exotic species üü 3 ûû ûû ûû
Absence of some primary species which were recorded in undisturbed plots
üü
ûû
üü
ûû
Reduction in the density and/or basal area of plant communities
üü 4 üü üü 5 ûû6
Increase in density and/or basal area of plant communities
üü 7 ûû ûû ûû
Low value for similarity index in different plant communities
üü üü üü üü
Increase in species dominance value
üü üü ûû8 ûû9
Increase in RISQ value of tree community
üü üü 10 üü 11 üü 11
Skewed girth cla ss distribution of tree community
üü12 üü 12 üü 12 ûû
Tree cutting recorded üü üü üü 13 ûû üü 1, Prominent in herbs and shrub community.
üü 2, In seedling phase, primary species are dominant.
üü 3, Recorded in the tree seedling and shrubs and herbs communities.
üü 4, Recorded the reduction in density of herbs and shrubs due to collection of stems
of species like Strobilanthus homotropa.
35
üü 5, Not recorded in tree seedling and herbs and shrub communities due to
recruitment of more number of individuals of light demanding species.
ûû6, Not recorded due absence of disturbance in recent time.
üü 7, Recorded in tree seedling community due to recruitment of more number of
individuals of light demanding and exotic species
ûû8, In mature tree phase, species dominance value decreased due to reduction in the
dominance of Hydnocarpus alpina.
ûû9, In tree community, species dominance value decreased probably due to the fact
the disturbance in this plot provide favour the recruitment and establishment of
several species.
üü 10, Slightly high in sapling and seedling phases suggesting that the disturbance here
is due to recent action.
üü 11, Slightly high in mature tree and sapling phase suggesting that the plots
experienced disturbance a few years back and the recently disturbance is absent
or light in intensity.
üü 12, Density of trees in sapling and mature trees of small girth classes is less
indicating harvest of poles an small wood by the local people.
üü 13, Even the removal of trees of higher girths classes recorded.
3.3 Socio-economic analysis
The main driving forces behind these disturbances and degradation of forests
stem from human activities. It is possible to distinguish proximate and underlying
causes for the degradation. In general, over exploitation may be identified as
proximate cause, while economic, socio-political and cultural factors may be the
underlying ones behind the activities leading to any forest degradation (Barbier, et.al,
1994; Heywood and Watson, 1995). However, there is no consensus among the social
scientists regarding which underlying factors are contributing more for degradation of
forests. For instance, some social scientists argue that recent population pressure and
expanding markets are responsible for large scale degradation of forests
(Browder,1989; Black, 1989). On the other hand, some others argue that it is the
36
consequence of economic pressure of poverty and under development that have
forced the rural population to adopt pattern of destructive exploitation of the forests
(Gills and Repetto, 1988; Moench, 1989). Another school of thought strongly
maintained that the root cause of the on-going disaster of deforestation lies in the
radical transformation of social system of resource use (Gadgil, 1989). In the case of
shola forests in Kerala, the degradation was closely linked with population increase,
and changes in resource use. In this section an attempt is made to analyze how socio-
economic factors are responsible for the degradation of shola forests.
3.3.1. Socio-economic conditions of the selected households
3.3.1.1 Mannavan Shola
The villages dependent on Mannavan shola are Kanthallur, Perumala, Puthur
and Kolachavayil. Except tribes in Kolachavayil, all other households depending upon
Mannavan shola are Tamil people who migrated from Tamil Nadu. In the selected
100 households of these four villages there are 670 persons of which male and female
constitute 49% and 51% respectively. Children constitute about 20% of the
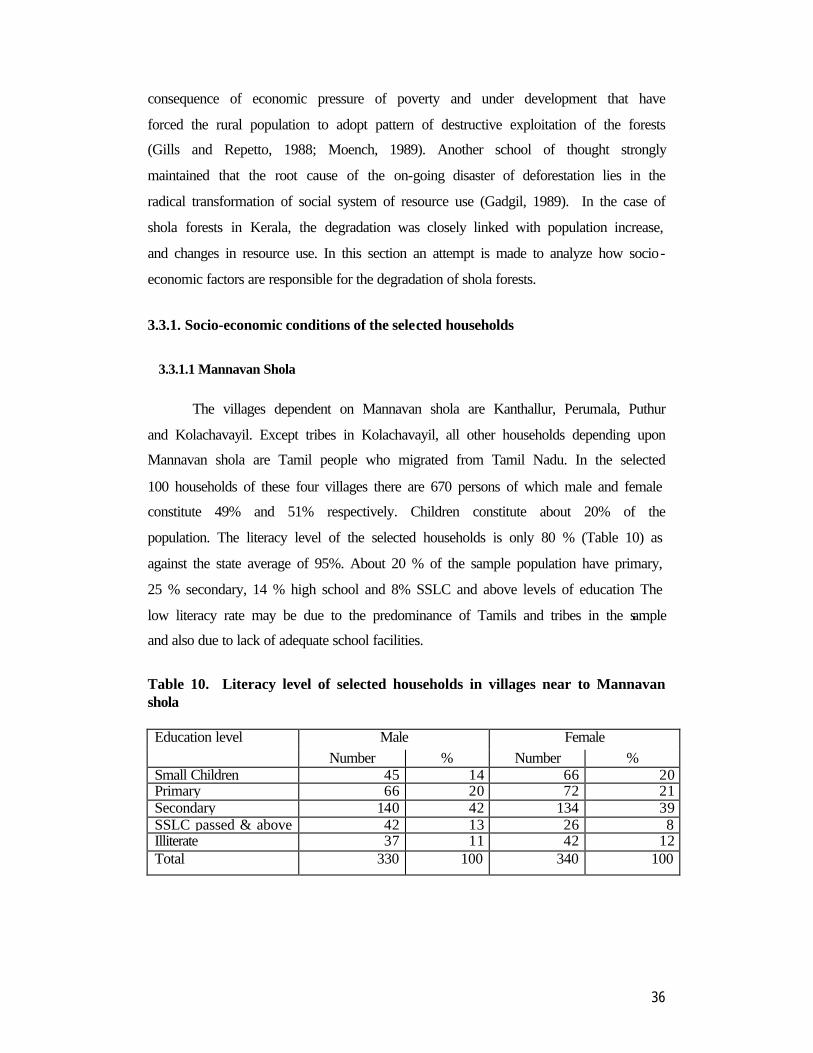
population. The literacy level of the selected households is only 80 % (Table 10) as
against the state average of 95%. About 20 % of the sample population have primary,
25 % secondary, 14 % high school and 8% SSLC and above levels of education The
low literacy rate may be due to the predominance of Tamils and tribes in the sample
and also due to lack of adequate school facilities.
Table 10. Literacy level of selected households in villages near to Mannavan shola
Male Female Education level Number % Number %
Small Children 45 14 66 20 Primary 66 20 72 21 Secondary 140 42 134 39 SSLC passed & above 42 13 26 8 Illiterate 37 11 42 12 Total 330 100 340 100
37
The main occupation of the people (both tribes and non-tribes) is cultivation.
Vegetables and food grains like carrot (Daucus carota ), beetroot (Beta vulgaris),
cabbage (Brassica oleracea), garlic (Allium sativum), ragi (Eleusine coracana), beans
(Phaseolus vulgaris), potato (Solanum tuberosum), ginger (Zingiber officinale) etc.
are cultivated extensively in the area. Lemon grass cultivation is another important
source of income of the people. There are about 295 cattle in the selected area, which
provide a sizeable income to the selected households. In addition, some people get
seasonal jobs, like fire-line work, road construction etc., which are undertaken by the
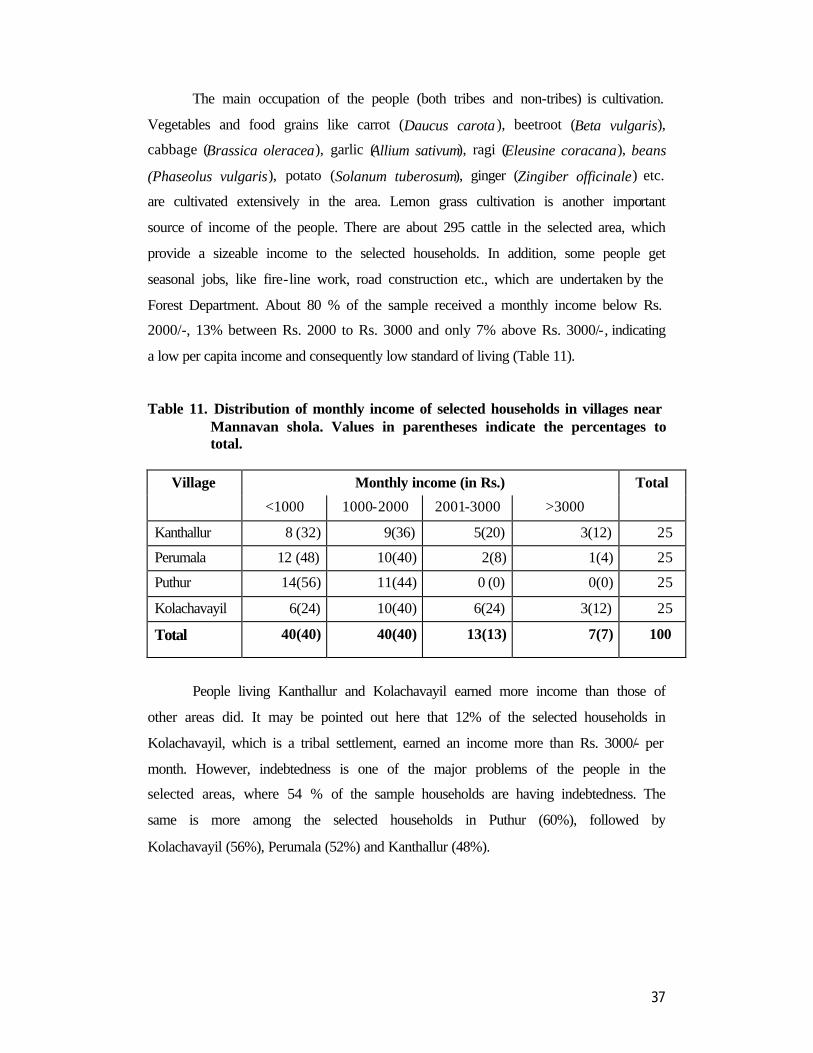
Forest Department. About 80 % of the sample received a monthly income below Rs.
2000/-, 13% between Rs. 2000 to Rs. 3000 and only 7% above Rs. 3000/-, indicating
a low per capita income and consequently low standard of living (Table 11).
Table 11. Distribution of monthly income of selected households in villages near Mannavan shola. Values in parentheses indicate the percentages to total.
Village Monthly income (in Rs.) Total
<1000 1000-2000 2001-3000 >3000
Kanthallur 8 (32) 9(36) 5(20) 3(12) 25
Perumala 12 (48) 10(40) 2(8) 1(4) 25
Puthur 14(56) 11(44) 0 (0) 0(0) 25
Kolachavayil 6(24) 10(40) 6(24) 3(12) 25
Total 40(40) 40(40) 13(13) 7(7) 100
People living Kanthallur and Kolachavayil earned more income than those of
other areas did. It may be pointed out here that 12% of the selected households in
Kolachavayil, which is a tribal settlement, earned an income more than Rs. 3000/- per
month. However, indebtedness is one of the major problems of the people in the
selected areas, where 54 % of the sample households are having indebtedness. The
same is more among the selected households in Puthur (60%), followed by
Kolachavayil (56%), Perumala (52%) and Kanthallur (48%).
38
3.3.1.2 Pullaradi Shola
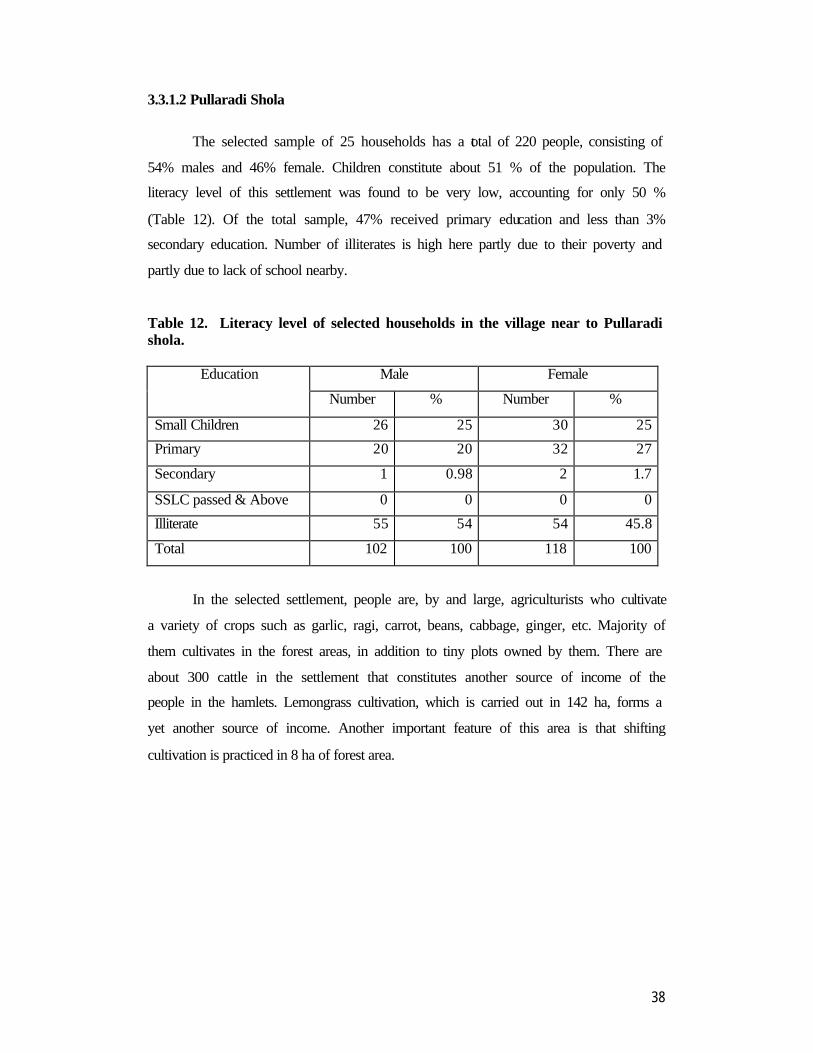
The selected sample of 25 households has a total of 220 people, consisting of
54% males and 46% female. Children constitute about 51 % of the population. The
literacy level of this settlement was found to be very low, accounting for only 50 %
(Table 12). Of the total sample, 47% received primary education and less than 3%
secondary education. Number of illiterates is high here partly due to their poverty and
partly due to lack of school nearby.
Table 12. Literacy level of selected households in the village near to Pullaradi shola.
Male Female Education
Number % Number %
Small Children 26 25 30 25
Primary 20 20 32 27
Secondary 1 0.98 2 1.7
SSLC passed & Above 0 0 0 0
Illiterate 55 54 54 45.8
Total 102 100 118 100
In the selected settlement, people are, by and large, agriculturists who cultivate
a variety of crops such as garlic, ragi, carrot, beans, cabbage, ginger, etc. Majority of
them cultivates in the forest areas, in addition to tiny plots owned by them. There are
about 300 cattle in the settlement that constitutes another source of income of the
people in the hamlets. Lemongrass cultivation, which is carried out in 142 ha, forms a
yet another source of income. Another important feature of this area is that shifting
cultivation is practiced in 8 ha of forest area.
39
3.3.1.3 Aruvikkad
The total 80 selected households consist of 378 persons of which males and
females account for 47% and 53% respectively. Small children account for 7.9 %.
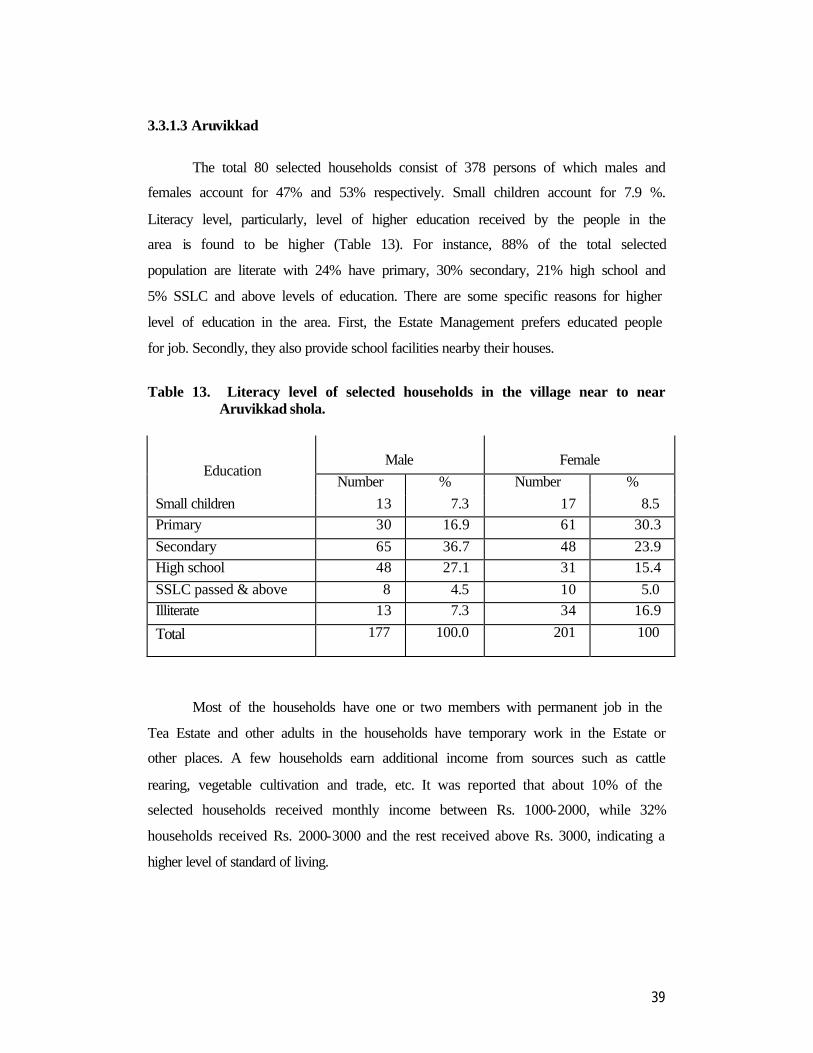
Literacy level, particularly, level of higher education received by the people in the
area is found to be higher (Table 13). For instance, 88% of the total selected
population are literate with 24% have primary, 30% secondary, 21% high school and
5% SSLC and above levels of education. There are some specific reasons for higher
level of education in the area. First, the Estate Management prefers educated people
for job. Secondly, they also provide school facilities nearby their houses.
Table 13. Literacy level of selected households in the village near to near
Aruvikkad shola.
Male
Female
Education Number % Number %
Small children 13 7.3 17 8.5 Primary 30 16.9 61 30.3 Secondary 65 36.7 48 23.9 High school 48 27.1 31 15.4 SSLC passed & above 8 4.5 10 5.0 Illiterate 13 7.3 34 16.9
Total 177 100.0 201 100
Most of the households have one or two members with permanent job in the
Tea Estate and other adults in the households have temporary work in the Estate or
other places. A few households earn additional income from sources such as cattle
rearing, vegetable cultivation and trade, etc. It was reported that about 10% of the
selected households received monthly income between Rs. 1000-2000, while 32%
households received Rs. 2000-3000 and the rest received above Rs. 3000, indicating a
higher level of standard of living.
40
Thus the socio-economic conditions of the people who live near Mannavan
and Pullaradi sholas and those live near the Aruvikkad shola areas are significantly
different. People living near the Mannavan shola and Pullaradi shola area heavily
depend upon land near shola forests for their subsistence, while people in village near
Aruvikkad shola are least depended on forest, as they are primarily wage earners. The
first group (people of villages near Mannavan shola and Pullaradi shola) live in an
unorganized manner, with highly fluctuating income and middlemen quite often
exploit them. On the other hand the interest of the second group (People of village
near Aruvikkad shola) is very much safeguarded by the Estate management. These
differences have implications on their resource utilization and consequently the
degradation of the shola areas. This will be dealt with in the following section.
3.4 Degradation of sholas
3.4.1 Resource use pattern in the past
According to some old people who were interviewed, about 5 decades ago
there were hardly 10 households each located near Mannavan Shola and Pullaradi
shola and depended on these two forests for their livelihood. Mainly they depended on
sholas and it’s neighboring areas in three ways such as shifting cultivation, collectio n
of NWFPs and firewood. The tribal people who live nearby the sholas were basically
shifting cultivators. They practiced similar shifting cultivation practices as done
elsewhere in the country such as clearing of forests with slash and burn techniques, no
tillage, irrigation and fertilizer application except ashes deposited during the burning,
frequent shifting of field, growing of traditional annual crops, etc. In olden days the
cultivation cycle was about 20-25 years. Traditional crops such as chama (Panicum
miliaceum), ragi,, etc. were cultivated. Since there were only limited number of
people who cultivated in the area, this had not altered the ecosystem much.
Collection of NWFPs (nonwood forest produces) was another important
activity of the tribes. Since the collection of NWFPs is a seasonal activity, and honey
was the major NWFP item collected by the tribes, this was not harmful to the
ecosystem. Firewood, which was used mainly for cooking, is another item collected
by the people from the shola. As there were only a limited number of households that
41
used firewood only for cooking, the firewood collection was scanty, resulting in
minimum disturbance to the ecosystem. In short, the major activities of the inhabitants
in olden days had not been harmful to the selected shola areas.
3.4.2 Present resource use pattern
It has been pointed out that the forest areas in the tropical countries are under
severe pressure due to uncontrolled growth of population, followed by unsustainable
use of forest resources. Heavy anthropogenic pressure brings out a series of changes,
including structural changes that ultimately end up in degradation of forests
(Ramakrishnan, et al., 2000). Although this is the basis of most of the disturbance and
degradation of forests, the underlying process varies from place to place. The origin
of the present resource use in the shola areas dates back to early 1970 when migration
of the people from the nearby Tamil Nadu state and southern Kerala began to occur.
According to old people in the area, majority of the migration occurred during 1970’s
and 1980’s. The migrant people possessed the land either by encroaching or by
purchasing from the tribes at a nominal price. They introduced new crops particularly,
vegetables such as cabbage, carrot, beans, etc. which are suitable to the agroclimatic
conditions. They also introduced lemon grass cultivation in the areas, which is a
commercial crop. This crop has both advantages and disadvantages from the point of
view of conservation. The most important advantage is that it helps to prevent soil
conservation. The disadvantage is that large-scale firewood is required for distillation
of lemon grass oil, which resulted in extraction of more firewood from the shola
areas. Rearing cattle is another important activity of the people in the areas and
uncontrolled grazing resulted in poor regeneration of species. In short, population
increase has brought about a significant change in the resource use, manifested by
new cropping pattern, introduction of commercial crops and consequent increase in
use of wood, including firewood cattle raring, shifting cultivation, etc. which resulted
in degradation of shola. Such changes in the resource use by people living near shola
forests such as Mannavan shola, Pullaradi and Manthan shola are depicted in Figure
10. A detailed discussion of this change and its impact on selected areas is held
below.
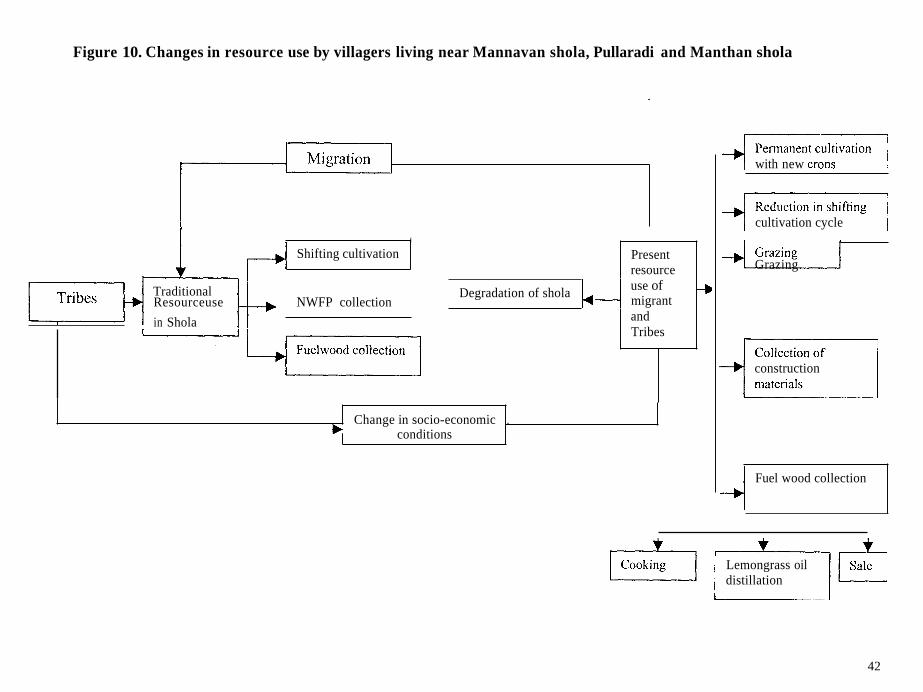
Figure 10. Changes in resource use by villagers living near Mannavan shola, Pullaradi and Manthan shola
Present resource use of migrant and Tribes
Degradation of shola
1 I
-b
Shifting cultivation
+
Traditional
in Shola F H Resourceuse NWFP collection
Change in socio-economic . conditions
Fuelwood collection -L,C__?
with new crom
cultivation cycle
u Grazing
construction
Fuel wood collection -4 Lemongrass oil distillation
42
43
3.4.2.1 Food Crop cultivation pattern
As pointed out earlier, the selected area witnessed migration since 1970. The
migrated farmers had not followed shifting cultivation in their new place partly
because there was no adequate land and partly due to their lack of awareness of
various practices of the shifting cultivation. On the other hand, they introduced a
cropping pattern, which is known to them. The new cropping pattern introduced by
the migrant farmers predominantly consisted of vegetables such as carrot, beans,
cabbage, garlic, ginger etc. These crops are high value crops when compared to most
of the crops in the shifting cultivation, and provided more income to the farmers.
Lured by high profit received by migrant farmers, especially in early years, some of
the tribal people also started the cultivation of these crops in their shifting cultivation
areas, which reduced shifting cultivation in the study area. For instance, in
Goodallarkudi, the shifting cultivation was stopped during 1970’s and 1980’s. As the
newly introduced crops generally require more care, fertilizer and pesticide
application, its cultivation is more capital intensive. Another draw back of these crops
is that they are produced for the markets, which are located far-off. The prices of their
products are often determined by market forces, which, according to them, are not
attractive. Further, the prices of these items are highly fluctuating; for instance, the
prices of cabbage varied between Rs. 2 and Rs. 15 and that of beans between Rs. 4
and Rs. 24 in a year. In the context of price fluctuations, there are instances of market
interventions, to control the price as a result of which their income from agricultural
activities has not been steady. There is considerable evidence that poverty among the
users of natural resources in many of the least resilient ecosystem has been due to
manipulation of the set of prices they face. Generally the effect of market intervention
in the less developed economy has been the reduction of productive income (Warford,
1987). With a view to enhance their income, the farmers diversified their agricultural
activities in two ways: grazing and cultivation of lemon grass cultivation.
44
3.4.2.2 Cattle grazing
It was estimated that there were about 295 livestock in the selected 100
households from four villages near Mannavan shola. On an average, each selected
household possessed 3 livestock. Average number of livestock per household is more
in Kanthallur village (7) and less in Kolachavayil (2), Perumala (1) and Puthur (1). In
Pullaradi shola, the number of livestock is as high as 300 per selected 25 households.
Of the total livestock population, the number of cattle constitutes 77% and
81% in Mannavan shola and Pullaradi shola area respectively. It was estimated that
cattle rearing provided on an average about 12% of the total income of the
households. However, about 85% of the cattle in Mannavan shola and all the cattle in
Pullaradi shola are sent for grazing in shola area. Both field observation and
discussion with the respondents indicated clearly that some parts of the shola forests
are experiencing overgrazing and also that the grazing pressure is increasing day by
day. Such a raise in grazing pressure frequently has the effect of lowering the
resilience of the ecosystem (Perrings and Walker, 1997). Further, increasing grazing
pressure implies reduction in the proportion of palatable plants and increase in both
impalatable grasses and wood plants which are susceptible to fire (Knoop and Walker,
1985). Further, overgrazing leads to undesirable alterations in the biomass (Perrings,
1989). Change in species composition including the dominance of impalatable shrubs
such as Laportea bulbifera and Achyranthes bidentata as in case of Pullaradi shola
and even invasion of exotic weedy species such as Ageratina adenophora in case of
Mannavan shola could be partially due to grazing pressure.
3.4.2.3 Lemongrass cultivation
Lemongrass cultivation is another reason for degradation of Mannavan shola
and Pullaradi shola. The origin of the cultivation of lemon grass dates back to 1970’s
when new migrant people started inhabiting this area. Around Mannavan shola,
lemongrass has been cultivated in about 188 ha. Out of four villages located near
Mannavan shola in Kanthallur village lemongrass cultivation is more (82 ha) followed
by Perumala (48.7 ha), Kolachavayil (48.7 ha) and Puthur (7.5 ha). Near Pullaradi
shola, estimated area under lemongrass cultivation is about 142 ha. In these villages,
earlier the farmers undertook the lemon grass cultivation as a source of supplementary
45
income. But later it became a major source of income accounting for 45% of the total
household income. It is generally pointed out that the lemon grass cultivation is a
profitable one. The average per hectare net returns of the cultivation of lemongrass
for 5 years was estimated as Rs. 37,500 (excluding the value of land) (Thomas, 2000).
Another study in the neighboring area of the Mannavan shola indicated that net
annual monetary benefit by lemongrass cultivation was Rs. 23,713+5,997 ha-1, with
monetary output/input ratio of 1.81 + 0.14 when the cost of firewod and land was not
accounted (Chandrashekara, 2000). The farmers in the study areas also indicated the
profitability of the cultivation. Three reasons attributed for the profitability are: a) the
price of lemongrass oil is high and less fluctuating (between Rs. 400-450 kg-1 during
last 5 years), b) firewood required for its distillation is taken freely from the forest
areas, which lowers cost, and c) wage rate is less in shola area (Rs.40 per female
labor) when compared to other places (Rs. 100).
Lemon grass cultivation has both merits and demerits. In addition to a source
of income, this helps to prevent soil erosion (Chandrashekara and Sankar, 1998b). But
most important demerit of lemongrass cultivation is that its oil distillation takes a
huge quantity of firewood for its distillation. For example, according to the
cultivators, on an average, distillation of lemongrass collected in one-year period from
one hectare land requires about 9,839 kg of firewood. Thus it is estimated that about
3,243 tones of firewood per year is required for distillation of lemon grass cultivated
in 330 ha in the villages near Mannavan shola and Pullaradi shola.
3.4.2.4 Firewood Collection
Firewood is one of the major sources of energy in rural areas in Kerala. This is
particularly true in upland areas where the availability of the firewood is more. It was
found that firewood constitutes the major source of energy to 90% of the selected
households in the Mannavan shola areas and all the selected households in the
Pullaradi shola. About 10 % of the households in Mannavan shola area use other
energy sources like cow dung and LPG gas, in addition to firewood. Firewood is
invariably collected from the shola areas and wattle plantations nearby it. Some of the
firewood species collected from the shola forests are presented in the Table 14.
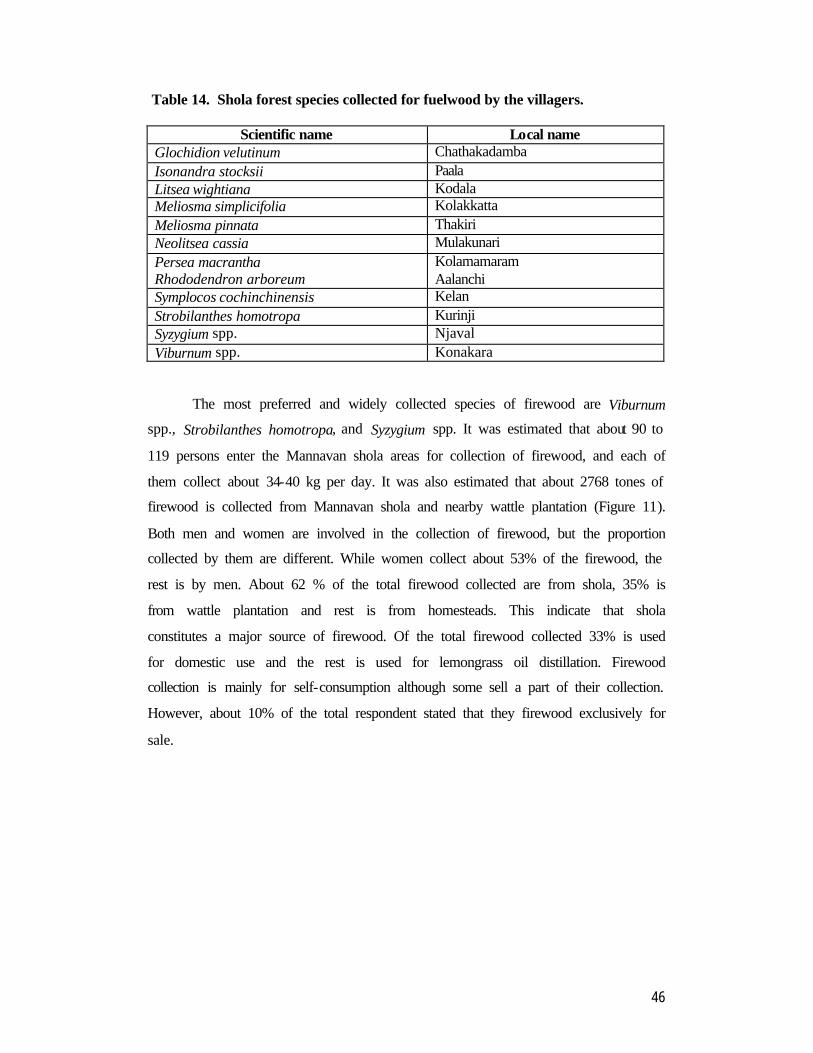
46
Table 14. Shola forest species collected for fuelwood by the villagers.
Scientific name Local name Glochidion velutinum Chathakadamba Isonandra stocksii Paala Litsea wightiana Kodala Meliosma simplicifolia Kolakkatta Meliosma pinnata Thakiri Neolitsea cassia Mulakunari Persea macrantha Kolamamaram Rhododendron arboreum Aalanchi Symplocos cochinchinensis Kelan Strobilanthes homotropa Kurinji Syzygium spp. Njaval Viburnum spp. Konakara
The most preferred and widely collected species of firewood are Viburnum
spp., Strobilanthes homotropa, and Syzygium spp. It was estimated that about 90 to
119 persons enter the Mannavan shola areas for collection of firewood, and each of
them collect about 34-40 kg per day. It was also estimated that about 2768 tones of
firewood is collected from Mannavan shola and nearby wattle plantation (Figure 11).
Both men and women are involved in the collection of firewood, but the proportion
collected by them are different. While women collect about 53% of the firewood, the
rest is by men. About 62 % of the total firewood collected are from shola, 35% is
from wattle plantation and rest is from homesteads. This indicate that shola
constitutes a major source of firewood. Of the total firewood collected 33% is used
for domestic use and the rest is used for lemongrass oil distillation. Firewood
collection is mainly for self-consumption although some sell a part of their collection.
However, about 10% of the total respondent stated that they firewood exclusively for
sale.
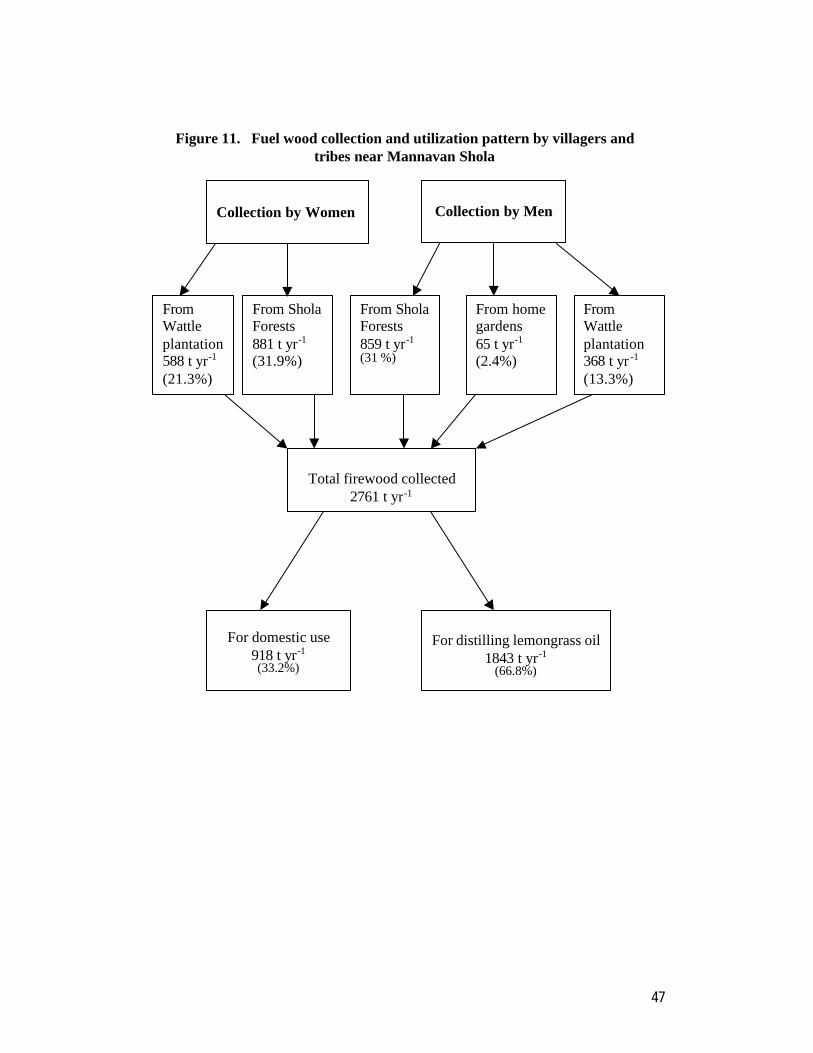
47
Figure 11. Fuel wood collection and utilization pattern by villagers andtribes near Mannavan Shola
Collection by Women Collection by Men
FromWattleplantation588 t yr-1
(21.3%)
From SholaForests881 t yr-1
(31.9%)
From SholaForests859 t yr-1
(31 %)
From homegardens65 t yr-1
(2.4%)
FromWattleplantation368 t yr -1
(13.3%)
Total firewood collected2761 t yr-1
For domestic use918 t yr-1
(33.2%)
For distilling lemongrass oil1843 t yr-1
(66.8%)
48
In Pullaradi shola, the firewood required for distillation of lemongrass oil was
estimated to be 1140 m2 of which 80% was collected from shola and rest from wattle
plantation. Some of the respondents stated that collectors collect fallen trees and
branches, which are available in the shola and utilize them as firewood. Then the
question is whether the quantity of fallen and dead wood is enough to meet the
requirement of the villagers. Thus an attempt was made to estimate quantity of
fallen/dry wood available in the Mannavan shola by establishing ten sample plots of
10x10 m at 100 meter interval. It is estimated that 966+287 tonnes km-2 fallen and
dead wood is available in the forest. Accordingly, a substantial quantity of firewood
may be collected from the selected area. But the problem is that, the gatherers collect
firewood only from the fringes of the Mannavan shola (Figure 5), due to variety of
reasons such as inaccessibility, wildlife, etc. Since the firewood is collected only from
fringes, the availability of fallen wood is usually less, which quite often, force them to
cut branches and even tree for firewood, resulting in degradation. As already stated in
the Section 3.1, apart from collection of stems of understorey small trees or large
shrubs such as Strobilanthes homotropa, Maesa indica, Canthium etc., as many as
600 to 930 trees ha-1 were found cut from different shola forests. Such a large scale
harvest of trees, which is brought about predominantly by lemongrass cultivation, is
either degrading the shola or slowing down the forest recovery process. Even the
collection of a large quantity of fallen and dead wood is not advisable in the context
of ecological resilience of the forests. If dead wood is left to decompose within the
forests, with the help of micro organism, it adds to the stock of existing humus,
strengthen soil structure, enrich soil composition and retards soil loss and erosion
(Roba, 2000). As sholas are confined to uplands and play an important role in
watershed protection, this aspect may also be taken in to account while formulating
the strategy for its conservation
3.4.2.5 Collection of timber
Cutting of timber for house construction is another factor, which contributes
degradation of forests. In the study area, there has been significant increase in the
construction work. For instance, during the period from 1995 to 1999, about 47
houses were newly constructed (Table 15).
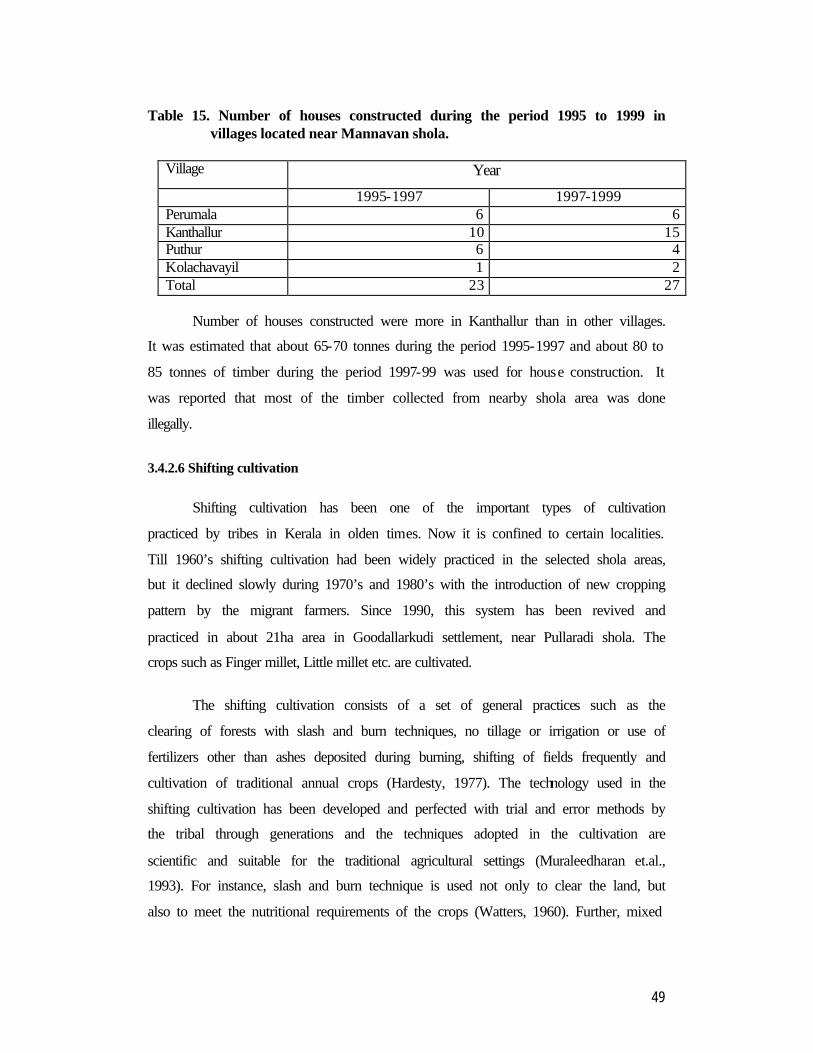
49
Table 15. Number of houses constructed during the period 1995 to 1999 in
villages located near Mannavan shola.
Village Year
1995-1997 1997-1999 Perumala 6 6 Kanthallur 10 15 Puthur 6 4 Kolachavayil 1 2 Total 23 27
Number of houses constructed were more in Kanthallur than in other villages.
It was estimated that about 65-70 tonnes during the period 1995-1997 and about 80 to
85 tonnes of timber during the period 1997-99 was used for house construction. It
was reported that most of the timber collected from nearby shola area was done
illegally.
3.4.2.6 Shifting cultivation
Shifting cultivation has been one of the important types of cultivation
practiced by tribes in Kerala in olden times. Now it is confined to certain localities.
Till 1960’s shifting cultivation had been widely practiced in the selected shola areas,
but it declined slowly during 1970’s and 1980’s with the introduction of new cropping
pattern by the migrant farmers. Since 1990, this system has been revived and
practiced in about 21ha area in Goodallarkudi settlement, near Pullaradi shola. The
crops such as Finger millet, Little millet etc. are cultivated.
The shifting cultivation consists of a set of general practices such as the
clearing of forests with slash and burn techniques, no tillage or irrigation or use of
fertilizers other than ashes deposited during burning, shifting of fields frequently and
cultivation of traditional annual crops (Hardesty, 1977). The technology used in the
shifting cultivation has been developed and perfected with trial and error methods by
the tribal through generations and the techniques adopted in the cultivation are
scientific and suitable for the traditional agricultural settings (Muraleedharan et.al.,
1993). For instance, slash and burn technique is used not only to clear the land, but
also to meet the nutritional requirements of the crops (Watters, 1960). Further, mixed
50
cropping is employed in shifting cultivation to maximize production and income and
to meet the nutritional requirements of the farmers.
As no attempt was made to study the effect of shifting cultivation on
ecosystem and degradation of shola, it is difficult to say anything conclusive on this
issue here. However, It is widely known fact that, when a forest is converted to a
cultivable land, not only its original vegetation destroyed, but the site is subject to
continuing perturbations due to fire, weeding, hoeing, etc. (Ramakrishnan, 1993).
Further, if the fallow is very short degradation set in and crop yield declines (Mishra
and Ramakrishnan, 1981). The respondents indicated decline in the fallow period in
shifting cultivation area near Pullaradi shola. During our survey it was also indicated
that many people nearby shola might involve in the shifting cultivation in future,
anticipating an additional income. Needless to say this will be a threat to the degraded
shola.
3.4.2.7 Illegal cutting of timber and tree fern (Cyathea)
The survey indicated that illegal cutting of tree from Manthan shola,
Mannavan shola and Pullaradi shola was not a rare phenomenon. Outsiders with the
help of people living nearby the shola did this. Cutting of tree fern Cyathea
nilgiriensis and Cyathea crinita, particularly from Mannavan shola, for the purpose of
decoration during the festivals and marriages is also a regular activity. Among these
two species Cyathea nilgiriensis is often cut as it found more in the low altitude area.
3.5 Aruvikkad Shola : A Contrast
Vegetation analysis carried out in the Aruvikkad shola (Plate 7) located near
the residential areas of the estate workers of the Central Division of Tata Tea Estate
indicated that this forest patch is not experiencing disturbance in recent days and
recovering from the past damages occurred to its vegetation. Further analysis of
socio-economic aspects of the local people indicated that none of the selected
households were depending on shola for meeting any of their requirements. This is
primarily because the Tea Estate managers do not allow the people to enter the shola
for firewood collection. Houses of the workers were also constructed by Estate and
consequently, workers do not want timber for house construction. Besides this, the
51
Tea Estate owns a large area of plantations of fuel wood species, aiming for tea
processing. The Estate managers supply the workers with firewood annually at a
concession rate (Plate 8). It was reported in the survey that each family has received
3m3 firewood (650 kg) during that year at a price of Rs. 120 per m3. The quantity of
firewood supplied and price per unit changes annually, according to the availability.
All the households have smokeless choola, which helps to reduce the consumption of
firewood. In addition, about 21 % of the households have the LPG gas for cooking. It
was found in the survey that higher income group owns LPG gas. For instance, about
88 % of the selected households having LPG connection fall in the monthly income
category of above Rs. 2000.
3.6 Dependency on shola
It is clear from the above discussion the people living nearby Mannavan shola
and Pullaradi shola depended heavily on forest area for their livelihood. This is also
true in the case of Manthan shola while contrary is the case in Aruvikkad shola.
Income received from different sources that is one of the indicators of level of
dependency, indicates this fact. Source-wise income distribution of the selected
households in the Mannavan shola and Pullaradi shola which represent the forest still
under disturbance and Aruvikkad shola which represents the forest under progressive
succession due to absence disturbance in recent days is shown in the Figures 12 and
13. On an average in Mannavan shola and Pullaradi shola, lemon grass cultivation
provided 50% of the income of the selected household, followed by agriculture
including grazing (30%), shifting cultivation (5%) sale of firewood (5%), wage from
forestry work (7%) and others (3%). On the other hand in the village located near
Aruvikkad shola, 90 % of the income of the people is obtained from wage labour and
rest from other sources business, agriculture and cattle rearing etc. This has
implication on conservation of shola forest in Kerala. As far as shola is concerned,
degradation and level of dependency are closely linked that is degradation increases
with increase of dependency. Thus the crux and the success of future management and
conservation strategy depend on how one reduces the dependency of people on shola.
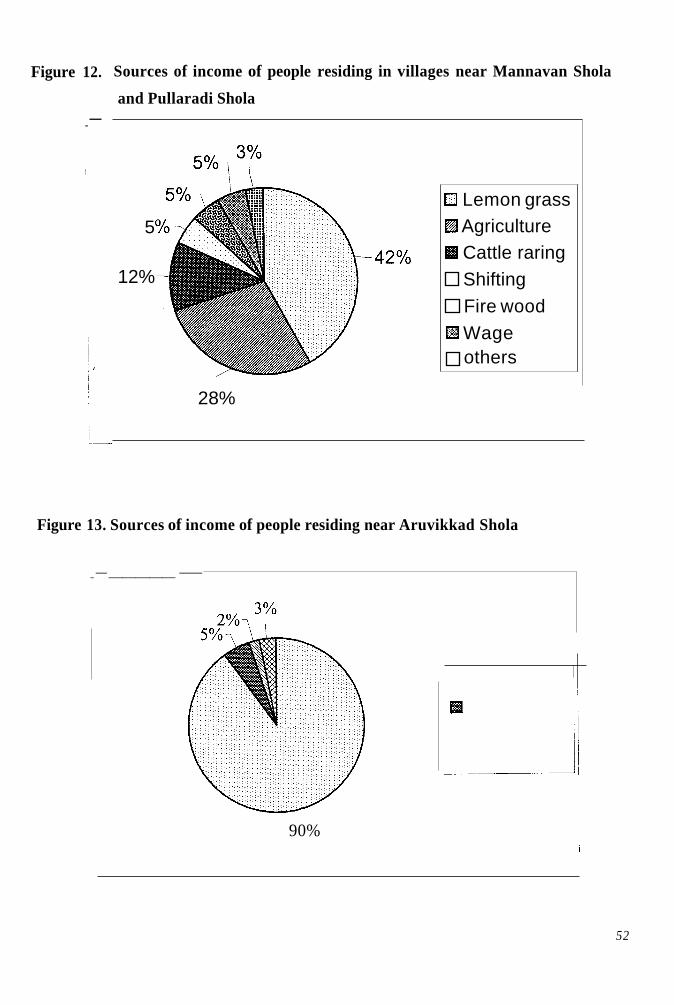
Figure 12.
_-
Sources of income of people residing in villages near Mannavan Shola
and Pullaradi Shola
5
12% 42%
28%
0 Lemon grass Agriculture Cattle raring Shifting Fire wood Wage others
Figure 13. Sources of income of people residing near Aruvikkad Shola
_-_____-
90%
52
4.0 Strategy for conservation of shola
Detailed studies on the vegetation structure and composition clearly indicated that
all the four shola forests studied are either fully or partially disturbed. Analysis of level of
disturbance and recovery process indicated that Mannavan Shola, Pullaradi Shola and
Manthan Shola are disturbed much and no recovery process is operating. Socio-economic
analysis has identified three major threats for the effective conservation of the sholas.
These threats include firewood collection, grazing and revival of shifting cultivation.
These factors may be taken into account, while formulating strategies for conservation
and management of these shola forests.
4.1 Enrichment planting in disturbed parts of shola
As highlighted in the Section 3.1 , due to continuous disturbance and invasion of
exotic weeds, succession is either arrested or slowed down. In such a situation, attempts
need to be made for enrichment planting and also assisting natural regeneration. Species
that may be considered for enrichment planting in Mannavan Shola, Manthan Shola and
Pullaradi Shola is given in Table 16. In case of Aruvikkad Shola, if present management
system continued, enrichment planting is not required. However, here there is a scope for
assisting natural regeneration mainly by weed management.
Table 16. Species suitable for enrichment planting in disturbed parts of Mannavan
Shola, Pullaradi Shola and Manthan Shola
Acronychia pedunculata Actinodaphne bourdillonii Alseodaphne semecarp ifolia Beilschmiedia wightii Canthium dicoccum Chionan th us ram ifl orus Cinnamomum sulphuratum Cinnamomum Cryptocarya bourdillonii Cyathea nilgiriensis Dap hnip hyllum n eilgherrense
Elaeocarpus serratus Elaeocarpus munronii Elaeocarpus recurvatus Glochidion neilgherrense Gomphandra coriacea Hydnocarpus alpina Litsea floribunda Litsea wightiana Mastixia arborea Meliosma pinnata Microtropis ramiflora Neolitsea cassia
Neolitsea scrobiculata Persea m acran th a Rhododendron arboreum Sc h e fflera racem osa Symplocos cochinchinensis Syzygium cumini Syzygium densiflorum Syzygium gardneri Turpinia nepalensis Vaccinium leschenaultii Viburnum coriaceum
53
4.2 Enhancement of firewood availability
In the villages located near shola forests, initially lemongrass cultivation was
introduced mainly to supplement the income from agriculture, but later on it became a
major source of income, In view of the low per capita income and very few avenues of
income generation the idea of banning lemongrass cultivation may not be acceptable to
the inhabitants. At the same time, the present study clearly demonstrated that firewood
harvest and collection for lemongrass oil distillation is the major cause of forest
disturbance. In this context several strategies are to be adopted to enhance the firewood
base. Some of them are discussed below:
0 Conversion of monocropping of lemongrass into an agroforestry system with the
incorporation of tree components particularly, firewood species, may be an
appropriate strategy to make the system an ecologically viable and sustainable one
and this will also reduce the pressure on shola forests. Some of the species identified
as appropriate to incorporate in lemongrass system are Symplocos cochinchinensis,
Syzygiuin cumini, Viburnum coriaceuni, Viburnum punctatum, Canthium dicoccuni,
Eurya nitida and Maesa indica.
0 The study indicated that wattle plantation raised near Mannavan Shola by the Forest
Department is the second largest source of firewood contributing 34.6% of total
firewood collected in an year. Thus enhancement of growing stock and better
management of the existing plantations with a view to provide firewood at a
concession rate as done by Tata Tea Plantation to the local people near Aruvikkad
Shola may be considered.
0 Through PRA exercise it is learnt that villagers are ready to participate with the
Forest Department and other government agencies if efforts are made to establish
energy plantations in government lands near their villages and provide firewood at
concession rate. Some of the species suggested by them for energy plantation include
Eucalyptus grandis, Eucalyptus globulus, Acacia dealbata, Acacia melanoxylon and
Acacia decurrens. It may be mentioned here that in Devikulam Forest Range, about
54
52 ha of mixed species fuelwood plantations were established with an intention to
provide fuelwood to the local people. However, it is understood that in due course of
time, local people are deprived of such a facility due to the fact that wood from these
plantations have earmarked for supply to the Hindustan News Print Limited. In view
of the greater damage occurring in the shola forest due to firewood collection by the
local people it may be appropriate to revive the earlier system of firewood supply by
raising firewood plantations near all shola forests, which are being disturbed.
4.3 Reduction of grazing pressure
Grazing is another important threat to the conservation of shola. This can be
minimized by encouraging stall-feeding and making the community aware of the serious
consequences of the grazing. Attempts may be made to develop silvopastoral systems
with components such as fodder plants and firewood trees outside the shola areas.
Grazing may be restricted to these areas. Fodder plants suitable to these area include
Desmodium intortum, Desmodium uncinatum, Trifolium repens, Dactyles glomerata
(Cock’s foot grass), Setaria anceps (Setaria grass), Lolium perreni (Italian rye grass) and
Dactyles sp. (English rye grass).
4.4 Prevention of encroachment
In many occasions, the farmers will burn more area than that can be utilised for
shifting cultivation. Such an activity coupled with increase in area under shifting
cultivation would lead to the forest degradation. Added to this, if the fallow period
become short the crop productivity would decline slowly and consequently cultivation
would be less remunerative. In this context, people may convert this land for lemongrass
cultivation, which ultimately affect the conservation of shola. Recent field visits to
Manthan Shola revealed the fact that encroachment to shola forest for cultivation is
becoming more frequent and intensive (Plate 6). Forest encroachment and enhancement
of shifting cultivation need to be strictly prohibited.
55
5.0 Recommendations
Many of the above mentioned strategies may be implemented through eco-
development programmes aiming at overall development of the shola as well as people
living nearby. These programmes may undertake plantation of firewood species, supply
of inputs, increased facilities for marketing their produces, increasing availability of
fodder plants and additional employment generation activities. As part of these
programmes, campaigns for creating awareness for conservation and sustainable
management of shola and nearby ecosystems may be undertaken. Inhabitants, especially
tribes, may be employed to a greater extent in forestry related works so that pressure on
shola may be reduced.
We would like to record our sincere gratitude to Dr. J.K. Sharma, Director, Dr.
K.S.S. Nair, former Director and Dr. R. Gnanaharan, Research coordinator for their keen
interest and encouragement. Sincere thanks are also due to the Forest Department
officials and staff of Munnar Forest Division, Marayoor Forest Range, Devikulom Forest
Range and Munnar Wildlife Division for their kind support and co-operation. Some of
them need special mention for their timely help and support: Mr.G. Mohandas Munnar
D.F.O., Mr. P.K.Pathak, former D.F.O., Mr. Mohan Almpath, Eravikulam Wildlife
Warden, Mr. V.C.Hassan, former Wildlife Warden, Mr. Udayakumar, Marayoor Forest
Range Officer, Mr. V.K. Francis, Devikulom Forest Range Officer, Mr. G.R. Mohandas,
former Range Officer, P.Sasidharan Nair, Deputy Range Officer of Marayoor Forest
Range, Mr. Gopalakrishnan, former Deputy Range Officer of Marayoor Forest Range,
Mr. Balagopalan Thampi, Forester of Devikulom Range, Mr. I.V. Thomas, T.K. Mani,
M. Ramar and other staff of Kanthallur Forest Station. We are also thankful to the people
of Kanthallur, Puthur, Kolachavayil, Goodallarkudi and Aruvikkad for their co-operation
with the data collection. Thanks are due to staff of Kerala Livestock Development Board,
Mattupetty for providing us accommodation facilities during our filed visits. Thanks are
due to Mr. Subash Kuriakose for photography and maps preparation. Special thanks Mr.
P.K.Rajendran, Mr. Shahul Hameed and Mr. P.C. Chandran, for their dedicated services
56
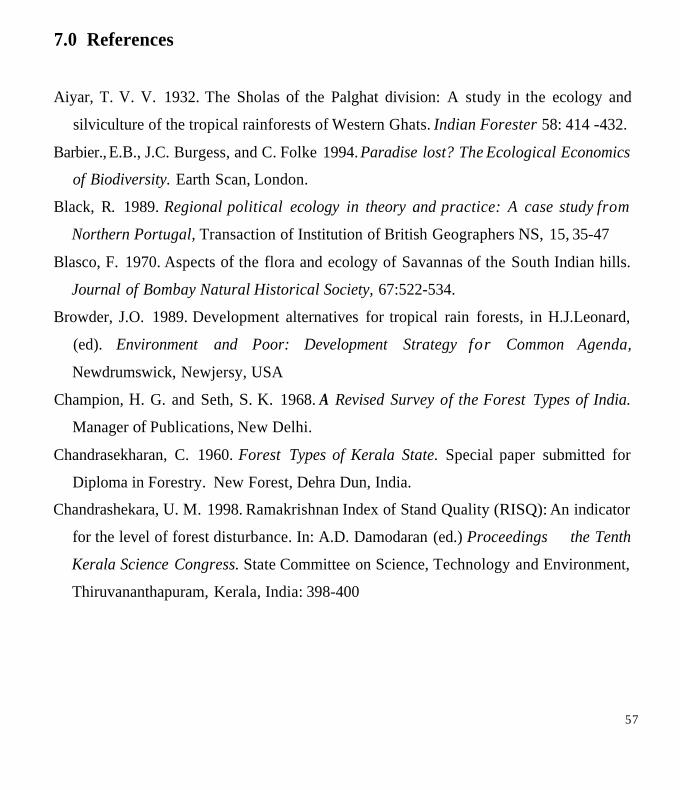
provided for our each field trip. The Kerala Forest Department under its scheme
Conservation and Developemnt of Hill Shola Forests supported this research. We extend
our sincere thanks to Dr. C.Renuka, Dr. C. Mohanan and Dr. E.M.Muralidharan for their
editorial comments on the final draft. Our hearty thanks are due to Mr. D.S. Rao, Chief
Conservator of Forests for providing fund under the above mentioned scheme and also
necessary advice throughout the Project period.
7.0 References
Aiyar, T. V. V. 1932. The Sholas of the Palghat division: A study in the ecology and
silviculture of the tropical rainforests of Western Ghats. Indian Forester 58: 414 -432.
Barbier., E.B., J.C. Burgess, and C. Folke 1994. Paradise lost? The Ecological Economics
of Biodiversity. Earth Scan, London.
Black, R. 1989. Regional political ecology in theory and practice: A case study from
Northern Portugal, Transaction of Institution of British Geographers NS, 15, 35-47
Blasco, F. 1970. Aspects of the flora and ecology of Savannas of the South Indian hills.
Journal of Bombay Natural Historical Society, 67:522-534.
Browder, J.O. 1989. Development alternatives for tropical rain forests, in H.J.Leonard,
(ed). Environment and Poor: Development Strategy for Common Agenda,
Newdrumswick, Newjersy, USA
Champion, H. G. and Seth, S. K. 1968. A Revised Survey of the Forest Types of India.
Manager of Publications, New Delhi.
Chandrasekharan, C. 1960. Forest Types of Kerala State. Special paper submitted for
Diploma in Forestry. New Forest, Dehra Dun, India.
Chandrashekara, U. M. 1998. Ramakrishnan Index of Stand Quality (RISQ): An indicator
for the level of forest disturbance. In: A.D. Damodaran (ed.) Proceedings of the Tenth
Kerala Science Congress. State Committee on Science, Technology and Environment,
Thiruvananthapuram, Kerala, India: 398-400
57
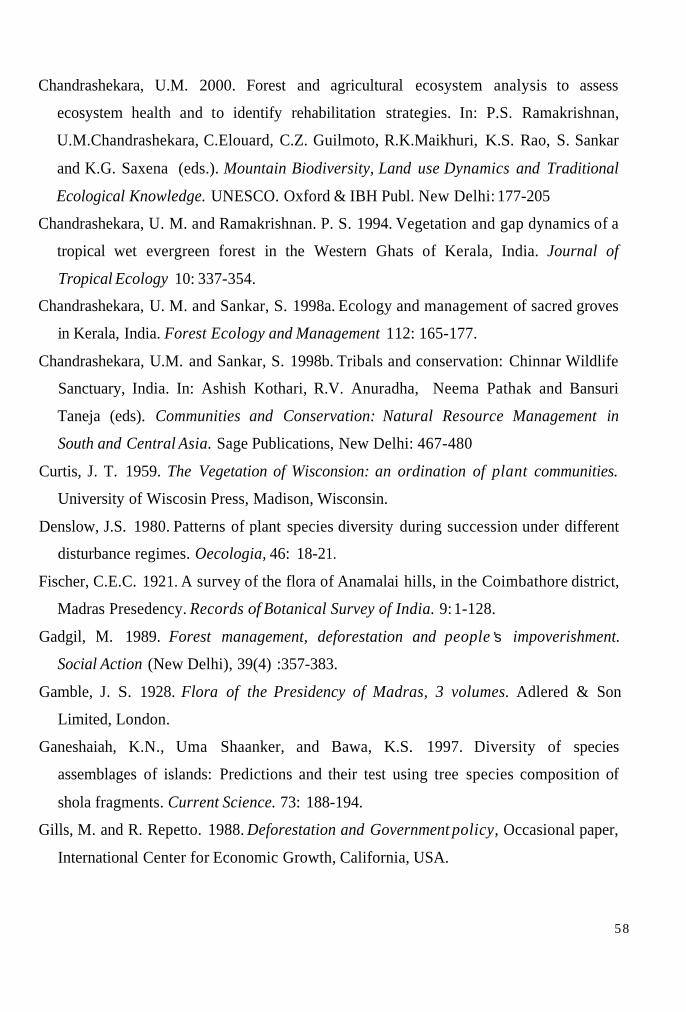
Chandrashekara, U.M. 2000. Forest and agricultural ecosystem analysis to assess
ecosystem health and to identify rehabilitation strategies. In: P.S. Ramakrishnan,
U.M.Chandrashekara, C.Elouard, C.Z. Guilmoto, R.K.Maikhuri, K.S. Rao, S. Sankar
and K.G. Saxena (eds.). Mountain Biodiversity, Land use Dynamics and Traditional
Ecological Knowledge. UNESCO. Oxford & IBH Publ. New Delhi: 177-205
Chandrashekara, U. M. and Ramakrishnan. P. S. 1994. Vegetation and gap dynamics of a
tropical wet evergreen forest in the Western Ghats of Kerala, India. Journal of
Tropical Ecology 10: 337-354.
Chandrashekara, U. M. and Sankar, S. 1998a. Ecology and management of sacred groves
in Kerala, India. Forest Ecology and Management 1 12: 165- 177.
Chandrashekara, U.M. and Sankar, S. 1998b. Tribals and conservation: Chinnar Wildlife
Sanctuary, India. In: Ashish Kothari, R.V. Anuradha, Neema Pathak and Bansuri
Taneja (eds). Communities and Conservation: Natural Resource Management in
South and Central Asia. Sage Publications, New Delhi: 467-480
Curtis, J. T. 1959. The Vegetation of Wisconsion: an ordination of plant communities.
University of Wiscosin Press, Madison, Wisconsin.
Denslow, J.S. 1980. Patterns of plant species diversity during succession under different
disturbance regimes. Oecologia, 46: 18-2 1.
Fischer, C.E.C. 192 1. A survey of the flora of Anamalai hills, in the Coimbathore district,
Madras Presedency. Records of Botanical Survey of India. 9: 1-128.
Gadgil, M. 1989. Forest management, deforestation and people 's impoverishment.
Social Action (New Delhi), 39(4) :357-383.
Gamble, J. S. 1928. Flora of the Presidency of Madras, 3 volumes. Adlered & Son
Limited, London.
Ganeshaiah, K.N., Uma Shaanker, and Bawa, K.S. 1997. Diversity of species
assemblages of islands: Predictions and their test using tree species composition of
shola fragments. Current Science. 73: 188-194.
Gills, M. and R. Repetto. 1988. Deforestation and Government policy, Occasional paper,
International Center for Economic Growth, California, USA.
58
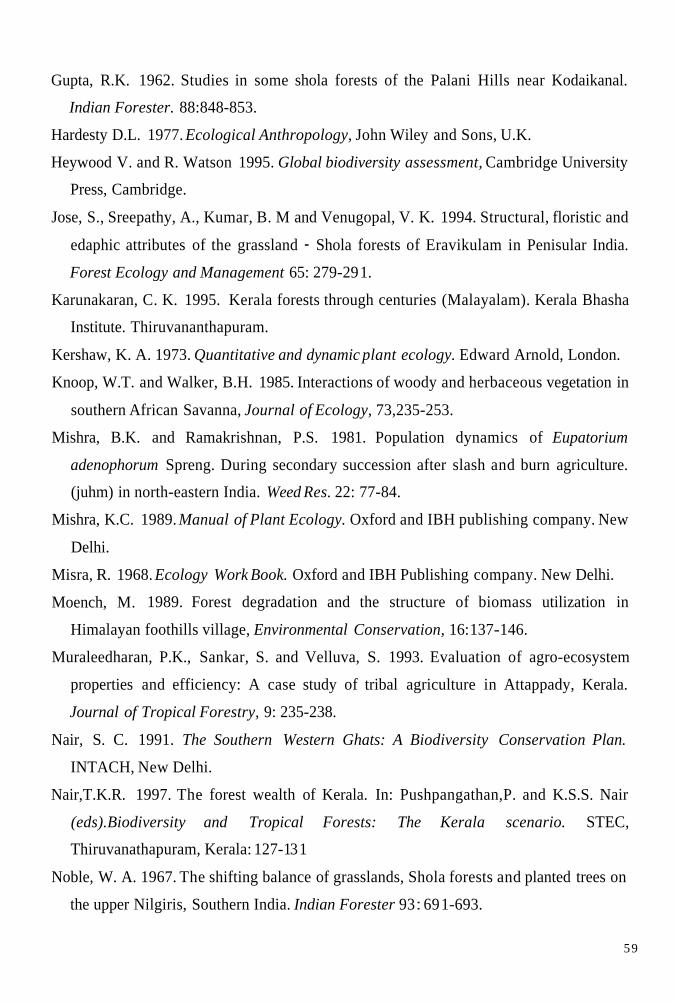
Gupta, R.K. 1962. Studies in some shola forests of the Palani Hills near Kodaikanal.
Indian Forester. 88:848-853.
Hardesty D.L. 1977. Ecological Anthropology, John Wiley and Sons, U.K.
Heywood V. and R. Watson 1995. Global biodiversity assessment, Cambridge University
Press, Cambridge.
Jose, S., Sreepathy, A., Kumar, B. M and Venugopal, V. K. 1994. Structural, floristic and
edaphic attributes of the grassland - Shola forests of Eravikulam in Penisular India.
Forest Ecology and Management 65: 279-29 1.
Karunakaran, C. K. 1995. Kerala forests through centuries (Malayalam). Kerala Bhasha
Institute. Thiruvananthapuram.
Kershaw, K. A. 1973. Quantitative and dynamic plant ecology. Edward Arnold, London.
Knoop, W.T. and Walker, B.H. 1985. Interactions of woody and herbaceous vegetation in
southern African Savanna, Journal of Ecology, 73,235-253.
Mishra, B.K. and Ramakrishnan, P.S. 1981. Population dynamics of Eupatorium
adenophorum Spreng. During secondary succession after slash and burn agriculture.
(juhm) in north-eastern India. Weed Res. 22: 77-84.
Mishra, K.C. 1989. Manual of Plant Ecology. Oxford and IBH publishing company. New
Delhi.
Misra, R. 1968. Ecology Work Book. Oxford and IBH Publishing company. New Delhi.
Moench, M. 1989. Forest degradation and the structure of biomass utilization in
Himalayan foothills village, Environmental Conservation, 16: 137- 146.
Muraleedharan, P.K., Sankar, S. and Velluva, S. 1993. Evaluation of agro-ecosystem
properties and efficiency: A case study of tribal agriculture in Attappady, Kerala.
Journal of Tropical Forestry, 9: 235-238.
Nair, S. C. 1991. The Southern Western Ghats: A Biodiversity Conservation Plan.
INTACH, New Delhi.
Nair,T.K.R. 1997. The forest wealth of Kerala. In: Pushpangathan,P. and K.S.S. Nair
(eds).Biodiversity and Tropical Forests: The Kerala scenario. STEC,
Thiruvanathapuram, Kerala: 127-1 3 1
Noble, W. A. 1967. The shifting balance of grasslands, Shola forests and planted trees on
the upper Nilgiris, Southern India. Indian Forester 93 : 69 1-693.
59
Pascal, J. P. 1988. Wet Evergreen Forests of the Western Ghats of India: Ecology,
Structure, Floristic composition and Succession. Institut Francais de Pondicheny,
Pondicheny, India.
Perrings,C. 1989. An optimal path to extinction? Poverty and resource degradation in the
open agrarian economy. Journal of Development Economics, 30( l), 1-24.
Perrings, C. and Walker, B.H. 1997. Biodiversity, resilience and the control of ecological
economic system: the cases of fire driven rangelands, Ecological Economics 22:73-83.
Phillips. E. A. 1959. Methods of Vegetation Study. Henry Hold & Company, New York.
Rai, S. N. 1979. Gap generation in wet evergreen forest of Karnataka. Karnataka Forest
Department Research Paper, KFD-2. Karnataka Forest Department, Bangalore.
Rai, S. N. and Proctor, J. 1986. Ecological studies on four rainforests in Karnataka,
India: .’ I. Environment, structure, floristics and biomass. Journal of Ecology 74:439-
454.
Ramakrishnan, P.S. 1993. Shifting Agriculture and Sustainable Development: An
Interdisciplinary Study from North Eastern India, Oxford University Press, New
Delhi.
Ramakrishnan, P.S. Chandrashekara, U.M. Elouard, C., Guilmoto, C.Z., Maikhuri, R.K.,
Rao, K.S., Sankar, S. and Saxena, K.G. 2000. Mountain Biodiversity, Land use
Dynamics and Traditional Ecological Knowledge. UNESCO. Oxford & IBH Publ.
New Delhi.
Ranganathan, C. R. 1938. Studies on the ecology of the grassland vegetation of the
Nilagiri Plateau. Indian Forester 64: 523-541.
Rangarajan, A. 1997. Shredding the Nilgiris. Sanctuary Asia 17: 30-37.
Roba, A.W. 2000. Costs and benefits of protected areas: Marsabit Forest Reserve,
Northern Kenya. In: C.Perrings (ed). The Economics of biodivesity Conservation in
Sub- Shaharan Africa, Edward Elgar, U.K:115-154.
Shannon, C. E and Wiener, W. 1963. The Mathematical Theory of Communication.
University of Illinois Press, Urbana, IL.
Simpson, E. H. 1949. Measurement of diversity. Nature (London) 163:688.
Srivastava, R.J. 1994. Re-establishment of sholas in grasslands: A reverse process. Indian
Forester 120: 868-870.
60
Swarupanandan, K., N. Sasidharan, K.C. Chacko and S. C. Basha, S. C. 1998. Studies on
the Shola Forests of Kerala. KFRI Research Report No. 158. Kerala Forest Research
Institute, Peechi, Kerala, India.
Thomas, A. 2000. Cost of cultivation of one hectare of Lemon Grass. Kerala Agricultural
University, Aromatic & Medicinal Plants Research Station, Odakkali.
Warford, J. 1987. Environment and Development, World Bank/IMF Development
Committee, Washington D.C.
Watters, R.F. 1960. The nature of shifting cultivation, Pacafic Viewpoint 1 :59-99.
61
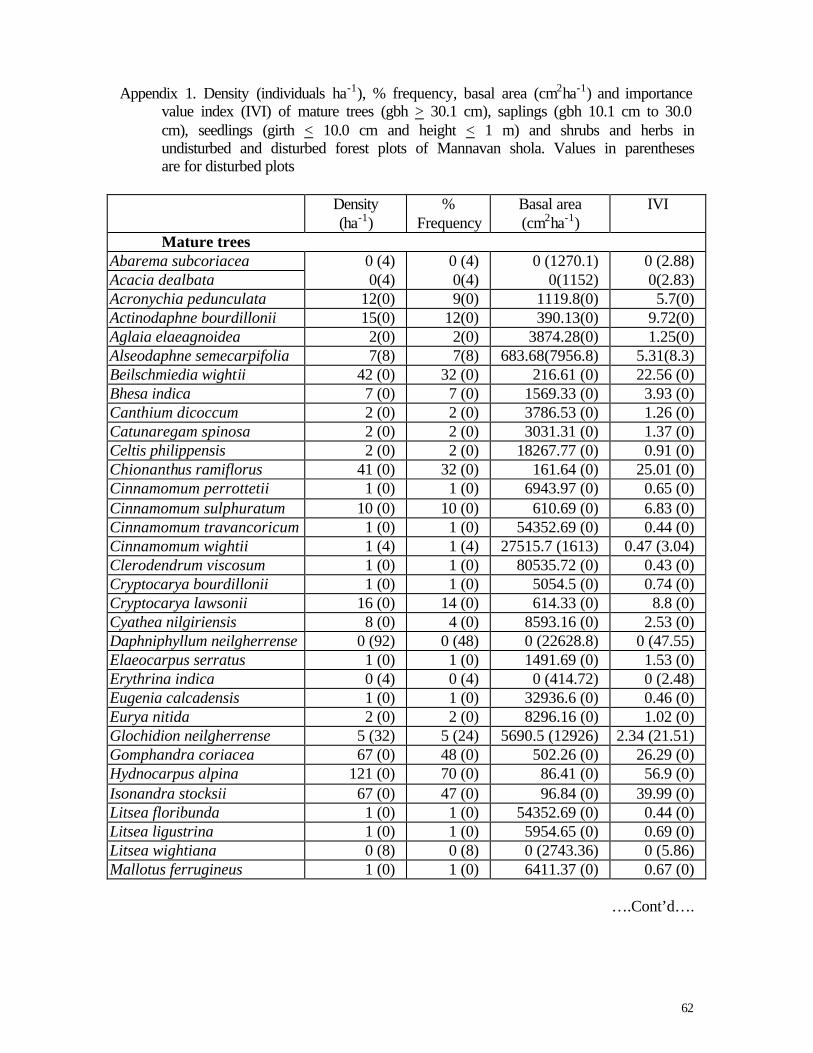
62
Appendix 1. Density (individuals ha-1), % frequency, basal area (cm2ha-1) and importance
value index (IVI) of mature trees (gbh > 30.1 cm), saplings (gbh 10.1 cm to 30.0 cm), seedlings (girth < 10.0 cm and height < 1 m) and shrubs and herbs in undisturbed and disturbed forest plots of Mannavan shola. Values in parentheses are for disturbed plots
Density
(ha-1) %
Frequency Basal area (cm2ha-1)
IVI
Mature trees Abarema subcoriacea 0 (4) 0 (4) 0 (1270.1) 0 (2.88) Acacia dealbata 0(4) 0(4) 0(1152) 0(2.83) Acronychia pedunculata 12(0) 9(0) 1119.8(0) 5.7(0) Actinodaphne bourdillonii 15(0) 12(0) 390.13(0) 9.72(0) Aglaia elaeagnoidea 2(0) 2(0) 3874.28(0) 1.25(0) Alseodaphne semecarpifolia 7(8) 7(8) 683.68(7956.8) 5.31(8.3) Beilschmiedia wightii 42 (0) 32 (0) 216.61 (0) 22.56 (0) Bhesa indica 7 (0) 7 (0) 1569.33 (0) 3.93 (0) Canthium dicoccum 2 (0) 2 (0) 3786.53 (0) 1.26 (0) Catunaregam spinosa 2 (0) 2 (0) 3031.31 (0) 1.37 (0) Celtis philippensis 2 (0) 2 (0) 18267.77 (0) 0.91 (0) Chionanthus ramiflorus 41 (0) 32 (0) 161.64 (0) 25.01 (0) Cinnamomum perrottetii 1 (0) 1 (0) 6943.97 (0) 0.65 (0) Cinnamomum sulphuratum 10 (0) 10 (0) 610.69 (0) 6.83 (0) Cinnamomum travancoricum 1 (0) 1 (0) 54352.69 (0) 0.44 (0) Cinnamomum wightii 1 (4) 1 (4) 27515.7 (1613) 0.47 (3.04) Clerodendrum viscosum 1 (0) 1 (0) 80535.72 (0) 0.43 (0) Cryptocarya bourdillonii 1 (0) 1 (0) 5054.5 (0) 0.74 (0) Cryptocarya lawsonii 16 (0) 14 (0) 614.33 (0) 8.8 (0) Cyathea nilgiriensis 8 (0) 4 (0) 8593.16 (0) 2.53 (0) Daphniphyllum neilgherrense 0 (92) 0 (48) 0 (22628.8) 0 (47.55) Elaeocarpus serratus 1 (0) 1 (0) 1491.69 (0) 1.53 (0) Erythrina indica 0 (4) 0 (4) 0 (414.72) 0 (2.48) Eugenia calcadensis 1 (0) 1 (0) 32936.6 (0) 0.46 (0) Eurya nitida 2 (0) 2 (0) 8296.16 (0) 1.02 (0) Glochidion neilgherrense 5 (32) 5 (24) 5690.5 (12926) 2.34 (21.51) Gomphandra coriacea 67 (0) 48 (0) 502.26 (0) 26.29 (0) Hydnocarpus alpina 121 (0) 70 (0) 86.41 (0) 56.9 (0) Isonandra stocksii 67 (0) 47 (0) 96.84 (0) 39.99 (0) Litsea floribunda 1 (0) 1 (0) 54352.69 (0) 0.44 (0) Litsea ligustrina 1 (0) 1 (0) 5954.65 (0) 0.69 (0) Litsea wightiana 0 (8) 0 (8) 0 (2743.36) 0 (5.86) Mallotus ferrugineus 1 (0) 1 (0) 6411.37 (0) 0.67 (0)
….Cont’d….
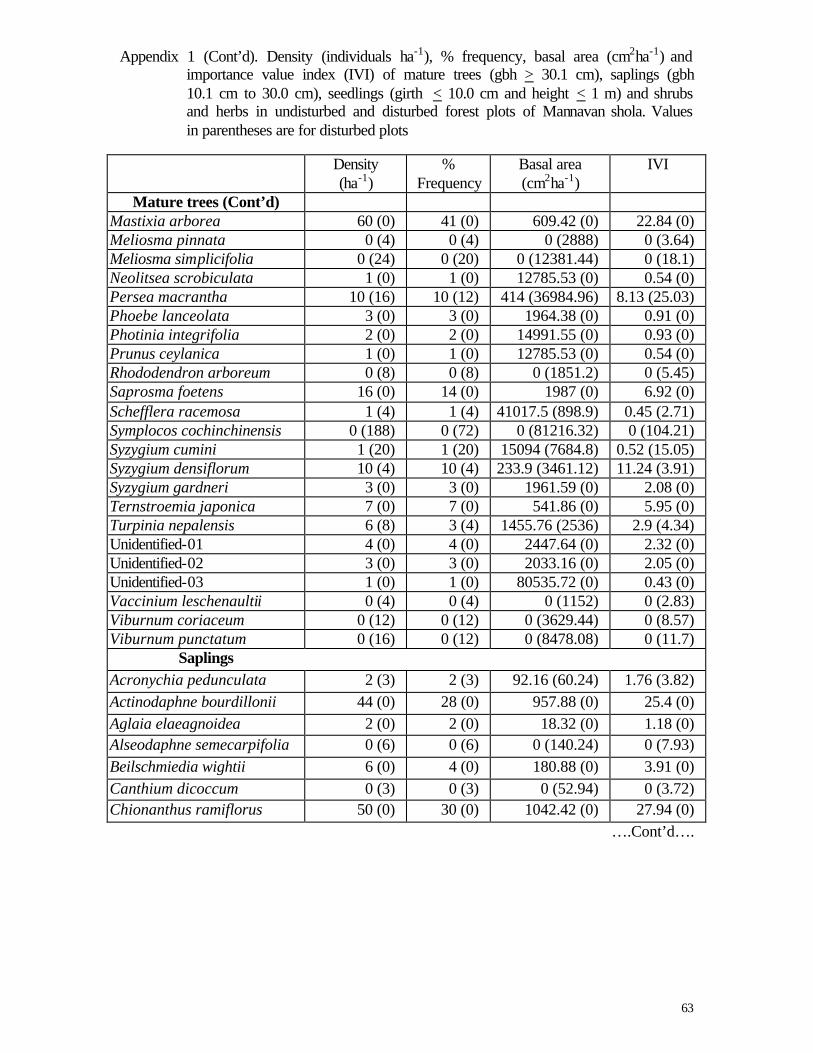
63
Appendix 1 (Cont’d). Density (individuals ha-1), % frequency, basal area (cm2ha-1) and importance value index (IVI) of mature trees (gbh > 30.1 cm), saplings (gbh 10.1 cm to 30.0 cm), seedlings (girth < 10.0 cm and height < 1 m) and shrubs and herbs in undisturbed and disturbed forest plots of Mannavan shola. Values in parentheses are for disturbed plots
Density
(ha-1) %
Frequency Basal area (cm2ha-1)
IVI
Mature trees (Cont’d) Mastixia arborea 60 (0) 41 (0) 609.42 (0) 22.84 (0) Meliosma pinnata 0 (4) 0 (4) 0 (2888) 0 (3.64) Meliosma simplicifolia 0 (24) 0 (20) 0 (12381.44) 0 (18.1) Neolitsea scrobiculata 1 (0) 1 (0) 12785.53 (0) 0.54 (0) Persea macrantha 10 (16) 10 (12) 414 (36984.96) 8.13 (25.03) Phoebe lanceolata 3 (0) 3 (0) 1964.38 (0) 0.91 (0) Photinia integrifolia 2 (0) 2 (0) 14991.55 (0) 0.93 (0) Prunus ceylanica 1 (0) 1 (0) 12785.53 (0) 0.54 (0) Rhododendron arboreum 0 (8) 0 (8) 0 (1851.2) 0 (5.45) Saprosma foetens 16 (0) 14 (0) 1987 (0) 6.92 (0) Schefflera racemosa 1 (4) 1 (4) 41017.5 (898.9) 0.45 (2.71) Symplocos cochinchinensis 0 (188) 0 (72) 0 (81216.32) 0 (104.21) Syzygium cumini 1 (20) 1 (20) 15094 (7684.8) 0.52 (15.05) Syzygium densiflorum 10 (4) 10 (4) 233.9 (3461.12) 11.24 (3.91) Syzygium gardneri 3 (0) 3 (0) 1961.59 (0) 2.08 (0) Ternstroemia japonica 7 (0) 7 (0) 541.86 (0) 5.95 (0) Turpinia nepalensis 6 (8) 3 (4) 1455.76 (2536) 2.9 (4.34) Unidentified-01 4 (0) 4 (0) 2447.64 (0) 2.32 (0) Unidentified-02 3 (0) 3 (0) 2033.16 (0) 2.05 (0) Unidentified-03 1 (0) 1 (0) 80535.72 (0) 0.43 (0) Vaccinium leschenaultii 0 (4) 0 (4) 0 (1152) 0 (2.83) Viburnum coriaceum 0 (12) 0 (12) 0 (3629.44) 0 (8.57) Viburnum punctatum 0 (16) 0 (12) 0 (8478.08) 0 (11.7)
Saplings Acronychia pedunculata 2 (3) 2 (3) 92.16 (60.24) 1.76 (3.82) Actinodaphne bourdillonii 44 (0) 28 (0) 957.88 (0) 25.4 (0) Aglaia elaeagnoidea 2 (0) 2 (0) 18.32 (0) 1.18 (0) Alseodaphne semecarpifolia 0 (6) 0 (6) 0 (140.24) 0 (7.93) Beilschmiedia wightii 6 (0) 4 (0) 180.88 (0) 3.91 (0) Canthium dicoccum 0 (3) 0 (3) 0 (52.94) 0 (3.72) Chionanthus ramiflorus 50 (0) 30 (0) 1042.42 (0) 27.94 (0)
….Cont’d….
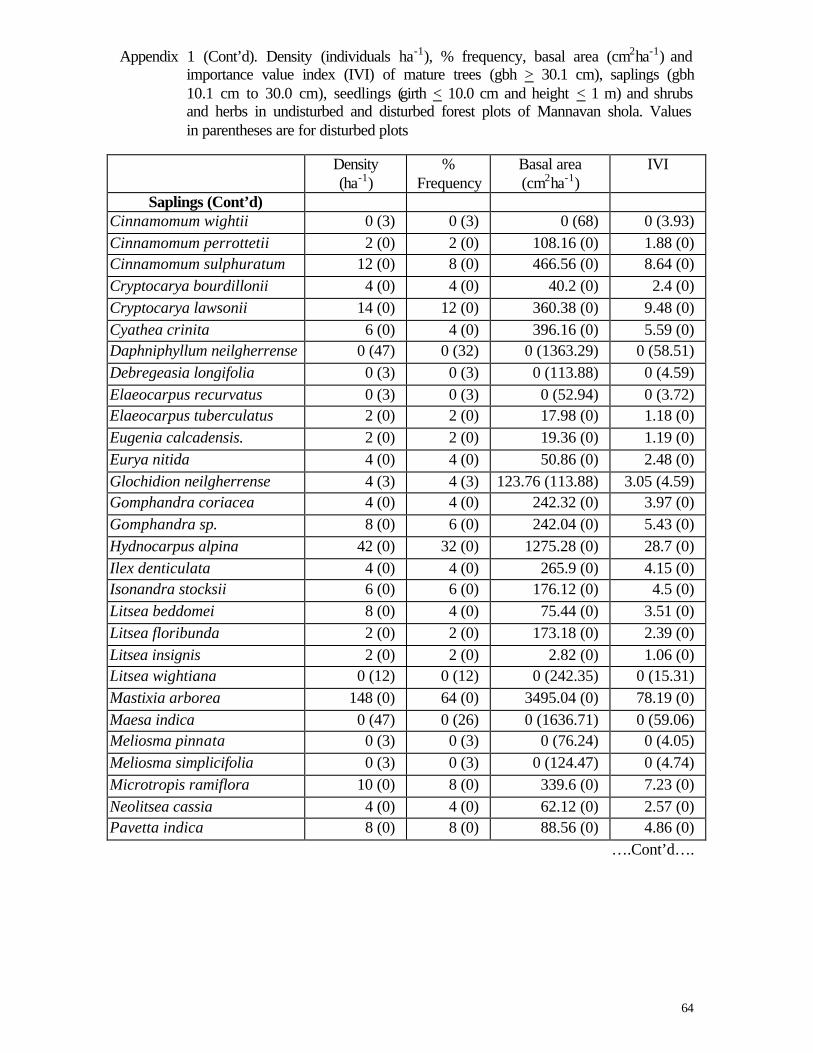
64
Appendix 1 (Cont’d). Density (individuals ha-1), % frequency, basal area (cm2ha-1) and importance value index (IVI) of mature trees (gbh > 30.1 cm), saplings (gbh 10.1 cm to 30.0 cm), seedlings (girth < 10.0 cm and height < 1 m) and shrubs and herbs in undisturbed and disturbed forest plots of Mannavan shola. Values in parentheses are for disturbed plots
Density
(ha-1) %
Frequency Basal area (cm2ha-1)
IVI
Saplings (Cont’d) Cinnamomum wightii 0 (3) 0 (3) 0 (68) 0 (3.93) Cinnamomum perrottetii 2 (0) 2 (0) 108.16 (0) 1.88 (0) Cinnamomum sulphuratum 12 (0) 8 (0) 466.56 (0) 8.64 (0) Cryptocarya bourdillonii 4 (0) 4 (0) 40.2 (0) 2.4 (0) Cryptocarya lawsonii 14 (0) 12 (0) 360.38 (0) 9.48 (0) Cyathea crinita 6 (0) 4 (0) 396.16 (0) 5.59 (0) Daphniphyllum neilgherrense 0 (47) 0 (32) 0 (1363.29) 0 (58.51) Debregeasia longifolia 0 (3) 0 (3) 0 (113.88) 0 (4.59) Elaeocarpus recurvatus 0 (3) 0 (3) 0 (52.94) 0 (3.72) Elaeocarpus tuberculatus 2 (0) 2 (0) 17.98 (0) 1.18 (0) Eugenia calcadensis. 2 (0) 2 (0) 19.36 (0) 1.19 (0) Eurya nitida 4 (0) 4 (0) 50.86 (0) 2.48 (0) Glochidion neilgherrense 4 (3) 4 (3) 123.76 (113.88) 3.05 (4.59) Gomphandra coriacea 4 (0) 4 (0) 242.32 (0) 3.97 (0) Gomphandra sp. 8 (0) 6 (0) 242.04 (0) 5.43 (0) Hydnocarpus alpina 42 (0) 32 (0) 1275.28 (0) 28.7 (0) Ilex denticulata 4 (0) 4 (0) 265.9 (0) 4.15 (0) Isonandra stocksii 6 (0) 6 (0) 176.12 (0) 4.5 (0) Litsea beddomei 8 (0) 4 (0) 75.44 (0) 3.51 (0) Litsea floribunda 2 (0) 2 (0) 173.18 (0) 2.39 (0) Litsea insignis 2 (0) 2 (0) 2.82 (0) 1.06 (0) Litsea wightiana 0 (12) 0 (12) 0 (242.35) 0 (15.31) Mastixia arborea 148 (0) 64 (0) 3495.04 (0) 78.19 (0) Maesa indica 0 (47) 0 (26) 0 (1636.71) 0 (59.06) Meliosma pinnata 0 (3) 0 (3) 0 (76.24) 0 (4.05) Meliosma simplicifolia 0 (3) 0 (3) 0 (124.47) 0 (4.74) Microtropis ramiflora 10 (0) 8 (0) 339.6 (0) 7.23 (0) Neolitsea cassia 4 (0) 4 (0) 62.12 (0) 2.57 (0) Pavetta indica 8 (0) 8 (0) 88.56 (0) 4.86 (0)
….Cont’d….
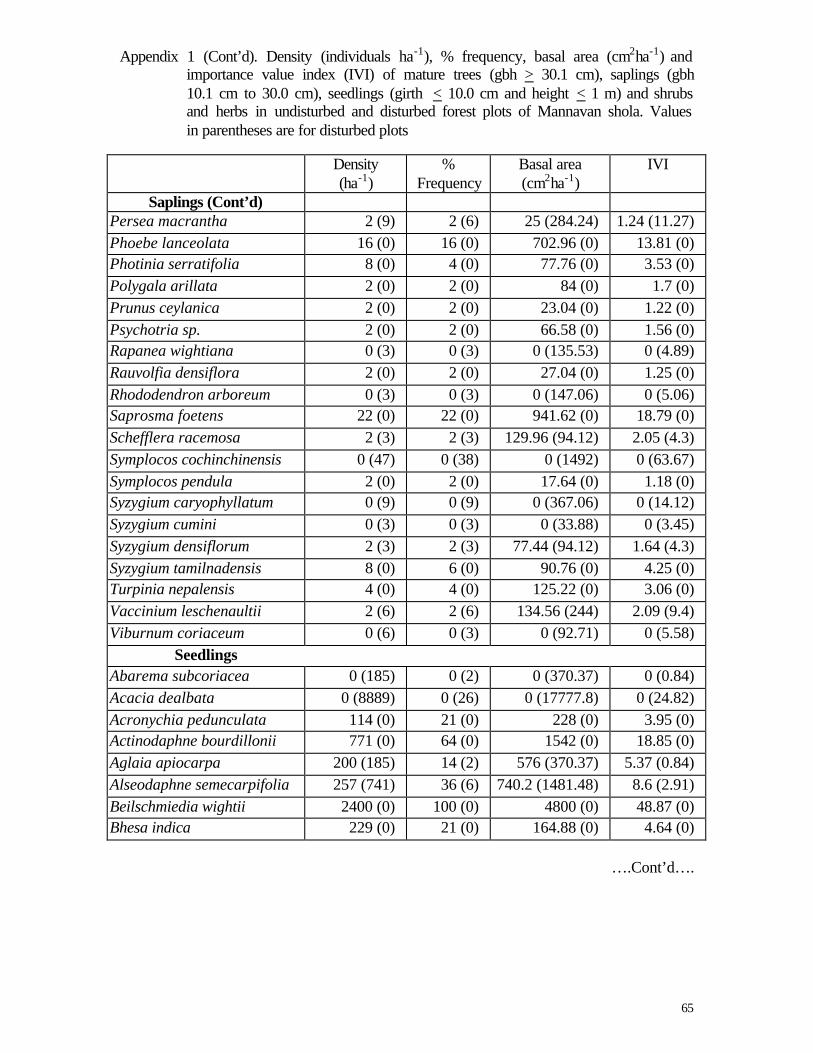
65
Appendix 1 (Cont’d). Density (individuals ha-1), % frequency, basal area (cm2ha-1) and importance value index (IVI) of mature trees (gbh > 30.1 cm), saplings (gbh 10.1 cm to 30.0 cm), seedlings (girth < 10.0 cm and height < 1 m) and shrubs and herbs in undisturbed and disturbed forest plots of Mannavan shola. Values in parentheses are for disturbed plots
Density
(ha-1) %
Frequency Basal area (cm2ha-1)
IVI
Saplings (Cont’d) Persea macrantha 2 (9) 2 (6) 25 (284.24) 1.24 (11.27) Phoebe lanceolata 16 (0) 16 (0) 702.96 (0) 13.81 (0) Photinia serratifolia 8 (0) 4 (0) 77.76 (0) 3.53 (0) Polygala arillata 2 (0) 2 (0) 84 (0) 1.7 (0) Prunus ceylanica 2 (0) 2 (0) 23.04 (0) 1.22 (0) Psychotria sp. 2 (0) 2 (0) 66.58 (0) 1.56 (0) Rapanea wightiana 0 (3) 0 (3) 0 (135.53) 0 (4.89) Rauvolfia densiflora 2 (0) 2 (0) 27.04 (0) 1.25 (0) Rhododendron arboreum 0 (3) 0 (3) 0 (147.06) 0 (5.06) Saprosma foetens 22 (0) 22 (0) 941.62 (0) 18.79 (0) Schefflera racemosa 2 (3) 2 (3) 129.96 (94.12) 2.05 (4.3) Symplocos cochinchinensis 0 (47) 0 (38) 0 (1492) 0 (63.67) Symplocos pendula 2 (0) 2 (0) 17.64 (0) 1.18 (0) Syzygium caryophyllatum 0 (9) 0 (9) 0 (367.06) 0 (14.12) Syzygium cumini 0 (3) 0 (3) 0 (33.88) 0 (3.45) Syzygium densiflorum 2 (3) 2 (3) 77.44 (94.12) 1.64 (4.3) Syzygium tamilnadensis 8 (0) 6 (0) 90.76 (0) 4.25 (0) Turpinia nepalensis 4 (0) 4 (0) 125.22 (0) 3.06 (0) Vaccinium leschenaultii 2 (6) 2 (6) 134.56 (244) 2.09 (9.4) Viburnum coriaceum 0 (6) 0 (3) 0 (92.71) 0 (5.58)
Seedlings Abarema subcoriacea 0 (185) 0 (2) 0 (370.37) 0 (0.84) Acacia dealbata 0 (8889) 0 (26) 0 (17777.8) 0 (24.82) Acronychia pedunculata 114 (0) 21 (0) 228 (0) 3.95 (0) Actinodaphne bourdillonii 771 (0) 64 (0) 1542 (0) 18.85 (0) Aglaia apiocarpa 200 (185) 14 (2) 576 (370.37) 5.37 (0.84) Alseodaphne semecarpifolia 257 (741) 36 (6) 740.2 (1481.48) 8.6 (2.91) Beilschmiedia wightii 2400 (0) 100 (0) 4800 (0) 48.87 (0) Bhesa indica 229 (0) 21 (0) 164.88 (0) 4.64 (0)
….Cont’d….
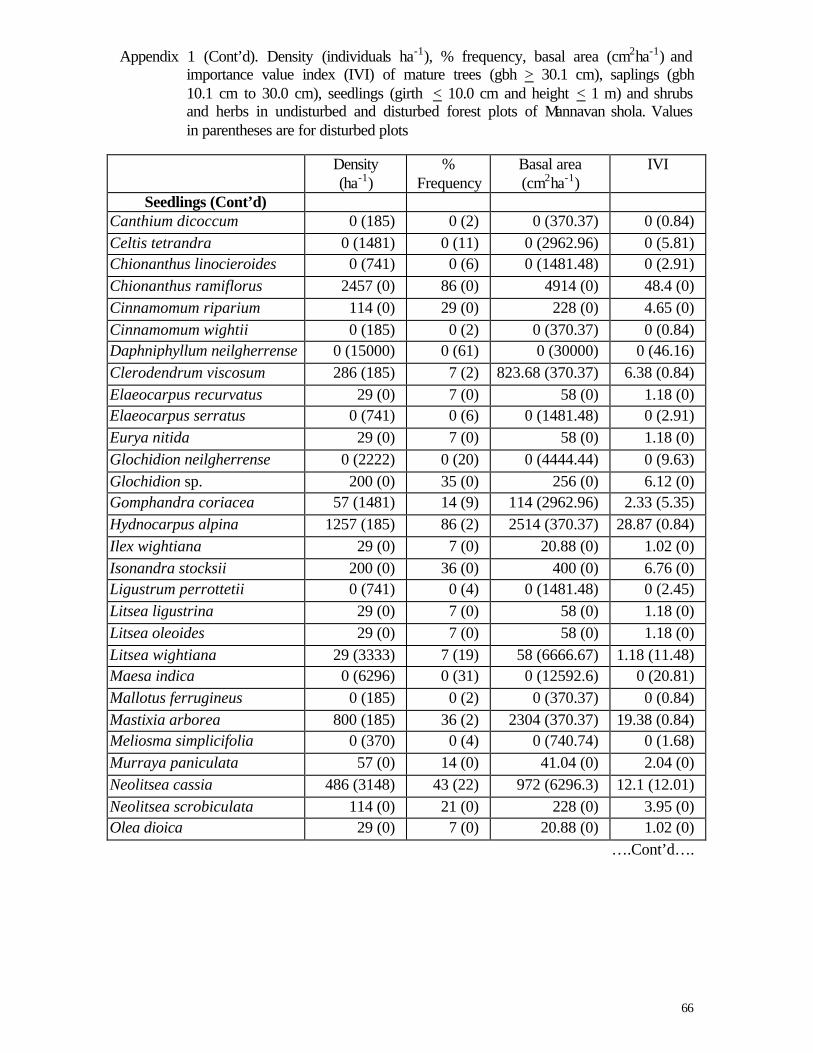
66
Appendix 1 (Cont’d). Density (individuals ha-1), % frequency, basal area (cm2ha-1) and importance value index (IVI) of mature trees (gbh > 30.1 cm), saplings (gbh 10.1 cm to 30.0 cm), seedlings (girth < 10.0 cm and height < 1 m) and shrubs and herbs in undisturbed and disturbed forest plots of Mannavan shola. Values in parentheses are for disturbed plots
Density
(ha-1) %
Frequency Basal area (cm2ha-1)
IVI
Seedlings (Cont’d) Canthium dicoccum 0 (185) 0 (2) 0 (370.37) 0 (0.84) Celtis tetrandra 0 (1481) 0 (11) 0 (2962.96) 0 (5.81) Chionanthus linocieroides 0 (741) 0 (6) 0 (1481.48) 0 (2.91) Chionanthus ramiflorus 2457 (0) 86 (0) 4914 (0) 48.4 (0) Cinnamomum riparium 114 (0) 29 (0) 228 (0) 4.65 (0) Cinnamomum wightii 0 (185) 0 (2) 0 (370.37) 0 (0.84) Daphniphyllum neilgherrense 0 (15000) 0 (61) 0 (30000) 0 (46.16) Clerodendrum viscosum 286 (185) 7 (2) 823.68 (370.37) 6.38 (0.84) Elaeocarpus recurvatus 29 (0) 7 (0) 58 (0) 1.18 (0) Elaeocarpus serratus 0 (741) 0 (6) 0 (1481.48) 0 (2.91) Eurya nitida 29 (0) 7 (0) 58 (0) 1.18 (0) Glochidion neilgherrense 0 (2222) 0 (20) 0 (4444.44) 0 (9.63) Glochidion sp. 200 (0) 35 (0) 256 (0) 6.12 (0) Gomphandra coriacea 57 (1481) 14 (9) 114 (2962.96) 2.33 (5.35) Hydnocarpus alpina 1257 (185) 86 (2) 2514 (370.37) 28.87 (0.84) Ilex wightiana 29 (0) 7 (0) 20.88 (0) 1.02 (0) Isonandra stocksii 200 (0) 36 (0) 400 (0) 6.76 (0) Ligustrum perrottetii 0 (741) 0 (4) 0 (1481.48) 0 (2.45) Litsea ligustrina 29 (0) 7 (0) 58 (0) 1.18 (0) Litsea oleoides 29 (0) 7 (0) 58 (0) 1.18 (0) Litsea wightiana 29 (3333) 7 (19) 58 (6666.67) 1.18 (11.48) Maesa indica 0 (6296) 0 (31) 0 (12592.6) 0 (20.81) Mallotus ferrugineus 0 (185) 0 (2) 0 (370.37) 0 (0.84) Mastixia arborea 800 (185) 36 (2) 2304 (370.37) 19.38 (0.84) Meliosma simplicifolia 0 (370) 0 (4) 0 (740.74) 0 (1.68) Murraya paniculata 57 (0) 14 (0) 41.04 (0) 2.04 (0) Neolitsea cassia 486 (3148) 43 (22) 972 (6296.3) 12.1 (12.01) Neolitsea scrobiculata 114 (0) 21 (0) 228 (0) 3.95 (0) Olea dioica 29 (0) 7 (0) 20.88 (0) 1.02 (0)
….Cont’d….
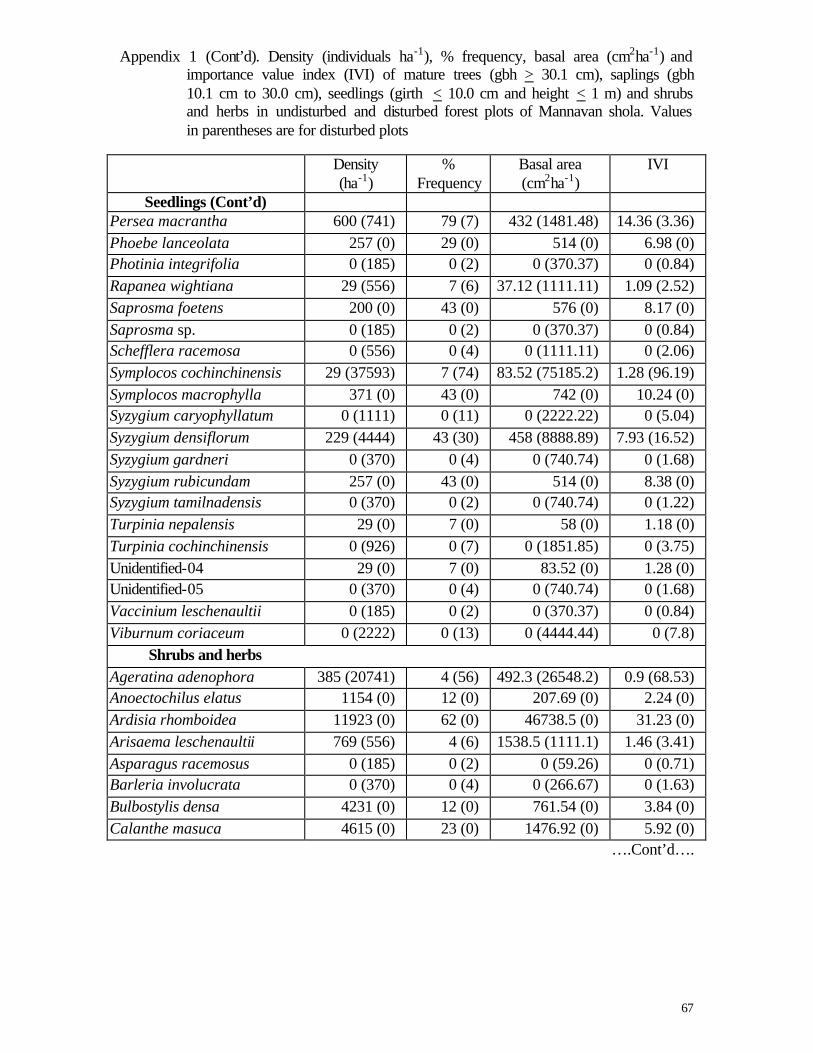
67
Appendix 1 (Cont’d). Density (individuals ha-1), % frequency, basal area (cm2ha-1) and importance value index (IVI) of mature trees (gbh > 30.1 cm), saplings (gbh 10.1 cm to 30.0 cm), seedlings (girth < 10.0 cm and height < 1 m) and shrubs and herbs in undisturbed and disturbed forest plots of Mannavan shola. Values in parentheses are for disturbed plots
Density
(ha-1) %
Frequency Basal area (cm2ha-1)
IVI
Seedlings (Cont’d) Persea macrantha 600 (741) 79 (7) 432 (1481.48) 14.36 (3.36) Phoebe lanceolata 257 (0) 29 (0) 514 (0) 6.98 (0) Photinia integrifolia 0 (185) 0 (2) 0 (370.37) 0 (0.84) Rapanea wightiana 29 (556) 7 (6) 37.12 (1111.11) 1.09 (2.52) Saprosma foetens 200 (0) 43 (0) 576 (0) 8.17 (0) Saprosma sp. 0 (185) 0 (2) 0 (370.37) 0 (0.84) Schefflera racemosa 0 (556) 0 (4) 0 (1111.11) 0 (2.06) Symplocos cochinchinensis 29 (37593) 7 (74) 83.52 (75185.2) 1.28 (96.19) Symplocos macrophylla 371 (0) 43 (0) 742 (0) 10.24 (0) Syzygium caryophyllatum 0 (1111) 0 (11) 0 (2222.22) 0 (5.04) Syzygium densiflorum 229 (4444) 43 (30) 458 (8888.89) 7.93 (16.52) Syzygium gardneri 0 (370) 0 (4) 0 (740.74) 0 (1.68) Syzygium rubicundam 257 (0) 43 (0) 514 (0) 8.38 (0) Syzygium tamilnadensis 0 (370) 0 (2) 0 (740.74) 0 (1.22) Turpinia nepalensis 29 (0) 7 (0) 58 (0) 1.18 (0) Turpinia cochinchinensis 0 (926) 0 (7) 0 (1851.85) 0 (3.75) Unidentified-04 29 (0) 7 (0) 83.52 (0) 1.28 (0) Unidentified-05 0 (370) 0 (4) 0 (740.74) 0 (1.68) Vaccinium leschenaultii 0 (185) 0 (2) 0 (370.37) 0 (0.84) Viburnum coriaceum 0 (2222) 0 (13) 0 (4444.44) 0 (7.8)
Shrubs and herbs Ageratina adenophora 385 (20741) 4 (56) 492.3 (26548.2) 0.9 (68.53) Anoectochilus elatus 1154 (0) 12 (0) 207.69 (0) 2.24 (0) Ardisia rhomboidea 11923 (0) 62 (0) 46738.5 (0) 31.23 (0) Arisaema leschenaultii 769 (556) 4 (6) 1538.5 (1111.1) 1.46 (3.41) Asparagus racemosus 0 (185) 0 (2) 0 (59.26) 0 (0.71) Barleria involucrata 0 (370) 0 (4) 0 (266.67) 0 (1.63) Bulbostylis densa 4231 (0) 12 (0) 761.54 (0) 3.84 (0) Calanthe masuca 4615 (0) 23 (0) 1476.92 (0) 5.92 (0)
….Cont’d….
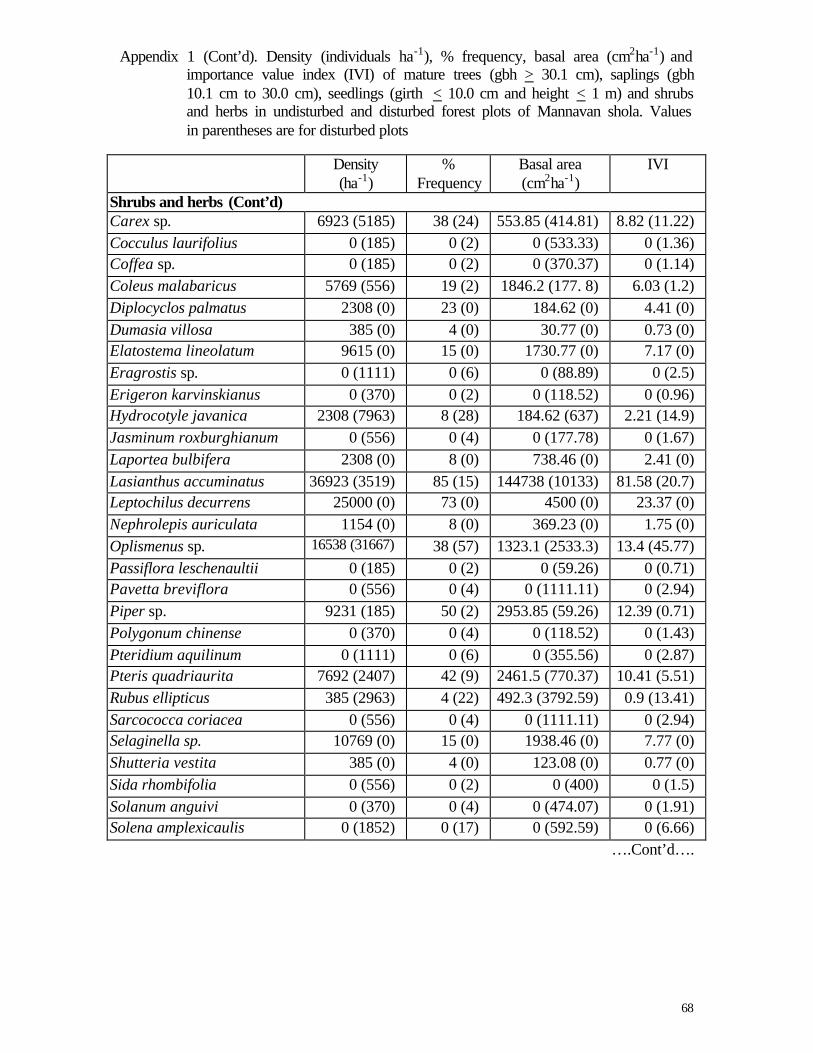
68
Appendix 1 (Cont’d). Density (individuals ha-1), % frequency, basal area (cm2ha-1) and importance value index (IVI) of mature trees (gbh > 30.1 cm), saplings (gbh 10.1 cm to 30.0 cm), seedlings (girth < 10.0 cm and height < 1 m) and shrubs and herbs in undisturbed and disturbed forest plots of Mannavan shola. Values in parentheses are for disturbed plots
Density
(ha-1) %
Frequency Basal area (cm2ha-1)
IVI
Shrubs and herbs (Cont’d) Carex sp. 6923 (5185) 38 (24) 553.85 (414.81) 8.82 (11.22) Cocculus laurifolius 0 (185) 0 (2) 0 (533.33) 0 (1.36) Coffea sp. 0 (185) 0 (2) 0 (370.37) 0 (1.14) Coleus malabaricus 5769 (556) 19 (2) 1846.2 (177. 8) 6.03 (1.2) Diplocyclos palmatus 2308 (0) 23 (0) 184.62 (0) 4.41 (0) Dumasia villosa 385 (0) 4 (0) 30.77 (0) 0.73 (0) Elatostema lineolatum 9615 (0) 15 (0) 1730.77 (0) 7.17 (0) Eragrostis sp. 0 (1111) 0 (6) 0 (88.89) 0 (2.5) Erigeron karvinskianus 0 (370) 0 (2) 0 (118.52) 0 (0.96) Hydrocotyle javanica 2308 (7963) 8 (28) 184.62 (637) 2.21 (14.9) Jasminum roxburghianum 0 (556) 0 (4) 0 (177.78) 0 (1.67) Laportea bulbifera 2308 (0) 8 (0) 738.46 (0) 2.41 (0) Lasianthus accuminatus 36923 (3519) 85 (15) 144738 (10133) 81.58 (20.7) Leptochilus decurrens 25000 (0) 73 (0) 4500 (0) 23.37 (0) Nephrolepis auriculata 1154 (0) 8 (0) 369.23 (0) 1.75 (0) Oplismenus sp. 16538 (31667) 38 (57) 1323.1 (2533.3) 13.4 (45.77) Passiflora leschenaultii 0 (185) 0 (2) 0 (59.26) 0 (0.71) Pavetta breviflora 0 (556) 0 (4) 0 (1111.11) 0 (2.94) Piper sp. 9231 (185) 50 (2) 2953.85 (59.26) 12.39 (0.71) Polygonum chinense 0 (370) 0 (4) 0 (118.52) 0 (1.43) Pteridium aquilinum 0 (1111) 0 (6) 0 (355.56) 0 (2.87) Pteris quadriaurita 7692 (2407) 42 (9) 2461.5 (770.37) 10.41 (5.51) Rubus ellipticus 385 (2963) 4 (22) 492.3 (3792.59) 0.9 (13.41) Sarcococca coriacea 0 (556) 0 (4) 0 (1111.11) 0 (2.94) Selaginella sp. 10769 (0) 15 (0) 1938.46 (0) 7.77 (0) Shutteria vestita 385 (0) 4 (0) 123.08 (0) 0.77 (0) Sida rhombifolia 0 (556) 0 (2) 0 (400) 0 (1.5) Solanum anguivi 0 (370) 0 (4) 0 (474.07) 0 (1.91) Solena amplexicaulis 0 (1852) 0 (17) 0 (592.59) 0 (6.66)
….Cont’d….
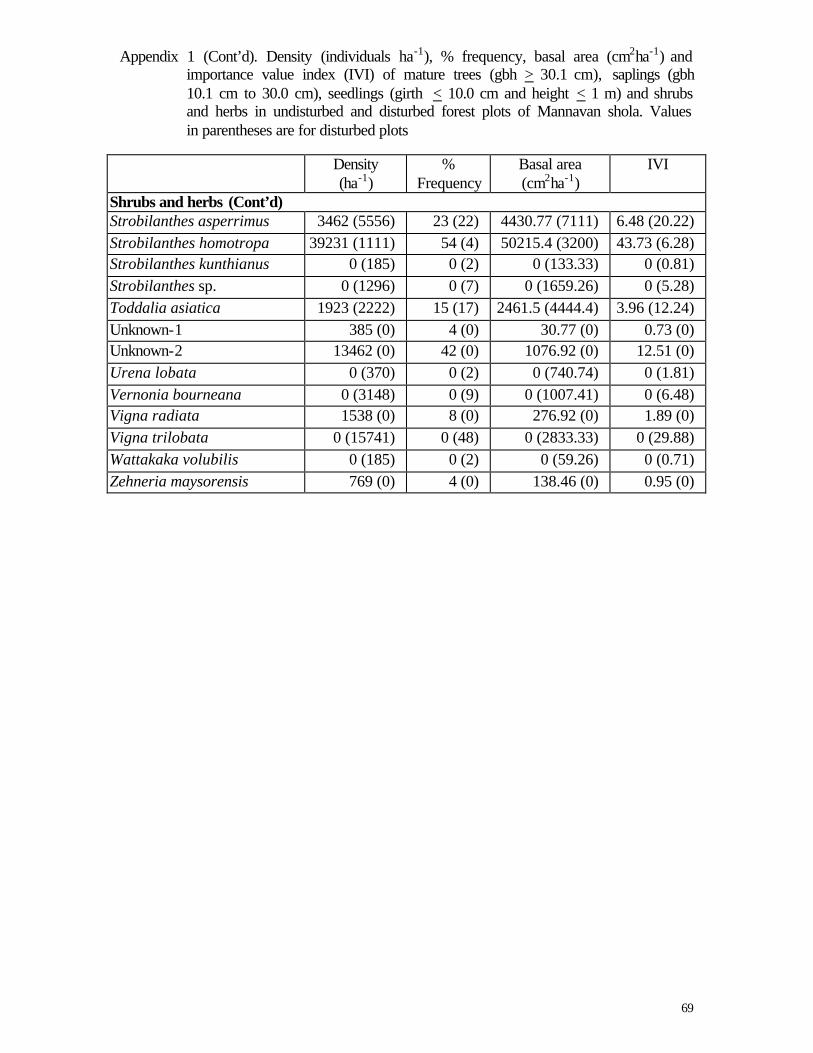
69
Appendix 1 (Cont’d). Density (individuals ha-1), % frequency, basal area (cm2ha-1) and importance value index (IVI) of mature trees (gbh > 30.1 cm), saplings (gbh 10.1 cm to 30.0 cm), seedlings (girth < 10.0 cm and height < 1 m) and shrubs and herbs in undisturbed and disturbed forest plots of Mannavan shola. Values in parentheses are for disturbed plots
Density
(ha-1) %
Frequency Basal area (cm2ha-1)
IVI
Shrubs and herbs (Cont’d) Strobilanthes asperrimus 3462 (5556) 23 (22) 4430.77 (7111) 6.48 (20.22) Strobilanthes homotropa 39231 (1111) 54 (4) 50215.4 (3200) 43.73 (6.28) Strobilanthes kunthianus 0 (185) 0 (2) 0 (133.33) 0 (0.81) Strobilanthes sp. 0 (1296) 0 (7) 0 (1659.26) 0 (5.28) Toddalia asiatica 1923 (2222) 15 (17) 2461.5 (4444.4) 3.96 (12.24) Unknown-1 385 (0) 4 (0) 30.77 (0) 0.73 (0) Unknown-2 13462 (0) 42 (0) 1076.92 (0) 12.51 (0) Urena lobata 0 (370) 0 (2) 0 (740.74) 0 (1.81) Vernonia bourneana 0 (3148) 0 (9) 0 (1007.41) 0 (6.48) Vigna radiata 1538 (0) 8 (0) 276.92 (0) 1.89 (0) Vigna trilobata 0 (15741) 0 (48) 0 (2833.33) 0 (29.88) Wattakaka volubilis 0 (185) 0 (2) 0 (59.26) 0 (0.71) Zehneria maysorensis 769 (0) 4 (0) 138.46 (0) 0.95 (0)
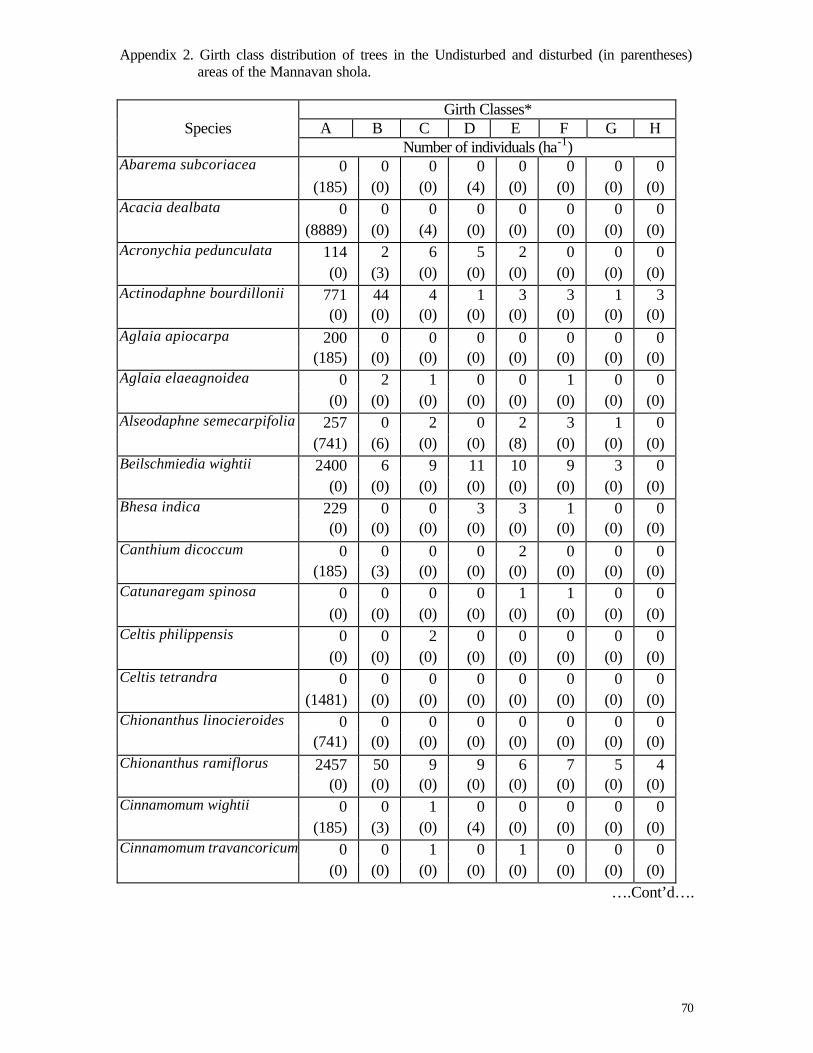
70
Appendix 2. Girth class distribution of trees in the Undisturbed and disturbed (in parentheses) areas of the Mannavan shola.
Girth Classes*
Species A B C D E F G H Number of individuals (ha-1) Abarema subcoriacea 0 0 0 0 0 0 0 0
(185) (0) (0) (4) (0) (0) (0) (0) Acacia dealbata 0 0 0 0 0 0 0 0
(8889) (0) (4) (0) (0) (0) (0) (0) Acronychia pedunculata 114 2 6 5 2 0 0 0
(0) (3) (0) (0) (0) (0) (0) (0) Actinodaphne bourdillonii 771 44 4 1 3 3 1 3
(0) (0) (0) (0) (0) (0) (0) (0) Aglaia apiocarpa 200 0 0 0 0 0 0 0
(185) (0) (0) (0) (0) (0) (0) (0) Aglaia elaeagnoidea 0 2 1 0 0 1 0 0
(0) (0) (0) (0) (0) (0) (0) (0) Alseodaphne semecarpifolia 257 0 2 0 2 3 1 0
(741) (6) (0) (0) (8) (0) (0) (0) Beilschmiedia wightii 2400 6 9 11 10 9 3 0
(0) (0) (0) (0) (0) (0) (0) (0) Bhesa indica 229 0 0 3 3 1 0 0
(0) (0) (0) (0) (0) (0) (0) (0) Canthium dicoccum 0 0 0 0 2 0 0 0
(185) (3) (0) (0) (0) (0) (0) (0) Catunaregam spinosa 0 0 0 0 1 1 0 0
(0) (0) (0) (0) (0) (0) (0) (0) Celtis philippensis 0 0 2 0 0 0 0 0
(0) (0) (0) (0) (0) (0) (0) (0) Celtis tetrandra 0 0 0 0 0 0 0 0
(1481) (0) (0) (0) (0) (0) (0) (0) Chionanthus linocieroides 0 0 0 0 0 0 0 0
(741) (0) (0) (0) (0) (0) (0) (0) Chionanthus ramiflorus 2457 50 9 9 6 7 5 4
(0) (0) (0) (0) (0) (0) (0) (0) Cinnamomum wightii 0 0 1 0 0 0 0 0
(185) (3) (0) (4) (0) (0) (0) (0) Cinnamomum travancoricum 0 0 1 0 1 0 0 0
(0) (0) (0) (0) (0) (0) (0) (0) ….Cont’d….
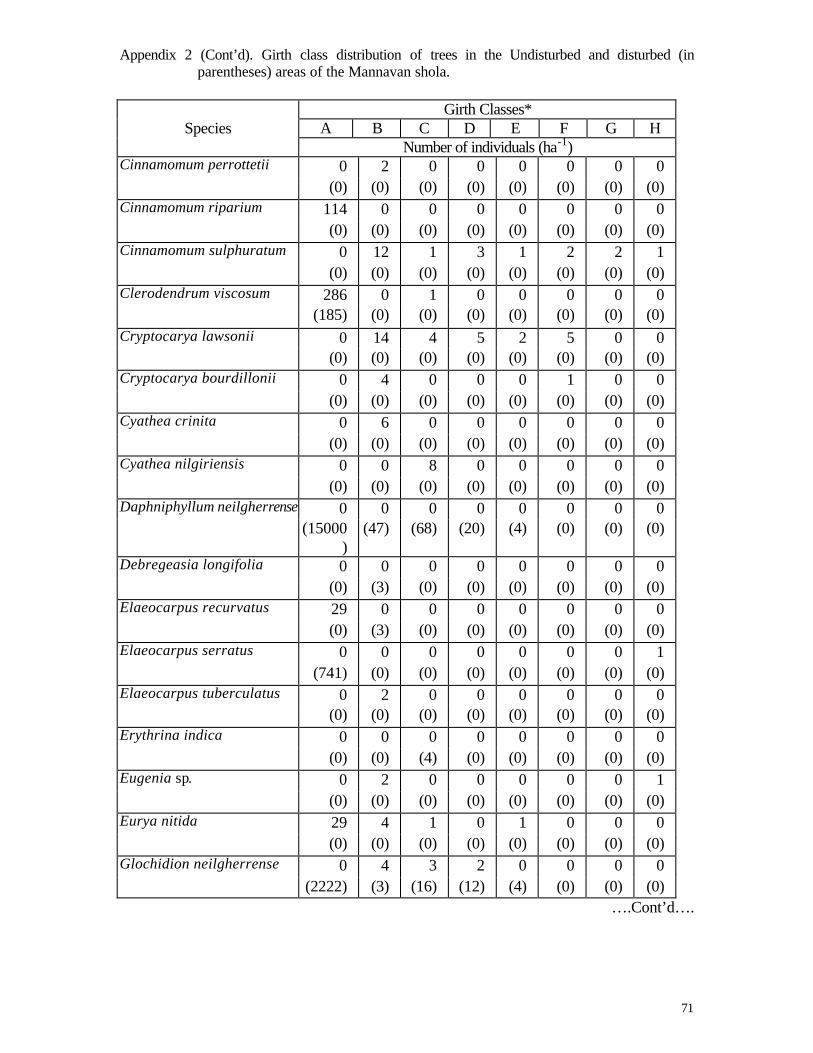
71
Appendix 2 (Cont’d). Girth class distribution of trees in the Undisturbed and disturbed (in parentheses) areas of the Mannavan shola.
Girth Classes*
Species A B C D E F G H Number of individuals (ha-1) Cinnamomum perrottetii 0 2 0 0 0 0 0 0
(0) (0) (0) (0) (0) (0) (0) (0) Cinnamomum riparium 114 0 0 0 0 0 0 0
(0) (0) (0) (0) (0) (0) (0) (0) Cinnamomum sulphuratum 0 12 1 3 1 2 2 1
(0) (0) (0) (0) (0) (0) (0) (0) Clerodendrum viscosum 286 0 1 0 0 0 0 0
(185) (0) (0) (0) (0) (0) (0) (0) Cryptocarya lawsonii 0 14 4 5 2 5 0 0
(0) (0) (0) (0) (0) (0) (0) (0) Cryptocarya bourdillonii 0 4 0 0 0 1 0 0
(0) (0) (0) (0) (0) (0) (0) (0) Cyathea crinita 0 6 0 0 0 0 0 0
(0) (0) (0) (0) (0) (0) (0) (0) Cyathea nilgiriensis 0 0 8 0 0 0 0 0
(0) (0) (0) (0) (0) (0) (0) (0) Daphniphyllum neilgherrense 0 0 0 0 0 0 0 0
(15000)
(47) (68) (20) (4) (0) (0) (0)
Debregeasia longifolia 0 0 0 0 0 0 0 0 (0) (3) (0) (0) (0) (0) (0) (0)
Elaeocarpus recurvatus 29 0 0 0 0 0 0 0 (0) (3) (0) (0) (0) (0) (0) (0)
Elaeocarpus serratus 0 0 0 0 0 0 0 1 (741) (0) (0) (0) (0) (0) (0) (0)
Elaeocarpus tuberculatus 0 2 0 0 0 0 0 0 (0) (0) (0) (0) (0) (0) (0) (0)
Erythrina indica 0 0 0 0 0 0 0 0 (0) (0) (4) (0) (0) (0) (0) (0)
Eugenia sp. 0 2 0 0 0 0 0 1 (0) (0) (0) (0) (0) (0) (0) (0)
Eurya nitida 29 4 1 0 1 0 0 0 (0) (0) (0) (0) (0) (0) (0) (0)
Glochidion neilgherrense 0 4 3 2 0 0 0 0 (2222) (3) (16) (12) (4) (0) (0) (0)
….Cont’d….
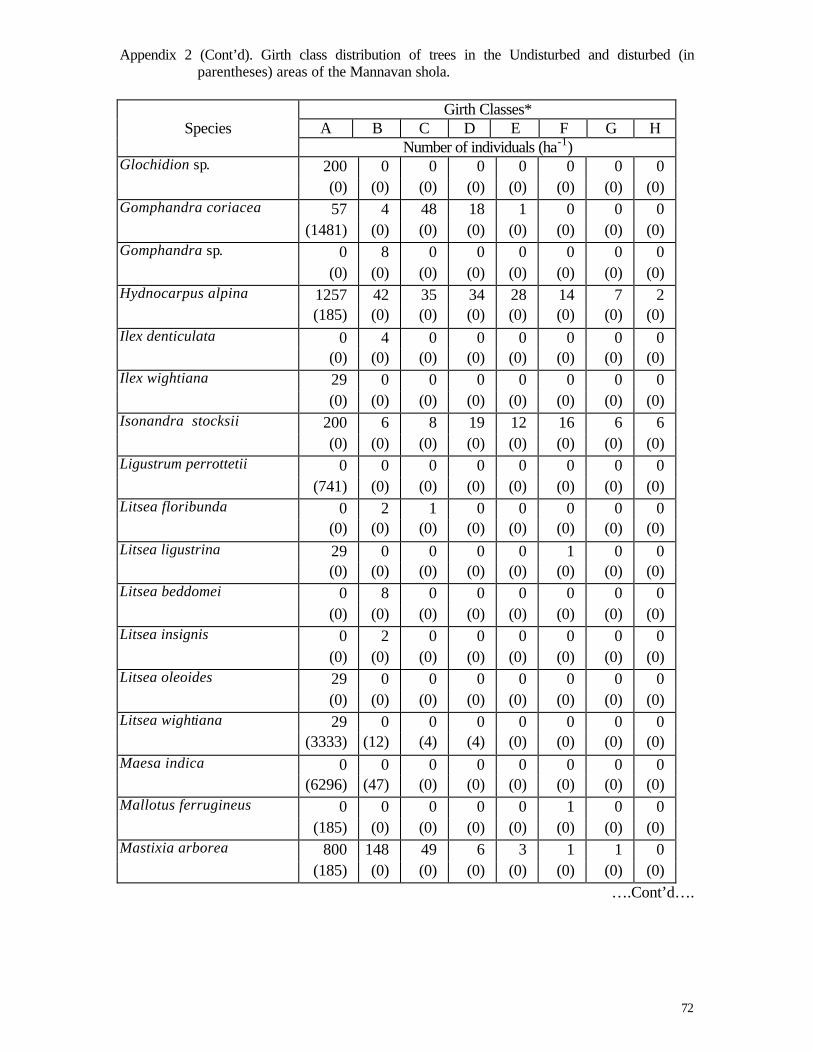
72
Appendix 2 (Cont’d). Girth class distribution of trees in the Undisturbed and disturbed (in parentheses) areas of the Mannavan shola.
Girth Classes*
Species A B C D E F G H Number of individuals (ha-1) Glochidion sp. 200 0 0 0 0 0 0 0
(0) (0) (0) (0) (0) (0) (0) (0) Gomphandra coriacea 57 4 48 18 1 0 0 0
(1481) (0) (0) (0) (0) (0) (0) (0) Gomphandra sp. 0 8 0 0 0 0 0 0
(0) (0) (0) (0) (0) (0) (0) (0) Hydnocarpus alpina 1257 42 35 34 28 14 7 2
(185) (0) (0) (0) (0) (0) (0) (0) Ilex denticulata 0 4 0 0 0 0 0 0
(0) (0) (0) (0) (0) (0) (0) (0) Ilex wightiana 29 0 0 0 0 0 0 0
(0) (0) (0) (0) (0) (0) (0) (0) Isonandra stocksii 200 6 8 19 12 16 6 6
(0) (0) (0) (0) (0) (0) (0) (0) Ligustrum perrottetii 0 0 0 0 0 0 0 0
(741) (0) (0) (0) (0) (0) (0) (0) Litsea floribunda 0 2 1 0 0 0 0 0
(0) (0) (0) (0) (0) (0) (0) (0) Litsea ligustrina 29 0 0 0 0 1 0 0
(0) (0) (0) (0) (0) (0) (0) (0) Litsea beddomei 0 8 0 0 0 0 0 0
(0) (0) (0) (0) (0) (0) (0) (0) Litsea insignis 0 2 0 0 0 0 0 0
(0) (0) (0) (0) (0) (0) (0) (0) Litsea oleoides 29 0 0 0 0 0 0 0
(0) (0) (0) (0) (0) (0) (0) (0) Litsea wightiana 29 0 0 0 0 0 0 0
(3333) (12) (4) (4) (0) (0) (0) (0) Maesa indica 0 0 0 0 0 0 0 0
(6296) (47) (0) (0) (0) (0) (0) (0) Mallotus ferrugineus 0 0 0 0 0 1 0 0
(185) (0) (0) (0) (0) (0) (0) (0) Mastixia arborea 800 148 49 6 3 1 1 0
(185) (0) (0) (0) (0) (0) (0) (0) ….Cont’d….
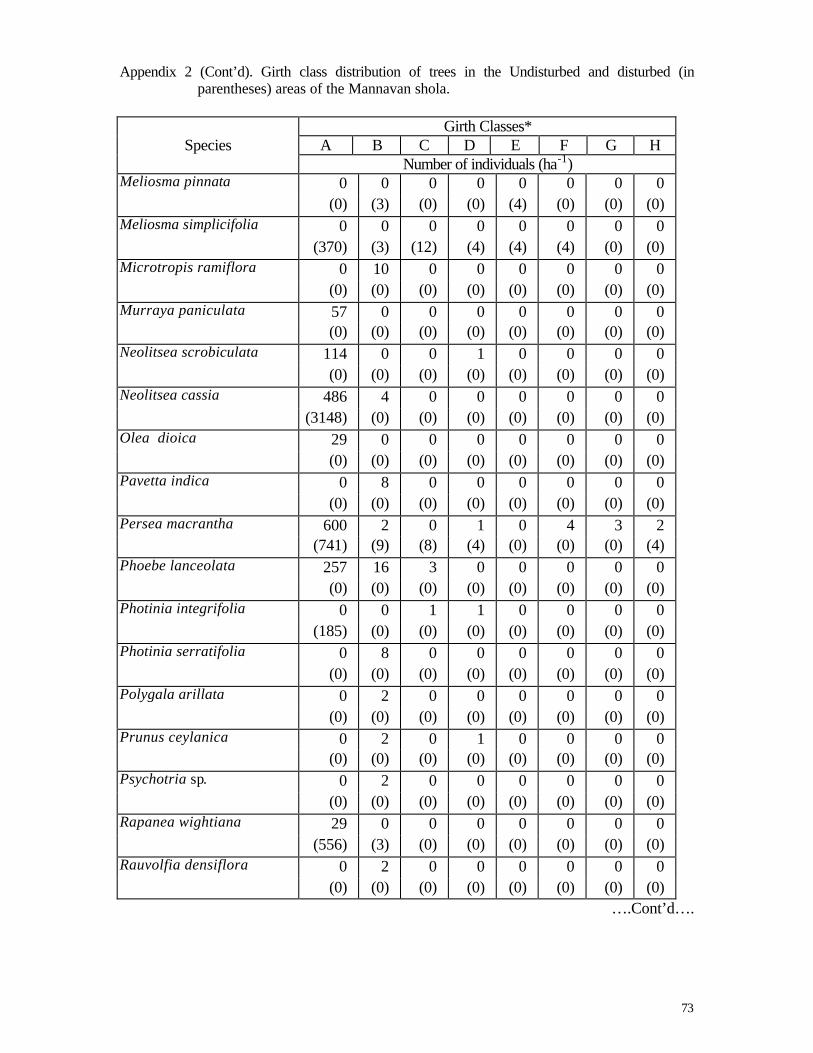
73
Appendix 2 (Cont’d). Girth class distribution of trees in the Undisturbed and disturbed (in
parentheses) areas of the Mannavan shola.
Girth Classes* Species A B C D E F G H
Number of individuals (ha-1) Meliosma pinnata 0 0 0 0 0 0 0 0
(0) (3) (0) (0) (4) (0) (0) (0) Meliosma simplicifolia 0 0 0 0 0 0 0 0
(370) (3) (12) (4) (4) (4) (0) (0) Microtropis ramiflora 0 10 0 0 0 0 0 0
(0) (0) (0) (0) (0) (0) (0) (0) Murraya paniculata 57 0 0 0 0 0 0 0
(0) (0) (0) (0) (0) (0) (0) (0) Neolitsea scrobiculata 114 0 0 1 0 0 0 0
(0) (0) (0) (0) (0) (0) (0) (0) Neolitsea cassia 486 4 0 0 0 0 0 0
(3148) (0) (0) (0) (0) (0) (0) (0) Olea dioica 29 0 0 0 0 0 0 0
(0) (0) (0) (0) (0) (0) (0) (0) Pavetta indica 0 8 0 0 0 0 0 0
(0) (0) (0) (0) (0) (0) (0) (0) Persea macrantha 600 2 0 1 0 4 3 2
(741) (9) (8) (4) (0) (0) (0) (4) Phoebe lanceolata 257 16 3 0 0 0 0 0
(0) (0) (0) (0) (0) (0) (0) (0) Photinia integrifolia 0 0 1 1 0 0 0 0
(185) (0) (0) (0) (0) (0) (0) (0) Photinia serratifolia 0 8 0 0 0 0 0 0
(0) (0) (0) (0) (0) (0) (0) (0) Polygala arillata 0 2 0 0 0 0 0 0
(0) (0) (0) (0) (0) (0) (0) (0) Prunus ceylanica 0 2 0 1 0 0 0 0
(0) (0) (0) (0) (0) (0) (0) (0) Psychotria sp. 0 2 0 0 0 0 0 0
(0) (0) (0) (0) (0) (0) (0) (0) Rapanea wightiana 29 0 0 0 0 0 0 0
(556) (3) (0) (0) (0) (0) (0) (0) Rauvolfia densiflora 0 2 0 0 0 0 0 0
(0) (0) (0) (0) (0) (0) (0) (0) ….Cont’d….
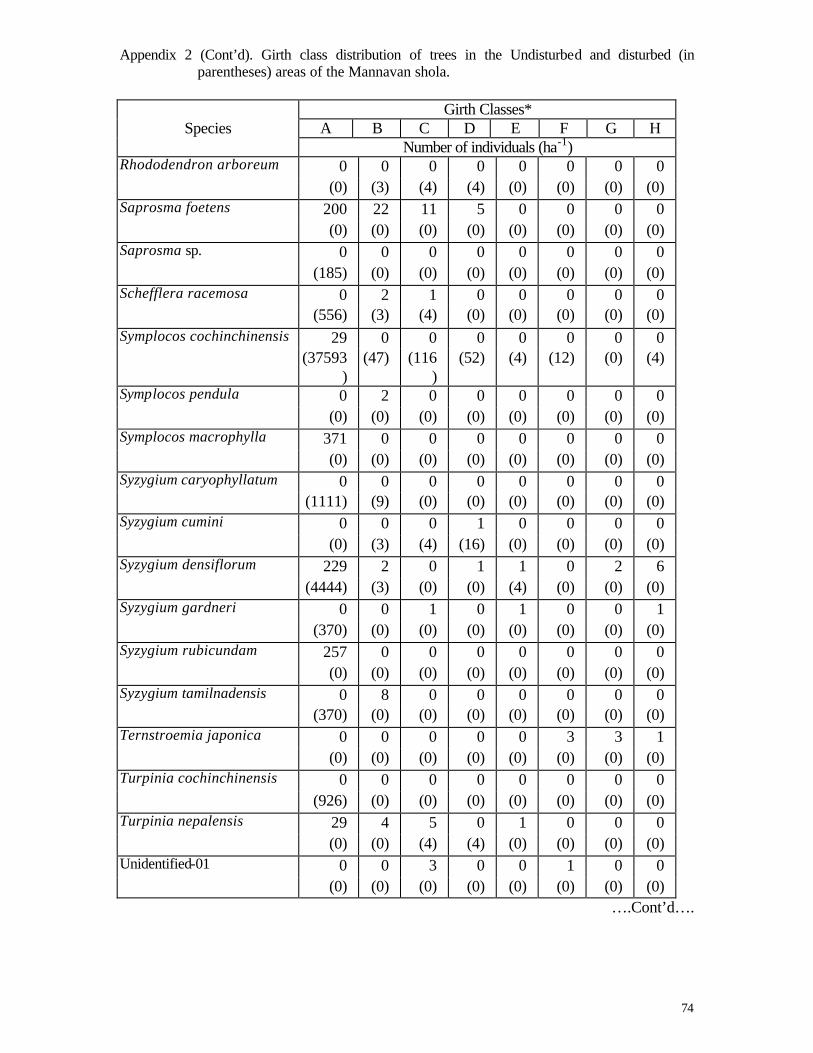
74
Appendix 2 (Cont’d). Girth class distribution of trees in the Undisturbed and disturbed (in parentheses) areas of the Mannavan shola.
Girth Classes*
Species A B C D E F G H Number of individuals (ha-1) Rhododendron arboreum 0 0 0 0 0 0 0 0
(0) (3) (4) (4) (0) (0) (0) (0) Saprosma foetens 200 22 11 5 0 0 0 0
(0) (0) (0) (0) (0) (0) (0) (0) Saprosma sp. 0 0 0 0 0 0 0 0
(185) (0) (0) (0) (0) (0) (0) (0) Schefflera racemosa 0 2 1 0 0 0 0 0
(556) (3) (4) (0) (0) (0) (0) (0) Symplocos cochinchinensis 29 0 0 0 0 0 0 0
(37593)
(47) (116)
(52) (4) (12) (0) (4)
Symplocos pendula 0 2 0 0 0 0 0 0 (0) (0) (0) (0) (0) (0) (0) (0)
Symplocos macrophylla 371 0 0 0 0 0 0 0 (0) (0) (0) (0) (0) (0) (0) (0)
Syzygium caryophyllatum 0 0 0 0 0 0 0 0 (1111) (9) (0) (0) (0) (0) (0) (0)
Syzygium cumini 0 0 0 1 0 0 0 0 (0) (3) (4) (16) (0) (0) (0) (0)
Syzygium densiflorum 229 2 0 1 1 0 2 6 (4444) (3) (0) (0) (4) (0) (0) (0)
Syzygium gardneri 0 0 1 0 1 0 0 1 (370) (0) (0) (0) (0) (0) (0) (0)
Syzygium rubicundam 257 0 0 0 0 0 0 0 (0) (0) (0) (0) (0) (0) (0) (0)
Syzygium tamilnadensis 0 8 0 0 0 0 0 0 (370) (0) (0) (0) (0) (0) (0) (0)
Ternstroemia japonica 0 0 0 0 0 3 3 1 (0) (0) (0) (0) (0) (0) (0) (0)
Turpinia cochinchinensis 0 0 0 0 0 0 0 0 (926) (0) (0) (0) (0) (0) (0) (0)
Turpinia nepalensis 29 4 5 0 1 0 0 0 (0) (0) (4) (4) (0) (0) (0) (0)
Unidentified-01 0 0 3 0 0 1 0 0 (0) (0) (0) (0) (0) (0) (0) (0)
….Cont’d….
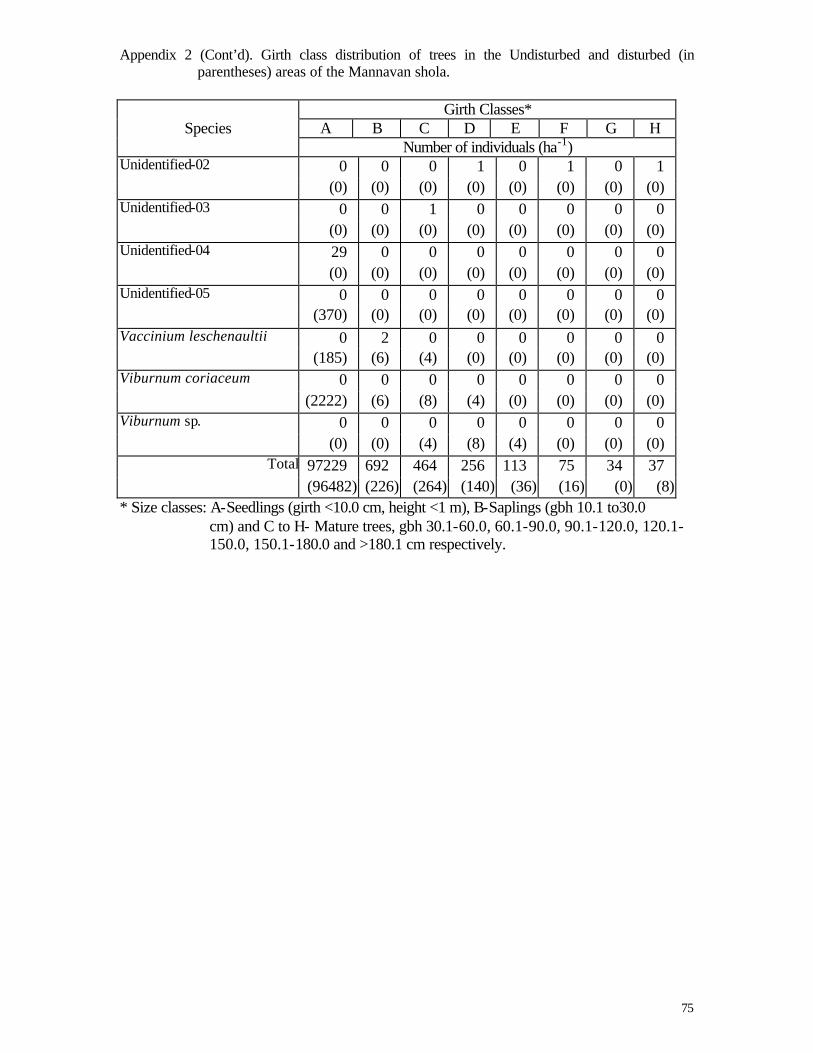
75
Appendix 2 (Cont’d). Girth class distribution of trees in the Undisturbed and disturbed (in parentheses) areas of the Mannavan shola.
Girth Classes*
Species A B C D E F G H Number of individuals (ha-1) Unidentified-02 0 0 0 1 0 1 0 1
(0) (0) (0) (0) (0) (0) (0) (0) Unidentified-03 0 0 1 0 0 0 0 0
(0) (0) (0) (0) (0) (0) (0) (0) Unidentified-04 29 0 0 0 0 0 0 0
(0) (0) (0) (0) (0) (0) (0) (0) Unidentified-05 0 0 0 0 0 0 0 0
(370) (0) (0) (0) (0) (0) (0) (0) Vaccinium leschenaultii 0 2 0 0 0 0 0 0
(185) (6) (4) (0) (0) (0) (0) (0) Viburnum coriaceum 0 0 0 0 0 0 0 0
(2222) (6) (8) (4) (0) (0) (0) (0) Viburnum sp. 0 0 0 0 0 0 0 0
(0) (0) (4) (8) (4) (0) (0) (0) Total 97229 692 464 256 113 75 34 37
(96482) (226) (264) (140) (36) (16) (0) (8) * Size classes: A-Seedlings (girth <10.0 cm, height <1 m), B-Saplings (gbh 10.1 to30.0
cm) and C to H- Mature trees, gbh 30.1-60.0, 60.1-90.0, 90.1-120.0, 120.1-150.0, 150.1-180.0 and >180.1 cm respectively.
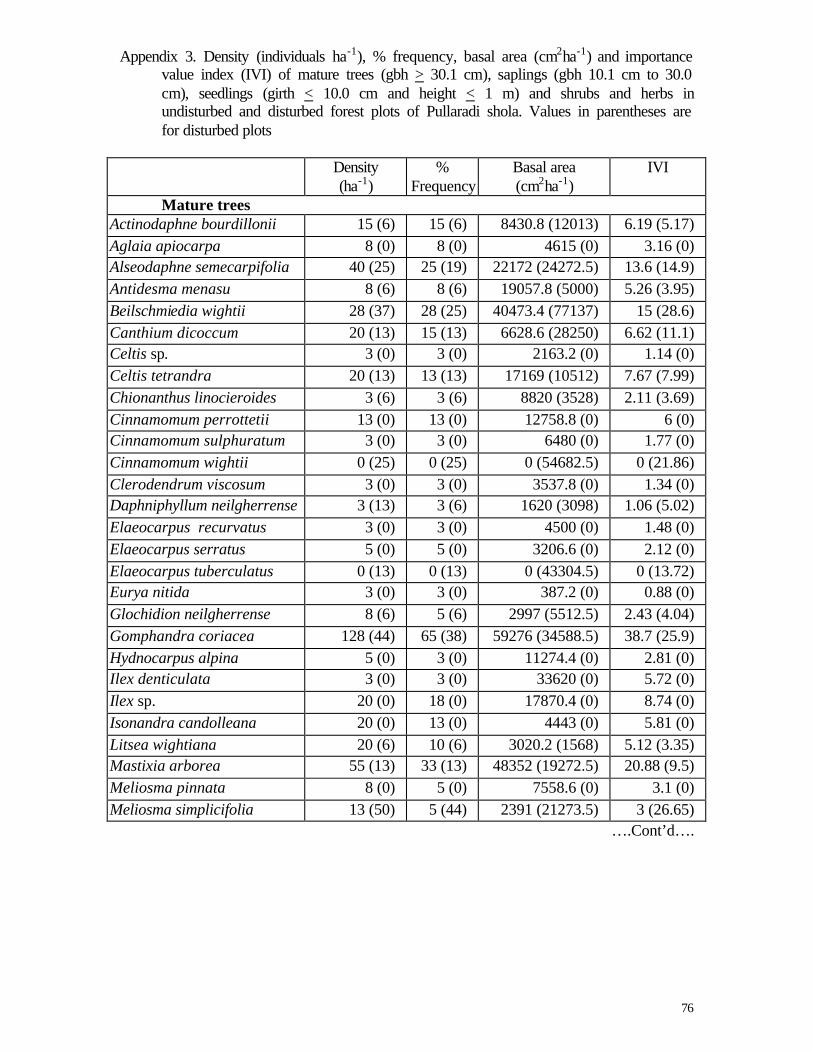
76
Appendix 3. Density (individuals ha-1), % frequency, basal area (cm2ha-1) and importance value index (IVI) of mature trees (gbh > 30.1 cm), saplings (gbh 10.1 cm to 30.0 cm), seedlings (girth < 10.0 cm and height < 1 m) and shrubs and herbs in undisturbed and disturbed forest plots of Pullaradi shola. Values in parentheses are for disturbed plots
Density
(ha-1) %
Frequency Basal area (cm2ha-1)
IVI
Mature trees Actinodaphne bourdillonii 15 (6) 15 (6) 8430.8 (12013) 6.19 (5.17) Aglaia apiocarpa 8 (0) 8 (0) 4615 (0) 3.16 (0) Alseodaphne semecarpifolia 40 (25) 25 (19) 22172 (24272.5) 13.6 (14.9) Antidesma menasu 8 (6) 8 (6) 19057.8 (5000) 5.26 (3.95) Beilschmiedia wightii 28 (37) 28 (25) 40473.4 (77137) 15 (28.6) Canthium dicoccum 20 (13) 15 (13) 6628.6 (28250) 6.62 (11.1) Celtis sp. 3 (0) 3 (0) 2163.2 (0) 1.14 (0) Celtis tetrandra 20 (13) 13 (13) 17169 (10512) 7.67 (7.99) Chionanthus linocieroides 3 (6) 3 (6) 8820 (3528) 2.11 (3.69) Cinnamomum perrottetii 13 (0) 13 (0) 12758.8 (0) 6 (0) Cinnamomum sulphuratum 3 (0) 3 (0) 6480 (0) 1.77 (0) Cinnamomum wightii 0 (25) 0 (25) 0 (54682.5) 0 (21.86) Clerodendrum viscosum 3 (0) 3 (0) 3537.8 (0) 1.34 (0) Daphniphyllum neilgherrense 3 (13) 3 (6) 1620 (3098) 1.06 (5.02) Elaeocarpus recurvatus 3 (0) 3 (0) 4500 (0) 1.48 (0) Elaeocarpus serratus 5 (0) 5 (0) 3206.6 (0) 2.12 (0) Elaeocarpus tuberculatus 0 (13) 0 (13) 0 (43304.5) 0 (13.72) Eurya nitida 3 (0) 3 (0) 387.2 (0) 0.88 (0) Glochidion neilgherrense 8 (6) 5 (6) 2997 (5512.5) 2.43 (4.04) Gomphandra coriacea 128 (44) 65 (38) 59276 (34588.5) 38.7 (25.9) Hydnocarpus alpina 5 (0) 3 (0) 11274.4 (0) 2.81 (0) Ilex denticulata 3 (0) 3 (0) 33620 (0) 5.72 (0) Ilex sp. 20 (0) 18 (0) 17870.4 (0) 8.74 (0) Isonandra candolleana 20 (0) 13 (0) 4443 (0) 5.81 (0) Litsea wightiana 20 (6) 10 (6) 3020.2 (1568) 5.12 (3.35) Mastixia arborea 55 (13) 33 (13) 48352 (19272.5) 20.88 (9.5) Meliosma pinnata 8 (0) 5 (0) 7558.6 (0) 3.1 (0) Meliosma simplicifolia 13 (50) 5 (44) 2391 (21273.5) 3 (26.65)
….Cont’d….
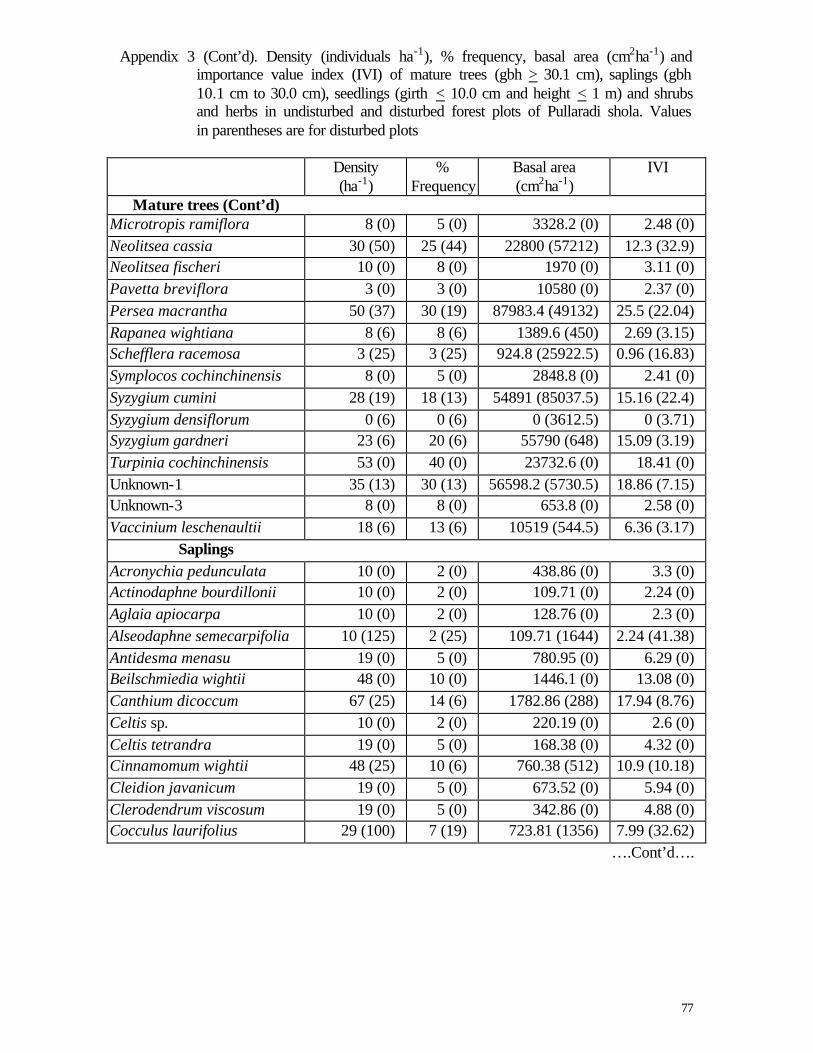
77
Appendix 3 (Cont’d). Density (individuals ha-1), % frequency, basal area (cm2ha-1) and importance value index (IVI) of mature trees (gbh > 30.1 cm), saplings (gbh 10.1 cm to 30.0 cm), seedlings (girth < 10.0 cm and height < 1 m) and shrubs and herbs in undisturbed and disturbed forest plots of Pullaradi shola. Values in parentheses are for disturbed plots
Density
(ha-1) %
Frequency Basal area (cm2ha-1)
IVI
Mature trees (Cont’d) Microtropis ramiflora 8 (0) 5 (0) 3328.2 (0) 2.48 (0) Neolitsea cassia 30 (50) 25 (44) 22800 (57212) 12.3 (32.9) Neolitsea fischeri 10 (0) 8 (0) 1970 (0) 3.11 (0) Pavetta breviflora 3 (0) 3 (0) 10580 (0) 2.37 (0) Persea macrantha 50 (37) 30 (19) 87983.4 (49132) 25.5 (22.04) Rapanea wightiana 8 (6) 8 (6) 1389.6 (450) 2.69 (3.15) Schefflera racemosa 3 (25) 3 (25) 924.8 (25922.5) 0.96 (16.83) Symplocos cochinchinensis 8 (0) 5 (0) 2848.8 (0) 2.41 (0) Syzygium cumini 28 (19) 18 (13) 54891 (85037.5) 15.16 (22.4) Syzygium densiflorum 0 (6) 0 (6) 0 (3612.5) 0 (3.71) Syzygium gardneri 23 (6) 20 (6) 55790 (648) 15.09 (3.19) Turpinia cochinchinensis 53 (0) 40 (0) 23732.6 (0) 18.41 (0) Unknown-1 35 (13) 30 (13) 56598.2 (5730.5) 18.86 (7.15) Unknown-3 8 (0) 8 (0) 653.8 (0) 2.58 (0) Vaccinium leschenaultii 18 (6) 13 (6) 10519 (544.5) 6.36 (3.17)
Saplings Acronychia pedunculata 10 (0) 2 (0) 438.86 (0) 3.3 (0) Actinodaphne bourdillonii 10 (0) 2 (0) 109.71 (0) 2.24 (0) Aglaia apiocarpa 10 (0) 2 (0) 128.76 (0) 2.3 (0) Alseodaphne semecarpifolia 10 (125) 2 (25) 109.71 (1644) 2.24 (41.38) Antidesma menasu 19 (0) 5 (0) 780.95 (0) 6.29 (0) Beilschmiedia wightii 48 (0) 10 (0) 1446.1 (0) 13.08 (0) Canthium dicoccum 67 (25) 14 (6) 1782.86 (288) 17.94 (8.76) Celtis sp. 10 (0) 2 (0) 220.19 (0) 2.6 (0) Celtis tetrandra 19 (0) 5 (0) 168.38 (0) 4.32 (0) Cinnamomum wightii 48 (25) 10 (6) 760.38 (512) 10.9 (10.18) Cleidion javanicum 19 (0) 5 (0) 673.52 (0) 5.94 (0) Clerodendrum viscosum 19 (0) 5 (0) 342.86 (0) 4.88 (0) Cocculus laurifolius 29 (100) 7 (19) 723.81 (1356) 7.99 (32.62)
….Cont’d….
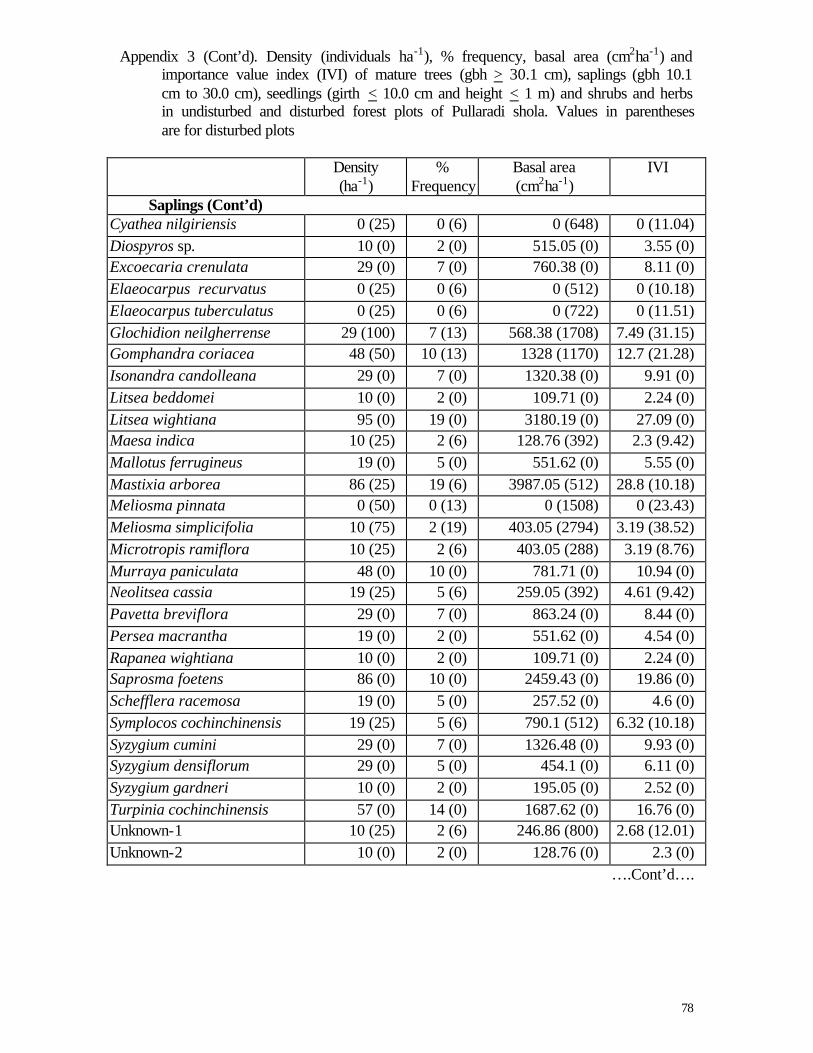
78
Appendix 3 (Cont’d). Density (individuals ha-1), % frequency, basal area (cm2ha-1) and importance value index (IVI) of mature trees (gbh > 30.1 cm), saplings (gbh 10.1 cm to 30.0 cm), seedlings (girth < 10.0 cm and height < 1 m) and shrubs and herbs in undisturbed and disturbed forest plots of Pullaradi shola. Values in parentheses are for disturbed plots
Density
(ha-1) %
Frequency Basal area (cm2ha-1)
IVI
Saplings (Cont’d) Cyathea nilgiriensis 0 (25) 0 (6) 0 (648) 0 (11.04) Diospyros sp. 10 (0) 2 (0) 515.05 (0) 3.55 (0) Excoecaria crenulata 29 (0) 7 (0) 760.38 (0) 8.11 (0) Elaeocarpus recurvatus 0 (25) 0 (6) 0 (512) 0 (10.18) Elaeocarpus tuberculatus 0 (25) 0 (6) 0 (722) 0 (11.51) Glochidion neilgherrense 29 (100) 7 (13) 568.38 (1708) 7.49 (31.15) Gomphandra coriacea 48 (50) 10 (13) 1328 (1170) 12.7 (21.28) Isonandra candolleana 29 (0) 7 (0) 1320.38 (0) 9.91 (0) Litsea beddomei 10 (0) 2 (0) 109.71 (0) 2.24 (0) Litsea wightiana 95 (0) 19 (0) 3180.19 (0) 27.09 (0) Maesa indica 10 (25) 2 (6) 128.76 (392) 2.3 (9.42) Mallotus ferrugineus 19 (0) 5 (0) 551.62 (0) 5.55 (0) Mastixia arborea 86 (25) 19 (6) 3987.05 (512) 28.8 (10.18) Meliosma pinnata 0 (50) 0 (13) 0 (1508) 0 (23.43) Meliosma simplicifolia 10 (75) 2 (19) 403.05 (2794) 3.19 (38.52) Microtropis ramiflora 10 (25) 2 (6) 403.05 (288) 3.19 (8.76) Murraya paniculata 48 (0) 10 (0) 781.71 (0) 10.94 (0) Neolitsea cassia 19 (25) 5 (6) 259.05 (392) 4.61 (9.42) Pavetta breviflora 29 (0) 7 (0) 863.24 (0) 8.44 (0) Persea macrantha 19 (0) 2 (0) 551.62 (0) 4.54 (0) Rapanea wightiana 10 (0) 2 (0) 109.71 (0) 2.24 (0) Saprosma foetens 86 (0) 10 (0) 2459.43 (0) 19.86 (0) Schefflera racemosa 19 (0) 5 (0) 257.52 (0) 4.6 (0) Symplocos cochinchinensis 19 (25) 5 (6) 790.1 (512) 6.32 (10.18) Syzygium cumini 29 (0) 7 (0) 1326.48 (0) 9.93 (0) Syzygium densiflorum 29 (0) 5 (0) 454.1 (0) 6.11 (0) Syzygium gardneri 10 (0) 2 (0) 195.05 (0) 2.52 (0) Turpinia cochinchinensis 57 (0) 14 (0) 1687.62 (0) 16.76 (0) Unknown-1 10 (25) 2 (6) 246.86 (800) 2.68 (12.01) Unknown-2 10 (0) 2 (0) 128.76 (0) 2.3 (0)
….Cont’d….
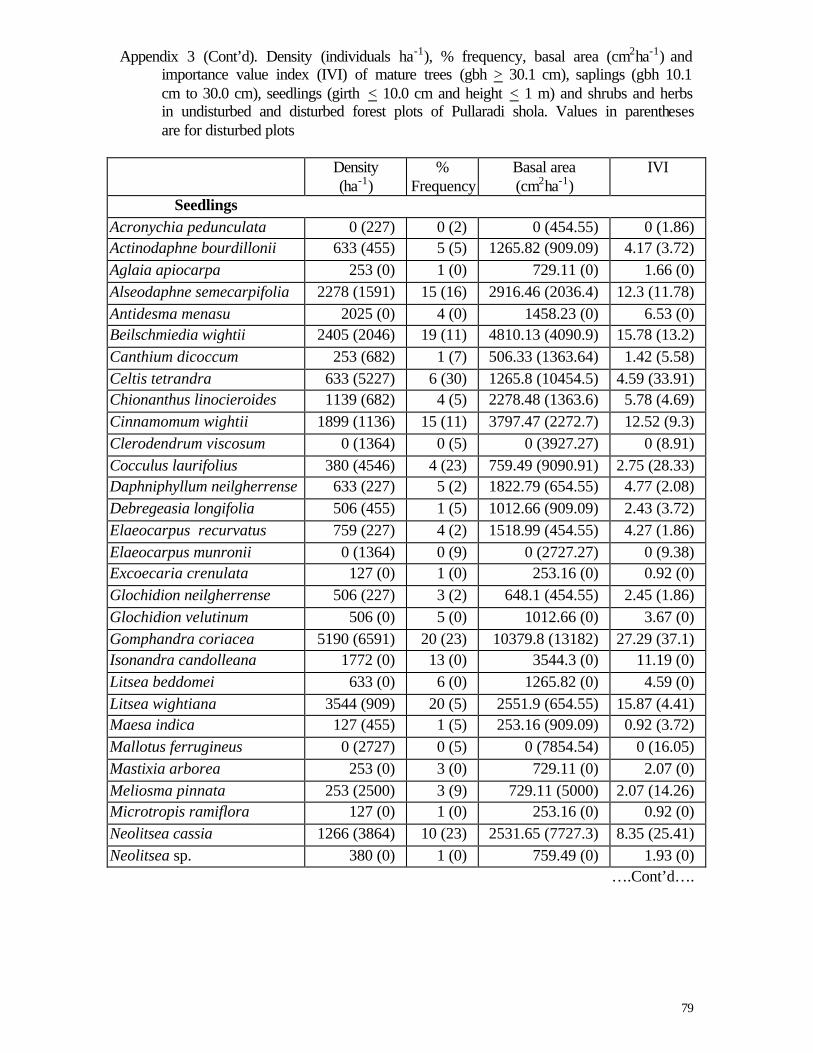
79
Appendix 3 (Cont’d). Density (individuals ha-1), % frequency, basal area (cm2ha-1) and importance value index (IVI) of mature trees (gbh > 30.1 cm), saplings (gbh 10.1 cm to 30.0 cm), seedlings (girth < 10.0 cm and height < 1 m) and shrubs and herbs in undisturbed and disturbed forest plots of Pullaradi shola. Values in parentheses are for disturbed plots
Density
(ha-1) %
Frequency Basal area (cm2ha-1)
IVI
Seedlings Acronychia pedunculata 0 (227) 0 (2) 0 (454.55) 0 (1.86) Actinodaphne bourdillonii 633 (455) 5 (5) 1265.82 (909.09) 4.17 (3.72) Aglaia apiocarpa 253 (0) 1 (0) 729.11 (0) 1.66 (0) Alseodaphne semecarpifolia 2278 (1591) 15 (16) 2916.46 (2036.4) 12.3 (11.78) Antidesma menasu 2025 (0) 4 (0) 1458.23 (0) 6.53 (0) Beilschmiedia wightii 2405 (2046) 19 (11) 4810.13 (4090.9) 15.78 (13.2) Canthium dicoccum 253 (682) 1 (7) 506.33 (1363.64) 1.42 (5.58) Celtis tetrandra 633 (5227) 6 (30) 1265.8 (10454.5) 4.59 (33.91) Chionanthus linocieroides 1139 (682) 4 (5) 2278.48 (1363.6) 5.78 (4.69) Cinnamomum wightii 1899 (1136) 15 (11) 3797.47 (2272.7) 12.52 (9.3) Clerodendrum viscosum 0 (1364) 0 (5) 0 (3927.27) 0 (8.91) Cocculus laurifolius 380 (4546) 4 (23) 759.49 (9090.91) 2.75 (28.33) Daphniphyllum neilgherrense 633 (227) 5 (2) 1822.79 (654.55) 4.77 (2.08) Debregeasia longifolia 506 (455) 1 (5) 1012.66 (909.09) 2.43 (3.72) Elaeocarpus recurvatus 759 (227) 4 (2) 1518.99 (454.55) 4.27 (1.86) Elaeocarpus munronii 0 (1364) 0 (9) 0 (2727.27) 0 (9.38) Excoecaria crenulata 127 (0) 1 (0) 253.16 (0) 0.92 (0) Glochidion neilgherrense 506 (227) 3 (2) 648.1 (454.55) 2.45 (1.86) Glochidion velutinum 506 (0) 5 (0) 1012.66 (0) 3.67 (0) Gomphandra coriacea 5190 (6591) 20 (23) 10379.8 (13182) 27.29 (37.1) Isonandra candolleana 1772 (0) 13 (0) 3544.3 (0) 11.19 (0) Litsea beddomei 633 (0) 6 (0) 1265.82 (0) 4.59 (0) Litsea wightiana 3544 (909) 20 (5) 2551.9 (654.55) 15.87 (4.41) Maesa indica 127 (455) 1 (5) 253.16 (909.09) 0.92 (3.72) Mallotus ferrugineus 0 (2727) 0 (5) 0 (7854.54) 0 (16.05) Mastixia arborea 253 (0) 3 (0) 729.11 (0) 2.07 (0) Meliosma pinnata 253 (2500) 3 (9) 729.11 (5000) 2.07 (14.26) Microtropis ramiflora 127 (0) 1 (0) 253.16 (0) 0.92 (0) Neolitsea cassia 1266 (3864) 10 (23) 2531.65 (7727.3) 8.35 (25.41) Neolitsea sp. 380 (0) 1 (0) 759.49 (0) 1.93 (0)
….Cont’d….
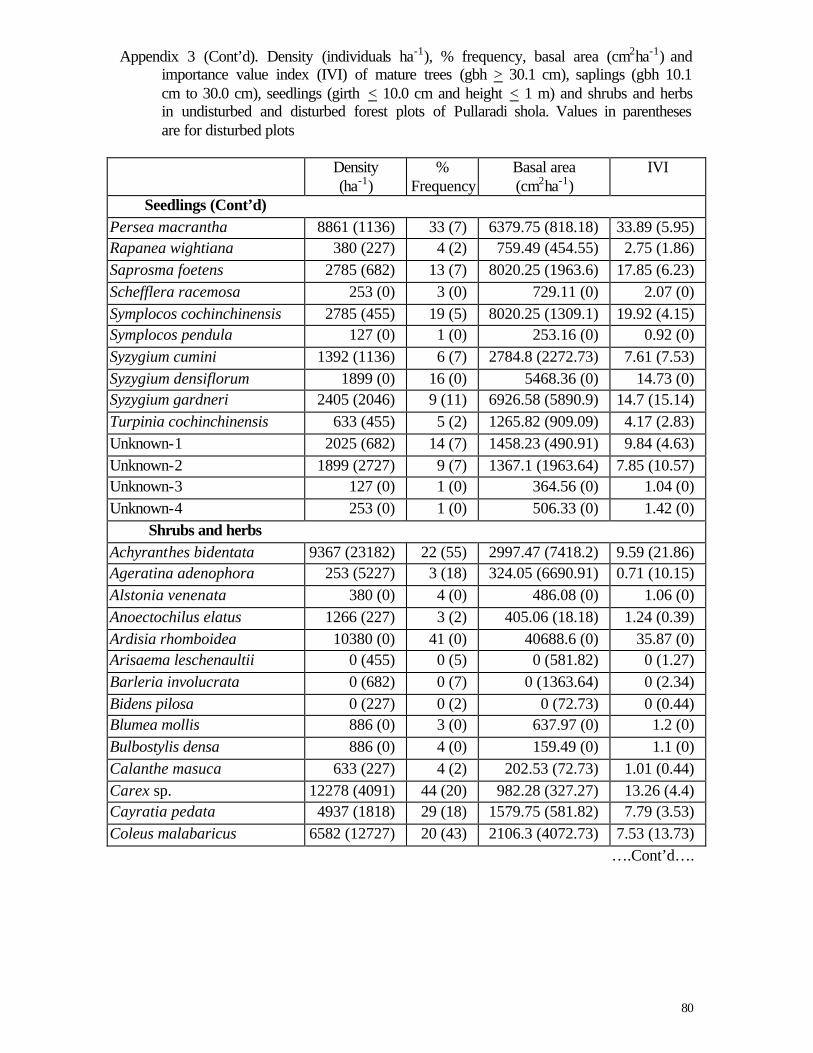
80
Appendix 3 (Cont’d). Density (individuals ha-1), % frequency, basal area (cm2ha-1) and importance value index (IVI) of mature trees (gbh > 30.1 cm), saplings (gbh 10.1 cm to 30.0 cm), seedlings (girth < 10.0 cm and height < 1 m) and shrubs and herbs in undisturbed and disturbed forest plots of Pullaradi shola. Values in parentheses are for disturbed plots
Density
(ha-1) %
Frequency Basal area (cm2ha-1)
IVI
Seedlings (Cont’d) Persea macrantha 8861 (1136) 33 (7) 6379.75 (818.18) 33.89 (5.95) Rapanea wightiana 380 (227) 4 (2) 759.49 (454.55) 2.75 (1.86) Saprosma foetens 2785 (682) 13 (7) 8020.25 (1963.6) 17.85 (6.23) Schefflera racemosa 253 (0) 3 (0) 729.11 (0) 2.07 (0) Symplocos cochinchinensis 2785 (455) 19 (5) 8020.25 (1309.1) 19.92 (4.15) Symplocos pendula 127 (0) 1 (0) 253.16 (0) 0.92 (0) Syzygium cumini 1392 (1136) 6 (7) 2784.8 (2272.73) 7.61 (7.53) Syzygium densiflorum 1899 (0) 16 (0) 5468.36 (0) 14.73 (0) Syzygium gardneri 2405 (2046) 9 (11) 6926.58 (5890.9) 14.7 (15.14) Turpinia cochinchinensis 633 (455) 5 (2) 1265.82 (909.09) 4.17 (2.83) Unknown-1 2025 (682) 14 (7) 1458.23 (490.91) 9.84 (4.63) Unknown-2 1899 (2727) 9 (7) 1367.1 (1963.64) 7.85 (10.57) Unknown-3 127 (0) 1 (0) 364.56 (0) 1.04 (0) Unknown-4 253 (0) 1 (0) 506.33 (0) 1.42 (0)
Shrubs and herbs Achyranthes bidentata 9367 (23182) 22 (55) 2997.47 (7418.2) 9.59 (21.86) Ageratina adenophora 253 (5227) 3 (18) 324.05 (6690.91) 0.71 (10.15) Alstonia venenata 380 (0) 4 (0) 486.08 (0) 1.06 (0) Anoectochilus elatus 1266 (227) 3 (2) 405.06 (18.18) 1.24 (0.39) Ardisia rhomboidea 10380 (0) 41 (0) 40688.6 (0) 35.87 (0) Arisaema leschenaultii 0 (455) 0 (5) 0 (581.82) 0 (1.27) Barleria involucrata 0 (682) 0 (7) 0 (1363.64) 0 (2.34) Bidens pilosa 0 (227) 0 (2) 0 (72.73) 0 (0.44) Blumea mollis 886 (0) 3 (0) 637.97 (0) 1.2 (0) Bulbostylis densa 886 (0) 4 (0) 159.49 (0) 1.1 (0) Calanthe masuca 633 (227) 4 (2) 202.53 (72.73) 1.01 (0.44) Carex sp. 12278 (4091) 44 (20) 982.28 (327.27) 13.26 (4.4) Cayratia pedata 4937 (1818) 29 (18) 1579.75 (581.82) 7.79 (3.53) Coleus malabaricus 6582 (12727) 20 (43) 2106.3 (4072.73) 7.53 (13.73)
….Cont’d….
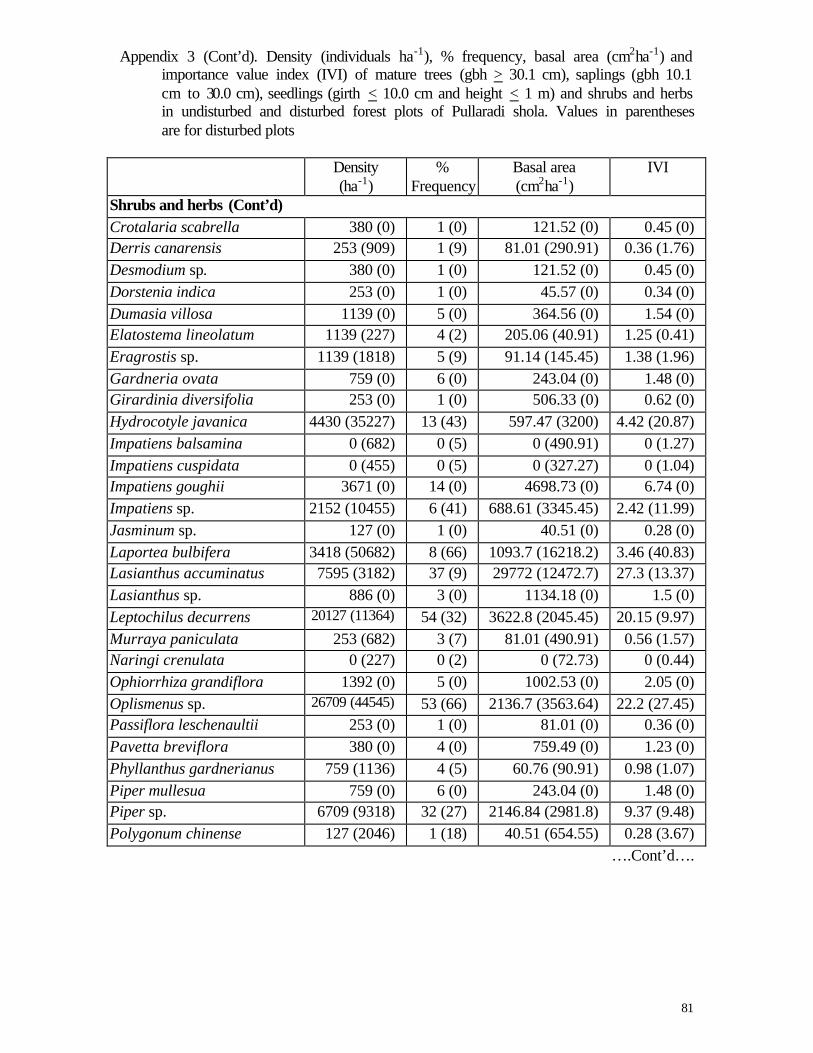
81
Appendix 3 (Cont’d). Density (individuals ha-1), % frequency, basal area (cm2ha-1) and importance value index (IVI) of mature trees (gbh > 30.1 cm), saplings (gbh 10.1 cm to 30.0 cm), seedlings (girth < 10.0 cm and height < 1 m) and shrubs and herbs in undisturbed and disturbed forest plots of Pullaradi shola. Values in parentheses are for disturbed plots
Density
(ha-1) %
Frequency Basal area (cm2ha-1)
IVI
Shrubs and herbs (Cont’d) Crotalaria scabrella 380 (0) 1 (0) 121.52 (0) 0.45 (0) Derris canarensis 253 (909) 1 (9) 81.01 (290.91) 0.36 (1.76) Desmodium sp. 380 (0) 1 (0) 121.52 (0) 0.45 (0) Dorstenia indica 253 (0) 1 (0) 45.57 (0) 0.34 (0) Dumasia villosa 1139 (0) 5 (0) 364.56 (0) 1.54 (0) Elatostema lineolatum 1139 (227) 4 (2) 205.06 (40.91) 1.25 (0.41) Eragrostis sp. 1139 (1818) 5 (9) 91.14 (145.45) 1.38 (1.96) Gardneria ovata 759 (0) 6 (0) 243.04 (0) 1.48 (0) Girardinia diversifolia 253 (0) 1 (0) 506.33 (0) 0.62 (0) Hydrocotyle javanica 4430 (35227) 13 (43) 597.47 (3200) 4.42 (20.87) Impatiens balsamina 0 (682) 0 (5) 0 (490.91) 0 (1.27) Impatiens cuspidata 0 (455) 0 (5) 0 (327.27) 0 (1.04) Impatiens goughii 3671 (0) 14 (0) 4698.73 (0) 6.74 (0) Impatiens sp. 2152 (10455) 6 (41) 688.61 (3345.45) 2.42 (11.99) Jasminum sp. 127 (0) 1 (0) 40.51 (0) 0.28 (0) Laportea bulbifera 3418 (50682) 8 (66) 1093.7 (16218.2) 3.46 (40.83) Lasianthus accuminatus 7595 (3182) 37 (9) 29772 (12472.7) 27.3 (13.37) Lasianthus sp. 886 (0) 3 (0) 1134.18 (0) 1.5 (0) Leptochilus decurrens 20127 (11364) 54 (32) 3622.8 (2045.45) 20.15 (9.97) Murraya paniculata 253 (682) 3 (7) 81.01 (490.91) 0.56 (1.57) Naringi crenulata 0 (227) 0 (2) 0 (72.73) 0 (0.44) Ophiorrhiza grandiflora 1392 (0) 5 (0) 1002.53 (0) 2.05 (0) Oplismenus sp. 26709 (44545) 53 (66) 2136.7 (3563.64) 22.2 (27.45) Passiflora leschenaultii 253 (0) 1 (0) 81.01 (0) 0.36 (0) Pavetta breviflora 380 (0) 4 (0) 759.49 (0) 1.23 (0) Phyllanthus gardnerianus 759 (1136) 4 (5) 60.76 (90.91) 0.98 (1.07) Piper mullesua 759 (0) 6 (0) 243.04 (0) 1.48 (0) Piper sp. 6709 (9318) 32 (27) 2146.84 (2981.8) 9.37 (9.48) Polygonum chinense 127 (2046) 1 (18) 40.51 (654.55) 0.28 (3.67)
….Cont’d….
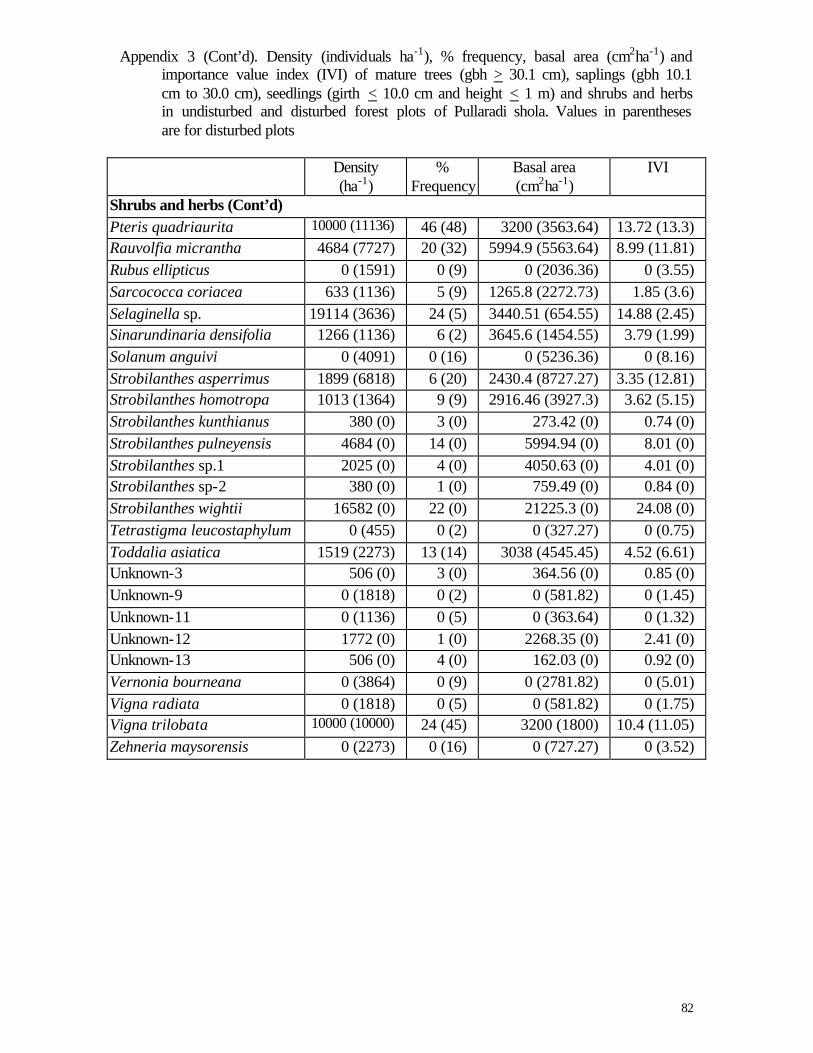
82
Appendix 3 (Cont’d). Density (individuals ha-1), % frequency, basal area (cm2ha-1) and importance value index (IVI) of mature trees (gbh > 30.1 cm), saplings (gbh 10.1 cm to 30.0 cm), seedlings (girth < 10.0 cm and height < 1 m) and shrubs and herbs in undisturbed and disturbed forest plots of Pullaradi shola. Values in parentheses are for disturbed plots
Density
(ha-1) %
Frequency Basal area (cm2ha-1)
IVI
Shrubs and herbs (Cont’d) Pteris quadriaurita 10000 (11136) 46 (48) 3200 (3563.64) 13.72 (13.3) Rauvolfia micrantha 4684 (7727) 20 (32) 5994.9 (5563.64) 8.99 (11.81) Rubus ellipticus 0 (1591) 0 (9) 0 (2036.36) 0 (3.55) Sarcococca coriacea 633 (1136) 5 (9) 1265.8 (2272.73) 1.85 (3.6) Selaginella sp. 19114 (3636) 24 (5) 3440.51 (654.55) 14.88 (2.45) Sinarundinaria densifolia 1266 (1136) 6 (2) 3645.6 (1454.55) 3.79 (1.99) Solanum anguivi 0 (4091) 0 (16) 0 (5236.36) 0 (8.16) Strobilanthes asperrimus 1899 (6818) 6 (20) 2430.4 (8727.27) 3.35 (12.81) Strobilanthes homotropa 1013 (1364) 9 (9) 2916.46 (3927.3) 3.62 (5.15) Strobilanthes kunthianus 380 (0) 3 (0) 273.42 (0) 0.74 (0) Strobilanthes pulneyensis 4684 (0) 14 (0) 5994.94 (0) 8.01 (0) Strobilanthes sp.1 2025 (0) 4 (0) 4050.63 (0) 4.01 (0) Strobilanthes sp-2 380 (0) 1 (0) 759.49 (0) 0.84 (0) Strobilanthes wightii 16582 (0) 22 (0) 21225.3 (0) 24.08 (0) Tetrastigma leucostaphylum 0 (455) 0 (2) 0 (327.27) 0 (0.75) Toddalia asiatica 1519 (2273) 13 (14) 3038 (4545.45) 4.52 (6.61) Unknown-3 506 (0) 3 (0) 364.56 (0) 0.85 (0) Unknown-9 0 (1818) 0 (2) 0 (581.82) 0 (1.45) Unknown-11 0 (1136) 0 (5) 0 (363.64) 0 (1.32) Unknown-12 1772 (0) 1 (0) 2268.35 (0) 2.41 (0) Unknown-13 506 (0) 4 (0) 162.03 (0) 0.92 (0) Vernonia bourneana 0 (3864) 0 (9) 0 (2781.82) 0 (5.01) Vigna radiata 0 (1818) 0 (5) 0 (581.82) 0 (1.75) Vigna trilobata 10000 (10000) 24 (45) 3200 (1800) 10.4 (11.05) Zehneria maysorensis 0 (2273) 0 (16) 0 (727.27) 0 (3.52)
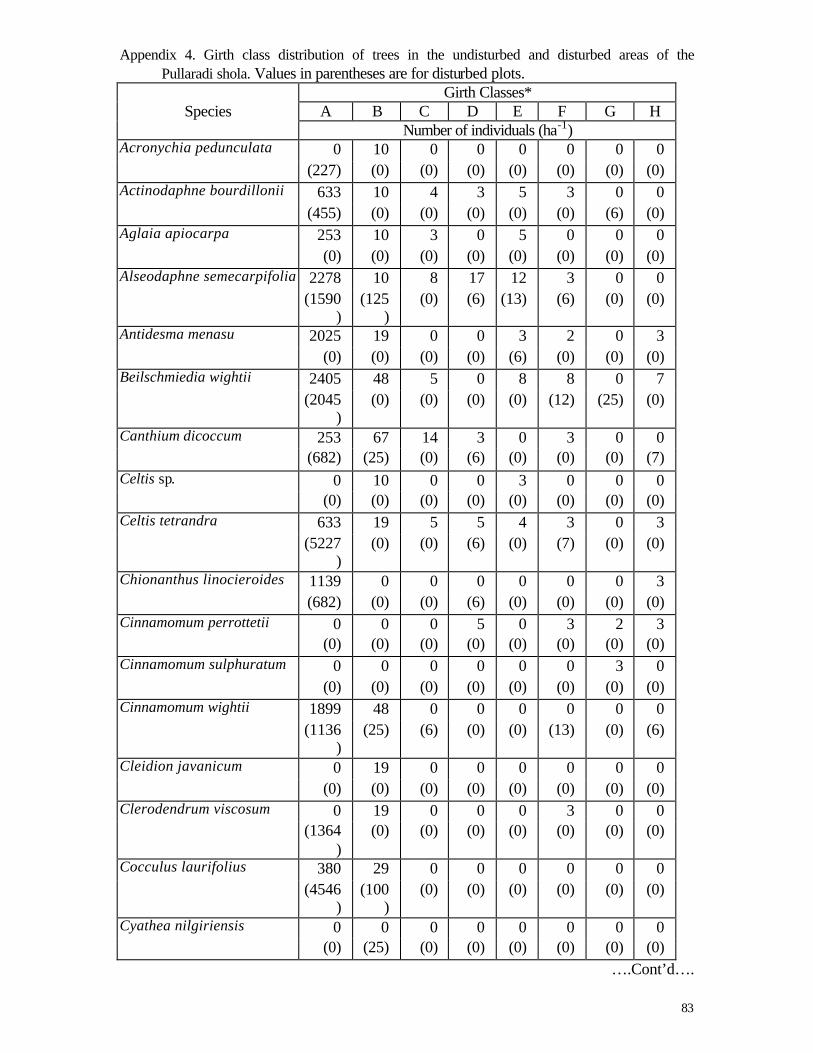
83
Appendix 4. Girth class distribution of trees in the undisturbed and disturbed areas of the Pullaradi shola. Values in parentheses are for disturbed plots.
Girth Classes* Species A B C D E F G H
Number of individuals (ha-1) Acronychia pedunculata 0 10 0 0 0 0 0 0
(227) (0) (0) (0) (0) (0) (0) (0) Actinodaphne bourdillonii 633 10 4 3 5 3 0 0
(455) (0) (0) (0) (0) (0) (6) (0) Aglaia apiocarpa 253 10 3 0 5 0 0 0
(0) (0) (0) (0) (0) (0) (0) (0) Alseodaphne semecarpifolia 2278 10 8 17 12 3 0 0
(1590)
(125)
(0) (6) (13) (6) (0) (0)
Antidesma menasu 2025 19 0 0 3 2 0 3 (0) (0) (0) (0) (6) (0) (0) (0)
Beilschmiedia wightii 2405 48 5 0 8 8 0 7 (2045
) (0) (0) (0) (0) (12) (25) (0)
Canthium dicoccum 253 67 14 3 0 3 0 0 (682) (25) (0) (6) (0) (0) (0) (7)
Celtis sp. 0 10 0 0 3 0 0 0 (0) (0) (0) (0) (0) (0) (0) (0)
Celtis tetrandra 633 19 5 5 4 3 0 3 (5227
) (0) (0) (6) (0) (7) (0) (0)
Chionanthus linocieroides 1139 0 0 0 0 0 0 3 (682) (0) (0) (6) (0) (0) (0) (0)
Cinnamomum perrottetii 0 0 0 5 0 3 2 3 (0) (0) (0) (0) (0) (0) (0) (0)
Cinnamomum sulphuratum 0 0 0 0 0 0 3 0 (0) (0) (0) (0) (0) (0) (0) (0)
Cinnamomum wightii 1899 48 0 0 0 0 0 0 (1136
) (25) (6) (0) (0) (13) (0) (6)
Cleidion javanicum 0 19 0 0 0 0 0 0 (0) (0) (0) (0) (0) (0) (0) (0)
Clerodendrum viscosum 0 19 0 0 0 3 0 0 (1364
) (0) (0) (0) (0) (0) (0) (0)
Cocculus laurifolius 380 29 0 0 0 0 0 0 (4546
) (100
) (0) (0) (0) (0) (0) (0)
Cyathea nilgiriensis 0 0 0 0 0 0 0 0 (0) (25) (0) (0) (0) (0) (0) (0)
….Cont’d….
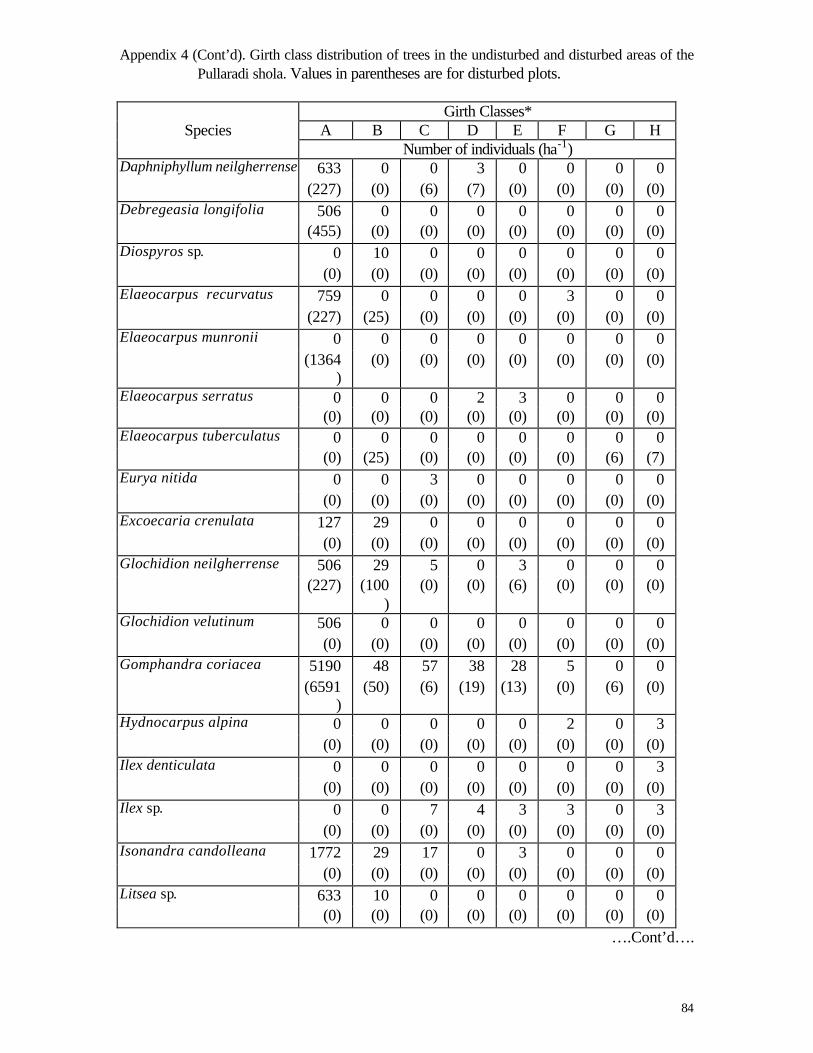
84
Appendix 4 (Cont’d). Girth class distribution of trees in the undisturbed and disturbed areas of the Pullaradi shola. Values in parentheses are for disturbed plots.
Girth Classes*
Species A B C D E F G H Number of individuals (ha-1) Daphniphyllum neilgherrense 633 0 0 3 0 0 0 0
(227) (0) (6) (7) (0) (0) (0) (0) Debregeasia longifolia 506 0 0 0 0 0 0 0
(455) (0) (0) (0) (0) (0) (0) (0) Diospyros sp. 0 10 0 0 0 0 0 0
(0) (0) (0) (0) (0) (0) (0) (0) Elaeocarpus recurvatus 759 0 0 0 0 3 0 0
(227) (25) (0) (0) (0) (0) (0) (0) Elaeocarpus munronii 0 0 0 0 0 0 0 0
(1364)
(0) (0) (0) (0) (0) (0) (0)
Elaeocarpus serratus 0 0 0 2 3 0 0 0 (0) (0) (0) (0) (0) (0) (0) (0)
Elaeocarpus tuberculatus 0 0 0 0 0 0 0 0 (0) (25) (0) (0) (0) (0) (6) (7)
Eurya nitida 0 0 3 0 0 0 0 0 (0) (0) (0) (0) (0) (0) (0) (0)
Excoecaria crenulata 127 29 0 0 0 0 0 0 (0) (0) (0) (0) (0) (0) (0) (0)
Glochidion neilgherrense 506 29 5 0 3 0 0 0 (227) (100
) (0) (0) (6) (0) (0) (0)
Glochidion velutinum 506 0 0 0 0 0 0 0 (0) (0) (0) (0) (0) (0) (0) (0)
Gomphandra coriacea 5190 48 57 38 28 5 0 0 (6591
) (50) (6) (19) (13) (0) (6) (0)
Hydnocarpus alpina 0 0 0 0 0 2 0 3 (0) (0) (0) (0) (0) (0) (0) (0)
Ilex denticulata 0 0 0 0 0 0 0 3 (0) (0) (0) (0) (0) (0) (0) (0)
Ilex sp. 0 0 7 4 3 3 0 3 (0) (0) (0) (0) (0) (0) (0) (0)
Isonandra candolleana 1772 29 17 0 3 0 0 0 (0) (0) (0) (0) (0) (0) (0) (0)
Litsea sp. 633 10 0 0 0 0 0 0 (0) (0) (0) (0) (0) (0) (0) (0)
….Cont’d….
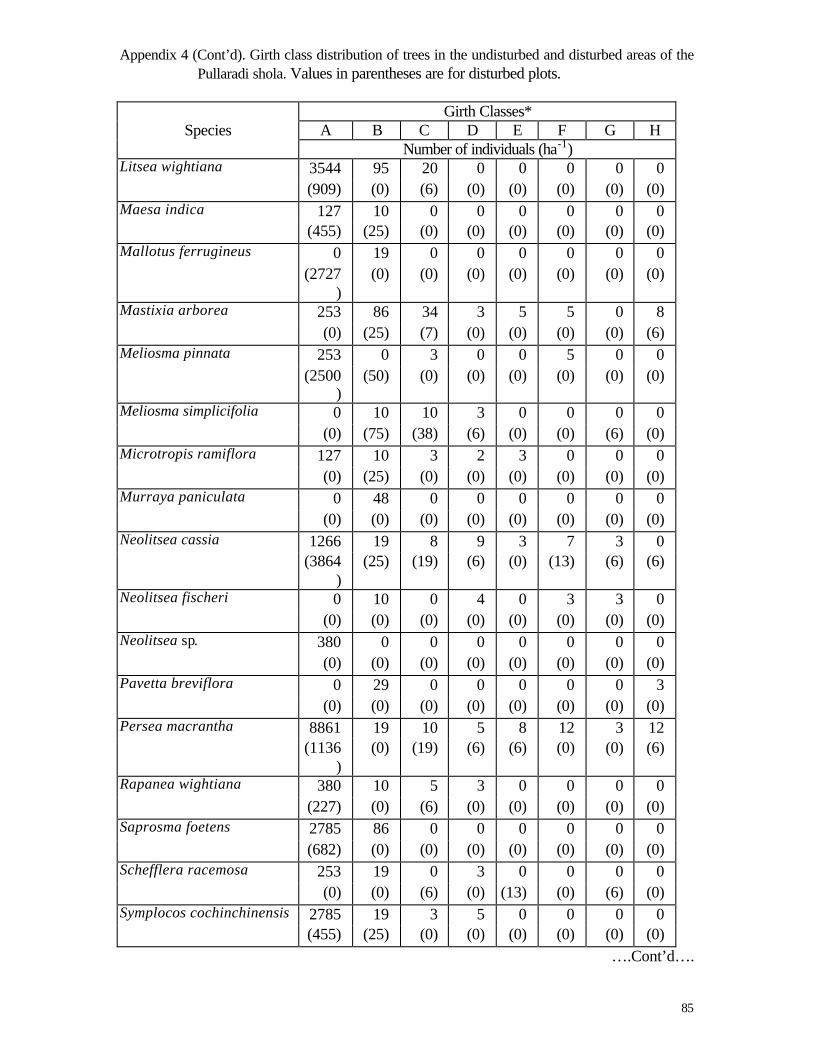
85
Appendix 4 (Cont’d). Girth class distribution of trees in the undisturbed and disturbed areas of the Pullaradi shola. Values in parentheses are for disturbed plots.
Girth Classes*
Species A B C D E F G H Number of individuals (ha-1) Litsea wightiana 3544 95 20 0 0 0 0 0
(909) (0) (6) (0) (0) (0) (0) (0) Maesa indica 127 10 0 0 0 0 0 0
(455) (25) (0) (0) (0) (0) (0) (0) Mallotus ferrugineus 0 19 0 0 0 0 0 0
(2727)
(0) (0) (0) (0) (0) (0) (0)
Mastixia arborea 253 86 34 3 5 5 0 8 (0) (25) (7) (0) (0) (0) (0) (6)
Meliosma pinnata 253 0 3 0 0 5 0 0 (2500
) (50) (0) (0) (0) (0) (0) (0)
Meliosma simplicifolia 0 10 10 3 0 0 0 0 (0) (75) (38) (6) (0) (0) (6) (0)
Microtropis ramiflora 127 10 3 2 3 0 0 0 (0) (25) (0) (0) (0) (0) (0) (0)
Murraya paniculata 0 48 0 0 0 0 0 0 (0) (0) (0) (0) (0) (0) (0) (0)
Neolitsea cassia 1266 19 8 9 3 7 3 0 (3864
) (25) (19) (6) (0) (13) (6) (6)
Neolitsea fischeri 0 10 0 4 0 3 3 0 (0) (0) (0) (0) (0) (0) (0) (0)
Neolitsea sp. 380 0 0 0 0 0 0 0 (0) (0) (0) (0) (0) (0) (0) (0)
Pavetta breviflora 0 29 0 0 0 0 0 3 (0) (0) (0) (0) (0) (0) (0) (0)
Persea macrantha 8861 19 10 5 8 12 3 12 (1136
) (0) (19) (6) (6) (0) (0) (6)
Rapanea wightiana 380 10 5 3 0 0 0 0 (227) (0) (6) (0) (0) (0) (0) (0)
Saprosma foetens 2785 86 0 0 0 0 0 0 (682) (0) (0) (0) (0) (0) (0) (0)
Schefflera racemosa 253 19 0 3 0 0 0 0 (0) (0) (6) (0) (13) (0) (6) (0)
Symplocos cochinchinensis 2785 19 3 5 0 0 0 0 (455) (25) (0) (0) (0) (0) (0) (0)
….Cont’d….
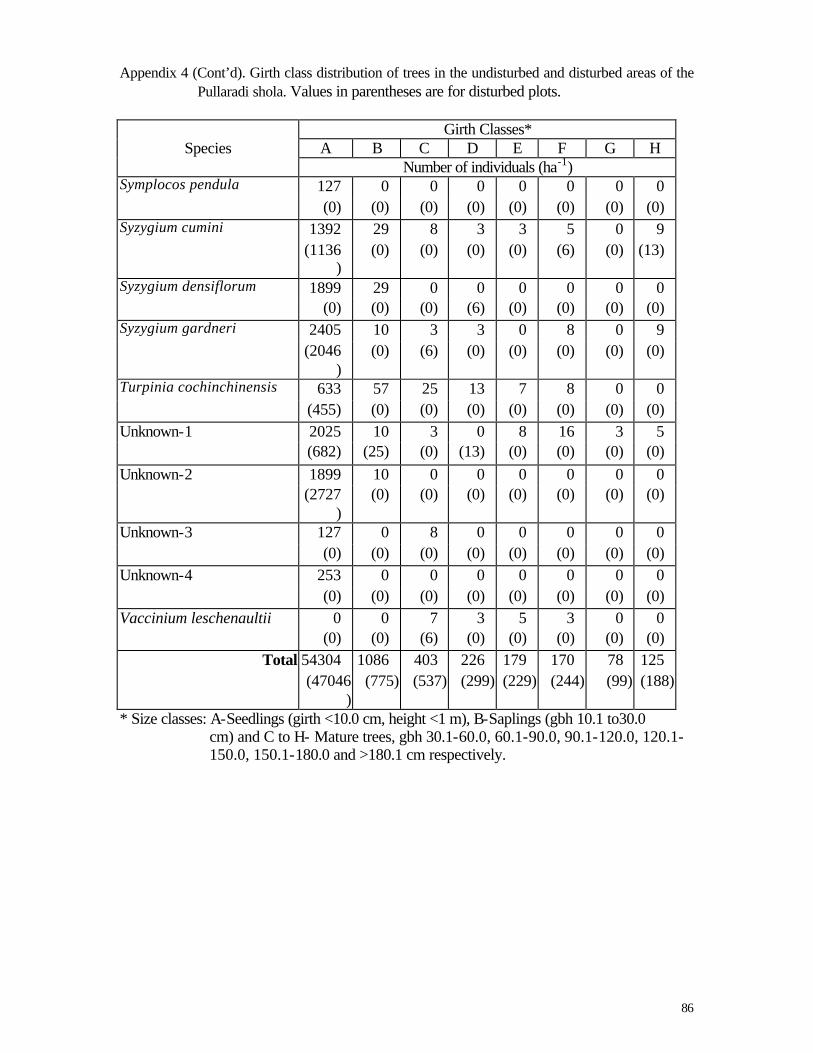
86
Appendix 4 (Cont’d). Girth class distribution of trees in the undisturbed and disturbed areas of the
Pullaradi shola. Values in parentheses are for disturbed plots.
Girth Classes* Species A B C D E F G H
Number of individuals (ha-1) Symplocos pendula 127 0 0 0 0 0 0 0
(0) (0) (0) (0) (0) (0) (0) (0) Syzygium cumini 1392 29 8 3 3 5 0 9
(1136)
(0) (0) (0) (0) (6) (0) (13)
Syzygium densiflorum 1899 29 0 0 0 0 0 0 (0) (0) (0) (6) (0) (0) (0) (0)
Syzygium gardneri 2405 10 3 3 0 8 0 9 (2046
) (0) (6) (0) (0) (0) (0) (0)
Turpinia cochinchinensis 633 57 25 13 7 8 0 0 (455) (0) (0) (0) (0) (0) (0) (0)
Unknown-1 2025 10 3 0 8 16 3 5 (682) (25) (0) (13) (0) (0) (0) (0)
Unknown-2 1899 10 0 0 0 0 0 0 (2727
) (0) (0) (0) (0) (0) (0) (0)
Unknown-3 127 0 8 0 0 0 0 0 (0) (0) (0) (0) (0) (0) (0) (0)
Unknown-4 253 0 0 0 0 0 0 0 (0) (0) (0) (0) (0) (0) (0) (0)
Vaccinium leschenaultii 0 0 7 3 5 3 0 0 (0) (0) (6) (0) (0) (0) (0) (0)
Total 54304 1086 403 226 179 170 78 125 (47046
) (775) (537) (299) (229) (244) (99) (188)
* Size classes: A-Seedlings (girth <10.0 cm, height <1 m), B-Saplings (gbh 10.1 to30.0 cm) and C to H- Mature trees, gbh 30.1-60.0, 60.1-90.0, 90.1-120.0, 120.1-150.0, 150.1-180.0 and >180.1 cm respectively.
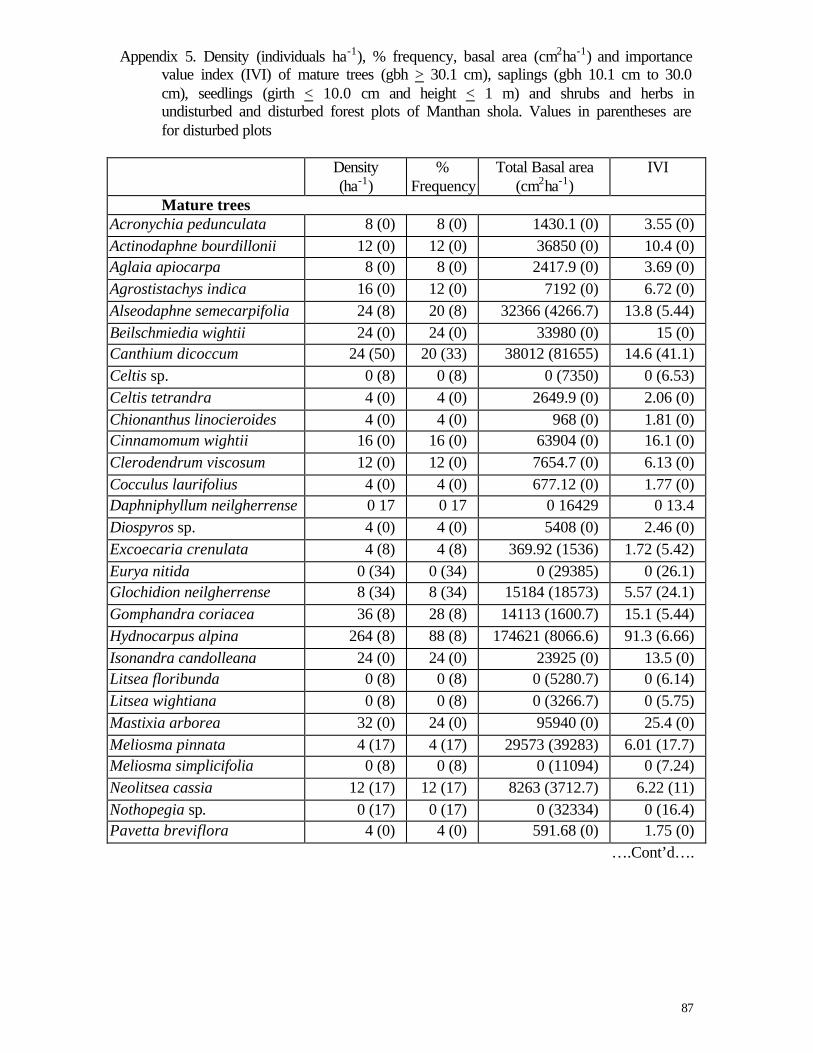
87
Appendix 5. Density (individuals ha-1), % frequency, basal area (cm2ha-1) and importance value index (IVI) of mature trees (gbh > 30.1 cm), saplings (gbh 10.1 cm to 30.0 cm), seedlings (girth < 10.0 cm and height < 1 m) and shrubs and herbs in undisturbed and disturbed forest plots of Manthan shola. Values in parentheses are for disturbed plots
Density
(ha-1) %
Frequency Total Basal area
(cm2ha-1) IVI
Mature trees Acronychia pedunculata 8 (0) 8 (0) 1430.1 (0) 3.55 (0) Actinodaphne bourdillonii 12 (0) 12 (0) 36850 (0) 10.4 (0) Aglaia apiocarpa 8 (0) 8 (0) 2417.9 (0) 3.69 (0) Agrostistachys indica 16 (0) 12 (0) 7192 (0) 6.72 (0) Alseodaphne semecarpifolia 24 (8) 20 (8) 32366 (4266.7) 13.8 (5.44) Beilschmiedia wightii 24 (0) 24 (0) 33980 (0) 15 (0) Canthium dicoccum 24 (50) 20 (33) 38012 (81655) 14.6 (41.1) Celtis sp. 0 (8) 0 (8) 0 (7350) 0 (6.53) Celtis tetrandra 4 (0) 4 (0) 2649.9 (0) 2.06 (0) Chionanthus linocieroides 4 (0) 4 (0) 968 (0) 1.81 (0) Cinnamomum wightii 16 (0) 16 (0) 63904 (0) 16.1 (0) Clerodendrum viscosum 12 (0) 12 (0) 7654.7 (0) 6.13 (0) Cocculus laurifolius 4 (0) 4 (0) 677.12 (0) 1.77 (0) Daphniphyllum neilgherrense 0 17 0 17 0 16429 0 13.4 Diospyros sp. 4 (0) 4 (0) 5408 (0) 2.46 (0) Excoecaria crenulata 4 (8) 4 (8) 369.92 (1536) 1.72 (5.42) Eurya nitida 0 (34) 0 (34) 0 (29385) 0 (26.1) Glochidion neilgherrense 8 (34) 8 (34) 15184 (18573) 5.57 (24.1) Gomphandra coriacea 36 (8) 28 (8) 14113 (1600.7) 15.1 (5.44) Hydnocarpus alpina 264 (8) 88 (8) 174621 (8066.6) 91.3 (6.66) Isonandra candolleana 24 (0) 24 (0) 23925 (0) 13.5 (0) Litsea floribunda 0 (8) 0 (8) 0 (5280.7) 0 (6.14) Litsea wightiana 0 (8) 0 (8) 0 (3266.7) 0 (5.75) Mastixia arborea 32 (0) 24 (0) 95940 (0) 25.4 (0) Meliosma pinnata 4 (17) 4 (17) 29573 (39283) 6.01 (17.7) Meliosma simplicifolia 0 (8) 0 (8) 0 (11094) 0 (7.24) Neolitsea cassia 12 (17) 12 (17) 8263 (3712.7) 6.22 (11) Nothopegia sp. 0 (17) 0 (17) 0 (32334) 0 (16.4) Pavetta breviflora 4 (0) 4 (0) 591.68 (0) 1.75 (0)
….Cont’d….
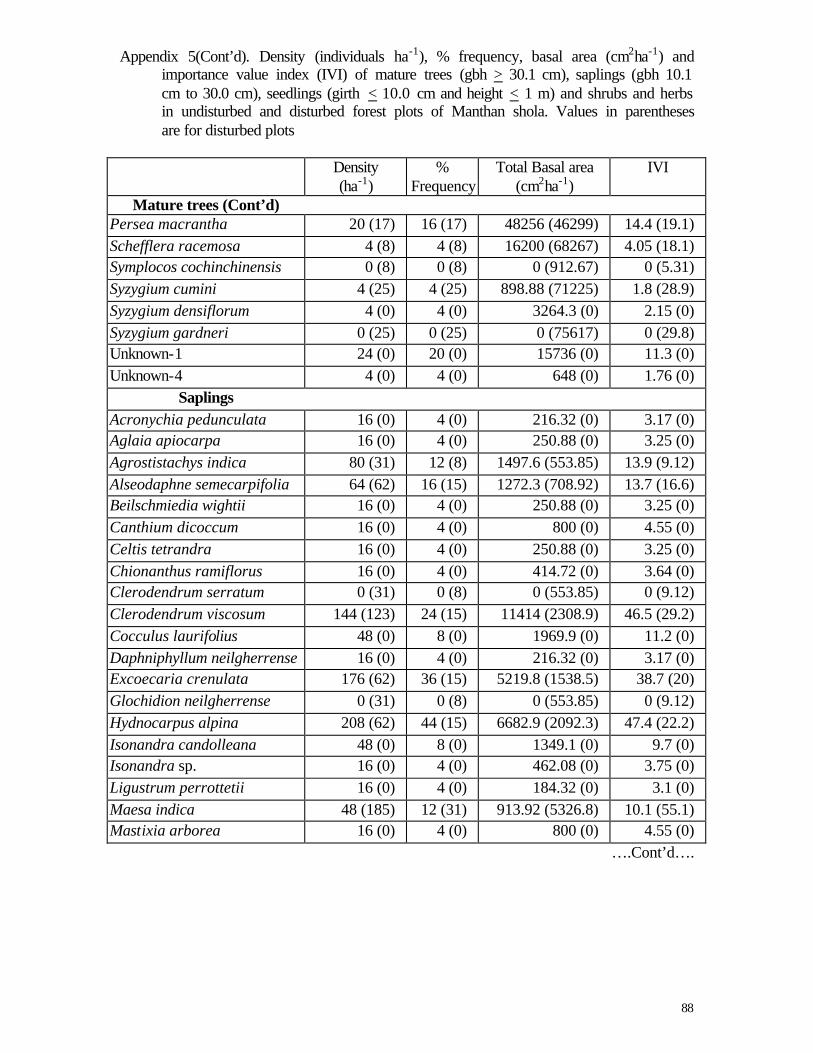
88
Appendix 5(Cont’d). Density (individuals ha-1), % frequency, basal area (cm2ha-1) and importance value index (IVI) of mature trees (gbh > 30.1 cm), saplings (gbh 10.1 cm to 30.0 cm), seedlings (girth < 10.0 cm and height < 1 m) and shrubs and herbs in undisturbed and disturbed forest plots of Manthan shola. Values in parentheses are for disturbed plots
Density
(ha-1) %
Frequency Total Basal area
(cm2ha-1) IVI
Mature trees (Cont’d) Persea macrantha 20 (17) 16 (17) 48256 (46299) 14.4 (19.1) Schefflera racemosa 4 (8) 4 (8) 16200 (68267) 4.05 (18.1) Symplocos cochinchinensis 0 (8) 0 (8) 0 (912.67) 0 (5.31) Syzygium cumini 4 (25) 4 (25) 898.88 (71225) 1.8 (28.9) Syzygium densiflorum 4 (0) 4 (0) 3264.3 (0) 2.15 (0) Syzygium gardneri 0 (25) 0 (25) 0 (75617) 0 (29.8) Unknown-1 24 (0) 20 (0) 15736 (0) 11.3 (0) Unknown-4 4 (0) 4 (0) 648 (0) 1.76 (0)
Saplings Acronychia pedunculata 16 (0) 4 (0) 216.32 (0) 3.17 (0) Aglaia apiocarpa 16 (0) 4 (0) 250.88 (0) 3.25 (0) Agrostistachys indica 80 (31) 12 (8) 1497.6 (553.85) 13.9 (9.12) Alseodaphne semecarpifolia 64 (62) 16 (15) 1272.3 (708.92) 13.7 (16.6) Beilschmiedia wightii 16 (0) 4 (0) 250.88 (0) 3.25 (0) Canthium dicoccum 16 (0) 4 (0) 800 (0) 4.55 (0) Celtis tetrandra 16 (0) 4 (0) 250.88 (0) 3.25 (0) Chionanthus ramiflorus 16 (0) 4 (0) 414.72 (0) 3.64 (0) Clerodendrum serratum 0 (31) 0 (8) 0 (553.85) 0 (9.12) Clerodendrum viscosum 144 (123) 24 (15) 11414 (2308.9) 46.5 (29.2) Cocculus laurifolius 48 (0) 8 (0) 1969.9 (0) 11.2 (0) Daphniphyllum neilgherrense 16 (0) 4 (0) 216.32 (0) 3.17 (0) Excoecaria crenulata 176 (62) 36 (15) 5219.8 (1538.5) 38.7 (20) Glochidion neilgherrense 0 (31) 0 (8) 0 (553.85) 0 (9.12) Hydnocarpus alpina 208 (62) 44 (15) 6682.9 (2092.3) 47.4 (22.2) Isonandra candolleana 48 (0) 8 (0) 1349.1 (0) 9.7 (0) Isonandra sp. 16 (0) 4 (0) 462.08 (0) 3.75 (0) Ligustrum perrottetii 16 (0) 4 (0) 184.32 (0) 3.1 (0) Maesa indica 48 (185) 12 (31) 913.92 (5326.8) 10.1 (55.1) Mastixia arborea 16 (0) 4 (0) 800 (0) 4.55 (0)
….Cont’d….
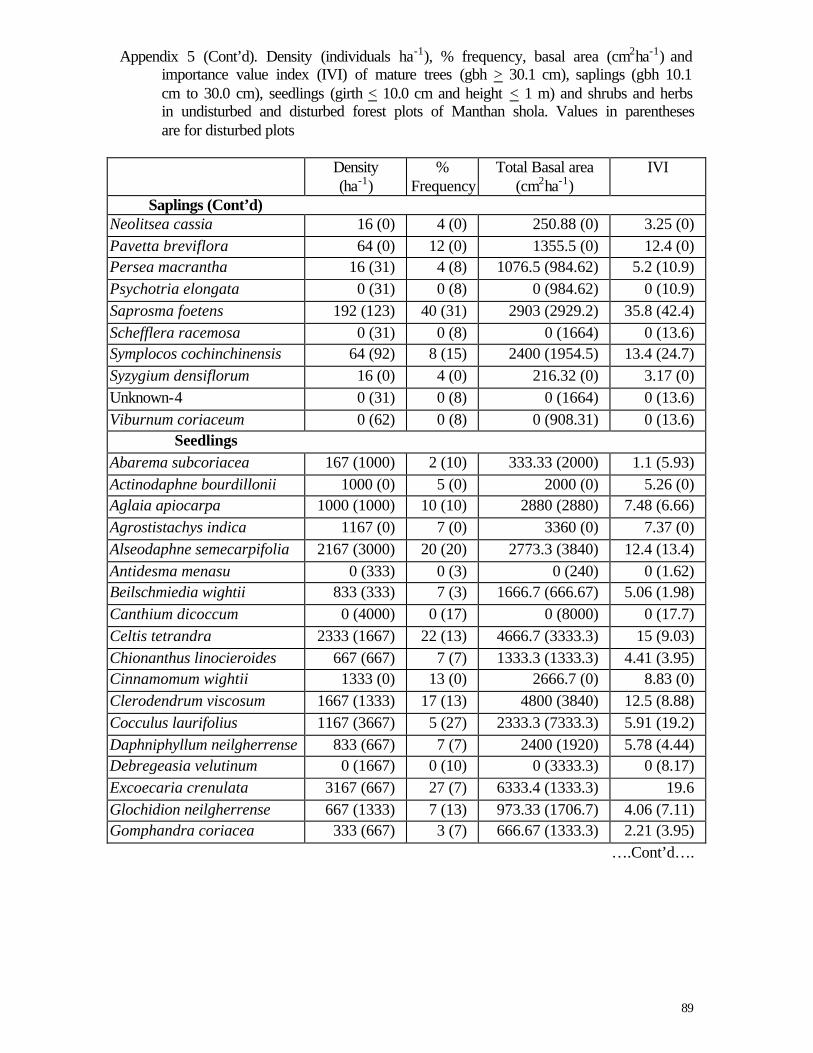
89
Appendix 5 (Cont’d). Density (individuals ha-1), % frequency, basal area (cm2ha-1) and importance value index (IVI) of mature trees (gbh > 30.1 cm), saplings (gbh 10.1 cm to 30.0 cm), seedlings (girth < 10.0 cm and height < 1 m) and shrubs and herbs in undisturbed and disturbed forest plots of Manthan shola. Values in parentheses are for disturbed plots
Density
(ha-1) %
Frequency Total Basal area
(cm2ha-1) IVI
Saplings (Cont’d) Neolitsea cassia 16 (0) 4 (0) 250.88 (0) 3.25 (0) Pavetta breviflora 64 (0) 12 (0) 1355.5 (0) 12.4 (0) Persea macrantha 16 (31) 4 (8) 1076.5 (984.62) 5.2 (10.9) Psychotria elongata 0 (31) 0 (8) 0 (984.62) 0 (10.9) Saprosma foetens 192 (123) 40 (31) 2903 (2929.2) 35.8 (42.4) Schefflera racemosa 0 (31) 0 (8) 0 (1664) 0 (13.6) Symplocos cochinchinensis 64 (92) 8 (15) 2400 (1954.5) 13.4 (24.7) Syzygium densiflorum 16 (0) 4 (0) 216.32 (0) 3.17 (0) Unknown-4 0 (31) 0 (8) 0 (1664) 0 (13.6) Viburnum coriaceum 0 (62) 0 (8) 0 (908.31) 0 (13.6)
Seedlings Abarema subcoriacea 167 (1000) 2 (10) 333.33 (2000) 1.1 (5.93) Actinodaphne bourdillonii 1000 (0) 5 (0) 2000 (0) 5.26 (0) Aglaia apiocarpa 1000 (1000) 10 (10) 2880 (2880) 7.48 (6.66) Agrostistachys indica 1167 (0) 7 (0) 3360 (0) 7.37 (0) Alseodaphne semecarpifolia 2167 (3000) 20 (20) 2773.3 (3840) 12.4 (13.4) Antidesma menasu 0 (333) 0 (3) 0 (240) 0 (1.62) Beilschmiedia wightii 833 (333) 7 (3) 1666.7 (666.67) 5.06 (1.98) Canthium dicoccum 0 (4000) 0 (17) 0 (8000) 0 (17.7) Celtis tetrandra 2333 (1667) 22 (13) 4666.7 (3333.3) 15 (9.03) Chionanthus linocieroides 667 (667) 7 (7) 1333.3 (1333.3) 4.41 (3.95) Cinnamomum wightii 1333 (0) 13 (0) 2666.7 (0) 8.83 (0) Clerodendrum viscosum 1667 (1333) 17 (13) 4800 (3840) 12.5 (8.88) Cocculus laurifolius 1167 (3667) 5 (27) 2333.3 (7333.3) 5.91 (19.2) Daphniphyllum neilgherrense 833 (667) 7 (7) 2400 (1920) 5.78 (4.44) Debregeasia velutinum 0 (1667) 0 (10) 0 (3333.3) 0 (8.17) Excoecaria crenulata 3167 (667) 27 (7) 6333.4 (1333.3) 19.6 Glochidion neilgherrense 667 (1333) 7 (13) 973.33 (1706.7) 4.06 (7.11) Gomphandra coriacea 333 (667) 3 (7) 666.67 (1333.3) 2.21 (3.95)
….Cont’d….
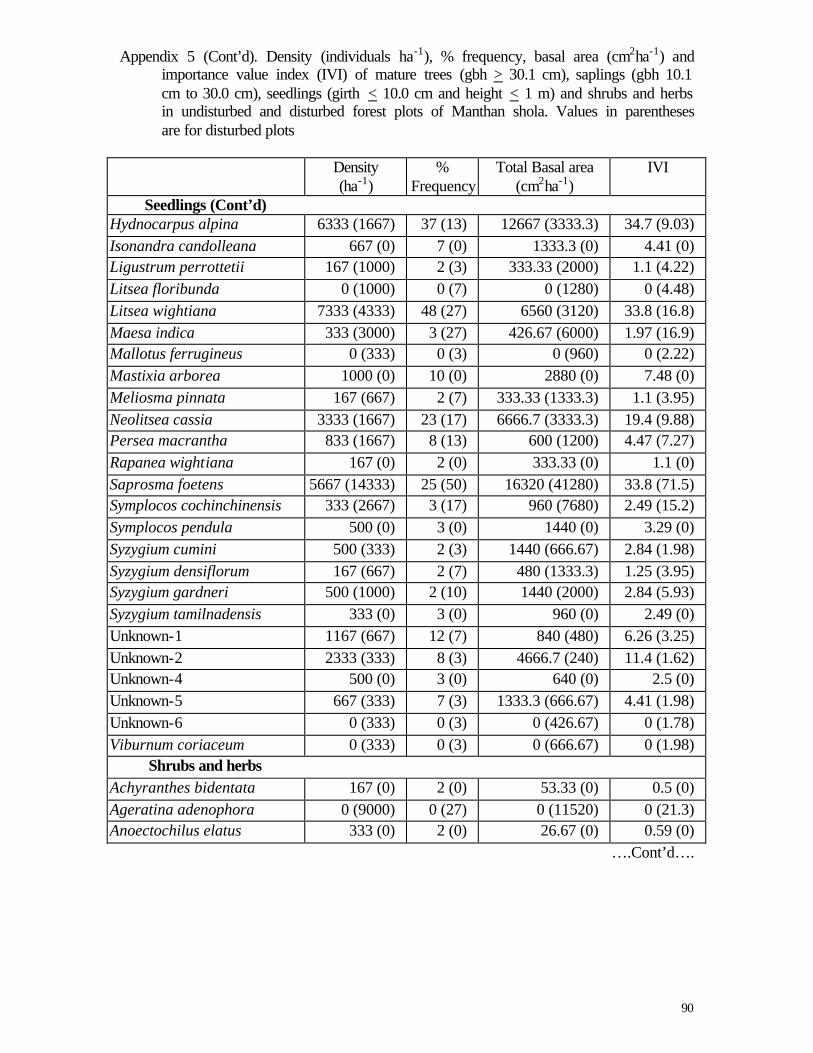
90
Appendix 5 (Cont’d). Density (individuals ha-1), % frequency, basal area (cm2ha-1) and importance value index (IVI) of mature trees (gbh > 30.1 cm), saplings (gbh 10.1 cm to 30.0 cm), seedlings (girth < 10.0 cm and height < 1 m) and shrubs and herbs in undisturbed and disturbed forest plots of Manthan shola. Values in parentheses are for disturbed plots
Density
(ha-1) %
Frequency Total Basal area
(cm2ha-1) IVI
Seedlings (Cont’d) Hydnocarpus alpina 6333 (1667) 37 (13) 12667 (3333.3) 34.7 (9.03) Isonandra candolleana 667 (0) 7 (0) 1333.3 (0) 4.41 (0) Ligustrum perrottetii 167 (1000) 2 (3) 333.33 (2000) 1.1 (4.22) Litsea floribunda 0 (1000) 0 (7) 0 (1280) 0 (4.48) Litsea wightiana 7333 (4333) 48 (27) 6560 (3120) 33.8 (16.8) Maesa indica 333 (3000) 3 (27) 426.67 (6000) 1.97 (16.9) Mallotus ferrugineus 0 (333) 0 (3) 0 (960) 0 (2.22) Mastixia arborea 1000 (0) 10 (0) 2880 (0) 7.48 (0) Meliosma pinnata 167 (667) 2 (7) 333.33 (1333.3) 1.1 (3.95) Neolitsea cassia 3333 (1667) 23 (17) 6666.7 (3333.3) 19.4 (9.88) Persea macrantha 833 (1667) 8 (13) 600 (1200) 4.47 (7.27) Rapanea wightiana 167 (0) 2 (0) 333.33 (0) 1.1 (0) Saprosma foetens 5667 (14333) 25 (50) 16320 (41280) 33.8 (71.5) Symplocos cochinchinensis 333 (2667) 3 (17) 960 (7680) 2.49 (15.2) Symplocos pendula 500 (0) 3 (0) 1440 (0) 3.29 (0) Syzygium cumini 500 (333) 2 (3) 1440 (666.67) 2.84 (1.98) Syzygium densiflorum 167 (667) 2 (7) 480 (1333.3) 1.25 (3.95) Syzygium gardneri 500 (1000) 2 (10) 1440 (2000) 2.84 (5.93) Syzygium tamilnadensis 333 (0) 3 (0) 960 (0) 2.49 (0) Unknown-1 1167 (667) 12 (7) 840 (480) 6.26 (3.25) Unknown-2 2333 (333) 8 (3) 4666.7 (240) 11.4 (1.62) Unknown-4 500 (0) 3 (0) 640 (0) 2.5 (0) Unknown-5 667 (333) 7 (3) 1333.3 (666.67) 4.41 (1.98) Unknown-6 0 (333) 0 (3) 0 (426.67) 0 (1.78) Viburnum coriaceum 0 (333) 0 (3) 0 (666.67) 0 (1.98)
Shrubs and herbs Achyranthes bidentata 167 (0) 2 (0) 53.33 (0) 0.5 (0) Ageratina adenophora 0 (9000) 0 (27) 0 (11520) 0 (21.3) Anoectochilus elatus 333 (0) 2 (0) 26.67 (0) 0.59 (0)
….Cont’d….
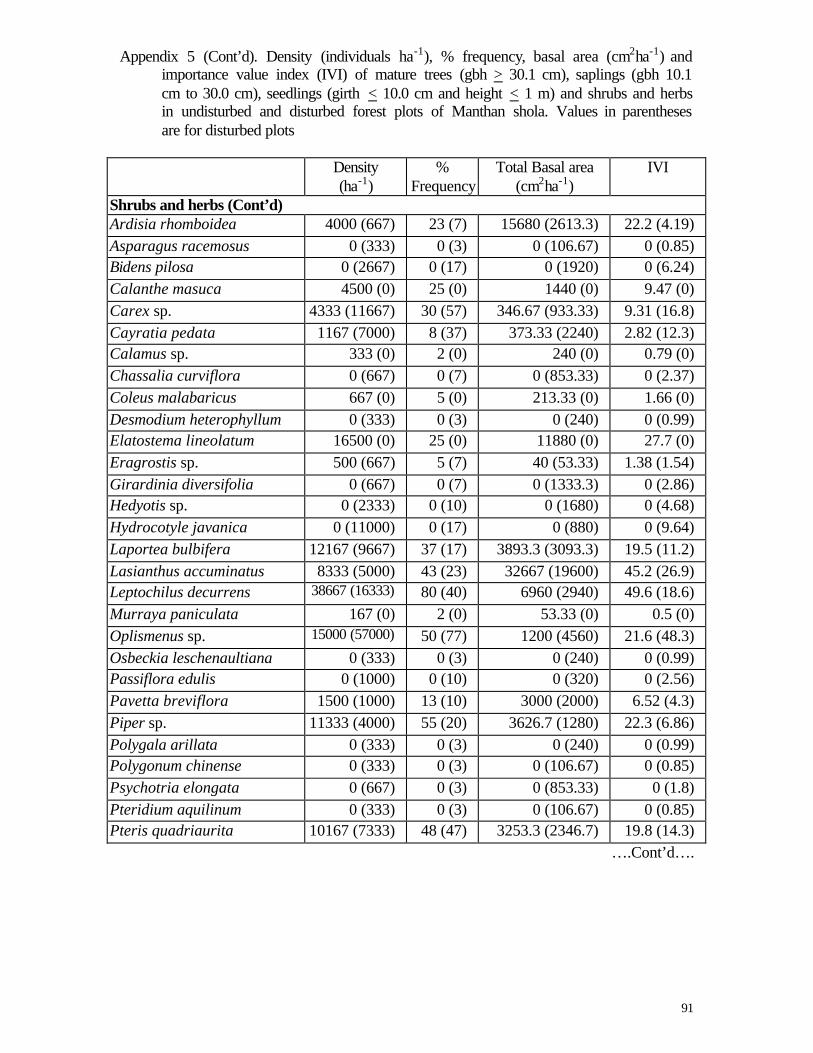
91
Appendix 5 (Cont’d). Density (individuals ha-1), % frequency, basal area (cm2ha-1) and importance value index (IVI) of mature trees (gbh > 30.1 cm), saplings (gbh 10.1 cm to 30.0 cm), seedlings (girth < 10.0 cm and height < 1 m) and shrubs and herbs in undisturbed and disturbed forest plots of Manthan shola. Values in parentheses are for disturbed plots
Density
(ha-1) %
Frequency Total Basal area
(cm2ha-1) IVI
Shrubs and herbs (Cont’d) Ardisia rhomboidea 4000 (667) 23 (7) 15680 (2613.3) 22.2 (4.19) Asparagus racemosus 0 (333) 0 (3) 0 (106.67) 0 (0.85) Bidens pilosa 0 (2667) 0 (17) 0 (1920) 0 (6.24) Calanthe masuca 4500 (0) 25 (0) 1440 (0) 9.47 (0) Carex sp. 4333 (11667) 30 (57) 346.67 (933.33) 9.31 (16.8) Cayratia pedata 1167 (7000) 8 (37) 373.33 (2240) 2.82 (12.3) Calamus sp. 333 (0) 2 (0) 240 (0) 0.79 (0) Chassalia curviflora 0 (667) 0 (7) 0 (853.33) 0 (2.37) Coleus malabaricus 667 (0) 5 (0) 213.33 (0) 1.66 (0) Desmodium heterophyllum 0 (333) 0 (3) 0 (240) 0 (0.99) Elatostema lineolatum 16500 (0) 25 (0) 11880 (0) 27.7 (0) Eragrostis sp. 500 (667) 5 (7) 40 (53.33) 1.38 (1.54) Girardinia diversifolia 0 (667) 0 (7) 0 (1333.3) 0 (2.86) Hedyotis sp. 0 (2333) 0 (10) 0 (1680) 0 (4.68) Hydrocotyle javanica 0 (11000) 0 (17) 0 (880) 0 (9.64) Laportea bulbifera 12167 (9667) 37 (17) 3893.3 (3093.3) 19.5 (11.2) Lasianthus accuminatus 8333 (5000) 43 (23) 32667 (19600) 45.2 (26.9) Leptochilus decurrens 38667 (16333) 80 (40) 6960 (2940) 49.6 (18.6) Murraya paniculata 167 (0) 2 (0) 53.33 (0) 0.5 (0) Oplismenus sp. 15000 (57000) 50 (77) 1200 (4560) 21.6 (48.3) Osbeckia leschenaultiana 0 (333) 0 (3) 0 (240) 0 (0.99) Passiflora edulis 0 (1000) 0 (10) 0 (320) 0 (2.56) Pavetta breviflora 1500 (1000) 13 (10) 3000 (2000) 6.52 (4.3) Piper sp. 11333 (4000) 55 (20) 3626.7 (1280) 22.3 (6.86) Polygala arillata 0 (333) 0 (3) 0 (240) 0 (0.99) Polygonum chinense 0 (333) 0 (3) 0 (106.67) 0 (0.85) Psychotria elongata 0 (667) 0 (3) 0 (853.33) 0 (1.8) Pteridium aquilinum 0 (333) 0 (3) 0 (106.67) 0 (0.85) Pteris quadriaurita 10167 (7333) 48 (47) 3253.3 (2346.7) 19.8 (14.3)
….Cont’d….
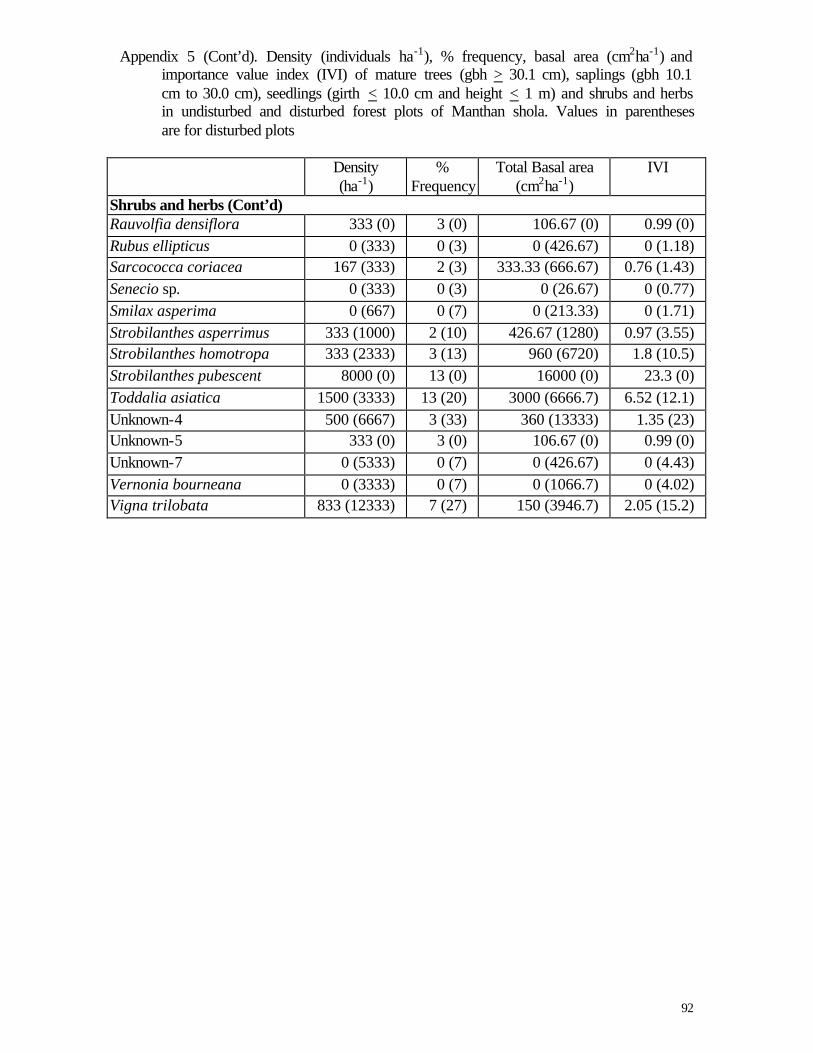
92
Appendix 5 (Cont’d). Density (individuals ha-1), % frequency, basal area (cm2ha-1) and importance value index (IVI) of mature trees (gbh > 30.1 cm), saplings (gbh 10.1 cm to 30.0 cm), seedlings (girth < 10.0 cm and height < 1 m) and shrubs and herbs in undisturbed and disturbed forest plots of Manthan shola. Values in parentheses are for disturbed plots
Density
(ha-1) %
Frequency Total Basal area
(cm2ha-1) IVI
Shrubs and herbs (Cont’d) Rauvolfia densiflora 333 (0) 3 (0) 106.67 (0) 0.99 (0) Rubus ellipticus 0 (333) 0 (3) 0 (426.67) 0 (1.18) Sarcococca coriacea 167 (333) 2 (3) 333.33 (666.67) 0.76 (1.43) Senecio sp. 0 (333) 0 (3) 0 (26.67) 0 (0.77) Smilax asperima 0 (667) 0 (7) 0 (213.33) 0 (1.71) Strobilanthes asperrimus 333 (1000) 2 (10) 426.67 (1280) 0.97 (3.55) Strobilanthes homotropa 333 (2333) 3 (13) 960 (6720) 1.8 (10.5) Strobilanthes pubescent 8000 (0) 13 (0) 16000 (0) 23.3 (0) Toddalia asiatica 1500 (3333) 13 (20) 3000 (6666.7) 6.52 (12.1) Unknown-4 500 (6667) 3 (33) 360 (13333) 1.35 (23) Unknown-5 333 (0) 3 (0) 106.67 (0) 0.99 (0) Unknown-7 0 (5333) 0 (7) 0 (426.67) 0 (4.43) Vernonia bourneana 0 (3333) 0 (7) 0 (1066.7) 0 (4.02) Vigna trilobata 833 (12333) 7 (27) 150 (3946.7) 2.05 (15.2)
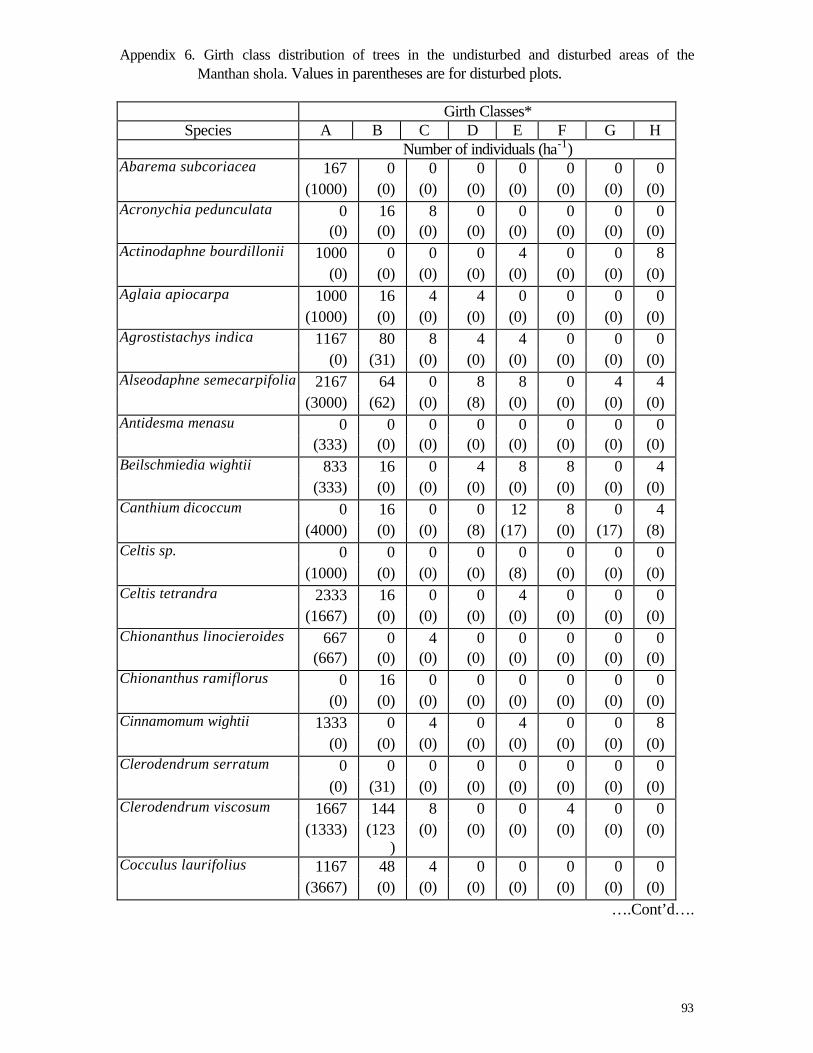
93
Appendix 6. Girth class distribution of trees in the undisturbed and disturbed areas of the Manthan shola. Values in parentheses are for disturbed plots.
Girth Classes*
Species A B C D E F G H Number of individuals (ha-1) Abarema subcoriacea 167 0 0 0 0 0 0 0
(1000) (0) (0) (0) (0) (0) (0) (0) Acronychia pedunculata 0 16 8 0 0 0 0 0 (0) (0) (0) (0) (0) (0) (0) (0) Actinodaphne bourdillonii 1000 0 0 0 4 0 0 8 (0) (0) (0) (0) (0) (0) (0) (0) Aglaia apiocarpa 1000 16 4 4 0 0 0 0 (1000) (0) (0) (0) (0) (0) (0) (0) Agrostistachys indica 1167 80 8 4 4 0 0 0 (0) (31) (0) (0) (0) (0) (0) (0) Alseodaphne semecarpifolia 2167 64 0 8 8 0 4 4 (3000) (62) (0) (8) (0) (0) (0) (0) Antidesma menasu 0 0 0 0 0 0 0 0 (333) (0) (0) (0) (0) (0) (0) (0) Beilschmiedia wightii 833 16 0 4 8 8 0 4 (333) (0) (0) (0) (0) (0) (0) (0) Canthium dicoccum 0 16 0 0 12 8 0 4 (4000) (0) (0) (8) (17) (0) (17) (8) Celtis sp. 0 0 0 0 0 0 0 0 (1000) (0) (0) (0) (8) (0) (0) (0) Celtis tetrandra 2333 16 0 0 4 0 0 0 (1667) (0) (0) (0) (0) (0) (0) (0) Chionanthus linocieroides 667 0 4 0 0 0 0 0 (667) (0) (0) (0) (0) (0) (0) (0) Chionanthus ramiflorus 0 16 0 0 0 0 0 0 (0) (0) (0) (0) (0) (0) (0) (0) Cinnamomum wightii 1333 0 4 0 4 0 0 8 (0) (0) (0) (0) (0) (0) (0) (0) Clerodendrum serratum 0 0 0 0 0 0 0 0 (0) (31) (0) (0) (0) (0) (0) (0) Clerodendrum viscosum 1667 144 8 0 0 4 0 0 (1333) (123
) (0) (0) (0) (0) (0) (0)
Cocculus laurifolius 1167 48 4 0 0 0 0 0 (3667) (0) (0) (0) (0) (0) (0) (0)
….Cont’d….
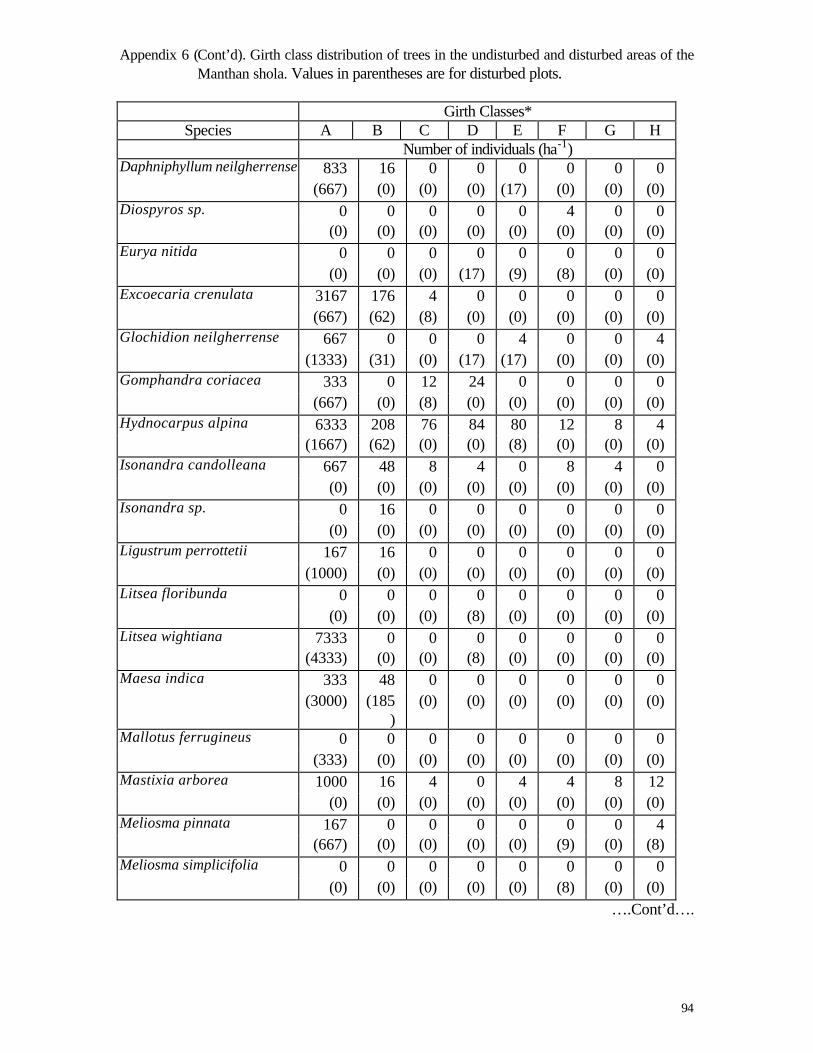
94
Appendix 6 (Cont’d). Girth class distribution of trees in the undisturbed and disturbed areas of the Manthan shola. Values in parentheses are for disturbed plots.
Girth Classes*
Species A B C D E F G H Number of individuals (ha-1) Daphniphyllum neilgherrense 833 16 0 0 0 0 0 0 (667) (0) (0) (0) (17) (0) (0) (0) Diospyros sp. 0 0 0 0 0 4 0 0 (0) (0) (0) (0) (0) (0) (0) (0) Eurya nitida 0 0 0 0 0 0 0 0 (0) (0) (0) (17) (9) (8) (0) (0) Excoecaria crenulata 3167 176 4 0 0 0 0 0 (667) (62) (8) (0) (0) (0) (0) (0) Glochidion neilgherrense 667 0 0 0 4 0 0 4 (1333) (31) (0) (17) (17) (0) (0) (0) Gomphandra coriacea 333 0 12 24 0 0 0 0 (667) (0) (8) (0) (0) (0) (0) (0) Hydnocarpus alpina 6333 208 76 84 80 12 8 4 (1667) (62) (0) (0) (8) (0) (0) (0) Isonandra candolleana 667 48 8 4 0 8 4 0 (0) (0) (0) (0) (0) (0) (0) (0) Isonandra sp. 0 16 0 0 0 0 0 0 (0) (0) (0) (0) (0) (0) (0) (0) Ligustrum perrottetii 167 16 0 0 0 0 0 0 (1000) (0) (0) (0) (0) (0) (0) (0) Litsea floribunda 0 0 0 0 0 0 0 0 (0) (0) (0) (8) (0) (0) (0) (0) Litsea wightiana 7333 0 0 0 0 0 0 0 (4333) (0) (0) (8) (0) (0) (0) (0) Maesa indica 333 48 0 0 0 0 0 0 (3000) (185
) (0) (0) (0) (0) (0) (0)
Mallotus ferrugineus 0 0 0 0 0 0 0 0 (333) (0) (0) (0) (0) (0) (0) (0) Mastixia arborea 1000 16 4 0 4 4 8 12 (0) (0) (0) (0) (0) (0) (0) (0) Meliosma pinnata 167 0 0 0 0 0 0 4 (667) (0) (0) (0) (0) (9) (0) (8) Meliosma simplicifolia 0 0 0 0 0 0 0 0 (0) (0) (0) (0) (0) (8) (0) (0)
….Cont’d….
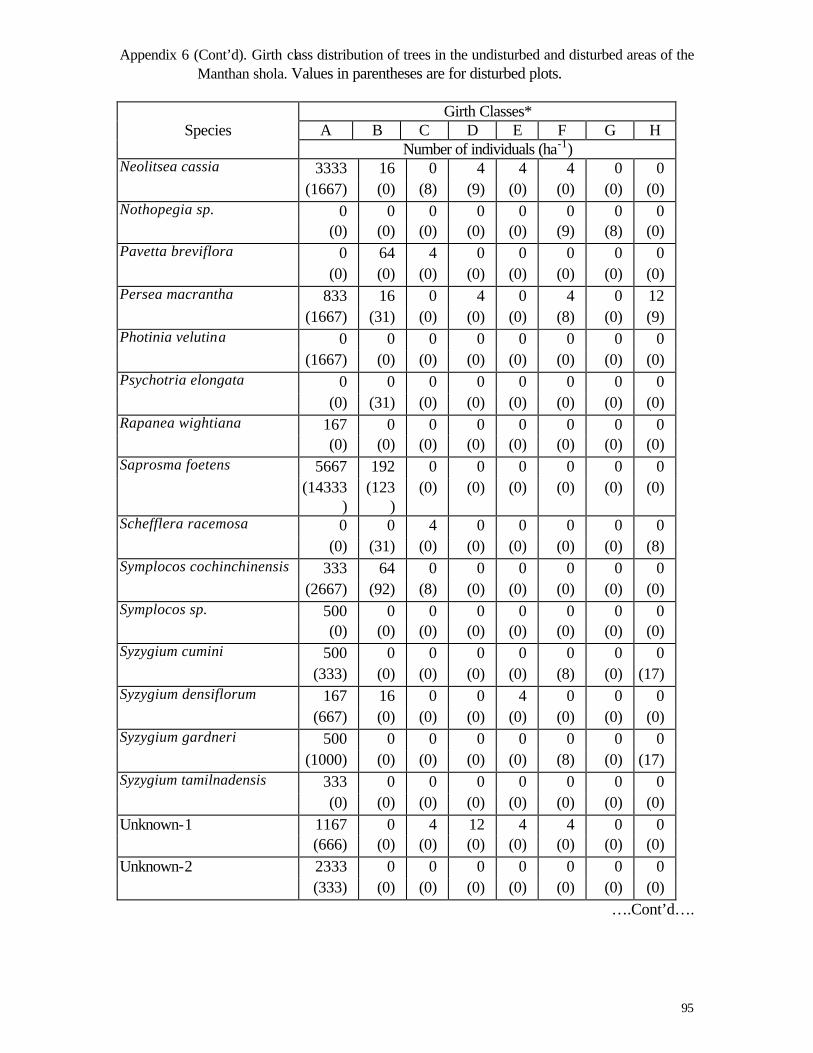
95
Appendix 6 (Cont’d). Girth class distribution of trees in the undisturbed and disturbed areas of the Manthan shola. Values in parentheses are for disturbed plots.
Girth Classes*
Species A B C D E F G H Number of individuals (ha-1) Neolitsea cassia 3333 16 0 4 4 4 0 0 (1667) (0) (8) (9) (0) (0) (0) (0) Nothopegia sp. 0 0 0 0 0 0 0 0 (0) (0) (0) (0) (0) (9) (8) (0) Pavetta breviflora 0 64 4 0 0 0 0 0 (0) (0) (0) (0) (0) (0) (0) (0) Persea macrantha 833 16 0 4 0 4 0 12 (1667) (31) (0) (0) (0) (8) (0) (9) Photinia velutina 0 0 0 0 0 0 0 0 (1667) (0) (0) (0) (0) (0) (0) (0) Psychotria elongata 0 0 0 0 0 0 0 0 (0) (31) (0) (0) (0) (0) (0) (0) Rapanea wightiana 167 0 0 0 0 0 0 0 (0) (0) (0) (0) (0) (0) (0) (0) Saprosma foetens 5667 192 0 0 0 0 0 0 (14333
) (123
) (0) (0) (0) (0) (0) (0)
Schefflera racemosa 0 0 4 0 0 0 0 0 (0) (31) (0) (0) (0) (0) (0) (8) Symplocos cochinchinensis 333 64 0 0 0 0 0 0 (2667) (92) (8) (0) (0) (0) (0) (0) Symplocos sp. 500 0 0 0 0 0 0 0 (0) (0) (0) (0) (0) (0) (0) (0) Syzygium cumini 500 0 0 0 0 0 0 0 (333) (0) (0) (0) (0) (8) (0) (17) Syzygium densiflorum 167 16 0 0 4 0 0 0 (667) (0) (0) (0) (0) (0) (0) (0) Syzygium gardneri 500 0 0 0 0 0 0 0 (1000) (0) (0) (0) (0) (8) (0) (17) Syzygium tamilnadensis 333 0 0 0 0 0 0 0
(0) (0) (0) (0) (0) (0) (0) (0) Unknown-1 1167 0 4 12 4 4 0 0 (666) (0) (0) (0) (0) (0) (0) (0) Unknown-2 2333 0 0 0 0 0 0 0 (333) (0) (0) (0) (0) (0) (0) (0)
….Cont’d….
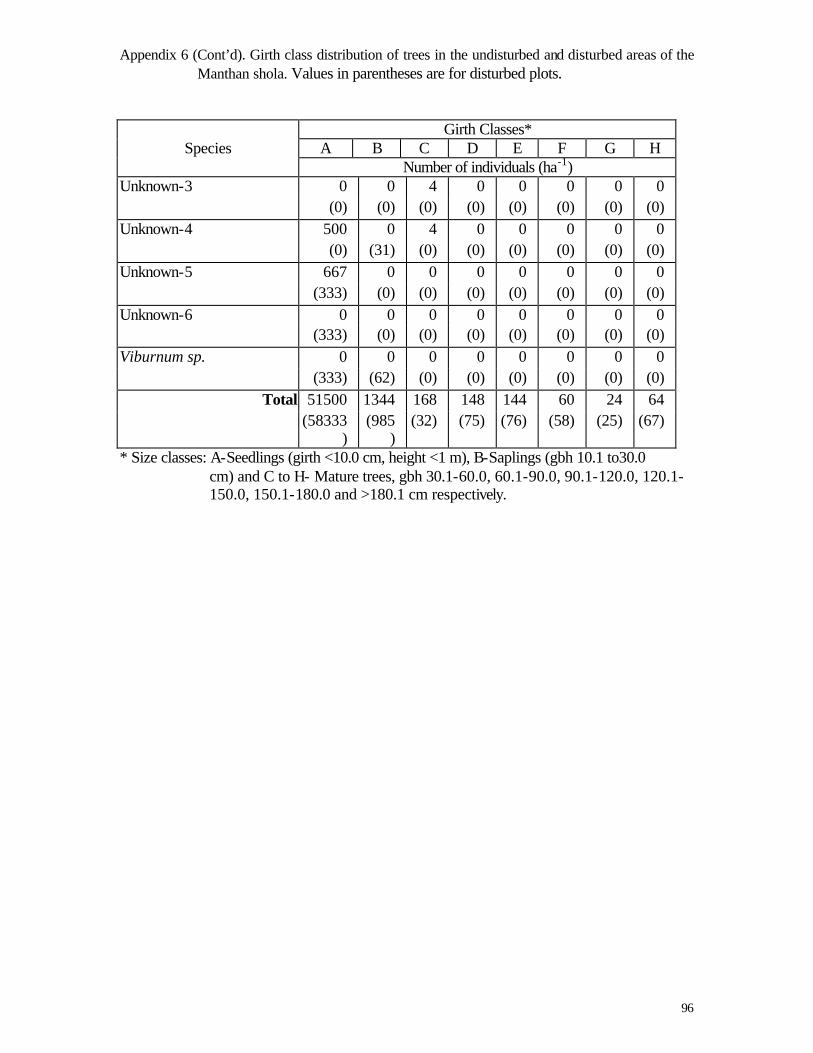
96
Appendix 6 (Cont’d). Girth class distribution of trees in the undisturbed and disturbed areas of the Manthan shola. Values in parentheses are for disturbed plots.
Girth Classes* Species A B C D E F G H
Number of individuals (ha-1) Unknown-3 0 0 4 0 0 0 0 0 (0) (0) (0) (0) (0) (0) (0) (0) Unknown-4 500 0 4 0 0 0 0 0 (0) (31) (0) (0) (0) (0) (0) (0) Unknown-5 667 0 0 0 0 0 0 0 (333) (0) (0) (0) (0) (0) (0) (0) Unknown-6 0 0 0 0 0 0 0 0 (333) (0) (0) (0) (0) (0) (0) (0) Viburnum sp. 0 0 0 0 0 0 0 0
(333) (62) (0) (0) (0) (0) (0) (0) Total 51500 1344 168 148 144 60 24 64
(58333)
(985)
(32) (75) (76) (58) (25) (67)
* Size classes: A-Seedlings (girth <10.0 cm, height <1 m), B-Saplings (gbh 10.1 to30.0 cm) and C to H- Mature trees, gbh 30.1-60.0, 60.1-90.0, 90.1-120.0, 120.1-150.0, 150.1-180.0 and >180.1 cm respectively.
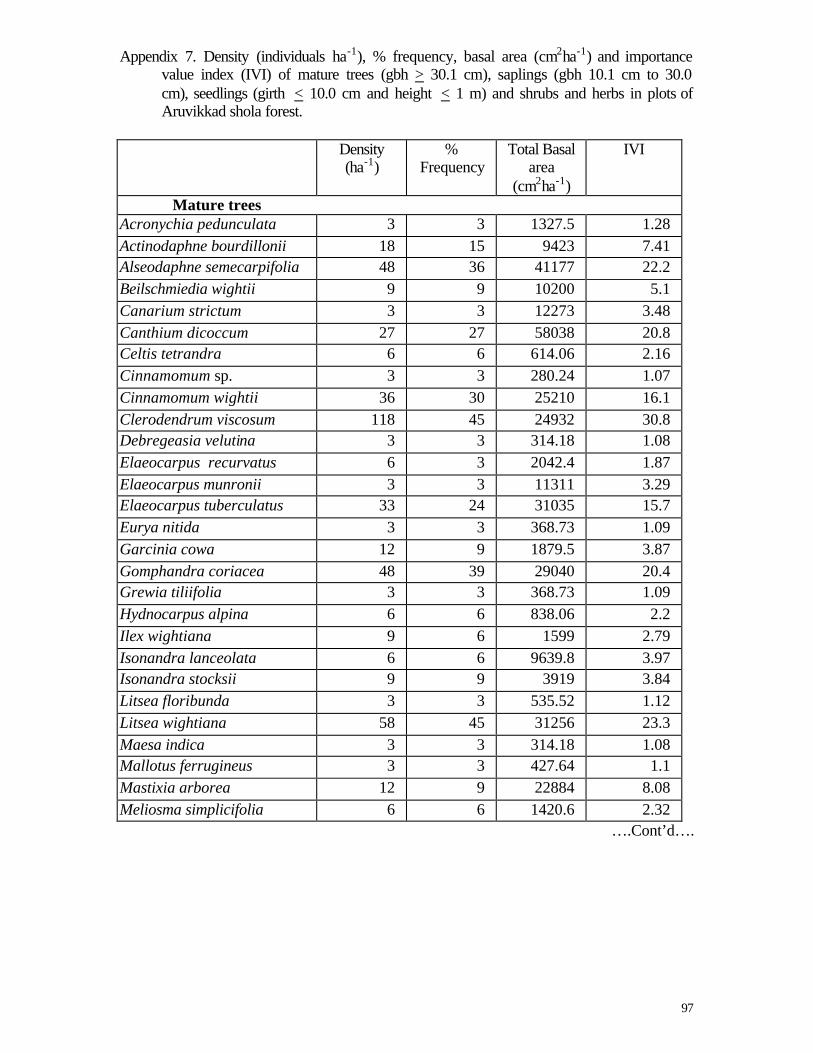
97
Appendix 7. Density (individuals ha-1), % frequency, basal area (cm2ha-1) and importance value index (IVI) of mature trees (gbh > 30.1 cm), saplings (gbh 10.1 cm to 30.0 cm), seedlings (girth < 10.0 cm and height < 1 m) and shrubs and herbs in plots of Aruvikkad shola forest.
Density
(ha-1) %
Frequency Total Basal
area (cm2ha-1)
IVI
Mature trees Acronychia pedunculata 3 3 1327.5 1.28 Actinodaphne bourdillonii 18 15 9423 7.41 Alseodaphne semecarpifolia 48 36 41177 22.2 Beilschmiedia wightii 9 9 10200 5.1 Canarium strictum 3 3 12273 3.48 Canthium dicoccum 27 27 58038 20.8 Celtis tetrandra 6 6 614.06 2.16 Cinnamomum sp. 3 3 280.24 1.07 Cinnamomum wightii 36 30 25210 16.1 Clerodendrum viscosum 118 45 24932 30.8 Debregeasia velutina 3 3 314.18 1.08 Elaeocarpus recurvatus 6 3 2042.4 1.87 Elaeocarpus munronii 3 3 11311 3.29 Elaeocarpus tuberculatus 33 24 31035 15.7 Eurya nitida 3 3 368.73 1.09 Garcinia cowa 12 9 1879.5 3.87 Gomphandra coriacea 48 39 29040 20.4 Grewia tiliifolia 3 3 368.73 1.09 Hydnocarpus alpina 6 6 838.06 2.2 Ilex wightiana 9 6 1599 2.79 Isonandra lanceolata 6 6 9639.8 3.97 Isonandra stocksii 9 9 3919 3.84 Litsea floribunda 3 3 535.52 1.12 Litsea wightiana 58 45 31256 23.3 Maesa indica 3 3 314.18 1.08 Mallotus ferrugineus 3 3 427.64 1.1 Mastixia arborea 12 9 22884 8.08 Meliosma simplicifolia 6 6 1420.6 2.32
….Cont’d….
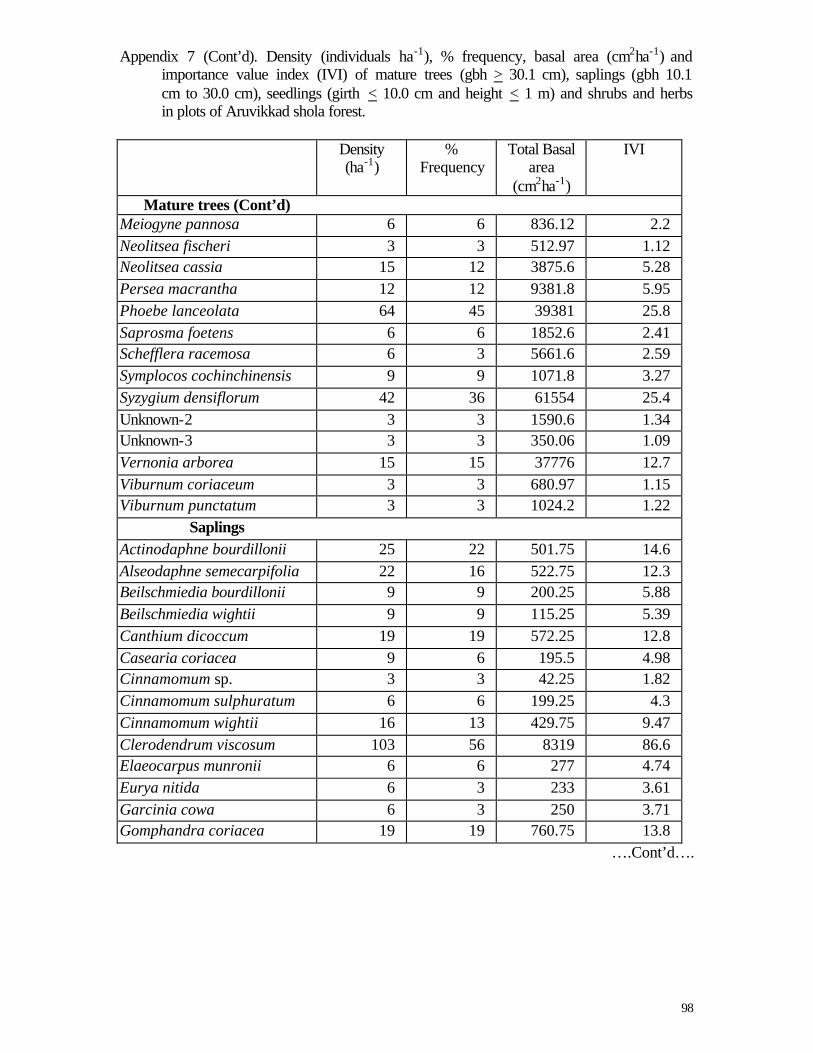
98
Appendix 7 (Cont’d). Density (individuals ha-1), % frequency, basal area (cm2ha-1) and importance value index (IVI) of mature trees (gbh > 30.1 cm), saplings (gbh 10.1 cm to 30.0 cm), seedlings (girth < 10.0 cm and height < 1 m) and shrubs and herbs in plots of Aruvikkad shola forest.
Density
(ha-1) %
Frequency Total Basal
area (cm2ha-1)
IVI
Mature trees (Cont’d) Meiogyne pannosa 6 6 836.12 2.2 Neolitsea fischeri 3 3 512.97 1.12 Neolitsea cassia 15 12 3875.6 5.28 Persea macrantha 12 12 9381.8 5.95 Phoebe lanceolata 64 45 39381 25.8 Saprosma foetens 6 6 1852.6 2.41 Schefflera racemosa 6 3 5661.6 2.59 Symplocos cochinchinensis 9 9 1071.8 3.27 Syzygium densiflorum 42 36 61554 25.4 Unknown-2 3 3 1590.6 1.34 Unknown-3 3 3 350.06 1.09 Vernonia arborea 15 15 37776 12.7 Viburnum coriaceum 3 3 680.97 1.15 Viburnum punctatum 3 3 1024.2 1.22
Saplings Actinodaphne bourdillonii 25 22 501.75 14.6 Alseodaphne semecarpifolia 22 16 522.75 12.3 Beilschmiedia bourdillonii 9 9 200.25 5.88 Beilschmiedia wightii 9 9 115.25 5.39 Canthium dicoccum 19 19 572.25 12.8 Casearia coriacea 9 6 195.5 4.98 Cinnamomum sp. 3 3 42.25 1.82 Cinnamomum sulphuratum 6 6 199.25 4.3 Cinnamomum wightii 16 13 429.75 9.47 Clerodendrum viscosum 103 56 8319 86.6 Elaeocarpus munronii 6 6 277 4.74 Eurya nitida 6 3 233 3.61 Garcinia cowa 6 3 250 3.71 Gomphandra coriacea 19 19 760.75 13.8
….Cont’d….
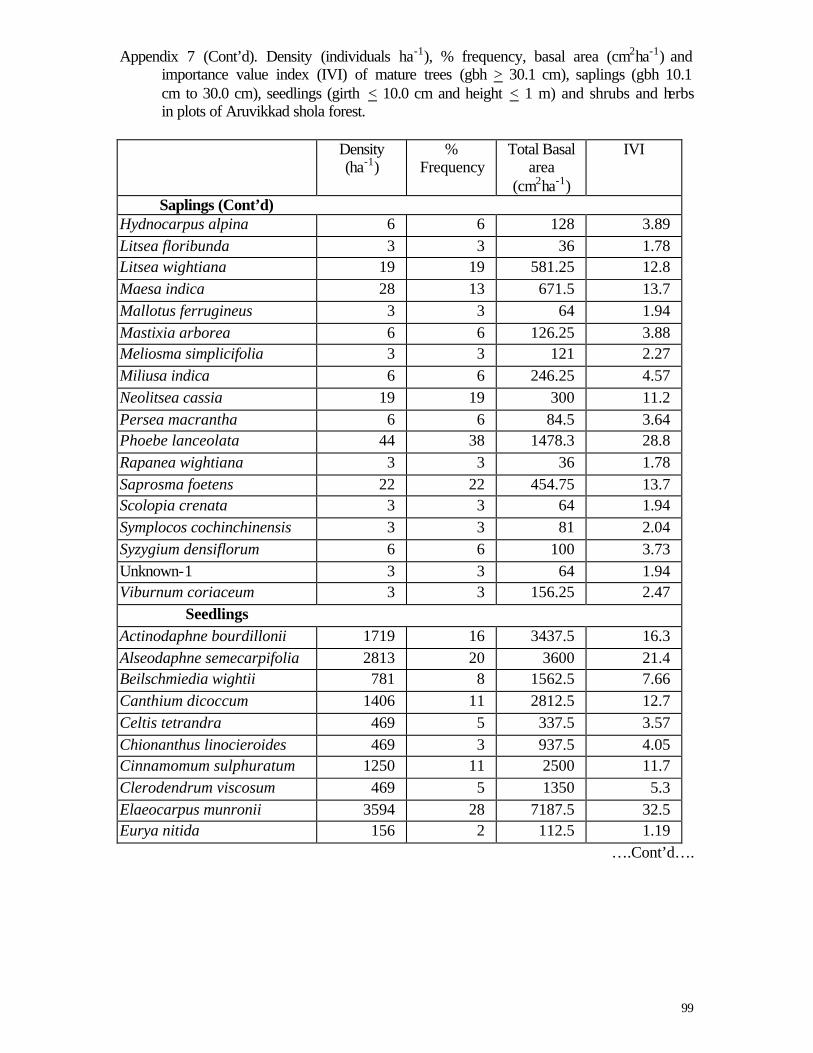
99
Appendix 7 (Cont’d). Density (individuals ha-1), % frequency, basal area (cm2ha-1) and importance value index (IVI) of mature trees (gbh > 30.1 cm), saplings (gbh 10.1 cm to 30.0 cm), seedlings (girth < 10.0 cm and height < 1 m) and shrubs and herbs in plots of Aruvikkad shola forest.
Density
(ha-1) %
Frequency Total Basal
area (cm2ha-1)
IVI
Saplings (Cont’d) Hydnocarpus alpina 6 6 128 3.89 Litsea floribunda 3 3 36 1.78 Litsea wightiana 19 19 581.25 12.8 Maesa indica 28 13 671.5 13.7 Mallotus ferrugineus 3 3 64 1.94 Mastixia arborea 6 6 126.25 3.88 Meliosma simplicifolia 3 3 121 2.27 Miliusa indica 6 6 246.25 4.57 Neolitsea cassia 19 19 300 11.2 Persea macrantha 6 6 84.5 3.64 Phoebe lanceolata 44 38 1478.3 28.8 Rapanea wightiana 3 3 36 1.78 Saprosma foetens 22 22 454.75 13.7 Scolopia crenata 3 3 64 1.94 Symplocos cochinchinensis 3 3 81 2.04 Syzygium densiflorum 6 6 100 3.73 Unknown-1 3 3 64 1.94 Viburnum coriaceum 3 3 156.25 2.47
Seedlings Actinodaphne bourdillonii 1719 16 3437.5 16.3 Alseodaphne semecarpifolia 2813 20 3600 21.4 Beilschmiedia wightii 781 8 1562.5 7.66 Canthium dicoccum 1406 11 2812.5 12.7 Celtis tetrandra 469 5 337.5 3.57 Chionanthus linocieroides 469 3 937.5 4.05 Cinnamomum sulphuratum 1250 11 2500 11.7 Clerodendrum viscosum 469 5 1350 5.3 Elaeocarpus munronii 3594 28 7187.5 32.5 Eurya nitida 156 2 112.5 1.19
….Cont’d….
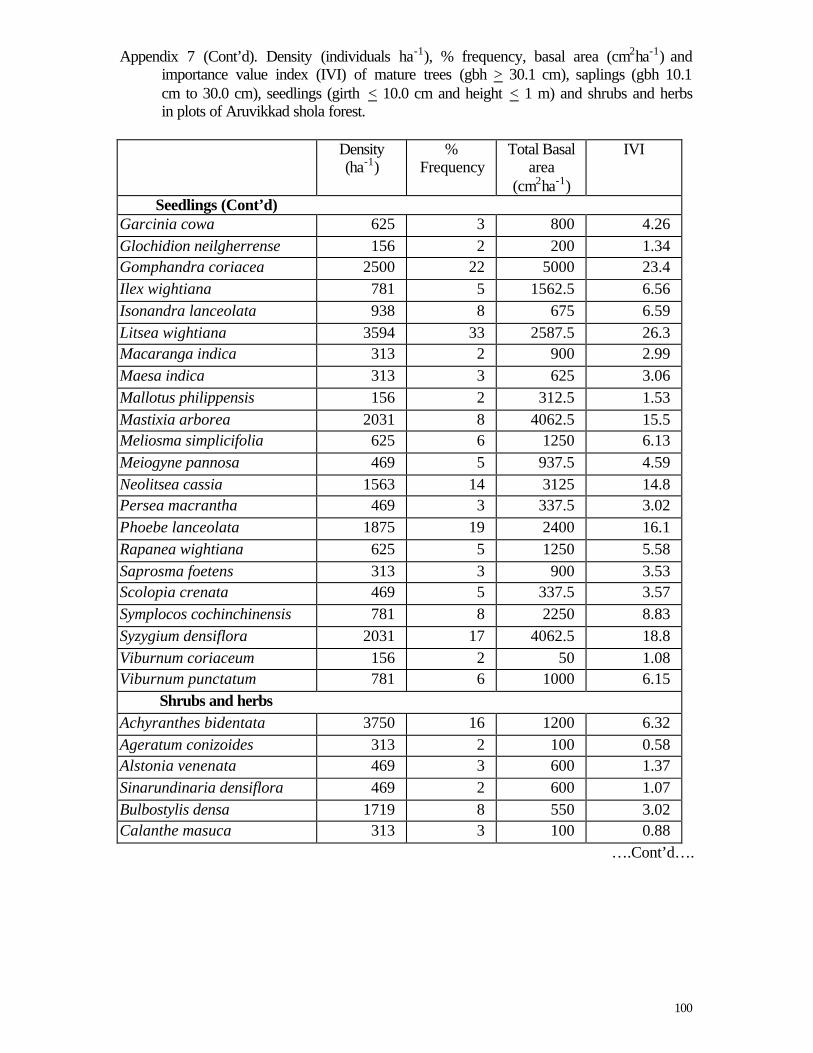
100
Appendix 7 (Cont’d). Density (individuals ha-1), % frequency, basal area (cm2ha-1) and importance value index (IVI) of mature trees (gbh > 30.1 cm), saplings (gbh 10.1 cm to 30.0 cm), seedlings (girth < 10.0 cm and height < 1 m) and shrubs and herbs in plots of Aruvikkad shola forest.
Density
(ha-1) %
Frequency Total Basal
area (cm2ha-1)
IVI
Seedlings (Cont’d) Garcinia cowa 625 3 800 4.26 Glochidion neilgherrense 156 2 200 1.34 Gomphandra coriacea 2500 22 5000 23.4 Ilex wightiana 781 5 1562.5 6.56 Isonandra lanceolata 938 8 675 6.59 Litsea wightiana 3594 33 2587.5 26.3 Macaranga indica 313 2 900 2.99 Maesa indica 313 3 625 3.06 Mallotus philippensis 156 2 312.5 1.53 Mastixia arborea 2031 8 4062.5 15.5 Meliosma simplicifolia 625 6 1250 6.13 Meiogyne pannosa 469 5 937.5 4.59 Neolitsea cassia 1563 14 3125 14.8 Persea macrantha 469 3 337.5 3.02 Phoebe lanceolata 1875 19 2400 16.1 Rapanea wightiana 625 5 1250 5.58 Saprosma foetens 313 3 900 3.53 Scolopia crenata 469 5 337.5 3.57 Symplocos cochinchinensis 781 8 2250 8.83 Syzygium densiflora 2031 17 4062.5 18.8 Viburnum coriaceum 156 2 50 1.08 Viburnum punctatum 781 6 1000 6.15
Shrubs and herbs Achyranthes bidentata 3750 16 1200 6.32 Ageratum conizoides 313 2 100 0.58 Alstonia venenata 469 3 600 1.37 Sinarundinaria densiflora 469 2 600 1.07 Bulbostylis densa 1719 8 550 3.02 Calanthe masuca 313 3 100 0.88
….Cont’d….
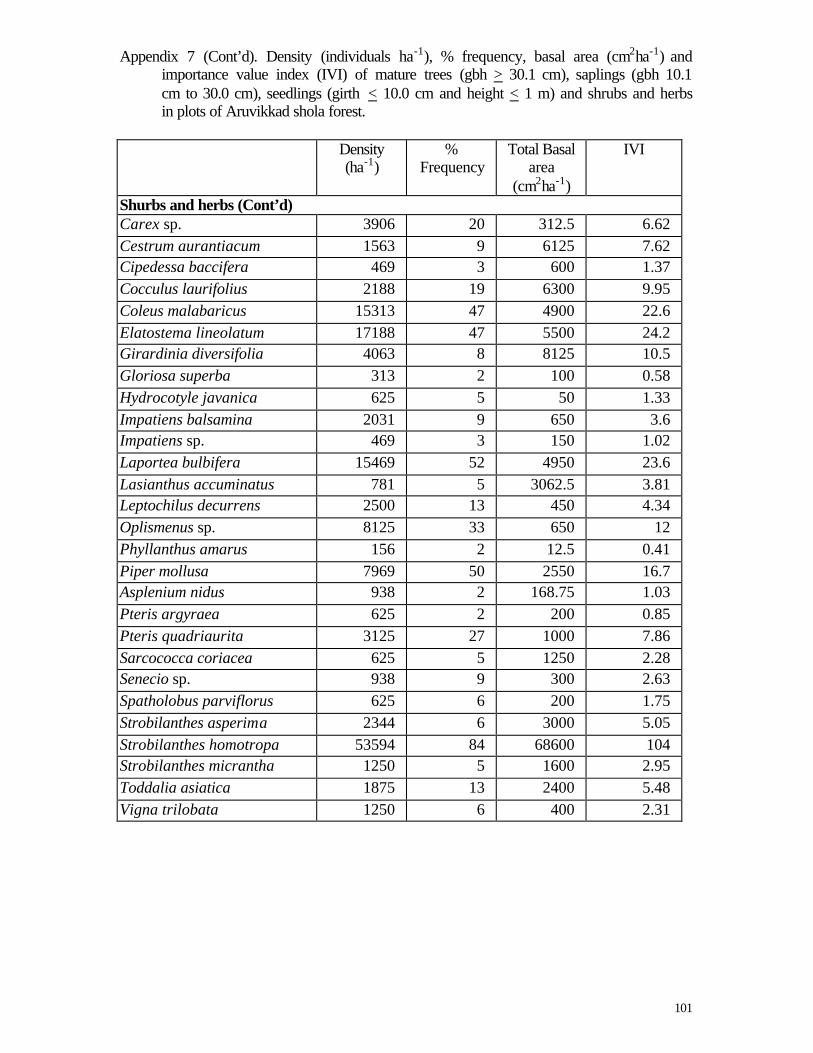
101
Appendix 7 (Cont’d). Density (individuals ha-1), % frequency, basal area (cm2ha-1) and importance value index (IVI) of mature trees (gbh > 30.1 cm), saplings (gbh 10.1 cm to 30.0 cm), seedlings (girth < 10.0 cm and height < 1 m) and shrubs and herbs in plots of Aruvikkad shola forest.
Density
(ha-1) %
Frequency Total Basal
area (cm2ha-1)
IVI
Shurbs and herbs (Cont’d) Carex sp. 3906 20 312.5 6.62 Cestrum aurantiacum 1563 9 6125 7.62 Cipedessa baccifera 469 3 600 1.37 Cocculus laurifolius 2188 19 6300 9.95 Coleus malabaricus 15313 47 4900 22.6 Elatostema lineolatum 17188 47 5500 24.2 Girardinia diversifolia 4063 8 8125 10.5 Gloriosa superba 313 2 100 0.58 Hydrocotyle javanica 625 5 50 1.33 Impatiens balsamina 2031 9 650 3.6 Impatiens sp. 469 3 150 1.02 Laportea bulbifera 15469 52 4950 23.6 Lasianthus accuminatus 781 5 3062.5 3.81 Leptochilus decurrens 2500 13 450 4.34 Oplismenus sp. 8125 33 650 12 Phyllanthus amarus 156 2 12.5 0.41 Piper mollusa 7969 50 2550 16.7 Asplenium nidus 938 2 168.75 1.03 Pteris argyraea 625 2 200 0.85 Pteris quadriaurita 3125 27 1000 7.86 Sarcococca coriacea 625 5 1250 2.28 Senecio sp. 938 9 300 2.63 Spatholobus parviflorus 625 6 200 1.75 Strobilanthes asperima 2344 6 3000 5.05 Strobilanthes homotropa 53594 84 68600 104 Strobilanthes micrantha 1250 5 1600 2.95 Toddalia asiatica 1875 13 2400 5.48 Vigna trilobata 1250 6 400 2.31
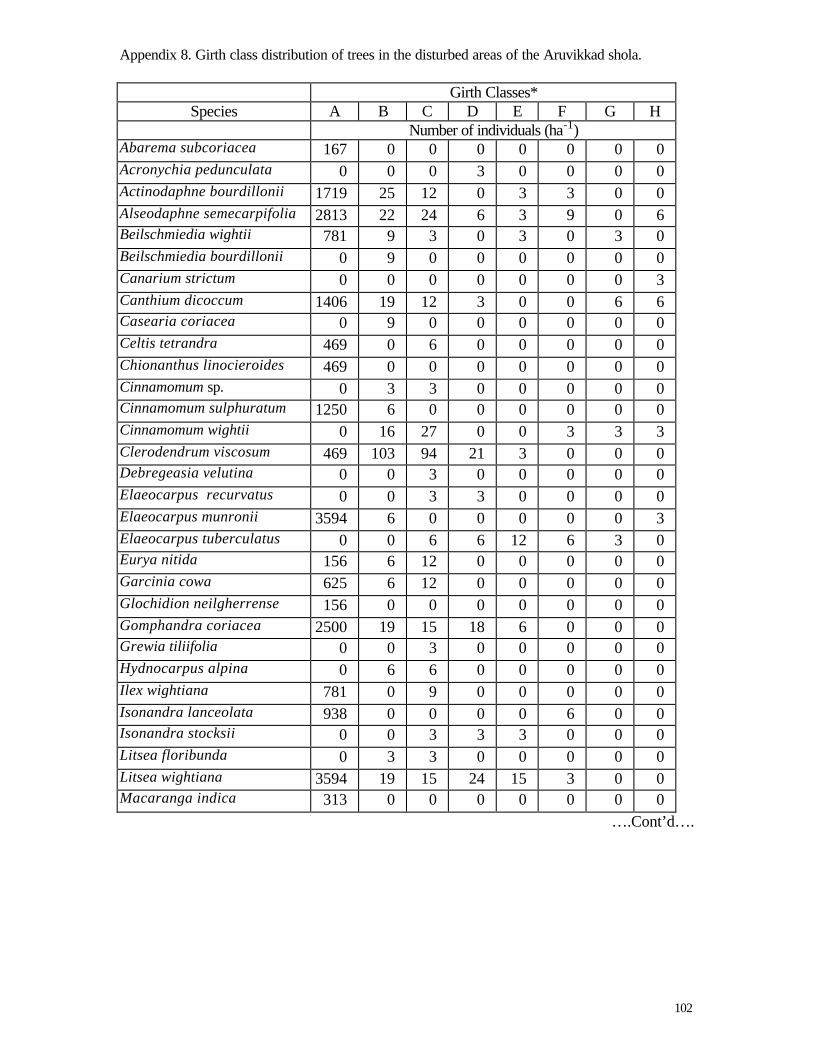
102
Appendix 8. Girth class distribution of trees in the disturbed areas of the Aruvikkad shola.
Girth Classes* Species A B C D E F G H
Number of individuals (ha-1) Abarema subcoriacea 167 0 0 0 0 0 0 0 Acronychia pedunculata 0 0 0 3 0 0 0 0 Actinodaphne bourdillonii 1719 25 12 0 3 3 0 0 Alseodaphne semecarpifolia 2813 22 24 6 3 9 0 6 Beilschmiedia wightii 781 9 3 0 3 0 3 0 Beilschmiedia bourdillonii 0 9 0 0 0 0 0 0 Canarium strictum 0 0 0 0 0 0 0 3 Canthium dicoccum 1406 19 12 3 0 0 6 6 Casearia coriacea 0 9 0 0 0 0 0 0 Celtis tetrandra 469 0 6 0 0 0 0 0 Chionanthus linocieroides 469 0 0 0 0 0 0 0 Cinnamomum sp. 0 3 3 0 0 0 0 0 Cinnamomum sulphuratum 1250 6 0 0 0 0 0 0 Cinnamomum wightii 0 16 27 0 0 3 3 3 Clerodendrum viscosum 469 103 94 21 3 0 0 0 Debregeasia velutina 0 0 3 0 0 0 0 0 Elaeocarpus recurvatus 0 0 3 3 0 0 0 0 Elaeocarpus munronii 3594 6 0 0 0 0 0 3 Elaeocarpus tuberculatus 0 0 6 6 12 6 3 0 Eurya nitida 156 6 12 0 0 0 0 0 Garcinia cowa 625 6 12 0 0 0 0 0 Glochidion neilgherrense 156 0 0 0 0 0 0 0 Gomphandra coriacea 2500 19 15 18 6 0 0 0 Grewia tiliifolia 0 0 3 0 0 0 0 0 Hydnocarpus alpina 0 6 6 0 0 0 0 0 Ilex wightiana 781 0 9 0 0 0 0 0 Isonandra lanceolata 938 0 0 0 0 6 0 0 Isonandra stocksii 0 0 3 3 3 0 0 0 Litsea floribunda 0 3 3 0 0 0 0 0 Litsea wightiana 3594 19 15 24 15 3 0 0 Macaranga indica 313 0 0 0 0 0 0 0
….Cont’d….
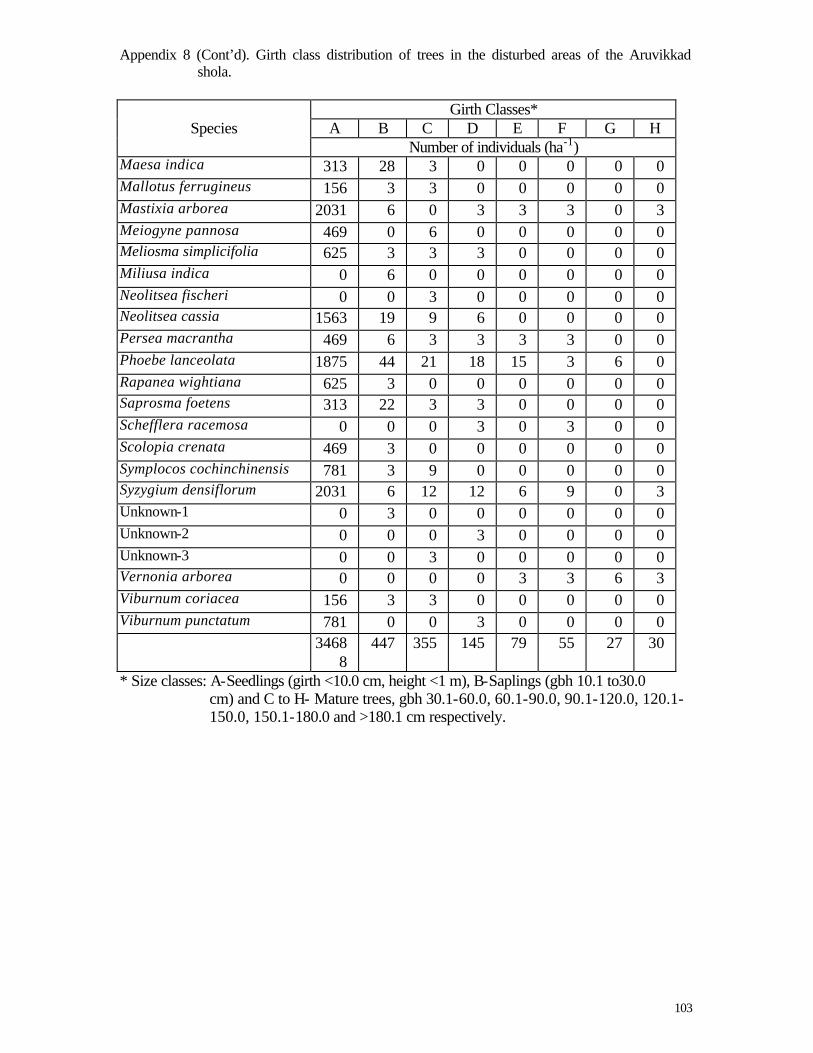
103
Appendix 8 (Cont’d). Girth class distribution of trees in the disturbed areas of the Aruvikkad shola.
Girth Classes*
Species A B C D E F G H Number of individuals (ha-1) Maesa indica 313 28 3 0 0 0 0 0 Mallotus ferrugineus 156 3 3 0 0 0 0 0 Mastixia arborea 2031 6 0 3 3 3 0 3 Meiogyne pannosa 469 0 6 0 0 0 0 0 Meliosma simplicifolia 625 3 3 3 0 0 0 0 Miliusa indica 0 6 0 0 0 0 0 0 Neolitsea fischeri 0 0 3 0 0 0 0 0 Neolitsea cassia 1563 19 9 6 0 0 0 0 Persea macrantha 469 6 3 3 3 3 0 0 Phoebe lanceolata 1875 44 21 18 15 3 6 0 Rapanea wightiana 625 3 0 0 0 0 0 0 Saprosma foetens 313 22 3 3 0 0 0 0 Schefflera racemosa 0 0 0 3 0 3 0 0 Scolopia crenata 469 3 0 0 0 0 0 0 Symplocos cochinchinensis 781 3 9 0 0 0 0 0 Syzygium densiflorum 2031 6 12 12 6 9 0 3 Unknown-1 0 3 0 0 0 0 0 0 Unknown-2 0 0 0 3 0 0 0 0 Unknown-3 0 0 3 0 0 0 0 0 Vernonia arborea 0 0 0 0 3 3 6 3 Viburnum coriacea 156 3 3 0 0 0 0 0 Viburnum punctatum 781 0 0 3 0 0 0 0
34688
447 355 145 79 55 27 30
* Size classes: A-Seedlings (girth <10.0 cm, height <1 m), B-Saplings (gbh 10.1 to30.0 cm) and C to H- Mature trees, gbh 30.1-60.0, 60.1-90.0, 90.1-120.0, 120.1-150.0, 150.1-180.0 and >180.1 cm respectively.