students' perceptions of their recount text writing - e-Campus
124
STUDENTS’ PERCEPTIONS OF THEIR RECOUNT TEXT WRITING EXPERIENCE AND TEACHER’S FEEDBACK AT SECOND GRADE STUDENTS OF MTsN 6 AGAM A THESIS Submitted as a Partial Fulfilment of The Requirements to Obtain Strata One (S1) Degree Written by : RAHMI PUTRI 2314.012 Advisor I Advisor II Dr.Melyann Melani,SS, M.Pd Loli Safitri, M.Pd NIP.198101312003122003 NIP.198805282015032003 ENGLISH EDUCATION DEPARTEMENT FACULTY OF TARBIYAH AND TEACHER TRAINING STATE ISLAMIC INSTITUTE OF BUKITTINGGI BUKITTINGGI 1
-
Upload
khangminh22 -
Category
Documents
-
view
1 -
download
0
Transcript of students' perceptions of their recount text writing - e-Campus

STUDENTS’ PERCEPTIONS OF THEIR RECOUNT TEXT WRITING
EXPERIENCE AND TEACHER’S FEEDBACK AT SECOND GRADE
STUDENTS OF MTsN 6 AGAM
A THESIS
Submitted as a Partial Fulfilment of The Requirements to Obtain
Strata One (S1) Degree
Written by :
RAHMI PUTRI
2314.012
Advisor I Advisor II
Dr.Melyann Melani,SS, M.Pd Loli Safitri, M.Pd
NIP.198101312003122003 NIP.198805282015032003
ENGLISH EDUCATION DEPARTEMENT
FACULTY OF TARBIYAH AND TEACHER TRAINING
STATE ISLAMIC INSTITUTE OF BUKITTINGGI
BUKITTINGGI
1
2
2018M/1439H
ABSTRACT
Rahmi Putri, 2314.012, Students’ Perceptions of Their Recount Text Writing
Experience and Teacher’s Feedback at Second Grade Students of MTsN 6
Agam.
This research was purposed to know what are the students’ perceptions on
their Recount text writing experience and teacher’s feedback at second grade
students of MTsN 6 Agam. This research was done because the researcher found
that the students’ had different perceptions toward their Recount text writing
experience those perceptions were some of the students said they had bad
experience when writing recount text because they felt confuse to develop their
ideas, difficult to use English in their text and used the approriate vocabularies
also could not write down their sentences correctly. Another students had different
perceptions, they said that they could write recount text easily and did not found
any problem when writing the recount text.
The students’ perceptions toward the teacher’s feedback were some
students said that they did not understand with the feedback that they got on their
task, they said the teacher gave written feedback by using some corrections
symbols without any comments or explanations which made the students difficult
to understand those symbols. Another students also said that they could not repair
their mistakes related to the symbols that they got on their task because they did
not know what their mistakes are and how to repair those mistakes. They need
2
3
more explanation from the teacher to help them in understanding their mistakes.
But some students said that they understood with the feedback that provided by
the teacher they also said the feedback that provided by the teacher could increase
their skill in learning recount text
The researcher used descriptive research for this research. The total
population was 247 students, the researcher took 20% from the total of population
so the sample was 49 students which consisted 7 students from 7 classes and the
researcher used simple random sampling in determining the sample. The data
were gotten from questionnaire. Based on the analysis of the data, found that the
students’ perceptions on their Recount text writing experience was on good
category with mean of total score was 73%. It means that almost all of the
students had good perceptions on their Recount text exeprience. And the students’
perceptions toward teacher’s feedback was also on good category with the meant
of total score was 82%. It means that almost all of the students had good
perceptions toward the teacher’s feedback.
Keyword: Students’ Perception, Recount Text, Teacher’s Feedback.
3
4
ABSTRAK
Rahmi Putri, 2314.012, Persepsi Siswa Terhadap Pengalaman Menulis Teks
Recount dan Feedback Guru pada Siswa Kelas 2 MTsN 6 Agam.
Penelitian ini bertujuan untuk mengetahui persepsi siswa kelas 2 MTsN 6
Agam terhadap pengalaman mereka dalam menulis teks Recount dan umpan balik
dari guru. Penelitian ini dilakukan karena peneliti menemukan siswa memiliki
persepsi yang berbeda saat menulis teks Recount dan mendapatkan umpan balik
dari guru. Persepsi beberapa orang siswa saat menulis teks Recount adalah hampir
seluruh siswa merasa kebingungan saat mengembangkan ide mereka, kesulitan
untuk menggunakan bahasa Inggris yang tepat, tidak bisa menulis kalimat mereka
dengan benar dan sulit menggunakan kosa kata yang tepat. Siswa yang lain
memepunyai persepsi yang berbeda mereka mengatakan bahwa mereka sangat
mudah menulis teks recount dan tidak menemukan kesulitan saat menulis teks
recount.
Persepsi siswa terhadap umpan balik dari guru adalah siswa tidak
memahami umpan balik yang diberikan guru, mereka mengatakan bahwa guru
memberikan umpan balik tertulis dengan memberikan koreksi berupa simbol-
simbol tanpa memberikan komentar atau penjelasan yang membuat siswa
kesulitan memahami simbol-simbol tersebut. Siswa lainnya juga mengatakan
bahwa mereka tidak bisa memperbaiki kesalahan-kesalahan berdasarkan simbol-
simbol yang ada di tugas mereka karena mereka tidak mengetahui apa kesalahan
4
5
mereka dan bagaimana cara memperbaikinya. Tetapi siswa lain mengatakan
bahwa mereka memahami umpan balik yang diberikan guru dan umpan balik
tersebut bisa membantu meningkatkan kemampuan mereka dalam mempelajari
recount text.
Penelitian ini adalah penelitian deskriptif. Total populasi adalah 247
siswa, peneliti mengambil 20% dari kesuluruhan total populasi sebagai sample
jadi total sample untuk penelitian ini adalah 49 siswa yang merupakan 7 orang
siswa dari 7 kelas dan peneliti menggunakan simple random sampel untuk
menentukan sampel. Peneliti menggunakan angket untuk mendapatkan data.
Berdasarkan analisis data, peneliti menemukan bahwa persepsi siswa terhadap
pengalaman mereka dalam menulis teks Recount berada dalam kategori baik
dengan hasil rata-rata total skor 73%. Hal ini berarti bahwa hampir dari seluruh
siswa mempunyai persepsi yang baik terhadap pengalaman menulis teks Recount
mereka. Dan persepsi siswa mengenai umpan balik yang diberikan guru juga
berada dalam kategori baik dengan rata-rata total skor 82%. Hal ini berarti bahwa
hampir dari seluruh siswa mempunyai persepsi yang baik terhadap umpan balik
yang diberikan guru.
Kata kunci: Persepsi Siswa, Teks Recount, Umpan Balik Guru
5
6
ACKNOWLEDGEMENT
Alhamdulillahhirrabil’alamin, in the name of Allah SWT, the most
Gracious and Merciful, who always gives helath and all of things to the writer in
accomplishing this thesis, Shalawat and Salam to the most honorable Prophet
Muhammad SAW, messengers, and his followers who has opened our mind to
study until now.
The researcher would like to express the deepest gratitude to the people
who give their contribution and helps to the researcher in conducting this thesis:
1. Dr. Ridha Ahida, M. Hum as the rector of IAIN Bukittinggi and also her first,
second, and third assistans.
2. Dr. H. Nunu Burhanuddin, Lc, M.Pd as the dean of Tarbiyah Faculty IAIN
Bukittinggi.
3. Dr. Veni Roza, S.S, M.Pd, as the head of English Education Departement of
IAIN Bukittinggi.
4. Dr. Melyann Melani, S.S, M.Pd and Loli Safitri, M.Pd as advisor for their
care, time, attention, guidance, valuable advices, suggestions, critics, and
patience in complishing this thesis. Their suggestions and contributions are
highly appreciated.
5. The librariants of IAIN Bukittinggi who have sincerely helped and allowed the
writer in collecting the refernces.
6

7
6. All of the lectures in English Departement of Faculty of Tarbiyah and Teacher
Training of valuable knowledge, guidance, and advices during the years of my
study.
7. The writer also shows her thanks to her beloved mother and father, Erniwati
and Arlis who have given their endless love, pray, and supports to accomplish
this thesis soon.
8. The writer also shows her thanks to her beloved friends (Erin, Riana, Suci,
Dani, Dina, Fadli, Gion). Thanks for their love, supports, and motivations for
the researcher to finish this thesis.
9. All of her friends at English Education Departement 2014 generation,
especially PBI “A” for their sweet memories, wonderful friendship, helps,
supports, and inspirations in studying and accomplishing this thesis.
10. Her special thanks and love for someone special for his love, supports,
motivations to finish this thesis.
The writer hopes Allah SWT always blesses all of the people those helped
her, who have been mentioned or not. The writer honestly believe that this thesis
might still have some weaknesses. Therefore, she really hope that there will be
some criticism and suggestions from the reader to make this thesis better.
Bukitttinggi, 5 Agustus 2018
The Researcher
Rahmi Putri 2314.012
7
8
TABLE OF CONTENTS
ABSTRACT.............................................................................................................. i
ACKNOWLEDGEMENT....................................................................................... iii
TABLE OF CONTENTS......................................................................................... v
LIST OF TABLES................................................................................................... viii
LIST OF GRAPHIC................................................................................................ xii
LIST OF APPENDICES.......................................................................................... xiii
CHAPTER I: INTRODUCTION
A. Background of The Problem............................................................................... 1
B. Identification of The Problem............................................................................. 5
C. Limitation of The Study...................................................................................... 5
D. Formulation of The Problem............................................................................... 6
E. Purposes of The Research................................................................................... 6
F. Significant of The Research................................................................................ 6
G. Definition of The Key Terms.............................................................................. 7
CHAPTER II: REVIEW OF RELATED LITERATURE
A. Review of the Related Theory
1. Nature of Perception
a. Definition of perception........................................................................ 9...............................................................................................................
8
9
b. Factors influencing perception.............................................................. 11
c. Process of Perception............................................................................ 14
d. Aspects of Perception........................................................................... 17
e. Principles of Perception........................................................................ 19
2. Nature of Writing
a. Definition of writing............................................................................. 21
b. Process of writing................................................................................. 21
3. Nature of Recount Text
a. Definition of recount text...................................................................... 25
b. Generic Structure of Recount Text....................................................... 26
c. The Grammatical Features of Recount Text......................................... 28
d. Example of Recount Text..................................................................... 28
4. Nature of Feedback
a. Definition of Feedback......................................................................... 29
b. The purposes of feedback..................................................................... 30
c. Source of feedback................................................................................ 32
d. Forms of feedback ................................................................................ 34
B. Review of The relevant Studies.......................................................................... 37
C. Conceptual Framework....................................................................................... 40
CHAPTER III: RESEARCH METHOD
A. Design of The Research...................................................................................... 42
B. Populasi and Sample .......................................................................................... 42
9
10
1. Population..................................................................................................... 43
2. Sample........................................................................................................... 44
C. Research Instrument............................................................................................ 45
D. Technique of Data Collection............................................................................. 47
E. Technique of Data Analysis................................................................................ 47
CHAPTER IV: FINDING AND DISCUSSION
A. Finding................................................................................................................ 50
1. Description of the data.................................................................................. 50
2. Analysis of The Data..................................................................................... 67
B. Discussion........................................................................................................... 102
CHAPTER V: CONCLUSIONS AND SUGGESTIONS
A. Conclusions ........................................................................................................ 105
B. Suggestions......................................................................................................... 106
BIBLIOGRAPHY.................................................................................................... 107
APPENDICES.......................................................................................................... 111
DOCUMENTATION............................................................................................... 137
10
11
LIST OF TABLE
Table 3.1: The Total Population of the second grade students of MTsN 6 Agam......... 43
Table 3.2: Interpratation Table....................................................................................... 49
Table 4.1:Students’ perceptions of their writing recount text experience the
description of data calculation of frequency and percentage of the students’
answer............................................................................................................................. 51
Table 4.2:The mean score of students’ perceptions on their writing recount text
experience toward choosing the topic............................................................ 54
Table 4.3:The mean score of students’ perceptions on their writing recount text
experience toward narrowing the topic.......................................................... 55
Table 4.4:The mean score of students’ perceptions on their writing recount text
experience toward generate the ideas............................................................. 55
Table 4.5:The mean score of students’ perceptions on their writing recount text
experience toward making sublist.................................................................. 56
Table 4.6:The mean score of students’ perceptions on their writing recount text
experience toward writing the topic sentence................................................ 57
Table 4.7:The mean score of students’ perceptions on their writing recount text
experience towar the outlining....................................................................... 57
Table 4.8:The mean score of students’ perceptions on their writing recount text
experience toward writing the first rough draft ............................................. 58
11
12
Table 4.9:The mean score of students’ perceptions on their writing recount text
experience toward revising content and organization ................................... 59
Table 4.10:The mean score of students’ perceptions on their writing recount text
experience toward writing the final copy ...................................................... 59
Table 4.11: Students’ perceptions toward teacher’s feedback the description of
data calculation of frequency and percentage of the students’ answer........
60
Table 4.12:The mean score of students’ perceptions toward teacher’s feedback in
grammar ...................................................................................................... 63
Table 4.13:The mean score of students’ perceptions toward teacher’s feedback in
vocabulary choice ....................................................................................... 63
Table 4.14:The mean score of students’ perceptions toward teacher’s feedback in
punctuation................................................................................................... 64
Table 4.15:The mean score of students’ perceptions toward teacher’s feedback in
spelling ....................................................................................................... 65
Table 4.16:The mean score of students’ perceptions toward teacher’s feedback in
quality of the content ................................................................................... 65
Table 4.17:The mean score of students’ perceptions toward teacher’s feedback in
organization of the content .......................................................................... 66
12
13
Table 4.18:The mean score of students’ perceptions toward teacher’s feedback in
combination of correction and content related feedback............................. 66
Table 4.1: Choosing the Topic Statement 1.................................................................... 67
Table 4.2: Choosing the Topic Statement 2.................................................................... 68
Table 4.3: Students’ perceptions toward narrowing the topic Statement 3.................... 69
Table 4.4: Students’ perceptions toward narrowing the topic Statement 4.................... 70
Table 4.5: Students’ perceptions toward generate the ideas Statement 5....................... 71
Table 4.6: Students’ perceptions toward generate the ideas Statement 6....................... 72
Table 4.7: Students’ perceptions toward making sublist Statement 7............................ 73
Table 4.8: Students’ perceptions toward making sublist Statement 8............................ 74
Table 4.9: Students’ perceptions toward making sublist Statement 9............................ 75
Table 4.10: Students’ perceptions toward making sublist Statement 10........................ 76
Table 4.11: Students’ perceptions toward making outlining Statement 11.................... 77
Table 4.12: Students’ perceptions toward making outlining Statement 12.................... 77
Table 4.13: Students’ perceptions toward writing the first rough draft Statement
13.................................................................................................................. 78
Table 4.14: Students’ perceptions toward writing the first rough draft Statement
14..................................................................................................................................... 79
13
14
Table4.15:Students’ perceptions toward revising content and organization
Statement 15................................................................................................... 80
Table4.16:Students’ perceptions toward revising content and organization
Statement 16................................................................................................... 81
Table 4.17: Students’ perceptions toward writing the final copy Statement 17............. 82
Table 4.18: Students’ perceptions toward writing the final copy Statement 18............. 83
Table 4.19:The Mean Score of Students’ Perceptions on Their Recount text
Writing Experience..................................................................................... 84
Table 4.20: Students’ perceptions toward teacher’s feedback in grammar
Statement 19................................................................................................. 85
Table 4.21: Students’ perceptions toward teacher’s feedback in grammar
Statement 20................................................................................................. 86
Table 4.22: Students’ perceptions toward teacher’s feedback in vocabulary choice
Statement 21................................................................................................. 87
Table 4.23: Students’ perceptions toward teacher’s feedback in vocabulary choice
Statement 22................................................................................................. 88
Table 4.24:Students’ perceptions toward teacher’s feedback in punctuation
Statement 23................................................................................................. 89
14
15
Table 4.25: Tabel Students’ perceptions toward teacher’s feedback in punctuation
Statement 24................................................................................................. 90
Table 4.26: Students’ perceptions toward teacher’s feedback in spelling Statement
25.................................................................................................................. 91
Table 4.27: Students’ perceptions toward teacher’s feedback in spelling Statement
26.................................................................................................................. 92
Table 4.28: Students’ perceptions toward teacher’s feedback in spelling Statement
27.................................................................................................................. 93
Table 4.29: Students’ perceptions toward teacher’s feedback in spelling Statement
28.................................................................................................................. 94
Table4.30: Students’ perceptions toward teacher’s feedback in quality of
thecontent Statement 29............................................................................... 95
Table 4.31: Students’ perceptions toward teacher’s feedback in quality of the
content Statement 30.................................................................................... 96
Table 4.32: Students’ perceptions toward teacher’s feedback in organization of the
content Statement 31.................................................................................... 97
Table 4.33: Students’ perceptions toward teacher’s feedback in organization of the
content Statement 32.................................................................................... 98
Table 4.52: The Mean Score of Students’ Perceptions Toward Teacher’s
Feedback...................................................................................................... 9915
16
LIST OF FIGURES
Picture 1: The researcher gave explanation to the students about the questionnaire......
138
Picture 2: The students listened the researcher’s explanation........................................ 138
Picture 3: The students filled the questionnaire.............................................................. 139
Picture 4: The students filled the questionnaire.............................................................. 139
Picture 5: The researcher collected the questionnaire from the students........................ 140
16
17
LIST OF APPENDICES
Appendix 1: Research Instrument Guideline.................................................................. 111
Appendix 2: Questionnaire............................................................................................. 115
Appendix 3: Distribution of questionnaire from students’ answer................................. 119
Appendix 4: Score of questionnaire................................................................................ 121
Appendix 5: Percentage of questionnaire based on each item........................................ 123
Appendix 6: Total score of questionnaire based on each item....................................... 127
17
18
CHAPTER I
INTRODUCTION
A. Background of The Problem
Writing is one of language skill that students acquire in learning English
besides listening, reading, and speaking. Writing is a skill that required in written
communication. A good writing is not always easy and be a challenge even for the
best students. Mastering vocabularies and tenses become the main key to get a
good writing. The students have to choose the appropriate vocabularies to arrange
words, making sentences and develop them into paragraphs using correct
grammar, and punctuation.
As a skill in English, writing has become an important skill for future life
because it is required in various aspects such as science, technology, and others.
Writing should become familiar in students’ daily life, because they do writing in
order to complete many tasks of their studies. Writing practice can help the
students to improve their vocabulary, grammar and of course increase their ability
in English. Because writing is important to learn, students in Junior High School
are expected to learn and master writing skill. Based on the English syllabus in
curriculum for second grade students of Junior High School, there are some text
types that should be learned by the students. One of those text is recount text.
18

19
19
20
Recount text is a text that tells the reader or the listener about a sequence
of even in the past time. There are three generic structures of recount text, first is
orientation which introducing the event consist of character , setting of time, and
setting of place. Second is events, consist of chronological sequence of the event.
The last is re-orientation, is the closing of the text consist of writer’s feeling,
opinion or planning. Tense that used in recount text is past tense.
Students have their own experience during writing recount text. Writing
experience is how the students feel, how they give meaning, how they figured out
the difficulties, and how their perceptions when writing recount text are. It is may
bad or good experience. After having interviewed with some students in MTsN 6
Agam on 21th february 2018, the researcher found that the students had different
perceptions toward their recount text writing experience. Some of the students
said they had bad experience when writing recount text because they felt confuse
to develop their ideas, difficult to use English in their text and used the approriate
vocabularies also could not write down their sentences correctly. Another students
had different perceptions, they said that they could write recount text easily and
did not found any problem when writing the recount text.
To help the students in producing recount text effectively, the teacher have
to provide feedback for the students. Feedback is one of some factors which
support success of students writing process. Feedback can be defined as a
response that is given by the teacher to students’ performance in oral or written
form. They are such corrections and suggestions for the students and contains
critics or encouragements for better performance. In general, there are two kinds
20
21
of feedback that are commonly used by the teacher in learning process such as
written feedback and oral feedback. The teacher have to use the appropriate
feedback because each feedback have different affect to the students.
Based on the researcher interviewed with some of the second grade
students in MTsN 6 Agam related to the teacher’s feedback, the researcher found
that the students had different perceptions toward the feedback that they got from
the teacher. Some students said that they did not understand with the feedback that
they got on their task, they said the teacher gave written feedback by using some
corrections symbols without any comments or explanations which made the
students difficult to understand those symbols. Another students also said that
they could not repair their mistakes related to the symbols that they got on their
task because they did not know what their mistakes are and how to repair those
mistakes. They need more explanation from the teacher to help them in
understanding their mistakes. But some students said that they understood with
the feedback that provided by the teacher they also said the feedback that provided
by the teacher could increase their skill in learning recount text.
The teacher have to develop the student’s skill and performance in
learning recount text and understanding the feedback. One of the ways which the
teacher can do is knowing how the students’ perceptions. Perception is a process
of accepting information to get message in the environment. It means that,
students’ perception is how the students’ opinions, senses, and beliefs toward the
learning material and feedback which provided by the teacher. The students may
21
22
have negative and positive perceptions. Those perceptions will affect the students
in learning process and understanding the feedback.
When the teacher gets the students’ perception, the teacher will find what
the students’ needs to improve their skill in writing recount text and understanding
the feedback. Collete said “ By making students aware of their perceptions and
discussing and critiqueing them, it is likey that they will be able to correct them
self based on contextual sensitivity, which will in turn, eliminated the barrier and
fear they have towards English.”1 It is mean that, when then teacher find out the
students’ perception, they can help the students in learning English especially in
writing recount text and understanding the feedback.
From the problems that the researcher found when had interview with the
teacher and the students, the researcher is interested to know what the students’
perceptions of their recount text writing experience and teacher’s feedback are and
make a research entitle Students’ Perceptions of Their Recount Text Writing
Experience and Teacher’s Feedback at Second Grade Students Of Mtsn 6 Agam.
1 Despagne Collete. The Difficulties of Learning English: Perception and attitude inMexico Canadian an International article. The University of Western Ontario.article 5. 2010. p.18 http.//ir.ilb.uwo.ca/cie-eci.Retrieved on Sunday 25 January 2013
22
23
B. Identification of The Problem
Based on the background of the problem above, there are some problems
that faced by the students, which are :
1. Some of the students had some difficulties in writing recount text.
2. Some students could write recount text easily and did not found any problem
when writing the recount text.
3. Some students said that they did not understand with the feedback that they
got on their task, they said the teacher gave written feedback by using some
corrections symbols without any comments or explanations which made the
students difficult to understand those symbols.
4. Some students said that they could not repair their mistakes related to the
symbols that they got on their task because they did not know what their
mistakes are and how to repair those mistakes.
5. Some students said that they understood with the feedback that provided by
the teacher and the feedback that provided by the teacher could increas their
skill in learning recount text.
C. Limitation of The Study
Based on the problem above, the researcher focusses on students’
perceptions of their recount text writing experience and teacher’s feedback at
second grade students of Mtsn 6 Agam.
23
24
D. Formulation of The Problem
Based on the limitation of the problems, the researcher focusses on the
following questions.
1. What are the students’ perceptions of their recount text writing experience on
the second grade students at MTsN 6 Agam?
2. What are the students’ perceptions of the teacher’s feedback on the second
grade students at MTsN 6 Agam?
E. Purposes of The Research
Based on the formulation of the problem above, the purpose of this
research are:
1. To find what the students’ perceptions of their writing recount text experience
on the second grade students at MTsN 6 Agam are.
2. To find what the students’ perceptions toward teacher’s feedback on the
second grade students at MTsN 6 Agam are.
F. Significant of The Research
This research is expected to be useful for:
1. For teachers, this research can give informations related to the students’
perception about their writing recount text and teachers’ feedback, which can
influence the effective learning in the classroom.
2. For students, this research can be a preference to increase students’ interest
and motivation in learning English.
24
25
3. For researcher, this research can be information and explanation related to the
topic, which is concern of the research.
4. For college, this research as an addition of educational literature and reference.
G. Definition of The Key Terms
1. Perception
Perception is the consciousness of particular things presented to senses. The
sensea are described as the gateways of knowledge or windows of the mind or
soul.2 In this research perception is the students’ sense, opinion and belief after
writing recount text and getting teacher’s feedback on the second grade
students at MTsN 6 Agam .
2. Recount text
Recount text is a kind of genre that has social function to retell event for the
purpose of informing or entertaining.3 In this research recount text is a kind of
text which is t augh toward the second grade students at MTsN 6 Agam.
3. Writing experience
Experience ia a category of thinking, a minimal unit of analysis that includes
people (their intellectual, affective, and practical characteristics), their material
and social environment, their transactional relations, and affect.4 Writing
experience is the students’ intellectual, social environment, transactional
relations, and affect when writing process. In this research writing exprience is
2 Musabbihin, Students Difficulties and Their Perception in Writing Recount Text: AStudy at the Second Year Students of MA Muallimin NW Anjani in Academic Year 2016/1017. TheIndonesian Journal of Language Teaching Vol.2 No 2,Mei 2017 pp.82-88, English Post-GraduateStudents, University of Mataram. p 84
3 Ibid. P. 834 Wolf-Michael Roth & Alfredo Jornet, Toward A Theory of Experience. Science
Education .DOI 10.1002/sce. 21085. 2014. p. 2
25
26
how the students’ knowledge and skill when writing recount text on the
second grade students at MTsN 6 Agam.
4. Feedback
Feedback is information which a learner can confirm, add to, overwrite, tune,
or restructure information in memory, whether that information is domain
knowledge, meta-cognitive knowledge, beliefs about self and tasks, or
cognitive tactics and strategies.5 In this research feedback is informations
which give by the teacher toward the students’ performance in writing recount
text on the second grade students at MTsN 6 Agam.
CHAPTER II
5 John Hattie & Helen Timperley, The Power of Feedback. Review of EducationalResearch Vol. 77 No.1, March 2007 pp.81-112, University of Auckland. p 82
26
27
REVIEW OF RELATED LITERATURE
A. Review of the Related Theory
1. Nature of Perception
a. Definition of perception
Each person has different perception about something whether
object, people or even around them. The perception come out may be
negative or positive because the perception often affected by surrounding
environment. Perception is the organization and identification of
information in order to represent and understand the presented
information on the environment.
The researcher found some definitions of perception from the
recent theses arround perception. Bruce Goldstein in his book said,
” Perception is something you experience constantly, knowing about how
it works is interesting in its own right.”6 It means that perception is related
to things which appear around the people.
Furthermore, Slameto said, “ Perception is a process related to
acceptance of information by human brain that is said that during the
process a person continually interacts with his or her environment.”7 It
means that perception is started from the sense of organ. This process is
related to the acceptance of message or information by human brain. In
line with Slameto, Walgito also said “ Perception is a process of
6 E. Bruce Goldstein, Sensation and Perception, (Canada: Wadsworth, 2010), eighthedition. p 5
7 Slameto, Belajar dan Faktor-Faktor yang Mempengaruhinya, (Jakarta: Bina Aksara,2000). p. 102
27
28
acceptance the stimulus by the human’s receptor.”8 It is clear that
perception is a process that involves the incusion of the message or
information into the human brain, through human perception in constant
contact with the environment.
Perception is an important thing in learning because it can
influence the learning process. Barbot and Camatarri in Despagne said, “
the notion of perception refers to a group of attitudes and ideas,
sometimes even stereotypes that the person conveys in an unconscious
way which affects the student’s learning process.”9 It is clear that the
students’ perception is influenced by the outside of environment and it is
also caused by his and other’s interpretation about something.
In conclusion, perception is a process which people receive,
organize, and interpret information from their environment through the
sense of organ. The perception cannot be separated from learning process
because through perception the students make relation with their
environment. They will interprate all stimulus of information around them
and give conclusion in each stimulus they have.
b. Factors influencing perception
8 Bimo Walgito, Pengantar Psikologi Umum, (Jakarta: PT. Raja Grafindo Persada, 2010), p. 99
9 Despagne Collete, The Difficulties of Learning English: Perception and attitude inMexico Canadian an International article, ............. p. 58
28
29
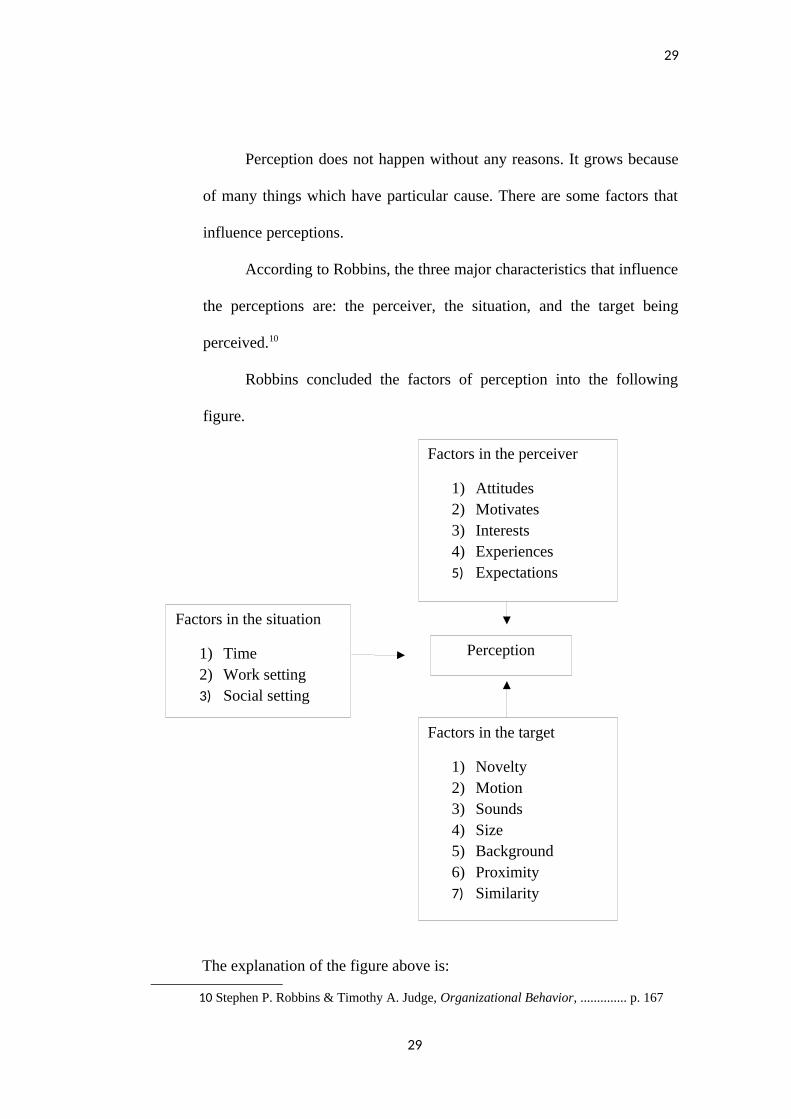
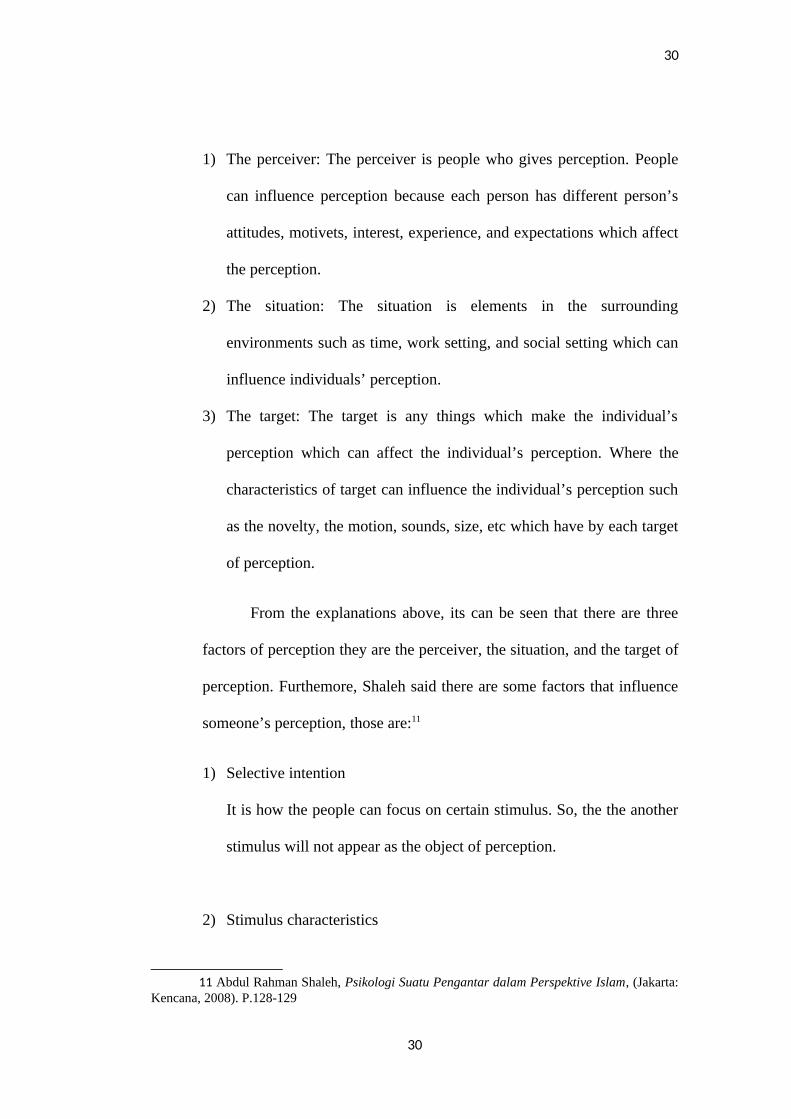
Perception does not happen without any reasons. It grows because
of many things which have particular cause. There are some factors that
influence perceptions.
According to Robbins, the three major characteristics that influence
the perceptions are: the perceiver, the situation, and the target being
perceived.10
Robbins concluded the factors of perception into the following
figure.
The explanation of the figure above is:
10 Stephen P. Robbins & Timothy A. Judge, Organizational Behavior, .............. p. 167
29
Factors in the perceiver
1) Attitudes2) Motivates3) Interests4) Experiences5) Expectations
Factors in the situation
1) Time2) Work setting3) Social setting
Factors in the target
1) Novelty2) Motion3) Sounds4) Size5) Background6) Proximity7) Similarity
Perception
30
1) The perceiver: The perceiver is people who gives perception. People
can influence perception because each person has different person’s
attitudes, motivets, interest, experience, and expectations which affect
the perception.
2) The situation: The situation is elements in the surrounding
environments such as time, work setting, and social setting which can
influence individuals’ perception.
3) The target: The target is any things which make the individual’s
perception which can affect the individual’s perception. Where the
characteristics of target can influence the individual’s perception such
as the novelty, the motion, sounds, size, etc which have by each target
of perception.
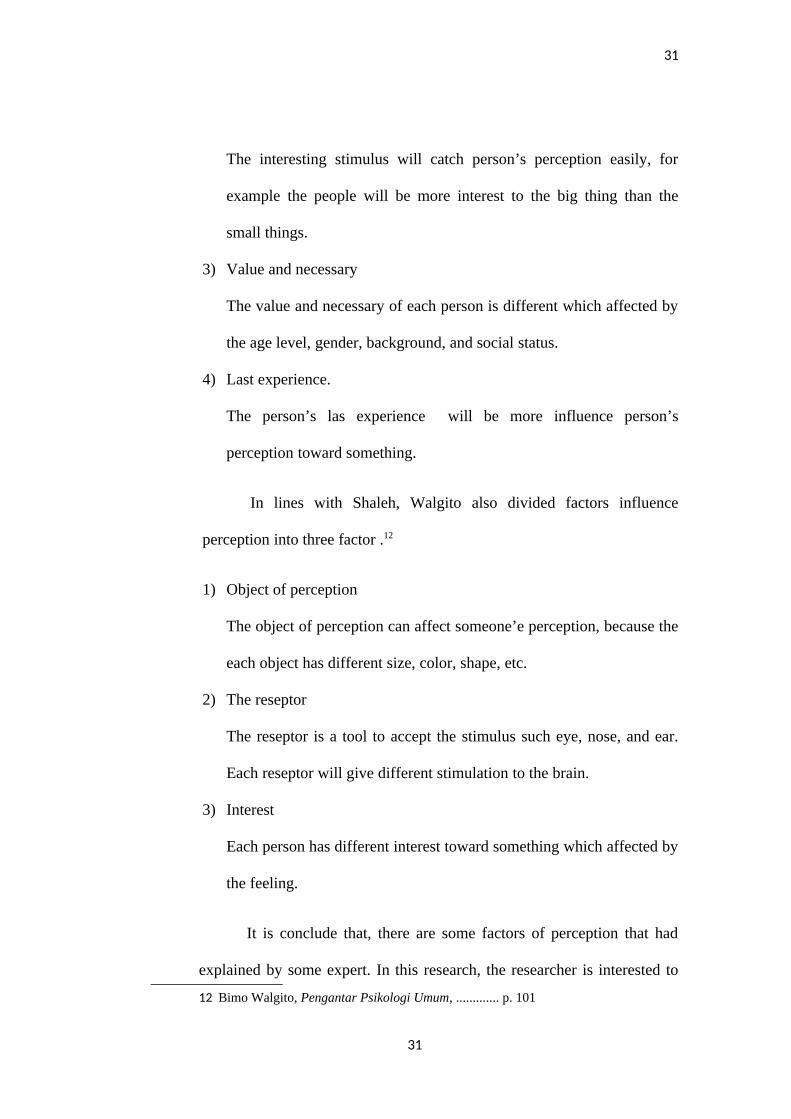
From the explanations above, its can be seen that there are three
factors of perception they are the perceiver, the situation, and the target of
perception. Furthemore, Shaleh said there are some factors that influence
someone’s perception, those are:11
1) Selective intention
It is how the people can focus on certain stimulus. So, the the another
stimulus will not appear as the object of perception.
2) Stimulus characteristics
11 Abdul Rahman Shaleh, Psikologi Suatu Pengantar dalam Perspektive Islam, (Jakarta:Kencana, 2008). P.128-129
30
31
The interesting stimulus will catch person’s perception easily, for
example the people will be more interest to the big thing than the
small things.
3) Value and necessary
The value and necessary of each person is different which affected by
the age level, gender, background, and social status.
4) Last experience.
The person’s las experience will be more influence person’s
perception toward something.
In lines with Shaleh, Walgito also divided factors influence
perception into three factor .12
1) Object of perception
The object of perception can affect someone’e perception, because the
each object has different size, color, shape, etc.
2) The reseptor
The reseptor is a tool to accept the stimulus such eye, nose, and ear.
Each reseptor will give different stimulation to the brain.
3) Interest
Each person has different interest toward something which affected by
the feeling.
It is conclude that, there are some factors of perception that had
explained by some expert. In this research, the researcher is interested to
12 Bimo Walgito, Pengantar Psikologi Umum, ............. p. 101
31
32
the Robbins’s factors perceptions because his explanations are more
complext than the another expert and has include the another expert
theory.
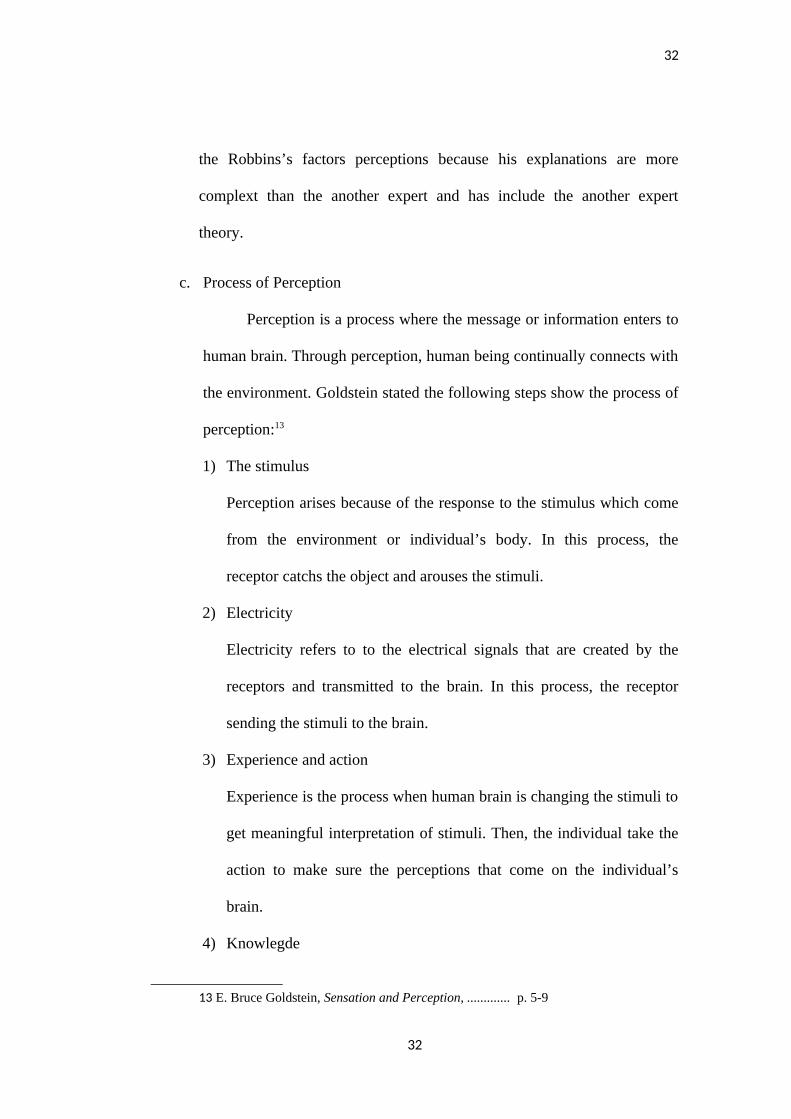
c. Process of Perception
Perception is a process where the message or information enters to
human brain. Through perception, human being continually connects with
the environment. Goldstein stated the following steps show the process of
perception:13
1) The stimulus
Perception arises because of the response to the stimulus which come
from the environment or individual’s body. In this process, the
receptor catchs the object and arouses the stimuli.
2) Electricity
Electricity refers to to the electrical signals that are created by the
receptors and transmitted to the brain. In this process, the receptor
sending the stimuli to the brain.
3) Experience and action
Experience is the process when human brain is changing the stimuli to
get meaningful interpretation of stimuli. Then, the individual take the
action to make sure the perceptions that come on the individual’s
brain.
4) Knowlegde
13 E. Bruce Goldstein, Sensation and Perception, ............. p. 5-9
32
33
Knowlegde refers to the knowlegde that the individual brings to the
perceptual situation.
Furthermore, Alizamar and Nasbahry also stated the following
steps of perception, they are:14
1) Selection of stimulus
Perception is started from the sense of organ. This process is related to
the acceptance of message or information from environments using
five sense. Those are vision, hearing, taste, smell, and touch. Alizamar
and Nasbahry in their book said, “ the main receptor that used by the
human in learning are vision and hearing.”15 It means that, vision and
hearing is the important receptor that used by human in learning
process. When selections the stimuli, each individual will have
different experience toward the object because they are influenced by
dimension of the sense. Alizamar and Nasbahry said there are four
dimension sense of organ:16
a) Intensity means the weak and powerful the sense of organ
toward the stimulations. For example individual can distinguish
the powerful and the weak of light.
b) Ekstensity means the total comprehension toward the
stimulations related to the thick or thin, much or little, wide or
narrow, and big or small the object of sense.
14 Alizamar and Nasbahry Couto. Psikologi Persepsi &Desain Informasi . (Yogyakarta:Media Akademi, 2016). P. 128-129
15 Ibid. P. 3416 Ibid. P. 42
33
34
c) Time means the duration of the sense.
d) Quality means the quality of the stimulus such as clear or not
clear of the sounds of the stimulus.
2) Organization
The stimulus will be transeferred by nerve to brain. Then it will be
processed by brain. In this process, human being recognizes the
stimulus. This process is consist of the emotions such as happy, sad,
curious, grateful, atc and response in the human body like smiling,
crying, and raising the beat of the heart.
3) Interpretation
Stimulus entering into the brain will be interprated, construed, and
given meaning through a complicated process. In this process, brain
interprates the stimulus and makes the comprehension.This process is
influenced by experience, knowledge, motivation, and personality of
the individual.
4) Retention
This process means how the individual feeling, processing, saving,
and responding the information. After the individual gets the
comprehension, he or she will make the reaction and action toward the
object of perception.
34
35
From explanation above it can be conclude that the process of
perception is started from the selection of stimuli that the person get from
the environment and the body through sense of organ, then the nervous
system send the stimulus to the brain which called organization, after that
the individual understanding the information that he or she gets then
makes the actions.
d. Aspects of Perception
There are three aspects of perception they are: cognitive, affective,
and conative aspect. Walgito states that perception consist of three
aspects:17
1) Cognitive aspect or perceptual aspect
Cognitive aspect related to knowledge, opinion, belief, that is good
things that relate how someone’s perception toward attitude object.
2) Affective or emotional aspect
This aspect related to like or dislike toward attitude’s object. Like for
positive thing, while dislike for negative thing. This component
indicates attitude’s direction, positive and negative.
3) Conative or action aspect
17 Ibid. p. 98
35
36
This aspect related to action tendency toward attitude’s object. This
component indicates big or small action tendency of someone toward
attitude’s object.
Furthermore, Allport in Dena said there are three aspects of
perception, they are:18
1) Cognitive aspect
This aspect related to the knowledge or information that someone’s
has toward the object of perception.
2) Affective aspect
This aspect related to how someone’s feel toward the object. He may
like or dislike the object.
3) Conative aspect
This aspect related to the preparation that someone’s act toward the
object of perception.
In conclusion, there are some aspects related with perception. It
can be understood that perception also consist of cognitive which related
to knowledge, affective related to the feeling , and conative aspect related
to the action. Therefore, there is internal process between three aspect
above in having perception about an object or even.
18 Dena Yudiapasa Mulyono, Perception and Interest in English Teaching as Profession. 2017. Teacher Training and Education Faculty. Muhammadiyah University of Purwokerto. p.7
36
37
e. Principles of Perception
In understanding perception, it will be more advisable to find out
the principles of perception itself. By knowing them, people will know
how the perception looks like.
Slameto divided the principles of perception become five points:19
1) Perception is relative not absolut
This principle means that, humans’ nature not be able to
predict something correctly, they are just be aable to gues something
relatively.
2) Perception is selective
The stimulations which are received will depend on to
something that he or she learned. Something that attract his or her
interest will directing the perception.
3) Perception has its arrangement
People received stimulation not by doing things. They will
receive it by forming of relations or groups. If the stimulations which
comes is not complete, they will complete the stimulus by analyzing
it.
19 Slameto, Belajar dan Faktor-Faktor yang Mempengaruhinya, ............ .p. 102-105
37
38
4) Perception is influenced by hope and readiness
This princilpe meas hope and readiness of the receiver will
determine which message will be chosen to be received., how the
message will be arranged and how that message will be interpreted.
5) Someone’s perception or group’s perceeption can be so different with
other’s perception even if the situations are same.
The perception of a person or group can be different with
another person even though the situation is similar. Everyone has a
different side to interpret the information which they get it is
influenced by differentiation of personality, motivation, and attitude.
Based on the explanation above, it can be concluded that
perception is relative rather than absolut, selective, has its arrangement,
influenced by hope and readiness, and someone’s perception with
another one is different.
2. Nature of Writing
a. Definition of writing
Writing is one of the ways used by the people communicate or to
express the idea to other people when impossible to communicate orally.
Raimes states “Writing is a skill in which we express the ideas, feelings,
and thoughts arranged in words, sentences and paragraphs using eyes,
38
39
brain, and hand.”20 It means that, writing is a skill is an activity to express
ideas and informations to communicate.
Writing is actually a developmental process. Students try to
express their views or ideas in the best writing with teachers’ guidance.
Teachers have to provide students with the space to make their own
meanings within a positive and a cooperative environment.
b. Process of writing
Writing involves a number of activities; setting goal, generating
ideas, organizing information, selecting appropriate language, making a
draft, reading and revising it, then editing. Writing process as mention
above is a complicated activity not only needs language skill but also
creativity to arrange a set of words, sentences become a readable text.
When the writer wants to producing a text, he or she must to follow
some steps which help to write a text become easier. According to
Harmer states that proces of writing has four main elements. Those are
planning, drafting, editing, and final version.21
1) Planning
Before starting to write down on paper, a writer needs to decide what
to write. The writer have to choose a topic, gathering ideas, and
organizing the writing. That is why the plan must be set up first.
20 Imelda, HasanBasri., et. Al., (2014). “Improving the ability in writng descriptve teet through guided-questons technique”. e-Journal of English Language Teaching Society (ELTS) Vol. 2 No. 1 2014 – ISSN 2331-1841,p. 2
21 Jeremy Harmer. How to Teach Writing. (England: Person Education Ltd. 2004). P. 4
39
40
During the moment of making plan, there are three main points
which must be keep on writer’s mind:
a) A writer must determine the purpose of writing, which can
influence on what types of text want to make, what language
want to use, and what information is going to deliver.
b) Consider who the audiences are. This will influence not only the
shape of the writing, but also the choice of language.
c) The content structure, that is how best of sequence the fact,
ideas, or arguments which the writer include.
2) Drafting
It is the first version of a piece of writing which usually called a draft
as it will be going through editing steps. The draft can be considered
as the raw writing which is needed to be fixed and revised before the
final product is completed.
3) Editing
After the first draft, a writer needs to reread his work to see which
one is working, which one is not and also to see some parts which
are not grammatically accurate or some words which have to be
changed to make clearer meaning because some of writers may
create ambiguity and confusion on the audience
4) Final report
40

41
After the writer edits the draft, making changes the reader being
necessary, the writer produced the final version. This may look
considerably different from both the original plan and the first draft,
because things have changed in the editing process. But the writer is
now ready to send the written text to its intended audience.
Furthermore, Oshima and Hogue divided the process of writing into
several steps, they are:22
1) Prewriting
There are two crucial activities which have to be done in prewriting
those are;
a) Choosing and narrowing a topic. In prewriting activity the writer
just thinkgs the topics, choose one of it and narrowing the topic
be a specific one.
b) Brainstorming. After the writer has chosen a topic and narrowing
it to a specific focus, the next prewriting step is to generate ideas.
2) Planning (outlining)
In this step, the writer makes specific topic that chosen on generalist
which support the topic being a paragraph. There two steps that
should the writer does in this step:
a) Making sublist, the writer divides the ideas in the list and make
the sublist and choose any ideas that aren’t use.
22 Alice Hoshima and Ann Hogue. Writing Academic English Third Edition. (New York:Longman. 1999) p. 3-12
41
42
b) Writing the topic sentence, after making the sublist then the
writer make the topic sentence. The topic sentence is the most
general sentence in a paragraph and it expresses the central focus
of the paragraph.
c) Outlining, then the writer write down the main points and
subpoints.
3) Writing and Revising Drafts
There are three activities in this step, they are:
a) Writing the first rough draft, in this activity the writer start to
write a rough draft from the outline, write down the topic
sentence and write the paragraph by following the outline.
b) Revising content and organization, in this activity the writer
needs to check the organization of the paragraph and look at the
ideas. The student also can get respond or comments by others
such as additional information to make the written form more
clearly and grammatical correction from others.
c) Writing the final copy, it means after revising the writer rewrites
the writing form more perfect.
From two kinds process of writing above, the researcher is agree
with the process by Oshima and Hogue because it is more clear where
there are three stages in writing process those are; the first stage is
prewriting consist of choosing and narrowing the topic and
brainstorming, the second stage is planning (outlining) consist of making
42
43
sublist, writing the topic sentence, and outlining, and the third is writing
and revising drafts consist of writing the first rough draft, revising
content and organization, and writing the final copy.
3. Nature of Recount Text
a. Definition of recount text
The term “recount” is quite familiar. This term is based on
everyday language in many aspects, such as education. Recount text is
one of the text types which are taught at Junior High School. Recount text
is a text which retells events or experience in the past. Grace in Dian said,
“ Recount text is a text that tells the reader or listener what happen in the
past through a sequence of events.”23 The social function of the recount
text is to inform the readers about past events in chronological order
Hyland in Etri said, ”Recount is a kind of genre that has social function to
retell event for the purpose of informing and entertaining.”24 And the
purpose of recount text is to inform or to entertain the audience Knapp in
Natanel said, “ Recount text, basically it is written out to make a report
about an experience of a series of related event.” 25 It means that recount
text is kind of text which has the purpose to tell past event.
23 Dian Sukma, A Study on Writing Recount Text, Journal of English Education Vol 1No. 1 June 2015, University of Pasir Pangaraian.. p. 66
24 Etri Hidayati, et.al. Improving Students’ Writing Skill in Recount Text by UsingPersonal Letter at Eight Grade of SMP Tiga Hati. Article. 10 February 2015. English StudyProgram, Faculty of Teacher Training and Education, University of Pasir Pengaraian.p. 2
25 Natanael Saragih., et. Al., The Effectiveness of Using Recount Text to Improve WritingSkill for Grade III Students of Kalam Kudus Elementary School 2 Pematangsiantar, InternationalJournal of Humanities and Social Science Vol 19 No. 1 Ver. XII Feb 2004, Faculty of CultureStudies University of Sumatera Utara.. P 57
43

44
From some definitions of recount text above, it is clear that recount
text is a kind of text that has social function to retell event for the purpose
of informing or entertaining. This text tells about something that happened
in the past. The details in a recount can include what happened and why
something occured. A writer or speaker uses a recount to tell about a story
or an event. .
b. Generic Structure of Recount Text
Generic structure or rethorical structure is a package of events in a
text. This generic structure will explain how the stages move through to
attain the purpose. Every genre has its generic structure, so do the recount
text. According to Pardiyono, there are three generic structures of recount
tex26.
1) Orientation: provides the setting and produces participant. It is
provides information about who, where, and when.
2) Record of events: tell what happened, present even in temporal
sequence. It is usually recounted in chronological order.
3) Re-orientation: it is rounds off the sequence of events.
In line with Pardiyono, Boardman in Natanel stated that the steps
for constructing of written recount text are:27
26 Pardiyono, Pasti Bisa!! Teaching Genre-Based Writing, (Yogyakarta: Andi offset,2007).p. 63
27 Natanael Saragih., et. Al., The Effectiveness of Using Recount Text to Improve WritingSkill for Grade III Students of Kalam Kudus Elementary School 2 Pematangsiantar, ........... .p.58
44
45
1) The first paragraph that give background information about who,
what, where, and when. It is called on orientation.
2) A record of events usually recounted in chronological order, named;
event 1, event 2, event 3.
3) A personal comment and or evaluative remarks, which are interspered
throughout the record of events named evaluation.
4) A reorientation which “reounds off” the sequence of events or retell
about what happened in the end.
In conclude, the generic structures of the recount text are
organized from the orientation with the contents about the general
information of setting, character, place and time. Then, it is followed by
the events describing the series of events. In the last, it presents the close
of the events called re-orientation.
c. The Grammatical Features of Recount Text
Hyland in Etri explains the grammatical features of recount text are:28
1) Use of nouns and pronouns to identify people, animals, things
involved.
2) Use actions verbs to refers to events
3) Use of past tense to locate events in relation to speaker’s or writer’s
time.
28 Etri Hidayati, et.al. Improving Students’ Writing Skill in Recount Text by UsingPersonal Letter at Eight Grade of SMP Tiga Hati, ............. p. 2
45
46
4) Use of conjunctions and time connectives to sequence of events.
5) Use of adverb and adverbial phrase to indicate place and time.
6) Use of adjective to describe nouns.
It can be seen that there are some grammatical features that used
in recount text, they are: nouns and pronouns, action verbs, past tense,
conjunctions, adverb and adverbial phrases, and adjective.
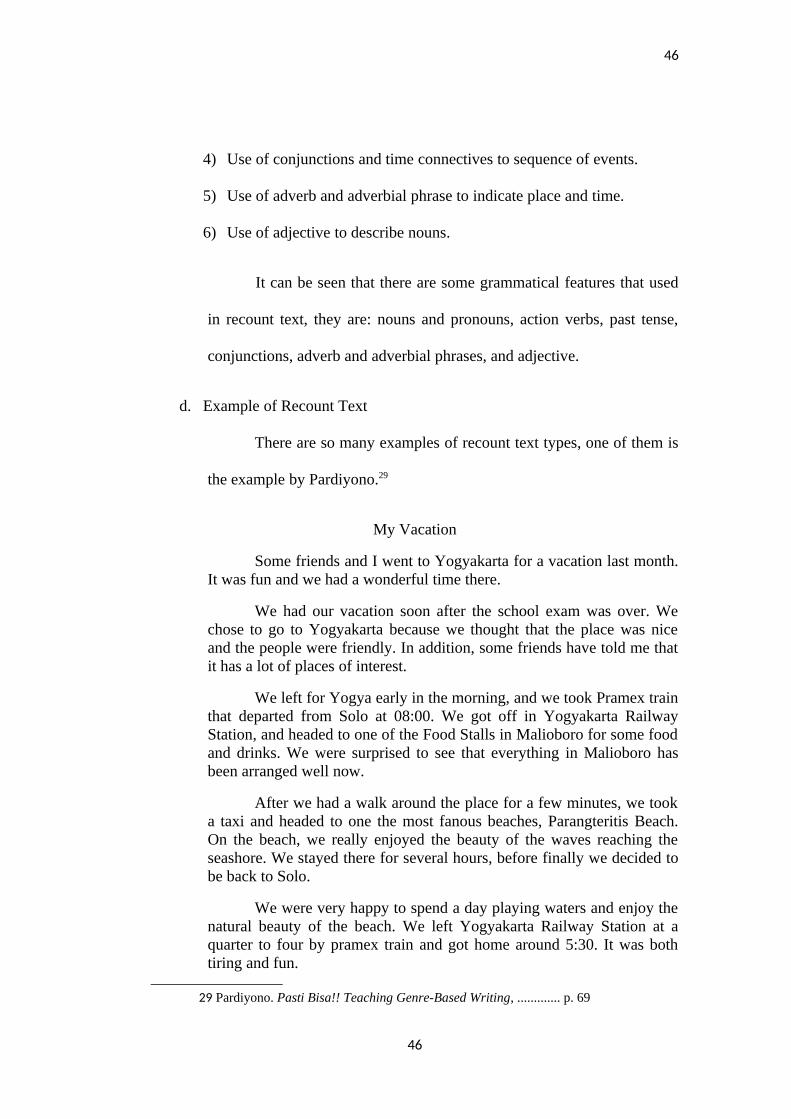
d. Example of Recount Text
There are so many examples of recount text types, one of them is
the example by Pardiyono.29
My Vacation
Some friends and I went to Yogyakarta for a vacation last month.It was fun and we had a wonderful time there.
We had our vacation soon after the school exam was over. Wechose to go to Yogyakarta because we thought that the place was niceand the people were friendly. In addition, some friends have told me thatit has a lot of places of interest.
We left for Yogya early in the morning, and we took Pramex trainthat departed from Solo at 08:00. We got off in Yogyakarta RailwayStation, and headed to one of the Food Stalls in Malioboro for some foodand drinks. We were surprised to see that everything in Malioboro hasbeen arranged well now.
After we had a walk around the place for a few minutes, we tooka taxi and headed to one the most fanous beaches, Parangteritis Beach.On the beach, we really enjoyed the beauty of the waves reaching theseashore. We stayed there for several hours, before finally we decided tobe back to Solo.
We were very happy to spend a day playing waters and enjoy thenatural beauty of the beach. We left Yogyakarta Railway Station at aquarter to four by pramex train and got home around 5:30. It was bothtiring and fun.
29 Pardiyono. Pasti Bisa!! Teaching Genre-Based Writing, ............. p. 69
46
47
From the text above it can be seen that, the first paragraph of the text
above is an orientation part. The second until fourth paragraph are record of
events part and the last paragraph is re-orientation part.
4. Nature of Feedback
a. Definition of Feedback
Feedback is given by teachers after students’ performance in
learning or doing task. According to Ur, feedback is information that is
given to the learner about his or her performance of a learning task,
usually with the objective of improving his performance.30 It means
feedback has function as improving students performance in learning
process.
In second language learning, feedback is focussed on almost all
aspects of language elements and language skill such as grammar,
vocabulary, speaking, and writing. According to Lightbown and Spada, “
Feedback refers to any indications to the learners that their target
language used is incorrect, which includes various responses that the
learners receive.”31 Furthemore Hyland said, “ Feedback has a crucial role
in opening and mataining a dialogue between tutors and students and also
serves as an important function in motivating and encouraging students.”32
It is clear that, feedback is information or comments that is given by the
30 Ellis Rod, Corrective feeedback and Teacher Development, L2 Journal Vol 1. 2009,Shanghai International Studies and University of Auckland p. 4
31 Pramela Krish, The Power of Feedback in An Online Learning Environment, 3LJournal of Language Teaching, Linguistics and Literature, Vol 12. p. 96
32 Ibid., p. 96
47
48
teacher to students after they do performance or task in learning to
improve their performance.
b. The purposes of feedback
Before providing feedback, the teacher have to identifying the
purposes why he or she wants to give feedback to the students. It is
important, because by determined the purposes in giving feedback can
help the teacher to consider the kinds of feedback that will give to the
students.
Carolin said there are some purposes for providing feedback to the
students:33
1) To support students’ writing development. Where the purpose of the
teacher gives feedback to the students may to improve the students’
skill in writing.
2) To teach or reinforce a particular aspect of disciplinary content. The
teacher purpose in giving feedback is to make the students understand
about specific material.
3) To teach specific academic writing conventions. The teacher may give
feedback to give specific material to the students.
4) To indicate strengths and weaknesses of piece of writing (perhaps in
relation to a set of criteria).
5) To explain or justify a grade.
6) To suggest how a student may improve in their next piece of writing.
33 Carolin Coffin., et. Al.,Teaching Academic Writing, ( London: Routlrdge.2003). p.104
48
49
When giving feedback to the students, the teacher may combined
different purposes for example, the teacher gives feedback with the
purposes to justify a grade and to teach students. So, the teacher can give
feedback with some purposes which appropriate with the students’ need.
Furthermore, Lewis in Wahyu said there are some purposes of
feedback which given in the language classes.34
1) Feedback provides information for teacher and students
For the teacher, feedback can give information about the students and
feedback can also be an evaluation for his own teaching. For the
students, feedback can give infprmation about their grade and
knowing their weakness and strengths.
2) Feedback can provides students with advice about learning
It means that teacher can provide students with more than simply
description of their language use.
3) Feedback provides students with language input
By giving feedback the students can learn about new language and
vocabulary which can improve their knowledge in second language.
4) Feedback is form of motivation
Feedback can be more motivating than marks or grades. Feedback can
give the students to improve their skill in learning and encourage them
to study.
34 Wahyu Dewi Pratiwi. Students’ Perception Towards Teacher’s Written FeedbackAmong 11th Grade Students at SMA N 1 Wedi Klaten. published. 2013. English Education StudyProgram, Faculty of language and Arts, State University of Yogyakarta.p. 17-18
49
50
5) Feedback can lead students toward autonomy
By providing feedback, the students can learn to find their own
mistakes which can make them become an independent students.
From explanation above the researcher is agree with the purposes
of providing feedback by Lewis because it is more complete.
c. Source of feedback
There are many sources of feedback. However, there are three
source of feedback that are commonly used in teaching and learning
process, they are teacher’s feedback, peer feedback, and self feedback.
1) Teacher’s feedback
Teacher feedback can be written or spoken. Lewis in Marta
stated, “ teacher has been the main source of feedback both on oral
and written language in many classes.”35 It means, giving feedback on
students’ writing assignment is one of teachers’ important roles in
learning process. Teacher gives comments or responses on students’
activity. Teacher also gives suggestion in order to improve students’
writing competency. Spoken feedback is usually given when students
are just completing their speaking sctivities. Meanwhile written
feedback is usually given on the students’ assigment after submitting
their work. Teacher gives immediate comments or suggestions to
students after the work done.
35 Marta Agustina Sri Wulandari, Students’ Responses to Teacher Written Feedback onTheir Compositions, 2007. Faculty of Teachers Training and Education. Sanata DharmaUniversity. Yogyakarta. p. 16
50
51
2) Peer feedback
Students also can give feedback each other after or during
students’ writing activity. Liu and Hansen in Marta said, “ Peer
feedback is the use of learners or peers as sources of information and
interacting for each others in such a way that learners themselve take
roles or responsibilities which are normally taken and done by
teachers or trained tutors in commenting or criticizing their own
writings or drafts in the process of writing.”36 it means that, the
students give comments on the other students’ performances in order
to give critics and suggestions. Students who receive feedback from
peer can improve their writing ability.
3) Self feedback
Teacher can also ask students to evaluate their own in writing
which calls self feedback. Penaflorida in Marta said, “ in self
feedback, the students can correct and evaluate their own work. It is a
step toward learner autonomy because by giving students chance to
analyze their own work and practise self feedback may encourage
them to be self sufficient and independent students.”37 It means that in
self feedback the students can eavaluate their self, they are also
expected to know the stregnth and the weaknesses of their own
writing.
36 Ibid. p.1637 Ibid. p. 16
51
52
In conclusion, there are there sources of feedback which common
used by the teacher in learning process they are teacher’ feedback, peer
feedback, and self feedback.
d. Forms of feedback
There are so many forms of feedback that can the teacher choose
in giving feedback to the students. Carolin said there are three forms of
giving feedback to the students:38
1) Commenting on students’ writing
This is a form of giving feedback where the teacher gives
some comments on students’ writing text such as the teacher gives
comments about grammar errors, speallings, content, etc. This is
important to help the students identify errors in their own writing and
also to consider why such errors may be being made.
2) Individual and group feedback
In this types, the teacher gives the individual or group
feedback to the students. Individual feedback focussing on issues that
are specific to a particular students’ work. Meanwhile, group feedback
is giving a set general comments to the students’ which have same
mistakes. Group feedback may save time by avoiding repetition of
similar points in individual feedback.
38 Carolin Coffin., et. Al.,Teaching Academic Writing, ............. p. 105-112
52
53
3) The use of spoken feedback
In this type of feedback, the teacher apply a face to face
discussion. The discussion can facilitates certain kinds of feedback
which can limit of time and helps the students to understand the
mistake on their written.
Furthermore, Cohen in Wahyu proposes two forms of feedback,
they are:39
1) Oral feedback
Oral feedback is a form of feedback where the teacher and students do
a personal consultation to discuss about the students’ performance.
2) Written feedback
Written feedback is a from of feedback where the teacher gives some
comments, corrections, or mark on the students’ written work. Further
more, Park in Razlina and Rohaiza said that there are three types of
teacher’s written feedback, they are:
a) Form-focus feedback which focus on grammar correction such as
grammar, spelling, vocabulary choice, and punctuation.
b) Content based feedback which focus on the quality and
organizational of the content.
39 Wahyu Dewi Pratiwi. Students’ Perception Towards Teacher’s Written Feedback Among 11th Grade Students at SMA N 1 Wedi Klaten ............. p. 18-19
53
54
c) Integrated feedback which is combination of form focus feedback
with content related feedback.40
In conclusion, there are three forms of feedback that can the
teachers choose in providing feedback to the studens they are: individual
and group feedback which the teacher make a discussion with the
students which have some mistakes and gives feedback to the individual
of students to focussing on specific particular students’ work and the last
is use of oral feedback where the teacher and student doing some
discussion about students’ performance and wrritten feedback where the
teacher gives some comments on students’ written text. written feedback
has three types; form-focus feedback, content based feedback, and
integrated feedback.
In this research the researcher will focuse on the teacher’s written
feedback in students’ writing Recount text experience, because it is
related with the purpose of this research.
B. Review of The relevant Studies
The researcher has found some previous studies about students’
perception. First thesis was written by Kasmiwati 2015 in IAIN Bukittinggi,
entitled “Students Perception toward Lectures’ Ways in Giving Feedback in
Speaking Performance at the Fourth Semester English Education Departement
40 Razlina Razali and Rohaiza Jupri. Exploring Teacher Written Feedback and StudentRevision on ESL Students’ Writing. IOSR Journal of Humanities and Social Science (IOSR-JHSS), Vol 9. Issue 5. Ver. V (May 2014). p. 64
54
55
Students of IAIN Bukittinggi in Academic Year 2014/2015”. This research is a
quantitative research with descriptive technique. The population of this research
was students at the fourth semester in IAIN Bukittinggi. The technique of data
collection in this research is the questionnaire.
The result of the research showed some categories of students’ perceptions
toward lectures ways in giving feedback in speaking performance. Students’
perception toward lecture’s ways in giving feedback on form is moderate with
mean percentage 47,50%. Students’ perception toward lecture’s ways in giving
feedback during accuracy work is good with mean percentage 49,56%. Students’
perception toward lecture’s ways in giving feedback during fluency work is good
with mean percentage 62,45%. So, the highest perception given by the students
toward lecture’s ways in giving feedback in speaking during fluency work with
positive perception.41
The second study was conducted by Galih Kusumastuti 2013 in Sanata
Dharma University entitle “ Students’ Perception of The Use of English as A
Medium of Instruction in RSBI at SMP Negeri 2 Magelang.” The researcher has
two problems in this research: (1) how is English as a medium of instruction
implemented in RSBI? and (2) what are students’ perceptions on the use of
English as a medium of instruction in RSBI?. The researcher used survey research
to find those questions. The researcher used three instruments to collect the data.
The researcher conducted observations in Biology, Mathematics, and Physics
41 Kasmiwati, Students Perception toward Lectures’ Ways in Giving Feedback inSpeaking Performance at the Fourth Semester English Education Departement Students of IAINBukittinggi in Academic Year 2014/2015, 2015. Unpublish. Faculty of Tarbiyah and TeacherTraining, University State Islamic Institute of Bukittinggi. Bukittinggi
55
56
Class to observe the implementation of English as a medium of instruction in
RSBI. The researcher distributed questionnaire and conducted interview to the
eight-grade students of RSBI at SMP Negeri 2 Magelang to get the students’
perception on the use of English as a medium of instruction on RSBI.
The result of the research showed that the implementation on the use of
English as a medium of instruction in RSBI at SMP negeri 2 Magelang was good
but should be improved. The result of the observation showed that the teachers
and students used English in the learning process although still dominant used
Bahasa Indonesia. The texbook of Mathematics, Physics, Biology and ICT
subjects were in English. The students’ perception on the language used in class is
low with the mean percentage 18%. Students’ perception on the effect of using
English as a medium of instruction in RSBI is good with mean percentage
49,33%. Students’ interest an participation on the use of English as a medium of
instruction in RSBI is low with mean percentage 20,25%. Students’ competence
on the use of English as a medium of instruction in RSBI is good with mean
percentage 46,5%. In conclusion, the students had positive perception on the
effect of using English as a medium of instruction in RSBI.42
In this research, the researcher wants to discover the students’ perceptions
on their writing recount text experience in MTsN 6 Agam. The researcher also
wants to know about the students’ perceptions toward teacher’s feedback. the
similarities this research with the previous research is the researcher also wants to
42 Galih Kusumastuti, Students’ Perception on The Use of English as A Medium ofInstruction in RSBI at SMP Negeri 2 Magelang, 2013. Faculty of Teacher Training andEducation, Sanata Dharma University. Yogyakarta
56
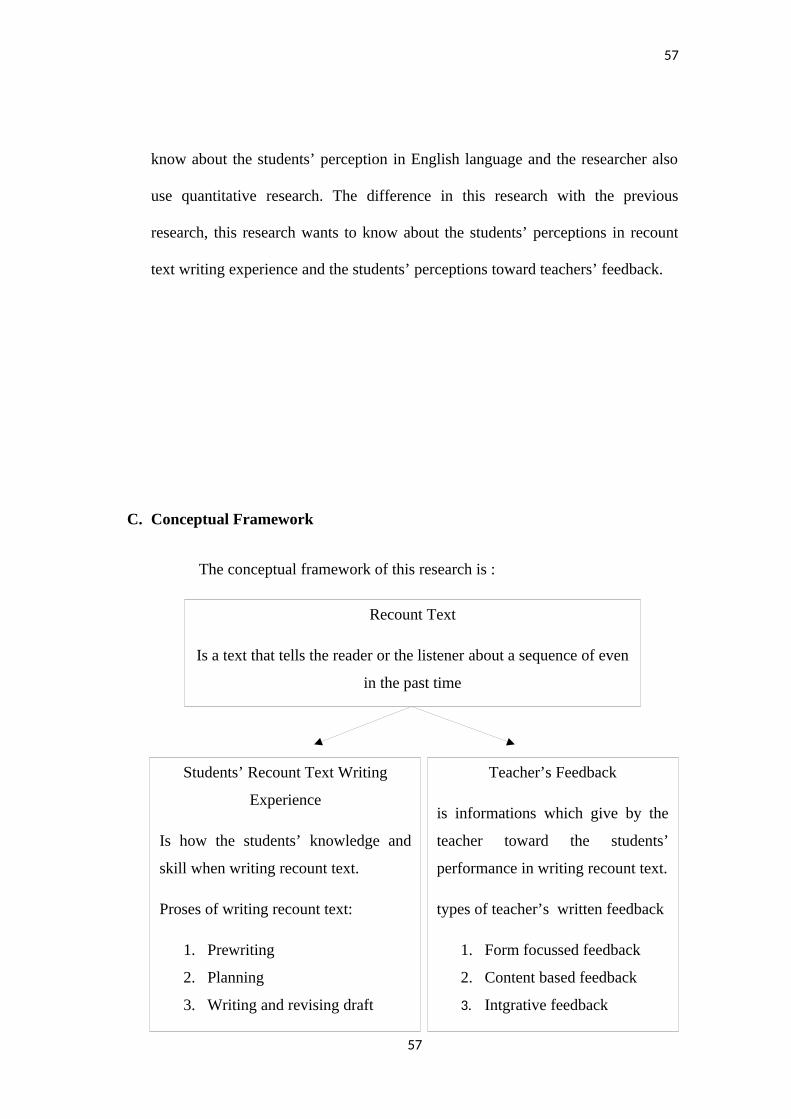
57
know about the students’ perception in English language and the researcher also
use quantitative research. The difference in this research with the previous
research, this research wants to know about the students’ perceptions in recount
text writing experience and the students’ perceptions toward teachers’ feedback.
C. Conceptual Framework
The conceptual framework of this research is :
57
Students’ Recount Text Writing
Experience
Is how the students’ knowledge and
skill when writing recount text.
Proses of writing recount text:
1. Prewriting
2. Planning
3. Writing and revising draft
Teacher’s Feedback
is informations which give by the
teacher toward the students’
performance in writing recount text.
types of teacher’s written feedback
1. Form focussed feedback
2. Content based feedback
3. Intgrative feedback
Recount Text
Is a text that tells the reader or the listener about a sequence of even
in the past time
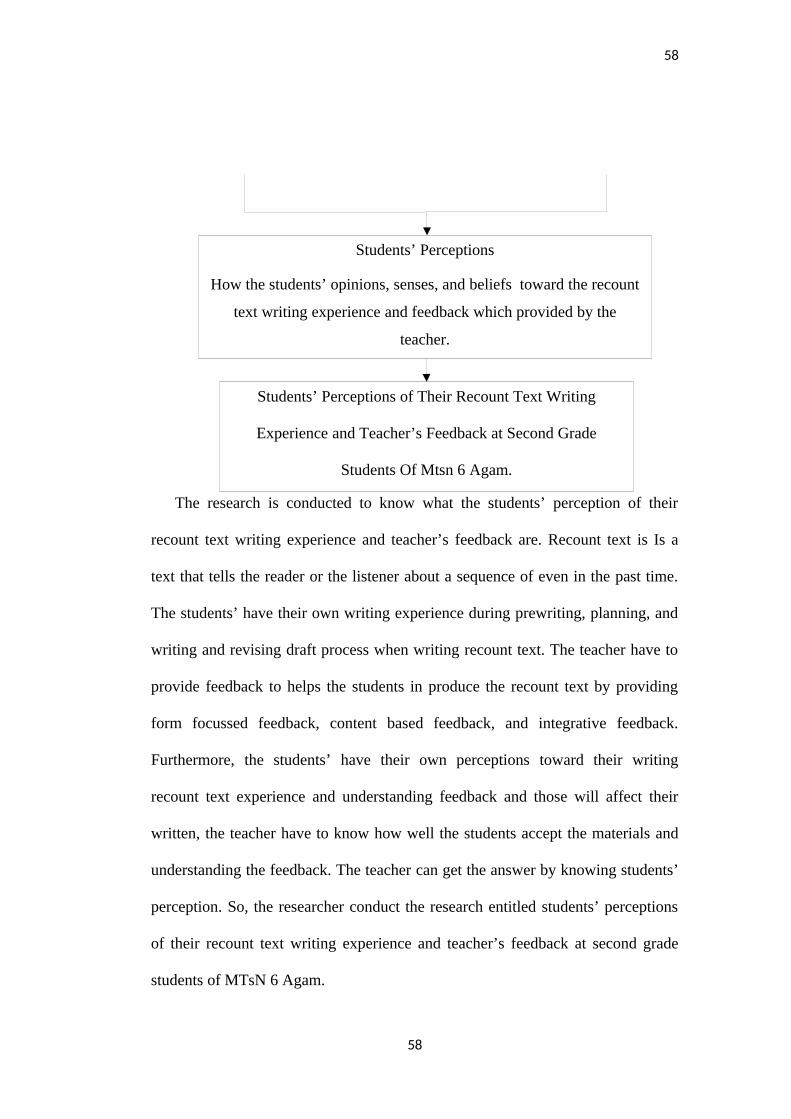
58
The research is conducted to know what the students’ perception of their
recount text writing experience and teacher’s feedback are. Recount text is Is a
text that tells the reader or the listener about a sequence of even in the past time.
The students’ have their own writing experience during prewriting, planning, and
writing and revising draft process when writing recount text. The teacher have to
provide feedback to helps the students in produce the recount text by providing
form focussed feedback, content based feedback, and integrative feedback.
Furthermore, the students’ have their own perceptions toward their writing
recount text experience and understanding feedback and those will affect their
written, the teacher have to know how well the students accept the materials and
understanding the feedback. The teacher can get the answer by knowing students’
perception. So, the researcher conduct the research entitled students’ perceptions
of their recount text writing experience and teacher’s feedback at second grade
students of MTsN 6 Agam.
58
Students’ Perceptions of Their Recount Text Writing
Experience and Teacher’s Feedback at Second Grade
Students Of Mtsn 6 Agam.
Students’ Perceptions
How the students’ opinions, senses, and beliefs toward the recount
text writing experience and feedback which provided by the
teacher.

59
CHAPTER III
RESEARCH METHOD
A. Design of The Research
This research was a descriptive quantitatvie research. Gay stated,
“ Quantitative research is the collection and analysis of numeral data to describe,
explain, predict, or control phenomena of interest.”43 It means that, quantitative
research was a research which dealing with numbers in analysing the
phenomenon.
Furthermore Gay also said, descriptive research involved collecting data in
order to test hypothesis or to answer questions concerning the current status of the
subject of the study.44 Descriptive research was a research which used to describe
43 L. R. Gay, Educational Research: Competencies for Analysis and Application, 6thed, (New York: Prentice-Hall,2000), p. 7
44 Ibid. p. 276
59
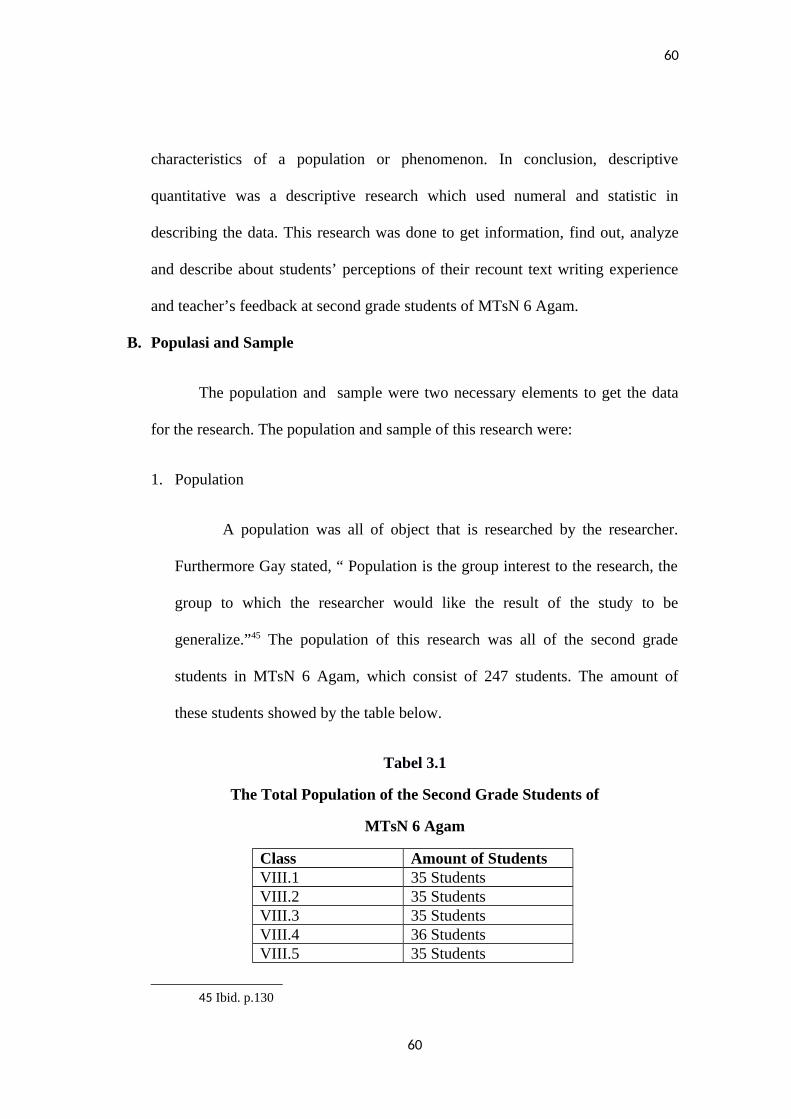
60
characteristics of a population or phenomenon. In conclusion, descriptive
quantitative was a descriptive research which used numeral and statistic in
describing the data. This research was done to get information, find out, analyze
and describe about students’ perceptions of their recount text writing experience
and teacher’s feedback at second grade students of MTsN 6 Agam.
B. Populasi and Sample
The population and sample were two necessary elements to get the data
for the research. The population and sample of this research were:
1. Population
A population was all of object that is researched by the researcher.
Furthermore Gay stated, “ Population is the group interest to the research, the
group to which the researcher would like the result of the study to be
generalize.”45 The population of this research was all of the second grade
students in MTsN 6 Agam, which consist of 247 students. The amount of
these students showed by the table below.
Tabel 3.1
The Total Population of the Second Grade Students of
MTsN 6 Agam
Class Amount of StudentsVIII.1 35 StudentsVIII.2 35 StudentsVIII.3 35 StudentsVIII.4 36 StudentsVIII.5 35 Students
45 Ibid. p.130
60
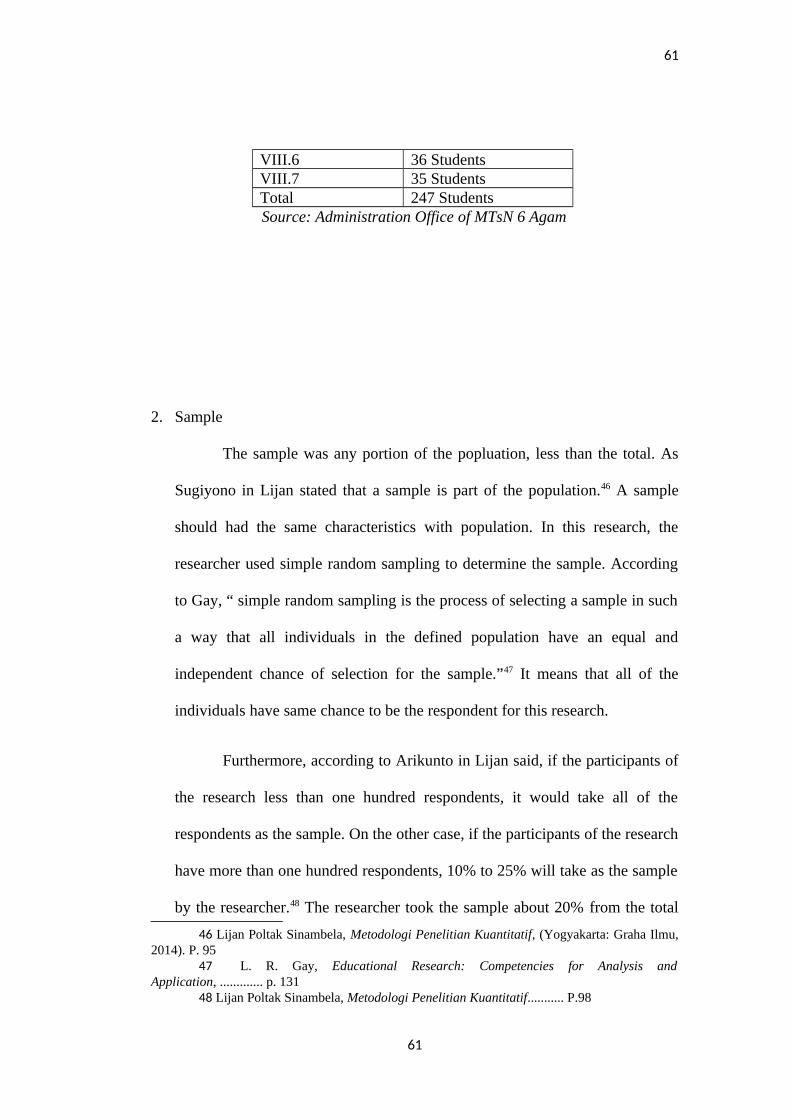
61
VIII.6 36 StudentsVIII.7 35 StudentsTotal 247 StudentsSource: Administration Office of MTsN 6 Agam
2. Sample
The sample was any portion of the popluation, less than the total. As
Sugiyono in Lijan stated that a sample is part of the population.46 A sample
should had the same characteristics with population. In this research, the
researcher used simple random sampling to determine the sample. According
to Gay, “ simple random sampling is the process of selecting a sample in such
a way that all individuals in the defined population have an equal and
independent chance of selection for the sample.”47 It means that all of the
individuals have same chance to be the respondent for this research.
Furthermore, according to Arikunto in Lijan said, if the participants of
the research less than one hundred respondents, it would take all of the
respondents as the sample. On the other case, if the participants of the research
have more than one hundred respondents, 10% to 25% will take as the sample
by the researcher.48 The researcher took the sample about 20% from the total
46 Lijan Poltak Sinambela, Metodologi Penelitian Kuantitatif, (Yogyakarta: Graha Ilmu,2014). P. 95
47 L. R. Gay, Educational Research: Competencies for Analysis andApplication, ............. p. 131
48 Lijan Poltak Sinambela, Metodologi Penelitian Kuantitatif........... P.98
61
62
of population and the total of the sample for this research was 49 students.
Because there were 7 classes the second grade students of MTsN 6 Agam, so
the researcher took 7 students from each classes. The researcher used lottery to
choose the respondent.
C. Research Instrument
Instrument was a tool which is used by the researcher to get the data.
In this research, the researcher used questionnaire as the instrument. Brown in
Mickey and Gass stated, “Questionnaires is any written instruments that
present respondents with a series of questions or statements to which they are
react either by writing out their answer or selecting them among existing
answer.”49 It means that questionnaire was an instrument by giving some
written questions with providing some alternative to respondent. In this
research, the researcher used questionnaire because it was an appropriate way
to collected the data related to the focus of the research and gave some
advantages for the researcher.
Moreover, there were some kinds of questionnaire; close, open,
combination close open, and open half questionnaire. Furthemore, Mickey and
Gass said that there are two types of questionnaire they are: closed and open
49 Mackey and Gass, Second Language Research: Methodology and Design, (NewJersey: Lawrence Erlbaum Associates, Inc, 2005), p. 92
62
63
ended questionnaire.50 In this research the researcher used close questionnaire.
As stated Mickey and Gass, “ A closed-item questions is one for which the
researcher determines the possible answer.”51 It means that, close
questionnaire was a kind of questionnaire which provided some possible
answers that could choosen by the respondents.
This research used check list () to answer the questionnaire. By
providing five answer, the respond in questionnaire used 5 points of Likert
Scale to measure perception. According to Gay, “Likert Scale requires an
individual respond to a series of statements.”52 Likert Scale was a tool where
the respondents were asked to indicate their respond related to the statements
which given by the researcher. In this research, the researcher used of strongly
agree, agree, moderate, disagree, and strongly disagree answer.
The questionnaire consisted of thirty two statements with nine
indicators for students’ writing recount text experience: choosing the topic,
narrowing the topic, generate the ideas, making sublist, writing the topic,
outlining, writing the first rough draft, revising content and organization, and
writing the final copy. And seven indicators for teacher’s feedback: grammar,
vocabulary choice, punctuation, spelling, quality of the content, organization
of content, and combination of correction and content related feedback. The
scores for each statements were: strongly agree= 5, agree= 4, moderate= 3,
50 Mickey and Gass, Second Language Research: Methodology and Design, ............ p.93
51 Ibid. p. 93 52 L. R Gay, Educational Research: Competencies for Analysis and Application, .............
p. 157
63
64
disagree= 2, and strongly disagree= 1. The questionnaire was translated to
indonesian in order to make the respondents easy to understand and answered
the questions and no time limits was set to answer the questionnaire.
Furthermore in term to make the questionnaire was valid, there were
some techniques that could be chosen by the researcher. They were content
validity, construct validity, concurrent validity, and predictive validity. In this
research, the researcher used content validity. As stated by Gay that content
validity is determined by expert judgement53. The questionnaire could be
valid if it measured accurately as what was intended to be measured. Gay also
said that a judgement of content validity is determined by expert.54 It means
that the researcher should did the validity to judge the questionnaire was valid
by consulting the content validity to the expert.
D. Technique of Data Collection
In collecting data, the researcher distributed the questionnaire to the
respondents of the research. It means that the researcher distributed the
questionnaire to the second grade students of MTsN 6 Agam with seven
classes as the sample which amount of sample was 49 students. Clearly, in
collecting the data the researcher follow the following steps:
a. Distributing the questionnaire to the sample (49 students).
b. Giving explanation to the students how to answer it and asking to read the
instruction first carefully.
53 Ibid. P. 16154 Ibid. p. 161
64
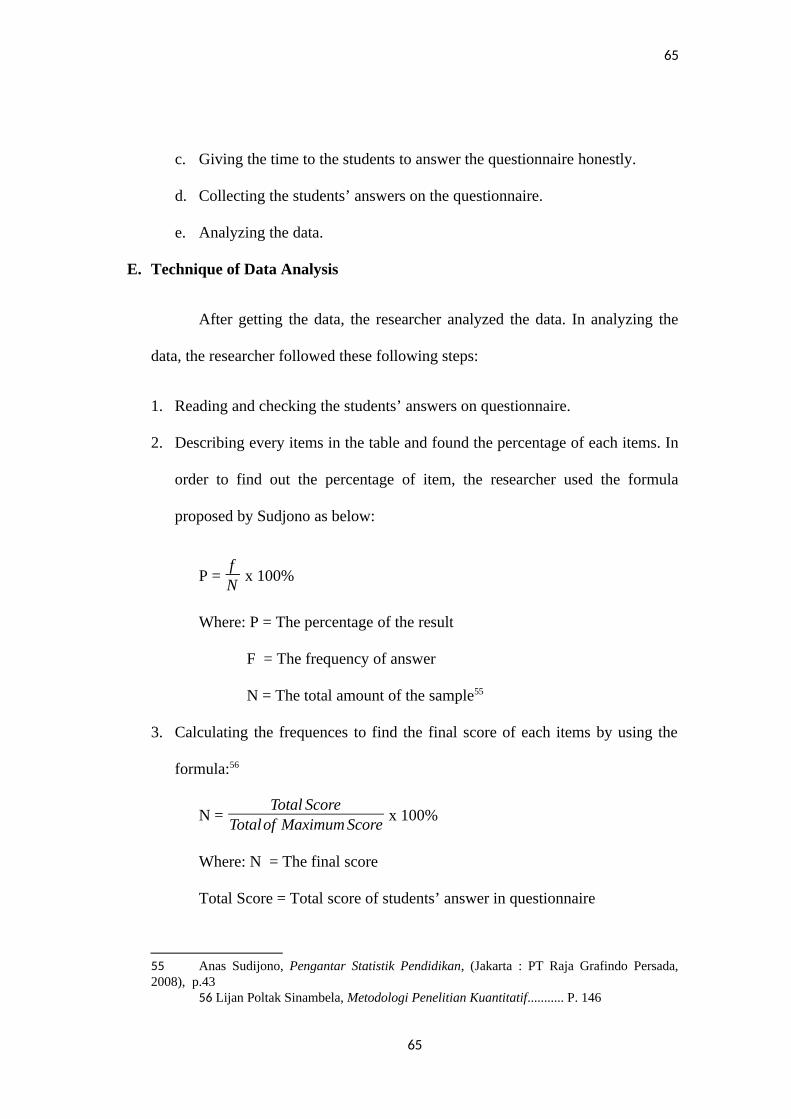
65
c. Giving the time to the students to answer the questionnaire honestly.
d. Collecting the students’ answers on the questionnaire.
e. Analyzing the data.
E. Technique of Data Analysis
After getting the data, the researcher analyzed the data. In analyzing the
data, the researcher followed these following steps:
1. Reading and checking the students’ answers on questionnaire.
2. Describing every items in the table and found the percentage of each items. In
order to find out the percentage of item, the researcher used the formula
proposed by Sudjono as below:
P = fN
x 100%
Where: P = The percentage of the result
F = The frequency of answer
N = The total amount of the sample55
3. Calculating the frequences to find the final score of each items by using the
formula:56
N = Total Score
Totalof Maximum Score x 100%
Where: N = The final score
Total Score = Total score of students’ answer in questionnaire
55 Anas Sudijono, Pengantar Statistik Pendidikan, (Jakarta : PT Raja Grafindo Persada,2008), p.43
56 Lijan Poltak Sinambela, Metodologi Penelitian Kuantitatif........... P. 146
65
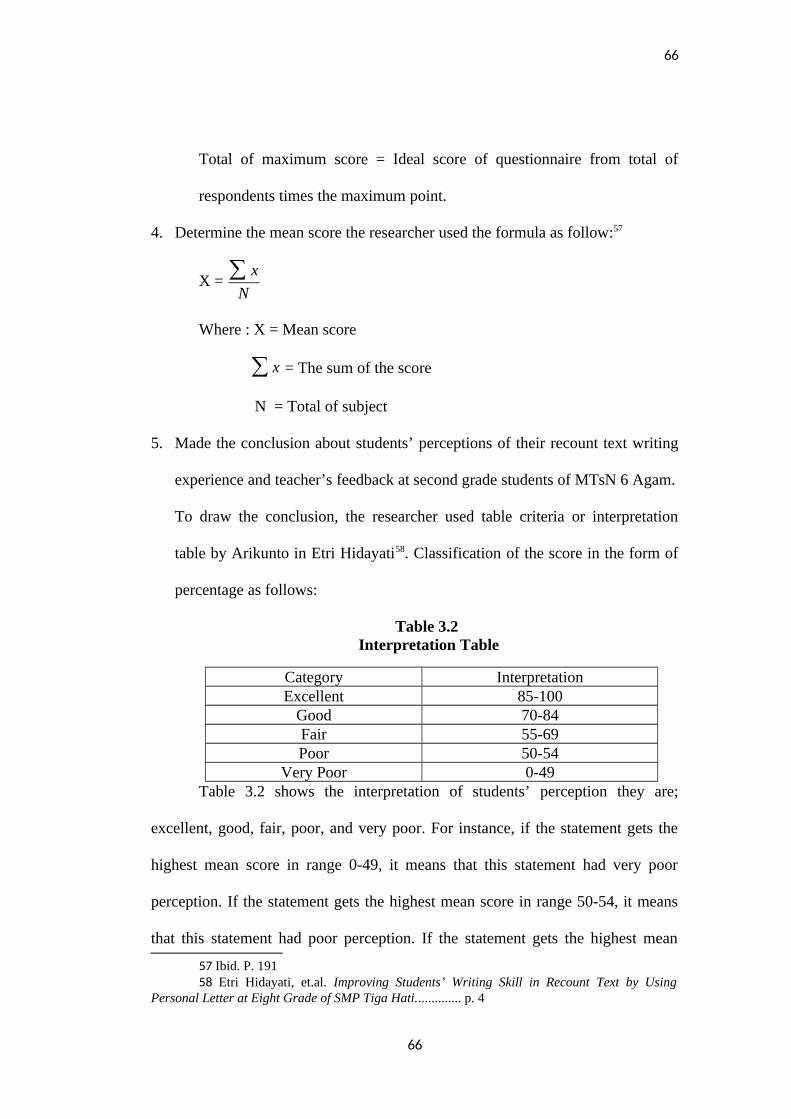
66
Total of maximum score = Ideal score of questionnaire from total of
respondents times the maximum point.
4. Determine the mean score the researcher used the formula as follow:57
X = ∑x
N
Where : X = Mean score
∑ x = The sum of the score
N = Total of subject
5. Made the conclusion about students’ perceptions of their recount text writing
experience and teacher’s feedback at second grade students of MTsN 6 Agam.
To draw the conclusion, the researcher used table criteria or interpretation
table by Arikunto in Etri Hidayati58. Classification of the score in the form of
percentage as follows:
Table 3.2 Interpretation Table
Category InterpretationExcellent 85-100
Good 70-84Fair 55-69Poor 50-54
Very Poor 0-49Table 3.2 shows the interpretation of students’ perception they are;
excellent, good, fair, poor, and very poor. For instance, if the statement gets the
highest mean score in range 0-49, it means that this statement had very poor
perception. If the statement gets the highest mean score in range 50-54, it means
that this statement had poor perception. If the statement gets the highest mean
57 Ibid. P. 191 58 Etri Hidayati, et.al. Improving Students’ Writing Skill in Recount Text by Using
Personal Letter at Eight Grade of SMP Tiga Hati.............. p. 4
66
67
score in range 55-69, it means that this statement had fair perception. If the
statement gets the highest mean score in range 70-84, it means that this statement
had good perception. And if the statement gets the highest mean score in range
85-100, it means that this statement had excellent perception.
CHAPTER IV
FINDING AND DISCUSSION
A. Finding
This chapter explains the finding of data collected through questionnaire to
answer the research questions:
3. What are the students’ perceptions of their recount text writing experience on
the second grade students at MTsN 6 Agam?
4. What are the students’ perceptions of the teacher’s feedback on the second
grade students at MTsN 6 Agam?
The sample were the second grade students of MTsN 6 Agam. The total of
participant were 49 students. They answered the items of the questionnaire with
five categories; strongly agree (SA), agree (A), moderate (M), disagree (D), and
strongly disagree (SD). The answer of each category was 5 point for strongly
agree, 4 point for agree. 3 point for moderate, 2 point for disagree, and 1 point for
strongly disagree. In collecting the data for this research, the researcher used
questionnaire. The description of the data and analysis were described below.
1. Description of the data
67
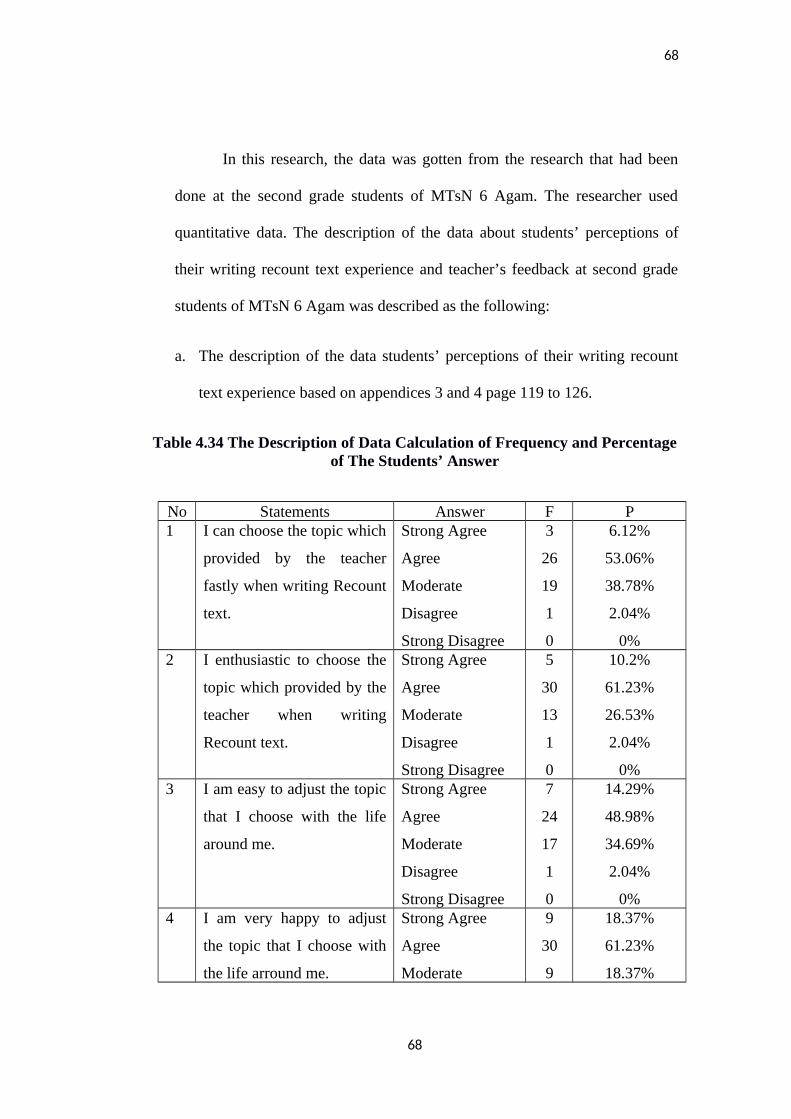
68
In this research, the data was gotten from the research that had been
done at the second grade students of MTsN 6 Agam. The researcher used
quantitative data. The description of the data about students’ perceptions of
their writing recount text experience and teacher’s feedback at second grade
students of MTsN 6 Agam was described as the following:
a. The description of the data students’ perceptions of their writing recount
text experience based on appendices 3 and 4 page 119 to 126.
Table 4.34 The Description of Data Calculation of Frequency and Percentageof The Students’ Answer
No Statements Answer F P1 I can choose the topic which
provided by the teacher
fastly when writing Recount
text.
Strong Agree
Agree
Moderate
Disagree
Strong Disagree
3
26
19
1
0
6.12%
53.06%
38.78%
2.04%
0%2 I enthusiastic to choose the
topic which provided by the
teacher when writing
Recount text.
Strong Agree
Agree
Moderate
Disagree
Strong Disagree
5
30
13
1
0
10.2%
61.23%
26.53%
2.04%
0%3 I am easy to adjust the topic
that I choose with the life
around me.
Strong Agree
Agree
Moderate
Disagree
Strong Disagree
7
24
17
1
0
14.29%
48.98%
34.69%
2.04%
0%4 I am very happy to adjust
the topic that I choose with
the life arround me.
Strong Agree
Agree
Moderate
9
30
9
18.37%
61.23%
18.37%
68
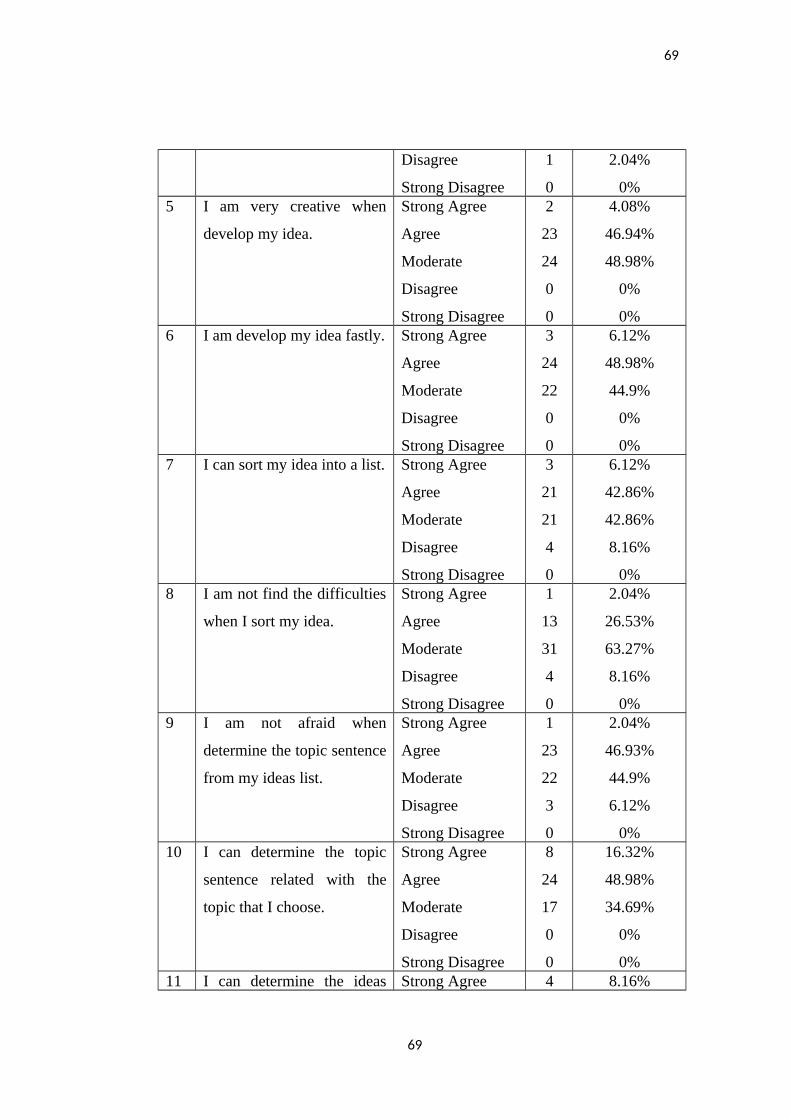
69
Disagree
Strong Disagree
1
0
2.04%
0%5 I am very creative when
develop my idea.
Strong Agree
Agree
Moderate
Disagree
Strong Disagree
2
23
24
0
0
4.08%
46.94%
48.98%
0%
0%6 I am develop my idea fastly. Strong Agree
Agree
Moderate
Disagree
Strong Disagree
3
24
22
0
0
6.12%
48.98%
44.9%
0%
0%7 I can sort my idea into a list. Strong Agree
Agree
Moderate
Disagree
Strong Disagree
3
21
21
4
0
6.12%
42.86%
42.86%
8.16%
0%8 I am not find the difficulties
when I sort my idea.
Strong Agree
Agree
Moderate
Disagree
Strong Disagree
1
13
31
4
0
2.04%
26.53%
63.27%
8.16%
0%9 I am not afraid when
determine the topic sentence
from my ideas list.
Strong Agree
Agree
Moderate
Disagree
Strong Disagree
1
23
22
3
0
2.04%
46.93%
44.9%
6.12%
0%10 I can determine the topic
sentence related with the
topic that I choose.
Strong Agree
Agree
Moderate
Disagree
Strong Disagree
8
24
17
0
0
16.32%
48.98%
34.69%
0%
0%11 I can determine the ideas Strong Agree 4 8.16%
69
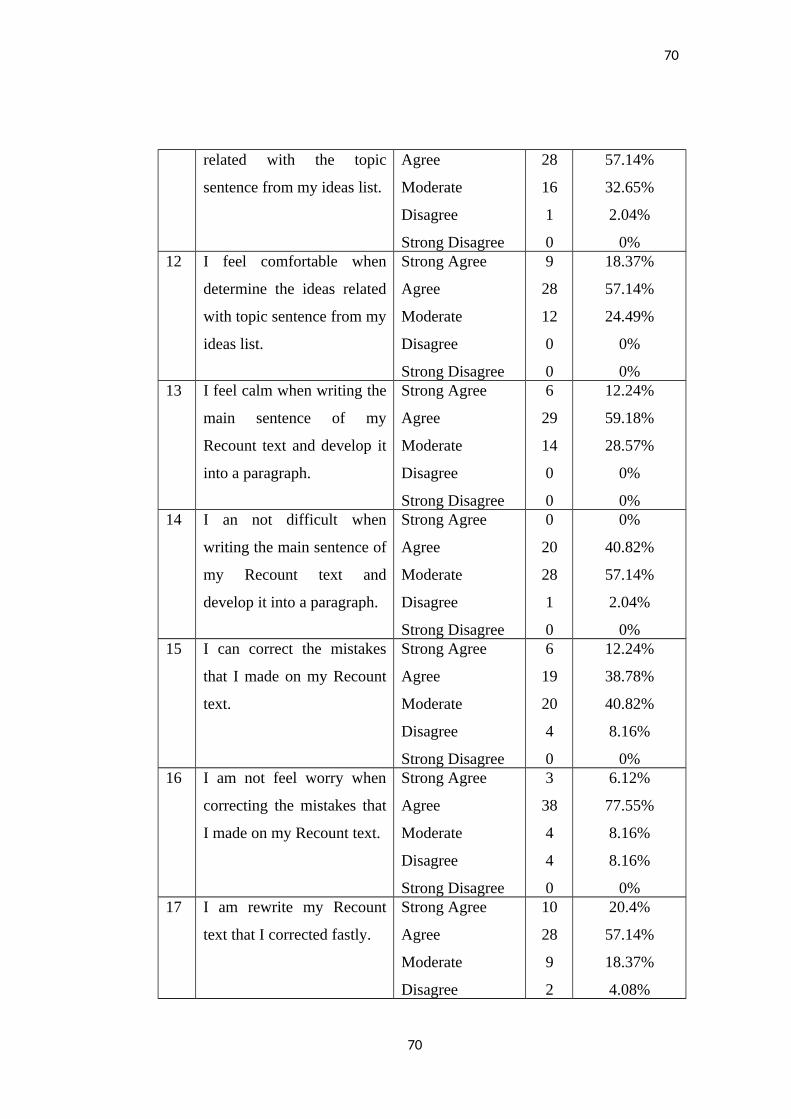
70
related with the topic
sentence from my ideas list.
Agree
Moderate
Disagree
Strong Disagree
28
16
1
0
57.14%
32.65%
2.04%
0%12 I feel comfortable when
determine the ideas related
with topic sentence from my
ideas list.
Strong Agree
Agree
Moderate
Disagree
Strong Disagree
9
28
12
0
0
18.37%
57.14%
24.49%
0%
0%13 I feel calm when writing the
main sentence of my
Recount text and develop it
into a paragraph.
Strong Agree
Agree
Moderate
Disagree
Strong Disagree
6
29
14
0
0
12.24%
59.18%
28.57%
0%
0%14 I an not difficult when
writing the main sentence of
my Recount text and
develop it into a paragraph.
Strong Agree
Agree
Moderate
Disagree
Strong Disagree
0
20
28
1
0
0%
40.82%
57.14%
2.04%
0%15 I can correct the mistakes
that I made on my Recount
text.
Strong Agree
Agree
Moderate
Disagree
Strong Disagree
6
19
20
4
0
12.24%
38.78%
40.82%
8.16%
0%16 I am not feel worry when
correcting the mistakes that
I made on my Recount text.
Strong Agree
Agree
Moderate
Disagree
Strong Disagree
3
38
4
4
0
6.12%
77.55%
8.16%
8.16%
0%17 I am rewrite my Recount
text that I corrected fastly.
Strong Agree
Agree
Moderate
Disagree
10
28
9
2
20.4%
57.14%
18.37%
4.08%
70

71
Strong Disagree 0 0%18 I am not bored when rewrite
the Recount text after I
correct it.
Strong Agree
Agree
Moderate
Disagree
Strong Disagree
9
25
12
3
0
18.37%
51.02%
24.49%
6.12%
0%
The description the mean score of the data about students’
perceptions of their Recount text writing experience at second grade
students of MTsN 6 Agam related to each indicator based on appendix 6
page 127 could be seen on the table below:
Table 4.35
The Mean Score of Students’ Perceptions on their Writing Recounttext Experience toward Choosing the Topic
NoStatementNumber
Total Score
1 Statement 1 72%
2 Statement 2 76%
Total (∑x) 148%Mean (X) 74%
The table 4.2 shows the mean score of students’ perceptions on
their writing recount text experience toward choosing the topic. The mean
score of the students’ perceptions toward pre-writing was 74%. This score
was on 70-84 scale which mean the students’ perceptions toward their
experience on choosing the topic process when writing Recount text was
good.
71
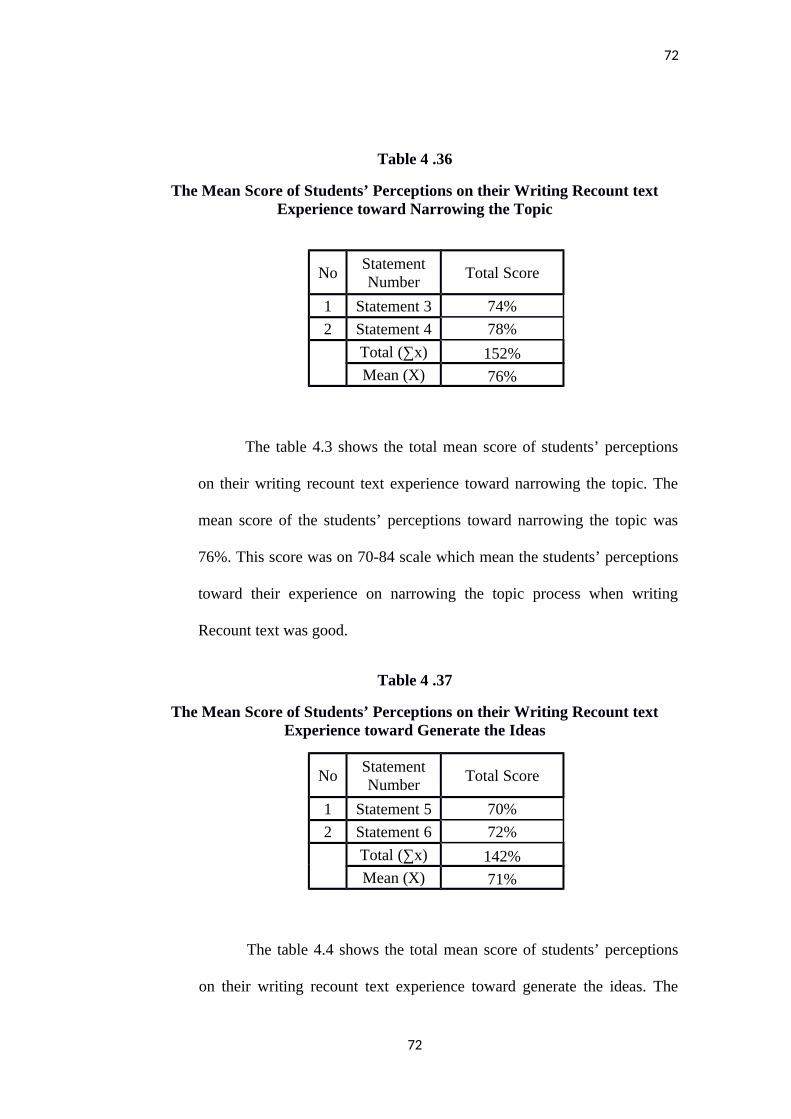
72
Table 4 .36
The Mean Score of Students’ Perceptions on their Writing Recount textExperience toward Narrowing the Topic
NoStatementNumber
Total Score
1 Statement 3 74%
2 Statement 4 78%
Total (∑x) 152%Mean (X) 76%
The table 4.3 shows the total mean score of students’ perceptions
on their writing recount text experience toward narrowing the topic. The
mean score of the students’ perceptions toward narrowing the topic was
76%. This score was on 70-84 scale which mean the students’ perceptions
toward their experience on narrowing the topic process when writing
Recount text was good.
Table 4 .37
The Mean Score of Students’ Perceptions on their Writing Recount textExperience toward Generate the Ideas
NoStatementNumber
Total Score
1 Statement 5 70%
2 Statement 6 72%
Total (∑x) 142%Mean (X) 71%
The table 4.4 shows the total mean score of students’ perceptions
on their writing recount text experience toward generate the ideas. The
72
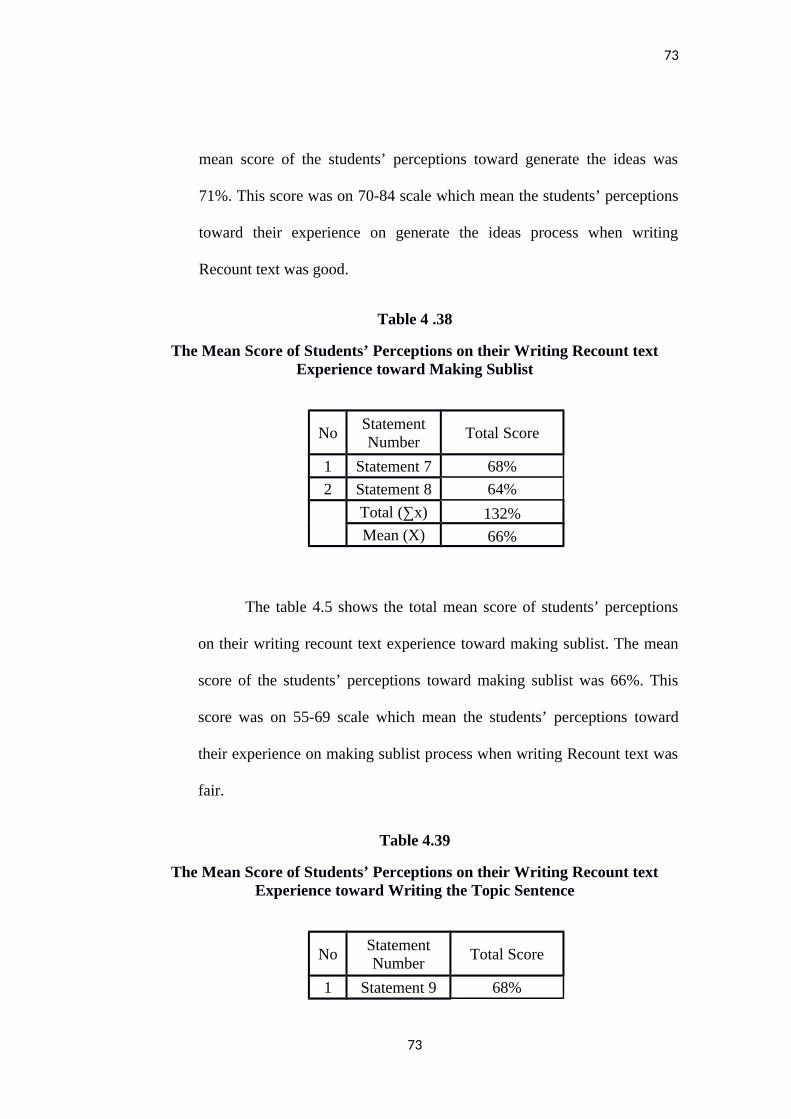
73
mean score of the students’ perceptions toward generate the ideas was
71%. This score was on 70-84 scale which mean the students’ perceptions
toward their experience on generate the ideas process when writing
Recount text was good.
Table 4 .38
The Mean Score of Students’ Perceptions on their Writing Recount textExperience toward Making Sublist
NoStatementNumber
Total Score
1 Statement 7 68%
2 Statement 8 64%
Total (∑x) 132%Mean (X) 66%
The table 4.5 shows the total mean score of students’ perceptions
on their writing recount text experience toward making sublist. The mean
score of the students’ perceptions toward making sublist was 66%. This
score was on 55-69 scale which mean the students’ perceptions toward
their experience on making sublist process when writing Recount text was
fair.
Table 4.39
The Mean Score of Students’ Perceptions on their Writing Recount textExperience toward Writing the Topic Sentence
NoStatementNumber
Total Score
1 Statement 9 68%
73
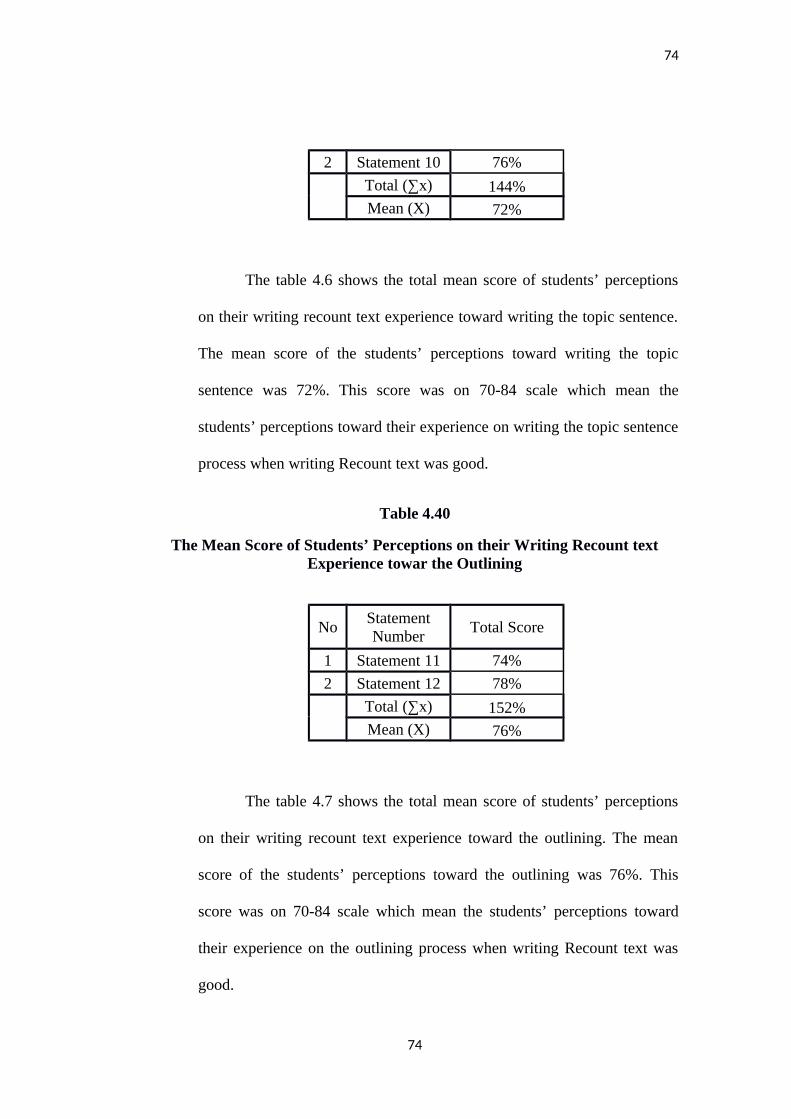
74
2 Statement 10 76%
Total (∑x) 144%Mean (X) 72%
The table 4.6 shows the total mean score of students’ perceptions
on their writing recount text experience toward writing the topic sentence.
The mean score of the students’ perceptions toward writing the topic
sentence was 72%. This score was on 70-84 scale which mean the
students’ perceptions toward their experience on writing the topic sentence
process when writing Recount text was good.
Table 4.40
The Mean Score of Students’ Perceptions on their Writing Recount textExperience towar the Outlining
NoStatementNumber
Total Score
1 Statement 11 74%
2 Statement 12 78%
Total (∑x) 152%Mean (X) 76%
The table 4.7 shows the total mean score of students’ perceptions
on their writing recount text experience toward the outlining. The mean
score of the students’ perceptions toward the outlining was 76%. This
score was on 70-84 scale which mean the students’ perceptions toward
their experience on the outlining process when writing Recount text was
good.
74

75
Table 4.41
The Mean Score of Students’ Perceptions on their Writing Recount textExperience toward Writing the First Rough Draft
NoStatementNumber
Total Score
1 Statement 13 76%
2 Statement 14 68%
Total (∑x) 144%Mean (X) 72%
The table 4.8 shows the total mean score of students’ perceptions
on their writing recount text experience toward writing the first rough
draft. The mean score of the students’ perceptions toward writing the first
rough draft was 72%. This score was on 70-84 scale which mean the
students’ perceptions toward their experience on writing the first rough
draft process when writing Recount text was good.
Table 4.42
The Mean Score of Students’ Perceptions on their Writing Recount textExperience toward Revising Content and Organization
NoStatementNumber
Total Score
1 Statement 15 70%
2 Statement 16 76%
Total (∑x) 146%Mean (X) 73%
75
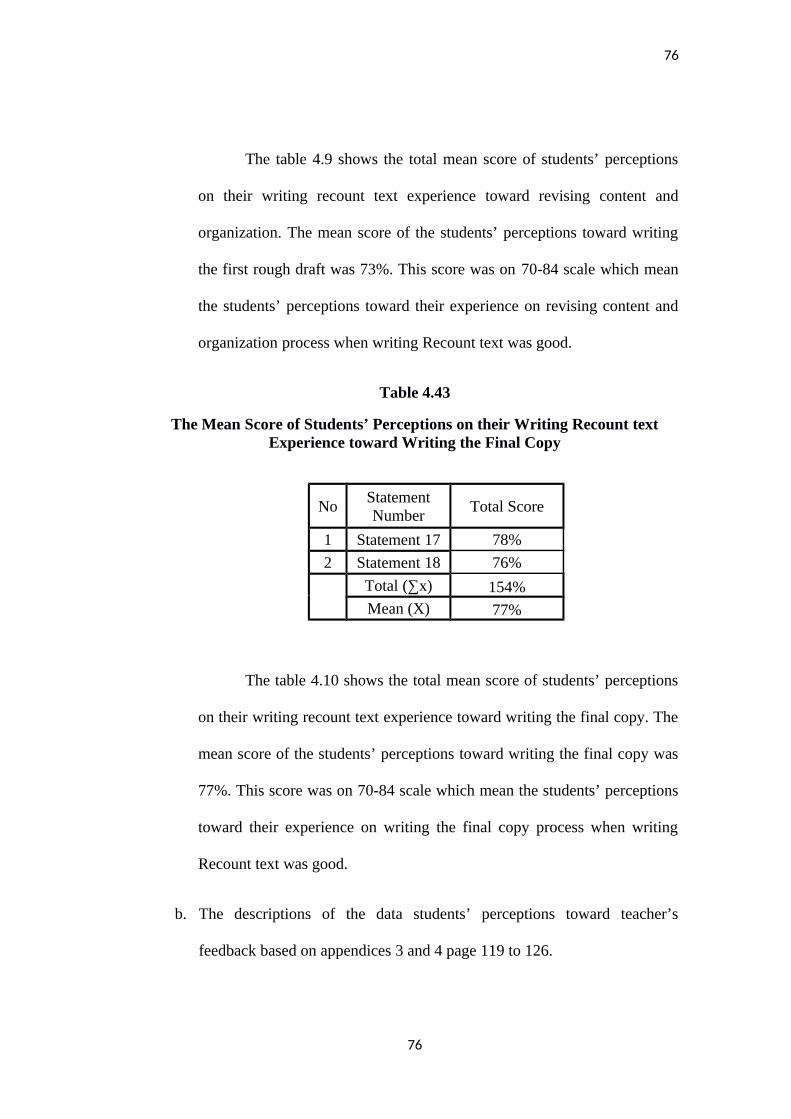
76
The table 4.9 shows the total mean score of students’ perceptions
on their writing recount text experience toward revising content and
organization. The mean score of the students’ perceptions toward writing
the first rough draft was 73%. This score was on 70-84 scale which mean
the students’ perceptions toward their experience on revising content and
organization process when writing Recount text was good.
Table 4.43
The Mean Score of Students’ Perceptions on their Writing Recount textExperience toward Writing the Final Copy
NoStatementNumber
Total Score
1 Statement 17 78%
2 Statement 18 76%
Total (∑x) 154%Mean (X) 77%
The table 4.10 shows the total mean score of students’ perceptions
on their writing recount text experience toward writing the final copy. The
mean score of the students’ perceptions toward writing the final copy was
77%. This score was on 70-84 scale which mean the students’ perceptions
toward their experience on writing the final copy process when writing
Recount text was good.
b. The descriptions of the data students’ perceptions toward teacher’s
feedback based on appendices 3 and 4 page 119 to 126.
76
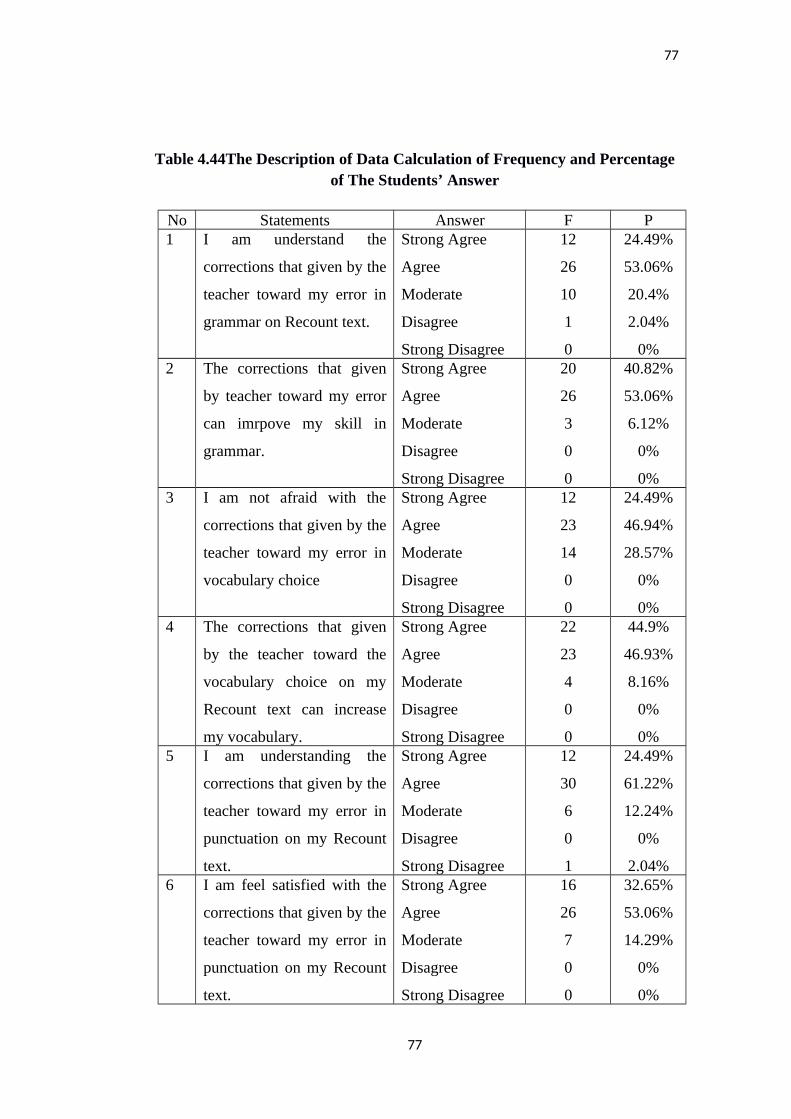
77
Table 4.44The Description of Data Calculation of Frequency and Percentageof The Students’ Answer
No Statements Answer F P1 I am understand the
corrections that given by the
teacher toward my error in
grammar on Recount text.
Strong Agree
Agree
Moderate
Disagree
Strong Disagree
12
26
10
1
0
24.49%
53.06%
20.4%
2.04%
0%2 The corrections that given
by teacher toward my error
can imrpove my skill in
grammar.
Strong Agree
Agree
Moderate
Disagree
Strong Disagree
20
26
3
0
0
40.82%
53.06%
6.12%
0%
0%3 I am not afraid with the
corrections that given by the
teacher toward my error in
vocabulary choice
Strong Agree
Agree
Moderate
Disagree
Strong Disagree
12
23
14
0
0
24.49%
46.94%
28.57%
0%
0%4 The corrections that given
by the teacher toward the
vocabulary choice on my
Recount text can increase
my vocabulary.
Strong Agree
Agree
Moderate
Disagree
Strong Disagree
22
23
4
0
0
44.9%
46.93%
8.16%
0%
0%5 I am understanding the
corrections that given by the
teacher toward my error in
punctuation on my Recount
text.
Strong Agree
Agree
Moderate
Disagree
Strong Disagree
12
30
6
0
1
24.49%
61.22%
12.24%
0%
2.04%6 I am feel satisfied with the
corrections that given by the
teacher toward my error in
punctuation on my Recount
text.
Strong Agree
Agree
Moderate
Disagree
Strong Disagree
16
26
7
0
0
32.65%
53.06%
14.29%
0%
0%
77
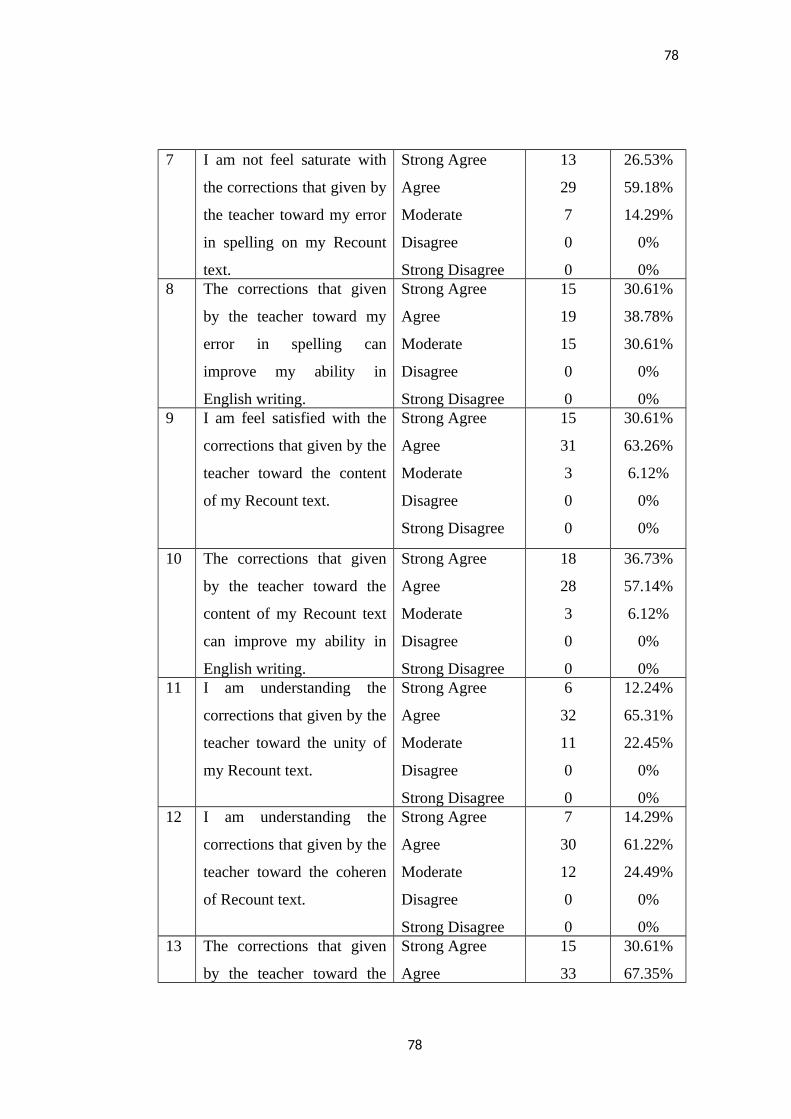
78
7 I am not feel saturate with
the corrections that given by
the teacher toward my error
in spelling on my Recount
text.
Strong Agree
Agree
Moderate
Disagree
Strong Disagree
13
29
7
0
0
26.53%
59.18%
14.29%
0%
0%8 The corrections that given
by the teacher toward my
error in spelling can
improve my ability in
English writing.
Strong Agree
Agree
Moderate
Disagree
Strong Disagree
15
19
15
0
0
30.61%
38.78%
30.61%
0%
0%9 I am feel satisfied with the
corrections that given by the
teacher toward the content
of my Recount text.
Strong Agree
Agree
Moderate
Disagree
Strong Disagree
15
31
3
0
0
30.61%
63.26%
6.12%
0%
0%
10 The corrections that given
by the teacher toward the
content of my Recount text
can improve my ability in
English writing.
Strong Agree
Agree
Moderate
Disagree
Strong Disagree
18
28
3
0
0
36.73%
57.14%
6.12%
0%
0%11 I am understanding the
corrections that given by the
teacher toward the unity of
my Recount text.
Strong Agree
Agree
Moderate
Disagree
Strong Disagree
6
32
11
0
0
12.24%
65.31%
22.45%
0%
0%12 I am understanding the
corrections that given by the
teacher toward the coheren
of Recount text.
Strong Agree
Agree
Moderate
Disagree
Strong Disagree
7
30
12
0
0
14.29%
61.22%
24.49%
0%
0%13 The corrections that given
by the teacher toward the
Strong Agree
Agree
15
33
30.61%
67.35%
78
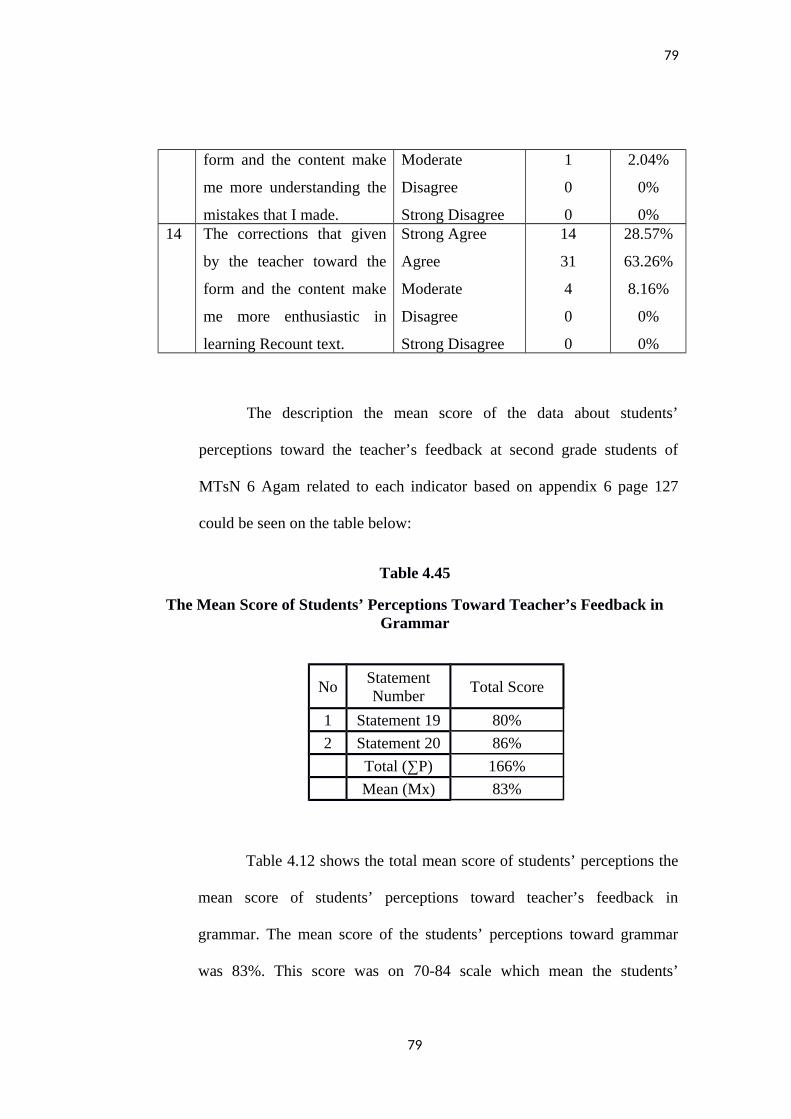
79
form and the content make
me more understanding the
mistakes that I made.
Moderate
Disagree
Strong Disagree
1
0
0
2.04%
0%
0%14 The corrections that given
by the teacher toward the
form and the content make
me more enthusiastic in
learning Recount text.
Strong Agree
Agree
Moderate
Disagree
Strong Disagree
14
31
4
0
0
28.57%
63.26%
8.16%
0%
0%
The description the mean score of the data about students’
perceptions toward the teacher’s feedback at second grade students of
MTsN 6 Agam related to each indicator based on appendix 6 page 127
could be seen on the table below:
Table 4.45
The Mean Score of Students’ Perceptions Toward Teacher’s Feedback inGrammar
NoStatementNumber
Total Score
1 Statement 19 80%
2 Statement 20 86%
Total (∑P) 166%
Mean (Mx) 83%
Table 4.12 shows the total mean score of students’ perceptions the
mean score of students’ perceptions toward teacher’s feedback in
grammar. The mean score of the students’ perceptions toward grammar
was 83%. This score was on 70-84 scale which mean the students’
79
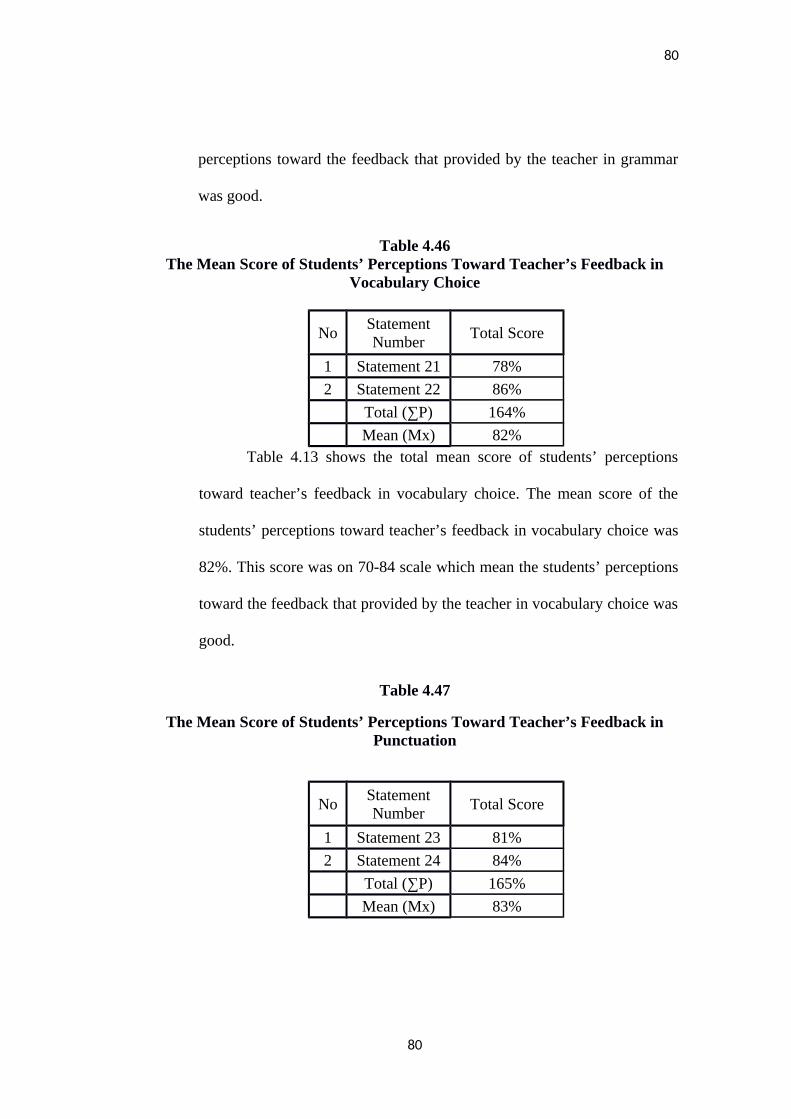
80
perceptions toward the feedback that provided by the teacher in grammar
was good.
Table 4.46The Mean Score of Students’ Perceptions Toward Teacher’s Feedback in
Vocabulary Choice
NoStatementNumber
Total Score
1 Statement 21 78%
2 Statement 22 86%
Total (∑P) 164%
Mean (Mx) 82%Table 4.13 shows the total mean score of students’ perceptions
toward teacher’s feedback in vocabulary choice. The mean score of the
students’ perceptions toward teacher’s feedback in vocabulary choice was
82%. This score was on 70-84 scale which mean the students’ perceptions
toward the feedback that provided by the teacher in vocabulary choice was
good.
Table 4.47
The Mean Score of Students’ Perceptions Toward Teacher’s Feedback inPunctuation
NoStatementNumber
Total Score
1 Statement 23 81%
2 Statement 24 84%
Total (∑P) 165%
Mean (Mx) 83%
80
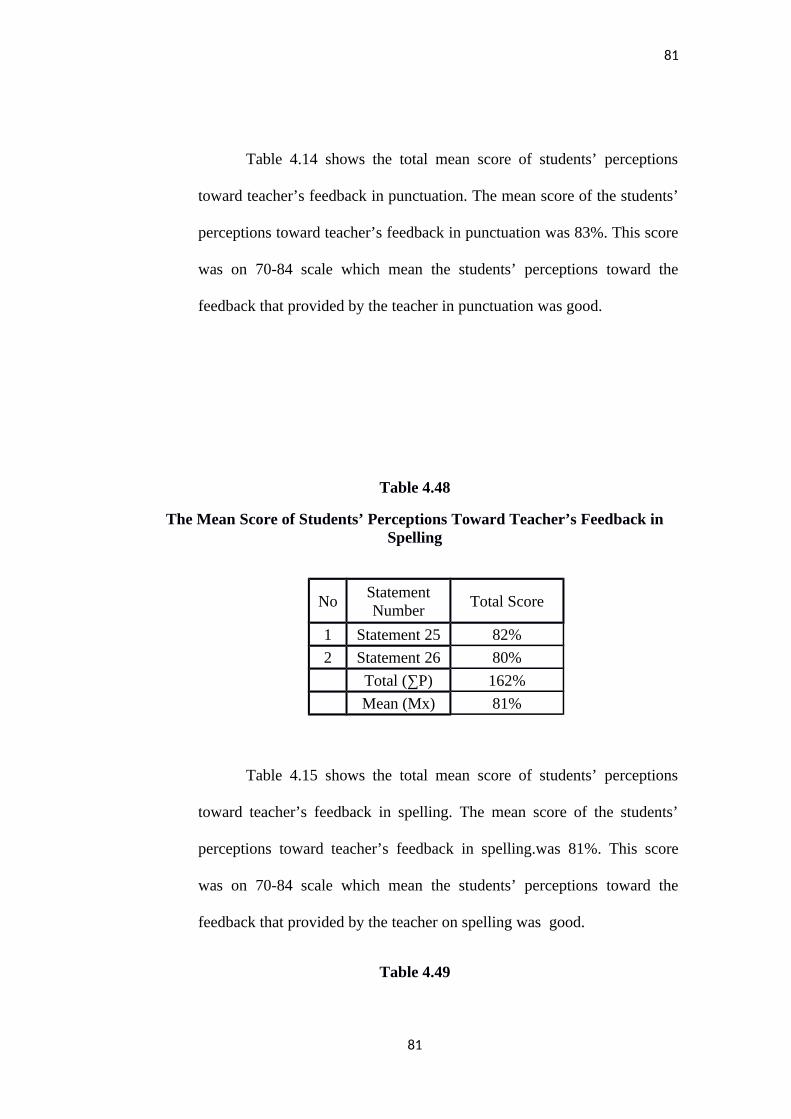
81
Table 4.14 shows the total mean score of students’ perceptions
toward teacher’s feedback in punctuation. The mean score of the students’
perceptions toward teacher’s feedback in punctuation was 83%. This score
was on 70-84 scale which mean the students’ perceptions toward the
feedback that provided by the teacher in punctuation was good.
Table 4.48
The Mean Score of Students’ Perceptions Toward Teacher’s Feedback inSpelling
NoStatementNumber
Total Score
1 Statement 25 82%
2 Statement 26 80%
Total (∑P) 162%
Mean (Mx) 81%
Table 4.15 shows the total mean score of students’ perceptions
toward teacher’s feedback in spelling. The mean score of the students’
perceptions toward teacher’s feedback in spelling.was 81%. This score
was on 70-84 scale which mean the students’ perceptions toward the
feedback that provided by the teacher on spelling was good.
Table 4.49
81
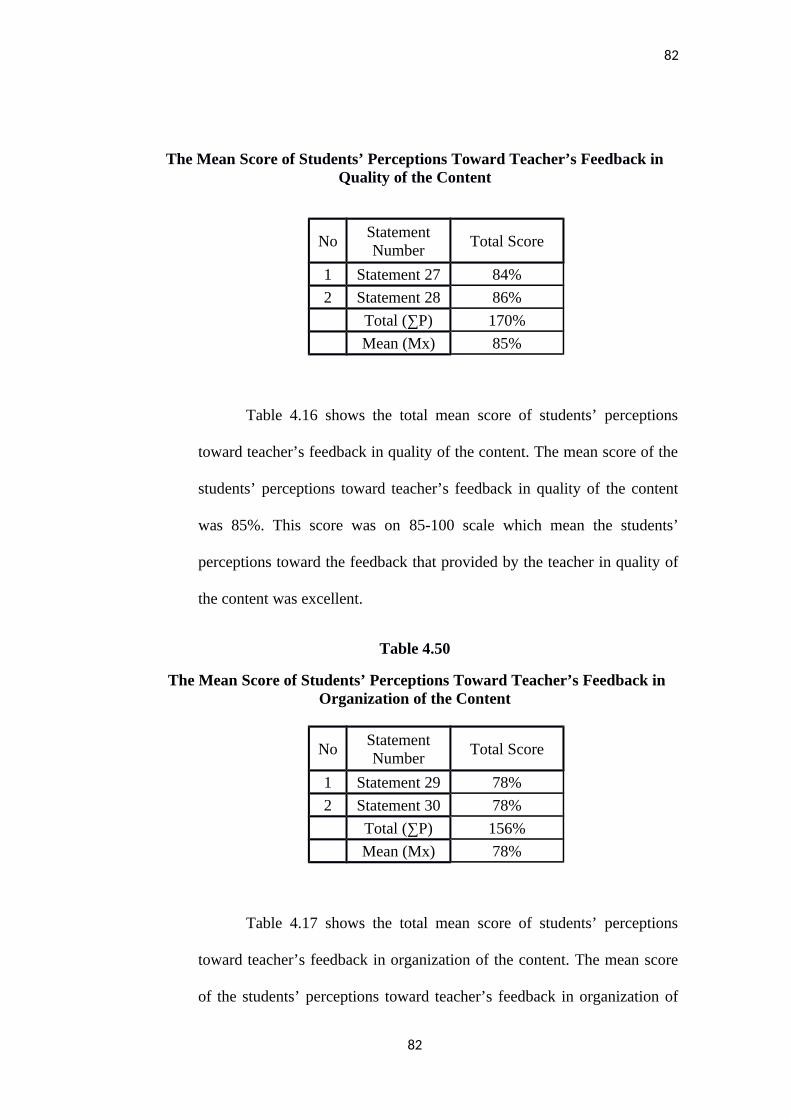
82
The Mean Score of Students’ Perceptions Toward Teacher’s Feedback inQuality of the Content
NoStatementNumber
Total Score
1 Statement 27 84%
2 Statement 28 86%
Total (∑P) 170%
Mean (Mx) 85%
Table 4.16 shows the total mean score of students’ perceptions
toward teacher’s feedback in quality of the content. The mean score of the
students’ perceptions toward teacher’s feedback in quality of the content
was 85%. This score was on 85-100 scale which mean the students’
perceptions toward the feedback that provided by the teacher in quality of
the content was excellent.
Table 4.50
The Mean Score of Students’ Perceptions Toward Teacher’s Feedback inOrganization of the Content
NoStatementNumber
Total Score
1 Statement 29 78%
2 Statement 30 78%
Total (∑P) 156%
Mean (Mx) 78%
Table 4.17 shows the total mean score of students’ perceptions
toward teacher’s feedback in organization of the content. The mean score
of the students’ perceptions toward teacher’s feedback in organization of
82
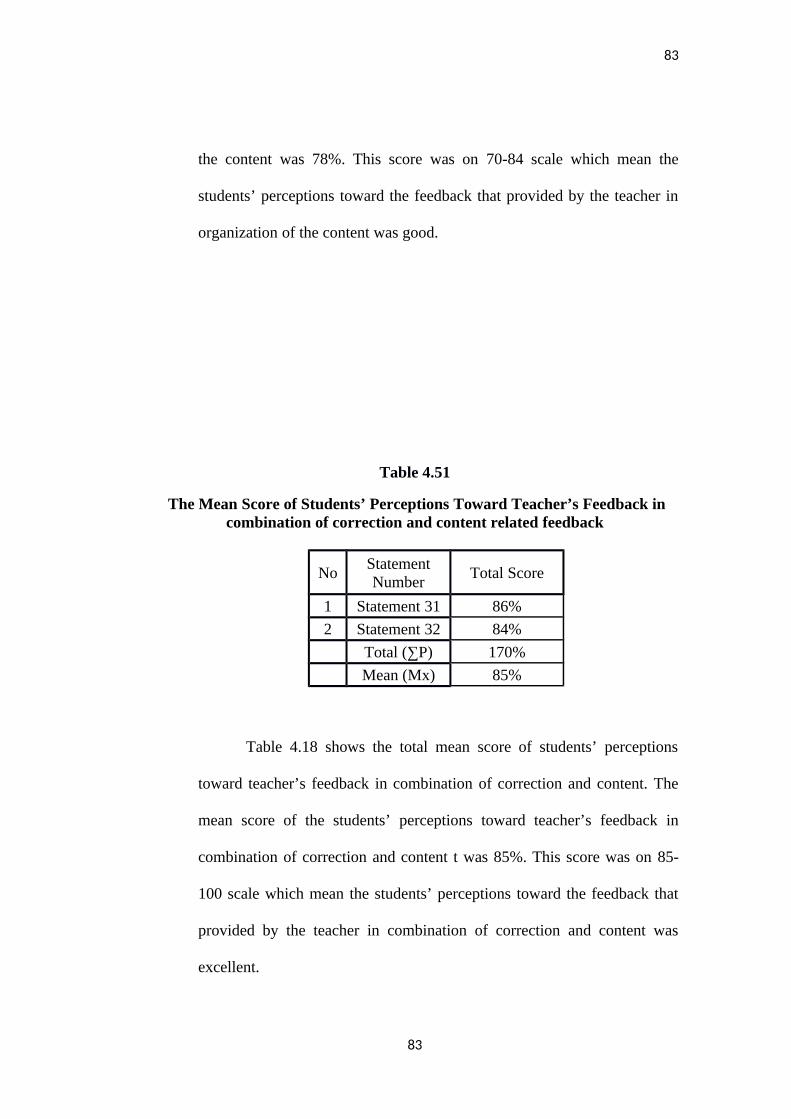
83
the content was 78%. This score was on 70-84 scale which mean the
students’ perceptions toward the feedback that provided by the teacher in
organization of the content was good.
Table 4.51
The Mean Score of Students’ Perceptions Toward Teacher’s Feedback incombination of correction and content related feedback
NoStatementNumber
Total Score
1 Statement 31 86%
2 Statement 32 84%
Total (∑P) 170%
Mean (Mx) 85%
Table 4.18 shows the total mean score of students’ perceptions
toward teacher’s feedback in combination of correction and content. The
mean score of the students’ perceptions toward teacher’s feedback in
combination of correction and content t was 85%. This score was on 85-
100 scale which mean the students’ perceptions toward the feedback that
provided by the teacher in combination of correction and content was
excellent.
83
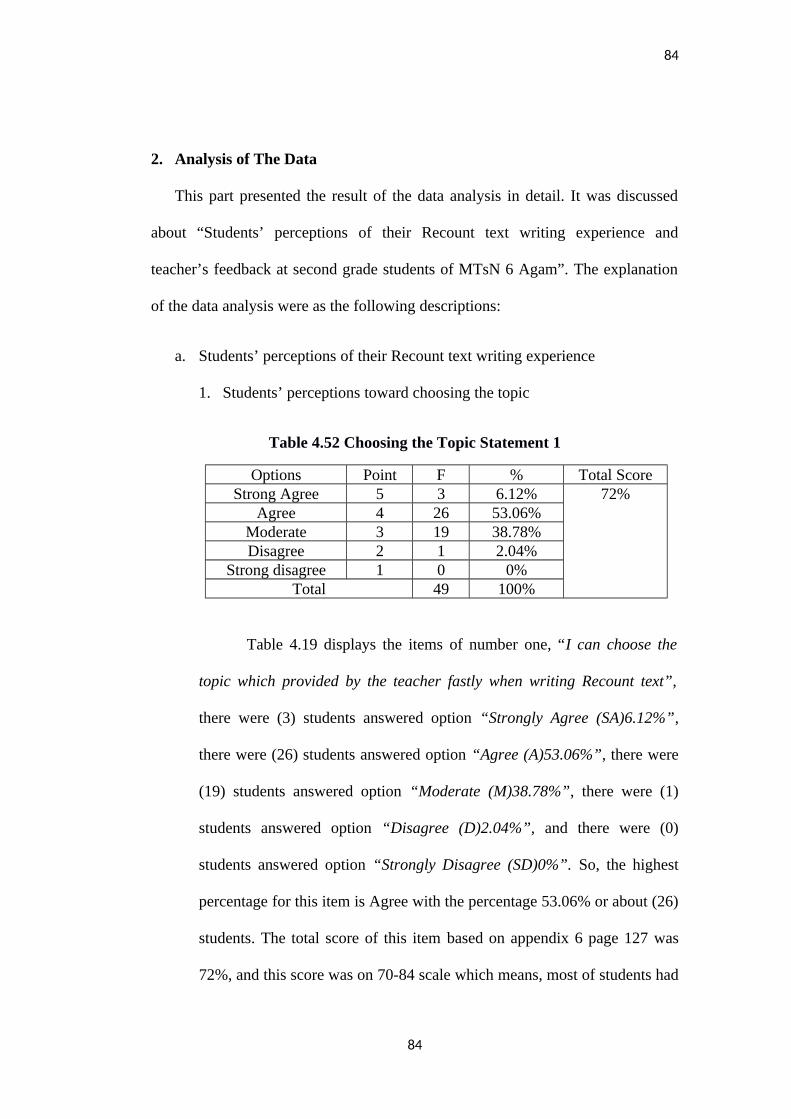
84
2. Analysis of The Data
This part presented the result of the data analysis in detail. It was discussed
about “Students’ perceptions of their Recount text writing experience and
teacher’s feedback at second grade students of MTsN 6 Agam”. The explanation
of the data analysis were as the following descriptions:
a. Students’ perceptions of their Recount text writing experience
1. Students’ perceptions toward choosing the topic
Table 4.52 Choosing the Topic Statement 1
Options Point F % Total ScoreStrong Agree 5 3 6.12% 72%
Agree 4 26 53.06%Moderate 3 19 38.78%Disagree 2 1 2.04%
Strong disagree 1 0 0%Total 49 100%
Table 4.19 displays the items of number one, “I can choose the
topic which provided by the teacher fastly when writing Recount text”,
there were (3) students answered option “Strongly Agree (SA)6.12%”,
there were (26) students answered option “Agree (A)53.06%”, there were
(19) students answered option “Moderate (M)38.78%”, there were (1)
students answered option “Disagree (D)2.04%”, and there were (0)
students answered option “Strongly Disagree (SD)0%”. So, the highest
percentage for this item is Agree with the percentage 53.06% or about (26)
students. The total score of this item based on appendix 6 page 127 was
72%, and this score was on 70-84 scale which means, most of students had
84
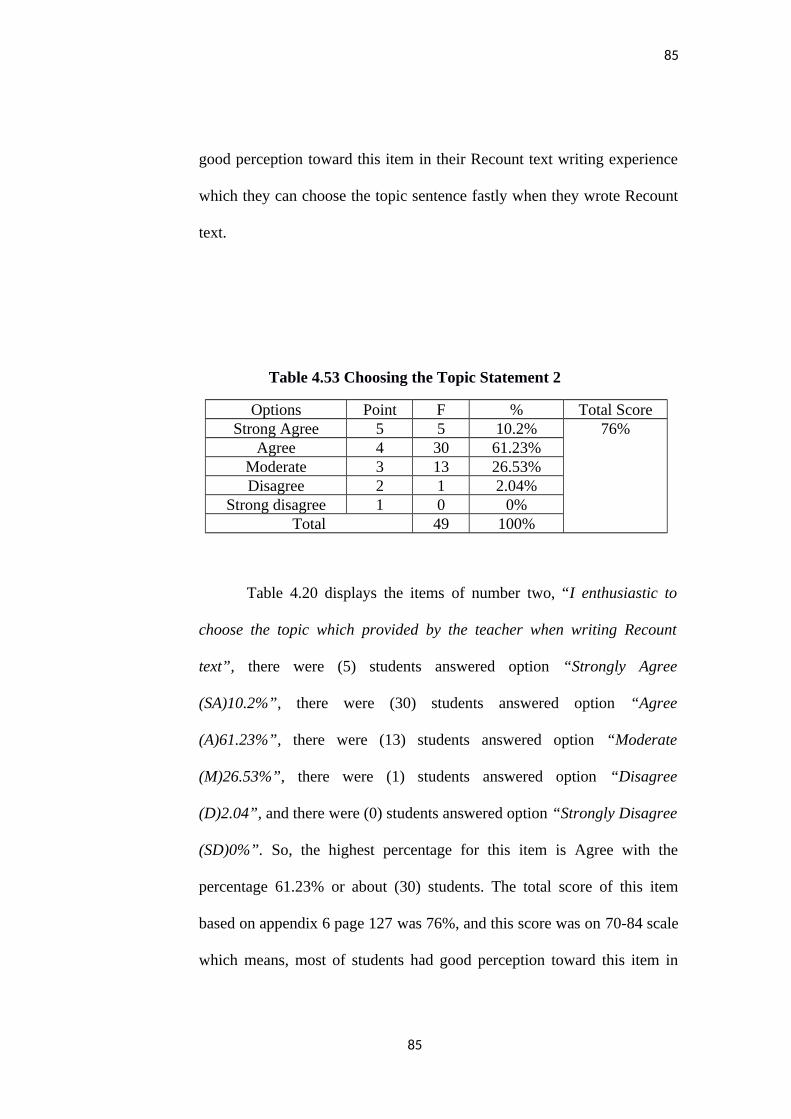
85
good perception toward this item in their Recount text writing experience
which they can choose the topic sentence fastly when they wrote Recount
text.
Table 4.53 Choosing the Topic Statement 2
Options Point F % Total ScoreStrong Agree 5 5 10.2% 76%
Agree 4 30 61.23%Moderate 3 13 26.53%Disagree 2 1 2.04%
Strong disagree 1 0 0%Total 49 100%
Table 4.20 displays the items of number two, “I enthusiastic to
choose the topic which provided by the teacher when writing Recount
text”, there were (5) students answered option “Strongly Agree
(SA)10.2%”, there were (30) students answered option “Agree
(A)61.23%”, there were (13) students answered option “Moderate
(M)26.53%”, there were (1) students answered option “Disagree
(D)2.04”, and there were (0) students answered option “Strongly Disagree
(SD)0%”. So, the highest percentage for this item is Agree with the
percentage 61.23% or about (30) students. The total score of this item
based on appendix 6 page 127 was 76%, and this score was on 70-84 scale
which means, most of students had good perception toward this item in
85
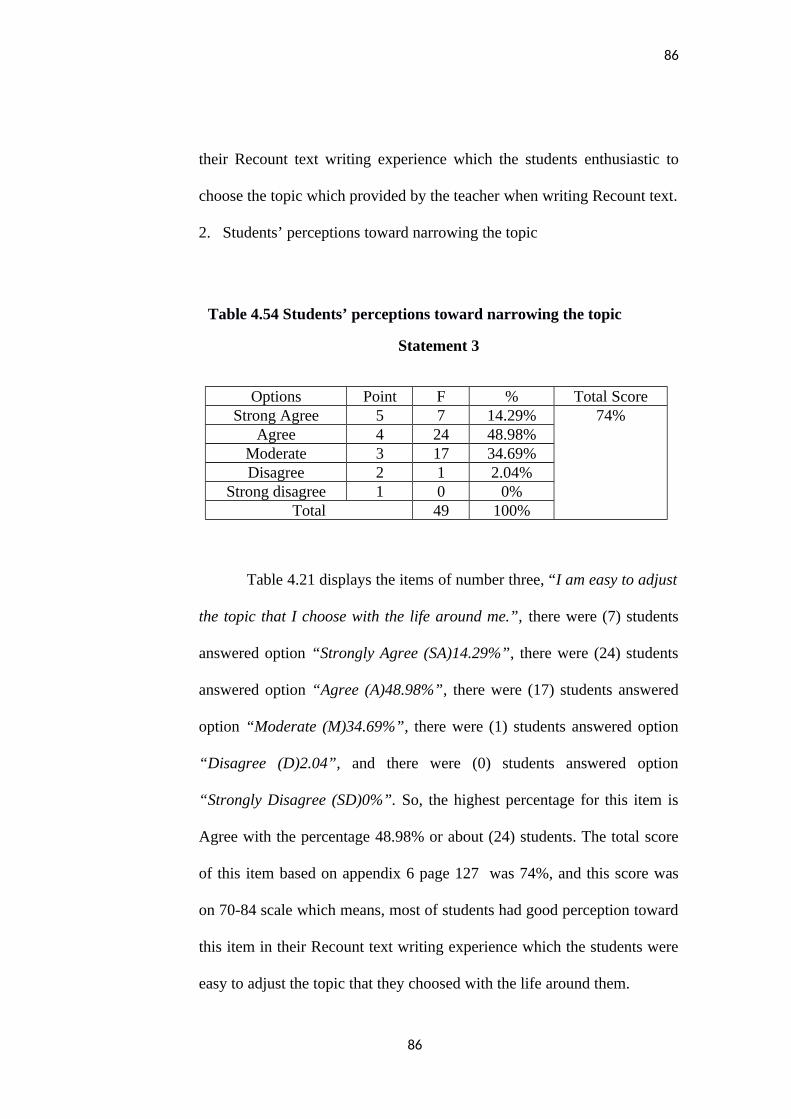
86
their Recount text writing experience which the students enthusiastic to
choose the topic which provided by the teacher when writing Recount text.
2. Students’ perceptions toward narrowing the topic
Table 4.54 Students’ perceptions toward narrowing the topic
Statement 3
Options Point F % Total ScoreStrong Agree 5 7 14.29% 74%
Agree 4 24 48.98%Moderate 3 17 34.69%Disagree 2 1 2.04%
Strong disagree 1 0 0%Total 49 100%
Table 4.21 displays the items of number three, “I am easy to adjust
the topic that I choose with the life around me.”, there were (7) students
answered option “Strongly Agree (SA)14.29%”, there were (24) students
answered option “Agree (A)48.98%”, there were (17) students answered
option “Moderate (M)34.69%”, there were (1) students answered option
“Disagree (D)2.04”, and there were (0) students answered option
“Strongly Disagree (SD)0%”. So, the highest percentage for this item is
Agree with the percentage 48.98% or about (24) students. The total score
of this item based on appendix 6 page 127 was 74%, and this score was
on 70-84 scale which means, most of students had good perception toward
this item in their Recount text writing experience which the students were
easy to adjust the topic that they choosed with the life around them.
86
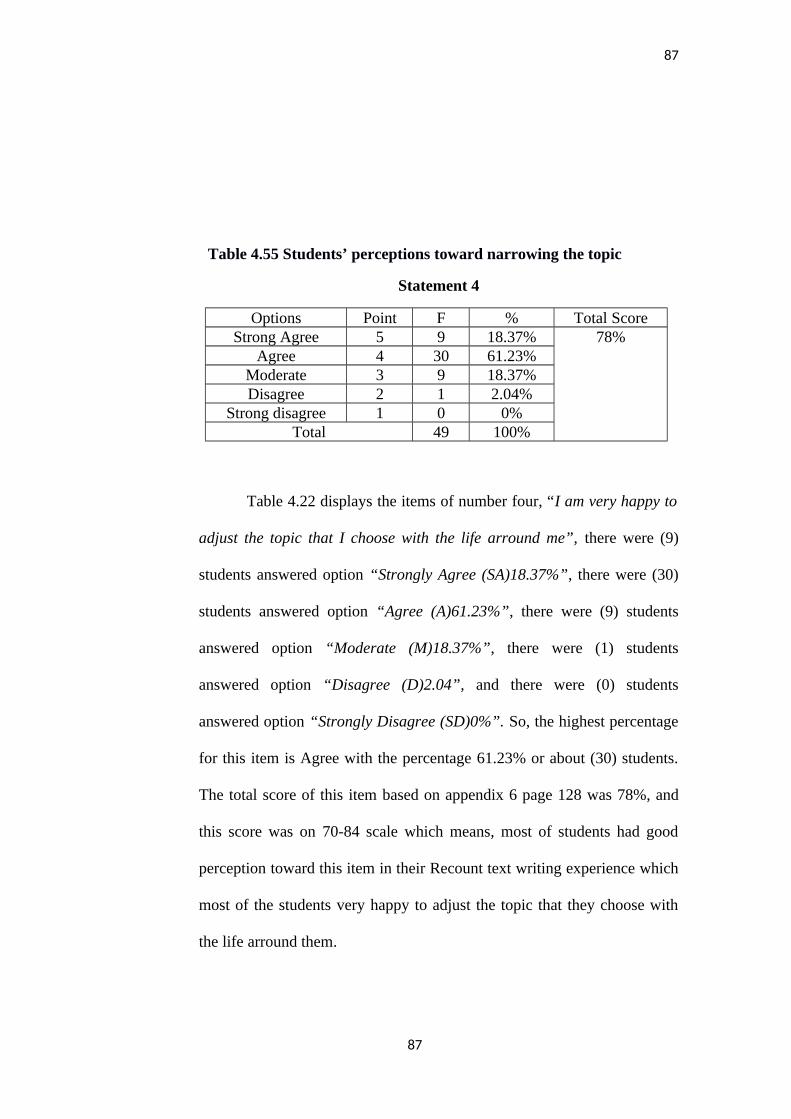
87
Table 4.55 Students’ perceptions toward narrowing the topic
Statement 4
Options Point F % Total ScoreStrong Agree 5 9 18.37% 78%
Agree 4 30 61.23%Moderate 3 9 18.37%Disagree 2 1 2.04%
Strong disagree 1 0 0%Total 49 100%
Table 4.22 displays the items of number four, “I am very happy to
adjust the topic that I choose with the life arround me”, there were (9)
students answered option “Strongly Agree (SA)18.37%”, there were (30)
students answered option “Agree (A)61.23%”, there were (9) students
answered option “Moderate (M)18.37%”, there were (1) students
answered option “Disagree (D)2.04”, and there were (0) students
answered option “Strongly Disagree (SD)0%”. So, the highest percentage
for this item is Agree with the percentage 61.23% or about (30) students.
The total score of this item based on appendix 6 page 128 was 78%, and
this score was on 70-84 scale which means, most of students had good
perception toward this item in their Recount text writing experience which
most of the students very happy to adjust the topic that they choose with
the life arround them.
87
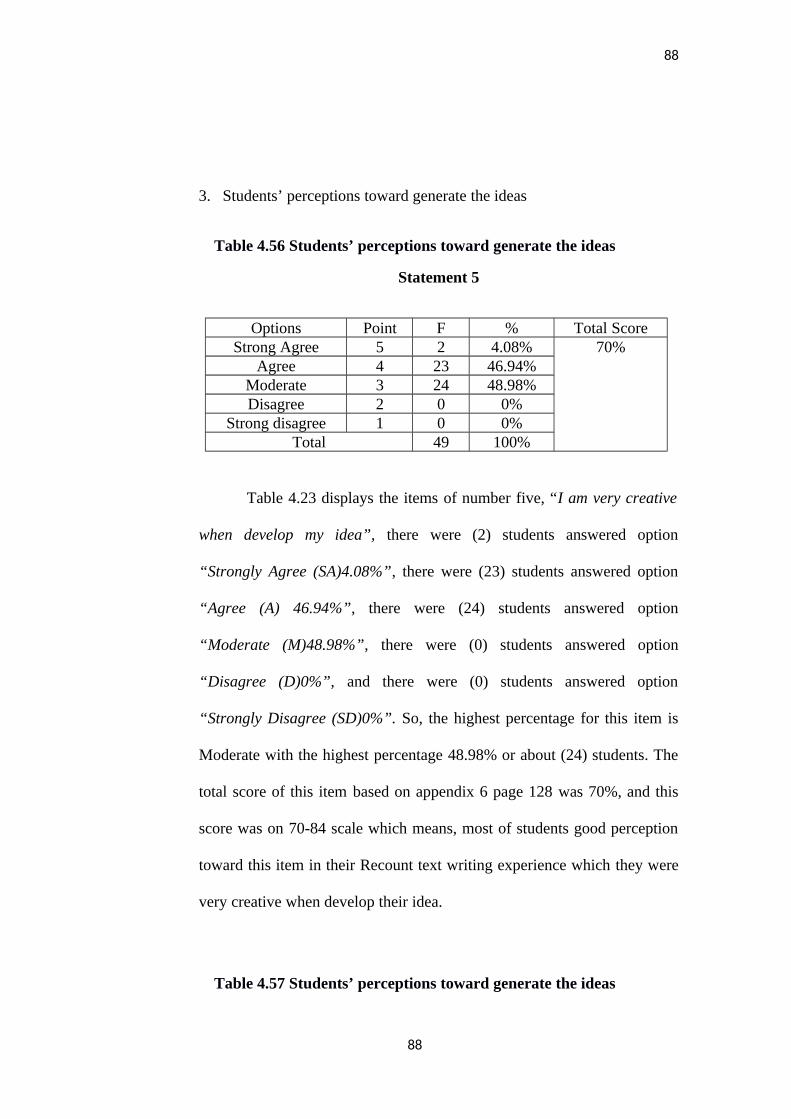
88
3. Students’ perceptions toward generate the ideas
Table 4.56 Students’ perceptions toward generate the ideas
Statement 5
Options Point F % Total ScoreStrong Agree 5 2 4.08% 70%
Agree 4 23 46.94%Moderate 3 24 48.98%Disagree 2 0 0%
Strong disagree 1 0 0%Total 49 100%
Table 4.23 displays the items of number five, “I am very creative
when develop my idea”, there were (2) students answered option
“Strongly Agree (SA)4.08%”, there were (23) students answered option
“Agree (A) 46.94%”, there were (24) students answered option
“Moderate (M)48.98%”, there were (0) students answered option
“Disagree (D)0%”, and there were (0) students answered option
“Strongly Disagree (SD)0%”. So, the highest percentage for this item is
Moderate with the highest percentage 48.98% or about (24) students. The
total score of this item based on appendix 6 page 128 was 70%, and this
score was on 70-84 scale which means, most of students good perception
toward this item in their Recount text writing experience which they were
very creative when develop their idea.
Table 4.57 Students’ perceptions toward generate the ideas
88
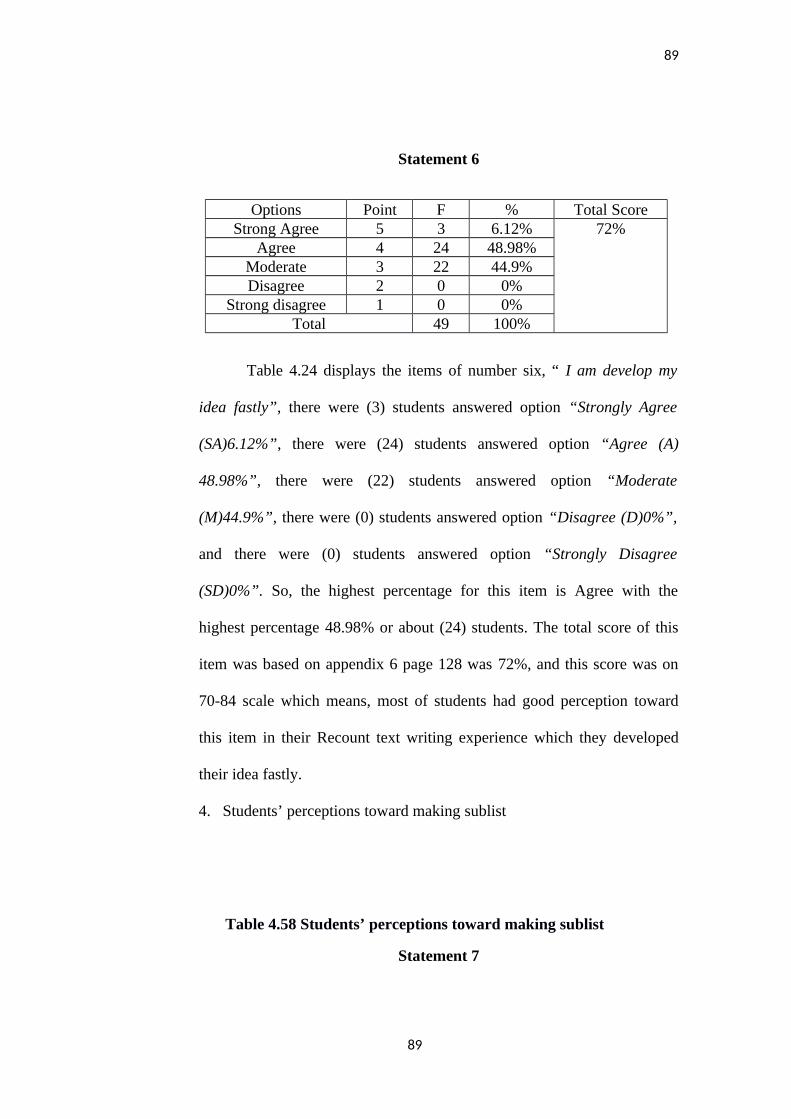
89
Statement 6
Options Point F % Total ScoreStrong Agree 5 3 6.12% 72%
Agree 4 24 48.98%Moderate 3 22 44.9%Disagree 2 0 0%
Strong disagree 1 0 0%Total 49 100%
Table 4.24 displays the items of number six, “ I am develop my
idea fastly”, there were (3) students answered option “Strongly Agree
(SA)6.12%”, there were (24) students answered option “Agree (A)
48.98%”, there were (22) students answered option “Moderate
(M)44.9%”, there were (0) students answered option “Disagree (D)0%”,
and there were (0) students answered option “Strongly Disagree
(SD)0%”. So, the highest percentage for this item is Agree with the
highest percentage 48.98% or about (24) students. The total score of this
item was based on appendix 6 page 128 was 72%, and this score was on
70-84 scale which means, most of students had good perception toward
this item in their Recount text writing experience which they developed
their idea fastly.
4. Students’ perceptions toward making sublist
Table 4.58 Students’ perceptions toward making sublist
Statement 7
89

90
Options Point F % Total ScoreStrong Agree 5 3 6.12% 68%
Agree 4 21 42.86%Moderate 3 21 42.86%Disagree 2 4 8.16%
Strong disagree 1 0 0%Total 49 100%
Table 4.25 displays the items of number seven, “ I can sort my
idea into a list”, there were (3) students answered option “Strongly Agree
(SA)6.12%”, there were (21) students answered option “Agree (A)
42.86%”, there were (21) students answered option “Moderate
(M)42.86%”, there were (4) students answered option “Disagree
(D)8.16%”, and there were (0) students answered option “Strongly
Disagree (SD)0%”. The option of agree and moderate had same
percentage were 42.86% about (26) students. So, the highest percentage
for this item is Agree and Moderate . The total score of this item based on
appendix 6 page 129 was 68%, and this score was on 55-69 scale which
means, most of students had fair perception toward this item in their
Recount text writing experience which could sort their idea into a list.
Table 4.59 Students’ perceptions toward making sublist
Statement 8
Options Point F % Total ScoreStrong Agree 5 1 2.04% 64%
90
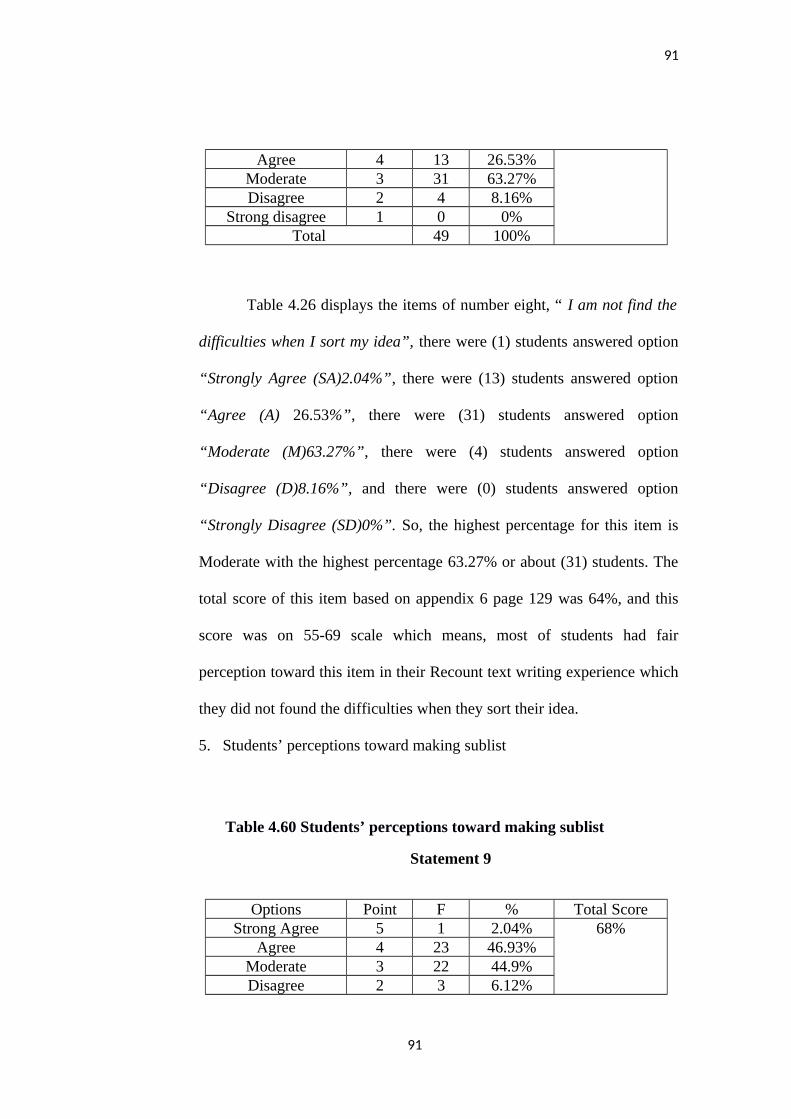
91
Agree 4 13 26.53%Moderate 3 31 63.27%Disagree 2 4 8.16%
Strong disagree 1 0 0%Total 49 100%
Table 4.26 displays the items of number eight, “ I am not find the
difficulties when I sort my idea”, there were (1) students answered option
“Strongly Agree (SA)2.04%”, there were (13) students answered option
“Agree (A) 26.53%”, there were (31) students answered option
“Moderate (M)63.27%”, there were (4) students answered option
“Disagree (D)8.16%”, and there were (0) students answered option
“Strongly Disagree (SD)0%”. So, the highest percentage for this item is
Moderate with the highest percentage 63.27% or about (31) students. The
total score of this item based on appendix 6 page 129 was 64%, and this
score was on 55-69 scale which means, most of students had fair
perception toward this item in their Recount text writing experience which
they did not found the difficulties when they sort their idea.
5. Students’ perceptions toward making sublist
Table 4.60 Students’ perceptions toward making sublist
Statement 9
Options Point F % Total ScoreStrong Agree 5 1 2.04% 68%
Agree 4 23 46.93%Moderate 3 22 44.9%Disagree 2 3 6.12%
91
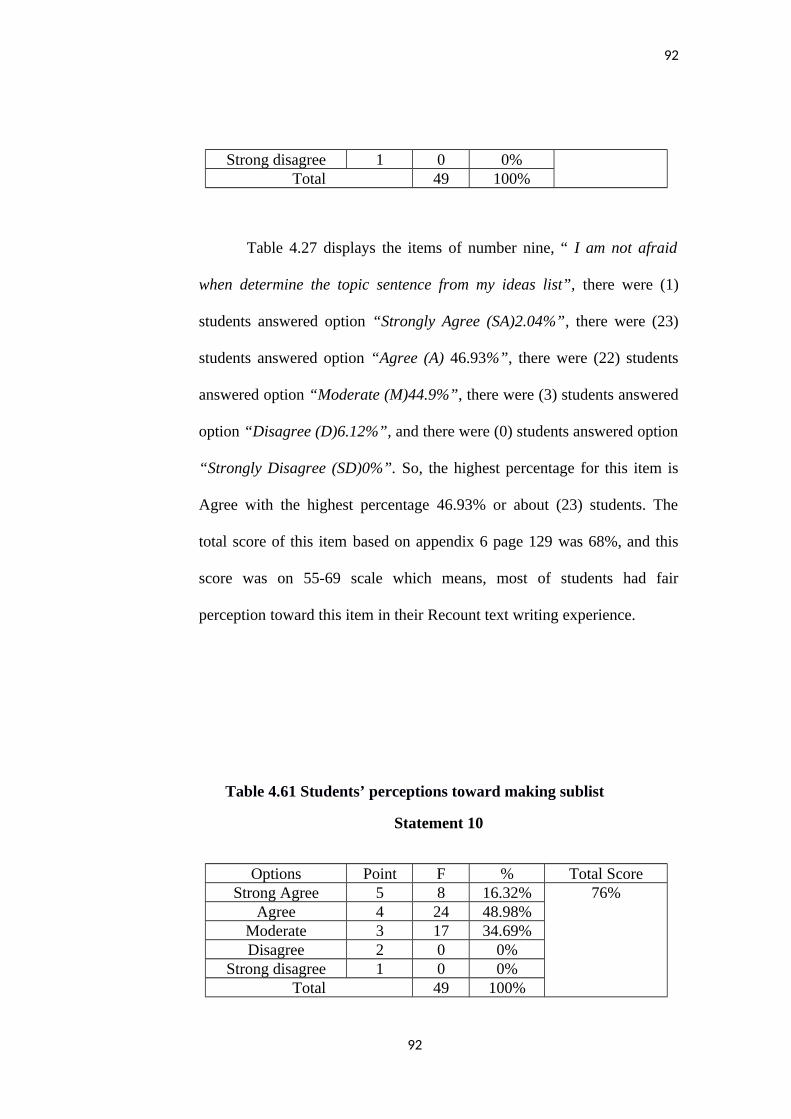
92
Strong disagree 1 0 0%Total 49 100%
Table 4.27 displays the items of number nine, “ I am not afraid
when determine the topic sentence from my ideas list”, there were (1)
students answered option “Strongly Agree (SA)2.04%”, there were (23)
students answered option “Agree (A) 46.93%”, there were (22) students
answered option “Moderate (M)44.9%”, there were (3) students answered
option “Disagree (D)6.12%”, and there were (0) students answered option
“Strongly Disagree (SD)0%”. So, the highest percentage for this item is
Agree with the highest percentage 46.93% or about (23) students. The
total score of this item based on appendix 6 page 129 was 68%, and this
score was on 55-69 scale which means, most of students had fair
perception toward this item in their Recount text writing experience.
Table 4.61 Students’ perceptions toward making sublist
Statement 10
Options Point F % Total ScoreStrong Agree 5 8 16.32% 76%
Agree 4 24 48.98%Moderate 3 17 34.69%Disagree 2 0 0%
Strong disagree 1 0 0%Total 49 100%
92
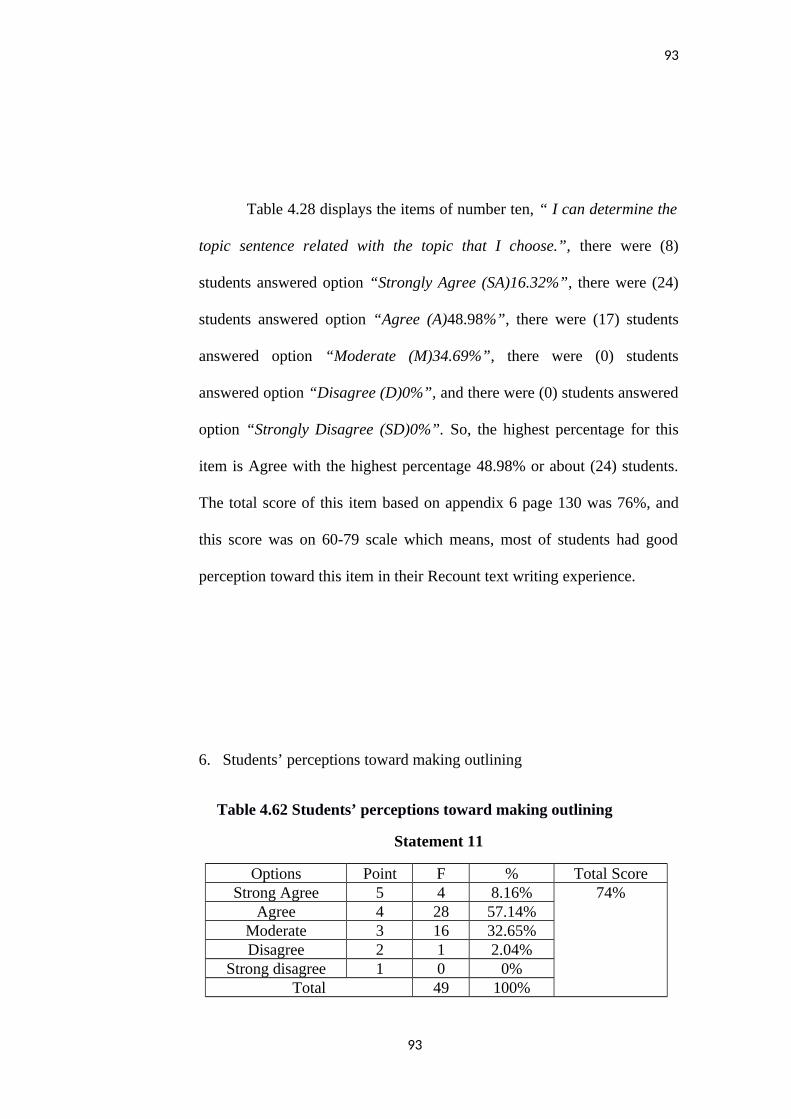
93
Table 4.28 displays the items of number ten, “ I can determine the
topic sentence related with the topic that I choose.”, there were (8)
students answered option “Strongly Agree (SA)16.32%”, there were (24)
students answered option “Agree (A)48.98%”, there were (17) students
answered option “Moderate (M)34.69%”, there were (0) students
answered option “Disagree (D)0%”, and there were (0) students answered
option “Strongly Disagree (SD)0%”. So, the highest percentage for this
item is Agree with the highest percentage 48.98% or about (24) students.
The total score of this item based on appendix 6 page 130 was 76%, and
this score was on 60-79 scale which means, most of students had good
perception toward this item in their Recount text writing experience.
6. Students’ perceptions toward making outlining
Table 4.62 Students’ perceptions toward making outlining
Statement 11
Options Point F % Total ScoreStrong Agree 5 4 8.16% 74%
Agree 4 28 57.14%Moderate 3 16 32.65%Disagree 2 1 2.04%
Strong disagree 1 0 0%Total 49 100%
93
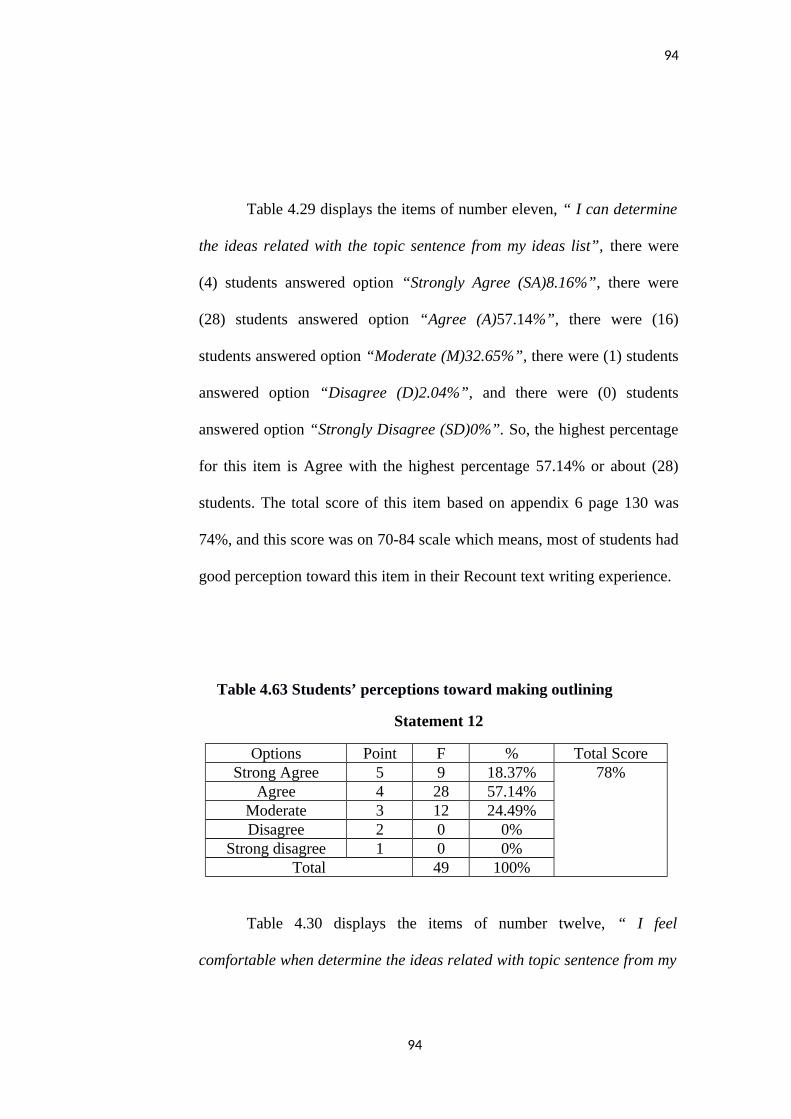
94
Table 4.29 displays the items of number eleven, “ I can determine
the ideas related with the topic sentence from my ideas list”, there were
(4) students answered option “Strongly Agree (SA)8.16%”, there were
(28) students answered option “Agree (A)57.14%”, there were (16)
students answered option “Moderate (M)32.65%”, there were (1) students
answered option “Disagree (D)2.04%”, and there were (0) students
answered option “Strongly Disagree (SD)0%”. So, the highest percentage
for this item is Agree with the highest percentage 57.14% or about (28)
students. The total score of this item based on appendix 6 page 130 was
74%, and this score was on 70-84 scale which means, most of students had
good perception toward this item in their Recount text writing experience.
Table 4.63 Students’ perceptions toward making outlining
Statement 12
Options Point F % Total ScoreStrong Agree 5 9 18.37% 78%
Agree 4 28 57.14%Moderate 3 12 24.49%Disagree 2 0 0%
Strong disagree 1 0 0%Total 49 100%
Table 4.30 displays the items of number twelve, “ I feel
comfortable when determine the ideas related with topic sentence from my
94

95
ideas list”, there were (9) students answered option “Strongly Agree
(SA)18.37%”, there were (28) students answered option “Agree
(A)57.14%”, there were (12) students answered option “Moderate
(M)24.49%”, there were (0) students answered option “Disagree (D)0%”,
and there were (0) students answered option “Strongly Disagree
(SD)0%”. So, the highest percentage for this item is Agree with the
highest percentage 57.14% or about (28) students. The total score of this
item based on appendix 6 page 130 was 78%, and this score was on 70-84
scale which means, most of students had good perception toward this item
in their Recount text writing experience.
7. Students’ perceptions toward writing the first rough draft
Table 4.64 Students’ perceptions toward writing the first rough draftStatement 13
Options Point F % Total ScoreStrong Agree 5 6 12.24% 76%
Agree 4 29 59.18%Moderate 3 14 28.57%Disagree 2 0 0%
Strong disagree 1 0 0%Total 49 100%
Table 4.31displays the items of number thirteen, “I feel calm when
writing the main sentence of my Recount text and develop it into a
95
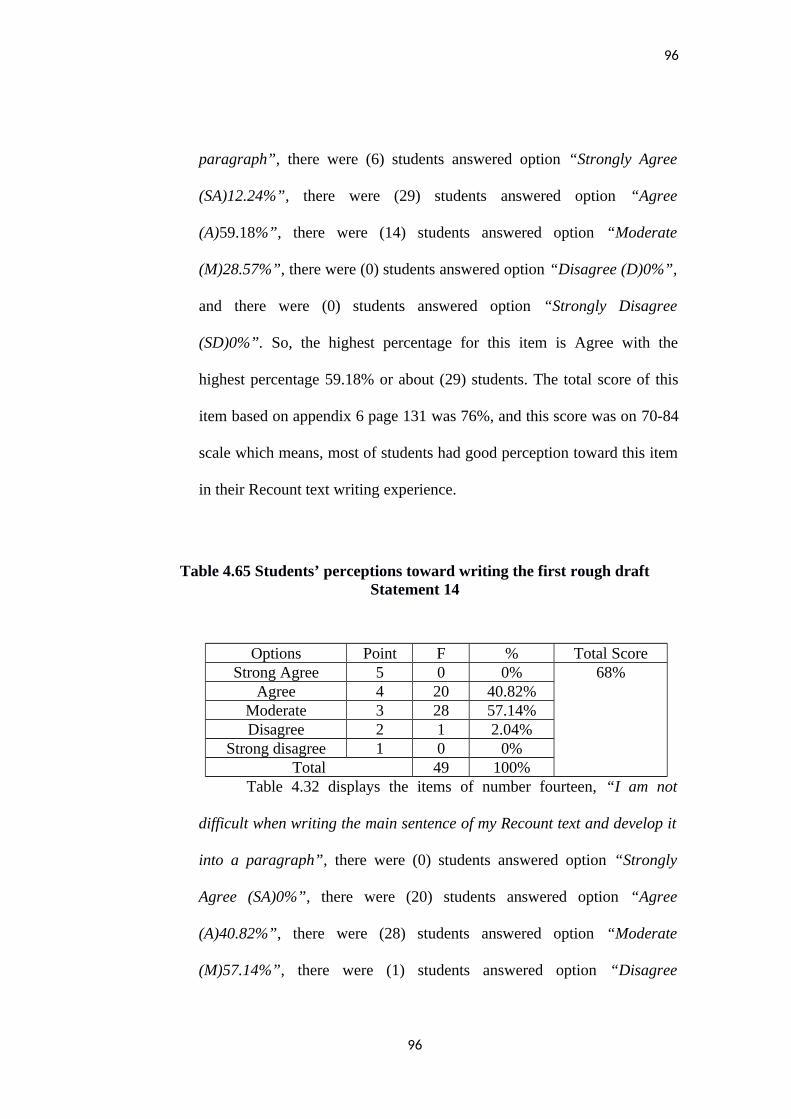
96
paragraph”, there were (6) students answered option “Strongly Agree
(SA)12.24%”, there were (29) students answered option “Agree
(A)59.18%”, there were (14) students answered option “Moderate
(M)28.57%”, there were (0) students answered option “Disagree (D)0%”,
and there were (0) students answered option “Strongly Disagree
(SD)0%”. So, the highest percentage for this item is Agree with the
highest percentage 59.18% or about (29) students. The total score of this
item based on appendix 6 page 131 was 76%, and this score was on 70-84
scale which means, most of students had good perception toward this item
in their Recount text writing experience.
Table 4.65 Students’ perceptions toward writing the first rough draftStatement 14
Options Point F % Total ScoreStrong Agree 5 0 0% 68%
Agree 4 20 40.82%Moderate 3 28 57.14%Disagree 2 1 2.04%
Strong disagree 1 0 0%Total 49 100%
Table 4.32 displays the items of number fourteen, “I am not
difficult when writing the main sentence of my Recount text and develop it
into a paragraph”, there were (0) students answered option “Strongly
Agree (SA)0%”, there were (20) students answered option “Agree
(A)40.82%”, there were (28) students answered option “Moderate
(M)57.14%”, there were (1) students answered option “Disagree
96
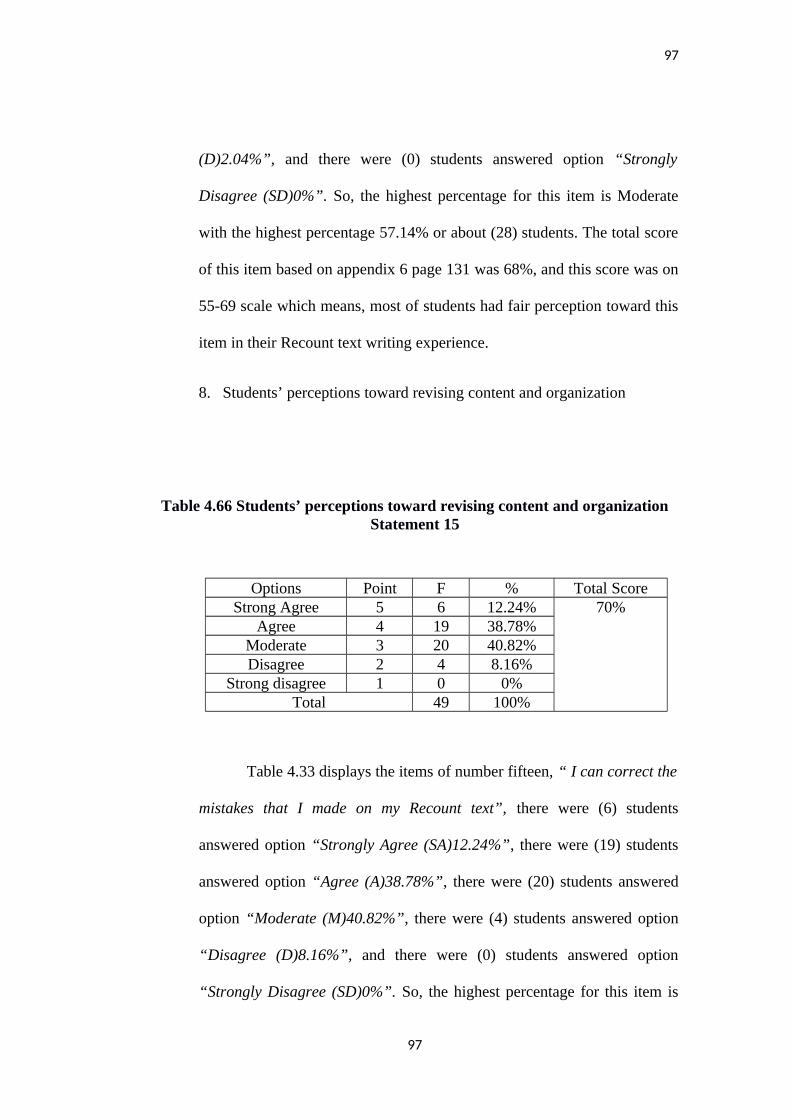
97
(D)2.04%”, and there were (0) students answered option “Strongly
Disagree (SD)0%”. So, the highest percentage for this item is Moderate
with the highest percentage 57.14% or about (28) students. The total score
of this item based on appendix 6 page 131 was 68%, and this score was on
55-69 scale which means, most of students had fair perception toward this
item in their Recount text writing experience.
8. Students’ perceptions toward revising content and organization
Table 4.66 Students’ perceptions toward revising content and organizationStatement 15
Options Point F % Total ScoreStrong Agree 5 6 12.24% 70%
Agree 4 19 38.78%Moderate 3 20 40.82%Disagree 2 4 8.16%
Strong disagree 1 0 0%Total 49 100%
Table 4.33 displays the items of number fifteen, “ I can correct the
mistakes that I made on my Recount text”, there were (6) students
answered option “Strongly Agree (SA)12.24%”, there were (19) students
answered option “Agree (A)38.78%”, there were (20) students answered
option “Moderate (M)40.82%”, there were (4) students answered option
“Disagree (D)8.16%”, and there were (0) students answered option
“Strongly Disagree (SD)0%”. So, the highest percentage for this item is
97
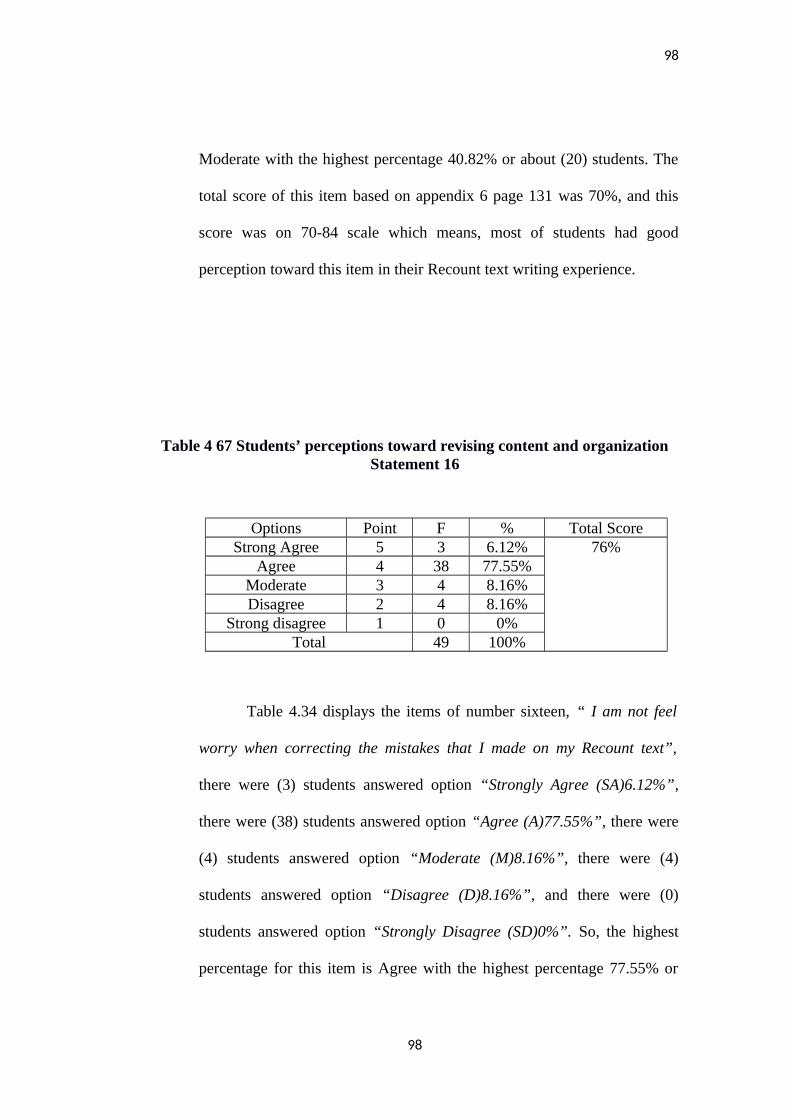
98
Moderate with the highest percentage 40.82% or about (20) students. The
total score of this item based on appendix 6 page 131 was 70%, and this
score was on 70-84 scale which means, most of students had good
perception toward this item in their Recount text writing experience.
Table 4 67 Students’ perceptions toward revising content and organizationStatement 16
Options Point F % Total ScoreStrong Agree 5 3 6.12% 76%
Agree 4 38 77.55%Moderate 3 4 8.16%Disagree 2 4 8.16%
Strong disagree 1 0 0%Total 49 100%
Table 4.34 displays the items of number sixteen, “ I am not feel
worry when correcting the mistakes that I made on my Recount text”,
there were (3) students answered option “Strongly Agree (SA)6.12%”,
there were (38) students answered option “Agree (A)77.55%”, there were
(4) students answered option “Moderate (M)8.16%”, there were (4)
students answered option “Disagree (D)8.16%”, and there were (0)
students answered option “Strongly Disagree (SD)0%”. So, the highest
percentage for this item is Agree with the highest percentage 77.55% or
98
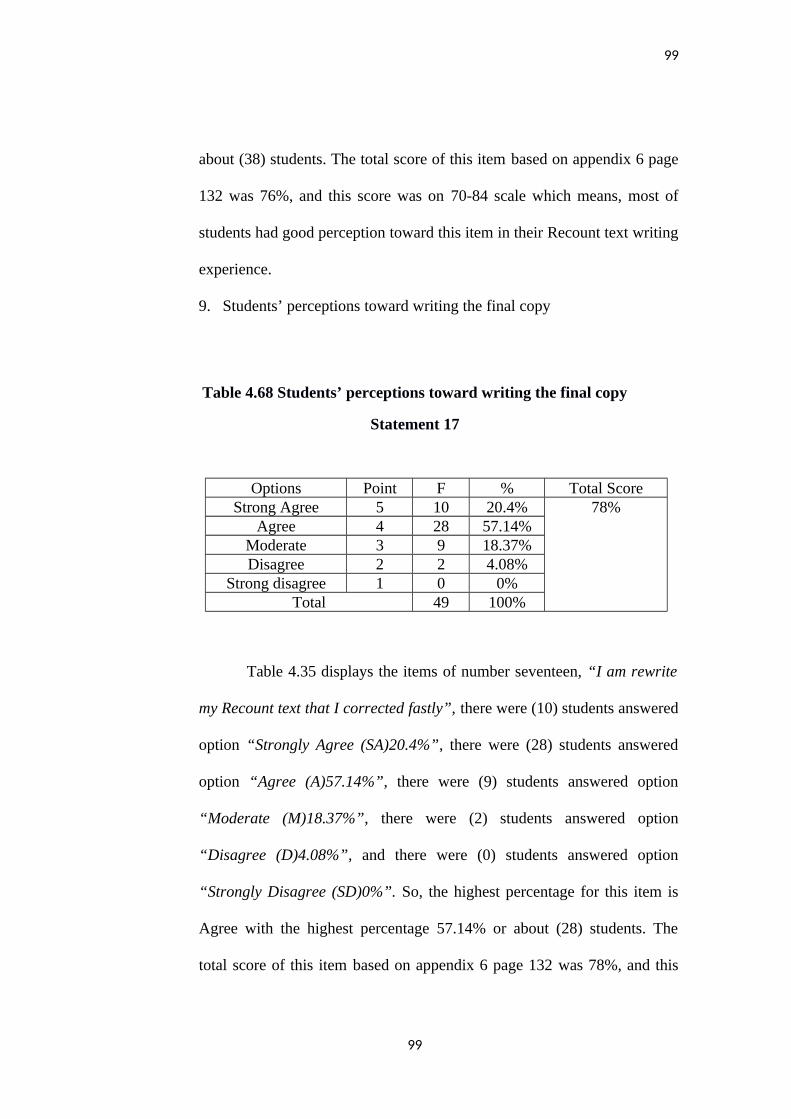
99
about (38) students. The total score of this item based on appendix 6 page
132 was 76%, and this score was on 70-84 scale which means, most of
students had good perception toward this item in their Recount text writing
experience.
9. Students’ perceptions toward writing the final copy
Table 4.68 Students’ perceptions toward writing the final copy
Statement 17
Options Point F % Total ScoreStrong Agree 5 10 20.4% 78%
Agree 4 28 57.14%Moderate 3 9 18.37%Disagree 2 2 4.08%
Strong disagree 1 0 0%Total 49 100%
Table 4.35 displays the items of number seventeen, “I am rewrite
my Recount text that I corrected fastly”, there were (10) students answered
option “Strongly Agree (SA)20.4%”, there were (28) students answered
option “Agree (A)57.14%”, there were (9) students answered option
“Moderate (M)18.37%”, there were (2) students answered option
“Disagree (D)4.08%”, and there were (0) students answered option
“Strongly Disagree (SD)0%”. So, the highest percentage for this item is
Agree with the highest percentage 57.14% or about (28) students. The
total score of this item based on appendix 6 page 132 was 78%, and this
99
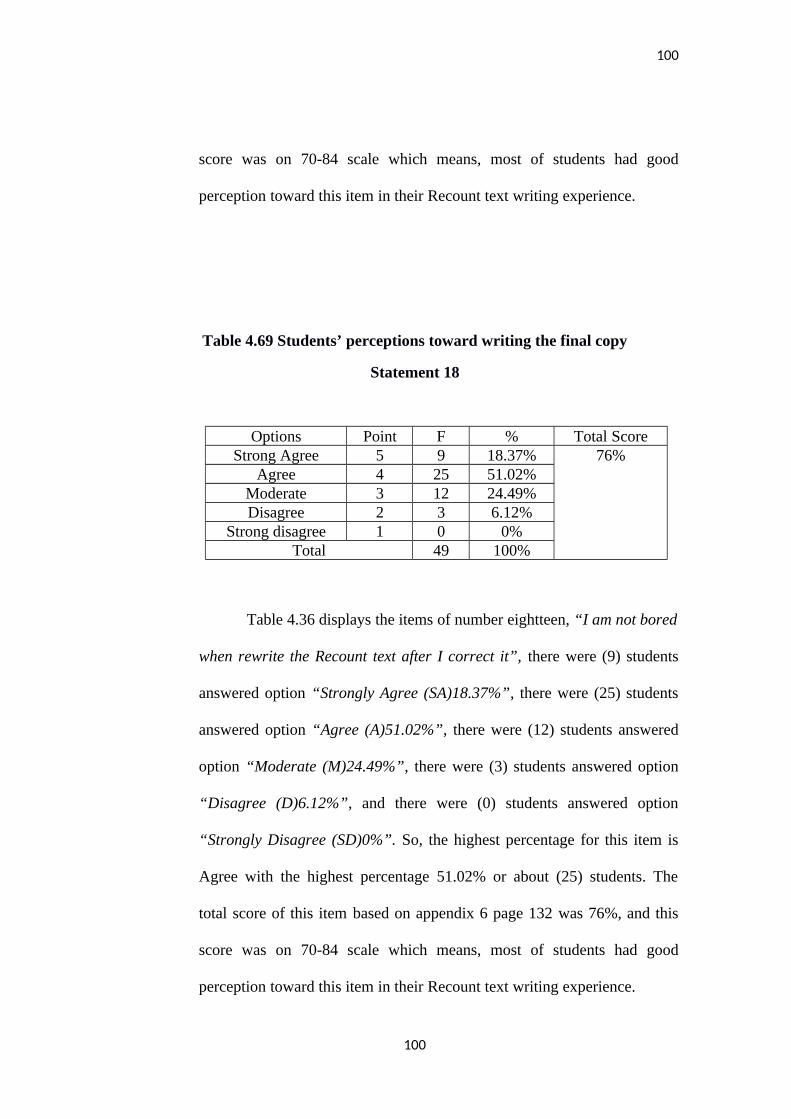
100
score was on 70-84 scale which means, most of students had good
perception toward this item in their Recount text writing experience.
Table 4.69 Students’ perceptions toward writing the final copy
Statement 18
Options Point F % Total ScoreStrong Agree 5 9 18.37% 76%
Agree 4 25 51.02%Moderate 3 12 24.49%Disagree 2 3 6.12%
Strong disagree 1 0 0%Total 49 100%
Table 4.36 displays the items of number eightteen, “I am not bored
when rewrite the Recount text after I correct it”, there were (9) students
answered option “Strongly Agree (SA)18.37%”, there were (25) students
answered option “Agree (A)51.02%”, there were (12) students answered
option “Moderate (M)24.49%”, there were (3) students answered option
“Disagree (D)6.12%”, and there were (0) students answered option
“Strongly Disagree (SD)0%”. So, the highest percentage for this item is
Agree with the highest percentage 51.02% or about (25) students. The
total score of this item based on appendix 6 page 132 was 76%, and this
score was on 70-84 scale which means, most of students had good
perception toward this item in their Recount text writing experience.
100
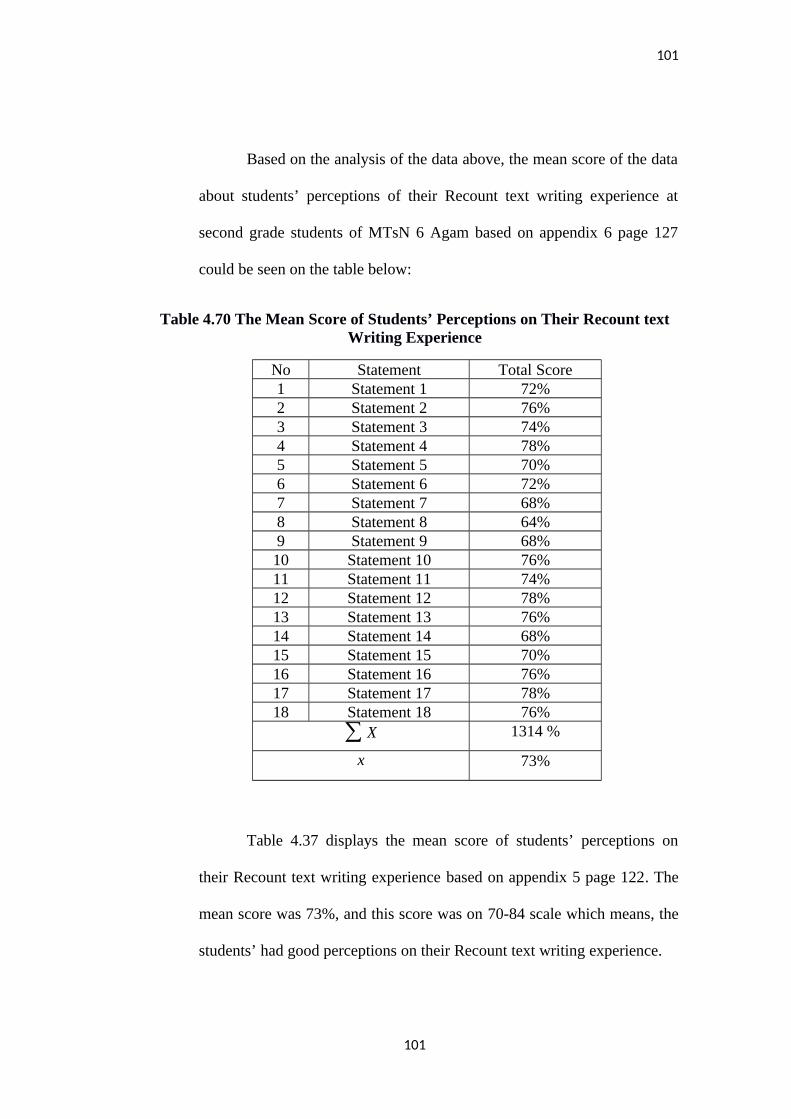
101
Based on the analysis of the data above, the mean score of the data
about students’ perceptions of their Recount text writing experience at
second grade students of MTsN 6 Agam based on appendix 6 page 127
could be seen on the table below:
Table 4.70 The Mean Score of Students’ Perceptions on Their Recount textWriting Experience
No Statement Total Score1 Statement 1 72%2 Statement 2 76%3 Statement 3 74%4 Statement 4 78%5 Statement 5 70%6 Statement 6 72%7 Statement 7 68%8 Statement 8 64%9 Statement 9 68%10 Statement 10 76%11 Statement 11 74%12 Statement 12 78%13 Statement 13 76%14 Statement 14 68%15 Statement 15 70%16 Statement 16 76%17 Statement 17 78%18 Statement 18 76%
∑ X 1314 %
x 73%
Table 4.37 displays the mean score of students’ perceptions on
their Recount text writing experience based on appendix 5 page 122. The
mean score was 73%, and this score was on 70-84 scale which means, the
students’ had good perceptions on their Recount text writing experience.
101
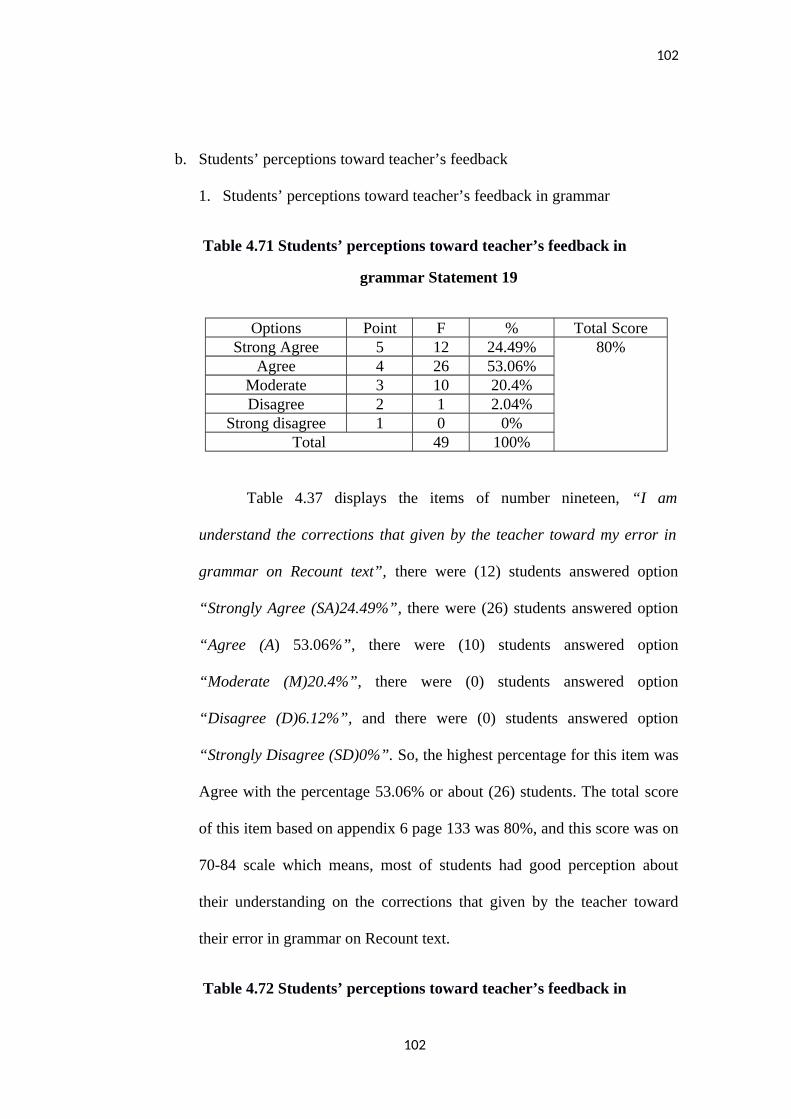
102
b. Students’ perceptions toward teacher’s feedback
1. Students’ perceptions toward teacher’s feedback in grammar
Table 4.71 Students’ perceptions toward teacher’s feedback in
grammar Statement 19
Options Point F % Total ScoreStrong Agree 5 12 24.49% 80%
Agree 4 26 53.06%Moderate 3 10 20.4%Disagree 2 1 2.04%
Strong disagree 1 0 0%Total 49 100%
Table 4.37 displays the items of number nineteen, “I am
understand the corrections that given by the teacher toward my error in
grammar on Recount text”, there were (12) students answered option
“Strongly Agree (SA)24.49%”, there were (26) students answered option
“Agree (A) 53.06%”, there were (10) students answered option
“Moderate (M)20.4%”, there were (0) students answered option
“Disagree (D)6.12%”, and there were (0) students answered option
“Strongly Disagree (SD)0%”. So, the highest percentage for this item was
Agree with the percentage 53.06% or about (26) students. The total score
of this item based on appendix 6 page 133 was 80%, and this score was on
70-84 scale which means, most of students had good perception about
their understanding on the corrections that given by the teacher toward
their error in grammar on Recount text.
Table 4.72 Students’ perceptions toward teacher’s feedback in
102
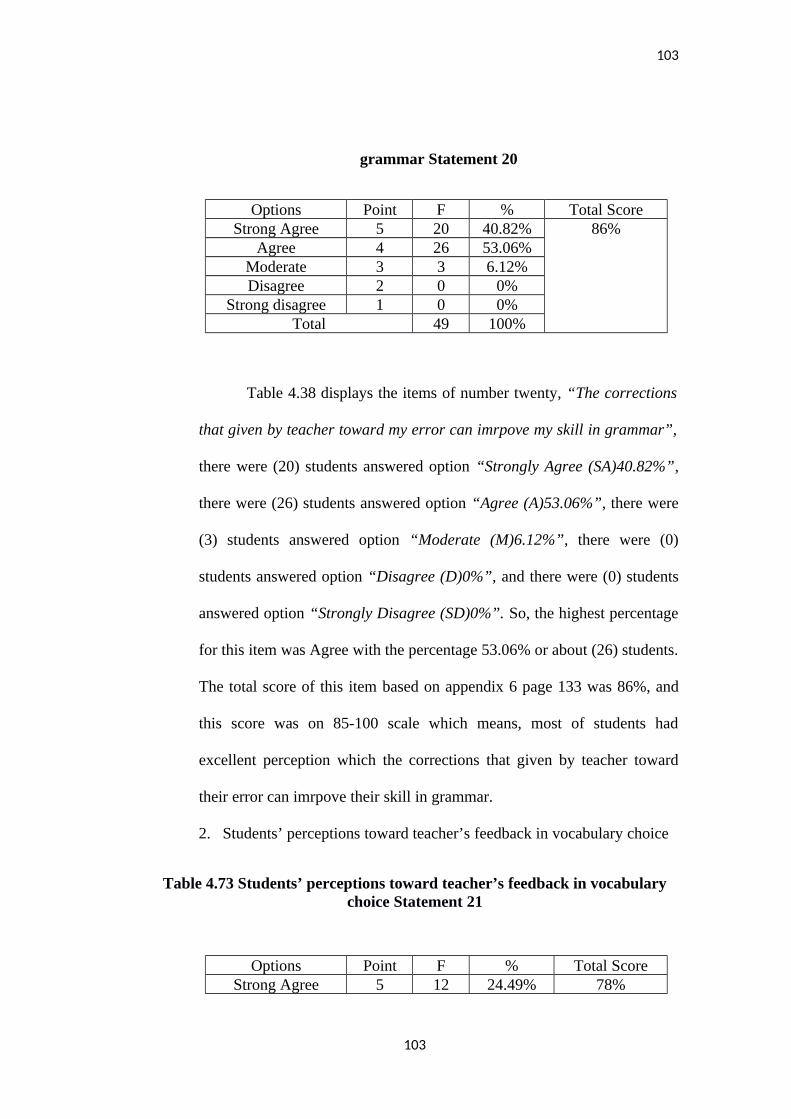
103
grammar Statement 20
Options Point F % Total ScoreStrong Agree 5 20 40.82% 86%
Agree 4 26 53.06%Moderate 3 3 6.12%Disagree 2 0 0%
Strong disagree 1 0 0%Total 49 100%
Table 4.38 displays the items of number twenty, “The corrections
that given by teacher toward my error can imrpove my skill in grammar”,
there were (20) students answered option “Strongly Agree (SA)40.82%”,
there were (26) students answered option “Agree (A)53.06%”, there were
(3) students answered option “Moderate (M)6.12%”, there were (0)
students answered option “Disagree (D)0%”, and there were (0) students
answered option “Strongly Disagree (SD)0%”. So, the highest percentage
for this item was Agree with the percentage 53.06% or about (26) students.
The total score of this item based on appendix 6 page 133 was 86%, and
this score was on 85-100 scale which means, most of students had
excellent perception which the corrections that given by teacher toward
their error can imrpove their skill in grammar.
2. Students’ perceptions toward teacher’s feedback in vocabulary choice
Table 4.73 Students’ perceptions toward teacher’s feedback in vocabularychoice Statement 21
Options Point F % Total ScoreStrong Agree 5 12 24.49% 78%
103
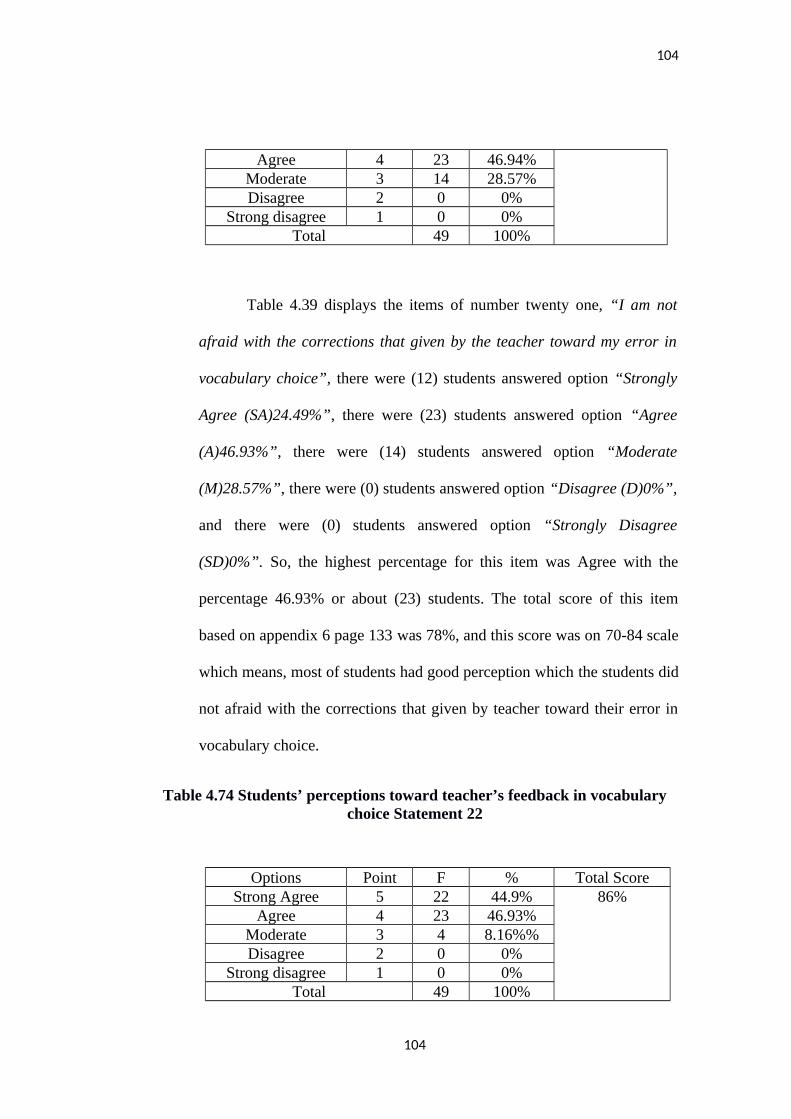
104
Agree 4 23 46.94%Moderate 3 14 28.57%Disagree 2 0 0%
Strong disagree 1 0 0%Total 49 100%
Table 4.39 displays the items of number twenty one, “I am not
afraid with the corrections that given by the teacher toward my error in
vocabulary choice”, there were (12) students answered option “Strongly
Agree (SA)24.49%”, there were (23) students answered option “Agree
(A)46.93%”, there were (14) students answered option “Moderate
(M)28.57%”, there were (0) students answered option “Disagree (D)0%”,
and there were (0) students answered option “Strongly Disagree
(SD)0%”. So, the highest percentage for this item was Agree with the
percentage 46.93% or about (23) students. The total score of this item
based on appendix 6 page 133 was 78%, and this score was on 70-84 scale
which means, most of students had good perception which the students did
not afraid with the corrections that given by teacher toward their error in
vocabulary choice.
Table 4.74 Students’ perceptions toward teacher’s feedback in vocabularychoice Statement 22
Options Point F % Total ScoreStrong Agree 5 22 44.9% 86%
Agree 4 23 46.93%Moderate 3 4 8.16%%Disagree 2 0 0%
Strong disagree 1 0 0%Total 49 100%
104
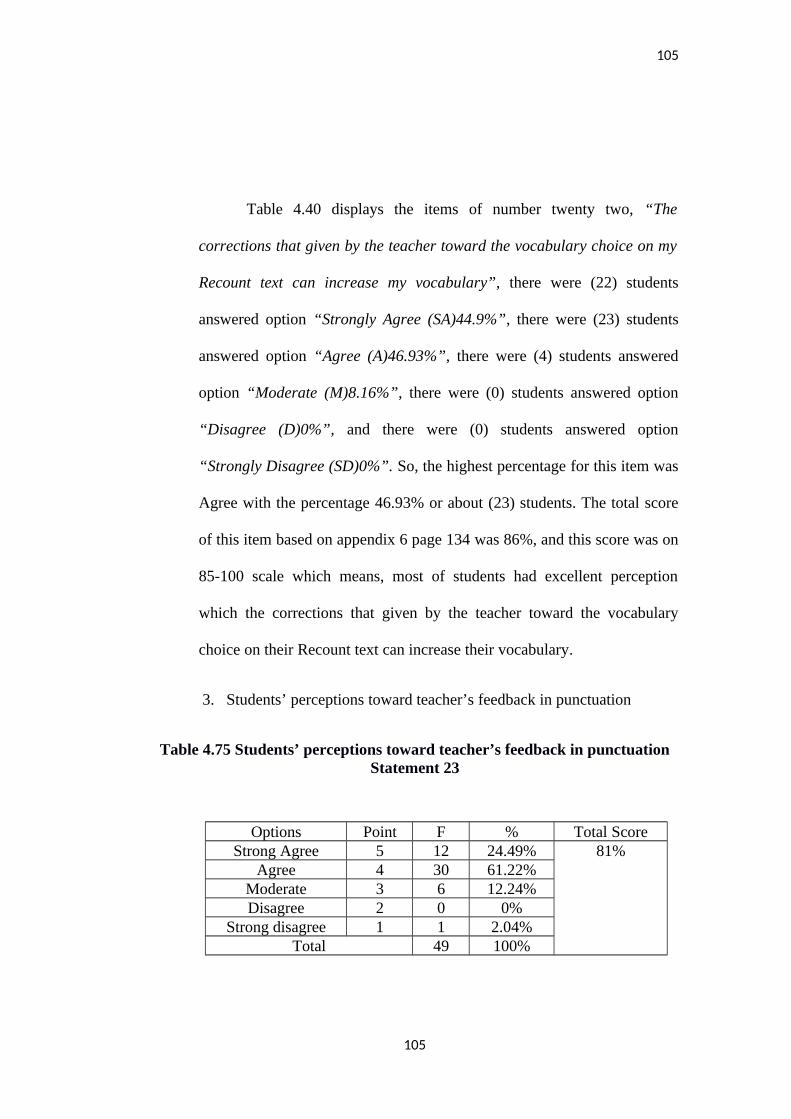
105
Table 4.40 displays the items of number twenty two, “The
corrections that given by the teacher toward the vocabulary choice on my
Recount text can increase my vocabulary”, there were (22) students
answered option “Strongly Agree (SA)44.9%”, there were (23) students
answered option “Agree (A)46.93%”, there were (4) students answered
option “Moderate (M)8.16%”, there were (0) students answered option
“Disagree (D)0%”, and there were (0) students answered option
“Strongly Disagree (SD)0%”. So, the highest percentage for this item was
Agree with the percentage 46.93% or about (23) students. The total score
of this item based on appendix 6 page 134 was 86%, and this score was on
85-100 scale which means, most of students had excellent perception
which the corrections that given by the teacher toward the vocabulary
choice on their Recount text can increase their vocabulary.
3. Students’ perceptions toward teacher’s feedback in punctuation
Table 4.75 Students’ perceptions toward teacher’s feedback in punctuationStatement 23
Options Point F % Total ScoreStrong Agree 5 12 24.49% 81%
Agree 4 30 61.22%Moderate 3 6 12.24%Disagree 2 0 0%
Strong disagree 1 1 2.04%Total 49 100%
105

106
Table 4.41 displays the items of number twenty three, “ I am
understanding the corrections that given by the teacher toward my error
in punctuation on my Recount text”, there were (12) students answered
option “Strongly Agree (SA)24.49%”, there were (30) students answered
option “Agree (A)61.22%”, there were (6) students answered option
“Moderate (M)12.24%”, there were (0) students answered option
“Disagree (D)0%”, and there were (1) students answered option
“Strongly Disagree (SD)2.04%”. So, the highest percentage for this item
was Agree with the percentage 61.22% or about (30) students. The total
score of this item based on appendix 6 page 134 was 81%, and this score
was on 70-84 scale which means, most of students had good perception
which the students understanding the corrections that given by the teacher
toward their error in punctuation on their Recount text.
Table 4.76 Tabel Students’ perceptions toward teacher’s feedback inpunctuation Statement 24
Options Point F % Total ScoreStrong Agree 5 16 32.65% 84%
Agree 4 26 53.06%Moderate 3 7 14.29%Disagree 2 0 0%
Strong disagree 1 0 0%Total 49 100%
Table 4.42 displays the items of number twenty four, “I am feel
satisfied with the corrections that given by the teacher toward my error in
punctuation on my Recount text”, there were (16) students answered
106

107
option “Strongly Agree (SA)32.65%”, there were (26) students answered
option “Agree (A)53.06%”, there were (7) students answered option
“Moderate (M)14.29%”, there were (0) students answered option
“Disagree (D)0%”, and there were (0) students answered option
“Strongly Disagree (SD)0%”. So, the highest percentage for this item was
Agree with the percentage 53.06% or about (26) students. The total score
of this item based on appendix 6 page 134 was 84%, and this score was on
70-84 scale which mean, most of students had good perception which the
students feel satisfied with the corrections that given by the teacher toward
their error in punctuation on their Recount text.
3. Students’ perceptions toward teacher’s feedback in spelling
Table 4.77 Students’ perceptions toward teacher’s feedback in spellingStatement 25
Options Point F % Total ScoreStrong Agree 5 13 26.53% 82%
Agree 4 29 59.18%Moderate 3 7 14.29%Disagree 2 0 0%
Strong disagree 1 0 0%Total 49 100%
Table 4.43 displays the items of number twenty five, “I am not feel
saturate with the corrections that given by the teacher toward my error in
spelling on my Recount text”, there were (13) students answered option
“Strongly Agree (SA)26.53%”, there were (29) students answered option
107
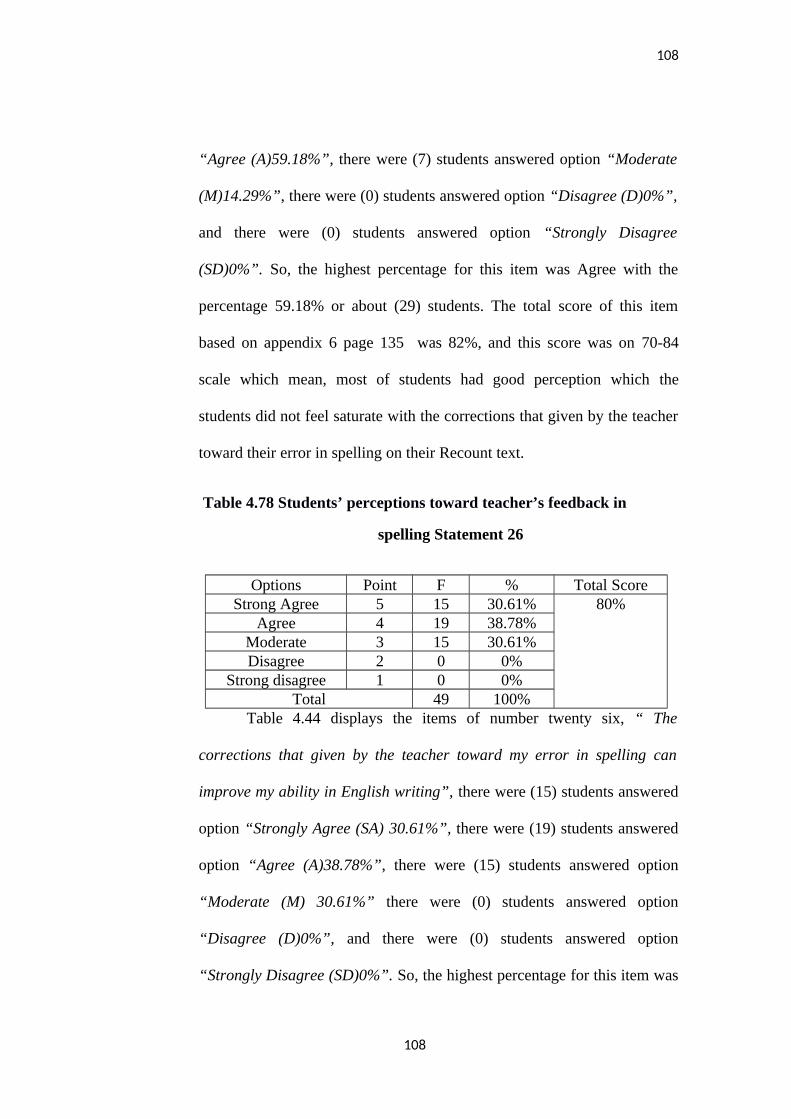
108
“Agree (A)59.18%”, there were (7) students answered option “Moderate
(M)14.29%”, there were (0) students answered option “Disagree (D)0%”,
and there were (0) students answered option “Strongly Disagree
(SD)0%”. So, the highest percentage for this item was Agree with the
percentage 59.18% or about (29) students. The total score of this item
based on appendix 6 page 135 was 82%, and this score was on 70-84
scale which mean, most of students had good perception which the
students did not feel saturate with the corrections that given by the teacher
toward their error in spelling on their Recount text.
Table 4.78 Students’ perceptions toward teacher’s feedback in
spelling Statement 26
Options Point F % Total ScoreStrong Agree 5 15 30.61% 80%
Agree 4 19 38.78%Moderate 3 15 30.61%Disagree 2 0 0%
Strong disagree 1 0 0%Total 49 100%
Table 4.44 displays the items of number twenty six, “ The
corrections that given by the teacher toward my error in spelling can
improve my ability in English writing”, there were (15) students answered
option “Strongly Agree (SA) 30.61%”, there were (19) students answered
option “Agree (A)38.78%”, there were (15) students answered option
“Moderate (M) 30.61%” there were (0) students answered option
“Disagree (D)0%”, and there were (0) students answered option
“Strongly Disagree (SD)0%”. So, the highest percentage for this item was
108
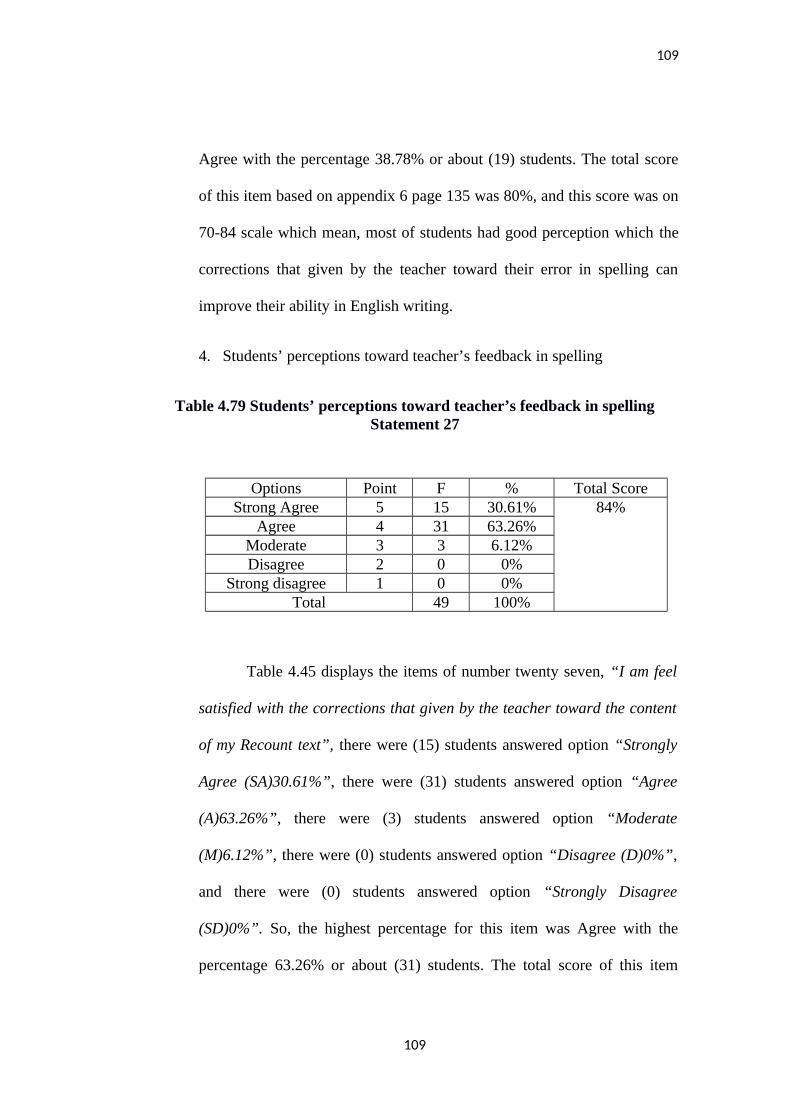
109
Agree with the percentage 38.78% or about (19) students. The total score
of this item based on appendix 6 page 135 was 80%, and this score was on
70-84 scale which mean, most of students had good perception which the
corrections that given by the teacher toward their error in spelling can
improve their ability in English writing.
4. Students’ perceptions toward teacher’s feedback in spelling
Table 4.79 Students’ perceptions toward teacher’s feedback in spellingStatement 27
Options Point F % Total ScoreStrong Agree 5 15 30.61% 84%
Agree 4 31 63.26%Moderate 3 3 6.12%Disagree 2 0 0%
Strong disagree 1 0 0%Total 49 100%
Table 4.45 displays the items of number twenty seven, “I am feel
satisfied with the corrections that given by the teacher toward the content
of my Recount text”, there were (15) students answered option “Strongly
Agree (SA)30.61%”, there were (31) students answered option “Agree
(A)63.26%”, there were (3) students answered option “Moderate
(M)6.12%”, there were (0) students answered option “Disagree (D)0%”,
and there were (0) students answered option “Strongly Disagree
(SD)0%”. So, the highest percentage for this item was Agree with the
percentage 63.26% or about (31) students. The total score of this item
109
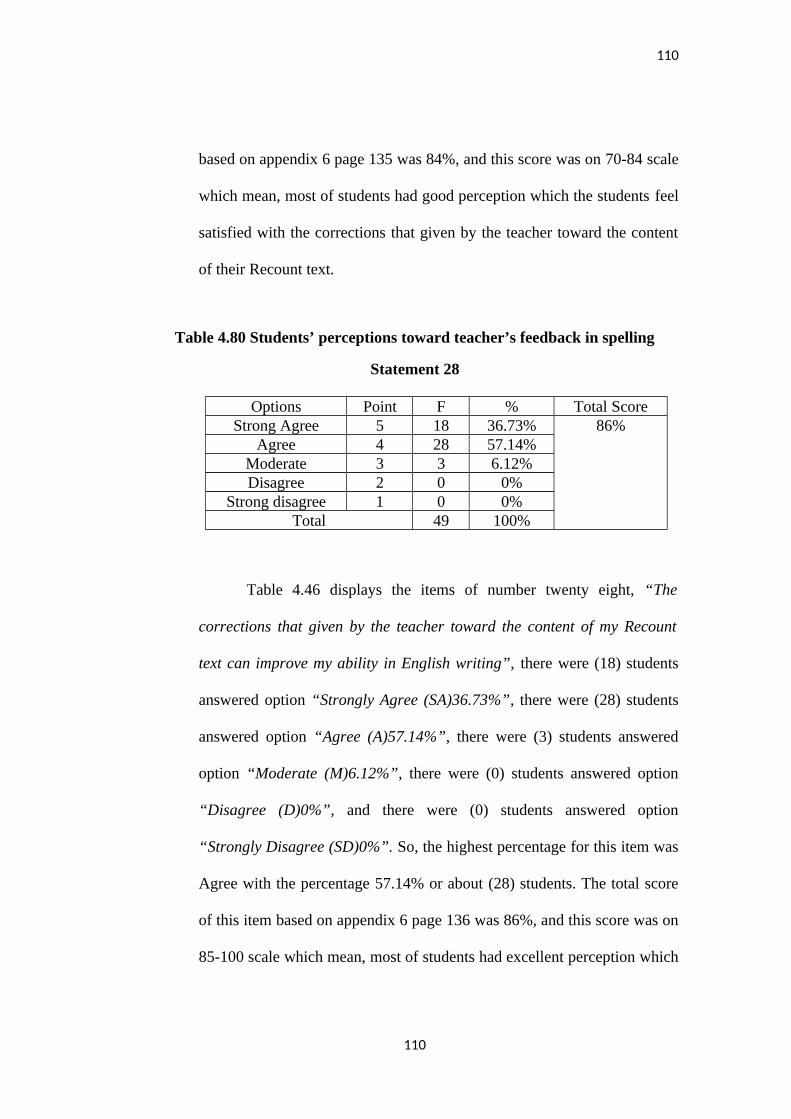
110
based on appendix 6 page 135 was 84%, and this score was on 70-84 scale
which mean, most of students had good perception which the students feel
satisfied with the corrections that given by the teacher toward the content
of their Recount text.
Table 4.80 Students’ perceptions toward teacher’s feedback in spelling
Statement 28
Options Point F % Total ScoreStrong Agree 5 18 36.73% 86%
Agree 4 28 57.14%Moderate 3 3 6.12%Disagree 2 0 0%
Strong disagree 1 0 0%Total 49 100%
Table 4.46 displays the items of number twenty eight, “The
corrections that given by the teacher toward the content of my Recount
text can improve my ability in English writing”, there were (18) students
answered option “Strongly Agree (SA)36.73%”, there were (28) students
answered option “Agree (A)57.14%”, there were (3) students answered
option “Moderate (M)6.12%”, there were (0) students answered option
“Disagree (D)0%”, and there were (0) students answered option
“Strongly Disagree (SD)0%”. So, the highest percentage for this item was
Agree with the percentage 57.14% or about (28) students. The total score
of this item based on appendix 6 page 136 was 86%, and this score was on
85-100 scale which mean, most of students had excellent perception which
110
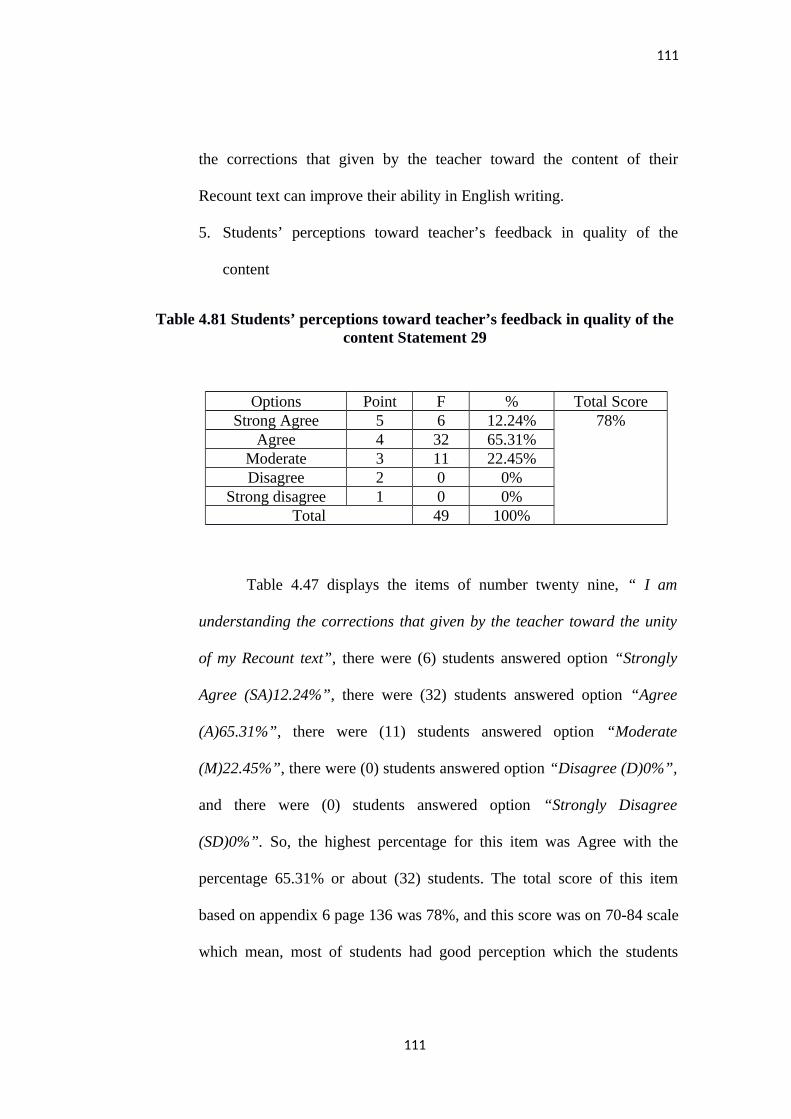
111
the corrections that given by the teacher toward the content of their
Recount text can improve their ability in English writing.
5. Students’ perceptions toward teacher’s feedback in quality of the
content
Table 4.81 Students’ perceptions toward teacher’s feedback in quality of thecontent Statement 29
Options Point F % Total ScoreStrong Agree 5 6 12.24% 78%
Agree 4 32 65.31%Moderate 3 11 22.45%Disagree 2 0 0%
Strong disagree 1 0 0%Total 49 100%
Table 4.47 displays the items of number twenty nine, “ I am
understanding the corrections that given by the teacher toward the unity
of my Recount text”, there were (6) students answered option “Strongly
Agree (SA)12.24%”, there were (32) students answered option “Agree
(A)65.31%”, there were (11) students answered option “Moderate
(M)22.45%”, there were (0) students answered option “Disagree (D)0%”,
and there were (0) students answered option “Strongly Disagree
(SD)0%”. So, the highest percentage for this item was Agree with the
percentage 65.31% or about (32) students. The total score of this item
based on appendix 6 page 136 was 78%, and this score was on 70-84 scale
which mean, most of students had good perception which the students
111
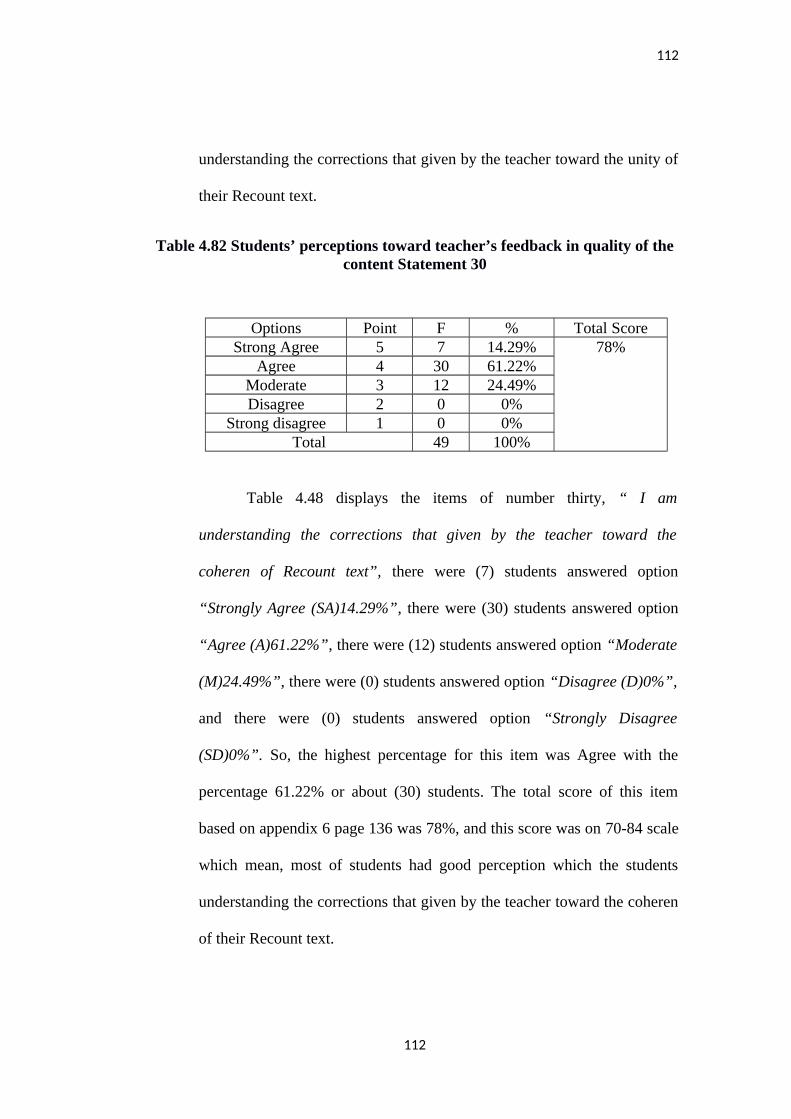
112
understanding the corrections that given by the teacher toward the unity of
their Recount text.
Table 4.82 Students’ perceptions toward teacher’s feedback in quality of thecontent Statement 30
Options Point F % Total ScoreStrong Agree 5 7 14.29% 78%
Agree 4 30 61.22%Moderate 3 12 24.49%Disagree 2 0 0%
Strong disagree 1 0 0%Total 49 100%
Table 4.48 displays the items of number thirty, “ I am
understanding the corrections that given by the teacher toward the
coheren of Recount text”, there were (7) students answered option
“Strongly Agree (SA)14.29%”, there were (30) students answered option
“Agree (A)61.22%”, there were (12) students answered option “Moderate
(M)24.49%”, there were (0) students answered option “Disagree (D)0%”,
and there were (0) students answered option “Strongly Disagree
(SD)0%”. So, the highest percentage for this item was Agree with the
percentage 61.22% or about (30) students. The total score of this item
based on appendix 6 page 136 was 78%, and this score was on 70-84 scale
which mean, most of students had good perception which the students
understanding the corrections that given by the teacher toward the coheren
of their Recount text.
112
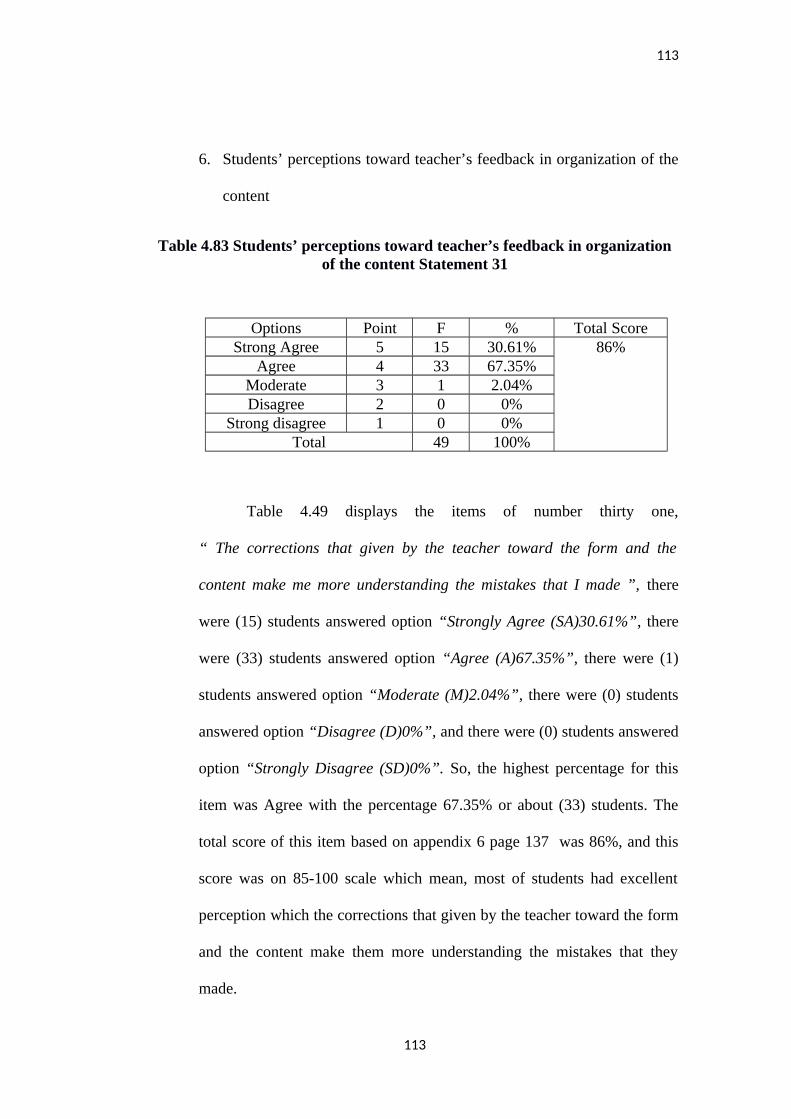
113
6. Students’ perceptions toward teacher’s feedback in organization of the
content
Table 4.83 Students’ perceptions toward teacher’s feedback in organizationof the content Statement 31
Options Point F % Total ScoreStrong Agree 5 15 30.61% 86%
Agree 4 33 67.35%Moderate 3 1 2.04%Disagree 2 0 0%
Strong disagree 1 0 0%Total 49 100%
Table 4.49 displays the items of number thirty one,
“ The corrections that given by the teacher toward the form and the
content make me more understanding the mistakes that I made ”, there
were (15) students answered option “Strongly Agree (SA)30.61%”, there
were (33) students answered option “Agree (A)67.35%”, there were (1)
students answered option “Moderate (M)2.04%”, there were (0) students
answered option “Disagree (D)0%”, and there were (0) students answered
option “Strongly Disagree (SD)0%”. So, the highest percentage for this
item was Agree with the percentage 67.35% or about (33) students. The
total score of this item based on appendix 6 page 137 was 86%, and this
score was on 85-100 scale which mean, most of students had excellent
perception which the corrections that given by the teacher toward the form
and the content make them more understanding the mistakes that they
made.
113
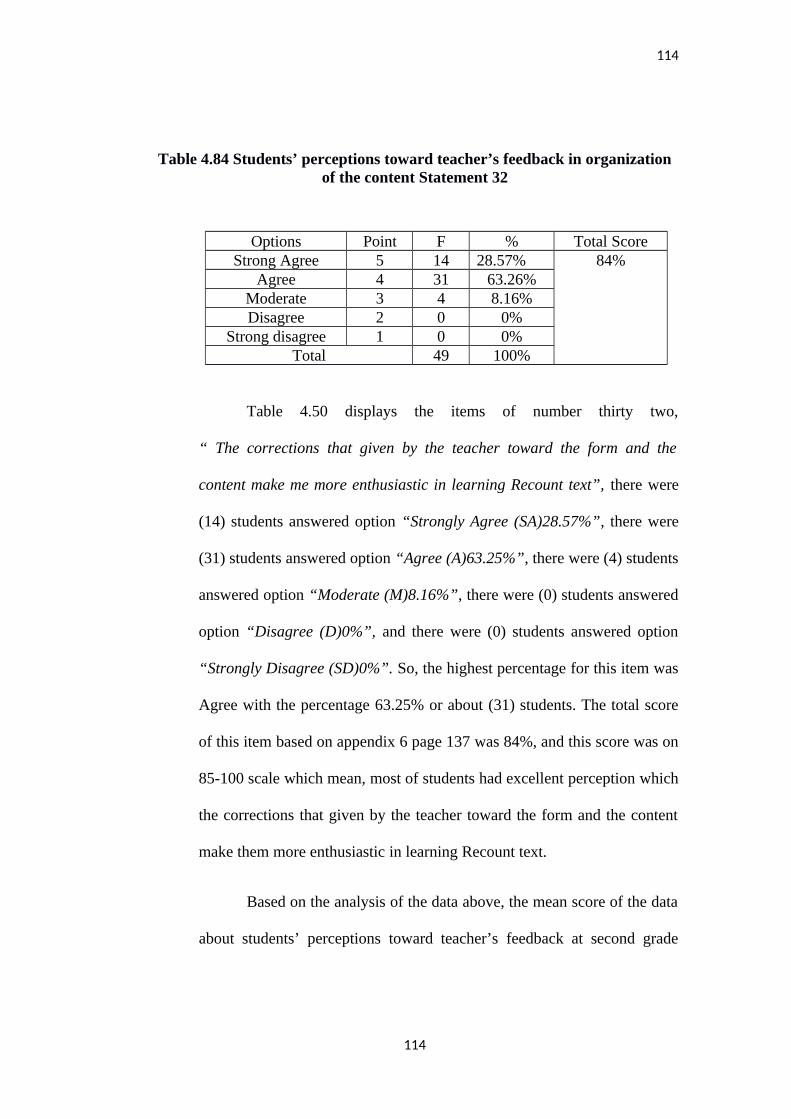
114
Table 4.84 Students’ perceptions toward teacher’s feedback in organizationof the content Statement 32
Options Point F % Total ScoreStrong Agree 5 14 28.57% 84%
Agree 4 31 63.26%Moderate 3 4 8.16%Disagree 2 0 0%
Strong disagree 1 0 0%Total 49 100%
Table 4.50 displays the items of number thirty two,
“ The corrections that given by the teacher toward the form and the
content make me more enthusiastic in learning Recount text”, there were
(14) students answered option “Strongly Agree (SA)28.57%”, there were
(31) students answered option “Agree (A)63.25%”, there were (4) students
answered option “Moderate (M)8.16%”, there were (0) students answered
option “Disagree (D)0%”, and there were (0) students answered option
“Strongly Disagree (SD)0%”. So, the highest percentage for this item was
Agree with the percentage 63.25% or about (31) students. The total score
of this item based on appendix 6 page 137 was 84%, and this score was on
85-100 scale which mean, most of students had excellent perception which
the corrections that given by the teacher toward the form and the content
make them more enthusiastic in learning Recount text.
Based on the analysis of the data above, the mean score of the data
about students’ perceptions toward teacher’s feedback at second grade
114
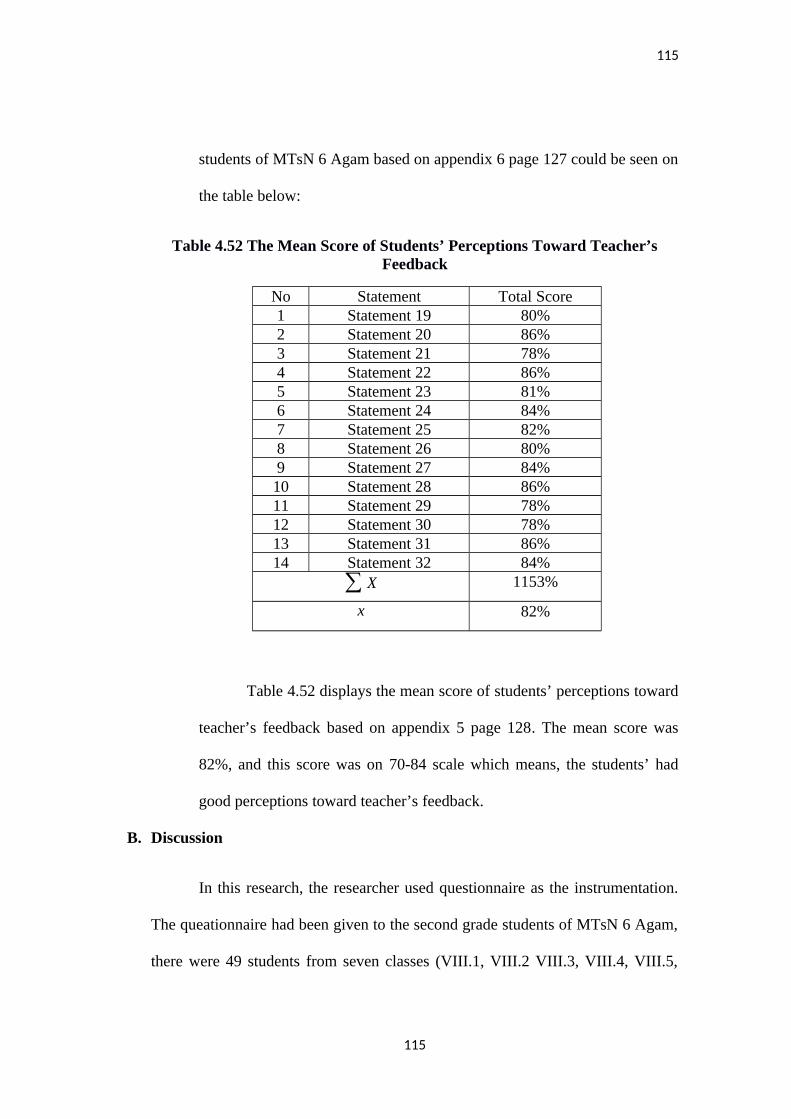
115
students of MTsN 6 Agam based on appendix 6 page 127 could be seen on
the table below:
Table 4.52 The Mean Score of Students’ Perceptions Toward Teacher’sFeedback
No Statement Total Score1 Statement 19 80%2 Statement 20 86%3 Statement 21 78%4 Statement 22 86%5 Statement 23 81%6 Statement 24 84%7 Statement 25 82%8 Statement 26 80%9 Statement 27 84%10 Statement 28 86%11 Statement 29 78%12 Statement 30 78%13 Statement 31 86%14 Statement 32 84%
∑ X 1153%
x 82%
Table 4.52 displays the mean score of students’ perceptions toward
teacher’s feedback based on appendix 5 page 128. The mean score was
82%, and this score was on 70-84 scale which means, the students’ had
good perceptions toward teacher’s feedback.
B. Discussion
In this research, the researcher used questionnaire as the instrumentation.
The queationnaire had been given to the second grade students of MTsN 6 Agam,
there were 49 students from seven classes (VIII.1, VIII.2 VIII.3, VIII.4, VIII.5,
115
116
VIII.6, VIII.7) as the respondents. The questionnaire given was included two
variable, the students’ perceptions of their Recount text writing experience and the
students’ perceptions toward teacher’s feedback.
There were three sub variable for students’ perceptions of their Recount
text writing experience which consisted nine indicators. The indicators were about
students’ exeperience when writing Recount text they were choosing the topic,
narrowing the topic, generate the ideas, making sublist, writing the topic,
outlining, writing the first rought draft, revising content and organization, and
writing the final copy tthe total of statement for students’ perceptions of their
Recount text writing experience was 18 statements.
Furthermore, there were also three sub variables for the students’
perceptions toward teacher’s feedback which consisted seven indicators they were
grammar, vocabulary choice, punctuation, spelling, quality of the content,
organization of the content, and combination of correction and content related
feedback the total statement for the students’ perceptions toward teacher’s
feedback was 14 statements. After the respondents filled and answered the
questionnaire, the researcher collected and scored it then analyzed the data from
students’ answer.
Students’ perception is how the students’ opinions, senses, and beliefs
toward the object arround them. By knowing how the students’ perceptions, the
teacher can improve her/his skill in teaching English and can help the students in
learning English. Collete said “ By making students aware of their perceptions
116
117
and discussing and critiqueing them, it is likely that they will be able to correct
them self based on contextual sensitivity, which will in turn, eliminated the barrier
and fear they have towards English.”59 Which mean after the teacher knowing
what the students’ perceptions and their problems on their Recount text writing
experience, the teacher can discussion the students’ perceptions and help the
students to solve their problems.
The result of this research for students’ perceptions of their Recount text
writing experience was the students had good perceptions toward their Recount
text writing experience which could be seen from the mean score items of the
questionnaire where the mean of score was 73%. From the result of the research,
the researcher found that the students had low perceptions in making sublist
indicator statement 7 and 8 with the score was 68% and 64%. It was showed that
the students had some problems in this process when writing Recount text, where
most of the students answered moderate for the statement I can sort their idea
into a list and I do not find the difficulties when sort my idea. It mean that most of
the students could not sort their idea into a list and most of the students found
some difficulties when sort their idea. The teacher have to discussion these
students’ perceptions toward their experience when writing Recount text.
Students’ perceptions toward teacher’s feedback
The result for the students’ perceptions toward teacher’s feedback was the
students had good perceptions toward the teacher’s feedback on their Recount text
59Despagne Collete. The Difficulties of Learning English: Perception and attitude inMexico Canadian an International article. The University of Western Ontario.article 5. 2010. p.18 http.//ir.ilb.uwo.ca/cie-eci.Retrieved on Sunday 25 January 2013
117
118
which could be seen from the mean score items of the questionnaire where the
mean of score was 82%. From the result of the research, the researcher found that
the students had low perceptions toward teacher’s feedback in indicator
organization of the content statement 29 and 30 with the score was 78%. It was
showed that the students did not understood with the feedback that provided by
the teacher in organization of the content from the students’ Recount text., where
most of the students answered moderate for statement I am understanding the
corrections that given by the teacher toward the unity of my Recount text and I am
understanding the corrections that given by the teacher toward the coheren of
Recount text. It mean half of the students was agree that they understood with the
corrections that given by the teacher toward the unity of their Recount text and the
corrections that given by the teacher toward the coheren of their Recount text.
And half of the students’ did not agree with theses statement, which mean they
did not understood with those corrections. From this result, the teacher have to
repair to provide the feedback toward the students’ organization of the content on
the students’ Recount text because it will affect to the learning process.
CHAPTER V
CONCLUSIONS AND SUGGESTIONS
A. Conclusions
The purpose of this research is to know how the students’ perceptions on
their Recount text writing experience and how the students’ perceptions toward
118
119
teacher’s feedback on second grade students of MTsN 6 Agam. Based on finding
and discussion that have presented in the previous chapter, the researcher
concludes the result of the research about the students’ perceptions on their
Recount text writing experience and teacher’s feedback as follows:
Based on the result of the research above, the researcher concludes that the
students’ perceptions of their Recount text writing experience is enough and the
students perceptions’ toward the teacher’s feedback is good.
1. The mean score of students’ perceptions of their Recount text writing
experience at second grade students on MTsN 6 Agam is 73% which mean the
students’ perception of their Recount text experience is good.
2. The mean score of students’ perceptions toward teacher’s feedback at second
grade students of MTsN 6 Agama is 82% which mean the students’
perceptions toward teacher’s feedback is good.
B. Suggestions
Based on the finding above, the following may be useful dealing with
teaching and learning process in teaching English especially in writing Recount
text, the researcher suggests as follows:
1. The teacher should help the students to solve their problems in writing
Recount text especilly in making the sublist process.
119
120
2. It’s better for the teacher to use integrative feedback in providing the feeback
for the students’, because based on the result of the research most of the
students were more understand with the feedback that provided by the teacher
in combination of corrections of form and content based feedback.
BIBLIOGRAPHY
Alizamar and Nasbahry Couto. 2016. Psikologi Persepsi &Desain Informasi
Yogyakarta: Media Akademi
Coffin, Carolin., et. Al., 2003. Teaching Academic Writing, London: Routlrdge.
Despagne, Collete. 2010. The Difficulties of Learning English: Perception and
attitude in Mexico Canadian an International. Canadian ad International
120
121
Education/Education Canadienne et Internationale. 39 (2), 55-74. February
20, 2018. The University of Western Ontario.
Mulyono, Dena Yudiapasa. 2007. Perception and Interest in English Teaching as
Profession. Published Thesis. Teacher Training and Education Faculty.
Muhammadiyah University of Purwokerto. Access on February 20, 2018.
Gay, L. R. 2000. Educational Research: Competencies for Analysis and
Application. New York: Prentice-Hall, 6thed
Goldstein, E. Bruce. 2010. Sensation and Perception. Canada: Wadsworth.
Harmer, Jeremy. 2004. How to Teach Writing. England: Person Education Ltd.
Hattie, John and Helen Timperley. 2007. The Power of Feedback. Review of
Educational Research 77(1), 81-112. March 3, 2018. University of
Auckland: New Zealand.
Hidayati, Etri, et.al. 2015. Improving Students’ Writing Skill in Recount Text by
Using Personal Letter at Eight Grade of SMP Tiga Hati. Article. English
Study Program, Faculty of Teacher Training and Education, University of
Pasir Pengaraian. Access on February 20, 2018.
Hoshima, Alice and Ann Hogue. 1999. Writing Academic English Third Edition.
New York: Longman
Kasmiwati. 2015. Students Perception toward Lectures’ Ways in Giving
Feedback in Speaking Performance at the Fourth Semester English
Education Departement Students of IAIN Bukittinggi in Academic Year
2014/2015. Unpublished Thesis. Faculty of Tarbiyah and Teacher Training,
University State Islamic Institute of Bukittinggi: Bukittinggi.
Krish, Pramela. 2012. The Power of Feedback in An Online Learning
Environment. 3L Journal of Language Teaching, Linguistics and Literature.
Vol 12.
121
122
Kusumastuti, Galih. 2013. Students’ Perception on The Use of English as A
Medium of Instruction in RSBI at SMP Negeri 2 Magelang. Published
Thesis. Faculty of Teacher Training and Education, Sanata Dharma
University: Yogyakarta. Access on February 20, 2018.
Mackey and Gass. 2005. Second Language Research: Methodology and Design,
New Jersey: Lawrence Erlbaum Associates, Inc.
Musabbihin. 2017. Students Difficulties and Their Perception in Writing Recount
Text: A Study at the Second Year Students of MA Muallimin NW Anjani in
Academic Year 2016/1017. The Indonesian Journal of Language Teaching.
2 (2), 82-88. March 10, 2018. English Post-Graduate Students, University of
Mataram.
Pardiyono. 2007. Pasti Bisa!! Teaching Genre-Based Writing. Yogyakarta: Andi
offset
Pratiwi, Wahyu Dewi. 2013. Students’ Perception Towards Teacher’s Written
Feedback Among 11th Grade Students at SMA N 1 Wedi Klaten. Published
Thesis. English Education Study Program, Faculty of language and Arts,
State University of Yogyakarta: Yogyakarta. Access on February 20, 2018.
Rahimi, M. 2010. Iranian EFL Students’ Perceptions and preferences for
Teacher’s Written Feedback: Do Students’ Ideas Reflect Teacher’s Practice?
The Journal of Teaching Language Skills (JTLS). 2 (2), 75-98. Shiraz
University: Shiraz.
Robbins, Stephen P. and Timothy A. Judge. 2013. Organizational Behavior,
USA: Pearson Education. 15th edition.
Rod, Ellis. 2009. Corrective feeedback and Teacher Development. L2 Journal,
UC Consortium for Language Learning & Teaching. 1(1), 3-18. March 10,
2018. Shanghai International Studies and University of Auckland: New
Zealand.
122
123
Roth, Wolf-Michael and Alfredo Jornet. 2014. Toward A Theory of Experience.
Science Education.
Saragih, Natanael., et. Al., 2004. The Effectiveness of Using Recount Text to
Improve Writing Skill for Grade III Students of Kalam Kudus Elementary
School 2 Pematangsiantar. International Journal of Humanities and Social
Science. 19 (1), 56-64. February 25, 2018. Faculty of Culture Studies
University of Sumatera Utara: Pematangsiantar.
Sinambela, Lijan Poltak. 2014. Metodologi Penelitian Kuantitatif. Yogyakarta:
Graha Ilmu
Slameto. 2000. Belajar dan Faktor-Faktor yang Mempengaruhinya. Jakarta: Bina
Aksara.
Sudijono, Anas. 2008. Pengantar Statistik Pendidikan. Jakarta : PT Raja Grafindo
Persada.
Sugiyono. 2007. Metode Penelitian Pendekatan Kuantitatif, Kualitatif, R&D.
Bandung: Alfabeta.
Sukma, Dian. 2015. A Study on Writing Recount Text. Journal of English
Education. 1 (1), 50-65. February 25, 2018. University of Pasir Pangaraian.
Wulandari, Marta Agustina Sri. 2007. Students’ Responses to Teacher Written
Feedback on Their Compositions,. Faculty of Teachers Training and
Education. Saanata Dharma University. Yogyakarta. Access on February
10, 2018.
Wulandari, Retno. 2012. Korelasi Persepsi Mata Pelajaran Matematika dan
Minat Belajar Matematika dengan Presetasi Belajar Matematika Siswa
Kelas VI Sekolah Dasar Negeri Se-Kecamatan Gamping Tahun Ajaran
2010/2011. Published Thesis. Jurusan Pendidikan Pra Sekolah dan Sekolah
Dasar, Fakultas Ilmu Pendidikan, Universitas Negeri Yogyakarta:
Yogyakarta. Access on February 10, 2018.
123
124
Zhan, Li. 2016. Written Teacher feedback: Students Perceptions, Teacher
Perceptions, and Actual Teacher Performance. English Language Teaching.
9. (8), 73-84. February 25, 2018. School of Foreign Language Literature,
Beijing Normal University, Beijing: China.
124