Students from Five Continents Complete T e xas Inter n ational Cotton School
10
Students from Five Continents Complete Texas International Cotton School On September Third, 2005, a class of fourteen students from six different countries graduated from the Texas International Cotton School. During the two weeks of intensive study, students participated in hands-on instruction of all phases of cotton production, harvesting, ginning, classing, testing, preparation and processing. In addition, students studied futures, indexing and examined cotton’s role in the global cotton/textile complex. Among some of the new features of this session of the Cotton School, students attended a tour of the field laboratories of Bayer CropScience, toured Samuel Jackson, Inc., the world’s leading manufacturer of gin moisture systems and travelled to a cattle ranch to witness roping and branding demonstrations. Now totalling twenty-five sessions, the Texas International Cotton School, a cooperative effort of the Lubbock Cotton Exchange and the International Textile Center, has educated 399 students from 57 different countries and countless disciplines. The next session is scheduled to begin Monday, August 21st, 2006. To learn more about this session or the Cotton School in general, check the school’s website at http://www.texasintlcottonschool.com or email us at [email protected]. (A note to international students--please remember that the current climate to obtain a visitor visa is more complex than ever. Please register and follow the steps listed on the website as early as possible to assure your ability to attend the next set of classes. ) TICS Class of 2005 (Front Row, left to right): Carol Mason, Texas Tech University; Teresa McKeivier, USDA-FAS; Alicia Thompson, McCauley Cotton; Judy Teeas, ACG Cotton; Abby Liu, Applecore, Ltd.; Nyi Ayu Titi-Chomsiah, Tomen, Indonesia. (Back Row, left to right): Fernando Naranjo, Teimsa, Ecuador; Bhumik Patel, Oklahoma State University; Erik Everett, Texas Tech Univer- sity; Paul Martin-Gryzbowski, Copaco, France; Mike Stephens; Steve Claus, Fiberbrite, Ltd.; Paul Rodgers, USDA-SRRC; Martin Wamaniala, Uganda; Mohmammed Mamunur Rashid, Communic Pvt. Ltd., Bangladesh; Fazal Khijili, Drachenberg Trad- ing, Pakistan. Volume 2005-4 Fall 2005 The International Textile Center gratefully acknowledges the donation of two pieces of equipment. First, a Hollingsworth Saco/Lowell 16-spindle Fh-PK1500 Roving Frame has been installed. It was accompanied by a Zweigle 580 Evenness tester now in the ITC Materials Evaluation Laboratory. Both these items were surplused by Cotton Incorporated and will be a useful addition to the program work at the International Textile Center. Equipment Donated by Cotton Incorporated
Transcript of Students from Five Continents Complete T e xas Inter n ational Cotton School

Students from Five Continents CompleteT e x a s I n t e r n a t i o n a l C o t t o n S c h o o l
On September Third, 2005, a class of fourteen students from six different countries graduated from the Texas International Cotton School. During the two weeks of intensive study, students participated in hands-on instruction of all phases of cotton production, harvesting, ginning, classing, testing, preparation and processing. In addition, students studied futures, indexing and examined cotton’s role in the global cotton/textile complex. Among some of the new features of this session of the Cotton School, students attended a tour of the fi eld laboratories of Bayer CropScience, toured Samuel Jackson, Inc., the world’s leading manufacturer of gin moisture systems and travelled to a cattle ranch to witness roping and branding demonstrations. Now totalling twenty-fi ve sessions, the Texas International Cotton School, a cooperative effort of the Lubbock Cotton Exchange and the International Textile Center, has educated 399 students from 57 different countries and countless disciplines. The next session is scheduled to begin Monday, August 21st, 2006. To learn more about this session or the Cotton School in general, check the school’s website at http://www.texasintlcottonschool.com or email us at [email protected].(A note to international students--please remember that the current climate to obtain a visitor visa is more complex than ever. Please register and follow the steps listed on the website as early as possible to assure your ability to attend the next set of classes.)
TICS Class of 2005 (Front Row, left to right): Carol Mason, Texas Tech University; Teresa McKeivier, USDA-FAS; Alicia Thompson, McCauley Cotton; Judy Teeas, ACG Cotton; Abby Liu, Applecore, Ltd.; Nyi Ayu Titi-Chomsiah, Tomen, Indonesia. (Back Row, left to right): Fernando Naranjo, Teimsa, Ecuador; Bhumik Patel, Oklahoma State University; Erik Everett, Texas Tech Univer-sity; Paul Martin-Gryzbowski, Copaco, France; Mike Stephens; Steve Claus, Fiberbrite, Ltd.; Paul Rodgers, USDA-SRRC; Martin Wamaniala, Uganda; Mohmammed Mamunur Rashid, Communic Pvt. Ltd., Bangladesh; Fazal Khijili, Drachenberg Trad-ing, Pakistan.
Volume 2005-4 Fall 2005
The International Textile Center gratefully acknowledges the donation of two pieces of equipment. First, a Hollingsworth Saco/Lowell 16-spindle Fh-PK1500 Roving Frame has been installed. It was accompanied by a Zweigle 580 Evenness tester now in the ITC Materials Evaluation Laboratory. Both these items were surplused by Cotton Incorporated and will be a useful addition to the program work at the International Textile Center.
Equipment Donated by Cotton Incorporated

TEXTILE TOPICS2
HPLC of Insect Honeydew Deposits Collected from the High Speed Stickiness DetectorNoureddine Abidi and Eric Hequet,International Textile Center, Texas Tech UniversityAdapted with permission from an article published in the Textile Research Journal, 75(4), 362-370.
Materials and Methods
A subset of 81 honeydew contaminated cotton bales were selected from the set of 150 bales described in previous papers [9]. Samples came from three different geographic growing areas. Twenty-seven bales were contaminated mainly by whitefl y honeydew (from geographic area 1), 27 bales were contaminated by aphid and whitefl y honeydew (from geographic area 2), and 27 bales were contaminated mainly by aphid honeydew (from geographic area 3). Among the 81 contaminated cotton bales, two were selected to illustrate the differences in the chromatograms of whitefl y honeydew-contaminated cotton versus aphid honeydew-contaminated cotton. The cotton sample selected from geographic Area 1 was contaminated by whitefl y honeydew (33.9% of trehalulose and 19.1% of melezitose, in percent of the HPLC total sugars). The cotton sample selected from geographic
The primary source of cotton stickiness is attributed to the presence of excess sugars on the surface of the lint. These sugar deposits are produced either by the cotton plant (physiological sugars) or by feeding insects (entomological sugars). The presence of sucrose (C12H22O11) is a major indicator of contamination with physiological sugars [6]. The presence of trehalulose (C12H22O11) and melezitose (C18H32O16), with trehalulose being dominant is an indication of contamination with whitefl y honeydew, while the presence of melezitose along with a very small amount of trehalulose is an indication of contamination with aphid honeydew [6]. Cotton stickiness is a very serious problem for the textile industry because it damages yarn quality and textile mill productivity [11,14]. Poor yarn quality is mainly due to the unevenness in the fl ow of fi bers being drawn durning processing, while low productivity is the result of decreased throughput, a more frequent cleaning schedule (necessary to clean off the residues accumlated on the textile equipment), and excessive endsdown. A number of mechanical instruments were developed to evaluate the stickiness potential of cotton fi bers before processing: the Minicard instrument [1], the fi ber contamination tester (Lintronics, Israel) [13], the sticky cotton thermodetector (CIRAD, France) [2], and the high speed stickiness detector (CIRAD, France) [3]. Among these technologies, the high speed stickiness detector (H2SD) has the potential to be a fast and reliable technique for stickiness measurements [7]. In previous work, we reported on the implication of trehalulose in the residue build-up on textile equipment during processing of moderately sticky cotton [8]. We concluded that a low melting point and high hygroscopicity explained whay trehalulose was accumulating the most on the equipment. Therefore, since sugars involved in cotton stickiness have different thermal and hygroscopic properies, we conducted another study
to investigate the effect of the H2SD hot plate temperature settings and relative humidity on H2SD measurements [9]. We showed that at the manufacturer-recommended hot plate temperature setting (53ºC), all kinds of honeydew caused stickiness, while at a lower hot plate temperature, only trehalulose-rich honeydew caused stickiness. Thus, the origin of the contamination (whitefl ies or aphids) has an effect on the H2SD readings. The honeydew droplets with a high percentage of trehalulose are sticky at any H2SD hot plate temperature above 25ºC, while honeydew droplets with a low percentage of trehalulose are not [10].In this paper, we report the combined effect of the H2SD hot plate temperature and the cleaning roll pressure on stickiness measurements and the kinds of sugars sticking on the H2SD’s aluminum foil.
Area 3 was contaminated by aphid honeydew (0.6% of trehalulose and 10.2% of melezitose).
3FALL 2005
High speed stickiness detector test at different settings
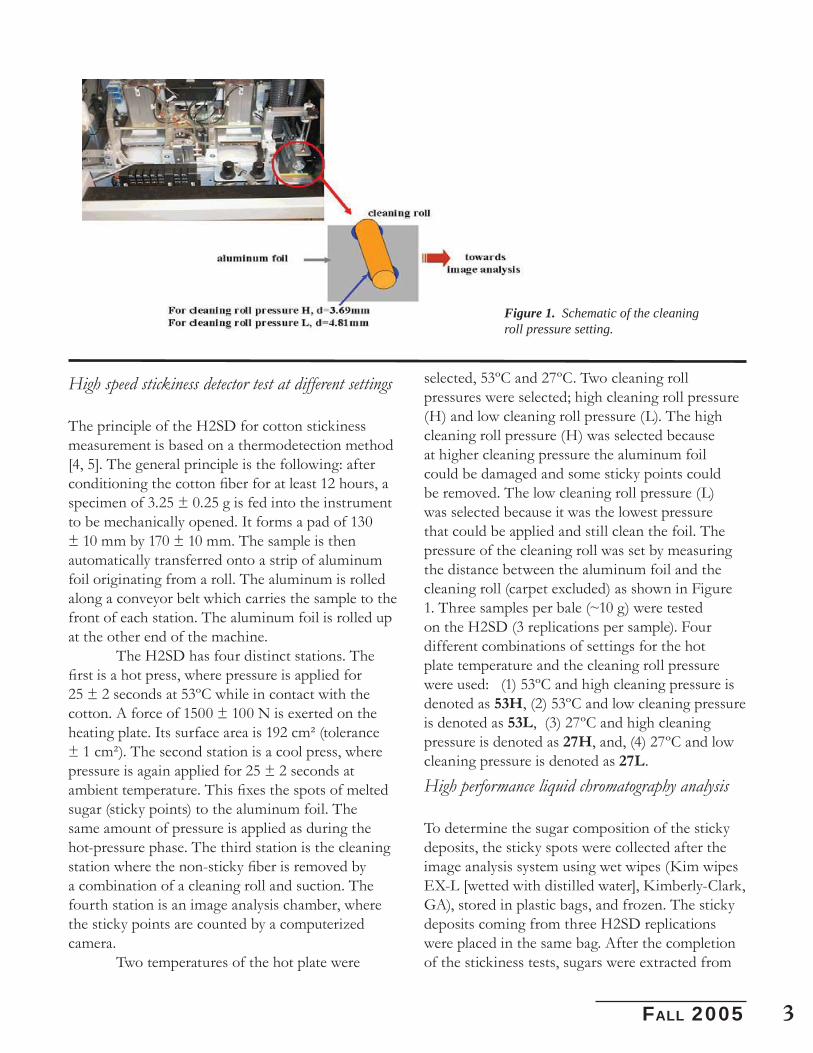
The principle of the H2SD for cotton stickiness measurement is based on a thermodetection method [4, 5]. The general principle is the following: after conditioning the cotton fi ber for at least 12 hours, a specimen of 3.25 ± 0.25 g is fed into the instrument to be mechanically opened. It forms a pad of 130 ± 10 mm by 170 ± 10 mm. The sample is then automatically transferred onto a strip of aluminum foil originating from a roll. The aluminum is rolled along a conveyor belt which carries the sample to the front of each station. The aluminum foil is rolled up at the other end of the machine. The H2SD has four distinct stations. The fi rst is a hot press, where pressure is applied for 25 ± 2 seconds at 53ºC while in contact with the cotton. A force of 1500 ± 100 N is exerted on the heating plate. Its surface area is 192 cm² (tolerance ± 1 cm²). The second station is a cool press, where pressure is again applied for 25 ± 2 seconds at ambient temperature. This fi xes the spots of melted sugar (sticky points) to the aluminum foil. The same amount of pressure is applied as during the hot-pressure phase. The third station is the cleaning station where the non-sticky fi ber is removed by a combination of a cleaning roll and suction. The fourth station is an image analysis chamber, where the sticky points are counted by a computerized camera. Two temperatures of the hot plate were
selected, 53ºC and 27ºC. Two cleaning roll pressures were selected; high cleaning roll pressure (H) and low cleaning roll pressure (L). The high cleaning roll pressure (H) was selected because at higher cleaning pressure the aluminum foil could be damaged and some sticky points could be removed. The low cleaning roll pressure (L) was selected because it was the lowest pressure that could be applied and still clean the foil. The pressure of the cleaning roll was set by measuring the distance between the aluminum foil and the cleaning roll (carpet excluded) as shown in Figure 1. Three samples per bale (~10 g) were tested on the H2SD (3 replications per sample). Four different combinations of settings for the hot plate temperature and the cleaning roll pressure were used: (1) 53ºC and high cleaning pressure is denoted as 53H, (2) 53ºC and low cleaning pressure is denoted as 53L, (3) 27ºC and high cleaning pressure is denoted as 27H, and, (4) 27ºC and low cleaning pressure is denoted as 27L. High performance liquid chromatography analysis
To determine the sugar composition of the sticky deposits, the sticky spots were collected after the image analysis system using wet wipes (Kim wipes EX-L [wetted with distilled water], Kimberly-Clark, GA), stored in plastic bags, and frozen. The sticky deposits coming from three H2SD replications were placed in the same bag. After the completion of the stickiness tests, sugars were extracted from
Figure 1. Schematic of the cleaning roll pressure setting.

TEXTILE TOPICS4
containers containing mixed sugar samples were stored at 65 ± 2% relative humidity and 21 ± 1°C for more than one month. Because of the high hygroscopicity of trehalulose and fructose, the hydrated mixes had the consistency of glue. Mixes 3 and 4 were commercial syrups, which were stored in 65 ± 2%RH and 21 ± 1°C then tested as is. Two pieces of cotton yarns (~30 cm in length) were impregnated with the sugar mixes and stuck together as shown in Figure 2 (the sugar mixes were acting like glue). The adhesiveness test performed measures the force (peak load) needed to separate the 2 pieces of cotton yarns using a dynamometer, Testometric UT350 (The Testometric Company Ltd., UK). Ten replications from each mix were performed.
Figure 2. Adhesive test schematic.
Results and Discussion
Table 2 summarizes the sugar contents of honeydew contaminated cotton bale samples, measured by HPLC expressed as the percent of total sugars. All bales having less than 10 sticky spots with a hot plate temperature setting of 53ºC and low pressure of the cleaning roll were not included in this study. Asshown in previous work [12], the H2SD number of sticky deposits among readings within a cotton sample follows a Poisson-like distribution; therefore, a square root transformation is adequate to normalize data prior to statistical analysis. Consequently, all H2SD readings reported in this work and the statistical analyses were on the square root transformed data.
the wipes using 20ml of 18.2-megahom water and the HPLC tests were performed using the procedure described in our previous papers [8, 9]. The sugar content was calculated from the peak area of known sugars. Evaluation of the stickiness potential of identifi ed sugars
Trehalulose sugar was obtained through Cornell University; the other sugars were purchased from Sigma Chemical Company (St Louis, Mo). Commercial syrups (mixes 3 and 4) were obtained from MitsuiUSA Inc (Misui & Co, NY). These mixes contain palatinose in addition to glucose, fructose, trehalulose, and sucrose. To evaluate the stickiness potential, hydrated sugar mixes 1, 2 and 5 were prepared from inositol, glucose, fructose, trehalulose, sucrose, and melezitose (Table 1). To prepare mixes 1, 2, and 5, the dehydrated sugars were weighed and mixed with a spatula. The open
Mixes I G F W S M Pal
Mix 1 5% 15% 15% 5% 15% 45% 0
Mix 2 5% 10% 10% 45% 15% 15% 0
Mix 3† 0 5.2% 6% 74.2% 1.1% 0 11.9%
Mix 4† 0 1.1% 1.2% 85% 0.2% 0 12.5%
Mix 5 0 0 0 99.8% 0 0 0
Table 1. Sugar mixes tested for the adhesiveness test. I=Inositol, G=Glucose, F=Fructose, W=Trehalulose, S=Sucrose, M=Melezitose, Pal=Palatinose.
†-commercial sugars
Effect of the H2SD Hot Plate Temperature and Cleaning Roll Pressure
The H2SD measurements for the Areas 1, 2, and 3 at different H2SD settings showed an increase in the number of H2SD sticky deposits when the H2SD hot plate temperature increases from 27ºC to 53ºC for the 3 areas tested. On average for both cleaning roll pressures, the H2SD readings increased by 49.3% for Area 1, 52.5% for Area 2, and 157.0% for Area 3. However, when compared to the low cleaning roll pressure, the number of H2SD sticky deposits decreased with the high cleaning roll pressure for the 3 areas tested. On average for both H2SD hot plate temperatures,

5FALL 2005
Geographic growing Area Sugar Contents, % of total sugars I T G F W S M MAL
Table 2. Sugar content of honeydew contaminated cotton samples, as measured by HPLC, expressed in percent total sugars. I=Inositol, T=trehalose, G=Glucose, F=Fructose, W=Trehalulsoe, S=Sucrose, M=Melezitose, MAL=Maltose.
Area 1 average 13.7 6.3 16.9 20.6 23.7 0.3 14.2 4.2minimum 6.4 3.1 8.2 12.7 2.8 0.0 0.0 0.3maximum 21.0 14.7 33.6 35.1 41.7 1.5 36.7 10.7
Area 2 average 19.1 1.1 20.1 24.4 13.5 2.3 18.7 0.7minimum 7.9 0.2 12.1 8.6 0.7 0.1 7.0 0.3maximum 36.9 5.1 36.5 36.5 29.4 5.9 25.6 1.4
Area 3 average 17.6 5.8 25.4 28.2 0.2 8.9 11.4 2.6minimum 8.4 0.9 13.8 13.1 0.0 1.4 2.4 0.3maximum 33.3 16.3 37.3 46.5 1.7 23.8 28.3 6.9
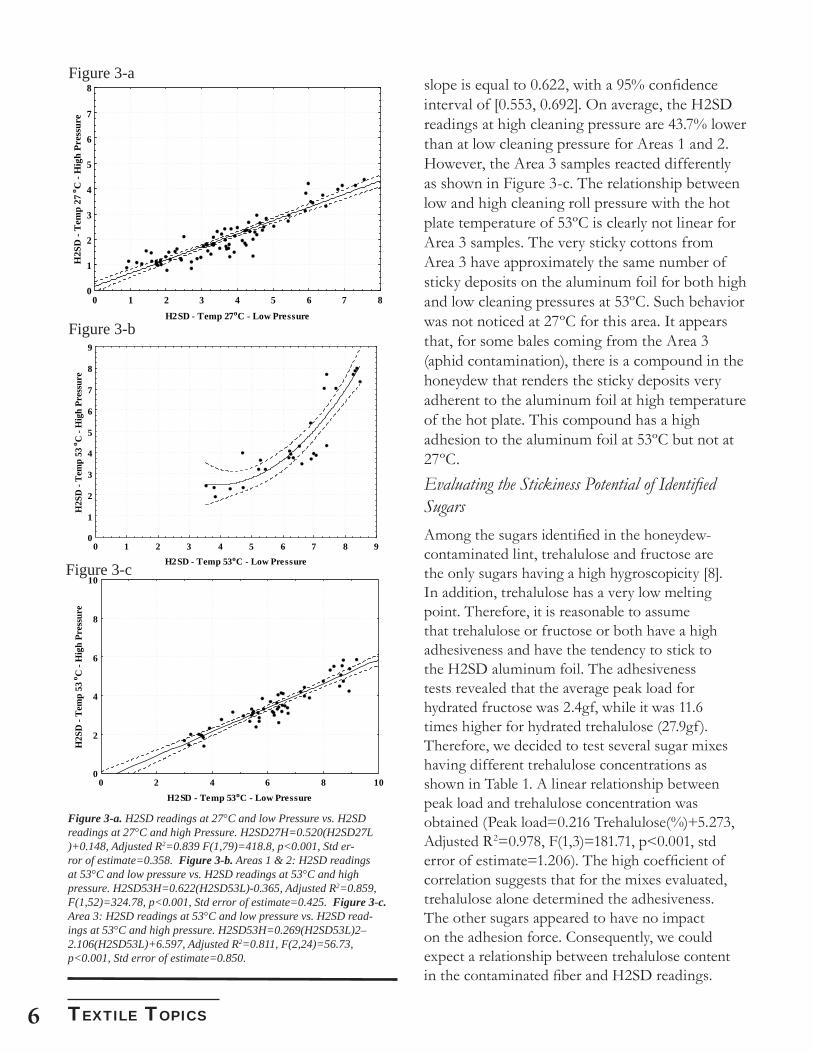
-Hot plate temperature setting at 53ºC: The relationship between the H2SD readings at low and high cleaning roll pressure with the hot plate temperature of 53ºC is much more complex. Two groups with fundamentally different behaviors are distinguished. For Areas 1 and 2, the relationships are linear and there is no slope difference between the 2 areas. A global linear regression can be calculated. As shown in Figure 3-b, the intercept is not different from 0 ([-0.808, 0.079]) and the
Intercept 1 2686.07 0.000001Area 2 2.77 0.0641521 4.182 3.853 3.76Temperature 1 208.43 0.00000127°C 2.84 b53°C 5.03 aPressure 1 171.65 0.000001L 4.92 aH 2.94 bArea × temperature 2 13.85 0.000002Area 1 - 27°C 3.35 cArea 1 - 53°C 5.00 abArea 2 - 27°C 3.05 cArea 2 - 53°C 4.65 bArea 3 - 27°C 2.11 dArea 3 - 53°C 5.42 aPressure × temperature 1 6.61 0.010624L - 27°C 3.63 bL - 53°C 6.21 aH - 27°C 2.04 cH - 53°C 3.84 bArea × pressure 2 4.14 0.016756Area 1 - L 5.31 bArea 1 - H 3.05 cArea 2 - L 5.01 aArea 2 - H 2.68 cArea 3 - L 4.45 bArea 3 - H 3.08 cArea × pressure × temperature 2 0.01 0.988620Area 1 - L - 27°C 4.29Area 1 - L - 53°C 6.32Area 1 - H - 27°C 2.41Area 1 - H - 53°C 3.68Area 2 - L - 27°C 4.00Area 2 - L - 53°C 6.02Area 2 - H - 27°C 2.09Area 2 - H - 53°C 3.27Area 3 - L - 27°C 2.61Area 3 - L - 53°C 6.29Area 3 - H - 27°C 1.60Area 3 - H - 53°C 4.55
Table 3. Variance analysis on the square root trans-formed data: Combined effect of the cleaning roll pres-sure and the hot plate temperature settings on H2SD readings. Df F Probability H2SDa
aH2SD readings not followed by the same letter are signifi cantly different with = 5% (Newman-Keuls test).
-Hot plate temperature setting at 27ºC: The relationship between the H2SD readings at low and high cleaning roll pressure with the hot plate temperature set at 27ºC is linear. There are no slope differences between the 3 areas; therefore, a global linear regression can be calculated. As shown in Figure 3-a, the intercept is not different from 0 ([-0.052, 0.348]) and the slope is equal to 0.520, with a 95% confi dence interval of [0.469, 0.570]. On average, the H2SD readings at high cleaning roll pressure are 43.9% lower than at low cleaning roll pressure. The decrease of the H2SD readings at high cleaning roll pressure is attributed to the fact that some sticky spots having a low adhesion to the aluminum foil are removed.
the H2SD readings decreased by: 42.6% for Area 1, 48.3% for Area 2, and 30.8% for Area 3. Furthermore, the analysis of variance showed signifi cant two-way interactions between all the factors tested (Table 3). Indeed, the Area 3 appeared to be much more sensitive to the hot plate temperature and somewhat less sensitive to the cleaning roll pressure than Areas 1 and 2.
TEXTILE TOPICS6
Evaluating the Stickiness Potential of Identifi ed Sugars
0 1 2 3 4 5 6 7 8H2SD - Temp 27oC - Low Pressure
0
1
2
3
4
5
6
7
8H
2SD
- T
emp
27o C
- H
igh
Pres
sure
0 1 2 3 4 5 6 7 8 9H2SD - Temp 53oC - Low Pressure
0
1
2
3
4
5
6
7
8
9
H2S
D -
Tem
p 53
o C -
Hig
h Pr
essu
re
0 2 4 6 8 10H2SD - Temp 53oC - Low Pressure
0
2
4
6
8
10
H2S
D -
Tem
p 53
o C -
Hig
h Pr
essu
reFigure 3-a
Figure 3-b
Figure 3-c
Among the sugars identifi ed in the honeydew-contaminated lint, trehalulose and fructose are the only sugars having a high hygroscopicity [8]. In addition, trehalulose has a very low melting point. Therefore, it is reasonable to assume that trehalulose or fructose or both have a high adhesiveness and have the tendency to stick to the H2SD aluminum foil. The adhesiveness tests revealed that the average peak load for hydrated fructose was 2.4gf, while it was 11.6 times higher for hydrated trehalulose (27.9gf). Therefore, we decided to test several sugar mixes having different trehalulose concentrations as shown in Table 1. A linear relationship between peak load and trehalulose concentration was obtained (Peak load=0.216 Trehalulose(%)+5.273, Adjusted R2=0.978, F(1,3)=181.71, p<0.001, std error of estimate=1.206). The high coeffi cient of correlation suggests that for the mixes evaluated, trehalulose alone determined the adhesiveness. The other sugars appeared to have no impact on the adhesion force. Consequently, we could expect a relationship between trehalulose content in the contaminated fi ber and H2SD readings.
Figure 3-a. H2SD readings at 27°C and low Pressure vs. H2SD readings at 27°C and high Pressure. H2SD27H=0.520(H2SD27L)+0.148, Adjusted R2=0.839 F(1,79)=418.8, p<0.001, Std er-ror of estimate=0.358. Figure 3-b. Areas 1 & 2: H2SD readings at 53°C and low pressure vs. H2SD readings at 53°C and high pressure. H2SD53H=0.622(H2SD53L)-0.365, Adjusted R2=0.859, F(1,52)=324.78, p<0.001, Std error of estimate=0.425. Figure 3-c. Area 3: H2SD readings at 53°C and low pressure vs. H2SD read-ings at 53°C and high pressure. H2SD53H=0.269(H2SD53L)2–2.106(H2SD53L)+6.597, Adjusted R2=0.811, F(2,24)=56.73, p<0.001, Std error of estimate=0.850.
slope is equal to 0.622, with a 95% confi dence interval of [0.553, 0.692]. On average, the H2SD readings at high cleaning pressure are 43.7% lower than at low cleaning pressure for Areas 1 and 2. However, the Area 3 samples reacted differently as shown in Figure 3-c. The relationship between low and high cleaning roll pressure with the hot plate temperature of 53ºC is clearly not linear for Area 3 samples. The very sticky cottons from Area 3 have approximately the same number of sticky deposits on the aluminum foil for both high and low cleaning pressures at 53ºC. Such behavior was not noticed at 27ºC for this area. It appears that, for some bales coming from the Area 3 (aphid contamination), there is a compound in the honeydew that renders the sticky deposits very adherent to the aluminum foil at high temperature of the hot plate. This compound has a high adhesion to the aluminum foil at 53ºC but not at 27ºC.

7FALL 2005
HPLC Analyses of Insect Honeydew Deposits Collected from H2SDFigure 5 shows scanning electron micrographs of sticky deposits on the H2SD’s aluminum foil. These micrographs show fi bers and crystals assumed to be sugars embedded in an amorphous substance (top micrographs), droplets thought to be honeydew on fi ber (bottom left), and a crystal trapped in entangled fi ber (bottom right). Wet wipes were used to remove these sticky deposits from the aluminum foil after they were analyzed by the H2SD system.
Figure 5. Scanning electron microscopy of a sticky deposit collect-ed from the H2SD aluminum foil (whitefl y contaminated cotton).
Sugars from the wet wipes were then extracted and analyzed by HPLC. As a control, HPLC analyses were performed on clean aluminum foil wiped with wet Kim wipes. With the exception of a small inositol peak, the HPLC profi les of the control did not show any signifi cant peaks. Thus, all peaks shown in the chromatograms of
To validate this assumption, we tested 150 bale samples having different amounts of trehalulose [9]. The global relationship between the H2SD readings and trehalulose content on the lint was: Trehalulose (%)=0.0187 H2SD -0.0314, Adjusted R2=0.286, F(1,148)=60.63, p<0.001, std error of estimate=0.068. This lack of correlation was also true for all sugars identifi ed on the lint (inositol, trehalose, fructose, glucose, sucrose, melezitose, and
-0 .05 0.00 0.05 0.10 0.15 0.20 0.25 0.30 0.35 0.40Trehalulose (%)
0
1
2
3
4
5
6
7
8
9
10
H2S
D - T
emp
53o C
Figure 4. Areas 1 & 2: Trehalulose content (% of the fi ber weight) vs. H2SD at 53°C and low cleaning roll pressure. H2SD=1.819+42.263Trehalulose (%)-68.196[Trehalulose (%)]2, Adjusted R2=0.874, F(2,97)=343.68, p<0.001, Std er-ror of estimate=0.822.
To explain the data from the Area 3 samples, it could be hypothesized that the unknown compound causing stickiness for the samples of this
maltose). This leads to another hypothesis that some other unidentifi ed compound may exist on the lint and cause stickiness. This hypothesis is supported by the results reported in Figure 3-c. Area 3 samples contained a compound or compounds with a very high adhesion behavior. These compounds, once they are fi xed on the aluminum foil, could not be removed even at high cleaning pressure. This compound could not be trehalulose as the HPLC analysis clearly revealed its extremely low level for the cotton samples in Area 3 [9]. Therefore, if the Area 3 is excluded from the analysis, a good non-linear correlation between the trehalulose content (for samples from Areas 1 and 2) and H2SD readings is obtained as shown in Figure 4. The non-linear nature of this relationship is attributed to very high levels of contamination, where H2SD sticky spots have the tendency to merge and lead to a saturation phenomenon of the image analysis system.
area is not one of the sugars currently identifi ed with the HPLC. It could be also an unknown sugar present in the HPLC chromatogram but not yet identifi ed because of the lack of the corresponding standard. Therefore, HPLC analysis of the deposits on the H2SD’s aluminum foil could help elucidate the difference between samples from Areas 1, 2, and 3.

TEXTILE TOPICS8
the extracts are not due to an external source of contamination, i.e. wipes or aluminum. Among the sugars detected for Area 1 and Area 2, trehalulose was the only one showing signifi cant correlations between the quantities found on the lint and the quantities found on the H2SD aluminum foil (Figure 6 - log transformation was applied to the graph data in order to better visualize the relationship). These results confi rmed our previous hypothesis that at any temperature, when the lint is contaminated essentially with whitefl y honeydew (Area 1 and Area 2) trehalulose preferentially sticks on the aluminum foil and that explains the H2SD readings [9]. Since the trehalulose content on the lint for the Area 3 is very small, such a relationship does not exist for this area. Furthermore, the other sugars identifi ed on the lint from the Area 3 do not explain the H2SD
readings either (data not shown). This leads us to hypothesize that for this area, there is another compound or compounds on the lint not yet identifi ed. These compounds could contribute to the interaction Area × Temperature as noticed earlier (Table 3). All chromatograms of 81 cotton samples were analyzed. To illustrate the difference in the chromatograms of samples from geographical area contaminated with whitefl y honeydew (Area 1) and aphid honeydew (Area 3), two representative cottons were selected. Figures 7-a through 7-c show the chromatograms for the lint and the corresponding deposits collected from the H2SD aluminum foil. These chromatograms were obtained by subtracting the chromatograms of clean aluminum wipes from the chromatograms of honeydew-
-3.5 -3.0 -2.5 -2.0 -1.5 -1.0 -0.5 0.0 0.5Trehalulose on lint (log transf.)
-3.2
-2.8
-2.4
-2.0
-1.6
-1.2
-0.8
-0.4
0.0
Tre
halu
lose
on
wip
es (l
og tr
ansf
.)
Areas 1 & 2 Area 3
-3.5 -3.0 -2.5 -2.0 -1.5 -1.0 -0.5 0.0 0.5Trehalulose on lint (log transf.)
-3.2
-2.8
-2.4
-2.0
-1.6
-1.2
-0.8
-0.4
0.0
Tre
halu
lose
on
wip
es (l
og tr
ansf
.)
Areas 1 & 2 Area 3
-3.5 -3.0 -2.5 -2.0 -1.5 -1.0 -0.5 0.0 0.5Trehalulose on lint (log transf.)
-3.2
-2.8
-2.4
-2.0
-1.6
-1.2
-0.8
-0.4
0.0
Tre
halu
lose
on
wip
es (l
og tr
ansf
.)
Areas 1 & 2 Area 3
-3.5 -3.0 -2.5 -2.0 -1.5 -1.0 -0.5 0.0 0.5Trehalulose on lint (log transf.)
-3.2
-2.8
-2.4
-2.0
-1.6
-1.2
-0.8
-0.4
0.0
Tre
halu
lose
on
lint (
log
tran
sf.)
Areas 1 & 2 Area 3
Figure 6. Trehalulose on the lint vs. Trehalulose on aluminum foil at different H2SD settings.

9FALL 2005
contaminated aluminum wipes. The results from two H2SD settings are presented: 53ºC and 27ºC. For both settings the cleaning roll pressure was set to low pressure. The analysis of these 6 chromatograms revealed the presence of 7 individual peaks or groups of peaks that are not currently identifi ed: Group 1 contains a single peak that is extremely small for the 2 lint samples. This peak appeared on all aluminum foil deposit extracts at both temperatures tested and is much larger than on the lint. It means that this substance has probably a very low melting point but, as this compound is present at all temperatures, it could not cause the interaction Area × Temperature. Group 2 contains three individual peaks that are present on the 2 cotton lint samples but in different proportions. These peaks are also present on the extracts from the aluminum foil at 53ºC, but they disappeared at 27ºC except for the lint from the Area 1. It means that these peaks could at least partly, contribute to the interaction Area × Temperature. Group 3 contains a single peak that is extremely small for the 2 lint samples. This peak appeared on all aluminum foil deposit extracts at both temperatures and is much larger than on the lint. It means that this substance has probably a very low melting point but, as it is present at both temperatures, it could not contribute to the interaction Area × Temperature. Group 4 is one single peak that is quite small for the 2 lint samples. This peak is also present on the aluminum foil at 53ºC, but disappears at 27ºC except for the lint from Area 1. It suggests that this substance could contribute to the interaction Area × Temperature. Group 5 is one single peak that is present on lint samples from Areas 1 and 3. It also appears on the aluminum foil deposits at 53ºC but not at 27ºC for samples from Area 3. It suggests that this substance could contribute to the interaction Area × Temperature. Group 6 consists of 2 peaks present on the 2 lint samples. It is also present on the aluminum foil at both temperatures for samples from Area 1, but disappears at 27ºC for the samples from the Area 3. It means that this substance could contribute to the
Figure 7-a.
0 5 10 15 20 25
Minutes
micr
oCou
lom
b (a
.u.)
Area 1
Area 3
I
W
1 7
6M2
T GF 3 4 S
5
0 5 10 15 20 25
Minutes
micr
oCou
lom
b (a
.u.)
Area 1
Area 3
I
W
1 7
6M2
T GF 3 4 S
5
0 5 10 15 20 25
Minutes
micr
oCou
lomb (
a.u.)
53oC&low pressure
27oC&low pressure
I1 S
7
6M2 T
G
F
3 45
Area 3
Figure 7-a. Comparison between HPLC profi les of cotton fi bers from Areas 1 and 3. (I=Inositol, T=Trehalose, G=Glucose, F=Fructose, W=Trehalulose, S=Sucrose, M=Melezitose, peaks 1-7 are non-identifi ed). Figure 7-b. Compari-son between HPLC profi les of sticky deposits on H2SD aluminum foil of cotton fi bers from Area 1. (I=Inositol, T=Trehalose, G=Glucose, F=Fructose, W=Trehalulose, M=Melezitose, peaks 1-7 are non-identifi ed). Comparison between HPLC profi les of sticky deposits on H2SD aluminum foil of cotton fi bers from Area 3. (I=Inositol, T=Trehalose, G=Glucose, F=Fructose, S=Sucrose, M=Melezitose, peaks 1-7 are non-identifi ed).
Figure 7-a
Figure 7-b
Figure 7-c

TEXTILE TOPICS10
The results demonstrated the signifi cant effect of the H2SD hot plate temperature and the cleaning roll pressure on stickiness measurements. On average for both cleaning roll pressures, the H2SD readings increased by 49.3% for Area 1, 52.5% for Area 2 and 157% for Area 3. However, when compared to the low cleaning roll pressure, the number of H2SD sticky deposits decreased with the high cleaning roll pressure for the 3 areas tested. On average for both H2SD hot plate temperatures, the H2SD readings decreased by: 42.6% for Area 1, 48.3% for Area 2, and 30.8% for Area 3. The HPLC analysis of sticky deposits on the H2SD aluminum foil have shown that for the cotton contaminated with whitefl y honeydew, trehalulose was the dominant sugar in the deposits on the aluminum foil. However, for cottons contaminated with aphid honeydew other non-identifi ed compounds stick on the aluminum foil at high temperature 53ºC but not at low temperature 27ºC.
Conclusions
References1. Anonymous, Meeting of Honeydew Working Group, S.A. Heap & J.C. Stevens (eds.), Proceedings: International Committee on Cotton Testing Methods, ITMF, Zurich, (1988).2. CIRAD, Standard Operation Procedure SCT, S.A. Heap & J.C. Stevens (eds), Proceedings: International Committee on Cotton Testing Methods, ITMF, Zurich, 41-45 (2000).3. CIRAD, Standard Operation Procedure H2SD, S.A. Heap & J.C. Stevens (eds), Proceedings: International Committee on Cotton Testing Methods, ITMF, Zurich, 46-49 (2000)4. Frydrych, R., Hequet, E., and Cornuejols, G., “A High Speed Instrument for Stickiness Measurement,” S.A. Heap & J.C. Stevens (eds.), Proceedings: International Committee on Cotton Testing Methods, ITMF, Zurich, (1994).5. Frydrych, R., and Hequet, E., “ Standardization Proposal-- The Thermodetector and its Methodology,” S.A. Heap & J.C. Stevens (eds.), Proceedings: International Committee on Cotton Testing Methods, ITMF, Zurich, 97-102 (1998).6. Hendrix, D.L., Wei, Y-A., and Leggett, J.E., “Homopteran Honeydew Sugar Composition is Determined by Both the Insect and Plant Species,” Comp. Biochem. and Physiol. 101B, 1/2, 23-27. (1992).7. Hequet, E., “Implication of the Origin of Honeydew Contamination on Stickiness Measurements and Fiber Processing,” Ph.D. Thesis, 03MULH0722, University of Haute Alsace, France (2003).8. Hequet, E. and Abidi, N., “Processing Sticky Cotton: Implication of Trehalulose in Residue Build-up,” The Journal of Cotton Science, 6(1), 77-90 (2002). online at http://www.jcotsci.org.9. Hequet, E. and Abidi, N., “High Speed Stickiness Detector Measurement: Effect of Temperature Settings and Relative Humidity,” The Journal of Cotton Science 6(1), 68-76 (2002).online at http://www.jcotsci.org.10. Hequet, E. and Abidi, N., Cotton Stickiness Evaluation by Means of Multi-temperature Testing, United Sates Patent US 6,520,007 B2, (2003).11. Hequet, E., Ethridge, D., Cole, B., and Wyatt, B., “How Cotton Stickiness Measurements Relate to Spinning Effi ciency,” 99-121. In: Proc. 13th Annual Engineer Fiber Selection System Conference. 17-19 April 2000, Cotton Inc., Cary, NC.12. Hequet, E., Frydrych, R., and Watson, M., “The Use of the High Speed Stickiness Detector on a Large Range of Cotton Coming from Different Countries,” In. Proc. Beltwide Cotton Prod. Res. Conf., Menphis, TN., Natl Cotton Counc. Am., Memphis, TN. (1997).13. Mor, U, “FCT - Fiber Contamination Tester– A New Instrument for the Rapid Measurement of Stickiness, Neps, Seed-coat Fragments and Trash – for the Ginner to the Spinner,” H. Harig, S.A. Heap & J.C. Stevens (eds), Proceedings: Bremen International Cotton Conference, Faserinstitut Bremen e.V., Bremen, 205-212 (1996).14. Watson, M.D, “An Overview of Cotton Stickiness,” H. Harig, S.A. Heap & J.C. Stevens (eds), Proceedings: Bremen International Cotton Conference, Faserinstitut Bremen e.V., Bremen, (2000).
Acknowledgements
The Project was supported by Cotton Incorporated and the Texas Food and Fibers Commission. We wish to thank P. Williams and B. Wyatt for the valuable technical assistance.
interaction Area × Temperature. Group 7 consists of a large number of peaks that are not well separated; they are on the 2 lint samples but more on the lint sample from the Area 3. The intensity of these peaks at 53ºC is very high compared to 27ºC for the Area 3. It means that this or these substances could contribute to the interaction Area × Temperature. In summary, groups 2, 5, 6, and 7 could contribute to the interaction Area × Temperature. Group 7 may be specifi c to aphid contamination leading to discriminating between whitefl y and aphid contaminations. These compounds may have low melting points, as they are found on the H2SD aluminum foil with the hot plate temperature setting of 53ºC but not at 27ºC.