Student Attendance and Enrollment Loss in 2020–21
13
1 National Survey of Public Education’s Response to COVID-19 In spring 2020, the COVID-19 pandemic led schools across the country to close their doors and transition to distance learning. One year later—in spring 2021—districts continued to adapt to the persistent and evolving challenges of schooling during the pandemic. With variations in state guidelines and community needs, the importance of understanding the education landscape across the United States is greater than ever. The American Institutes for Research (AIR) launched two national surveys to better understand how school districts across the country have responded to the pandemic. The first National Survey of Public Education’s Response to COVID-19 was sent to leaders in approximately 2,500 school districts in May 2020 and received 753 responses. 1 Results from the first survey appear in a collection of research briefs published between July 2020 and April 2021, which are available on the project page. The second survey was sent to the same sample of 2,500 leaders, as well as an additional 10,000 districts that were not included in the original survey sample. Administration took place in April 2021, with 565 districts responding from 46 states. 2 While the survey response rate is low, observed characteristics of the responding districts About This Brief • This brief examines public school district attendance rates, attendance monitoring and outreach methods, and enrollment loss during the 2020–21 school year. • Findings suggest that attendance rates have dropped compared with previous years, with lower attendance rates in districts that were not providing primarily in-person instruction, as well as high-poverty districts and districts serving mostly students of color. These districts, as well as lower achieving districts, were also more likely to report substantially lower attendance in fall 2020 compared with fall 2019. • Districts that were not providing primarily in- person instruction used a variety of nontraditional methods to monitor student attendance and to contact students who were chronically absent. • Districts that were not providing primarily in- person instruction, high-poverty districts, and historically lower achieving districts reported higher rates of enrollment loss than their counterparts. Student Attendance and Enrollment Loss in 2020–21 Joanne Carminucci | Sarah Hodgman | Jordan Rickles | Mike Garet June 2021 RESEARCH BRIEF
-
Upload
khangminh22 -
Category
Documents
-
view
2 -
download
0
Transcript of Student Attendance and Enrollment Loss in 2020–21

1
National Survey of Public Education’s Response to COVID-19
In spring 2020, the COVID-19 pandemic led schools across the country to close their doors and transition to distance learning. One year later—in spring 2021—districts continued to adapt to the persistent and evolving challenges of schooling during the pandemic. With variations in state guidelines and community needs, the importance of understanding the education landscape across the United States is greater than ever.
The American Institutes for Research (AIR) launched two national surveys to better understand how school districts across the country have responded to the pandemic. The first National Survey of Public Education’s Response to COVID-19 was sent to leaders in approximately 2,500 school districts in May 2020 and received 753 responses.1 Results from the first survey appear in a collection of research briefs published between July 2020 and April 2021, which are available on the project page. The second survey was sent to the same sample of 2,500 leaders, as well as an additional 10,000 districts that were not included in the original survey sample. Administration took place in April 2021, with 565 districts responding from 46 states.2
While the survey response rate is low, observed characteristics of the responding districts
About This Brief
• This brief examines public school district attendance rates, attendance monitoring and outreach methods, and enrollment loss during the 2020–21 school year.
• Findings suggest that attendance rates have dropped compared with previous years, with lower attendance rates in districts that were not providing primarily in-person instruction, as well as high-poverty districts and districts serving mostly students of color. These districts, as well as lower achieving districts, were also more likely to report substantially lower attendance in fall 2020 compared with fall 2019.
• Districts that were not providing primarily in-person instruction used a variety of nontraditional methods to monitor student attendance and to contact students who were chronically absent.
• Districts that were not providing primarily in-person instruction, high-poverty districts, and historically lower achieving districts reported higher rates of enrollment loss than their counterparts.
Student Attendance and Enrollment Loss in 2020–21
Joanne Carminucci | Sarah Hodgman | Jordan Rickles | Mike Garet June 2021
RESEARCH BRIEF

National Survey of Public Education’s Response to COVID-19: Student Attendance and Enrollment Loss in 2020–21
2
reflect average characteristics of the national district sample. In addition, our survey results on the prevalence of in-person instruction are consistent with findings from the Institute of Education Sciences’ (2021) School Survey Dashboard, providing reassurance that our survey sample is a reasonable representation of districts across the country.
In this brief, we highlight survey results on student attendance and enrollment loss during the pandemic, focusing on how attendance and enrollment loss differed by mode of instruction and other district characteristics.
Introduction In the years prior to the COVID-19 pandemic, the average daily attendance rate was about 95% for elementary schools, 92% for secondary schools, and 94% for elementary and secondary schools combined (National Center for Education Statistics, 2013), which amounts to an average absence rate of approximately 6% prior to the pandemic. Kurtz (2020) found that absence rates increased to approximately 10% in fall 2020, with even higher rates in districts that were providing fully remote instruction. Results from our brief on instructional approaches indicate that traditionally marginalized students were overrepresented in districts that continued providing remote instruction in 2020–21 (see Hodgman et al., 2021). Furthermore, Korman et al. (2020) estimated that the increase in absence rates combined with increased enrollment loss could drastically disrupt instruction for nearly “3 million of the most educationally marginalized students in the country,” with English learners (ELs), students with disabilities, students experiencing homelessness and poverty, and students in foster care especially at risk.
Although there has been much discussion of attendance during the pandemic, we lack an “established definition of ‘attendance’ in an online environment” (Chambers et al., 2020, p. 1). Under remote learning, districts are of course unable to count students physically present in a classroom; thus, districts have been left to find other ways of defining and measuring the attendance and participation of remote students. Most often, districts have defined attendance as “a once-per-day check-in,” with the check-in taking various forms including sign-ins to learning management systems, homework submission, or forms submitted by parents (Schwartz et al., 2021, p. 6).
This brief builds upon previous reports on student attendance and enrollment loss by exploring how attendance rates and enrollment loss, as reported by district leaders, differed between grade bands and by mode of instruction in 2020–21. We also present differences by district locale, size, poverty level, racial composition, concentration of English learners, and historic achievement.3
Student Attendance in 2020–21 To better understand student attendance during the pandemic, we asked district leaders to report their district’s average attendance rates in fall 2020 for students in early elementary school (Grades K–2), upper elementary school (Grades 3–5), middle school (Grades 6–8), and high school (Grades 9–12). Based on these responses, we found that the average attendance rate in fall 2020 was 92% for early and

National Survey of Public Education’s Response to COVID-19: Student Attendance and Enrollment Loss in 2020–21
3
upper elementary school students, 90% for middle school students, and 89% for high school students. These attendance rates were generally lower than the national pre-pandemic averages of 95% for elementary school students and 92% for middle and high school students. Overall, 18% of districts reported that daily attendance for all students was substantially lower in fall 2020 than in fall 2019.
Differences in Attendance Rates by Mode of Instruction Districts that provided primarily in-person instruction in fall 2020 reported higher attendance rates than districts that did not provide primarily in-person instruction, and these differences were more pronounced for students in higher grade levels (see Figure 1). Nearly a quarter of districts (24%) that did not provide primarily in-person instruction in fall 2020 indicated that attendance was substantially lower than in the previous year, compared with 8% of districts that provided primarily in-person instruction at that time.
Differences in Attendance Rates by District Characteristics Low-poverty districts and districts serving mostly White students reported higher attendance rates than high-poverty districts and districts serving mostly students of color, respectively (see Figure 2). In addition, higher achieving districts maintained higher daily attendance during the COVID-19 pandemic than districts with lower historic achievement. High-poverty districts, districts serving mostly students of color, and lower achieving districts were also more likely than their respective counterparts to indicate that daily attendance in fall 2020 was substantially lower than in the previous year.
Figure 1. Student Attendance in 2020–21 Average fall 2020 attendance rates by instructional mode and grade
Sample sizes. Primarily in person = 235 districts, Not primarily in person = 258.
94% 94% 93% 93%89% 89% 88% 85%
Grades K–2 Grades 3–5 Grades 6–8 Grades 9–12
Primarily in person Not primarily in person
Classifying District Instruction “Primarily in-person instruction” = more than 75% of students received all or most of their instruction in person.4 This includes fully in-person instruction as well as hybrid instruction where “most” instruction took place in person.
“Not primarily in-person instruction” = at least 25% of students received remote instruction. This includes fully remote instruction as well as hybrid instruction where “most” instruction took place remotely or instruction was equally divided between remote and in-person delivery.

National Survey of Public Education’s Response to COVID-19: Student Attendance and Enrollment Loss in 2020–21
4
Figure 2. Student Attendance in 2020–21 by District Characteristics Average fall 2020 attendance rates
* Difference between district groups was statistically significant (p < 0.05).
Sample sizes (left panel). 494 districts overall; 154 urban or suburban districts and 340 town or rural districts; 58 large districts and 195 small districts; 145 high-poverty districts and 137 low-poverty districts; 124 districts serving mostly students of color and 369 districts serving mostly White students; 90 districts serving a high percentage of ELs and 328 districts serving a low percentage of ELs; 156 low-achieving districts and 166 high-achieving districts.
Sample sizes (right panel). 492 districts overall; 154 urban or suburban districts and 338 town or rural districts; 58 large districts and 193 small districts; 144 high-poverty districts and 138 low-poverty districts; 123 districts serving mostly students of color and 368 districts serving mostly White students; 90 districts serving a high percentage of ELs and 326 districts serving a low percentage of ELs; 155 low-achieving districts and 166 high-achieving districts.

National Survey of Public Education’s Response to COVID-19: Student Attendance and Enrollment Loss in 2020–21
5
Figure 2. Student Attendance in 2020–21 by District Characteristics (continued) Average fall 2020 attendance rates
* Difference between district groups was statistically significant (p < 0.05).
Sample sizes (left panel). 485 districts overall; 152 urban or suburban districts and 333 town or rural districts; 58 large districts and 188 small districts; 142 high-poverty districts and 138 low-poverty districts; 119 districts serving mostly students of color and 365 districts serving mostly White students; 88 districts serving a high percentage of ELs and 322 districts serving a low percentage of ELs; 151 low-achieving districts and 165 high-achieving districts.
Sample sizes (right panel). 432 districts overall; 120 urban or suburban districts and 312 town or rural districts; 55 large districts and 154 small districts; 128 high-poverty districts and 112 low-poverty districts; 99 districts serving mostly students of color and 332 districts serving mostly White students; 66 districts serving a high percentage of ELs and 303 districts serving a low percentage of ELs; 127 low-achieving districts and 137 high-achieving districts.
District Responses to Attendance Concerns By winter 2021, districts that were not providing primarily in-person instruction were using a variety of methods to monitor the attendance of remote students and to contact chronically absent students in an effort to minimize attendance concerns (see Figures 3A and 3B). Nearly all of the districts that were not providing primarily in-person instruction in winter 2021 (94%) reported using teacher reports of student absences to monitor attendance. Most of these districts also indicated that they used a learning management system or completion of homework assignments to monitor attendance (89% and 84%, respectively). In general, districts that were providing primarily in-person instruction were less likely to use these methods of attendance tracking (see Figure 3A).

National Survey of Public Education’s Response to COVID-19: Student Attendance and Enrollment Loss in 2020–21
6
For students who were chronically absent in 2020–21, nearly all districts that were not providing primarily in-person instruction said they expected teachers (98%) and/or other school or administrative staff (96%) to contact students and families directly. A smaller majority (74%) used automated messages, and over half (56%) indicated that teachers were expected to visit the homes of students who were chronically absent (see Figure 3B).
“Home visits have done more good than anything else to get students to participate.” – District leader from a rural district that was not providing
primarily in-person instruction in fall 2020
Figure 3. District Responses to Attendance Concerns Figure 3A. Percentage of districts using each of the following methods for attendance tracking in winter 2021 by instructional mode
Figure 3B. Percentage of districts using each of the following methods to contact chronically absent students in winter 2021 by instructional mode
Sample sizes. Figure 3A: 212 districts providing primarily in-person instruction, 336 districts not providing primarily in-person instruction. Figure 3B: 294 districts providing primarily in-person instruction, 266 districts not providing primarily in-person instruction.
84%
89%
94%
68%
73%
73%
Homework Submissions
Learning Management Systems
Teacher Reports
Primarily in person Not primarily in person
56%
74%
96%
98%
22%
47%
70%
73%
Teachers Visit Homes
Automated Messages
Other Staff Message Families
Teachers Message Families
Primarily in person Not primarily in person
National Survey of Public Education’s Response to COVID-19: Student Attendance and Enrollment Loss in 2020–21
7
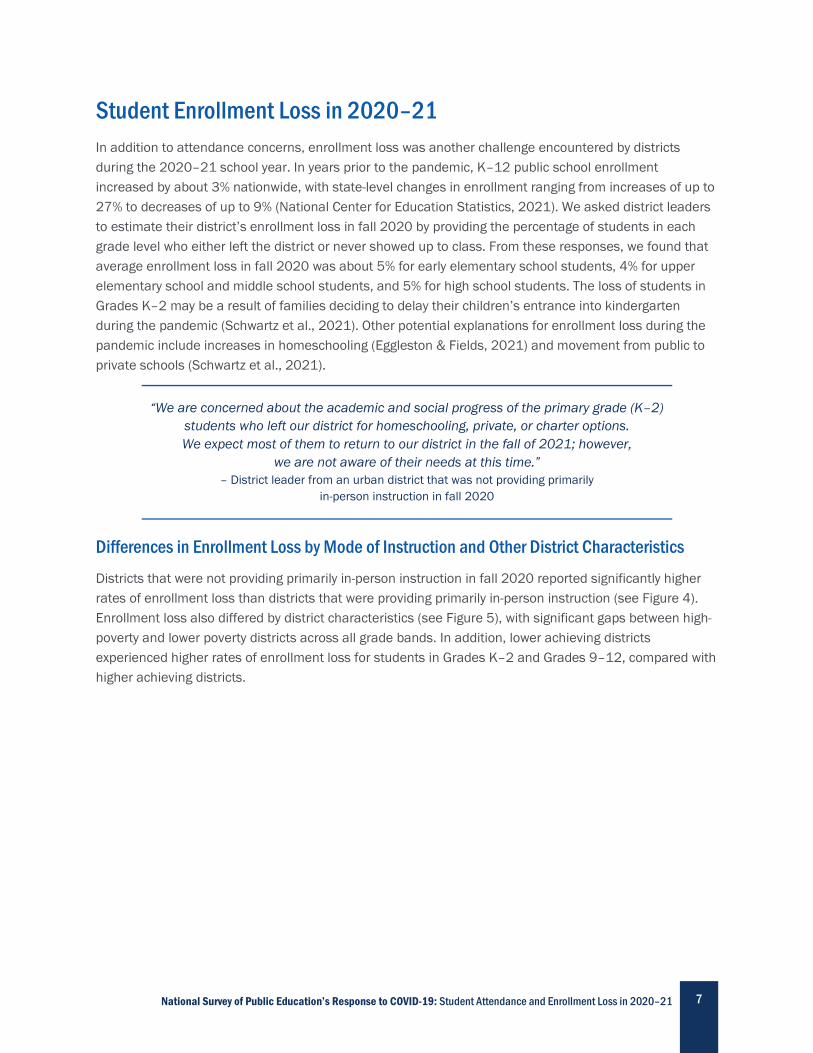
Student Enrollment Loss in 2020–21 In addition to attendance concerns, enrollment loss was another challenge encountered by districts during the 2020–21 school year. In years prior to the pandemic, K–12 public school enrollment increased by about 3% nationwide, with state-level changes in enrollment ranging from increases of up to 27% to decreases of up to 9% (National Center for Education Statistics, 2021). We asked district leaders to estimate their district’s enrollment loss in fall 2020 by providing the percentage of students in each grade level who either left the district or never showed up to class. From these responses, we found that average enrollment loss in fall 2020 was about 5% for early elementary school students, 4% for upper elementary school and middle school students, and 5% for high school students. The loss of students in Grades K–2 may be a result of families deciding to delay their children’s entrance into kindergarten during the pandemic (Schwartz et al., 2021). Other potential explanations for enrollment loss during the pandemic include increases in homeschooling (Eggleston & Fields, 2021) and movement from public to private schools (Schwartz et al., 2021).
“We are concerned about the academic and social progress of the primary grade (K–2) students who left our district for homeschooling, private, or charter options. We expect most of them to return to our district in the fall of 2021; however,
we are not aware of their needs at this time.” – District leader from an urban district that was not providing primarily
in-person instruction in fall 2020
Differences in Enrollment Loss by Mode of Instruction and Other District Characteristics Districts that were not providing primarily in-person instruction in fall 2020 reported significantly higher rates of enrollment loss than districts that were providing primarily in-person instruction (see Figure 4). Enrollment loss also differed by district characteristics (see Figure 5), with significant gaps between high-poverty and lower poverty districts across all grade bands. In addition, lower achieving districts experienced higher rates of enrollment loss for students in Grades K–2 and Grades 9–12, compared with higher achieving districts.

National Survey of Public Education’s Response to COVID-19: Student Attendance and Enrollment Loss in 2020–21
8
Figure 4. Student Enrollment Loss in 2020–21 Average fall 2020 enrollment loss by instructional mode and grade
Sample sizes. Primarily in person = 232 districts, Not primarily in person = 256.
4% 3% 3% 4%
7%
5% 5%6%
0%
2%
4%
6%
8%
10%
Grades K–2 Grades 3–5 Grades 6–8 Grades 9–12
Primarily in person Not primarily in person

National Survey of Public Education’s Response to COVID-19: Student Attendance and Enrollment Loss in 2020–21
9
Figure 5. Student Enrollment Loss in 2020–21 by District Characteristics Average fall 2020 enrollment loss
* Difference between district groups was statistically significant (p < 0.05).
Sample sizes (left panel). 490 districts overall; 154 urban or suburban districts and 336 town or rural districts; 59 large districts and 194 small districts; 142 high-poverty districts and 138 low-poverty districts; 125 districts serving mostly students of color and 364 districts serving mostly White students; 89 districts serving a high percentage of ELs and 327 districts serving a low percentage of ELs; 152 low-achieving districts and 164 high-achieving districts.
Sample sizes (right panel). 486 districts overall; 153 urban or suburban districts and 333 town or rural districts; 59 large districts and 191 small districts; 141 high-poverty districts and 138 low-poverty districts; 124 districts serving mostly students of color and 361 districts serving mostly White students; 89 districts serving a high percentage of ELs and 324 districts serving a low percentage of ELs; 151 low-achieving districts and 163 high-achieving districts.

National Survey of Public Education’s Response to COVID-19: Student Attendance and Enrollment Loss in 2020–21
10
Figure 5. Student Enrollment Loss in 2020–21 by District Characteristics (continued) Average fall 2020 enrollment loss
* Difference between district groups was statistically significant (p < 0.05).
Sample sizes (left panel). 483 districts overall; 151 urban or suburban districts and 332 town or rural districts; 59 large districts and 189 small districts; 140 high-poverty districts and 138 low-poverty districts; 121 districts serving mostly students of color and 361 districts serving mostly White students; 87 districts serving a high percentage of ELs and 321 districts serving a low percentage of ELs; 149 low-achieving districts and 162 high-achieving districts.
Sample sizes (right panel). 432 districts overall; 120 urban or suburban districts and 312 town or rural districts; 56 large districts and 156 small districts; 127 high-poverty districts and 113 low-poverty districts; 100 districts serving mostly students of color and 331 districts serving mostly White students; 65 districts serving a high percentage of ELs and 304 districts serving a low percentage of ELs; 126 low-achieving districts and 135 high-achieving districts.

National Survey of Public Education’s Response to COVID-19: Student Attendance and Enrollment Loss in 2020–21
11
Conclusion The COVID-19 pandemic has presented widespread challenges to public school districts and their stakeholders, not least of which are declines in enrollment and daily attendance among K–12 students. While these hardships affected nearly all school districts, the results presented in this brief suggest that attendance rates and enrollment loss differed by district characteristics. In general, we found that high-poverty districts, districts serving mostly students of color, and historically low-achieving districts reported lower daily attendance rates than their respective counterparts. At the early elementary school and high school levels, historically lower achieving districts also reported higher rates of enrollment loss than high-achieving districts.
Attendance rates and enrollment loss also differed by instructional mode. Across all grade bands, districts that provided primarily in-person instruction in 2020–21 had higher attendance rates and a smaller enrollment loss than districts that did not provide primarily in-person instruction. These disparities persisted despite efforts made by districts that were not providing primarily in-person instruction to track attendance and contact chronically absent students. These findings are consistent with the differences by district characteristics noted above, reflecting the fact that traditionally marginalized students were overrepresented in districts that continued to provide remote instruction in 2020–21.
In summary, districts serving traditionally marginalized students faced lower attendance rates and a higher rate of enrollment loss in 2020–21. These disparities may exacerbate gaps in achievement that existed prior to the pandemic. Our results highlight the need for supports that can minimize the effects of these disparities as school districts prepare to transition into the post-COVID era.

National Survey of Public Education’s Response to COVID-19: Student Attendance and Enrollment Loss in 2020–21
12
References Chambers, D., Scala J., & English, D. (2020). Promising Practices Brief: Improving student engagement
and attendance during COVID-19 school closures. Insight Policy Research. https://insightpolicyresearch.com/wp-content/uploads/2020/08/NSAES_COVID19_Whitepaper_Final_508.pdf
Eggleston, C., & Fields, J. (2021). Census Bureau’s Household Pulse Survey shows significant increase in homeschooling rates in fall 2020. United States Census Bureau. https://www.census.gov/library/stories/2021/03/homeschooling-on-the-rise-during-covid-19-pandemic.html#:~:text=Meeting%20Education%2C%20Health%20Needs&text=By%20fall%2C%2011.1%25%20of%20households,30%2DOct.&text=That%20change%20represents%20an%20increase,compared%20to%20the%20prior%20year.
Hodgman, S., Rickles, J., & Carminucci, J. (2021). District approaches to instruction in 2020–21: Differences in instructional modes and instruction time across contexts. American Institutes for Research. https://www.air.org/sites/default/files/research-brief-covid-survey-differences-instructional-modes-june-2021.pdf
Institute of Education Sciences. (2021). Monthly school survey dashboard. U.S. Department of Education. https://ies.ed.gov/schoolsurvey/
Korman, H., O’Keefe, B., & Repka, M. (2020). Missing in the margins: Estimating the scale of the COVID-19 attendance crisis. Bellwether Education. https://bellwethereducation.org/publication/missing-margins-estimating-scale-covid-19-attendance-crisis
Kurtz, H. (2020, October 15). In-person learning expands, student absences up, teachers work longer, survey shows. EdWeek. https://www.edweek.org/leadership/in-person-learning-expands-student-absences-up-teachers-work-longer-survey-shows/2020/10
National Center for Education Statistics. (2013). Table 203.90. Average daily attendance (ADA) as a percentage of total enrollment, school day length, and school year length in public schools, by school level and state: 2007-08 and 2011-12. Digest of Educational Statistics. U.S. Department of Education. https://nces.ed.gov/programs/digest/d19/tables/dt19_203.90.asp
National Center for Education Statistics. (2021). Public school enrollment. Condition of Education. U.S. Department of Education. https://nces.ed.gov/programs/coe/indicator/cga
Reardon, S. F., Ho, A. D., Shear, B. R., Fahle, E. M., Kalogrides, D., Jang, H., Chavez, B., Buontempo, J., & DiSalvo, R. (2019). Stanford Education Data Archive (Version 3.0). http://purl.stanford.edu/db586ns4974.
Schwartz, H., Diliberti, M., Berdie, L., Grant, D., Hunter, G., & Setodji, C. (2021). Urban and rural districts showed a strong divide during the COVID-19 pandemic. Rand Corporation. https://www.rand.org/pubs/research_reports/RRA956-2.html
U.S. Census Bureau. (n.d.). Census regions and divisions of the United States. https://www2.census.gov/geo/pdfs/maps-data/maps/reference/us_regdiv.pdf
U.S. Census Bureau. (2019). 2018 American Community Survey 5-year estimates. https://www.census.gov/programs-surveys/acs/data.html
U.S. Department of Education. (2019). 2018–19 National Center for Education Statistics (NCES) Common Core of Data. https://nces.ed.gov/ccd/files.asp

National Survey of Public Education’s Response to COVID-19: Student Attendance and Enrollment Loss in 2020–21
13
Endnotes 1 AIR funded and led the development of the first survey, which was administered by our partner NORC at the University of Chicago. We sent the survey to school districts in every U.S. state and Washington, D.C. The sample contained 2,536 districts, stratified by state (for districts in 12 focal states) or region (for districts in the remaining states) and by locale (urban, suburban, town, and rural). Within these strata, districts were drawn with probability proportional to the square root of enrollment. Large districts were drawn with certainty. The survey was open between May 20 and September 1, 2020, and 753 districts responded during that time. Results were weighted to adjust for nonresponse in the 64 state- or region-by-locale strata. More information about the 2020 survey methodology is available in the Preliminary Technical Supplement. 2 AIR also funded and led the development of the second survey, which was administered by our affiliate IMPAQ International, LLC. We initially sent the survey to the same 2,536 districts described above. Two months into the administration period, we sent the survey to the remaining 10,056 districts in our sampling universe in an effort to increase our sample size. The survey was open between January 26 and April 7, 2021, and 565 districts responded during that time. Results were weighted to adjust for nonresponse. More information about the 2021 survey methodology is available in the Technical Supplement. 3 We defined district characteristics as follows: • Geographic Region. Based on regional divisions determined by the U.S. Census Bureau (n.d.). • Locale. Based on four locale categories (city, suburb, town, and rural) determined by the U.S. Department of
Education (2019). We combined city with suburb, and town with rural. • Size. Based on district enrollment data provided by the U.S. Department of Education (2019). Small = <1,000
students; Medium = 1,000 to <10,000 students; Large = 10,000 or more students. • Poverty. Based on child poverty data provided by the U.S. Census Bureau (2019). Low = <10% of children;
Medium = 10% to <20% of children; High = 20% or more of children. • Racial Composition. Based on student demographic data provided by the U.S. Department of Education
(2019). Mostly students of color = >50% non-White students; Not mostly students of color = 50% or fewer non-White students.
• Concentration of English Learners. Based on student demographic data provided by the U.S. Department of Education (2019). Low = <10% of students; High = 10% or more of students.
• Historic District Achievement. Based on achievement data for Grades 3–8 from 2008–09 to 2015–16 provided by the Stanford Education Data Archive (Reardon et al., 2019). The pooled achievement indicators draw from student performance records in English language arts and mathematics. Cutoffs for low, medium, and high achievement were determined using tercile calculations on the survey sampling frame (N=13,281 districts).
4 In the survey, we asked district leaders to report the percentage of students who received each type of instruction in winter 2021 (approximately the last week of January): in-person instruction only, hybrid with more in-person instruction, hybrid with equal in-person and remote instruction, hybrid with more remote instruction, and remote instruction only. This question was asked for each grade bracket offered by the district. For fall 2020, we asked district leaders “about how many students received all or most of their instruction in person” in the first month of the 2020–21 school year. This question was asked for each grade bracket offered by the district, with response options as follows: no students, some students (1%–25%), many students (26%–75%), or all or almost all students. For analyses where instructional mode is presented for Grades K–12 combined, we identified districts as “primarily in person for all grades offered” if their responses met the preceding criteria (more than 75% of students received all or most of their instruction in person) across every grade bracket offered in their district.
Established in 1946, with headquarters in Arlington, Virginia, the American Institutes for Research® (AIR®) is a nonpartisan, not-for-profit organization that conducts behavioral and social science research and delivers technical assistance to solve some of the most urgent challenges in the U.S. and around the world. We advance evidence in the areas of education, health, the workforce, human services, and international development to create a better, more equitable world. The AIR family of organizations now includes IMPAQ, Maher & Maher, and Kimetrica. For more information, visit AIR.ORG.
Copyright © 2021 American Institutes for Research®. All rights reserved. No part of this publication may be reproduced, distributed, or transmitted in any form or by any means, including photocopying, recording, website display, or other electronic or mechanical methods, without the prior written permission of the American Institutes for Research. For permission requests, please use the Contact Us form on AIR.ORG.
Notice of Trademark: “American Institutes for Research” and “AIR” are registered trademarks. All other brand, product, or company names are trademarks or registered trademarks of their respective owners.
1400 Crystal Drive, 10th Floor Arlington, VA 22202-3289 +1.202.403.5000 | AIR.ORG
1519
7_06
/21