A systematic approach for structuring exception handling in ...
Upload
defyingrhetoricalorthodoxCategory
view
3download
0
SUGGESTED CITATION: Fetalvero, E. G., O’Connor, G., & Duad, V. D. (2012). Structuring stage two of Understanding by Design. In Ahmad Nurulazam MD Zain & R. P. Devadason (Eds.), Transforming School Science Education in the 21st Century (316-331). Penang, Malaysia: SEAMEO RECSAM. *The book is available at Romblon State University Library.

S300611EGF
1
THEME AND TRACK: ASSESSMENT
Structuring Stage Two of Understanding by Design
Eddie G. Fetalvero
Romblon State University, Philippines
Gayl O’Connor
Education Services Australia Ltd., Melbourne
Virgil D. Duad
Philippine Normal University
Abstract
Understanding by Design (UbD) curriculum framework is now adopted by
most secondary schools in the Philippines to improve the quality of education.
The design is composed of three stages: identification of desired results;
determination of acceptable evidence of understanding; and planning of
learning experiences and instruction. This contrasts with the traditional
practices by which teacher begins with textbooks, favored lessons and time-
honored activities rather than deriving them from targeted goals or standards.
This paper presents procedures in developing assessment tasks and rubrics in
science subjects for Stage 2 of UbD. It also addresses some important issues in
selecting assessment tasks; designing their cognitive structures to ensure that
learning can occur while students are being assessed; and developing,
validating and testing the reliability of rubrics.
.
Keywords: UbD; performance assessment; assessment task development; rubrics
development
Introduction
Teachers are designers. They design the curriculum and learning experiences to meet
specified purposes. They are also designers of assessments to diagnose student needs and to
determine whether goals have been achieved or whether students have learned.
Just like any other design professions, such as architecture, engineering, or graphic
arts, the design effectiveness corresponds to whether they have accomplished their goals for
the end users. They are client-centered. In these professions, standards inform and shape the
work. These standards provide a framework that will help them identify teaching and learning
priorities and guide them in designing their curriculum and assessment. Their design however
is influenced by the needs of their students like interest, development levels and previous
achievements (Wiggins & McTighe, 1999).
Wiggins, Wilbur and McTighe (2005) define Understanding by Design (UbD) as a
way of thinking purposefully about curricular planning and school reform, a set of helpful
design tools and design standards and not to be looked upon as a program or a recipe. The
end goal of UbD is understanding and the ability to transfer learning – to appropriately
connect, make sense of it and use discrete knowledge and skills in context. Evidence of
understanding is revealed through performance like when learners transfer knowledge and
skills effectively. In UbD, educators are coaches of understanding, not mere purveyors of
content or activity (Wiggins & McTighe, 2002).
S300611EGF
2
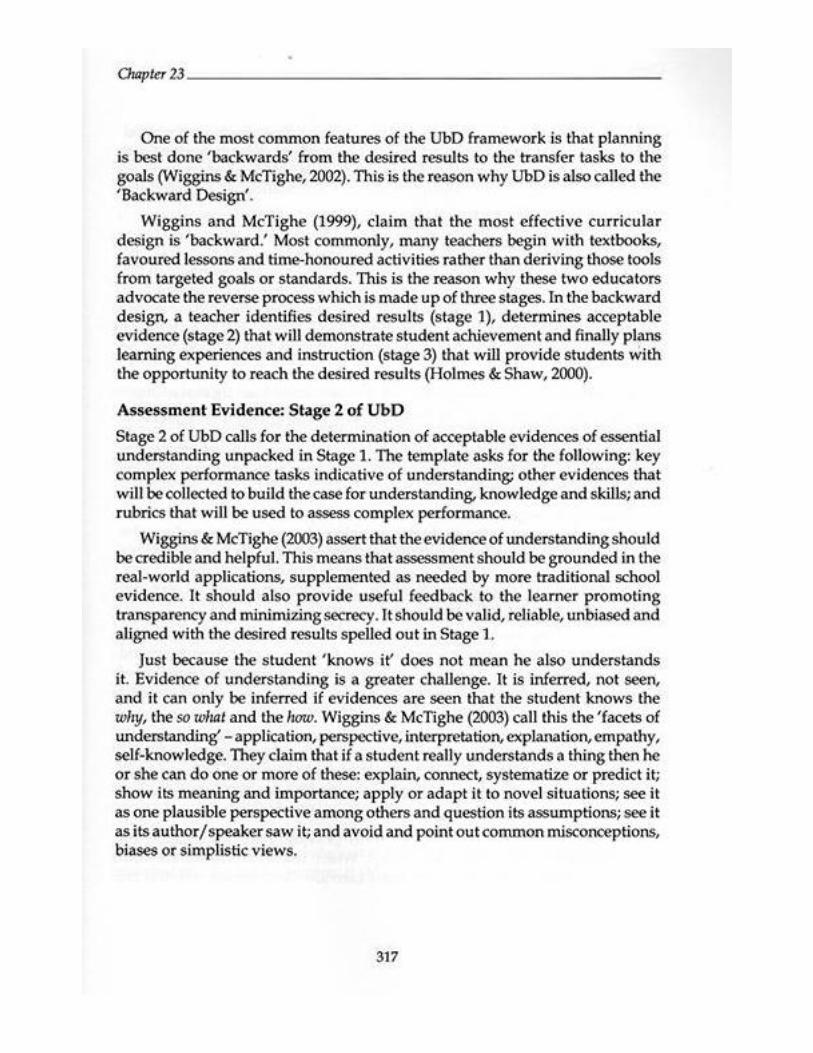
One of the most common features of the UbD framework is that planning is best done
„backwards‟ from the desired results to the transfer tasks to the goals (Wiggins & McTighe,
2002). This is the reason why UbD is also called the „Backward Design‟.
Wiggins and McTighe (1999) claim that the most effective curricular design is
„backward.‟ Most commonly, many teachers begin with textbooks, favored lessons and time-
honored activities rather than deriving those tools from targeted goals or standards. This is
the reason why these two educators advocate the reverse process which is made up of three
stages. In the backward design, a teacher identifies desired results (stage 1), determines
acceptable evidence (stage 2) that will demonstrate student achievement and finally plans
learning experiences and instruction (stage 3) that will provide students with the opportunity
to reach the desired results (Holmes & Shaw, 2000).
Assessment Evidence: Stage 2 of UbD
Stage 2 of UbD calls for the determination of acceptable evidences of essential
understanding unpacked in Stage 1. The template asks for the following: key complex
performance tasks indicative of understanding; other evidences that will be collected to build
the case for understanding, knowledge and skills; and rubrics that will be used to assess
complex performance.
Wiggins & McTighe (2003) assert that the evidence of understanding should be
credible and helpful. This means that assessment should be grounded in the real-world
applications, supplemented as needed by more traditional school evidence. It should also
provide useful feedback to the learner promoting transparency and minimizing secrecy. It
should be valid, reliable, unbiased and aligned with the desired results spelled out in Stage 1.
Just because the student „knows it‟ does not mean he also understands it. Evidence of
understanding is a greater challenge. It is inferred, not seen, and it can only be inferred if
evidences are seen that the student knows the why, the so what and the how. Wiggins &
McTighe (2003) call this the „facets of understanding‟ – application, perspective,
interpretation, explanation, empathy, self-knowledge. They claim that if a student really
understands a thing then he or she can do one or more of these: explain, connect, systematize
or predict it; show its meaning and importance; apply or adapt it to novel situations; see it as
one plausible perspective among others and question its assumptions; see it as its
author/speaker saw it; and avoid and point out common misconceptions, biases or simplistic
views.
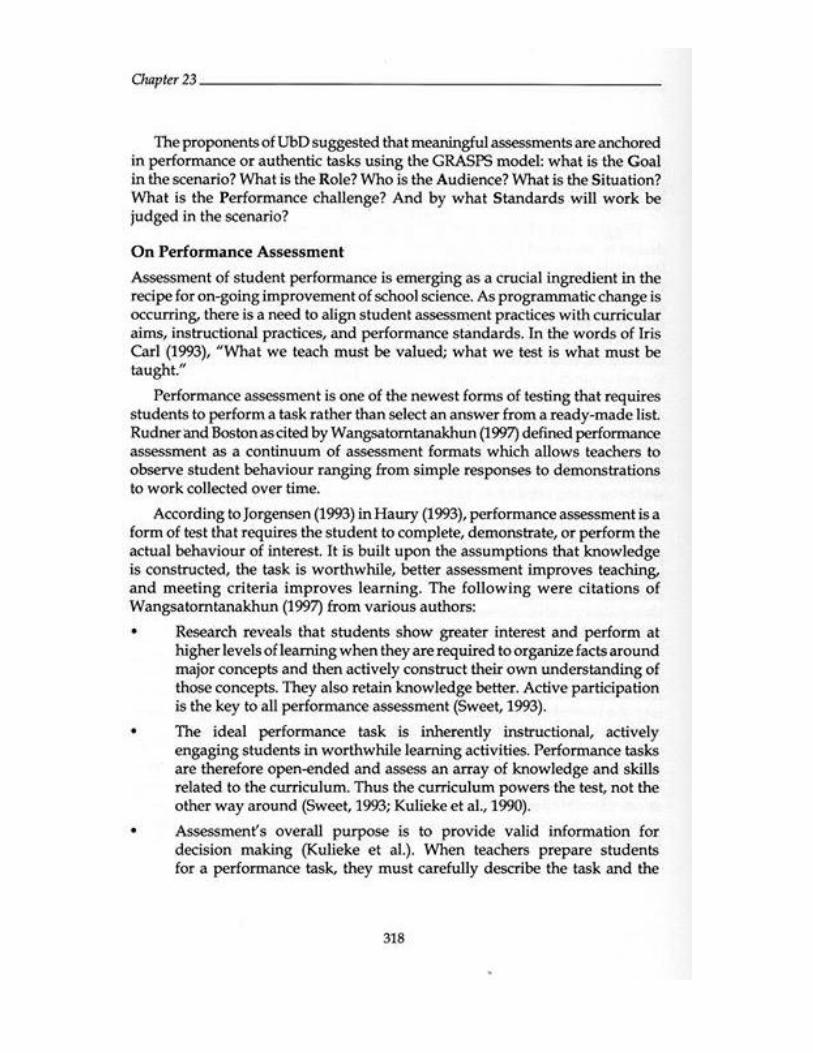
The proponents of UbD suggested that meaningful assessments are anchored in
performance or authentic tasks using the GRASPS model: what is the Goal in the scenario?
What is the Role? Who is the Audience? What is the Situation? What is the Performance
challenge? And by what Standards will work be judged in the scenario?
On Performance Assessment
Assessment of student performance is emerging as a crucial ingredient in the recipe
for on-going improvement of school science. As programmatic change is occurring, there is a
need to align student assessment practices with curricular aims, instructional practices, and
performance standards. In the words of Iris Carl (1993), “What we teach must be valued;
what we test is what must be taught.”
Performance assessment is one of the newest forms of testing that requires students to
perform a task rather than select an answer from a ready-made list. Rudner and Boston as
cited by Wangsatorntanakhun (1997) defined performance assessment as a continuum of
assessment formats which allows teachers to observe student behavior ranging from simple
responses to demonstrations to work collected over time.

S300611EGF
3
According to Jorgensen (1993) in Haury (1993), performance assessment is a form of
test that requires the student to complete, demonstrate, or perform the actual behavior of
interest. It is built upon the assumptions that knowledge is constructed, the task is
worthwhile, better assessment improves teaching, and meeting criteria improves learning.
The following were citations of Wangsatorntanakhun (1997) from various authors:
Research reveals that students show greater interest and perform at higher levels of
learning when they are required to organize facts around major concepts and then
actively construct their own understanding of those concepts. They also retain
knowledge better. Active participation is the key to all performance assessment
(Sweet, 1993).
The ideal performance task is inherently instructional, actively engaging students in
worthwhile learning activities. Performance tasks are therefore open-ended and assess
an array of knowledge and skills related to the curriculum. Thus the curriculum
powers the test, not the other way around (Sweet, 1993; Kulieke et al., 1990).
Assessment‟s overall purpose is to provide valid information for decision making
(Kulieke et al.). When teachers prepare students for a performance task, they must
carefully describe the task and the standards that will be used to evaluate
performance. When teachers are informed of the learning progress and difficulties of
their students they can then make better decisions about content and instruction
(Fuchs, 1996).
Students should be active participants in their own learning. They perform better
when they know what goals they are working towards, when they have the
opportunity to examine models of excellence and when they understand how their
own performance compares to a set of established criteria (McTighe, 1993).
Rubrics
As opposed to most traditional forms of testing, performance assessment does not
have clear-cut or wrong answers. Rather there are degrees to which a student is successful or
unsuccessful. This can be accomplished by creating rubrics.
Airasian, Popham, and Stiggins as cited in Brualdi (2000) defined rubric as a rating
system by which teachers can determine at what level of proficiency a student is able to
perform a task or display knowledge of a concept. Scoring rubrics are descriptive scoring
schemes that are developed by teachers or other evaluators to guide the analysis of the
products or processes of students‟ efforts (Brookhart, 1999).
There are many types of scoring rubrics. An analytic scoring rubric allows for the
separate evaluation of each independent criterion scored on a different descriptive scale. But
when there is an overlap between the criteria set, a holistic rubric is preferable. In this type of
scoring rubric, the criteria are considered in combination on a single descriptive scale which
supports broader judgments concerning the quality of the process or the product (Brookhart,
1999). Scoring rubric may either be general or task specific. General scoring rubrics are
designed to evaluate broader category of tasks while task specific scoring rubrics are
designed to evaluate students‟ performance on a single-assessment event. However, scoring
rubrics may contain both general and task-specific components (Moskal, 2000). Wiggins (as
cited in Brualdi, 1993) has cautioned that not all hands-on activities can be used as
performance assessments. Stix, still in Brualdi (1993) further stressed that in constructing
rubrics, the varying levels of proficiency must be properly communicated. This may be done
by using impartial words instead of numerical or letter grades.
Rubrics appeal to teachers and students for many reasons. First, they are powerful
tools for both teaching and assessment. Rubrics can improve student performance, as well as
monitor it (Marcus, 1995 in Andrade, 1997). Second, rubrics are useful in that they help
S300611EGF
4
students become more thoughtful judges of the quality of their own and others‟ work
(Andrade, 1997). Third, rubrics reduce the amount of time teachers spend evaluating student
work (Andrade, 1997). Fourth, teachers appreciate rubrics because their accordion nature
allows to accommodate heterogeneous classes. Finally, rubrics are easy to use and explain
(Andrade, 1997).
Rubrics are becoming increasingly popular with educator moving toward more
authentic, performance-based assessments. Andrade (1997) suggested some steps in rubric
design process among students to boost the learning leverage of rubrics: look at models, list
criteria, articulate gradations of quality, practice on models, use self and peer assessment,
revise and use teacher assessment using the same rubric students used in assessing their work.
Objectives
This study was conducted to provide science teacher educators with a proposed model
in developing performance assessments that will supplement the Stage 2 of the
Understanding by Design framework being implemented nationwide by the Department of
Education. Specifically, this study aimed to:
1. Present the procedures employed in developing assessment task (from identification
to validation) that would generate valid evidences of understanding;
2. Describe the process of developing, validating and testing the reliability of rubrics;
3. Testing the developed performance tasks among students of physical science at
Romblon State University; and
4. Present an experience in dealing with the issues in performance assessment.
Methodology
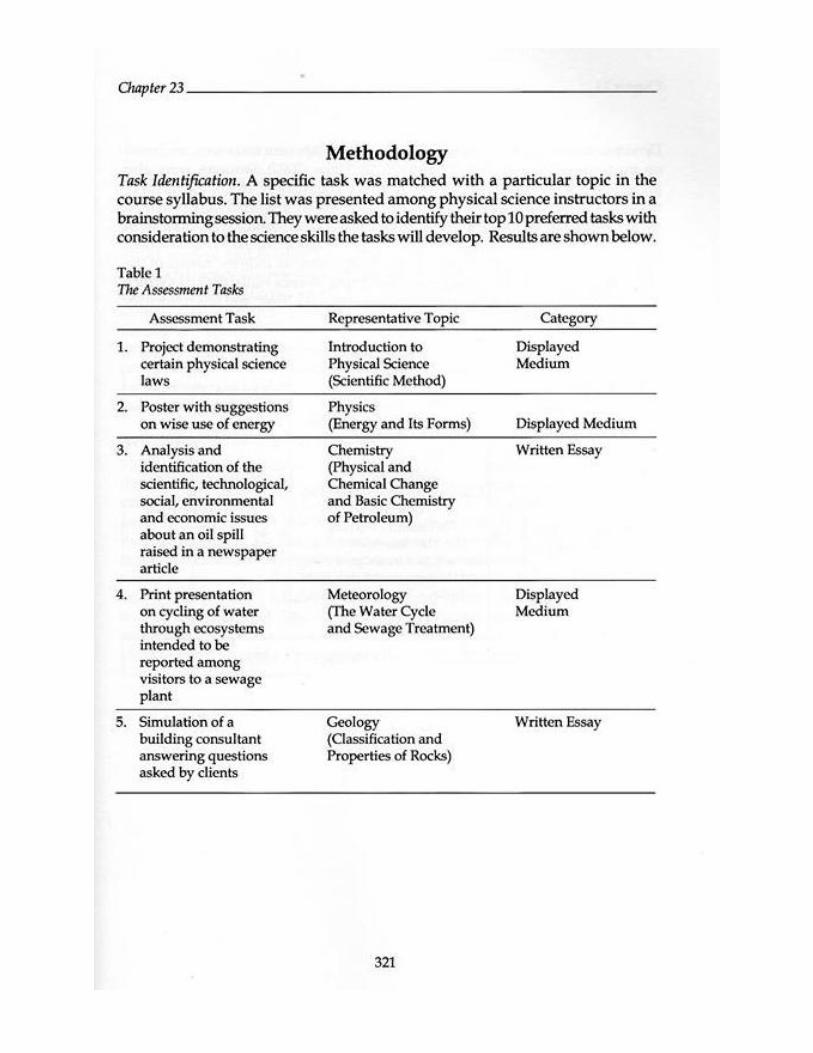
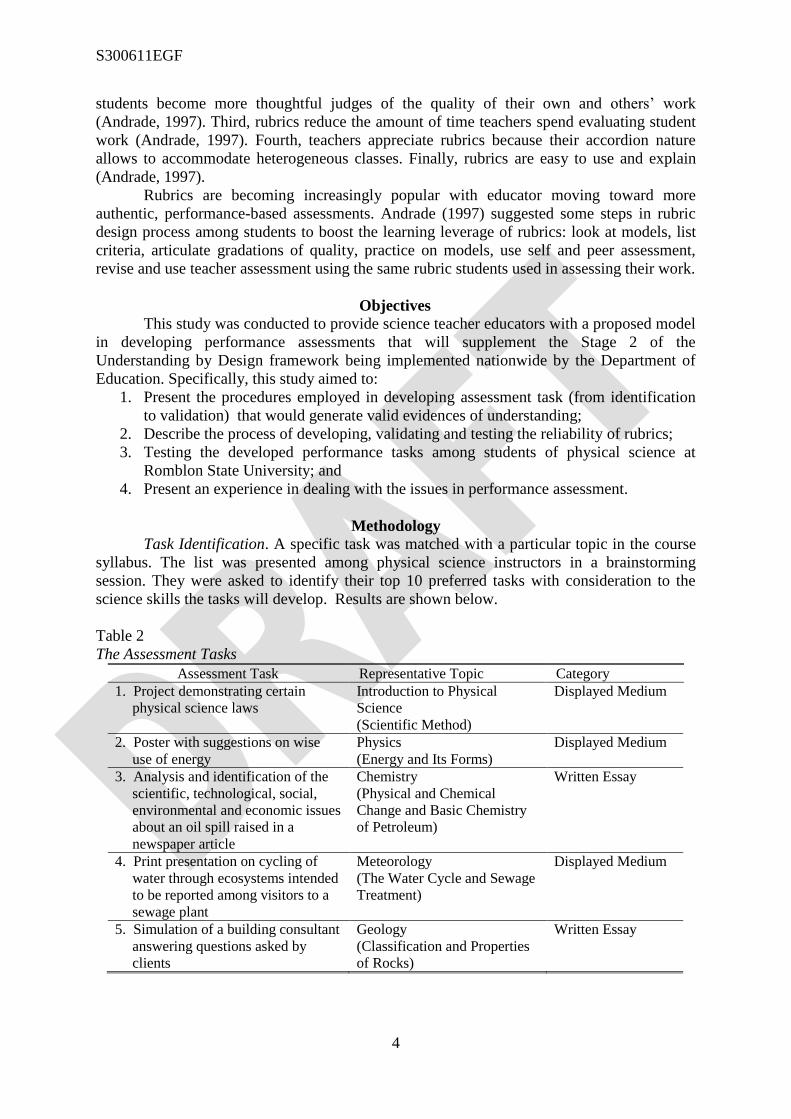
Task Identification. A specific task was matched with a particular topic in the course
syllabus. The list was presented among physical science instructors in a brainstorming
session. They were asked to identify their top 10 preferred tasks with consideration to the
science skills the tasks will develop. Results are shown below.
Table 2
The Assessment Tasks
Assessment Task Representative Topic Category
1. Project demonstrating certain
physical science laws
Introduction to Physical
Science
(Scientific Method)
Displayed Medium
2. Poster with suggestions on wise
use of energy
Physics
(Energy and Its Forms)
Displayed Medium
3. Analysis and identification of the
scientific, technological, social,
environmental and economic issues
about an oil spill raised in a
newspaper article
Chemistry
(Physical and Chemical
Change and Basic Chemistry
of Petroleum)
Written Essay
4. Print presentation on cycling of
water through ecosystems intended
to be reported among visitors to a
sewage plant
Meteorology
(The Water Cycle and Sewage
Treatment)
Displayed Medium
5. Simulation of a building consultant
answering questions asked by
clients
Geology
(Classification and Properties
of Rocks)
Written Essay

S300611EGF
5
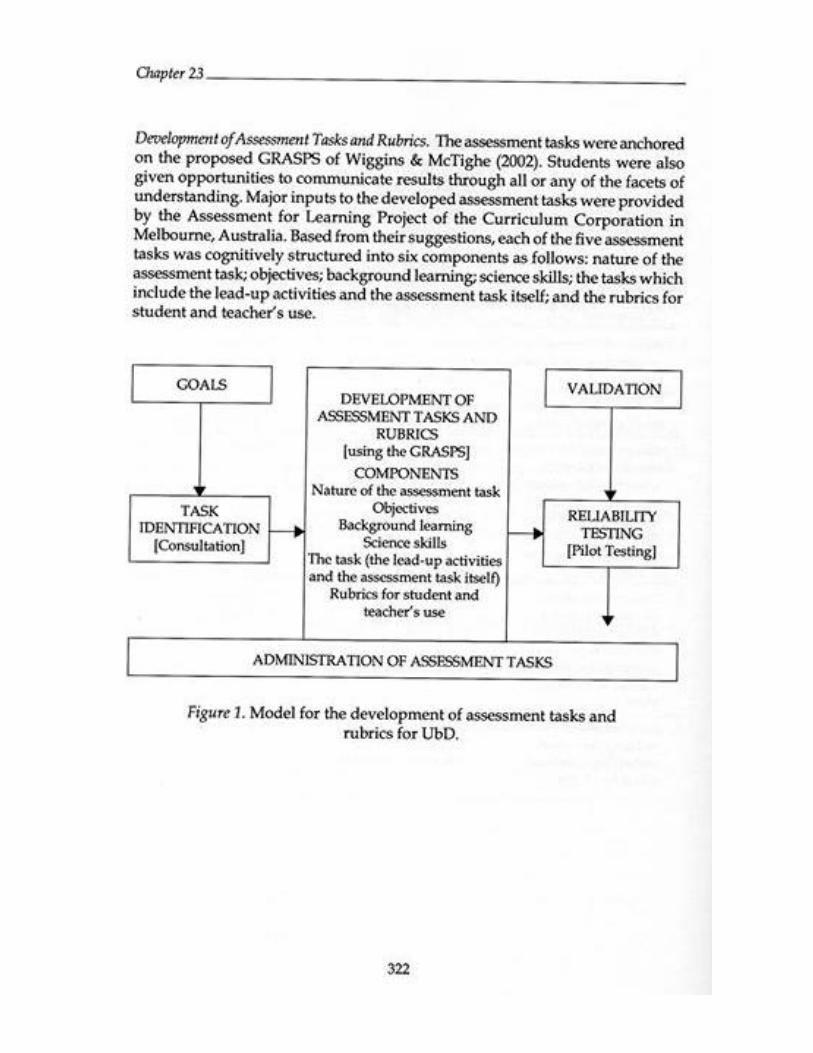
Development of Assessment Tasks and Rubrics. The assessment tasks were anchored
on the proposed GRASPS of Wiggins & McTighe (2002). Students were also given
opportunities to communicate results through all or any of the facets of understanding. Major
inputs to the developed assessment tasks were provided by the Assessment for Learning
Project of the Curriculum Corporation in Melbourne, Australia. Based from their suggestions,
each of the five assessment tasks was cognitively structured into six components as follows:
nature of the assessment task; objectives; background learning; science skills; the tasks which
include the lead-up activities and the assessment task itself; and the rubrics for student and
teacher‟s use.
Figure 1. Model for the Development of Assessment Tasks and Rubrics for UbD
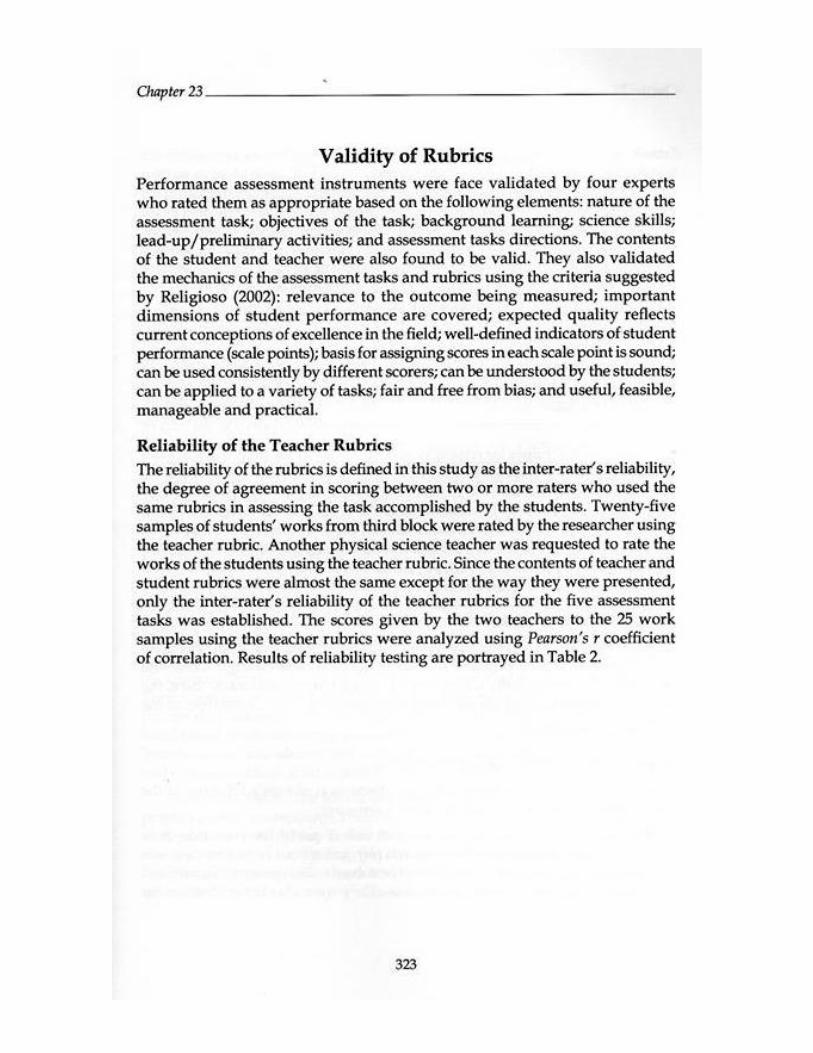
Validity of Rubrics
Performance assessment instruments were face validated by four experts who rated
them as appropriate based on the following elements: nature of the assessment task;
objectives of the task; background learning; science skills; lead-up/preliminary activities; and
assessment tasks directions. The contents of the student and teacher were also found to be
valid. They also validated the mechanics of the assessment tasks and rubrics using the criteria
suggested by Religioso (2002): relevance to the outcome being measured; important
dimensions of student performance are covererd; expected quality reflects current
conceptions of excellence in the field; well-defined indicators of student performance (scale
points); basis for assigning scores in each scale point is sound; can be used consistently by
different scorers; can be understood by the students; can be applied to a variety of tasks; fair
and free from bias; and useful, feasible, manageable and practical.
Reliability of the Teacher Rubrics
The reliability of the rubrics is defined in this study as the inter-rater‟s reliability, the
degree of agreement in scoring between two or more raters who used the same rubrics in
assessing the task accomplished by the students. Twenty-five samples of students‟ works
from third block were rated by the researcher using the teacher rubric. Another physical
science teacher was requested to rate the works of the students using the teacher rubric. Since
the contents of teacher and student rubrics were almost the same except for the way they were
presented, only the inter-rater‟s reliability of the teacher rubrics for the five assessment tasks
GOALS
TASK
IDENTIFICATION
[Consultation]
DEVELOPMENT OF
ASSESSMENT TASKS AND
RUBRICS [using the GRASPS]
COMPONENTS
Nature of the assessment task
Objectives
Background learning
Science skills
The task (the lead-up activities and
the assessment task itself)
Rubrics for student and teacher‟s use
VALIDATION
RELIABILITY
TESTING
[Pilot Testing]
ADMINISTRATION OF ASSESSMENT TASKS

S300611EGF
6
was established. The scores given by the two teachers to the 25 work samples using the
teacher rubrics were analyzed using Pearson’s r coefficient of correlation. Results of
reliability testing are portrayed in Table 3.
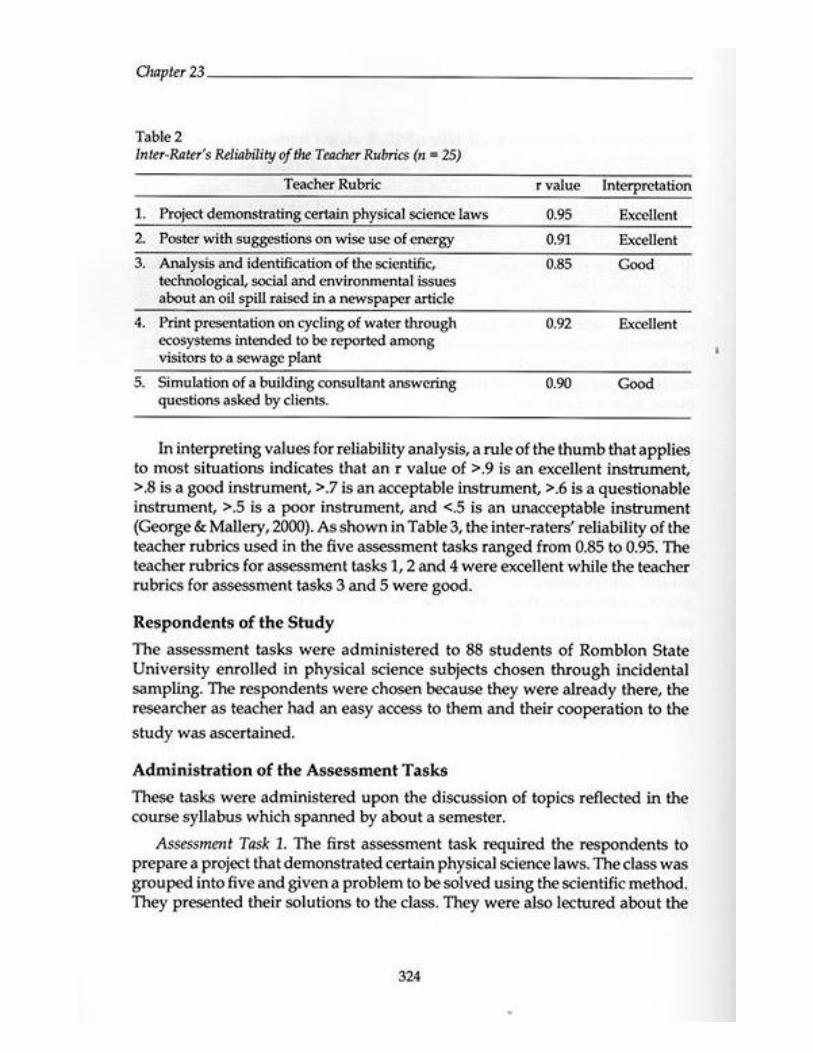
Table 3
Inter-Rater’s Reliability of the Teacher Rubrics (n = 25)
Teacher Rubric r value Interpretation
1. Project demonstrating certain physical science laws 0.95 Excellent
2. Poster with suggestions on wise use of energy 0.91 Excellent
3. Analysis and identification of the scientific,
technological, social and environmental issues about an
oil spill raised in a newspaper article
0.85 Good
4. Print presentation on cycling of water through
ecosystems intended to be reported among visitors to a
sewage plant
0.92 Excellent
5. Simulation of a building consultant answering questions
asked by clients.
0.90 Good
In interpreting values for reliability analysis, a rule of the thumb that applies to most
situations indicates that an r value of >.9 is an excellent instrument, >.8 is a good instrument,
>.7 is an acceptable instrument, >.6 is a questionable instrument, >.5 is a poor instrument,
and <.5 is an unacceptable instrument (George & Mallery, 2000). As shown in Table 3, the
inter-raters‟ reliability of the teacher rubrics used in the five assessment tasks ranged from
0.85 to 0.95. The teacher rubrics for assessment tasks 1, 2 and 4 were excellent while the
teacher rubrics for assessment tasks 3 and 5 were good.
Respondents of the Study
The assessment tasks were administered to 88 students of Romblon State University
enrolled in physical science subjects chosen through incidental sampling. The respondents
were chosen because they were already there, the researcher as teacher had an easy access to
them and their cooperation to the study was ascertained.
Administration of the Assessment Tasks
These tasks were administered upon the discussion of topics reflected in the course
syllabus which spanned by about a semester.
Assessment Task 1. The first assessment task required the respondents to prepare a
project that demonstrated certain physical science laws. The class was grouped into five and
given a problem to be solved using the scientific method. They presented their solutions to
the class. They were also lectured about the list of discoveries and significant events in
science and were exposed to famous science superheroes. The respondents named one
scientist that could serve as their role model. After carrying out the lead-up activities, they
completed the science projects which they presented in class. Students explained the physical
science principles their projects manifested. Their works were rated using the student and
teacher rubrics that contained the following parameters on expected quality: science concept
and understanding, aesthetic appeal, and creativity. Indicators of performance for all tasks
were expert, developing and beginner.
Assessment Task 2. The second assessment task required the respondents to prepare a
poster with suggestions on wise use of energy at home. Two activities were done before the
assessment task was carried out. Respondents identified the different forms of energy
depicted in a certain picture. A game called „energy cards‟ was played. This game
S300611EGF
7
strengthened the concept of the respondents in identifying the form of energy used by the
appliance that was drawn on a card. In the next activity, students were asked to observe,
describe, record and look for patterns of use of the appliances they have at home. Their
posters were rated based on the rubrics containing the following parameters on expected
quality: science understanding, making sense of information, applying understanding and
communicating understanding.
Assessment Task 3. The third assessment task required the respondents to analyze and
identify the scientific, technological, social, environmental and economic issues about a
major oil spill raised in a newspaper article. Before this task was administered, the class was
divided into groups. They were given a copy of the newspaper report about a major oil spill.
This was discussed in the group level and various issues were identified from the report.
Issues that needed further clarification and further investigation were marked. There were
series of activities performed: investigating the physical and chemical properties of oil;
simulating an oil spill; and investigating possible methods of oil clean-up. Their experiences
in the activities performed served as inputs so that the issues that needed further clarification
would be answered. Their written works were rated based on the following parameters on
expected quality: identification of issues, science knowledge and understanding, application
of understanding, and communication of information and understanding.
Assessment Task 4. The fourth assessment task called for the respondents to prepare a
print presentation about water cycle intended to be reported among visitors to a sewage plant.
Before the task was carried out, a grouped activity was performed investigating the change of
state in water in terms of the behavior of water particles associated with energy input and
energy loss. Their understanding of the change of state was applied to a natural phenomenon
- the water cycle. A diagram was studied and the factors that could likely interrupt or affect
the water cycle were enumerated and discussed. After performing those activities, the
assessment task was explained to them. Their print presentations were rated according to the
subsequent parameters on expected quality: science concept and understanding, applying
understanding, and communicating information.
Assessment Task 5. The fifth assessment task required the respondents to simulate a
building consultant answering questions asked by clients. Prior to the task administration,
activities were carried out by the respondents. Through experiments, they investigated some
physical properties of different kinds of rocks. They also simulated the action of chemical
weathering on different types of rocks. Four questions were asked by the clients and the
respondents gave their advices based on the lead-up activities. Their works were rated based
on the following parameters on expected quality: science concept and understanding,
applying understanding and communicating information.
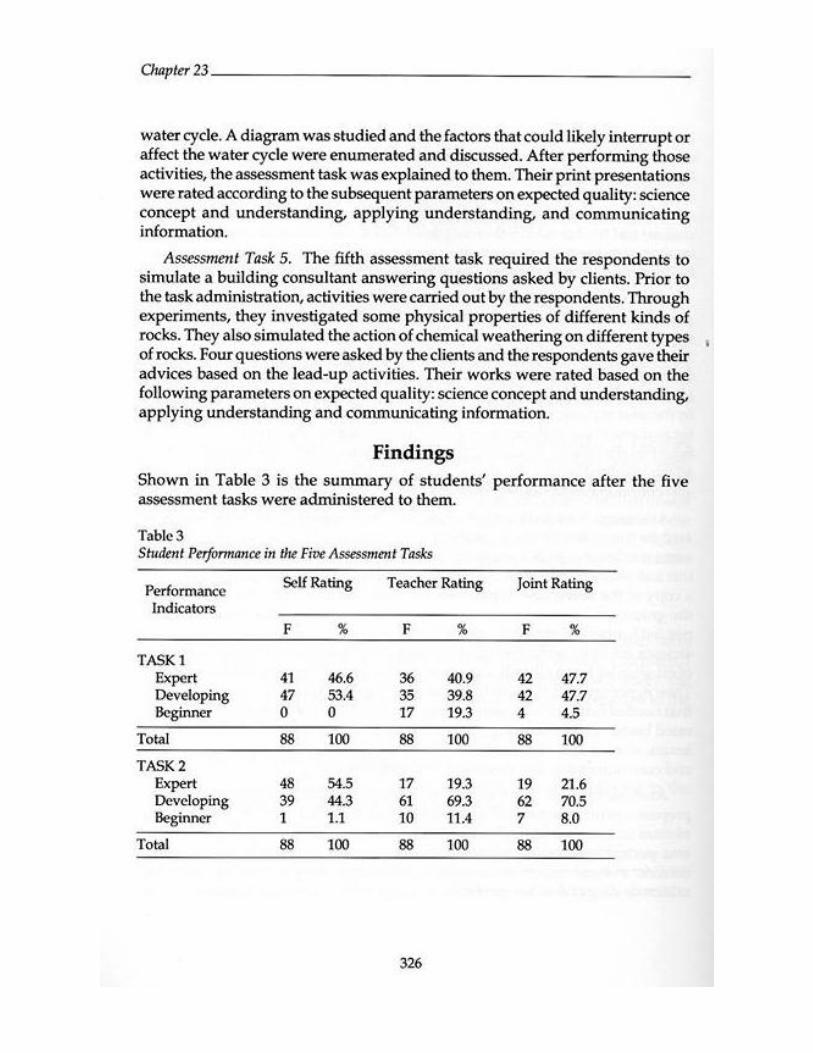
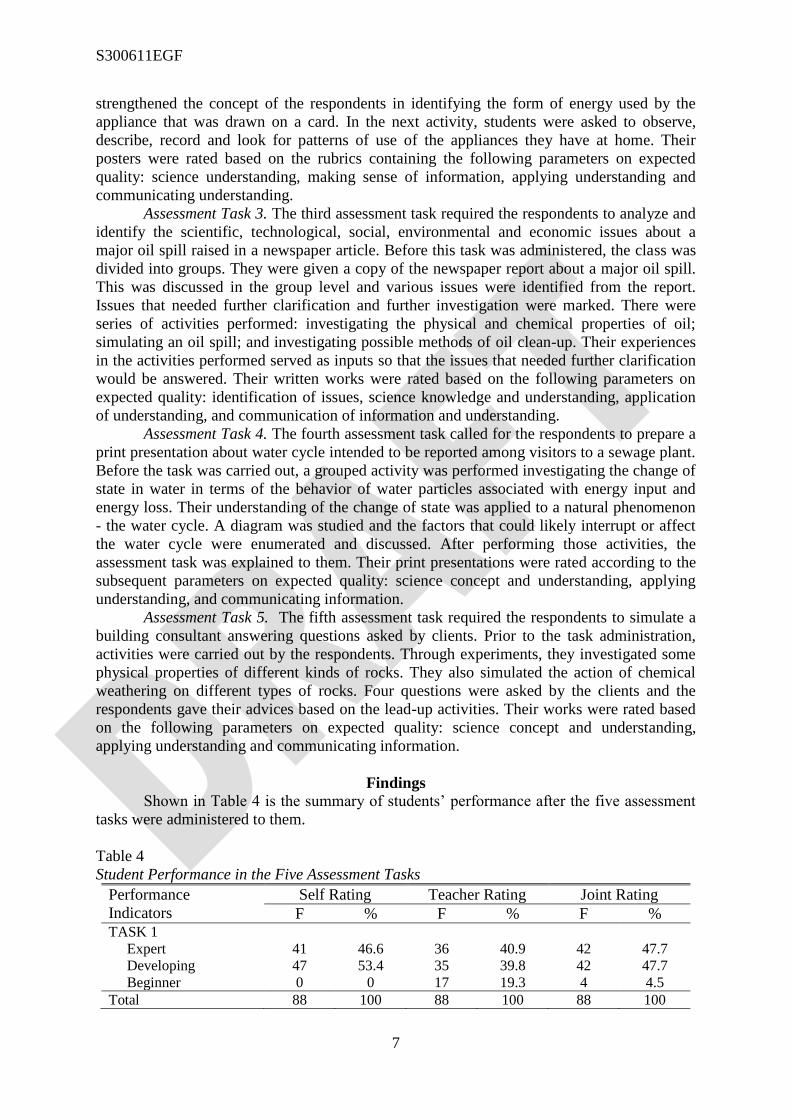
Findings
Shown in Table 4 is the summary of students‟ performance after the five assessment
tasks were administered to them.
Table 4
Student Performance in the Five Assessment Tasks
Performance
Indicators
Self Rating Teacher Rating Joint Rating
F % F % F % TASK 1
Expert 41 46.6 36 40.9 42 47.7
Developing 47 53.4 35 39.8 42 47.7
Beginner 0 0 17 19.3 4 4.5
Total 88 100 88 100 88 100
S300611EGF
8
Performance
Indicators
Self Rating Teacher Rating Joint Rating
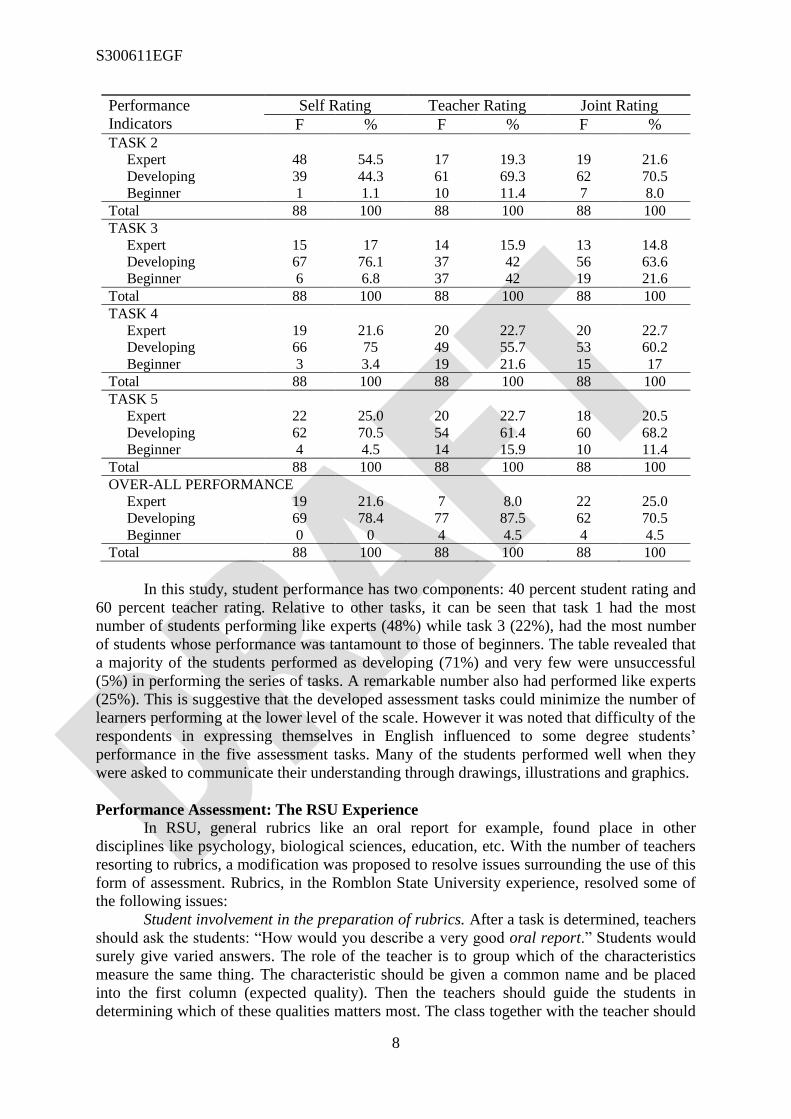
F % F % F % TASK 2
Expert 48 54.5 17 19.3 19 21.6
Developing 39 44.3 61 69.3 62 70.5
Beginner 1 1.1 10 11.4 7 8.0
Total 88 100 88 100 88 100
TASK 3
Expert 15 17 14 15.9 13 14.8
Developing 67 76.1 37 42 56 63.6
Beginner 6 6.8 37 42 19 21.6
Total 88 100 88 100 88 100
TASK 4
Expert 19 21.6 20 22.7 20 22.7
Developing 66 75 49 55.7 53 60.2
Beginner 3 3.4 19 21.6 15 17
Total 88 100 88 100 88 100
TASK 5
Expert 22 25.0 20 22.7 18 20.5
Developing 62 70.5 54 61.4 60 68.2
Beginner 4 4.5 14 15.9 10 11.4
Total 88 100 88 100 88 100
OVER-ALL PERFORMANCE
Expert 19 21.6 7 8.0 22 25.0
Developing 69 78.4 77 87.5 62 70.5
Beginner 0 0 4 4.5 4 4.5
Total 88 100 88 100 88 100
In this study, student performance has two components: 40 percent student rating and
60 percent teacher rating. Relative to other tasks, it can be seen that task 1 had the most
number of students performing like experts (48%) while task 3 (22%), had the most number
of students whose performance was tantamount to those of beginners. The table revealed that
a majority of the students performed as developing (71%) and very few were unsuccessful
(5%) in performing the series of tasks. A remarkable number also had performed like experts
(25%). This is suggestive that the developed assessment tasks could minimize the number of
learners performing at the lower level of the scale. However it was noted that difficulty of the
respondents in expressing themselves in English influenced to some degree students‟
performance in the five assessment tasks. Many of the students performed well when they
were asked to communicate their understanding through drawings, illustrations and graphics.
Performance Assessment: The RSU Experience
In RSU, general rubrics like an oral report for example, found place in other
disciplines like psychology, biological sciences, education, etc. With the number of teachers
resorting to rubrics, a modification was proposed to resolve issues surrounding the use of this
form of assessment. Rubrics, in the Romblon State University experience, resolved some of
the following issues:
Student involvement in the preparation of rubrics. After a task is determined, teachers
should ask the students: “How would you describe a very good oral report.” Students would
surely give varied answers. The role of the teacher is to group which of the characteristics
measure the same thing. The characteristic should be given a common name and be placed
into the first column (expected quality). Then the teachers should guide the students in
determining which of these qualities matters most. The class together with the teacher should

S300611EGF
9
decide how many points should be apportioned in each criterion (expected quality). This will
be the basis in making a scale. It should be taken into consideration that the narrower is the
range of the scale, the better judgment could be made on the work.
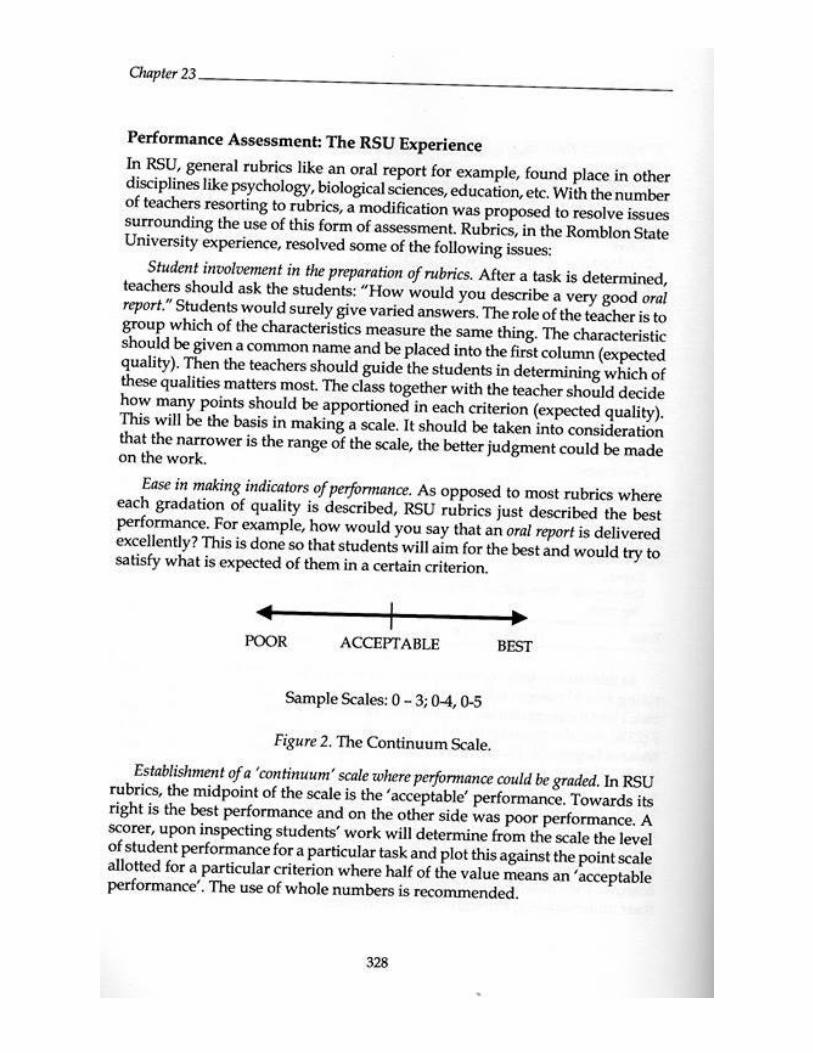
Ease in making indicators of performance. As opposed to most rubrics where each
gradation of quality is described, RSU rubrics just described the best performance. For
example, how would you say that an oral report is delivered excellently? This is done so that
students will aim for the best and would try to satisfy what is expected of them in a certain
criterion.
Sample Scales: 0 – 3; 0-4, 0-5
Figure 2. The Continuum Scale
Establishment of a ‘continuum’ scale where performance could be graded. In RSU
rubrics, the midpoint of the scale is the „acceptable‟ performance. Towards its right is the best
performance and on the other side was poor performance. A scorer, upon inspecting students‟
work will determine from the scale the level of student performance for a particular task and
plot this against the point scale allotted for a particular criterion where half of the value
means an „acceptable performance‟. The use of whole numbers is recommended.
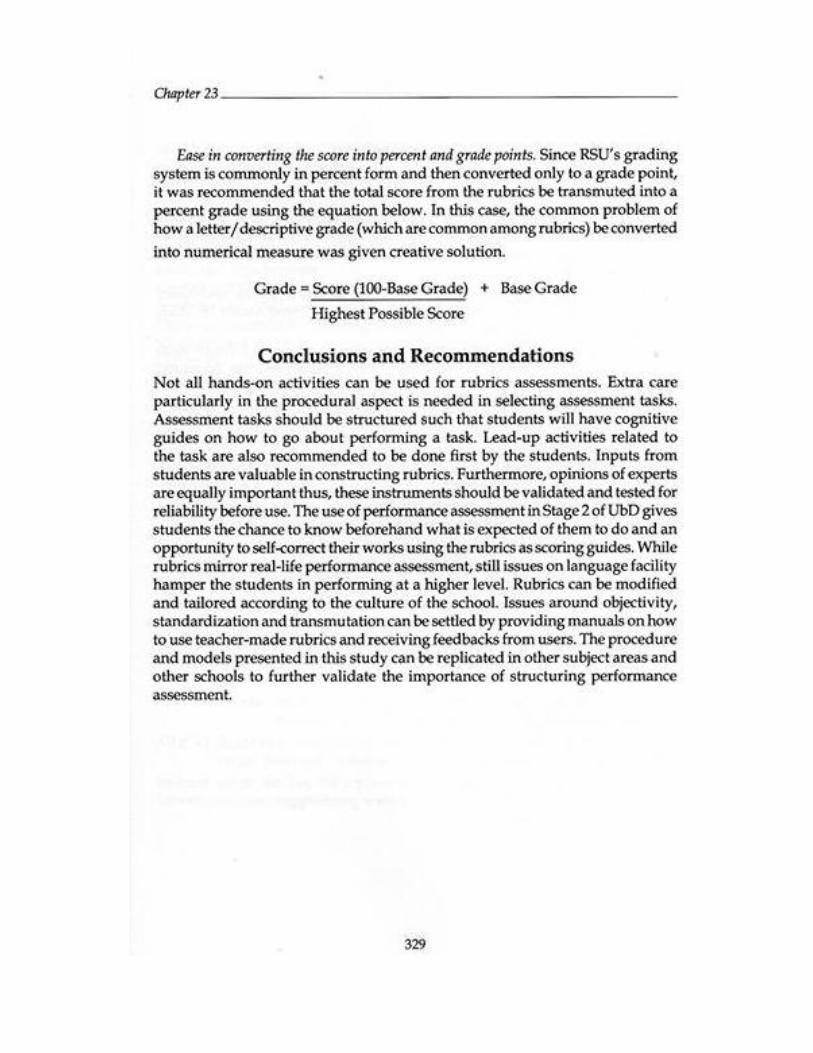
Ease in converting the score into percent and grade points. Since RSU‟s grading
system is commonly in percent form and then converted only to a grade point, it was
recommended that the total score from the rubrics be transmuted into a percent grade using
the equation below. In this case, the common problem of how a letter/descriptive grade
(which are common among rubrics) be converted into numerical measure was given creative
solution.
Grade = Score (100-Base Grade) + Base Grade
Highest Possible Score
Conclusions and Recommendations
Not all hands-on activities can be used for rubrics assessments. Extra care particularly
in the procedural aspect is needed in selecting assessment tasks. Assessment tasks should be
structured such that students will have cognitive guides on how to go about performing a
task. Lead-up activities related to the task are also recommended to be done first by the
students. Inputs from students are valuable in constructing rubrics. Furthermore, opinions of
experts are equally important thus, these instruments should be validated and tested for
reliability before use. The use of performance assessment in Stage 2 of UbD gives students
the chance to know beforehand what is expected of them to do and an opportunity to self-
correct their works using the rubrics as scoring guides. While rubrics mirror real-life
performance assessment, still issues on language facility hamper the students in performing at
a higher level. Rubrics can be modified and tailored according to the culture of the school.
Issues around objectivity, standardization and transmutation can be settled by providing
manuals on how to use teacher-made rubrics and receiving feedbacks from users. The
procedure and models presented in this study can be replicated in other subject areas and
other schools to further validate the importance of structuring performance assessment.
ACCEPTABLE BEST POOR

S300611EGF
10
References
Andrade, H.G. (1997). Understanding rubrics. Educational Leadership, 54(4)
Brookhart, S.M. (1999). The art and science of classroom assessment: The missing part of
pedagogy. ASHE-ERIC Higher Education Report (Vol. 27, No. 1). Washington, DC:
The George Washington University, Graduate School of Education and Human
Development.
Brualdi, A. (2000). Implementing perfromance assessment in the classroom. Practical
Assessment, Research & Evaluation, 6 (2). Retrieved March 18, 2003 from
http://ericae.net/pare/getvn.asp?v=6&n=2
George, D., Mallery P. (2000). SPSS for windows step by step: A simple guide and reference
9.0 update. Massachusetts: Allyn & Bacon Pearson Education Company.
Kilic, G. B. (2003). Application of self and peer assessment in an elementary science
teaching methods course. Retrieved October 20, 2004 from
http://www.upd.edu.ph/~ismed/
Moskal, B.M. (2000). Scoring rubrics: What, when and how? ERIC CSMEE Digest.
Retrieved March 20, 2003 from http://ericae.net/pare/getvn.asp?v=7&n=3
Moskal, B.M. (2000). Scoring Rubrics Part II: How? ERIC CSMEE Digest
Retrieved October 15, 2004 from http://ericae.net/pare/getvn.asp?v=7&m=1
Patchogue-Medford UbD Curriculum Group. Understanding by Design.
Religioso, T.F. (2002). Performance assessment: A St. Scholastica‟s Experience. Sangguni,
13 (1&2), 256-268
Wangsatorntanakhun, J.A. (1997). Designing performance assessments: Challenges for the
three-story intellect. Retrieved March 15, 2003 from
http://www.geocities.com/Athens/Parthenon/8658
Wiggins, G. and McTighe, J. (2003). Overview of UbD and The Design Template.
Wiggins, G. and McTighe, J. (2002). The Big Ideas of UbD.
Wiggins, G. and McTighe, J. (1999). Understanding by Design. Alexandria, VA: Association
for Supervision and Curriculum Development.
Wiggins, G. and McTighe, J. What is Backward Design?
________________. (____). Performance assessment. Retrieved March 15, 2003 from
http://www.exit109.com/~learn/perfases.htm
Authors:
Eddie G. Fetalvero, Director for Research and Publication, Romblon State University,
Philippines;
email: [email protected]
Gayl O’ Connor, Curriculum and Assessment Advisor, Education Services Australia Ltd.,
Melbourne, Australia;
e-mail: [email protected]
Dr. Virgil D. Duad, Faculty of Science Education, Philippine Normal University;
e-mail: [email protected]
Copyright © 2022 FDOKUMEN