Structuring Knowledge - CORE
340
Structuring Knowledge The development and evaluation of tools to support learning William Ross Reader Submitted for the degree of Doctor of Philosophy University of York Department of Psychology September 1994
-
Upload
khangminh22 -
Category
Documents
-
view
0 -
download
0
Transcript of Structuring Knowledge - CORE

StructuringKnowledge
The development andevaluation of tools to support
learning
William Ross Reader
Submitted for the degree
of
Doctor of Philosophy
University of York
Department of Psychology
September 1994

ABSTRACT
The use of computer-based knowledge mapping and knowledge structuring tools in
education is something that has recently excited much interest. The approach is not new,
many of the techniques described here date back to the 1960s and 1970s (and perhaps
earlier), although then maps were drawn on paper. Use of computer-based knowledge
mapping tools provides us with the possibility of harnessing the power of the computer to
produce more engaging and interactive software. This thesis examines some of the issues
involved in developing and using these tools. It was found that the free-form knowledge
mapping software, although useful, may provide learners with too much freedom and not
enough support. Following on from this observation an attempt was made to develop
and evaluate tools that required learners to build more structured representations.
Although more research needs to be conducted, the results of the evaluative studies were
encouraging, suggesting that constrained knowledge structuring tools may provide a
useful method for aiding the process of learning.
1

CONTENTS
Abstract ............................................................................................. i
Contents ............................................................................................ iiFigures.............................................................................................. viii
Tables............................................................................................... xi
Declaration.......................................................................................... xiii
Acknowledgements................................................................................ xiv
Dedication.......................................................................................... xv
Prefaceand overview ............................................................................. xvi
Chapter 1: The process of learning 1
1.1 Introduction 11.2 The goals of learning 1
1.2.1 Learning as progression towards expertise 61.2.2 Legitimate peripheral participation 71.2.3 Summary 8
1.3 Acquiring knowledge 81.3.1 Knowledge structures and learning 91.3.2 Accretion 101.3.3 Restructuring and conceptual change 131.3.4 The tuning of conceptual structure 15
1.3.4.1 Schemata and procedural and declarativeknowledge 181.3.4.2 Discrete or progressive learning? 18
1.3.5 Summary 201.4 Self-reflective learning: monitoring and repair 21
1.4.1 Summary 221.5 Can effective monitoring and reflective skills be taught? 231.6 Conclusions 24
Chapter 2: Computer-assisted learning 27
2.1 Introduction 272.2 Programmed learning 282.3 Microworlds 292.4 Intelligent tutoring 312.5 Hypertext 32
2.5.1 Application areas of hypertext 322.5.2 Hypertext for learning 332.5.3 Problems with hypertext 35
2.5.3.1 Getting lost 352.5.3.2 The implications of disorientation for learning 372.5.3.3 Comprehension failure 372.5.3.4 Problems with access 382.5.3.5 Inefficient learning strategies 39
2.5.4 Summary 402.5.5 Supporting learning from hypertext 40
2.5.5.1 Quizzes and questions 41
ii

2.5.5.2 Hypertext and artificial intelligence 412.5.5.3 User-created hypertexts 42
2.6 Discussion 43
Chapter 3: Learning through knowledge mapping 44
3.1 Introduction 443.2 Ausubel's influence on concept mapping 453.3 Cognitive accounts of knowledge mapping 483.4 An analysis of claims for knowledge mapping 49
3.4.1 Knowledge mapping improves retention 493.4.2 Knowledge mapping fosters understanding 50
3.4.2.1 Visualisation 513.4.2.2 Supporting relational thinking 523.4.2.3 Supporting communication 53
3.4.3 Other factors 543.4.4 When concept mapping may not be effective 553.4.5 Evidence for the effectiveness of knowledge mapping 56
3.5 Computer-based knowledge mapping tools 563.5.1 SemNet 573.5.2 Learning Tool — an "Ideas Processor" 593.5.3 KNOT - 613.5.4 TextVision 3D 623.5.5 Theories embodied in the tools 643.5.6 Discussion 67
3.6 Conclusions 69
Chapter 4: Learning and access strategies in hypertext 70
4.1 Introduction 704.2 The hypertext system 71
4.2.1 Access tools 714.2.2 Navigation facilities 724.2.3 The knowledge mapping tool 73
4.3 Method 744.3.1 Design 744.3.2 Experimental procedure 75
4.3.2.1 Practice session 754.3.2.2 Experimental session 76
4.3.3 Subjects 774.3.4 Measurements 77
4.3.4.1 Screen recordings 774.3.4.2 Verbal protocols 774.3.4.3 Video recording 78
4.4 Results 784.4.1 Access of material screens 784.4.2 Differences among pairs 784.4.3 Scores on the test 834.4.4 Strategies for the interaction: a first pass 834.4.5 The processes involved in the interaction 84
4.4.5.1 The process of categorisation 844.4.5.2 The comprehension level 854.4.5.3 The regulatory level 864.4.5.4 The interaction level 884.4.5.5 General comments 894.4.5.6 Summary of categories 89
ifi

4.4.6 Use of the knowledge mapping tool 914.5 Discussion and implications for further research 93
4.5.1 Why was there an absence of goal-directedness? 934.5.2 Effective learning and effective knowledge mapping 94
Chapter 5: Developing and evaluating tools to supportlearning and access 95
5.1 Strategies for more effective learning and search 955.1.1 The problem of goal-directedness 955.1.2 Supporting goal-directed access 96
5.2 Evaluating the effectiveness of knowledge mapping andquestioning strategy 97
5.2.1 Method 985.2.1.1 Design 985.2.1.2 Procedure 985.2.1.3 Materials 995.2.1.4 Subjects 100
5.2.2 Results 1005.2.2.1 Testing for increased learning 1005.2.2.2 Discussion 1025.3.2.3 Testing for more goal-directed access 1035.3.2.4 Discussion 1045.3.2.5 What is the source of the effect on learning? 105
5.2.3 Summary of quantitative results 1095.2.4 Qualitative results 110
5.2.4.1 Investigating the process of knowledge mapconstruction 1105.2.4.2 The relationships between organising andstructuring 1125.2.4.3 Accounting for these results 113
5.3 Conclusions 114
Chapter 6: Evaluation of paper-based maps 116
6.1 Introduction and motivation for study 3 1166.1.1 Subjects 1176.1.2 Instructions 1176.1.3 The task 117
6.2 Analyses of knowledge maps 1196.2.1 Analysis of macro-structure 119
6.2.1.1 Structural hierarchies 1196.2.1.2 Representations based on information flow 1206.2.1.3 Process versus structure distinction 1206.2.1.4 Network maps 120
6.2.2 Summary of macrostructure 1246.2.3 Achievement of task goals 124
6.2.3.1 Representing structure 1246.2.3.2 Representing processes 1256.2.3.3 Representing argument 125
6.2.4 Synthesis 1266.2.4.1 Misconceptions and mis-misconceptions 126
6.2.5 The students' perspective 1276.2.6 Relationships to the maps produced in Study 2 127
6.2.6.1 Differences 1276.2.6.2 Similarities 128
iv

6.3 Discussion 129
Chapter 7: Knowledge structuring tools 1317.1 Introduction 1317.2 Representing argument 1317.3 Notations and tools for representing argument 132
7.3.1 Green's cognitive dimensions 1337.3.2 Toulmin argument structures 1357.3.3 IBIS, gIBIS and PHI 1387.3.4 ARL and Euclid 1397.3.5 QOC 141
7.4 Summary 1427.5 Hybrid Systems 143
7.5.1 Writing Environment (WE) 1437.5.2 Author's Argumentation Assistant (AAA) 1447.5.3 Summary 145
7.6 Relationships with knowledge mapping 146
Chapter 8: Using structured maps 147
8.1 Introduction 1478.1.1 Subjects 1478.1.2 Instructions 1478.1.3 The task 148
8.2 Analyses of maps 1488.2.1 Overview 1488.2.2 Some observed problems 149
8.2.2.1 When hypotheses are not hypotheses 1508.2.2.2 Problems specifying evidence 1558.2.2.3 Lack of structure revisited 155
8.3 Summary 156
Chapter 9: The design of a knowledge structuring tool 160
9.1 Introduction 1609.2 The notation used for AKA 1609.3 Using AKA 164
9.3.1 The user interface 1649.3.2 Nodes and links 1659.3.3 Creating objects 1659.3.4 Moving objects 1669.3.5 Deleting objects 1679.3.6 Linking objects 1679.3.7 More about arrows 1699.3.8 Changing the name and type of nodes and links 1699.3.9 Text fields 1709.3.10 Changing the strength of links 1719.3.11 Balloon help 1729.3.12 "Why not?" help . 1739.3.13 Flashing direction 1749.3.14 Listing nodes 174
9.3.14.1 Listing by order 1759.3.14.2 Listing by type 175
9.3.15 Aliases 1759.3.16 Refreshing the screen 177
v

9.4 Summary
Chapter 10: Two case studies
10.1 Introduction . .................................. 17910.2 Method ... ................................... 180
10.2.1 Subjects 18010.2.2 Materials 18010.2.3 Procedure 181
10.3 Case study 1: health economics ............ , 18110.3.1 Use of the tools 18210 .3.2 Description of the interaction ..... 18210.3.3 Using the constrained tool ....... .. 18910.3.4 Summary 192
10.4 Case study 2: structuralism 19210 .4.1 Use of the two tools 19210.4.2 Use of the unconstrained tool 19210 .4.3 Use of the constrained tool 196
10.5 Summary 20110.5.1 Usability issues 20110 .5.2 Problems with the model 20110.5.3 Conceptual issues: using the tools 202
10.6 Factors affecting the structure of knowledge maps 20310.6.1 Framing effects 20410.6.2 Viscosity 20410.6.3 Premature commitment to structure 20410.6.4 Unconsidered relations 20510.6.5 Domain knowledge 20510.6.6 Reasoning and argument skills 206
10.7 Summary 206
Chapter 11: A comparison of structured andunstructured tools 206
11.1 Introduction 20611.1.1 Formalisation and premature commitment revisited 20611.1.2 Is learning different? 207
11.1.2.1 No premature commitment, no commitment 20911.1,2.2 Fluidity: escape from the problems of earlycommitment? 209
11.1.3 Summary 21111.2 Method 211
11.2.1 The task 21111.2.2 Design 21311 .2.3 Procedure 21311 .2.4 Subjects 21511.2.5 Potential outcomes 215
11 .3 Results .................... 21611.3.1 Initial comparisons 216
11.3.1.1 Number of nodes 21611.3.1.2 Node types 21811.3.1.3 Link types 21811.3.1.4 Summary 220
11.3.2 Scoring the maps 22011.3.2.1 Ratings 22211.3.2.2 Efficiency 222
177
vi

11.3.2.3 Proposition agreement 22411.3.2.4 Summary 225
11.3.3 Descriptions of the maps 22511.3.3.1 Constrained tool subjects 22511.3.3.2 Unconstrained tool subjects 228
11.3.4 Scores on the summaries 22911.3.4.1 Pre-test 22911.3.4.2 Post-test 230
11.3.5 Revisions 23011.4 General discussion 231
Chapter 12: Summary and conclusions 234
12.1 Introduction 23412.2 Factors influencing knowledge mapping 23512.3 Future developments 237
12.3.1 Better developed passive systems 23712.3.2 Active systems 239
12.4 Some questions for future research 241
References 243
Appendix 1: instructions for study I 257
Session 1: familiarisation with operations. 257The concept mapping tool 261Session 1 - Parts 2 & 3 265Session 2 266Questions 268
Appendix 2: instructions for study 2 269
Using Q-Tool 272Practice session 276Questions for session 2 277Knowledge maps 280
Appendix 3: instructions and marking schemes for finalstudy 288
Instructions for using AKA 288Instructions for using K-Tool 295The goals of the task 303Hints Sheet 304Rating sheet 305Marking scheme for maps 306Knowledge maps 309
vii

Figure 3.1
Figure 3.2
Figure 3.3
Figure 3.4
Figure 3.5
Figure 3.6
Figure 4.1
FIGURES
Figure 1.1 Part of a possible categorisation scheme for ontological categories,adapted from Chi (1993) 11
Figure 1.2 One of the problems that McCloskey gave subjects to solve. Doesthe ball thrown into the tube follow trajectory A or B after leavingit? 12
Figure 1.3 Thagard's types of conceptual change (adapted from Thagard,w1992) 14
Figure 1.4 Schematic of the ACT architecture 17
Novak-Gowin style concept map showing hierarchical structure,hatched cross-links and dotted instance ellipses 47
An example of a SemNet network relating to the "Twin Peaks"television series. 58
Learning tool concept map and masterlist windows 60
An example Knot network based on approaches to educationalcomputing 61
An example screen from TextVision 3D, showing indegreesimilarity. 63
Comparisons of Knot Networks showing expert (left) andintermediate (right) understanding of statistical tests. 68
Table of contents screen from the 'CaHanish' system, note thehighlighted potion on the 'Topics' window indicating the topicselected, also note the italicised text indicating that thecorresponding screen has been visited.
Figure 4.2 An example screen from the 'CaHanish' system
Figure 4.3 The knowledge mapping tool used in this experiment
Figure 4.4 Mean number of screens accessed by each facility
Figure 4.5 Facilities for access of material
Figure 5.1 An example of the augmented knowledge mapping tool showing aquestions, subquestions, concept nodes and answer nodes 96
Figure 5.2 A flow chart of the ideal strategy 97
Figure 5.3 Interaction between question type and condition. 101
Figure 5.4 A typical map from the augmented tool condition. 105
Figure 5.5 Map showing failure to link, spatial clustering and superordinatelink organisation. 111
72
73
74
79
79
viii

Figure 5.6 Map showing arbitrary link names being used to organiseinformation 111
Figure 5.7 Map showing a large number of structural relationships 112
Figure 6.1 A hierarchical map 121
Figure 6.2 map based on information flow 122
Figure 6.3 a map dichotomising process and structure 123
Figure 7.1 An example of Toulmin's argument structure 136
Figure 7.2 Basic syntax of IBIS (adapted from Lee & Lai 1991) 138
Figure 7.3 Comparison of the five notations discussed 142
Figure 8.1 Map showing hypotheses that are really claims 151
Figure 8.2 A map showing testable hypotheses 152
Figure 8.3 Map showing an intervening hypothesis between a claim andevidence (text starting "Concrete words recalled...") 154
Figure 8.4 In this map, the sentence starting "It's very difficult to determine..."is labelled 'evidence' (coloured boxes were used to indicate this) butis more of a critique 157
Figure 8.5 Example of inexplicit evidence-hypothesis linking 158
Figure 9.1 The tools palette. 164
Figure 9.2 The main components of the network. 165
Figure 9.3 Choosing the object type from the pop-up menu. 166
Figure 9.4 A dialog box warning about deletion 167
Figure 9.5 Linking nodes by dragging between them whilst in link mode, notethat the line with the arrow follows the mouse-pointer as it ismoved. 168
Figure 9.6 The dialog box presented when two nodes cannot be linkedtogether 168
Figure 9.7 Scrolling dialog containing the permitted link names 169
Figure 9.8 The 'change type' and 'rename node' options 170
Figure 9.9 Changing the strength of a link 171
Figure 9.10 Balloon help for the "delete node" button 172
Figure 9.11 Balloon help for linking 173
Figure 9.12 "Why not?" help window selected after the user attempted to linkto evidence nodes 174
ix

Figure 9.13 Listing the nodes by order of construction 176
Figure 9.14 Listing the nodes by type 176
Figure 9.15 Dialog box presented when attempting to delete an alias 177
Figure 9.16 Dialog box presented when attempting to delete a node that has analias associated with it. 178
Figure 10.1 Notes created for the node 'Class differences in health" 183
Figure 10.2 Skeletal notes in explanation note-field 184
Figure 10.3 An evidence and critique node, note that the information in theevidence node is more of a critique than evidence. 185
Figure 10.4 The skeletal outline is expanded, note that the assertion'Downward drift' contains both expository information andinformation that criticises this position 185
Figure 10.5 Explanation nodes are linked to the central 'note' node 'Commonsense' 187
Figure 10.6 The network with some of the note-fields visible. 188
Figure 10.7 The finished map created using the constrained tool 191
Figure 10.8 The network constructed using the unconstrained tool almostcomplete 194
Figure 11.1 Cumulative agreement scores 225
Figure 12.1 Mock up of tutor interface 241
x

TABLES
Table 3.1 A comparison of the essential features of the tools 65
Table 4.1 Overview or experimental procedure 75
Table 4.2 Access of material summarised 80
Table 4.3 The verbal protocols categorized 85
Table 4.4 Percentage number of relevant and irrelevant screens accessed 90
Table 4.5 Total number of occurrences of each category in the regulatory levelfor all pairs 91
Table 5.1 Instructions for augmented knowledge mapping tool condition 99
Table 5.10 Correlations for knowledge mapping tool condition 107
Table 5.11 Correlations for augmented knowledge mapping tool condition 107
Table 5.2 Instructions for knowledge mapping condition. 99
Table 5.3 Instructions for notes condition 99
Table 5.4 Mean percentage scores for each of the conditions 100
Table 5.5 Percentage of time spent on each of the facilities 101
Table 5.6 Times spent of irrelevant/relevant screens 103
Table 5.7 Mean numbers of screens accessed per condition 103
Table 5.8 Correlation matrix of principal variables for all three conditions 106
Table 5.9 Correlations for note tool condition 107
Table 6.1 Printed instructions given to students 117
Table 6.2 Number of students showing each type of macrostructure 119
Table 8.1 The task description as presented to the students 148
Table 9.1 List of nodes and permitted relationships. 163
Table 11.1 Instructions given to all subjects 213
Table 11.2 Hint sheet given to all subjects 214
Table 11.20 Mean percent scores for post-test summaries 230
Table 11.21 Mean number of revisions per condition 230
Table 11.22 Activities for both conditions that occurred in the first and secondhalves of the interaction, revision activities in bold text 231
xi
Table 11.3 Instructions for writing summaries 214
Table 11.4 Comparison of number of nodes per condition 216
Table 11.5 Comparison of number of words per condition 217
Table 11.6 Mean number of words per node 217
Table 11.7 Number of propositions in the text per condition 217
Table 11.8 Total number of system and user defined node types per condition 218
Table 11.9 Link types for both conditions 218
Table 11.10 Categories for link types 219
Table 11.11 Mean percent scores for maps 221
Table 11.12 Mean number of propositions expressed in the map 221
Table 11.13 Rated scores for completeness. 222
Table 11.14 Rated scores for communicability 222
Table 11.15 The mean number of all propositions for both conditions. 222
Table 11.16 Mean efficiency index per condition 223
Table 11.17 Efficiency index taking scores on maps into consideration. 223
Table 11.18 Agreement scores for propositions 224
Table 11.19 Mean percent scores for the post-test. 230
xii

Declaration
Work for this thesis has resulted in the following publications:
Trapp, A, Reader, W.R, Hammond, N.V. (1992). Tools for Knowledge Mapping: AFramework for Understanding. in Proceedings of the East-West Conference onEmerging Computer Technologies in Education, International Centre for Scientificand Technical Information, Moscow, Russia.
Reader, W.R. & Hammond, N.V. (1993). Computer-based tools to support learning inhypertext: concept mapping tools and beyond. Computers and Education., 22,1/2, 99-106.
Reader, W.R. & Hammond, N.V. (1993). Supporting search and learning in hypertextusing computer-based tools. Psychology Teaching Review 2, 89-95.
McKendree, J.E. & Reader, W.R. (1994). The homeopathic fallacy in hypertext:misocnceptions of psychology in the design of computer courseware. ALTNews. April, 1994.

ACKNOWLEDGEMENTS
First of all thanks must go to my supervisor Nick Hammond for all the help he has givenme during my time at York, he gave me just the right mixture of freedom and constraint toenable me to get this thing done. I would also like to thank Jean McKendre,e fordiscussing many of the ideas contained in this thesis with me, forcing me to sharpen themup and pointing me down new and intresting avenues of thought.
Various friends should also deserve a mention, not just for the oft expressed reason of'providing a life outside the PhD', but also for providing ideas that are included in thisthesis. Thanks to Mike, Richard, Charles, Alison, Martin and Keith.
Special thanks must go to Catriona for her love and her ability to truly understand.
Finally I must thank my parents for everything that they have given. This thesis isdedicated to them both.
xiv

To my parents
XV

PREFACE AND OVERVIEW
Not every end is a goal. The end of a melody is not its goal; but nonetheless, ifthe melody had not reached its end it would not have reached its goal either. Aparable.
F.W.Nietzsche, The Wanderer and his shadow (1880).
This thesis is primarily concerned with an approach to learning known as directed
reflection, and a means of achieving this through knowledge mapping and knowledge
structuring activities. Knowledge mapping (and knowledge structuring) is a deceptively
simple technique for supporting the process of learning, it simply requires the creation of
some form of network-based graphical representation of one's knowledge, or some set of
learning materials with which one is engaging. The motivation for this is based on a
number of assumptions regarding teaching and learning.
The first assumption is that many of the concepts and methods of academic subjects are
unnatural in that they are not merely extensions of things that we might have learned
through experience. The second assumption is that academic concepts are complex,
requiring the learner to assimilate a large amount information. Even apparently simple
constructs such as basic atomic structure require much prerequsite knowledge in order to
understand them. An in-depth understanding of a construct such as schizophrenia
requires the learner to assimilate a huge amount of information relating to symptoms,
aetiology, diagonostic criteria, evidence supporting or contradicting various
interpretations, models of the disorder and so on. The third assumption is that many of
the criteria necessary for understanding these concepts are not taught explicitly. To go
back to the schizophrenia example, much of what is taught on schizophrenia requires
learners to know what makes a suitable theory of the disorder; how well this theory
accounts for what is' known about the disorder; what new evidence would be explained
by the theory and what evidence would contradict it and so forth.
The experimental chapters of this thesis, reported here in chronological order, can be seen
as representative of a journey culminating not in answers but questions. Every study
threw up new issues only a handful of which could be pursued in any rigorous way in
subsequent studies.
The key attributes of knowledge mapping are focus, externalisation, visualisation and
communication. Focus because the idea is that it directs the learners attention on certain
attributes of the materials that one is learning about, primarily these involve the
relationships between concepts. There can be many different types of relationship:
xvi

hierarchical, causal, argumentative and problem-solution to name just four; one of the
strengths of knowledge mapping is that it encourages learners to think (and think hard)
about relationships that they may not otherwise have considered. Externalisation is the
second important attribute. A number of methods serve to focus learners' attention on
specific sorts of relationships (tutorials for example); knowledge mapping is different
because it holds a record of the relationships that one has previously thought about in
portions of the network created earlier. Because information is kept in the network in this
form, one is constantly reminded of the results of previous actions, which is likely to
have an impact on what one is thinking about at any other point. As we shall see, this
often causes problems of consistency. Flowing from the idea of externalisation is
visualisation: the map enables things like arguments, hierarchies and so on to be
represented in a easy to read manner, something that can facilitate the process of thinking.
Communication is the final attribute; learning does not occur in a vacuum (nor should it)
we learn as much, if not more, as a result of discussing, chatting and arguing with others
as we do sitting alone pouring over a book. Knowledge mapping with its emphasis on
focus, externalisation and so forth, can aid certain forms of communication.
Missing from the attributes, but of no less importance in terms of its impact on learning is
feedback. Feedback occurs naturally as a result of the other attributes, in some ways the
map can be said to 'speak back' to the learner. But only so much. Knowledge mapping
and knowledge structuring can only go so far in helping the learner, there is no substitute
for incisive comment and even friendly criticism. It is on the question of how to provide
effective feedback to learners that this thesis ends, indicating *le importance and diiCleul‘y
of this particular phenomenon.
As I stated above this summary represents the culmination rather than the starting point of
the research reported in these pages, the journey to this point is summarised below.
The first study (Chapter 4) reports a simple observational study that attempts to
investigate the important factors involved in learning from hypertext. It was found that
people tend to browse hypertext in a rather undirected fashion something that is consistent
with a number of studies (see Chapter 2). This chapter concludes by asking whether
there could be ways that encourage learners to be more goal-directed without losing the
self-directed nature of hypertext. As well as a hypertext system subjects in Study 1 also
used a simple knowledge mapping tool, another question that seemed to be of interest
was what effect using a knowledge mapping tool would have on learning when compared
to standard note tools such as those that have been incorporated into a number of
hypertext systems.
xvii

Given these two questions relating to goal-directedness and learning Study 2 was
conducted. This investigated methods to encourage active engagement in learning
materials and goal-directedness. There were three conditions: knowledge mapping
condition, note-tool condition, and a condition that used an augmented knowledge
mapping tool that required learners to specify their goals as questions to encourage goal
directedness. Study 2 suggested that whilst both the knowledge mapping tools seemed to
have equally beneficial effects on learning when compared to the note tool, there was no
measurable effect of the augmented tool on goal-directedness. This study also suggested
that learners may need more support in creating knowledge maps that are educationally
effective and communicable. Study 3 came to a similar conclusion, this was rather
different to the previous two studies in that it was based not in the laboratory using
experimental subjects, but used real students on a psychology course. It was found that
although students were quite able to create interesting maps, they may need more support
in directing their attention towards different sorts of relationships in the text-books that
they read.
The finding of Studies 2 and 3 led to the notion of constrained knowledge mapping tools,
something that I term knowledge structuring tools. These tools require learners to
construct maps in accordance with some form of notation (something that is discussed in
Chapter 7). A simple constrained notation was used in Study 4 which used three
elements: theory, hypothesis and evidence; and three relationships: predicts (theories
predict hypotheses), supports and contradicts (evidence can either support or contradict a
hypothesis). This notation was designed to capture the argumentative nature of many
psychology texts. The results of Study 4 (conducted in the same manner and on the same
students as Study 3) suggested that although promising, the notation used would need to
be expanded if it is to capture the subtleties of even the most plainly written psychological
argument. Chapter 9, therefore, attempts to take the findings of the Study 4 into account
and develop a suitable notation and the development of a computer-based tool that
embodies this notation.
Chapter 10 looks at two longish studies where the new constrained tool is used together
with an unconstrained knowledge mapping tool by two students (one undergraduate, one
graduate) tO help them during the initial stages of essay writing. This study, in addition
to suggesting further modification to both notation and tool, pointed out some of the
different effects that constrained and unconstrained tools may have. It appeared that
although unconstrained tools are fine for brainstorming, it was the constrained tool that
seemed to really force the students to reflect on their ideas, and get them thinking. There
were also some negative aspects of the constrained tools that were used: due to the way
that they are created students are always building upon earlier ideas, new insights might
xviii
make these redundant which makes it difficult to fit the new conception in with the old
portions of the network. There are (at least) two alternative perspectives that can be taken
on this fact; the first is that since a learner's initial ideas will change in some way over
time, one should not require them to impose any formality on their ideas until their ideas
have achieved some degree of stability. The second perspective argues that it is the
process of formalising that it partly responsible for learners seeing that their earlier
conception was lacking in some way, and because of this it is important that they
formalise their ideas early on to help them to see this. Furthermore, many of the
researchers who suggest that what is called premature commitment to structure is bad,
also suggest that formality is bad in itself (see, Shipman and Marshall, 1993).
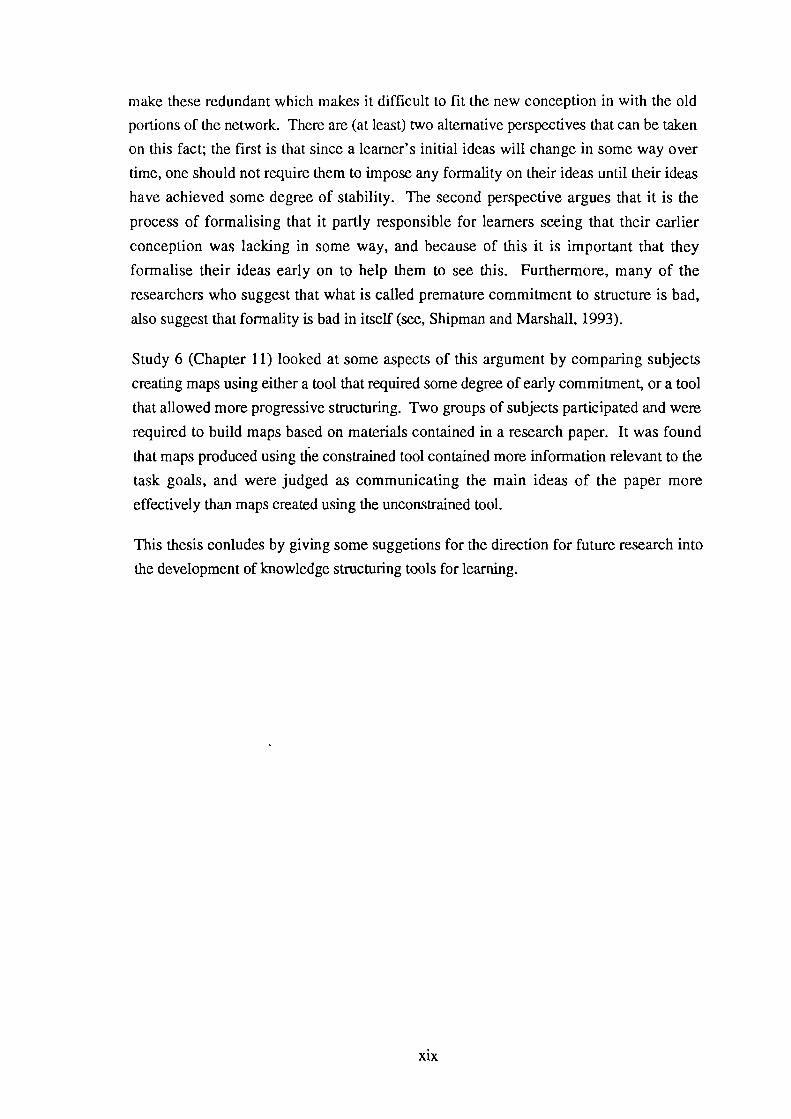
Study 6 (Chapter 11) looked at some aspects of this argument by comparing subjects
creating maps using either a tool that required some degree of early commitment, or a tool
that allowed more progressive structuring. Two groups of subjects participated and were
required to build maps based on materials contained in a research paper. It was found
that maps produced using the constrained tool contained more information relevant to the
task goals, and were judged as communicating the main ideas of the paper more
effectively than maps created using the unconstrained tool.
This thesis conludes by giving some suggetions for the direction for future research into
the development of knowledge structuring tools for learning.
xix

1
The process of learning
1.1 INTRODUCTION
The ability to learn complex behaviours is essential to our survival both as individuals and
as a species. Learning is an adaptive function that allows an organism to survive in a
changing environment, it operates over the lifespan of the organism unlike other adaptive
processes such as problem solving which offer short-term adaptation; and biological
adaptation which occurs over generations (Langley and Simon, 1981). Langley and
Simon define learning as:
"...any process that modifies a system so as to improve, more or lessirreversibly, its subsequent performance of the same task or tasks drawn from thesame population."
This view of learning as a natural process has led to something of a paradox: if learning is
natural, why do we need to spend so much time training teachers; why is so much effort
and money invested in educational research; why is the development of effective
educational software often so difficult and, perhaps most tellingly, why have we all had
occasion to feel that what we are doing is anything but natural? Some have argued that
the unnatural nature of most learning is a result of the unnatural nature of the educational
system (Papert, 1980, 1987; Gardner, 1994), whilst others argue that it is due to the
difficulty of the things that needs to be learned in academic settings (Chi, 1993;
Laurillard, 1993). This chapter is an attempt to investigate these and other issues, with
the goal of trying to specify some of the factors that influence the ability of people to learn
effectively, and then to suggest some ways that we might support the process of learning
using educational technology.
1.2 THE GOALS OF LEARNING
If the goal of learning is to adapt to the environment, it begs the question: which
environment? There is not a single unitary environment that we all inhabit, rather
1

The process of learning
different people need to respond to very different demands. The environment of the
concert pianist has different demands to that of a software designer; a mathematician
different from a newscaster. Each environment requires a different range of skills, and
places different values on these skills. The goal of learning is defined by these demands
and as such there is no monolithic solution to the learning problem. In many learning
situations goals can be described on a number of levels. A student working on an essay
may have the goal of trying to get a good grade, however the essay may also be given to
ensure that the student reads material relevant to the course that they are on, or it may be
to develop communication skills. In both these cases the purpose of the essay can be
seen as a step on the way to the achievement of longer-term goals such as being able to
write effective essays in order to pass the exam. Note that it is not necessary for the
student to be aware of the learning goals in order to learn effectively so long as the
environment is suitably structured. We do not need to know that we are learning
language to learn it, but on some occasions it can help. Given a poorly structured task it
often helps the learner to know what they are supposed to learn from it.
For many, particularly non-vocational, courses this could be seen as the final goal.
However, beyond this is some form of life outside the institution where they may be
required to use their knowledge as part of a job, or during their social life. Greeno
(1991) takes this point up:
"We would like students to be able to participate in conversations that areinformed by concepts. We would like students to benefit from understandingconcepts in the work they do or in other organisations, including analytic projectsand plans for proposed group activities. We would like students who understanda concept to be able to explain it to other people, and we would like students'understanding of concepts to support their further learning, includingunderstanding of information that the concepts help make meaningful and learningof other concepts that are related to those that were learned earlier." (Greeno,1991, P. 211)
Any approach to learning and education should try and identify the types of skills that the
student will need in the world at large. Of course it may not be profitaLle to examine the
minutiae of course content and fret over what skills it is endowing the student with, but it
should fit into some overarching educational framework to some degree.
Consistent with this approach is the theoretical stance that learning is situated. In its
crudest terms this argues that what we learn is a response to a specific set of
environmental constraints, and as such its transferability is limited to situations similar to
those under which learning took place. Such a view contrasts strongly with the 'faculty'
view of learning, popular in the last century (Anderson, 1990a) which stated the mind
consisted of different faculties that could be exercised by providing practice on abstract
2

The process of learning
problems. Hence, logic and Latin were thought to strengthen the mind enabling it to
perform better on a wide variety of tasks.
The situatedness of learning has been worked on by, among others, Jean Lave (1988;
Lave & Wenger, 1991). Lave and Wenger see the ultimate goal of learning as being to
enable the learner to become a participant in a community of practice, the guiding
principle being legitimate peripheral participation (see Section 1.2.2). Lave argues that
standard educational practice with its emphasis on learning in the abstract does not
achieve these goals and as a result learners are often poorly equipped to participate in
whichever community of practice they choose. At a simplistic level Lave (1990) reports a
study of the way that people perform arithmetical calculations in everyday life, for
example in assessing which food is the best value when it varies in both price and weight.
She found that individuals often use heuristics solutions rather than the correct
mathematical procedure, suggesting that what had been learned in the classroom was not
being applied to real world problems. This set of issues is not new, Vera and Simon
(1993) point out that the above effect used to be cast in terms of problems relating to the
transfer of learning where individuals fail to apply knowledge learned in different
contexts and under different task demands. Evidence of this from a cognitive perspective
comes from Carraher, Carraher and Schlieman (1985) who observed that Brazilian school
children working as street vendors often fail to solve simple mathematical problems as
presented in school, but can perform relatively complex calculations when working out
prices of food and so on—and this in a country which at the time of the study had three
different currencies. Although the view of learning as being situated is often pitched
against cognitive science (Lave & Wenger, 1991) some cognitive researchers are now
attempting to explain the context dependency of learning within a cognitive framework
(Anderson, 1990b).
Transferability of knowledge and skills is an obvious problem for education. The
modern workplace is not a static entity, new demands are being placed on the individual
all the time and it is no longer the case that skills learned during apprenticeship last the
individual a lifetime l . If skills cannot be transferred then it paints a very depressing
picture for education. However, it seems that all is not quite as gloomy as it may seem:
sometimes skills do seem to be transferable, so long as there is sufficient match between
the old and new skills—which may imply that jobs should be re-designed to try and
1 It could be argued that this was never the case, that people always needed to learn during work.
However, it seems that these demands are even more prevalent nowadays.
3

The process of learning
utilise old skills where possible (Anderson & Singley, 1993; Singley & Anderson,
1989).
As a final caveat, although it is true that educators should have some idea of what skills
the learner should possess, it is also true that learning can occur in the absence of explicit
goals. When a child learns language, it does not have the conscious goal to learn, nor
does anyone with whom the child engages have to have the goal of teaching the child;
learning occurs simply by virtue of the child interacting with other language speakers.
The example of language could be perceived as something of a red herring in this context;
after all a number of people believe that there is some genetic component to the acquisition
of language (Chomsky, 1972; Pinker, 1994). However, there are other examples of
unintentional or incidental learning. Mandler (1967) demonstrated that subjects who were
requested to sort cards with words printed on them into semantic categories were able to
recall as many words later on as subjects who had been told to learn the words, and Hyde
and Jenkins (1969) demonstrated that intention to learn did not effect the ability of
subjects to recall words that they had previously been instructed to rate for pleasantness.
Both these studies (and many others) might be seen as suggestive for the 'natural' status
of learning. Other studies, however, seemingly contradict this view. In the days when
telephone dials had both digits and letters Morton (1967) showed that experienced
telephone users were unable to correctly recall the correspondence of letters to numbers,
even thought they had seen the dial hundreds of times. A more up to date study
conducted by Mayes et al (1988); showed that users of the word processing package
MacWrite were unable to recall the order of the items on the menu-bar, which again had
been used many times. Presumably if the subjects of either of these experiments had
been given the goal before hand of recalling the items in question, then they could have
learned them intentionally. Why is there this paradox, on the one hand intention to learn
makes no difference, whilst on the other hand it makes all the difference? The answer to
this is that certain types of activity afford different types of processing, and one of the
important factors in whether or not something is remembered is the way that it was
processed. The type of processing can either be determined implicitly in the task (as for
the studies by Mandler, and Hyde and Jenkins, but not the Morton and Mayes et al task)
or it can be determined by the learners meta-cognitive skills (see Section 1.4). Hence,
goals can make a difference, in instructional design we need to know what we want
people to learn so that we can decide how best to help them to learn it.
A more complex example of how task can influence the sort of knowledge acquired is
provided by Berry and Broadbent (1984) and Broadbent, Fitzgerald and Broadbent
(1986). Subjects were provided with a simulation of, among other things, an economic
system. The system contained a large number of parameters which the subjects could
4

The process of learning
manipulate to change the behaviour of various output measures. For the purposes of this
discussion there were two key conditions: (1) an informed condition where subjects were
instructed as to the various effects of the parameters on output measures and interactions
between them; and (2) an uninformed condition where subjects were simply given the
system with no description of the effects of the parameters. There were two key
findings. First it was found that when there was a large number of parameters to control
subjects in the uninformed condition could control the system better than those who were
given instructions. Second, although subjects given no information could operate the
system to produce reasonable outcomes, they showed little awareness of what they were
doing and why when interviewed at the end of the study. It therefore seems that
individuals are able to learn implicitly2 in the sense that they have no direct verbalisable
knowledge about what they are doing and that in some circumstances (such as that in the
above experiment) this can lead to a performance advantage. In other situations such
implicit knowledge might be problematic. First, it is likely that learners will acquire rules
that although workable are incorrect or inefficient, being given explicit instructions will
help the student to use the correct (or more effective) rules. Second, it seems likely that if
students have no easily accessible knowledge about the principles underlying the rules
that they are using it may make it even harder for them to generalise to other related tasks,
or to recover themselves when things go wrong. Third, and related to the previous two
points, there is no guarantee that the benefits of implicit learning are very long lived. As
we shall see in Section 1.3.4 having verbal rules can initially lead to slow and error-prone
performance due to the demands that they place on working memory, after practice
performance gets faster and more accurate as rules are proceduralised. The studies by
Broadbent and collegues measure performance at these early stages and it is likely that
subjects in the instruction condition might, given sufficient practice, overtake the subjects
given no instructions. Generally though the best method of teaching will depend on the
goals of the instruction, often we do not need to know the underlying priciples of some
system or piece of apparatus to use it effectively, the level of knowledge needed about
computers will depend on whether one is a casual operator, a 'power user' or an
engineer. Given these goals we can decide what an individual needs to know and tailor
the instruction accordingly.
From the above we have an abstract (and not at all surprising) guiding principle for
learning outcomes: that learning should be directed towards the acquisition of the skills
and knowledge that the student will need to perform in the world, whether they be job
2 There is currently great debate about the status of implicit knowledge. Suffice to say that here I use itsimply in the sense that subjects can learn to do things that they are not able to articulate.
5

The process of learning
skills, life skills or intellectual skills. In order to make these goals usable they need to be
instantiated so they are relevant to the particular discipline in question. Help can be
obtained by looking at people who have the necessary skills and look to them for a
performance model.
1.2.1 Learning as progression towards expertise
One model of learning that is popular in cognitive approaches to learning and education is
obtained by looking at expert performance. Intelligent tutoring systems often work by
having a model of a good student built into them (often referred to, rather inaccurately, as
the expert model). The student's performance is compared to predictions generated by
the 'expert' model, and the students deviation from the model can initiate remediative
procedures. Hence the tutor is able to ensure that the learner stays on the 'optimal
learning trajectory' (Anderson, Boyle, Corbett and Lewis, 1990).
Other approaches which use an expert model outside the realm of intelligent tutoring
include those which have investigated expert problem solving. Sweller and colleagues
have conducted research into the nature of expert problem solving, primarily in the
domain of mathematics. Sweller, Mawer and Ward (1983) showed that expert
mathematicians solve medium complexity problems differently from novices. Experts
typically work forwards, taking the givens of the problem and applying appropriate
equations to effect a result; novices on the other hand work backwards, using a means-
ends analysis technique, working backwards from the goal state and applying equations
that reduce the difference between the goal state and the initial state. Sweller's basic aim
was to try and facilitate the development of more expert-like problem solving strategies in
subjects by providing them with conditions that are optimal for learning to take place.
Sweller argues that mere intensive practice on a task may actively prevent the
development of expert performance. Using weak problem solving techniques, such as
means end analysis, may have the effect of filling up working memory, preventing
learners from seeing more effective strategies. Instead, Sweller argues that learners
should be encouraged to explicate and reflect upon their strategies and understanding.
Cooper and Sweller (1987) demonstrated that problem solving behaviour can be
enhanced if the learner is encouraged to categorise rather than solve a battery of
questions. They argue that solving problems is such a demanding task that often there is
little chance for learners to reflect upon the nature of the problem itself. Categorising
problem descriptions can encourage learners to focus upon the structure of the problem
rather than simply on evoking the correct procedures to solve it.
In general, expert models can be useful in that they provide some ultimate goal for the
learning process. Care must be taken, however, not to overwhelm the learner. Merely
6

The process of learning
observing how an expert performs a task and then trying to emulate him or her may be of
little help to the learner. There are two reasons for this: first, many of the cognitive
operations that the expert will be performing may be hidden from view—in fact models of
skill acquisition (see Section 1.3.4) state that this is a fact of expertise. The learner may
therefore see only the what the expert does rather than how they achieve it. Second, even
if these hidden operations are made explicit it is likely that the learner will find it
impossible to perform them in an appropriate manner. An expert will have spent many
hours practising their chosen field enabling them to perform certain actions automatically.
A student would more than likely find this impossible as they would have to consciously
process most of the components of the task.
The expert model can be used effectively to help to design a learning program. However
in order to do this we must incorporate additional assumptions about the way that the
cognitive system operates. For example, the finding that in mathematical tasks experts
tend to work forwards from the givens can be used as a goal for instruction. Once we
identify the behaviours that we Want, we can start to specify the type of knowledge that
we wish learners to acquire, and we can then start to specify activities that support the
acquisition of this knowledge, as Cooper and Sweller demonstrated.
1.2.2 Legitimate peripheral participation
Lave and Wenger's (1991) notion of legitimate peripheral participation (LPP) provides
another performance model which can be used as a goal of education for specific
domains. As already stated above, and in the Greeno quotation, LPP involves the
gradual inclusion of the learner in a community of practice. LPP relates to an attempt to
reinterpret learning, to free it from the cognitivist viewpoint that learning is something that
occurs solely inside the heads of individual, by the formation and development of
structured representations of knowledge. Instead, learning is seen as being something
that occurs within the community itself; the result being LPP.
Lave and Wenger argue that LPP is most adequately achieved by apprenticeship. Under
the conditions of apprenticeship, the learner learns not only about the required skills of
the discipline, but also the norms and values of the community, the communication
patterns and so on. In short, apprenticeship provides a far richer set of experiences that
give the novice far greater chance of becoming a member of the group. Theoretical
shortcomings left aside for the moment, there are two problems with this approach: (1)
apprenticeship is expensive inasmuch as it is labour intensive (often one-to-one); and (2)
LPP presupposes that there is an extant community of practice with its own values,
norms and so forth that one can use as a guiding principle. This second point is only
really a problem if one adopts LPP in its strong form; the participation in a community of
7

The process of learning
practice was seen by Vygotsky (1962) as both the goal of education and the primary
means by which learning occurred. To Vygotsky learning involved the internalisation of
interactions between the learner and other actors in the learning environment. Through
this mechanism the values, assumptions, language, methodologies and so on of the
community were inculcated into the student, who gradually takes on the world view of
the community and can act as an increasingly autonomous practitioner.
In sum, LPP adds an extra level of complexity on top of the expert model, making
explicit many of the assumptions of expertise and also broadens the arena to incorporate
factors such as the language used and the specific ways of behaving, rather than just the
behaviours themselves. It is not necessarily the case that LPP and the expertise model are
incompatible; rather they are different types of description of the same phenomenon—
although the advocates of LPP would probably not agree with this. LPP may inform the
expert model as to the wider context of action, whilst the expert model may be useful in
determining effective ways to teach—particularly when we use computers rather than
human instructors. Since the purpose of this thesis is to suggest ways of supporting
learning, rather than a philosophical inquiry into the nature of pedagogy the expert model
and LPP (in its weaker sense) will be taken as being commensurable.
1.2.3 Summary
Goals are important as they have an effect upon the nature of the learning that students
do. We should be aware of the extent to which the tasks that we set students are mapping
on to the goals that they have been given. For example most would agree that one of the
primary goals of education is to endow students with some form of intellectual autonomy;
the ability for them to think for themselves. However, there must be mechanisms that
map between the goals that the instructor has and the activities that the learners are
engaging in. We may have the goal of students developing analytical skills, for example,
but without any knowledge of what this means and how tasks enable the development of
these skills, any programme will be doomed to failure. This is where cognitive
psychology can help.
1.3 ACQUIRING KNOWLEDGE
Perhaps the most important learning mechanism possessed by an organism is the ability
to form generalisations from specific instances, such an ability is the key to the adaptive
nature of learning. If one is bitten by a dog then it makes sense to generalise the fear of
this specific dog to a fear of all similar dogs; without this simple ability the individual
would be condemned to a life of frequent bitings by different dogs. Generalisation has to
be constrained somehow, otherwise one might avoid all dogs for ever more, or all
8

The process of learning
foodstuffs following sickness induced by a specific foodstuff. Happily, there are
mechanisms that constrain generalisation and a great deal of the animal learning literature
is concerned with such propensities, although such a discussion is beyond the scope of
this thesis. In the human literature discussions about the ability to form generalisations
have tended to centre on the formation and use of knowledge structures or schemata.
A schema is, at its simplest, a structured set of abstract knowledge that allows us to make
sense of a world in which no two objects or events are ever exactly the same. We
recognise a house that we have never seen before as a house because, it is argued, we
have a generalised schema that captures the general property of house-ness. A house
schema may therefore possess some of the components of a house: floor, roof, walls and
so on, which can be filled when the specific house is encountered. It will also contain
some functional attributes, such as the fact that people tend to live in them, and some
specific instances, such as the particular house the individual inhabits and so on. Once
evoked a schema permits individuals to draw certain inferences that enable them to go
beyond the information given sun as in the following example from Charniak (1972):
Jane was invited to Jack's birthday party. She wondered if he would like a kite.She went to her room and shook her piggy bank. It made no sound.
The information content in the above example is impoverished, but we are still able to
make sense of it because it triggers our background knowledge about birthday parties, not
only that but we can answer questions about it such as "How did Jane feel after this
event?".
It has been shown that schemata can exert powerful effects on learning, allowing learners
access to schemata by providing them with context can result in a substantial increase in
recall (Dooling & Lachman, 1971; Bransford & Johnson, 1973). It is as if schemata
provide slots for new experiences to latch on to, aiding retention. It is this mapping of
incoming information onto extant knowledge structures that according to many
constitutes understanding (Schank, 1986; Johnson-Laird, 1983).
1.3.1 Knowledge structures and learning
How do such knowledge structures develop, and how is new information integrated into
pre-existing structures? Rumelhart & Norman (1978) propose a framework for the
development of schemata by suggesting that there are three phases of learning each of
which results in a different knowledge state. The phases are referred to as accretion,
restructuring and tuning. Accretion involves the gradual accrual of domain information
and assimilation into extant knowledge structures. Thus new instantiations of older data
structures are made and the knowledge base grows accordingly. Restructuring occurs
9

The process of learning
when the existing structures fail to account adequately for the incoming information. If
this failure cannot be overcome by minor modifications of the schemata (by tuning) then
the schemata must be changed in order to render them useful. This will involve a process
of restructuring whereby old relationships are replaced and new ones formed. The
knowledge is therefore recast into different organisational structures which can be used to
explain and predict new events more effectively than before; whilst still accounting for
previously explainable events, though perhaps in new, more insightful ways. Finally, the
process of tuning involves the gradual refinement of knowledge structures, by practice on
problem solving tasks; to produce faster, more accurate behaviour.
1.3.2 Accretion
Accretion is perhaps the most obvious of the three categories, after all new knowledge
needs to be acquired somehow, what processes occur in this stage? It would surely be a
mistake to see accretion as somehow being akin to stuffing newly acquired concepts into
some cognitive in-tray to be .filed later by some other process, perhaps during
restructuring; new concepts are interpreted and categorised immediately by virtue of
whatever schema is currently active, this being determined by the context, knowledge
retrieved by association to the target concept, or by a combination of both. Given that a
concept is interpreted in some way, the way in which it is interpreted is going to have an
implication for the way that it is learned and consequently the inferences that one might
draw from it in problem solving. Chi (1993) makes the point that one of the great
problems with learning about certain academic concepts and constructs is that they are
effectively mis-categorised for two reasons:
• The absence of the correct ontological categories in memory,
• The learner is lead to incorrectly categorise the construct by some environmental
conditions.
Taking the absence of correct categories first. Chi argues that during the course of
development and learning the individual forms a hierarchical structure of ontological
categories, a subset of these are shown in Figure 1.1 below. When a new concept is
learned about, it is placed somewhere in the ontological hierarchy; this is not necessarily a
conscious process, it just happens because it has to go somewhere. Certain concepts
such as learning about a new chemical element will cause little problem, it is a form of
matter and matter is something that most people have ample experience of, even those
who have never been to school. Problems arise when the concept is in reality a member
of a category that the learner does not posses, gravity, for instance, is not a type of matter
it is a type of process. Further, it is not a process like the sort that people generally
10

Allentities
-----( Procedure )
--- ---
— —
nteractior)Acausal
— —
_._
( Intentional-- ---
(LightningSpeciation)
(Electricalcurrent)
Naturalkind
Living Non-living
----- ---..,( Processes )--
Mentalstates
The process of learning
experience, such as buying a book, it is a much more arcane form of process that Chi
terms acausal interaction. Acausal interaction processes have no direct cause gravity is a
force of mutual attraction between objects by virtue of them having mass, there is no
direct cause of gravity in the simple sense. When a student encounters members of these
categories the temptation is to think of them in terms of categories that they do have,
misconceptions arise because the newly categorised concept inherits properties from
similarly categorised concepts; students might incorrectly assume, for example, that
gravity has some direct cause.
Figure 1.1 Part of a possible categorisation scheme for ontological categories, adaptedfrom Chi (1993).
The second reason why misconceptions arise is because learners are mislead into thinking
about them in terms of other properties. Electric current, another member of the acausal
interaction category, is often taught to students by using the metaphor of water flowing
through pipes (see Gentner and Gentner, 1983). Although initially helpful in visualising
electric current by grounding it in something that students understand, it also has the
effect of making them think that electric current is a sort of matter, again leading to
inherited misconceptions.
Such a framework may go some way to explaining why students tend to display
anomalous behaviour when solving problems. McCloskey (1983) demonstrated that
physics undergraduates when asked to solve physics problems, such as that shown
below in Figure 1.2, often derive predictions that are out of touch with what the claim to
11

The process of learning
know. In Figure 1.2 a ball is thrown into the circular tube and the subject is asked for the
trajectory that it follows on leaving the tube, path A or path B. Many students chose B
the correct answer, but a large number of them chose the incorrect option, A. McCloskey
claims that students who choose path A in the task have a conception of physics that is
pre-Newtonian, often describing force as if it were matter that an object possessed that
gradually dissipated over time. Such naive physics might be explainable by using a
scheme such as that above.
Figure 1.2 One of the problems that McCloskey gave subjects to solve. Does the ballthrown into the tube follow trajectory A or B after leaving it?
There are two things to bear in mind about the integration of new concepts into
knowledge structures. The first is that most concepts are likely to be categorised in a
correct way, any problems with understanding are probably more to do with lack of
knowledge than concepts being subsumed under the wrong ontological category. The
second is that although Chi shows concepts as a hierarchical tree containing categories
that are ontologically distinct, it does not imply that human conceptual knowledge is cast
into such a rigid discrete structure. Some concepts seem to be described by students as if
they are part matter and part process depending on the context under which they are
questioned; the scheme is really only a guide to describe what seems to be happening in
the majority of situations when learners display misconceptions.
One might reasonably ask how many academic constructs are of this type? Are the
problems referred to by Chi ones that apply to academic concepts in general, or do they
only apply to a handful of special cases such as electric current? It seems that there are a
whole host of academic concepts and constructs that are fundamentally non-intuitive, and
result in persistent misconceptions. In psychology the persistence of homuncular
explanations of perception and reasoning; comprehending systems where there is no
12

The process of learning
controlling central executive, such as flocking behaviour in birds; comprehending
disorders that have complex mediated causes such as schizophrenia; natural selection
mechanisms; economic principles such as supply and demand where supply effects
demand (and vice versa) but not in a simple nor direct way; and so on. All of these are
cases where students' tendencies are to assume simple causal processes; getting rid of
these preconceptions is not easy.
Of course there are many other reasons why comprehending certain constructs might be
such as when they are abstract, or when they involve reasoning with mutually interactive
variables, but it seems that Chi's framework provides a useful starting point for
understanding why the task of the student is often a difficult one.
Errors such as those described by Chi and McCloskey although persistent eventually
change following repeated experience, such conceptual change is what Rumelhart and
Norman refer to as restructuring, or more generally conceptual change. The next section
describes a framework for conceptual change that has been developed by Paul Thagard.
1.3.3 Restructuring and conceptual change
Thagard (1992) has developed a more specific framework for the reconstructive nature of
learning; he divides conceptual change into four categories of increasing complexity:
addition, deletion, reorganisation and hierarchy redefinition (see Figure 1.3, below). The
simplest form of conceptual change involves the simple addition of an instance, concept,
part-relationship and so on to the knowledge base such that it has little effect on the extant
conceptual organisation. Finding out, for example, that there is an animal called a
dugong might involve simply adding the name to some list of animals already present
(addition of a concept). If we are told that the animal is part of the Walrus family, then
this might lead to the simple addition of a kind-relation (a dugong is a kind of walrus) or
may involve more complex forms of reorganisation, such as those covered later.
Elements of knowledge might also be deleted, although here it is difficult to see how
something can be deleted without some other form of restructuring. If we are told that a
Unicorn is not a real animal, we do not simply delete the concept from our knowledge
base, we place it somewhere else, under mythical animals for example. The only
apparent example of simple deletion is that of an instance, where an object may be falsely
recognised as belonging to one set, when in fact it is another, for example, initially
recognising a object in the distance as a dog and then realising that it is not. Even in this
restricted case it is likely that the deletion will be accompanied by an addition of some
sort.
13

Revisionary(branch jumping)
The process of learning
Reorganisation, the next category in Thagard's scheme, is more complex than simply
adding and deleting elements from the knowledge-base, and is divided into two sorts,
simple reorganisation and revisionary reorganisation. Simple reorganisation is further
subdivided into decomposition, coalescence and differentiation. Decomposition is where
new part relations are added to a concept, this can be a rather benign process akin to
addition, or more radical where what was thought to be a thing in itself is shown to
consist of more fundamental elements. Thagard's example of this last sort being the atom
which was shown to consist of electrons by Thompson. Coalescence is where two
previously unrelated concepts are linked by a higher level concept that subsumes them;
finding out that spiders and humans are both animals is an example of this.
Differentiation is where a concept held as being one thing is found to be two or more
distinct entities. An example of this is the division of ones concept of computer memory
into Random Access Memory (RAM) and disk-space, something that often confuses new
computer users. The key thing about differentiation is that the concept in its
undifferentiated form is entirely replaced by the new concepts, in decomposition, the
higher level concept still exists it is just refined by the addition of lower level concepts. A
atom still exists even though it consists of electrons, the differentiated concepts of RAM
and disk-space entirely obliterate the old general concept of memory.
Conceptual change
AdditionDeletion
Hierarchy redefinition
Reorganisation (tree switching)
Differentiation Decomposition
Coalescence
Figure 1.3 Thagard's types of conceptual change (adapted from Thagard, 1992).
Revisionary reorganisation is the most radical form of reorganisation according to
Thagard, and involves the re-categorisation of a concept under a different branch of the
14

The process of learning
kind-of hierarchy. Being told the simple fact that a whale is a kind of mammal will cause
this kind of change; the concept of whale switches from being classified as a kind of fish
to being a kind of mammal. Revisionary reorganisation is also known as branch jumping
because concepts are shifted from being on one branch of the hierarchical tree to another.
In the above forms of reorganisation concepts may be added, deleted, or shuffled around
the knowledge tree, but the overall structure of the tree remains the same; this is because
none of the above types of conceptual change the organising principles of the knowledge.
Sometimes, however, it may be impossible to explain new information or events by
simply tinkering with the local structure of the knowledge, a more global restructuring is
necessary; this is known as hierarchy redefinition. Such radical restructuring is rare, but
has occurred in the history of science. Darwin's theory of natural selection did not
simply require a revision of the creationist episteme that preceded it, it required it to be
abandoned and a new one be put in its place. Thagard argues that in creationist terms the
definition of 'kind' related mainly to the physical similarity between organisms, in
Darwinian terms it took on a histOrical interpretation.
Thagard's scheme was primarily developed as a model of the process of scientific
discovery rather than a theory of personal conceptual development, although he has
applied it to individuals with the question: does ontology recapitulate phylogeny? There
is some evidence to suggest that it does to a certain extent. Studies by Carey (1985)
illustrate that coalescence, differentiation and decomposition all occur within the during
childhood development, and Chi (1991) provides evidence that students undergo branch
jumping when learning about physics. There is, however, little evidence that the
individual undergoes hierarchical redefinition during learning and development.
1.3.4 The tuning of conceptual structure
In Rumelhart and Norman's scheme, tuning refers to the way that practice makes the use
of knowledge more efficient: access of information might be faster, more task-relevant
and less irrelevant knowledge might be accessed, and the knowledge that is accessed will
be structured in a way to help solve the problem. Rumelhart and Norman are not clear as
to the behavioural manifestations of tuning (other than increased efficiency and speed of
access), but what is certainly missing so far from this three-phase model is any notion of
practice effects. In the area of skill acquisition frameworks such as those proposed by
Anderson (1983) and Logan (1988) emphasise the increasing automaticity of action
following repeated practice; actions gets more accurate, faster, and less demanding of
attention or working memory. Is this the same as tuning? Before this an attempt is made
to answer this question, some exposition of Anderson's theory, known as ACT, is
necessary.
15

The process of learning
Basically, Anderson's theory states that there are two sort of knowledge: declarative
knowledge and procedural knowledge. Procedural knowledge is often termed knowing
how whilst declarative knowledge is described as knowing that—a distinction that dates
back to Ryle (1949). Declarative knowledge relates to information that one is able to
verbalise, such as that Paris is the capital city of France, or what one had for breakfast on
a particular morning, and is represented in Anderson's theory by a semantic network.
Procedural knowledge, on the other hand, relates to practical knowledge: being able to
ride a bicycle, solving an overlearned set of problems or driving, and is represented by
production rules. There is a third component to Anderson's model, a working memory
which contains a representation of whatever an individual is aware of at any time.
Following many other researchers (Miller, 1956; Simon, 1974; Baddeley, 1990) working
memory is seen as a short-term storage system that can hold a limited amount of
information, anywhere between three and seven chunks of knowledge. Knowledge in
working memory can come from two places, either from information in the outside world
that is being attended to (a sentence, a mathematical formula, a picture) or from
declarative memory. Often working memory contains information from both sources: if
someone presents you with the sentence "I like cats" in addition to having the sentence in
working memory because that it what you are attending to, you might retrieve information
from declarative memory about cats. Because working memory is of limited capacity
both of these sources of information will compete for space. This simple model explains
why learning complex skills is often difficult. If you have to pay attention to some set of
environmental cues and retrieve information from memory at the same time, then working
memory becomes overloaded and errors occur; either you fail to attend properly to the
external stimuli, or you fail to retrieve some important action. When we learn to drive we
often find that when we change gear, we lose control of the steering temporarily, or if
something on the road captures our attention then our driving might go to pot. Such
interference problems become less likely as competence develops, to the point that we can
'multi-task' and perform more than one action at once. Anderson explains this by stating
that skilled performance is dependent upon procedural knowledge which does not
compete for working memory. Instead information in working memory matches on to
the conditions (the 'IF' parts of the production rules) which then fire giving rise to the
action specified in the tail (the 'THEN' part) of the rule (see Figure 1.4). An production
rule for driving might be:
IF the goal is to stop
THEN dip the clutch and apply the brakes
Whenever working memory contains conditions that match the head of the goal, the
production fires automatically and the action is performed. At first blush this makes
humans sound like automata under complete control of the environment, but recall that the
16

Procedural memory
Match Execution
I
r •
The process of learning
information in working memory can derive either from the environment or from
declarative storage. It is therefore not just the environment, but the way that the
environment is appraised that effects a production firing and hence controls behaviour.
Outside world
Figure 1.4 Schematic of the ACT architecture
The acquisition of a skill in ACT is one of proceduralization; a progression from
behaviour based on declarative knowledge to behaviour based on procedural knowledge,
a process that depends upon practice. Procedural knowledge has a great deal going for it:
it is applied quickly, it is accurate and it demands little or no conscious effort. Sometimes
this automaticity is not always positive: once created productions are robust to change
meaning that errors are often difficult to eradicate, this is comgounded by the fact &at
because procedural knoWledge is impenetrable to consciousness an individual is unlikely
to know what knowledge is causing the errors, more of which later.
Anderson's distinction between declarative and procedural knowledge is not merely one
that is theoretically convenient, there does seem to be a psychologically real difference.
Neuropsychological studies (Cohen & Squire, 1980), experimental studies (Wellington,
Nissen & Bullemer, 1989) and skill acquisition studies (Anderson, 1993) all indicate that
there are qualitative differences between the two types of knowledge. Schema theory, on
the other hand, makes little reference to the distinction, this and the very different learning
mechanisms proposed for by the two theories seem suggest that the two theories are poles
apart. I shall briefly examine some of these differences in the search for some common
ground.
17

The process of learning
1.3.4.1 Schemata and procedural and declarative knowledge
The most salient difference is the separation in ACT of procedural and declarative
knowledge, whilst schema theory makes little reference to such a distinction. In truth this
probably has more to do with theoretical necessity, and the nature of the data being
explained rather than any real polarisation: ACT was proposed to explain the acquisition
and automation of skills, schema theory is proposed to explain already competent
behaviour. If we look at practically any complex, knowledge-intensive behaviour it will
use both procedural and declarative knowledge in varying measures. Seen from this
angle a schema is nothing more than a set of declarative memory nodes that are activated
by virtue of them being previously useful for that particular context, this part of
declarative memory will match the heads of specific productions that have been acquired
through repeated exposures. This account of schemata describes them not as monolithic
constructions of related knowledge, but as far softer entities, that are built up when
needed as a result of patterns of association between more basic entities. Barsalou
(1986), for example states that often our knowledge about the world, when closely
examined, refuses to show the static nature associated with certain conceptions of
structured knowledge. Rumelhart has also recently argued against the view that schemata
are things in themselves, stating that they emerge as a result of "...large numbers of much
simpler elements all working in concert with one another." (Rumelhart, Smolensky,
McClelland and Hinton, 1986, p.20).
1.3.4.2 Discrete or progressive learning?
On the face of it both ACT and schema theory make difference predictions about the way
that learning progresses. Anderson (1983) agues that learning seems to occur smoothly
and progressively, not in schema-like jumps during the restructuring process. This is
true, but there are two things to bear in mind: first, Anderson focuses very much on
factors such as speed and accuracy during the process of skill acquisition, whereas those
who make a claim for restructuring focus on less quantitative measures (Miyake, 1986;
Carey, 1985). There is no reason why shifts in understanding should cause a dramatic
shift in problem solving behaviour, particularly when you bear in mind that it might take
time for the new form of understanding to become effectively tuned. It is well known
that when an overlearned skill is restructured, then there is often a dip in performance
because it takes time to automate the new procedure.
Second, restructuring is unlikely to come all at once in a flash of inspiration, it is more
likely that it comes gradually over repeated experience. Thagard's analysis of the
development of Lavoisier's theory of oxidisation that replaced the earlier phlogiston
18

The process of learning
theory shows that arose slowly over the course of a number of years, not all of a sudden.
In cognitive terms revising a conceptual structure will come in fits and starts. When a
child is told that a whale is a mammal and not a fish, she does not suddenly branch switch
and treat the whale the same way as a cow or a dog in terms of their mammalian
properties. More likely is that over a period of time the child will see the whale as having
increasingly less fish-like and more mammalian properties. Chi (1991) argues that
children's conceptual development involves a functional rather than structural
reorganisation, viewed in this light coalescence, branch switching might occur, but the
old structure remains intact; behaviour changes when the strengths of the new
associations are higher than those of the old associations. This particular model of
conceptual change would accord with the idea that restructuring occurs gradually as
weights between concepts are altered due to experience, rather than suddenly through
concepts being 'physically' moved. The gradual switch would manifest itself in two
ways: first, there would be a period where behaviour becomes unpredictable, sometimes
behaving as if the individual has the old structure, sometimes as if they are behaving in
accordance with the new one. Second, there would be a large effect of local context upon
behaviour; when there are only small differences between the connection strengths of the
two structures a particular context might tip the balance in favour of one or other
structures. Such context effects are well known in the psychological literature; when
memory traces are weak, as might be the case when an individual is given a short time to
learn a list of words, context can have a large effect on recall (Godden and Baddeley,
1975) when something is overlearned, context has less effect on performance; memories
tend to become context independent (Barsalou, 1986).
There are therefore commonalities between schema theory and the skill acquisition
literature, three of which I have summarised below.
. Some bits of knowledge seem to be available to consciousness, whilst others are
unconscious and automatic. We saw this in Chi's example, people are often unaware
of the categorise that they are using to derive predictions.
• Both schema theory and ACT make claims about the effects of practice on efficiency
and speed.
• In ACT incorrect productions are never lost or obliterated by new productions: the
old ones just simply have a higher threshold for activation, and are therefore unlikely
to be used. The implication here is that it is entirely possible for two different bits of
knowledge to exist for the same thing—as Chi claims.
19

The process of learning
1.3.5 Summary
The above tells us a number of things about learning. First, it tells us that background
knowledge plays a critical role in the way that people understand a particular set of
concepts. More crucially, it informs us that many of the concepts that we expect people
to learn about in academic situations are difficult because people do not have the
conceptual machinery to understand them. The paradox of learning that I outlined in the
first section is not, I believe, wholly the fault of the education system, it is because the
nature of many topics cannot be directly experienced nor can they be related to any of the
other concepts that we might be familiar with. Attempts to use analogies for these forms
of concept, be they self-derived or given by an instructor, can give rise to false beliefs
and misconceptions. Chi's proposal might also provide us with some insight into the
difference between experiential and academic knowledge, or percepts and precepts
(Vygotsky, 1962; Laurillard, 1993). There exists a possibility that there may be some
innate propensity to acquire categories for direct causal relations, for the behaviour of
matter, for grammar, for certain forms of social interaction and so on (see Pinker, 1994
for a discussion). This would suggest that no degree of restructuring of the education
system would render certain academic concepts as easily learnable as those that we
acquire by direct experience. This is, of course, highly speculative but if it was true it
would suggest that using an experiential model for teaching difficult academic subjects is
just the wrong approach to take, since the learner is doomed to re-categorise new
information in terms of their old conceptual structure. More effective learning would be
brought about by gearing the educational intervention to explaining the nature of the
categories in a explicit way, rather than hoping that they acquire them implicitly.
The second thing that we know is that learning often involves some degree of conceptual
re-organisation; one of the possible misconceptions of reorganisation is that it happens
suddenly and obliteratively—overwriting the older conceptualisation. It seems more
realistic, and certainly more in accordance with the data to suggest that reorganisation
occurs gradually over repeated exposures of the information, and that the change is one of
emphasis than a real reordering. Viewed from this perspective, conceptual change would
predict the sensitivity to context and the inconsistencies that are often seen during the
process of learning and development.
Third, the ACT framework says much about the problems of correcting misconceptions.
If we repeatedly think about concepts in a certain way (such as thinking about electrical
current as flowing water) we make it functionally harder to acquire the correct
20

The process of learning
conceptualisation later on3 . It also makes claims about the nature of processing during
learning and the ability to verbalise that knowledge. Recall the study by Broadbent,
Fitzgerald and Broadbent (1987, Section 1.2). This study demonstrates that it is possible
to control a complex system with little ability to verbalise what rules one is following,
which is explained by ACT by stating that productions are formed without concommitant
a declarative representation sufficiently robust to permit verbalisation.
So far learning has been described in a way that detaches it both from the thinking human
being in which it occurs, and from the environment4 that both precipitates and provides
the raw materials. A learner is viewed as having knowledge, even structured knowledge,
but learning has been described as an unconscious process whereby knowledge is slotted
into extant categories like marbles tossed in a series of boxes. Finally, conceptual change
is seen as some covert flipping of conceptual structure that happens beyond conscious
awareness. Such a view seriously underplays the self-regulated nature of a great deal of
learning; to a certain extent learners are consciously trying to make sense of information
that is presented to them and relating this to what they already know. As we shall see,
there are differences in the extent to which learners do this.
1.4 SELF-REFLECTIVE LEARNING: MONITORING AND REPAIR
Self-monitoring is indispensable when it comes to learning and understanding; at its
simplest it describes the process by which learners ensure that their understanding of a
domain accords with the domain itself. Monitoring performance is closely related to
feedback; if we are learning to throw a ball through a hoop then the fact that the ball
misses can serve as a direct indication that we have done something wrong. In other
forms of monitoring, there is no direct feedback to indicate that ability or knowledge is
wanting, learners have to deploy specific processes themselves.
Glaser and Bassok (1989) propose four types of comprehension monitoring skill:
predicting, summarising, questioning and clarifying. Predicting is where learners try to
test out their understanding of the information presented to them in the learning set by
anticipating what comes next. Summarising is where learners from summaries of
material to attempt to integrate information presented to them to form a coherent
overview, again this can serve to aid identification of inconsistencies. Questioning is
3 By functionally I mean that although it is no harder to lay down the correct trace in memory itbecomes more difficult to get the new conceptualisation to a higher level because the activation level ofthe incorrect competing theory is so high from all the practice.
4 Environment here means the to-be-learned information, the instructors, peers and anything else thatoccurs outside the individuals head.
21

The process of learning
where learners attempt to resolve understanding failures by asking themselves questions
about the information. For example, they may ask: "How does this information relate to
what I have read before?", or "What is the relevance of this?". Finally, incongruous
information may result in learners clarifying certain points, simply re-reading material
may help here, although other strategies such as stepping through the set of propositions
to be understood providing self-explanations; or trying to find an analogy may also help.
Chi, Bassok, Lewis, Reimann and Glaser (1989) investigated students learning physics
from worked examples, and found that the students who did best were those who
engaged in self-explanations: deriving each line of the example from the previous line and
relating it to the problem whole. Similar results have been obtained by Fergusson-
Hessler and DeJong (1990), and Laurillard (1993). Self-explanations serve two
functions: first the learner's attention is focused upon the relevant information that links
two set of propositions (these might be mathematical statements as for the Chi et al study,
or textual structures as for Laurillard's studies), enabling a learner to assess whether they
understand the links. Second, generating the self-explanation mobilises knowledge that
can be used to understand the example more completely. Self-explanations, therefore,
not only enable comprehension to be monitored and help to resolve any understanding
failures that may occur; they might also actively prevent certain forms of misconceptions
from occurring because the student is engaged in justifying their reasoning.
On the back of this (and other) research, VanLehn (1988) argues for impasse-driven
learning. In one implementation the learner is forced to generate self-explanations by
being taken through an example one line at a time, providing a justification before
continuing on the next line. This approach attempts to minimise the tendency of weaker
students to simply ignore transitions in the problem statement because it seems to be too
much effort. The results of this approach are so far unknown.
Other attempts to encourage self-explanation have shown some degree of success,
Bielaczyc, Pirolli and Brown (in press) demonstrated that if learners are taught to
explicitly use self-regulatory strategies such as self-explanation and monitoring in
learning the Lisp programming language, then their performance is enhanced, when
compared to a group who are not taught these skills.
1.4.1 Summary
The results of the above studies show the importance of engaging in some form of self-
reflective reasoning during learning, it also shows that learners can often be taught (or
forced) to use reflective skills and that this can have a positive effect on learning. The
research by Bielaczyc et al, shows that within a narrow area of application (Lisp learning)
22

The process of learning
a requirement to monitor and reflect by generating self-explanations can turn poor learners
into better learners. Is this effect limited to specific domains, or will the teaching of
learning strategies such as those above generalise to other problem domains? The next
section attempts to answer this question.
1.5 CAN EFFECTIVE MONITORING AND REFLECTIVE SKILLS BE
TAUGHT?
There are many programmes that aim to teach general meta-cognitive skills to students
(Bransford, Sherman & Sturdevant, 1987; Lipman, 1987; Sternberg, 1987) by providing
a relatively small number of general heuristic strategies. After a review of the literature
Singley and Anderson (1989) remark that:
"These heuristics all have the ring of truth and seem quite reasonable on thesurface. However their application to a particular problem is difficult, given theabundance of abstract nouns in search of referents."
Singley and Anderson's point relates to the fact that the use of so-called weak heuristic
methods are no substitute at all for domain specific methods such as those found by
Sweller et al (1983; see Section 1.2.1). Somebody may advise that a good way of
critically evaluating an argument is to explicate its hidden assumptions and deciding on
their plausibility. What is the novice to do when faced with such a task; what are the
critical assumptions and how should they be addressed?
There is the additional problem of transferability of these skills. Even if a student does
effectively use monitoring and reflective skills when told to in a set of examples, would
they necessarily use them, or be able to use them in other problems? Reflective skills are
as likely as any other form of knowledge to suffer from the context and task specificity of
learning and people may often fail to see how such skills might be deployed. Hayes &
Simon (1977) showed that subjects who were able to solve the Tower of Hanoi problem
were unable to use this skill to solve problems that were structurally isomorphic but
superficially dissimilar. Hayes & Simon argue that this is because subjects fixate on the
superficial features of the problems and are unable to see the deeper or more abstract
structure. Gick & Holyoak (1980; 1983) demonstrated that even when subjects were
instructed to think about the underlying structure of problems, there was little transfer to
isomorphs. Cheng, Holyoak, Nisbett & Oliver (1986) showed that performance on
Wason's four-card problem, which has an underlying logical structure, was no better for
subjects who were trained in logic when compared to subjects with no such training.
Some general learning strategies, on the other hand, do seem to be of some use. PQ4R
(Thomas & Robinson, 1972), is a strategy for learning from text which has proved useful
in a number of cases (Frase, 1975), whilst subjects trained to use Dansereau et al's
23

The process of learning
MURDER text comprehension strategy, performed 14-18 percent better than untrained
subjects (Dansereau, McDonald, Collins, Garland, Holley, Diekhoff & Evans, 1979).
Why is it, therefore, that some strategies seem to have an effect, whilst others do not?
Perhaps the main reason is that the stages in strategies such as MURDER and PQ4R
pertain to fairly mundane activities, such as 'Set a number of questions to answer before
you read the text', or 'After an initial reading, try and recall the main points of the text'.
These are all very specific, all things that anyone can do and none of Singley and
Anderson's 'abstract nouns in search of referents'. The reason that PQ4R and MURDER
work, whilst strategies such as Rubinstein's (1975) problem solving heuristics do not is
likely to be because PQ4R and MURDER require learners to do things that they can do
relatively easily, but tend not to do in the normal course of events. Asking someone to do
something which is unfamiliar to them is likely to result in little improvement, as is asking
them to do things that they do in the normal course of their learning. It may be that this
reason underlies the effectiveness of teaching self-explanations referred to in Section 1.4,
as it is something that most learners are perfectly able to do, but tend not to.
1.6 CONCLUSIONS
This chapter has attempted to show some of the factors that are important in the design of
educational computing systems. Learning is geared towards helping the individual adapt
to the environment but it is not often clear, least of all to the learner, what skills and
knowledge they will need to do this, this is why deciding on goals is an important facet of
the design process. Like all forms of adaptation, learning is constrained in the sorts of
changes that can be made, in this case by both by the architecture of the mind, and by the
knowledge that we already have. Correct understanding of a topic is a prereguisite for
correct behaviour, but one of the blocks on aiding this is that often the knowledge that is
being used to define concepts is often deeply entrenched and learners are often unaware
of it. Such knowledge is not only a problem for errorful behaviour, we often need
knowledge of the categories that we are using to act in an appropriate way, when we are
aware of what type of entity electrical current is, it may open up a world of analogous
categories and structures.
Jonassen, Beisser and Yacci (1993) coined the term structural knowledge to refer to the
meta-knowledge about the organisational framework that act as the architecture for our
conceptual understanding. As Jonassen et al point out there is no psychological basis for
positing structural knowledge (unlike the procedural-declarative distinction), but it is
useful for discussion purposes. Structural knowledge, as used here, is necessarily based
upon abstractions and generalisations of 'real' relationships. Structural knowledge of a
psychology experiment El is that is has the relation 'supports' with theory Ti and
'contradicts' theory T2. As was discussed in Section 1.5 the psychological evidence
24

25
The process of learning
regarding the formation abstraction is often gloomy: on the one hand people do it with
ease, on the other hand they are not always the correct abstractions and transfer is often
weak. The educational psychology of theorists like Ausubel (see section 3.2) stresses the
importance of teaching top-down (from the abstract to the specific) something that is
echoed by Meyer (1984) in her work on text structure. Situated cognition researchers, on
the other hand, emphasise a more bottom-up approach, working from the specifics to and
allowing learners to induce the abstractions (Brown, Collins and Duguid, 1989). Still
others argue that neither top-down nor bottom-up is correct, but we should teach middle
out (White, 1993).
The difference in emphasis between top-down and bottom-up methods of learning and
teaching recapitulate the conceptualisation of learning held by these theorists.
Constructivists and cognitive psychologists emphasise the acquisition of abstractions, the
integration of knowledge into schemata and the organisational capacity of the mind.
Situated learning theorists, on the other hand, emphasise the dialectical relationhip
between the complexity of task and behaviour, the dominance of local context on
performance and the need to acquire specific rather than general skills. Put crudely the
former cap argue that you should concentrate on the generalities and the specifics look
after themselves, whereas the latter argue the converse. Although coming from a
cognitivist perspective, I have as yet made no specification as to which of these
approaches would best foster effective learning. The view that I adopt for the reast of this
thesis is in one sense that neither of these extreme views is correct, and in another both
are. Teaching abstractions is often meaningless to students in the first instance because
they give little away as to how they might be used in a specific instance (such as the
problem solving strategies referred to in Section 1.5). On the other hand, exposure to
specific instances gives learners free reign to treat every problem as the same or form
inadequate generalisations as we saw in Section 1.3.2. What seems to be needed is an
approach that operated at the level of specific instances, but draws learners attention to
and focuses their thought processes on the abstract relationships between elements. Such
an approach is not new (see Collins and Brown, 1988) but has so far been explored in
only a small number of domains. This approach is known as directed reflection because
the intention is to direct the learners thinking towards issues of importance to the domain.
Such a term, however, is vacuous without any specification of what these issues might
be, and how best to direct learners' attention, in order to try and render this concept more
tractable I make the following assumptions:
• Academic knowledge is structured in precise ways, and one of the goals of learning
is to learn about these and use them effectively to solve problems or communicate
with others.

The process of learning
• There are constraints upon an individuals ability to discover these structures; some of
these are due to the effects of prior knowledge, and some are due to computational
constraints, such as the limitations of working memory.
• The activities that learners engage in can have a large effect on what is learned due to
the differences in processing that occurs during learning.
The approach that is adopted is termed directed reflection. The intention is to try and
focus the learner's attention on the specific types of knowledge and skills that are
important to the educational goals, taking the various constraints above into
consideration. Of course knowing what the goals are is all important, and in later
chapters I shall say more about goals when more specific types of domain are discussed.
The next chapter looks at a number of approaches which use educational technology to
support the process of learning, these are discussed in relation to directed reflection.
26
2
Computer-assisted learning
2.1 INTRODUCTION
Computer-assisted learning is a broad church, encompassing a great number of different
approaches that have been tailored to suit a number of different educational, political,
psychological and technological considerations. In this chapter I consider a few of these
approaches with particular reference to some of the considerations that were outlined in
the previous chapter. In particular the relevance of the approaches to directed reflection
will be considered.
The two main approaches that are based on psychological principles are Microworlds
such as LOGO (Papert, 1980, 1987 which are based on neo-Piagetian constructivist
principles, and certain intelligent tutoring systems such as the ACT family of tutors,
which are based John Anderson's model of skill acquisition l . Interestingly both of these
approaches are used for domains that are both well-defined and formal. This is no mere
coincidence, formal domains happen to lend themselves to these types of systems,
whereas poorly defined declarative domains do not. The reason for this is two-fold: first
both microworlds and intelligent tutoring require some form of domain model, something
that is easier if the domain is formal; and second, these domains are nearly always require
a great deal of natural language to convey their concepts and natural language dialogues
are difficult to implement in computer systems.
The rest of this chapter discusses some approaches to educational computing, including
microworlds and intelligent tutoring. The main focus, however, is on a method that has
been used for domains that are primarily declarative in content: the hypertext approach.
l Interestingly LOGO and the ACT tutors are at opposite poles in the model of learning that they
implement.
27

Computer assisted learning
2.2 PROGRAMMED LEARNING
The primary way in which presentation systems communicate the knowledge to the
learner is by presenting, or allowing the learner to have access to, a corpus of
information. There is little attempt by the system to involve itself in the process of
learning in a sophisticated way. Historically they are perhaps the earliest form of
educational computing and date back to the late 1950s and early 1960s. The first systems
were linear tutorials, which would present information to the learner in textual or
graphical form, the learner progressed through these screens in a sequential fashion and
had no control over what they saw next. Some of these systems did require some form
of active involvement by the learner; the information screens may be interspersed with
sets of questions, normally of multiple choice format, the successful completion of which
was prerequisite to the learner progressing onto the next series of information screens.
Failure to answer questions correctly would normally result in learners staying at the
same level, reading the same information screens until they eventually got the questions
correct. More sophisticated systems could deal with learners failing to answer questions
correctly by offering remediation in the form of extra screens of information. These
branching systems, as they were known, were perhaps one of the first attempts to
produce systems that could respond to the needs of the individual, albeit in a severely
restricted way.
The interest in systems that regulated the learner's behaviour was based partly on one of
the major prevailing psychological theories of learning: Skinnerian learning theory
(Skinner, 1968). This suggests that learning could best be achieved by the systematic,
incremental shaping of a learner's behaviour by reinforcing behaviour that is correct or
appropriate. It is essential in this approach that mastery of a sub-topic occurs before the
learner is allowed to progress to the next. Thus assessment is effected by using quizzes.
In their book 'Principles of Instructional Design', Gagn6, Briggs and Wager (1988)
outline a number of principles designed to aid in the development of courseware, using an
approach that has become known as the systems approach. The systems approach is
what Carroll (1990) refers to as a monolithic approach to instruction, since the attempt is
to impose a single cohesive set of principles on the process of learning. In the systems
approach the information to be taught is hierarchically decomposed, first into units known
as target objectives, which may be thought of as topic areas, and then to decompose these
into still lower level units that represent the material and activities that the learner actually
engages with, known as enabling objectives. Enabling objectives are sequenced in a
logical way starting with the most fundamental information and building upon it.
28

Computer assisted learning
The systems approach makes a number of assumptions about the domain to be taught and
about the students themselves. First, it assumes that the domain can be hierarchically
decomposed, so that the domain is ultimately reducible to a number of low level activities.
Second, it assumes that the successful achievement of enabling objectives ultimately
results in the learning of the domain itself, or at least the portion of the domain in the
system. Third, it assumes that learners are intrinsically motivated to achieve the enabling
objectives. Fourth, it assumes that learners do not differ in their goals or background
knowledge, or at least it assumes them to make no difference.
The systems approach has been criticised from a number of perspectives. In particular
Carroll refers to its treatment of individuals almost as tabula rasa with no knowledge or
goals of their own as being a major stumbling block. Learners always have some reason
for learning, and these reasons are likely to differ in all but the most homogeneous
population; failure to take account of these may result in under-use of the systems, due to
the laboriousness of the interaction. Additionally, Carroll attacks the notion that there is
such a thing as a novice; even on a domain that they have not encountered before learners
will bring with them a large amount of information that is relevant to the domain, which is
likely to have an influence on the way that they interpret the information. Such
background knowledge may facilitate understanding of the information, but it may also
interfere with the new domain knowledge resulting in misconceptions (see Section
1.6.6).
The systems approach and variations are still used, particularly in computer-based
training where the learning population are relatively homogeneous and the teaching
materials relatively procedural. However the shortcomings of the systems approach led to
the desire to provide more adaptive systems. With the advent of artificial intelligence,
there was a possibility for developing systems that could first go beyond the mere
presentation of information learning materials that were truly interactive and generative,
and secondly could adapt the course of the interaction to the learners individual
requirements. The two systems that perhaps best typify this approach are microworlds
and intelligent tutoring.
2.3 MICROWORLDS
Microworlds are an attempt to foster the learning of academic and other concepts by
situating them in an computer-based environment that enables experiential learning.
Papert (1980, 1987), the father of the microworlds approach, argues that learning is
natural and the reason why it is sometimes hard or unsuccessful is due to the unnatural
nature of the pedagogy. Children learn, among other things, the rules of grammar, social
interaction and causality without being explicitly taught about them, so why should
29

Computer assisted learning
academic concepts such as those in mathematics and physics be any different?
Microworlds therefore attempt to recreate the conditions under which we learn these
'natural' phenomena and apply them to concepts that are traditionally taught by pedagogic
means. The best known microworld is the mathworld or LOGO which, as the name
implies is a environment for supporting the acquisition of mathematical concepts. The
goal of LOGO is to get a small graphical pointer (known as a turtle) to move around the
computer screen so that it draws geometric shapes. In order to do this the child (or other
learner) needs to give the turtle instructions, the language that the child uses is called
turtle-speak which is a computer programming language that follows the rules of
mathematics. Just as a child has a need to learn language to get other people to fulfil its
goals, and obtains feedback by observing the successfulness its communication in terms
of whether these goals are achieved, so the child learns about mathematics by interacting
with the turtle using the mathematical language of turtle-speak and watching how it
behaves. The analogy with language goes deeper: language is generative in that the
individual can use the grammatical rules to combine the elements into unique forms,
expressing things that they have never before thought about, and describing new events,
objects or situations. Papert argues that concepts learned by microworlds become what
he terms 'powerful ideas': generative, transferable knowledge that permits true intellectual
autonomy. In contrast knowledge acquire through pedagogic means suffers from the
context dependency, inflexibility and use-specificity that was described in Section 1.5.
The analogy is, superficially at least, very seductive, but is it correct: do microworlds lead
to powerful ideas? Most of the evidence for the effectiveness of LOGO is anecdotal, or
suffers from inadequate methodology (Kransor & Mitterer, 1984). Mitterer and Kransor
(1986) found that skills transfer for children using LOGO was no greater than other
interventions such as programming in BASIC and traditional problem solving. Despite
the lack of evidence for their effectiveness, microworlds are still a relatively powerhn
force in computer-assisted learning (see White, 1993). Part of the reason for this is that
they offer a way out of the learning paradox by apportioning blame to pedagogy: if all
learning is natural then all we need to do is to find the correct environment to engage the
natural learning mechanisms. Can academic subjects be learned in the same way as
language, causality, natural categories and social interaction? Laurillard (1994) think not,
she says about physics microworlds that:
"...they are learning about the Newtonian world through experiencing it. So it isnot academic knowledge that they are acquiring, but experiential knowledge....[T]he reasoning that students are doing while operating in a microworld, ishelping to build their personal theory of that world, just as the child buildstheories of the physical world by playing with bricks."
30

Computer assisted learning
The thing about personal theories is that, as Chi (1993) points out (Section 1.3.2) is that
they are often wrong. Laurillard's point is that microworlds, used by themselves, do not
convey the correct conceptualisation of a concept, rather they permit the reinterpretation of
new information in terms of old knowledge.
2.4 INTELLIGENT TUTORING
Intelligent tutoring bases its instructional approach on traditional educational practice: the
tutorial model. The reason for this is that it is well known that in practically any domain
you care to mention one-to-one tutoring produces by far the best results; the problem is
that it is very costly to implement. The goal of intelligent tutoring is therefore simple: to
provide an educational environment similar to one-to-one tutoring whilst replacing the
human tutor with a computer. Intelligent tutoring shares with the systems approach an
emphasis on the system regulating the interaction, based on a decomposition of the
knowledge and skills to be acquired. It differs from the systems approach in that the
specification of the curriculum is less rigid and is tailored to the demands of the individual
learner. In order to do this it is necessary to have a the following: an analysis of the skill
and sub-skills of the domain and the dependencies between these, such that skill X is
prerequisite to skill Y; an understanding of how these individual skills may best be
acquired; strategies of communicating the skills; and common misconceptions and
deviations from target skills and knowledge that learners exhibit. The system then
requires some form of representation of the student's level of understanding so that it can
select the appropriate course of action at the right time. When these criteria are fulfilled,
intelligent tutoring can be extremely effective; the Geometry Tutor developed by
Anderson and colleges has been shown to increase students' performance on standardised
tests by around one standard deviation when compared to traditional educational practice
(Anderson, Boyle & Yost, 1985).
Intelligent tutoring, properly designed and implemented, can fulfil many of the goals of
directed reflection. The tutor can set the focus of the interaction on relevant knowledge;
provide tasks that encourage the learner to consider appropriate concepts and relationships
and provide meaningful corrective feedback to the learner. Additionally, methods such as
the provision of a task goal-stack in the Lisp tutor, or the use of a graphical proof-tree
interface in the geometry tutor can serve to support working memory limitations; allowing
the learner to focus all of their attention on the relevant concepts. Intelligent tutoring
could be seen in some ways to be the ideal candidate for supporting directive reflection, in
reality, however, there are enormous problems getting the systems to work in domains
when the domain is non-procedural; when there is little or no well-defined objective to the
learning; when it is difficult to decompose competence into sub-skills; or when a lot of the
knowledge declarative. Many academic disciplines: psychology, economics, philosophy,
31

Computer assisted learning
history, etc. fill all or most of these criteria and are therefore largely impenetrable to
tutoring. However, within these disciplines there are often sub-topics that are relatively
well-defined and formal, statistics being an obvious candidate. However, in terms of
directed reflection we are only on the first rung of providing any sort of formal analysis
of the skills and knowledge needed to support such a task and tutoring seems a far off
goal. Perhaps in recognition of this and other problems with intelligent tutoring, many
practitioners have advocated approaches where the learner has more control, the claim
being that if we cannot regulate the interaction in a meaningful way, then we should
permit the learner to regulate it themselves, to allow them to take responsibility for their
own learning. Hypertext is one such approach, and it is to this that I shall now turn.
2.5 HYPERTEXT
In his now classic paper, "As we may think" Vannevar Bush (1945) outlines the Memex
system, which is recognised as containing many of the features of hypertext. Memex
allows individuals to store information in the form of associative networks, where
semantic relationships can be used to structure and access a knowledge-base. The
Memex system would also allow the individual to access information deposited by others,
thus the Memex was a shared memory, a notion that is still currently being implemented
to this day in tools such as CM/1 (Corporate Memory; Conklin, 1993). As Bush states:
"...science may implement the ways in which man produces, stores and consults the
records of his race."
The name most closely associated with hypertext is Ted Nelson (Nelson, 1988). Nelson
conceived his Xanadu system in the 1960s as a vast interconnected network of 'all human
knowledge' that anyone in the world could access via a terminal. Nelson's Xanadu, like
Bush's Memex has still yet to reach implementation, (although a new version of Xanadu,
Xanadu light, is in preparation) and all of the hypertext systems that exist today are more
modest in scope.
2.5.1 Application areas of hypertext
Hypertext has been used for a number of purposes, lending itself well to areas where the
task of the user is difficult to specify in advance, or where the learner population is likely
to be untrained in using databases. Some of theses application areas are: on-line help
systems, reference works, electronic books and learning systems. Since the main thrust
of this thesis is hypertext for learning, the lions share of the discussion centres around
this area of application, before I discuss learning in more detail.
On-line help systems such as the one which comes with HyperCard (Apple computers,
1994) use hypertext links. These allow the user to browse various topics which may be
32

Computer assisted learning
of interest, and jump to a selected topic immediately. Once in a topic the system provides
a list of additional topics which are related to the topic currently being viewed. Selecting
one of these topics takes the user to further information, which itself include related
topics. Thus, the user may find information that they require by accessing information
that seems close to their interests and by browsing related topics.
Hypertext systems have been used for producing on-line databases (such as Glasgow on-
line, Baird & Percival, 1989). Here the goal is to provide quick access to information
that the learners wants, but may not be able to ask for specifically enough for a query
system to handle. Information can be accessed via a graphical display that divides the
information up into different topic areas that are likely to be of interest to visitors to the
city of Glasgow.
Various on-line encyclopaedias, are also based on the hypertext metaphor. Here the
ability to cross reference words or topics is made easier by the provision of hypertext
links which allow users to access related information more quickly, and without the page-
flipping required for paper-based encyclopaedias. The Grolier encyclopaedia is an
example of such a system. The advent of the World Wide Web has opened up myriad
possibilities for people to develop their own personal hypertext publications, many for
educational purposes.
2.5.2 Hypertext for learning
Hypertext excited a lot of interest for its potential as a computer-assisted learning
medium, although trying to pin down why this should be so is rather difficult. Certainly it
has the potential for wide dissemination; electronic documents can be accessed over
information servers in seconds, however this is the case for all electronic media, not just
hypertext. A more reasonable explanation may be found in the oft-referred to similarity
between hypertext and the structure of memory or even the structure of the brain.
"The book is a wonderful invention, but it has one major flaw - the linear artefactComputers allow information to be stored and accessed relationally, therebymimicking the central nervous system." (Noblitt, 1991)
The above quotation emphasises what can be called the 'homeopathic fallacy' in hypertext
(McKendree & Reader, 1994); namely that a solution to a problem (a cure for a disease,
an approach to learning) can be found by looking for something that resembles either the
problem itself, or the effects of the solution. Such an episteme was popular in
renaissance times. Foucault (1970) refers to aconite, a plant that was used as a cure for
blindness based on the resemblance of its seeds to the human eye: "They are tiny dark
globes seated in white skinlike coverings whose appearance is much like that of eyelids
33

Computer assisted learning
covering an eye." If you replace blindness with ignorance, aconite with hypertext and the
eye with the brain (or as we shall see shortly, the mind) and you have a perfect mapping.
A more common comparison is that between the structure of hypertext and the structure
of memory (see also Bush's quotation, Section 2.4).
"[A] basic hypothesis of our study is that better concept structures can bedeveloped — structures that when mapped into a human's mental structure willsignificantly improve his capability to comprehend and to find solutions within hiscomplex-problem solving situations." (Englebart, 1963).
"Access to the information is facilitated by the associative organisation of theinformation which may resemble the associative structure of memory."(Jonassen & Grabinger, 1990)
Both of these derive from the fact that hypertext can be seen as a network of associations,
a model that has also been used for human declarative memory (Quillian, 1968; Collins &
Quillian, 1969; Anderson & Bower, 1973). Again mere structural similarity can be
misleading. Access of information such as word concepts from long-term memory can
be facilitated if words that are semantically similar are presented beforehand, this so-
called associative priming can be modelled by assuming that words are stored in a
network which is accessed by a spread of activation from the primed word to all its
semantic relatives; this activation causes the activation level of all the words touched by
the spread of activation to be reduced, resulting in quicker access next time around. This
way of storing information may serve some adaptive function because it means that
events that tend to co-occur in the environment will tend to prime each other leading to
faster access when required; in short it give the human cognitive system some means of
predicting what may happen next based on the prior probabilities of co-occurrence.
Hypertext could in principle be seen to be like this; providing access to related
information if required. The problem here is that although this may be an effective
method of aiding access for a knowledgeable person it may cause problems for the
novice, unaware of the reason for the semantic connections coded in by the expert. In
this sense it becomes rather like trying to make sense of someone else's personal filing
system. And indeed this is another, perhaps more plausible account of why hypertext
may be an effective medium for the delivery of educational material. The claim here is
that following the hypertext links gives the learner a clearer idea of the way that the
information fits together in the domain to form a coherent whole. Whilst this may be
true, it is contingent upon the learner processing the links in a meaningful way; merely
moving from one screen to another is unlikely to give the learner any insight as to what
the connection between the two screens is.
Mayes, Kibby and Watson (1988) take up this line of reasoning in their StrathTutor
system. StrathTutor was designed to encourage the learners to reflect upon and
34

Computer assisted learning
meaningfully process the relationships between semantically congruent screens of
information. Unlike standard hypertext which is geared towards making screen to screen
transitions as smooth as possible, StrathTutor attempts to turn the access of a new screen
into a problem solving exercise; one of the learner's tasks during the interaction is to
make sense of the relationships between the different screens. By actively encouraging
learners to make sense of the relationships, StrathTutor provides an environment that
demands meaningful, active processing; something which many hypertext systems tend
to ignore.
StrathTutor, however, encompasses attributes that lie outside the hypertext model, and
although an interesting system, is really something different. In the final analysis, there
are perhaps two substantive reasons as to why hypertext is useful for learning:
• Hypertext allows learners to direct the interaction themselves,
Hypertext allows information to be accessed rapidly.
Even these supposed benefits, particularly the first mentioned, are not without problems,
in the next section I discuss some of the problems with hypertext that have been
observed.
2.5.3 Problems with hypertext
Hammond and Allinson (1989) outline five problems with using hypertext for learning:
First, users get lost, The knowledge base may be large and unfamiliar; the linksprovided are unlikely to be suitable for all learners and for all tasks.. .Second,users may find it difficult to get an overview of the material. They may fail to seehow parts of the knowledge base are related and even miss relevant sectionsentirely. Third even if learners know specific information exists they may havedifficulty finding it. The knowledge base may not be structured in the way theyexpect, or their lack of knowledge might mislead them. ...Fourth, learners mayramble through the knowledge base in an unmotivated and instructionallyinefficient fashion. The materials may not provide sufficient tutorial guiduice forlearners to ask themselves the right questions or to help them to formulate or attainto their goals. Finally, coming to grips with the interface for controlling thevarious facilities may interfere with the primary task of exploring and learningabout the materials.
In the following sections I discuss each of these problems in turn
2.5.3.1 Getting lost
One of the problems that hypertext researchers quickly came up against was how user are
able to find information in hypertext information bases, when the goal state is not
specified as an option on the currently viewed screen. Obviously a default top-level
35

Computer assisted learning
access screen such as a table of contents screen could be made easily accessible, but this
can only list a finite number of topics which may have a potentially infinite number of
descriptors. Due to the strong spatial metaphor that has become associated with hypertext
this problem became known as one of navigation. The comparison is often drawn
between navigating hypertext and finding your way around an unfamiliar city; both tasks
may require you to achieve some goal (find some information, or find a say a railway
station); there are various means of reaching your goal state (following hypertext links or
walking along streets); and some clues as to how near you are to the goal and possible
routes to it (the information currently displayed may seem relevant, signposts may be
indicate possible directions). Cities however often contain fewer possible options than a
large hypertext system, after some time wandering round an unfamiliar city we will often
encounter areas that we have seen before, and because of the strong visuo -spatial cues in
the shapes of buildings etc. choosing alternative options becomes progressively easier as
we build up a mental map. With hypertext it is often extremely hard to acquire such maps
due to the lack of such cues (Fiderio, 1988) and disorientation may occur. As Elm and
Woods (1985) claim, navigational problems occur because of:
"The user not having a clear conception of the relationships within the system, orknowing his present location in the system relative to the display structure, and[thus] finding it difficult to decide where to look in the system."
Disorientation manifests itself as confusion and frustration and leads to time being wasted
wandering round the information base, reducing the effectiveness of the system.
Thus hypertext's great strength is also its Achilles' heel, it is just the lack of linearity, the
flexibility of the medium that leads to problems of disorientation (Conklin 1987).
Attempts to overcome the problem of disorientation haNt tended to either give the nstr
more cues in order for them to orientate themselves; such as maps (Foss 1987, Hammond
& Allinson 1989), or other spatial cues (Fiderio 1988); or to attempt to 'linearize the non-
linear' by providing paths through the information relating to a specific goal. This not
only aids the access of material, it may aid learners to develop some type of mental map
(Edwards & Hardman 1989; Zellweger 1989), which can enable to find their way around
more easily. These linear paths were dubbed 'guided tours' by Hammond & Allinson
who extended the spatial metaphor comparing an interaction with hypertext (in this case
with an educational purpose) to travelling round a foreign country; users (or tourists) can
either 'ramble' on their own; going where they please, or opt to take a guided tour where
the system 'selects' an itinerary of interesting topics for them to see based around some
theme. Guided tours have the effect of linearizing hypertext, however in the
implementation developed by Hammond & Allinson; The Hitch-Hiker's Guide, tours are
only one way through the material, during at any point the tour can be suspended,
allowing full use of all the other access facilities. There are many other approaches to
36
Computer assisted learning
aiding the learner's task of finding their way around large hypertext information bases,
see Section 2.4.5.2.
2.5.3.2 The implications of disorientation for learning
Disorientation of varying degrees is bound to have an effect on learning, most generally
this is taken to be a negative effect: disorientation prevents learners from getting where
they want to go; it slows down the access of meaningful and relevant material; it confuses
and bewilders the learner sapping their patience and eroding their motivation to learn.
Additionally, the demands that the system makes on the learner to continually choose
where to go next, may result in 'cognitive overheads' (Wright, 1991; Jonassen and
Grabinger 1990); learners spend so much time choosing and navigating that they have
little time to devote to reading and learning the information.
Kibby and Mayes (1991) take different line on disorientation, they suggest that the
process whereby learner actively seeks recovery from being lost can actually be a positive
learning experience. They give the example that an effective way to learn your way
around a strange city is to get lost and then have to find your way again. Thus getting
lost in hypertext may force learners to consider the organisation of the hypertext system
more closely, which may give them more of an idea as to the way that the domain
information is organised. Such a learning experience may only arise if the structure of the
hypertext system corresponds to the structure of the domain closely, without this
mapping the learner may be misled into making false inferences about the relationships in
the domain itself. Kibby and Mayes here draw a distinction between hyperspace: the
general framework of the hypertext system; and conceptual space: the actual conceptual
interrelations. Only getting lost in conceptual space would have any educational benefit,
so it is suggested that hyperspace follows the structure of conceptual space as closely as
possible. The notion of getting lost as being a positive learning experience can again be
attributed to constructivist epistemology and we shall return to this notion aga ; n when
concept mapping tools are considered later in this chapter.
2.5.3.3 Comprehension failure
There are few explicit reasons as to why hypertext should be useful for learning, there
have been some vague allusions to the fact that because hypertext is basically an
associative network, a form of representation that had been used to model human
memory. Cognitive interpretations of learning and memory emphasise the interconnected
nature of knowledge is represented in a 'tangled hierarchy' (Anderson, 1983); this has led
to the assumption that because hypertext explicitly represents information in a network it
37

Computer assisted learning
signals the conceptual relationships, hence enabling learners to more readily understand
and integrate the information. Such assumptions may well be true, but there is some
doubt as to whether novices can make sense of all the interconnections and therefore
construct some form of coherent overview. Text typically has a wide variety of structural
patterns that provide information such as where the text is going, providing integrations
between what is currently being read and information that the reader has encountered
before, or information that they will encounter later on. Such cataphoric and anaphoric
references are just one of the various signals made explicit by text, are based upon the
assumption that the text will be read left to right, top to bottom, front to back. It is
suggested that when these structures are removed that comprehension will become
problematic. Gordon, Gustavel, Moore & Hankey (1988) compared the effectiveness of
hypertext presentations of technical and non-technical topics with conventional linear
tutorials. They found that when subjects were later asked a series of questions which
required them to recall information from the texts that recall was significantly higher in the
linear conditions both for basic factual information and for information requiring them to
integrate the material. Subjects also expressed a preference for the linear presentation.
Indeed in studies where text and hypertext have been directly compared no study shows
that hypertext has any advantage over text for comprehension or learning.
Studies such as the ones above should not be seen as indicating that hypertext can never
be more effective for the delivery of instructional materials than standard text; there is
likely to be an interaction between comprehension and the level of domain specific
expertise. For example Kintsch's (1987) text comprehension model, the Construction-
Integration model predicts that non-linear representations may be useful when the learner
have some understanding of the domain (Folz, 1991). The argument here is that
knowledgeable users may be able to use content specific markers in the hypertext to
signal structure, rather than explicit structure.
2.5.3.4 Problems with access
Folz's point, above, also has a bearing on the ability of learners to access known material
(Hammond and Allinson's third point). Generally hypertext systems tend to be
structured with respect to the conceptual interrelationships of the particular domain; whilst
access may appear logical to someone who understands the subject, it may afford little
help to novices. This tends to contradict the stance taken by Jonassen and Grabinger
(1990) who refer to hypertext as the ultimate accretion medium, using Rumelhart and
Norman's interpretation of the term. Jonassen and Grabinger argue that the structure of
hypertext is tailor-made for novice to build up a workable understanding of the topic area.
In contrast it appears that hypertext is more of a medium for tuning, whereby learners
38

Computer assisted learning
with well developed domain schemata can use the non-linear structure effectively to
access relevant information.
2.5.3.5 Inefficient learning strategies
The connections in hypertext mean that learners can access material with only minimal
knowledge of what it is they are looking for. This is achieved by browsing, following
the various links that are present within the information itself. Users can follow links,
perhaps denoted by keywords, that seem to indicate the sort of information that they are
interested in finding out about. It is a heuristic strategy akin to a game of 'hunt the
thimble' where the similarity of present information to the goal informs the user as to
whether they are getting 'warmer' or 'colder'. It may be inefficient in terms of the time
taken: many blind alleys may be followed, and there is no guarantee of the goal being
reached; however it is useful in the sense that it will often result in success, when all other
attempts have failed.
Marchionini (1988) states three reasons as to why hypertext users browse:
"Firstly, they browse because they cannot, or have not defined their searchobjective... Second, people browse because it takes less cognitive load to browsethan it does to plan and conduct an analytical, optimised search... Third, peoplebrowse because the information system supports and encourages browsing."
Marchionini's third point illustrates that not only does hypertext permit browsing, but the
various on-screen affordances (see Ga yer, 1991) positively encourage the learner to
browse, irrespective of whether or not it is the most sensible strategy to adopt.
Additionally Hammond (1993) points out that very often hypertext can offer mis-
affordances in that buttons or active text tend to remain on-screen irrespective of whether
the learner has seen the information has been seen before; causing looping, or whether the
information is relevant to the learners goals. Such affordances may therefore actively
detract from the learner using their own goals to drive the interaction. McAleese (1989)
states that browsing should be purposeful, and that the design of the system can, in some
respects, support the user in their task to find information, by providing meaningful
structure to enable successful navigation. However, often hypertext consists of a mass of
interconnections that have no contextual sensitivity: one button looks pretty much like
another. A learner who is uninformed with respect to the domain is going to find
information seeking difficult. Not surprising, therefore, that learners often find that
browsing is the only realistic option open to them. This may have severe effects on the
quality of the learning experience, as it may side-track the learner resulting in them
covering irrelevant material.
39

Computer assisted learning
Suchman (1987) argues that many behaviours that seem planned are in fact the result of
situated actions caused by responses to changes of state in a system. The way that we
use a photocopier, to use Suchman's example, is not the result of plan following
behaviour, rather it consists of a sequence of actions in direct response to the particular
demands of the system itself. Whether this theoretical orientation is correct is up for
question, however it is certainly the case that often our behaviour is determined to a large
extent by the prevailing environmental conditions. Hypertext offers many things for the
learners to do, but often these things are not designed to have any instructional value
other than leading to extra information screens. If learners are to learn then they need to
take charge of the learning themselves by making summaries, testing themselves,
drawing overview diagrams and so on. The result of this is that learning from hypertext
places demands on the learners meta-cognitive learning strategies, in order for them to
learn the information in an effective manner. As Hammond and Allinson indicate,
learners rambling in an instructionally inefficient way, for example merely reading the
information, may result in them being able to recall very little after an interaction.
2.5.4 Summary
As well as inheriting problems from standard texts (such as passive learning) hypertext
also bring new problems to the use of text (such as disorientation, lack of clear structure
or narrative, poor integration and so on). The romantic view of hypertext that learners
explore conceptual space, integrate concepts and reflect upon the nature of these
integrations is rather too good to be true. What seems to happen, at least with domain
novices, is that they often fail to see the relationships that connect screens of information
because they are too busy reading text, clicking buttons, trying not to get lost and so on.
Furthermore hypertext does not focus the learners attention upon relationships, it
positively conceals them behind a 'Go to' button. Additionally many of these buttons are
not conceptually relevant, for example a button bearing the legend 'More' probably has
more to do with limitations on screen-size than any conceptual relationship. Unsurprising
that learners quickly abandon trying to infer relations, if they ever did in the first place.
Hypertext does not therefore support or encourage directed reflection, the interaction is
often anything but directed and the requirement to reflect is often nil.
These problems have led to a number of attempts to improve upon the basic hypertext
model in various way to increase its educational effectiveness.
2.5.5 Supporting learning from hypertext
We have seen that there are a number of problems with the use of hypertext in education,
some of which are a result of the specific features of hypertext, and some of which it
40

Computer assisted learning
inherits from its paper-based ancestors. The passive nature of hypertext is something that
is true for all text as text does not require the learner to engage in effective learning
strategies. The disorientation problems and lack of coherent structure, however, are
problems that tend to be specific to hypertext itself.
A number of methods have been used to aid learning from hypertext, the simplest involve
providing learners with quizzes to encourage active learning; more complex approaches
attempt to marry hypertext to artificial intelligence techniques.
2.5.5.1 Quizzes and questions
As was indicated earlier, the use of multiple choice questions in CAL dates back to some
of the earliest systems. Well designed multiple choice questions, with appropriate canned
remediation if the answers are incorrect and explanations for correct answers, can be a
useful addition to hypertext, and have been implemented in a number of educational
hypertext systems such as The Hitch-hiker's Guide (Hammond and Allinson, 1989).
Quizzes can encourage learners to test themselves, thus making them more active
learners, they can also serve to identify misconceptions and may encourage learners to be
more goal oriented: answering a question can serve to direct learners' efforts to answering
the question. Such facilities are, however, seriously limited: they can only accommodate
a subset of learners' goals, and remediation in the form of corrective feedback is either
primitive or non-existent. Since the system does not 'understand' the questions, it is
impossible for the system to effect responses that the author had not explicitly encoded
into the system during development. This problem was a motivating factor behind the
application of Artificial Intelligence techniques to educational computing. Some of these
techniques have also been applied to hypertext-based CAL systems.
2.5.5.2 Hypertext and artificial intelligence
Some developers of hypertext-based CAL systems have attempted to support the learner
by applying artificial intelligence approaches to hypertext. Most of these tend to be
directed at supporting browsing and information access by using search algorithms that
can extract certain contextually relevant subsets of information based on some measure of
the learner's goals (see Scott, 1993, for an example of this type of system). Other
approaches such as those suggested by Fischer (1992), use hypertext together with
knowledge mapping tools and critiquing systems to produce hybrid systems that aid
learning. Fischer's system Janus (Fischer, McCall and Morch, 1989) is a learning
environment designed to teach architects the rudiments of kitchen design, Janus contains
two components: Janus-construction, a knowledge-based construction component and
41

Computer assisted learning
Janus-argumentation, a hypermedia system structured with respect to argumentation.
Learners are allowed to construct potential kitchen designs in Janus-construction, using a
graphical interface; when design principles are violated the critics in the knowledge-based
component feeds information to the hypermedia system in Janus-argumentation, allowing
access to information relevant to the particular set of the domain relevant to the task.
Thus not only is immediate feedback presented to the individual, but some degree of
remediation fostered. Fischer's systems can be seen as falling in with guided
construction category of systems, offering a synthesis of intelligent tutoring principles
and the principles of open learning. In contrast to standard hypertext systems learners
engage with a task, rather than browse an information-base, the goals are therefore more
concrete as they are reified in some problem to be solved. This, perhaps, offers learners
a more engaging, motivating environment, with more scope for the recognition and
remediation of misconceptions. Currently it is a point of debate exactly when the system
should step in, as the recovery from errors of understanding can be useful in the
development of meta-cognitive skills, however it does appear useful for some form of
remediation and support to exist, rather than allowing learners to persist with
misconceptions, or to flounder with a problem in an unprofitable manner.
The aforementioned StrathTutor, although not based on strict AT techniques, attempts to
provide a reactive environment within which learners can explore conceptual space.
StrathTutor utilises the semantic distance between concepts within the hypertext as a
problem solving exercise; it is the learner's task to discover explicitly the relationships
between items of information.
2.5.5.3 User-created hypertexts
A final way in which learning may be facilitated places hypertext in a rather different role.
Instead of the learner accessing information to learn, the learner creates or modifies the
hypertext itself. As I pointed out in Section 2.4.2 merely following relational links does
not guarantee that the learner will think about the relationship, if the learner is required to
create the links themselves, it may at the very least get them thinking about the structure
of the information. Beeman, Anderson, Bader, Larkin, McClard, McQuillian and Shields
(1987), attempted to use the hypertext application Intermedia (Meyrowitz, 1986) in order
to foster what is known as pluralistic learning. Pluralistic learning means simply that as
well as learning given content material, learners also integrate ideas, form abstractions,
think critically and learn skills that may help them to do this more efficiently in the future.
The development of these critical thinking skills as they have been termed is embodied in
many educational cultures, particularly in Britain and the USA. Beeman et al required
learners to construct hypertext documents themselves, trying to relate the ideas together,
42

Computer assisted learning
form abstractions, derive generalisations and so on, thus engaging learners in processes
which may engender pluralistic learning.
2.6 DISCUSSION
There are a vast number of different approaches to computer-assisted learning, and it is
fair to say that there is not one approach which would serve as an educational panacea;
different approaches suit different educational demands. If our goal is to achieve directed
reflection then it appears that although intelligent tutoring may be a useful approach to
adopt, the effort required to formalise the requirements of directed reflection might be too
great. Approaches such as hypertext, whilst fine for presenting information in a textual
or graphical form to the learner are not really appropriate without much modification. The
demands that have shaped hypertext are not strictly speaking educational, rather they are
ones concerned with expedience. Some see hypertext as liberating the learner, freeing
them from the shackles of educational dogma, but as a number of studies have shown for
the domain novice hypertext is often less effective than the humble textbook. It seems
that the best view of hypertext is not as an educational system, but as part of an
educational system, used as a information resource in a way, perhaps, like that used by
Fischer.
Learners need to do something with the information in order to learn it, especially when
they have little or no domain specific schematic knowledge. The next chapter discusses a
method of getting learners to do something meaningful with information, presented by
various media, by using the techniques of knowledge mapping, and tools that embody
these.
43

3
Learning throughknowledge mapping
3.1 INTRODUCTION
This next section looks at possibly one of the more fruitful techniques for supporting the
directed reflection; the approach known as knowledge mapping. Knowledge mapping, in
its most basic form, is simply the construction by the learner of a graphical, network-
based representation of some area of knowledge. This knowledge could be material that
has been recently been presented to the learner, knowledge that the learner already knows
about, or (most commonly) some combination of the two.
Before I go on it seems appropriate to discuss briefly some of the terms that will be used
in discussing knowledge mapping tools. I use the term knowledge mapping as a generic
terms that subsumes all approaches to learning in which the learner tries to map out their
knowledge (or information) graphically. This therefore includes lots of other terms such
as cognitive mapping, semantic networking, concept mapping, mind mapping and
knowledge structuring, all of which have been used by other authors. The reason for
using knowledge mapping is that it is fairly neutral, making few bold claims as to the
nature of the activity, representational formalism or tool. Concept mapping, for example,
relates to Novak and Gowin's approach, which uses hierarchically structured
representations; semantic networking relates to Fisher's SemNet; and knowledge
structuring is a term that I use to refer to more structured tools such as gIBIS and Euclid
(see Chapter 5).
Two distinct evolutionary routes can be traced in the development of computer-based
knowledge mapping tools: many of the tools known as concept mapping tools derive
from Ausubelian constructivism, whereas other tools derive attempt to support various
tasks by allowing the manipulation of information rich objects. Some of the last-
mentioned tools are discussed in Chapter 6, and include various systems designed to
44

Learning through knowledge mapping
support argumentation, authoring and decision making. However, for the moment I shall
concentrate on those tools that are specifically designed to support learning.
Perhaps the first advocate of knowledge mapping as an approach to learning was Joseph
Novak (Novak and Gowin, 1984) in his work on concept mapping. Novak and Gowin
define a concept maps as: "...a schematic device for representing a set of concept
meanings embedded in a framework of propositions." (p. 15) Novak's notion of
concept mapping draws heavily from Ausubel's (1968) theory of learning and education,
and it seems profitable at this point to say a little about this theory.
3.2 AUSUBEL'S INFLUENCE ON CONCEPT MAPPING
Ausubel's theory, like more recent ventures (Thagard, 1992; Chi, 1993; see Section
1.3.3) emphasises the role of concepts and conceptual structure in the process of learning
and understanding: "Meaningful learning is so important because it is the human
mechanism par excellence for acquiring and storing the vast quantity of ideas and
information represented by any field of knowledge".
Ausubel has an affinity for speaking about concepts: "...man lives in a world of concepts
rather than in a world of objects events and situations" (Ausubel, 1968, p 505). Ausbel
believes that we understand the world through concepts and their relationships; indeed, as
the previous quotation highlights, the world that we inhabit is our concepts, and since we
all have slightly different experiences, we all inhabit slightly different worlds.
The key to Ausubel's theory is what he terms subsumption, which provides both an
account of conceptual learning, an explanation of why things sometimes go wrong and,
to an extent, prescriptions as to the best way to teach and learn. Subsumption is simply
the process whereby concepts become subsumed under more inclusive and general
concepts. In some forms of subsumption, both the general and more specific concepts
remain; in other forms, so called obliterative subsumption the general concept entirely
replaces the specific ones. Obliterative subsumption is seen as a mechanism for affording
economy of storage space, but in fact it is a bit of a double-edged sword. If the specific
concepts are entirely derivable from the general concepts (so-called derivative
subsumption), then obliterative subsumption might be of some use. For example if you
learn that a whale in a mammal and that all mammals suckle their young, then there is no
need to store the attribute of suckles_young at the level of whale; it can be subsumed
under mammal and derived (or inherited) from the general concept. However, often the
subsumed concepts are not entirely derivable from the subsumer—so-called correlative
subsumption. For instance, if you make the (not entirely correct) inference that all
mammals give birth to live young and store this at the general 'mammal' concept, then
45

Learning through knowledge mapping
incorrect predictions would be made in the case of the platypus; sometimes it makes sense
to store attributes as specifics rather than generalities. In order to best aid conceptual
development and encourage obliterative subsumption when it is useful and discourage it
when it might cause problems, Ausubel proposes a number of heuristic principles for
teaching and learning. These are: progressive differentiation, integrative reconciliation
and consolidation.
Progressive differentiation. Information should be presented to the learner from the most
general, inclusive level to the most specific; something that Ausubel views as a natural
process of the cognitive system. Hence we should be taught what mammals are before
we learn what platypuses are, and presumably we should learn about typical mammals
(dogs, apes) before we learn about atypical mammals (platypuses, whales). The purpose
here is to ensure that we obliteratively subsume useful concepts (suckle_young,
warm_blooded) rather than incorrect ones (lays_eggs and so on). This prescriptive
method contrasts with that of Glock (1967) who argues that the reverse should be
sought, details being presented before higher level abstractions; something that is also
argued by adherents to situated learning (Brown, Collins and Duguid, 1989).
Integrative reconciliation. Ideas and concepts may be acquired by the learner under many
circumstances and under different names, and often the relationships between these
concepts is not made explicit in the educational environment. The result of this,
according to Ausubel, is that the learner stores far more information than is necessary,
and knowledge becomes unduly compartmentalised. Integrative reconciliation states that
the instructor should serve to aid integration by either stating integrations explicitly in the
form of overviews, or encouraging the learner to do so.
Consolidation. The last of Ausubel's principles discussed here is consolidation. This is
the insistence that learners understand well a particular topic before going on to the next.
This would flow naturally if obliterative subsumption is to be avoided Recall that
obliterative subsumption is the result of new knowledge being integrated inappropriately
with old concepts, such that the subsuming concept stands for the whole of the one
subsumed. Ausubel argues that consolidation should be achieved by feedback, practice
on different tasks and repeated exposure to learning material.
Novak and Gowin's form of concept mapping is a meta-learning activity that rigorously
implements a number of Ausubel's principles in the form of a number of conventions that
effect both the appearance of the completed map, and the process by which a map is
constructed. The notation, in accordance with Ausubel's contention that conceptual
structure is hierarchical, is hierarchically based: going from the most general concept at
the top of the page to the most specific at the bottom, concepts are enclosed by ellipses,
46

Learning through knowledge mapping
and the links represented by solid lines. Non-hierarchical relationships are permitted but
requires a different form of notation. Cross links between concepts on the same level,
for example, must be drawn using dashed rather than the usual solid lines; additionally,
things that are not concepts such as specific instances and examples are enclosed with
dotted rather than solid ellipses (see Figure 3.1). Thus the distinction between
hierarchical structure and other forms of structure is preserved.
f..,.• '
, • .....
;. my phone number .1
"•• .................. ••''
E.g.
. ..................... ..
• paris is the capital of ....1france ...• 1
•••• .................... ••
Figure 3.1 Novak-Gowin style concept map showing hierarchical structure, hatchedcross-links and dotted instance ellipses.
The process of construction is also regulated. Learners start with the most inclusive
concept relevant to their task and work downwards to the most specific; any links
between concepts are requested to be stated before moving down to the next level, in
accordance with Ausubel's principles of integrative reconciliation and progressive
differentiation.
It should be apparent that the Novak-Gowin version of concept mapping requires rather
more of learners then simply to map out their ideas using nodes and links; it is in fact a
meta-learning strategy that students need to learn before they can map effectively. In
particular the importance of training and practice is emphasised: Wandersee (1991)
estimates that it can take eight to ten weeks before a student can use the strategy in an
educationally effective manner.
47

Learning through knowledge mapping
3.3 COGNITIVE ACCOUNTS OF KNOWLEDGE MAPPING
Not all advocates of knowledge mapping use Ausubel's principles of learning. For
example Kozma, (1992) a co-developer of the 'ideas processor' Learning Tool, takes a
more cognitive interpretation of knowledge mapping. According to Kozma, there are
three limitations on our ability to learn: the limited capacity of working memory; the
difficulty in retrieving needed information from long-term memory; and the inefficient of
ineffective use of cognitive and meta-cognitive strategies to obtain, manipulate and
restructure information. Knowledge mapping tools can be used by learners as an external
aid to both long and working memory: learners can note the contents of working memory
using concepts and text, and link in ideas that may be retrieved during the note making
process.
Fisher (1992) also uses cognitive science to justify the knowledge mapping approach'.
She sees knowledge mapping as supporting a number of factors in learning:
(1) The acquisition of both conceptual and relational knowledge by the activity of
naming and linking concepts.
(2) Permitting the learner to see their concept map from different perspectives.
(3) The progression towards more expert-like knowledge structures by browsing
expert maps and comparing them to their own.
(4) Aiding the reflection on their knowledge by examining it reified in a semantic net
by using (2) and (3) above.
(5) The development of knowledge representation strategies. All of these are
subsumed within:
(6) Fisher also claims that concept mapping can be useful in the sense that it allows
the instructor to get a more adequate, explicit idea of the sorts of beliefs that student has
about the topic area, in her words they offer the instructor "a window on the students'
mind".
In the next section I assess some of the claims that have been made for the effectiveness
of concept mapping.
1 Fisher, one of the developers of SemNet, uses the more specific term of semantic networking.
48

Learning through knowledge mapping
3.4 AN ANALYSIS OF CLAIMS FOR KNOWLEDGE MAPPING
Knowledge mapping researchers make three claims for the potential outcomes of concept
mapping activity, no matter what theoretical stance they adopt, these are:
(1) Knowledge mapping improves retention of information.
(2) Knowledge mapping fosters a deeper understanding of domain knowledge
(3) Knowledge mapping aids the development of meta-cognitive skills.
Different researchers tend emphasise different aspects of knowledge mapping. Kozma
and Fisher tend to emphasise the first and especially the second of the above points;
Buzan (1993) pays particular attention to the first point; whilst McAleese (1994)
acknowledges the role of knowledge mapping in the development of self-regulatory
skills. Finally, Novak has much to say about all three. Of course separating the claims
out like this is artificial from a psychological point of view. We know that, for example,
any tool that improves understanding is likely to have a concomitant effect on retention—
schema theory tells us this (Dooling & Lachman, 1971, see section 1.3), although this
does not necessarily work in the opposite direction. In the next few sections I investigate
some of these claims with a view to ascertaining what factors might give rise to these
outcomes.
3.4.1 Knowledge mapping improves retention
There may be many routes by which retention can be aided, having a deeper
understanding is one way, since I deal with this in Section 3.4.2, I shall look here at
mechanisms that more or less aid retention directly.
Depth of processing (Craik & Lockhart, 1973) is a principle that is related to the retention
of information. Put simply if subjects have to think about the meanings of concepts then
it is more likely that will be recalled at a later date (providing the meaning is required in
recall) than if the meaning is not thought about. Simply, one of the arguments that has
been put forward for concept mapping is that it forces the learner to think conceptually in
the action of creating and naming nodes and linking them together (Mayes, 1992).
Another psychological principle that Mayes invokes in support of concept mapping is
known as the enactment effect. This states that superior recall of the names of objects
presented to a subject is obtained if the subject does something with the object rather than
just imagines that they perform the action; for example a match may be presented to
subjects and they might be instructed to break the match.
49

Learning through knowledge mapping
Both of these principles seem to work as a result of other information that the to-be-
remembered item is elaborated with: meaningful processing relates the target item to
semantically related information, whereas performing and action encodes sensory-motor
information as part of the event. Elaborations, work by increasing the number of
retrieval paths to the target item. Mayes quotes Craik and Tulving (1975) who state that
people remember not what was 'out there' when they are learning, but what they did
when they were encoding the information; something which accords with this retrieval
cue account of the enactment effect and levels of processing.
Both these two principles relate the storage of information in episodic memory—memory
for concepts stored as part of the event itself rather than semantic memory, which is
information abstracted from the actual means and context of encoding.
3.4.2 Knowledge mapping fosters understanding
In Chapter 1 I made the point that there is often a dissociation between what teachers
teach and what learners learn, and often neither party realises that there is a difference
until the misconception manifests itself as a consistent error. Chi (1993) argues that often
these misconception arise as a result of the learner failing to have the correct
representational framework in which to correctly categorise the concept. Lack of an
appropriate ontological framework is only one reason why mis-categorisations occur; it is
also conceivable that a learner may possess the correct background knowledge, but for
some reason fails to integrate the new knowledge in an appropriate manner. One reason
why this may occur is by over-extending a initially useful analogy, such as seems to
happen in the 'flowing water' model of electric current. But perhaps a even more
common reason is that learners simply do not consider other potentially useful
integrations. There are two reasons why this may occur: first, restrictions on working
memory means that only a small number of things can be thought about at any one time,
Kintsch and vanDijk (1978) estimate this may be no more than around four propositions
(and often fewer); second, there is little guidance as to which, from all the set of
propositions one could consider, would be useful to them. It seems that knowledge
mapping might be of some use here.
Maps provide external support for working memory, by allowing learners to
visualise conceptual structure.
The activity of mapping encourages learners to explore relationships.
The map can be used to communicate ones understanding to others who can provide
useful directed feedback
50

Learning through knowledge mapping
I shall now discuss each of these in turn.
3.4.2.1 Visualisation
Visualisation tools have been used to great effect in a number of discipline areas.
Computer-aided design tools allow designers to visualise their work and get a better
understanding of the way that the artefact would work in practice. But tools for
visualisation pre-date the advent of the computer by many thousands of years. Wainer
(1992) discusses the impact of different representations on reasoning and problem
solving. He argues that the same information represented in different ways can have
differential effects on the sorts of inferences that we draw. He cites the example of John
Snow who made the link between cholera and infected water in 19th Century London.
This connection was established after Snow drew the locations of choleric homes on a
street map that also had the water stand-pipes marked; the outbreaks of the disease
clustered around the stand-pipes indicating a correlation between water and cholera. This
occurred because the use of a graphical representation effectively shouted out correlations
which may otherwise be hidden in a different representation.
Larkin & Simon (1987) elaborate this point. They argue that two representations can be
informationally equivalent (the same information can be represented in, for example, a
table, a pie chart and a histogram) but can be computationally distinct in that one enables
or encourages different types of processing, or makes different information salient.
Again one of the assumptions underlying this notion is that of the limited capacity
processor that is working memory. In order to solve, for example, a mathematics
problem in one's head, one would have to keep in mind the numbers to be manipulated
together with any partial results that may be needed in the course of solving the problem.
The more numbers that needed to be kept in memory, the harder the problem would be in
terms of the speed and accuracy of the solution. The fact that certain people can perform
extremely complex calculations mentally relates to the fact that they have learned
automatic ways of dealing with the information that enables them tc. devote tno&e of theit
limited capacity to solving the problem in hand. People, however, rarely solve complex
problems solely in the head; they use the environment to supplement working memory.
At least one of the benefits of graphs over tables is that trends can be deduced without
having to compare the numbers by storing them in working memory. The graph
effectively does this work for the solver. A further reason why graphs may be better than
other representations relates to the fact that they are in a visual modality. Perceptual
representations such as size and proximity can all immediately signal certain things about
information being represented such as the magnitude of an effect or relationships between
entities denoted by the graphics.
51

Learning through knowledge mapping
Knowledge maps can make use of many of the graphical attributes described above.
Links can indicate relationships in a very direct way, node-size might be used to indicate
importance or magnitude, and colour (or shading) can be used to make certain parts of the
map directly salient to the learner (or other people who might read the map). Many of the
tools and methods described in this chapter use some of these methods. TextVision 2D
uses node-size to indicate the significance of conceptual entities; Novak and Gowin's
concept mapping technique uses solid and broken lines to differentiate hierarchical from
non-hierarchical structure; and most can use proximity and links to designate
relationships.
An equally important attribute of schematic representations is that they only represent
certain types of information. A well-drawn sketch map of a route can be more effective
than a detailed ordinance survey map in route finding because it only contains information
that the use will need (left and right turns, traffic lights and so on) rather than burying this
information amongst irrelevancies. In the same way knowledge maps require only
certain types of information to be represented, the learner is invited to think only about
certain aspects of the information that is presented to them in the learning material such as
hierarchical or causal relationships.
3.4.2.2 Supporting relational thinking
Often people's conceptual understanding of a topic is attenuated by the fact that they may
not have considered the relationships between certain conceptual entities with the result
that their knowledge becomes compartmentalised; they fail to see the wood for the trees.
Knowledge mapping with its focus on relational thinking encourages learners to think
about how concepts that are seen as isolated entities may fit in to the overall picture.
Sometimes this activity is facile, but often it forces a search deep into deep into their
knowledge about the entities to come up with a possible relationship. Failing this it may
even encourage the learner to read more, or discuss the problem with a teacher or with
another student (see Section 3.4.2.3). One of the students participating in tile study
reported in Chapter 10 stated that this was one his over-riding memories of the exercise.
Often the process is described as making tacit knowledge explicit; and indeed a great deal
of the knowledge engineering literature is concerned with this goal using techniques such
as conceptual sorting (Kellogg & Breen, 1987) and the repertory grid (Kelly, 1955) to
elicit the rules and concepts that experts use. Psychological studies also show that a lot
of practical knowledge is often difficult for the individual to articulate (Berry and
Broadbent, 1984; Broadbent, Fitzgerald and Broadbent, 1986; see Section 1.2); it could
be that by requiring explicit statements of knowledge in map form that learners are forced
to reflect on the categories and structures that they use in certain situations. Knowledge
52

Learning through knowledge mapping
mapping can therefore be seen to aid the acquisition of structural knowledge (Jonassen,
Beisser and Yacci, 1993) which is explicit declarative (and therefore verbalisable)
knowledge about conceptual structure.
Whilst the above might be true, it is also true that knowledge mapping will suffer from
the cognitive indolence that prevents people from considering relationships in the first
place (although perhaps not quite as much). Recall that one of the arguments in favour of
knowledge mapping is that learners do not often normally consider relationships because
it is computationally expensive to do so. The same will undoubtedly apply here. Given
the task of thinking about a relationship between two concepts, it is conceivable that the
learner might give up, leaving a plain unlabelled link, or default to some woolly term
("relates_to" is a popular hedge). Simply knowledge maps might focus attention on
relationships, they may even facilitate it by bolstering working memory in the ways
described above, but when it comes to a difficult concept there is no way of ensuring that
the learner follows it through to the end.
Finally, there is another possible criticism of knowledge mapping that would see
reducing everything to a simple structure of nodes and links as potentially pernicious:
learners would be encouraged to see a complex world as nothing more than a set of
simple relationships. Laurillard (1993) aims a similar criticism at hypertext stating that it
destroys the structure of text. Her argument is that text as it appears in books is not only
richly interconnected, but that these connections are often very subtle. By making
explicit these subtle links she accuses hypertext of destroying the subtle structural
nuances that appear in text. Is this also the case with knowledge mapping? Possibly so:
typical propositions in knowledge maps use single or few words such as "is_a",
"relates_to", "causes", whilst normal text can use longer phrases and express more subtle
relationships. Any text can be turned into a concept map but something will undoubtedly
be lost. This is, however, less of a problem for knowledge mapping as it is for
hypertext. The purpose of concept maps is to be simpler than the text it represents, they
represent not the text but a subset of the ideas that the text conveys, they are abstractions;
this is the source of their power. When one presents information one does not merely
want to give the learner abstractions, as any abstraction will only tell part of the story.
Hence if Laurillard is correct in her assertion, it is a problem for hypertext, not for
knowledge mapping.
3.4.2.3 Supporting cornmunication
The final route by which knowledge mapping can impact understanding is an indirect
one; but may be of great importance for a number of reasons. Techniques such as
concept mapping and tools such as SemNet, Learning Tool and TextVision are not
53

Learning through knowledge mapping
designed to be private strategies, they are designed as a whole new method of teaching
and learning that lies alongside more traditional educational practice. Central to this role
is the notion of formative evaluation. Formative evaluation is an attempt to evaluate
learners with the intention of using the product of the evaluation to guide further
intervention; it is contrasted with summative evaluation which is used only to grade
students in some manner. One of the great problems with any type of effective formative
evaluation is that it is very difficult to elicit from the students the specific sort of
remediation that they might need; we saw in Chapter 1 that superficial behavioural errors
are often the result of deeply entrenched underlying misconceptions and that identifying
these is often not easy. Whilst not a panacea, knowledge mapping can often be an
effective method of understanding the way that a learner comprehends a topic. The
reasons for this are the reasons that knowledge mapping may be of use to the individual:
they are abstract, focusing on conceptual relationships; and they make apparent
relationships in a reasonably explicit way. Communication, however, places additional
demands on a knowledge map. If maps are for personal use only then, as long as they
are consistent, the learner can use their own idiosyncratic representation: colours, shapes,
symbols can be used to stand for a wide range of attributes and properties. When one of
the goals is communication then it is vital that some form of common syntax or semantics
is agreed upon in advance. In Novak and Gowin's concept mapping, the well-regulated
syntax serves not only to guide the learner to focus on certain types of relationships, it
also enables maps to be shared between different individuals: maps become public and
anyone be they student or instructor can offer advice, constructive criticism and feedback.
In many ways this shared function of knowledge maps may be their most powerful role
in aiding understanding, so long as the educational context is structured to optimise their
use, and the maps are structured to optimise communication.
3.4.3 Other factors
Finally, it should be mentioned that there have been claims that hint at the relationship
between the structure of information in a concept map and the structure of knowledge in
the learner's memory. Whilst no-one has gone so far as to claim that this similarity has
any relevance for learning—as some have claimed for hypertext (see Section 2.4.2)—
there is a temptation to consider that it may have. As for hypertext any putative
similarities between the structure of knowledge in memory and the structure of a
knowledge map are of no real educational benefit. We may see a knowledge map as
having something to do with the way that the learner understands the domain, but we
should steer clear of any beliefs of isomorphism. Knowledge mapping is a skill whereby
the learner translates their ideas into graphical format, just like essay writing is skill that
translates knowledge into text. There may be differences between essays and knowledge
54

Learning through knowledge mapping
maps in the degrees of freedom of the representation, but ultimately they involve similar
constraints in construction.
3.4.4 When concept mapping may not be effective
So far there are a number of positive claims relating to concept mapping but there are also
conditions under, which it is claimed concept mapping may not be effective. Fisher
(1992) argues that concept mapping is useful primarily for certain types of declarative
knowledge (or the type of declarative knowledge known as structural knowledge); it is
not so useful for aiding the acquisition of procedural knowledge, or declarative
knowledge that is conditional.
This is not a universally held belief in the knowledge mapping literature, Novak (1990)
argues that concept mapping can be useful for the tuning of procedural knowledge. He
states that concept mapping has been used successfully for increasing the performance in
the game of basketball (Novak & Gowin, 1984). Indeed, contradicting Fisher, Novak
states that he sees no reason for having procedural and declarative knowledge as distinct
epistemological entities. Whether Novak's theoretical stance is correct (there is mounting
psychological evidence to suggest that it is not—see Section 1.3.4), it seems entirely
possible that knowledge mapping may be used to aid the development of procedural
skills. Procedural knowledge is used when the contents of working memory contains
information that matches to the heads of production rules, on a very familiar overlearned
problem it is likely that environmental conditions will match directly to a particular
production, causing behaviour that is automatic. However, many other problems may
require some degree of interpretation before procedural knowledge can be used, which
can require some form of declarative knowledge. This will be particularly evident when
parts of the problems are poorly defined, or when the individual is non-expert. Expert
chess players almost certainly use a lot of procedural knowledge during the course of a
game, but because no two games will ever be quite the same it requires structured
declarative knowledge to interpret the moves and develop an effective strategy. It we can
develop more effective declarative knowledge structures, then it is likely that we will
increase our performance. Recall the research by Cooper and Sweller (1987; see Section
1.2.1) indicating that categorisation of physics problems (and knowledge mapping is in
some ways a categorisation task) can aid physics problem solving—a procedural type of
activity.
The real limitation on the effectiveness of knowledge mapping is the way that it is used.
As I indicated above, there is no guarantee that the learner will really explore their ideas;
there is the distinct possibility that knowledge mapping is no more than a direct
translation of what learners already know into few ovals and lines on a sheet of paper.
55

Learning through knowledge mapping
Learners need to be encouraged to think and reflect, and the use of computer-based
knowledge mapping tools might provide a tantalising method of attaining this.
3.4.5 Evidence for the effectiveness of knowledge mapping
There is a fair amount of evidence for the effectiveness of knowledge mapping, although
little of it tries to tease apart the potential varibles listed above and other variables that may
be of importance such as the feeling that knowledge mapping is some 'new' piece of
learning technology and potentially motivating effects that this might have (Hawthorne
effect). Some of the variables are very difficult to control for, particularly in naturalistic
environments, and since some of the research is conducted by educators, why should
they bother why it is effective so long as it is effective (providing it is not a manifestation
of the Hawthorn effect). Jedege, Alaiyemola and Okebukola (1990) found that concept
mapping had a marked increase on biology aptitude tests over standard expository
lectures; Mitchell and Taylor (1991) showed that it could increase comprehension from
text when compared to subjects not using the technique; and Beissner (1992) showed that
concept mapping had a positive effect on problem solving exercises when compared to
learners left to their own devices.
The reason that concept mapping seems to have an effect where other study techniques
fail (see Section 1.5) is that it simply gets learners to focus their attention on aspects of
the learning materials that they might otherwise not consider so deeply. All knowledge
mapping asks of a learner is to think of a suitable way in which concept 1 relates to
concept 2. Anyone with a rudimentary knowledge of what concept 1 and concept 2 are
could hazard a guess, or failing that go and look up the answer in a text book or ask
someone else. The important thing is that the question was asked and the learner spent
some time trying to answer it. Of course, this is not the only feature of knowledge
mapping (see above), nor is it a trivial act to think of relationships, indeed this is the
point, but the fact that the learner knows what to do when asked such a question is why
knowledge mapping has some effect when other strategies have little effect.
3.5 COMPUTER-BASED KNOWLEDGE MAPPING TOOLS
Concept mapping, in the Novak-Ausubel meaning of the term is something rather
specific; having a certain grammar that learners are instructed to accord with. None of the
tools that are discussed in the next section accord with Novak's grammar, and therefore
there is debate as whether they should be called concept mapping tools at all. SemNet is
termed a semantic networking tool, Learning tool is termed and ideas processor and Knot
is termed a knowledge organisation tool. However since all of these tools aid learning by
56

Learning through knowledge mapping
requiring the construction of node-link representations, they can, I believe, be discussed
alongside each other.
3.5.1 SemNet
SemNet (Fisher, 1992) is perhaps the most well-known of the knowledge mapping tools,
and incorporates a number of features and constraints that are designed to encourage the
learner to engage in effective learning activities. Fisher refers to SemNet as a semantic
networking tool rather then a concept mapping tool in the strict Novak sense of the
phrase, and it does differ in a number of ways from the Novak-Ausubel model. For
example, in SemNet learners construct networks, rather than hierarchical tree structures,
there being no difference between hierarchical and cross links. Concepts are of a single
type, represented by an ellipse; without the type-token distinction of concept maps2.
Other than this SemNet contains a number of attributes that transcend the limitations of
paper to support the learner in the creation of concept maps.
The default setting of SemNet displays instances which are node-link-node triples. The
view of these instances is limited to the central concept and its immediate neighbours;
resizing the window has no effect on the number of nodes that you see at any one point.
The developers argue that this is in order to focus the learner's attention on the
relationships that a single concept has with its neighbours, preventing the learner
becoming overwhelmed by the mass of nodes that may occur on other types of concept
mapping tool. In the default mode learners can browse the network by clicking on
peripheral concepts, causing this to become the central concept with its neighbours
shown. In addition to this default setting there are other views of the map that list the
concepts alphabetically, by creation date, by their degree of connectivity and so on. there
is therefore a plethora of different representation of the same information. See Figure
3.2 for an example.
Unlike the other tools discussed in this section, SemNet does not permit unlinked nodes
to be viewed in the default setting; the only way that they can be viewed is by linking the
node to another node thereby creating an instance. SemNet thus places great emphasis on
the process of linking, actively encouraging the user to link node (and therefore concepts)
together. When a link is created SemNet prompts the user to name the relationship
between the two concepts; link can be symmetrical or asymmetrical: symmetrical links
2 Interestingly the avoidance of representing type-token nodes also makes SemNet different from Quillian's
original model of semantic networks on which SemNet is supposedly based.
57

Leland Palmer.Sarah Palmer. Ronnette Pulaski . I
Figure 3.2 An example of a SemNet network relating to the "Twin Peaks" televisionseries. Note the central concept: "Laura Palmer", contains both text (the 'T') and graphics(the '13').
secret affair with
ran meals on wheels withboyfriend of
IDonna Heyward.)IF.................
best friends with
1 James Hurley . )
-.n•-..
Josie Packard. teacher toJohnny Horne• Dr Lawrence Jacobij
daughter of
working relationship with
patient of
Learning through knowledge mapping
have the same relation name in either direction, whereas asymmetrical relations must be
given different names for both directions.
For example if a node "Canary" is linked to a node "Bird" with the asymmetrical link
"is_a", then SemNet will not allow the instance to be created unless the user provides a
name in the opposite direction, e.g. "instance_or. It is claimed that this facility forces
learners to think bi-directionally and consider that asymmetrical relations must necessarily
work two ways. Whether this has any real educational value or is simply a result of the
way that SemNet's default browsing mode operates is uncertain. It could be argued that
this facility may actually impede a learner who is trying to represent some information by
continually requiring them to think about bi-directionality rather than allowing them to
proceed with the task in hand.
SemNet allows text and graphics to be inserted into nodes, but the amount of text is
limited to a few lines. Links can also contain text and graphics with similar limitations as
for nodes. The implication here is that SemNet is not really designed to support
annotations, rather it is designed as a sophisticated tool for constructing and manipulating
information at the conceptual level, with text being supported only for the purpose of
elaborating the concepts.
58

Learning through knowledge mapping
SemNet also provides facilities for the purposes of self-testing; for example the names of
nodes and relationships can be hidden so that the learner has to work out what a concept
or relation is by virtue of the elements that surround it.
In sum, SemNet is a very interventionist tool, it is not so much designed to support the
process of learning, rather it cajoles and coerces the learner into producing a well
specified map. This may be no bad thing. I outlined above that one of the main
weaknesses of paper-based knowledge mapping is that there is no requirement that
learners truly think about relationships; SemNet with its emphasis on getting the learner
to link nodes and name links may actually encourage reflection on conceptual
relationships. The real problem with this approach is that it is indiscriminate: sometimes
forcing reflection of this sort may be of real educational benefit, at other times it might get
in the way of potentially useful activities such as brainstorming a possibility that Fisher
recognised in later papers (Fisher, 1992). Perhaps a way around the problem is for the
system to adopt the principle of cognitive modes. There could be a 'brainstorming mode'
which allows learners to dump unspecified nodes and links, and another mode—that the
system may force upon the learner, which required the names of links to be specified as
above.
3.5.2 Learning Tool – an "Ideas Processor"
Learning tool (Kozma and van Roekel, 1986) is a concept mapping tool that differs in a
number of key ways to SemNet, which reflect its different intended purpose. Learning
Tool is an 'ideas processor' which means that it is designed to support the creation of
notes and the organisation and structuring of knowledge. Unlike SemNet, Learning Tool
supports text to a much higher degree, also unlike learning tool the portion of the network
that the learner can view is limited only by the size of his or her computer screen (see
Figure 3.3 for an example of a Learning Tool map). The difference between Learning
Tool and SemNet do not stop there; concept nodes can be created and viewed in the
default setting irrespective of whether they have been linked together, Learning Tool also
imposes no constraints as to the directionality of relation names for asymmetric links.
Again unlike SemNet, links can only be created between nodes; they cannot be created
independently.
One constraint built in to Learning Tool is that only three types of relation names are
permitted. Links do not need to be named, but if the learner wishes to do this then they
may assign different names to different thicknesses of link, and only thin, medium and
thick links are given.
59

Learning through knowledge mapping
MEMORY MasterList E MEMORY ConceptMap
Articulatory LoopPhonological storeControl process
CodingPhonemic similarity effectConrad and Hull, 64Temporal featuresWord-length effectSalome and Baddeley, 82Information accessUnattended speech effectBaddeley, Thomson & Buchanan,WORKING MEMORY
VSSP
IM—h7.5 prel—=- ,-1,111111111,1WORKING MEMORY Articulatory-Loop
hasp hash perty ierty pr
EM MO ifiaInformation access
pre 'ots
Coding Temporal features
pre 'cis pro pre "ots
ENE 174211 MIPhonemic similarity effect Word-len th effect
suppoied by suppo ed by
Unattended secct effect
suppo ed by
=I MN MConrad and Hull, 64 Salim and Baddeley, , 82 Baddeley, Thomson & Buchanan, 7
riri Li:,±iLLEATLii,EllEfElfilEififlaillEiffili
Figure 3.3 Learning tool concept map and masterlist windows
Whether this is a foible of the programming or a constraint that is perceived to have
educational value is unclear. Kozma and Van Roekel do not refer to this as a feature,
however given that later versions did not have this feature, it can probably be assumed
that it was a kludge. The argument could be made that by restricting the number of
available links the tool requires learners to be economical with the sorts of relations that
they use: this may encourage them to consider the relations more closely, rather than
generating a great deal of ad hoc relation names. However if this is the case it seems that
three names is rather too few even for simple examples.
Learning Tool also permits embedding, where maps are nested within higher-level
concepts. This facility is useful as it can be used to reduce clutter: enabling each map to
contain only the bare essentials, with more detail available at lower levels if required.
There is an obvious tension here: the more cluttered a concept map becomes, the more
difficult it becomes to read; on the other hand, placing concepts elsewhere can have
drawbacks since these it removes them from sight.
Learning Tool therefore places fewer demands on the learner than does SemNet, it does
not jump in requesting names for links every time a node or link is created; it simply lets
the learner get on with it. In some respects this could be seen as negative feature, it may
allow the learner too much freedom to produce poorly specified maps; on the other hand,
SemNet may be too keen to jump in and request names that the learner may not be
prepared to give. Fisher recognises this point stating that: "...assigning names to
relations is not a 'natural cognitive act' — that is, not a natural part of spontaneous
thought processes." (1992, p.73). As I shall discuss later, there are many features of
60

4Explorat on (Hypertext
\ 1 nformal I
Procedural
Learning through knowledge mapping
knowledge mapping tools that may be desirable under some circumstances, and less
desirable, or even harmful under others.
3.5.3 KNOT
KNOT (Dearholt and Schvaneveldt, 1990) stands for KNowledge Organisation Tool,
and can be used in a number of ways. Like SemNet and Learning Tool it can be used as
a simple interface tool allowing the construction of graphical representations of
information. Unlike traditional concept mapping tools it can also generate maps itself
based on information provided by the learner. As a simple concept mapping tool KNOT
is limited; representations are restricted to the node-link level as no text can be placed in
the nodes. Nodes can be named by the user, but links cannot, although the directionality
of the links can be specified.
What makes KNOT interesting is its ability to generate networks based on measurements
of semantic relatedness provided by the user. The system is given a list of concepts by
the learner or by an instructor and the system requests the learner to rate pairs of concepts
as to how similar they are using a nine-point scale. The system then generates a network
based on these judgements which - depending on the algorithm used, and there are
several - clusters closely related concepts and links these together. Figure 3.4 below
shows a sample network using concepts concerned with computer assisted learning
which were rated by myself and assembled by KNOT using a pathfinder algorithm. A
cursory glance at the network reveals that much of it makes sense, intelligent tutoring
being clustered with formal (knowledge), tutorial dialogue and expert systems; with
hypertext being placed with declarative, informal and exploration.
IDnI1 8. Pract ce I
Figure 3.4 An example Knot network based on approaches to educational computing.
Since the networks produced by KNOT do not contained typed links, KNOT can only be
used for organising information, providing a more explicit structure would require link
labels to specify the relationships. Unlike Learning Tool and perhaps SemNet, KNOT is
not designed to support learning, 'on the fly', rather it is designed to support reflective
61

Learning through knowledge mapping
processes after some time spent learning material. In fact although it deals in concepts
and conceptual relationships, KNOT really is a different species of animal to Learning
Tool and SemNet. Networks that are constructed tend to act as a snapshot of the learners
understanding at any one point rather than reusable, recursive structures that develop and
grow.
3.5.4 TextVision 3D
TextVision 3D is a concept mapping tool developed by Piet Kommers (see Heeren and
Kommers, 1991) as a method for 'visualising knowledge'. In accordance with other
developers of concept mapping tools, the rationale for the development of TextVision 3D
is based on constructivist premises: that learning from text is dependent upon the extent to
which learners can link new information to old; and, that what the learner understands is
not determined simply by the text, but by what they already know. In fulfilment of these
goals TextVision allows concepts to be manipulated and linked as per standard concept
mappers, it also contains some interesting features that allows relationships between
concepts to be visualised, more of which later. Perhaps the most immediate difference
between TextVision and the other tools discussed here is that the version tested allowed
objects to be moved in a simulated three dimensional space.
Like Learning Tool, and unlike SemNet, TextVision has a direct manipulation interface:
concepts, represented by circles, can be dragged around the screen by the mouse and
positioned as the learner sees fit; links are made by dragging between a pair of concepts
and so on. Again like Learning Tool, the nodes in TextVision can contain practically
unlimited textual information, accessed by double clicking over the appropriate node. In
version 1 at least, names could not be directly assigned to links. Directionality of the
links is not immediately available from the display. Earlier versions of TextVision,
which did not have the three dimensional representation, used the overlap of the links on
the nodes to indicate this, but this was abandoned for the version discussed here,
presumably due to the fact that overlap is used as a further cue to aid in the perception of
three dimensional shape. This is curious since directionality is a factor in the network, as
it is used in computing some of the functions discussed later.
Figure 3.5 shows the basic layout of the TextVision window. Note that the maps is
suspended above a grid that represents depth by perspective. The relative position of the
nodes in the virtual third dimension is shown in two ways: by the relative size of the
nodes, smaller nodes are further away than the larger ones; and by 'shadows' of the
nodes on the grid. Nodes are moved forward and backwards by dragging the shadows
with the mouse.
62

Learning through knowledge mapping
I'
1\go
0/ NO
Penguin
imal
b.
Mammal
411110 Carn.r.Y...
110Colour-yellow
MAIVAMMEMIIM• MEINnnn•nn••nnAMIAUMNIMMINnnIMILIN11111nnnnnMMAIMMI MN MIMI 1n1•nnnn•n•nnINI.MMIWUMMIMINERIMMMLIn••nn•nnAWA=InInIME/NUININ•11=INIMINIMMILINn
4nAnMWSIMINIII/MMIINIfl10•11•11111n11n•••nnnIWANNFAININ/MUNI•=1n11=MUMINIMIMILI=UmuCINIL
IIMIAMVIIIMIIWA,MA*(711=11n111n11MMINLIMWMaknaINNSEMIIMM=M1nn•n•nnn•n
nNIAPIRIBMIIIInIMINNIMME11n1=MMLIInn•nnn'.9.0c.:Alln•nnnnn1•1=11=1•nnnnnnnnn
n1110f,tAWMnAMM/MINI1nINIIMMNIn111=MININLInnnnnIMIAMIVOramerrac0477l 1I-.4404,--Ak Loom e-71nnnnnII/1=1Ms~401ImellilleM solloW*IMIUMNItmlowWnMnIn
Figure 3.5 An example screen from TextVision 3D, showing indegree similarity.
Perhaps the most important feature of TextVision, and that which sets it apart from its
siblings in the concept mapping family is that the system computes the degree of
centrality of a concept. A concept's centrality can be calculated by two means: by virtue
of the importance of the relations that go in to it, indegree similarity; and by virtue of the
importance of the relations that go from it, outdegree similarity. The indegree centrality
of a concept is a function of the degree to which that concept is indicated by other
important concepts. The metaphor here is with the notion that the importance of a
publication is a joint function both of the number of other publications which cite it, and
the importance of those citing publications. Indegree Centrality is shown in Figure 3.5
note that the concept 'Flies' is the most central (indicated by the darkness of the node)
because it had input from both 'Canary' and 'Bat', which themselves are quite central,
having input from 'Bird' and 'Mammal' respectively. Outdegree centrality is derived
Flies
63

Learning through knowledge mapping
from the degree to which a particular concept is used in explaining other concepts in the
network. Concepts have high outdegree centrality if they are used to explain other terms
within the network. In earlier versions centrality was represented by the size of the node:
the larger the size the more central the node. In the version discussed here, size is used
as a depth cue, so instead colour is used: central concepts are coloured red, peripheral
concepts are coloured violet, and intermediate concepts use the intermediate spectral
colours.
TextVision is again different from the other concept mapping tools described here. Like
Learning Tool it affords direct manipulation of elements; like SemNet it offers some
representation of conceptual centrality and degree of connectedness; like Knot it does not
allow names or types to be assigned to links. In reference to this last point it is likely that
in TextVision all links are supposed to mean the same thing, that is 'depends upon', or
'relates to'. Computations of centrality rely upon consistent link semantics. If the links
could be ascribed different meanings then calculating centrality would become
increasingly complex as the number of link types increased; offering the option for use
definable links may well result in the process of computation becoming intractable. This
is unfortunate as it will often be vital that the relationships be specified in order for
centrality to indicate anything meaningful. Taking the citation metaphor a stage further,
it may well be possible to establish a baseline of the importance of a document by
enumerating the number of citation that it has, but importance is a rather nebulous and
often meaningless construct: a paper may be cited by many other publications, but this
may be in order to criticise the cited paper, thus the centrality of the paper may mean
something different than what it first seems.
The representation of the network causes some problems. Whilst the extra dimension
may be a useful feature, and certainly differentiates it from other mapping tools, it is a
shame that so much has had to be compromised in order to represent it. The loss of an
obvious way of determining link directionality is a problem since this is often an
important factor when using concept maps: ideally the map should make as much
information available to the user as possible. The use of colour to represent centrality is,
perhaps, less of a problem, but it is certainly less immediate than size, particularly when
the colours are contiguous.
3.5.5 Theories embodied in the tools
It should be clear that there are a number of similarities and differences among the above
systems. All are similar in the sense that they allow ideas to be represented as nodes, and
allow these to be linked together to add organisation and structure to knowledge.
64

Learning through knowledge mapping
Tool Property Potential learning outcomeSem Net Restricts the amount of text that
the learner puts in.+ Forces the learner to express their ideasgraphically rather than textually.- Some information may need more textthat SemNet allows
Bi-directional links must benames in both directions
+ Makes learners think about relationshipsbetween concepts.- This may be irrelevant or unhelpful to alearner.
In default view nodes must belinked with relation name in orderto be seen
+ Forces learners to create a net, considerall relationships and produces structuralrelationships.- Learner may create net too soon. Forcinglinking does not necessarily guarantee thatthis meaningful.
Only central concept andimmediate neighbours can be seenin default view.
+ Forces learners to focus upon a singleconcept rather than being distracted byothers.- May preclude learner getting overview ofthe topic.
Learning Tool Amount of text practicallyunlimited.
+ Allows learners to make notes,summarise material, going fromunstructured representation to morestructured graphical representation.- May allow learners too much leeway inthe way they represent information,learners may use text instead of concepts.
No requirement to link or toprovide names
+ Allows progressive formalisation ofmaps using spatial clustering etc.- Learners may get entrenched in text-basedor unstructured network.
All the map can be seem at once —screen size permitting.
+ Allows learners to get an overview of thematerial.- Possibility that there may be too much onthe screen, may not focus the learner'sattention.
Maps can be nested withinconcepts
+ Removes clutter from screen, gives tidierrepresentations.- Is likely to hide important informationwhich may go unconsidered.
Knot System generates map. + Output may allow learner to reflect uponthe similarity criteria that they used.- Representation may be irrelevant,learners may generate as good or better mapmanually (cf conceptual sorting).
Pairwise comparisons used + System deals with macrostructure,learners only focuses on localrelationships.- May need more than one criterion / morespecific criteria.
No link names permitted ? Possibly beyond the scope of KNOTwhich is designed to organise rather thanstructure knowledge.- No ability to qualify or quantifyrelationships.
TextVision No link names permitted ? Like Knot, this may be beyond the scopeof the system. Links are all supposed tomean simply relates to, difficulties incomputation if links have differentmeanings.
System computes centrality basedon in and outdegree
_
+ May give learners some idea of the extentto which concepts are derived from or citedby other concepts.- Little ability to indicate what centralitymeans, other that in mere syntactic terms.
Table 3.1 A comparison of the essential features of the tools
65

Learning through knowledge mapping
Additionally all the representations are content free and therefore makes as few
assumptions as to the learners goals as hypertext does — in many ways working with
concept maps can be seen as authoring hypertext.
The tools above differ in a number of ways: the degree that they support text, the portion
of the map that the learner can see at one point, whether they allow typed relations, how
many types can be permitted, the extent to which the tool can compute various functions
for the learner and so on. These differences arise partly from the different theoretical
orientations that are embodied in the tool, which are often related to the specific task that
the tool is designed to support. Table 3.1 outlines the main attributes peculiar to each
system, with possible outcomes for the learning process. This scheme follows Carroll,
Singley and Rosson's (1991) assertion that all educational systems embody theories of
learning and education, theories which may often be tacit and of little use. The purpose
of this tentative claims analysis is to outline how some of the properties of such tools can
map on to some of the psychological theories of learning referred to above.
3.5.6 Discussion
Trying to pit the knowledge mapping tools above against one another in order to come up
with a winner appears to be a fruitless task; moreover, it is also worthless to try and
propose some hybrid system that has the best features of them all. Quite simply, the
effectiveness of a knowledge mapping tool is going to be dependent on a large number of
factors such as how much domain knowledge the learner has, their experience with
knowledge mapping techniques and so on. Heeren and Kommers (1991) looked at the
match between the expressiveness that learners demand (assessed using paper based
maps) against that offered by various knowledge mapping packages (Learning Tool,
SemNet and TextVision 2D). They concluded that learners should be offered as much
expressiveness as possible by being provided with libraries of node and link names and
types. However, Heeren and Kommers' subjects had been taught knowledge mapping
techniques according to Mirande's (1984) technique of schematising which emphasises
that learners should adopt their own relation and node types, rather than prescribing fixed
types as Novak and Gowin (1984) do. It is likely that subjects taught according to
Novak and Gowin's method (see Section 3.2) would find different problems with the
tools. This is by no means a criticism of Heeren and Kommers' research; the authors
themselves recognise this point. Rather the purpose is to emphasise that it is impossible
to specify what a knowledge mapper should offer independent of the demands of the
learner, which are likely to stem from a number of factors. An expressive tool in the
hands of someone unfamiliar to concept mapping may result in a proliferation of node
and link types that make communication difficult, this point crops up again in Studies
66

Learning through knowledge mapping
2,3,4 and 5, and therefore I shall make no more of it here (see Chapter 10 for a review of
these demands).
Barring certain design problems (such as Learning Tool's restriction to only three link
names, but see Section 3.5.2) the tools described above are, in many ways, designed to
fulfil different functions and highlight different aspects of the process of learning.
Perhaps the best form of discussion, therefore, would be to outline where the strengths
and weaknesses of the systems lie.
SemNet's great strength is in the way that it restricts what learners may do
spontaneously, trying to direct them into performing activities that support the process of
meaningful learning (requiring them to name links bi-directionally and so on). However,
there is no guarantee that merely forcing learners to provide names in both directions is
going to encourage them to produce meaningful names and think about the domain
relationships more deeply. Manipulating objects in SemNet is not the easiest of
processes, and it would be cumbersome for a learner to use whilst their knowledge about
the domain was still undergoing rapid development. In these circumstances Learning
Tool or TextVision would probably be more appropriate since they both support note-
taking, organisation of text and concepts. Both tools may be useful in supporting
brainstorming processes, where ideas are rapidly posted, arranged and gradually refined.
The networks constructed in both these systems can be structured and re-structured easily
with the minimum of effort. Learning Tool's a limitation it is that it may be too flexible,
allowing learning to do just what they want in commendable in many ways, but in other
ways it may not be the most efficient way to achieve effective meaningful learning.
TextVision has a similar lack of implicit structure, additionally the inability to specify link
names may be an encumbrance to learners trying to organise their ideas.
When learners have some degree of domain understanding, Knot may be of use to help
learners elicit the constructs that they have about the domain of study. By comparing
these to an expert model the learner may reflect upon their understanding of the
conceptual relationships and under the guidance of a tutor, explore their understanding
and misconceptions. Having a tutor present during these explorations is vital if the
learner is to understand the difference between their network and the expert net.
Consider the example shown in Figure 3.6 (below). Both networks are constructed by
rating a bunch of statistical concepts using Knot; the network on the left is an expert net,
rated by a lecturer in statistical methods; the network on the right was constructed by a
novice who had only a working knowledge of statistical procedures.
67

Learning through knowledge mapping
Figure 3.6 Comparisons of Knot Networks showing expert (left) and intermediate (right)understanding of statistical tests3.
A notable difference between these two networks is that the novice rated the F-Test as
being similar to a Tukey test; whereas the expert rated the F-test as being similar to
Kendel's Tau. Discussions with the two participants revealed that the expert rated the F-
test in this way because it was a test of variance, whereas the novice rated it as close to
the Tukey Test because it is often carried out as a post-hoc. This is consistent with
expertise research where experts categorize concepts based on high level categories and
underlying principles, and novices tend to categorize by function (see Chi, Feltovich and
Glaser, 1979).
This example indicates the role of knowledge mapping as a way of communicating the
learner's understanding to others. The novice map above, could be used by an instructor
as the focus for the discussion of statistical concepts, and the relationship between these
and specific tests. In some senses there is some validity to Fisher's point that knowledge
maps offer the instructor a unique insight into the workings of the student's mind.
3.6 CONCLUSIONS
Chapter 2 argued that many of the approaches computer-assisted learning that are
conventionally used for non-procedural domains tend not to engage the learner in the
3 Note that the maps shown in Figure 3.6 are reconstructions, the original Knot maps being lost.
68

Learning through knowledge mapping
process of directed reflection: that is they fail to get the learner thinking about the
structure of the concepts that they are being presented with. Furthermore, hypertext as a
popular computer-based medium compounds these problems by eradicating the various
structural cues that learners make use of when using conventional educational media such
as lecture notes and text-books.
This chapter discussed a potentially useful way of supporting directed reflection. I have
argued that knowledge mapping may be of use primarily because it focuses learner's
attention on specific sorts of relationships that may otherwise go unconsidered, learners
can reflect upon their conception of the domain and share the maps with other who may
offer useful advice and feedback. Developing useful computer-based knowledge
mapping tools can be of use because to some extent the computer can be used to regulate
the interaction more closely, to encourage learners to think about relation names and so
forth (as SemNet does), and can also allow the learner to view the developing map in
interesting and insightful ways.
The rest of this thesis explores the role that knowledge mapping techniques might play in
supporting learning.
69

4
Learning and accessstrategies in hypertext
4.1 INTRODUCTION
There is a romantic view of hypertext that because it places control of the interaction in
the hands of the learner: the learner iS free to explore in accordance with their educational
goals. There are, however, more negative views. Free to do what they want learners
will either be captured by every interesting thing that they see, whether or not it is of any
educational value to them; or will find the multiplicity of choices so overwhelming that
they become unable to do anything meaningful. Twidale (1991) refers to these two
extremes as dilettantism and cognitive agoraphobia. The purpose of this study was two
fold: first to investigate the sorts of strategies that learners use when interacting with
hypertext; and second, to investigate how they might use a computer-based knowledge
mapping tool to help them to learn. The study is necessarily exploratory; there is
precious little theory that might suggest in any detail what to expect learners to do under
these conditions, although some indication of what to expect are given in Chapters 1 and
2. It was therefore decided to simply observe what happened and use the data to suggest
possible improvements when problems became evident.
Of particular interest was the question of goal-directedness, since many of the
experimental evaluations of hypertext systems require subjects either to access specific
items of information (directed search), or to simply learn all the information contained in
the system. Either way the task that the subjects have to perform is fairly clear cut. In
real-world hypertext use, it is unlikely that the learner will be always be given some
specific task to perform; they will often enter an interaction with some ideas as to what
they are interesting in finding out about, but may not be able to find access it directly
using the facilities provided. The task given in this study attempted to simulate a situation
where a learner is told to find information in a system without being told exactly what to
look for, a situation perhaps more like the tasks set for essays and projects.
70

Learning and access strategies in hypertext
4.2 THE HYPERTEXT SYSTEM
For the purposes of this study a simple hypertext system was created. Within this system
the facilities that were provided fall fairly neatly into three categories: access facilities,
navigation facilities and learning tools.
4.2.1 Access tools
Access tools, as the name implies, provide the learner with various ways of accessing
information that exist within the hypertext system. There are many possible ways of
accessing information, some relying on the book metaphor, others relying on more
sophisticated procedures derived form database research such as word searches and the
like. In this system the following access tools were implemented: contents screen, index,
hypertext links, tours.
Contents facility: this consists of a list of topics structured into sub-topics so as to allow
an overview of the way that the material in the system is structured. Each of the sub-
topic names allows direct access to a screen or screens of relevant information by
selecting the name of the topic with the mouse. The contents screen can be accessed from
any other screen via a table of contents button (see Figure 4.1).
Index: the index is in some ways similar to the contents above in that it allows direct
access to the information. It differs primarily in that the index consists of a list of key-
words relating to the topics ordered alphabetically rather than by topic. Like the contents
screen the index screen can be accessed from any other screen.
Hypertext links : these consist of links within the text designated by bold text and are
cross reference links that lead to information related to the current topic on view (see
Figure 4.2).
Guided tours: these allow the learner to follow material relating to a particular topic within
the system in a linear fashion. Tours can be suspended if the learner wishes to browse
for other information (for example using hypertext links) and returned to later, or ended
part-way through. Tours can be taken either from the contents screen by selecting the
'Take Tour' button (see Figure 4.2), or they can be accessed via the information screens
themselves when they are available. The tour buttons on the information screen are
modal and have three modes: 'tour available' in which a bus icon is shown; no tour
available, in which the tour button is greyed out; and an icon which shows that a tour is
already in progress. Selecting the tour button when no tour has been selected provides
the user with two options: to start the tour from the screen that they are currently viewing
at and continuing to the end; or starting from the beginning of the tour. Selecting a tour
71

The structure of CallanishThe builders of CallanishAstronomical alignments
Tour Winio;:- Non*,
Why stone circles?Observat ion sitesAstronomic& alignmentsAlignments with the starsAlignments with the moonCell/coign and the moonAlignments with the sunEquinox alignmentsOther alignments
Learning and access strategies in hypertext
button when the system is already in tour-mode allows the user to cancel the tour in order
to minimise mode errors a dialog box asks them if they are sure that they wish to cancel
the tour. If a user selects either the within-text, contents or index buttons whilst in a tour,
then the tour is suspended until such a time as it is cancelled or re-joined. When a tour is
suspended a 'Rejoin Tour' button appears in a prominent position on the screen, selecting
this takes the user back to the last screen that they saw before the tour was suspended.
Figure 4.1 Table of contents screen from the `Callanish' system, note the highlightedpotion on the 'Topics' window indicating the topic selected, also note the italicised textindicating that the corresponding screen has been visited.
4.2.2 Navigation facilities
Although the term navigation is often used to refer to access tools, here I consider them
as being facilities that are aimed primarily at aiding the learner to find their way around
the document. Those implemented are listed below:
Book-marking facility: this allows the learner to mark off a screen of information in order
to return to it later, this is available from all of the text screens (see Figure 4.2).
Footprinting facility: this shows the learner the parts of the system that they have seen via
italicised text in the contents screen (see Figure 4.2).
Tour name indicator: this facility informs the learner when they are in a tour (and by
default when they are not) and also gives the name of the current tour.
Screen record: this informs the learner whether the number of times that they have been to
72

'Note button Pop-up field Tools palette
Table of contents
Index Index
Set go tobookmarks
Take/end tour
C:9 Go to last card seen
Back
Go to otherinformation
Screen recordTour name indicator
Learning and access strategies in hypertext
a screen aiding in the task of selecting appropriate information.
Collartish u2.0 (Screen) EIF.Create/accessnotes
Li1:-.1trAccess conceptapping tool
Alignment with the stars
Looking kor alignments with the st rs poses us with a number of
prob l emsi Not least is the fact that the night sky today looks ratherdifferent o the way it looked at the time stone circles such as Callanishwere builti For example the North p ting Pole star much used by
neolithic times,t watched as keenlythat they were of
e moon gives light at
night, changes in inte. NoJI.111111U IV 111“.“0, VII 411%,r, n the tide, the
moon)
stars In contrast were mere pinpricks of light. Another reason for their
rotation of the earth. This would make long , eiii
lack of importance to megalithic people is that the night sky is unstableand changes considerably
difficult to
during
take. (see alignmentsalignments
century due
with
topredictions,
aberrations
the ons
sun and the
dmeasurements
in theterm
navigatorsin recent /* Capella is a bright star in theInstead fil constallation of Auriga.as the sun or tie mooless significance. Th
Go to next screen in tour
Figure 4.2 An example screen from the Tallanish' system
4.2.3 The knowledge mapping tool
The knowledge mapping tool was developed for the purposes of the experiment using
HyperCard. Like most tools of its kind (see section 3.5) it allowed the construction of a
network in which nodes in the network denote for domain concepts, and links between
them show the way that the concepts relate to each other in the particular domain of
study. Nodes could be created in two ways: directly using the tool, by double-clicking
the mouse on the knowledge map window; or by creating a note window from the
hypertext system itself. Each time a note window is created a corresponding concept is
created in the knowledge map window, although during this process the knowledge
mapping tool remains hidden. Access to windows that have been closed is achieved by
opening up the knowledge map window and double-clicking the mouse on the node with
the appropriate name in the knowledge map; multiple note windows can be opened at the
same time. Concept nodes can be linked together using typed or untyped links, the
system prompting for a name after a link has been created. In addition to notes, any of
the nodes can contain sub-maps: maps within maps, which can allow hierarchical
structures to be created, thus avoiding the screen clutter which would be necessary if all
the nodes were represented on the same level. Nodes containing sub-maps had a
73

K-Tool 0=--
0 4-- Node with sub-map
The neutron
Link I Resize I Notes I Delete I Rename Concept I Sub Mop
Figure 4.3 The knowledge mapping tool used in this experiment
Active conceptnode
Learning and access strategies in hypertext
different appearance to those without (see Figure 4.3, below).
The electron 21-1
The electron is a negativelycharged particle
-4 - Note window
Finally, all the nodes and links could be renamed and deleted as desired; deleting a
concept node automatically deletes any notes or sub-maps contained within it.
The knowledge mapping tool and the hypertext system could be opened in different
windows at the same time, providing the computer-screen was large enough to view
both.
4.3 METHOD
4.3.1 Design
As has been mentioned the study was exploratory in nature and therefore only one
condition was used.
74

Learning and access strategies in hypertext
4.3.2 Experimental procedure
As most subjects were unfamiliar with hypertext, knowledge mapping tools, and indeed
the Macintosh interface, it was necessary to familiarise them with the various operations
they would need to complete the experimental session. The experiment was therefore
divided into two parts: a practice session, which introduced the subjects to the facilities
and structure of the hypertext document and allowed them to practice on it; and the
experimental session, which consisted of the subjects using the system to acquire
information for a subsequent test. Table 4.1 summarises the two sessions.
Session Phase Activity
Practice session
,
Familiarisation
Presented with instructions andoverview of system.Tutorial on hypertext andknowledge mapping tool.Questions
Guided explorationPractice using hypertext andknowledge mapping tool; similarto experimental session but withdifferent material.Questions / problems
Experimental session
InstructionsPresented with instructions andstudy goal (verbal and textual).
Learning session
Use of hypertext and knowledgemapping for learning.Five minute revision period(optional).
Question sessionPresentation of questionsWrite short summary ofinformation learnedAnswer questionnaire
Table 4.1 Overview or experimental procedure.
4.3.2.1 Practice session
The practice session began with a tutorial. The tutorial consisted of written instructions
on the various facilities provided in the HyperCard stack, together with tips on how to
navigate around the hypertext (see Appendix 1 for the tutorial sheet). The tutorial was
designed to encourage subjects to interact with the system as soon as possible, hence
expository text was interspersed with relevant activities for them to engage in. The
tutorial also dealt with the use of the knowledge mapping tool, and included a short
introduction to knowledge mapping to give subjects an idea as to what the tool could be
used for. During the tutorial, and through the experiment as a whole, an experimenter
was on hand to answer any queries that they may have. Following on from the initial
tutorial, subjects were given a short task similar to the one that they would perform in the
experimental session. The task required them to find out some information relating to the
structure of the atom, expressed both verbally and on a printed instruction sheet.
75

Learning and access strategies in hypertext
Subjects were required to try and use the knowledge mapping tool to make notes and also
to create a simple knowledge map relating to the goal that they were given. It was
stressed, however, that the task was only for practice and that they should not take more
than 30 minutes to complete it. A short question session followed this in which the
experimenter asked the subjects to describe the map that they constructed. They were
then asked if they had any problems or questions before they entered the next phase of
the experiment, after a short break for coffee.
4.3.2.2 Experimental session
The system used in the second session contained material relating to a historical
monument, the Callanish stone circle. The subjects were required to learn about certain
aspects of the stone circle using any means at their disposal. They were given a
maximum of 60 minutes in which to complete this task, although they were allowed to
finish whenever they felt that they had satisfied the task give to them. The task that they
were given was not explicit: instead of asking the subjects to find specific pieces of
information, or telling them to learn everything that the system contains, the task was
defined in the form of the study goal:
"How does the structure of Callanish relate to its hypothesised purposes, andwhy would these be important to its builders?"
This required the subjects to explore various high level relationships between pieces of
information contained within the system, and was intended to simulate as closely as
possible the sort of goals that learners may have if they were using the system to write an
essay. They would need to formulate their own more specific goals in order to
successfully complete the task.
As can be seen, although the study question provides some sort of goal for the
interaction, it does not specify exactly what information is relevant, nor does it indicate
the level of detail that the subjects need to acquire. The subjects would therefore need to
regulate the interaction to find the relevant material without becoming bogged down in
redundant information. The instructions for the task reminded subjects of the various
facilities that were available to them, but they were told that it was up to them to use
facilities they felt were useful to completing the task. If they felt that certain facilities
were unhelpful they could choose not to use them.
At the end of the interaction subjects were first given a set of 10 questions varying from
multiple choice to short answer questions which related to the material that was contained
in the system; no notes were allowed for this part (see Appendix 1 for the questions).
Following this subjects were asked to write a brief summary (no more that a page) on
76

Learning and access strategies in hypertext
what they had learned about Callanish relating to the goal. Finally they were asked to
complete a short questionnaire relating to the usefulness of the facilities and tools
contained within the system. After this the session was complete.
4.3.3 Subjects
Five pairs of subjects took part in the experiment. All were students from the University
of York, and were each paid ten pounds for their co-operation.
4.3.4 Measurements
4.3.4.1 Screen recordings
The use of screen recordings allows the possibility of an analysis of the interaction which
is highly detailed. Unlike the use of logs which typically record only the screens that
were visited, the length of time that they were open for and the sequence in which they
were visited, screen recordings-allow the interaction to be analysed at the level of the key
stroke, or more appropriately the mouse click.
Another approach that has been used in the past to record interactions within the medium
of HyperCard has been the method developed by MacLeod (Kornbrot & MacLeod,
1990). This approach records not only information relating to the screens that have been
opened, but also information relating to the buttons that had been pressed to access the
various screens of information. This was deemed inappropriate to this investigation as it
would not capture many of the generative activities that the learners would perform in this
task, for example: the evolution of notes, how the knowledge mapping tool was used and
so on. A screen recording, although requiring more analysis to render the information
meaningful, provides a much richer indication of what the subjects were doing as they
used the hypertext and knowledge mapping tools.
4.3.4.2 Verbal protocols
Investigating the types of activities that learners utilised in the interaction, it was clear at
the early stages of experimental design that merely recording the information at the level
of the system would not be sufficiently rich to gain an insight into the types of activities
that were being employed by the learner. Previous experiments have used gross
measurements such as logs to infer different high-levels strategies (Allinson, 1991), but
the intention of this experiment was to acquire data that allowed a synthesis between the
high level strategies employed and the lower level of learning activities. To this end,
verbal protocols were used in an attempt to gain data relating to the interaction a finer
grain size than previously achieved.
77

Learning and access strategies in hypertext
4.3.4.3 Video recordingAs well as being a means for recording the verbal protocols, video recordings were used
as a means for viewing the subjects as they used the system. Because subjects were
given their study goal on printed paper, video would enable many of the off-screen non-
verbal activities to be assessed. For instance subjects checking the goals on the paper that
they were given could be observed using video. Subsequent analyses demonstrated that
finger points were used fairly often by some subjects as a way of indicating to their
partner which buttons to press, or relevant pieces of text.
4.4 RESULTS
The data collected will be divided into two categories purely for ease of discussion.
These are the data derived from the screen recordings and the data derived from the verbal
protocols.
4.4.1 Access of material screens
The graph in Figure 4.4 (below) shows the number of screens accessed by each of the
access facilities provided. There is a marked preference for accessing material screens via
the guided tour facility, with hypertext links (the within-text cross-references) and the
contents facility coming in second and third respectively. The bookmark facility was
used by only one pair of subjects (pair 5) for whom it was as popular as the contents
facility. Interestingly enough no subjects used the index as a means to access the
information screens even though they all had experience using it during the training
session. The reason for the failure of subjects to use the index can be partly attributed to
the nature of the task: indexes best support directed search techniques, where the subject
has a pretty good idea what information they are looking for. This experiment required
subjects to learn a large amount of information without being given specific a priori goals
as to what material was relevant. Research by Hammond & Allinson (1989) shows
similar patterns of results, learners showing a marked preference for the index only when
the task required directed search.
4.4.2 Differences among pairs
Looking at the use of the facilities across the different pairs it can be seen that there are
marked differences in the use of the various facilities, see Figure 4.5. Although there
does seem to be some pattern in the use of the facilities (see Figure 4.4), the variability in
the results is marked, this can be at least partly explained by considering that the subjects
used different strategies during the interaction.
78

30
20 -
0"E' ,
o Access lacilityf(71_
• Pair 1
El Pair 2
ID Pair 3
El Pair 4
El pair 5
Learning and access strategies in hypertext
Figure 4.4 Mean number of screens accessed by each facility.
n-=0
`ci3
Access facility
Figure 4.5 Facilities for access of material
Table 4.2 (below) shows the data for all five pairs. It can be seen from both Figure 4.5
and the table that although overall the guided tour is the most popular means of accessing
text screens, this is by no means true for all subjects, both pairs 3 & 5 favour other
means, pair 3 favouring the contents screen and pair 5 preferring hypertext links. It
should be noted that these two pairs differ in other ways from the other three, a point
which shall be discussed later in this section. Table 4.2 also shows the number of
screens accessed by each group, these are divided into the number of new screens, those
79

Learning and access strategies in hypertext
that the subject sees for the first time, and old screens, those that have been seen before.
From this we can compute an index of efficiency (Hammond & Allinson 1989) which is
an arbitrary measure of how many redundant screens the subjects saw, a high efficiency
index equals low redundancy. However two of the pairs (pairs 1 and 2) saw all of the
screens, whilst another (pair 4) saw nearly all of them. The remaining pairs (pairs 3 & 5)
saw just less than three quarters of the total (see Table 4.2).
Calling the ratio of new screens to total screens seen efficiency may be misleading.
Simply because a subject has seen a material screen before does not mean that this was
either down to inefficient search, or insufficient processing first time around. Other
factors may give rise to this pattern of results, and it may even constitute a useful learning
strategy.
Facility used to access screen Pair 1 Pair 2 Pair 3 Pair 4 Pair 5 Mean
Contents
Tours
I lypertextBookmarks
Index
Total numberNew screens (total 42)
Old screensEfficiency (New/total)
Score
9 7 13 12 5 9.2
29 35 11 33 21 25.8
20 23 8 13 23 17.4
0 0 0 0 5 1
0 0 0 0 0 0
58 65 32 58 51 53.4
42 42 30 40 29 36.6
16 23 2 18 22 16.4
0.72 0.65 0.94 0.69 0.57 0.71
72 75 80 73 40 68
Table 4.2 Access of material summarised
One of the intentions of this investigation was to see how the various activities and
processes that occur during an interaction with hypertext are accommodated into an
overall learning strategy, and to examine the nature of these strategies. Graphs such as
those in Figures 4.4 and 4.5 can only tell part of the story; in order to understand the way
that these tools and facilities are used rather than merely how much it is necessary to first
of all examine at which points in the interaction when the tools are used, in order to do
this the use of the tools was represented using the meeting plot formalism (Olson &
Olson, 1991). The use of the various facilities was measured out along a time base
giving an indication of the distribution of tool use over time, in tandem with the verbal
protocols. It is hoped that this will give a clearer idea of the way that the subjects went
about their task. In attempting to describe the learning strategies of the subject pairs it is
probably best to describe the results for each of the five pairs in turn. But first I shall
discuss the data for all the subjects.
Subject pair I. The interaction of subject pair 1 can be divided into three phases. The
first phases lies between the beginning (0 minutes) and about 27 minutes and is
characterised by a fairly heavy reliance on tours interspersed by a following cross
80

Facilities Tours
Hypertext
Note ca rd
Corcept mapping
Book m ark
Contents
Index
Figure 4.7
_! '' •. I
I_ l_: : 1 1
• _I • _11_11_1_J_LJKI--- —.. . --k— Hi
.. I
. . I I I !
Meeting plot for subject pair 2..
• — — — — —. • :
__ AmomMomanammirmammam-. ____imminommommumummai_i
. ;L mufm_i Jailmma_ _ mk AIL _MIL _ _MEI:A& — — _i_MIIL lill111
^ _ _IM. _e:um__ min_ _ Am. _;_ __ _ _pa_ _IIL _i_JMIL _ _lin- _ _ _ _1_ _ _ _ _;._ _ _ _ _l_MIL __.
1I______:_________I_____,_. —___:_____I--_______i____I I 1 1 I
•
1•
Learning and access strategies in hypertext
references resulting in tour suspension (the grey sections) and note taking. The second
phase of the interaction occurs between 27 and 42 minutes and involves the subjects
browsing the material using the hypertext links and the contents screen as means of
access, as before some notes are made, the knowledge mapping tool is used for the first
time. The final phase is much shorter than the others and occurs between 42 and 45
minutes and involve the knowledge mapping tool being used to access the notes that have
been made previously.
5 10 15 20 25 30 35 40 45
Facilities Tours
Hypertext
Note ca rd
Concept mapping
Book m ark
Contents
Index
:_ . ENININ40•111111111411-1=n1111 _i
1 1 1 nLit a_ _ _ _ma_ _Au. _I_ _ _Ill_ __IIIIIIMIl_ IASI& WU us_ _ __ __l_ _
---------.----- i,_ Amioa_ .1 n _II_ _1
BR_ _
— —1— -- —1— 1 —
7
Figure 4.6 Meeting plot for subject pair 1.
Subject pair 2. The overall pattern for the interaction of subject pair 2 is in many ways
similar to that of pair 1. Again there is an initial phase whereby there is a reliance on tours
(between 2 & 39 minutes) during which notes are made and cross-references are
followed. This is followed by a period where material is accessed via the contents screen
and hypertext links (39 to 44 minutes). Finally, there is a brief period between 44 and 47
minutes where the subjects are accessing notes. It is important to note that the knowledge
mapping tool was not used at any point during the interaction.
5 10 15 20 25 30 35 40 45
Subject pair 3. The results for pair 3 look quite different than the previous two, the tours
were used much less frequently, less in fact than all the other pairs. Figure 4.5 shows
that the primary means of access for pair 3 was the contents facility. The interaction
starts by the selection of a tour which is followed without deviation of any sort (between
81

FacilitiesTours
Hypertext
Note ca rd
Corcept mapping
Ebok m ark
ContentsIndex
Learning and access strategies in hypertext
2 and 7 minutes); after this tour has reached its conclusion there is a period (7 to 15
minutes) of browsing using both cross-reference links and the contents screen to access
material (similar to that found in the second stages towards the end of the interactions of
pairs 1 and 2). In the next phase between 16 & 30 minutes there is extensive use of the
note-taking facilities with periodic dips into the hypertext, occasionally making use of the
contents screen to access the material. The fourth section (30 - 37 minutes) consists of
heavy use of the knowledge mapping tool, with note cards being opened up occasionally.
The final section (37 - 41 minutes), involves use of the knowledge mapping tool, and
some material screens accessed by the contents screen.
5 10 15 20 25 30 35 40
. . . . .
_L am 1.1 lo . i 4___ __Ii tma_ .0_[_.• _ _IL ______I___xx _i_ __i_nommu'l_ xt_ Milt J=4_ .14 _,r-
-
______;_
sl_____— ____:_---- -----
________i_____i_____i_____i_l______I_____i__
____L__i
.I
.. .—___ .--- —_ --t—
1 . 1 :Figure 4.8 Meeting plot for subject pair 3.
Pair 3 scored the highest efficiency index (see Table 4.2). The score of 0.94 is a near
perfect score indicating that they saw very few of the screens more than once. The
relevance of this figure will be discussed after the verbal protocols have been considered.
Subject pair 4. The pattern of the facility use for subject pair 4 is similar in many ways
to those of pairs 1 and 2 There is an initial phase between 1 minute and 29 minutes in
which the subjects use most of the facilities available to them; material is accessed
primarily by tours with only little use of the contents screen or cross reference links.
5 10 15 20 25 30 35 40
•••••— • • •
Facilities Tours
Conceptmapping ----Lit — -III— —11— — jilli —`
i_k_. i___. Ig___ i___
Hypertext -----1----11.1-1-1---‘—L---i-----1-----11-- ji alli t' .41— — —
ibokm ark
Note card ____JR* I_ _ _i_ x _ ALI _Kit_ ai_m_ I
Contents m H ! _m_ _1i ___ il_ _ _.1_ ill_ 1_ 1.1 ll_l_;11J— — —
1
I
1
'
1 1
•—,---:_--'
.1 '1 • r E r i 1 1Index
Figure 4.9 Meeting plot for subject pair 4.
82

Learning and access strategies in hypertext
Notes are made, concept nodes are linked using the knowledge mapping tool. The
second phase between 29 and 41 minutes reveals that the subjects are dipping in and out
of the material using the contents screen almost exclusively.
Subject pair 5 1. In addition to this being far and away the shortest interaction (26.6
minutes whereas all previous break the 40 minute barrier) it is also notable in that pair 5
were the only ones to use the bookmarking facility as a way of accessing material
screens. Like the results for pairs 1 & 2 the interaction can be seen as consisting of 3
phases of tool use. The first stage (0 - 10 minutes) involves the use of a tour, with
suspensions to follow cross-references, this is followed by a period of access using the
contents screen (10-16 minutes), with a final stage in which notes were made.
Occasionally, in this last phase, the subjects accessed material screens that had previously
been marked stored using the bookmark facility. The knowledge mapping tool was not
used at all.
The low efficiency index for this pair (0.57) can be attributed to their strategy of scanning
the material, bookmarking relevant screens, and returning to them later. Thus what
seems like low efficiency may actually be a useful learning strategy.
4.4.3 Scores on the test
Subjects were presented with a set of 11 questions about the Callanish stones (see
Appendix 1), which were marked by the experimenter. All subject pairs performed
approximately equally on the post-test (between 72 and 80% correct), apart from subject
pair 5, who only scored 40%. This seems to be largely to do with the relatively low
number of screens that this pair visited, meaning that they did not cover much of the
information relevant to the study goal, and hence the questions.
4.4.4 Strategies for the interaction: a first pass
Formulating explanations from the basically syntactic representation of the interaction that
the meeting plot provides is a contentious issue, but it does seem that even from this
coarse-grained analysis some tentative conclusions can be drawn regarding the particular
strategies used.
System-led accretion: this involves the learner trying to acquire the key facts of the
domain; searching will often tend to be driven by the structure of the system. Tours
perhaps encourage this approach and are used quite a lot early on in the interaction.
1 Meeting plot 5 has been lost.
83

Learning and access strategies in hypertext
Goal-directed access: interesting or potentially relevant topics are accessed by a top-level
menu or contents screen. This process may be driven by a desire to fill gaps in the
learners' knowledge, and can be aided by the use of footprinting showing how much the
learner has covered.
Skimming: characterised by subjects visiting screens for a short while in a manner similar
to skim reading. Skimming may serve two possible functions: first, to allow the learner
to assess the relevance of the material to their goals, before reading further; and second,
to allow subjects to obtain some idea of the information in the system by way of an
overview. It is suggested that skim reading before the information is read in more depth
is a useful strategy to aid learning and characterises expert performance (Bazerman,
1988). Bookmarks can be useful to this end allowing interesting or relevant material to
be stored for later use.
Note-taking: this can be done either "on the fly", the notes being made whenever
anything relevant crops up (as for pairs 1, 2 and 4), or they can be made in the form of
summaries after the material has first been surveyed.
Revising: characterised by access of notes at the end of the interaction, or the access of
key screens of the system (such as the use of an aerial diagram looked at by at least two
groups in this experiment).
Organising: here subjects organise and structure the concepts that they have created using
the knowledge mapping tool.
4.4.5 The processes involved in the interaction
The purpose of recording subjects' verbalisations was to obtain a clearer idea of the sorts
of processes and activities that were occurring during the interaction. The aim was here
to supplement any inforniation derived from the screen-recordings to attempt to
determine strategies for the interaction.
4.4.5.1 The process of categorisation
The verbal protocols were first transcribed, and then categorised into different types of
process. Following this, the low-level categories were grouped into higher level
categories relating to commonalities between verbalisations.
Table 4.3 shows that there are three high level categories relating to learning and
comprehension, regulation of the learning process, and verbalisations directed towards
the way that the system behaved. The numbers in the second column refers to the
number of verbalisations counted that relate to this category. Often an utterance was
84

Organising
6.6
Giving the information a loose structure, discussingcommonalities not explicitly stated in the text.
Selecting
18.8
Relevant or interesting material is selected.
Discussing goals
1.8
The goals of the interaction are referred to in orderto aid selection.
Evaluating achievements
0.4
The learner evaluates what has been achieved so far
Planning
4.8
The learners plan the next part of the interaction.
Discussing strategy
0.4
The strategy for the interaction is discussed.
Misc. control
11.8
A low level process involving one subjectrequesting some system related action of the other.
Evaluating redundancy
3.6
The subjects discuss whether they have seen ascreen of information before.
Discussing tool use
0.5
Low level discussion (i.e.. not strategic) relating tothe use of a tool or facility.
Discussing system operations
2.7
General comments
26.5
, The various operations of the system are discussed.
Comments not directly related to the task,information or process of learning.
Learning and access strategies in hypertext
deemed to relate to more than one activity which may fall into the same category, or two
separate categories. For example, the utterance from the experiment:
"So we have to look at the burial chamber don't we, because we've already seenthis." (points to information screen on the 'Central Menhir').
would be categorised as both planning, where subjects negotiate some action, and
evaluating redundancy, which is where subjects decide that they have covered some
information screen before. Alternatively more than one utterance may be categorized into
a single instance of a category type. For example, a verbal interchange where learners
discussed some aspect of the system would count as one instance of the particular
category.
Category % Description-ComprehensionSuperficial processingReading out loud 4.1 Self explanatoryAssimilationClarifying . 6.7 Trying to resolve misunderstandings, or make
points presented clear.
Summarizing
11.4
One subject summarises the information given tothem in their own words—self explanation.
Regulatory
Interaction
Table 4.3 The verbal protocols categorized.
4.4.5.2 The comprehension level
Learning from text involves the processes and activities that turn the material that it
presented to the individual (be it graphical or textual) into acquired knowledge. As we
saw in Chapter 1 a number of different processes have been described by different
researchers which serve to render the information and transform it to a mental
85

Learning and access strategies in hypertext
representation of that information. Learning, as Hammond (1991) points out, occurs as
a by-product of comprehension; in all but the most artificial rote learning situation,
learners attempt to make sense of the information before they attempt to retain it.
Superficial processing. Ferguson-Hessler and de Jong (1990) use the term superficial
processing as a way of describing the initial phase of learning where the information that
is presented to them is decoded. As may be expected, in this study most of the time was
spent reading the information screens in silence. The manifestation of superficial
processing in the protocols was subjects reading information out loud. Often this was
merely to indicate that a point was of some interest to them, and appeared to be of little
strategic use. For example the following was read from the system:
"Listen to this: 'Excavations of the burial chamber found bones, some weaponsand a black sticky substance that may have been the remains of human bodies...'Yuk!"
Assimilation. In this study learners could be observed explicitly and jointly attempting to
comprehend the information that was presented to them by the hypertext system; these
were categories as summarising, questioning, organising and clarifying.
Summarising was where Subjects made verbal summaries of the information to ensure
that they had understood it; for example, material relating to the actual structure of the
Callanish complex itself was summarised as:
"So it's basically a cross with a circle in it."
Organising was where subjects would draw connections between entities within the
material, not explicitly stated within the text itself, such as — referring to information on
ley-lines, and druids:
"These are all to do with mysticism aren't they?"
Clarifying is where subjects attempt to resolve misunderstanding and understanding
failures by discussing the information — referring to information one of the purposes of
the monument:
"So is this all about weather prediction then?"
4.4.5.3 The regulatory level
The regulatory level contains verbalisations directed towards managing the processes by
which information is accessed and learned; it contains five sub-categories of
verbalisation: selecting, discussing goals, evaluating achievements, planning, and
discussing strategy.
86

Learning and access strategies in hypertext
Selecting. This is simply where learners discuss whether or not a section of material is
interesting of relevant, these discussions may be whether to read a particular information
screen, or whether to make notes on a screen that they have read, for example:
"I don't think that we need to bother with the first three [topic options], I thinkthat 'builders of Callanish' would be a much better idea."
Discussing goals. This is where subjects discuss information that they are looking and
evaluate it in the light of the goals that they have been given to see if it is relevant.
Discussions such as these often led to the process of selection, see above. For example:
Subject 1: "What about this?" [points to screen on 'Astronomical Alignments]
Subject 2: [Looks at goal sheet] "Yeah, we need to look at stuff on the purposeso I suppose we do, yeah."
Evaluating achievements: this is where subjects discussed what information they had
covered, made notes on and so on; and evaluated this in the light of the goals that they
were given to see if they had covered enough information:
"So we've covered all that stuff [information on the structure of Callanish], so wejust need to do some stuff on the purpose."
Only by evaluating what they have achieved can subjects (and learners in the real world)
using hypertext determine when they are going to stop learning the material. In system
led interactions the stopping rule is provided by the system itself; in hypertext and other
discovery systems learners need to do this themselves if they are not going to carry on ad
infinitum or (perhaps more likely) ad tedium.
Planning: quite simply is where subjects tried to form some form of plan for how they
would proceed with the interaction. Planning occurred very infrequently (4.8%), and
those plans that were developed were short term, and low level, for example:
"OK., that's the 'structure' [of Callanish], let's go back to the 'purpose' [ofCallanish], [via] main contents."
Additionally, and importantly, no explicit planning took place at the beginning of the
interaction; subjects preferring to jump into the system rather than consider what they
should do beforehand.
Discussing strategy. Subjects very occasionally discussed the way that they were going
about the interaction, for example:
Subject 1: "I think we should just scan these don't you?"
Subject 2 "Yeah"
87

Learning and access strategies in hypertext
Subject 1 "I suppose in retrospect that's probably what we should have donefrom the beginning."
Such discussions were extremely rare in this study, subjects seemed quite happy
complete the interaction with little or no explicit evidence of them discussing the best
strategy to adopt.
4.4.5.4 The interaction level
Verbalisations at the interaction level relate to various discussions relating to the task that
learners are performing, or to the various operations of the system. The interaction level
contains four lower level categories: control, evaluating redundancy, discussing tool use
and evaluating system operations.
Control, the control category contained a high number of verbalisations (11.8%), these
basically took the form of instructions given from one subject to another. The
experimental set up required that one subject was in control of the mouse and the other
the keyboard and often one subject would need to instruct the other to click a button with
the mouse, or type something in to a dialog box. Many of these instructions are the result
of the experimental set-up and therefore of little interest here. For example:
"Can you move that [a note window] up there so I can read this [an informationscreen]"
Evaluating redundancy, these discussion centred around the subjects discussing whether
they had seem some information in the system before or not. These could either be
predictive: subjects deciding whether they had seen a screen by virtue of its name in a
cross reference link, or the discussions may take place when they are actually looking at a
particular screen. This last occurrence is rather surprising since the system logged a
screen every time it had been visited and displayed the number of times that the subjects
had been to a screen (set Figure 4.1). For example:
"Oh have we seen.. .[looks at number of times indicator].. .we've been here
before."
Discussing tool use, a number of discussion took place as to how a tool should be used.
These discussions were low level in the sense that they were not strategic in nature.
"Shall we put the note in here [a single note-window] or shall we create another
one?"
Evaluating system operations, this is simply where the behaviour of the system would be
discussed, or predicted by the subjects. For example:
88

Learning and access strategies in hypertext
"If I press this [button] will it cancel the tour as well?"
Activities evaluating system operations are low level, infrequent (2.7%) and not of
particular interest here.
4.4.5.5 General comments
General comments is effectively a default category for all the verbalisations that could not
be meaningfully categorised. The lion's share of this category is made up of various
remarks that have little to do with the task, in hand. Such verbalisations may be of
importance in regulating the human-human interaction, but are of little interest to this
study.
4.4.5.6 Summary of categories
Assimilation. The categories described in the assimilation category roughly accord with a
number of conjectures about the processes involved in learning from text. Kintsch
(1987) argues that comprehension of text is largely a bottom-up process; as it is read, text
is parsed into propositions which represent the various interpretations that can be placed
on the individual semantic units (words or aggregates). These propositions are arranged
into a network which develops as reading takes place. At some arbitrary point during the
reading process, which may correspond to the end of a sentence, but not necessarily so, a
proposition will become understood. Note that this process is not all or none as subjects
can be probed about meaning at various points during reading and are able to give an
answer. Furthermore, subjects can change their mind about an interpretation when further
evidence from the text or their background knowledge either invalidates the interpretation
or provides a better one, such as in the case of garden path sentences. Such a model
tends to play down the top-down components of comprehension that have been put
forward by other researchers such as Schank (1982) where comprehension is achieved
by virtue of what the learner expects. Such an effect is well known in s tudies where
semantic "priming" effects occur that are under conscious control as opposed to effects
that appear automatic (Posner & Snyder 1975, Neely 1977). Whichever model fits the
data best it seems to be the case that there are several levels involved in the
comprehension of material. First, a stage of initial processing occurs where the meaning
of the text is parsed into propositions, which are later mapped on to that learners
background knowledge in order to be understood. Next, these propositions are
incorporated into a domain model that relates items of knowledge together in a way that
reflects the learners current understanding of the domain. Finally, there is an integrative
process that involves input into the model of both past experience and recently acquired
information that can either serve to strengthen the existing model or cause re-evaluation in
89

Learning and access strategies in hypertext
background knowledge in order to be understood. Next, these propositions are
incorporated into a domain model that relates items of knowledge together in a way that
reflects the learners current understanding of the domain. Finally, there is an integrative
process that involves input into the model of both past experience and recently acquired
information that can either serve to strengthen the existing model or cause re-evaluation in
the light of new evidence.
Regulation. Perhaps the most surprising observation obtained in this study is the lack of
explicit regulatory behaviour that occurred: subjects formed few plans, evaluated their
achievements infrequently and only rarely referred back to the goals that they were given.
Recall that such activities are crucial if the subjects are to access and learn about relevant
information and ignore information that is irrelevant to the goals that they were given.
McAleese (1989) states that browsing should be purposeful, but these results seem to
indicate that browsing was not purposeful. Of course, merely looking at verbal protocols
does not provide an index for how effective learners were at obtaining relevant
information; however by loOking at the screens accessed it is possible to determine how
many relevant and irrelevant screens then subjects visited.
The goal of the task only required learners to learn about a subset of the information in
the system, designated as being relevant by the experimenter. Table 4.4 shows the
number of relevant screen and irrelevant screen that subjects covered.
Pair 1 Pair 2 Pair 3 Pair 4 Pair 5Total different screens (%) 100 100 71 95 70Relevant (%) 100 100 100 100 64Irrelevant (%) 100 100 14 71 77Table 4.4 Percentage number of relevant and irrelevant screens accessed.
Ideally subjects should score a maximum 100% for the number of relevant screens, a
zero for the irrelevant screens. In reality although four of the pairs score 100% for the
relevant screens, two of these score 100% for the irrelevant screens also, whilst another
pair looked at 71% of the irrelevant screens. Only one pair, pair 3 showed a perfect
relevant screen percentage, with a creditably low 14% of the irrelevant screens, revealing
Pair 3 to be the most selective in the study. Pair 5 are the odd ones out, showing a less
than perfect 64% for the relevant screens, and a high 77% for irrelevant screens. This
reveals that not only did pair 5 cover lots of irrelevant material, they also missed out on a
lot of relevant material. Perhaps unsurprisingly they scored the lowest on the post-test,
scoring approximately half as well as the other four pairs.
Some of the variability in goal directedness may be explained by looking at the
differences across subjects in the number of verbalisations in the regulatory level.
90

Learning and access strategies in hypertext
Pair 1 Pair 2 Pair 3 Pair 4 Pair 5Selecting 20 12 15 18 16Discussing goals 1 2 9 2 1Evaluating achievements 2 1 5 1 0Planning 4 3 4 5 6Discussing strateg y 0 3 1 2 3Table 4.5 Total number of occurrences of each category in the regulatory level for allpairs
Table 4.5 shows that although pair 3 differed very little in the number of verbalisations
concerned with selecting, planning and discussing strategy, they did appear to discuss
their goals and evaluate their achievements more. This observation suggests two things.
First, that subjects who attend to their goals and refer to them as they proceed through the
interaction may show more evidence of goal-directedness, than subjects who consider
such factors less — subject pair five for example. Second, that goal-directedness does
not appear to be related to the number of planning and discussing strategy verbalisations,
which were similar for all the pairs. On this second point, it must be borne in mind that
practically all of the planning behaviour was very low level, and also there is no
measurement of how well they actually adhered to any plans that they formulated.
We should be wary of drawing too many conclusions from these results, what may
appear to the developer of a system to be irrelevant to a particular goal may to a learner be
useful background knowledge. However the results do show when taken together with
the lack of explicit regulatory behaviour, that there may be some mileage in trying to
encourage learners to be more goal-directed in the way that they access information from
hypertext.
4.4.6 Use of the knowledge mapping tool
An aspect of this study which becomes increasingly important in later chapters is the
extent to which subjects used the knowledge mapping tool that they were provided with.
Out of the five pairs only three used the tool for anything other than note taking. Pair 2
and pair 5 both used the note tool which was part of the knowledge mapping tool, but did
not use the knowledge mapping tool itself to build maps and so on. Pairs 1, 3 and 4, on
the other hand, created multiple nodes and at least attempted to organise these into some
form of overview map (see Figure 4.10-4.12).
91

moon
burialchamberpurpose
menhir
-neasurerad
whobuilt
purpose
7:-LEN
:---za= -alignmentsun
Moon Alignme...
'StructureRock
Learning and access strategies in hypertext
why circles
Figure 4.10 Knowledge map for pair 1
North Avenue
-E=h, t/c struc
Stars Alignm...
ticIgEE12M
smaxstruc ‘'NN
East, West a...
Figure 4.11 Knowledge map for pair 3
D
/
Com onents
Made of
Circle
Rel.sites
Builders
Figure 4.12 Knowledge map for pair 4
92

Learning and access strategies in hyperteA1
Little can be said about these maps since subjects were not instructed to use it, merely
shown how to operate it and advised that it might help them; it was left very much up to
the subjects as to how much they used the tool. Some used it for the purpose that it was
intended, (pairs 1, 3 and 4) whilst some used it simply as a place to store notes (pairs 2
and 5). Looking forward to Chapter 5, many of the features in the maps above are also
shown in this next study. For example, a number of the nodes in maps from both studies
are left unlinked (see Section 5.3.4.1).
4.5 DISCUSSION AND IMPLICATIONS FOR FURTHER RESEARCH
Looking at the interactions as a whole, subjects appeared to have little problems using the
hypertext system, and in a post-experiment questionnaire, all ten subjects indicated that
they found the system easy and relatively pleasant to use, and managed to learn from it
successfully as well with four of the five pairs scoring around 80% in the post-test.
Subjects were less consistent in their use and attitude towards the knowledge mapping
tool. Whilst all pairs used the tool, only three of the five used it to explicitly organise
their ideas, the other two using it as a means of accessing notes, I shall return to this
point shortly. First I shall briefly discuss v,hy subjects did not appear to be very goal-
directed.
4.5.1 Why % as there an absence of goal-directedness?
In the main subjects in this study seemed quite happy make decisions as to where to go
and what to do next on the fly, on a moment to moment basis. To some extent this is
understandable: learners enter this particular domain kn wing nothing about it and
therefore need some kind of background bef re they are able to direct the interaction
successfully. This background can be achieved via the simple expedient of following
tours in the hope that something relevant comes up. These results are consistent with the
findings of Njoo and. de Jong (1991), who discovered that subjects us ; ng educational
simulations often interacted with the system in a rather arbitrary way, rather that
attempting to formulate and adhere to some form of plan for the course of the interaction.
The lack of any explicit planning was discussed by Suchman (1987) who stated that often
interactions are typified by situated action: acti as triggered by the moment-to-moment
changes of state of a system, rather than directed by high level plans. Of course, all the
subjects in this study were novice hypertext users, and to a large extent they were thrown
into a system which may initially be hugely unfamiliar. Such circumstances are likely to
result in the subjects applying weak meth ds t achieve their goals, such as system led
browsing; after all in order to form any sort of plan it is necessary f r an individual too
have a clear idea of what options in terms of access and nal, igation facilities are open to
them. In this study the minimal practice that they recei‘ed was unlikely to provide this.
93

Learning and access strategies in hypertext
What do these results prescribe? Marchionini (1988) argues that hypertext does not
support the formation of plans or goal directed search, it supports browsing; as Chamey
(1994) points out, "Hypertext cannot rival the ability of print to support rational,
deductive, goal-directed discourse."
It may therefore be profitable to provide explicit support for goal-directed learning; to
encourage learners to consider, reflect upon and use their goals to direct action, rather
than as Hammond (1989) states allowing them to "sink or swim in a sea of links and
nodes".
4.5.2 Effective learning and effective knowledge mapping
In the previous chapter a number of arguments were advance in favour of the use of
knowledge mapping as a learning activity. In this study subjects were merely given a
knowledge mapping tool and told to use it to help them to create and organise their notes;
no explicit instructions , were given to encourage them to construct network
representations. As a result of this only three of the pairs used the knowledge mapping
tool in the way it was intended, and only one of these pairs, pair 3, constructed anything
like an adequate network. It is an issue for debate whether this had any additional effects
on learning: certainly the post-test showed little difference. Future research may assess
the educational effects of learners being more strongly encouraged to construct overview
networks, to see if, as a number of theorists argue (see Novak, 1990; Novak and Gowin,
1984; Fisher, 1990; Kozma 1992 and Chapter 3), it is useful contribution to our armoury
of educational approaches.
94

5
Developing and evaluatingtools to support learningand access
5.1 STRATEGIES FOR MORE EFFECTIVE LEARNING ANDSEARCH
Study 1 revealed that although pairs of subjects could learn relatively effectively from
hypertext, there was little evidence that learners were using their goals to drive the
interaction. Additionally, although some of the subject pairs appeared to use the
knowledge mapping tool effectively, since there was no control condition, it made it
difficult to tell if this was having any effect on learning. The first objective of this study
is to ascertain the effect that knowledge map has on learning; the second objective is to
investigate further the way that knowledge maps are constructed; and the third objective is
to investigate the possibility of supporting goal-directed access of information.
5.1.1 The problem of goal-directedness
As has been discussed in Section 2.4.5 there are a number of approaches to hypertext-
based CAL that attempt to support goal directed access of information, the use of
knowledge-based systems have proved popular. The HAN system (Scott, 1993)
generates hypermedia tutorials as a result of a student query. Information is represented
as a semantic network in which the relationships between chunks of information, for
example prerequisite knowledge, are explicitly represented. By tagging relations in this
way the system can generate tutorials that are tailored towards different user types. Such
approaches, which in many ways can be seen as the on-line generation of guided tours,
can alleviate many of the problems related to the access of information from a massive
hypertext system.
95

HIUlaps What are the components of the
p, monument, and what were its''or function?A —1eVel ties ton
sub-quest.
nnn
klWhat was the function?
4iz
Sub-question 2
Untitled
Tools to support learning and access
Such approaches are still self-directed: the learner needs to specify appropriate questions
that accord with their goals; they have to assess whether the information that the system
delivers is appropriate to their goals; and they have to decide whether the top level goal
has been adequately addressed by the information that they have covered. Study 1
showed that learners will often be captured by information that they think is interesting,
rather then making a decision as to its relevance. Given that goal-directed behaviour is
desirable if aimless wandering is to be avoided, can it be enhanced? The next section
outlines a possible way that learners may be encouraged to be more goal-directed.
5.1.2 Supporting goal-directed access
A strategy encouraging activities that go some way to fulfilling these requirements was
used in one condition of the study reported below. This strategy was used alongside an
augmented knowledge mapping tool. An example is shown in Figure 5.1.
adckesses
AAnswer (function)predic6-
SolsticeAlignments finrtn avenue
Astrono Aliceenents
EN/S RowsPredicts _If]
Equinox
Figure 5.1 An example of the augmented knowledge mapping tool showing questions,subquestions, concept nodes and answer nodes.
The strategy adopted was similar to PQ4R (Thomas and Robinson, 1972) in that it used a
simple question and answer model in which learners are required to express their goals in
terms of a question which is set as the top-level study question.
The top-level question is represented as a question mark icon. Learners then try to break
this question down into sub-questions; this is supported by browsing the titles in the table
of contents of the hypertext system. Once learners have specified their goals in the form
of questions, they can use the knowledge mapping tool to record notes and construct
graphical representations of the domain information, in an attempt to address these
96

Relied upon goals,express them as a
question
I Create a set ofsub-question to the goal
question
I Access informationreading it to answer
questions
Try to determ newhat ts rmss ng
QLIT
i L nk the nodes nto
the network
Yes
II.
Tools to support learning and access
questions. Thus, learners are encouraged to reflect upon their goals. Explicit answers to
the questions can be given by the use of special answer nodes that form a bridge between
the questions and notes made by the learner.
Figure 5.2 shows a flow diagram which summarises the main aspects of this strategy.
Figure 5.2: A flow chart of the ideal strategy.
5.2 EVALUATING THE EFFECTIVENESS OF CONCEPT MAPPING
AND QUESTIONING STRATEGY
A study was designed to explore the use of three forms of tools: to support note-taking,
to support knowledge map generation and to support goal formulation using the question
and answer tool. The study addressed two questions: did use of the knowledge mapping
tool result in more effective learning when compared to notes only; and did the use of the
question and answer tool result in more goal-directed access of material.
Learning was measured by use of a post-test that consisted of a battery of questions
relating to the domain of study. It is hypothesised that because knowledge mapping
encourages learners to actively construct networks relating to the material in the hypertext
97

Tools to support learning and access
system, use of the knowledge mapping tool should enhance scores on the post-test. It
could be argued that using a note tool for comparison may be artificial in that it may
prohibit learners from performing activities that they may normally use, such as drawing
diagrams. However, since a number of hypertext systems allow users to make notes,
this was the most appropriate baseline condition.
5.2.1 Method
5.2.1.1 Design
The experiment had three conditions based on the tool and instructions that subjects were
given. There were two principal dependent variables: score on the post test, and the time
spent on goal-relevant versus goal-irrelevant screens.
5.2.1.2 Procedure
The experiment was divided into two sessions: a practice session where subjects had
practice using both the tool appropriate to their condition and a hypertext system,
structurally similar but containing different material to the experimental system, and the
experimental session in which they were required to learn some material from a hypertext
system in order to answer questions later. In the practice session subjects were first
given a tutorial explaining how to use the various facilities, and were then given a task
similar to the one that they would receive in the experimental session in order to
familiarise themselves with the way that the systems could be used.
In the experimental session subjects were presented with the Callanish stone circle
hypertext system used in study 1 and a sheet of paper that outlined their study goal. They
were told that they would be required to learn about a certain aspect of the information,
set down in their study goals, in order to answer a few questions at the end of the
session, and that these would have to be answered without reference to their notes. The
study goal we the same for all subjects and is shown below:
Learn information relating to the structure of the Callanish monument, and thetheories for why it was built.
In addition to their study goals subjects were given separate instructions that outlined the
strategy that they were to use depending on their experimental condition.
The instructions for all the conditions are shown in Tables 5.1 - 5.3.
98

Tools to support learning and access
'Step 1: Question formulationTry and turn the study question into a question that you might answer, use Q-Tool to create a question icon,type you question into the question box.Go to the table of contents screen, browse the topics headings try to think up questions that relate both toyour study question and to the names of the topics headings, use Q-Tool to create further question icons,type you question into the question boxes.
Step 2: Reading and note takingAccess material that you think will help to answer you questions, read the material trying to answer thequestions that you typed in to Q-Tool (keep referring to these).When you find information that you think may help you answer these questions make notes on them bycreating note icons and typing notes into the text boxes, create a new notes icon for each piece ofinformation that you find.
Step 3: Structuring and organisingWhen you think that you have enough material to answer the questions, try to link some of the iconstogether to show how the concepts that you have made notes on relate to one another.
Step 4: Question answering.Use the material that you have made notes on to help answer the questions that you formulated in Step 1.Create answer nodes, type your answers into these. If you feel that you do not have enough information toanswer the questions, go back to the system and try to find further information. Table 5.1 Instructions for augmented knowledge mapping tool condition.
Step 1: Note takingAs you read the material in the system make notes on relevant material by creating Q-Tool 'Note' icons,and typing notes into the text box.
Step 2: StructuringWhen you feel that you have covered enough information try to link the icons that you have createdtogether to show how the concepts that you have made notes on relate to one another as you did in the firstsession.Table 5.2 Instructions for knowledge mapping condition.
InstructionsRead the information contained in the hypertext system in order to learn it. Use the note tool in order tocreate notes to help you to learn the information and write a short essay. Try and organise your notes as if, you were going to give them to someone else to read. Table 5.3 Instructions for notes condition.
The session ended when subjects considered that they had covered enough to answer
questions on the study goal. Subjects were then asked to write a brief (no more than a
page) summary of the material relating to the study goal. Following this they were given
a set of 16 questions to answer relating to the material that they had covered (see
Appendix 2 for questions and full instructions). Typically the session lasted between 1
and 1.5 hours.
5.2.1.3 Materials
The educational material was presented using the same HyperCard stack that was used
for study 1. Again as for study one, two systems were used: one for practice, the other
for the experiment proper. Subjects were also provided with one of three tools to use
depending on experimental condition. Subjects in the control condition used a note tool
that allowed them to type notes into an on-screen scrolling window. A second group
99

Tools to support learning and access
used a simple knowledge mapping tool that allowed them to create concept nodes, which
could contain notes; these nodes could be linked together to denote domain relationships.
In the third condition subjects used the question and answer strategy together with the
augmented knowledge mapping tool which allowed the creation of question and answer
nodes to instantiate this strategy (see Figure 5.1 for an example).
5.2.1.4 Subjects
Subjects were 24 students from the University of York, between the ages of 19 and 35
and were paid five pounds to take part in the experiment
5.2.2 Results
5.2.2.1 Testing for increased learning
The experimental hypothesis predicts that subjects using knowledge mapping as a
learning activity should learn more effectively than those simply making notes, thus
subjects using both the simple knowledge mapping tools and the augmented knowledge
mapping tool should score higher on the post-test than did those using the note tool.
Table 5.4 shows mean percentage scores on the post-test for all conditions; a one
factor analysis of variance shows that the difference between these three conditions is
significant: (F [2, 21] = 4.1, p <0.05).
Condition N Mean % correct Std. Dev.Augmented tool 8 44.5 20.8Knowledge mapping 8 47.9 17.8Note tool 8 24.3 14.4Table 5.4 Mean percentage scores on the post-test for each of the conditions.
Since it was hypothesised that subjects in both of the knowledge mapping conditions
should perform better than those in the notes only condition it was appropriate to use a
planned contrast to test, first whether the two knowledge mapping conditions differed
from each other, second, whether these two conditions taken together differed from the
notes condition. A means comparisons contrast test revealed that the two knowledge
mapping conditions were not significantly different (F [2, 21] = 0.143, p = 0.7), and
therefore the two conditions were compared against the notes only condition. This test
yielded a significant difference (F [2, 21] = 8.04, p <0.01).
There was a high degree of within condition variability in scores reflected in the standard
deviations shown in table 5.4; this is not surprising when the nature of the study is
considered. Such tasks are open to effects from a wide variety of subject variables such
as motivation and general ability, in addition to the variables being manipulated.
100

so
70
so
SO
Tools to support learning and access
One possible explanation for these difference is that subjects using the knowledge
mapping tool spent longer reading the material screens than did subjects using the note
tool. Table 5.5 shows that whilst there was a large difference between conditions for the
total time of the interaction (F[2,211 = 17.8, p <0.01), this was accounted for almost
totally by the time spent using the tool (F[2,211 = 21.64, p <0.01), with no significant
difference in the time spent using the hypertext access facilities (F[2,21] = 0.53, p >
0.5), or the time spent looking at the material screens (F[2,21] = 0.8, p = 0.46). It
therefore seems that the difference is due specifically to the learning activities that learners
performed as a result of using the tools that they were provided with.
Condition Total time Material screens Access facilities ToolAugmented tool 76.3 18.3 3.7 54.3Knowledge mapping 50.1 14.2 4.0 32.0Note tool 34.7 17.3 3.1 14.3Table 5.5 Percentage of time spent on each of the facilities
We can further ask whether the knowledge mapping tool had any qualitative effect on the sort
of knowledge that subjects learned. It could be argued that since knowledge mapping places
an emphasis on the relational aspects of the domain, then it may help in the learning of this
type of information over an above any general effects on learning. In order to test this, one of
the questions (with a maximum score of 18) in the post test required learners to draw an aerial
diagram of the layout of the stone circle main site. There was no aerial diagram in the material
contained within the system, and it seemed that knowledge mapping may focus learners on the
relationships between the components of the circle that made up the main site, helping them to
produce a better diagram than the note tool subjects. The results reveal that although subjects
in both of the knowledge mapping tool condition scored higher on average on the overview
type questions than did the subjects in the node tool, there was no significant interaction
among these conditions.
40•
30 AugmentedAr0/°°°./.°A
20
--*-- knowledge mappingtool
—11-- Knowledge mapping
10 - —A-- Note tool
Overview Factual
Figure 5.3 Interaction between question type and condition.
101

Tools to support learning and access
Figure 5.3 shows a plot for the mean score for each type of question per condition
expressed as a percentage of the total possible for these type of question. The graph
shows that if there is any disproportionate effect of knowledge mapping then it appears to
bias on the factual questions rather than the overview.
5.2.2.2 Discussion
The results appear to show that knowledge mapping tools have a positive effect on
learning when measured by scores on a post test. However this result tended to be
distributed across all the questions rather than being confined to questions that require the
subject to abstract and form links between domain concepts as shown in Table 5.3
(above). This is contrary to the predictions (see Section 3.4.2.2) which would state that
the task of linking domain concepts together should aid the acquisition of this form of
relational knowledge, over and above any increase in basic factual knowledge.
This observation should not be seen as damning for knowledge mapping tools because it
is likely that any such effect is likely to occur over a longer time span than was possible
in an experiment of this kind, and may also require more training or experience than
subjects received in this study. There is also an alternative explanation for this result
which is that the relations that subjects focused on when creating the knowledge map
were not the relations that would enable them to draw a better overview map. However,
if we look at the maps that subjects produced (see Appendix 2) it does appear that most of
them included at least a few of the principal components (North Avenue, Central Menhir
and so forth) as concept nodes. Perhaps the most likely explanation for the absence of
any proportionate difference in factual versus overview questions is due to a combination
of subjects not focusing on all of the relevant components, plus the lack of sensitivity of
the so-called factual and overview questions to measure what they are intending to
measure.
5.3.2.3 Testing for more goal-directed access
The second hypothesis tested was that the question and answer strategy should make
subjects more goal directed in the way that they accessed material. This was investigated
by measuring the time that subjects spent on material screens that were judged by the
experimenter as being relevant to the goals that they were given, and the time spent on
screens judged irrelevant to the goals. An index of goal-directedness was calculated by
dividing the time spent on goal relevant screens by the time spent on goal irrelevant
screens. Table 5.6 summarises the results of this for condition 1 and condition 2. There
is very little difference in the mean for both conditions, and unsurprisingly this result is
non-significant using a one way ANOVA (F [2, 21] = 0.3 p = 0.74), there is also a great
102

Tools to support learning and access
deal of individual variation, particularly for condition 1, indicating that the strategy and tool
are having little effect on goal directedness.
Condition N Relevant /irrelevant Std. Dev.
Augmented tool 8 0.67 0.16
Knowledge mapping tool 8 0.72 0.15
Note tool 8 0.66 0.16
Table 5.6 Times spent of irrelevant/relevant screens
Table 5.7 (below) shows the mean number of screens accessed for each condition,
included also is the efficiency index used in the previous chapter. Note that unlike the
table shown
above, this one shows the number of times a certain type of screen was used, not the
length of time that the subject stayed there. Note that subjects using the two knowledge
mapping tools see slightly fewer new screens than do those using the note tool. They
also see more old screens than do those using the note tool; both of which are reflected in
the higher efficiency index for note tool subjects, when compared to knowledge mapping
subjects.
Condition Contents Index New Old Total New /Total
Augmented tool 15.37 0.13 25.88 15.25 41.00 0.67
Knowledge mapping 13.75 0.25 24.13 16.25 40.37 0.61
Note tool 10.50 0.00 29.25 12.00 41.25 0.72
Table 5.7 Mean numbers of screens accessed per condition.
Finally, on this line of investigation, we investigated the across condition difference in
the extent to which subjects accessed information screens that were central to the goals
that they were given. Here the notion of central information differs from relevant in
degree. Relevant screens contain information that is useful background as well as
information that is specifically referred to in the questions; information that is central to
the task consists only of those screens that are necessary to answer the questions. There
were nine such screens in the hypertext system, and it is suggested that access of these
screens is essential for completing the task effectively. Naturally there is more to the task
than this: in addition to accessing them the subjects must understand and be able to recall
the information; however information must be found before it can be learned. Subjects in
the augmented knowledge mapping condition accessed on average 13.50 of these central
questions; subjects in the knowledge mapping condition accessed 14.12; and note tool
subjects accessed an average of 14.75. These results again indicate that the question and
answer strategy is having little effect on subjects search behaviour.
5.3.2.4 Discussion
The question and answer strategy appeared to have little additional effect on either
learning outcome or the goal directedness of the access strategy. No additional effect on
103

Tools to support learning and access
learning, over and above that gained from knowledge mapping, was predicted, and the
non-significant effect of the augmented knowledge mapping tool on the post-test scores is
of little concern. Of much greater importance is the observation that there appeared to be
no difference in the goal-directedness of the learners, at least as measured here. The
results are not even in the predicted direction with note-tool subjects accessing slightly
more of the central screens than did those using the augmented tool; and appearing to do
this more efficiently (see table 5.7 above).
A major problem in encouraging planning is not just getting them to formulate plans, but
getting them to adhere to them once they have been formulated. We envisaged that
learners would be encouraged to address the goals that they formulated as questions by
being required to create a knowledge map to link in to the questions using answer nodes;
addressing their goals would be part of the creation of the knowledge map. However
many subjects complained that the knowledge map could not be linked to the question
nodes in any meaningful way. The knowledge maps in this study tended to be created in
a bottom-up, opportunistic fashion and thus the material relevant to the questions tended
to be distributed across a number of nodes, mixed up with less relevant information.
This made it difficult for learners to link any of this information into the questions.
Figure 5.4 (below) shows a typical map from the augmented tool condition. Notice that
there are three question nodes, and two answer nodes. The subject followed the
instructions insofar as the questions were created at the beginning of the interaction, and
the answers towards the end, but there was a failure to link these in to the map in the way
required by the strategy. A possible reason for this is that the map is hierarchical, starting
with a top node 'types of monument', with all the examples of the component types
stemming from this. The uses of the monument (the second lower order question) are
linked into this hierarchy by way of the 'use' relationships. It is therefore pointless to
link answers in to the map as no one point can be linked to an answer in a meaningful
way.
A further reason could be that of the material labelled irrelevant may have been seen by
the subjects are useful background information irrespective as to whether it was directly
relevant to the study goal. This would have meant that even subjects using the
augmented tool as it was intended to be used would spend time on so-called irrelevant
screens. Finally there may have been problems with the study itself relating to the size of
the hypertext system used. The system contained around 60 screens of information, and
it could be that this may not have been large enough to elicit an effect as it was within
subjects means to access and skim read all of the screens within half and hour—which is
what many of the subjects did irrespective of condition.
104

menhirs
Types of monument Examole
e.g. — E..types of monument
I e.g.Question
Main circle Burial chamber
UseNorth avenue
Use
Tools to support learning and access
Dolmens
kUseUses
Types of monument
central menhir
UsessUses
religion
/grolos
Examo7eExarnole
astronomyUses e.g.
Lunar observation
Clock Compass
Figure 5.4 A typical map from the augmented tool condition.
5.3.2.5 What is the source of the effect on learning?
So far we have discussed learning and search as if they are separate processes, which can
be supported in different way. Whilst this is in many ways true, it is also the case that
both processes, or sets of process, are interdependent. For example, the successfulness
at which an individual can find something in a hypertext system of book (supposing that
the hypertext is logically structured) will be easier if that person knows something about
the domain: if one wants to find X and one knows that X is related to Y, and one knows
how to find Y, then one can do worse that going to Y and starting the search there. On
the other hand, learning is dependent on the ability of the learner to find information that
they are interested in: if learners do not find the correct information, or they find the
wrong information then they are not going to fulfil their goals no matter how much of the
material they can recall.
Given that we obtained a significant increase in the post-test scores for both groups of
knowledge mapping subjects, it seems interesting to discuss what the source of this effect
may be. There are a number of possibilities, which are not necessarily mutually
exclusive.
The first factor that needs consideration is that learners were somehow spending more
time reading the information screens in the knowledge mapping conditions when
compared to the note taking condition. Table 5.5 shows that contrary to this prediction: it
is note-tool subjects who spent the most time reading. However, lower efficiency indices
105

Tools to support learning and access
for both groups of knowledge mapping subjects may indicate that although subjects were
spending roughly similar amounts of time reading the information as a whole, this time
was distributed differently. Subjects using the knowledge mapping tools tending to
spend more time on a smaller set of screens, and note-tool subjects tending to spend less
time on more screens. These difference were not statistically significant, but it could be
that the using the knowledge mapping tools were forcing learners to go into more depth
than if they were simply making notes.
A more plausible factor is the possible confounding effects of time on task. Table 5.5
indicates that although there was no significant difference between the time spent reading
information across the conditions, there was a highly significant difference among the
times for the interaction as a whole, which was basically a function of the time spent
using the tool, since no other factor was significant. Table 5.8 shows a correlation
matrix of some of the main variables.
Scores Total time Time using toolScores LoopTotal times 0.405 * 1.000Time using tool 0.426 * 0.938 ** 1.000Time on screens 0.143 0.341 0.030Table 5.8 Correlation matrix of principal variables for all three conditions
* significant to p < 0.05. ** significant to p < 0.01
To test the possibility that time on task was the main cause of the effect we performed and
analysis of co-variance (ANCOVA) using time using the tool as a covariant. This
revealed that when time was taken into consideration there was no significant main effect
of condition on score (F [1,18) = 3.137, P = 0.09). This obviously causes some
problems interpreting the results: could it be that the effect was merely due to subjects
spending more time processing the information? Possibly, but it must be stressed that
simply spending more time processing information does not necessarily increase learning
(Craik and Watkins, 1972); what is important is the amount of time that the learner is
meaningfully engaged in activities that aid retention and comprehension, such as
elaborating, organising and so on. This last stated point could indicate a possible source
of the effect; it is known that forcing subjects to organise words increases the degree to
which they can recall the words at a later date (Mandler, 1967). Something similar seems
to be happening here: when total time is decomposed into its subcomponents of time
using tool and time reading screens as above, the largest single predictor of the score on
the post test is the time that subjects spent using the tool, whatever that tool was (note
tool, knowledge mapping tool, augmented knowledge mapping tool). Thus it seems that
is not how long subjects spent reading the materials (so long as they read long enough to
access sufficient information), it is how long they spent summarising and knowledge
mapping.
106

Tools to support learning and access
Table 5.8 is rather limited since it groups together subjects from all the conditions, Tables
5.9 - 5.11 show the results for each of the conditions, the purpose being to ascertain
whether the above finding is true for all conditions, or just an artefact of collapsing the
conditions into a single correlation matrix (there is also an additional variable, map score,
that I shall discuss in due course).
Score Total time Time on screens
Score 1.000
Total time 0.049 1.000
Time on screens 0.500 -0.115 1.000
Time using note tool 0.049 0.318 0.016
Table 5.9 Correlations for note tool condition
Score Total time Time on screens Time using tool
Score 1.000
Total time 0.517 1.000
Time on screens -0.135 0.383 1.000
Time using tool 0.654* 0.381 -0.166 1.000Map score 0.622*, 0.082 -0.636 0.538
Table 5.10 Correlations for knowledge mapping tool condition
Score Total time Time on screens Time using tool
Score 1.000Total time 0.147 1.000Time on screens 0.379 0.387 1.000Time using tool -0.039 0.863* -0.166 1.000
Map score 0598* 0.693* 0.753* 0.334
Table 5.11 Correlations for augmented knowledge mapping tool condition
* Significant to p<0.01
It can be seen from the tables that total time only correlates highly with scores for the
knowledge mapping tool condition. For the note tool condition the only reasonably high
correlate with score is the time spent on the information screens, with the time spent
taking notes having little relationship with score. For the knowledge mapping condition
total time, time using tool and map score all correlate quite highly with score. For the
augmented knowledge mapping condition, only map score has a reasonably high
correlation. What are we to deduce from these data? First of all due to the small sample
size these data should be treated with some degree of caution, it is probable that they
occurred by chance. Setting this aside for the moment, and treating the effect as real
leaves us with the question as to why the use of the knowledge mapping tool correlated
highly with the final score whilst time using the note tool and augmented knowledge
mapping tool did not.
A possible explanation is that the amount of time spent taking notes did not correlate with
final score because learners tended to use it to copy down bits of the text (either verbatim
107

Tools to support learning and access
or in summary form) without attempting to organise it in the form of an overview. This
is one of the functions of notes in the real world, they are made so that we do not have to
remember information. Subjects using the knowledge mapping tool on the other hand are
encouraged to organise notes into an overview; the extent to which they did this (we can
get a rough guide by time using the tool) would correlate with the score on the questions.
The low correlations for the augmented knowledge mapping tool are likely to be due to
the fact that many of the activities that they were instructed to use the tool for were not
directed towards learning; a fair proportion of the time was spent formulating questions
and creating question and answer nodes. It is likely that these activities had little effect on
the degree of learning; thus subjects who spent a large amount of time creating questions
did not necessarily score any higher on the post-test than those who spent less time doing
this.
A further reason which may account for the noted effect is that because the knowledge
mapping tool was novel it made learners more motivated to learn the material than if they
merely made notes. This is a pbtentially damning criticism; it implies that when learners
become familiar with knowledge mapping tools the effects noted in this study may
reduce, perhaps to zero. This is a criticism that is very hard to escape; only long-term
studies with learners familiar with knowledge mapping tools could provide evidence to
the contrary. It is, however, worth examining how salient the novelty of the knowledge
mapping tool would be in this context. All subjects for this experiment used tools that
were novel to them. None of the subjects had ever used a hypertext system before; a
surprisingly large number (about 20%) had never used a word-processor before, and
90% had never used a Macintosh before. Thus the overwhelming majority of subjects
were encountering a wide array of novel features, and it seems stretching the point to
argue that an additional novel facility, the knowledge mapping tool, would have much
additional effect on motivation when placed in an array of unfamiliar artefacts.
Novelty could conceivably count against the learner. Subjects in this study had only
limited experience using the knowledge mapping tool, familiarity with the tool could lead
to a reduction of the motivating effects of novelty, assuming that they exist, but this may
be offset by positive effects of learning to used the knowledge mapping tool more
effectively.
Perhaps the most compelling single reason is that learners in the two knowledge
mapping condition are being encouraged to organise the notes that they made. Some
weakly supportive evidence for this position comes from correlations between objective
scores for the knowledge maps, and the final score on the post-test. It is assumed that a
well-formed knowledge map should contain the following attributes: a large number
rather than a small number of nodes, as many concepts should be identified as possible,
108

Tools to support learning and access
and superordinate concepts should be differentiated; concepts should be linked to show
relationships; relations should be given meaningful names; names should be explicit
rather than general. Therefore, a relatively objective index could be obtained simply by
marking the maps using these criteria. Each of the maps were marked and a point was
given for each node, a point for each link and so on until a final score was elicited. When
these scores were correlated with the final score for each subject, it was found to be 0.62
for the knowledge mapping condition (the second highest correlate behind time using
tool), and 0.6 for the augmented knowledge mapping condition (the highest correlate in
this condition)—see Tables 5.10 and 5.11. Both of these correlations are significant to
p<0.01. the greatest correlate obtained for any of the variables, including total time.
This result suggests that subjects producing well organised maps are tending to score
higher on the post-test than those producing less well organised maps. This result could
be interpreted causally: that subjects who score better than average do so because they are
devoting more of their time to organising and structuring the nformation that they are
working on; or, alternatively, both the degree of organisation and the scores on the post-
test may be due to some underlying factor such as motivation or meta-cognitive strategy,
which is accounting for them both. Again, there is no way of knowing this from the
results of this study, and it is something that needs to be tested empirically.
5.2.3 Summary of quantitative results
Knowledge mapping, therefore, seems to have some beneficial effect on learning, and
that this effect is one of generally enhancing performance on both relational and factual
information, rather than overview type questions. This does not necessarily mean that
knowledge mapping is not having a differential effect on the acquisition of the overview,
it could be argued that by constructing a graphical overview in the form of a map, one is
requiring learners to organise their ideas at a high level, which in turn is having a knock
on effect: factual information being more easily retained because there is more structure to
the learners ideas. This is something that has been observed widely (Mandler, 1967;
Meyer, 1984; Meyer, Young and Bartlett 1989, ).
Use of the augmented tool appeared to have no effect on the goal directedness of the
strategy; that is, subjects using the augmented tool spent roughly the same amount of time
on irrelevant screens as those using the note tool and knowledge mapping tool; and they
actually saw fewer, on average, of the screens that were central to answering the
questions.
109

Tools to support learning and access
5.2.4 Qualitative results
In addition to being interested in the effects of knowledge mapping on learning, we were
also concerned with the way that the actual tool was used. In order to evaluate this,
screen recordings were made which could allow us to observe the process of map
construction.
5.2.4.1 Investigating the process of knowledge map construction
Knowledge mapping tools, it is argued, can support the organisation and assimilation of
knowledge and ideas. The maps in this study showed different degrees of organisation,
based on how specific subjects were in specifying relationships between pairs of
concepts. Four types of organising behaviour was elicited during the observation
process: spatial clustering, nameless linking, the use of superordinate link names and the
use of structural links.
Spatial clustering. This is Where learners use the spatial features of concepts such as
proximity to and distance from other concept to denote relationships. Figure 5.5 shows
evidence of spatial clustering, with three clusters denoting information relating to the
structure of the stone circle (the five nodes in the middle left), its function (four nodes at
the top right) and its builders (two nodes, bottom right). Although at first blush these
clusters may appear to be a post-hoc reconstruction of events, by observing the screen-
recordings the subject could observed dragging the nodes into the parts of the screen that
they occupy on the diagram. Ignore the links for the moment; these were added later and
indicate another type of organising behaviour.
Nameless linking. A more specific from of organising is by using nameless links to
declare an, as yet, unqualified relationship between concepts; relationships are posited
between concepts, but the specific relationship is not specified. Figure 5.6 shows an
example of this. In this example the links are not strictly speaking nameless, but all apart
from one are numbered with respect to the order in which they were created, the names
therefore bear no relation to the concepts that they link.
Superordinate link names. The final and most precise from of organising observed was
executed by linking concepts together and providing a label for what the objects have in
common. Note this learners are not structuring, these links because there is apparently
no attempt by the subject to try to integrate the concepts by specifying an explicit
relationship. Instead the name specifies commonalities and differences among concepts.
In Figure 5.6 the three link names relate to commonalities between the linked concepts.
110

sun
origins of stones
/circleconstruction
menhir n avenue
construction
burial chamber
• w s rows
bulders
moon
mystic
ast priests
astronomy —CI
obs sitesname derivtypes of stone
s
Ch-1 hfe 3
Migrant Settlers Life 20008C Usage (Pries:3...;5Location
e'Builders
sun
The moon
\4
4.5
Tools to support learning and access
Figure 5.5 Map showing failure to link, spatial clustering and superordinate linkorganisation.
Figure 5.6 Map showing arbitrary link names being used to organise information
In contrast to superordinate link names, the use of structural links show an attempt on
the part of the learner to indicate the specific relationships between pairs of linked nodes.
In general structural links tended to be hierarchical, part of type relationships although
other link types were used. Figure 5.7 shows a map from the study that contains a large
number of structural links, for example the relation names a component of part of and
built by. All state in precise terms the relationships between concepts.
On average there were slightly fewer structural links than organisational links created (4.1
compared to 4.9).
111

theMamo inSite \-,,,,.,,..a copnent o7
J oonponent ofa component of
a componen t ora conronent of
CeannNulavig
oonsists of
yth)Complex
"7. part- of \part of part of
North Avenue
theCentralMenhir .;n* sIde
&Mt by -------n----
E1-----Callanish
/theBuilders used for
CnocCulaChleit
Purposessuch as
Alignments
theRows
insideburialCharnber
theStoneCircle
Tools to support learning and access
Figure 5.7 Map showing a large number of structural relationships
5.2.4.2 The relationships between organising and structuring
Ferguson-Hessler and de Jong (1990) looked at the sorts of learning activities students
display when using physics texts, they found five subcategories of activity that they
termed integration, these are:
(1) Recognition and emphasis of salient integrations within the text.
(2) Integrating knowledge by writing summaries, outlines, etc.
(3) Imposing structure on ideas within the text.
(4) Clarifying assumptions and checking relationships.
(5) Visualising the relations by drawing graphs, networks and so on.
These activities, it is claimed, are engaged in a roughly sequential manner, although no
activity is mandatory, or a necessary prerequisite of others. Note also that activity (5)
will not apply in this case since knowledge mapping requires learners to perform this
activity as a matter of course. What Ferguson-Hessler and de Jong's scheme does imply
is that each of the activities provides a certain output that can be used by other activities;
for example: recognising and integration can give rise to summarising activities which
explicate the integrations further; structuring the information can give rise to clarification
or visualisation activities. Ideally knowledge mapping should not only encourage the
engagement in the aforementioned individual activities, they should also allow the smooth
progression between different categories of activities, with the output of one activity or
112

Tools to support learning and access
process feeding into another. As we have seen this may not necessarily occur. Learners
using links to organise their ideas may not be able to use them to impose structure; often
concepts, some of which had been spatially organised, remained unlinked (see Figure 5.5
for an example), and concepts that had been linked using organisational links often
remained so, with little attempt by subjects to specify them as structural relationships.
This last point may be explained by subjects' apparent reticence to revise their maps: an
average of only 1.6 revisions were made per subject during the course of the interaction;
links that had been used for organising would have to be deleted, or at the very least
renamed if they are to be replaced by structural links. As a result the ability of the tool to
encourage knowledge structuring as opposed to knowledge organising will be severely
restricted.
The lack of revision does not only have implications for the formation of structural
relationships; it is known that during the process of learning a learner's understanding of
the domain will change, often resulting in some degree of restructuring (see Chapter 1).
If knowledge maps are supposed to be representations of the learner's understanding,
and their role in communication suggests that they should be, then they should also be
restructured accordingly.
5.2.4.3 Accounting for these results
These problems may in some ways be artefacts of the study itself. First the session may
have been too short, if subjects were given more time, or more demanding tasks then
they may structure and revise their networks more than they did here. Second, because
the task had no importance to the subjects outside of the experiment, it may mean that
they were prepared to make do with inadequate maps more than they might do if the task
was considered important, for example if it was a course requirement. Third, since the
material itself was novel, and in many ways not 'real' material, this may also have
implications for the Way that networks were constructed. Fourth, subjects only had
limited experience with knowledge mapping tools. None of the subjects had ever used
such a tool before, and it may not be too surprising that they produced maps that were
perhaps not as well structured as they might have been. Novak and Gowin (1984) argue
that in order for knowledge mapping to be a truly effective learning activity, learners must
put in many hours of practice constructing networks. Given the limited experience
subjects had using the tool the results were surprisingly good (see Figure 5.7 for a very
good example of a map). In truth, any attempt to evaluate computer-based tools is
always going to encounter problems as to how well the results can be generalised to other
tools, tasks, materials and subjects. This study should therefore be seen as contributing
information to a growing corpus of data which can inform our understanding of issues.
On this point there is some evidence that problems analogous to those encountered in this
113

Tools to support learning and access
study occur in real-world situations (Fischer, 1988; Shipman and Marshall, 1993) and it
is likely that they are not simply artefacts of this particular study. The issues mentioned
above have implications for the effectiveness of knowledge mapping tools in general.
One of the assumptions behind tools such as SemNet is that forcing learners to link
concepts encourages them to think about structural relationships. The results of this
study indicate that simply requiring learners to link is not enough as links can be used for
purposes other than structuring such as organising. Additionally all knowledge mapping
tools seem likely to suffer from the problems caused by the reticence of learners to
impose structure on knowledge and restructure extant networks that they have created,
simply because they require learners to use semi-formal representations. Shipman and
Marshall discuss a number of cases where learners apparently fail to organise and
structure effectively in areas as disparate as design and office filing. It seems that the
desire of individuals not to commit themselves to a structured representation prematurely
may be a major stumbling block for knowledge mapping. On the topic of restructuring
Fischer (1988) states that: . "Despite the fact that in many ways users could think of better
structures, they stick to inadequate structures, because the effort to change existing
structures is too large."
5.3 CONCLUSIONS
This study showed only two significant differences between the three conditions: that on
average knowledge mapping subjects performed better than note tool subjects; and that
subjects using the knowledge mapping tools spent more time using this tool that did those
subjects using the note tool. All other differences were slight and non-significant.
Perhaps of more interest than these quantitative results are the great variations in the maps
that were produced.
In sum when one tries to unpick the tangle of data that this study produced there are five
tentative observations:
• Knowledge mapping seems to be useful for learning; and, although it is not
immediately clear why, it may just be that it forces learners to spend more time
engaging in meaningful learning activities.
• Proposing questions does not necessarily have an effect on goal directedness of
search.
• The augmented knowledge mapping tools, as used here, sit at the confluence of
bottom-up and top-down note taking processes, and as such can make integration
difficult.
114

Tools to support learning and access
• Subjects revised maps very little, and revisions tended to be trivial rather than
significant.
• Subjects, in the main, tended to avoid the use of specific relation names.
Chapter 6 looks at some of these issues and tries to devise a way to encourage learners to
be more methodical in the maps that they produce. The next chapter looks at knowledge
maps that were constructed as part of a psychology course to ascertain whether the
qualitative differences noted in this experiment are peculiar to the particular demand
characteristics of this study.
115
6
Evaluation of paper-basedknowledge maps
6.1 INTRODUCTION AND MOTIVATION FOR STUDY 3
One of the problems with Study 2 is that many of the qualitative issues of knowledge map
construction could be interpreted as being due to the fact that the task was somewhat
artificial, and because subjects were simply told to construct maps to help them learn,
knowledge mapping was a secondary task. In order to obtain a clearer picture of the
issues involved in knowledge mapping it seems useful to look at knowledge mapping in a
variety of situations, Study 3 was an attempt to obtain data of a different sort.
Study 3 investigated knowledge maps on the topic of human memory constructed as part
of a cognitive psychology course. It was anticipated that the maps produced would throw
up some interesting issues in knowledge mapping for two reasons: first, because the
maps were to be assessed as part of the course they make the students more motivate,dt.Q,
produce well-formed maps; and second, because the domain was more complex and open
ended than the Callanish materials. Of course an obvious difference is that in Study 2 the
material was presented using hypertext, whilst in this it was not. Such considerations are
largely irrelevant to the process of knowledge mapping: in both studies the task was to
assemble information together, making explicit links that are tacit in the text.
The maps were discussed during tutorial sessions so it were possible to get some idea as
to how useful students found the maps in an educationally valid situation. Unlike study 2
the conditions were not controlled: no variables were manipulated, neither was the
process of map construction observed. It was felt, however, that valuable insights could
be gained into the issues of knowledge map construction, and their use in communicating
ideas to others.
116

Evaluation of paper-based knowledge maps
6.1.1 Subjects
In total 35 undergraduate students were required to construct the maps as an assignment
as part of their cognitive psychology course. Only 29 of the 35 assignments handed in
contained meaningful maps (some students preferring to ignore the instructions and
produce textual summaries); so only 29 were analysed.
6.1.2 Instructions
The instructions were give to students on a printed sheet of paper (see Table 6.1). In
addition verbal instructions were given to the students at a lecture preceding their tutorial,
together with examples of knowledge maps.
The purpose of this tutorial is to gain a clear overview of key issues in work on normal human memory.Rather than write an essay or 'short note' answers on this topic, I would like you to generate (if possibleon a single sheet of paper) a diagram summarizing your understanding of:
. The structure of human memory
. The processes operating within that structure
Key theories and evidence (if appropriate)
I will give some examples on the sort of thing I have in mind in the lecture. Obviously the diagram willbe rather high level: it could show what you consider to be the key points, and key relationships andinfluences. It may look like a number of boxes or headings joined by lines and arrows — but its up to youto choose a notation that you feel most effective.
You may well like to supplement you summary overview with some notes. Much of the relevantinformation can be found in Chapter 5 of Eysenck and Keane.
Come to the tutorial prepared to discuss and justify you overview. A possible exercise at the tutorial willbe to work jointly to combine the overviews which people bring along into a single 'best solution'.
Your diagram and notes should be handed in at the end of the tutorial: your tutor will add comments andreturn the work to you later in the term.
Table 6.1 Printed instructions given to students.
6.1.3 The task
For this exercise, as can be seen from the instruction in Table 6.1, students were required
to produce an overview summary of normal human memory. Prior to this task students
had been to several lectures on human memory but this was the first time that most of
them had attempted to integrate the information. The task was novel in that there is no
such map available in any of the text books available to students, and no such overview
was given by the lecturer. In fact, whilst text-books often contain diagrammatic
representations of process and structure (such as the famed modal model), there is
frequently little attempt to abstract across particular theories, nor to integrate evidence into
117

Evaluation of paper-based knowledge maps
this structure; and integrations that do occur tend to be tied specifically to subcomponents
of memory, such as working memory, or to specific models of memory.
It was anticipated that as well as being an interesting exercise from the point of view of
exploring knowledge mapping, students would find the task of educational benefit.
Students encounter a bewildering array of different 'types' of memory over the lecture
course and from background reading; a cursory glance at a cognitive psychology text
book revealed the following types of memory: short-term, long-term, working,
autobiographical, flashbulb, procedural, declarative, episodic, semantic, prospective,
retrospective, echoic, iconic and haptic. Many of these memory systems overlap with or
are modifications of other memory systems, some terms are used interchangeably, whilst
others are distinct systems in there own right. The task of attempting to draw together
these systems would, it is hoped, aid students in gaining some form of overview of the
topic.
The fragmentary nature of memory is not something that is confined to student textbooks,
indeed Barnard (1987) reflects that:
"...theories in cognitive psychology tend to be un-integrated both with respect tothe computer metaphor and in relation to the different components of mental life.The fragmentary and paradigm-bound nature of cognitive theory has been widelydiscussed as has the apparent inability of experimental research to delivercumulative theoretical developments of unifying principles for informationprocessing..."
Although referring to cognition in general, and not just memory research, this statement
indicates a major problem in learning about memory in general, and the task outlined here
in particular. Forming coherent integrations about the structure of memory is difficult,
not just because it is complex, but also because many integrations do not exist. How,
therefore, can students integrate the structure, process and evidence relating to memory if
psychological researchers. have consistently failed to do so? However often the journey is
better than the arrival and the same is true for knowledge mapping; it is the process of
floundering in the conceptual quagmire that leads to enlightenment, not simply the end
result.
Some of the factors of interest were:
(1) The overall macro-structure of the maps produced,
(2) The degree to which information relating to the three subgoals of process, structureand argument were included,
(3) Integrations between any of these bits of information,
(4) Any misconceptions or areas of poorly defined knowledge.
118

Evaluation of paper-based knowledge maps
The following sections investigate these issues.
6.2 ANALYSES OF KNOWLEDGE MAPS
Analyses of the maps took place at several levels: a broad analysis of the overall structure
of the maps, a more detailed analysis of the successfulness by which students achieved
the goals of the task, and an analysis of various deficiencies in the maps.
6.2.1 Analysis of macro-structure
Any text or discourse will tend to have some structure that has been selected by the
speaker or author to serve some rhetorical goal. The structure, however, is rarely pure
because the author has to work on a number of levels. Thus, argument may be mixed
with exposition; chronological sequencing may at times be tempered with a need to
explain outcomes before premises. Nevertheless one structure, the macrostructure, will
tend to dominate as an organising framework for the discourse. Similarly, maps such as
those produced here will coMain their own macrostructure, on which the lower level other
conceptual relations are hung. Hence the purpose of this section is to try and establish the
macrostructures used by students, and to see what differences, if any, there are across
different students.
Four macrostructures seemed apparent: those which used information flow, those that
were based on some form of structural hierarchy, those that dichotomised process and
structure, and those that were based upon a network. Table 6.2 (below) shows the
proportions of students adopting each of these macrostructures.
Type Number.Hierarchy 3 10Information flow 20 70Structure versus process 5 17Network 1 3
Table 6.2 Number of students showing each type of macrostructure
The next sections discusses these in more detail.
6.2.1.1 Structural hierarchies
Maps based on the structure of memory take the form of dividing memory up into the
postulated components and further sub-dividing these hierarchically into finer
distinctions. Three of the 29 maps were of this sort; Figure 6.1 shows an example. Here
the first order concept of 'modal model' is divided up into three second order
components: 'sensory store', 'short-term store' and long-term store', which are then
subdivided into their various subcomponents. To a large extent the material covered by
these maps is similar to that covered by the information flow models, indeed the
119

Evaluation of paper-based knowledge maps
information flow models often have a hierarchical feel to them. The differences, therefore
between these two types of structure are subtle, but seem clear enough to preserve the
distinction.
6.2.1.2 Representations based on information flow
These maps took as their macrostructure the familiar (to psychology students anyway)
three-store model, based upon the serial processing of information. Figure 6.2 shows
this structure quite clearly. Information from the outside world enters the cognitive
system by way of the perceptual pathways into a sensory buffer (iconic or echoic
memory), then passed to short-term or working memory and finally to long-term
memory. The majority of maps were of this type accounting for 18 out of the total of 29
maps analysed.
6.2.1.3 Process versus structure distinction
Five of the 29 maps were of this type. This type of map takes as its basis the distinction
between the structure of memory and the processes that operate in it. This distinction is
largely historical, in the 1970s there was a shift in research from that based around trying
to determine the structure of memory to studies attempting to specify the processes which
operate in memory. This distinction was used as a dichotomy in the lecture courses, and
occurs in many text books (see, for example, Baddeley, 1990). Figure 6.3 shows this
type of map. The central concept of memory is divided into two sections relating to its
hypothesised structure, and the processes that are postulated. Note that in the structure
there is a three store process model consisting of sensory memory, short-term memory
(STM) and long-term memory (LTM); which forms the central organisational core of the
process-based maps, although in this case it is subordinated by a different global
structure. These maps are quite different to the hierarchical and information flow
models, and often contain information not included by these other two types. Figure 6.3
contains information relating to 'Levels of processing theory' and 'Two process theory'
which is seldom included in the hierarchical and information flow maps.
6.2.1.4 Network maps
The final category of map that was noted was one that appeared to have little global
structure at all, although only one of the maps was of this type. Maps of this type had
local structure, that emerges from the relationships between linked concepts, there is no
immediately obvious macrostructure, making it hard to read the map.
120

Evaluation of paper-based knowledge maps
Figure 6.1 A hierarchical map.
121

NW.
h-cAy»4PuT
eAs
§/vsts-ey Afir
PAM
I
4itt9 t k°11\241TC401-e., 16\XLI1/4 Cka Sk141.4
44014akf )61-t, avyttAt
k.TiM?
Evaluation of paper-based knowledge maps
TM) R ?
(1714-hZ 17 LT/'4 off":Dent ? kewntsesc.rL4DEA-000omazucr4sf
it-A4 ID TRA4t4 urm -15 6er katts4e
rox Pitetem
rui
1 ILSA4AVTICL.Tni. 121) 12 --/- Mtn a _ INFt•
Figure 6.2 map based on information flow
Kig
122

Evaluation of paper-based knowledge maps
Figure 6.3 a map dichotomisin g process and structure
123

Evaluation of-paper-based knowledge maps
6.2.2 Summary of macrostructure
It is relatively easy to see where the students obtained inspiration for some the
macrostructures above. In constructing a map, clues as to which approach to take can be
drawn from the way that the material is divided up in the lecture course and in text books.
The lecture course split the topic of memory up in to its three components and use the
modal model as a map to indicate which bit of memory the lecture was on. To a lesser
extent the lecture course and the text-books make distinctions between process and
structure of memory. It seems that subjects using these macro-structures were simply
using frameworks available to them. The network models, on the other hand, seem to be
maps that are created without the use of any global orienting framework, it seems that the
student who created this considered the relations between concepts without trying to fit
them into any macrostructure.
6.2.3 Achievement of task goals
In order to gain some insight into how well students were able to represent the
information in network form the maps were scored by the experimenter. Maps were
marked as objectively as possible, a list of essential concepts and relation names was
drawn up and the maps were checked to see in they contained these essentials. No marks
were deducted for incorrect or inappropriate maps, although these were noted (see Section
6.2.6. Relationships were given an extra mark if the name of the relationship was given.
For example a relationship between short-term memory and long-term memory would be
given one point if it was unlabelled, and two points if it was given a meaningful link, for
example 'storage' or 'rehearsal'.
The average mark for the maps was 29.5%, ranging from 6.5% to 56.5%; these results
appear quite low, but it should be borne in mind that they were marked much more
stringently than tutorial essays would have been. Additionally the maps revealed a
number of misconceptions about the domain which I describe in section *; before this I
shall briefly describe the ability of the students to information relating to the structure,
process and evidence relating to human memory.
6.2.3.1 Representing structure
The structure of memory was marked according to the number of vital components that
the maps contained, and the existence of important relationships between these
components. All of the maps should contain the concepts of sensory memory, working
memory and long-term memory; the sub-components of these specified and the
relationships between these should be explicated. In general all students produced good
maps relating to the structure of memory, scoring an average of 34.5 percent for this part
124

Evaluation of paper-based knowledge maps
of the task. Structural relationships that were often omitted were the relationships
between declarative memory, procedural memory and working memory; and the
relationships between sensory memory and working memory (here distinguished from
short-term memory).
6.2.3.2 Representing processes
Students performed less well representing the processes that have been postulated to
occur in memory, interestingly students who dichotomised between structure and process
performed no better then those who took a more holistic approach to representing their
ideas. Processes that were commonly included were those relating to attention, rehearsal,
retrieval and storage of information; those that were commonly omitted were the
processes of spreading activation, a method of search proposed for memory; knowledge
compilation, where skills become automated; and the processes of encoding specificity
and the levels of processing model of learning and recall.
6.2.3.3 Representing argument
Providing evidence for the process and structures described in the networks seemed to
pose the biggest problem to students; indeed 10 of the students included no evidence
whatsoever in the networks. Most of the other evidence included by other students took
the form of citations, for example the existence of the three component model described in
Section 6.2.4 is often substantiated with the citation: "Atkinson and Shiffrin, 1968". This
is at least partly because stating evidence can involve a 1 t of text; revealed by the
observation that a lot of students used text for this part of the task; with some
incorp rating pointers to this text in the maps itself, such as reference names or numbers.
One of the more serious problems with representing evidence in maps of this kind is that
it reflects the historical process or argument; the devel pment f theories in psychology is
cumulative, with ideas building upon, modifying and, perhaps, refuting other ideas.
Showing this dynamic process is difficult in maps of this nature, in many ways
knowledge maps represent a single story, n t multiple c mpeting arguments. For
example many students included both working-mem ry and sh it-term memory; whilst in
many ways these are often used to describe the same the retical entity, more technical
definitions, such as those of Atkinson and Shiffnn 1968 and Baddeley and Hitch 1974)
refer t systems that are subtly different, the Baddely and Hitch m del being proposed to
acc unt for certain explanatory sh rtc mings f the rie.inal idea. Students tended to
side-step these complex arguments by stating simply that the v.orking memory
superseded short-term memory m del, or w rse they simply linked workine memory to
sh rt-term memory, providing no explanati n of the relati nship.
125

Evaluation of paper-based knowledge maps
6.2.4 Synthesis
6.2.4.1 Misconceptions and mis-misconceptions
One of the claimed benefits of knowledge mapping is that they can act as sensitive
barometers of conceptual change (Novak, 1990); Fisher (1990) argues that they offer the
teacher: 'a window on the students mind'. The ability to reveal misconceptions in student
understanding is therefore and important attribute of knowledge networks. A number of
misconceptions were identified by one of the tutors on the cognition course, which were
addressed during the tutorial session. An example of one of these is show in figure 6.2.
This clearly shows that the retrieval of information is seen by this student as coming out
of long-term memory and into space, instead of back into short-term memory as is
generally supposed. Staying with this map in Figure 6.2 for a moment, the text to the
right hand side of the central box asks: "What happens to taste, touch and smell in
working memory? Are they committed straight into long-term memory?". It could be
argued that this student asked herself this question prior to the creation of this map, on the
other hand the question may have arose as a consequence of having to be explicit about
the relationships between the components of memory and different sensory inputs. There
is no way of telling which of these answers is correct (the text was only noticed some
time after the papers had been handed in), but it does seem that since the map mentions
taste, touch and smell in the 'sensory memory' box, and this box is linked directly to the
working memory box, that the question arose during map creation: the task forced the
student to be explicit about things that she did not know.
One must, however be wary to read too much into apparent misconceptions. For example
a number of students appeared to be using the concepts of short-term memory and
working memory interchangeably which would be a serious misconception. A naive
person reading the map in Figure 6.1, for example, might assume that information flows
into short-term memory;then into working memory, and then into long-term memory,
which might indicate that the student who drew the map had some misconception about
the relationship between short-term and working memory. Reading the copious notes
that this student attached to the knowledge map indicated that this was not the case: it was
merely a failure to indicate that the arrows mean different things. Some mean hierarchical
relationships, some mean information flow, and so mean that a particular idea was
replaced by another idea, as is the case in this example. The reason for this lack of
explicitness could be because, as noted above, students may wish to tell a coherent story,
or perhaps because they found it cumbersome or difficult to express certain ideas in the
network. The amount of supplementary text that students used may indicate that this is
close to the truth.
126

Evaluation of paper-based knowledge maps
6.2.5 The students' perspective
Although no formal attempt was made to assess students opinions of the knowledge
mapping exercise, by the use of questionnaires and so on, discussions with the students
as part of the tutorial sessions revealed that opinions were generally positive. Most
students found the task difficult, which is unsurprising considering the breadth of
knowledge — a good size text book's worth at least — that they had to distil into a page
summary. It was the opinion of many of the students that the task forced them to think
about the relationship between, for example, semantic memory and declarative memory,
or procedural memory and episodic memory in ways that may had not done previously.
Other students were less positive about the notion of knowledge mapping, some felt that
they could have spent their time more profitably composing an essay; others felt that
knowledge mapping merely required them to restate old ideas in a different form, without
the discipline that essays forced on them.
6.2.6 Relationships to the- maps produced in Study 2
Looking at the maps constructed for this exercise there are both differences and
c mmonalities between these and the maps reported in Study 2; in this section I shall look
first at the differences and then the similarities.
6.2.6.1 Differences
One of the main differences between maps produced in this study and the Callanish maps
was the general coherence of the maps: the memory maps, in the main, being more
integrated than the Callanish maps. Perhaps the main reason for this was in the way that
the maps were constructed; which is probably a combined function of the task and the
level of understanding of the students. The task in the Callanish study was for subjects to
learn information that they had little a priori knowledge about from a text-based source;
the task in this study was to represent knowledge that learners should already be in
possession of using a network notation. Both tasks are concerned with learning; although
superficially the memory mapping task does not seems to be a learning exercise, it is in
the sense that the task requires students to integrate ideas that are not normally brought
together during the lecture course in which they take part.
As discussed in section 5.5.2.4 the Callanish maps were constructed bottom-up: that is
the various elements of the network; nodes, links and so on were created during as the
learners understanding of the domain was still developing, additionally The result of this
is that much of the network was constructed before the learners had any sort of a schema
for the topic area. This meant that towards the end of the study when subjects were trying
to link the concepts together, many of their ideas would have changed, leading to them
127

Evaluation of paper-based knowledge maps
either altering the names of the existing nodes, or making do with what they had. The
low number of revisions indicated that most subjects made do, or saticefised (Simon,
1955) with what they had, rather than investing effort reconstructing the network. In the
maps created here, most of the students had some form of domain schema before the
constructed the network allowing them to work more in a top-down form, working
forwards from their goals, rather than backwards from the learning materials.
A second difference is that the memory maps were more consistent across individuals
than were the CaHanish maps. The Callanish maps showed wide variation in content,
structure and the degree to which the concepts were linked, the links that were present
named, and whether the names were superordinate categories or relationships. In contrast
the memory maps were more homogeneous, with the only real variations being in global
structure and content—whether items were included or not. This homogeneity is again
probably to do with the differences in task and background knowledge of the students: the
Callanish maps were constructed to be disposable, mere tools to support the learning
process; the memory maps were for public appraisal and therefore students were probably
more conscientious in producing the maps. It is impossible to know, for example, how
many trial runs students constructing the memory maps had before producing a map that
they were satisfied with: some of them certainly appear to be at least second drafts.
6.2.6.2 Similarities
There were a number of similarities between the Callanish maps and the memory maps.
Perhaps the most important was the general tendency to avoid providing link names for
many of the relationships. As mentioned in the preceding section links that were named
tended to be ones that were familiar to them from text book diagrams: the 'attention' and
'rehearsal' links between sensory and short-term memory, and short-term and long-term
memory respectively. Other commonly occurring links, for example between the three
components of working memory, were often left. Of course not all links need names, in
cognitive psychology most links are unlabelled: standing for information flow or
subsystems interacting with one another. Many of the links used by students in the maps
were of this sort, particularly where cognitive models were copied. However, not all
links were intended to denote information flow or interactions, some denoted
generalisations, integrations and so on and it was often difficult to identify what a link
meant in many cases. Some of these omissions may have been the result of oversights on
the part of the students, others may have been due to the student simply being unable to
come up with a suitable link-type.
128

Evaluation o f paper-based knowledge maps
6.3 DISCUSSION
The maps were generally of a reasonable quality containing most of the things that were
required by the task goals. However there are some issues that come out of this study
that cast a degree of doubt on the usefulness of knowledge mapping as a learning
exercise, depending on what role they are supposed to fulfil. As a means for a tutor to
extract the learners understanding, which is as they were used here, they can elicit lively
discussion, and even occasionally allow the tutor to identify misconceptions that the
student may have (see Figure 6.2 for an example of this). Alternatively, as I have
indicated, there is always the problem that what may appear to be misconceptions at first
blush, are in fact merely the result of clumsy execution. Whatever reason, problems such
as this where students appear to have misconception may indicate that they are not
reflecting upon the product of their activities quite as much as we might want them to.
The lack of precision would also cause problems for those who advocate knowledge
mapping as being a route to collaborative learning. It has been suggested that learners
may share knowledge maps that they have created, using them as a form of tertiary
learning material (Mayes, 1992). Many of the maps here, particularly the better ones,
would communicate most of the central ideas concerning memory. However, the failure
to indicate what many of the links mean, for example, whether they indicate the flow of
information, subset / superset relations or integrative relationships may cause confusion to
others.
If one sees the process of constructing maps as being of educational benefit then there are
still a number of issues that need sorting out. Many of the students reported that they
found the process of trying t explicate their ideas in the form of a network to be
challenging and, often, thought provoking. Indeed s me claimed that they were forced to
consider the topic in ways that they had n t d ne bef re, some even claiming that they
were forced to reflect on the inf rmati n more than they would have done if they had
merely used text t con% ey their ideas. Such anecd tal e%idence can be taken too
seri usly: h w w uld ne kn w w hat ones acti ns w uld have been under different
conditi ns?
As a final caveat, this study suffers like Study 2 fr m the students being untrained and
unpractised in kn w ledge mapping; after all what w uld be the quality of an essay if one
had ne%er v.ritten ne bef re? Es ays, h we%er, are the primary in alas oda semrrvent in
psych I gy and many tiler c urse; essay v.-riting is a kill that needs to be learned in
order to pass exanunati ns, kn w ledge mapping is n L Here I echo the conclusion of theprevi us chapter ii hLn I stated that kti u ledge mappng to Is must.
129

Evaluation of paper-based knowledge maps
• Encourage as far as possible uniform structures to aid communication.
• Encourage the naming of links to encourage learners to be explicit.
• Encourage reflective learning.
If knowledge mapping tools do not fulfil these criteria then they place too much emphasis
on the learners' own metacognitive skills, reducing their effectiveness in learning.
A possible way to aid the above three goals is to provide students with support for
constructing explicit, communicable maps, this is the subject of the next chapter.
130

7
Knowledge structuring tools
7.1 INTRODUCTION
Studies 2 and 3 indicate that when few restrictions are placed on the maps that learttexs
construct, the maps that are produced can often be idiosyncratic; and there is doubt as to
the extent that such maps encourage learners to examine their understanding and
communicate ideas. I suggested in the last chapter that more structured representations
may help learners in this respect. In order to do this we need to investigate the demands
placed on the student by the particular goals of the learning situation. In the social
sciences the chapters of student text books tend to be structured according to some
argumentative theme, and one of the requirements of these courses is that the students
remember, understand and can critically evaluate arguments on their own. The centrality
of argument to disciplines such as psychology led to this being adopted as the supportive
structure for knowledge mapping tools.
7.2 REPRESENTING ARGUMENT
Languages for representing argument are not new, indeed work on propositional calculus
and syllogisms dates back to the Ancient Greeks. However recent attemp s have been
directed towards representing human thought in the real world, rather than in the highly
constrained micro-worlds of logic and mathematics. Motivation for this research comes
from two fronts: from AI research that attempts to develop machines that can behave in
human-like ways; and from research into the development of computer-based tools to
support the process of human reasoning.
There is a common link in that both of these areas are dealing with human knowledge and
behaviour which typically appears irrational, arbitrary, heuristically based and non-
deterministic; computer programs are deterministic systems and require that information
be formally represented and procedures well specified. Resolving this apparent
131

Knowledge structuring tools
contradiction has led to Al practitioners developing formal theories that can cope with
messy information and incomplete knowledge such as modal logics, fuzzy logics (Zadeh,
1983) and qualitative reasoning techniques (Hayes, 1985). This problem has also been
taken up by researchers developing computer-based tools to support human reasoning,
who have been exploring the development of semi-formal representations, both to aid
communication among users, and to allow their information to be manipulated by a
computer. Semi-formal representations therefore contain elements of both formal
notations, such as mathematics of logic, and informal notations such as natural language.
The goal, therefore, is to develop a notation which is tractable both by computer and
human. Natural language is tractable for humans, but is too poorly defined to be read by
a machine; similarly propositional calculus is too formal and constrained to support many
of the tasks that humans wish to perform. Finding this middle ground is not easy, as we
shall see in the next section when attempts to develop notations and tools are discussed.
7.3 NOTATIONS AND TOOLS FOR REPRESENTING ARGUMENT
Before some of the approaches to the development of notations and tools is discussed, it
is important to discuss the differences between the characteristics of a grammar, a
representation and a tool. A grammar related to some abstract specification the various
primitive elements and linking rules relating to the notation which is free from the
particular way that it is represented. In this sense a grammar can be described using a
number of formalisms, using node-links, propositional calculus or even natural language.
For example, conceptual graphs (Sowa, 1984) can be instantiated either as expression of
predicate logic or in graphical form, without changing the meaning of the expression, a
concept known as informational equivalence (Larkin and Simon, 1987). However,
merely because two representations contain the same information does not mean that they
have the same implications for the end user, there is a further factor, computational
efficiency, which relate to the degree to which the representation facilitates use,
irrespective of the grammar. Some of these issues were discussed in Chapter 3.
Of perhaps more direct importance are the effects on the user caused between the notation
(= grammar + representation) and the tool which implements it. A notation that is
perfectly tractable may be wholly unusable if it is incorporated into a tool that makes
manipulating it difficult. An example may be with a programming language: the extent to
which the language is usable is going to be determined not just by the formalism itself,
but by the quality of the interface, the editors that are provided, the debugging facilities
and so on. In the same way the successfulness of any tool is going to depend upon
match between the operations permitted, and the various cognitive and task demands that
the user brings to bear on the tool.
132

Knowledge structuring tools
It is extremely difficult to separate out the differential effects of the grammar, the
representation and the tool and test them independently; even using paper-based exercises
brings their own particular demand characteristics. However, to some extent we can
prescribe features the system as a whole must have in order to facilitate ease of use, such
a set of specifications are outlined by Green.
7.3.1 Green's cognitive dimensions
Green (1989, 1990) outlines what he calls cognitive dimensions of artefacts. Here the
goal is to reduce the wide range of domain, task and system dependent issues into a small
number of abstract factors that he invites us to consider as being general to the use of
designed artefacts in general and computer systems in particular. Green states that his
task is after that of the physicist who reduces all phenomena in the material world down
to three orthogonal dimensions of time, length and mass; he makes no claims that the
dimensions are orthogonal, just that they may be treated as such for the purposes of
design and evaluation. The dimensions are: hidden dependencies, viscosity, premature
commitment, role-expressiveness and hard mental operations.
Hidden dependencies can be described as the degree to which a change in one aspect of a
system that effects a change in another may be hidden by the computer interface. Such a
facility is well known to anyone who has ever tried scheduling rooms: a minor change in
the status quo can cause huge changes down the line, sometimes making it necessary to
change the whole schedule. In tools such as those described in this chapter, adding or
deleting a node can necessitate changes which resound throughout the whole network.
The degree to which the system changes as a result of this, and if it makes changes how it
reveals these to the user are important consideration. Of course not all systems are
'intelligent' enough to make such changes themselves; none of the concept mapping tools
do so, neither do some of the tools mentioned below.
Viscosity is Green's second dimension, it gets its name by analogy to hydrodynamics: a
viscous substance is resistant to local changes in shape, a fluid one permits such changes
more easily. Tools that are resistant to change may result in the user shying away from
making necessary alterations to the network, simply because it involves the user exerting
too much effort. The implications of this are that users may be tempted to make do with
old, inefficient structures that are unrepresentative of their current thinking; something
that was pointed out in the quotation by Fischer (1988; see section 5.3.4.3 ) and was
observed in Study 2.
Premature conunitment to structure occurs when a system demands that a user formalises
their ideas, or commits themselves to an action before they are ready to do so.
133

Knowledge structuring tools
Occasionally this is possible, especially when the task is very familiar; however we are
often not able to specify what we are going to do in advance, even in tasks that we may
consider, at first blush, to be trivial. In their well-known study, Hayes-Roth and Hayes-
Roth (1979) showed that human planning behaviour is often opportunistic: plans are
constructed in abstract, and fleshed out later on during the actual task. Additionally, their
behaviour showed deviations and modification to plans that were constructed. The
increasingly popular view that actions are situated, performed as responses to moment-to-
moment changes in the demands of the task, also seems to prescribe that expecting
individuals to think ahead in this way is unrealistic. The implication is that systems
should not demand too much of the learner in terms of up-front specifications for action.
Premature commitment can also be problematic due to the reconstructive nature of human
understanding. In Chapter 11 outlined that the process of learning often involves some
degre,e of conceptual change, such that not only in information added to concepts to make
them richer, but the conceptual framework that holds them together can itself undergo
various forms of restructuring. Ausubel's theory of conceptual development (Section
3.2) outlines some specific examples of these types of change. There is no guarantee that
a network created at time T as a reasonable representation of a person's knowledge, is
likely to be perceived in the same way at a later time T'. Moreover the actual process of
creating a map can result in some form of conceptual change, which compounds this
problem. Experiences with knowledge structuring and authoring tools shows that this is
very much the case, and has led to a number of researchers stressing that the tool should
avoid requiring the user to commit themselves too early (Monty, 1990; Marshall &
Rogers, 1992; Shipman & Marshall, 1993; Shum, 1991).
Role-expressiveness is the clarity to which a notation, or sub-set of a notation
communicates the essential features of the task to the user. We have already seen
problems with role-expressiveness in the maps analysed in Studies 2 and 3. If nodes and
links are left unnamed, or the network is tangled, then it makes the task of parsing the
network for meaning difficult. Graphical tools should encourage the construction of
networks that are meaningful and clear to other users; and any pre-existing node types
(for example as is the case for all of the notations below) should be as transparent as
possible, and suitably different from other types to be distinguishable avoiding
confusion.
Hard mental operations. Green's recommendations for computer system design states that
one should avoid the necessity for the user to perform difficult cognitive tasks as much as
possible. Tasks that involve overloading working memory by requiring learners to
remember strings of unrelated digits, or requiring information to be retrieved from long-
term memory, should be avoided. Whilst this principle is fine when designing an
134

Knowledge structuring tools
operating system, spread-sheet or word processor, it becomes less clear cut when the aim
is to promote effective learning. Learning naturally requires learners to perform difficult
cognitive operations, that is what learning is; "no pain, no gain" is appropriate in this
context. However, it is the case that not all cognitive tasks that the learner may perform
need necessarily be conducive to effective learning: it is known that if working memory is
overloaded by task-irrelevant verbal information then verbal learning of target material is
severely impaired. This is why the Lisp tutor Anderson and Reiser, 1985) tries to avoid
working memory overload by providing a goal stack that displays the various sub-goals
that the learner is executing to help them keep track of where they are in the problem
space, obviating the need for them to retain the information, and helping them to perform
the task in hand. Similarly knowledge mapping is an attempt to focus learners efforts on
thinking about relations that are of educational value by directed reflection.
7.3.2 Toulmin argument structures
In the 1950s Stephen Toulmin (1958) proposed a system of logical reasoning that
attempted to define a science of logic. This was both descriptive, in that it could be used
both to study the way that people reasoned; and also prescriptive, suggesting better
methods of argumentation. Toulmin's basic model consists of six elements and a number
of different relationships, the primitives are: claim, datum, warrant, backing, qualifier and
rebuttal.
A claim is some assertion that is made about the area of argument such as 'Love of money
is the root of all evil' or 'Schizophrenia is caused by dysfunctional families'. The
purpose of argument is often to ascertain the plausibility of a claim, this is done by using
the other elements in the Toulmin model.
A datum is some fact or set of facts about the world which is pertinent to the claim. It is
usually some generally accepted fact normally derived from direct observa on. Often a
datum can be interpreted as a claim: in the example shown in Figure 7.1 below) he
datum that 'Harry was born in Bermuda', may, in some arguments, be evaluated as a
claim: was he really born in Bermuda, or was his birth certificate forged 9 Thus the
elements in Toulmin structures are not fixed within the categories that they are ass'gned,
they shift according to the goals of the argument.
A warrant is the part of the argument that allows us to make the inference that the datum
implies the claim. Often the information contained in the warrant will be tri ial, at other
times the warrant may indicate non-sequitur, where a datum is erroneously supporting a
claim that it should not do.
135

Knowledge structuring tools
The backing can help here as it requires the explication of the bases of the particular
principles expressed in the warrant; the backing may often be left out as it is often
meaningless to include. In an example where the claim 'schizophrenia is caused by
dysfunctional families', is supported by the datum 'High correlations between
dysfunctional family behaviour and schizophrenia'; the warrant may be 'Correlations can
sometimes be seen to imply causation', and the backing will be something quite nebulous
such as 'standard scientific practice'. Occasionally articulating the backing may be
profitable as it may be attacked later on, but often it may be otiose, as in the schizophrenia
example.
The qualifier is another item that is often left out of Toulmin structures. This allows the
person making the argument to indicate the strength by which they can make the claim
given the datum, warrant, backing and likelihood that the rebuttal is true. In the trivial
example below it is relatively easy to assign a weight to the link given that some
probability estimate is likely to be available. On the other hand, real-world arguments
may be more difficult to qualify in this and some form of subjective measure may be
required. This has the problem that even if different people agree on the fundamentals of
the argument (claims, data and so on) there may be contention as to how strongly the
claim can be made.
Finally, one of the most important parts of the Toulmin model is the rebuttal. This
articulates information that, if true, would refute the claim even if the other information
were true. In Figure 7.1 irrespective the truth value of the datum, warrant and backing, if
the rebuttal is true then the claim is false: Harry would not be a British subject. This
makes the rebuttal very powerful, perhaps too powerful in many cases. In reality a
rebuttal represents a counter position and is therefore an argument in its own right.
DatumHany was bornin Bermuda
since
Warrant
Qualifier
so -.lb Presumably
unless
Rebuttal
ClaimHarry is aBritishsubject
A man born in Bermuda will
Both his parents weregenerally be a British subject aliens, or he has
become an a Americancitizen
on account of
BackingOn the basis of the following statutes...
Figure 7.1 An example of Toulmin's argument structure.
136

Knowledge structuring tools
Toulmin structures have been widely cited in the articles about computer-based support
for argumentation, however they have been criticised particularly after attempts have been
made to use Toulmin representations for design rationale.
One of the problems is that Toulmin arguments are designed primarily to represent how
single claims were arrived at, and what conditions are necessary for us to accept or reject
a single claim. Often in the real world we are more interested in articulating and
evaluating competing claims. For example in the above example (Figure 7.1) suppose the
rebuttal is found to be true, then what? The notation provides little support or
encouragement for the formulation of alternative claims if the original claim is found to be
incorrect. In real world arguments there is often at least one alternative claim, and
Toulmin makes it hard to represent this. Additionally, often we may wish to represent
claims that are negated by the current information: a conjecture that schizophrenia is a
developmental disorder may be attacked by the datum that people tend to develop it after
adolescence. Toulmin structures, because they work on supportive relationships would
necessitate expressing the claim in the negative: 'schizophrenia is not a developmental
disorder' which may then be supported by the above datum. Clearly this is a
cumbersome way of operating and has led some researchers to modify the model by
allowing attacks relationships as well (Birnbaum et al, 1980).
There are also issues concerned with the context dependency of the elements in Toulmin
structures: as I mentioned above, a warrant in one situation may be a backing in another;
one person's claim may be another person's datum and vice versa. Notwithstanding this,
given some knowledge of the context and goals of the argument it is often relatively
straightforward to get identify what a claim is; identifying the difference between a datum
and a warrant may often be less simple, partly due to the exact meaning of the terms being
unclear. This may result in rather baroque constructions to satisfy the notation. In the
schizophrenia example noted above it is difficult to see whether 'High correlations
between dysfunctional families and schizophrenics' is a datum or a warrant; and if it is a
datum what is the warrant, and what is the backing (Lee and Lai, 1991) To refer back to
Green's cognitive dimensions, the role expressiveness of the terms used in Toulmin may
not be as they should be. Given a piece of information it is often difficult to decide what
role it is playing in the argument.
The upshot of this may be that structures are idiosyncratic, and users may spend time
worrying about problems that are not directly related to the goals of their task. Making
knowledge explicit by using a notation is only useful to the extent that it forces
meaningful reflection on the information being represented, and communicates this
information to others effectively. If the effort is being diverted by working with a
representation that is cumbersome then it may have negative, rather than positive effects;
137

GeneralizesSpecializes
GeneralizesSpecializes
ReplacesQuestionsIs Suggested_By
Questions J QuestionsIs Suggested_ByIs Suggested By
SupportsObjects To
GeneralizesSpecial zes
Knowledge structuring tools
particularly if the task is learning, where the individual is likely to have scant
understanding of the information to be represented.
Perhaps the most serious restriction of Toulmin's model is that it represents argument at a
fine granularity. Whilst this may be useful for some tasks, such as coding sentence by
sentence transcriptions, representing information for the purposes of learning may
typically require learners to incorporate a substantial body of information, containing a
number of different claims. Toulmin structures are likely to be too low level for this
purpose. Although many researchers have criticised Toulmin's model as being
impractical, for the above (and other) reasons, it has been implemented in a number of
tools that attempt to support the process of writing and learning (see Section 7.5).
Although there is little evaluation of such systems reported using real users and real tasks.
7.3.3 IBIS, gIBIS and PHI
IBIS (Issue-Based Information System; Kunz and Rittel, 1970) was developed to
represent the design process, and is based on the principle that the design of complex
artefacts is a process of negotiation between different interest groups. During the process
of development these groups (designers, programmers, customers and so on) pool their
respective demands and perspectives to reach a design decision. IBIS has three basic
entities: issues which relate to questions about the decision making process; positions
which represent the stances of the various collaborators as they attempt to address the
issue; and arguments which are justifications or objections to particular issues. Figure
7.2 shows an abstract representation of IBIS; it can be seen that in addition to being liked
to other nodes, all three types of entity can be linked to members of their own type by
relations such as generalise, specialise, and so on.
Figure 7.2 Basic syntax of IBIS (adapted from Lee & Lai 1991)
gIBIS (graphical Issue-Based Information System; Conklin and Begeman, 1988) is an
instantiation of IBIS which was developed to support the design process. OBIS offers
138

Knowledge structuring tools
two ways of viewing the developing representation: as a text-based outline, showing the
node hierarchy; and as a network or browser. Superficially, at least, gIBIS shares
features with Learning Tool (see section 3.5.2) which also has outline and network
modes; although gIBIS has greater functionality. In addition to the three IBIS nodes,
glBIS also contains an "other" node that allows users to create their own specific instance
and relationships, when the ones provided do not suffice.
A further development of IBIS is PHI (Procedural Hierarchy of Issues; McCall, 1987)
which was developed to overcome some of the limitations of the original model. It
allows quasi-hierarchical structures among the three main types of node. The semantics of
these relationships depends on the types of nodes that are connected; for example, an
issue is a child of another issue if addressing the lower level issue helps in addressing the
higher level issue: in this sense the child issue acts as a sub-goal to its parent.
Both IBIS and PHI deal with information at a high level of granularity and the node types
are specific to the range of tasks that they are designed to support. As such IBIS has
been used successfully by a number of companies in its new format, CM/1 (Corporate
Memory; Conklin, 1993). With regard to supporting learning, the IBIS notation may be
of some use: the macrostructure of text often consists of some delimited topic of
discussion (Issue), a set of assertions relating to this topic (Positions) and a set of
arguments for and against the position (Arguments). However it is likely that more nodes
types will be needed to encompass the granularity that arguments will need.
7.3.4 ARL and Euclid
ARL (Smolensky, Fox, King and Lewis; 1988) stands for Argument Representation
Language, and is an argument notation developed for Euclid, a computer-based tool
which supports collaborative argument. Smolensky et at draw a distinction between two
components of reasoned discourse: content and structure. Content relates to particular
principles, facts, laws and truths specific to the world of discourse; structure is more
abstract relating to the types of assertions and relationships that make up a reasoned
argument. Smolensky et al's claim is that whilst the content information is relatively
specific to the domain of study, the structure tends to hold for many, often superficially
disparate, domains. ARL ties together the content with the structure information,
representing the structure in a formal manner, and the content information informally
using natural language; ARL is thus referred to as a semi-formal language.
ARL is more complex than the IBIS and PHI notations discussed above, having more
node and relation primitives. This is partly due to the fact it is designed as a general
argumentation language, with specific emphasis on supporting academic argument
139

Knowledge structuring tools
requiring it to capture more subtle nuances of argument than do the others. In spirit, ARL
is perhaps closest to Toulmin's model: both are general purpose, both have low
granularity of representation and both are based around the analysis of claims. Unlike
Toulmin, ARL has operators for assessing competing claims, rather than a single claim; it
is a less prescriptive model providing informal primitives to be used; and it is more
flexible, allowing the user to define his or her own argument primitives. The second
mentioned point derives from the authors' desires to support less formal, more
conversationally-based argument; rather than allowing only academic style arguments.
Indeed, in developing ARL, the authors of the system analysed transcripts of different
types of argument to identify the sorts of things that individuals typically use while
arguing.
Since ARL contains a large number of primitives a full description would be rather
superfluous but one which is worth mentioning in passing is known as domains of
assertion. These are central to ARL, and are designed to capture an entire set of claims
advanced by an participant in the argument. The participant may be real in that they are
actually representing their own ideas, or this may be done by proxy. A person may, for
example, appeal to some particular set of assumptions such as Skinner's behaviourist
arguments in order to make some point; this may be represented as a domain of assertion.
Domains of assertion can therefore be seen as a particular perspective or mind set based
on a set of assumptions; it is therefore an argument in its own right, although the extent to
which this argument is fleshed out depends on the goals and context of the particular task.
Euclid makes use of the ARL grammar to encourage the user to represent their arguments
in a coherent fashion; it also supports the construction of writing by the progressive
structuring of ideas, which accords with the Hayes and Flower's (1980) observations on
the writing process. The premise here is that in the process of writing, initial ideas are
likely to be produced by something akin to brainstorming. The products of this process
will be unstructured notes, tentative suggestions, queries and so on. Later, as the user
becomes more sure of their communication, they may start to impose structure upon their
developing ideas.
Euclid supports brainstorming by allowing users to create general 'notes' nodes, in
addition to any specific categories of node (claims, definitions, and so forth). When
users have a clearer idea of the implicit structure of the argument that they are formulating
then they can impose structure on the initially unstructured set of notes, this can be done
both by linking up the nodes using typed links, or by changing the category of node to a
more specific type that more adequately represents its role in the argument. Euclid makes
it easy for users to change the structure once it has been created by allowing the cutting
and pasting of both objects, relations, groups of objects and text. Thus Euclid attempts to
140

Knowledge structuring tools
overcome the problem of premature commitment, in two ways: by allowing progressive,
rather than immediate structuring of ideas; and by providing tools that make it relatively
easy to edit objects and relations that have already been structured.
Each element in Euclid's database keeps a record of all the things that it is linked to;
moreover it stores these in such a way as to keep track on all the dependencies between
elements. For example a claim, or a set of claims, may be asserted with a particular
strength; this strength may be contingent on certain assumptions. If these assumptions
are brought into questions Euclid could conceivably let the author know of this potential
change, allowing the user to change the strength of the assertion accordingly. Euclid
therefore makes the representation cognitively transparent, revealing the dependencies
between objects and actions.
Euclid therefore builds upon the expressiveness and flexibility of ARL. However, the
flexibility may be too great for learners uncertain about what terms to use; with the likely
result being sub-optimal structures. In many ways Euclid caa be seen as being
somewhere between unconstrained concept mapping tools and the structured
representations such as IBIS.
7.3.5 QOC
QOC (Questions, Options and Criteria; MacLean, Young, Bellotti and Moran, 1991) is a
notation for constructing design rationale. Unlike gIBIS, QOC is not supposed to be a
record of the process of design, but rather is an artefact itself, constructed alongside the
thing that is being designed. The purpose of QOC-based design rationale is to assist
designers in being reflective during the design process, by making them more aware of
the various alternatives and reasons for selecting them, and to communicate these ideas to
other people. Although couched in design terms, it can be seen that the goals of QOC are
very similar to the goals ofia concept map, which also emphasise the role of explicating
knowledge and communication. Central to QOC is the notion of design space, which
MacLean et al divide into two sub-components: decision space and evaluation space.
Decision space consists of the design question (the goals of the exercise) together with all
the possible alternatives for a particular artefact, expressed in the notation as options. For
example, the decision space for a scroll-bar may include various options such as having
the scroll-bar appear when the mouse passes over it, or having it permanently visible.
Options can invoke other questions, which may be set as subgoals. In evaluation space
the various arguments for and against the various options are advanced using criteria,
which can either support a particular option, or object to it. A criterion may be some
generally accepted principle of design such as: 'screen clutter should be kept to a
minimum', or it could be some other constraint such as 'computational expense'. When
141

Coarse
Granularity
Fine
•BroadNarrow Scope
Knowledge structuring tools
there are no such criteria, the designers may have to construct a mini-theory which is an
ad hoc principle relating to the particular options being evaluated. In the scroll-bar
example, a criterion 'reduce screen clutter' may support the option of having a pop-up
scroll-bar, and object to the permanent one. Thus are the various options evaluated,
arriving, in the simplest case, with an option that predominates when all criteria, and there
are likely to be many, have been considered; this should be the successful candidate.
QOC has been evaluated in a number of work situations (Shum, 1991) and has proved to
be relatively successful. However, the representation is too rooted in design to be of
much use as a tool for supporting learning. Unlike gIBIS which has general argument
node types, Q0C's nodes are heavily process based.
7.4 SUMMARY
The systems of argument and tool discussed above differ from each other in number of
ways. Perhaps the most way of comparing them is on two dimensions: granularity and
scope. Here scope is intended to mean something similar to expressiveness of the
notation: all the possible things that it can express.
Figure 7.3 Comparison of the five notations discussed.
Toulmin's representation has perhaps the finest granularity: representing the internal
working of a single claim; the scope of Toulmin structures is also quite low as it has quite
specific node types and relations. ARL has a large spread of granularity, able to represent
both low and high level components of argument. ARL also has a high degree of scope,
142

Knowledge structuring tools
its many primitives can express much more than the other notations discussed. IBIS,
QOC and PHI operate at a high granularity and low degree of scope, reflecting their task-
dependent nature. Figure 7.3 also gives some indication as to how flexible the notations
are, here indicated by the area of the ellipses.
7.5 HYBRID SYSTEMS
The systems above are based on a single cohesive model of argument; other systems,
however, use more than one representation, some of these are discussed below.
7.5.1 Writing Environment (WE)
Writing environment is related to AAA (discussed in the next section), differing in some
of its representational formalisms. WE is designed to aid the process of writing by
explicitly supporting the activities and operations involved. These activities are grouped
into what are called cognitive modes that relate to the goals that writers have whilst
producing documents. Engagement in a mode produces output that is worked on in the
next mode; in this way each mode provides the input for the next. There are seven modes
in all each of which has its own specific processes and output. Exploration involves the
writer recalling relevant facts and clustering them in order to externalise their ideas.
Situational analysis is where the writer starts to gather the ideas produces in the
exploration phase and prioritises them in accordance with the goals of the task. In the
organisation mode the individual structures their ideas. Writing involves coding the
output of the structured notes into coherent linguistic forms. Editing global organisation
involves the manipulation of large scale structural components of the text to produce a
more organised product. In editing coherence relations the writer refines the relationships
between sentences and paragraphs. The final stage editing expression involves the
polishing of the final document into a coherent whole.
Some of these cognitive modes are supported by system modes. Exploration is
supported by a system mode that permits the loose structuring of information typically
required when ideas are organised initially. Organisation is supported by a more
constrained network tool that forces the user to organise their ideas hierarchically,
generally regarded to be the clearest discourse structure for reader understanding.
Writing is supported by the editor mode that allows the concepts and relations structured
in the organisation phase to be encoded into written text by using a conventional text
editor. Coherence editing is supported by the text mode which is a text-based
representation of the document structure formed by the system itself by stepping through
the nodes in the tree mode in a left to right, top to bottom fashion, and pasting the text
143

Knowledge structuring tools
associated with nodes and relations into a separate window in the form of a document.
Users can then edit this representation for coherence.
Hence four of the seven of the cognitive modes are supported by four system modes. Of
the remaining three nodes, structure editing is supported by the user restructuring the
graph in the tree node, which in turn restructures the text and expression editing is
supported by the user editing text in either the editor or text modes.
Only the situational analysis mode has no explicit support from the system, this is
because situational analysis is an activity performed on the products of exploration, where
goal relevant ideas are selected for further processing, its outputs are therefore transient
and thus no tool has been provided to support it.
7.5.2 Author's Argumentation Assistant (AAA)
AAA is both part of a larger system called SEPIA (Structured Elicitation and Processing
of Ideas for Authoring) which is designed to support the construction of hypertext
documents; and is also related to WE. The most important distinction between AAA and
WE is that AAA contains an argumentation mode in order to support the argumentative
and rhetorical components of hypertext construction.
Like WE, AAA is based on the principle of cognitive modes, and supports them by
having various system modes. The system modes are: the argumentation mode, the
rhetorical mode, the tree mode and the text mode, and the system reifies these modes by
providing a separate window for each one. Central to AAA is the argumentation mode
this has two levels of structure: a microstructure which uses Toulmin-like representations,
and tnacrostructures 1 which use based on the PHI argumentation model. The PHI-based
macro structure allows users to represent the various competing issues and sub-issues in
the domain, and the arguments that relate to them. Toulmin structures are used to
represent analyses of the individual arguments at a lower level. Thus an issue—which
may be subordinate to other issues in the hierarchy—may be answered by a position
supported by some argument. These positions and arguments may in turn be evaluated
using the Toulmin concepts of warrant, rebuttal and backing. The purpose of this is to
provide a finer granularity of analysis for the arguments proposed than PHI alone allows.
In addition to the argumentation mode described above, there are other modes designed to
support the different tasks involved in writing argumentative texts. The rhetorical mode
allows the selection of elements from the argumentation network that the author wishes to
1 Note that the tenns microstructure and macrostructure whilst similar in spirit to those used by Van Dijkand Kintsch (1983) are, in fact, referring to slightly different things.
144

Knowledge structuring tools
reorganise for rhetorical purposes. Other modes include the tree mode; which is basically
a planning space that allows the goals of the task to be represented and referred to, and
the text mode, which allows the editing of text stored within the various nodes.
AAA allows nodes, sub-graphs and text to be copied between windows, where
appropriate, however the authors say little about AAA's capabilities for redefining node
categories, link types, etc. and the various constraints that exist during this process (see
Euclid, Section 7.3.4).
AAA is a good example of a suite of tools designed for a specific purpose. The various
modes allow information to be structured, whilst still preserving the information in its
unstructured state; this means that any action can always be reversed to some extent,
overcoming some of the problems of premature commitment by allowing backtracking.
Because AAA has separate windows for each of the modes, the user can operate at
several different levels at the same time: some information may be in textual form, other
information may be partly structured in the form of Toulmin or PHI based
representations. For the purposes of learning this may be advantageous, understanding
of complex information tends to develop in a piecemeal way; often we need to
understand certain parts quite well, whilst having less understanding of other parts. On
the other hand, having separate windows for each mode may result in problems
combining certain aspects of the information into a structured whole; it is difficult to see,
for example, how PHI type representations can be broken down in a meaningful way into
Toulmin structures. Unfortunately I know of no evaluations of AAA, so its benefits and
drawbacks remain pure conjecture.
7.5.3 Summary
WE, AAA and Sepia are systems designed to support tasks that involve a number of
distinct activities such as writing and authoring hypermedia documents. AAA has been
advocated as a system that may support the process of learning by encouraging the
structuring of ideas and concepts. Since they also allow several representations of
information to exist at one time they avoid some of the problems of premature
commitment to structure. A user for example could use one of the workspaces for
brainstorming initial ideas and then impose structure upon these more using one of the
formal notations—both representations would co-exist. This is one of the ideas
investigated in the two case studies in Chapter 10. A possible problem with the notion of
activity spaces is that there is little support for transitions between them. An experienced
writer would know intuitively when to get on with formalising their ideas, a
inexperienced learner might need quite a lot of training to move between the spaces
seamlessly and productively.
145

Knowledge structuring tools
7.6 RELATIONSHIPS WITH KNOWLEDGE MAPPING
In general the tools and notations discussed above differ from knowledge mapping tools
in that the representations that they use are more constrained; the idea being to support the
task by encouraging users to structure their thoughts more clearly. It must be
remembered, however, that Novak's (1990) conception of concept mapping with its
specification of hierarchical organisation was also constrained. At least in principle,
knowledge mapping tools and the tools discussed in this chapter, are not necessarily as
far apart as they seem.
Nevertheless most of the things that are called knowledge mapping tools (SemNet,
Learning Tool, TextVision) make few prescriptions as to the structure that the learner
creates, they are genuinely domain general. On the other hand QOC, gIBIS, AAA and
the like have all been created in response to the specific demands of particular tasks
(collaborative design, writing and so forth). Once we have a task in mind we can go
some way towards understanding where problems might lie and what action might be
taken to improve upon the traditional methods. Learning however, is not a task. Rather
learning is an essential by product of some action, it is not the action itself. Therefore we
cannot specify what needs to be done to support learning without having a tight
specification of the educational goals, the expertise level of the learner, the nature of the
domain and so on and so forth. In their search to provide a generic package it is possible
that the developers of knowledge mapping tools have settled on a sub-optimal solution.
This is, of course, conjecture but it does seem that given the results of the two previous
studies there is scope for developing more structured tools, as I indicated in the
introduction to this chapter. The rest of this thesis explores the issues of trying to
develop tools that support specific tasks, tasks which as identified by looking at specific
domains, specific user profiles, and specific educational goals. Given these
specifications we can attempt to mobilise some of the learning issued mentioned in the
first chapter to develop methods of supporting effective learning.
Study 4 represents a first attempt to do this. A specific goal in psychology might be to
get subjects to think about the relationships of evidence to theories. A simple framework
was chosen to encourage students to do this.
146

8
Using structured maps8.1 INTRODUCTION
The purpose of Study 4 was to ascertain how well students could cope with representing
information using a semi-structured formalism which took argumentation as its basis.
The task was simpler than that of Study 3, requiring participants to represent a narrower
set of information relating to coherent 'topics' in cognitive psychology, rather than to
construct a broad overview of what is often very disparate research. The task was
additionally simplified because it required participants to take a single aspect of the
domain, looking at the evidence supporting and contradicting a theory, rather than trying
to encompass structure, process and argument within the same framework: something
which is a natural consequence of the particular framework chosen.
Like Study 3 this was not a controlled experiment, so it is difficult to come up with any
firm conclusions; however, as a data gathering exercise it may provide some pointers
towards the issues in using such representations which may inform the development of a
tool.
8.1.1 Subjects
The subjects were 36 undergraduate students who constructed the maps as an assignment
as part of their cognitive psychology course. Each participant constructed two maps for
the purposes of the study. Due to a lot of the maps not being handed in only 15 were
analysed.
8.1.2 Instructions
The instructions were given to the participants both during their lecture course, and in the
form of a printed sheet of paper (see Table 8.1). Examples were given together with a
skeletal framework for the representation.
147

Paivio's DualCode Theory
Ids
Hypothesis
Pe cs
Hypothesis
EvidenceEvidence
R utes
Evidence
Sup forts
Evidence
Using structured maps
1 Draw a diagram, in the form of that below, summarising key hypotheses and evidence relating toPaivio's dual code theory. Briefly fill in predictions made by the theory at the hypothesis level of thediagram (you may need a different number of boxes), and list evidence which supports or refutes eachhypothesis at the evidence level of the diagram (again you may need more or less boxes).
2 Draw a diagram, similar to that above, to summarise key hypotheses and evidence relating toCollins & Quillian's model of semantic memory.
Table 8.1 The task description as presented to the students
8.1.3 The task
The task that learners were given would naturally constrain the sort of information that
participants could include in their networks more than did the task in Study 3. First of all
the information needed to complete the task was narrower in scope, often to be found in a
few pages of text; second, only information relating to argument was requested; and
finally, the representational structure was given to them, they no longer had to invent it
themselves.
8.2 ANALYSES OF MAPS
8.2.1 Overview
In general the students seemed to be able to use the representation fairly well, and the
maps produced were more consistent across different individuals than the ones produced
for study 3. There are two likely reasons for this. First, the maps were more
prescriptive, containing both a global structure—the overall shape of the map, and a local
structure—the types of node and relationships between them. This meant that the maps
148

Using structured maps
were less dependent on the preferences of the particular individual. Second, the task was
easier, more tractable than the last one. This consistency meant that it was easier to
compare the maps produced by individual students to each other, aiding communication.
There are however a number of issues that manifested themselves that have certain
implications both for the design of computer-based knowledge structuring tools and for
the teaching of psychology.
First of all it must be said that in general the maps from this task contained more of the
information appropriate to the goals of the task than did those in the memory task (see
Chapter 6). Because all of the students were asked to use a standard textbook (Eysenck
& Keane, 1990) it was possible to ascertain the hypotheses and evidence that should have
been included. These can be parsed in to propositions relating to the relationship between
evidence and hypotheses, for example Evidence (Paivio, 1971) Supports Hypothesis
(Two separate systems) would count as a single proposition. Table 8.2 summarises the
results of this propositional analysis
Map Maximum no ofpropositions
Mean (SD) Mean percentage
Paivio map 12 5.2 (2) 43%Collins and Quillianm'ip
8 4.7 (1.5) 58.7%
Table 8.2 Summary table showing student's performance against maximum propositionsuggested by the textbook.
Whilst these mean percentages of 43 and 58% are low, it must be borne in mind that these
are the maximum number of evidence-hypothesis propositions referred to in the text.
Much of the evidence tends to show similar things, and we really should not be too
bothered if students tend to focus on certain pieces of evidence and ignore others.
All told the maps produced in this experiment were certainly more similar to each other
than those produced in the memory study, and students seemed to feel that this exercise
was somewhat more tractable. This said, some problems were manifest, and these are
discussed in the next section.
8.2.2 Some observed problems
Although the maps were both more coherent and more cohesive than those investigated in
the previous study, there are certain issues that reveal potential problems with the use of
knowledge structuring tools, these are discussed below.
149

Using structured maps
8.2.2.1 When hypotheses are not hypotheses
Some of the terms used in the framework appeared to cause problems, most important of
these was the meaning of hypothesis. "The New Hamlyn Encyclopedic World
Dictionary" defines 'hypothesis' as follows:
"A proposition (or set of propositions) proposed as an explanation for theoccurrence of some specified group of phenomena, either asserted merely asprovisional investigation (a working hypothesis) or accepted as highly probable inthe light of established fact."
In psychology and in the natural sciences a hypothesis tends to have a more specific
interpretation relating to an assertion about the world pertaining to a phenomenon that is
testable empirically. Such an understanding is not universally accepted, but it is
doubtless the one which undergraduate psychology students are most familiar with, and
is the meaning intended here. Therefore the assertion: "A horse can run faster over a mile
than a human" is a hypothesis in this sense because it is directly testable empirically,
whereas: "Love of money is the root of all evil" is not a hypothesis in the sense used here
because it is not susceptible to empirical testing; such a statement could be called a claim
or a conjecture. Central to this definition is the relationship of the hypothesis to evidence.
Evidence can support or contradict a hypothesis directly; in order to empirically test
claims one must nearly always include a mediating hypothesis that permits testing. A
similar set of issues relates to the notion of a theory; this will need to broken down into
claims before hypotheses are generated.
In this study participants frequently seemed to have problems over the interpretation of a
hypothesis, in fact in the 78 hypotheses advanced, only 13 actually fitted the criterion of
being directly testable. Most of the other so-called hypotheses were in fact claims (or
conjectures), some were assumptions of the model or theory and some were simply
properties of the model. In the example below (Figure 8.1), the theory "Paivio's dual
code theory" is said to predict that there are two systems, verbal and non-verbal. In many
ways this is a claim embodied in the theory. A more accurate experimental hypothesis (in
the sense that it is a testable prediction) would be "Items receiving both verbal and non-
verbal processing should show better recall than items requiring just one type of
processing". Thus pictures, which are processed twice according to the model, should
show higher recall than words, which only need to be processed verbally. This could
then be supported by experimental evidence. Not all students showed this failure to
correctly specify a suitable hypothesis, Figure 8.2 show two good hypotheses specified
for the 'Semantic memory' task. Note that the same student produced both of these maps
indicating that it is not just some general deficiency in understanding.
150

HYPOTHESIS There are two
distinct cod-
ing systems:-
VERBAL &
NCNVERBAL
Pictures recalled
more than words
in free-reckl
tasks.
supports
supports supports
The routes to
to perception
and imagery
are based on
similar procés-
Segal a FUcella
(1970) found
perception
in a nrdality
interferes
with imagery
in that modality
•
Using structured maps
The systems
sometimes act
independently.
PAIVIO'S DUALr-
E TIMORX\\\\
predicts
Concrete words
recalled more
than abstract
words.
The systems
sometimes
combine to
produce add-
,itive effects.
refutes
?refutes
Farah et al
(1988) found
evidence
that imagery
can be separ-
ated into vis-
Zal -and spatial
imagery.
Bower (1970,1972)
found that interactive
imagery and verbal
nediation lead to
higher recall of con-
crete words.
Figure 8.1 Map showing hypotheses that are really claims.
151

Predicts/
When subjects are asked
to verify whether a Sen-
tence is true, the reac-
tion time should increase
with increasing distance
between the concept-nodes.
HYPOTHESIS When subjects are asked
to say whether a concept
has a particular property,
the reaction time should be
longer because attributes
need to be inferred from
superordinate nodes.
Collins and Quillian
found that the greater
the distance, the long-
the verification time..
refutes
Times for
lexical
decision
fit in
with the
theory.
Can reject
false sen-
tences with
speed.
Using structured maps
COLLINS AND QUILLIAN
NETWORK MODEL.
refutes refutes
supports supports refutes
Conrad (1972) found —
that certain attributes
of concepts appear
to be more salient;
controlling for fre-
quency lea& to little
effect of distance.
Smith, Shoben Rips (1974)
showed that more distant super-
ordinates could be verified
faster than inrnediate super-
ordinates.
Figure 8.2 A map showing testable hypotheses.
152

Using structured maps
One is forced to ask the question: does this matter? In many ways it does: an important
part of psychology is the development of critical thinking skills, indeed, it could be
argued that this is the most important thing that students will learn, given that many of the
theories, facts and principles that students learn will be out of date a few years hence it is
the ability to think critically that will keep them afloat in a changing world.
Understanding why a hypothesis is predicted by a theory (or a claim), being able to
identify non-sequitur and other such problems and effecting recovery is vital if
psychology is not to require mere rote learning of information. Of course we cannot lay
all of the blame at the feet of the students (or the education system!), and some further
discussion of the implications of these results continue in the next section.
The above observation could be interpreted as indicating the participants did not fully
understand the meaning of the terms such as 'hypothesis', and were therefore unable to
adequately use the model correctly. However, the students taking part in the study had
undergone a number of hours learning about experimental design and methodology, as
well as statistics; both of which discuss the nature and role of hypotheses in psychology.
It is therefore unlikely to be something as simple as merely failing to understand terms.
Further evidence in support of this can be found by the observation that students did not
always use the term consistently: a number of maps contained hypothesis nodes that
were used both appropriately and inappropriately. Perhaps the most likely explanation is
that students' incomplete understanding of a hypothesis was compounded by the paucity
of its node types. In the hypothetico-deductive model of scientific methodology a theory
is tested first by deriving predictions that it naturally implies in the form of claims, and
then operationalising these into hypotheses; the model used here missed out the crucial
step of allowing students to articulate the claims of the theory. Omitting this step meant
that students had to go straight from a theory such as Paivio's dual code theory, to the
hypotheses in one step. Figure 8.3 (below) shows an example of a map in which the
hypotheses are correctly used notice: first that there is a conceptual leap from theory to
hypothesis, and second that the student has attempted to rectify this by introducing an
intervening claim which lies outside the original model.
A further potential cause for this effect is may be due to the situated nature of the way that
students learned about hypotheses; they may be able to define a hypothesis correctly, as
most of them demonstrated during tutorials, but they may find it harder to actually use
this definition when explicating psychological studies. Such phenomena are well known
in the literature relating to transfer of learning, and the importance of such problems has
recently been highlighted by situated leaning theorists (see Chapter 1).
153

2 S mtdi s yslems ben-ye/ha/ anisys 'ape/ale M an iiz
lasIrtin M sow aireztaJittilaS (4'
freseirttil a of catels and lareitad:.5-park e laird /it ors sr.,/
th Marlzetily Item /hal4/ At telzb
Paii/ki and Ccapas itkreSub 'ech ifrik s 4 efrkelf ttg/7
/¢-7 iiiirnanaq
44/ fah. /hk d)Itok.d/za /ma& x asOS itoirnalfia.
/9097,&al etadi
vhied aic na-rzeV 401ifr:e1Plainaysicira .
Using structured maps
LP/1470.i adit CODE TREORV)
a srderns frelitte adaihie fed-.S., Mgr- a:au-Asia/las
nzemory 144 . ivalei to/4 sreed.i/liems. 2
Tigens wait 47,4er,
ccaricle wadsecallcd easier/Inn aisiract
Strpfa/4
&wag /A:/-drools/
etzkead.ps.;;IAzns03.
ziyaaosicea.i/ .feeoui 4plie /II /wasp
,exe 414 0 CCM k (5/17 OvN.- -, .frvve".- " Ca/7 7 n4a1
. ai) kt& 9A0 -. adag.4e Aft le-iiiat4
eezA q2c r;ve_eavvy
Oruro
Alsait ealtak,abstradtip s'Azt/ Act, Aereia a e coic/PlowastdI iad (112ei - 0 • /2111
causal re grab?, textlardsai13ave,
*ilk a re Mold__ . .
Shur/ ernuele reetzaihehicr?tan °is/galashate hilierttvlue ámq 2 ea*addh'ir
Colua bleac54\godina -P /rasa/4/g/3. 691)04k gi/Stivnt,4ii
611- tooth r /511711.‘riadf
al
Hafrenc M eris/ir&p.r.q Arh.4 46114. lathkr Wei 94 op, lithyiitscarle sysfem .
Figure 8.3 Map showing an intervening hypothesis between a claim and evidence (textstarting "Concrete words recalled...").
154

Using structured maps
8.2.2.2 Problems specifying evidence
Much of the evidence that students brought to bear on the task was not evidence in the
strict sense of the word. Evidence arises as a result of some empirical investigation in
response to a hypothesis. Often information that was cited as evidence were actually
critiques of one form or another. For example in Figure 8.4 (below) the evidence that
begins: 'It's very difficult to actually determine...' in the left of the diagram, is in fact a
criticism of the stance adopted by the theory: that concepts have specific defining
attributes, rather than refuting evidence.
In total 32 out of the 138 evidence boxes contained information that was not really
evidence. Again we must first apportion blame on the model that students were given;
given that they had no chance to represent critiques, assumptions and the like, it seems
churlish to chastise them for bundling everything up as evidence. It remains to be seen,
however, exactly how good students are at spotting the difference between evidence and
critiques (see Chapter 11 for more on this).
8.2.2.3 Lack of structure revisited
Given that the purpose of using a semi-structured representation was to try and encourage
students to produce more meaningful structures, it came as some surprise to find that
there were still occasions where students refused to do so, albeit much less frequently
than in the previous study. The main failure to commit to structure was in failing to link
up evidence to appropriate hypotheses. As shown in Figure 8.5 there was sometimes a
tendency to list the evidence without providing explicit links, or as in Figure 8.4 simply
link a set of different studies to all the hypotheses without attempting to indicate which
studies supported or refuted which hypotheses.
Given that students were instructed to link evidence directly to hypotheses, and assuming
that they were trying to complete the task, there are two potential reasons why this
occurred. First, it is quite likely that although students were aware of the evidence
relating to the theory, they may not have been entirely sure as to how this related to the
specific claims of the theory; since most of the hypotheses were actually claims they may
have simply resorted to the strategy of not linking the evidence to the hypotheses (or
claims). Second—and again this is due to the uncertain status of the hypotheses—it
could be that the hypotheses articulated were not refined enough to be addressed by a
single piece of evidence. In many ways the two go hand in hand: a well specified
hypothesis, if it exists, is likely to be derived from the student by working backwards
from an experimental study. Knowing that, for example, a study to test Paivio's dual
code theory looked at memory for concrete and abstract words will imply the hypothesis
155

Using structured maps
that concrete words should be remembered better than abstract words. The fact that
hypotheses can be ascertained by working backwards from the experiment makes it even
more surprising that so few of the hypotheses were specified. Perhaps students found it
more important to articulate claims than hypotheses, even when specifying a hypothesis
would have made their maps more intelligible. This again emphasises the need for more
components in the model.
A further problem in this lack of structuring involves arrow directionality. The original
model contained no arrows (see Table 8.1) as it was felt that the name of the link would
be sufficient to indicate the direction of the relationship. However 8 of the 30 maps
incorporated arrows in the maps and in every instance where they were included, the
links between hypotheses and evidence were the wrong way round: implying that the
hypotheses support or contradict the evidence. This is curious. It could be that subjects
do this by analogy to other maps that they may have seen which show hierarchical
relationships between nodes; or it could be that starting from the top with the downwards
pointing 'predicts' relationship between theories and hypotheses, they just carry on the
same direction. Whatever the source is, it may indicate that students are not focusing on
the explicit meaning of the relationships in a way which we may have initially supposed.
8.3 SUMMARY
The task was in some ways more successful than the previous 'memory mapping' task, at
least if we look at the extent to which students achieved the goals of the task. The
students seemed to feel that the task was more meaningful and somewhat simpler than the
memory mapping exercise. Tutorial discussion were, perhaps, less interesting, perhaps
because most of the maps were similar there were fewer discussions among individuals.
These observations are perhaps more a function of the task being of a less grand scale
than in the previous task, rather than being a feature of the structured representation per
se. As I mentioned above (Section 8.2.1) this task required students to integrate ideas
that were already integrated in text-books, rather than drawing together information from
disparate areas which is often left un-integrated in the literature. The task was therefore,
perhaps, more an exercise of translation and formalisation of knowledge, where
information is recast into a new form using a notation, rather than being one where
conceptual space was explored.
156

b0P
4
\il
t
.i, g-vt lirip 4IG'iltrl:trip 11‘.120)-•)g
>
Using structured maps
Figure 8.4 Critique masquerading as evidence; the sentence starting "It's very difficult todetermine..." is labelled 'evidence' (coloured boxes were used to indicate this) but is more ofa critique.
157

J'hge.1
angoti ilAt '4W-'-,(a1Pratt Ave mtaite.4
/41e 41e Me/eciawbit
• .
anC40h/ a/zerfaAived 61 a
Ave, c4•7a
„ if velvIce .-fruNa2./ dicir/ /arks
...ff e /Tole ve.tremar .PI°Peri Valiant e
A ru 0/110 -P0
au; fly —PI
e Min leiVf0 Wt.- .
reivemicamtup a birdCaAalyit 4(a/wry-Jo
/nate ptedioall fiAll 'Aura& ihaila be
efai .—JvpporV MAI Avail.
f4cP-- filtaPrponfe -limit !DWI/v.'JenteAcif Kral
,teroaltitc dittanc.e.
Using structured maps
i
taumMODEL Ohipwric /Pernifigyl
-/ &wawa
-*PAWL lexed diclflom lark1.cok at- fevitt for falle'
.feAtellarDo Mt- nillaxirviOdil Pre4ict/6W
kV& bii wsildiRA/0U if fal.redoern't- „ream
VOV k /MAO •/et/ 10/7 of
4 atal.e.it iaw 61/1-1,:f f.
— 90 Whul ( Wan. °viz-co iwol —t- eemif tak /1/1-It effeci-oldeAutAtic cup-ma Colraol
p —don 't- MALIry to lnk cfo
Circulari? V 1.-_A RN.
Atd C— Word_ •mi ci,v,wr —
Ories7at-lb
Figure 8.5 Example of inexplicit evidence-hypothesis linking
Certain problems were noted, in particular the failure to use terms such as hypothesis and
evidence appropriately within the context of the model may have implications for the
development of future structuring tools. However we must be wary of making too many
assumptions. For example, as mentioned previously it would be erroneous to infer that
students understanding of what constituted a hypothesis was bugged. Discussions
158

Using structured maps
revealed that they appeared to have a good understanding of what the term meant and
additionally errors were not stable; students using the term correctly may also show
incorrect usage in the same or in the other network. What this appears to indicate is that
students were struggling to express their ideas against a representation that would not
permit them to do so.
The observations from this study gave rise to two design criteria for the structuring tool
described in the next chapter. First, any notation needs a more expressive grammar
which would allow learners to represent claims which mediate between hypotheses and
theories; second, there needs to be restrictions built in to the grammar that permit certain
relationships, and do not allow other relationships that are likely to be unhelpful. An
example of this last point would be that 'supports' or 'contradicts' relationships should
go from evidence to hypotheses or claims, rather than the other way round has was the
case in this last exercise. Attempting to create links in the incorrect direction could lead to
explanatory text indicating why this link is not permitted.
The next chapter pursues these issues further.
159

9
The design of a knowledgestructuring tool
9.1 INTRODUCTION
The previous study suggested that it might be profitable to develop constrained tools to
give the learners some support in forming representations of domain information that are
educationally meaningful. The study also suggested that the theory-hypothesis-evidence
model used was too constrained, in that students needed to include additional information
to create a reasonable argument. The purpose of this chapter is twofold: first it described
a more elaborate (but still not a final) notation which was use for the next two studies;
and second, it describes the tool that was designed to implement the notation.
9.2 THE NOTATION USED FOR AKA
The purpose of the language used for AKA was not to come up with a formally sound
representation for argument, but to develop a notation that could be used to represent
much of the argument structure in many social science texts, particularly psychology.
Like most of the notions discussed above, with the exception of Toulmin arguments, the
notation used was both task and domain dependent; the intention was to develop
something that could be used for a sub-set of learning tasks, in certain domains, rather
than a general notation.
AKA has five basic primitives: claim, evidence, critique, phenomenon and question; it
also has a further three nodes that are modifications of a claim: assumption, theory and
hypothesis. I shall discuss these in turn.
A claim is an assertion made about some domain of discourse, and as such it has a very
similar definition to that used by Toulmin and Smolensky et al (see Sections 7.3.2 and
7.3.4). Claims require some form of backing, and there are several ways that they can
160

The design of a knowledge structuring tool
receive this. By being directly supported by evidence, or by being supported, by logical
deduction, by other lower level claims.
Evidence relates to a variety of forms of information that can support or contradict claims.
In many ways the notion of evidence as a primitive appears fallacious; evidence is only
evidence insofar as it related to something else. The notion of evidence is only
meaningful when we have some claim, otherwise it is just undifferentiated information.
For example stating that I saw my friend Mike at the Opera last night would not be
considered evidence unless someone else, such as the police, claimed he was elsewhere.
Additionally these pieces of 'evidence' are not, strictly speaking, evidence at all: they are
claims, as there are dependent on you believing me or the police. Therefore what we
perceive as evidence depends not only on the context (is there a contradictory claim?) but
also on how rigorous we wish to be about when we stop calling something evidence and
start to call it a claim. In science evidence has a special status because it is assumed to
uncontaminated by subjectivity; however there are doubts as to the objectivity of
observations (Kuhn, 1970; Brewer and Lambert, 1993). Whatever, the term evidence
was selected because it is something that is familiar to most people; the main perceived
problem was not one of the epistemological status of evidence, but that it may be used too
freely by users of the system — a problem of definition which affects Touhnin's model of
argument
Critiques are items that in many ways lie outside standard argument representation; like
evidence it is the relationship between a piece of information and another piece of
information that makes it a critique, rather than it being something in its own right. Again
the term was chosen because it is something that is easy to understand. A critique is, as it
sounds, a criticism—which is itself neither evidence nor a claim—of another information
object. Critiques can stand for many things: they may criticise experimental
methodology, or may attack a claim for being overly complex or implausible; as such
critiques can attack any other type of node, even other critiques.
Questions are provided to define the boundaries of the argument; to set up a context in
which the argument takes place. The purpose of providing question nodes is to try and
encourage the learner to define their goals and focus on the particular area that they are
interested in, rather than straying too far from the point.
Phenomena are observations about the world that appear to be true under certain
conditions. An example of a phenomenon in psychology is the recency effect of items in
a serial recall task. Claims are often advanced to explain such phenomena; alternatively a
phenomenon may be used to support a particular claim. Care must be taken to prevent an
argument becoming circular when claims are supported by phenomena that they are
161

The design of a knowledge structuring tool
constructed to explain. For example, a theory or claim may be advanced to provide and
explanation for a phenomenon such as the recency effect; this can become circular if
experiments involving the recency effect are used to support the claim; with no other
measures taken.
Assumptions. Most arguments are based on certain assumptions which allow the certain
claims to be advanced, or certain bits of evidence to be used. One way in which
arguments proceed is by bringing the underlying assumptions, of a claim or theory into
question. This can then be used to reduce the certainty with which one can assert a
particular claim. Assumptions themselves are often arguments in their own right, with
claims evidence and so on of their own, in this way they are similar to Smolenslcy et al's
domain of assertion (see Section 7.3.4). The inclusion of a special assumption node was
made in recognition that often we are not interested in pursuing this line of thought any
further, we merely wish to note that the assumption is there and, perhaps, criticise it..
Theories and hypotheses are specific forms of claim. Theories relate to clusters of claims
which are put together in a rigorous manner. Hypotheses, on the other hand, are claims
that are articulated in such a way as to allow direct testing. Both these nodes were added
at a late stage and can be seen as an attempt to tailor AKA for the use in aiding learning
from psychology texts.
A final option for creating link types (although not really a type in its own right) is the
wildcard option. This allows the user to tailor a node type to their own specification if
the pre-defined ones do not suffice.
As well as these primitives there are certain rules for linking them together. Table 9.1
shows the permitted relationships between the various nodes.
Perhaps as important as the permitted relationships are the relationships that are not
permitted. An example of this is the way that evidence cannot be linked to other evidence
as it is assumed that evidence does not usually make any useful statements about other
evidence; that is not to say that it cannot be linked, just that it may be more useful for
learners to try and think about the evidence—claims relationships, rather than those
between evidence and evidence. The basic model, then, is one of evaluating claims that
are competing to explain a phenomenon or to address a question. Claims are evaluated
by virtue of the evidence that can be mobilised to support or contradict them. There are
some similarities with Toulmin's model in that AKA is based around claims, but it
contains primitives that, we believe, accord more with the sorts of informational roles that
students will encounter in text-books.
162

The design of a knowledge structuring tool
Node type I Links to... I Relation nameTheory Question
HypothesisAddressesPredicts
Claim ClaimQuestionTheoryHypothesis
Sub-claimAddressesSub-claimPredicts
Evidence Claim
Assumption
Critique
Hypothesis
SupportsContradictsSupportsContradictsSupportsContradictsSupportsContradicts
Hypothesis NoneAssumption Any node UnderliesCritique Any node AttacksPhenomenon Claim Sus g orts
ContradictsQuestion Question Sub-questionWildcarcl Any node User definableTable 9.1 List of nodes and permitted relationships.
The notation used by AKA was developed progressively as a result of comments by the
users and attempts to use the system by the experimenter. The aim was to start with as
few nodes-types as possible and add them only when significantly large chunks of
information could not be represented. Hence AKA started with 4 node types: claim,
evidence, question and evaluation. Evidence could support or contradict claims, as could
claims, evaluations analysed claims which in turn could be used to address the question
or questions. Critiques were added after a number of testers commented that they could
not fully evaluate competing claims using evidence alone: evidence could be criticised for
methodological and other considerations; claims could be attacked for being
unparsimonious and so on. Similarly, assumptions were added for similar reasons: a
tester indicated that claims were often based on certain assumptions and could be attacked
indirectly by attacking these underlying assumptions. Phenomena were added still later
as something that claims are set up to explain (other than questions). Both hypotheses
and theories were added as special types of claim. These last three mentioned node-types
are really variations of nodes that were already existed, the reason for incorporating them
is to make the notation more tractable, rather than simply making it more expressive
although it also does this. It is assumed that during the selection of the node types
learners would be triggered by terms used within the text, it seems useful to provide
learners with the option of doing this.
163

AKA - Directiol
Creates different types of node
Deletes nodes and relations
Allows nodes to be linked
Renames nodes and changes types (where permissable).
Flashes nodes of a certain type
Balloon help facility
The design of a knowledge structuring tool
9.3 USING A K A
The notation above was incorporated into a system, AKA, which was implemented in
HyperCard; the following section introduces the various features of the system, with
some information as to how these were implemented.
9.3.1 The user interface
The user interface of AKA was designed to be as simple to use and as quick to learn as
possible. It was felt that direct manipulation of objects, using the mouse, was the best
way to achieve this. A tools palette was used to perform most of the major operations
that could not be performed by directly clicking on an object (see Figure 9.1). As many
of the participants who would be used to test the system would be unfamiliar with the
Macintosh interface, menu operations were kept to a minimum, except where it was the
simplest means of achieving the desired effect, or where the command would be used
infrequently.
Figure 9.1 The tools palette.
çi
Because AKA was driven as much as possible by the mouse it necessitated having
separate modes for each type of action; AKA had three modes: browse mode, link mode
and delete mode; clicking on an object in any of these modes has a different consequence.
To avoid confusion, the mouse-pointer was used to signal to the user which mode the
system was in. When in browse mode the cursor was set to its default arrow shape until
it was moved over a draggable object_ When this happened the pointer changed to a hand
showing that the object could be moved. In link mode the same default arrow cursor was
used, this time moving it over a linkable object changed the pointer to a cross. Finally
when in delete mode the cursor took the form of a dustbin to indicate that objects could be
deleted when in this mode.
164

EvidenceEvidence 2
Node type
Node name
ContradictsRelation type
EvidenceEvidence 1
Type text in here...
Scroll bars
Resize box
Pop-up text field
The design of a knowledge structuring tool
9.3.2 Nodes and links
Nodes in the network are represented by rectangles which contain two text areas: a type
area which contains the category of the node (claim, evidence and so on) which is in
bold text; and a name area which contain the name of the node which is entered by the
user, as an aid to discriminating the node from other of the same type. Nodes also
contain text fields, to allow the user to record notes. Links are directional, the direction of
the link being indicated by an arrow; the relation type of the link is denoted by italicised
text. Figure 9.2 shows the main components of the network.
Figure 9.2 The main components of the network.
9.3.3 Creating objects
Objects are chosen via a pop-up menu activated by holding the mouse down over a button
in the tools palette (see Figure 9.3). Selection of the appropriate type is achieve by
moving the mouse-pointer over the options and releasing the button when the required
node type is highlighted in black. The cursor then changes to a small rectangle to show
that it is ready to create a node, clicking this cursor anywhere in the workspace creates the
node of the required type, in the place where the mouse was clicked. The system then
prompts the user for a suitable name for the node: 'Untitled' is the default name.
Both the nodes and the relation names in AKA are HyperCard fields, lines are simply
drawn onto the card. HyperCard fields were chosen in preference to buttons, perhaps the
most obvious choice, for two reasons: first, fields allowed the use of nodes that contain
both a type and a name, buttons allow only a single line of text; second fields can also act
as containers for text allowing the nodes to contain information about themselves. On this
165

Question
HypothesisClaimEvidenceAssumptionCritiquePhenomenon
WildCard..
The design of a knowledge structuring tool
first point, buttons could have been used if the node type were represented by an icon
rather than text; however, it was felt that given the relatively large number of different
node types the proliferation of different icons could cause confusion. The second point is
important: both the argument nodes and relation names in AKA store information relating
to which other nodes they are linked to, and the relation names also store information
relating to the strength of the link between the two nodes that it joins.
Figure 9.3 Choosing the object type from the pop-up menu.
9.3.4 Moving objects
Once created, screen objects can be moved around the screen simply by positioning the
mouse over the object, holding the mouse-button down and dragging the mouse.
Releasing the mouse-button deposits the node at the co-ordinates of the mouse-pointer
when the button was released, any links between the moved-node and other nodes are re-
drawn. During the dragging process, a grey rectangle indicates the future position of the
node, in a way similar to that used by the Apple Macintosh operating system when
dragging files, windows and folders; Indeed, the same dragGrayRegion function used
by the operating system is used by AKA. It was felt that this was desirable to the
standard way of dragging in HyperCard (where the object itself, rather than a grey
rectangle, follows the mouse-pointer around the screen) for three reasons: first it is
quicker, with less annoying lag between a movement of the mouse-pointer and a change
in the object's position. Second, it is tidier: when objects are linked, moving the object
directly reveals the mess of converging links under it, moving a grey rectangle avoids
166
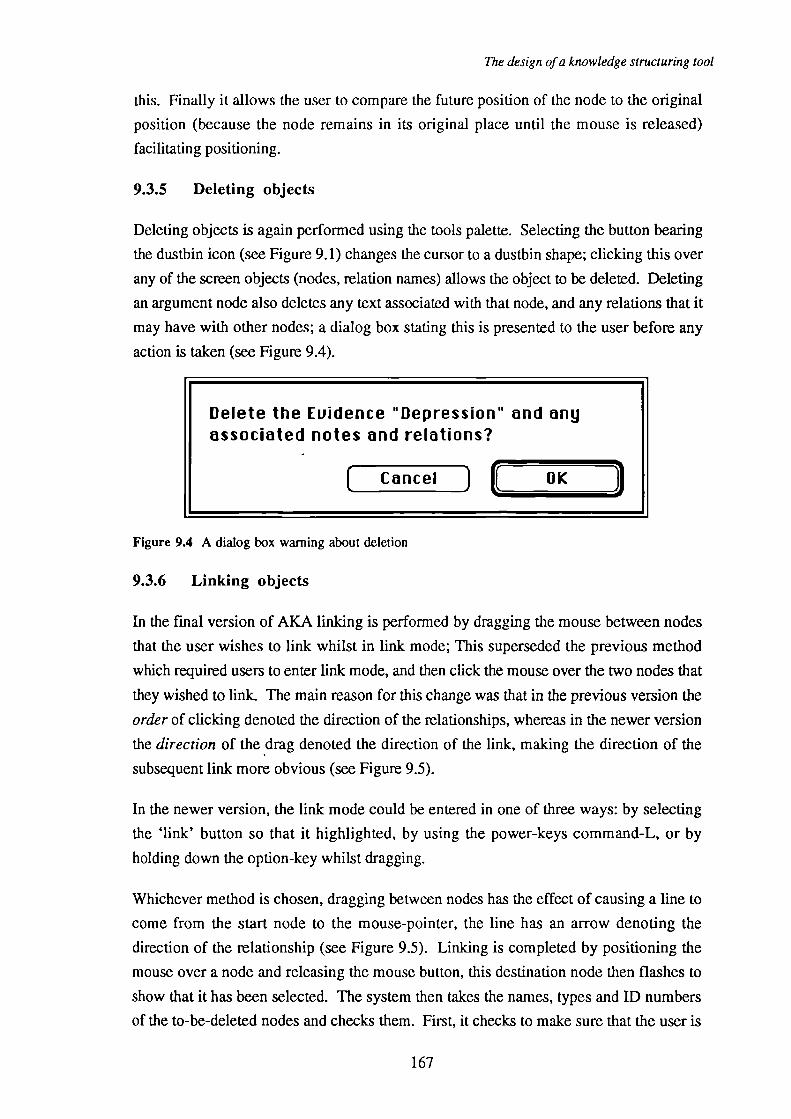
C )OK
Delete the Evidence "Depression" and anyassociated notes and relations?
: Cancel )
The design of a knowledge structuring tool
this. Finally it allows the user to compare the future position of the node to the original
position (because the node remains in its original place until the mouse is released)
facilitating positioning.
9.3.5 Deleting objects
Deleting objects is again performed using the tools palette. Selecting the button bearing
the dustbin icon (see Figure 9.1) changes the cursor to a dustbin shape; clicking this over
any of the screen objects (nodes, relation names) allows the object to be deleted. Deleting
an argument node also deletes any text associated with that node, and any relations that it
may have with other nodes; a dialog box stating this is presented to the user before any
action is taken (see Figure 9.4).
Figure 9.4 A dialog box warning about deletion
9.3.6 Linking objects
In the final version of AKA linking is performed by dragging the mouse between nodes
that the user wishes to link whilst in link mode; This superseded the previous method
which required users to enter link mode, and then click the mouse over the two nodes that
they wished to link. The main reason for this change was that in the previous version the
order of clicking denoted the direction of the relationships, whereas in the newer version
the direction of the drag denoted the direction of the link, making the direction of the
subsequent link more obvious (see Figure 9.5).
In the newer version, the link mode could be entered in one of three ways: by selecting
the 'link' button so that it highlighted, by using the power-keys command-L, or by
holding down the option-key whilst dragging.
Whichever method is chosen, dragging between nodes has the effect of causing a line to
come from the start node to the mouse-pointer, the line has an arrow denoting the
direction of the relationship (see Figure 9.5). Linking is completed by positioning the
mouse over a node and releasing the mouse button, this destination node then flashes to
show that it has been selected. The system then takes the names, types and ID numbers
of the to-be-deleted nodes and checks them. First, it checks to make sure that the user is
167

This operation can't be performed, check theperissable links and directionality of the link(USE BALLOON HELP!).
OK
I
( Why not? )
The design of a knowledge structuring tool
not trying to link the node to itself, a pointless action, but one that can occur by accident;
if this is the case it exits the linking routine informing the user why via a dialog box.
Second, it checks to see if any of the nodes are wildcard nodes, if they are then it invokes
a routine that deal exclusively with this type of node. If neither of the nodes are
wildcard, the system invokes a routine that deals with pre-set node types. If this last
mentioned routine is invoked then AKA makes a third check to see if a link is permitted
between the two nodes. If linking the two node types contravenes the linking rules then
AKA exits the routine, presenting a dialog box stating that the node cannot be linked (see
Figure 9.6); this dialog box offers a "Why not?" help facility that gives reasons as to why
the two node types cannot be linked.
ClaimI some claim 1 — Desi nati o n node
X — Mouse-pointer (in link mode)
Drag arrow
Evidencesome evidence —Source node
Figure 9.5 Linking nodes by dragging between them whilst in link mode, note that theline with the arrow follows the mouse-pointer as it is moved.
If the two nodes can be linked together, then AKA selects the link names allowed for the
two node types, and presents them to the user in a scrolling dialog box (see Figure 9.7).
Selecting one of these names, and choosing "OK" causes a link to be drawn, with the
arrow pointing in the direction of the drag, and the relation name positioned halfway
along the link. Selecting "Cancel" exits the routine and returns the network to the state
that it was at before the linking procedure started.
Figure 9.6 The dialog box presented when two nodes cannot be linked together.
168

ContradictsSupports
Cancel OK 3
Select a name for thisevidence/claimrelationship.
The design of a knowledge structuring tool
Figure 9.7 Scrolling dialog containing the permitted link names.
9.3.7 More about arrows
HyperCard, unlike a number of drawing packages such as MacDraw, does not support
lines with arrows. Earlier versions of AKA simply used plain arrowless lines; the only
way that users could tell the direction of a relationship was either by working it out from
the relation name, or by using the facility that flashes nodes in the direction of the link.
Indeed, the instructions for the earlier systems advised users to be consistent about the
direction of the links: to place claims above evidence and so on. This state of affairs was
clearly unsatisfactory: as networks got more complex it became increasingly harder for
users to determine the directionality of the links, resulting in confusion. Additionally, if
maps are to be used to communicate ideas to others then the directionality of the links
should be immediately obvious; particularly if paper-based printouts are use, which do
not afford the luxury of being able to click on elements to get the to flash in the direction
of the link. Later versions therefore used line with arrows which were drawn using the
HyperCard paint facility.
9.3.8 Changing the name and type of nodes and links
The names of nodes can be changed at any time, this is achieved by using a pop-up menu
activated by holding the mouse down over the rename button (see Figure 9.8). Selecting
the rename node option causes the mouse-pointer to change to a capital letter 'A', clicking
this over any of the nodes causes a dialog box to prompt the user for a new name for the
node.
169

*Change type 0Rename node
The design of a knowledge structuring tool
Figure 9.8 The 'change type' and 'rename node' options
Changing the type of a node is slightly more complex. The nature of the tool prevents the
user from linking certain objects together, thus it is important that users are not allowed to
contravene these linking rules by linking two permitted node types together and then
changing one to an type that is not permitted. For example, if an 'Evidence' node is
linked to a 'Claim' node, it is important that the user cannot change the claim to another
'Evidence' node. Thus the system checks the node that is being renamed and selects,
from a database of known types, all the nodes that can replace the selected node without
contravening the linking rules; these nodes are then presented to the user in a scrolling
dialog box, which they can select in order to effect a change of type (see Figure 9.7).
Changing the type of a link follows a similar procedure to changing the type of node (see
above) except this time the system checks its database for a list of relationships that can
hold between the two nodes connected by the link. Again these are presented to the user
in a scrolling dialog box.
The exception to these rules is if the node selected is a wildcard node, identified by it type
being written in italicised text. Recall that wildcard nodes can have any type, and any
relationship with other node types. Thus there are no restrictions placed the possible
types, or relationships between adjacent nodes when one is a wildcard.
9.3.9 Text fields
Each of the argument nodes has a pop-up field associated with it that allows text to be
typed into it. Text field are accessed by double-clicking on an argument node. When the
field appears it does so with the cursor already placed at the end of any text in the field (or
at the top-left if there is no text already in) so typing can be begin straight away.
170

The design of a knowledge structuring tool
The default size of the text-field is 6.6 by 2.6 cm and the default text font is Geneva 9
point, although these can be changed by the user if they wish. Early versions of AKA
used standard HyperCard fields as text fields, but later versions used external windows
as they allow the user to resize the text-field by dragging a resize box at the bottom right
of the field, something not permitted by HyperCard fields. Changing the size, style and
font of the text is achieved by using the standard Macintosh menu facilities.
In addition to resizing text fields they can also be moved; moving the parent node causes
any open text fields to move proportionately. Text fields can also be move independently
of nodes by holding down the control-key and dragging with the mouse. This feature is
useful when multiple text-fields are open at the same time and the user wishes to read
them all without disturbing the structure of the underlying network.
Closing the text-fields is achieved by the same means as opening: by a double click over
the parent node. When text-fields are closed any changes to the text made; including the
style, size and font are save; changes made to the size of the text-field are saved also.
9.3.10 Changing the strength of links
In certain circumstances it was thought that users would like to be able to show that some
relationships are stronger than others. For example, a piece of evidence supporting a
claim may be widely criticised. Alternatively a claim may be supported by evidence which
it is generally agreed is good evidence. AKA allows such distinctions to be made by
allowing the user to represent the strength of the links. This is done simply by having
three thicknesses on line: thick lines standing for strong relationships, thin lines standing
for weak relationships and medium lines standing for medium strength relationships.
Figure 9.9 Changing the strength of a link
171

This button allows you todelete either argumentnodes or relations, afterselecting this button clickthe mouse on a node orrelation that you wish to
( delete. ./
The design of a knowledge structuring tool
The default line size, and therefore the default relation strength is medium; although this
can be changed by the user very easily. If the mouse is placed over a relation name and
the mouse-button held down then a pop-up menu appears over the relation name, this
contains the three link strengths, with the current strength having a tick next to it;
changing the link strengths is done by dragging the mouse over the appropriate menu
option and releasing the mouse-button, this causes the thickness of the line to change.
9.3.11 Balloon help
In order to make the system as simple as possible for users to use alone, a balloon help
facility is provided. Balloon help uses the FullBalloons external command from the
Rinaldi collection which automatically turns the Macintosh "Finder" balloon help on, and
allows scripts to be placed in screen objects which evoke a help bubble when the mouse
is move over it. The script is executed every time the mouse-pointer enters the button that
contains it, if balloon help is switched on then the external command "FullBalloons"
places the quoted text in a speech bubble on the screen (see Figure 9.10).
Figure 9.10 Balloon help for the "delete node" button.
Balloon help is switched on by selecting the "Balloon help" button in the tools palette,
when it is switched on the icon of this button changes bears a cross showing that it is
active; clicking it again turns balloon help off. Balloon help is available for all of the
buttons in the tools palette, many of which are modal, that it the buttons can have
different functions depending on the state of the system. For example the balloon help
button itself has two functions: to turn balloon help on if it is off, and to turn it off it is
on. Such modal buttons are handled by the use of IF... THEN.. handlers in the button
script. Thus different two alternative messages may be displayed, depending on whether
the system is currently in link mode or not
172

The design of a knowledge structuring tool
As well as providing help relating to the function of the various buttons, balloon help can
also indicate to the user what other nodes a particular node can be linked to, and the
relations that can exist between these. This is the main function of balloon help in this
system, and was implemented as a result of a number of users complaining that they
could not remember what objects could be linked together, and what relationships were
permitted. Paper-based descriptions of this tended to be ignored as they were difficult to
read, and before balloon help was implemented a number of users wasted time trying out
combinations of links to see if they were allowed and what relationships were provided.
Figure 9.11 shows this facility in operation, note that it provides information about what
the node is, what it can be linked to and what relationships are permitted.
I Some evidence Evidence
This is an evidence node,it can support orcontradict claims,assumptions, hypothesesand critiques.
Figure 9.11 Balloon help for linking.
9.3.12 "Why not?" help.
"Why not?" help is a provision for allowing users to obtain some rationale for the
restrictions placed on linking. When the system exits a linking routine after failing to find
the attempted link in its database, it provides a dialog with the option "Why not?" (see
Figure 9.6). Selecting this option brings up a window containing a text-based
explanation why the two objects could not be linked. The window shown in Figure 9.12
is displayed when the user selects "Why not?" after unsuccessfully attempting to link two
evidence nodes together. The help text is stored in a number of hidden HyperCard fields,
there is one field for each help text, which is determined by the number of possible
combinations of node that are not permitted to be linked. Each of the fields has a name
173

HeIp ...............................................................Although evidence may be seen to be related to other evidence, this is oftenan unhelpful way of viewing argument. Much better to see evidence assupporting or contradicting some claim about the world, and Afrect4/supporting or contradicting other evidence.
•••••
The design of a knowledge structuring tool
formed by the concatenation of a source node and destination node; for example the field
containing the help text shown in Figure 9.12 is called TvidenceEvidence'.
Figure 9.12 "Why not?" help window selected after the user attempted to link toevidence nodes.
The linking function keeps track of the types of the nodes that the user is attempting to
link in a global variable, all it then has to do is to concatenate the two types, check if there
is a field with that name, and if there is place the text into the help window.
9.3.13 Flashing direction
As mentioned in the previous section the facility that flashes nodes in the direction of a
link was written before AKA had arrows. It was preserved, however, because even with
arrows, confusion can arise when the screen gets cluttered. The problem here is not
always the direction of links, but as nodes start to overlap and links get tangled, it is often
difficult to see which objects are linked together, and what the relation names are. The
flash direction facility was preserved for this reason. It is invoked simply by double-
clicking the mouse over a relation name, this causes the nodes to flash in the order:
source node, relation name, destination node, thereby indicating the direction of the
relationship.
9.3.14 Listing nodes
A facility that arrived late in the evolution of AKA was the ability to list aigument nodes
that reside on the screen. This could be done in two ways: by the order in which they
were created, or by the type of node. In both cases the lists are evoked by selecting a
menu-option. Being able to list the nodes was implemented for two reasons: first, it
provides a alternative way for users to find particular nodes, rather than scanning the
network; and second, it was thought that providing a different representation might give
learners a new perspective on the information that they are working with.
174

The design of a knowledge structuring tool
9.3.14.1 Listing by order
Listing by order merely collects together all of the argument nodes currently residing in
the workspace and orders them by their order of creation. Because each of the nodes is a
HyperCard field, and HyperCard automatically gives each new field a unique ID number
of increasing size, ordering the nodes in is very simple to perform. The complete list is
placed into a external list window, which allows data to be structured in columns (see
Figure 9.13). Selecting any of the names in the window causes the corresponding node
to flash, indicating the location of the node. Double-clicking on the name opens the text
field associated with the node.
9.3.14.2 Listing by type
Listing by type produces a more structured list of the argument nodes, listing them
according to their type. This feature simply checks through all of the argument nodes on
the workspace grouping together nodes of a similar type, putting them in a sub-list, and
the creating a master list °fall the nodes by concatenating these sub-lists in a fixed way.
As much as possible, the list is structured according to the precedence of the node type in
argument; thus questions appear first in the list, then phenomena, evaluations, theories,
hypotheses, claims and so on (see Figure 9.14). It was envisaged that this list may be a
useful alternative representation for the argument network, perhaps giving users a fresh
perspective on the arguments being constructed. It is for this reason that the list produced
by AKA contains the titles of arguments even when there are no nodes of that type; to
encourage learners to reflect upon the argument, perhaps thinking "I've got no
assumptions, perhaps I could identify some."
9.3.15 Aliases
It is almost inevitable that during the construction of a network that a single node may
need to be linked to more than one other node; for example an evidence node may support
one claim and contradict another. If the two claims are some distance apart on the
workspace, or there are a number of other nodes between the nodes, then the network
can get tangled and difficult to read. For this reason AKA offers an alias option which
allows a particular node to be copied and placed anywhere on the workspace, thus the
alias can be linked to the node instead of the original which can reduce the number of
confusing cross-links.
Aliases are identified by their titled being in outline text rather than the normal bold text;
they also contain no text fields, instead double-clicking on an alias causes the text field of
the original node to open, and flash to direct attention.
175

NKR V. ILO
MFRARRZ
In ""7"."M=I
.4•14-1--1--1-1-12:12=1:13111-4-4-1--1-t4—111A/4—Vial Owereada1What le 1n01.1.1Meow*treatImoterMal WhewCow InkeGorda vir.Lawry.WinF..% Problemamoral Nees(warm ...web*INreln1poyas.oholoolPaetaloglool fo•OpIliernewlea ireaaellseSew*Le& ./Cmirel▪ lartreNod 1:11relmbropitlepoor MN en..lone. oeoweembTer
Ow.lea
Flam
▪
e.a.
Theory
lebloomTheo,tvlemooMimesClamMhoMenMaotvlema.IrkirraaUrteetrehilenorMemo,Meow
[Adore.
EVAUJATIONS
THEMESTloory General viers
Theory General %lees
HYPOTHESES
CI. APISClaim Mows
Clain Societal biluenoe
Claes PaYchekl'calClain fareflj
Clain Negative
Clete Dyal'hectb,Mire Smog elan
(111:414:1&leen. StarvatienEvident* Coot Ghshes
Cele." Wrote*(Aden. Cnotitg
Crleense /ors*. Problem
Ietelonee looroseva movie.
(elder. P•trirtiUrldenee Lack of Cohlrel
Irldenoe ItchreEvidino• feral Monroe
(Hamm In-egular Eating(widen.. Pow self eatoom
C• boom hag. obersann
(Monet Thorapy
(Odom. Uralltled Roe.
Evidence Same vvIderot
ASSUFFT OYS
COG' OLICS
VIDCAMOS
OM= II ER E Eal E In it
GUEST ENSWW1.Partneri
P1.00111:11A
Ararevrla•Vtlat ISuisnia,
The design of a knowledge structuring tool
Figure 9.13 Listing the nodes by order of construction.
Figure 9.14 Listing the nodes by type
176

This Evidence node is an alias, do you want todelete the original as well?
( Just alias Both ) Cancel
The design of a knowledge structuring tool
Attempting to delete an alias results in a dialog box which gives the user the option of
deleting the alias alone, or the alias and the original (see Figure 9.15). Aliases cannot
exist independently, therefore deleting a node that has an alias will automatically delete
the alias as well; the user is warned of this by way of a dialog box (see Figure 9.16).
9.3.16 Refreshing the screen
Every time a linked node is moved the links need to be erased and re-drawn in a new
place; erasing is done by painting over the old link using paint with the same colour as the
background (in this case white). Unfortunately if the link crosses any other links then the
part of the other link that overlaps with the link being deleted will also be erased. If this
occurs a number of times then the network starts to look tatty with lots of broken lines;
for this reason a refresh screen facility was added. Refresh screen is selectable from the
'Utilities' menu, and simply redraws the screen, mending any broken lines and erasing
any rogue paint.
9.4 SUMMARY
The final version of AKA represented a culmination of an iterative design process.
Features were added following comments by various testers, which were themselves
tested on subjects. It was not only system features that were incorporated as a result of
tests; the notation itself changed as a result of subjects struggling with too few terms, or
terms that were too general. As a result of this the notation is considerably more complex
than it was at the start; perhaps too complex for most individuals. However, given the
nature of the learning tasks (see next chapter) it seemed sensible to have too many rather
than too few nodes and relation types.
Figure 9.15 Dialog box presented when attempting to delete an alias.
177

This Evidence node has an alias associatedwith it, deleting it will also delete the alias.
The design of a knowledge structuring tool
Figure 9.16 Dialog box presented when attempting to delete a node that has an aliasassociated with
AKA suffers most from being implemented in HyperCard. Although it affords rapid
prototyping and an in-built user-friendly interface, it is much less flexible than a true
programming language often many of the features had to be achieved in ways that were
notable less graceful than they could have been. Perhaps HyperCard's biggest drawback
is that it is slow. For short programs that do not require use of the graphics facility this is
negligible; AKA however uses long scripts and extensive use of graphics. Additionally
when networks get bigger, AKA runs ever slower. In some ways this may be more of a
personal bias; few of the subjects and testers commented on the slowness, perhaps
because they were unused to other, faster, structuring tools such as MacEuclid.
Unfortunately the nature of the studies reported in the next two chapters required
extensive manipulation of the system to arrive at appropriate control conditions, and thus
use of off-the-shelf software was not possible.
178

10
Two case studies
10.1 INTRODUCTION
Although laboratory-based studies into the use of knowledge mapping tools can tell
us a great deal, it is also the case that the artificiality of the task can have the
implications for the way that any tools are used. A number of researchers (Suchman,
1987; Carroll, 1990) have suggested that in order to appreciate the limitations of a
computer system (or any system for that matter) one needs to study it being used for
real tasks. To supplement any experimental observations is was deemed appropriate
to investigate the use of the knowledge mapping tools in a real task. Two subjects
took part in the study and used the tools to organise and structure their ideas in order
to write an essay assignment.
Essay writing and learning place different demands on an individual. Essay writing
does not require that learners retain information—although this may occur as a by-
product of the writing process. It does, however, require that the learner understands
the information if ideas are to be communicated effectively. At the point of the study
the subjects in these two studies claimed that although they had a basic grasp of the
main points to be articulated in the essay, they did not have a clear idea of many of the
details and arguments that they would undoubtedly need to incorporate in o the essay,
neither did they have a clear idea of the structure of the information. It is important at
this point to define that the term the structure of the information relates to the
relationships between arguments and concepts, it should be contrasted with the term
the structure of the essay, which in addition to the structure of the information, is
compromised with other issues such as rhetorical style and having to present the
information in a clear, linear way. The first term involves learning, the second,
although it can involve learning, is more concerned with the process of writing, and
involves different skills. Of course it is impossible to pinpoint, in a task such as this,
the point at which learning skills end and writing skills take over, in many ways the
179

Two case studies
process of writing occurs side by side with the process of learning: one naturally
complements the other. Writing also involves organising ideas, another process
which can have an effect on recall.
The subjects were given two tools to use: an unconstrained knowledge mapping tool,
and a constrained argumentation tool (AKA) which was described in detail in Chapter
9. The knowledge mapping tool was given as a means for subjects to create and
organise their notes; the constrained tool was given to allow them to represent the
structure of the main arguments to be incorporated into the essay.
10.2 METHOD
10.2.1 Subjects
Two subjects took part in the study: an MSc student in health economics, and a BA
student in English literature. Both had been assigned essays as part of their course
and had agreed to use the tool to help them in this task. Both subjects were male; and
were not paid for their participation.
10.2.2 Materials
Subjects in this study were provided with two tools to help them in their task. The
constrained tool, described in Chapter 9, and an unconstrained concept mapping tool.
The unconstrained tool was similar to the constrained tool, in that it both nodes and
links could have types assigned to them, the difference was that these were optional
not mandatory. The purpose of using two tools was that it was anticipated that in
such a long sessions subjects would probably wish to have some form of scratch pad
where they could record their ideas, and perhaps construct simple maps, before using
the constrained tool. As we shall see the emphasis that the subjects placed on the two
tools was one of the principal differences in this study. The constrained tool was of a
slightly earlier version than the final one described in Chapter 9. The mos t salient
difference is that it contained only six node types: Claim, Evidence, Question,
Phenomenon, Assumption, Critique. It therefore omitted Hypothesis and Theory
which were added later. Additionally, the arrow facility had not been implemented;
links between nodes were therefore 'plain' lines.
Although the two tools operated independently of one another, it was possible to cut
and paste text between the two tools, although nodes and links could not be
transferred in this way.
180

Two case studies
A Macintosh IIcx was used to run the experiment. This was fitted with a two-page
monitor, enabling the two tool windows to be on screen at the same time in A4 size.
As in the previous experiments screen-recording were made; and a video of the
interaction was made to match up on screen actions with verbal discussions.
10.2.3 Procedure
Subjects were introduced to the two tools by way of a paper-based tutorial (see
Appendix 3) which familiarised them with the various facilities available to them.
Following this they were shown examples of networks created by other subjects
during the development of the tools; during this part the experimenter discussed the
nature of the various node types and relation names. Subjects then had an
opportunity to practise using both tools by themselves. This required them to
construct two networks based on the Callanish stone circle. A short discussion
followed this when subjects were asked to describe the network that they had created
to the experimenter; the purpose of this was to ensure that subjects had a working
knowledge of the various argument primitives used in the constrained tool. When it
seemed that subjects understood how to use the tool, they proceeded to the main part
of the study.
Subjects were allowed as much time as they wanted to complete the task. They used
both tools to organise and structure their ideas. They were requested to bring along
any books or notes that they felt that they might need to help them to compete the
task. During the session the experimenter periodically interrupted them to discuss
what they had done, and what they were going to do next. This method was chosen
in preference to using 'think aloud' protocols because it was envisaged that having to
verbalise in this way may interfere with students efforts to learn and organise the
information.
The session ended when subjects felt that they had assembled enough information to
help them to write an essay. Both subjects were given the option to take the networks
away with them either in computer-readable form, or as a computer print-out which
contained both the map and any notes that were made.
10.3 CASE STUDY 1: HEALTH ECONOMICS
Case study 1 investigated the use of knowledge mapping and knowledge structuring
tools in supporting essay writing in the field of health economics. The subject had an
assignment to write an essay relating to the factors that influence health states. This
required him to discuss various claims and theories, assess these based on different
181
Two case studies
criticisms and evidence, and finally produce a conclusion. It was anticipated that the
use of the constrained tool would help in structuring these arguments and information
required to complete this task. This subject used the tool for a total of 6 hours and 40
minutes, excluding training, over the course of a single day.
10.3.1 Use of the tools
Participant 1 used both of the tools, but spent the overwhelming majority of the time
using the unconstrained tool. Indeed it was only when he was four hours into the
study before he opened' the knowledge structuring tool and this was only briefly to
check the different node types available. All told this subject spent 5 hours and 32
minutes using the unconstrained tool, and only 1 hour and 8 minutes using the
constrained tool.
10.3.2 Description of the interaction
The first section of the interaction consisted of a period where the subject made
copious notes in a single note-field belonging to a node in the unconstrained tool
called "Class differences in health" the information outlines empirical evidence
relating to the observation that there are class differences in health. This took
approximately one hour. Following this period two other nodes were created: one on
ethnicity, and one relating to common sense theories. Notes were made in the
ethnicity node outlining the fact that the claims in the first node are flawed as they
failed to control for ethnicity. The 'Common sense' node contained information
relating to the general perception that there are class differences in health (see Figure
10.1).
Discussions with the subject revealed that this part of the session involved laying out
what he already new about the topic, and making notes to outline various objections:
"What I'm doing is trying to lay the foundations of the argument. Everyoneknows that there are class differences in health, but we shouldn't take this as amatter of good faith. I'm trying to provide evidence for them."
Having set up a general framework which lays out the nature of the problem to be
addressed, the subject then proceeded to create a set of explanation nodes that address
some of these issues.
'The two windows were both on screen that the same time and were both in view. However, I referto opening when a participant makes the window active for some reason.
182

Immuismnnymiwommmr K Tool
ETIAIREH VEDICAL SOCIOLOGY - CLASS DFTERLIICES VI 1401-TH - ON THE RELATIONSII• KNEEN LIKMPLOYMENT 011511EOLTH
Is Vlore My MY/vile lammed IM Wien ef p. .014.014 slam dIfferenees 01 Mallhf
beezegoTo_. Ire "ere any a/Mpule eoplamtlens ef oriel InevalIties b WISP.......................................... are the pulals health InOteatlera of Mew to:pia...11ms?
PM MIKE - The metal Ow vedients I -5 rem devised by Nevem. ISO years ma and WON as the seeial Mass elareficatien ef the ItaqislesrOenerals office Ocry therefore r• need la reeerd the father's eempahen et all birth and all male deains - and have Wsequently been used by theOPCS I. glassily the WOW populatien f.r most effleial Gevernment stattrites Creations are frequently raised WO its us evilness Way.Class 3 has Mr.*/ Mee broke. Ma Me Wow It has cr.rn mere Man any Mbar ever the past 50 yews in (15, 1.. the middle Mass. It Pootraditirolly Men VW en male movatien I., bisterical mums (altheugh rem. are my included) - 01. 1% nor has the biggest preportien elverhy venom 01 11 verld Periops mesi beipertantly the Mole 1501w 01 orreic predictive - yea de net mower% represent yew elms le Mew ethealth Post as you may net reprosent year Mass it terms ef edueatlenal Melmreund, wealth midermset sr am ether traditional emmende endeinnentSe My le It still m Pneably bemuse It Is establistwd and mod Immtntain. There I dream* le nuke mere sontleated and mrdati tt, .4. 15.entensian owlet slam 3.
The BMA Rawl was orentirtemd I. assess Mellor losectrin the ...4.1 .1... yradivis there was eny evidence le support IM elabn that !We arepenrirtent differ ewes et WM In ether words had Sal.years .4 01. WS had the Intended Imen ef providing free health ow far all revedlev ofthe ablhly te pec la feat re Imer there we persistent slaSS differences In health but Is there a reasonable mph/Mien? The Impact .4th. Blaci Repertvas ine exteat .401,. Offerences Mild saw as • surprise le ninny lhe Report rat oorrvismed by • LaMar generenent but after an election was dna
fer publimeim was, the Carrervaiives NM 4.. te lb coMent them was an atienot to woos the Reperi end it vas eventually mdaltsbed
SY Penguin Perhaps In pari Maw. .10w d•verram•nts attempts at nvermlen the book sold May and mused eensieerable endoressmort and a generalMort Mother lee MY ran *Whine Hs Wm. TM Report else ...rated • law el swim* Mar Mire .41.4. 0* atiembei I. explain
Me observed flfforme. ei MathThe wet invert/sit welusiv ef report rat that MIhmagh MaIlla levels were ImprevIry .11. 15. 111140s/50s relatively .04.1 .1... I and 2 WIimpreved wrkedy rad elmis 4 wel Shad Vamped little
Obviees p-eblems .115 15. elms 111•101o40.ns Voinselves, ie Vore ire ros .0014 11.404.. and mast importantly they are a result .4 4.411' weerminded pf•esswel ma* (enee & Cremen) -Sem 0411, 01 nee AY Wham. Wormed any %eery el swab/ 01 01.0 vriten s . their standards efMot was rleht thr rnerriorship ef Vie va-ims Masses were private mi prebably darlymi hem their ern Mass experiver (Jones 3. Cameren) Po theearly day • .1 11. eleasirleatien le Marne • mares .04.1 .1... le terms ef his wypailen was I. Wert.. an Invertant pert ad hen, emodays Nov IsOttle Inloritenee' ef eempailv am/ It um be said to remount • far Ws rpm MO reheat., persoyhty
......
.............
........
......
......
......
......
1110
JE1
Two case studies
Figure 10.1 Notes created for the node 'Class differences in health".
In total four nodes named explanation nodes are created (called explanation 1 through
to 4), these are created in rapid succession, all within 15 minutes of one another.
Brief notes are typed into each of the note-fields associated with these nodes; the
notes simply outline the nature of the explanation and are written in skeletal form, as
though they are to be fleshed out later (see Figure 10.2).
Having assembled a number of possible explanations for the notion of class
differences, the subject then tries to outline some evidence which related to the
explanations. A node is created with the name 'Evidence' and some information is
typed into it. At the end of the evidence a contradictory clause which begins
'However...' is introduced. Immediately after a new node is created, named
'Critique' and the 'However...' clause pasted into it. He said of this move:
"I suddenly realised that I was saying two separate things, on the one hand Iwas giving evidence to support this position, and on the other hand I wasqualifying the statement with a critique, which is sort of what you do in anessay. I thought that it [the clause] would be better off in its own node,mainly because it's important and I intend to come back to it."
183

WI!PAMPRIM
MATERIALIST
(a) Levels of health arise es a consequence of competitive capitolism. Health directly relatedto the distribution of goods, income and wealth...... • • •(b) Illness result of poverty, poor housing, poor education, etc.
(c) Working conditions; exposure to noxious substances, industrial injury. (Navarro, 1978)
a
Two case studies
Figure 10.2 Skeletal notes in explanation note-field
In fact, the position represented by the 'Evidence' node is not really evidence in the
strictest sense, but itself more of a critique of a position. The node 'Critique' is
therefore a critique of a critique! (see Figure 10.3)
He then expands on this criticism in the node entitled 'Critique', he also notes what
the people asserting the critique believe should be done. The node 'Evidence' is then
moved over near to the node 'Explanation 1' these are then linked, and asterisk is
used to denote this relationship. The critique is then linked to the evidence node,
again an asterisk is used.
More notes are then made in the node entitled 'Explanation 2'. These elaborate upon
the information that was already there. As before, a critique is placed at the end of
the notes (see Figure 10.4). Unlike before, this is not incorporated into a critique
node. A new node is then created relating to a theory put forward by LeGrand, some
of the information in this node is incorporated in a node created called 'Economics'.
The text from economics is copied, pasted into the new node 'LeGrand' and the older
node is deleted. Thus the old node which stated general economic principles is
specified so that it asserts a single theory.
There then follows a period where various note fields are opened an closed as the
subject reads the text contained in them, to check what information they contain.
184

bigiingi Iexp Ienation 2 1 FexTianah.71-4
Hipro SAnat
Jones & Cameron argue that the theevidence which results from viewinghealth in terms of the social classclassifications Used Is an artifact of theway the table has been drawn up. In otherwords, the table was built around thefigures and using an approach like thisyou can explain anything.
....
bintmeizim
• ..........
..............
...........
Two case studies
critiqueHowever, there are persistent Inter -class differencesobserved whi ch cannot be adequately explained here. Alsocannot explain the steep observed gradients for the young,eg, young men.Jones & Cameron beleive a class classification must bebased on a theoryl
...... " ' • • • ' • Figure 10.3 An evidence and critique node, note that the information in the evidence node
is more of a critique than evidence.
..... .._ ....... •
SOCIAL SELECTION
(a) Downward Drift - eg Schzophrenia, (Goldberg & Morrison, 1963) - Retrospective case-controlstudy, le. the worst type of tnal. The control is the general population. The idea is the controversialclaim that the weak and frail naturally end up In social class 5. The implication of the Goldberg &
Morrison study Is that causality runs from failure to achieve to schizophrenia, but don't prove it andthe causality may run the other way (similarly the direction of the causal link between health andunemloyment is unclear). Also they don't consider the class issue that historically and even to anextent today (eg. ethnic minorities) those of lower social class are more likely to be labelledschizophrenic.
(b) Associative mating - le. titter women marry upwards (Insley, 1980)
(c) Genetic theories - Potentially there are predisposed genetic factors which lead to poor health.However, environmental factors are still likely to be required to stimulate those factors andtherefore environmental concerns, eg, better quality housing, more even distribution of wealth, etcare more important.
:
I:
.:.111n,
ig
•+.1.,:i4
4 :..
....
.=
I'
-
-**•,...:to
..?.:
%%-
• k
1;1II
R..:
U.'
Figure 10.4 The skeletal outline is expanded, note that the assertion 'Downward drift'contains both expository information and information that criticises this position.
185

Two case studies
Following this the explanations that are currently unlinked, that is all of them bar
'Explanation l', are linked to the concept 'Common sense' (see Figure 10.5):
"What I am trying to show here is that although we believe intuitively thatSocial class must have an effect on heath, there are a lot of confoundingfactors. I mean, trying to isolate the effects of SES [Social-Economic Status]per se from the knock-on effects of, well, Northeners eating pies and drinkingbeer is difficult. I'm trying here to show that there are alternative explanationsfor the effects of class on health, and then I'm trying to knock these down byusing other arguments. So [points to links between explanation nodes andCommon sense node] these are all related, sort of to common sense beliefs"
He therefore sees his task as being to put forward evidence for there being class
differences in health, against opposition which stated that there are no differences.
Next the types of the four explanation nodes are changed from the default bullets to
the type 'Explanation'. The reason why node-names were initially used to denote
type may be indicated by the following exchange:
Experimenter: "These [nodes] are given names that are type-like, why haveyou done this?"
Subject: "I thought it easier to call them just by a name, and worry about thetypes later, when it actually matters."
This indicates that the subject is adopting a least commitment strategy, preferring to
start of with ideas that are relatively unspecified and formalise them later. It is
important to bear in mind that this is not something that is determined by the system
— in the unconstrained tool (but not the constrained tool) types can be changed at any
point during the interaction. Rather, it appears that the subject does not wish to
commit himself to a specific type of node because he is unsure as to exactly what role
the information represented by the node will fulfil as the network develops.
Three nodes are then created all with the type 'Implication'. These are then given the
names 1 through to 4, and linked to the 'Explanation' nodes with the same names (1
through to 4). The implication nodes as yet contain no text.
Subject: "After creating these explanation nodes, which are sort of theories Isuppose; I've now gone on to try and decide what the implications of thedifferent explanations are for health policy."
Experimenter: "You have four implications nodes, does this mean that youknow of four separate implications, each relating to a particular explanation?"
Subject: "No, well not yet, but this one does [points to explanation 1] andgiven that there are all these explanations [points to other explanation nodes]each one must imply something or other for policy, whether its stated is adifferent matter."
186

T__11
Two cure studies
Iciass differhencees in health H
I poleI note ethnicitU I
note *common sense-
explanation txo...tioi, I2 1
........................................................
explanktionexplanation 13 4 1
................................................... •
............................................. •
.....................................................
evidence
.......................................... • • •
...... . one_. . .
LeGrand
u emp ogment 1
.....• • • • • • .
Figure 105 Explanation nodes are linked to the central 'n e' node Common sense
This interchange perhaps reveals something quite imp rtant abou the effec ha us ng
a network-based map is having on the subjects' behaviour. By laying ou he
different explanations separately, and being informed by the text that one explanat on
has an implication for health practice, the subject decides ha a 1 of he o her
explanations must have implications as well. This may then fuel a sear h for the
implications in the literature, or encourage him to refle,c upon what he knows about
health economics to try and postulate an implicati n.
187

'ARTIFACT
(a) function of the claselficallan system adopted.(Janes & Comecon, 1904)
(b) Proportion if the populetion defined as unskilledho. declined. I trw workers enter the workforce at •hIcther level Social class 5110W hoe a wall pool ofolder workers and recent inornigrents
NKR
LIFESTYLE
(a) Social behaviour differential use of alcohol, tobecco,nuUltIon, exercise, etc.
(6) Different cultural Materna of Ill&
Certsinly it would seam intuitively obvious that lifestyleVectors are as much an indlcstor of peer health as social classsod.. occupation le now less closely linked to overell MMussuch lectors are now perhaps bettor prooloo Ow occupation.
Argurnents about social cl I and 2 in scalland hivesimilar haellh status to classes 4 end 3 East Anglia?
(a) Downward Drift - as Schzephrsnia, (SolMorrison, 1963) - Retrospective case-control tudy,Is. ha went type of trial. The control 1(809 floralpopulation. The ido., the controversial claim thatUm weak and (roll naturally and up In social el ss 5TM implication of the Goteborg & Morrison ttudy isthat causallty now Iran fsihre to achieve toscniseenrenie, but don t prove It end Uto csuselitymay run the ether way (similorly tM direction ofIna causal link between health end unemleyrnent isunclear) Also they don I conelder the close issuethat historically and even 10 00 extant today (egethnic minorities) 18011 01 lower yodel class aremacs likely too. 'Mel led mill zabhrenic.
(b) Associative meting - is fitter wOrnOn
OPWOrd, (1110 1 ,9, MEM
(c) Genetic theorise - Potentially then anpredisposed genetic factors which lead to poorhealth However, environmental rectors ars stillIlitely 10 80 remind to stimulate those rectors endtherefore eiwironmentat concerns, og, better qualityhousIng, mere soon dietributian of wealth, etc aremore Important
MATERIALIST
(a) Loomis of Molth rOOeOO consequence of
competitive capitalism Health directly related tothe distribution of goods, Ince/no and wealth. Oursociety is g to making money, which leads toa skewed distribution of wealth. 14.01(0 11therefore not a prime consideretion
(b) Illness result of poverty, poor housing, pooreducation, etc.
(c) Working conditions; exposure to holdout•ututames, industrial Injury (0.010ro, 1070)
cli
Two case studies
In the next step the implications for all the explanations were specified in the text
fields and the implications nodes linked to the corresponding explanations. During
the process of making notes the subject spent a great deal of time with a number of
note-fields open as he tried to determine the nature of the implications (see Figure
10.6). The intention was to fill in the details of the implications and then try and
construct an argument network using the constrained tool.
Figure 10.6 The network with some of the note-fields visible.
Some of the implication nodes were linked together, because the corresponding
explanations both prescribe the same action.
With all the nodes now in place the subject then spends some time refining the
network. Some of the nodes are given proper types, more notes are added to some of
the note-fields and so on.
10.3.3 Using the constrained tool
As was mentioned above the constrained tool was used for only a fraction of the time
that the unconstrained tool was used. In many ways the network provided using the
unconstrained tool contained a reasonably articulate, if rather idiosyncratic and under-
specified argument relating to health care policy.
188

Two case studies
The use of the constrained tool began with the specification of the first claim. This
was basically a re-written version of the information articulated in Explanation 1 from
unconstrained tool, although the text was more focused. Some evidence is provided
to support this position, and a critique node is created which criticises this evidence.
As for the claim both these nodes contain refinements of the information incorporated
into nodes in the unconstrained tool. Following this, three other claims are then
created: named 'Claim l', 'Claim 2' and 'Claim 3'. Text is typed into these nodes,
which again is similar to that in the explanation nodes in the unconstrained tool .
'Claim 1' is then renamed 'No differences', 'Claim 2' is re-named 'lifestyle' and
'Claim 3' is re-named 'Materialist' these names are more meaningful and related to
the propositions that they assert. 'No differences' states that there are no real
differences in health as a function of class; 'Lifestyle' relates to information about the
effects of unhealthy lifestyle that poorer people tend to lead; and 'Materialist' states
that the poorer members of society often live in less healthy areas and so on.
The sole piece of evidence is linked to the three claims: supporting 'lifestyle',
'Materialist' and contradicting the 'No difference' position. A new claim node is
created called 'Differences' to contrast with the no differences position, and the two
claims that assert that there is a difference are linked together with the relationship
`Sub-claim'. As the subject stated:
"It seemed that when it boils down to it there are only two claims: that there isa difference and that there isn't a difference. These then contain more subtledifferences. There really isn't a theory or anything for the statement that thereare no differences; it mainly just contains criticisms of the approaches tomeasuring the differences... I created the differences node because itbalanced the no differences node. These two [Materialist and lifestyle] aresort of sub-claims of it."
The position that there are no class differences is therefore really a null hypothesis;
there is little evidence to support it: the burden of proof lies on those who state that
there are differences.
When asked whether he thought they really were sub-claims he said:
Subject: "Well they're related in some way, and they are sub-claims of eachother, but perhaps they are more than that as well.
Experimenter: "I mean, why have you got 'materialist' a sub-claim of'lifestyle'; why didn't you just put them as both being sub-claims ofdifferences, linked directly to it?"
Subject: "Well, I could, but they aren't independent: having poor housingand education can effect the sort of lifestyle you lead, so they are related."
189

Two case studies
Since in this model claims could only support, contradict, imply or be a sub-claim to
another claim the subject was experiencing a problem of being unable to express what
he wanted, so he defaulted to using a sub-claim relationship. The problem was not
that sub-claim was the wrong sort of relationship, but that it could not express the
nature of the relationship in as fine enough way. It would appear that this is a
manifestation of Green's role expressiveness, which relates to how well the set of
available terms allow the user to express themselves. Note, however, that the subject
could think of no better term than the one he selected; he therefore satisficed with a
structure that was close to the one that he wanted.
Finally in this part of the interaction a claim of 'Selection' was created, again derived
from the explanations made in the unconstrained tool. This contained information
that stated that to some extent so-called class differences in health are a result of
genetically determined differences in health which also determine what class someone
will be in. For example, it is argued that fitter women marry men who are higher in
the class hierarchy. The evidence mobilised to address this claim is rather curious.
The evidence node connected to it states evidence that supports the position, however
the link between the evidence and the claim is a contradicts relationship. This is by
virtue of the fact that the evidence is largely retrospective and has subsequently been
largely discredited. In actual fact what we have here is some supportive evidence that
has been criticised, this criticism should be represented by a critique node attacking
the evidence. At the end of the study the subject agreed with this point and admitted
that he was incorrect in his procedure at this point. This could be due to a number of
reasons. First, and perhaps most obviously, it could be the case that the subject did
not review the network carefully enough to identify this inconsistency. Second, it
may be a manifestation of Green's viscosity, recall that this is a measure of a tool's
ability to be changed. He may have seen the inconsistency but could not be bothered
to change, given that it was not crucial, and would require more work.
Another point was that the 'Selection' claim was not linked in to the rest of the
network, the reason for this was that:
"...it represents a different approach from the one in the rest of the network.It doesn't state that there are no class differences per se, just that the classdifferences are the result of other factors."
In other words by adopting a strict dichotomy: pitting differences against no
differences, the subject automatically excluded information that provided alternative
explanations for the observations. This is an interesting point and is not merely the
result of the constraints provided. The constraints built in to the system would permit
such a feature; for example, instead of a dichotomy three top-level claims could be
190

AKA - Mike
78;
I Claim_1—alilerence-s-
Claimlifest le ()--
I Sub-claim I
Claim maierialist (s)
7777orts
idencel1
D-e
Two case studies
advanced: that there are real differences in class health, no differences, and artificial
differences. The problem with the subject's map is that the argument advanced was
too narrow in its scope. This may perhaps be due to unfamiliarity of dealing with this
type of representation, or it may be indicative of some underlying failure to
conceptualise the problem per se in a suitably rich way.
Figure 10.7 The finished map created using the constrained tool
10.3.4 Summary
This subject was quite well prepared for this session in the sense that he had most
most of the ideas regarding the structure and content of the essay failrly well
formulated at the outset. This can be seen by the amount of text that he was
'downloading' in the early phases (see Figure 10.1). In truth the benefit that either of
the two tools had is questionable, they may have helped clear up a few ideas, but it
seems from the statements that he made during the interaction that the tool was not
191

Two case studies
really helping that much, the rather impoverished constrained map (Figure 10.7) also
suggests that using this tool gave little insights into the problem. I shall say more
about his after discussing the results of the second subject.
10.4 CASE STUDY 2: STRUCTURALISM
Case study 2 was rather different to case study 1: requiring the subject to represent
his thoughts on structuralist theories of literature. It was supposed that this task
really would test the argumentation model; the previous domain, health economics
tends to use terms such as evidence, theory and the like; often the arguments
concerning literature are more oblique, more tied up in discursive text.
10.4.1 Use of the two tools
Subject 2 spent 8 hours and 25 minutes using the two tools spread over two days.
This time divided into 1 hour and 40 minutes using the unconstrained tool, and 6
hours and 54 minutes using the more structure the constrained tool. This is in
contrast to subject 1 who spent the majority of the time using the unconstrained tool.
10.4.2 Use of the unconstrained tool
As for subject 1 the interaction started with the creation of a single node in which the
subject made copious introductory notes, finishing off by specifying two questions
that needed to be addressed: 'Is structuralism an adequate account of language?' and
'Is language a prison?'. The subject then creates three other nodes in quick
succession: 'Basic Saussure', 'Marxism' and 'Historical context'. Some expository
text is typed into these nodes. At this point the subject justified his actions:
"Well I've got two questions in here [the `Superstructuralism' node] relatingto whether it is a good account of language and what its implications are [Islanguage a prison] so I'm just laying out the various factors that are relevantto answering those. 'Basic Saussure' is just Saussure's position, and'Marxism' and 'Historical context' are sort of to do with thoughts that wereflying around at the time."
Thus having formulated the question, the subject was laying out the historical context
of the arguments. 'Marxism' and 'Historical context' are then linked with an untitled
relation.
A new node is created 'Public system' this is linked to the `Superstructuralism' node
by the relation 'Evidence'. Two other new nodes are created: 'Sign nature' which is
linked to `Superstructuralism' with the relationship 'Evidence' and 'Meaning fixed'
which is linked to 'Sign nature' 'Implication'.
192

Two case studies
"...Saussure's arguments are partly based on the premises that therelationship between the signifier, that is the word, and the signified, theobject in the real world, are arbitrarily related. There is no reason why, say, adog should be called a dog and not a cat. [The other reason]...is thatlanguage is a public system it is an inherently social phenomenon, that cannotbe discussed in isolation. [Both of] these are therefore some sort of evidencefor structuralism. [Meaning being fixed] is refuted here by Saussure'sargument that there are two signifiers for a single signified and this canchange. This is related to structuralism, but it's not evidence, more of animplication."
Following this, a number of other nodes were created relating to various factors
relevant to the structuralist debate (see Figure 10.8).
"What I've done is started mapping what structuralism is, the sort of thingsthat it replaces, some of the things that Saussure says implies, the sort ofthings that refute those implications; and therefore to an extent, refutestructuralism. It also comes to the sense that one's a sign and one's a publicsystem"
Figure 10.8 shows the network in its almost completed state. It can be seen although
that there is some organisation to the network denoted by the links between nodes,
there are also links left untitled:
"I've left this one [the link between `orgsound' and 'Public system' untitled.Organised sound rorgsound'l is linked in some way to it both being a publicsystem: that meaning is public, and meaning being fixed. Both this and theothers [untitled links] are untitled because I'm not sure how they fit in."
A number of nodes are left unlinked, this was not merely due to carelessness:
"In a sense I'm breaking structuralism up and trying to look at it in terms ofother things such as rhetoric and personal meaning; though I'm not sure whatI'm doing with that yet. There is a completely different paradigm over here[points to the right of the network] which is Marxism / materialism, which hasto be taken into account. I haven't linked them in yet: maybe Marxism can beused to provide a critique of structuralism, or an alternative to it. I have to putit in terms of the enlightenment as well."
Hence the reason for the poorly specified links is due to the subject being unable to
come up with a precise definition of the relationships between concepts, short of
saying that they are relevant. This appears to occur at two levels: at a local level,
being unable to specify relationships between individual pairs of nodes; and at the
level of clusters of nodes, where the subject is trying to fit a paradigm distributed
across more than one node to another paradigm.
193

siqn nature
two signified I
public s stemrhetoric —I
orgsound Untitled
inexclusive ••••• I materialism
Two case studies
K Tool
Isuperstructuralism
evi • ence
meanin g fixed
re u esImplication
chien
[ evidence I
basic saussure
I Untitled I
ht.confr:Ort
[historical context I se•••
yication
Untitled
s'o
marxisrn111 111111111 0
Igoddeath
Figure 10.8 The network constructed using the unconstrained tool almost complete
Overall it appears that the unconstrained tool was used very much for brainstorming:
concepts were created as the subject thought of them, or as they were suggested by
other concepts. Concepts that were linked tended to be done so shortly after they
were created, rather than near the end. Very little text was actually included in the
194

Two case studies
network, apart from the text that was typed in at the very beginning, perhaps
indicating that the subject was dealing with the organisation of ideas rather than
considering the way that it would be translated into text. This seems to be quite
different to the way that subject 1 proceeded.
10.4.3 Use of the constrained tool
As has been mentioned, use of the constrained tool accounted for most of the time of
the interaction as a whole. The use of the constrained tool started off with the
creation of a question, which was: "Does structuralism give us an accurate theory of
language?". It is therefore similar to the main question noted in the unconstrained
tool . Following on from this three evidence nodes were created that were closely
modelled on three of the nodes in the unconstrained tool . Then the subject hit a
problem trying to use the model:
"[Structuralism is]... such a self-contained system. There aren't anyexperiments or anything. There are kind of observations, which kind of pointto things, but is seems that the way that these observations are made certainassumptions which make it difficult to use this [the argumentation model]."
The problem seemed to be that the way information is expresses in the text-books
does not explicitly accord with the argumentation model. As he said shortly after:
"Part of the difficulty is that I'm used to a more open style: you're set aquestion, and although you come up with an answer at the end; most of theessay is more of an exploration into the nature of the question."
It is interesting to note that 'exploring the question' in terms of deciding which
information is relevant and, perhaps more importantly, the role that the information
plays in addressing the question appears to be the most important factor in using the
tool effectively.
The subject then seemed to get the hang of using the model; some claims were
created, and the subject realised that two of the things that were initially called
evidence were in actual fact claims. Once this impasse had been resolved the subject
produced a highly organised representation of the information:
"I was talking to someone last night who was saying that you can't say if awork of art is good or bad, it's all a matter of opinion. I don't see whyliterature should get away with that. This [the tool] makes you look at what'shappening [in the domain] and means that your aesthetic ideas are a lotclearer."
Once the claim had been defined the main part of the network was assembled very
quickly (see Figure 10.9).
195

Question superstructuralism
I Addresses I
Evaluationit] pcnri
Assesses r valuation
use of rhetoric
Assesses IAssessesTop level claims
Evidence no language without societu n no society without language
I Sub-claim
arbitrar natur
Supports
Evidencdoq/chien
Contradicts
AttacksAttacks
lan ua e not
Claimlue internal to --i
Contradicts
Supports
_Evidence_renc words for words
Assumption marxist? in sense
persoinal sense odEvidence
Claim U. orts
Su orts
Claimhenomenolo • ical
1—meamn•fixedClaim
_CO _
si nifieds
I Supports
Claimsocial historical
Two case studies
There are two top-level claims: that meaning is fixed in an institution of discourse,
and that language is phenomenological; these are characterised in the network as
being in direct contradiction to one another. Only one piece of evidence was placed in
support of the phenomenological claim, but it had no contradictory evidence and no
critiques.
Figure 10.9 The constrained tool network almost complete.
The claim 'meaning fixed' on the other hand had one piece of evidence that supported
it directly; one sub-claim, itself supported by evidence; a supportive claim, which in
turn was supported by evidence. On the negative side it had two critiques, one of
which was supported by a claim; and this claim also contradicted one of the claims of
the 'meaning fixed' top-level claim. Referring to this bias in the evaluation of the top-
level claims the subjects had this to say:
196

Two case studies
"I suppose that what I'm doing is to evaluate the structuralist claims, ascharacterised by Saussure, in their own right, rather than to simply look at thedifference between structuralist and other explanations. This is mainlybecause [first] I know more about structuralism, rather than its alternatives;and [second] the way that structuralism is normally evaluated, if it is evaluatedat all, tends to be in its own right whether it is useful; rather than comparing itto other approaches. People then stick to their own approach, whether itsstructuralist, deconstructionalist, Marxist or whatever, and whilst theycriticise the others [approaches] it's not normally so analytical as this thing[the argument model] requires it to be."
Thus it appears that the nature of argument within literary criticism seems to be unlike
the rational model for science2. In science, claims are evaluated by how useful they
are in explaining certain phenomena and how well they allow us to predict new
phenomena; the theory that predicts and explains more is regarded as the most useful.
If this subject is correct, this is difficult in that the different approaches to literary
criticism are less like competing claims and more like competing paradigms. It is
therefore difficult to pit them against each other since they share little common
ground. Each approach makes so many assumptions of its own that even discussing
basic ideas is problematic. This is not to say that trying to do this is fruitless; it
appears that some of the more useful experiences that this subject has was in the
failures:
"I mean I can't connect these two very meaningfully [the structuralist andphenomenological arguments] I've put contradicts, but that's pretty wide ofthe mark. If there's one thing that this [the exercise] has made me do its totake a step back from all of this and to try and be quite precise in the way Iconsider the relationships of the arguments to one another. I mean, lot of thetime I've failed to integrate the ideas: I'm still not exactly sure what therelationships between Marxism and Structuralism are, but I think its good thatit made me realise that."
It therefore seems that one of the more useful properties of using graphical
representations with fixed node and relation types is that having to choose a node or
relation type from a collection of unsuitable alternatives may force the individual to
think more deeply about relationships than if they were allowed to generate imprecise
types themselves, this is something that I shall return to in the conclusions to this
thesis (Chapter 12).
The final stage of this subject's activities involved fine tuning the network. Another
claim was added which acted as a single top level claim; the claim was "Language is
thought" — a basic structuralist tenet; the previous two top-level claims were seen to
2 Note that I am not stating that individual researchers necessarily adhere to this model, but it tendsto be the way that it is presented to the individual in textbooks.
197

Two case studies
support or contradict this position. The two evaluation nodes were deleted to be
replaced by a single one, which addressed the question. An extra critique was
brought in: "Descartes likes this", this compares Saussure's distinction between
signified and signifier to Descartes mind body duality, and criticises the exclusive
dichotomy as being a fundamentally Western predilection. An extra link was added,
the phenomenological perspective was used to support the critique of structuralism
that language is not static:
"I suppose I'm stepping through the network, making sure that all the nodesare linked to all the nodes that they should be linked to. For example, this[the link between 'Phenomenological' and 'language not static', although notexplicitly referred to [in the texts that were used] is certainly the case"
This again shows that, if used properly as here, such representations can allow the
user to go beyond the text, merely by being encouraged to link concepts.
It should be mentioned that at this point, after around 8 hours of use, the subject
started to hit problems with the model:
"...I want to say that there's all this stuff about the subjectivity of language;this relates to the phenomenological idea, but it isn't a claim or evidence ofanything; it's just sort of 'to do' with it— I just can't fit it in."
It was never intended that the model be used to express everything an individual
wanted to. Arguments often require information to be brought to bear which lie
outside any model; this was catered for by the wildcard facility (see Section 10.2)
which allowed user definable nodes and links. The subject used this facility, creating
an "Info." node that allowed contributing information to be linked to the
phenomenological perspective.
At this point the subject considered that the network was about as good as he wanted
and needed:
Subject: 'I suppose that's about finished. There's more that I could say, buta lot of it couldn't be done using this [type of model]. It doesn't doeverything, built as a way of clarifying ideas and making me examine myunderstanding its been useful."
Experimenter: "Are you happy with it then?"
Subject: "I suppose that I'm fairly happy with it. I suppose, if I started[using the constrained tool] again from scratch, then it would look a bitdifferent. I mean, its OK, it means something. But the way that I built itmeant that I was always building upon something I built earlier. And oftenmy ideas had changed slightly."
This comment indicates a very important issue in using such tool and representations
for learning. As was discussed in Chapter 1 learning and understanding is not a
198
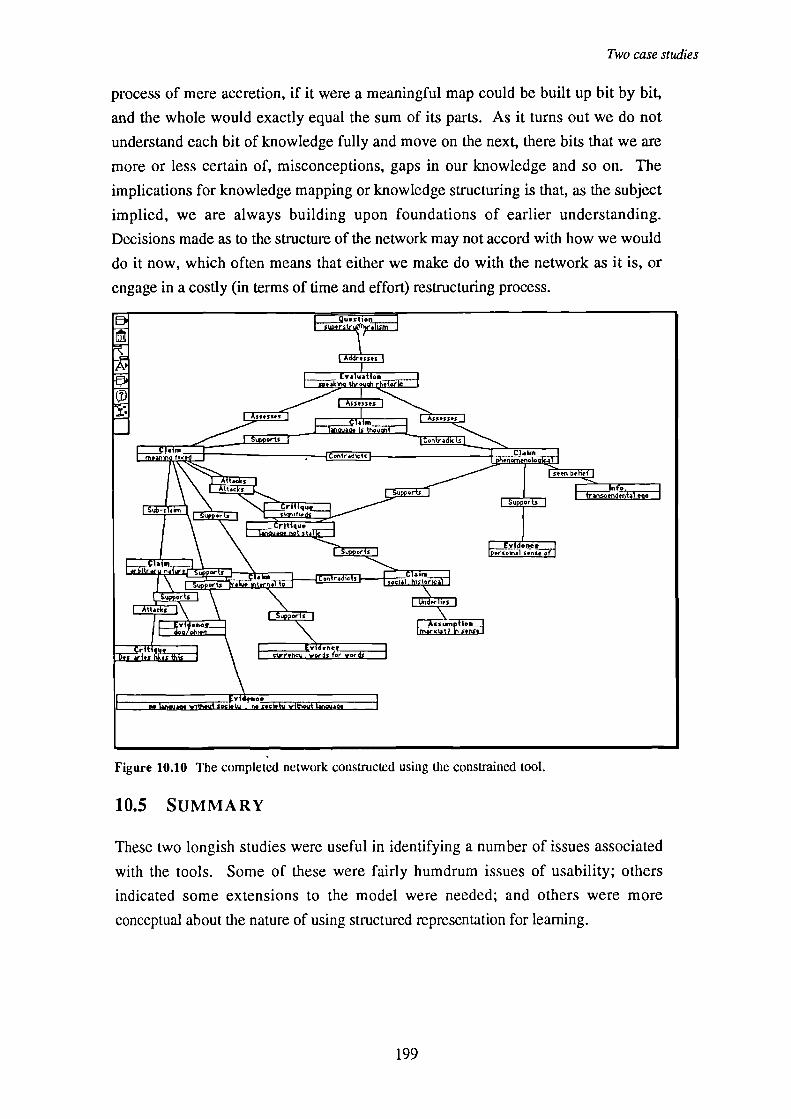
HiTi r htEvaluati
oho
thn
MITIMEM
ME=
ILS=11
&MM.
WelMiEU rittque
UMUZ=1 7o—r
der asI Attar s
SWAMDes ries hkes 11-1FH
I Supports I
wards
MI
Assesses laun W.T=IN
sp arts
I Sup arts
Clainanent.]
Supports I
L__rvidenceIpersconal sense o
PROM
Iahen arrscend tTnid
nfo
arts
Two case studies
process of mere accretion, if it were a meaningful map could be built up bit by bit,
and the whole would exactly equal the sum of its parts. As it turns out we do not
understand each bit of knowledge fully and move on the next, there bits that we are
more or less certain of, misconceptions, gaps in our knowledge and so on. The
implications for knowledge mapping or knowledge structuring is that, as the subject
implied, we are always building upon foundations of earlier understanding.
Decisions made as to the structure of the network may not accord with how we would
do it now, which often means that either we make do with the network as it is, or
engage in a costly (in terms of time and effort) restructuring process.
Figure 10.10 The completed network constructed using the constrained tool.
10.5 SUMMARY
These two longish studies were useful in identifying a number of issues associated
with the tools. Some of these were fairly humdrum issues of usability; others
indicated some extensions to the model were needed; and others were more
conceptual about the nature of using structured representation for learning.
199

Two case studies
10.5.1 Usability issues
The study revealed that there were problems associated with the tool itself. For
instance, there were quite a lot of errors caused by subjects being unaware of what
mode they were in: subjects would often try and move a node whilst in link mode, or
link two nodes whilst in the default mode, resulting in time being wasted. To correct
this, the system was altered so that the mouse pointer changed when it was over a
node, to indicate which mode it was in (a hand icon when a mouse-down could move
the node, and an arrowed-cross when it could create a link and so on, see Section
9.3.1). Perhaps more importantly the lack of explicit directionality in the links often
made reading the maps difficult: for example when one claim supported another it
was not immediately obvious which one supported which, thus arrows were added to
the system to indicate the direction of the relationship.
10.5.2 Problems with the model
A number of problems with the model were indicated by the subjects. Often these
were problems associated with trying to turn everything into an argument; as
indicated in the penultimate comment in Section 10.4.3 other information may often
need to be added. To a large extent this can be addressed by using wildcard nodes.
Of perhaps more relevance to developing usable networks were the paucity of node
types. In this form the model did not distinguish between different types of claim; for
example, there was no notion of a theory or hypothesis in the model. Subject 1, in
particular, found this disconcerting; the text that he was dealing with used the term
theory, and he felt that there should be provision for representing the distinction.
Additionally claims (or theories) are not made in a vacuum, they are attempts to
explain some phenomenon in the world such as language, or class differences in
health; whilst question nodes can be used, as in these studies, to represent
phenomena, it seems more realistic to incorporate phenomena as a the thing that is
explained by the claims. Modifications were therefore made to the model to allow
hypotheses, theories and phenomena to be created.
10.5.3 Conceptual issues: using the tools
Perhaps the most striking difference between the two studies were the differences in
the extent to which the two subjects used the tools. Subject 1 constructed an almost
complete network using the unstructured tool, and translating the basic points to the
constrained tool. Subject 2, on the other hand, used the unconstrained tool to simply
record the basic ideas doing most of his work using the constrained tool. The relative
difference in importance with which subjects considered the two representations can
200

Two case studies
be seen by the way that subject 1 continued to refine his network using the
unconstrained tool as a result of work done using the constrained tool. Subject 2, on
the other hand, once he had started to use the constrained tool, he only returned to the
unconstrained tool to check and copy notes.
Trying to explain why there was this difference is not easy; subjects own
explanations indicated that they were unsure as to why they distributed their time they
way they did. Perhaps it was due to the extent to which they could express their
ideas in terms of concepts and relationships. As I mentioned above, the discussions
revealed that from the outset subject 1 had a fairly good idea what information should
and should not be included in the essay, and also how this information should be
structured. Subject 2, on the other hand, had less of an idea of what the final essay
should include. Thus, subject 1 could go a long way using his own knowledge to
construct a network, whereas subject 2 appeared to hit a point where he could go no
further linking concepts together using the unconstrained tool. This may have
prompted him to start using the constrained tool earlier in the hope that it may provide
him with some ideas as to how to fit the information together. Of course there could
be many other reasons for the difference, but this explanation is consistent with
discussions with the subjects. Subject 1 gave far more detailed descriptions of what
he was going to do from the outset, whereas subject 2's descriptions were more
concerned with the here and now. The relative effectiveness of constrained and
unconstrained tools in supporting the learning process are discussed in the next
chapter since they represent a theoretical dissociation in the development of
knowledge structuring tools.
Another factor that appears relevant to the use of these sorts of tools is the importance
of deciding on the overall approach to be taken before committing oneself to any form
of structure. It was indicated in Study 3 that the sort of macrostructure an individual
chooses can have implications for the ease with which they can fit the information
together at a more local level. The same applies also for the use of the constrained
tool: the sort of claims that are set as being top-level can have implications for the
nature of the rest of the argument. If users commit themselves a particular approach
too early, then they may have to spend time restructuring the network later on when
they realise that the it is not how they would like it. This was observed in both of the
above sessions: subject 1 committing himself to evaluating two top-level claims,
when really there were three; and subject 2 needing to restructure his ideas when he
realised that some of the so-called opposing claims were, in fact, related.
In many ways this problem is unavoidable because avoiding it would requires them
to know how they want the network to look before they start to construct it. In other
201

Two case studies
words they would need to have a very good understanding of the domain before they
used the tool, rendering the tool surplus to requirement. Some of the more negative
effects of premature commitment may be alleviated if the users are encouraged to be
more circumspect about the way that they construct the net. Hints for how to do this
were provided in the next study.
Finally, it should be mentioned that both subjects were enthusiastic about their time
spent using the tool. They were not paid to take part in the exercise, and were using
time that they could, perhaps, have used in more traditional essay preparation; so their
comments may count for something. Of course, there is always the problem that
using a novel tool may make subjects perceptions of what they actually derived from
the experience seem somewhat overly positive, but given that there was some real
objective at the end of it—the essay—I assume their judgements to be fairly sound.
Perhaps the overriding comment was that the constrained tool seemed to provide
something to react against as much as something to support structuring of ideas, that
it made them question their tmderstanding more than they may do otherwise. Future
research needs to deal with whether using such representation encourages reflection
when compared to other learning activities, such as: note-taking, essay writing and so
on. However, given that these comments were made when describing what they had
just done, they can perhaps be given more credence than if there were stated at the
end of the experiment.
Generally there are a number of processes that were seen to occur for both subjects
during the course of these interactions.
10.6 FACTORS AFFECTING THE STRUCTURE OF KNOWLEDGEMAPS
The construction of a map requires subjects to translate both mental and textual
representations into a graphical form. There are a number of factors that seem to
influence the way that knowledge maps look; in this study there were at least six
factors that affected the structure of the maps constructed.
10.6.1 Framing effects
This study revealed that the way in which the problem was framed had implications
for the way that the subjects pursued a solution, and hence constructed the network.
Framing effects are well known in the problem solving literature, and relate to the
way in which the superficial structure of two isomorphic problems can effect the
extent to which they are solved (Wason & Shapiro, 1971Kotovsky, Hayes & Simon,
202

Two case studies
1985). I have already discussed that Subject 1 framed the problem as two competing
claims, rather than three competing claims; and that Subject 2 revised his network
after realising the relationship of structuralism to Marxism. Subject 2's comments
about 'exploring the question' are also indicative of the importance of framing effects.
10.6.2 Viscosity
Green's dimension of viscosity appears a number of times in subjects' comments.
Subject 2's last reported comment that he was building upon what something that he
built earlier relates, in part, to viscosity; he later stated that if he had started again then
the structure would be different. One must ask, however, how fluid a tool needs to
be to permit this. The utility of fluidity can be interpreted as a cost! benefit trade off:
the benefits that can be gained from restructuring in terms of producing a more
satisfactory network that permits further 'building' are offset by the costs of devoting
time and effort—both cognitive and physical—of restructuring the net. The more
fluid the tool, the lower the effort, leading to lower cost and hence, more benefit.
However, restructuring of the type indicated by Subject 2 is likely to involve rather
more than simply renaming and rearranging a few nodes, and perhaps moving some
text (see next chapter).
10.6.3 Premature commitment to structure
Related to viscosity is premature commitment, which I also discuss at length in the
next chapter. It could be argued that many of the problems mentioned in the
discussion of viscosity are due to subjects committing themselves to structure
prematurely. I would argue against this view; from the subjects' comments it was the
fact that they had to commit themselves to a structure that made them realise that the
structure was inadequate. Again, I am not arguing that we should force learners to
commit themselves to a structure at the outset—subjects in this study were not
required to do this—rather I am arguing that like viscosity premature commitment
may be seen as a greater evil than it really is in the context of learning (but see
Sommerville & Twidale for another view). A possible alternative is that learners
never commit themselves to a structure.
10.6.4 Unconsidered relations
Similar to Green's notion of hidden dependencies is that of unconsidered relations.
The difference is that whilst Green's principle relates to the extent to which a system
makes relationships among objects and operations transparent. Unconsidered
relations refers to the user not seeing, or not being aware of the implications of one
part of the argument to another. For example in subject 2's final map, there is quite a
203

Two case studies
lot of evidence (both direct and indirect) used to assess the claim that meaning is
fixed, but there seems to have been little attempt to show how the evidence that
supports and contradicts this position related to the alternative 'phenomenological'
claim. Likewise the single piece of evidence used to support the phenomenological
position is not linked in to the claim that meaning is fixed. Of course this could be
due to the fact that the subject thought about this and failed (not too likely given the
fact that he did not mention this when asked about the network), or it could be that
evidence relating to one claim has nothing to say about the other (which seems rather
implausible). Unconsidered relations can be seen as being related to problem
framing: the subject has a particular conception of the goals of the task, which
prevents them from visualising other interpretations. They might ask themselves
"how does X relate to Y?" but not "How does X relate to Z?". This problem is
discussed further is Chapter 12 when I suggest improvements to knowledge
structuring.
10.6.5 Domain knowledge
The domain knowledge that the user has is going to a large determiner of the final
network; not just the atoms of knowledge the individual posses, but the way that it is
structured and organised. Certain aspects of network construction seemed facile for
the subjects in this study: some of the evidence for particular claims, for example,
seemed to be reeled off as if it was stored in this manner. At other times subjects
were made aware of gaps in their knowledge by the activity of constructing the
network. Subject 2's comment about the relationship of Marxism to structuralism
indicated that here was an integration that he had no a priori knowledge about. It
was only by mobilising knowledge about Marxism and about structuralism that
enabled him to approximate an integration. The task therefore can be seen as a
method of prompting learners to delve deeper into their knowledge, perhaps drawing
connections that they Might otherwise not consider.
10.6.6 Reasoning and argument skills
The constrained tool requires subjects to structure arguments, in order to do this
effectively users must have knowledge and skills relating to effective argumentation.
The constrained tool helps here by providing a number of pre-defined categories that
subjects may use, and by permitting certain relationships between particular node
types; but it still requires the subject to identify elements of the argument in the text
(such as the claims, assumptions and so on) and map these onto the developing
representation. Recent psychological studies have highlighted the importance of
domain content knowledge to reasoning and argument tasks (Carey, 1985;Wason and
204

Two case studies
Shapiro, 1971) but equally it is the case that merely having knowledge about content
does not presuppose that the individual can reason or construct an argument about it
(Kuhn, 1991). Of course in this task much of the work was already done. Subjects
could merely follow the line of the text sources that they used, translating textual
versions of, for example, "The claim X is supported by evidence Y" into a graphical
version. Similarly much of psychology can be learned without the necessary critical
thinking skills that enable the student to truly explore and discuss the area (see the
Greeno quotation in Section 1.2 for an example); rather information can be learned
almost by wrote with little understanding of the deeper and wider implications of the
argument. Notwithstanding this, there were occasions in this study where learners
seemed to hit impasses; where the text seemed to give them no clue as to where to go
next (for example, the Marxism / structuralism problem referred to in the previous
section); so it does appear that reasoning skills may have some role to play.
10.7 SUMMARY
This points above do seem to play a role in shaping the map that the subjects
produced. Perhaps the most important factors from a design point of view are the
effects of premature commitment and viscosity because they are the factors that we
have most control over. The next study is an attempt to investigate these issues in
more detail.
205

II
A comparison of structuredand unstructured tools
11.1 INTRODUCTION
This chapter is an attempt to investigate the relative costs and benefits of using a
constrained tool when compared to an unconstrained tool for supporting learning. The
potential benefits centre around the possibility that the constrained tool tends to direct the
learners' thinking towards specific sorts of relationships, in this case argument, thus
providing a supportive framework for exploration. There are, however, a number of
potential costs: first, the problem of shoe-horning may arise, this is where the learner
attempts to force ideas into a representation that is inappropriate; second there is the
problem that the commitment to structure that this requires interferes with the learner's
attempt to understand the information; and third, there is the less severe but still
significant potential problem that learners may be forced to structure their ideas before
they are ready to do so—the problem of premature commitment The problem of shoe-
horning is self explanatory, and I shall go on to discuss the implications of this after the
study; however the harmful effects of formality and premature commitment need further
elaboration.
11.1.1 Formalisation and premature commitment revisited
Recently Shipman and Marshall (1993) aired a cautionary note about the dangers of
requiring users to formalise their ideas. They see the requirement to formalise as being a
result of the increasing use of computers in the workplace; in order to support a task a
computer needs a formal representation, and humans, they argue, do not work like this.
To support this claim they assemble evidence from a number of studies which include:
(1) Their own experiences using formal versions of the NoteCards environment;
(2) Naturalistic studies on office filing behaviour which show that people often postpone
filing to the last possible moment;
206

A comparison of structured and unstructured tools
(3) Instances from applications, such as gIBIS and the Co-ordinator, that have failed due
to users' rejection of the formal aspects of the system.
Shipman and Marshall give three reasons for the occurrence of these problems. The first
relates to the hoary old problem of changing conceptual structure, which I have already
covered in the section on premature commitment (Chapter 7). Second, that the process of
formalisation, rather than the formal language per se forces people to do things that
interfere with the standard working practice. Third, some knowledge is tacit and
therefore is difficult to formalise and attempts to do this might result in reconstructions
rather than a true reflection of the actual knowledge used. Shipman and Marshall
conclude by stating that people might be justified in avoiding the formalisation of
knowledge as often the costs outweigh the benefits.
There are therefore two issues relating to premature commitment: that it may give rise to
inefficient organisation, and that people tend to avoid doing it. Arguing that premature
commitment is a good thing is like arguing that too much exercise is a good thing: saying
that something is premature automatically denotes it as potentially harmful. I therefore
take no issue with premature commitment, but I would like to question the notion that
early commitment is a global malady that would afflict all tasks and tools to an equal
extent. Much of the research suggesting the problematic nature of early commitment is
bad comes from studies where the user is well practised in the particular domain (Shum,
1991; Monty, 1990; Marshall & Rogers, 1992; Shipman & Marshall, 1993). Does the
same apply to knowledge structuring for learning?
11.1.2 Is learning different?
Is there a difference between the principle of premature commitment as applied to
knowledge structuring for design and authoring as compared to learning? Some seem to
suggest that there is not. Twidale, Rodden and Sommerville (1994) report on the
development and evaluation of Designers' Notepad (DNP) which is a computer-based
tool that was originally developed to support the initial stages of the software design
process, but has also been used as a general purpose knowledge mapping toot for
supporting learning. Recognising the problems of premature commitment, they have
designed DNP as a system that attempts to avoid the pitfalls of premature commitment in
three ways: first, by placing no constraints as to the way in which the learner creates
concepts, whether these are linked or whether names or types are assigned to the
concepts. Second, by allowing the use of user-defined symbols such as the colour,
shape and type-names of the concepts and links. Third, by making the tool fluid by
permitting changes to the structure as it develops. Shapes, types, colours and the
structure of the network can all be changed quickly and easily. DNP therefore accords
quite closely to the prescriptions of the early-commitment-is-bad school. But is this
207

A comparison of structured and unstructured tools
necessarily appropriate, and is the avoidance of early commitment at all costs a good
thing?
First there tends to be a different value placed on making mistakes. In design or
authoring a bad product produced as a result of premature commitment is always viewed
as a cost; in education, on the other hand, this is not always the case. Often errors can
have a great deal of educational significance in that they may highlight underlying
misconceptions. A caveat of this is that the student makes the mistake in a sufficiently
explicit fashion so that they can reflect upon it, or an instructor can provide informative
feedback. Getting it wrong is an important aspect of learning, indeed impasse-driven and
constructivist accounts of learning place errors as being an important learning mechanism
(see Chapter 1).
Second, there are differences in the knowledge that the different users possess.
Designers and authors are professionals and will therefore not only have a great deal of
knowledge not only about the domain, but will also have their own (often personal)
working practices. The 'whole point of being a student is that they do not have this
breadth and depth of knowledge and methods. The point here is that whilst a
professional might find certain types of commitment bad, the same may not necessarily
apply to the learner who might welcome the support offered by a system that does not
require them to specify structure as well as content.
Third, the fact that a learner tends to do something in a particular way is no guarantee that
it is the best way to do it; of course the same applies to professionals but the case is
weaker, and they are likely to be more resistant to change. In Green's Word Processor
example (see Section 7.3.1) there is a no relationship between the task (writing a
document) and the nature of the commitment (specifying the number of words)—simply
the action of committing oneself does not help one to do the task any better. Imagine,
however, that a novice writer had to pre-specify the maximum length of each sentence
used in the document, such that the system gave an error message each time the sentence
exceeded the given length. Suppose that the system recommended that a sentence should
not exceed 30 words to be readable. The individual might find using the system a
frustrating experience, it may take twice as long to complete the document, but it is likely
that they will learn something about their writing; it may even force them to use shorter
sentences in future documents not using this Machiavelian system. Of course a word
processor such as this is unlikely to be the best or even a good way of teaching about
writing, but this is likely to be due to the quality and the way it delivers the feedback
rather than being due to premature commitment alone. The notion of meaningful feedback
also applies to design tools, as it is argued that one of the benefits of design rationale
208

A comparison of structured and unstructured tools
notations is that it explicates knowledge by encouraging users to be more formal about
specifying the relationships between decisions and options.
Fourth there are differences in the time scale that the benefits of knowledge structuring
are supposed to act. In design and authoring the tools have to support their particular
activities over a long period of time: days, weeks or even months, and they have to do
this with little or no external intervention. Knowledge structuring tasks for learning tend
to be used over a shorter time, around the time that it takes to write a good essay. A map
that takes several months to complete is likely to be an arduous, time consuming and
therefore costly task, whereas a the effort involved in doing this to a smaller map will be
rather more modest
We can now can attempt to define the cost of early commitment to structure. When the
task is poorly defined in terms of all participants, when the structuring activity takes a
long time, when there is little meaningful feedback offered by committing oneself and
where the notation conflicts with standard working practice there is likely to be a high
cost associated with early -commitment. When there is some form of agreed upon good
answer, when the time-scale is short, when meaningful feedback may be offered, when
there is little interference between working practice and the notation then there is likely to
be a low cost associated with early commitment
11.1.2.1 No premature commitment, no commitment
Finally I should mention one of the potential drawbacks of avoiding early commitment.
One of the findings of Study 2 was that many of the maps contained unlinked concept
nodes and nameless links. By avoiding early commitment there is a very real danger that
one throws the baby out with the bath-water: the benefit of knowledge mapping is that
learners are encouraged to reflect upon structural relationships. If they are not
encouraged to do this then they might not do it at all. As I have argued in Chapter 1, part
of learning about a domain is to learn not just the content material, but also how
practitioners deal with the information that is being learned about Merely asking learners
to map out what they feel is important or relevant may be of some use, but perhaps it is
also good to give them some agreed upon methods of representing this information.
Second, how communicable are maps where learners assign their own symbols to
concepts? How can these maps support peer or expert evaluation?
So far I have made the argument look like we either have a system that forces early
commitment, or one that does not. This is not strictly the case as another of Green's
dimensions, that of fluidity, can provide some escape from the ills of early commitment.
209

A comparison of structured and unstructured tools
11.1.2.2 Fluidity: escape from the problems of early commitment?
If one finds, as Marshall & Rogers did, that some representation has become a blind alley
due to early commitment to structure what can you do? If the tool is fluid rather than
viscous, the argument runs, you can restructure the network so that it accords more
closely to your understanding. A tool can be fluid in a number of ways, of which I shall
only mention three. First, the system can be fast. McAleese (1989) criticized early
versions of NoteCards for being "notoriously slow" in updating the network. If it takes
even a few seconds to perform an action then it is less likely that the user will perform it
than if it takes a fraction of a second. Second, the interface should permit wholesale
restructuring: multiple elements should be able to be modified or deleted at the same time;
links can be changed and deleted; types changed and so on. Third, other interface
considerations involve the ability to copy portions to the network as provided by AAA
(see section 7.5.2) and so on. Although Green agues that we should consider these
dimensions as orthogonal, it seems that premature (or early) commitment and viscosity
are in fact closely related, and impact on one another l . Given two systems, one viscous
and one fluid which are otherwise identical, it seems fair to predict that an experienced
user would tend to avoid commitment more on the viscous system because there is a
greater cost associated with making changes to the representation.
Fluidity is however often non-trivial to implement as it brings yet another of Green's
dimensions into play; that of hidden dependencies. Once you permit users to restructure
part of a network, it has an impact on other parts of the network. Assume, for example,
that one of the restrictions in the tool is that evidence can say nothing about other
evidence, as is the case for the constrained tool used in this and the previous study.
Assume that the learner has linked an evidence node in support of a claim. Now suppose
that the learner realises that they have mis-categorised the information; what was has been
called a claim is now in fact evidence. When the type of the offending node is changed
from claim to evidence it must necessarily delete the link in order for it not to violate the
linking rule. Because the rules are in effect hidden, the learner may not necessarily
realise that this would happen. This is a very simple case, one could easily imagine more
complex cases. Dependencies between concepts could result in a large portion of the
network being restructured as a result of a single superficially benign action.
Hence the problem with fluidity is that any structure, be it text or a knowledge map, is
not modular; you cannot simply plug bits in and out to change the meaning, or more
accurately, you do change the meaning but not necessarily in the way that you want. For
I Green himself recognises that the dimensions are non-orthogonal, but states that for the purposes ofguidance we should 'pretend' that they are unrelated.
210

A comparison of structured and unstructured tools
example the two networks produced on KNOT (see Section 3.5.3) are dissimilar in
almost every respect and one cannot be derived from the other simply by moving a few
nodes around, it requires a global restructuring. A standard fluid tool such as Microsoft
Word permits restructuring of text in a large number of ways: cutting and pasting
sentences; dragging and dropping words and phrases; rearranging whole sections via the
outline facility and so on. Subjectively we may have the experience of trying to rearrange
a document that would have been better if we had started again from scratch rather than
tinkering with the pre-existing structure. An additional problem with the notion of
fluidity is that it is not a fixed quantity, rather it decreases with the number of entities that
need to be changed. No matter how fluid a system is, if a large portion of it needs to be
changed, the effort, and therefore the cost, is going to be quite large.
All of this is not to say that fluidity is a worthless concept, it is of course an essential
feature of any tool, however, it is not always the answer to poorly structured maps.
Often it is better to throw out the old map and start again.
11.1.3 Summary
The following study is an attempt to investigate some of these issues. Subjects used two
tools, one constrained and one unconstrained. In addition the constrained tool required
some degree of early commitment (pre-selection of node and link types), and was
relatively viscous in that modification was reasonably effortful (link types could not be
changed once created). Subjects were required to use the tools to structure information
presented to them in a research paper. Some of the factors under discussion were:
• Which condition produced maps that were the most focused?
• Which condition produced the more communicable maps?
• Were there any obvious manifestations of premature commitment in the constrained
tool, and if so did these seem to outweigh any positive effects (such as points 1 & 2).
11.2 METHOD
11.2.1 The task
The task in this study required subjects to learn information relating to anorexia and
bulimia nervosa. The topic was chosen primarily because it is involves much debate and
argument, without it being too technical for the average post-graduate student to
understand. The materials used consisted of a paper by StOylen and Laberg (1990)
which was judged by a lecturer in psychopathology to be a reasonable introduction to the
211

A comparison of structured and unstructured tools
area. Subjects used either a constrained or unconstrained tool depending on the condition
that they were in.
The constrained and unconstrained tools were roughly similar to those used in the
Chapter 10, for the purposes of clarity I shall briefly state some of the principal
differences between them.
The unconstrained tool allowed learners to create nodes which initially had no type
assigned to them (indicated, as for the case studies, by four bullet points, `••••'),
although types could be assigned later on if the subject wished to do so. On creating a
type the system presented subjects with a dialog box containing all seven types available
for the constrained tool (see below), however, the unconstrained tool also allowed them
to specify their own types if they wanted to, which were stored for later use. Node types
could be changed at any point in the interaction. When two nodes were linked the
subjects were asked to select a type and were given all of the types available in the
constrained tool (supports, contradicts, underlies and so on, see Chapter 9), but again
they could choose either - to leave the node untitled or create their own type as for nodes.
Finally, and again similar to nodes, the types of links could be changed at any time
during the course of the experiment.
The constrained tool provided subjects with a list of node-primitives that they could use
to help them in their task, these were: claim, theory, hypothesis, question, phenomenon,
evidence, critique, and assumption. Learners have to select a node type before the node
is created. The name of a node can be changed at any point in the interaction, however
the type of a node could only be changed if the node was not linked to any other nodes.
Changing a node-type once the node was linked required subjects to delete the links first
A similar set of constraints applied to link-types, except not only were there a limited set
of types but these varied depending on types of node was being linked (see Chapter 9).
As for nodes, the type of a link had to be specified before the link was created, and could
only be changed by deleting the link and creating a new one. Finally subjects in this
condition were provided with a special node option known as wildcard that allowed them
to specify their own type if they wished to. Wildcard nodes behaved like nodes in the
unconstrained tool, in the sense that they could be linked to anything with any
relationship that the subject felt was appropriate, and the types of node and relations
could be changed at any point
The two tools therefore differed not just in the constraint, but also in the extent to which
each required some form of early commitment, and in viscosity, or resistance to change.
Both of these factors are not central to the claimed benefits of the tool, but rather they
represent a fairly simple way of implementing commitment to some structure (early
commitment), and of preventing the structural rules from being violated (viscosity).
212

A comparison of structured and unstructured tools
Both tools were run on a Macintosh IIcx computer fitted with a two-page monitor. A
screen-recording program was used to record the on-screen interaction.
11.2.2 Design
The study was a simple two-condition between subjects design, the independent variable
was the type of tool used: structured or unstructured. There were two main dependent
variables: the quality of the maps that were produced and the quality of summaries written
at the end of the experiment.
11.2.3 Procedure
Like studies 1, 2 and 5, study 6 had two sessions: a practice session, where subjects
familiarised themselves with the system; and the experimental session where they used
the tool to construct a map of some information that they were provided with.
Subjects were provided with a tutorial booklet that explained what the tool was and what
it could be used for; it 'also introduced them to the various operations that they could
perform using the tool that they were given (see Appendix 3). Students went through the
tutorial at their own pace, and were free to ask questions at any point. There were two
tutorials, one for each condition.
Once the tutorial was complete, and subjects were happy that they could operate the
system they were told that they would be required to learn some material relating to
anorexia and bulimia nervosa, using the tool to help them. They were told that in order to
establish how much they already knew about the topic that they were to write down as
much as they could relating to the two diseases; they were allowed a maximum of fifteen
minutes to do this. When this was complete they were given an instruction sheet which
outlined their task. The instructions are show in Table 11.1.
The paper that you have been given contains information that relates to anorexia and bulimia nervosa.Read through the paper making use of the tool to construct a map of the information. Pay particularattention to:
The nature of the diseases,
• Proposed theories for why they arise,
Evidence supporting or refuting these theories.
You have a maximum of 2 hours to complete the task, but you can finish before this if you wish. Whenyou have finished I will ask you to write a short summary of the information in this paper, this will becompleted WITHOUT NOTES.
Table 11.1 Instructions given to all subjects.
To help subjects to understand what was required of them they were shown an example
of a network based on theories of schizophrenia. The experimenter discussed this with
them briefly.
213

A comparison of structured and unstructured tools
Subjects were also given a list of hints (see Table 11.2 below) to help them in
constructing the network.
If there were no questions then the study began. Subjects were given a maximum of two
hours to complete the task, although they were told that they could finish before this if
they felt they had covered enough.
Throughout the course of the experiment subjects were asked to describe what they were
doing during 'natural breaks' in the session, when the subject appeared to have
something interesting on the screen. Discussions during the construction of the a map
can be insightful, but care was taken for them not to intrude too much on the subject's
task.
• Start by identifying and specifying the question that you are interested in answering, make it your goalto answer this, use sub-questions if necessary.
• Identify the key claims of the argument(s).
• Identify the evidence that relates to these claims.
• Don't be in a rush to link nodes together, often it's better to wait a while until you're more sure ofwhat should be linked to what.
• Reflect upon what you are doing regularly. Asking yourself questions relating to the identity of certaincomponents of the argument, for example: "Is this a claim or a critique?", "Is there any evidence tosupport this claim?" can often be of great benefit.
• Try and use as little text as possible, when typing check whether some of the information in the textmight not be better represented as part of the network.
• Check the validity of the relationships that you have created; you may find that you will need to changethem, or restructure the network as you progress.
• Try and provide a summary of your conclusions in the question box.
Table 11.2 Hint sheet given to all subjects
After a maximum of two hours, subjects were requested to stop using the tool (they were
given five minute warnings from 15 minutes if necessary). They were then quizzed
about the map that they had constructed. Following this the network was hidden and
subjects presented with the second set of instructions, which were practically the same as
the first set (see Table 11.3)
Write a summary of the information contained in the paper with particular reference to:
The nature of the diseases,
Proposed theories for why they arise,
. Evidence supporting or refuting these theories.
Try and get across the main points rather than the details, and pay attention to the structure of the, summary; try and make it as clear as possible. Write no more than a page.
Table 11.3 Instructions for writing summaries
When subjects had finished writing the summary the experiment was at an end.
214

A comparison of structured and unstructured tools
11.2.4 Subjects
Subjects were post-graduate students from the University of York. 12 subjects took part
in the study, (seven male, five female); the unconstrained condition having four male and
two female subjects; the constrained condition three male and three female.
11.2.5 Potential outcomes
There are four possible outcomes relating to the quality of the maps:
(1) Subjects using the unconstrained tool produce better maps due to the fact that they are
able to express what they want, and formalise when they feel it necessary.
(2) Subjects using the constrained map produce better maps due to the fact that they are
given the means to represent goal-relevant information.
(3) There is no difference between the maps because subjects using the unconstrained
tool used similar primitives and relations to those using the unconstrained tool.
(4) There is no difference between the maps because subjects using the constrained tool
avoided using the node primitives.
These last two potential outcomes are possible because the unconstrained tool can be
treated as a semi-constrained tool by using the node and link types built into the system.
On the other hand the constrained tool can be treated as an unconstrained tool by using
the WildCard option.
In order to define what I mean by 'better map' I make the following assumptions:
(1) Relevance assumption: a good map is one that contains a large number of proposition
that are relevant to the goals of the task.
(2) Correctness assumption: a good map is one in which the propositions that it includes
are correct in relation to the information in the texi
(3) Communicability assumption: a good map is one that communicates ideas effectively
to others, irrespective of whether the propositions are relevant to the goal of not, or
are correct or not.
For the purposes of this study the relevance and correctness assumptions were coalesced
to produce the completeness assumption. The quality of the maps was measured using a
combination of objective ratings (using a propositional analysis) and subjective ratings
using independent raters. Details of these are reported in the results section.
215

A comparison of structured and unstructured tools
Of less importance was the quality of the summaries that students wrote at the end of the
study. One possible outcome would be that the constrained tool by focusing subjects'
attention onto the argumentative relationships might result in subjects showing a better
understanding of the arguments in the text. In order to explore this a similar
propositional analysis to the one used for analysing the maps was used.
11.3 RESULTS
The use of knowledge structuring tools for learning is a relatively new area of study, as
should be clear from the previous chapters there is as yet no theory that can be used to
guide analysis. Any data generated by this study, therefore, may say something about
the use of these tools and have potentially important implications for the development of
such a theory. In addition to the possibilities posed at the end of the last section, it
seemed profitable to investigate as much of the data as possible to see what the
implications are for knowledge structuring. The results section is therefore divided into
three sections: first, some initial observations of between-condition differences in the
maps are noted; second, the maps and summaries are analysed to investigate the
differences more systematically by looking at the propositions that they contained; and
third, the process by which the maps were created is analysed.
11.3.1 Initial comparisons
In this comparison I look at the maps in very simple terms. The aim is simple: what
differences between the conditions were there in the number and type of nodes, links and
propositions that subjects created?
11.3.1.1 Number of nodes
One of the most obvious differences observed between the two conditions was that
subjects using the constrained tool created more nodes than did those in the unconstrained
tool (see Table 11.4), a difference that was statistically significant using a one-way
ANOVA (F [1,10] = 5.45, p< 0.05).
Condition N Mean number of nodes SDConstrainedUnconstrained
66
2516
5.17.3
Table 11.4 Comparison of number of nodes per condition
What might this difference mean? One potential explanation may be that subjects using
the unconstrained tool used text as a means for recording information in preference to
using nodes and links. In order to test this the amount of text used across the two
conditions was compared to see if subjects in the unconstrained condition made more
notes. When this was done it was found that although in general subjects using the
216

A comparison of structured and unstructured tools
constrained tool did make more notes (see Table 11.5), this difference was not significant
(F [1,10] — 0.86, p-0.37).
Condition N Mean number of words SDConstrainedInconmrained
66
274366
120214
Table 11.5 Comparison of number of words per condition
This gross measure may be confounded since subjects in the constrained condition
created more nodes. A measure of number of words per node was used to see in there
was an across condition difference here. Again it was found that although subjects in the
unconstrained condition used more text per-node (see Table 11.6) this was not
significantly different (F [1,10] = 3.025, p = 0.11). This lack of significance is due to
the large between subject variance, particularly in the unconstrained condition.
Condition N Mean number of wordsper node
SD
Constrained 6 11.5 7.5Unconstrained 6 23.8 15.6Table 11.6 Mean number of words per node
A final test on the relationship between number of words and number of nodes at the
number of words looked at the relationship between the number of nodes created and the
amount of text produced, with the conjecture that this relationship may be inverse.
Subjects using nodes to express themselves may find less need for making notes and vice
versa. A Spearman Rank-Order correlation was performed looking at the relationship
between number of nodes and number of words; this again showed no relationship (r =
0.004).
The lack of any significant results relating to the number of words may be due to the
small sample size: any real difference between conditions is being masked by the
individual variation in note-taking. Subjects can make notes in a number of ways, using
more or less text to express the ideas that they have. In order to test for this the notes
were evaluated to see if they differed in the number of propositions that they expressed.
This is likely to be a more valid measurement of the relationship between the amount of
information in the map and information in the text than simply the number of words since
it frees the information from the vagaries of individual style. A proposition is a single
statement such as 'depression causes bulimia' and using the scheme the number of
propositions used could be enumerated. The results of this exercise are shown in Table
11.7 below (see Section 11.3.2 for more on propositional analysis).
Condition N Mean number ofpropositions
SD
Constrained 6 38.5 6.9Unconstrained 6 38.1 10.1Table 11.7 Number of propositions in the text per condition.
217

A comparison of structured and unstructured tools
The table indicates that there is little difference between the two conditions in the number
of propositions that subjects expressed in textual form, an ANOVA shows the same non-
significant result (F [1,10] = 0.001, p = 0.98).
11.3.1.2 Node types
As stated in the Design section the two tools were not really all that different in terms of
what one could represent. The constrained tool could be treated as unconstrained if
wildcard nodes were used, whereas if the unconstrained subjects stuck with the node and
link type that were given rather than creating their own they could approximate the use of
the constrained tool. This section looks at the number of system given primitives that
subjects used, when compared to self-generated primitives.
Condition User defined Provided Type-less Total(wild)
Constrained 7 143 0 149Unconstrained 56 28 15 99Table 11.8 Total number of system and user defined node types per condition.
It can be seen from Table 11.8 that the vast majority of node-types in the constrained
condition were given by the system, whereas most of the nodes in the unconstrained
condition were self-generated. There are also a fairly high number of type-less nodes in
the unconstrained condition (15% of the total) something in common with the study in
Chapter 10. The absence of any type-less nodes in the constrained condition is not too
surprising given the system's insistence for the specification of node-types up front; only
wildcard nodes can be left untyped, and, as Table 121.8 shows, there were only seven of
these created out of 149.
11.3.1.3 Link types
Looking at the link types reveal a similar story (see Table 11.9 below), with subjects in
the constrained condition using predominantly given link types (again not surprising
since only wildcard nodes could be linked using subject-generated types) whilst subjects
in the unconstrained condition tending to ignore the link types provided and define their
own.
Condition User defined Provided Typeless TotalConstrainedUnconstrained
587
12219
00
127106
Table 11.9 Link types for both conditions
If the source of the node types (user defined or provided) is treated as a within subjects
variable with three levels then the interaction between this and condition is significant
using a one within, one between ANOVA F [1,10] = 52.93, p< 0.0001.
218

A comparison of structured and unstructured tools
A couple of interesting comparisons can be made with the data for the node-types. First,
although one subject in the unconstrained condition, Subject U3, used given node-types
almost exclusively, he tended to use self-defined link types. Second, two subjects, C4
and C5, used a handful of self-typed wildcard nodes, they tended to link these by using
the given argumentative relationships. This indicates that when subjects in the two
conditions are using these facilities in different ways: constrained subjects use wildcard
nodes to represent parts of the argument that they cannot do using the pm-defined nodes;
whilst subjects in the unconstrained conditions even when they use argumentative node-
types, tend to use these for non-argumentative purposes. This observation is expanded
in the next few paragraphs.
The next analysis attempted to look at the nature of the propositions that were expressed;
a proposition corresponding to a node-link-node triplet (see Section 11.3.2). Three
categories were used: argumentative, structural and causal. Argumentative propositions
are things such as Evidence(X) supports Claim (Y), and generally say something about
the evaluation of the models in the text. Structural propositions relate to the organisation
of concepts in the domain, they may be hierarchical such as, Anorexia is_a Eating
disorder, or non-hierarchical such as Bulimia relates_to Anorexia. Structural
relationships also occur between argument nodes such as: Claim (X) underlies Claim (Y).
Finally causal propositions make statements about the cause and effect relationships
among concepts such as, Bingeing leads_to vomiting. Table 11.10 (below) shows the
number of these categories of relationship.
Condition Argumentative Structural Causal TotalConstrainedUnconstrained
11727
1033
141
128101
Table 11.10 Categories for link types
It can be seen from the table that the majority of propositions in the constrained condition
are argumentative in nature, with only one causal relationship. The constrained
condition, on the other hand, shows a more equal distribution of the three types,
interestingly the two conditions show opposite emphasis of these three types: the
unconstrained condition showing most causal relationships, and fewest argumentative
relationships, whereas the constrained condition is the converse. A Mann-Whitney test
revealed significant differences between the conditions for argumentative relationships (U
= 1, p<0.01) and causal relationships (U = 3.5, p<0.05, with hierarchical relationships
narrowly missing significance (U = 6.5, p = 0.06).
It is probably unsurprising that subjects in the constrained condition tended to incorporate
argumentative relationships at the expense of hierarchical and causal links; very few of
the pre-defined links were of the latter two types and subjects wanting to incorporate
them would have to use wildcard nodes. Of more interest is the general paucity of
219

A comparison of structured and unstructured tools
argumentative relationships created in the unconstrained condition. In many ways this is
not so surprising; the text contained a great deal of causal propositions (bingeing leads_to
vomiting, anxiety causes bulimia and so on) it seems that subjects in the constrained
condition were merely being led along by what the text told them.
11.3.1.4 Summary
In trying to determine why subjects using the constrained tool created more nodes, Iadvanced the hypothesis that it may be due to them preferring to express graphically what
they did not express textually. The results of various analyses are rather mixed. It does
not seem to be the case that subjects in represent information graphically instead of
textually, but rather that they use text in addition to any graphical representation.
One feature of potential interest is that, subjects using the unconstrained tool show higher
standard deviations for the amount of text, the number of nodes and the number of
propositions created during the study. It could be that the constrained tool somehow
level individual differences, even for things such as number of nodes which superficially
has little to do with how constrained the tool is.
11.3.2 Scoring the maps
The assumptions in the Design section state that a good map should be a faithful
representation of the information contained in the text, given the goals of the task and that
they should also be as explicit as possible for the purposes of communication. In order
to try and get some objective measure of the completeness and goal relevance of the
maps, the text was broken down into its relevant propositions, and the map was marked
using these.
The text refers to eight models of the aetiology and maintenance of bulimia and anorexia
nervosa. Of these four are discussed in some depth, these are: the socio-cultural model;
the cognitive-behavioural model; the anxiety model; and the affective disorder model.
Each of these models is discussed with respect to how good and useful it is. This
information falls into three categories: evidence from studies on suffers of eating
disorders; the extent to which the model explains certain features of the diseases; and how
well the model prescribes remediation of the illness and how effective these treatments
are. A well-structured map should therefore contain the following features: the four main
models discussed (and perhaps passing mention to the other four models) together with
the evidence, criticisms and scope of these models with appropriate links to the models.
The value of links was ascertained by coding two linked concepts as a proposition, in the
same was as in Section 11.3.2. A list of all the important propositions suggested in the
paper was drawn up and marks assigned to them; two marks were given to an important
220

A comparison of structured and unstructured tools
proposition, one mark to a more peripheral proposition. This scheme has obvious
problems: subjects may not use exactly the same node types; or may express themselves
in a novel (but not necessarily incorrect) way. An example of both these points may be
to express a negative finding as a critique which attacks a model rather than expressing it
as contradictory evidence. To overcome these problems flexibility was built into the
scheme if the proposition could be expressed a number of ways then alternatives were
allowed with no decrease in marks; further flexibility was provided by reducing the
marks by half for a proposition that was not quite right, but still not wrong (see Appendix
3 for the marking scheme). Two other points must also be stressed: first the scheme was
drawn up before the networks were marked so that it reflects the propositions suggested
by the text, not by the networks. Second, the marking is of the networks not of the
supportive text; this seems a reasonable assumption given that it is networks that are
being analysed, not the text (subjects were instructed to keep text to a minimum). This
said, the text was used occasionally but only when the names of nodes were not enough
to indicate their role in the argument.
The maps were marked by the experimenter and a final mark assigned to each one. It
was found that overall maps created using the constrained tool contained a greater number
of propositions than those created using the unconstrained tool. Table 11.11 shows the
means and standard deviations for this measure.
Condition N Mean percent score SDConstrainedUnconstrained
66
2912
10.97.6
Table 11.11 Mean percent proposition scores for the maps
This difference was significant when tested using a one way ANOVA (F [1,10] =5.0 p<
0.05).
In order check the reliability of this measure, an independent rater was assigned the task
of marking the maps using the scheme used above. It was found that the raters marks
agreed favourable with those of the experimenter using a Spearman Rank-Order
correlation (r = 0.74).
If we are to look at the total number of key propositions rather than the scores (recall that
some of the propositions are scored out of 2) then a similar difference is obtained (F
[1,10] = 12.63, p < 0.01). The rationale for doing this is to find out if there is a
difference in quantity as well as quality of key propositions expressed (see Table 11.12).
Condition N Mean number ofpropositions
SD
Constrained 6 12.50 1.18Unconstrained 6 5.83 1.30Table 11.12 Mean number of propositions expressed in the map
221

A comparison of structured and unstructured tools
11.3.2.1 Ratings
Two raters were assigned the task of marking the maps on two dimensions: (1) the extent
to which the maps contained goal relevant information (completeness) and (2) the extent
to which the maps communicated these ideas to others (communication); both ratings
were out of ten. The correlations between the scores for both of these raters were 0.89
for completeness, and 0.80 for communication; showing close agreement between raters.
The means for both raters are shown below.
Condition N Completeness rating SDConstrained 6 7.2 1.6Unconstrained 6 5.7 3.9Table 11.13 Rated scores for completeness (maximum = 10).
Condition N Communicabilityrating
SD
Constrained 6 7.3 1.2Unconstrained 6 4.3 2.7Table 11.14 Rated scores for communicability (maximum = 10).
Although completeness was found to be nowhere near significant F [1,10] = 2.2, p =
0.16; communication narrowly missed significance at the 95% level F [1,10] = 4.1, p =
0.06. The non-significance of this result (with a two-tailed test) is not too surprising
given the rather low number of maps used per condition (six). However, the means for
both of these results are in the direction predicted by the hypothesis, and the standard
deviations show that the constrained maps again produced scores that were more similar.
If we are less conservative and apply a one-tailed test, we find that communication
reaches significance (p>0.05) and completeness almost does (p=0.08). This confirms
the results of the propositional analysis: subjects using the constrained tool generally
seem to produce better maps that are more similar to one another. Subjects using the
unconstrained tool, on the other hand, tend to vary more.
11.3.2.2 Efficiency
A further question we might investigate is how focused subjects were in the creation of
the map; in other words how many of the propositions that they created were relevant to
the goals of the task—assessing models of eating disorder—and how many were less
relevant to this task. First of all we need to look at the total number of propositions that
were created, Table 11.15 (below) shows this. Whilst there are slightly more
propositions in the constrained condition, this difference was not significant (F [1,10] =
0.65, p = 0.44).
Condition N Mean percent score SDConstrainedUnconstrained
66
20.817.6
2.43.5
Table 11.15 The mean number of all propositions for both conditions.
222

A comparison of structured and unstructured tools
Interestingly, although subjects in the constrained condition created a significantly larger
number of nodes, they created comparatively fewer links. This could be partly due to the
restrictions in the system which prohibited certain node-types to be linked together—for
example, evidence could not be linked to evidence—and by reducing the potential link
types between any pair of nodes.
Efficiency can then be established by using the ratio:
Number of key propositions Efficiency – Total number of propositions
Maximum efficiency therefore equals 1 where all the propositions are key-propositions.
Table 11.16 (below) shows the means for both conditions for this efficiency index.
Condition N Mean efficiency SDConstrained 6 0.62 0.06Unconstrained 6 0.37 0.07Table 11.16 Mean efficiency index per condition.
This difference was significant using a one-way ANOVA (F [1,10] = 6.53, p <0.05).
It therefore appears that not only do subjects using the constrained tool include more key
propositions in their maps, they also include proportionally fewer less relevant
propositions.
Of course this measure of efficiency is only partial. We should also take into
consideration the proposition scores that each of the maps obtain. Although this score is
similar to the number of propositions, it also takes into account the clarity of the
proposition. Recall that certain propositions are marked out of two or three depending on
how explicit the subject is (see marking scheme, Appendix 3).
Thus the equation for this more complete efficiency index is:
Number of key propositions * Map score Efficiency – Total number of propositions Maximum possible score
A perfect efficiency score using this new measure would again attain 1. Table 11.17
(below) shows the average scores for both conditions using this new index of efficiency.
Condition N Mean efficiency SDConstrainedUnconstrained
66
0.190.07
0.040.06
Table 11.17 Efficiency index taking scores on maps into consideration.
This difference was again significant (F [1,10] = 7.143, p <0.05).
223

A comparison of structured and unstructured tools
11.3.2.3 Proposition agreement
One of the problems with the global analyses on the propositions reported above is that it
is possible that two subjects including 50% of the total number of key propositions could
conceivably have completely different propositions in their maps. It would be of interest
to ascertain the extent to which subjects agreed as to the importance of salience of a
particular proposition and to see if there were any differences between conditions. One
of the benefits of constrained tools is that it tends to make maps more similar, indicating
that it is focusing learners on the goals of the tasks. One way of investigating this is to
look at the number of propositions shared by subjects in both of the conditions.
In order to test the significance of this it is necessary to weight each of the propositions
with the number of subjects who agreed upon it, such that a proposition that all agreed
upon would score 6, whereas a proposition that only one person included would score 1.
Propositions that no-one included in their maps were removed from the analysis, note
that because there were more zero scores in the unconstrained condition, the groups are
of unequal size.
Condition N Mean agreement score SDConstrained 37 3.0 1.6Unconstrained 27 2.3 1.7Table 11.18 Agreement scores for propositions
This difference shown in Table 11.18 was found to be significant using a non-parametric
Mann-Whitney test: (U = 350, p <0.05).
Figure 11.1 shows the deviations from the ideal. In an ideal world, educationally
speaking, all the maps would have been the same and perfectly correct. If everyone
agreed on the propositions there would be no outliers, so that there would be as many
propositions agreed upon by all subjects as there would be say half of them and above.
Plotted on the graph below this would result in a horizontal line at the 100% mark. The
worse case, on the other hand, would be where no one agreed with each other, and none
of the propositions were correct, represented by the graph by the horizontal line the zero
point. The graph shows that although both groups were far from perfect, the subjects in
the constrained condition were closer to the ideal than those in the constrained condition.
224

1 00
0 0—Constrained
B0—•
7 0—.--Unconstrained
a.o — • —Bestrt. 60
• 5 0 — —6-- Worst
40 —
•tr.
3 0
2 0
1 0
0
6 5-6
4-6 3-6 2-6 1-6
Cummulative •greoment
A comparison of structured and unstructured tools
Figure 11.1 Cumulative agreement scores
11.3.2.4 Summary
The propositional analysis reveals the following:
(1) Subjects using the constrained tool included a greater amount of goal relevant
propositions.
(2) Subjects using the constrained tool scored tended to show more agreement with each
other on the propositions that should be included.
11.3.3 Descriptions of the maps
The analyses described above are quantitative in nature; they look at how many of the
key-propositions subjects included. Given that some leeway was allowed in marking the
maps, there also needs to be some qualitative analysis of the maps constructed. This may
help answer a number of pertinent questions such as how did subjects in both conditions
seem to frame the problem? How much were they led by the text? What errors or
misinterpretations did subjects show? For references to individual maps, see Appendix
3.
11.3.3.1 Constrained tool subjects
Subjects using the constrained tool seemed to have a few problems using the notation.
One area of disagreement (although by no means an error) was whether to frame the
problem as trying to explain the phenomenon of eating disorders, or trying to answer the
question of what caused them. Three used questions for this (Subjects Cl, C4 and C6),
one used phenomenon (Subject C2) and out of the remaining two one did not tie his
argument together in this way (Subject C5) and one used wildcard nodes (Subject C3).
225

A comparison of structured and unstructured tools
This is not a great problem, but it seems that using phenomena is of more use since this is
more specific to what eating disorder are. It could be argued that constructing an
argument to explain phenomena rather than to address a question is more in keeping with
the goal of scientific reasoning.
Another area of disagreement was how one represented the various models that were
discussed in the text. There was no specific 'model' node, so subjects either had to
create their own or to rely on a pre-defined node.
Subject Cl used 'claims' to represent the competing models 'theories' were used, but
these were non-specific, only forming a bridge between the claims and the questions. In
fact the theories could be removed with no effect on the meaning of the map. Subject C2
used hypotheses to represent the models. Here is a rather unsurprising misinterpretation
of what a hypothesis was meant to mean. In the notation a hypothesis is intended to
relate to a general prediction generated by a claim that can be tested empirically. The
subject responsible for this map quite understandably used hypothesis to refer to a model
or a theory.
Subject C3 used both claims and theories to represent the models producing a rather
interesting inconsistency. Anorexia is addressed by claims, whilst bulimia is addressed
by theories. One possible reason for this is that the claims were created before any of the
theories, which were created towards the end of the session. It could simply be that the
subject decided to use the more specific term late on, and did not bother to change the
claims back to theories2 This is likely to be a manifestation of viscosity and will be
addressed in the general discussion.
Subject C4 used claims to represent the models in a consistent way, quite a lot of
evidence was mobilised in the form of evidence node. One problem that C4 encountered
was that he felt that there were levels of evidence. For example, the evidence node
'Mostly women' is used in the paper as supportive of the socio-cultural model. This led
to a problem because as he saw it this evidence was itself supported by other evidence:
the pressures of advertising, the desire for an ideal shape, women's generally low self-
esteem (perhaps cause by the first two factors) and the absence of control over their lives.
The syntax of the constrained tool prevented evidence being linked to evidence, so he
created his own `Supp. evidence' (supportive evidence) node to express the relationship
as he saw it. This shows one of the difficulties of trying to come up with a rigid model
2 As pointed out in the method section the constrained tool was quite viscous in that it would not permitthe user to change the type of a node once it had been linked. Changing the type would require the userto cut all the links first!
226

A comparison of structured and unstructured tools
of argument: there are always thing that will slip through. Perhaps a more appropriate
interpretation of the information would be that the socio-cultural model has a sub-claim,
or makes the assumption, that factors such as advertising will have an effect on eating on
self-perception, and this sub-claim (or assumption) is supported by the fact that eating
disorders are a predominantly female problem. It is not ideal, but it captures the essence
of the argument. Subject C4's map also has eight nodes that are not linked into the
network (and therefore do not form propositions). A discussion with the subject after the
experiment revealed that this was due to them not being treated by the paper other than
them being mentioned in passing.
Subject C5 produced a map that had a half-completed feel about it. He used a mixture of
theory nodes (endocrynal, family systems and ego-psychological), claim nodes,
hypothesis nodes and wildcard nodes to represent the various models. Unlike subject C3
who also showed some (though rather less) inconsistency, this cannot simply be
explained by the order in which the nodes were created. All that could be said is that the
subject saw little difference between the meanings of the node-types and therefore used
them interchangeably.
Subject C6 was much more principled in her approach. Theories were used to represent
models, and a single claim was used to highlight a specific assumption of a theory, and a
hypothesis was used to represent a more specific prediction of a model which was
supported by evidence.
Generally the use of terms such as critique and evidence were less problematic, although
there was some confusion over whether something was contradictory evidence, or a
attacking critique. This is likely to be partly to do with the rather unspecific nature of a
critique. A critique can be a number of things: it can be a criticism of experimental
methodology in evidence; an attack on philosophical assumptions; a criticism of a theory
for being too vague or narrow; or the assertion that a claim or theory does not explain
certain findings or phenomena. All of these things can be built up from lower level types
such as claim, evidence (or datum) and so on. Critiques are not part of a global argument
structure, rather like assumptions, they exist in the main from a particular perspective
within a genre. Here they can be contrasted with data, phenomena, claims and so on
which exist independently in a genre although perhaps not outside. Part of what a genre
is about is having a tacit agreement about what constitutes a claim or acceptable evidence.
In psychology the notion of situated cognition can be used as a critique of cognitive
science if our intention is to elaborate the arguments in cognitive science. Situated
cognition is not a critique however, rather it is an independent discipline in its own right.
It can however, function as a critique when we do not need (or cannot be bothered)
elaborating upon the claims, data etc. that constitute situated cognition.
227

A comparison of structured and unstructured tools
It therefore seems that terms such as critique and assumption can be a double edged
sword. One the one side they represent a useful way of pruning the argument tree toprevent claims being elaborated ad infinitum on the other side they may result in
premature stoppage, providing the user with a means to cease elaborating when it would
be more educationally useful (in terms of explicating argument) to carry on. We thereforehave a dilemma: how do we provide encouragement to explicate argument just the rightamount, without going into endless and largely irrelevant side-issues? This is seemingly
impossible, like 'premature commitment' it is impossible to determine a metric that
bounds the space of the network for even a subset of debates. All we can do is to
provide feedback on good technique it is likely that such feedback would itself be of
wider educational benefit, concerned with learning the boundaries of acceptable
discussion for a given discipline, and the development of acceptable criteria for what
constitutes a reasonable argument. I pursue this point in the next chapter.
11.3.3.2 Unconstrained tool subjectsLooking over the maps from the unconstrained condition, the map produced by Ulcontained many of the key arguments mentioned in the study. On unusual feature of this
map is that it repeats itself, distorted or dysfunctional cognitions, for example, appears
three times in the network. Another failure is that the evidence for each of the models is
placed in a single node, and no attempt is made to say whether it is supportive or
contradictory.
The map of Subject U2 is perhaps the most idiosyncratic of the six maps created in the
unconstrained condition, based as it is on a decision tree flow chart. As a result of this
representation there are relatively high number of total propositions, with a low number
of key propositions expressed. The majority of propositions in this map express the
interrelationships between the variables that are supposed to cause eating disorders.
Hence, psychological factors contribute to the feeling of worthlessness, Generally the
structure expressed the causation and aetiology of the disease, rather than the structure of
the arguments expressed within the text. The arguments are taken in good faith and the
evidence, claims and assumptions that constitute the argument are not expressed.
The map of U3 is a highly interconnected cyclical graph that, superficially, contains a
number of arguments indicated by the use of terms such as 'Hypothesis' and 'Claim',
however many of these node are use to express causal rather than argumentative
relationships. For example, the 'Ideal image' is said to conflict with the 'Image of self,
the 'Image of self' influences the node 'Cog/ behav model' (Cognitive behavioural
model). In this case it is not the model that is being influenced, but the cognitions of the
individual.
228

A comparison of structured and unstructured tools
The map of U4 contains all of the key models together with some of the criticisms (the
'Critique' nodes) and some evidence, although this evidence is often not stated labelled as
such. The 'Treatments' of anorexia often serve the role of evidence, since treatments is
often one of the main sources of evidence for the different theories. Another interesting
feature of this map is that many of the links go the opposite direction that which one
would expect. For example, Bulimia nervosa is said to explain the models, whereas a
more accurate description is that the models explain the phenomenon of bulimia. Also the
so-called 'Contributing factors' do not contribute to bulimia, but bulimia is said to
contribute to these factors. Again the link direction is inconstant with the stated purpose
of the proposition.
U5's map contains some of the models of interest (the anxiety model, the sociocultural
model and so on), but contained practically no evidence in the network. Like number of
the subjects in this condition there was a tendency to state the type of the node in the
name box, this does not really affect readability and the subject was not penalised for this
in the process of marking the maps.
The map of subject U6 This is rather different from the other two maps in that it is
impoverished, containing only four propositions. Again the relations that exist express
causal rather than argumentative relations between the nodes.
Generally, and in accordance with the analysis of the proposition types (see Section
11.3.1.3) there was a tendency for subjects in the unconstrained condition to represent
lots of different types of relationships and propositions presented in the text. Also, in
accordance with the proposition agreement results (see Section 11.3.2.3) the
unconstrained maps were much more varied than those in the constrained condition.
11.3.4 Scores on the summaries
An additional measure was the extent to which the use of the tools had any effect on the
summaries that subjects wrote at the end of the session.
11.3.4.1 Pre-testTo try and control for the effects of prior knowledge subjects were asked to write down
all that they knew about anorexia and bulimia nervosa on a sheet of A4 paper before the
experiment proper began. The were told to pay particular attention to the theories of the
cause of the diseases. These pre-summaries were marked using a similar method to the
way that the maps were marked (see section). The scores for the pre-test are shown
below in Table 11.19.
229

A comparison of structured and unstructured tools
This difference was shown to he non-significant using a one-way ANOVA (F [1,10] =
0.73, p = 0.4). It therefore seems that there was no appreciable difference in the amount
of prior knowledge relating to the key information on anorexia and bulimia.
Condition N Mean score SDConstrained 6 3.50 1.80Unconstrained 6 2.70 1.50Table 11.19 Mean percent scores for the post-tesi
11.3.4.2 Post-testThe summaries were marked using the same scoring scheme used to mark both the maps
and the pre-test, which was simply a listing of all of the central propositions covered in
the paper (see section 11.3.2). The scores for these summaries are shown in Table 11.20
below.
Condition N Mean score SDConstrainedUnconstrained
66
23.8024.80
2.000.07
Table 11.20 Mean percent scores for post-test summaries
The table shows that the results were very close, and although suhSects in the,
unconstrained condition showed a slightly higher mean score, this was not significant (F
[1,10] = 0.049, p = 0.8).
11.3.5 Revisions
It is inevitable that maps will be revised during the process of construction: names of
nodes be changed, some nodes and links will be deleted and so on. The question is will
there be a difference between the conditions? In order to explore this question the screen-
recordings were coded to enumerate the principle areas of revision, these are: changing
the name of a node, changing the type of a node, changing the type of a link, deleting a
node completely. The mean number of instances for these are shown in Table 11.21
below.
Condition Change nodetype
Rename node Change linktype
Delete node Total
Constrained 3.00 5.67 2.00 3.33 14.07Unconstrained 0.50 1.33 0.67 0.16 2.5Table 11.21 Mean number of revisions per condition
Out Of these differences three were significant, these were: rename node (F [1,10] =
6.35, p<0.5), delete node (F [1,10] = 46.75, p<0.0001) and the total number of
revisions (F [1,10] = 11.03, p<0.01). The number of instances for changing the types
of both node and links being non-significant (F [1,10] = 2.78, p = 0.12) and (F [1,10] =
2.28, p=0.16) respectively. What do these results mean? It could be argued that the
higher number of revisions in the constrained condition were a manifestation of
230

A comparison of structured and unstructured tools
premature commitment: subjects being forced to change inadequate maps as a result of
committing themselves early on. This may well be the case, but what does this have to
say about the very low number of revisions in the unconstrained condition? Could it was
because there was little requirement for premature commitment in the unconstrained
condition it meant that subjects did not need to go back on previously made decisions
because they only committed when they were quite happy with the network? One
possible way of investigating why these changes occurred is to look at when they
occurred. One might hypothesise that if the increased numbers of revisions in the
constrained condition were due to the subjects having to commit themselves early on,
then the majority of revisions would occur in the latter stages of the interaction.
Action Unconstrained Constrained- First Second First Second
Create node 72 28 67 33Link node 33 66 30 70Type node 20 80 ** **
Change nodetype
25 75 62 38
Change link type 75 25 73 27Rename node 50 50 67 33Delete node 0 100*
..n65 35
Table 11.22 Activities for both conditions that occurred in the first and second halves ofthe interaction, revision activities in bold text. * Only one instance. ** Nodes in theconstrained condition were created pre-typed.
Table 11.22 above shows two things: first the revisions in the constrained tool condition
tended to be in the first half of the interaction rather than in the second half, and second
that the activities of linking are remarkably similar for both conditions. Of course these
findings could be explained in terms of premature commitment by stating that subjects in
the unconstrained condition may have wanted to revise their maps in the second half of
the interaction, but did not because as the maps gets larger and more connected it
becomes harder to change. Such a claim would have to show that the maps in the
unconstrained condition were somehow substandard to those in the unconstrained
condition, and as has'been illustrated above, this does not seem to be the case.
11.4 GENERAL DISCUSSION
In the intr duction I stated that one of the main objections to providing a tool that forces
learners to pre-select node-types and select from a finite set of relations was that it
requires learners to commit themselves early on to some form of structure. The
implication of this is that either that the maps would be in some way sub-standard, or that
they would require a lot of revising if the latter stages of the interaction. The results
show that on a number of measures the maps for the constrained condition seem to be on
the %%hole a better reflection of the task goals than those for the unconstrained condition,
and that alth ugh there were mom revisions for the constrained these tended to be in the
231

A comparison of structured and unstructured tools
first rather than the second half of the interaction. Of course, this experiment was rather
short and the materials were rather limited; one could reasonably argue that early
commitment to structure might show its negative consequences much later than the time
scale used here. This is a likely occurrence, but one wonders how significant it is for
learning. Perhaps it is better to spend a few hours creating a map for discussion with a
tutor or another student, rather than spending days or weeks in isolation struggling trying
to obtain a representation that is just right. On this point the issue of communication
plays a role, to communicate ideas a representation needs to be easily readable and
explicit, and independent raters judged the constrained maps as communicating the
learners ideas more effectively than the unconstrained maps, something that should be
borne in mind if the maps are to be used for discussion purposes.
A further observed difference was that subjects in the constrained condition tended to
create argumentative propositions, whereas subjects in the unconstrained condition
tended to create causal propositions. A great deal of reasoning involves stringing
together causal chains, for example dysfunctional cognitions does not cause eating
disorders directly, it does so though several other factors.
Dysfunctional cognition ---> Negative body image ---> Unrealistic desire to be thin --->
Anorexia
Each of the propositions in this causal chain represent a claim in itself that could be
evaluated: do dysfunctional cognitions lead to negative body image, what evidence is
there to suggest that an unrealistic desire to be thin leads to anorexia? Elaborating the
causal chain is therefore an important issue in reasoning because if one fails to do this one
might conceivably miss out on some of the key areas for evaluating and criticising the
argument.
The fact that subjects using the constrained tool scored no higher on the summaries is
rather disappointing, but in many ways insignificant. The interpretation of the significant
result in Study 2 was that subjects were performing elaboration activities that they may
not do otherwise, in this study it is conceivable that both groups were encouraged to do
this. The potential benefits of using constrained knowledge mapping tools go beyond
those measured by post-experimental tests, knowledge structuring activities can provide a
way for supporting the acquisition of procedures and methods that are deployed within a
domain, and the understanding of what makes a genre what it is to some extent they may
support the critical evaluation of argument. As one of the constrained tool subjects stated:
"What was interesting though was that by doing this it really, having just readthrough this [the paper] once I thought, 'well OK, that seems pretty reasonable'but having to build this [the network] really pointed out weakness in the articlemuch more than if I'd just read the article"
232

A comparison of structured and unstructured tools
The next chapter deal with some of these issues.
One observed problem with the constrained tool was its viscosity. Requiring learners to
delete all links to change a node is clearly something that it unsatisfactory, and it would
seem by looking at the screen-recordings that the number of revisions in the constrained
condition would be even higher if they had been allowed to change node and link types
more easily. As I mentioned in the introduction, increasing viscosity in such a tool
automatically brings in problems of trying to preserve the syntactic structure between
nodes and links, however it is possible to provide some limited facility for revisions by
giving users the option of changing types to those which would not contravene the
syntax.
Finally, the notion of unfamiliarity raises its head yet again. There is simply no way of
telling how the results of this study would have differed if subjects in both conditions
were experienced users of the tools that they had been given. It could be that subjects
using the unconstrained tool would find it easier to represent the arguments of the paper
that they were presented 'with, whereas subjects using the constrained tool found it
unduly restricting. Such issues are the topic for future long-term studies, but there seem
to be no obvious reasons why the results would be very different with experienced
knowledge mappers,
In sum it seems that the constrained tool does have some problems with it, but these
could be addressed by relatively simple modifications to the interface and the underlying
argument model. Generally the results suggest that the tools are usable and that they
offer some clear advantages over unstructured knowledge mapping tools.
233

12
Summary and conclusions
12.1 INTRODUCTION
This thesis began with the premises that academic concepts are difficult to learn because
they often require the students to change their way of thinking, either at the level of the
concepts themselves (I gave the example of electrical current, but there are many others),
or at the level of the way that practitioners go about reasoning, communicating and
arguing. A change is needed because often folk knowledge and practices are insufficient
to act as a foundation that can be built upon. We saw that many theorists have advanced
theories of conceptual change to account for the way that knowledge is restructured over
the course of learning and development (see Thagard, 1992), and that certain theories,
such as that of Chi (1991), propose that restructuring occurs gradually and the new
structure never completely replaces the old one'.
The learner's task is made yet harder because often many of the things that the student
needs to know is often left for them to discover for themselves; the education system is
often not tailored to challenge the learner's pre-existing conceptualisations directly and
precipitate change 2. Finally there are all the so-called architectural limitations on learning:
the narrow focus of attention, the limitations of working memory, the computational cost
of managing the mind's vast knowledge-base demand certain types of educational
approach impose restrictions on what learners can meaningfully acquire.
The approach that I proposed to go some way towards addressing these problems is
called directed reflection, which is instantiated in a generic approach known as
1 Of course taken to its logical extreme this theory would posit that there is no old structure in terms ofit being a single entity. Any structure that we have will, in fact, contain fragments of earlier structures,right back to the earliest
2 Gardner (1993) refers to the process of challenging misconceptions as "Christopherian Encounter" afterChristopher Columbus who challenged the supposed prevailing view that the earth was flat.
234

Summary and conclusions
knowledge mapping. The studies in this thesis are not, however, an investigation into
the nature of directed reflection, rather they are a exploration into a problem that
ultimately suggested directed reflection as some form of answer. The concept of directed
reflection is therefore the culmination not the origin of this thesis. It emerged as a result
of the observations in the experimental chapters, which I describe below.
Study 1 asked what do people do when they are using resources such as hypertext and
found that often subjects can be less goal-directed that we would perhaps like. Study 2
looked at ways in which the problems of lack of goal-directedness and active engagement
might be adressed by using knowledge mapping tools and found that whilst such tools
may have an impact on learning, tools used to support goal-directed behaviour did not
appear to have an effect. A potentially interesting finding of this study was subjects
using knowledge mapping tools might need some support in forming explicitly structured
maps that could encourage both reflection and ease of communication of their ideas to
others. Study 3 indicated further that more task-directed knowledge mapping tools might
be of some use, and some first attempts to do this were investigated in Study 4. The two
case studies that constituted Study 5 suggested that constrained tools may have a number
of benefits over unconstrained ones. Finally Study 6 provided data that in some ways
confirmed this conjecture: showing that constraint makes maps more goal-directed, more
similar to each other and more communicable.
The purpose of this chapter is two-fold. First I attempt to provide some kind of
summary about knowledge mapping and structuring activities based on both the work in
this thesis and what is known about learning. Second, I try to use some of these
conclusions to suggest some future directions and further research.
12.2 FACTORS INFLUENCING KNOWLEDGE MAPPING
All of the studies on knowledge mapping indicate that there is a single factor that is pre-
eminent in determining the shape of the maps produced, that of problem framing. How
one initially conceptualises the problem will have a large impact on the way that the
argument is evaluated. If one sees the argument as being between two competing claims,
then these two claims will be evaluated; however, often people's initial conceptualisations
of the problem are incorrect. In the case studies we saw how both subjects
underestimated the number of claims that were pertinent to the arguments that they were
evaluating.
Problems of premature commitment can doubtless be found in all the studies reported in
this thesis. Case study Subject 2's comments about building upon what was already
there refers to this principle. These observations have been used to suggest that tools
235

Summary and conclusions
should not require (or early) commitment on the part of the learner. The interesting thing
about these recommendations is that they are tacitly suggesting that the change in
understanding was in no way influenced by the requirement to formalise ideas. The
argument of the previous chapter (Chapter 11) was that often it is the requirement to
formalise that makes students realise that they have faulty understanding. The famous
Irish Cyclist Sean Kelly was once asked whether he went training on cold days he
replied:
"The trouble is that you never know how cold it is outside from looking out ofthe kitchen window. What you do is to get dressed, get out on the bike and trainfor a couple of hours, then you know how cold it was."
When the structure affords information relating to the task in hand (as it does in the
previous chapter) playing around trying to fit ideas into some structure can provide useful
feedback about your understanding of the learning materials.
Exploring one's structure by tinkering with a knowledge structuring tool requires some
degree of fluidity, as it Seems fair to believe that people are more likely to commit
themselves to some action if it is easily reversible. There are basically two ways in
which restructuring of a knowledge map can be achieved. Local fluidity, where the
system permits the names and types of single nodes and links to be changed seems fairly
easy to achieve. Global fluidity in which wholesale restructuring is supported seems
more problematic since it tends to require changes at the local level as well. As I pointed
out in Section 11.1.1.2 perhaps at this point it is better to start afresh.
Care must be made in overestimating the impact that knowledge mapping tools might
have on learning. It would be all to easy too make bold claims about how knowledge
structuring tools might foster the development of reasoning, argument, analytical and
critical thinking skills. This seems rather rash. What these tools do is to provide a
framework for getting learners to think about the structure of argument, their
successfulness depends not simply upon the tool, but also the educational environment in
which it is situated. First of all, the instruction that learners receive on how arguments
work is of great importance. Lipman (1991) states that one of the most important factors
in the development of critical thinking and analytical skills is the development of effective
criteria; that is the attributes that make a good argument, as opposed to one that is less
good. If students are to maximise the potential of tasks such as the ones described in this
thesis, they will need to be educated in these criteria. Related to this is the quality of the
feedback that is given. Spending time with the student discussing their maps is vital if
students are to learn from their mistakes. As we saw in Chapter 6, knowledge maps can
reveal some quite interesting misconceptions, but we must take care not to over-interpret
236

Summary and conclusions
what might be lapses of attention or slips of the pen, and if misconceptions do seem to be
present we must try and resolve them.
Finally there is nothing special about using argument or theory evaluation structure, it is
simply one of a large number of structures that might be used. The one selected will be
dictated by the skills that we wish students to acquire and the structures used to present
information to students. One could conceive of hybrid representations, designed to
support a variety of educationally relevant tasks, similar to the authoring systems
mentioned in Chapter 7. Thagard (1992) argues that scientific knowledge can be crudely
divided into two levels: conceptual knowledge which is basically hierarchical, and
propositional knowledge which is the relationship between theories and evidence, and is
non-hierarchical. As we saw in the previous chapter, a lot of the ideas expressed in the
paper were also causal in nature. It seems possible that these three types of relationship
could be accommodated in a single tool, but the question remains as to whether or not it
is educationally tractable to combine these three types of representation, or whether it
merely muddies the issue-and makes learners less focused. It is an empirical question.
12.3 FUTURE DEVELOPMENTS
There are a number of different directions that can be pursued in the future development
of knowledge mapping for learning. These can be divided into two overarching
categories of passive and active systems. Passive developments could increase the things
that the learner could do with the tool, whilst keeping the amount that it interferes with
the learner's actions down to a minimum; perhaps only restricting the learner to accord
with a particular notation as for the constrained tool used in the last two studies. Active
systems would be more interventionist either providing advice or reacting against actions
that the learner performed. Some of the recommendations for passive systems are
prerequisite for the development of active systems in the sense that you need to get the
underlying notation and interface right before you can expect to develop active systems,
for this reason the two approaches should be seen as mutually exclusive.
12.3.1 Better developed passive systems
One of the most important attributes of knowledge maps is their visual clarity; like all
maps they only show the information that is relevant to a particular set of goals;
effectively separating the wheat from the chaff. Unfortunately as networks get bigger,
the ease with which they communicate the information to the learner tends to decrease.
An obvious way round this is to reduce the complexity of the network by allowing the
learner to hide certain portions of the net, as offered by Euclid and Inspiration. This
would enable learners to, for example, to hide all of the data that relates to a claim so that
237

Summary and conclusions
only the key points of the argument are displayed—cutting down the amount of
information which might get in the way. Another way of lowering the information
overload is by permitting maps to be nested within higher-level maps, something that is
permitted by a number of commercial packages such as Learning Tool. Again this serves
the function of permitting learners to view only the important parts of the maps and
remove irrelevant clutter. Both of these approaches have trade-offs. Hidden information
can be dangerous in that users may forget that it exists, a case of out of sight out of mind.
Hiding parts of a net can therefore both aid and impede visualisation in varying
measures. A passive system can do little to remedy this problem, although it can keep
track of nodes created and remind the user of their existence from time to time.
It also seems that there are improvements that can be made to the underlying model, the
constrained tool reported earlier in this thesis has a God's-eye view of theoretical or
argumentative structure, meaning that it treats argument or theory building as if all
theories accounting for a set of data or phenomena are known at the outset. In order for
learners to come up with-a meaningful and tractable structure they have to frame the
problem by pitting a particular theory against all other theories. If a new theory comes
along, or the learner becomes aware of another theory or claim then they can run into
problems trying to fit this into the structure that they have created, something that was
evident in Case Study 2. In truth it is difficult to see how this problem can be overcome
in a knowledge structuring tool. Increasing the fluidity of the tool is a possibility but, as
I discussed in Section 12.2, this will only provide part of the answer; perhaps is it is an
unavoidable problem.
A further problem is that there is little distinction in the model between explanatory and
predictive theories. Explanatory theories are good because they explain all (or at least a
major subset) of the data or phenomena in the world, predictive theories are good
because they generate strong hypotheses that can be tested either by experimentation or
by observation—in Karl Popper's terms they are refutable. A good theory makes sense
of the world by linking together phenomena that at first blush seem disparate, and render
new observations explainable. Theories make sense of the world by making
assumptions which are based on data, phenomena, or generally held beliefs about the
world, through these assumptions the theory can make claims, claims explain data.
Claims also generate hypothesis, which can be empirically tested. Elaborating the
assumptions of a theory or claim is crucial to testing its validity. For example, consider
Craik and Lockhart's levels of processing theory. This theory makes the claim that there
are different levels of processing, and that the depth of processing determines the extent
to which something can be recalled at a later date. It then makes the assumption that
semantic processing is a deep form of processing, whilst syntactic processing is a
238

Summary and conclusions
shallow form of processing, this allows a hypothesis to be generated that tasks that
require subjects to focus on semantics should lead to better retention than those where the
subject focuses on the syntax, which has been found by a number of studies (Hyde and
Jenkins, 1969, for example). Unfortunately, among other problems for this theory,
there is no evidence to support the semantic = deep assumption, short of saying that
semantic must be better than deep because the data says so. The argument therefore
largely depends upon auxiliary assumptions that allow the claim to predict the
hypothesis, since this assumption has no data to support it short of the data that supports
the hypothesis that it is needed to derive, the argument is therefore circular.
A better developed system might incorporate methods of representing these ways of
evaluating and criticising arguments. Some of the studies reported in this thesis indicate
that the representation used for AKA, described in Chapter 9, fails to capture many forms
of argument in a satisfactory manner. Currently I am working on models which enable
students to represent some of these attributes of argument and theory evaluation.
A final way forward using systems that are essentially passive, is to develop systems that
enable collaborative argument. Students could work on a shared structure over a
network with the goal to resolve, as far as they can, some relevant problem or debate,
effectively learning about both content knowledge and argument structure by interacting
with each other.
12.3.2 Active systems
Perhaps more educational value can be made from knowledge mapping tools if the
system is made active, or reactive. An active system can offer advice to the learner on the
appropriateness or well-formedness of a map, whereas a passive system, such as all the
ones discussed thus far, requires a human being to do this. There is a continuum here:
the simplest form of active system could give basic syntactic feedback on a net, a more
complicated one could give more semantic feedback. Again there is a trade-off, not least
in that as feedback becomes more informative and more domain dependent there is a
concomitant increase in the amount of domain dependent information that the system
needs to have and be able to communicate to the learner.
Syntactic feedback is probably the easier of the two, the system could offer the student
feedback on the well-formedness of the argument, perhaps by extending the 'why not'
help of AKA (see Chapter 9). The system could, for example, tell the learner who is
trying to support a theory directly with evidence that it is more effective to articulate the
individual claims first and then cite evidence in support of these claims.
239

Sununary and conclusions
A more complex, but still tractable, possibility would be to require learners to specify
numerical or categorical link weights (for example, evidence X supports claim Y with
strength of 0.8, or it supports it very strongly). The system could then run through the
network taking the weighting into account and suggest which theory or claim is best
supported by the available evidence. The idea of this would be to see if the claim that the
system decides is the best agrees with what the learner or information source that the
learner is using is the best. This may force the learner to look for more evidence,
criticisms and so on to try and redress the balance.
There are some apparent problems with this approach. First, there is the possibility that
given a disparity between the opinions of learner and system, the learner could merely
adjust the weights blindly until agreement was reached. Second, and more worryingly,
what happens if (perhaps by accident) both learner and system agree on the best solution.
Given two competing claims or theories (something that is likely in many arguments—
think of the nature-nurture debate) there is a 0.5 probability that the learner and system
would agree at this gross- level through chance alone, even thought they agree for
different reasons. Notwithstanding these potential problems, an approach similar to this
has been developed by Michael Ranney and colleagues (Schank & Ranney, 1993) using
their Convince Me program. Convince Me allows students to assess the relationship
between competing theories and particular bits of evidence which are either given to the
student or are self-generated. Two competing theories might be the sociocultural and
cognitive models of anorexia. These two competing theories are then linked to evidence
that they explain, and the student can provide weights to show how strongly the
explanatory link is, and how important the evidence is. Once the student has gone
through this process they can run the model that they have created using ECHO a
connectionist network that simulates a method of belief revision known as Explanatory
Coherence (Thagard, 1992).
Useful though it is, Convince Me only really deals with the explanatory power of
theories, it says nothing about their predictive power, nor does it question the validity of
different sorts of evidence. Perhaps further developments of tools such as Convince Me
might utilise some of the methods use in the tools used in this thesis and take a broader
slice of theory and argument evaluation.
A still more complicated approach would be to build some form of domain knowledge
into the system, in the form of canonical argument structures. The system would set the
learner a task such as "evaluate the different models of eating disorders" and they could
then look for information in a hypertext database built in to the system. When they find
information that appears relevant, they create a node in the network and give it a type that
reflects its role in the developing argument. Since the system has some knowledge about
240

6 File Edit Go Tools Objects Font Style Utilities ViewI IIIda licks I IIIda I Task I Mat— 114•re I.1. _J
—19eneaterat ler lamina
Coneradicet
Attacks
—latiWC•retleMn.
NI
TaskEvaluate the claim thathypertext Is good for learning.
patenGorden Gustaver.Ty -
1•111:PrfaISTII=,=27.1TE:lok
Summary and conclusions
the way that the information relates to the argument, it can offer advice and feedback on
the network as it develops (see Figure 12.1 for a mock-up interface).
Figure 12.1 Mock up of tutor interface.
This type of approach is as of yet pure fantasy, and it is unclear if would be useful even
if it were possible to build such a system. What does seem to be clear, however, is that
feedback of some sort be it given by a computer or by a human is of vital importance if
we are to get the most out of these tools.
This hypothetical example brings us full circle. One of the problems with hypertext that I
discussed earlier in this thesis was users lack of goal-directedness when accessing the
information, this 'tutoring' approach provides learners with primary task that drives the
interaction; hypertext simply provides a convenient way of providing relevant
information to support this task.
12.4 SOME QUESTIONS FOR FUTURE RESEARCH
This thesis raises more questions than it answers, which given the fact that this research
is in its early stages is both unsurprising and healthy. Below I list some of the questions
that seem to be of relevance for future research.
• Will using structured tools such as those described in this thesis aid people to
evaluate arguments?
241

Summary and conclusions
• Given that the tools help evaluate arguments, will this translate into evaluative skills
when not using the tool (or a paper and pencil)?
. What is the transfer between domains of any skills that learners might acquire?
. What sort of feedback should learners be given when using the tools in order to
extract their maximum potential?
. What sort of collaborative discussion might the tools support or promote?
• How must the educational context be structured to best engender the activities that the
tools support?
These questions are, I believe, central to the development of tools that aid directed
reflection; a tool is just an artefact, it is the ingenuity and creativity with which it is used
that is central to its usefulness.
242

REFERENCES
Allinson, L.J. (1991). Navigational issues in hypertext-based learning. UnpublishedPhD thesis, University of York.
Anderson, J. R. & Reiser, B. J. (1985). The LISP tutor, Byte, vol. 10, no. 4, pp 159-175.
Anderson, J. R. (1983). The Architecture of Cognition. Cambridge, MA: HarvardUniversity Press.
Anderson, J. R. (1990a). The Adaptive Character of Thought. Hillsdale, NJ: LEA.
Anderson, J.R. & Bower, G. H. (1973). Human Associative Memory. Winston,Washington.
Anderson, J.R. & Singley, M.K. (1993). The identical elements theory of transfer. InJ.R. Anderson, Rules of the Mind. pp 183-205.
Anderson, J.R. (1990). Cognitive Psychology and its Implications. (3rd ed.) NewYork: Freeman. -
Anderson, J.R. (1993). Rules of the Mind.. Hillsdale, NJ: Lawrence ErlbaumAssociates.
Anderson, J.R., Boyle, C.F. & Yost, G. (1985). The geometry tutor. Proceedings ofthe IJCAI, 1-7.
Anderson, J.R., Boyle, C.F., Corbett, A.T. and Lewis, M.W. (1990). Cognitivemodeling and intelligent tutoring, Artificial Intelligence, 42, 7-49.
Ausubel, D.P. (1968). Educational Psychology; A Cognitive View. Holt, New York:Rinehart Winston.
Baddeley, A.D. (1990). Human Memory: theory and practice. Hillsdale, NJ: LEA.
Baddeley, A.D. & Hitch, G. (1974). Working memory. In G.H. Bower (Ed.) Thepsychology of Learning and Motivation, vol. 8. London: Academic Press.
Baird, P. & Percival, M. (1989). Glasgow on-line: database development using apple'sHypeiCard. in R. McAleese (Ed.) Hypertext: Theory into Practice. London:Intellect.
Barnard, P.J. (1987). Cognitive resources and the learning of human-computerdialogues. In J.M. Carroll (Ed.) Interfacing Thought: Cognitive Aspects ofHuman-Computer Interaction. MA: CUP.
Barsalou, L.W. (1986). 'Are there static category representations in long termmemory?' Behavioural and brain sciences. vol. 9(4), 651-652.
Bartlett, F.C. (1932). Remembering. Cambridge: CUP.
Bazerman, C. (1988). Shaping written knowledge: the genre and activity of theexperimental article in science. Madison: University of Wisconsin Press.
243

References
Beeman, W., Anderson, K., Bader, G., Larkin, J., McClard, A., McQuillan, P., andShields, M. (1987). Hypertext and pluralism: From lineal to non-lineal thinking.Proceedings of the Hypertext '87 conference, Chapel Hill, NC, November, pp67-88.
Bernstein, B. (1992). Euclid: Supporting collaborative argumentation with hypertext.Technical Report CU-CS-596-92, Department of Computer Science, Universityof Colorado.
Berry, D.C. & Broadbent, D.E. (1984). On the relationship between task performanceand associated verbalisable knowledge. Quarterly Journal of ExperimentalPsychology, 36A, 209-231.
Bielaczyc, K., Pirolli, P.L. & Brown, A.L. (in press) Training in self-explanation andself regulation strategies: investigating the effects of knowledge acquisitionactivities on problem solving. Cognition and Instruction.
Birnbaum, L.M., Flowers, M. & McGuire, R. (1980). Towards an Al model ofargumentation. Proceedings of the First International Conference on ArtificialIntelligence. Stanford, CA.
Bloom, B.S. (1964). Taxonomy of Educational Objectives: The Classification ofEducational Goals. vol. 2. Longman.
Bransford, JD. & Franks,J.J. (1971). The abstraction of linguistic ideas. CognitivePsychology, 3. pp 331-350.
Bransford, J.D. & Johnson, M.K. (1973). Consideration of some problems ofcomprehension. In Chase, W.G. (Ed.) Visual Information Processing, NewYork: Academic Press.
Bransford, J.D., Sherwood, R.D. & Sturdevant, T. (1987). Teaching thinking andproblem solving. In R.J. Sternberg & J.B. Baron, (Eds) Teaching thinkingskills: theory and practice. New York: Freeman. pp 162-181.
Brewer, W.F. & Lambert, B.L. (1993). The theory-ladenness of observation: evidencefrom cognitive psychology. In Proceedings of the fifteenth annual conference ofthe cognitive science society. Hillsdale, NJ: LEA. pp 254-259
Broadbent, D.E., Fitzgerald, P. & Broadbent, M.H.P. (1986). Implicit and explicitknowledge in the control of complex systems. British Journal of Psychology,77, 33-50. •
Brown, J.S., Collins, A, & Duguid, P. (1989). Situated cognition and the culture oflearning, Educational Researcher, Jan-Feb, 32-42.
Bush, V. (1945). As we may think. Atlantic Monthly, 176, 1, (July), 101-108.
Buzan, T. (1993). Use your head. London: BBC Books.
Carbonell, J.R. (1970). Mixed-Initiative Man-Computer Dialogues. DoctoralDissertation, Massachusetts Institute of Technology, Cambridge, MA.
Carey, S. (1985). Conceptual Change in Childhood. MIT Press, Cambridge, MA.
Carraher, T.N., Carraher, D.W. & Schliemann, A.D. (1985). Mathematics in thestreets and in the schools. British Journal of Developmental Psychology, 3, 21-29.
244

References
Carroll J.M. (1990). The Nurnberg Funnel: designing minimalist instruction forpractical computing skill. Cambridge, Massachusetts: MIT press
Carroll, J.M., Singley, M.K. & Rosson, M.B. (1991). Toward an Architecture forInstructional Evaluation. Research Report, IBM Research Division, YorktownHeights, New York.
Charney, D. (1994). The impact of hypertext on the processes of reading and writing.In S.J. Hilligoss & C.L. Selfe (Eds). Literacy and Computers , New York:MLA.
Charnialc, E. (1972). Towards a model of children's story comprehension. Technicalreport 266, Artificial Intelligence Laboratory, Massachusetts Institute ofTechnology.
Cheng, P.W., Holyoak, K.J., Nisbett, R.E. and Oliver, L.M. (1986). Pragmaticversus syntactic approaches to training deductive reasoning. CognitivePsychology, 5, 121-152
Chi, M.T.H, Glaser,R. & Rees, E. (1982). Expertise in problem solving. In R.J.Sternberg (E.) Advances in the Psychology of Human Intelligence, vol. 1,Hillsdale, NJ: LEA. pp 7-15.
Chi, M.T.H. & VanLehn, K. A. (1991) The content of physics self-explanations. TheJournal of the Learning Sciences, 1(1), 69-105.
Chi, M.T.H. (1991). Conceptual change within and across categories: implications forlearning and discovery in science. In R. Giere (Ed.), Cognitive Models ofScience, Minnesota Studies in the Philosophy of Science, vol. 15. Minneapolis:University of Minnesota.
Chi, M.T.H. (1993). Barriers to conceptual change in learning science concepts: atheoretical conjecture. In Proceedings of the fifteenth annual conference of thecognitive science society. Hillsdale, NJ: LEA. pp 312-317.
Chi, M.T.H., Bassok, M., Lewis, M., Reimann, P. & Glaser, R. (1989). Self-explanations: how students study and use examples in learning to solve problems.Cognitive Science, 13, 145-182.
Chi, M.T.H., Feltovich, P.J. & Glaser, R. (1979). Categorization and Representationof Physics Problems by Experts and Novices. Cognitive Science, 5, 121-152.
Clancey, W.J. (1987). Knowledge-based tutoring: the GUIDON program. Cambridge,MA: M.I.T. Press
Cohen, H.J., & Squire, L.R. (1980). Preserved learning and retention of patternanalysing skills in amnesia: dissociation of knowing how and knowing that.Science, 210, 207-210.
Collins, A. & Brown, J.S. (1988). The Computer as a Tool for Learning ThroughReflection. In H. Mandl & A. Lesgold (Eds). Learning Issues for IntelligentTutoring Systems. Berlin: Springer-Verlag. pp 1-18.
Collins, A. (1977). Processes in acquiring knowledge. in R,C. Anderson; R.J. Spiroand W.E. Montague (Eds). Schooling and the Acquisition of Knowledge.,Hillsdale, NJ: LEA.
245

References
Collins, A.M. & Loftus, E.F. (1975). A spreading activation theory of semanticprocessing, Psychological Review, 82, 407-28.
Collins, A.M. & Quillian, M.R. (1969). Retrieval time from semantic memory. Journalof Verbal Learning and Verbal Behaviour, 8, 240-247.
Conklin, J & Begeman, M. L. (1988). gIBIS: a tool for all reasons, Journal of theAmerican Society for Information Science, May, 200-213.
Conldin, J, (1993). CM/1. Corporate memory systems. Austin, Texas.
Conklin, J. (1987). Hypertext: an Introduction and Survey. IEEE Computer. 20, (9),17-41.
Cooper, G.A. & Sweller, K. (1987). Effects of schema acquisition and rule automationon mathematical problem-solving transfer. Journal of Educational Psychology,79, 347-362.
Cox, R. & Cumming, G. (1990). The role of exploration-based learning in thedevelopment of expertise. in A. McDougal & C. Dowling (Eds) Computers inEducation. North-Holland: Elsevier Science Publishers B.V.
Craik, F.I.M. & Lockhart, R.S. (1972). Levels of processing: a framework formemory research. Journal of Verbal Learning and Verbd Behaviour ,11.6.1V-684.
Craik, F.I.M. & Tulving, E. (1975). Depth of processing and the retention of words inepisodic memory. Journal of Experimental Psychology: General, 104, 268-294.
Craik, F.I.M. & Watkins, M.J. (1973). The role of rehearsal in short term memory.Journal of Verbal Learning and Verbal Behaviour, 12, 599-607.
Dansereau, D.F., McDonald, B.A., Collins, K.H., Garland, J., Holley, C.E.,Diekhoff, E.M. & Evans, S.H. (1979). Evaluation of a learning strategy system.In H.F. O'Neil & C.D. Spielberger. Cognitive and affective learning strategies.New York: Academic Press.
Dearholt, W. & Shvaneveldt, R. W. (1990). Properties of pathfinder networks. In R.WShvaneveldt (Ed.) Pathfinder Associative Networks: Studies in KnowledgeOrganisation. NJ: Ablex.
Di Vesta, F.J. & Rieber, L.P. (1987). Characteristics of Cognitive Engineering: TheNext Generation of Instructional Systems. ECTJ, vol. 35, No. 4. pp 213-230.
Dooling, D. J. & Lachman, R. (1971). Effects of comprehension on retention ofprose. Journal of Experimental Psychology, 88, 216-22.
Edwards, D.M. & Hardman, L. (1989). Lost in Hyperspace: Cognitive Mapping andNavigation in a Hypertext Environment. in R. McAleese (Ed.) Hypertext Theoryinto Practice. pp 105-125.
Elm, W.C. & Woods, D.D. (1985). Getting lost: A Case Study in Interface Design.Proceeding of the Human Factors Society, 927-931.
Englebart, D. C. (1963). A conceptual framework for the augmentation of man'sintellect. In Vistas in Information Handling, Washington, DC: Spartan Books.pp 1-29.
246

References
Eysenck, M.W. & Keane, M.T. (1990). Cognitive psychology: a student's handbook.Hillsdale, NJ: LEA.
Ferguson-Hessler, M.G.M. & de Jong, T. (1990). Studying physics texts: Differencesin study processes between good and poor performers. Cognition and Instruction7(1), 41-54.
Fiderio, J. (1988). A Grand Vision. Byte. October. 237-247.
Fischer, G. (1988). A critical assessment of hypertext systems. Panel Session inProceedings of CHI '88: Human Factors in Computing Systems, 223-227, NewYork: ACM.
Fischer, G., McCall, R., and Morch, A. (1989). JANUS: Integrating hypertext with aknowledge-based design environment. Proceedings of the Second ACMConference on Hypertext: hypertext 89. Pittsburgh, PA, November. 105-118.
Fisher, K.M. (1990). Semantic Networking: the new kid on the block. Journal ofReasearch in Science Teaching, 27(10), 1001-1018.
Fisher, K.M. (1992). SemNet: a tool for personal knowledge construction. In P.A.M.Kommers, D.H. Jonassen & J.T. Mayes (Eds) Cognitive Tools for Learning.Berlin: Springer-Verlag. pp 63-77.
Folz, P.W. (1991). A text comprehension model of hypertext: a theory based approachto design and evaluation. in S.P. Robertson, G. Ohlson & J.S. OhlsonReaching Through Technology Proceedings of CHI 1991, 489-490. New York:ACM.
Foss, C.L. (1987). Effective Browsing in Hypertext Systems. Unpublished Paper.University of Lancaster.
Foucault, M. (1970). The order of things. A. Sheridan (trans.) New York: RandomHouse.
Frase, L.T. (1975). Prose processing. In G.H. Bower (Ed.). The Psychology ofLearning and Motivation., vol. 9. New York: Academic Press.
Gagne, R.M; Briggs, L.J. & Wager, W.W. (1988). Principles of Instructional Design(3rd ed.) New York: Holt, Rinehart & Winston.
Gardner, H. (1993). The Unschooled Mind. London: Fontana.
Gayer, W.W. (1991). Technology Affordances. in S.P. Robertson, G, Ohlson &J.S. Ohlson (Eds) Reaching Through Technology Proceedings of CHI 1991.New York: ACM. 79-84.
Gentner, D. & Gentner, D.R. (1983). Flowing water and teeming crowds: mentalmodels of electricity. In D.R. Gentner & A.L. Stevens (Eds). Mental ModelsHillsdale, NJ: LEA.
Gentner, D. & Stevens, A.L. (1983). Mental models. Hillsdale, NJ: LEA.
Gick, M.L. and Holyoak, K.J. (1980). Analogical problem solving. CognitivePsychology, 12, 306-355.
Glaser, R. & Bassok, M. (1989). Learning theory and the study of instruction. AnnualReview of Psychology, 40, 631-666.
247

References
Glock, M.D. (1967). The improvement of college reading. Boston: Houghton Mifflin.
Godden, D.R. & Baddely, A.D. (1975). Context dependent memory in two naturalenvironments: on land and underwater. British Journal of Psychology, 55. 325-332.
Gordon, S., Gustave!, J. Moore, J. & Hankey, J. (1988). The effects of hypertext onreader knowledge representation. Proceedings of the Human Factors Society,32nd Annual Meeting, Anaheim, CA.
Green, T.R.G. (1989). Cognitive dimensions of notations. In A. Sutcliffe and L.Macaulay (Eds) People and Computers V, Cambridge: CUP. pp 443-460.
Green, T.R.G. (1990). The cognitive dimension of viscosity: a sticky problem forHCI. In D. Diaper, G. Gilmour, C. Cockton and B. Shackel (Eds) Human-Computer Interaction: Proceedings of Interact '90, 79-86. N. Holland: ElsevierScience Publishers.
Greeno, J. G. (1991). Environments for Situated Conceptual Learning. In L.Birnbaum. (Ed.). The International Conference on the Learning Sciences:Proceeding of the 1991 conference. Virginia: Association for the Advancement ofComputing in Education. pp 211-217.
Hammond, N.V. & Allinson, L. (1989). Extending hypertext for learning: andinvestigation of access and guidance tools. in A. Sutcliffe and L. Macaulay (Eds)People and Computers V. Cambridge: CUP. pp 293-304.
Hammond, N.V. (1990). Tailoring hypermedia for the learner. Presented at NATOARW.
Hammond, N.V. (1993). Learning with hypertext: problems, principles and prospects.In C. McKnight, A. Dillon and J. Richardson (Eds). Hypertext: a PsychologicalPerspective. Ellis Horwood: New York.
Hayes, J. R. & Flower, L. S. (1980). Identifying the Organisation of WritingProcesses. In L.W. Gregg & E.R. Steinberg, (Eds). Cognitive Processes inWriting, Hillsdale, NJ: LEA.
Hayes, J.R. & Simon, H.A. (1977). Psychological differences among problemisomorphs. In J. Castellan, D.P. Pisoni & C. Potts (Eds), Cognitive theory,vol. 2. Hillsdale, NJ: LEA.
Hayes, P.J. (1985). The second naive physics manifesto in J.R. Hobbs & R.C.Moore, (Eds). Formal Theories of the Comnwnsense World NJ: Norwood.
Hayes-Roth, B. & Hayes-Roth, F. (1979). A cognitive model of planning. CognitiveScience, 3, 275-310.
Heeren, E. & Kommers, P.A.M.(1992). flexibility of expressiveness: a critical factorin the design of concept mapping tool for learning. In P.A.M. Kommers, D.H.Jonassen & J.T. Mayes (Eds) Cognitive Tools for Learning. NATO ISI Series,Berlin: Springer-Verlag. pp 85-10.
Hyde, T.S. & Jenkins, J.J. (1969). Differential effects of incidental tasks on theorganisation of recall of a list of highly associated words. Journal ofExperimental Psychology, 82, 472-481.
HyperCard version 2.2 (1994). Apple Computers inc. Cupertino, CA.
248

References
Jegede, 0.J., Alaiyemola, F.F. & Okebukola, P.A.O. (1990). The effect of conceptmapping on students' anxiety and achievement in biology. Journal of Research inScience Teaching, 27, 951-960.
Johnson-Laird, P. N. (1983). Mental Models Cambridge: CUP.
Jonassen, D.H. & Grabinger, R.S. (1990). Problems and Issues in designinghypertext/hypermedia for learning. In D.H. Jonassen & H. Mandl (Eds). Designissues in hypertexYhypermedia for learning: Heidelberg: Springer-Verlag. pp 3-25.
Jonassen, D.H., Beissner, K. & Yacci, M. (1993). Structural Knowledge. Hillsdale,NJ: LEA.
Jones, T. (1990). Towards a typology of educational uses of hypermedia. in TheProceedings of the International Conference on Computer Assisted Learning.June 11-13 1990, Hagen, West Germany.
Kellogg, W.A. & Breen, T.J. (1987). Evaluating user and system models: applyingscaling techniques to problems in human-computer interaction. In R Baecker &W. Buxton (Eds), CHI '87: Human Factors in Computing Systems, NewYork: ACM. pp 303-308.
Kelly, G.A. (1955). The Psychology of Personal Constructs. New York: Norton.
Kibby, M.R. & Mayes, J.T. (1991). The learner's view of hypermedia. In M.R.Kibby, G. Tanner, T. Mayes, C. Knussen, S. Grant & L. Hardman (Eds). Finalreport on user interfaces for hypermedia. The SAFE report.
Kibby, M.R., Tanner, G., Mayes,. Knussen, C., Grant, S. & Hardman, L. (1991).HYP/21 Final report on user interfaces for hypermedia. The SAFE report.
Kintsch, W. (1987). The role of knowledge in discourse comprehension: aconstruction-integration model. Psychological Review 95, 2 163-182.
Kintsh, W. & van Dijk, T. A. (1978). Towards a model of text comprehension andreproduction. Psychological Review, 85, 363-94.
Kommers, P.A.M. & de Vries, S.J. (1992). TextVision and the visualisation ofknowledge: school-based evaluation of its acceptance at two levels of schooling.In P.A.M. Kommers, D.H. Jonassen & J.T. Mayes (Eds) Cognitive Tools forLearning. NATO ISI Series, Springer-Verlag: Berlin.
Kornbrot, D.E. & MacLeod, M. (1990). Monitoring and analysis of hypermediainteraction. In D. Diaper, G. Gilmour, C. Cockton and B. Shackel (Eds)Human-Computer Interaction: Proceedings of Interact '90, 79-86. N. Holland:Elsevier Science Publishers. pp 401-406.
Kotovsky, K. Hayes, J.R. & Simon, H.A. (1985). Why are some problems hard?Evidence from the Tower of Hanoi. Cognitive Psychology, 17, 248-294.
Kozma, R.B. (1992). Constructing knowledge with learning tool. In P.A.M.Kommers, D.H. Jonassen & J.T. Mayes (Eds) Cognitive Tools for Learning.Springer-Verlag, Berlin. pp 23-33.
Kozma, R.B., & Van Roekel, J. (1986). Learning Tool. Santa Barbara, CA:Intellimation.
249

References
Kransor, L. & Mitterer, J. (1984). LOGO and the development of general problemsolving skills. The Alberta Journal of Educational Research, 30(2), 133-144.
Kuhn, D. (1991). The Skills of Argument. Cambridge: CUP.
Kuhn, T. (1970). The Structure of Scientific Revolutions, 2nd ed. University ofChicago Press, Chicago.
Kunz, W. & Rittel, H. (1970). Issues as elements of information systems. Centre forPlanning and Development Research. Univ. of California, Berkeley, WorkingPaper.
Lakoff, G. (1987). Women Fire and Dangerous Things: What Categories RevealAbout the Mind. Chicago: University of Chicago Press.
Langley, P. & Simon, H. A. (1981). The Central Role of Learning in Cognition. inJ.R. Anderson (Ed.) Cognitive Skills and their Acquisition. NJ: LEA.
Larkin, J. & Simon, H.A. (1987). Why a diagram is (sometimes) worth ten thousandwords. Cognitive Science, 11, 65-99.
Laurillard, D. (1993). Rethinking University Education: a framework for the effectiveuse of educational technology. New York: Routledge.
Lave, J. & Wenger, E. (1991). Situated Learning: Legitimate Peripheral Participation.Cambridge University Press, Cambridge, New York.
Lave, J. (1988). Cognition in Practice: Mind, Mathematics and Culture in EverydayLife. New York: CUP.
Lee, J. & Lai, K. (1991). What's in design rationale. Human-Computer Interaction, 6(3&4), 251-280.
Lipman, M. (1987). Some thoughts on the foundations of reflective education. In J.B.Baron and R.J. Sternberg (Eds) Teaching Thinking Skills: theory into practice.New York: Freeman. pp 151-161.
Lipman, M. (1991). Thinking in Education. Cambridge: CUP.
Logan, D. (1988). Toward an instance theory of automatization. PsychologicalReview, 95, 492-527.
Luria, A.R. (1976). Cognitive Development: it's Cultural and Social Foundations.Cambridge, Massachusetts: Harvard University Press.
MacLean, A., Young, R.M., Bellotti, V. & Moran, T.P. (1991). Questions, Optionsand Criteria: elements of design space analysis. Human-Computer Interaction; 6(3&4), 201-250.
Mandler, G. (1967). Organisation in memory. In K.W. Spence & J.T. Spence (Eds)The psychology of learning and motivation, vol. 1, pp 327-372. New York:Academic Press.
Marchionini, G. (1988). An invitation to browse: designing full text systems for casualusers. Canadian Journal of Information Science, 12(3/4), 69-79.
250

References
Marshall, C. C. and Rogers, R. A. (1992). Two Years before the Mist: Experienceswith Aquanet. In Proceedings of the Fourth ACM Conference on Hypertext, 53-62.
Marshall, C.C., Halasz, F.G., Rogers, R.A. and Janssen, W.C. (1991). Aquanet: ahypertext tool to hold your knowledge in place. in. Hypertext '91: Third ACMconference on hypertext. New York: ACM Press.
Mayes, J.T. (1990). Come back programmed learning all is forgiven! Presented atNATO ARW.
Mayes, J.T. (1992). Cognitive tools: a suitable case for learning. In P.A.M.Kommers, D.H. Jonassen & J.T. Mayes (Eds) Cognitive Tools for Learning.Berlin: Springer-Verlag. pp 7-18.
Mayes, IT., Draper, S., McGregor, A., & Oakley, K. (1988). Information flow in auser interface: the effect of experience and context on recall of MacWrite screens.In D.M. Jones and R. Winder (Eds) People and Computers IV, CambridgeUniversity Press, Cambridge.
Mayes, J.T., Kibby M. R. & Watson. H. (1988). StrathTutor: The Development andEvaluation of a Learning-by-Browsing System on the Macintosh. Computers andEducation, 12, 221-229.
McAleese, R. (1989). Navigation and browsing in hypertext. in R. McAleese (Ed.)Hypertext Theory into Practice, pp 6-44.
McAleese, R. (1994). A theoretical view of concept mapping. Association for LearningTechnology Journal, 2, 1, 38-48.
McCall, R. (1987). Procedurally Hierarchical Issue-Based Information Systems.Proceeding of Conference on Planning and Design in Architecture Boston, MA.American Society of Mechanical Engineers.
McCloskey, M. (1983). Naive theories of motion. In D.R. Gentner & A.L. Stevens(Eds). Mental Models Hillsdale, NJ: LEA.
McKendree, J.E. & Reader, W.R. (1994). The homeopathic fallacy in hypertext:misconceptions of psychology in the design of computer courseware. ALTNews. April, 1994.
Meyer, B.J.F. & Rice-, G. (1982). The interaction of reader strategies and theorganisation of text. Text, 2, 141-154.
Meyer, B.J.F. (1975). Signalling the structure of text. in Jonassen, D. (Ed.)., TheTechnology of Text. Englewood Cliffs, NJ: Educational TechnologyPublications
Meyer, B.J.F., Young, C.J. & Bartlett, B.J. (1989). Memory Improved: Reading andMowry Enhancement Across the Life Span Through Strategic Text Structures.Hillsdale, NJ: LEA.
Meyer, R. (1984). Aids to prose comprehension. Educational Psychologist, 19, 30-42.
Meyrowitz, N. (1986). Intermedia: The architecture and construction of an object-oriented hypermedia system and applications framework. Proceedings of theOOPSLA '86 Conference, (Portland, OR, September), pp 186-201.
251

References
Miller, G. A. (1956). The magical number seven, plus or minus two: some limits onour capacity for processing information. Psychological Review, 63, 81-97.
Mirande, M.J.A. (1984). Studeren door schematiseren [Studying by schematizing].Utrech, The Netherlands: Het Spectrum.
Mitchell, P.D. & Taylor, S.G. (1991). Concept mapping as an aid to computer-mediated conversation: an application of conversation theory. Paper presented tothe Association for Educational Communications and Technology, Orlando, FL.
Mitterer, J. & Kransor, L. (1986). LOGO and the transfer of problem solving skills: anempirical test. The Alberta Journal of Educational Research, 32(3). 176-194.
Miyake, N. (1986). Constructive interaction and the iterative process of understanding.Cognitive Science, 10, 151-177.
Monty, M.L. (1990). Issues for supporting note-taking and note using in the computerenvironment. Unpublished PhD Dissertation, University of San Diego, CA.
Morton, J. (1967). A singular lack of incidental learning. Nature, 215, 203-204.
Moulthrop, S. (1991). Beyond the electronic book: a critique of hypertext rhetoric. in.Hypertext '91: Third ACM conference on hypertext. New York: ACM Press.
Neely, J.H. (1977). Semantic priming and retrieval from lexical memory. Roles ofinhibitionless spreading activation and limited capacity attention. Journal ofExperimental Psychology: General, 106, 226-254.
Nelson, T. H. (1988). The Xanadu hypertext system. Unpublished manuscript,Xanadu Operating Company, Inc., Palo Alto, California.
Nielsen, J. (1986). Online Documentation and Reader Annotation. in Proceedings of1st International Conference Work with Display Units, Stockholm, Sweden May12-15 1986, pp 526-529.
Njoo, M. & de Jong, T. (1991). Support for learning with computer simulations;giving hints, supporting learning processes, and providing hypotheses.Presented at the 1991 AERA Annual Meeting, Chicago, April 3-7, 1991.
Noblitt, J. (1991). Paper presented at IBM European conference, August, 1991.
Novak, J.D. & Gowin; D.B. (1984). Learning How to Learn. Cambridge, England;CUP.
Novak, J.D. (1990). Concept mapping: a useful tool for science teaching. Journal ofReasearch in Science Teaching, 27(10), 937-951.
Olson, G.M. & Olson, J.S. (1991). User-centred design collaboration technology.Journal of Organisational Computing. 1 (1), 61-83.
Papert, S. (1980). Mindstorms: Children, Computers and Powerful Ideas. New York:Basic Books.
Papert, S. (1987). Microworlds: transforming education. in Lawler, R.W. & Yazdani,M. (Eds). Artificial intelligence and education volume one. Norwood: Ablex. pp54-95
Piaget, J. (1963). The Origins of Intelligence in Children. New York: W.W. Norton.
252

References
Pinker, S. (1994). The language instinct: how the mind creates language. New York:Morrow/viking.
Posner, M.I. & Snyder, C.R.R. (1975). Attention and cognitive control. In R.L.Solso (Ed.), Information Processing and cognition. Hillsdale, NJ: LEA.
Quinlan, M.R. (1968). Semantic memory. In M.L. Minsky (Ed.), Semanticinformation processing. Cambridge, MA: MIT Press.
Reason, J. T. (1979). Actions not as planned. In G. Underwood & R. Stevens (Eds),Aspects of Consciousness. London: Academic Press.
Reder, L. (1982). Elaborations: when do they help and when do they hurt? Text, 2,211-224.
Reiser, B.J., Anderson, J.R. and Farrell, R.G. (1985). Dynamic student modeling inan intelligent tutor for Lisp programming. Proceedings of the Ninth InternationalJoint Conference on Artificial Intelligence, Los Angeles, Morgan Kaufmann, LosAltos, California. pp 8-14.
Rosch, E. H. (1973). Natural Categories. Cognitive Psychology, 4, 328-350.
Rubinstein, M. F. (1975). Patterns of Problem Solving. Englewood Cliffs, NJ:Prentice Hall.
Rumelhart, D.E. & Norman, D.A. (1978). Accretion, tuning and restructuring: threemodes of learning. In J.W. Cotton & R.L. Klatzky (Eds) Semantic Factors inCognition. Hillsdale, NJ: LEA.
Rumelhart, D.E., Smolensky, P., Hinton, G. and McClelland, J. (1986). Schemataand sequential thought processes in PDP models. In J. McClelland & D.Rumelhart (als), Parallel distributed processing: explorations in themicrostructure of cognition, vol. 2. Cambridge MA: MIT Press/Bradford Books.pp 7-57.
Rundus, D. (1971). Analysis of rehearsal processes in free recall. Journal ofExperimental Psychology, 89, 68-77.
Ryle, G. (1949). Concept of the mind. London: Hutchinson.
Schank, P & Ramey, M. (1993). Can reasoning be taught? Educator. University ofBerkeley. vol. 7(1).
Schank, R.C. & Abelson, R. (1977). Scripts, Goals, Plans and Understanding: anEnquiry into Human Knowledge Structures. Hillsdale NJ: LEA.
Schank, R.C. (1982). Dynamic Memory. Cambridge New York: University Press.
Schank, R.C. (1986). Explanation Patterns: Understanding Mechanically andCreatively. Hillsdale, NJ: LEA.
SchOn, D,A. (1988). Educating the Reflective Practitioner, San Francisco: JosseyBass.
253

References
Schuler, W. & Smith, J. B. (1990). Author's Argumentation Assistant (AAA): ahypertext-based authoring tool for argumentative texts. In A. Rizk, N. Streitz &J. Andre, (Eds). Hypertext: Concepts, systems and applications. Proceedings ofthe European Conference on hypertext. IN'RIA, France, November. 1990Cambridge University Press.
Scott, P. (1993). Generating a hypermedia tutorial from a concept network. Presentedat CAL 93. University of York, April, 1993.
Self, J.A. (1988). Bypassing the intractable problem of student modelling.Proceedings of the 1st International Conference on Intelligent Tutoring Systems.Montreal, Canada, pp 18-24.
Shipman, F.M. & Marshall, C.C. (1993). Formality considered harmful: experiences,emerging themes and directions. Technical report CU-CS-948-93. Departmentof Computer Science, University of Colorado, Boulder.
Shuell, T.J. (1992). Designing instructional computing for meaningful learning. In P.Winne & M. Jones (Eds) Foundations and Frontiers in Instructional ComputingSystems. Berlin: Springer-Verlag.
Shum, S.J. & Hammond, N.V. (1994). Argumentation-based design rationale: whatuse at what cost?. International Journal of Human-Computer Studies. 40, 603-652
Shum, S.J. (1991). Cognitive Dimensions of Design Rationale, unpublished PhDthesis, University of York.
Simon, H.A. (1955). A behavioural model of rational choice. Quarterly Journal ofEconomics, 69, 268-288.
Simon, H.A. (1974). How big is a chunk? Science, 183, 482-488.
Singley, M.K. & Anderson, J.R. (1989). The Transfer of Cognitive Skill. HarvardUniversity Press, Cambridge, MA.
Skinner, B.F. (1968). The Technology of Teaching. Appleton-Century-Crofts, NewYork.
Smolensky, P., Fox, R., King, R. & Lewis, C. (1988). Computer-aided reasoneddiscourse, or how to argue with a computer. In R. Guindon (Ed.). CognitiveScience and Its Application to Human-Computer Interaction. pp 109-162. N.J.:Ablex, Norwood,
Sowa, J.F. (1984). Conceptual Structures: Information Processing in Mind andMachine. Reading, MA: Addison-Wesley.
Sternberg, R.J. (1987). Teaching intelligence: the application of cognitive psychologyto the improvement of intellectual skills. In R.J. Sternberg & J.B. Baron, (Eds)Teaching thinking skills: theory and practice. New York: Freeman. pp 182-218.
Stoylen, I.J.& Laberg, J.C. (1990). Anorexia nervosa and bulimia nervosa:perspectives on etiology and cognitive behaviour therapy. Acta PsychiatricaScandinavian Supplement, 82. 52-58.
Suchman, L.A. (1987). Plans and Situated Actions: The Problem of Human MachineCommunication. New York: CUP.
254

References
Sweller, J. & Cooper, G.A. (1985). The use of examples as a substitute for problemsolving in learning algebra. Cognition and Instruction, 2, 59-89.
Sweller, J., Mawer, R.F. & Ward, M.R. (1983). Development of expertise inmathematical problem solving. Journal of Experimental Psychology: General,112, 463-474.
Tennyson, R.D., Woolley, F.R. & Merrill, M.D. (1972). Exemplar and non-exemplarvariables which produce correct concept classification behaviour and specifiedclassification errors. Journal of Educational Psychology, 67, 852-859.
Thagard, P. (1992). Conceptual Revolutions. Princeton University Press.
Thomas, E.L. & Robinson, H.A. (1972). Improving reading in every class: asourcebook for teachers. Boston: Houghton Mifflin.
Tompsett, C.P. (1990). Contextual browsing within a hypermedia environmentunpublished paper. Kingston polytechnic.
Toulmin, S. (1958). The Uses of Argument. Cambridge: CUP.
Twidale, M.B. (1991). Cognitive agoraphobia and dilettantism: issues for reactivelearning environments. In L. Birnbaum (Ed.), Proceeding of the 1991International Conference on the Learning Sciences. Virginia: AACE.
Twidale, M.B., Rodden, T. & Sommerville, I. (1994). Investigating the use of acomputational tool to support the refinement of ideas. Computers and Education,vol. 22, No 1/2, 107-118.
Van Dijk, T. (1977). Text and context: explorations in the semantics and pragmatics ofdiscourse.. London: Longman.
Van Dijk, T. A. & Kintsch, W. (1983). Strategies of discourse comprehension. NewYork: Academic Press.
VanLehn, K. (1988). Towards a theory of impasse driven learning. In H. Mandl & A.Lesgold (Eds). Learning Issues for Intelligent Tutoring Systems. Berlin:Springer-Verlag. pp 18-41.
Vera, A.H. & Simon, H.A. (1993). Situated action: a symbolic interpretation.Cognitive Science, 17, 7-48.
Vygotsky, L. (1962). Language and Thought. Cambridge, MA: MIT Press.
Wainer, H. (1992). Understanding graphs and tables. Educational Researcher, Jan-Feb12-23.
Wandersee, J.H. (1990), Concept Mapping and the Cartography of Cognition. Journalof Research in Science Teaching, 27(10), 923-936.
Wason, P.C. & Shapiro, D. (1971). Natural and contrived experience in a reasoningproblem. Quarterly Journal of Experimental Psychology, 23, 63-71.
Wason, P.C. (1977). 'On the failure to eliminate hypotheses...' — a second look. InP.C. Wason & P.N. Johnson-Laird, (Eds) Thinking: Readings in cognitivescience. Cambridge University Press, Cambridge.
255

References
Wellington, D.B., Nissen, M.J. & Bullemer, P. (1989). On the development ofprocedural knowledge. Journal of Experimental Psychology: Learning, Memoryand Cognition, 15, 1047-1060.
Wenger, E. (1987). Artificial Intelligence and Tutoring Systems. Morgan Kaufmaninc. California.
White, B.Y. & Frederilcsen, J.R. (1990). Causal model progressions as a foundationfor intelligent learning environments. Artificial Intelligence, 42, 99-157.
White, B.Y. (1993). Intermediate abstractions and causal models: a microworld-basedapproach to science education. P. Brna, S. Ohlsson & H. Pain (Eds),Proceedings of Al-ED 93. pp 26-33.
Wright, P. (1991). Cognitive overheads and prostheses: some issues in evaluatinghypertexts. Hypertext '91: Third ACM conference on hypertext. New York:ACM Press.
Zadeh, L. (1965). Fuzzy sets. Information and Control ,8, 338-53.
Zellweger, P.T. (1989). Scripted documents: a hypermedia path mechanism. InHypertext '89. New York: ACM Press.
256

5tarting out
The first screen that you encounter is a startup screen bearing the title "Atomic Structure".
At the start up screen click the mouse anywhere on this screen. A screen calledintroduction should reveal itself, read this.
After you have finished go to the contents screen by selecting the "-- Next - 2 buttonnear the bottom right hand corner of the screen, you now should be on the contentsscreen.
Appendix 1
Appendix 1: instructions for study 1
Session 1: familiarisation with operations.
How to use these instructions
These sheets constitute a tutorial describing the basic features of the hypertext system
'Atomic structure' and are thus designed to be used whilst using the system. With this in
mind these instructions attempt both to describe the various features of the system and
give you a series of exercises to perform which should enable you to get a feel for the
various facilities available in the system. Thus exercises are denoted by boxed text,
whilst descriptions are left un-boxed. Y might therefore find it useful, at least in the early
stages, to stick as closely as possible to the exercises that are given; you will get a chance
to explore on your own later on in this session.
Using the contents facility
The box on the left contains four Topics, selecting one of these with the mouse brings up
the sub-topics relating to this chapter heading in the left hand box. Once displayed you
can go to any of these sub-topics by selecting them with the mouse.
Select one of the titles in the left hand Topics box, notice how it causes the listings inthe right hand box to change appropriately, try this a few times to get the feel for it.Select one of the names in the right hand "Sub-topics" box, when you reach therelevant screen return to the contents screen by selecting the light bulb icon on theright hand side of that screen The light bulb always takes you to the contents screen(this icon is known as a 'button 'see next section). When you get back to thecontents screen note that the topic that you selected is now italicised indicating thatyou have seen that particular topic (this happens whenever you first visit a screen).Try this a few times to get used to it.
257

Appendix 1
Within text links
Within this system there are objects known as buttons, these are parts of the screen that
are active, selecting one of these areas with a mouse click initiates a certain action. There
are a number of different buttons in this system which you will encounter in due course,
you have already encountered the light bulb button that returns you to the contents screen.
A type of button in this system is the cross reference button, these are located within the
text itself and are represented by Bold underlined text. These buttons denote cross
references that are related to the current topic in some way, selecting such a button takes
you to a screen of information that relates to the meaning of the text that you selected.
Select the Topic "Atomic structure" in the left hand box, this brings up a list of topicsabout the structure of the atom. Select the sub-topic "The electron". The screen thatyou arrive at contains words in Bold underlined text, if you move the mouse overthese then they blacken indicating that they are buttons. Select the text "Neutrons"by clicking on it, this should take you to a screen of information titled "The neutron".
Backtracking
So much for that, but it may also be necessary to backtrack through the screens that you
have seen already, such a facility is available. In the bottom right hand corner of every
text screen is a icon that is a sort of bent arrow icon with the word "Back" underneath it.
This button when selected with the mouse has the effect of taking you back to the last
screen that you saw, repeated selections of this button will take you back through all the
screen that you have seen previously in reverse chronological order.
Select the "Back' button at the bottom right of the screen. This should return you tothe screen entitled 'The electron"
Note buttons
Another type of textual button is the note button, this has the effect of showing a pop up
field with a brief note relating to the relevant piece of text, these buttons are represented
by bold underlined italicised text.
The screen that you are currently on (the electron) contains text of this sort, select thetext "ener2y" with the m use, hold the mouse button down to keep the notevisible, releasing the mouse button hides it again. Return to the contents page via thelight bulb icon., .-
The index
As well as the contents facility there is an alphabetically ordered index of key-words that
can be accessed fr m any screen in the system.
258

Appendix 1
From the current screen (Contents) select the button 'Index" on the right hand side ofthe screen. This takes you to the index screen containing a list of key-words. Selectone of the titles in the index box, this should take you to a screen of informationrelevant to the title. Try this a number of times to get a feel for the way it works.After you have finished go back to the contents screen.
Guided Tours
In the previous section you saw how different screens of information can be accessed in
three ways:
1. By accessing the material directly via the contents page using a list of titles;
2. By following within text cross reference links;
3. By using the alphabetically ordered index facility.
There is a further way of accessing material, the guided tour. Unlike the previous
methods which rely on your judgement to make decisions about where to go next, the
guided tour facility allows you to follow a linear sequence of screens rather in the manner
that you might follow the pages of a book.
Taking a tour
A tour can be taken from the contents page by selecting the "Take tour" button which is
located at the bottom of the right hand sub-topics box on the contents page.
Select the title "Radioactivity" (left hand title box), then select the "Take tour" buttonthis should take you to a screen titled "Tour on radioactivity". This contains a briefdescription of the information covered in the tour. Select the "-- Next --" button nearthe bottom right of the screen, repeat this procedure until tour reach a screen entitled"Radiation ha7ards".
Whilst in a tour the "-- Next --" button is used to move forward through the screens in the
tour.
During a tour all the other buttons mentioned previously are still available, selecting
within text links will take you to the appropriate screen as before. However, since
you are on a tour selecting any button that takes you to another screen other than the
"-- Next --" button will result in the tour being suspended until you wish to return to it.
Another important point is that "-- Next - 2 buttons only really make sense within the
confines of the tour, if you are outside the tour then all
"-- Next -2 buttons are hidden, being shown again once the tour is rejoined. Because of
this you must select the "rejoin tour" button to rejoin a tour! (see later).
259

Appendix 1
Another type of button that you may see outside a tour is the "-- More --" button, this
simply means that there is more information available on the same topic as the screen that
you are currently on.
From the screen entitled "Radiation hazards", select the text button "ionisation",this takes you to a screen on the topic of ionisation. Note that a button appears nearthe bottom right of the screen bearing the name "Rejoin tour" at any point afterleaving a tour it can be rejoined at the point that you left it by selecting this button.Select the rejoin tour button to take you back to "Radiation hazards" where you leftoff.
Ending a tour part-way through
Sometimes you may want to end a tour (as opposed to simply suspending a tour see
above) part-way though. On the right hand strip of buttons is a bus icon, when you are
in a tour it has a diagonal bar through it, selecting this allows you to end a tour.
From the screen you are at ("Radiation hazards") select the Bus icon, select "OK" onthe dialog box, the next dialog box asks whether you wish to go back to the contentsscreen or stay where you are, opt to remain where you are for the moment, byselecting "Remain".
Joining a tour from text screens
Sometimes you may wish to start a tour from a text screen rather than from the contents
screen. If you are not currently in a tour and you are on a screen that is part of a tour then
there should be a bus icon (no diagonal bar (see quick reference)).
From the screen now displayed ("Radiation hazards") select the bus button, note thatthe dialog allows you to carry on with the tour from the point that you are at, or go tothe beginning of the tour. Opt to continue.
Taking the option to start at the beginning, not surprisingly, takes you to the first screen
in the tour, as if you started from the contents screen.
Making notes
Within the system is a facility that allows you to create your own notes when you want
to.
From the screen you are currently at "Radiation hazards", select the note pad button(second from the top, right-hand strip). This brings up a dialog box asking whetheryou wish to access previously created note pad, or make a new one, for the momentdo not respond.
260

Appendix 1
Making new notes
Since you are a first timer opt to make a new one by selecting the "Create..." option.A new box appears asking you to name the note card, give it a name (normally youwill give it a name with some relevance to the notes that you wish to make for nowanything will do (names longer than "12" characters are automatically truncated).Click on "OK" if you have not already done so. A note pad with "Notes on<YOURNAME>" appears, click the mouse on the pad part of it and type away tomake notes. When you have finished click on the closebox (top left hand corner)) toet rid of the notepad.
Retrieving a previously made note pad
Select the note pad button again, this time opt for the "Existing" option. A window isbrought up that contains a small "page" icon with the name on the note pad youcreated underneath it, this icon 'contains' the note you just made, accessing it iscovered in the next section on the concept mapping tool.
The concept mapping tool
Accessing notes
Notes are stored in a window as page icons with the associated name underneath, as well
as accessing notes there are a number of other things that you can do with the page icons,
these will be covered later.
At the moment the K-Tool window should be open after following the last set of
instructions. The page icon in the centre of the window should bear the name that you
gave the note pad (or some truncated form of it). This icon is movable in a similar way to
the way that files, folders etc. are moveable in a standard Macintosh window.
Move the icon, put the mouse pointer over it, hold down the mouse button (the iconshould highlight black), then move the mouse pointer, still holding the button down,the icon should follow the movements of the mouse pointer. Release the mousebutton and the icon stays where you put it. Try dragging the icon to different part ofthe screen to get a feel for the way that it can be moved.
Accessing previously made notes via K-Tool
Highlight the icon by clicking on it with the mouse, then go to the button at thebottom of the K-Tool window named "Notes", select this with the mouse. Thenote that you made should now be brought up in a separate window, you can editthis or add more to it if you wish. To hide the window click in the close box (topleft hand corner) with the mouse or alternatively click on the screen (or screens)behind it with the mouse, this becomes active hiding the note pad window.
261

K-Tool
Notes I
Delete link Notes Delete concept Create Cancept SubMap"••• • ' s' . . . . .
Appendix 1
Creating concept icons and note cards with K-Tool
As well as creating note pads via the main screens of the hypertext document you can also
create them via the concept mapping tool.
Click on the button named "Create icon..." at the bottom of the K-Tool window,type a name different to the one you used previously into the dialog box as you didwhen creating the note card, click "OK", then wait. An icon bearing the name yougave it (or a truncated form of it) should appear in the centre of the window, a notepad can be accessed from this as before.
Linking icons together.
The icons in the concept map window in addition to being used as a means to access and
create note cards can also be linked together as a means for noting the relationships
between the concepts that you see in the hypertext database. You have seen that the icons
can be dragged around in the manner of standard Macintosh icons, but they can also be
linked together to form a conceptual map of the domain.
Figure 1 linking icons together in the concept mapping window
Select the button named "Link" at the bottom of the concept map window, (it shouldremain highlighted in black when you do this). Move the mouse pointer to one of thetwo icon currently in the window, hold the mouse button down and drag from thelocation of this icon to the other icon, then release the mouse button. A dialog boxwill then ask you if you wish to name the link, select "Yes" type in a name and clickon "OK". A line should now be seen linking the two concepts together with the nameyou gave it (or a truncated form) on it.
262

Bookmark button(in unset position)
Go to bookmark button
Appendix 1
Deleting links
Deleting links follows a similar to the process of drawing links.
Select the 'Delete link' button (it remains highlighted), position the mouse pointerover the start of the to-be-deleted link, hold down the mouse button and then drag thepointer over the link, the mouse pointer should change to a square the link shoulddelete as you do this.
Other operations
Other operations can be performed using the concept mapping tool, all follow a similar
pattern to the ones above and will not be covered here.
Bookmarks
The bookmark facility allows you to mark a particular screen of information that you
consider to be important in some way and may wish to return to it in the future.
Figure 2. bookmark in unset position
263

Bookmark button(in set position)
Go to bookmark button
Appendix 1
Figure 3: bookmark in set position
Close the concept mapping tool window and any open notepads. Go to any card inthe system via the contents screen, set the bookmark by selecting the exclamationmark button (a cross means that a bookmark for that card is already set see (figures 2and 3), the button changes to a cross to show that the bookmark has been set (seefigure 3). The name of this screen is then placed on a list of names on anotherscreen, to view this list select the 'go to bookmark button' (see diagram). The listthat you see should contain the card that you have just left, go to it by selecting itsname in the list. Once you have returned to the card remove the bookmark byselecting the cross icon, if you go to the bookmark list again (the same procedure) thename of the screen should have been removed.
'Return to the contents page and wait for the next set of instructions...
264

Appendix 1
Session 1 - Parts 2 & 3
Task
Your task is to find information relating to the following:
1. The properties of the electron,2. How radiation is measured,3. How the Thompson atomic model differs from the Rutherford atomic model:what evidence led to the adoption of the Rutherford model.
To find the information you can use any means that is at your disposal, but note that
some of the information in the system is more relevant to the task in hand than other
information. You may therefore find it necessary to spend more time on material that you
feel is relevant, and less (or perhaps none) on that which you feel is less so. Be
selective, but make these decisions with your partner.
Feel free to ask questions, at any point.
Remember...
The system has been designed with a number of facilities to aid you in our task, it may be v
reminding you of these.
Guided tours - allow you to follow linear sequences of information.
Contents- allows you to straight to material that you feel is relevant.
Hypertext links (bold text) - allow you to go to cross references within the text itself.
Bookmarks - allow you to mark material that you think particularly important and/or mathat you wish to return to.
Index - an alphabetically ordered list of key-words.
Note tool - allows you to make on screen notes.
Concept mapping tool - Can be used to access notes and as a means for depictingbetween pieces of information that you feel are connected.
265

Appendix 1
Session 2
Introduction
Previously you saw a hypertext system containing information relating to the atom. In
this part of the experiment you will use a similar system on as different subject matter.
All the facilities that you used previously are available on this system including guided
tours, hypertext links, bookmarks, concept mapping and note tools, etc. etc. If you have
not used any of these facilities before say so before the session begins.
The system that you are to use contains information on a historic monument; the stone
circle at Callanish in the Outer Hebrides. The material covers the structure of this stone
circle; theories of why it was built; the people who built it and other related information.
Your task is to use the material in the system to learn about certain aspects of the
Callanish stone circle, specified below.
Study task
Find out about some of the theories relating to the purpose of Callanish, payparticular attention to the relationship between these theories and the overaff structureof the monument.
At the end of the session you will be presented with a few questions that relate to the
above, these will be answered without notes. After this session you will be required to
give a brief summary of the material that you have seen, for this you will be allowed to
use any notes that you have made.
Finding information-
To find the information you can use any means that is at your disposal, but note that
some of the information in the system is more relevant to the task in hand than other
information. You may therefore find it necessary to spend more time on material that you
feel is relevant, and less (or perhaps none) on that which you feel is less so.
Feel free to ask question when you feel it is necessary.
266

Appendix 1
Remember...
The system has been designed with a number of facilities to aid you in our task, it may be
worth reminding you of these.
Guided tours - allow you to follow linear sequences of information.
Contents- allows you to straight to material that you feel is relevant.
Hypertext links (bold text) - allow you to go to cross references within the textitself.
Bookmarks - allow you to mark material that you think particularly important and/ormaterial that you wish to return to.
Index - an alphabetically ordered list of key-words.
Note tool - allows you to make on screen notes.
Concept mapping tool z Can be used to access notes and as a means for depictinglinks between pieces of information that you feel aie connected.
If you have any problems, do not hesitate to ask the experimenter.
267

Appendix 1
Questions
Below are a number of questions relating to the information contained in the system that
you just used. Due to the nature of the system and time constraints it is entirely possible
that you missed some of the information required by one or more of the questions; do not
worry about this and do not be afraid to guess.
1. What artefacts denoted by the names:
a) CaBanish main site,
b) Callanish complex?
2. Why is it difficult to find alignments between Callanish and stars today?
3. 'It is as likely that potential alignments have been ignored as it is that hypothesised
alignments are spurious.' Why might this be?
4. Despite being cross shaped, the Callanish main site is not of Christian origin, why
not?
5. Draw a rough sketch of the Callanish main site, indicating the main features.
6. The builders of CaHanish must have been less primitive than we generally assume,
(briefly) give reasons in support of this statement.
7. Give some reasons as to why no dwelling places of comparable age have been found
near to Callanish?
8. How tall and how heavy is the central menhir?
9. Roughly how big is the stone circle itself?
10. Approximately when was Callanish constructed?
11. There is a theory that unlike today stone age and bronze age man divided the year up
into three seasons. Based on the information that you have seen in the system, which
points of the year do you think would signify the onset of these seasons and where
would these seasons fall? Give reasons for you choices.
268

Select the 'Note' tool from the tools palette by clicking on it with the mouse, thecursor should now adopt the same appearance as the Note icon, if it doesn't tryagain. Without touching the mouse button, move the mouse so that the cursor ispositioned somewhere in the Q-Tool work-space, click the mouse button to create
269
Appendix 2
Appendix 2: instructions for study 2
[Same instructions for hypertext system as for Study 1]
Q-Tool: a concept mapping tool.Q-Tool is an application known as a concept mapping tool, this allows you to represent
the key concepts of the domain graphically by creating small 'page' icons and linking
them together to show how the domain concepts relate to each other. These icons
created using Q-Tool can contain text that are accessed by a clicking on the icon with the
mouse, thus the tool provides you with a way of organising and structuring your notes.
In addition to allowing the creation of 'note' icons Q-Tool can also be used to aid the
learning processes in other ways by provision of features such as the 'question' and
'answer' facilities. The purpose of these is to encourage the learner (you) to explore the
material in a more efficient Way
• Q-Tool U. 2.0 =
— Question tool: allows the creation of a 'question icon.
I
Different node icons
/
Answer
CI
Notes
<>Question
I I
E-i _ Note tool: allows the creation of a 'notes' icon.
s",
' the 'answer'Answer tool: allows creation of an icon.
— Link tool: allows pairs of concepts to be linked together
LICA — Unlink tool: removes links between any two linked icons
n_ Move tool: permits icons to be moved around the screen_
-5 Delete— tool: deletes selected icon.
A — Rename tool: allows the name of icons to be changed.
Magnify tool: allow' s you to make text boxes larger
I
Tools paletteI
Screen objects
Figure 1: overview of the features of Q-Tool

the icon. In response to the dialog box give the icon a name* . When the icon iscreated try each of the following procedures:
1. Moving the icon - click on the 'hand' icon (fourth from the bottom in onthe tools palette), the cursor should become an open hand, position this over theicon, hold down the mouse button, wait until the icon highlights in black, thenmove the mouse, still holding down the button, the icon should follow the mousepointer, to release the icon let go of the mouse button.
2. Renaming the icon - click the rename button (the 'A' button, second tobottom in the tools palette), the cursor should change to a letter 'A'. Click thisover the icon, it should flash. Give the button another name via the dialog box,click 'OK', the button should now have its new name. Note clicking 'Cancel'returns the name to its original.
3. Deleting the icon - click at the 'Dustbin' icon (second from the bottom onthe tools palette), click this over the icon to delete it, respond to the dialog box bychoosing 'Cancel' to cancel the operation (or else the icon will be lost, if thishappens create a new one as before).
4. Show and edit the text box - With no other tools active, click on theicon, a box 'pops up' next to it. Type some text into the text box then close thetext box either by hitting the enter key on the keyboard (extreme right), or byclicking over the icon itself.
5. Making the text box larger - open up a text box, click on the magnifyingglass icon, click this over the open text box. This will give you a larger text boxthat makes reading and typing easier. Hide this text box by clicking on the 'OK'button, or press <ENTER> whilst the cursor is in the text box.
Note - When the text box is open, the corresponding icon cannot be moved,alwaysclose the text box before attempting to move............. .
N.B. If you mistakenly choose a tool, you can cancel it by moving the cursorto the tools palette and clicking the mouse button.
Appendix 2
Linking icons togetherIcons of all different types (see above) can be linked together, and these links can be
named the following exercise shows you how to link two icons together.
Create another 'Note' icon as before, drag it using the 'Move' tool so that it issome distance from the first icon that you have created. Click on the 'Link tool'(the cross shaped icon), the cursor should change to a cross shape. Position thecursor over one of the icons and click the mouse button once, the icon shouldflash in acknowledgement, move the cursor so it is over the other icon and clickonce again. A dialog box will now ask you to name this link (the default is
* Note: when giving icons names, two rules of thumb apply in all cases 1. the shorter the better,names should be long enough to be identifiable and meaningful, but not so long as they clutter up thescreen (12 characters including spaces is a good upper limit); 2. give each icon a unique name whereappropriate so to avoid confusing it with others.
270

Drag one of the icons away from the end of the link using the 'Move' tool asbefore, note that the link(s) move accordingly.
Select the unlink tool (fifth from the top in the tools palette), then click over thetow icons that are joined by the link these should flash accordingly,. the link
, should then disappear.
Appendix 2
I 'untitled') type a name in, and select 'OK', the icons should now be linked'I together.
Re-naming a linkRenaming a link is the same as renaming an icon above.
Select the 'Rename' icon from the tools palette, the cursor should change to acapital letter 'A'. Click on the name of the link that you made previously (thismay be a bit tricky if the name is short.)
Moving and deleting linksFirst of all note that the links are flexible, moving a linked icon results in the appropriate
links re-aligning themselves.
The two buttons in the tools palette that you have not yet used are the 'Answer' button
that looks like a light-bulb, and the 'Question' icon in the form of a letter 'Q' (see
diagram). These operate in exactly the same way as the 'Note' icon that you've just
created, apart from the having a different appearance, the reason for them having
different appearances will be explained later.
271

What are the principlecomponents of the atom, andwhat are the properties ofthese?
Appendix 2
Using 0-Tool
Step 1: formulating questions
Question icons are designed to allow you to type in questions that you feel need
answering, and can be used to remind you of what you should be looking for whilst
browsing the material (see Figure 2)
Figure 2: the top level question.
In Figure 2 a question has been formulated that relates to what the learner is primarily
interested in - the components of the atom, this can be referred to in order to stop the
leaner from digressing too far into irrelevant material.
At this point the Q-Tool work-space contain 1 icon, a question icon, the purpose of this
is to allow you to type in a question to help you to keep to the subject in hand and not
deviate too far off course when reading the material.
In the above example the question posed was before the material was looked at, just a
cursory glance at the material, for example looking at topic headings can lead to insight
into the way that the material is structured within the system and hence to more specific
and tractable questions. An example of this is show in Figure 3
In Figure 3 the learner has looked at the way that the material is structured and
formulated a more specific question, answering this question can be seen as a sub-goal
to the original question. The learner has split the question into more than one sub-
component (another sub-component of the top level question may be "What are the
properties of the atomic components")
272

What are the principlecomponents of the atom, andwhat are the properties ofthese?
The electron is a negativelycharged particle that orbits
the nucleus.
Appendix 2
Figure 3: a second order question or sub-goal (components).
Step 2: selecting relevant materialOnce the learner has decided on some broad questions to answer, these can be used to
guide the search as an aid to decide which material is relevant. Note icons (see Figure 1)
can be used to represent key domain concepts, and detailed notes can be typed into the
text box of this icon. Notes icons then are designed to be used as ways of representing
the material contained within the system unlike the question icons that are used as an aid
to the selection of appropriate material. In Figure 4 below it can be seen that a notes
icon has been used to provide a brief summary of the properties of the electron, thus
fitting in part of the jigsaw set up in the top level question (see Figure 2). Many
different notes icons may be used, the idea being that the learner creates as many as they
need to cover the relevant material.
Figure 4: a brief note on the electron in a 'note' icon.
I
Create a 'Notes' icon (same as creating a question icon only use the notesbutton). Move it (using the move hand) so it is some distance from the singlequestion icon that should still be present. Open up the text box, type some text
273

Appendix 2
into it (nonsense will do at this point), close the text box using <Enter-key> or by'selecting the icon.
Step 3: organising the materialOnce the learner has collected all the material that appears to be relevant to the study goal
as referred to in the top level question, the process of organising the notes and questions
can begin. The purpose of this is two-fold, firstly to produce an overview of the
various inter-relationships of the material in the domain, and secondly in order to see if
the notes adequately answer the top level question and hence realise the study goal.
There are two parts to the process of organising the material, structuring and question
answering.
Structuring the material
Structuring involves linking together the 'notes' icons to form a network that depicts the
way that the various concepts relate to one another.
Figure 5 shows a simple example of a concept map in the domain of introductory
particle physics, the way in which the various components of the atom relate to each
other can be seen.
, Q-Tool U. 2.0 .
<L>_
.-----41
a-------
Coerponent The electron/
The atom., Orbits
Conponent
ComponentThe nucleus
\ The neutron
Conponent
The proton
0
cal
n12
n •
Figure 5: organising notes based on structure of domain concepts.
Question answering
In addition to allowing the learner to organise their notes by graphically representing the
relationships between concepts, Q-Tool can also be to aid the learning process by
274

Appendix 2
ensuring that the objectives (i.e. the study goals) are fully addressed, this involves the
use of 'answer' icons. 'Answer' icons bridge the gap between the questions that were
generated in step 1 and the notes/icons that were generated in step 2.
Em '- 0 Tool U. 2.0 E
What areatom?
the components of the M.
dThe
r OM ,41.
components of the atom arethe proton and the neutron whichform the nucleus, and theelectron which orbits thenucleus.
—
c83•:;filiptut 0 .E!
VI)',Rs.
)2::------
zrTUelectron
Orbi&The atom.,' ACornponent
TT Component ____0The nucleus
\The neutron
n ! ' Cotrponent•I i • f
I . :, 12 2 !
,
ii i I! iThe proton
" 1 • i '
Figure 6: answering the 'top level' question based on concept map made.
Figure 6 show that the note in the text box of the 'answer' icon entitled 'Structure'
summarises the network to its left in such a way as to answer the sub-goal question
relating to the components of the atom (see Figure 3). The learner is therefore forced by
the nature of the task to ensure that they have enough information to answer the
questions that they formulated in step 1, and in attempting to answer the questions
directs the search for relevant material, forces them to think about the relevance of
material and gets them to process the material in a more active way.
Select 'The Atom' by clicking on the open window, then return to the contentspage an wait for the next set of instructions...
275

It it is not already active, click on the 'Atom' window to make it so, you shouldstill be on the 'Contents' screen.
Access any material that you feel is relevant to your study goal, make notes onany material that seems relevant using the note facility in the Q-Tool window.
When you fell that you have covered enough information to adequately addressthe goal, this session is at an end.
Appendix 2
Practice session
In the following instructions you will find out some information about the atom using
both the atom hypertext system for access of information and Q-Tool in order to make
notes on the material that you have found. You will do this by following the
instructions below.
Study goal
Find out the properties of the alpha particle and the various ways in which they are
measured.
This session involves you accessing material that is relevant to your study goal and
making notes on them..
276

. ---- North avenue (1) 19 stones (1)North
7.NSouth row (1) 5 stones (1)
East row (1) 5 stones (1)
Central menhir (1)
. • • •• •
Appendix 2
Questions for session 2
The following questions relate to the material that you have covered in the system
although some of the questions will relate to material from several screens, if you feel
that you didn't cover the material that relates to a question, have a think, it may be one
of these questions. If you guess the answer to a question (educated or otherwise), or
answer from background knowledge (i.e.. information that you didn't get from the
system), then note this after the question. [Answers and marks are given in
italics]
Answer in as much detail as you can.
1. Draw as accurately as you can the layout of the Callanish main site, show on
your diagram the orientation of the site to North.
•/Stone circle (1)
West row (1) 4 stones (1)
Burial chamber (1)Two chambers (1)
12 marks in total, see diagram
2. What comprises the feature called the Callanish complex?
Three stone rows ( I ), North avenue (1), Stone circle (1), burial chamber (1), cnoc an
tursa (1), ceann hulavig (1), CilDC cul a chleit (1). 7 marks in total.
3. What is the height and weight of the central Menhir?
277

Appendix 2
15.6 feet (4.75 meters) tall; 5 tonnes. (2 marks).
4. Who built the stone monument at Callanish?
Iron or bronze age people (1 mark).
5. Approximately when was Callanish built?
Approx. 1500 BC (I mark)
6. How has dowsing been utilised in the exploration of stone circles?
Mystical connections with ley-lines. (1)
7. What is the diameter of the stone circle?
11-13 metres (2)
8. What astronomical alignments are there with:
a. The central menhir?
Solar alignment with cnoc an tursa points north, also used as clock (2)
b. The north avenue?
Aligns with Clisham to show southern maximum (2)
9. What other alignments are there in the main site?
North avenue and capella (north in the old days) (2)
Ceann hulavig to main sight, midsununer sunrise (summer solstice) (2)
10. Where does the name "Callanish" come from?
Kjallari = "cellar", Ness = Headland both from the Norse (2)
11. Why wasn't the pole star the pole star when Callanish was built?
Pole star was not north this was served by the star capella. (2).
12. Of what type of rock is Callanish, and where was it obtained?
278

Appendix 2
Lewissian gneiss from Loch Baravat (2).
13. What makes us think that the so-called burial chamber served this purpose?
Contained human remains (1) similar structure to other burial chambers (2).
14. What purposes have been put forward to explain the existence of the central
Menhir?
Astronomical alignments, phallic symbolism. (2).
15. What is a dolmen?
Stone structure consisting of uprights and a flat roof (like a table) (1).
16. What role did the druids play in the history of stone circles such as Callanish?
None (1).
279

consists of
th;Complex77. part of \
part of part of
----theMainSitea cornoonent
a cornoonent ofa ccvnoonent of
CeannHulauig
NorthAuenue
theCentralMenhi r side
OriginsQburial Chamber
ainQueAtionA?:
main Answer
ContentsA
OtOriginsA
,.,Purposessuch as
built by
theBuilders used for
Align M ents
theRowsContents()
CnocCulaChleit
Callanish
ClockCompass
Appendix 2
KNOWLEDGE MAPS
Maps from augmented knowledge mapping tools
0
theStoneCircle
e.g. —Question
Uses
menhirs
Types of monument Example
I% of monuMentI e.g.
\t]Dolmens
/groups Use
Exany2e
central menhir
UsessUses Main circle
Use North auenUe
Use
Exarnp7e
Burial chambe
Types of monument
religion
i)n)
Uses
ase.9. e.g.
Lunar obseruation
280

burial
sec 7
stone circle
sec 6
STONES ORIGIN (--SEC 5
TYPES OF
A
Appendix 2
estion D
estion c
A
answer
answer
answer •nonumentr
possible functions
evidence
11:1intro
SEC
BU ILDERS 1
SEC 2
(14_DER 2SEC 3'
MI GRANT1
SEC 4
dsa
281

other reasons
but...uses-menhir
olstice alignments
and
allanish
usesI(vssibilties
nnerikilikjespossibilities
equinox augmentsuses
or none
Burial ifj,. later --a/ druids \,.. Uikings
i
Eiaterpart n contempt/Auntie
rel. s
reli9ous/
later
Question
--9:Components components
answer__47
TIJP ( specifType
Usesreli9ous
Dwelling
./lunarastral as eror,
Cup
fertilitysymbol
mainsite
Part extraEuidence
nightsky equinoxastron
astron
Appendix 2
components
make-up
Par t5 —El- parts 1– parts –CIeneal info_
'main circle menhir burial chambermake-v rp..tke-uo parts
18.6 years 7 physical properties sizes of stones
components
other bits
part
part-0Rows
Pillar
Euidence
solar
S tronastron
solstice
Complex
others
282

1:13
A
fo.
Too_leuel questionsub-quest. sub-quest.
c8;11) Sub-question 1
addresses
__EI__ predicts --iflSolstice
_,.........___A2i9nments—North avenue
Astronomy MignmenegPredicts
E/W/S RowsEquinox
Answer (function)
UntitledA
central menhir
Ceann hulauig
sub-question 2
Untitled Untitled
original q.Untitled Untitled
Untitled Untitled
uses of sites
allanish
surrounding sites
UntitledMain site
Ni Untitled
UntitledCnoc cul a chleit
untitled
burial stone
standing stone
illanish
ntitleduse:
Untitled
Untit7ed
evidence
Untitled
religious
Untitled
11-1as
Appendix 2
Maps from knowledge mapping tools
283

Burial Chamber
NorthAuenue
MainSitC\s,.,„
Iconlorises conloris,c9frPrises "'II-Prises
conprises
OutlgingSites
A
Other rows Stone circle
burial chamber
funchons of cananish
structure of callanish 2 4:1
structure of cananish 3
Näeast west and south rows
one circle
Appendix 2
cs3Introduction
CategoriesofMonument
CentralMenhir
cs2nents of callanishIN
e of callanish
A
I rt
funchons of callanish 2
the central menhir
astronomical links
284

Appendix 2
0Stone Circlesi en
Graves? Dolems
Roofed Graves
Use of?
Use.of -- Burial chamber
Clallanish Predicts
Predicts
Use (NOT 0 Same sites Equinoxes
SolisticeAstro Dodgy link
MysticismReligion
oon and..
types of stone name denyastronomy —CI
ask priests obs sites
0 sun
moon
origins of stones
/circieconstruction
menhir n avenue
construction bulders
burial chamber
e.u.) slowsmystic
285

East, west, south rows North avenue explanatiol
Mptical aspects\
Mystic Mysticism
Dowsing
Leg lines
siynificancealignmentsrows
augmentsA
Appendix 2
CID
A
What is Callum's!! f2-Plain items_. Contents of circle
ExPlanati°Standing stonet.flainki er\ms Stone circle ,..Contenes of circ2e Standing stone emplanatil
\ Contents of circle( % ExplanationContents of circle Burial chambei
VXZ
Main items Function
North avenueBurial chamber explanation'i 6 \
oc cul a Chleit"Function
Function
07.7.
Christianitg
rr Details
Left ouers
cliCeann hulauig
Function .Funodon Untitled
F1stronomg
we,ails Details
Astronorng priests Alignments
Calnorth
main componentssiynificance
s tone, circle
encloses the
burial chamber
286

life fa 3
0.Locatior.Migrant settlers Life 20008c Usage (Prie ;
\4
5
A
:•:•:•:•:•:.
:.::.::::•::: :•:.:•:::•
•:•:•:•:.:
• : : • : ::•:::::•:.
• ' • ' ••••••••••••" " ' •" • • "• • • • •• • • • •... • .• • • • • •• •
Builders
conronentsintro \ introintro intro --"'"fl
whotgpes of mon. name
origins and componenets
aornoonents carrPoPents
rEa
UZI
stone circle-structureali9nment and structure
astro aligm
/I\a7i9nment and atructurealignrne,
burial chamber
A
Appendix 2
use
north auenue eiwis rows
287

Appendix 3
Appendix 3.. instructions and marking schemes forChapter II
INSTRUCTIONS FOR USING AKA
INTRODUCTION
AKA is a graphically-based tool for helping you to represent argument. It does this by
allowing you to construct argumentation networks which are built from a small number
of elements put together in accordance with particular syntactic rules. AKA therefore has
a language associated with it, albeit a very restricted one.
Central to AKA are the different node types and permitted relationships, these are
outlined below together with some rationale for their use.
A theory is a coherent set of claims about the world, put together in a systematic way.
Theories are normally backed up by a lot of evidence, or used to explain certain
phenomena. For example Einstein's relativity is a good example of a theory.
A hypothesis is a specific claim about the world that has been specifically designed to be
testable empirically, via experiments of observations.
Claim This is some assertion about a phenomenon that is held by a person, or a set of
people. Claims may be accepted or rejected for a number of reasons, experimental or
observational evidence may support of refute claims, additionally other claims can
support or contradict claims.
Evidence As has been alluded, evidence is information that can support or contradict
some assertion such as a hypothesis, theory or claim. Evidence can be experimental, or
observational; there is no distinction made in AKA between the two.
Critiques Often statements that cast doubt on the validity of claims and/or evidence are
made that are not strictly speaking pieces of evidence themselves. Such statements may
criticise experimental methodology, or some philosophical standpoint embodied in a
claim. In order to represent this AKA has critique nodes that can be used to represent
such objections.
Assumptions Often theories claims and evidence make certain assumptions in order for
them to be true. For example the philosophical assumption that human intelligence can be
288

RICA - Directiol
Creates different types of node
Deletes nodes and relations
Allows nodes to be linked
I Renames no-des and changes types (where permissable).
Flashes nodes of a certain type
Balloon help facility
=I
Appendix 3
simulated on a computer assumes that computers and the brain are functionally similar in
some way because they are both symbol processors. Assumptions are really arguments
in their own right, consisting of claims supported by evidence, and perhaps based on
assumptions of their own. However in many arguments we may be prepared to accept
certain assumptions on face value, without going into a systematic analysis of their make
up, but still be aware that they exist and play a role in the argument.
A phenomenon is some observation that in the world that needs to be explained. For
example auditory hallucinations is a phenomena (also a symptom) of schizophrenia.
Claims and theories are often created to explain specific phenomena.
Questions, these generally define the purpose of the argument in terms of its content:
what should and, crucially, what should not be included in the argument. A question
asking "What is Marx's economic theory?" will require not only an exposition of Marxist
theory, but also perhaps a discussion of how Marx flew in the face of previous
interpretations of economics. Often question will need sub-questions; for example in the
above example a sub-question; "What was the prevailing economic theory" will need to
be addressed before the top level question can be addressed adequately.
Sometimes you may find that you need to use some other form of node, the WildCard
option allows you to do this. WildCard nodes can have any type that you wish to give
them, and can have any relationship with other nodes, they are denoted by italicised text
to distinguish them from other nodes.
Overview of the different types of buttons on the tools palette.
Creating nodes
Nodes are created by using the topmost button on the tools palette, selecting this button
brings up a pop-up menu that lists the different types of nodes that you can create,
selecting one of these options can allow you to create an icon of the corresponding type.
289

Appendix 3
Hold the mouse down over the create node button, notice the menu that pops up. Still
holding the mouse button down drag it over the menu options until the 'Claim' option is
highlighted in black, then release the mouse button, notice that the pointer changes to a
small rectangle. Move the pointer so that it is somewhere in the work-space. Click the
mouse button once. Respond to the dialogue box by typing in a name (anything) and
clicking on the "OK" button with the mouse. After a few seconds a claim node should be
created of the type you selected, with the name you gave it, in the place on the screen
where you clicked the mouse.
Then create some more nodes as before.
Click over the "create argument" button, select "Evidence" from the pop-up menu; create
a node giving it a name as before. Then create another "Evidence" node.
You should now have three nodes a claim and two evidence nodes.
Moving nodes .
Nodes can be moved around the workspace, by dragging them with the mouse.
Move the mouse pointer so that it is over one of the nodes that you created. Notice that
the mouse pointer changes to an open hand. Whilst the pointer is over the node click the
mouse button and hold it down, the pointer should then change to a closed hand. Still
keeping the mouse button held down move the mouse around, notice that an outline of
the node is dragged around the screen, place this rectangle somewhere in the workspace
and release the mouse button, the node should then be moved to this place.
Linking nodes together
The nodes that you just created can be linked together in order to represent arguments.
For example imagine 'that the claim that you created made some assertion about the
acquisition of language, such as "Language constrains thought", we may seek evidence
in order to decide whether this assertion is plausible, relevant evidence may either support
of contradict this position.
Suppose that we find a tribe of people who only have two colour names, red and green,
and that they see all other colours as shades of red of green, such that blue is dark green
and black is dark red. We may put this forward as evidence in support of the claim
above. This can be represented by linking and evidence node to the claim node by the
relation "supports".
290

Appendix 3
Click over the link button (third from the top in the tools palette). Hold the mouse
button down over the "Evidence" node, notice that the cursor changes to an arrowed
cross, and drag the mouse, still holding the mouse-button down, until the pointer is over
the "Claim" node, then release the mouse button. The system will ask you to choose the
type of relationship that you want between these two nodes, choose 'supports', then
select 'OK'. After a few seconds a link will be drawn between the two nodes with the
relationship that you specified between them, and an arrow showing the direction of the
relationship.
Note that the direction in which you drag the mouse when linking is vitally important, the
arrow will always point in the direction that you drag.
Checking for directionality
If the networks get very tangled you may find that it is difficult to determine the
directionality of a link purely from the arrows on the lines, to remedy this you can check
the direction by double-clicking over a link name with the mouse pointer, this causes the
linked objects to flash in the direction of the link.
Place the mouse pointer over the link name that connects the evidence and claim nodes,
and click the mouse button twice in rapid succession. The two linked nodes should flash
in the direction of the link. Demonstrating that the Evidence either supports or contradicts
the Claim - not the other way round.
Restrictions placed on linking
Because AKA is designed to help you represent argument, there are restrictions placed on
what nodes can be linked together and the types of relations that can exist between nodes.
Thus in this system evidence can only support or contradict claims, critiques and
assumptions, it cannot say anything about other evidence.
Balloon help can be of use here, with balloon help switched on moving the mouse pointer
over any of the nodes will give you information about what any of the nodes can be
linked to, with the relations that can hold.
Click over the balloon help button (the small speech bubble in the tools palette). The icon
should change to a speech bubble with a cross showing that it is active. Place the mouse
pointer over any of the nodes on the workspace a bubble should appear informing you
what the node can be linked to. When you have finished, turn balloon help off by
clicking over the button again.
291

EvidenceEvidence 2
Node type
Node name
Sqoports
EvidenceEvidence 1
Type text in here...
ContradkesRelation type
Scroll bars
Resize box
Pop-up text field
Appendix 3
Changing the name and type of nodes
The name of any node can be changed at any time, however there are limitations on
changing node types. A type is a category of node that denotes the role that the
information plays in the network, for example 'evidence'; a name is an identifier to some
information, for example 'my evidence' (see diagram below). Since there are restrictions
placed on the relationships that nodes can have with each other, the types of nodes can
only be changed to other types that would not contravene the linking rules. Thus in the
diagram below the type of the evidence node 'Evidence l' could only be changed to a
type that can be linked to a claim using the 'supports' relation; in this case it could be
changed to another claim node, because a claim can support another claim. Note that
WildCard nodes (italicised text) can always have their types changed.
Diagram showing the some of the features of a network.
Try this, choose the 'Change Type' option via the 'Rename button', and click on the
evidence node that you created, assuming that it is still linked to the claim node, the
system should permit you to change this to a claim. Cancel the dialog box and then try to
rename the claim in the same way as before. Notice that you cannot change the type of
this at all since evidence cannot support evidence in the scheme.
Nodes that are not linked to other nodes can have their type changed to any other type
since this cannot contravene any of the rules of the system. Thus if you wish to change
the type of a node you can do it by deleting its links and changing its type.
292

Appendix 3
Select the change type option from the menu as before. This time click over the unlinked
Evidence node. Notice that because this is unlinked you can its type to any other type
available.
Changing the name of a node is similar to the above.
Select "Change name" menu option from the rename button. Click over one of the nodes
that you have, the system should prompt you for a name. Enter a new name into the
dialog box and click "OK"; the node should now have a new name.
ADDING STRENGTH TO LINKS
All links are created of equal strength, sometimes you may wish to show that a link is
particularly strong or weak. You can choose how strong a link is by selecting the link
name with the mouse.
Click over a link name with the nwuse and hold the mouse button down (if there are no
links, create one). A pop-up menu should appear, Still holding the button down, move
the mouse so that the word "Weakly" is highlighted in black, release the mouse button.
After a few seconds the link should change in thickness showing that it is a weaker
relation than it was before.
The same can be done to indicate stronger relationships, this time by selecting "Strongly"
from the menu.
DELETING NODES AND LINKS
Both nodes and links can be deleted in the same way; using the delete tool: the dustbin
button on the tools palette.
Click over the delete button with the mouse; notice that the cursor changes to a dustbin
icon. Position this over the relation name of the link that you have created, click the
mouse button once. The relation name should flash to show that it has been selected.
Now select "OK" in response to the dialog box. After a few seconds the link should
disappear.
Now select the delete button again. This time click the cursor over one of the nodes.
Notice that as before the name flashes to show that it has been selected. This time select
the option "Cancel" at the dialog box This cancels the procedure and no deletion is done
selecting "OK" would have resulted in the node being deleted.
293

Appendix 3
DEALING WITH TEXT FIELDS
Each concept node contains a text-field, which are accessed by double-clicking with the
mouse.
Hold the mouse-pointer over the node, and click the mouse button twice in quick
succession, the text-field should appear just below the node. When a text-field is first
opened it puts the text cursor at the end of any text that the field contains, so that you
simply need to type to add notes at the end of the existing notes. However if you click
anywhere else on the screen (for example to open another field up) then you will need to
place the text cursor back in the field, to do this simply position the mouse over the field
and click the mouse button, the flashing cursor indicates that you can now type in text.
OTHER NODES
Of course, not everything that you may wish to include in your network will be part of an
argument; some information may just offer additional information to the reader, and so
forth. This is where WildCard nodes really come into their own as they can stand for
anything that you want them to, and can be linked to any other node with any name that
you wish to give.
294
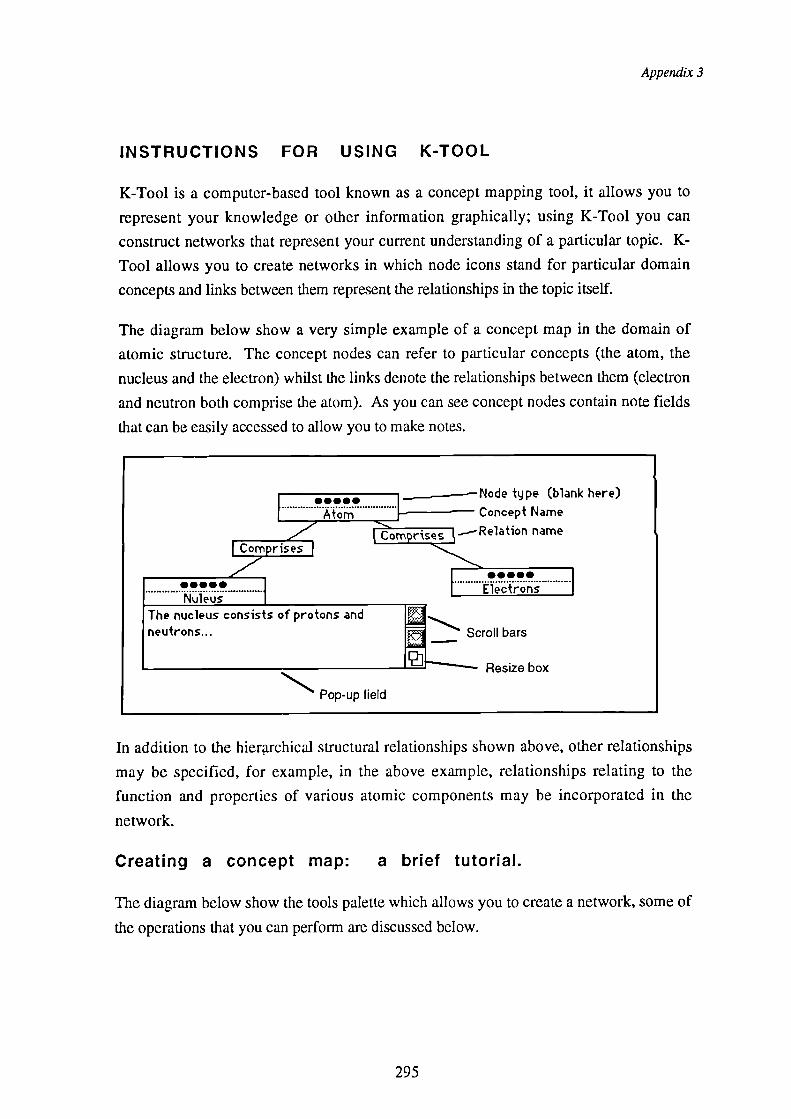
Node type (blank here)
— Concept Name
(ornprises V--Relation name
The nucleus consists of protons andneutrons... Scroll bars
Resize box
Pop-up field
•••••Atom
om rises
111411110111
•11111111141
NuleusElectrons
Appendix 3
INSTRUCTIONS FOR USING K-TOOL
K-Tool is a computer-based tool known as a concept mapping tool, it allows you to
represent your knowledge or other information graphically; using K-Tool you can
construct networks that represent your current understanding of a particular topic. K-
Tool allows you to create networks in which node icons stand for particular domain
concepts and links between them represent the relationships in the topic itself.
The diagram below show a very simple example of a concept map in the domain of
atomic structure. The concept nodes can refer to particular concepts (the atom, the
nucleus and the electron) whilst the links denote the relationships between them (electron
and neutron both comprise the atom). As you can see concept nodes contain note fields
that can be easily accessed to allow you to make notes.
In addition to the hierarchical structural relationships shown above, other relationships
may be specified, for example, in the above example, relationships relating to the
function and properties of various atomic components may be incorporated in the
network.
Creating a concept map: a brief tutorial.
The diagram below show the tools palette which allows you to create a network, some of
the operations that you can perform are discussed below.
295

Appendix 3
Creates node icons'
Deletes nodes and relations
Allows nodes to be linked together
Renames nodes
Balloon help
Creating concept nodes
Nodes are created using the topmost button in the tools palette.
Click on the topmost button with the mouse pointer, notice that the mouse pointer adopts
the same appearance as the icon on the button. Position the mouse pointer somewhere in
the workspace (the patterned area that makes up most of the K-Tool suiface) and click the
mouse button to create a concept node. Type a name into the dialog box (anything will
do for the time being), and click OK.
You should now have a concept node positioned in the workspace. If the name that you
gave was longer than about 15 characters then you may find that not all of the name is
visible, don't worry, the node can be expanded (see later). Also notice that the top line of
the node contains five bullet points ( ), this always happens when you first create a
node, later you can change this to give your node a type or category if you wish (again
see later).
Moving concept nodes
Concept nodes can be moved around the workspace easily.
Position the mouse pointer over the node and hold the mouse button down, wait until the
mouse-pointer changes to a hand shape and, still holding the mouse button down move
the mouse. Releasing the mouse button deposits the node in the position that you left it.
Note: if you move the mouse pointer off the workspace then the node will remain in its
original position.
Linking nodes together
Nodes can be linked quite simply by using the link button in the tools palette (third from
the top).
First of all create another concept node in the same way as before. When this is done,
click over the link button with the mouse, this should highlight black, alternatively hold
296

Rename LinkChange Type
Change Name
Appendix 3
down the option key (the key two along to the left of the space bar). Position the mouse-
pointer over one of the nodes and hold the mouse button down, drag the mouse pointer
from this node (still holding down the mouse button and option key, if you're using this
method). Release the mouse when it is within the destination node. Type a name into the
dialog box and click OK. After a few seconds the two nodes should be linked with a
relation name corresponding to the one that you gave it.
IMPORTANT - if you used the 'link' button to link the two icons together, it remains
operational until you switch it off, moving nodes or opening text fields is not possible as
long as it is switched on. If you wish to turn linking off, do so by clicking over the
button so that it becomes un-highlighted.
Renaming nodes and links
The rename facility allows you to change both the type and name of concept nodes, and
the type of links using the rename facility. Names of nodes (the bottom most title in the
node box) provide labels for the concept that they denote, whereas types (the top most
tide, more than likely at the moment) specify the sort of information contained in the
concept, for example the type of information may be a fact, a theory, a piece of evidence,
etc..
Changing link and node types and node names is all done in the same way by using the
rename facility.
Click over the rename button (the button with the capital letter A on it), and hold the
mouse button down. A pop-up menu should appear (see below)
Notice that rename node has a sub-menu, this is because two attributes can be changed,
the sub-menu is designed to resemble the way that the titles in the node itself are arranged
(i.e. type at the top, dotted line, name at the button). Select the "Rename Link" option by
dragging the mouse pointer over it until it highlights and then releasing the mouse button.
297

Appendix 3
The mouse-pointer should now change to a capital 'A'. Click the mouse over the link
that you created, and type in a new name in response to the dialog box
Try this procedure for node names
Changing node types
The type of a node (top line in bold) can also be changed, this time by using the 'Change
type' option from the menu.
Select 'Change type' from the menu, then click the mouse-pointer over one of the nodes.
A scrolling dialog box should appear containing a list of types, select one of these by
clicking over the name with the mouse and then selecting 'OK'. The type of this node
should now have changed to the one that you selected.
K-Tool has a number of node-types built in to it, these are listed below with some
explanation of what they refer to:
A theory is a coherent set of claims about the world, put together in a systematic way.
Theories are normally backed up by a lot of evidence, or used to explain certain
phenomena. For example Einstein's relativity is a good example of a theory.
A hypothesis is a specific claim about the world that has been specifically designed to be
testable empirically, via experiments of observations.
Claim This is some assertion about a phenomenon that is held by a person, or a set of
people. Claims may be accepted or rejected for a number of reasons, experimental or
observational evidence may support of refute claims, additionally other claims can
support or contradict claims.
Evidence As has been alluded, evidence is information that can support or contradict
some assertion such as a hypothesis, theory or claim. Evidence can be experimental, or
observational; there is no distinction made in AKA between the two.
Critiques Often statements that cast doubt on the validity of claims and/or evidence are
made that are not strictly speaking pieces of evidence themselves. Such statements may
criticise experimental methodology, or some philosophical standpoint embodied in a
claim. In order to represent this AKA has critique nodes that can be used to represent
such objections.
Assumptions Often theories claims and evidence make certain assumptions in order for
them to be true. For example the philosophical assumption that human intelligence can be
298

Appendix 3
simulated on a computer assumes that computers and the brain are functionally similar in
some way because they are both symbol processors. Assumptions are really arguments
in their own right, consisting of claims supported by evidence, and perhaps based on
assumptions of their own. However in many arguments we may be prepared to accept
certain assumptions on face value, without going into a systematic analysis of their make
up, but still be aware that they exist and play a role in the argument.
A phenomenon is some observation that in the world that needs to be explained. For
example auditory hallucinations is a phenomena (also a symptom) of schizophrenia.
Claims and theories are often created to explain specific phenomena.
Questions, these generally define the purpose of the argument in terms of its content:
what should and, crucially, what should not be included in the argument. A question
asking "What is Marx's economic theory?" will require not only an exposition of Marxist
theory, but also perhaps a discussion of how Marx flew in the face of previous
interpretations of economics.. Often question will need sub-questions; for example in the
above example a sub-question; "What was the prevailing economic theory" will need to
be addressed before the top level question can be addressed adequately.
You do not need to stick to the types given, you can create your own node type.
Select the 'Change type' option again and click over one of the nodes. This time select
"New Type" from the dialog box; type a new type of node into the second dialog box and
click 'OK'. Now the node should have the new type.
Note that K-Tool stores the type that you just entered and it appears in the dialog box next
time you try to change a type.
ADDING STRENGTH TO LINKS
All links are created of equal strength, sometimes you may wish to show that a link is
particularly strong of weak. To do this you can choose how strong a link is by selecting
the link name with the mouse.
Click over a link name with the mouse and hold the mouse button down (if there are no
links, create one). A pop-up menu should appear, Still holding the button down, move
the mouse so that the word "Weakly" is highlighted in black, release the mouse button.
After a few seconds the link should change in thickness showing that it is a weaker
relation than it was before.
The same can be done to indicate stronger relationships, this time by selecting "Strongly"
from the menu.
299

Appendix 3
Deleting screen objects
Both nodes and links can be deleted individually using the "delete object button" (the
dustbin icon). Note that deleting a concept node automatically deletes any notes that are
in it, it is always worthwhile to check before you delete.
Click on the dustbin button, notice that the cursor changes to a dustbin shape. Click
mouse over one of the concept nodes, answer yes to the dialog box. The node should
now be deleted, notice that the link between the two nodes deletes also, since it would
make no sense to leave an unattached link.
The process of deleting links is the same as for nodes.
Create a new node as before, then link this to the other node in the workspace. Select the
delete button as before, click over the name of the link that you just created - this can
sometimes be tricky, it works best if you position the 'lid' of the dust-bin mouse-pointer
dead centre on the link name box. Answer OK to the dialog box and after a few seconds
the link name and the link should be deleted
Dealing with text-fields
Each concept node contains a text-field, which are accessed by double-clicking with the
mouse.
Hold the mouse-pointer over the node, and click the mouse button twice in quick
succession, the text-field should appear just below the node. When a text-field is first
opened it puts the text cursor at the end of any text that the field contains, so that you
simply need to type to add notes at the end of the existing notes. However if you click
anywhere else on the screen (for example to open another field up) then you will need to
place the text cursor back in the field, to do this simply position the mouse over the field
and click the mouse button, the flashing cursor indicates that you can now type in text.
Resizing text-fields
Depending on how many notes you make you may wish to make the text boxes bigger
than they are initially, you can do this using the resize box.
Click at the bottom right of the field over the resize box (the icon that looks like two
overlapping squares); drag with the mouse button held down, the field should resize itself
accordingly.
300

Appendix 3
Scrolling through text
No matter how small the text-field is you can still type up to 32,000 characters into the
field and access this text. The text-field is a window on a much larger document, and
typing of the bottom of the field causes the window to move down. To move through the
text for reading purposes without resizing position the mouse on the up and down arrows
on the right of the field and hold the mouse button down until the text you are interesting
scrolls past. Note that the up and down arrows are only active when the text is larger that
the window itself.
Moving text-fields
Sometimes you will find that a text-field obscures some other piece of information on the
screen, for example a node or another text-field. Although you can move the field by
moving the node that it corresponds to, it is not always desirable to do this, if this
happens then you can move the text-field on its own.
Open up any text-field as before. Hold down the CONTROL key ,at the extreme front
left of the computer keyboard, position the mouse pointer anywhere on the field, and
hold the mouse button down, the cursor changes to an arrowed-cross, moving the mouse
will now cause the text-field to move.
Copying text
Sometimes you may wish to copy text from one field to another, this can be done by
using the 'Edit' menu.
If there are no fields open, then open one up by double clicking on a node. Type some
text into the field (rubbish will do). Select the text in the field by holding the mouse
button down at the beginning of the text that you wish to select, and then dragging the
mouse over the rest of the text, the text should highlight as you do this. Release the
mouse button when the text is selected. Move the mouse to the 'Edit' menu towards the
left hand side of the menu bar, hold down the mouse button and select the option 'Copy'.
Open up another text field and place the insertion point in the field. Go up the file menu
again, and select the option 'Paste Text'. The text that you copied should now appear in
the field.
Expanding nodes
To reduce screen clutter all the nodes are created the same size, this may mean that the
name that you gave to it is obscured by the edges of the node. In order to allow you to
301

Appendix 3
read the name of a node it can be expanded briefly simply by holding down the shift key
on the keyboard, and clicking over the node with the mouse.
Try this now although you may find that none of your names are long enough for it to
have an effect, if this is so try it later on.
USING BALLOON HELP
In order to help you as you create a network a balloon help facility is provided that allows
you to find out what the various buttons do.
Click on the balloon help button (the icon with the question mark in the speech bubble).
Placing the cursor over any of the buttons will result in a bubble appearing telling you
what function the button performs. To turn balloon help off simply click over the
balloon help button again.
302

Appendix 3
The goals of the task [All subjects]
The paper that you have been given contains information that relates to anorexia andbulimia nervosa. Read through the paper making use of the tool to construct a map of theinformation. Pay particular attention to:
• The nature of the diseases,
• Proposed theories for why they arise,
• Evidence supporting or refuting these theories.
You have a maximum of 2 hours to complete the task, but you can finish before this ifyou wish. When you have finished I will ask you to write a short summary of theinformation in this paper, this will
Instructions for writing summary [All subjects]
Write a summary of the information contained in the paper with particular reference to:
• The nature of the diseases,
• Proposed theories for why they arise,
• Evidence supporting or refuting these theories.
Try and get across the main points rather than the details, and pay attention to thestructure of the summary; try and make it as clear as possible. Write no more than apage.
303

Appendix 3
Hints Sheet [All subjects]
• Start by identifying and specifying the question that you are interestedin answering, make it your goal to answer this, use sub-questions ifnecessary.
• Identify the key claims of the argument(s).
• Identify the evidence that relates to these claims.
• Don't be in a rush to link nodes together, often it's better to wait awhile until you're more sure of what should be linked to what.
• Reflect upon what you are doing regularly. Asking yourself questionsrelating to the identity of certain components of the argument, forexample: "Is this a claim or a critique?", "Is there any evidence to supportthis claim?" can often be of great benefit.
• Try and use as little text as possible, when typing check whether someof the information in the text might not be better represented as part ofthe network.
• Check the validity of the relationships that you have created; you mayfind that you will need to change them, or restructure the network as youprogress.
• Try and provide a summary of your conclusions in the question box.
304

Appendix 3
Rating sheet [independent raters]
Here are some guidelines for marking the maps that I have given you. Completeness
refers to how well the subject managed to incorporate the information in the paper (with
respect to the goals of the task). Remember that some of the information that was in the
paper is NOT necessarily relevant to the task in hand. It's up to you how you deal with
this. Communication relates to how clearly the subject communicates the ideas that they
have in the map. To some extent these are independent factors. Someone may include
everything, but may communicate it poorly, and vice versa.
Remember it is the maps that you are marking NOT the text. Use the text to disambiguate
uncertain nodes, but mark only the map. Some things that you may find useful. (1) Are
the nodes given meaningful and appropriate type names (the top name on the node). (2)
Are the names clear. (3) Are-the link names understandable and correct, etc.
Overall impression. This is a subjective mark that you can assign yourself. Basically
how good is the map (imagine that you are learning about the stuff for the first time).
This will naturally have both communication and completeness in it, but try and make it
more than just the sum of these two scores.
Add comments if you wish.
Card number 1
Completeness
Communication
Overall impression
Comments
[...ETC]
305

Appendix 3
Marking scheme for maps (numbers in bold denote points for inclusion)
Central Models (also 1 2
theories) 2 points formodel 2 for theory 1 forclaim 1 for h •othesisAffective disorder 2 111111Anxiet model 2 01111111
3
IN
El
MIN
4
•11111••1111
5 6 7
iiim
III
MIME
1111111.1m1111111111111
1111111111111111
8
III
1010101
9
1111
1111111
IIIIII
ilia
10
NI
IIIIIIIIIIIIIIII
MINIM
ill
11
IIII
IIIIIIIII
12
Co • nitive-behavioural model 2 owSociet model 2 IIIIIIIIIIIIIIIIIIIIIIIIIIIIIIIIIIIIIIIIIIIIIIIIIIIIIPeriphral models (also IIIIIIIIIIIIIIIIIIIIIIIIIIIItheoriesEso-.s choloaical 1 IIIIIIIIIIIReinforcement 1 IIIIIIIIIIIIIIIIIIIIIIIAM11111111.1111111111InISTIMIIIIIIIIIIIIIIIIIIIIIIIBiolosical model 1 EIIIIIIIIIIIIIIIIIIIIIIIIINIIIIIIIIIIIIIIIIIIIIIIICentral • ro • ositionsSocio :1111111111•1111=11111111111111111DD iiseet iansesouf aoffrl tuse oSooeci soo2pooffs , num
sock) 2Essentially female problem
1° IICritique (or evidence) Men thatmen are also anorexix Attacks(or contradicts) Soclo-culturalmodel 1 I IICase studies supportsociocultural model 2 11111111111111111111111111111111Family systems model can't 2explain why it is a disesase ofAffluent Societ 2
why it is a disesase of AffluentAnxiety model can't explain 11111111
Societ 2
I
rri
Affective can't exaplain why it 2is a disesase of Affluent Society2
why women tend to get eatingFamily systems can't expla i n 111111111111111111
disorders 2Anxiety can't explain why 2women tend to get eatingdisorders2Affective can't exaplain why 111111111111women tend to get eatingdisorders2Socio-cultural model Explains AN 11111111111111111111111111111& BN 2 Stronel 3Affective disorder model ..1Evidence - Depression associatedwith with eating disorderssus sorts Affective model 2
306
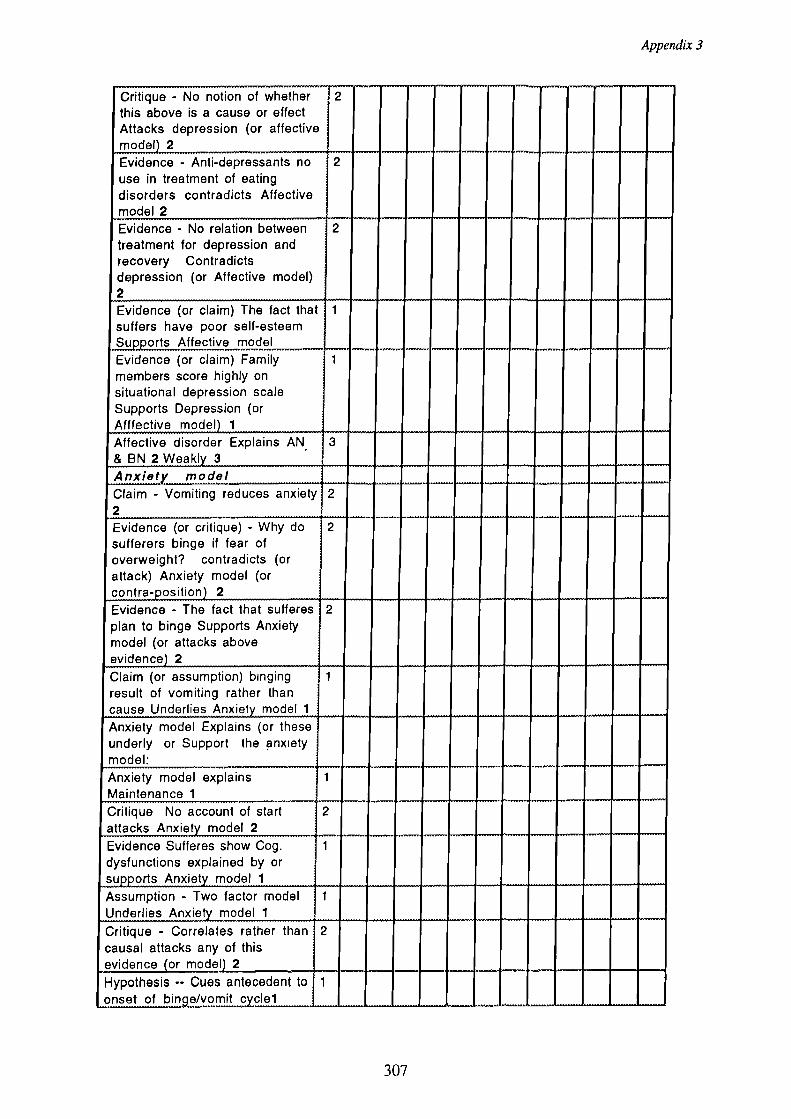
Appendix 3
Critique - No notion of whetherthis above is a cause or effectAttacks depression (or affectivemodel 2Evidence - Anti-depressants nouse in treatment of eatingdisorders contradicts Affectivemodel 2
2
2
1
.
1
_ . ..
—
.. _.
—.
—Evidence - No relation betweentreatment for depression andrecovery Contradictsdepression (or Affective model)2Evidence (or claim) The fact thatsuffers have poor self-esteem
_Supports Affective modelEvidence (or claim) Familymembers score highly onsituational depression scaleSupports Depression (orAfffective model 1Affective disorder Explains AN& BN 2 Weakly 3Anxiet y . model . .. Claim - Vomiting reduces anxiety2
2---
Evidence (or critique) - Why dosufferers binge if fear ofoverweight? contradicts (orattack) Anxiety model (orcontra-position) 2
2
.Evidence - The fact that sufferesplan to binge Supports Anxietymodel (or attacks aboveevidence) 2
2
Claim (or assumption) binging .result of vomiting rather thancause Underlies Anxiet model 1Anxiety model Explains (or theseunderly or Support the anxietymodel:Anxiety model explainsMaintenance1
4
1
1______
........_______
Critique No account of start_15,2.2i1LAratetyimi2Li____________Evidence Sufferes show Cog.dysfunctions explained by or
Assumption - Two factor modelUnderlies Anxie model 1
2
1
1
supports A n_xiety_maciell.____________________
_ ........._____—
Critique - Correlates rather thancausal attacks any of thisevidence (or mode I.) 2
2
——Hypothesis -- Cues antecedent toonset of binge/vomit c clel
307

Appendix 3
•1
Evidence Cues not arousingcontradicts_Anicielymodel 2Evidence Treatment (EVP)Supports (ish) Anxiety modelPoss claim 2
Anxiety model explains AN & BN2 Weakl 3
Co.nitive modelEvidence BNs high in dietaryrestraint Su. sorts Co.. model 2
Evidence Sufferes showdysfunctional cognitionsSus•orts Co.. model 2Evidence Results of Heynemanstudy Supports Cog. style (orco. model 2Cog. model Explains Paradoxicalbin.in . 1Evidence (or claim or critique)not all People with cog dys areBN Contradicts (or attacks) Cog.model. 2 .Claim (or Assumption )Dysfunctional cognitionsUnderlies Co.. model 1
Evidence Treatment studiesSu•sorts Co.. model 2Evidence (or critique)cPosgycnhitoivtehertahpey
raapsy ContradictsCog. model 1 or Attackstreatment studies 2Critique (2) or Evidence (1)Methodology Attacks orContradicts Treatment studiesor co. model
Critique Mechanisms elusiveCog model or treatment
.1.
ill 1
2
11111
ill IIi ill1
........
II
111111111111111111111111111111IIIIIIIIIIIIIIIIIIIIIIIIIIIIIIIIIIIIIIIIIIII111111101111111111111111111
IIIIIIIIIIIIIIIIIIIIIIIIIIIIIIIIIIII
IIIIlIIIIuhl"PIP"......_
III
II
I
II
.........
Ir.....issio
Ill
Imo,lullIan
11111111111111111III
Evidencence better than .pharmacological ntstreatmentsSupports Cog. model orTreatments 1
Cog model Explains BN oraddresses Question BN 2Weighted strong 3
Cog model Explains AN & BN orEating disorders 2 WeightedWeak or not ex lains 2 3
308

Appendix 3
. .Ar
It 47110<101B1
o1;z
,-0
309
•
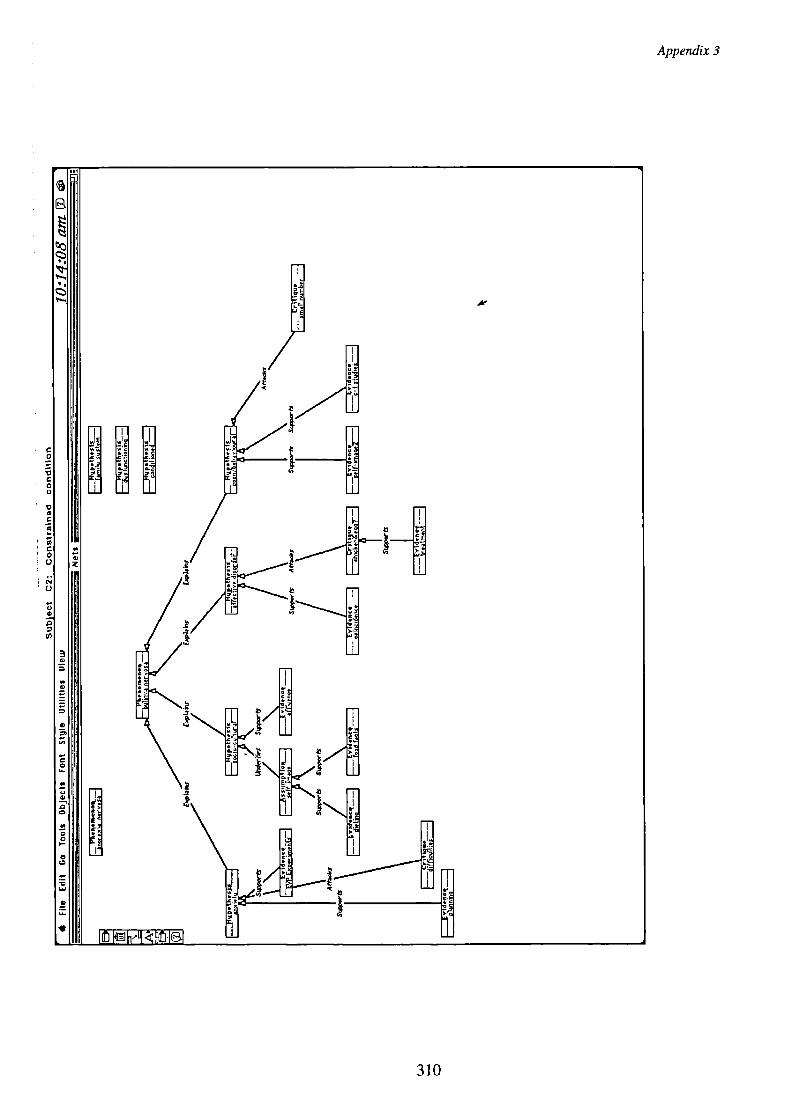
A.•
i n OFR OBI II II
f.
r1Z
1.ja.Srg
Appendix 3

It 1011 ttiel
•
•
71)
Appendix 3

Appendix 3
.qtTI
E.§

-r
kgg
Appendix 3
•
t•-n
c;)
C.)0
N5-0-;;ERTOTETI.

W=7
0
Ul
1-6 —WIT:CTOTC:11 n
Appendix 3

A**
Appendix 3

•
o
=iiC0
C.)
•30C
1:11
5C0OC7
0
.00cn
3S
••
Z
Appendix 3

•
0
7
.0
3
41.
Appendix 3
317

9
10101.10.1
•
3
•tt-9
•
Appendix 3

Cr;
•
Appendix 3
319

1
A'
I1 Oleg< lei
o
IR
Z3=
Appendix 3