Structural variationsaheadofcracktipduringmonotonicandcyclicfracture tests ofAISI304LN...
12
Structural variations ahead of crack tip during monotonic and cyclic fracture tests of AISI 304LN stainless steel H. Roy a,b,n,1 , A. Ray c , K. Barat d , C. Hochmuth b , S. Sivaprasad d , S. Tarafder d , U. Glatzel b , K.K. Ray e a NDT & Metallurgy Group, CSIR-Central Mechanical Engineering Research Institute, Durgapur-713209, India b Metals and Alloys, Universit¨ at Bayreuth, Ludwig-Thoma Straße, 36b, 95447 Bayreuth, Germany c Institute f¨ ur Experimentalphysik, Universit¨ at Bayreuth, Bayreuth 95440, Germany d Material Science and Technology Division, CSIR-National Metallurgical Laboratory, Jamshedpur-831007, India e Department of Metallurgical and Materials Engineering, Indian Institute of Technology, Kharagpur-721302, India article info Article history: Received 18 June 2012 Received in revised form 20 October 2012 Accepted 23 October 2012 Available online 7 November 2012 Keywords: Deformation induced martensite AISI 304LN stainless steel Monotonic fracture Cyclic fracture R ratio abstract This investigation presents examination of structural variations ahead of crack tip during monotonic fracture toughness and cyclic fracture toughness tests of AISI 304LN stainless steel. The monotonic fracture toughness tests are carried out using standard J-integral technique; whereas the cyclic fracture toughness tests are evaluated using periodic unloading to different extents fixed by pre-determined stress-ratio, R. The associated structural variations adjacent to fracture surfaces are characterized in terms of nature and amount of deformation induced martensite using micro structural analysis, X-ray diffraction, hardness measurement, ferrofluid technique and transmission electron microscope. The obtained results reveal that monotonic fracture toughness specimens exhibit higher amount of deformation induced martensite compared to cyclic fracture toughness specimens, and the latter exhibit variation in martensite content with change in R ratio. The dislocation substructure also changes rapidly with decreasing stress ratio for cyclically deformed samples. The associated significant structural variations in cyclic fracture toughness specimens has been explained by variation in energy expended during crack propagation and different residual stress fields ahead of cracks in cyclic fracture toughness compared to monotonic fracture toughness specimens. & 2012 Elsevier B.V. All rights reserved. 1. Introduction Cyclic fracture toughness tests are usually aimed to assess the integrity of components during seismic events [1–9]. Though, there exists controversy over the applicability of the J-integral technique to compressive crack tip load-excursions that take place in such tests, several investigators [3–8] have examined the appropriateness of the concept of cyclic J–R curves using compact tension specimens. The earlier researchers [4,6–9] in this domain have unanimously illustrated that the fracture resistance of materials decreases upon imposition of compressive cyclic loads during conventional J-integral tests. The bulk damage mechanism of AISI 304LN stainless steel, considered for this investigation, subjected to cyclic fracture tests is primarily due to formation of voids, their smearing and re-sharpening of crack tip [7,9]. AISI 304 grade stainless steel is well known to exhibit deformation induced martensite and Mei and Morris [10] have specifically used this phenomenon to explain crack propagation rate in this grade of stainless steel. However, the changes in the substructure associated with the fracture surfaces owing to cyclic loading effects have not been examined by earlier investigators [4,6–9]. In this investigation, attempts are therefore made to highlight the changes in the substructure and microstructure in AISI 304LN stainless steel during monotonic vis- a-vis cyclic fracture toughness tests and their possible influence on crack initiation phenomenon, if any. Austenitic stainless steels (like 304LN grade) are unstable upon monotonic and cyclic deformation and these readily exhibit transformation of austenite to martensite [11–15]. The extent of martensite transformation depends on several factors such as chemical composition of the steel and the temperature at which the deformation takes place [16]. It is generally believed that during initial stages of deformation, austenite (g) transforms into hexagonal close packed e-martensite and on further deformation this e-martensite transforms to body centred cubic a 0 -martensite [17,18]. The parameters that characterize the amount of marten- site transformation are M d30 temperature (a temperature at which 50% austenite transforms to martensite at a deformation of Contents lists available at SciVerse ScienceDirect journal homepage: www.elsevier.com/locate/msea Materials Science & Engineering A 0921-5093/$ - see front matter & 2012 Elsevier B.V. All rights reserved. http://dx.doi.org/10.1016/j.msea.2012.10.074 n Corresponding author at: NDT & Metallurgy Group, CSIR-Central Mechanical Engineering Research Institute, Durgapur-713209, India. Tel.: þ91 343 6452085; fax: þ91 343 2546745. E-mail addresses: [email protected], [email protected] (H. Roy). 1 Currently with Metals and Alloys Group, Universit ¨ at Bayreuth, Germany. Materials Science & Engineering A 561 (2013) 88–99
Transcript of Structural variationsaheadofcracktipduringmonotonicandcyclicfracture tests ofAISI304LN...

Materials Science & Engineering A 561 (2013) 88–99
Contents lists available at SciVerse ScienceDirect
Materials Science & Engineering A
0921-50
http://d
n Corr
Enginee
fax: þ9
E-m1 Cu
journal homepage: www.elsevier.com/locate/msea
Structural variations ahead of crack tip during monotonic and cyclic fracturetests of AISI 304LN stainless steel
H. Roy a,b,n,1, A. Ray c, K. Barat d, C. Hochmuth b, S. Sivaprasad d, S. Tarafder d, U. Glatzel b, K.K. Ray e
a NDT & Metallurgy Group, CSIR-Central Mechanical Engineering Research Institute, Durgapur-713209, Indiab Metals and Alloys, Universitat Bayreuth, Ludwig-Thoma Straße, 36b, 95447 Bayreuth, Germanyc Institute fur Experimentalphysik, Universitat Bayreuth, Bayreuth 95440, Germanyd Material Science and Technology Division, CSIR-National Metallurgical Laboratory, Jamshedpur-831007, Indiae Department of Metallurgical and Materials Engineering, Indian Institute of Technology, Kharagpur-721302, India
a r t i c l e i n f o
Article history:
Received 18 June 2012
Received in revised form
20 October 2012
Accepted 23 October 2012Available online 7 November 2012
Keywords:
Deformation induced martensite
AISI 304LN stainless steel
Monotonic fracture
Cyclic fracture
R ratio
93/$ - see front matter & 2012 Elsevier B.V. A
x.doi.org/10.1016/j.msea.2012.10.074
esponding author at: NDT & Metallurgy Gro
ring Research Institute, Durgapur-713209, In
1 343 2546745.
ail addresses: [email protected], h_roy
rrently with Metals and Alloys Group, Unive
a b s t r a c t
This investigation presents examination of structural variations ahead of crack tip during monotonic
fracture toughness and cyclic fracture toughness tests of AISI 304LN stainless steel. The monotonic
fracture toughness tests are carried out using standard J-integral technique; whereas the cyclic fracture
toughness tests are evaluated using periodic unloading to different extents fixed by pre-determined
stress-ratio, R. The associated structural variations adjacent to fracture surfaces are characterized in
terms of nature and amount of deformation induced martensite using micro structural analysis, X-ray
diffraction, hardness measurement, ferrofluid technique and transmission electron microscope. The
obtained results reveal that monotonic fracture toughness specimens exhibit higher amount of
deformation induced martensite compared to cyclic fracture toughness specimens, and the latter
exhibit variation in martensite content with change in R ratio. The dislocation substructure also
changes rapidly with decreasing stress ratio for cyclically deformed samples. The associated significant
structural variations in cyclic fracture toughness specimens has been explained by variation in energy
expended during crack propagation and different residual stress fields ahead of cracks in cyclic fracture
toughness compared to monotonic fracture toughness specimens.
& 2012 Elsevier B.V. All rights reserved.
1. Introduction
Cyclic fracture toughness tests are usually aimed to assess theintegrity of components during seismic events [1–9]. Though,there exists controversy over the applicability of the J-integraltechnique to compressive crack tip load-excursions that takeplace in such tests, several investigators [3–8] have examinedthe appropriateness of the concept of cyclic J–R curves usingcompact tension specimens. The earlier researchers [4,6–9] in thisdomain have unanimously illustrated that the fracture resistanceof materials decreases upon imposition of compressive cyclicloads during conventional J-integral tests. The bulk damagemechanism of AISI 304LN stainless steel, considered for thisinvestigation, subjected to cyclic fracture tests is primarily dueto formation of voids, their smearing and re-sharpening of cracktip [7,9]. AISI 304 grade stainless steel is well known to exhibit
ll rights reserved.
up, CSIR-Central Mechanical
dia. Tel.: þ91 343 6452085;
@cmeri.res.in (H. Roy).
rsitat Bayreuth, Germany.
deformation induced martensite and Mei and Morris [10] havespecifically used this phenomenon to explain crack propagationrate in this grade of stainless steel. However, the changes in thesubstructure associated with the fracture surfaces owing to cyclicloading effects have not been examined by earlier investigators[4,6–9]. In this investigation, attempts are therefore made tohighlight the changes in the substructure and microstructure inAISI 304LN stainless steel during monotonic vis-�a-vis cyclicfracture toughness tests and their possible influence on crackinitiation phenomenon, if any.
Austenitic stainless steels (like 304LN grade) are unstableupon monotonic and cyclic deformation and these readily exhibittransformation of austenite to martensite [11–15]. The extent ofmartensite transformation depends on several factors such aschemical composition of the steel and the temperature at whichthe deformation takes place [16]. It is generally believed thatduring initial stages of deformation, austenite (g) transforms intohexagonal close packed e-martensite and on further deformationthis e-martensite transforms to body centred cubic a0-martensite[17,18]. The parameters that characterize the amount of marten-site transformation are Md30 temperature (a temperature at which50% austenite transforms to martensite at a deformation of

Table 1Chemical composition of the investigated steel (in wt%).
Steel C Si Mn P S Cr Ni Fe
AISI 304LN 0.03 0.54 1.80 0.03 0.01 18.55 9.50 Bal.
contain 0.1% Nitrogen
Table 2Tensile and hardness values of AISI 304LN stainless steel.
Type Strain rate
(s�1)
YS
(MPa)
UTS
(MPa)
%et %eu Hardness,
HV 10
AISI 304LN 1E-4 340 680 70.61 49.78 195
YS¼yield strength, UTS¼ultimate tensile strength, %eu¼uniform elongation, %et¼ total elongation, Hv
10¼vickers hardness at 10 kgf load.
H. Roy et al. / Materials Science & Engineering A 561 (2013) 88–99 89
0.3 true strain) and stacking fault energy. The Md30 temperature isgoverned by the chemical composition and grain size of the steel.The estimated Md30 temperature of AISI 304LN stainless steelsuggests that transformation would readily occur when thedeformation temperature is below �17 1C [18]. However, instainless steel, stacking fault energy is reported to increase withincreasing temperature [19] which assists transformation ofaustenite to martensite. The formation of deformation inducedmartensite at room temperatures above the Md30 temperature hasbeen observed and is extensively reported in literature [20,21].The deformation induced martensite formation at room tempera-ture requires large strains due to insufficient thermodynamicdriving forces. Such large strains are available at the tip ofgrowing crack during fracture tests.
Influence of the deformation induced martensite on tensileand fatigue properties are found reported in several investigations[10,13–15,18]. Mei and Morris [10] have extensively character-ized the extent of deformation induced martensite formationduring fatigue crack propagation in 304 type stainless steels.Their work has clearly brought out the fact that deformationinduced martensite significantly reduces the fatigue crack growthrate of this grade of stainless steels. Biswas et al. [18] havecharacterized the effect of load history on fatigue crack growthrate behaviour of 304LN stainless steel in terms of deformationinduced martensite. These authors have found that martensitictransformation decreases the applied stress amplitude due tovolumetric expansion and strain associated with phase transfor-mation. Biswas et al. [18] have also highlighted that in AISI 304LNstainless steel the formation of e-martensite gets suppressed.These authors [18] have argued that as stacking fault energyincreases with temperature, the sequence of dominant deforma-tion mode becomes g-mechanical twin (g0)-a0-martensiterather than the sequence of g-e-martensite-a0-martensite.Tsuzaki et al. [22] have also studied the kinetics of deformationinduced martensite formation in AISI 304 stainless steel and haveemphasized that a0-martensite forms near the surface layer(30–60 mm) of the fractured specimen due to an increase in localconcentrated stress which in turn results in increase in piled updislocations. The available results primarily highlight the evolu-tion of deformation induced martensite during tensile and fatiguetests. However, systematic research reports concerned with therole of deformation induced martensite formation during variedtypes of fracture tests are not available to the best knowledge ofthe current authors.
The major emphasis in this investigation is to examine theeffect of cyclic loading at different R ratios on AISI 304LN stainlesssteel with respect to possible variation of substructure anddeformation induced martensite during fracture toughness testsin comparison to monotonic fracture toughness tests. The sub-structural and microstructural changes occurring during thesetests have been examined with detailed X-ray diffraction analysis,hardness measurements, ferro-fluid technique and transmissionelectron microscopy.
2. Experimental procedure
The material selected for this investigation is AISI 304LNstainless steel (henceforth referred only as 304LNSS) employedfor primary heat transport piping system in nuclear power plants.The steel, which is known to be solution annealed from 1233 K, isobtained as 12 in. diameter pipes of 1 in. wall thickness. Thechemical composition of the selected steel is given in Table 1. Themicrostructures were examined using optical microscope (Zeiss,model: Axioplan 2) attached with an image analyzer (software:Stream motion, Olympus). The average austenite grain size of the
material was estimated following ASTM standard E112-09 [23].Tensile tests were carried out on cylindrical specimens of 6 mmdiameter and 25 mm gauge length with the help of a 100 kNservo-hydraulic test system at a nominal strain rate of1.0�10�4 s�1 at ambient temperature. The hardness measure-ment of the as received material was carried out using a Vickershardness tester. The estimated tensile properties and Vickershardness of the material are summarized in Table 2.
Compact tension [C(T)] specimens of width 50 mm and thick-ness 20 mm were used for the fracture toughness tests. Thespecimens were fabricated in a way such that the notch planeremains in the longitudinal–circumferential (LC) orientation withrespect to the pipe dimension. The detailed specimen configura-tions are reported elsewhere [9]. All specimens were fatigue pre-cracked to a/WE0.5 following the ASTM standard E647-09 [24].The pre-cracking was carried out on a computer controlled servohydraulic Instron machine (model: 8502) coupled to a commer-cial software. All pre-cracking experiments were carried out at astress ratio of R¼0.1 at 15 Hz frequency, employing decreasingstress intensity factor range (DK) envelope. The final DK at theend of pre-cracking was maintained between 12–15 MPaOm. Thecrack length during pre-cracking was measured using compliancetechnique.
Monotonic J integral tests were carried out, as per the guide-lines of ASTM standard E1820-09 [25] on a servo-electric Instronmachine (model 8562) using a crosshead ramp velocity of0.003 mm/s at room temperature. Cyclic fracture toughness testswere carried out at R-ratios of �0.5,�0.8, and �1.0. The proce-dure adopted for conducting cyclic fracture toughness tests wassimilar to that of monotonic J-integral tests except for the factthat periodic unloadings were continued up to some pre-fixedload levels which correspond to the desired R-ratio of the test.All these tests have been done at the ambient temperature ofE298 K and at a displacement rate of 3�10�2 s�1. A clip gauge(with a travel of 10 mm) was attached to the integral knife-edge(machined at the specimen load line) during the fracture tough-ness tests to monitor the load line displacement (LLD). The load-LLD data for each of the specimens was recorded for subsequentanalysis to obtain the J–R curve. The data obtained from themonotonic J-integral tests were analyzed to construct the J–R
curves using an in-house developed software. The softwareidentifies the data points corresponding to the loading–unloading sequences of J-integral test and determined the cracklengths from the unloading-compliance in accordance withE 1820.
Crack lengths in cyclic J–R tests were estimated from thecompliance value corresponding to the linear portion of theunloading curve and J was calculated from the area under the

Austenite grain Annealing twin
Fig. 1. Optical micrograph of the investigated AISI 304LN stainless steel.
1 2
400
800
1200
1600
Tota
l J, k
J/m
2
Δa, mm
J= 915 kJ/m2
Fig. 2. Typical J–Da plot obtained from monotonic J integral test.
H. Roy et al. / Materials Science & Engineering A 561 (2013) 88–9990
envelope curve above the baseline P¼0; the rationale for suchestimation is based on the argument that once the crack is fullyopen, the energy spent in further opening it directly contributesto crack tip processes responsible for crack extension [26]. Thesoftware used for analysis of monotonic J–R tests was adapted foranalysis of cyclic J–R test data. Additional details about the testprocedure for cyclic J–R are available in an earlier report [9].
Specimens were cut from the transverse sections of the brokenfracture specimens in a way that both fatigue pre-crack and fractureregions are clearly revealed. The cross sections of the specimens, cutwith an abrasive cutting machine, were ground and polished with SiCemery paper up to a roughness of 1200 grit and were then polished incloth with 1 mm diamond paste. To reveal the a0-martensite phase,ferrofluid (Ferrotech Corporation EMG 707) was used [27]. A ferro-fluid is a water based liquid that contains small magnetic particleswith an average diameter of 10 nm. The solution was applied to thepolished specimen surfaces with a syringe. As a result the smallmagnetic particles were attracted to the ferromagnetic a0-martensite.Hardness profiles of the deformed regions near the fracture surfaces(including fatigue pre crack regions) were analyzed using an instru-mented indentation test machine (Fischerscope H 100) at an indenta-tion load of 1 N. A total of 600 hardness values were taken coveringthe crack front regime for all specimens. The obtained hardnessvalues are measured in martens hardness. Martens hardness isdetermined from the force/indentation depth curve and is definedas the test force divided by the surface area of the indenterpenetrating beyond the zero point of the contact [28]. The values ofmartens hardness are generally reported in N/mm2. X-ray diffractionanalyses were carried out with counting times of 10 for steps of 0.021in 2y using a high resolution X-ray diffractometer (Seifert 3000P,Germany) using Cu Ka radiation. The volume fraction of themartensite phases formed after the test was estimated from thewhole X-ray diffraction patterns using JAVA based Rietveld’s software(MAUD). In addition, thin slices (E0.5 mm thick) were cut from thenearby regions of the fracture surface using slow speed precisioncutter. The slices were next thinned sequentially by manual polishingon emery paper and subsequently thinned in a twin-jet electropolisher using 9:1 acetic-perchloric acid mixture at 40 V untilperforation. TEM studies were carried out using a 200 keV transmis-sion electron microscope (Zeiss, model: LIBRA 200FE, Germany).Finally, few more XRD tests were carried out for X-ray line profileanalyses which provide information regarding the contribution ofdislocations (strain broadening) and twinning along with stackingfaults (size broadening) in the total deformation processes. These XRDtests were carried out for 2y values ranging from 40–1301 with stepsof 0.021, where time per step is 3 s.
3. Results and discussion
3.1. Microstructure and mechanical properties
The microstructure of 304LNSS (Fig. 1) shows annealing twinsin nearly equiaxed austenite grains with an average grain size of8375 mm. The recorded load elongation data of tensile tests havebeen analyzed to obtain the engineering stress–strain diagramsfor the investigated steel. The average values of yield strength,tensile strength, uniform elongation and total elongation of thematerial have been estimated from stress–strain diagrams andare reported in Table 2, together with its hardness value.
3.2. Monotonic vis-�a-vis cyclic fracture toughness
The monotonic fracture toughness tests have been carried outusing single specimen technique as per the guidelines of ASTMstandard E 1820-09 [25]; the details of this test procedure and
necessary analyses are reported earlier [9]. However, a few moreexperiments have been carried out in a similar manner togenerate fresh fracture surfaces for this investigation. Thesequence of estimating monotonic fracture toughness values areas follows: (a) obtaining the load–load line displacement data ofthe test, (b) from the obtained load–load line displacement data,J–Da plot is evaluated and finally (c) the magnitude of J0.2 isestimated from the line offset to 0.2 mm from the experimentalblunting line. A typical J–R curve with estimated value of J0.2 isshown in Fig. 2. The average monotonic fracture toughness of304LNSS is calculated as 1116 kJ/m2. The estimated monotonicfracture toughness values of 304LNSS when compared with1280 kJ/m2, in an earlier investigation [29] are found to be lower.The difference is attributed to the variation in the specimenthickness considered in the two investigations; the specimenthickness in the present study is 19.8 mm and that in the earlierreport is 12.7 mm.
The procedure to obtain cyclic J–R curves is also reported inthe earlier publication [9]. This procedure is similar to that ofestimating monotonic J–R curves except superposition of cyclicloading with predetermined R values at fixed intervals of DV asdiscussed in Section 2. Typical load–load line displacement curvesof cyclic fracture toughness tests are shown in Fig. 3, while a set ofcyclic J–R curves are shown in Fig. 4, in which a monotonic J–R
curve is also superimposed for ready comparison. The equivalentfracture toughness values for cyclic J–R curves were estimatedusing the same procedure as followed for monotonic J–R curves.The average magnitudes of JQ for cyclic J–R tests are found to be486 kJ/m2 (R¼�0.5), 323 kJ/m2 (R¼�0.8) and 180 kJ/m2
(R¼�1.0) which indicate that with decrease in R ratio, the cyclicfracture toughness value decreases. Similar observations have

0 1 2 3 4 5 6-40
-30
-20
-10
0
10
20
30
40
50
Load
, kN
N=69N=53N=41N=30N=13
N=9
0 1 2 3 4
N=53N=42N=31N=22N=15
N=8
0 1 2 3 4
N=45N=33N=31N=17
N=11N=8
Load line displacement, mm
Fig. 3. Typical load–load line displacement plot obtained from cyclic fracture toughness test at (a) R¼�0.5, (b) R¼�0.8 and (c) R¼�1.0.
0.0 0.5 1.0 1.5 2.00
200
400
600
800
1000
1200
1400
1600
1800
R= -1.0 R= -0.8 R= -0.5 Mon J
J, k
J/m
2
Δa, mm
Fig. 4. Typical J–Da plot obtained from cyclic fracture toughness test. Monotonic
J–R curve is shown for comparison [9].
Fracture region
Fatigue region
Overload fracture after the J-R test1mm
Fig. 5. Crack front transverse section.
H. Roy et al. / Materials Science & Engineering A 561 (2013) 88–99 91
been reported earlier by Singh et al. for SA 333 Gr.6 pipingmaterial [6] and Rudland et al. [30] for SA 106 Gr. B steel. Theestimated fracture toughness of 304LNSS under cyclic loadingcondition is always lower than that estimated from tests undermonotonic loading, and the lowest value could be almost one fifthof the latter.
3.3. Variation of substructure and microstructure under monotonic
and cyclic loading
To understand the substructural and microstructural varia-tions associated with monotonic and cyclic fracture toughnesstests of the investigated steel, specimens were suitably preparedto examine fatigue pre-crack and fracture regions in a distin-guished manner as discussed earlier. The crack front in specimenssubjected to monotonic loading exhibits distinguished conven-tional thumbnail shape, whereas the warp on the crack front ismarkedly different under cyclic loading [9]. These observationsare attributed to the difference in the stress conditions on thesurface and within the interior of the specimens subjected tomonotonic and cyclic loading. In monotonic loading, free defor-mation occurs along the crack tip, while the deformation isconstrained in specimens subjected to cyclic loading. The changesin the nature and magnitude of plastic deformation in specimenssubjected to cyclic loading are associated with reverse plasticzone [4] and occurrence of crack closure [8]. Similar transversesections obtained after monotonic and cyclic fracture tests wereexamined for microstructural details using instrumented inden-tation testing machine, nano-ferrofluid test technique, X-raydiffraction studies and transmission electron microscope. A typi-cal test coupon with transverse section marked for the three
different regimes of fatigue (FR), fracture initiation (FrR) andoverload fracture (OFR) regions has been shown in Fig. 5. The testcoupons extracted from locations near the crack front from bothmonotonic and cyclic fracture specimens were polished andetched using freshly prepared Aqua Regia (3 part HCL and 1 partHNO3) to reveal the microstructure. The obtained microstructuresindeed show presence of deformation induced martensite, theamount of which varied for samples subjected to different testparameters. Typical microstructures revealing the presence ofdeformation induced martensite under both monotonic fracturetoughness and cyclic fracture toughness tests are shown in Fig. 6.The observed morphology of the martensite was predominantlylath type as seen from Fig. 6. Initial attempts were made todetermine the depth of martensite formation below the fracturesurface by simple polishing and etching with Aqua Regia. How-ever, formation of considerable extents of etch pits rendered theestimation of the zone of martensitic transformation below thefractured surfaces difficult.
As an alternate way, the polished but unetched test couponsfor all the tested specimens were coated with the nano-ferrofluidto reveal the depth of martensite formed along the crack frontfollowing the guidelines of a few earlier researchers [10]; a typicalresult is depicted in Fig. 7. It is evident from Fig. 7 that the depthof martensite formation is almost negligible near the fatigue pre-crack regions, whereas the major extent of the martensiteformation is confined in regimes associated with the crackinitiation process. During stable crack growth process the mar-tensitic transformation is however insignificant. This technique ofcoating the samples with ferrofluid was earlier used by Mei andMorris [10] in order to examine the distribution of the martensitictransformation near a growing fatigue crack. The extent ofmartensite is found to be maximum for the samples subjectedto monotonic fracture toughness tests compared to the onessubjected to cyclic fracture toughness tests. This observationcan be attributed to free deformation being predominant aheadof crack tips in monotonic fracture toughness specimens unlikeconstrained deformation in cyclic fracture toughness specimens.

50μm 50μm
Fig. 6. Optical micrograph near the crack front revealing presence of martensite (marked with arrows) in (a) monotonic fracture toughness test and (b) cyclic fracture
toughness test specimens.
1 mm
Fatigue pre-crack region
Actual crack extension
Overload fracture
200 ?m
Fig. 7. (a) Typical polished but unetched samples coated with ferrofluid revealing the presence of a0-martensite localized near the fracture region of a cyclic fracture test
specimen and (b) morphology of the a0-martensite as revealed at a higher magnification.
H. Roy et al. / Materials Science & Engineering A 561 (2013) 88–9992
The contention is ably supported by the generated hardnessprofile near the crack front of all the specimens tested and isillustrated in Figs. 8 and 9 for monotonic and cyclic fracture testsrespectively. The hardness profiles of the tested specimens(Figs. 8 and 9) highlight the martensitic formation, deformedregion and undeformed region by red, yellow and green colourrespectively. The ferrofluid coated specimens highlighting thepresence of martensite has also been shown in the right-handside of Figs. 8 and 9 for comparison. The extent of martensiteformation is minimum in cyclic fracture toughness specimens(Fig. 9) tested at R¼�0.8, unlike in R¼�1.0. This could be due tothe fact that at R¼�1.0 there is rubbing of crack surfaces whichresults into higher deformation compared to R¼�0.8 and �0.5.Therefore, the combined use of ferrofluid technique and hardnessprofile near the crack front clearly brings forward the distributionof martensitic transformation in the monotonic fracture tough-ness and cyclic fracture toughness specimens.
In order to understand the nature and amount of martensite inthe monotonic fracture toughness and cyclic fracture toughnesssamples, X-ray diffraction studies have been carried out. Theresults of these tests indicate that there is no evidence for thepresence of e-martensite in specimens subjected to monotonicfracture toughness tests (Fig. 10a) unlike its prominent presencein some of the specimens subjected to cyclic fracture toughnesstests (Fig. 10a). In cyclic fracture toughness specimens, presenceof e-martensite (HCP) peak could be detected (Fig. 10b) alongwith that for a0-martensite only for intermediate R ratios (�0.5and �0.8); its presence is not revealed in specimens tested atR¼�1.0. The volume fractions of the different constituent phaseswere estimated from the XRD data of the entire spectrum usingJava based Rietveld analysis software, MAUD [31]. The Rietveld
method basically consists of modelling a large portion of theexperimental X-ray spectrum with analytical functions containingboth the instrumental and structural parameters to describe theprofiles whose intensity is directly related to the structure of eachconcerned phases. The estimated volume fractions of the phaseshave been summarized in Table 3.
The obtained results in Table 3 demonstrate that monotonicfracture toughness specimens possess higher volume fraction ofthe transformed phase (almost 34% a0-martensite) compared toall cyclic fracture toughness specimens. In the cyclic fracturetoughness specimens volume fraction of a0-martensite decreasesfrom 25% in case of R¼�0.5 to 12% in case of R¼�0.8 specimens.An amount of 4–5% e-martensite remains untransformed for bothR¼�0.5 and �0.8 specimens. The formation of deformationinduced martensite during crack growth of 304 type austeniticstainless steel has been explained by Mei and Morris [10].According to the suggested analyses by Mei and Morris [10],compressive residual stresses originating from volumetric expan-sion and the shear strain associated with the strain generatedduring phase transformation decreases the crack tip stress field.Similar understanding can be invoked to the observed phenom-enon. As the plastic deformation during crack initiation of mono-tonic fracture toughness specimens remains confined to themonotonic plastic zone, the g to a0 transformation is expectedto be confined within the volume swept out by it, which is notaffected by any alternate extraneous stress field. During mono-tonic fracture toughness tests the extent of the influence oftearing induced deformation at the crack tip is considerablyhigher compared to that associated with cyclic fracture toughnessspecimens and this leads to increased propensity of martensitictransformation and hence higher amount of observed martensite

Fig. 8. (a) Hardness profile of the crack front under monotonic J and
(b) corresponding area coated with ferrofluid highlighting the presence of a0-martensite. The arrow shows the direction of crack propagation. (For interpreta-
tion of the references to colour in this figure, the reader is referred to the web
version of this article.)
H. Roy et al. / Materials Science & Engineering A 561 (2013) 88–99 93
volume fraction around crack initiation region. This can beexplained in the following manner. In the monotonic fracturetoughness tests a part of the supplied energy is used for crackextension by tearing while the rest is used for deformationprocess. The part that is utilized for deformation is responsiblefor phase transformation in the metastable microstructure. Cyclicfracture toughness tests unlike monotonic fracture toughnessinvolve periodic unloadings and hence the supplied energy isspent in a threefold manner: (i) for crack extension by tearing, (ii)for crack extension by fatigue and (iii) for deformation of materialahead of crack tip. As a consequence, the energy available fordeformation in monotonic fracture toughness is more in compar-ison to cyclic fracture toughness, and hence one finds moreamount of martensite in monotonic fracture toughness than incyclic fracture toughness specimens. In support for the aboveexplanation one can examine the load–load line displacementcurves of the two types of tests (Fig. 11); the supplied energy inmonotonic fracture toughness specimens manifested by increaseddisplacement associated with higher load is more in comparisonto the cyclic fracture toughness ones. The argument can be further
strengthened by the observations related to the amount ofmartensite associated with cyclic fracture toughness specimenstested at different R values for constant DV of 0.1 mm. As themagnitude of R increases in cyclic fracture toughness, energyutilization for crack extension (as crack grows more by fatigue)becomes more than that for causing deformation, and hence theextent of martensite associated with crack initiation process isalso expected to decrease, as observed in the results illustrated inTable 3. In generalization, therefore, the additional crack exten-sion in cyclic fracture toughness due to fatigue diminishes theeffective driving force available for deformation than in mono-tonic fracture toughness which leads to higher martensite inmonotonic fracture toughness than in cyclic fracture toughnessspecimens. Moreover, earlier researchers [3–5] have observedthat during cyclic fracture toughness tests there is some amountof tensile residual stress that remains in each unloading cyclewhich could probably lead to incomplete transformation ofe-martensite-a0-martensite. This leads to the observed presenceof some e-martensite in R¼�0.5 and R¼�0.8. The absence ofe-martensite in cyclic fracture toughness specimens tested atR¼�1.0 and in monotonic fracture toughness tests unlike that incyclic fracture toughness specimens tested at R¼�0.5 andR¼�0.8 are interesting observations. Deformation induced trans-formation of e and a0-martensite has been the subject of severalinvestigations [13,14,18,32–34] under tensile, compressive, biax-ial and fatigue loading etc. It is established in the earlierinvestigations that Ms temperature gets significantly influencedby tensile, compressive and hydrostatic loading modes apart fromstrain rate and temperature. However the obtained results by theearlier investigators are controversial in nature specifically withrespect to the relation between propensity towards martensitictransformation and mode of loading. In case of fatigue andfracture, additional influence on phase transformation originatesfrom the crack closure induced due to either plasticity orroughened cracked surfaces [35]. For example the phenomenonof crack closure in metastable austenitic stainless steel causesfurther alteration in phase transformation from austenite tomartensite [18].
In the present investigation, during monotonic fracture tough-ness tests, plasticity induced crack closure is operative while incyclic fracture toughness tests both plasticity and surface rough-ness induced closures are possible because the cracked surfacesrub each other during compressive cycling part. It is difficult toestimate the deviatoric (tensile, compressive) and hydrostaticcomponents of stress when the crack remains closed during cyclicfracture toughness tests. It can only be considered that themagnitude of the deviatoric component is sufficiently high inmonotonic fracture toughness tests which possibly lead to earlyformation of e-martensite with its immediate transformation toa0 form. In case of cyclic fracture toughness specimens, dependingon R-ratio, the magnitude of the deviatoric and hydrostaticstresses alter and it is considered that this alternation is favour-able for the formation of e-martensite followed by transformationof only a part of this phase to a0. This is what has been observedfrom the recorded data of X-ray profiles for cyclic fracturetoughness specimens tested at R¼�0.5 and R¼�0.8. AtR¼�1.0, the magnitude of these stress component are higherwhich leads to complete transformation of e to a0 martensite.Thus in generalization it can be inferred, that crack closure andrubbing of surfaces during cyclic fracture toughness tests doinduce phase transformation from austenite to martensite butthe nature and amount of martensite is dependent on themagnitude of R.
Typical TEM bright field images obtained from thin foils,prepared from the transverse section near the crack front (about1.2–1.5 mm away from fracture surface) of both monotonic

Fig. 9. Hardness profile of the crack front under cyclic J at (a) R¼�0.5, (b) R¼�0.8 and (c) R¼�1.0. Corresponding areas coated with ferrofluid highlighting the presence
of a0-martensite as shown in (d), (e) and (f) respectively. The arrow at the top shows the direction of crack propagation. (For interpretation of the references to colour in
this figure, the reader is referred to the web version of this article.)
H. Roy et al. / Materials Science & Engineering A 561 (2013) 88–9994
fracture and cyclic fracture toughness specimens are illustrated inFig. 12. TEM results in Fig. 12 exhibit randomly distributeddislocation structure in monotonic fracture test specimenswhereas diffused sub-cell structure in cyclic fracture test speci-mens. In addition to dislocation substructure, both monotonic
and cyclic fracture test specimens exhibit shear bands and/ortwins (Fig. 13) which are difficult to distinguish without theevidence of SAD patterns. In monotonic fracture test specimensthe twins are confirmed by the presence of double diffractionspots while in cyclic fracture test specimens, absence of the same

40 50 60 70 80 90 1000
20
40
60
80
100
120
140
(202)(110)(311)(220)
(200)
2θ
Inte
nsity
, au
(111)Austenite
40 50 60 70 80 90 100
10
20
30
40
50
60
70
80
90
(211)(211) (311)
(220)
(200)
(111)
Inte
nsity
, a.u
2θ
α' martensiteAustenite
ε martensite
α' martensite
Fig. 10. X-Ray diffraction pattern showing formation of only a0-martensite in (a)
R¼�1.0, whereas both a0-martensite and e-martensite are found to occur for (b)
R¼�0.8.
Table 3Volume fractions of deformation induced martensite phases formed during
monotonic and cyclic fracture toughness tests.
Type of test Vol. fraction
of a0-martensite
Vol. fraction
of e-martensite
Monotonic J 34% –
Cyclic J (R¼�0.5) 25% 5
Cyclic J (R¼�0.8) 12% 4
Cyclic J (R¼�1.0) 17% –
0 4 8 12 16 20 24 28-40
-20
0
20
40
60
80
Loa
d, k
N
Load line displacement, mm
Monotonic J
Cyclic J
Fig. 11. Load–load line displacement curves obtained from monotonic and cyclic
fracture tests of AISI 304LN stainless steel.
500 nm
Twins
500 nm
'(12 1)α−−
'(1 21)α−
(111)γ−
(111)γ−−
Fig. 12. TEM bright field image showing (a) the presence of twins and a0-martensite (with a zone axis of [211] in g austenite matrix with zone axis [311]
in monotonic J sample and (b) cell structure formation in cyclic J specimen.
H. Roy et al. / Materials Science & Engineering A 561 (2013) 88–99 95
signifies that these features are primarily shear bands. It istherefore evident that monotonic deformation encourages twinformation whereas cyclic deformation around the crack tip tendsto suppress the same. The following arguments can be invoked
for this observed phenomenon: formation of twins takes placewhenever deformation by dislocation glide is not favoured, e.g. whengrain-orientations are unfavourable or when sub-microstructuralconstituents prevent easy glide. During cyclic plastic deformation,repetitive opportunities are available for dislocation glide in eachcycle and the propensity towards twin formation is decreased. Duringmonotonic deformation, on the other hand, the continually increasingstress–strain triggers preferential twin formation whenever disloca-tion glide is unfavourable.
An attempt has been directed to reveal the formation andlocation of martensite in monotonic and cyclic fracture testspecimens using TEM investigations. The deformation inducedmartensite in AISI 304LN stainless steel can occur at variouslocations like isolated shear bands, shear band interactions, shearband grain boundary intersection, grain boundary triple point,twin boundaries etc. as reported earlier by several earlier inves-tigators [36–38]. Das and Tarafder [36] have shown that forma-tion of martensite at all the above mentioned locations can occurduring tensile deformation of AISI 304LN stainless steel. In thisinvestigation martensite has been found primarily at regionsadjacent to twin boundaries during loading of monotonic fracturetest samples. A typical TEM bright field image along with thecorresponding selected area diffraction pattern, taken from theencircled region are shown in Fig. 12(a) in order to provideevidence for the formation of martensite during monotonicfracture process. The substructural features in cyclic fracture testspecimens exhibit primarily dislocation cell like morphology(Fig. 12b). The dimensions of these cellular domains are found
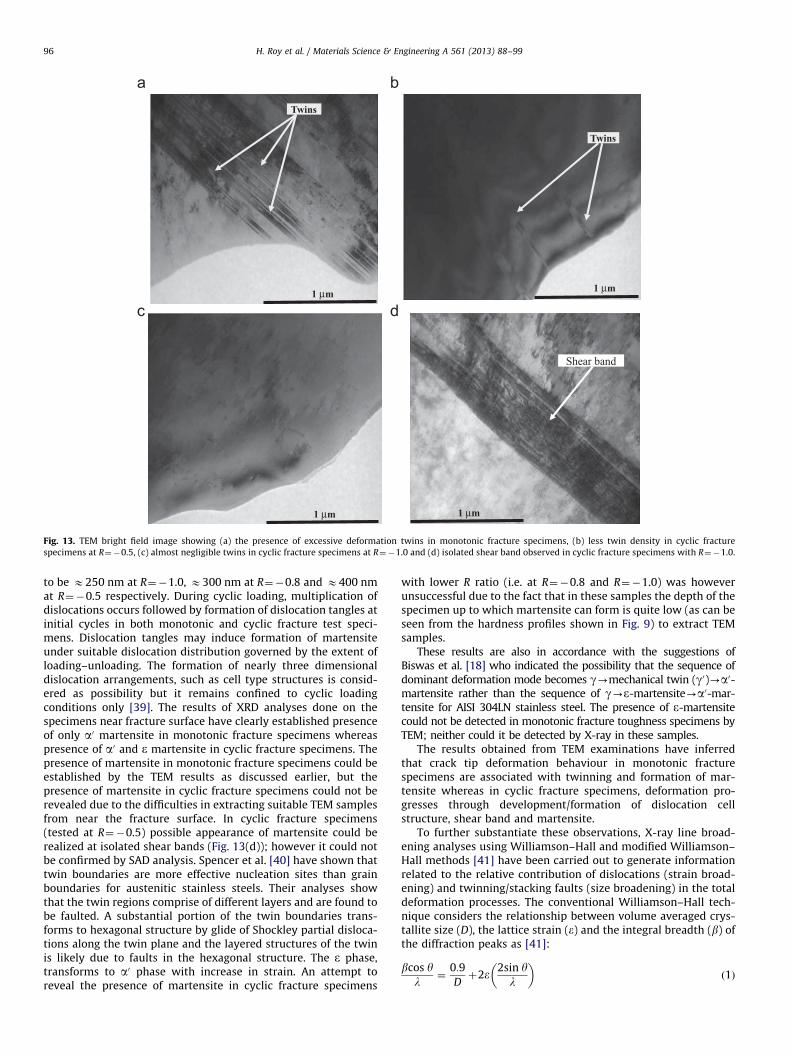
1 µm 1 µm
1 µm 1 µm
Twins
Shear band
Twins
Fig. 13. TEM bright field image showing (a) the presence of excessive deformation twins in monotonic fracture specimens, (b) less twin density in cyclic fracture
specimens at R¼�0.5, (c) almost negligible twins in cyclic fracture specimens at R¼�1.0 and (d) isolated shear band observed in cyclic fracture specimens with R¼�1.0.
H. Roy et al. / Materials Science & Engineering A 561 (2013) 88–9996
to be E250 nm at R¼�1.0, E300 nm at R¼�0.8 and E400 nmat R¼�0.5 respectively. During cyclic loading, multiplication ofdislocations occurs followed by formation of dislocation tangles atinitial cycles in both monotonic and cyclic fracture test speci-mens. Dislocation tangles may induce formation of martensiteunder suitable dislocation distribution governed by the extent ofloading–unloading. The formation of nearly three dimensionaldislocation arrangements, such as cell type structures is consid-ered as possibility but it remains confined to cyclic loadingconditions only [39]. The results of XRD analyses done on thespecimens near fracture surface have clearly established presenceof only a0 martensite in monotonic fracture specimens whereaspresence of a0 and e martensite in cyclic fracture specimens. Thepresence of martensite in monotonic fracture specimens could beestablished by the TEM results as discussed earlier, but thepresence of martensite in cyclic fracture specimens could not berevealed due to the difficulties in extracting suitable TEM samplesfrom near the fracture surface. In cyclic fracture specimens(tested at R¼�0.5) possible appearance of martensite could berealized at isolated shear bands (Fig. 13(d)); however it could notbe confirmed by SAD analysis. Spencer et al. [40] have shown thattwin boundaries are more effective nucleation sites than grainboundaries for austenitic stainless steels. Their analyses showthat the twin regions comprise of different layers and are found tobe faulted. A substantial portion of the twin boundaries trans-forms to hexagonal structure by glide of Shockley partial disloca-tions along the twin plane and the layered structures of the twinis likely due to faults in the hexagonal structure. The e phase,transforms to a0 phase with increase in strain. An attempt toreveal the presence of martensite in cyclic fracture specimens
with lower R ratio (i.e. at R¼�0.8 and R¼�1.0) was howeverunsuccessful due to the fact that in these samples the depth of thespecimen up to which martensite can form is quite low (as can beseen from the hardness profiles shown in Fig. 9) to extract TEMsamples.
These results are also in accordance with the suggestions ofBiswas et al. [18] who indicated the possibility that the sequence ofdominant deformation mode becomes g-mechanical twin (g0)-a0-martensite rather than the sequence of g-e-martensite-a0-mar-tensite for AISI 304LN stainless steel. The presence of e-martensitecould not be detected in monotonic fracture toughness specimens byTEM; neither could it be detected by X-ray in these samples.
The results obtained from TEM examinations have inferredthat crack tip deformation behaviour in monotonic fracturespecimens are associated with twinning and formation of mar-tensite whereas in cyclic fracture specimens, deformation pro-gresses through development/formation of dislocation cellstructure, shear band and martensite.
To further substantiate these observations, X-ray line broad-ening analyses using Williamson–Hall and modified Williamson–Hall methods [41] have been carried out to generate informationrelated to the relative contribution of dislocations (strain broad-ening) and twinning/stacking faults (size broadening) in the totaldeformation processes. The conventional Williamson–Hall tech-nique considers the relationship between volume averaged crys-tallite size (D), the lattice strain (e) and the integral breadth (b) ofthe diffraction peaks as [41]:
bcos yl¼
0:9
Dþ2e 2sin y
l
� �ð1Þ

4 5 6 7 8 9 10
0.03
0.04
0.05
0.06
0.07
0.08
[222]
[311]
[220]
[200]
[111]
ΔK
K (nm-1)
4 5 6 7 8 9 10 11 12
-0.02
0.00
0.02
0.04
0.06
0.08
0.10[400]
[311]
[222][220]
[200]
[111]
cyclic J (R = -0.5) cyclic J (R = -0.8) cyclic J (R = -1.0)
K (nm-1)
ΔK (n
m-1
)ΔK
(nm
-1)
Fig. 14. (a) Conventional Williamson–Hall plot for monotonic fracture test
sample. (b) Conventional Williamson–Hall plot for cyclic fracture test samples.
Fig. 15. (a) Modified Williamson–Hall plot for monotonic fracture test specimens
excluding planar fault effect. (b) Modified Williamson–Hall plot for cyclic fracture
test specimens excluding planar fault effect.
H. Roy et al. / Materials Science & Engineering A 561 (2013) 88–99 97
or
DK ¼0:9
Dþ2eK ð2Þ
where y¼angular position of peak and l¼wavelength of mono-chromatic X-Ray. The magnitude of DK refers to peak broadeningwhile the value of K is considered to be the coefficient of straincontribution (e) towards line broadening.
Williamson–Hall plots i.e. DK vs. K (associated with eachreflection) for monotonic and cyclic fracture specimens have beenconstructed in Fig. 14a and Fig. 14b, respectively. The variation ofDK vs. K for monotonic fracture specimens does not exhibit anysystematic trend, whereas DK shows an increasing trend with K
for cyclic fracture specimens. Increasing trend of DK with K forcyclic fracture specimens in Williamson–Hall plot implies dom-inance of strain broadening (due to dislocations) over size broad-ening due to twins/stacking faults.
To understand the contribution of defects like stacking faults,twins etc. other than dislocations, commonly modifiedWilliamson–Hall technique is used to analyze X-ray line profile[42]:
DK ¼0:9
Dþa0 KC
1=2� �2
þO KC1=2
� �4ð3Þ
where a0 is a constant, C is the contrast factor due to strain field ofdislocations and O stands for higher order terms.
Values of the contrast factors for all the concerned reflectionshave been calculated for 304 L(N) stainless steel (fcc) from elasticcompliance values (C11¼204.6, C12¼137.7, C44¼126.2) reportedby Vitos et al. [43] with the help of ANIZC program [42]. Thevariation between DK and KC
1=2values (for each reflection) has
been depicted in Fig. 15(a) and (b) for monotonic and cyclic
fracture specimens, respectively. The modified Williamson–Hallplot for cyclic fracture specimens exhibit linear relationshipbetween DK and KC
1=2values associated with R2
Z0.93. Thislinear relationship infers dominance of strain broadening due todislocations in cyclic fracture specimens. In contrast to themodified Williamson–Hall plot for cyclic fracture specimens, therelationship between DK and KC
1=2values for monotonic speci-
mens can be better expressed in a quadratic form except forreflections like (220) and (200). The associated R2 value for thisquadratic fitting is 0.96. The quadratic nature of modifiedWilliamson–Hall plots for monotonic fracture specimens indi-cates that the deformation behaviour around the crack tip in thisspecimen is not solely governed by dislocations.
In order to achieve further insight related to the influence ofdifferent factors on the recorded line broadening, size componentof the line broadening (DKs) has been estimated followingWarren’s formulation as reported by Ungar [44]:
DKS¼
0:9
Dþb0W gð Þ ð4Þ
where W (g) is a function dependent on particular reflection (g)and b0 is the planar fault probability.
Values of W (g) for different reflections in 304 L(N) stainlesssteel are obtained from literature [44]. Considering a largenumber of b0 values between 10�5 and 10�1, a series of plotsbetween [K–b0W(g)] and (KC
1=2) were constructed and their
associated R2 values were computed for monotonic and cyclicfracture specimens. These analyses indicate that R2 valuesdecrease for fitting [DK–b0W(g)] vs. KC
1=2with incorporation of
b0 in case of cyclic fracture specimens whereas the values of R2
increase for monotonic fracture specimens. These analyses signifya definite influence of b0 values on deformation behaviour around

Fig. 16. Modified Williamson–Hall plot for monotonic fracture test sample taking the planar fault effect into account.
H. Roy et al. / Materials Science & Engineering A 561 (2013) 88–9998
the crack tip of monotonic fracture specimens. The highest valueof R2 has been obtained for b0 ¼0.01 (Fig. 16) which implies thatthere exists the probability of finding a twin in every hundredthplane. This inference is well supported by the TEM observationsreported earlier.
In generalization, it can be convincingly argued based on thepresent observations and their pertinent analyses that the formationof substructure and microstructure associated with the regimeswhere crack initiation occurs in monotonic fracture toughness andcyclic fracture toughness specimens are different. In monotonicfracture toughness specimens higher twin density interfaced withhigher volume fraction of martensite originates unlike lower volumefraction of martensite formed in a cellular type structure beingobserved in cyclic fracture toughness specimens. Interestingly,fracture toughness of monotonic fracture toughness specimens isconsiderably higher than that in cyclic fracture toughness speci-mens. It has been argued earlier that this phenomenon is primarilydue to crack tip resharpening in cyclic fracture toughness speci-mens. On the basis of the present results it can be inferred thathigher amount of martensite formation in monotonic fracturetoughness specimens of AISI 304LN stainless steel results in higherenergy absorption at the point of crack initiation unlike in cyclicfracture toughness specimens. Thus, higher fracture toughness ofmonotonic fracture toughness specimens compared to cyclic frac-ture toughness specimens are resultant of both crack tip resharpen-ing in cyclic fracture toughness specimens and higher extent ofmartensitic transformation in the former ones.
4. Conclusions
Investigations on monotonic and cyclic fracture resistance ofAISI 304LN stainless steel reveal that the minimum J0.2 value
under cyclic fracture toughness test is only 20% of that undermonotonic fracture toughness tests [9]. The associated in-depthstudies on the variation of sub-structure and microstructureduring these tests lead to the following conclusions:
1.
The estimated amount of deformation induced martensiteahead of crack tips in specimens subjected to monotonicfracture toughness tests is considerably higher (34 vol%) com-pared to that (25, 17 and 12 vol%) observed in specimenssubjected to cyclic fracture toughness tests at different R ratios.This is due to free deformation ahead of the crack tip duringmonotonic fracture toughness tests as opposed to constraineddeformed volume during cyclic fracture toughness tests.2.
Presence of e-martensite can be detected ahead of crack-tips inspecimens subjected to cyclic J-integral tests unlike that inmonotonic ones. In general e-martensite is an intermediatetransformation prior to formation of a� martensite; theuntransformed e-martensite can be attributed to modifiedstress/strain field ahead of crack tip in cyclic J integral tests.3.
Microstructural locations at which deformation induced mar-tensite gets triggered off is different for specimens subjected tomonotonic and cyclic fracture tests. In the former specimens(monotonic fracture toughness), formation of deformationinduced martensite occurs primarily near twin boundariesunlike its formation at isolated dislocation tangles in thelatter ones.4.
The results obtained from TEM and X-ray line profile analysesunambiguously confirm that twinning plays the governing rolein crack tip deformation behaviour in monotonic fracturetoughness specimens whereas dislocations and shear bandsexhibit predominance in cyclic fracture toughness specimens.5.
The observed higher fracture toughness of monotonic fracturetoughness specimens compared to cyclic fracture toughness
H. Roy et al. / Materials Science & Engineering A 561 (2013) 88–99 99
specimens of AISI 304LNSS are resultant of both crack tipre-sharpening occurring in latter specimens and higher extentof martensitic transformation in the former ones.
Acknowledgement
One of the authors (H. Roy) gratefully acknowledges the financialsupport from the Department of Science and Technology (DST),Government of India for awarding him the BOYSCAST fellowshipunder which program a part of this investigation was carried out. Theauthors would like to thank H. Daoud for her assistance in XRD testsand H. Lassner for TEM sample preparation.
References
[1] K. Mogami, T. Hayashi, K. Ando, V. Ogura, Int. J. Pressure Vessels Piping 44(1990) 85–97.
[2] J.D. Landes, H. Walker, A.G. Clarke, Elastic Plastic Fracture ASTM STP 668(1979) 266–287.
[3] H. Kobayashi, T. Kusumoto, H. Nakazawa, Int. J. Pressure Vessels Piping 52(1992) 337–356.
[4] C.S. Seok, K.L. Murty, Int. J. Pressure Vessels Piping 77 (2000) 303–311.[5] P.K. Singh, J. Chattopadhyay, H.S. Khuswaha, S. Tarafder, V.R. Ranganath, Int. J.
Pressure Vessels Piping 75 (1998) 271–280.[6] P.K. Singh, V.R. Ranganath, S. Tarafder, P. Prasad, V. Bhasin, K.K. Vaze,
H.S. Khuswaha, Int. J. Pressure Vessels Piping 80 (2003) 745–752.[7] H. Roy, S. Sivaprasad, S. Tarafder, K.K. Ray, Eng. Fract. Mech. 76 (2009)
1822–1832.[8] C.W. Marshall, G.M. Wilkowski, J. Pressure Vessel Technol. 113 (1993)
358–367.[9] H. Roy, S. Sivaprasad, S. Tarafder, K.K. Ray, Fatigue Fract. Eng. Mater. Struct.
35 (2011) 108–113.[10] Z. Mei, J.W. Morris Jr., Metall. Trans. A 21 (1990) 3137–3152.[11] E. Nagy, V. Mertinger, F. Tranta, Mater. Sci. Eng. A 378 (2004) 308–313.[12] A.K. Dey, D.C. Murdoch, M.C Mataya, J.C. Speer, D.K. Matlock, Scripta Mater.
50 (2000) 1445–1449.[13] A. Das, S. Sivaprasad, M. Ghosh, P.C. Chakraborty, S. Tarafder, Mater. Sci. Eng.
A 486 (2008) 283–286.
[14] K. Dutta, S. Sivaprasad, S. Tarafder, K.K. Ray, Mater. Sci. Eng. A 527 (2010)7571–7579.
[15] U. Krupp, C. West, H.J. Christ, Mater. Sci. Eng. A 481–482 (2008) 713–717.[16] J. Talonen, P. Aspegren, H. Hanninen, Mater. Sci. Technol. 20 (2004)
1506–1512.[17] J. Talonen, N. Pertti, P. Gersom, H. Hanninen, Metall. Trans. A 36 (2005)
421–432.[18] S. Biswas, S. Sivaprasad, N. Narasaiah, S. Tarafder, P.C. Chakraborti, Int.
J. Fatigue 29 (2007) 786–791.[19] J.Y. Choi, W. Jin, Scripta Mater. 36 (1997) 99–104.[20] M.S. Andrade, O.A. Gomes, J.M.C Vilela, A.T.L Serrano, J.M.D. de Moraes,
J. Braz. Soc. Mech. Sci. Eng. XXVI (2004) 47–50.[21] W.S. Lee, C.F. Lin, Mater. Sci. Eng. A 308 (2001) 124–135.[22] K. Tsuzaki, T. Maki, I. Tamura, J. Phys. C4 (1982) 423–428.[23] E112-09, Annual book of ASTM standards, 2009.[24] E647-09, Annual Book of ASTM Standards, 2009.[25] E1820-09, Annual Book of ASTM Standards, 2009.[26] N.E. Dowling, J.A. Begley, ASTM STP 590 (1976) 82–103.[27] A. Ray, Th.M. Fischer, Eur. Phys. J. E 35 (2012) 17–23.[28] ISO 14577-1, Metallic Materials—Instrumented Indentation Test for Hard-
ness and Materials Parameters-Part 1: Test method, 2002.[29] Report no. MST/304IR-1, Evaluation of Fatigue and Fracture Behaviour of
Narrow Gap Pipe Weldments of Similar and Dissimilar Metals, NationalMetallurgical Laboratory, Jamshedpur, India, March 2005.
[30] D.L. Rudland, F. Burst, G.M. Wilkowski. Technical Report no. NUREG/ CR-6440, 1996.
[31] P. Sahu, M. Dey, S. Kajiwara, J. Alloys Compd. 346 (2002) 158–169.[32] D. Taylor, J.F. Knott, Fatigue Eng. Mater. Struct. 4 (1981) 147–152.[33] J.R. Patel, M. Cohen, Acta Metall. 1 (1953) 531–538.[34] T. Iwamoto, T. Tsuta, Y. Tomita, Int. J. Mech. Sci. 20 (1998) 173–182.[35] R.O. Ritchie, Int. J. Fract. 100 (1999) 55–83.[36] A. Das, S. Tarafder, Int. J. Plasticity 25 (2009) 2222–2247.[37] G.B. Olson, M. Cohen, Met. Trans. A 7 (1976) 1905–1914.[38] K. Spencer, J.D. Embury, K.T. Conlon, M. Veron, Y. Brechet, Mater. Sci. Eng. A
387–389 (2004) 873–881.[39] H. Mugarabi, H.J. Christ, ISIJ Int. 37 (1997) 1154–1169.[40] K. Spencer, M. Veron, K.Y. Zhang, J.D. Embury, Mater. Sci. Technol. 25 (2009)
7–17.[41] T. Ungar, J. Gubicza, G. Ribarik, A. Borbely, J. Appl. Cryst. 34 (2001) 298–310.[42] T. Ungar, S. Ott, P.G. Sanders, A. Borbely, J.R. Weertman, Acta Mater. 46 (1998)
3693–3699.[43] L. Vitos, P. Korzhavyi, B. Johansson, Nat. Mater. 2 (2003) 25–28.[44] T. Ungar, International Centre for Diffraction Data. vol. 40 (1997).