
Structural targeting for heat integration retrofit
12
STRUCTURAL TARGETING FOR HEAT INTEGRATION RETROFIT Jos L. B. van Reisen,*$ Graham T. Polley$$ and Peter J. T. Verheijen$ $Department of Chemical Engineering, Delft University of Technology, Julianalaan 136, 2628 BL Delft, The Netherlands; and $$Department of Chemical Engineering, UMIST, P.O. Box 88, Manchester M6O 1QD, UK (Received 17 July 1997) Abstract—A new targeting method for the retrofit of heat exchangers networks is presented. It com- bines existing targeting and design methods for retrofit with the concept of zoning used in grassroots design. The structural targeting retrofit method gives targets not only for the utility saving and exchan- ger area investment, but also for the extent and locations of the required modifications. This targeting requires a special way of zoning based on the existing network. This zoning is extensively discussed. Practical aspects like functionality, lay-out and operability can be taken into account. Two case studies are presented: a simplified aromatics and a real C3/C4 separation case. Both cases illustrate that struc- tural targeting is an eective method to identify parts of the original network with a high saving to investment potential. The method favours simple adaptations and is especially eective for large net- works. The C3/C4-case also shows how structural targeting provides a number of alternatives, many of which are independent of each other, to adapt the existing network. The retrofit design eort is signifi- cantly reduced compared to existing methods. # 1998 Elsevier Science Ltd. All rights reserved Keywords—Heat exchanger networks, zoning, structural targeting methodology, layout, case studies. INTRODUCTION Process integration procedures concentrate on the trade-o between operating costs and capital investment to get a cost eective design. In targeting-based procedures the design is created only after a pre-analysis or screening phase. This allows the user to set the key design characteristics, called targets, such as the area and utility requirements, that are optimal on some (economic) measure and that take into account any other criteria and demands. The final design is often very dependent on the used targets. Targeting for heat exchanger network design must thus take into account all aspects that contribute substantially to the energy and capital cost. At the same time, a targeting procedure must remain simple for it has to be fast and suciently transparent to allow user interaction. These features give targeting an advantage over rigorous mathematical synthesis techniques, such as those presented by Yee and Grossmann [1] and Ciric and Floudas [2], and also that presented by Briones and Kokossis [3], that allows some user inter- action, but requires a complicated three-stage optimisation. The retrofit of heat exchanger networks aims at cost eective adaptations of the existing net- work to reduce the energy costs. This requires investments both to add area and modify the existing structure, which includes the installation of new units with new connections and the modification of the pipe-runs. The amount of area that is added in each modification hardly in- fluences the costs of the structural modifications and is, generally, evaluated independently. The costs of the structural modifications are built from several contributions. These costs increase with the number of modifications that are required, and the number of streams and which streams are involved. Streams that are close together or already connected in the existing situ- ation are easier and cheaper to connect than those that are very far apart or, for example, in dierent safety zones. Obviously, addition of area to existing matches generally requires little structural adaptations and is thus preferred over the installation of new matches. An economical Applied Thermal Engineering Vol. 18, No. 5, pp. 283–294, 1998 # 1998 Elsevier Science Ltd. All rights reserved Printed in Great Britain 1359-4311/98 $19.00 + 0.00 PII: S1359-4311(97)00067-7 *Author to whom correspondence should be addressed. 283
Transcript of Structural targeting for heat integration retrofit

STRUCTURAL TARGETING FOR HEAT INTEGRATION
RETROFIT
Jos L. B. van Reisen,*$ Graham T. Polley$$ and Peter J. T. Verheijen$$Department of Chemical Engineering, Delft University of Technology, Julianalaan 136, 2628 BL
Delft, The Netherlands; and $$Department of Chemical Engineering, UMIST, P.O. Box 88,Manchester M6O 1QD, UK
(Received 17 July 1997)
AbstractÐA new targeting method for the retro®t of heat exchangers networks is presented. It com-bines existing targeting and design methods for retro®t with the concept of zoning used in grassrootsdesign. The structural targeting retro®t method gives targets not only for the utility saving and exchan-ger area investment, but also for the extent and locations of the required modi®cations. This targetingrequires a special way of zoning based on the existing network. This zoning is extensively discussed.Practical aspects like functionality, lay-out and operability can be taken into account. Two case studiesare presented: a simpli®ed aromatics and a real C3/C4 separation case. Both cases illustrate that struc-tural targeting is an e�ective method to identify parts of the original network with a high saving toinvestment potential. The method favours simple adaptations and is especially e�ective for large net-works. The C3/C4-case also shows how structural targeting provides a number of alternatives, many ofwhich are independent of each other, to adapt the existing network. The retro®t design e�ort is signi®-cantly reduced compared to existing methods. # 1998 Elsevier Science Ltd. All rights reserved
KeywordsÐHeat exchanger networks, zoning, structural targeting methodology, layout, case studies.
INTRODUCTION
Process integration procedures concentrate on the trade-o� between operating costs and capital
investment to get a cost e�ective design. In targeting-based procedures the design is created only
after a pre-analysis or screening phase. This allows the user to set the key design characteristics,
called targets, such as the area and utility requirements, that are optimal on some (economic)
measure and that take into account any other criteria and demands. The ®nal design is often
very dependent on the used targets. Targeting for heat exchanger network design must thus take
into account all aspects that contribute substantially to the energy and capital cost. At the same
time, a targeting procedure must remain simple for it has to be fast and su�ciently transparent
to allow user interaction. These features give targeting an advantage over rigorous mathematical
synthesis techniques, such as those presented by Yee and Grossmann [1] and Ciric and
Floudas [2], and also that presented by Briones and Kokossis [3], that allows some user inter-
action, but requires a complicated three-stage optimisation.
The retro®t of heat exchanger networks aims at cost e�ective adaptations of the existing net-
work to reduce the energy costs. This requires investments both to add area and modify the
existing structure, which includes the installation of new units with new connections and the
modi®cation of the pipe-runs. The amount of area that is added in each modi®cation hardly in-
¯uences the costs of the structural modi®cations and is, generally, evaluated independently. The
costs of the structural modi®cations are built from several contributions. These costs increase
with the number of modi®cations that are required, and the number of streams and which
streams are involved. Streams that are close together or already connected in the existing situ-
ation are easier and cheaper to connect than those that are very far apart or, for example, in
di�erent safety zones. Obviously, addition of area to existing matches generally requires little
structural adaptations and is thus preferred over the installation of new matches. An economical
Applied Thermal Engineering Vol. 18, No. 5, pp. 283±294, 1998# 1998 Elsevier Science Ltd. All rights reserved
Printed in Great Britain1359-4311/98 $19.00+0.00PII: S1359-4311(97)00067-7
*Author to whom correspondence should be addressed.
283

and practical retro®t should thus reduce the energy costs by a proper balance of the amount ofnew area, the number of structural modi®cations and feasibility of these modi®cations.
Most of the current targeting methods for the retro®t of heat exchanger networks, like themethod of Tjoe [4, 5], solely trade o� energy savings and addition of area. The area cost usedfor this trade-o� only evaluates the lumped amount of area without any reference to the streamsthat are involved. The costs of structural modi®cations are not taken into account. One result isthat the procedure can favour complicated structural changes. Attractive simple opportunitiesmay be overlooked.
A recent mathematical analysis method proposed by Asante and Zhu [6] searches for the sim-plest modi®cations that have the largest energy savings. However, they ignore the investmentrequired to achieve this saving. Further, this method, like the method of Carlsson et al. [7], isan evolutionary rather than targeting approach. The alternative modi®cations are only evaluatedafter the most attractive modi®cation has been made. This way, opportunities for smaller, butmore pro®table modi®cations and combinations of modi®cations may be overlooked.Recently, Van Reisen et al. [8] presented a basic procedure, called Path Analysis, to evaluate
a number of substructures or subnetworks (i.e. independent fractions of the existing heat exchan-ger network) to ®nd the most economical and practical opportunities to save energy.Principally, this procedure allows the engineer to evaluate structural aspects of a retro®t duringtargeting. We call such evaluation structural targeting.In this paper, we present an extension of that original procedure. The result is a retro®t
method which takes into account all three essential aspects: saving, area investment and struc-tural modi®cations. The most crucial step is the de®nition of structural unities in the existingnetwork. These we call zones, and their de®nition and use to build subnetworks will cover themajor part of this paper.
PATH ANALYSIS: THE BASIS FOR STRUCTURAL TARGETING
Path Analysis [8] allows the identi®cation of the subnetworks of an existing network, thathave good economical retro®t potentials on their own. This way, locations or combinations oflocations can be found that have good savings to investment ratios compared with that of theentire network. These savings can be achieved by modi®cation of the selected locations only,irrespective of the remaining network. For example, an independent subnetwork exists in Fig. 1containing the exchangers H2, E1 and C2, and the streams Hot2 and Cold2. Energy saving ispossible within this subnetwork when process-to-process heat exchange is intensi®ed betweenHot2 and Cold2. This requires the addition of area to E1. The exchangers outside the subnet-work are not a�ected. Similarly, just a new match between stream Hot1 and Cold1 allowsenergy saving within the subnetwork that consists of the exchangers H1 and C1.
Fig. 1. Example network.
J. L. B. van Reisen et al.284

Subnetworks must contain at least a heater and a cooler to allow any energy saving. Theycan be systematically extended until all exchangers are included. In the example, obviously noenergy saving is possible within the subnetwork that consists of exchanger H1 only. No alterna-tive heat source is available in this case to replace the hot utility. Besides the heater and thecooler, a path is required to shift the available heat from the cooler to the heater. Such a pathmay exist in the original network as in the subnetwork H2-E1-C2 or must be created throughthe formation of a new heat recovery match as in the subnetwork H1-C1. The demarcation ofrelevant subnetworks, that takes into account all these and occasionally other practical aspects,will be discussed later in this paper.
Path Analysis evaluates all demarcated subnetworks to identify the most optimal ones formodi®cation. The complete procedure of a retro®t using Path Analysis is given in Fig. 2.After data extraction and the de®nition of the base case, savings on area investment targetsare calculated ®rst for the entire network using one of the available retro®t targetingmethods [4]. These targets for the entire network are taken as a reference. Next, the relevantsubnetworks are de®ned. For each of them the savings on investment targets are calculatedusing the same targeting method. The subnetworks are evaluated and the best are kept. Formany problems, the subnetworks are ranked graphically using the saving on investment plots.This graphical evaluation gives the most insight for problems with small numbers of relevantsubnetworks. Only large problems require numerical ranking or a stage-wise approach. Anexample will be given later. When the evaluation is completed retro®t designs are created forthe best subnetworks using one of the available retro®t design methods [4]. All streams andmatches outside the subnetwork are unmodi®ed. Finally, the designs are evaluated and theresults compared with the targets.
Fig. 2. Scheme of Path Analysis.
Structural targeting for heat integration retro®t 285

SUBNETWORKS AND ZONE DEMARCATION
The key to use the above procedure as structural targeting is the incorporation of the existingnetwork structure as the basis for the demarcation of the relevant subnetworks. Relevant sub-networks are therefore built by the combination of structural unities, these will be de®nedbelow. These unities we call zones similar to the de®nition of Ahmad and Hui [9], who intro-duced this concept for grassroots heat exchanger network targeting and design. They de®nedzones as logically identi®able areas, in which a process plant can often be divided associatedwith speci®c processing tasks or practical aspects like safety and layout. As in the grassrootscase, zones in retro®t must remain as self contained as possible. It is assumed that integrationwithin a zone is always feasible. Integration of di�erent zones requires more structural complex-ity. This is only desirable if it gives substantial additional savings or lower area investments. Aproper trade-o� is necessary. This is possible by the evaluation of all subnetworks that can bebuilt by the combination of zones. Subnetworks thus may range from a single zone to the entirenetwork.
Zones based on the existing network
The previous discussion shows that the existing structure must be used to split the existingnetwork in independent zones. Zones must demarcate parts of the network that can easily beintegrated. Thus, streams that are close together or connected in the existing situation can be inone zone. Further, it must be possible to make independent changes to any retro®t zone irre-spective of the network remaining outside this zone. Therefore, zones should be heat-balancedparts of the original network. The smallest heat-balanced parts of the existing network are thestream fractions originally covered by the individual process-to-process or process-to-utility heatexchangers. These network parts are the smallest zones that can be identi®ed. The maximumnumber of zones is thus the number of heat-exchangers present in the existing design. More in-formation about the existing structure must be included to get zones that are more practical forstructural targeting. The zones, however, will always be combinations of heat exchangers andtheir stream fractions.
Because of the basic demands, heat exchangers are always in just one zone. Streams, however,can ¯ow through several zones. In a single zone, a fraction of such a stream is handled and onlythis fraction is actually part of that zone. Each stream fraction is thus like each heat exchangerjust in one zone. Note that the utility streams must be included to heat balance the zones thatcontain a utility exchanger. The utilities have to be part of these zones explicitly and cannot beignored as is common in existing retro®t methods. The load of the utility stream is initially ®xedat the existing load in the exchanger. It may be changed later by a new network design.
Individual heat-balanced exchangers provide no scope for energy saving, as the inlet and out-let temperatures, and the heat capacity ¯owrate of the contacted streams are ®xed. To allow anyenergy saving a subnetwork must include, as mentioned before, both a heater, cooler and pathbetween this heater and cooler.
Paths help to demarcate the zones that are better suitable to include structure in targeting.During retro®t, one must exploit paths that exist in the original network or create new ones. Itwill be clear that the exploitation of existing paths is preferred. This only requires the additionof area to existing matches. The creation of a new path always requires a new match. On oc-casions it is useful in some cases to make a new match across an existing path in order toimprove its potential. This is generally still preferred over using a new match to create a comple-tely new path, for this involves streams that are local to each other geographically. Thus, a newmatch will generally be easier and cheaper between streams that are in an existing path thanbetween streams that are not connected at all. This also holds for matches between streams thatare connected through any part of a path, i.e. any chain of heat exchangers not necessarily con-necting any utility exchangers.
Zones should thus be based on the existent (parts of) paths to account for the di�erent kindsof matches that are possible. Such a `path-based zone' should contain all exchangers associatedwith a speci®c process stream and all streams these heat exchangers connect. The path-basedzones thus contain the independent parts of the original network. Each path will be in a separ-
J. L. B. van Reisen et al.286

ate zone. An additional bene®t of this way of zoning is that there is no need to ®nd boundarytemperatures for stream fractions that are in di�erent zones.
Aspects for re®ned zoning
The path-based zoning may still not give the zones that will be the most practical represen-tation of the structure. On one hand, the individual zones will be large if the network is highlyintegrated. This makes the assumption less acceptable that heat shifts and new matches will beeasier within zones than between zones. Also, the desired reduction of the design problem willbe limited and the localisation of the problem area may be too weak. On the other hand, thenumber of zones may still be too large to make a rigorous evaluation if the network is large andhas little integration. Therefore, the path-based zones should be further re®ned by splitting andcombining to get a practical set of re®ned zones. A number of aspects can be included in thisre®nement:
. The functionality of plant sections, as can be seen in the ¯owsheet, may justify the combi-nation of independent zones, for example, the reboiler, feed preheater and eventually conden-ser of a column.
. The physical lay-out may also justify the combination zones that are close together or the div-ision of zones that are spread out. This layout is not necessarily based on the functionalityand may result in rather di�erent zoning.
. A zone may contain a set of streams that can hardly be integrated because a local pinch inthe zone (a `zone pinch') prevents this. For example, the reboiler and condenser of a distilla-tion column may be in one zone. Integration is not possible. If such a zone is integrated withanother zone, generally only the heater or the cooler need to be integrated. In more generalterms, integration of a zone with a pinched zone generally only integrates with the heat sinkabove the zone pinch or the heat source below the zone pinch. The remaining part of thezone should not be modi®ed, but its presence may complicate the design process. Therefore,such a pinched zone may be split into two zones or more if near pinches or utility pinchesexist. If a stream crosses the zone pinch the split should be made between the two heatexchangers associated with this stream that have inlet and outlet temperatures closest to thezone pinch temperatures.
. Temperature ranges of the process streams or used utility type may also be a reason to dividea path based zone, even if no pinch point exists.
. Operational aspects may ask for the combination or division of independent zones. Thedesired (in)dependency of streams may be to maintain the best ¯exibility, safety, start-up andshutdown procedures. Streams that may not be matched should be in di�erent zones. Duringanalysis the combinations should be excluded that include both such streams. This enables theexclusion of forbidden matches.
The importance of the given aspects varies from case to case. In most cases physical lay-out ismost crucial. Various aspects may result in rather di�erent zones. In such cases the analysisshould evaluate various scenarios.
AROMATICS CASE
The new method is ®rst illustrated using the aromatics case originally published by Tjoe andLinnho� [4]. The network grid and the data for this case are given in Fig. 3. The utility cost is2 £/GJ and the area costs are calculated according toCarea [£] = 6300 + 670�Area0.83 if Area < 484 m2
Carea [£] = 252�Area if Arear484 m2
The payback time must be below two years.
Zoning
In the aromatics case, 10 exchangers exist and thus at most 10 elementary zones can be de-marcated. If no more network information is included, 210ÿ1 = 1023 subnetworks need to beevaluated, 672 of them meet the basic requirements of having a heater and a cooler. Also, the
Structural targeting for heat integration retro®t 287
paths in the existing network are not su�ciently recognised. The use of the presented zoningprinciples will focus the evaluation to the relevant subnetworks.
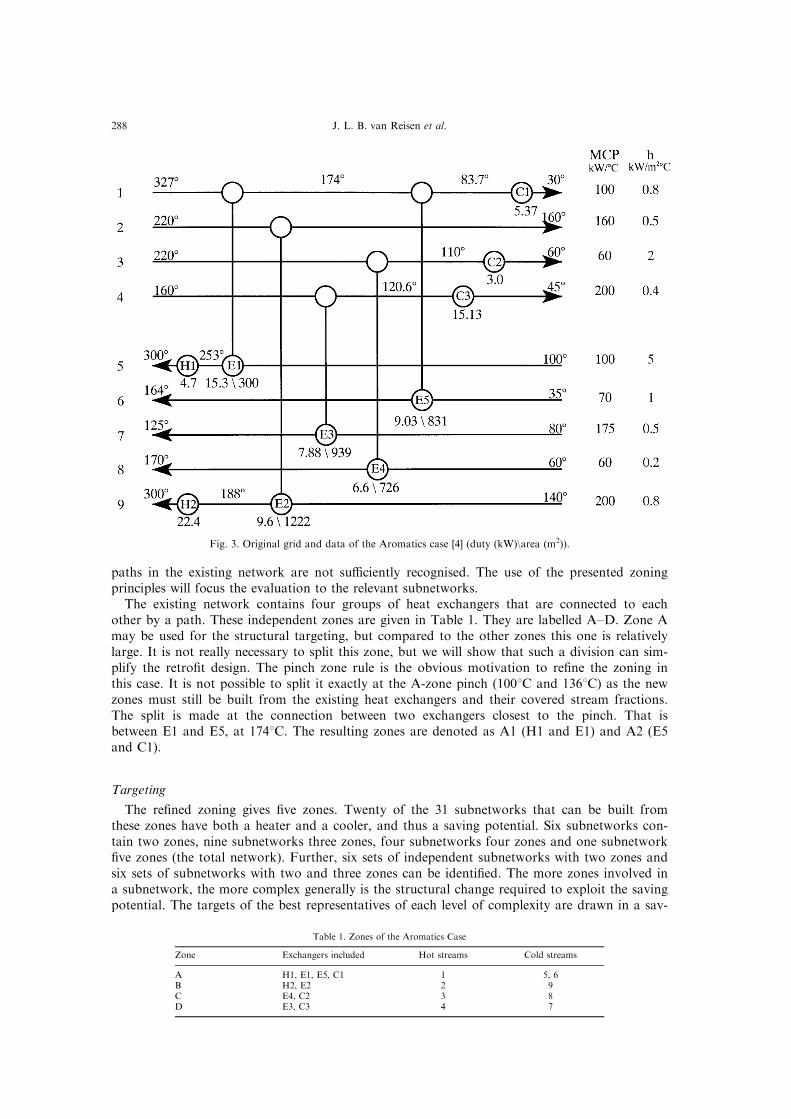
The existing network contains four groups of heat exchangers that are connected to eachother by a path. These independent zones are given in Table 1. They are labelled A±D. Zone Amay be used for the structural targeting, but compared to the other zones this one is relativelylarge. It is not really necessary to split this zone, but we will show that such a division can sim-plify the retro®t design. The pinch zone rule is the obvious motivation to re®ne the zoning inthis case. It is not possible to split it exactly at the A-zone pinch (1008C and 1368C) as the newzones must still be built from the existing heat exchangers and their covered stream fractions.The split is made at the connection between two exchangers closest to the pinch. That isbetween E1 and E5, at 1748C. The resulting zones are denoted as A1 (H1 and E1) and A2 (E5and C1).
Targeting
The re®ned zoning gives ®ve zones. Twenty of the 31 subnetworks that can be built fromthese zones have both a heater and a cooler, and thus a saving potential. Six subnetworks con-tain two zones, nine subnetworks three zones, four subnetworks four zones and one subnetwork®ve zones (the total network). Further, six sets of independent subnetworks with two zones andsix sets of subnetworks with two and three zones can be identi®ed. The more zones involved ina subnetwork, the more complex generally is the structural change required to exploit the savingpotential. The targets of the best representatives of each level of complexity are drawn in a sav-
Fig. 3. Original grid and data of the Aromatics case [4] (duty (kW)\area (m2)).
Table 1. Zones of the Aromatics Case
Zone Exchangers included Hot streams Cold streams
A H1, E1, E5, C1 1 5, 6B H2, E2 2 9C E4, C2 3 8D E3, C3 4 7
J. L. B. van Reisen et al.288
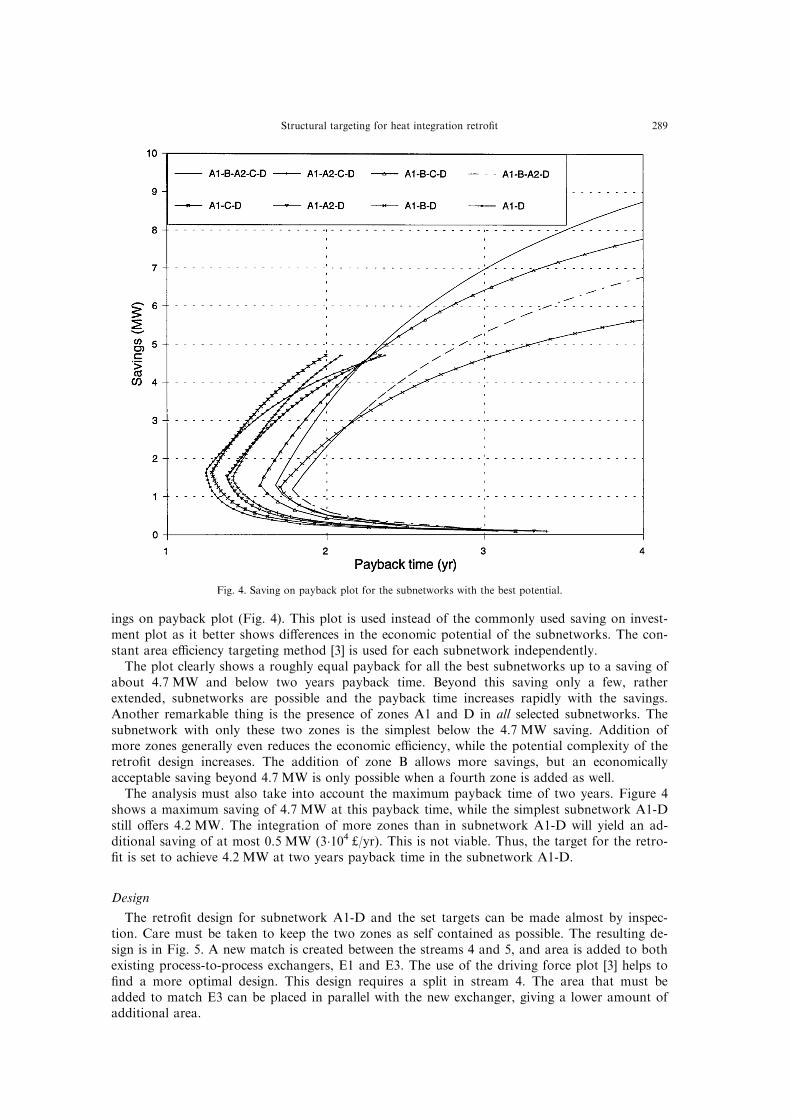
ings on payback plot (Fig. 4). This plot is used instead of the commonly used saving on invest-ment plot as it better shows di�erences in the economic potential of the subnetworks. The con-stant area e�ciency targeting method [3] is used for each subnetwork independently.
The plot clearly shows a roughly equal payback for all the best subnetworks up to a saving ofabout 4.7 MW and below two years payback time. Beyond this saving only a few, ratherextended, subnetworks are possible and the payback time increases rapidly with the savings.Another remarkable thing is the presence of zones A1 and D in all selected subnetworks. Thesubnetwork with only these two zones is the simplest below the 4.7 MW saving. Addition ofmore zones generally even reduces the economic e�ciency, while the potential complexity of theretro®t design increases. The addition of zone B allows more savings, but an economicallyacceptable saving beyond 4.7 MW is only possible when a fourth zone is added as well.
The analysis must also take into account the maximum payback time of two years. Figure 4shows a maximum saving of 4.7 MW at this payback time, while the simplest subnetwork A1-Dstill o�ers 4.2 MW. The integration of more zones than in subnetwork A1-D will yield an ad-ditional saving of at most 0.5 MW (3�104 £/yr). This is not viable. Thus, the target for the retro-®t is set to achieve 4.2 MW at two years payback time in the subnetwork A1-D.
Design
The retro®t design for subnetwork A1-D and the set targets can be made almost by inspec-tion. Care must be taken to keep the two zones as self contained as possible. The resulting de-sign is in Fig. 5. A new match is created between the streams 4 and 5, and area is added to bothexisting process-to-process exchangers, E1 and E3. The use of the driving force plot [3] helps to®nd a more optimal design. This design requires a split in stream 4. The area that must beadded to match E3 can be placed in parallel with the new exchanger, giving a lower amount ofadditional area.
Fig. 4. Saving on payback plot for the subnetworks with the best potential.
Structural targeting for heat integration retro®t 289

Both designs give the target saving of 4.2 MW. In the design without split the new match has418 m2. To E1, 394 m2 is added and to E3, 1189 m2. In the design with split the ®gures are676 m2, 394 m2 and 619 m2, respectively, a reduction of 312 m2. The former design gives a pay-back time of 2.1 years, the latter 1.8 years.
Discussion
The achieved saving is 4.2 MW. This saving is 17% larger than the 3.6 MW saving achievedby Tjoe's retro®t method. This is due to Tjoe setting the energy targets from the saving toinvestment relation for the entire network. This is also in Fig. 4. He selected the maximal savingfor a two year payback time: 3.6 MW.
Although the savings targets are di�erent, the resulting structures of the ®nal designs aresimilar. Also, the economical ®gures are comparable. However, the initial design of Tjoe dif-fered considerably. This initial design required an extensive analysis of the entire network withremaining problem analysis and the driving force plot. Finally, they used a large number ofevolution steps to achieve their ®nal design, but they failed to exploit the full potential of thestructure found. Using the structural targeting method no evolution was necessary in thiscase.
The previous paragraph shows that the potential of subnetwork A1-D is comparable to thatof subnetwork A1-A2-D. The zones A1 and A2 resulted from the re®nement the initially ident-i®ed zone A. Structural targeting shows that the A2 zone hardly contributes to the saving. As aresult of splitting zone A, this irrelevant part can be discarded. If the original zone A was kept,a design should have been made for the subnetwork A-D. This would have been less easy.Subnetwork A-D includes two coolers instead of one as in subnetwork A1-D. A trade-o� isnecessary in this case to ®nd out how the cooler loads should be reduced. Though a quick quali-tative trade-o� may be possible, e.g. using the driving force plot, a quantitative trade-o� is morereliable and thus preferred. One possible way is to evaluate all possible structures in the A-Dsubnetwork, but this is complicated. Another way is to target the area requirement for all com-binations of zones including either H1, C1 or C3. But this is essentially the same as we didwhen we split zone A. A careful demarcation of the zones thus prevents unnecessary calcu-lations.
C3/C4-CASE
Zoning
The C3/C4-case is the C3/C4 separation section of an existing industrial ethylene plant. Asimpli®ed ¯ow diagram is given in Fig. 6. The zoning concepts are applied to this case and
Fig. 5. Subnetwork A1-D with modi®cations.
J. L. B. van Reisen et al.290
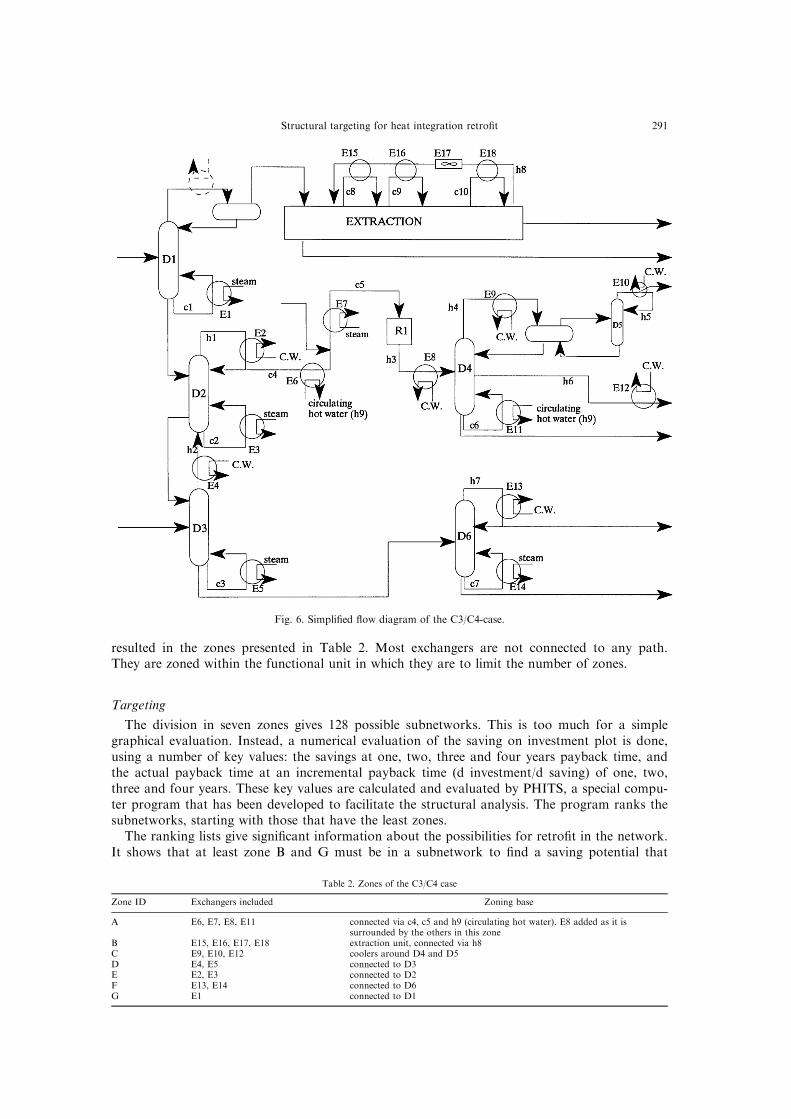
resulted in the zones presented in Table 2. Most exchangers are not connected to any path.They are zoned within the functional unit in which they are to limit the number of zones.
Targeting
The division in seven zones gives 128 possible subnetworks. This is too much for a simplegraphical evaluation. Instead, a numerical evaluation of the saving on investment plot is done,using a number of key values: the savings at one, two, three and four years payback time, andthe actual payback time at an incremental payback time (d investment/d saving) of one, two,three and four years. These key values are calculated and evaluated by PHITS, a special compu-ter program that has been developed to facilitate the structural analysis. The program ranks thesubnetworks, starting with those that have the least zones.
The ranking lists give signi®cant information about the possibilities for retro®t in the network.It shows that at least zone B and G must be in a subnetwork to ®nd a saving potential that
Fig. 6. Simpli®ed ¯ow diagram of the C3/C4-case.
Table 2. Zones of the C3/C4 case
Zone ID Exchangers included Zoning base
A E6, E7, E8, E11 connected via c4, c5 and h9 (circulating hot water). E8 added as it issurrounded by the others in this zone
B E15, E16, E17, E18 extraction unit, connected via h8C E9, E10, E12 coolers around D4 and D5D E4, E5 connected to D3E E2, E3 connected to D2F E13, E14 connected to D6G E1 connected to D1
Structural targeting for heat integration retro®t 291
approaches the potential of the total network. Most individual zones have no saving potentialat all. Only zone A showed some interesting potential. The overall potential ranking is poor(106 out of 128, and 1 being the best), but it obviously is the simplest part of the network tomodify. The best subnetworks with two and three zones are B-G and B-E-G. Both are signi®-cantly better in the ranking compared to the next best subnetworks. However, a subnetworkthat joins zone B and any other zone is not very desirable, as zone B is very much apart. Thesavings must justify the integration of zone B and this can be evaluated at this targeting stageahead of any design. In this case, the integration of zone B is accepted.
Design
Table 3 reviews the required modi®cations for the selected target subnetworks: A, B-G and B-E-G. It also gives the resulting savings, area addition and the payback times for the subnet-works themselves and of the few combinations of independent solutions that are possible. Thepro®tability of the extension of subnetworks with other zones, as from B-G to B-E-G, is evalu-ated using the incremental payback: the additional investment over the additional saving. Thesame criterium is used to evaluate the combinations of solutions, but in these cases an extensionincludes more simple solutions and not one solution, that gets more complicated.
Table 3 clearly shows that the extension of the number of zones in a subnetwork has an econ-omic limit. This was expected before the analysis and therefore only subnetworks with three outof the eight groups or less have been considered. It becomes clear from the table that the combi-nations of independent solutions, e.g. for the subnetworks A and B-E, result in a better incre-mental payback time than the extension of individual subnetworks, B-E to B-E-G.
Up to 80% of the theoretical cost saving can be achieved, combining the modi®cation of twosmall subnetworks with a combination of only three of the seven zones. For the combination oftwo small subnetworks with four groups the saving is 88%. It is very unlikely that the combi-nation of four or even more zones will give more economical proposals, though this can neverbe guaranteed.
The result may be di�erent with an alternative zoning based on di�erent insights. Forexample, the exchangers E8 and E11 are combined in the work above with E6 and E7 to followthe path criterium. They can also be combined with E9, E10 and E12 when the split in func-tional groups is preferred. A similar analysis has been done based on this alternative zoning. Itshows that the subnetworks B-G and B-E-G are still the best, but there are no interesting sub-networks with one zone anymore. The consequences of the alternative zoning are thus limited.
DISCUSSION
The case studies showed the potential of the structural targeting. For the Aromatics Case thenew approach is clearly better than the existing retro®t targeting approaches for which this casehas been reported. The advantages that have been found in this case will hold for most cases.The selection of zones is generally important to get good results. Zone re®nement allows the in-corporation of practical aspects, but may be rather subjective. Di�erent zonings may give di�er-ent results. Generally these di�erences are limited, but the evaluation of alternative zoningsshould be done to avoid missing opportunities. When zones are split, the potential of the orig-
Table 3. Retro®t design options for the C3/C4 case
Adaptations Saving (% max) Payback time (yr) Incr. payback time
SubnetworkA new match between the streams h3 and c5 between the E6
and E7; E8 by-passed 20% 2.3 ÐBG new match between h8, before E18 and c1 parallel to E1
area added to E18; E17 by-passed 60% 1.4 ÐBEG new match between h8, before E18 and c1 parallel to E1 68% 2.0 6.1
hot side E15 moved from h8 to h1, parallel to cooler E2area added to E1, E16 and E18; E17 by-passed
Subnetwork combinationsBG + A see adaptations for BG and A 80% 1.6 2.3BEG +A see adaptations for BEG and A 88% 2.0 2.3
J. L. B. van Reisen et al.292
inal zones should always be checked. Good potential of such zones may not be recognised intargeting as they seem to require more complex integration than actually needed. In theAromatics Case, subnetwork A (A1 + A2) had little potential and was ignored in targeting.
The practical number and size of the zones is a trade-o� between accuracy and computationale�ort. The aromatics case shows that smaller zones allow better identi®cation of the critical net-work parts that must be adapted. On the other hand, the introduction of more zones increasesthe targeting e�ort. Mostly for this reason, a number of the path-based zones were joined in theC3/C4-case. In practice, up to ®ve zones can be handled with conventional targeting software.More specialised software with graphical evaluation can handle about 10 zones. More than 10zones must be evaluated numerically, eventually using integer programming techniques. In bothcases, a proper objective function must be available to get su�cient di�erentiation between thepossible subnetworks.
When a large number of subnetworks is evaluated, the optimisation will not give a unique op-timum in most cases. The result will be a set of subnetworks that have comparable potential.This set even increases when the limited accuracy of the calculated object function is taken intoaccount. Further di�erentiation may be done on a number of practical, qualitative, aspects.
The ®nal result of the evaluation may still be a set of subnetworks with comparable potential.Generally, these include subnetworks that have one or more zones in common, but may alsogive a set of independent subnetworks that have no common zones at all. Simultaneous adap-tation of such subnetworks is possible and can be realised independently of each other, their po-tential can be summed. Such a set of good opportunities is very useful to ®nd the most practicaladaptations as the engineer is not only ®xed at the best opportunity, but is also aware ofalternatives and additional opportunities.
The identi®cation of zones and possible subnetworks, and the evaluation of these subnetworksmay be done in a once through approach: for one set of zones all subnetworks are evaluatedand ranked. A stage-wise approach may reduce the calculation e�ort and facilitate the selectionproblem. There are two ways of doing this.
One way initially focuses on the most promising subnetworks. The subnetworks are primarilyranked according to the number of zones. The subnetworks with the smallest number of zonesare evaluated ®rst to ®nd the best simple opportunities. The evaluation proceeds with the sub-networks with more zones until the saving potential improves too little to justify the integrationof an additional zone. The best subnetworks of the previous stages are further examined toselect the best part to modify. Instead of the number of zones, the number of heat exchangersmay be used or another quali®cation that is easy to determine and generally limits the savingpotential.
Another way uses a steadily decreasing size of the zones. The network is initially divided in asmall number of relatively extended zones. All subnetworks are evaluated and the best areselected. These best subnetworks are divided in new smaller zones and the best smaller subnet-works are identi®ed again. This process can be repeated down to the smallest zones: the individ-ual heat exchangers.
CONCLUSIONS
Structural targeting for existing networks results in simpler designs than existing methods,and identi®es alternatives and additional possibilities. It facilitates the design process as it usesextensive targeting to ®nd the critical parts of the network to modify. It allows the trade o� ofenergy saving, area investment, and the number and extent of the required modi®cations duringtargeting.
Zones are essential for structural targeting to recognise the structure of the existing network.The presented basic rules and re®nements help avoid excessive targeting and limit the risk ofmissing opportunities.
Case studies show the potential and relevance of the method. It is rather quick and ¯exiblefor realistic cases as well. The basic assumption of relation between the saving potential and thecomplexity of the required modi®cations is clearly shown in the C3/C4-case.
Structural targeting for heat integration retro®t 293
In future, the methodology will be extended to allow debottlenecking studies and to take intoaccount practical aspects that have been encountered in several case studies, like multi-utilityoptimisation and utility level optimisation.
AcknowledgementsÐThis work has been funded through NOVEM, the Dutch Society for Energy and Environment,under contracts no. 33104/0131 and 333104/0134. We thank the Dutch Advanced Heat Exchanger Study Group and itschairman Ir. A. R. Braun for initiative and support during the studies.
REFERENCES
1. T. F. Yee and I. E. Grossmann, A screening and optimization approach for the retro®t of heat-exchanger networks.Ind. Eng. Chem. Res. 30, 146±162 (1991).
2. A. R. Ciric and C. A. Floudas, A comprehensive optimization model of the heat exchanger network retro®t problem.Heat Recovery Syst. CHP 10(4), 407±422 (1990).
3. V. Briones and A. Kokossis, A new approach for the optimal retro®t of heat exchanger networks. Comput. Chem.Eng. 20(Suppl. A, European Symposium on Computer Aided Process EngineeringÐ6, 1996), S43±S48 (1996).
4. T. N. Tjoe and B. Linnho�, Using Pinch Technology for process retro®ts. Chem. Engng. April 28, 47±60 (1986).5. T. N. Tjoe, Retro®t of heat exchanger networks. Ph.D Thesis, UMIST, Manchester (1986).6. N. D. K. Asante and X. X. Zhu, An automated approach for heat exchanger network retro®t featuring minimal top-
ology modi®cations. Comput. Chem. Engng. 20, S7±S12 (1996).7. A. Carlsson, P. Frank and T. Berntsson, Design better heat exchanger network retro®ts. Chem. Eng. Prog. 1, 87±
96 (1993).8. J. L. B. Van Reisen, J. Grievink, G. T. Polley and P. J. T. Verheijen, The placement of two-stream and multi-stream
heat-exchangers in an existing network through path analysis. Comput. Chem. Engng. 19, S143±S148 (1995).9. S. Ahmad and C. W. Hui, Heat recovery between areas of integrity. Comput. Chem. Engng. 15(12), 809±832 (1991).
J. L. B. van Reisen et al.294