
Structural econometric approach to bidding in the main refinancing operations of the Eurosystem
33
WORKING PAPER SERIES NO 793 / AUGUST 2007 STRUCTURAL ECONOMETRIC APPROACH TO BIDDING IN THE MAIN REFINANCING OPERATIONS OF THE EUROSYSTEM by Nuno Cassola, Christian Ewerhart and Claudio Morana
-
Upload
independent -
Category
Documents
-
view
1 -
download
0
Transcript of Structural econometric approach to bidding in the main refinancing operations of the Eurosystem

ISSN 1561081-0
9 7 7 1 5 6 1 0 8 1 0 0 5
WORKING PAPER SER IESNO 793 / AUGUST 2007
STRUCTURAL ECONOMETRIC APPROACH TO BIDDING IN THE MAIN REFINANCING OPERATIONS OF THE EUROSYSTEM
by Nuno Cassola, Christian Ewerhartand Claudio Morana
In 2007 all ECB publications
feature a motif taken from the €20 banknote.
WORK ING PAPER SER IE SNO 793 / AUGUST 2007
1 The opinions presented in this paper are those of the authors and do not necessarily coincide with the views of the ECB. The present paper is a corrected and revised version of the draft that was published in the Journal of Financial Transformation, Vol. 19, April 2007. Preliminary versions of the paper were presented at internal ECB seminars, and to the conference The
well as an anonymous referee, for comments and discussions. All remaining errors are our own. 2 European Central Bank, Kaiserstrasse 29, D-60311, Frankfurt am Main, Germany; e-mail: [email protected]
3 Institute for Empirical Research in Economics (IEW), University of Zurich,Winterthurerstrasse 30, CH-8006, Zurich, Switzerland; e-mail: [email protected]
4 International Centre for Economic Research (ICER), and Università del Piemonte Orientale, Facoltà di Economia,
e-mail: [email protected]
STRUCTURAL ECONOMETRIC APPROACH TO BIDDING IN
THE MAIN REFINANCING OPERATIONS OF THE
EUROSYSTEM 1
by Nuno Cassola 2, Christian Ewerhart 3
and Claudio Morana 4
This paper can be downloaded without charge from http://www.ecb.int or from the Social Science Research Network
Econometrics of Auctions in Toulouse, May 12-13, 2006. We would like to thank B. Biais, A. Hortaçsu, J. Kastl and H. Paarsch, as
Dipartimento di Scienze Economiche e Metodi Quantitativi, Via Perrone 18, 28100, Novara, Italy;
electronic library at http://ssrn.com/abstract_id=1003968.
© European Central Bank, 2007
AddressKaiserstrasse 2960311 Frankfurt am Main, Germany
Postal addressPostfach 16 03 1960066 Frankfurt am Main, Germany
Telephone +49 69 1344 0
Internethttp://www.ecb.europa.eu
Fax +49 69 1344 6000
Telex411 144 ecb d
All rights reserved.
Any reproduction, publication and reprint in the form of a different publication, whether printed or produced electronically, in whole or in part, is permitted only with the explicit written authorisation of the ECB or the author(s).
The views expressed in this paper do not necessarily reflect those of the European Central Bank.
The statement of purpose for the ECB Working Paper Series is available from the ECB website, http://www.ecb.europa.eu/pub/scientific/wps/date/html/index.en.html
ISSN 1561-0810 (print)ISSN 1725-2806 (online)
3ECB
Working Paper Series No 793August 2007
CONTENTS
Abstract 4
Executive Summary 5
1 Introduction 6
2 Theoretical framework 8
3 Econometric methodology 13 3.1 Estimation of a structural model 13 3.2 Estimation of the auction’s equilibrium price 14 3.3 Nonparametric estimation of the bid-shading components 14 3.4 Tests of individual bidding behavior 15 3.4.1 Test 1: Is more successful bidding associated with more aggressive bidding? 15 3.4.2 Test 2: Is the strategic inverse bid schedule flatter than the true demand? 16 3.4.3 Test 3: The sources of bid-shading 16
4 The data 16
5 Empirical results 17 5.1 Bidders’ heterogeneity 18 5.2 Bid-shading analysis 19 5.3 Tests on individual bidding behavior 19
6 Conclusions 20References 21
Tables and figures 23
European Central Bank Working Paper Series 29
AbstractThis paper contributes to the existing literature on central bank repo
auctions. It is based on a structural econometric approach, whereby theprimitives of bidding behavior (individual bid schedules and bid-shadingcomponents) are directly estimated. With the estimated parameters wecalibrate a theoretical model in order to illustrate some comparative staticresults. Overall the results suggest that strategic and optimal behavior isprevalent in ECB tenders. We �nd evidence of a statistically signi�cant bid-shading component, even though the number of bidders is very large. Bid-shading increases with liquidity uncertainty and decreases with the numberof participants.J.E.L. classi�cation: G21, G12, D44, E43, E50Keywords: repo auctions, monetary policy implementation, primary money
market market, multi unit auctions, discriminatory auctions, collateral,central bank, nonparametric estimation
4ECB Working Paper Series No 793August 2007
Executive Summary
The European Central Bank (ECB) provides refinancing to the banking system on a
weekly basis via standard tender procedures. This paper contributes to the existing
literature on central bank auctions by applying a structural econometric approach to
modelling bidding behaviour at these tenders. The primitives of bidding behaviour are
estimated (individual bid schedules and residual supply) and a re-sampling
methodology is used to retrieve the individual bid-shading components (i.e. bid
submitted below the marginal valuation). This is done in three steps: first, the market
clearing price for each auction is estimated; second, given the market clearing price
for each auction, the probability, for each bank, that an individual bid is successful is
calculated; third, using these probabilities the first order optimality conditions are
used, for each bank, to retrieve the individual bid-shading components.
The data set includes the bids submitted to the 31 weekly main refinancing operations
conducted by the ECB between 16 March 2004 and 11 October 2004. Estimation has
been performed by considering jointly the data for all the auctions for each bank,
aggregating the bids over all the auctions, and averaging the bids to obtain the final
data. The aggregation is justified by the stable environment that characterized the euro
area money market over the period investigated both in terms of tender volumes and
prices.
Overall the econometric results suggest that strategic and optimal behaviour is
prevalent in ECB tenders. In fact, and despite some heterogeneity across bidders,
there is evidence of a statistically significant bid-shading component even though the
number of bidders is very large. Furthermore, we found that bid-shading increases
with liquidity uncertainty and decreases with the number of participants and with
price uncertainty. These results are fully in line with the theoretical predictions of a
multi-unit auction model with discriminatory pricing and declining marginal
valuations.
5ECB
Working Paper Series No 793August 2007
1. Introduction
The banking system in the euro area1 is in a structural de�cit position vis-à-visthe Eurosystem.2 In fact, according to the consolidated �nancial statement ofthe Eurosystem3 on 1 July 2005, on the asset side, the re�nancing of the ECBprovided to the banking system via open market operations and recourse to themarginal lending facility amounted to EUR 398 billion, of which EUR 308 billioncorresponded to liquidity provided through the regular (weekly) main re�nancingoperations. The latter are executed in the form of tender procedures.4
Central bank operations and government auctions of treasury securities looklike similar means of allocating a good. In particular, both take place in theenvironment of a secondary market which in principle allows potential buyers toarbitrage away any potential di¤erence in prices between the primary and thesecondary markets. However, the central bank auctions like those conducted bythe ECB di¤er from treasury auctions in several important dimensions. Firstly,central bank re�nancing is provided against collateral. To the extent that lowopportunity cost collateral is used �rst, the marginal valuation of liquidity shouldbe declining as collateral of better quality must be increasingly provided. Second,in the euro area banks have to ful�ll reserve requirements and this, rather thenreselling in the secondary market, is the main motive for banks to bid in theregular open market operations of the ECB. Third, unlike T-bills, there are onlyimperfect substitutes to ECB re�nancing. For example banks face credit limitsand may not be able to borrow the full extent of their liquidity needs, or theymay not be willing to extend their own credit limits. Thus, borrowing in theprimary market with the objective of reselling in the secondary market is not asprevalent as in the treasury bond market. Fourth, there is little uncertainty about
1The euro area refers to the 13 European Union (EU) Member States that share a singlecurrency - the euro. These countries are Austria, Belgium, Finland, France, Germany, Greece,Ireland, Italy, Luxemburg, the Nederlands, Portugal, Slovenia and Spain.
2The Eurosystem refers to the European Central Bank (ECB) and the 13 National CentralBanks (NCBs) of the participating EU Member States.
3The consolidated balance sheet of the Eurosystem shows that, on the liabilities side, themain liquidity absorbing factor is banknotes in circulation followed by current account holdingsof credit institutions with the Eurosystem, where the latter cater essentially for the minimumreserve system. The consolidated balance sheet of the Eurosystem is published regularly in theEuro Area Statistics Annex of the ECB Monthly Bulletin.
4For details on the operational framework of the Eurosystem see �The implementationof monetary policy in the euro area: general documentation on Eurosystem monetary policyinstruments and procedures�, ECB, September 2006, downloadable from www.ecb.int.
6ECB Working Paper Series No 793August 2007
the (common) value of the good auctioned.5 In fact, re�nancing is provided forvery short-term (overnight in the case of the marginal lending facility or one-weekin the case of the main re�nancing operations of the ECB) for which there is littleprice risk and, besides, a very liquid derivatives (swap) market exists, allowinghedging short-term interest rate risk.6
The combined features of declining marginal valuations, low uncertainty aboutthe market value of the good and reserve requirements should be taken into ac-count when modelling ECB tenders. In this paper we empirically test a model ofoptimal bidding in variable rate tenders using data from ECB auctions. Existingempirical work on the ECB main re�nancing operations has relied exclusively onpanel data analysis without any underlying structural model (see Nyborg et al.(2002) and Scalia et al. (2005)). Both papers conclude that bid-shading by partic-ipants to ECB tenders decreases with interest rate uncertainty, which is againstthe prediction of standard single-unit, common value auction theory (winner�scurse). However, in none of these papers are the individual bid-shading compo-nents estimated. For example, Nyborg et al. (2002) compute two price measures,discount and underpricing, de�ned as the di¤erence between the swap rate and,respectively, the quantity-weighted average bid rate and the quantity-weightedaverage winning rate for each bidder. As argued in this paper these measures maybe good proxies for bid-shading only if marginal valuations are constant.This paper contributes to the existing literature on central bank auctions in
so far as it is based on a structural econometric approach, whereby the primitivesof bidding behavior (individual bid schedules and bid-shading components) aredirectly estimated. With the estimated parameters we calibrate a theoreticalmodel of the discriminatory auction, in order to illustrate some comparative staticresults. The remainder of the paper is organized as follows. Section 2 sets outthe theoretical model of optimal bidding and Section 3 explains the econometricmethodology. The data used in the study is described in Section 4 and the resultsare presented in Section 5. The main conclusions are presented at the end.
5Except on the �nal day of the reserve maintenance period. In the euro area the reservemaintenance period has a variable length, of approximately one month.
6The announcement of the weekly auction takes place, as a rule, on Monday at 15:00, to-gether with the publication of the Eurosystem�s forecast of the average daily liquidity needsof the banking system until the next open market operation, stemming from the so-called au-tonomous factors. At the same time, the ECB also publishes the benchmark allotment whichcorresponds, in general, to the amount of reserves that, based on past ful�lment and the pro-jected autonomous factors, would bring the average reserve holdings one week ahead in line withthe reserve requirement plus a technical, small amount for excess reserves.
7ECB
Working Paper Series No 793August 2007
2. Theoretical framework
As mentioned in Section 1, the Eurosystem conducts weekly tenders whereby re�-nancing is provided to the banking system. The liquidity is allotted via standardtender procedures, pay-your-bid and pro-rata allotment at the cut-o¤ price (mar-ginal tender rate).7 Formally these auctions are multi-unit auctions (or shareauctions) with discriminatory pricing and a reserve price. The econometric ap-proach employed in this paper is based on the idea that individual bidders faceuncertainty about residual supply, as modeled by Klemperer and Mayer (1989),Kyle (1989), Back and Zender (1993) and Viswanathan and Wang (2002), amongothers. Ewerhart et al. (2006) have shown that when bidders have ex-post dis-cretion about the choice of collateral that is used in funding transactions, as isthe case in the Euro area, then such a model is consistent with the existence ofa perfect secondary market for short-term credit. For complete references anddetails on the derivations, as well as for the discussion of uniform vs. discrimina-tory pricing, the reader is referred to Ewerhart et. al. (2006). In this paper thediscussion will focus exclusively on the discriminatory pricing case.
Model A central bank puts up for sale a random quantity, the total allotmenteQ � 0, of liquidity (i.e. a perfectly divisible good). There are two alternativeinterpretations for uncertainty about aggregate allotment. First, the central bankmay possess a superior knowledge about the aggregate liquidity shortage facingthe banking system. Second, there may be a fraction of non-strategic bidders.In practice, both e¤ects contribute to the uncertainty about the residual supplyperceived by the individual bidder (bank). For reasons of tractability we assumethat eQ is uniformly distributed in
�0; Q
�: There are i = 1; 2; :::; n bidders which
do not observe the total allotment prior to the submission of bids. The centralbank does not exploit its information about the incoming bid schedules to a¤ect
7The Eurosystem has the option of conducting either �xed rate (volume) or variable rate(interest) tenders. The main re�nancing operations have been conducted as variable rate tenders,with a minimum bid rate, since June 2001. In the variable rate tenders banks may submit bidsfor up to ten di¤erent pairs of interest rate/quantity levels. The interest rates bid must beexpressed as multiples of 0.01 percentage point. The minimum bid amout is EUR 1,000,000and bids exceeding this amount must be expressed as multiples of EUR 100,000. Counterpartiesare expected to cover the amounts alloted to them (not their bids) by a su¢ cient amout ofeligible underlying assets. For further details on the tender procedures see �The implementationof monetary policy in the euro area: general documentation on Eurosystem monetary policyinstruments and procedures�, ECB, September 2006, downloadable from www.ecb.int.
8ECB Working Paper Series No 793August 2007
the distribution of eQ. Marginal valuations are assumed to be linearly decreasingfrom a maximum valuation v > 0 that is common to all bidders. Thus, bidder i�smarginal valuations for quantities qi � 0 are formally given by vi(qi) = v� qi=Bi,for an exogenous parameter Bi > 0: We consider a symmetric set-up where B1 =B2 = ::: = Bn. The tender mechanism asks each bidder to submit a bid schedulethat speci�es, for any price p � 0, the amount xi(pi) � 0 that bidder i is willingto buy at p. A schedule xi(pi) is admissible if it is non-increasing, left-continuous,and if xi(pi) = 0 for a su¢ ciently high p. It is assumed that only admissiblebid schedules are accepted by the auctioneer. Let x(p) =
Pni=1 xi(p) denote
total demand at price p, and P �( eQ) = np � 0jx(p) � eQo the set of prices at
which total demand can be satis�ed. The stop-out price is de�ned as the in�mump�( eQ) = inf P �( eQ) of such prices.Individual allotments are determined by satisfying all bids strictly above the
stop-out price, and by applying rationing at the margin, if necessary. Formally,de�ne x+i (p
�) = limp!p�;p>p� xi(p) as bidder�s i demand at a price just abovep�, and let x+(p�) =
Pni=1 xi(p
�), denote the corresponding aggregate. Bidder iobtains an allotment
q�i ( eQ) = x+i (p�( eQ)) + xi(p�( eQ))� x+i (p�( eQ))x(p�( eQ))� x+(p�( eQ))
n eQ� x+(p�( eQ))o ; (2.1)
in state eQ. Thus, when demand exceeds supply, the allotment is composed of acomplete allocation of the part of the bid schedule that lies above the stop-outprice, and a pro-rata allocation of any �at segment of the bid schedule that liesat the stop-out price. The tuple (p�; q�1; q
�2; :::; q
�n) consisting of the stop-out price
and the individual allotments will be referred to as the outcome of the tender.Bidders are risk-neutral, assumed to maximize expected pro�ts. De�ne the
inverse bid schedule as bi(qi) = inf fp � 0jxi(p) � qig. Under discriminatory pric-ing, the bidder i pays her own bid bi(qi) for any marginal unit, so that the resultingpro�t from an outcome (p�; q�1; q
�2; :::; q
�n) amounts to
�i =
Z q�i
0
fvi(qi)� bi(qi)g dqi: (2.2)
Equilibrium An equilibrium can be found in the discriminatory auction forn � 2, when bidders i = 1; 2; :::; n; have identical marginal valuations vi(qi) =
9ECB
Working Paper Series No 793August 2007

v � qi=B. For simplicity, we assume also that demand is su¢ ciently strong, i.e.,Q < nvB: Then bidder i submits the piecewise linear bid schedule
xi(p) =
8<:0
Bd(vd � p)B(v � p)
for p > vd
for pmin < p � vdfor p � pmin
9=; (2.3)
for i = 1; 2; :::; n; where
vd = v � Q
(2n� 1)B (2.4)
Bd =2n� 1n� 1 B (2.5)
pmin = v � Q
nB: (2.6)
are the maximum price bid, the slope of the inverse bid schedule, and the minimumstop-out price, respectively.8
The equilibrium marginal rate in the model is stochastic as it depends on theallotment. The expected stop-out rate is equal to the rate that obtains when thecentral bank allots half of the maximum quantity and it is given by
E(pmar) = v � (3n� 1)Q2n(2n� 1)B: (2.7)
When n!1 the quantity allotted is Q(n) = n Q. Then, the maximum priceat which a bid is placed will converge to
limn!1
vd = v � Q
2B; (2.8)
and the expected stop-out rate will converge to
limn!1
E(pmar) = v � 3Q4B
(2.9)
= v � 3p3
2Bstd( eQ)
8For formal proofs see Ewerhart et. al. (2006).
10ECB Working Paper Series No 793August 2007
with std( eQ) = Q=(2p3). From equation (2.9) three conclusions can be drawn.
First, strategic behavior does not disappear when the number of participants tothe auction is very large; thus some bid-shading will be observed also in thiscase. Second, an increase in liquidity uncertainty, measured by an increase in thestandard deviation of the total allotment (or its variance) increases bid-shadingand leads to a fall in the stop-out rate. Third, if less liquid collateral becomesrelatively more abundant in the collateral pool (increase in B) bid-shading isreduced and the stop-out price increases.
Empirical predictions The theoretical model suggests �ve testable predic-tions about individual bidding behavior and interest rate spreads:
1. The inverse bid schedule is �atter than the true demand or, equivalently,the bid schedule is steeper than the true marginal valuation curve.
2. In equilibrium there is a positive spread between the (shadow) repo rate andthe marginal (stop-out) price.
3. Bid-shading decreases with the number of bidders; however, it does notdisappear even when the participation in the auction (n) is very large.
4. Bid shading increases with allotment uncertainty.
Illustration of the model The solution of the model is illustrated in Figure1. The true linear demand curve (dotted line) is represented above a piecewiselinear bid schedule (xi(p)) which was drawn for Q(n) = 300 (EUR billion). Theother parameters are set as follows: v = 2:06 (the one-week EONIA swap ratelevel9); B = 18:7; n = 300, i.e. calibrated to match euro area data (see Section 3for details). Auction prices correspond to interest rates in percent.Equilibrium is determined at the interception of the individual bid schedule
with the residual supply curve, i.e. the supply diminished by the allotmentsmade to the other bidders at a given price. The theory predicts that bids will
9EONIA (euro overnight index rate) is a weighted average of the interest rates on unsecuredovernight lending transactions denominated in euro, as reported by a panel of contributingbanks. The one-week EONIA swap rate is the main reference for banks when they prepare theirbids, given that this segment of the swap market is very liquid and the Eurosystem�s re�nancingoperations have one-week maturity. Given that the underlying EONIA refers to unsecured loans,bids submitted to ECB repo operations should be below that rate.
11ECB
Working Paper Series No 793August 2007
be submited at rates between 2:007 and 2:033. An equilibrium is depicted suchthat the allotment ratio is 50%; the stop-out price (marginal ECB tender rate)is at 2:02, and the corresponding shadow repo rate (equal to the true marginalvaluation) is at 2:033 with a bid-shading component of 1:3 basis points. Supposethe minimum bid rate was set at 2:0. Thus, in this particular case, the spreadbetween the swap rate and the minimum bid rate would be 6 basis points; thespread between the repo rate10 and the minimum bid rate would be 2:7 basispoints, and the spread between the marginal tender rate (cut-o¤ rate) and theminimum bid rate would be 2 basis points. These spreads are close to thoseobserved in the euro money market when ECB�s minimum bid rate was 2.0.Consider next an allotment with Q(n) = 375 with the remaining parameters
unchanged. This could result from an increase in liquidity uncertainty (see Figure2). The (expected) stop-out price is at 2:01; while the shadow repo rate is 2:027with a bid-shading component of 1:7 basis points. Thus, in this particular case,the spread between the swap rate and the minimum bid rate would still be 6 basispoints; the spread between the repo rate and the minimum bid rate, 2:7 basispoints, and the spread between the marginal tender rate and the minimum bidrate would be 1 basis points. This exercise illustrates the ceteris paribus impactof an increase in liquidity uncertainty on bid shading (increase from 1:3 to 1:7basis points).Finally consider again an allotment with Q(n) = 300; however with a higher
swap rate (v = 2:07) and a steeper bid shedule (i.e. �atter marginal valuation).This shift could be due to an increase in the relative scarcity of liquid collat-eral.11 An equilibrium is depicted in Figure 3. The (expected) stop-out price isat 2:04; while the shadow repo rate is 2:05 with a bid-shading component of 1basis points. Thus, in this particular case, the spread between the swap rate andthe minimum bid rate would be 7 basis points; the spread between the repo rateand the minimum bid rate, 5 basis points, and the spread between the cut-o¤rate (marginal tender rate) and the minimum bid rate would be 4 basis points.In this case volatility in market interest rates would be correlated with a declinein bid-shading, which could be wrongly interpreted as a reversal of the winner�s
10The theoretical repo rate does not correspond to the private market repo rate (the so-calledGC rate). The former should lie somewhat above the latter because it is collateralized with lessliquid paper.11This situation could also be explained by an increase in Q(n) when this shift captures an
increase in demand/supply with unchanged availability of liquid collateral. This would lead toan increase in v: For simplicity we kept Q(n) unchanged in this simulation.
12ECB Working Paper Series No 793August 2007
curse and may explain the �nding in Nyborg et. al. (2002).
3. Econometric methodology
3.1. Estimation of a structural model
In the econometric work we follow the structural empirical approach to auctions,which is an expanding �eld recently surveyed by Athey and Haile (2004). Morespeci�cally we follow the approach suggested by Hortaçsu (2002 a, b).We proceedin three steps:
1. Estimation of the equilibrium price for each auction.
2. Estimation of the bid-shading components.
3. Tests on individual bidding behavior.
Denote bidder i�s marginal utility from winning q units of the good, vi(q). Theutility maximization problem can be written as
maxyi(:)
Z 1
0
�Z qi
0
[vi (q)� bi (q)] dq�dH (pc; xi (p)) ; (3.1)
where qi = xi(p); and H (pc; xi (p)) and dH (pc; xi (p)) are the cumulative dis-tribution and density functions of the market clearing price (pc), conditional onsubmitting a demand function xi (p), respectively, i.e. pc is such that xi(pc) =eQ�X
j 6=i
xj (pc) and H (pc; xi (p)) = Pr fpc � pjxi (p)g :
The Euler necessary condition for the maximization of the objective functionis then
v (xi (p)) = p+H(pc; xi(p))
Hp(pc; xi(p)); (3.2)
where Hp(pc; xi(p)) =@H(pc; xi(p))
@pc; v (xi (p)) is the true marginal valuation given
to quantity q by bidder i. It is equal to the price bid p plus the bid-shadingcomponent, measured by the inverse hazard ratio. The above optimality conditionallows to nonparametrically identify the marginal valuations of the bidders usingobserved bids.
13ECB
Working Paper Series No 793August 2007
3.2. Estimation of the auction�s equilibrium price
Estimation has been performed by considering jointly the data for all the auctionsfor each bank, aggregating the bids over all the auctions, and averaging the bidsto obtain the �nal data. This has required the exclusion from the sample of allbanks that bid at the same price in all auctions. The aggregate approach can bejusti�ed by the stable environment that characterized the euro area money marketover the period investigated. Moreover, during the sample period there were nochanges in ECB key policy rates. The assumption that auctions take place in astatic environment is important for the validity of the methodology we follow inthis paper.The OLS estimator has been employed, considering both linear and log-log
speci�cations. The clearing (equilibrium) price for each auction (t), pc;t, has beencomputed by equating the aggregate bidding function, obtained by horizontalsumming of the inverse individual bidding functions, and total supply, and solvingfor the equilibrium price (interest rate). Hence, by denoting the estimated inverseaggregate bid function as p = � � �qd, the equilibrium price has been computedfrom the market equilibrium condition, qd = qs as pc;t = �� �qs.
3.3. Nonparametric estimation of the bid-shading components
In this part we follow the methodology developed by Hortaçsu (2002b). There areT auctions in the sample and nt bidders participate at auction t, t = 1; :::; T: Theprocedure to estimate the bid-shading components works as follows:i) select auction t and bidder i;ii) from the sample of nt�1 vectors, draw a random sample of nt�1 individual
intercept and slope vectors with replacement;iii) use the random sample to compute the residual supply function and in-
tersect with bidder i0s bidding function to determine the market clearing priceconditional on i0s submitting a bid shedule (pc);iv) repeat forK times the previous steps to determine the empirical cumulative
conditional distribution of the market clearing price, H(pc; xi(p)), taking intoaccount the truncation implied by the minimum bid rate;v) then, with reference to the estimated equilibrium price for the auction, pc;t;
compute the probability Pr fpc � pc;tjxi (p)g = H(pc;t; xi(p)) and the value of the
density function at pc;t; i.e.@H(pc;t; xi(p))
@p; as
H(pc;t; xi(p))� H(p0; xi(p))pc;t � p0 , where
p0 is the ordered price statistic before the equilibrium price (::: < p0 < pc;t < :::).
14ECB Working Paper Series No 793August 2007
The bid-shading component can then be computed as the ratio of the probabilityover the value of the density function;vi) repeat the previous steps for each of the bidders participating to auction t.vii) repeat the previous steps for each auction.Kernel estimation has been employed at point v). Given that the price distri-
bution is truncated to the left, i.e. the bid rate cannot fall below the minimumbid rate, a Gaussian truncated kernel has been employed for the estimation of theequilibrium price density function.12 Finally, standard errors for the bid-shadingcomponents have been obtained by bootstrapping the empirical distribution ofthe bid-shading components for each auction.
3.4. Tests of individual bidding behavior
On the basis of the estimated slopes and intercepts, heterogeneity across bidderscan be assessed and measured by standard statistical tools. Moreover, tests onbidding behavior can be carried out as follows.
3.4.1. Test 1: Is more successful bidding associated with more aggres-sive bidding?
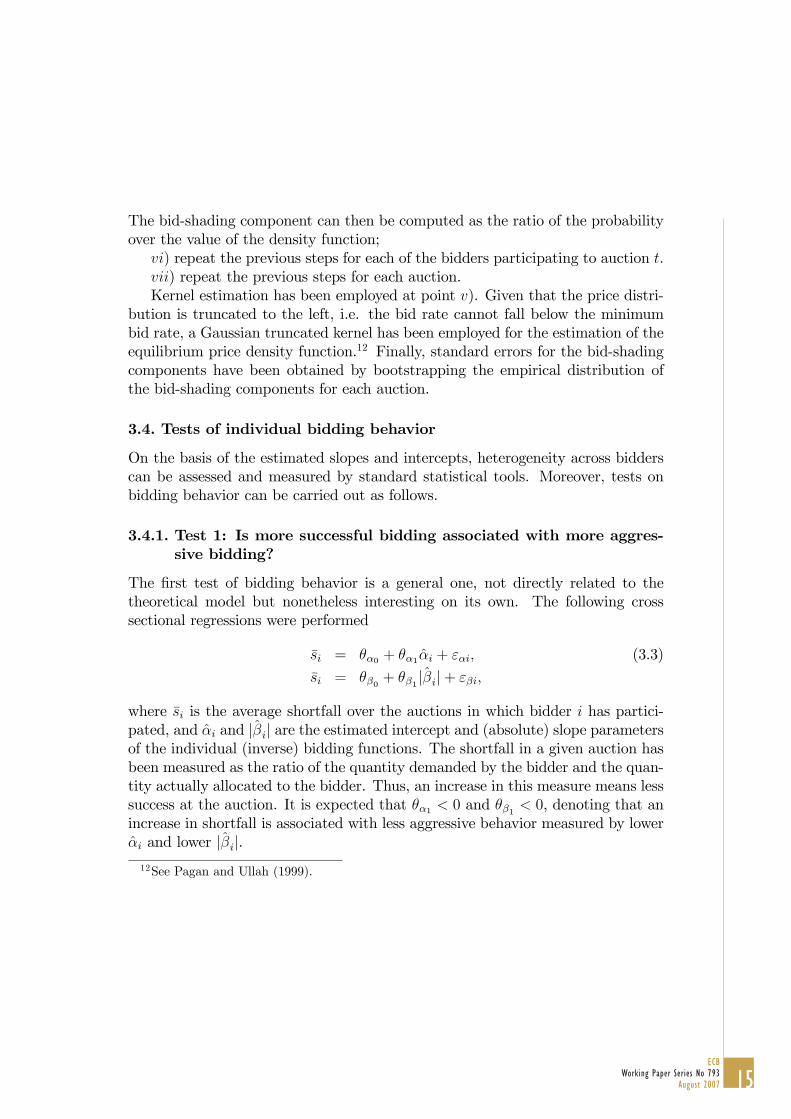
The �rst test of bidding behavior is a general one, not directly related to thetheoretical model but nonetheless interesting on its own. The following crosssectional regressions were performed
�si = ��0 + ��1�i + "�i; (3.3)
�si = ��0 + ��1j�ij+ "�i;
where �si is the average shortfall over the auctions in which bidder i has partici-pated, and �i and j�ij are the estimated intercept and (absolute) slope parametersof the individual (inverse) bidding functions. The shortfall in a given auction hasbeen measured as the ratio of the quantity demanded by the bidder and the quan-tity actually allocated to the bidder. Thus, an increase in this measure means lesssuccess at the auction. It is expected that ��1 < 0 and ��1 < 0, denoting that anincrease in shortfall is associated with less aggressive behavior measured by lower�i and lower j�ij.12See Pagan and Ullah (1999).
15ECB
Working Paper Series No 793August 2007
3.4.2. Test 2: Is the strategic inverse bid schedule �atter than the truedemand?
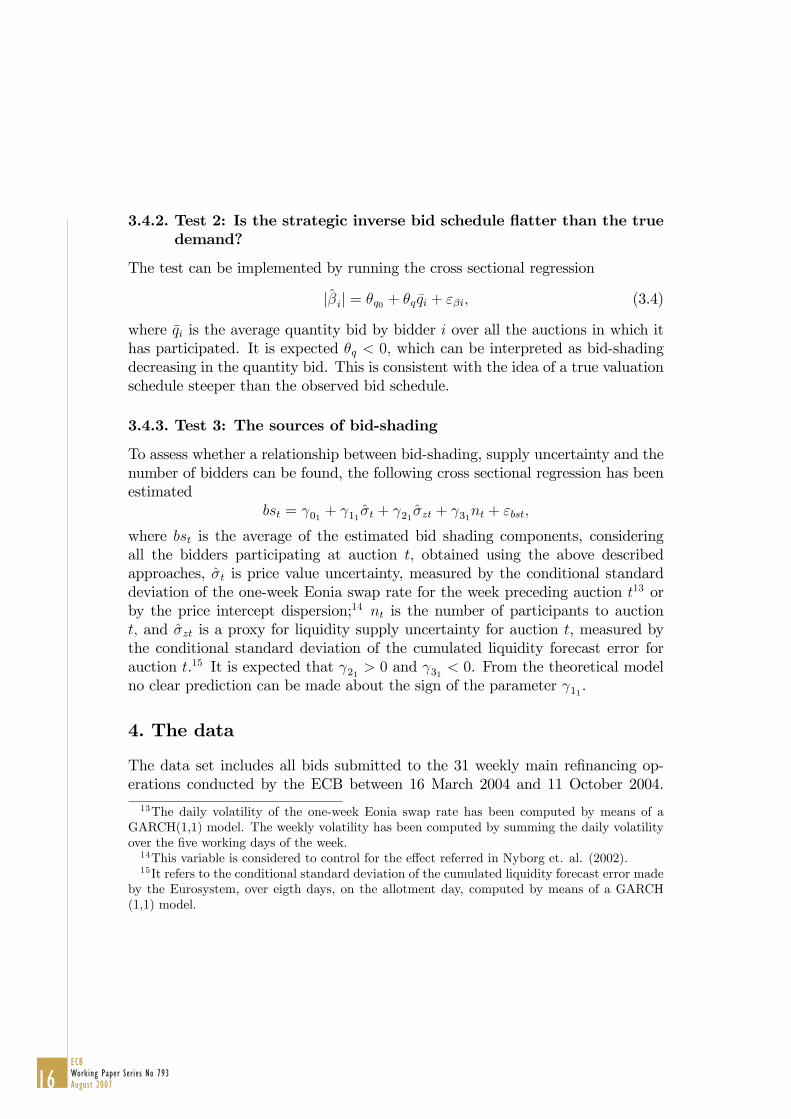
The test can be implemented by running the cross sectional regression
j�ij = �q0 + �q�qi + "�i; (3.4)
where �qi is the average quantity bid by bidder i over all the auctions in which ithas participated. It is expected �q < 0; which can be interpreted as bid-shadingdecreasing in the quantity bid. This is consistent with the idea of a true valuationschedule steeper than the observed bid schedule.
3.4.3. Test 3: The sources of bid-shading
To assess whether a relationship between bid-shading, supply uncertainty and thenumber of bidders can be found, the following cross sectional regression has beenestimated
bst = 01 + 11�t + 21�zt + 31nt + "bst;
where bst is the average of the estimated bid shading components, consideringall the bidders participating at auction t; obtained using the above describedapproaches, �t is price value uncertainty, measured by the conditional standarddeviation of the one-week Eonia swap rate for the week preceding auction t13 orby the price intercept dispersion;14 nt is the number of participants to auctiont; and �zt is a proxy for liquidity supply uncertainty for auction t, measured bythe conditional standard deviation of the cumulated liquidity forecast error forauction t.15 It is expected that 21 > 0 and 31 < 0. From the theoretical modelno clear prediction can be made about the sign of the parameter 11.
4. The data
The data set includes all bids submitted to the 31 weekly main re�nancing op-erations conducted by the ECB between 16 March 2004 and 11 October 2004.13The daily volatility of the one-week Eonia swap rate has been computed by means of a
GARCH(1,1) model. The weekly volatility has been computed by summing the daily volatilityover the �ve working days of the week.14This variable is considered to control for the e¤ect referred in Nyborg et. al. (2002).15It refers to the conditional standard deviation of the cumulated liquidity forecast error made
by the Eurosystem, over eigth days, on the allotment day, computed by means of a GARCH(1,1) model.
16ECB Working Paper Series No 793August 2007
During the period under analysis the maturity of the ECB repo operations wasone week. The average number of bidders was 359 with an average of 515 bids,thus giving 1.44 bids per bidder. The average bid amount was EUR 300 billion,with a maximum of EUR 344 billion and a minimum of EUR 224 billion. Thus,in the calibration exercise presented in Section 2, we set as benchmark valuesQ(n) = 300 and n = 300. The average allotted amount was EUR 239 billion, witha maximum of EUR 263 billion and a minimum of EUR 206 billion, suggestinga relatively stable supply environment. The bid-to-cover ratio moved around anaverage value of 1.26, which suggests relatively successful bidding. In the sam-ple period the marginal MRO rate was 2.007 on average, the average secondarymarket repo rate 2.011, the weighted average MRO rate was 2.0148 on average,and the average EONIA swap rate 2.0306. Thus, the average spread betweenthe secondary market repo rate and the marginal ECB tender rate was 0.4 basispoints, indicative of a small though positive bid shading component.16 In thecalibration exercise we used somewhat higher market rates for the sake of clarityin the illustration.
5. Empirical results
Not all the data are usable for the empirical analysis. In fact, the implementationof the (averaged) parametric disaggregated approach requires the availability of atleast two di¤erent bids placed during the 31 auctions in the sample, not necessarilyat the same auction. After excluding from the sample the banks that placed only asingle bid over the 31 auctions or always bid at the same price, 525 banks and 15753bids (representing a value of EUR 9297.607 billion) are left, against a total of 593banks and 15973 bids (for a total value of EUR 9327.326 billion). Although thenumber of excluded banks relative to the total number of banks in the sample is notnegligible (12%; 68 banks), the number of excluded bids is negligible both in termsof total number (0.25%; 220 bids) and total value (0.3%; EUR 29.719 billion).Hence, the analysis carried out by means of the disaggregated parametric approachshould not be a¤ected by sample trimming, albeit subject to the caveat that theestimated bidding functions are only representative of the average behavior ofeach agent. Yet, in the light of the short sample employed (March 2004 - October2004) and the relatively smooth liquidity supply and bidding environment that
16Note that the theoretical (shadow) repo rate should lie somewhat above the secondarymarket repo rate because the collateral pledged in the latter is more liquid than the collateralpledged in the ECB main re�nancing operations.
17ECB
Working Paper Series No 793August 2007
characterized the euro area money market over the period investigated, the resultsdrawn from the average analysis are expected to be reliable. Moreover, the periodunder analysis was marked by absence of short-term expectations of key ECBinterest rate changes, which could have undermined the private values assumptionunderlying the modelling approach.
5.1. Bidders�heterogeneity
A �rst evaluation of the presence of heterogeneity across bidders can be carriedout through the analysis of the estimated bidding functions for each single bidder.As discussed in the methodological section, bidding functions for each agent andauction have been estimated by means of OLS regressions using both a linear andlog-log speci�cation. Given the characteristics of the data analyzed, only averagebidding functions could be estimated for each agent. Summary statistics arereported in Table 1, where �gures have been normalized relative to the averageallotment value, while in Figure 4 the estimated empirical distributions, afterlog transformation, are plotted. Only results obtained for the linear model havebeen reported, since the latter speci�cation appeared to be superior to the log-logmodel in terms of �t (the average R2 is equal to 0.98 for the linear model and0.95 for the log-log model). As Table 1 and Figure 4 show, there is evidenceof heterogeneity across bidders, with 70% of the slopes and intercepts falling inthe range (-0.002, -0.16) and (0.008, 0.85), respectively (the estimated standarddeviations are equal to 0.93 and 1.89, with mean values equal to -0.20 and 0.41,for slopes and intercepts respectively).Evidence of heterogeneity is also provided by the estimated price (interest
rate) elasticities, ranging between -203 and -33 (estimated mean and standarddeviations are -94 and 34). Despite the variability found, in all cases the evidencepoints to highly elastic (inverse) bidding functions. Computing the price elastic-ities using the log-log model, rather than using the average bids values, does notmodify this conclusion, with quantiles also numerically very similar to the onesobtained from the linear model.As shown by the QQ-plots reported in Figure 4, the distribution of the es-
timated slopes and intercepts is very close to a lognormal one, while for theelasticities the evidence is less compelling, due to a heavier than predicted lefttail. An important open question thus is whether the presence of heterogeneity issu¢ cient to empirically reject the theoretical results implied by an homogeneousagents framework.
18ECB Working Paper Series No 793August 2007
5.2. Bid-shading analysis
In Figure 4 the empirical distribution for the estimated (log) bid-shading compo-nents are plotted, while in Table 1 quantiles for the actual values of the components(multiplied by 100) and the test for signi�cance of the estimated components arereported. Three �ndings seem to be of particular interest. First, the bid-shadingcomponents seem to follow closely a log normal distribution. Second, the esti-mated bid-shading components tend to be small, ranging between 0.2 b.p. and0.8 b.p., with average value of 0.5 b.p. and a standard deviation equal to 0.12 b.p.The fact that the sample average of the spread between the secondary market reporate and the marginal ECB tender rate (0.4 b.p.) falls within this interval is fur-ther evidence of bid-shading (see footnote 11). Third, the estimated bid-shadingcomponents tend to be statistically signi�cant. The null of zero bid-shading com-ponent, against the alternative of positive bid-shading component, can be rejectedat the 1% signi�cance level 90% of the times. Given the large number of biddersparticipating at each auction and across auctions, �nding positive, statisticallysigni�cant bid-shading components provides evidence that bid-shading does notdisappear even when n is large. This is one of the key theoretical predictions,which is not rejected.
5.3. Tests on individual bidding behavior
Table 2 reports the results of the tests on bidding behavior described in themethodological section. The regressions have been estimated by OLS and het-eroskedasticity consistent standard errors have been computed. Moreover, in or-der to control for the di¤erent magnitude of the variables employed the dependentand independent variables have been standardized.
Test 1: Is more successful bidding associated with more aggressivebidding? The key parameters to answer this question are ��1 and ��1, which areexpected to be both negative as an increase in �si (less success) should be correlatedwith less aggressive bidding behavior. Indeed, both estimated parameters arenegative and statistically signi�cant (see Table 2). However, the R2 of the sloperegression is virtually zero (0.01), while that of the intercept regression is nonnegligibly larger (0.12).
Test 2: Is the strategic inverse bid schedule �atter than the true de-mand? The key parameter for this test is �q; which is expected to be negative
19ECB
Working Paper Series No 793August 2007
in the case large bid volumes are accompanied by less bid-shading. This hypoth-esis is weakly supported by the data (see Table 2). In fact, the linkage betweenslopes and the bid quantities is negative, but signi�cant only at the 10% level.However, the R2 of the regression is virtually zero (0.01), suggesting that bidders�heterogeneity is little explained by this size variable.
Test 3: Sources of bid shading The key parameters for this test are 11 ; 21; 31 : Theoretical results suggest that 21 > 0; and 31 < 0; No clear cut pre-diction can be made about 11. Empirical evidence (see Table 2) does not rejectthe hypothesis that bid-shading falls as value uncertainty and the number of bid-ders increase ( 11, 13 < 0); and that bid-shading increases as supply uncertaintyincreases ( 32 > 0). The linkage of bid-shading with value uncertainty is signif-icant only when the one-week Eonia rate volatility is employed as a measure ofvalue uncertainty. As a general result, using the standard deviation of the es-timated intercepts to proxy value uncertainty leads to less signi�cant estimates,both in terms of estimated coe¢ cients and R2 of the regressions, than when thevolatility of the one-week Eonia rate is employed.17
The empirical evidence is in line with the theoretical predictions. The �ndingthat the parameter 11 has a negative sign con�rms the previous �ndings in Ny-borg et. al. 2002 that interest rate volatility leads to a reduction in bid-shading.This empirical �nding can be explained within the theoretical framework presentedin this paper, by an increase in the relative scarcity of liquid collateral. Unfor-tunately, until individual data on collateral is available this hypothesis cannotbe tested. Nevertheless, we �nd that allotment uncertainty increases bid-shadingand lowers tender rates, which is a result so far not considered or tested by otherauthors.
6. Conclusions
Overall the econometric results suggest that strategic and optimal behavior isprevalent in ECB tenders. Despite the documented heterogeneity across bidders,bidding behavior in ECB tenders seems consistent with optimal behavior in amulti-unit discriminatory pricing auction. There is evidence of a statistically sig-ni�cant bid shading component, even though the number of bidders is very large.
17The highest, average and lowest R2 for the parametric disaggregated approach are 0.73, 0.66and 0.58, respectively.
20ECB Working Paper Series No 793August 2007
We found that bid-shading increases with liquidity uncertainty and decreases withthe number of participants and with price uncertainty.
References
[1] Athey, Susan and P. A. Haile, 2004, Nonparametric Approaches to Auctions,(forthcoming Handbook of Econometrics).
[2] Back, K., and J. F. Zender, 1993, Auctions of Divisible Goods: On theRationale for the Treasury Experiment, Review of Financial Studies, 6, 733-764.
[3] Ewerhart, C., N. Cassola, N. Valla, 2006, Declining Valuations and Equilib-rium Bidding in Central Bank Re�nancing Operations, ECB Working PaperNo. 668, August 2006.
[4] Haile, P.A., H. Hong and M. Shum, 2003, Nonparametric Tests for CommonValues in First-Price Bid-Sealed Auctions, mimeo, University of Yale.
[5] Hortaçsu, A., 2002a, Mechanism Choice and Strategic Bidding in DivisibleGood Auctions: An Empirical Analysis of the Turkish Treasury AuctionMarket, mimeo, University of Chicago.
[6] Hortaçsu, A., 2002b, Bidding Behavior in Divisible Good Auctions: Theoryand Evidence from the Turkish Treasury Auction Market, mimeo, Universityof Chicago.
[7] Klemperer, P. and M. Meyer, 1989, Supply Function Equilibria in Oligopolyunder Uncertainty, Econometrica, 57, 1243-1277.
[8] Kyle, A. S., 1989, Informed Speculation with Imperfect Competition, Reviewof Economic Studies, 56, 317-356.
[9] Nyborg, K., U. Bindseil, and I. Strebulaev, 2002, Bidding and performance inrepo auctions: evidence from the ECB open market operations, ECBWorkingPaper No. 157, July 2002.
[10] Pagan, A. and Ullah, A., 1999, Nonparametric Econometrics, CambridgeUniversity Press, Cambridge, United Kingdom.
21ECB
Working Paper Series No 793August 2007
[11] Scalia, A., G. Bruno, and M. Ordine, 2005, Bank�s participation in the Eu-rosystem auctions and money market integration, paper presented to theECB Conference on Monetary Policy Implementation, 20-21 January 2005.
[12] Viswanathan, S. and J. Wang, 2002, Market Architecture, Limit-Order Booksversus Dealership Markets, Journal of Financial Markets, 5, 127-167.
22ECB Working Paper Series No 793August 2007
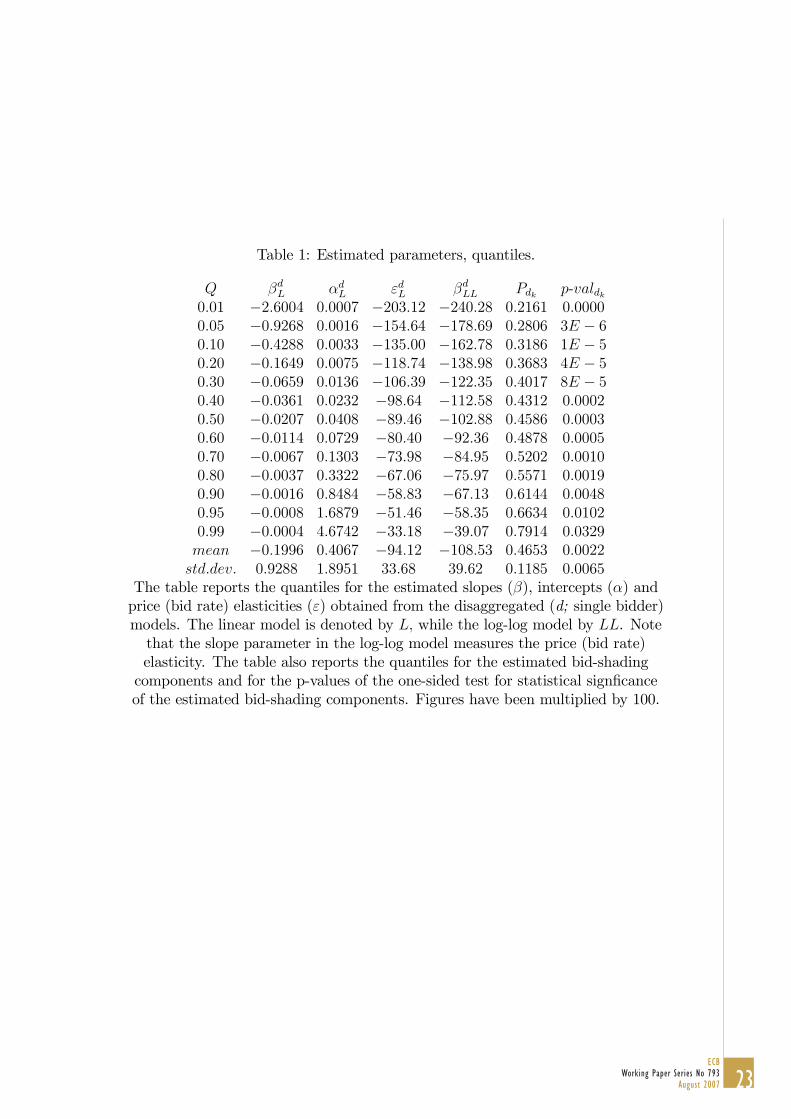
Table 1: Estimated parameters, quantiles.
Q �dL �dL "dL �dLL Pdk p-valdk0:01 �2:6004 0:0007 �203:12 �240:28 0:2161 0:00000:05 �0:9268 0:0016 �154:64 �178:69 0:2806 3E � 60:10 �0:4288 0:0033 �135:00 �162:78 0:3186 1E � 50:20 �0:1649 0:0075 �118:74 �138:98 0:3683 4E � 50:30 �0:0659 0:0136 �106:39 �122:35 0:4017 8E � 50:40 �0:0361 0:0232 �98:64 �112:58 0:4312 0:00020:50 �0:0207 0:0408 �89:46 �102:88 0:4586 0:00030:60 �0:0114 0:0729 �80:40 �92:36 0:4878 0:00050:70 �0:0067 0:1303 �73:98 �84:95 0:5202 0:00100:80 �0:0037 0:3322 �67:06 �75:97 0:5571 0:00190:90 �0:0016 0:8484 �58:83 �67:13 0:6144 0:00480:95 �0:0008 1:6879 �51:46 �58:35 0:6634 0:01020:99 �0:0004 4:6742 �33:18 �39:07 0:7914 0:0329mean �0:1996 0:4067 �94:12 �108:53 0:4653 0:0022std:dev: 0:9288 1:8951 33:68 39:62 0:1185 0:0065
The table reports the quantiles for the estimated slopes (�), intercepts (�) andprice (bid rate) elasticities (") obtained from the disaggregated (d; single bidder)models. The linear model is denoted by L; while the log-log model by LL. Notethat the slope parameter in the log-log model measures the price (bid rate)elasticity. The table also reports the quantiles for the estimated bid-shadingcomponents and for the p-values of the one-sided test for statistical sign�canceof the estimated bid-shading components. Figures have been multiplied by 100.
23ECB
Working Paper Series No 793August 2007
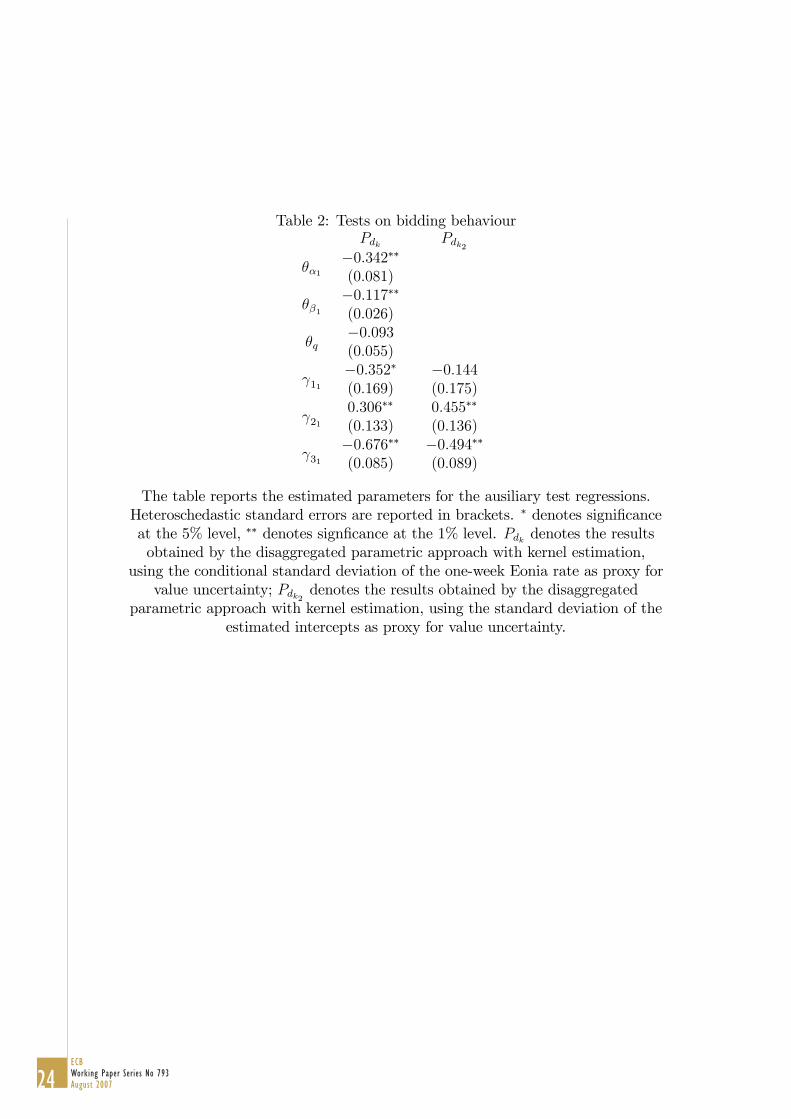
Table 2: Tests on bidding behaviourPdk Pdk2
��1�0:342��(0:081)
��1�0:117��(0:026)
�q�0:093(0:055)
11�0:352�(0:169)
�0:144(0:175)
210:306��
(0:133)0:455��
(0:136)
31�0:676��(0:085)
�0:494��(0:089)
The table reports the estimated parameters for the ausiliary test regressions.Heteroschedastic standard errors are reported in brackets. � denotes signi�canceat the 5% level, �� denotes sign�cance at the 1% level. Pdk denotes the resultsobtained by the disaggregated parametric approach with kernel estimation,
using the conditional standard deviation of the one-week Eonia rate as proxy forvalue uncertainty; Pdk2 denotes the results obtained by the disaggregated
parametric approach with kernel estimation, using the standard deviation of theestimated intercepts as proxy for value uncertainty.
24ECB Working Paper Series No 793August 2007
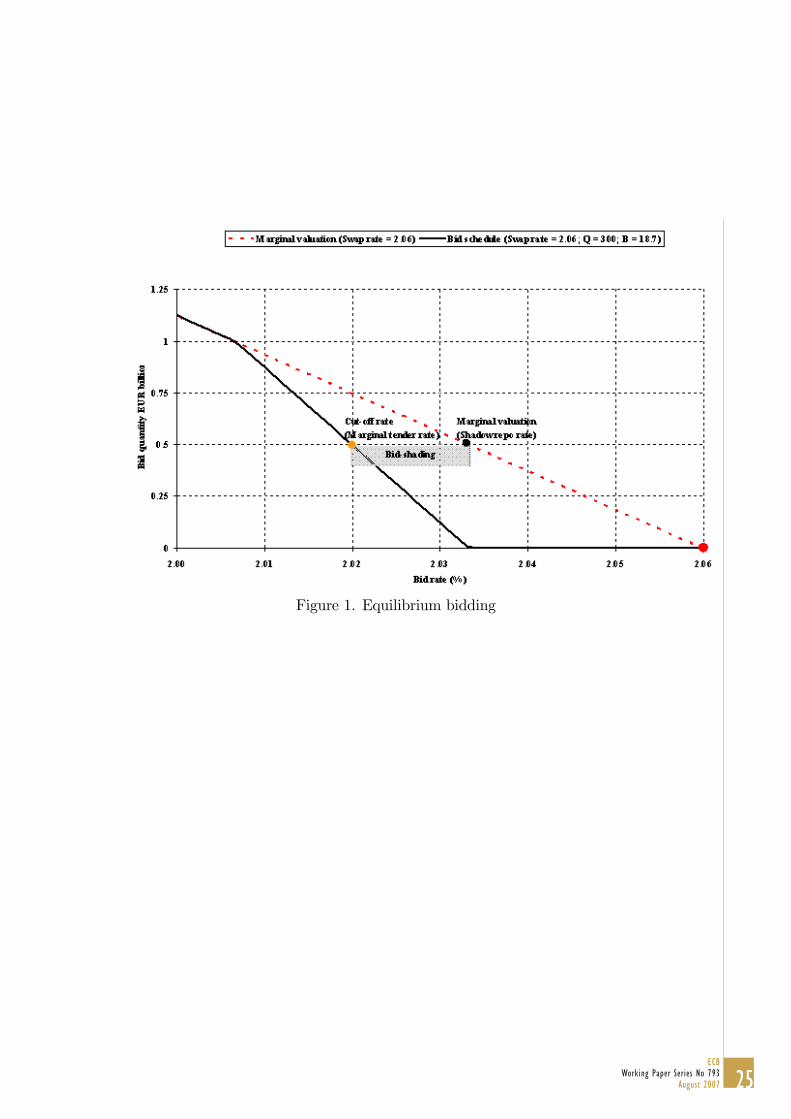
Figure 1. Equilibrium bidding
25ECB
Working Paper Series No 793August 2007
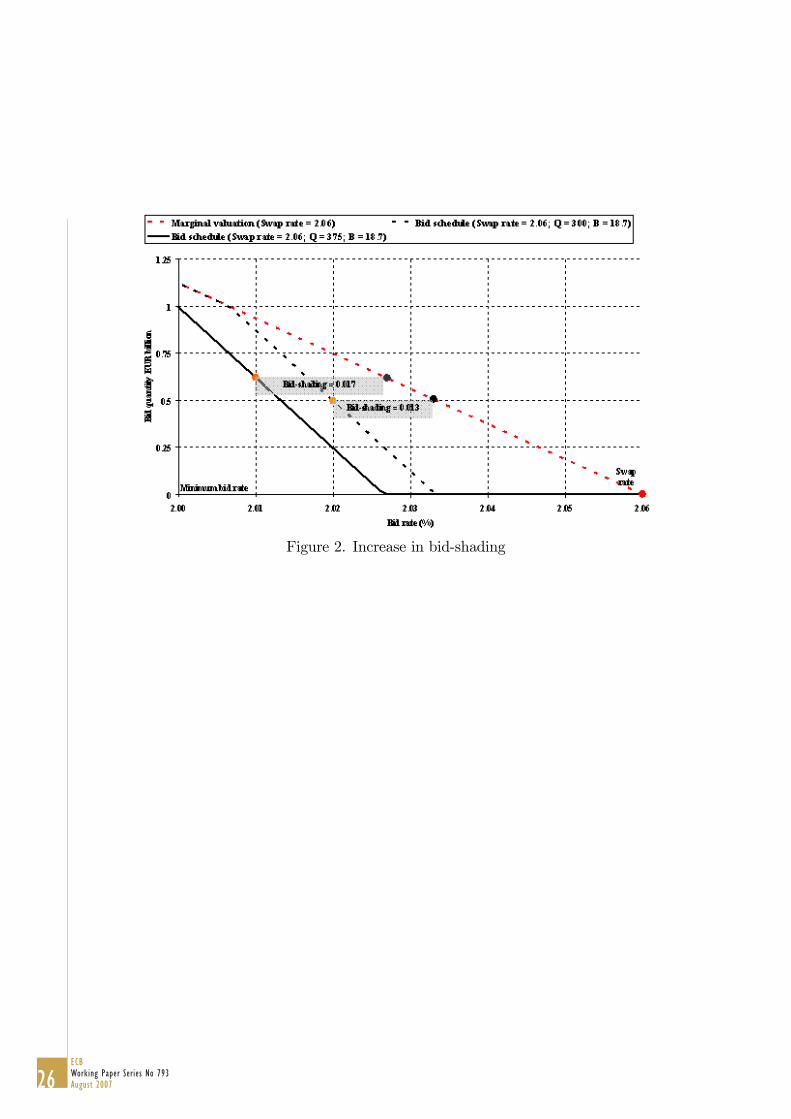
Figure 2. Increase in bid-shading
26ECB Working Paper Series No 793August 2007
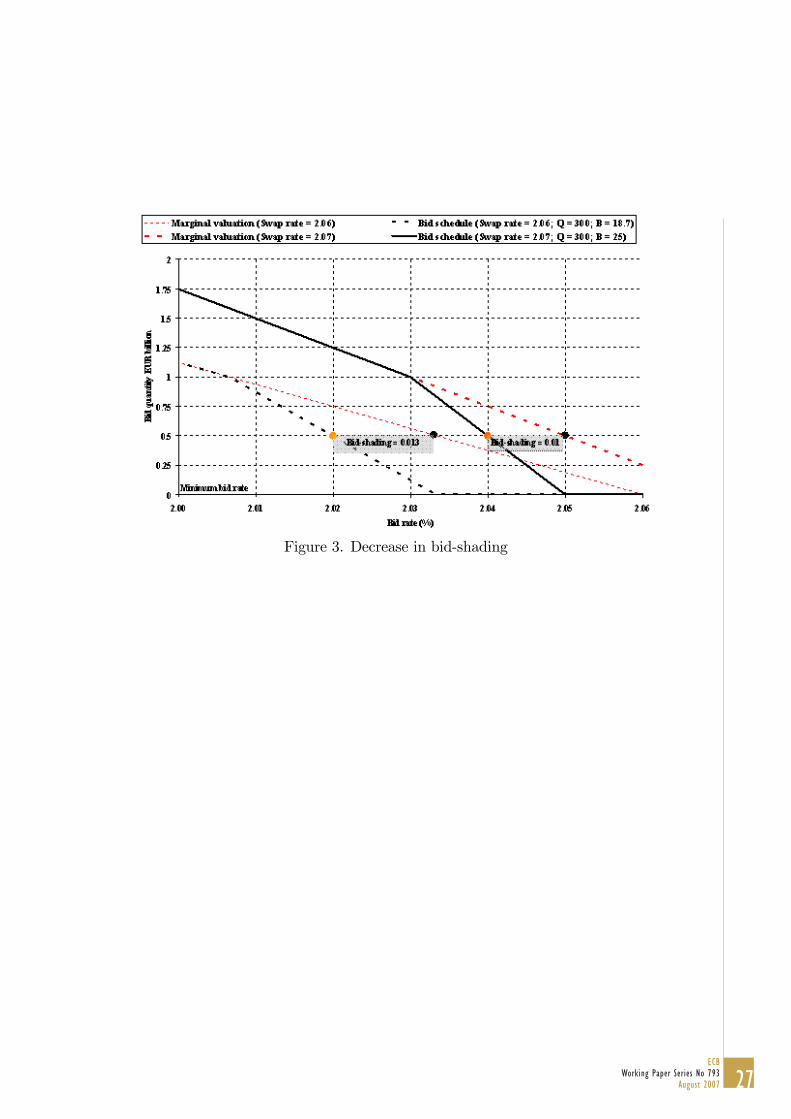
Figure 3. Decrease in bid-shading
27ECB
Working Paper Series No 793August 2007
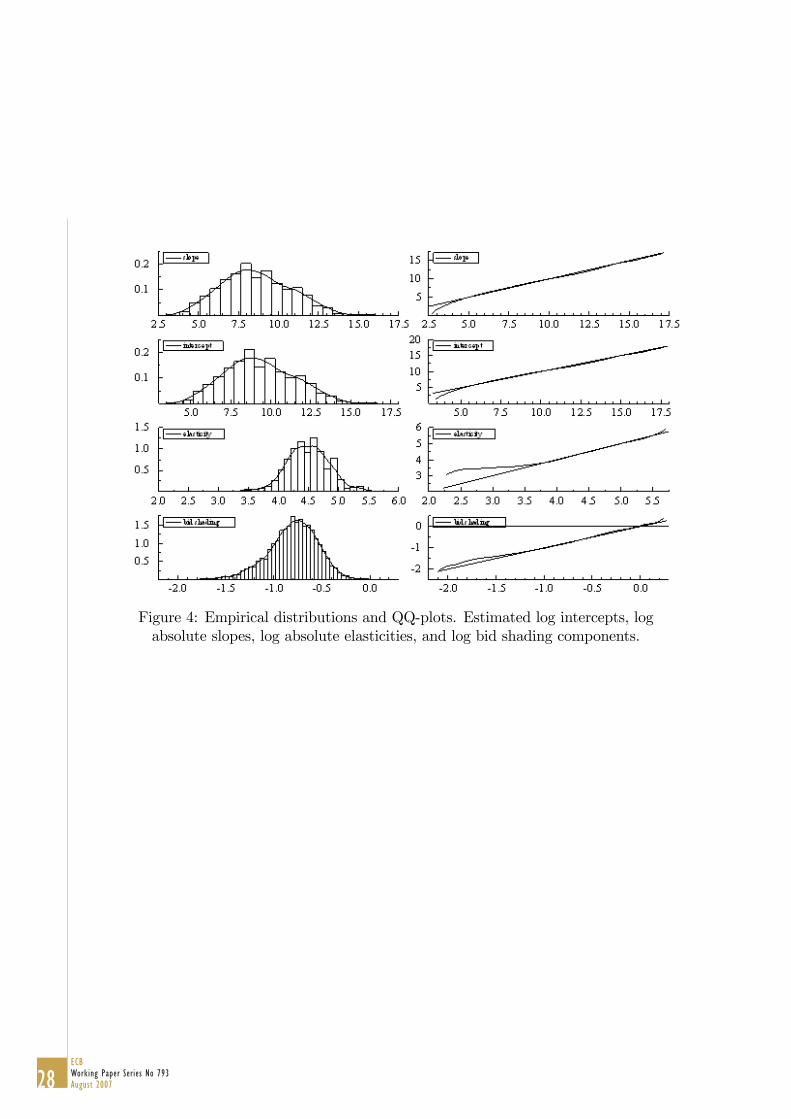
Figure 4: Empirical distributions and QQ-plots. Estimated log intercepts, logabsolute slopes, log absolute elasticities, and log bid shading components.
28ECB Working Paper Series No 793August 2007
29ECB
Working Paper Series No 793August 2007
European Central Bank Working Paper Series
For a complete list of Working Papers published by the ECB, please visit the ECB’s website(http://www.ecb.int)
748 “Financial dollarization: the role of banks and interest rates” by H. S. Basso, O. Calvo-Gonzalez and M. Jurgilas, May 2007.
749 “Excess money growth and inflation dynamics” by B. Roffia and A. Zaghini, May 2007.
750 “Long run macroeconomic relations in the global economy” by S. Dées, S. Holly, M. H. Pesaran and L. V. Smith, May 2007.
751 “A look into the factor model black box: publication lags and the role of hard and soft data in forecasting GDP” by M. Bańbura and G. Rünstler, May 2007.
752 “Econometric analyses with backdated data: unified Germany and the euro area” by E. Angelini and M. Marcellino, May 2007.
753 “Trade credit defaults and liquidity provision by firms” by F. Boissay and R. Gropp, May 2007.
754 “Euro area inflation persistence in an estimated nonlinear DSGE model” by G. Amisano and O. Tristani, May 2007.
755 “Durable goods and their effect on household saving ratios in the euro area” by J. Jalava and I. K. Kavonius, May 2007.
756 “Maintaining low inflation: money, interest rates, and policy stance” by S. Reynard, May 2007.
757 “The cyclicality of consumption, wages and employment of the public sector in the euro area” by A. Lamo, J. J. Pérez and L. Schuknecht, May 2007.
758 “Red tape and delayed entry” by A. Ciccone and E. Papaioannou, June 2007.
759 “Linear-quadratic approximation, external habit and targeting rules” by P. Levine, J. Pearlman and R. Pierse, June 2007.
760 “Modelling intra- and extra-area trade substitution and exchange rate pass-through in the euro area” by A. Dieppe and T. Warmedinger, June 2007.
761 “External imbalances and the US current account: how supply-side changes affect an exchange rate adjustment” by P. Engler, M. Fidora and C. Thimann, June 2007.
762 “Patterns of current account adjustment: insights from past experience” by B. Algieri and T. Bracke, June 2007.
763 “Short- and long-run tax elasticities: the case of the Netherlands” by G. Wolswijk, June 2007.

30ECB Working Paper Series No 793August 2007
764 “Robust monetary policy with imperfect knowledge” by A. Orphanides and J. C. Williams, June 2007.
765 “Sequential optimization, front-loaded information, and U.S. consumption” by A. Willman, June 2007.
766 “How and when do markets tip? Lessons from the Battle of the Bund” by E. Cantillon and P.-L. Yin, June 2007.
767 “Explaining monetary policy in press conferences” by M. Ehrmann and M. Fratzscher, June 2007.
768 “A new approach to measuring competition in the loan markets of the euro area” by M. van Leuvensteijn, J. A. Bikker, A. van Rixtel and C. Kok Sørensen, June 2007.
769 “The ‘Great Moderation’ in the United Kingdom” by L. Benati, June 2007.
770 “Welfare implications of Calvo vs. Rotemberg pricing assumptions” by G. Lombardo and D. Vestin, June 2007.
771 “Policy rate decisions and unbiased parameter estimation in typical monetary policy rules” by J. Podpiera, June 2007.
772 “Can adjustment costs explain the variability and counter-cyclicality of the labour share at the firm and aggregate level?” by P. Vermeulen, June 2007.
773 “Exchange rate volatility and growth in small open economies at the EMU periphery” by G. Schnabl, July 2007.
774 “Shocks, structures or monetary policies? The euro area and US after 2001” by L. Christiano, R. Motto and M. Rostagno, July 2007.
775 “The dynamic behaviour of budget components and output” by A. Afonso and P. Claeys, July 2007.
776 “Insights gained from conversations with labor market decision makers” by T. F. Bewley, July 2007.
777 “Downward nominal wage rigidity in the OECD” by S. Holden and F. Wulfsberg, July 2007.
778 “Employment protection legislation and wages” by M. Leonardi and G. Pica, July 2007.
779 “On-the-job search and the cyclical dynamics of the labor market” by M. U. Krause and T. A. Lubik, July 2007.
780 “Dynamics and monetary policy in a fair wage model of the business cycle” by D. de la Croix, G. de Walqueand R. Wouters, July 2007.
781 “Wage inequality in Spain: recent developments” by M. Izquierdo and A. Lacuesta, July 2007.
782 “Panel data estimates of the production function and product and labor market imperfections” by S. Dobbelaere and J. Mairesse, July 2007.
783 “The cyclicality of effective wages within employer-employee matches: evidence from German panel data”by S. Anger, July 2007.
784 “Understanding the dynamics of labor shares and inflation” by M. Lawless and K. Whelan, July 2007.
31ECB
Working Paper Series No 793August 2007
785 “Aggregating Phillips curves” by J. Imbs, E. Jondeau and F. Pelgrin, July 2007.
786 “The economic impact of merger control: what is special about banking?” by E. Carletti, P. Hartmann and S. Ongena, July 2007.
787 “Finance and growth: a macroeconomic assessment of the evidence from a European angle” by E. Papaioannou, July 2007.
788 “Evaluating the real effect of bank branching deregulation: comparing contiguous counties across U.S. state borders” by R. R. Huang, July 2007.
789 “Modeling the impact of external factors on the euro area’s HICP and real economy: a focus on pass-through and the trade balance” by L. Landolfo, July 2007.
790 “Asset prices, exchange rates and the current account” by M. Fratzscher, L. Juvenal and L. Sarno, August 2007.
791 “Inquiries on dynamics of transition economy convergence in a two-country model” by J. Brůha and J. Podpiera, August 2007.
792 “Euro area market reactions to the monetary developments press release” by J. Coffinet and S. Gouteron, August 2007.
793 “Structural econometric approach to bidding in the main refinancing operations of the Eurosystem” by N. Cassola, C. Ewerhart and C. Morana, August 2007.

ISSN 1561081-0
9 7 7 1 5 6 1 0 8 1 0 0 5