Structural Dynamics of the Actomyosin Complex Probed by a Bifunctional Spin Label that Cross-Links...
22
Structural dynamics of the actomyosin complex probed by a bifunctional spin label that crosslinks SH1 and SH2 Andrew R. Thompson 1† , Nariman Naber 2† , Clyde Wilson 2 , Roger Cooke 2,3 , and David D. Thomas 1 * 1 Department of Biochemistry, Molecular Biology and Biophysics, University of Minnesota, Minneapolis, MN 55455 2 Department of Biochemistry and Biophysics and 3 Cardiovascular Research Institute, University of California, San Francisco, California 94158; Accepted to Biophys. J. on September 2, 2008 † A.R.T. and N.N. contributed equally to this work. *To whom correspondence should be addressed Running title : EPR of a bifunctional spin label on myosin Keywords: EPR, ESR, cross-linking, weak-binding, muscle fiber, pPDM Abbreviations: BSL, 3,4-bis-(methanethiosulfonyl-methyl)-2,2,5,5-tetramethyl-2,5-dihydro-1h- pyrrol-1-yloxy; pPDM, N,N′-(1,4-phenylene)dimaleimide; EPR, electron paramagnetic resonance; STEPR, saturation transfer electron paramagnetic resonance; IASL, 4-(2- iodoacetamido)-2,2,6,6-tetramethylpiperidine 1-oxyl; MTSSL, (1-oxy-2,2,5,5-tetramethyl-∆ 3 - pyrroline-3-methyl)methanethiosulfonate.
-
Upload
independent -
Category
Documents
-
view
1 -
download
0
Transcript of Structural Dynamics of the Actomyosin Complex Probed by a Bifunctional Spin Label that Cross-Links...

Structural dynamics of the actomyosin complex probed by a
bifunctional spin label that crosslinks SH1 and SH2
Andrew R. Thompson1†, Nariman Naber2†, Clyde Wilson2, Roger Cooke2,3, and David D.
Thomas1*
1Department of Biochemistry, Molecular Biology and Biophysics, University of Minnesota, Minneapolis, MN 55455 2Department of Biochemistry and Biophysics and 3Cardiovascular Research Institute, University of California, San Francisco, California 94158;
Accepted to Biophys. J. on September 2, 2008
† A.R.T. and N.N. contributed equally to this work. *To whom correspondence should be addressed Running title : EPR of a bifunctional spin label on myosin Keywords: EPR, ESR, cross-linking, weak-binding, muscle fiber, pPDM Abbreviations: BSL, 3,4-bis-(methanethiosulfonyl-methyl)-2,2,5,5-tetramethyl-2,5-dihydro-1h-pyrrol-1-yloxy; pPDM, N,N′-(1,4-phenylene)dimaleimide; EPR, electron paramagnetic resonance; STEPR, saturation transfer electron paramagnetic resonance; IASL, 4-(2-iodoacetamido)-2,2,6,6-tetramethylpiperidine 1-oxyl; MTSSL, (1-oxy-2,2,5,5-tetramethyl-∆3-pyrroline-3-methyl)methanethiosulfonate.
ABSTRACT We have used a bifunctional spin label (BSL) to crosslink
Cys 707 (SH1) and Cys 697 (SH2) in the catalytic domain of myosin subfragment
1 (S1). BSL induces the same weakened ATPase activity and actin-binding
affinity that is observed when SH1 and SH2 are crosslinked with pPDM, which
traps an analog of the post-hydrolysis state A.M.ADP.P. EPR showed that BSL
reports the global orientation and dynamics of S1. When bound to actin in
oriented muscle fibers in the absence of ATP, BSL-S1 showed almost complete
orientational disorder, as reported previously for the weakly bound A.M.ATP. In
contrast, helical order is observed for the strongly bound state A.M. Saturation
transfer EPR showed that the disorder of crosslinked S1 on actin is nearly static
on the microsecond time scale, at least 30 times slower than that of A.M.ATP.
We conclude that crosslinked S1 exhibits rotational disorder comparable to that
of A.M.ATP, slow rotational mobility comparable to that of A.M, and intermediate
actin affinity. These results support the hypothesis that the catalytic domain of
myosin is orientationally disordered on actin in a post-hydrolysis state in the early
stages of force generation.
Introduction
Muscle contraction is produced when actin activates the hydrolysis of ATP by myosin, resulting
in relative translation of the two proteins. Force generation has been proposed to originate from
transition of the myosin catalytic domain from a disordered state of weak actin binding to an
ordered state of strong actin binding, followed by a lever arm rotation of the light chain domain
(1-3) (Fig. 1). The strongly bound complexes A.M and A.M.D have been studied in great detail:
In the absence of nucleotide or in the presence of MgADP, actin and myosin interact such that
the orientations of both the catalytic (4,5) and light-chain (6) domains are well defined with
respect to the actin filament axis. However, much less is known about the structures of the
weakly bound complexes (A.M.T and A.M.D.P), not only because of their dynamic disorder, but
also because they are short-lived. Saturation transfer EPR (STEPR) in the steady state of ATP
hydrolysis (7,8), or in the presence of ATPγS (9,10) has shown clearly that weakly attached
myosin heads undergo large-amplitude rotational motions with correlation times in the range of 1
to 20 µs, and this is consistent with the orientationally disordered appearance of S1 bound to
actin in electron micrographs of similar weakly bound complexes (11-13).
However, all of these EPR and EM experiments were done under conditions in which the
predominant actin-attached states were most likely the prehydrolysis complex A.M.T. The post-
hydrolysis complex A.M.D.P is potentially of much more interest, since there is evidence that
force generation begins in this biochemical state, before phosphate is released (14,15). This
complex has remained elusive for two reasons: (a) Actin greatly accelerates the release of Pi
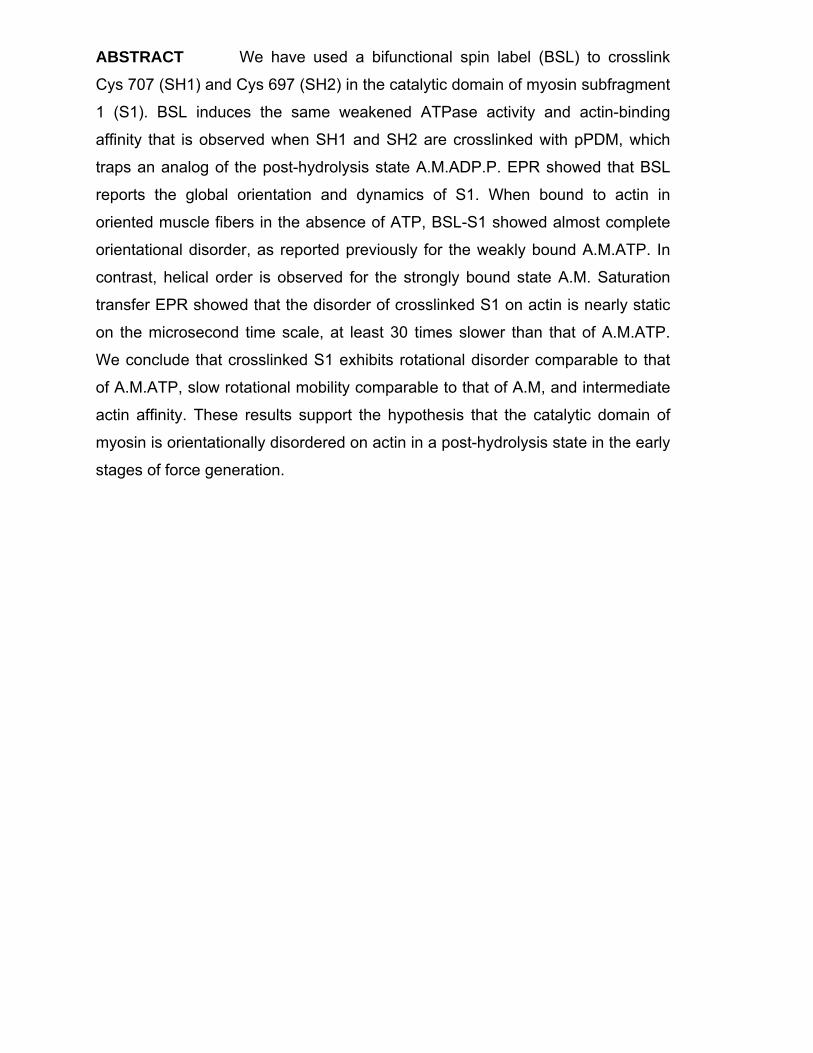
A.M.D ↔ A.M.T ↔ A.M.D.P ↔ A.M'.D ↔ A.M.D(S) (W) (W) (S) (S)
CD
LCD
Fig. 1: Structural model by which ATP hydrolysis is coupled to movement of actin (yellow) by myosin’s catalytic domain (CD) and light-chain domain (LCD). Red and green colors signify pre-and post-force generating conformations, arrows signify orientational disorder, and steps indicate stages in the cycles where force and movement are likely to be imparted to actin. A = actin, M = myosin, T = ATP, D = ADP, P = inorganic phosphate. S = strong-binding (force-generating) structural state, W = weak-binding structural state. Prime symbol (′) indicates a second structural state corresponding to the same biochemical state (defined by the active-site ligand).

from myosin (converting A.M.D.P to A.M.D); and (b) actin shifts the equilibrium constant for
hydrolysis toward the prehydrolysis state (converting A.M.D.P to A.M.T) by a factor of 20 (16).
It has not proven feasible to prepare a stable complex of actin with myosin using the post-
hydrolysis analogs ADP.Vi and ADP.AlF4, because actin rapidly dissociates the phosphate
analogs from the complex (17,18). The nucleotide analogs AMPPNP and pyrophosphate do
remain bound in ternary complexes with actin and myosin, but these complexes are
indistinguishable from the strongly bound complex A.M.D (9,19,20).
There is one relatively stable equilibrium complex, though, that has been proposed to
have the biochemical and structural properties of the ternary complex A.M.D.P: the complex of
actin with myosin S1 that has been reacted with pPDM, which specifically crosslinks SH1 (Cys
707) to SH2 (Cys 697) (21-23). It was found that pPDM-S1 exhibits weak actin binding, with an
actin affinity at low ionic strength (Kd = 30 µM) only about 3 times stronger than S1.ATP, 100
times weaker than S1.AMPPNP, and 1000 times weaker than S1.ADP (22). The observation that
ADP-bound S1 has three orders of magnitude greater actin affinity seems surprising, considering
that pPDM traps MgADP during crosslinking and MgADP accelerates the reaction of pPDM
with S1 (24,25). However, the removal of MgADP after pPDM crosslinking has little effect on
the properties of pPDM-S1, so the weak binding is not a function of the trapped nucleotide (21).
Chemical (25), spectroscopic (26), and crystallographic (27) analysis suggested a structural
explanation: pPDM is much too short to crosslink Cys697 to Cys707 in the crystal structure of
S1 (28), so nucleotide binding results in the disordering of the intervening SH1 helix, permitting
the two Cys residues to approach, at least transiently, within the pPDM crosslinking distance.
Thus it is likely that pPDM-S1 is a structural and functional analog for a weak-binding post-
hydrolysis state A.M.D.P, so there is a need for spectroscopic data to characterize the structure
and dynamics of this complex.
However, the reaction of pPDM blocks SH1 and SH2, thus preventing use of the SH1-
bound spin labels that have been so useful in characterizing the orientation and dynamics of
myosin catalytic domains bound to actin. To solve this problem, in the present study we use a
bifunctional spin label (BSL) that is itself a cysteine cross-linker. We show that it binds rigidly
and specifically to S1, crosslinking SH1 and SH2. To obtain information about the orientation of
the spin-labeled S1 relative to actin, and to overcome the weak binding of the crosslinked S1 to
actin, we perform EPR experiments in skinned muscle fibers, where the free actin concentration
is ~360µM (29). We decorate these fibers with spin-labeled S1 and then use both conventional
and STEPR to determine the orientation and rotational dynamics of the actin-attached myosin
heads in this weak-binding analog of A.M.D.P.

Methods
Preparation of proteins and muscle fibers
Myosin, chymotryptic myosin subfragment 1 (S1), and actin were prepared from rabbit
skeletal muscle as described previously (17). Concentrations were determined from UV
absorbance: [myosin] = (A280-A320)/(2.49 x 105 M-1cm-1), [S1] = (A280-A320)/(8.07 x 104 M-1cm-1),
[actin] = (A290-A320)/(2.71 x 104 M-1cm-1). Glycerinated rabbit psoas muscle fiber strips
(approximately 2 mm diameter) were prepared and stored in a 1:1 (vol:vol) mixture of rigor
buffer (120 mM KCl, 25 mM MOPS, 2 mM MgCl2, 1 mM EGTA, pH 7.0) and glycerol at -20oC
for up to 6 months without significant loss of function (30). All preparations and experiments
below were carried out at 4oC.
Monofunctional labeling SH1 (Cys 707) of the myosin S1 head was spin-labeled with the monofunctional probes IASL
(Sigma–Aldrich, St. Louis, MO) or MTSSL (Toronto Research Chemicals, North York, ON) as
follows: 20 µM S1 was incubated with 30 µM spin label at 4oC in monofunctional labeling
buffer (50 mM MOPS, 50 mM KCl, pH 7.0) for 16 h for IASL or 2 h for MTSSL. The unbound
spin label was removed by passing the labeled protein twice through a Pierce Zeba size-
exclusion spin column (Thermo Fisher Scientific Inc., Rockford, IL), which was equilibrated
with monofunctional labeling buffer. S1 was then concentrated and transferred to low salt buffer
(LSB, 2 mM MgCl2, 1 mM EGTA, 40 mM MOPS pH 7) using an Amicon Centricon membrane
concentrator (Millipore, Billerica, MA). The resulting purified protein is termed IASL-S1 or
MTSSL-S1. To prepare IASL-myosin, the same procedure was used, except that removal of
unbound label and concentration were accomplished by sedimentation and resuspension of
myosin filaments (31).
Bifunctional labeling
SH1 (Cys 707) and SH2 (Cys 697) were crosslinked using either BSL (Toronto Research
Chemicals, North York, ON) or pPDM (Sigma–Aldrich, St. Louis, MO). To a solution of 20 µM
S1 in crosslinking buffer (1 mM ADP, 2mM MgCl2, 100 mM KCl, 40 mM Tris, pH 7.8), 24 µM
BSL or 30 µM pPDM was added from freshly prepared stock solutions in DMF, such that the
final DMF concentration never exceeded 1%. After 1 h, the unreacted crosslinker was removed
and the protein was concentrated as described above for monofunctional labeling. The unreacted
and monofunctionally labeled S1 were removed by co-sedimentation with actin in LSB. The
resulting purified preparations are termed BSL-S1 and pPDM-S1 respectively. To prepare BSL-

myosin, the same procedure was used, except that removal of unbound label was accomplished
by sedimentation and resuspension of myosin filaments (31).
Biochemical Assays
To assess Cys labeling of SH1 and SH2, the K/EDTA and Ca/K ATPase activities were
measured at high ionic strength by measuring phosphate liberation after acid quench (32). The
incubation buffer (25°C) contained 50 mM MOPS and 0.6M KCl, pH 7.5, and either 5 mM
EDTA (K/EDTA ATPase) or 10 mM CaCl2 (Ca/K ATPase). The activity was checked by
ATPase assays both before and after the acquisition of spectra to ensure stability of the observed
state. The equilibrium constant for dissociation of labeled S1 from actin (Kd) was measured in
LSB by cosedimentation (33).
To assess the weak or strong mode by which S1 binds to actin, the quenching of pyrene-
labeled actin was measured (34). Actin was labeled at Cys 374 with pyrene iodoacetamide
(Invitrogen, Carlsbad, CA) (17), and fluorescence was measured using a Varian Cary Eclipse
fluorometer (Varian Inc., Palo Alto, CA), with excitation and emission at 350 nm and 409 nm,
respectively. S1 or labeled S1 was then added in excess of actin. Strong binding of S1 to actin
was noted by a quenching of pyrene fluorescence, whereas weak binding (e.g., in the presence of
saturating ATP) produced no change from the basal pyrene fluorescence (34).
EPR spectroscopy
For EPR experiments on spin-labeled myosin or S1 in solution, samples were dialyzed into LSB,
adjusted to a final concentration of 100 µM myosin heads, and were placed into a flame-sealed
glass capillary (50 µL Wiretrol, Drummond Scientific, Broomall, PA). For experiments on actin-
bound S1, skinned muscle fiber strips were dissected into bundles of approximately 0.5 mm
diameter. The fibers were then soaked in the spin-labeled S1 solution in LSB (either IASL-S1 or
BSL-S1), at a concentration of 100 µM or higher. After at least 2 h the fibers were washed
several times with LSB to remove any unbound S1.
S1-decorated muscle fiber bundles were cut into 0.5 cm lengths and aligned to be
perpendicular to the long axis of a quartz tissue flat cell that contained a well of dimensions 0.5 x
1.0 x 0.05 cm (WG-806-Q, Wilmad-Labglass, Buena, NJ). Excess moisture was wicked away
from the fibers with a Kimwipe (Kimberly-Clark, Neenah, WI) and a cover-slip was placed over
the sample well, sealed with vacuum grease to prevent sample dehydration. The flat cell
assembly was then centered in the EPR cavity using Teflon collets and the fiber axis was
manually oriented parallel or perpendicular to the external magnetic field. To obtain randomly
oriented fibers for STEPR and other experiments, fibers were minced with a razor blade, and

random orientation was verified by showing that the spectrum was insensitive to the flat cell’s
orientation in the magnetic field. STEPR experiments were performed with the flat cell plane
perpendicular to the applied field.
EPR spectra were obtained at X-band (9.5 GHz) with either a Bruker (Billerica, MA)
EMX or E500 spectrometer, using a TE102 (Bruker 4102ST) cavity. The sample temperature
was maintained at 4°C by flowing cold N2 gas through a nozzle attached to the optical port on
the front of the cavity. The sweep width was 120 G (1024 points), sweep time was typically 40s,
and the center field value HC was set proportionally to the microwave frequency (HC = ν/2.803
MHz/G, corresponding to a g value of 2.0027, the value of gz for a typical nitroxide) so that all
spectra were equivalently aligned.
Conventional (V1) spectra were recorded at a microwave field amplitude of H1 = 0.14 G,
with modulation frequency νm = 100 kHz (first harmonic), peak-to-peak modulation amplitude
Hm = 1 G, modulation phase φm = 0 degrees (maximum signal), and filter time constant τF =
conversion time. STEPR (V2') spectra were recorded essentially as described previously (35),
with H1 = 0.25 G, νm = 50 kHz, Hm = 5 G, phase-sensitive detection at 100 kHz (second
harmonic), φm = 90 degrees (minimum signal at non-saturating power), and τF = twice the
conversion time (Due to the higher Hm, this does not distort the spectrum, since the linewidths
are greater.). Typically, the signal/noise per scan was lower for V2' than for V1, so the number of
scans was increased; typical acquisition times were 5 min for V1 and 30 min for V2'.
For each different sample configuration, H1 was determined from H1 = C P1/2Q0/Q, where
C was determined by calibration with a sample of known saturation properties (peroxylamine
disulfonate (35)), Q0 is the cavity quality factor (measured by the spectrometer) during the
original calibration, and Q is the value measured for each experiment. P was adjusted to obtain
the desired H1 value. For the standard flat cell configuration, C = 1.0 G/W1/2 and Q0 = 1200, so P
was set at 20 mW x Q/1200 for V1 and 63 mW x Q/1200 for V2'.
Conventional EPR spectra (V1) of spin-labeled S1 attached to actin in oriented muscle
fibers were analyzed to determine the orientational distribution of the nitroxide spin label relative
to the muscle fiber axis, using computational simulation and least-squares minimization, as
described previously (4,36). Briefly, the spectrum of minced fibers or precipitated S1 was first fit
to obtain the orientation-independent parameters, such as the effective values for the anisotropic
T and g matrices, and the linewidths. Using these values, spectra of oriented fibers were then fit
to the orientational distribution of the spin label relative to the fiber axis, as defined by the center
(θ0') and width (∆θ', full width at half maximum) of the presumed Gaussian orientational
distribution.

STEPR spectra (V2') of randomly oriented samples (in solution or minced fibers) were
analyzed to determine the effective rotational correlation time τR, by measuring the ratio of the
features L'' and L for µs-ms motion or C' and C for sub-µs motion, as defined previously (35).
The position of L'' was taken as an average of height above baseline of the data 5-10G to the
right of L. The measured ratios L''/L and C'/C were then used to determine the rotational
correlation time by comparison to the data for a model system shown in Figure 3 of (35).
Quantification of the extent of spin labeling (spin labels bound per S1) was done by
digital analysis of EPR spectra (37). Briefly, the double integral of the V1 spectrum of a known
concentration of S1 (typically 100 µM) was obtained at sufficiently low power to avoid
saturation (typically 1 mW). This value was then compared to the double integral of a sample of
known spin label concentration at the same microwave power and H1 value, to obtain the number
of spin labels per S1.

Results BSL crosslinks SH1 and SH2.
The K-ATPase and Ca-ATPase activities, in conjunction with spin counts, were used to
assess the extent and specificity of SH1 and SH2 labeling (Table 1). In both cases of
monofunctional labeling (with IASL and MTSSL), the K-ATPase is inhibited by >85% and Ca-
ATPase activated by >90%, indicating an essentially complete reaction with SH1 but not SH2
(38). For both BSL-S1 and pPDM-S1, the K-ATPase is also strongly inhibited, indicating
essentially complete reaction with SH1, but the Ca-ATPase is less than 10% of that observed for
IASL-S1 and MTSSL-S1, implying that at least 90% of SH2 has also been labeled (39). The
result of EPR-based quantitation of the spin label concentration (METHODS) yields 0.94 ± 0.07
moles of BSL per mole of S1. We conclude that virtually every S1 has both SH1 and SH2
blocked by a single spin label, which must be crosslinking the two cysteines (see Supplementary
Material). Cosedimentation with actin showed that monofunctionally labeled S1 binds actin
strongly (Kd < 1 µM), in agreement with previous results (9), while both crosslinked S1 species
bind actin much more weakly (Kd ≈ 30 µM) (Table 1). Similarly, monofunctionally labeled S1
strongly quenched the fluorescence of pyrene-labeled actin, while neither BSL-S1 nor pPDM-S1
caused significant quenching, even when added at concentrations comparable to Kd. These
results confirm that monofunctionally labeled S1 binds strongly to actin, while BSL-S1 binds
weakly and has the same effect on actin structure as pPDM-S1 or S1.ATP (34). We conclude that
BSL completely and specifically crosslinks SH1 and SH2, giving BSL-S1 the same weak actin-
binding properties as pPDM-S1.
Table 1: The effect of labeling S1 on ATPase activity and actin binding
Sample Relative K-ATPase Relative Ca-ATPase Kd
IASL-S1 11 ± 4 1080 ± 70 < 1 µM
MTSSL-S1 13 ± 7 960 ± 90 < 1 µM
BSL-S1 8 ± 6 79 ± 6 31 ± 6 µM
pPDM-S1 12 ± 9 45 ± 7 30 ± 7 µM
ATPase values are % (mean ± SE) of unmodified S1 values, 8.7 ± 0.5 s-1 (K-ATPase) and 0.92 ± 0.07 s-1 (Ca-ATPase).

The conventional (V1) EPR spectra of
both IASL-S1 and BSL-S1 indicate that the
nitroxide probes are strongly immobilized on
the protein, with an outer splitting 2T||’ = 69.5
G (Fig. 2) corresponding to that predicted for
slow tumbling of S1 in solution, with a
rotational correlation time of about 200 ns
(40). In contrast MTSSL, the monofunctional
version of BSL, shows a narrow spectrum
indicating a high degree of mobility in the
subnanosecond time range (Fig. 2), despite its
attachment to the same SH1 site as IASL. This
result indicates that BSL’s immobilization is
due to bifunctional attachment to S1, at both
SH1 and SH2, as indicated by Table 1.
EPR of oriented muscle fibers
decorated with S1 EPR has a high degree of sensitivity to the orientational distribution of a spin label with
respect to the externally applied magnetic field. The spectrum is sensitive primarily to the angle
IASL
MTSSL
BSL
2TII'
Fig. 2: Conventional (V1) EPR spectra of spin-labeled S1 (100 µM) in LSB at 4°C.
θ0′=0° θ0′=45° θ0′=90°
FIB
ERA
XIS
θ ′ H||
H⊥
∆θ ′=0°
∆θ ′=45°
∆θ ′≥180°
Fig. 3: Simulated EPR spectra, showing the dependence of conventional (V1) EPR spectra on the orientation θ′ of the nitroxide spin label’s principal axis relative to the muscle fiber (actin filament) axis. A Gaussian distribution of θ′is assumed, where θ0′ is the center of the distribution and ∆θ′ is the full width at half maximum. Spectra are shown corresponding to the muscle fiber axis both parallel (red) and perpendicular (blue) to the applied magnetic field (H).

θ between the spin label’s principal axis and the field. In a well oriented system, such as skinned
muscle fibers, this sensitivity can be used to measure the orientation of the probe with respect to
the fiber axis (θ') (4), as simulated in Fig. 3. When the fibers are aligned on a flat cell, the fiber
axis can be oriented either parallel (red, where θ = θ′) or perpendicular (blue, where θ′ exhibits
more disorder due to helical symmetry, as illustrated in Fig. 3) to the applied magnetic field.
The orientation of spin-labeled S1
bound to actin, with respect to the actin
filament axis, was determined from EPR
spectra of S1-decorated muscle fibers (Fig. 4).
As shown previously, fibers decorated with
IASL-S1 show a high degree of orientational
order with respect to the fiber axis (Fig. 4,
top), indicating that the angles (defined in Fig.
3) are θ′ = 68 ± 1o and ∆θ′ = 17 ± 2o (4). In
contrast, fibers decorated with BSL-S1 yield
spectra that are characteristic of near random
orientation (∆θ' ≥ 90°), having little sensitivity
to sample orientation with respect to the
applied magnetic field (Fig. 4, bottom). We
conclude that BSL-S1, bound to oriented actin
in the muscle fiber, shows a profound degree
of orientational disorder relative to the actin filament axis. The next question: is this disorder
dynamic on the microsecond time scale, as observed previously for S1 weakly bound to actin in
a ternary complex with ATP (7), or static? This question can only be answered by STEPR.
IASL-S1
BSL-S1
Fig. 4: Oriented muscle fibers decorated with spin-labeled S1. The spectra were recorded with the fiber axis aligned parallel (red) or perpendicular (blue) to the external magnetic field in a quartz flat cell.

STEPR In addition to orientation, EPR is also sensitive to
rotational dynamics from the ps to ms time
scales. To ensure that any observed spectral
changes are due only to dynamics, samples must
be randomly oriented. However, conventional
(V1) EPR is sensitive only to motions with
rotational correlation times (τR) in the ps to ns
range (Fig. 5, left). For slower motions (µs to
ms), such as those likely to occur for a large
protein or within a large protein assembly,
STEPR must be used (Fig. 5, right) (35,42).
Conventional EPR (V1) and STEPR (V2')
measurements were performed on randomly
oriented samples of IASL-S1 and BSL-S1 (Fig.
6) in a variety of environments, in order to determine the dynamics of the actin bound catalytic
domain. The conventional (V1) spectra for both IASL-S1 and BSL-S1 have virtually no
sensitivity to the different protein environments (Fig. 6), and all spectra have the characteristic
“powder” shape, indicating that the rotational correlation time is greater than 0.1 µs (Fig. 5). In
contrast, STEPR (V2') is quite sensitive to the changes in S1 environment (Fig. 6), demonstrating
(s)
ps –
ns
µs –
ms
τR (s)
ConventionalEPR
Saturation TransferEPR
Fig. 5: Dependence of conventional (V1, left) and saturation transfer (V2', right) EPR spectra on isotropic rotational correlation time (41).
V1 V2’IASL
Free in solution
On Actin
20% PEG
Myosin Filaments
V1 V2’BSL
Fig. 6: Conventional (V1) and saturation transfer (V2') EPR spectra for IASL-S1 (left) and BSL-S1 (right).

dynamics in the µs-to-ms time range (Fig. 5). Rotational correlation times for V2′ spectra were
determined from lineheight ratio parameters as described in METHODS (35) (Table 2). We
found that the rotational correlation times for BSL-S1 and IASL-S1 are identical within
experimental error in all of the preparations studied (Table 2). The noticeable difference in V2'
lineshape between the two samples is due to the narrower intrinsic linewidth observed for BSL-
S1, probably due to the more rigid coupling of the probe to the protein, which appears to affect
small amplitude motions that have little effect on the V2′ lineshape parameters (43). For both
spin labels, S1 free in solution (Fig. 6, top row) gave spectra characteristic of sub-µs rotational
motion (Table 2), as expected for the rigid-body tumbling of S1, while S1 precipitated in 20%
polyethylene glycol (Fig. 6, bottom row) gave spectra approaching the rigid limit for STEPR,
implying correlation times ≥ 1 ms (Table 2). Therefore, the µs rotational correlation times
measured for other samples reflect accurately the global dynamics of the myosin head. Most
importantly, the rotational correlation times for both IASL-S1 and BSL-S1 bound to actin (Fig.
6, third row) are both approximately 600 µs, nearly at the static limit for STEPR. This similarity
in rotational correlation time is remarkable, in light of the dramatic difference in the orientational
distributions for these two spin labels (Fig. 4). The extremely slow motion is not surprising for
IASL-S1, since this protein binds quite strongly to actin (Kd < 1 µM, Table 1). However, BSL-
S1 binds much more weakly (Kd = 30 µM, Table 1) and has the same slow motion, despite
previous reports that weak-binding myosin heads rotate on actin at least 30 times faster
(7,44,45). This fast motion of weakly bound heads is simulated here for our probes by myosin
filaments, which have a correlation time of 20 µs (Table 2), approximately the same as observed
previously for S1 weakly bound to actin in a ternary complex with ATP (7,45). Thus BSL-S1 has
the same orientational disorder on actin as observed for ATP-induced weak binding, but rotates
30 times more slowly.

Table 2: Effective rotational correlation times (τR) from V2' spectra (Fig. 6)
Sample L''/L C'/C τR (µs)
IASL-S1 -0.26±0.01 ≤ 0.50
IASL-myosin 0.47±0.01 18 ± 1
MSL-S1 on actin + ATPγS(9) 0.54±0.05 24 ± 5
IASL-S1 on actin 1.44±0.02 560 ± 40
IASL-S1 in 20% PEG 1.58±0.02 ≥ 1000
BSL-S1 0.18±0.01 ≤ 0.50
BSL-myosin 0.51±0.01 21 ± 1
BSL-S1 on actin 1.46±0.01 600 ± 20
BSL-S1 in 20% PEG 1.60±0.01 ≥ 1000
Values are mean ± SE (n = 3-6).

DISCUSSION
Summary of results
When myosin S1 is reacted with a stoichiometric amount of BSL in the presence of ADP, a
stable ternary complex is formed between the label, SH1 and SH2. Hi-salt ATPase activities
(Table 1) and the EPR spectral intensity reveal that this reaction is highly specific and complete.
Binding assays reveal that the affinity for actin (Table 1) is similar to that of the well studied
pPDM-S1 complex: BSL-S1 (Kd = 30 µM) binds much more weakly than S1 (Kd < 1 µM) but 3
times more strongly than S1.ATP (Kd = 100 µM at the same ionic strength (22)). The failure to
quench pyrene-labeled actin fluorescence, even at concentrations exceeding Kd, confirms that the
structural interactions in the acto-S1 complex are of the same weak-binding nature as observed
for pPDM. Consistent with the observed weak binding, EPR of BSL-S1 bound to actin reveals
virtually complete orientational disorder relative to actin (Fig. 4), as observed previously for S1
in ternary complexes with actin and ATP (discussed below). This is in sharp contrast to the high
degree of orientational order observed for the strongly bound IASL-S1. STEPR of these two
preparations, on the other hand, reveals similar sub-millisecond rotational dynamics (Fig. 6), 30
times slower than observed for the ternary complex A.M.T, as modeled by A.M.ATPγS (Table
2)(9).
Interpretation of results
During the actomyosin ATPase cycle, myosin undergoes a weak-to-strong binding
transition, accompanied by ATP hydrolysis and Pi release, in which the catalytic domain
undergoes a disorder-to-order transition at the actin interface and the light chain domain rotates
as a lever arm (Fig. 1). This two-step structural transition is proposed to generate force in muscle
contraction (1-3). The weak-binding state, simulated here by myosin filaments (Fig. 6, second
row), exhibits a high degree of orientational disorder on the microsecond time scale, similar to
that of the A.M.T state measured directly (9,44). The strong-binding state, represented by IASL-
S1, makes a bond to actin with a high degree of orientational order (Fig. 4, top) and at least 30-
fold slower motion than A.M.T (Table 2). BSL-S1 exhibits characteristics of each: Its motion is
as slow (τR = 600 µs) as in the strong-binding state (τR = 560 µs, Table 2), but its orientation on
actin is as poorly defined as in the weak-binding state (Fig. 4). These properties are accompanied
by an affinity for actin that is also intermediate between the weak-binding and strong-binding
states, as in the case of pPDM-S1 (Table 1). What biochemical intermediate might be trapped by
the BSL crosslinker? To increase the specificity of BSL for SH1 and SH2 crosslinking, the

reaction was done in the presence of MgADP, stoichiometrically trapping the nucleotide upon
crosslinking. It would be natural, then, to conclude that we have trapped a state toward the end of
the power stroke. This conclusion is greatly weakened, though, by the observations that the
S1.ADP state binds actin 1000 times more strongly than does crosslinked S1 (22) and that
removal of the bound ADP only slightly affects actin affinity (21). Therefore, we conclude that
the SH1-SH2 helix is always in equilibrium between crosslinkable (disordered) and
uncrosslinkable (ordered) conformational states, and the nucleotide simply shifts the equilibrium
between these two states, and thus the rate of crosslinking. Indeed, it has been shown that oPDM
(N,N’-1,2-phenylene dimaleimide), a crosslinker of similar dimensions to BSL, reacts with SH1-
SH2 at least 4 times faster in the presence of a post-hydrolysis analog (ADP vanadate or ADP
aluminum fluoride) than a pre-hydrolysis analog (46). This suggests that BSL crosslinking traps
S1 in a state that mimics a post-hydrolysis ternary complex, A.M.ADP.Pi. This represents an
important breakthrough, since this complex is proposed to initiate force generation (14,15) but is
virtually impossible to trap in solution in the absence of crosslinking, as discussed in the
Introduction.
Relationship to previous results
Our observation of slow orientational disorder of crosslinked S1 is consistent with
previous studies. Electron microscopy of pPDM-S1 bound to actin via a zero-length crosslinker
reveals a high degree of orientational disorder (47), in stark contrast to the highly ordered
arrowhead-shaped rigor acto-S1 complex (48). This level of orientational disorder is quite
similar to that observed by EM when S1 is bound to actin in the presence of saturating ATP (11-
13), and to the dynamic orientational disorder observed by EPR for actin-bound S1 in the
presence of ATP (7,44) or ATPγS ((9), Table 2). Even in intact muscle fibers, myosin heads
bound to actin and ATP, in the absence of calcium, show similar dynamic disorder of the
catalytic domain (49). However, EPR of spin labeled muscle fibers in the presence of aluminum
fluoride and calcium revealed a state similar to that observed in the present study for BSL-S1 –
slow disorder of the catalytic domain, leading the authors to suggest that this represents an
intermediate state between weak binding and force generation (50). Together, these results
suggest that the myosin catalytic domain enters the powerstroke when its dynamic (microsecond)
disorder becomes much slower.
Alternative explanations
It is conceivable that the observed orientational disorder of BSL-S1 is due to internal
disorder within S1, rather than global disorder of S1 due to weakening of the actomyosin

interface. However, even if the SH1-SH2 helix unfolds, it seems unlikely that the orientational
disorder would be as complete as we observe (∆θ′ ≥ 90o, Fig. 3, Fig. 4) while also being so slow.
Note that the STEPR spectra are not consistent with more rapid (i.e., submicrosecond) motions
that are more restricted, since STEPR measures the correlation time directly and accurately in the
time domain from 0.1 to 1 ms (43). Furthermore, it is difficult to discount the orientational
disorder observed in EM, as discussed above. Finally, it is not possible that the disorder is due to
a significant population of dissociated heads, since the dissociation constant (30 µM, Table 1) is
~10 times less than the concentration of unoccupied actin (29).
Relationship to the mechanism of force generation
Our biochemical and EPR data indicate that we have trapped an intermediate state of the
catalytic domain along the pathway from weak-binding disorder (W) to strong-binding order (S).
In this new state, shown as A.M′.D.P (WS) in the revised scheme (Fig. 7), the myosin catalytic
domain shares the orientational disorder of weak binding (red) and the slow dynamics of strong
binding (green). The nucleotide-binding cleft is also beginning to open, as evidenced by the
ability to freely exchange the trapped nucleotide with other nucleotides when on actin (21),
providing the impetus for product release and the generation of mechanical force. We propose
that the relatively slow rotational dynamics of this state, compared with the truly weak-binding
states A.M.T and A.M.D.P, confers enough mechanical stability at the actomyosin interface to
begin generating (and bearing) force. This model is consistent with mechanical evidence, both in
muscle fibers and in isolated actomyosin, that the A.M′.D.P state initiates force generation
(14,15).

Acknowledgments This work was supported by NIH grants AR032961 (D.D.T) and AR42895 (R.C.). A.R.T was supported by NIH/NIAMS training grant AR07612. We thank Leanne Kolb, Christina Yi, Sarah Blakely, and Octavian Cornea for excellent technical support. We thank Yuri Nesmelov, Roman Agafonov, Ryan Mello, Jenny Klein, Ewa Prochniewicz, and Jack Surek for insightful discussions. We thank Edmund Howard for EPR analysis software. 1. Thomas, D. D., S. Ramachandran, O. Roopnarine, D. W. Hayden, and E. M. Ostap. 1995. The mechanism of force generation in myosin: a disorder-to-order transition, coupled to internal structural changes. Biophys J 68:135S-141S. 2. Taylor, K. A., H. Schmitz, M. C. Reedy, Y. E. Goldman, C. Franzini-Armstrong, H.
Sasaki, R. T. Tregear, K. Poole, C. Lucaveche, R. J. Edwards, L. F. Chen, H. Winkler, and M. K. Reedy. 1999. Tomographic 3D Reconstruction of Quick-Frozen, Ca2+-Activated Contracting Insect Flight Muscle. Cell 99:421-431.
3. LaConte, L. E., J. E. Baker, and D. D. Thomas. 2003. Transient kinetics and
mechanics of myosin's force-generating rotation in muscle: resolution of millisecond rotational transitions in the spin-labeled myosin light-chain domain. Biochemistry 42:9797-9803.
4. Thomas, D. D. and R. Cooke. 1980. Orientation of spin-labeled myosin heads in
glycerinated muscle fibers. Biophys J 32:891-906. 5. Cooke, R., M. S. Crowder, and D. D. Thomas. 1982. Orientation of spin labels attached
to cross-bridges in contracting muscle fibres. Nature 300:776-778. 6. Baker, J. E., I. Brust-Mascher, S. Ramachandran, L. E. LaConte, and D. D. Thomas.
1998. A large and distinct rotation of the myosin light chain domain occurs upon muscle contraction. Proc Natl Acad Sci U S A 95:2944-2949.
A.M.D ↔ A.M.T ↔ A.M.D.P ↔ A.M'.D.P ↔ A.M'.D ↔ A.M.D(S) (W) (W) (WS) (S) (S)
Kd < 1 µMSlow (τR~1ms)
Kd = 100 µMFast (τR~10 µs)
Kd = 30 µMSlow (τR~1 ms)
Kd < 1 µMSlow (τR~1 ms)
CD
LCD
Fig. 7: A revised model for the coupling of actomyosin ATP hydrolysis to force and movement, focusing on the coupling of biochemical transitions to structural dynamics of the myosin catalytic domain (CD). The structural states and definitions are the same as in Fig. 1, except for the WS intermediate defined by the present study. Text under each state indicates distinguishing properties of the catalytic domain. Prime symbol (′) indicates a second structural state corresponding to the same biochemical state (defined by the active-site ligand). Although this scheme shows that structural transitions in the catalytic domain are completed before rotation of the light chain domain (LCD), this is probably an unnecessary assumption.
7. Berger, C. L., E. C. Svensson, and D. D. Thomas. 1989. Photolysis of a photolabile
precursor of ATP (caged ATP) induces microsecond rotational motions of myosin heads bound to actin. Proc Natl Acad Sci U S A 86:8753-8757.
8. Berger, C. L. and D. D. Thomas. 1993. Rotational dynamics of actin-bound myosin
heads in active myofibrils. Biochemistry 32:3812-3821. 9. Berger, C. L. and D. D. Thomas. 1991. Rotational dynamics of actin-bound
intermediates in the myosin ATPase cycle. Biochemistry 30:11036-11045. 10. Berger, C. L. and D. D. Thomas. 1994. Rotational dynamics of actin-bound
intermediates of the myosin adenosine triphosphatase cycle in myofibrils. Biophys J 67:250-261.
11. Craig, R., L. E. Greene, and E. Eisenberg. 1985. Structure of the actin-myosin
complex in the presence of ATP. Proc Natl Acad Sci U S A 82:3247-3251. 12. Walker, M., J. Trinick, and H. White. 1995. Millisecond time resolution electron
cryo-microscopy of the M-ATP transient kinetic state of the acto-myosin ATPase. Biophys J 68:87S-91S.
13. Walker, M., H. White, B. Belknap, and J. Trinick. 1994. Electron cryomicroscopy of
acto-myosin-S1 during steady-state ATP hydrolysis. Biophys J 66:1563-1572. 14. Takagi, Y., H. Shuman, and Y. E. Goldman. 2004. Coupling between phosphate
release and force generation in muscle actomyosin. Philos Trans R Soc Lond B Biol Sci 359:1913-1920.
15. Smith, D. A. and J. Sleep. 2004. Mechanokinetics of rapid tension recovery in muscle:
the Myosin working stroke is followed by a slower release of phosphate. Biophys J 87:442-456.
16. White, H. D., B. Belknap, and M. R. Webb. 1997. Kinetics of Nucleoside
Triphosphate Cleavage and Phosphate Release Steps by Associated Rabbit Skeletal Actomyosin, Measured Using a Novel Fluorescent Probe for Phosphate. Biochemistry 36:11828-11836.
17. Prochniewicz, E., T. F. Walseth, and D. D. Thomas. 2004. Structural dynamics of
actin during active interaction with myosin: different effects of weakly and strongly bound myosin heads. Biochemistry 43:10642-10652.
18. Werber, M. M., Y. M. Peyser, and A. Muhlrad. 1992. Characterization of stable
beryllium fluoride, aluminum fluoride, and vanadate containing myosin subfragment 1-nucleotide complexes. Biochemistry 31:7190-7197.
19. Pate, E. and R. Cooke. 1988. Energetics of the actomyosin bond in the filament array
of muscle fibers. Biophys J 53:561-573. 20. Fajer, P. G., E. A. Fajer, N. J. Brunsvold, and D. D. Thomas. 1988. Effects of
AMPPNP on the orientation and rotational dynamics of spin-labeled muscle cross-bridges. Biophys J 53:513-524.

21. Greene, L., J. Chalovich, and E. Eisenberg. 1986. Effect of nucleotide on the binding
of N,N'-p-phenylenedimaleimide-modified S-1 to unregulated and regulated actin. Biochemistry 25:704-709.
22. Chalovich, J., L. Greene, and E. Eisenberg. 1983. Crosslinked myosin subfragment 1:
a stable analogue of the subfragment-1.ATP complex. Proc Natl Acad Sci USA 80:4909-4913.
23. Bobkov, A. and E. Reisler. 2000. Is SH1-SH2-cross-linked myosin subfragment 1 a
structural analog of the weakly-bound state of myosin? Biophysical journal 79:460-467.
24. Wells, J. and R. Yount. 1979. Active site trapping of nucleotides by crosslinking two
sulfhydryls in myosin subfragment 1. Proc Natl Acad Sci USA 76:4966-4970. 25. Burke, M. and E. Reisler. 1977. Effect of nucleotide binding on the proximity of the
essential sulfhydryl groups of myosin. Chemical probing of movement of residues during conformational transitions. Biochemistry 16:5559-5563.
26. Dalbey, R., J. Weiel, and R. Yount. 1983. Förster energy transfer measurements of
thiol 1 to thiol 2 distances in myosin subfragment 1. Biochemistry 22:4696-4706. 27. Houdusse, A., V. Kalabokis, D. Himmel, A. Szent-Gyorgyi, and C. Cohen. 1999.
Atomic structure of scallop myosin subfragment S1 complexed with MgADP: a novel conformation of the myosin head. Cell 97:459-470.
28. Rayment, I., W. R. Rypniewski, K. Schmidt-Base, R. Smith, D. R. Tomchick, M. M.
Benning, D. A. Winkelmann, G. Wesenberg, and H. M. Holden. 1993. Three-dimensional structure of myosin subfragment-1: a molecular motor. Science 261:50-58.
29. Bagshaw, C. R. 1993. Muscle Contraction. New York: Chapman & Hall. 155 p. 30. Prochniewicz, E., D. A. Lowe, D. J. Spakowicz, L. Higgins, K. O'Conor, L. V.
Thompson, D. A. Ferrington, and D. D. Thomas. 2008. Functional, structural, and chemical changes in myosin associated with hydrogen peroxide treatment of skeletal muscle fibers. Am J Physiol Cell Physiol 294:C613-626.
31. Barnett, V. A. and D. D. Thomas. 1987. Resolution of conformational states of spin-
labeled myosin during steady-state ATP hydrolysis. Biochemistry 26:314-323. 32. Lanzetta, P. A., L. J. Alvarez, P. S. Reinach, and O. A. Candia. 1979. An improved
assay for nanomole amounts of inorganic phosphate. Anal Biochem 100:95-97. 33. Prochniewicz, E. and D. D. Thomas. 2001. Site-specific mutations in the myosin
binding sites of actin affect structural transitions that control myosin binding. Biochemistry 40:13933-13940.
34. Geeves, M. A., T. E. Jeffries, and N. C. Millar. 1986. ATP-induced dissociation of
rabbit skeletal actomyosin subfragment 1. Characterization of an isomerization of the ternary acto-S1-ATP complex. Biochemistry 25:8454-8458.

35. Squier, T. C. and D. D. Thomas. 1986. Methodology for increased precision in
saturation transfer electron paramagnetic resonance studies of rotational dynamics. Biophys J 49:921-935.
36. Fajer, P. G., R. L. H. Bennett, C. F. Polnaszek, E. A. Fajer, and D. D. Thomas. 1990.
General method for multiparameter fitting of high-resolution EPR spectra using a simplex algorithm. J. Magn. Res. 88:111-125.
37. Karim, C. B., Z. Zhang, and D. D. Thomas. 2007. Synthesis of TOAC spin-labeled
proteins and reconstitution in lipid membranes. Nat Protoc 2:42-49. 38. Sekine, T. and W. W. Kielley. 1964. The enzymic properties of N-ethylmaleimide
modified myosin. Biochim Biophys Acta 81:336-345. 39. Reisler, E., M. Burke, and W. Harrington. 1974. Cooperative role of two sulfhydryl
groups in myosin adenosine triphosphatase. Biochemistry 13:2014-2022. 40. Thomas, D. D., J. C. Seidel, J. S. Hyde, and J. Gergely. 1975. Motion of subfragment-
1 in myosin and its supramolecular complexes: saturation transfer electron paramagnetic resonance. Proc Natl Acad Sci U S A 72:1729-1733.
41. Thomas, D. D. 1977. Saturation transfer EPR. Trends Biochem Sci 2:N62-N63. 42. Thomas, D. D., L. R. Dalton, and J. S. Hyde. 1976. Rotational diffusion studied by
passage saturation transfer electron paramagnetic resonance. J Chem Phys 65. 43. Howard, E. C., K. M. Lindahl, C. F. Polnaszek, and D. D. Thomas. 1993. Simulation
of saturation transfer electron paramagnetic resonance spectra for rotational motion with restricted angular amplitude. Biophys J 64:581-593.
44. Svensson, E. C. and D. D. Thomas. 1986. ATP induces microsecond rotational
motions of myosin heads crosslinked to actin. Biophys J 50:999-1002. 45. Barnett, V. A. and D. D. Thomas. 1989. Microsecond rotational motion of spin-
labeled myosin heads during isometric muscle contraction. Saturation transfer electron paramagnetic resonance. Biophys J 56:517-523.
46. Nitao, L. K., T. O. Yeates, and E. Reisler. 2002. Conformational dynamics of the
SH1-SH2 helix in the transition states of myosin subfragment-1. Biophys J 83:2733-2741.
47. Flicker, P. F., R. A. Milligan, and D. Applegate. 1991. Cryo-electron microscopy of
S1-decorated actin filaments. Adv Biophys 27:185-196. 48. Moore, P. B., H. E. Huxley, and D. J. DeRosier. 1970. Three-dimensional
reconstruction of F-actin, thin filaments and decorated thin filaments. J Mol Biol 50:279-295.
49. Fajer, P. G., E. A. Fajer, M. Schoenberg, and D. D. Thomas. 1991. Orientational
disorder and motion of weakly attached cross-bridges. Biophys J 60:642-649.

50. Raucher, D. and P. G. Fajer. 1994. Orientation and dynamics of myosin heads in aluminum fluoride induced pre-power stroke states: an EPR study. Biochemistry 33:11993-11999.