Structural Changes in India's Direction of Foreign Trade - PHD ...
10
Structural Changes in India’s Direction of Foreign Trade March 2014 PHD RESEARCH BUREAU PHD CHAMBER OF COMMERCE AND INDUSTRY PHD House, 4/2 Siri Institutional Area, August Kranti Marg New Delhi 110016 Phone: 91-11-49545454, Fax: 91-11-26855450, 26863135 Email: [email protected] Website: www.phdcci.in
-
Upload
khangminh22 -
Category
Documents
-
view
1 -
download
0
Transcript of Structural Changes in India's Direction of Foreign Trade - PHD ...
Structural Changes in India’s Direction of Foreign Trade
March 2014
PHD RESEARCH BUREAU
PHD CHAMBER OF COMMERCE AND INDUSTRY PHD House, 4/2 Siri Institutional Area, August Kranti Marg New Delhi 110016
Phone: 91-11-49545454, Fax: 91-11-26855450, 26863135 Email: [email protected] Website: www.phdcci.in
Structural Changes in India’s Direction of Foreign Trade
PHD Research Bureau 2
Executive summary
India’s direction of foreign trade has exhibited a structural shift during the last decade. Trade volume and trade share of emerging and developing economies has increased while the share of conventional trading partners has showed a declining trend.
China has become India’s top trading partner followed by USA and UAE. India-China foreign trade has reached at US$49.5bn with 8.7% share in India’s total trade followed by USA at US$46bn with 8.1% share and UAE at US$45.4bn with 8% share during the first nine months (April-Dec 2013) of the current financial year 2013-14. India’s trade (exports and imports) with China was only of US$7bn in 2004 which increased to US$38bn in 2008 and to US$65bn in 2013.
However, with the revival of demand in advanced economies, USA has emerged India’s top exports destination once again. India’s exports to USA during the first nine months (April-Dec 2013) of the current financial year 2013-14 were at US$29.3bn followed by UAE at US$22.3bn and China at US$10.8bn. Last year, FY 2012-13, UAE was the top exports destination followed by USA and Singapore.
UK and Germany have shifted downwards, while Belgium, Italy eventually disappeared from the top ten export destinations. On the other hand, Saudi Arabia and Netherlands have entered the top ten export destinations.
These shifts amongst India’s trading partners are the result of several external factors including volatile economic environment in the advanced economies, huge imports of POL commodities, rising imports from China including electronic goods, machinery, organic chemicals, project goods and fertilizers etc.
China has emerged the major source of imports for India during the recent years. In 2004, imports from china were only of US$4bn which surged to US$27bn in 2008 and to US$52bn in 2013. China’s share in India’s imports has also doubled within the last decade from 5% in 2004 to about 11% in 2013 and this has led China to replace USA as India’s major import source.
Besides USA, several other countries Belgium, UK, Korea and Japan have also shown declining trend and finally disappeared from India’s the top ten sources of imports. One significant development in India’s import scenario is the emergence of Saudi Arab, UAE Kuwait, Qatar, Iraq and Switzerland amongst India’s top ten import sources.

Structural Changes in India’s Direction of Foreign Trade
PHD Research Bureau 3
Structural changes in India’s direction of foreign Trade
India’s direction of foreign trade has exhibited a structural shift during the
last decade. This is manifest in the increased trade volume and trade share
of emerging economies accompanied by up shift of their positions in India’s
top ten major trading partners. While, the share of conventional developed
trading partners has showed a declining trends in India’s overall foreign
trade.
USA with 11.6% share in India’s total trade remained the top most trading
partner of India in 2004. The total trade with USA reported about US $17
billion which is increased to US $42 billion in 2008 and US $76 billion in
2013.However, recent trends exhibited a declined its share to about 10% in
2008 and to 7.8% in 2013. While the trade with UAE has rose from US $7.2
billion in 2004 to US $29 billion in 2008 and to US $75 billion in 2013.
Increased trade volume is accompanied by rise in its share in India’s overall
trade from 5% in 2004 to 7% in 2008 and 9.5% in 2013 and even replaced
USA as a top trading partner.
However, according to recent trade data from April-December 2013, China
with 8.7% share in India’s foreign trade have become the top-most trading
partner of India followed by USA and UAE. This is considered as a
significant change in India’s foreign trade. Because, with China India’s trade
was only of US $7 billion in 2004 which increased to US $38 billion in 2008
and to US $65 billion in 2013. Corresponding to this growing trade trends
between the two countries, not only China’s share in India’s overall foreign

Structural Changes in India’s Direction of Foreign Trade
PHD Research Bureau 4
trade increased from 4.9% in 2004 to 8.3% in 2013, but also become the
topmost trading partner of India according to the recent India’s trade data
of 2013(Apr-Dec) surpassing major economies like USA and UAE. The
country has reported the trade worth US $50 billion with China with 8.7%
share in the first nine months of the financial year 2013-14.
India’s top ten trading partners (in USD billion)
Rank CountryTotal trade in USD bn
Share in total trade (%) 2004
CountryTotal trade in USD bn
Share in total trade (%)2008
CountryTotal trade in USD bn
Share in total trade (%) 2013
CountryTotal trade in USD bn
Share in total trade 2013 (Apr-Dec)
1 U S A 16.5 11.6 U S A 41.8 10.1 U ARAB EMTS 75.5 9.5 CHINA P RP 49.5 8.7
2 U ARAB EMTS 7.2 5.1 CHINA P RP 38.0 9.2 CHINA P RP 65.8 8.3 U S A 46.0 8.1
3 CHINA P RP 7.0 4.9 U ARAB EMTS 29.1 7.0 U S A 61.4 7.8 U ARAB EMTS 45.4 8.0
4 U K 6.3 4.4 SAUDI ARAB 23.2 5.6 SAUDI ARAB 43.8 5.5 SAUDI ARAB 36.3 6.4
5 BELGIUM 5.8 4.1 SINGAPORE 15.5 3.7 SWITZERLAND 33.3 4.2 SWITZERLAND 16.7 2.9
6 GERMANY 5.5 3.8 GERMANY 15.0 3.6 GERMANY 21.6 2.7 IRAQ 15.5 2.7
7 HONG KONG 4.8 3.3 IRAN 12.9 3.1 SINGAPORE 21.1 2.7 SINGAPORE 15.4 2.7
8 JAPAN 4.4 3.1 U K 11.7 2.8 INDONESIA 20.2 2.6 INDONESIA 14.8 2.6
9 SINGAPORE 4.2 3.0 SWITZERLAND 10.4 2.5 HONG KONG 20.2 2.6 GERMANY 14.7 2.6
10 SWITZERLAND 3.8 2.6 JAPAN 10.2 2.5 JAPAN 18.5 2.3 HONG KONG 14.6 2.6
Total Trade142.00
100.0 Total Trade 415 100.0Total Trade 791
100.0Total Trade 570.1
100.0Source: PHD Research Bureau, compiled from Ministry of Commerce
The other major significant and interesting change which occurred during
the last decade is the replacement of many traditional developed
economies by emerging developing economies. This is evident with the fact
that UK, Belgium which had reported the trade worth US $4 billion with
about 5% share in India’s total trade in 2004 gradually disappeared from
the list of India’s top ten trading partners.

Structural Changes in India’s Direction of Foreign Trade
PHD Research Bureau 5
The countries Hong Kong, Japan which accounted for trade of nearly US $5
billion with 3% share in India’s overall trade have also reported declining
trends in recent years. However, the countries - Iran, Indonesia, Saudi Arab,
and Iraq which were not amongst the major trading partners of India in
2004 have entered the list of top ten trading partners of India in recent
years.
These shifts amongst the three major trading partners USA,UAE and China
is the result of several external factors viz. slowdown in advanced
economies, huge imports of POL commodities, rising imports from China
especially of machinery etc.
In terms of export volume, USA had been the topmost export destination
for Indian exports. In 2004, exports to USA were reported at US $11.5
billion in 2004 which were increased to US $21 billion in 2008 and to US
$36.2 billion in 2013. However, it is observed that USA share in India’s total
exports has declined from 18% in 2004 to about 13% in 2008 and to 12% in
2013.
On the other hand, exports to UAE have shown a remarkable rise during
the last decade. Exports to UAE were US $5.1 billion in 2004 which
increased to US $15.6 billion in 2008 and to US $36.3 billion in 2013.
Growing exports to UAE made the country capable to increase its share in
India’s exports from 8% in 2004 to 12% in 2013 and to replace USA as the
top most export destination of India. However, recent data (2013 April-
December) shows that with US $29 billion exports and with 12.8% share in
Structural Changes in India’s Direction of Foreign Trade
PHD Research Bureau 6
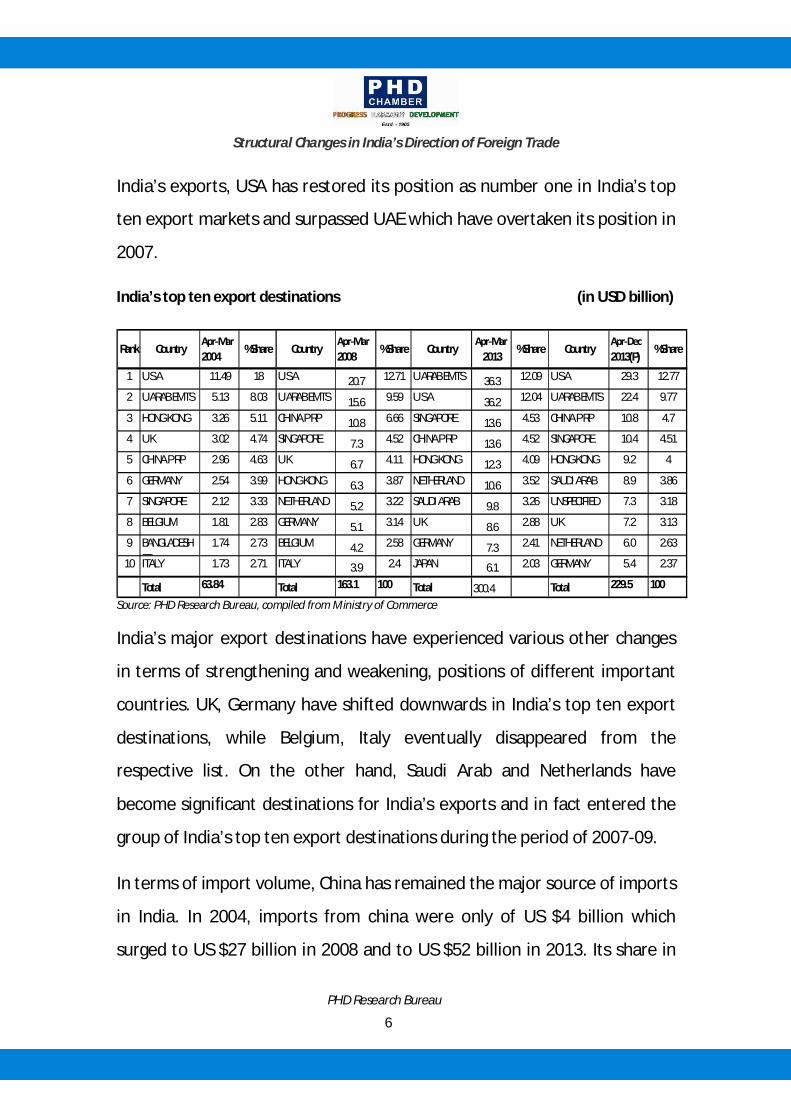
India’s exports, USA has restored its position as number one in India’s top
ten export markets and surpassed UAE which have overtaken its position in
2007.
India’s top ten export destinations (in USD billion)
Rank CountryApr-Mar 2004
%Share CountryApr-Mar 2008
%Share CountryApr-Mar
2013%Share Country
Apr-Dec 2013(P)
%Share
1 U S A 11.49 18 U S A 20.7 12.71 U ARAB EMTS 36.3 12.09 U S A 29.3 12.77
2 U ARAB EMTS 5.13 8.03 U ARAB EMTS 15.6 9.59 U S A 36.2 12.04 U ARAB EMTS 22.4 9.77
3 HONG KONG 3.26 5.11 CHINA P RP 10.8 6.66 SINGAPORE 13.6 4.53 CHINA P RP 10.8 4.7
4 U K 3.02 4.74 SINGAPORE 7.3 4.52 CHINA P RP 13.6 4.52 SINGAPORE 10.4 4.51
5 CHINA P RP 2.96 4.63 U K 6.7 4.11 HONG KONG 12.3 4.09 HONG KONG 9.2 4
6 GERMANY 2.54 3.99 HONG KONG 6.3 3.87 NETHERLAND 10.6 3.52 SAUDI ARAB 8.9 3.86
7 SINGAPORE 2.12 3.33 NETHERLAND 5.2 3.22 SAUDI ARAB 9.8 3.26 UNSPECIFIED 7.3 3.18
8 BELGIUM 1.81 2.83 GERMANY 5.1 3.14 U K 8.6 2.88 U K 7.2 3.13
9 BANGLADESH PR
1.74 2.73 BELGIUM 4.2 2.58 GERMANY 7.3 2.41 NETHERLAND 6.0 2.63
10 ITALY 1.73 2.71 ITALY 3.9 2.4 JAPAN 6.1 2.03 GERMANY 5.4 2.37
Total 63.84 Total 163.1 100 Total 300.4 Total 229.5 100
Source: PHD Research Bureau, compiled from Ministry of Commerce
India’s major export destinations have experienced various other changes
in terms of strengthening and weakening, positions of different important
countries. UK, Germany have shifted downwards in India’s top ten export
destinations, while Belgium, Italy eventually disappeared from the
respective list. On the other hand, Saudi Arab and Netherlands have
become significant destinations for India’s exports and in fact entered the
group of India’s top ten export destinations during the period of 2007-09.
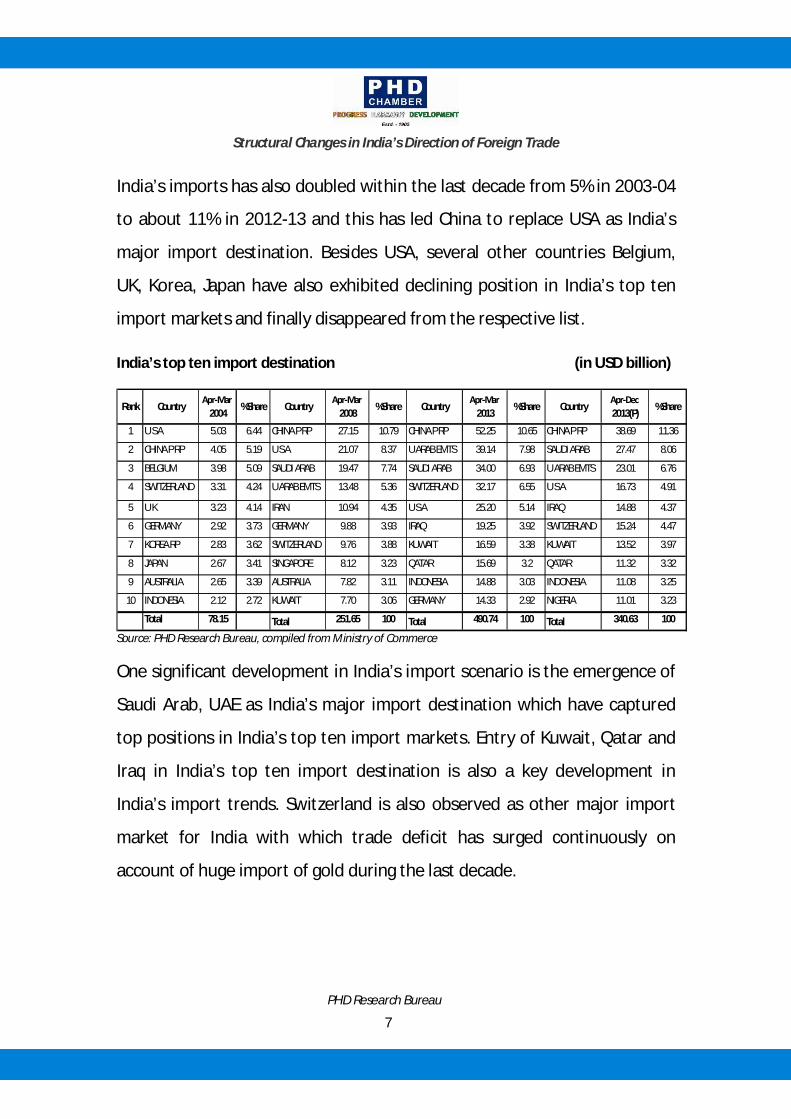
In terms of import volume, China has remained the major source of imports
in India. In 2004, imports from china were only of US $4 billion which
surged to US $27 billion in 2008 and to US $52 billion in 2013. Its share in
Structural Changes in India’s Direction of Foreign Trade
PHD Research Bureau 7
India’s imports has also doubled within the last decade from 5% in 2003-04
to about 11% in 2012-13 and this has led China to replace USA as India’s
major import destination. Besides USA, several other countries Belgium,
UK, Korea, Japan have also exhibited declining position in India’s top ten
import markets and finally disappeared from the respective list.
India’s top ten import destination (in USD billion)
Rank CountryApr-Mar
2004%Share Country
Apr-Mar 2008
%Share CountryApr-Mar
2013%Share Country
Apr-Dec 2013(P)
%Share
1 U S A 5.03 6.44 CHINA P RP 27.15 10.79 CHINA P RP 52.25 10.65 CHINA P RP 38.69 11.36
2 CHINA P RP 4.05 5.19 U S A 21.07 8.37 U ARAB EMTS 39.14 7.98 SAUDI ARAB 27.47 8.06
3 BELGIUM 3.98 5.09 SAUDI ARAB 19.47 7.74 SAUDI ARAB 34.00 6.93 U ARAB EMTS 23.01 6.76
4 SWITZERLAND 3.31 4.24 U ARAB EMTS 13.48 5.36 SWITZERLAND 32.17 6.55 U S A 16.73 4.91
5 U K 3.23 4.14 IRAN 10.94 4.35 U S A 25.20 5.14 IRAQ 14.88 4.37
6 GERMANY 2.92 3.73 GERMANY 9.88 3.93 IRAQ 19.25 3.92 SWITZERLAND 15.24 4.47
7 KOREA RP 2.83 3.62 SWITZERLAND 9.76 3.88 KUWAIT 16.59 3.38 KUWAIT 13.52 3.97
8 JAPAN 2.67 3.41 SINGAPORE 8.12 3.23 QATAR 15.69 3.2 QATAR 11.32 3.32
9 AUSTRALIA 2.65 3.39 AUSTRALIA 7.82 3.11 INDONESIA 14.88 3.03 INDONESIA 11.08 3.25
10 INDONESIA 2.12 2.72 KUWAIT 7.70 3.06 GERMANY 14.33 2.92 NIGERIA 11.01 3.23
Total 78.15 Total 251.65 100 Total 490.74 100 Total 340.63 100
Source: PHD Research Bureau, compiled from Ministry of Commerce
One significant development in India’s import scenario is the emergence of
Saudi Arab, UAE as India’s major import destination which have captured
top positions in India’s top ten import markets. Entry of Kuwait, Qatar and
Iraq in India’s top ten import destination is also a key development in
India’s import trends. Switzerland is also observed as other major import
market for India with which trade deficit has surged continuously on
account of huge import of gold during the last decade.
Structural Changes in India’s Direction of Foreign Trade
PHD Research Bureau 8
Disclaimer “Structural Changes in India’s Direction of Foreign Trade” is prepared by PHD Chamber of Commerce and Industry to provide a broad view of the state. This report may not be reproduced, wholly or partly in any material form, or modified, without prior approval from the Chamber. It may be noted that this report is for guidance and information purposes only. Though due care has been taken to ensure accuracy of information to the best of the PHD Chamber’s knowledge and belief, it is strongly recommended that readers should seek specific professional advice before taking any decisions. Please note that the PHD Chamber of Commerce and Industry does not take any responsibility for outcome of decisions taken as a result of relying on the content of this report. PHD Chamber of Commerce and Industry shall in no way, be liable for any direct or indirect damages that may arise due to any act or omission on the part of the Reader or User due to any reliance placed or guidance taken from any portion of this publication. Copyright 2014 PHD Chamber of Commerce and Industry ALL RIGHTS RESERVED. No part of this publication including the cover, shall be reproduced, stored in a retrieval system, or transmitted by any means, electronic, mechanical, photocopying, recording or otherwise, without the prior written permission of, and acknowledgement of the publisher (PHD Chamber of Commerce and Industry).
Structural Changes in India’s Direction of Foreign Trade
PHD Research Bureau 9
Dr. S P Sharma Chief Economist
Ms. Megha Kaul, Senior Research Officer Ms. Nidhi Gautam, Research Associate Ms. Rashmi Taneja, Senior Research Officer Ms. Bhawana Sharma, Research Associate
Ms. Surbhi Sharma, Researc Dr. S P Sharma
Dr. S P Sharma Chief Economist & Head of Research
Ms. Megha Kaul, Senior Research Officer Ms. Rashmi Taneja, Senior Research Officer Ms. Surbhi Sharma, Research Officer Ms. Nidhi Gautam, Research Associate Ms. Bhawana Sharma, Research Associate

Structural Changes in India’s Direction of Foreign Trade
PHD Research Bureau 10
About the PHD Research Bureau
PHD Research Bureau; the research arm of the PHD Chamber of Commerce and Industry was constituted in 2010 with the objective to review the economic situation and policy developments at sub-national, national and international levels and comment on them in order to update the members from time to time, to present suitable memoranda to the government as and when required, to prepare State Profiles and to conduct thematic research studies on various socio-economic and business developments.The Bureau has been accurately forecasting various lead economic indicators at the micro as well as macro level. Many of its research reports have been widely covered by media and leading business newspapers.
Studies undertaken by PHD Research Bureau
A: Thematic research reports
1. Comparative study on power situation in Northern and Central states of India (September 2011) 2. Economic Analysis of States: A Study of Northern & Central States of India ( October 2011 ) 3. Growth Prospects of the Indian Economy, Vision 2021 (December 2011) 4. Budget 2012-13: Move Towards Consolidation (March 2012) 5. Emerging Trends in Exchange Rate Volatility, Trade Performances & Exporters Profitability (Apr 2012) 6. The Indian Direct Selling Industry Annual Survey 2010-11: Expanding Horizons (May 2012 ) 7. Global Economic Challenges: Implications for India ( May 2012 ) 8. India Agronomics: An Agriculture Economy Update (August 2012 ) 9. Reforms to Push Growth on High Road ( September 2012 ) 10. The Indian Direct Selling Industry Annual Survey 2011-12: Beating Slowdown (March 2013) 11. Budget 2013-14: Moving on reforms (March 2013) 12. India- Africa Promise Diverse Opportunities (November 2013) 13. India- Africa Promise Diverse Opportunities: Suggestions Report (November 2013) 14. Annual survey of Indian Direct Selling Industry-2012-13 (December 2013) 15. Imperatives for Double Digit Growth (December 2013) B: State profiles
16. Rajasthan: The State Profile ( April 2011 ) 17. Uttarakhand: The State Profile ( June 2011) 18. Punjab : The State Profile ( November 2011) 19. J&K: The State Profile ( December 2011 ) 20. Uttar Pradesh: The State Profile ( December 2011 ) 21. Bihar: The State Profile ( June 2012 ) 22. Himachal Pradesh: The State Profile ( June 2012 ) 23. Madhya Pradesh: The State Profile ( August 2012 ) 24. Resurgent Bihar (April 2013) 25. Life ahead for Uttarakhand (August 2013) 26. Punjab : The State Profile (February 2014)