N 2 , N 2 , N 6 , N 6 -Tetrakis(2,3,4,5,6-pentafluorobenzoyl)pyridine-2,6-diamine
Solar Energy Materials & Solar Cells 94 (2010) 2265–2274
Contents lists available at ScienceDirect
Solar Energy Materials & Solar Cells
0927-02
doi:10.1
n Corr
Elce di
E-m
journal homepage: www.elsevier.com/locate/solmat
Structural and photophysical characterization of some La2xGa2yIn2zO3 solidsolutions, to be used as photocatalysts for H2 production fromwater/ethanol solutions
Pier Luigi Gentili a,b,n, Marta Penconi a, Ferdinando Costantino a,c, Paola Sassi a, Fausto Ortica a,b,d,Federico Rossi b, Fausto Elisei a,b,d
a Dipartimento di Chimica, Universit �a di Perugia, Via Elce di Sotto 8, 06123 Perugia, Italyb CIRIAF, Via G. Duranti 67, 06125 Perugia, Italyc CNR, Istituto di Chimica dei Composti Organometallici (ICCOMCNR), Via Madonna del Piano 10, 50019 Sesto Fiorentino (Firenze), Italyd CEMIN, Via Elce di Sotto 8, 06123 Perugia, Italy
a r t i c l e i n f o
Article history:
Received 26 April 2010
Received in revised form
21 July 2010
Accepted 23 July 2010Available online 11 August 2010
Keywords:
Water splitting
Hydrogen production
Heterogeneous photocatalysts
Solid solutions
Metal oxides
48/$ - see front matter & 2010 Elsevier B.V. A
016/j.solmat.2010.07.024
esponding author at: Dipartimento di Chimi
Sotto 8, 06123 Perugia, Italy. Tel.: +39 75 585
ail address: [email protected] (P.L. Gen
a b s t r a c t
In this work, the structural and photophysical characterization of newly synthesized La2xGa2yIn2zO3
solid solutions is presented. By changing the relative amounts of La, Ga and In in La2xGa2yIn2zO3, it has
been possible to prepare polyphasic samples whose compositions have been determined by means of
the X-ray powder diffraction and micro-Raman techniques. Moreover, it is demonstrated how the
composition and structure of prepared ternary oxides rule their UV–vis absorption spectrum.
La2xGa2yIn2zO3 solid solutions have been synthesized to obtain suitable photocatalysts for hydrogen
production from water–bioethanol solutions. Preliminary photocatalytic experiments carried out using
some of the prepared compounds in different conditions are presented in this paper.
& 2010 Elsevier B.V. All rights reserved.
1. Introduction
A promising way of exploiting solar energy relies on itsconversion into chemical fuels that can be stored and burnedaccording to the energy demand. Among the solar fuels, methanoland hydrogen are drawing worldwide attention because they canbe synthesized from abundant raw materials, such as carbondioxide and water, respectively. Both the reduction of CO2 toCH3OH [1] and the reaction of water splitting through the energyof the sun require the involvement of suited photocatalysts.Hydrogen could play a major role in the economy of the nextfuture, since it burns without generating pollutants, produceselectric current when oxidized in a fuel cell and can allowcatalytic hydrogenative conversion of CO2 to methanol. From theviewpoint of Gibbs free energy change, water splitting is an uphillreaction. The free energy required to carry out this redox reactioncan be achieved from the solar radiation:
H2O(l)-H2(g)+½O2(g) (1)
ll rights reserved.
ca, Universit�a di Perugia, Via
5576; fax: +39 75 5855598.
tili).
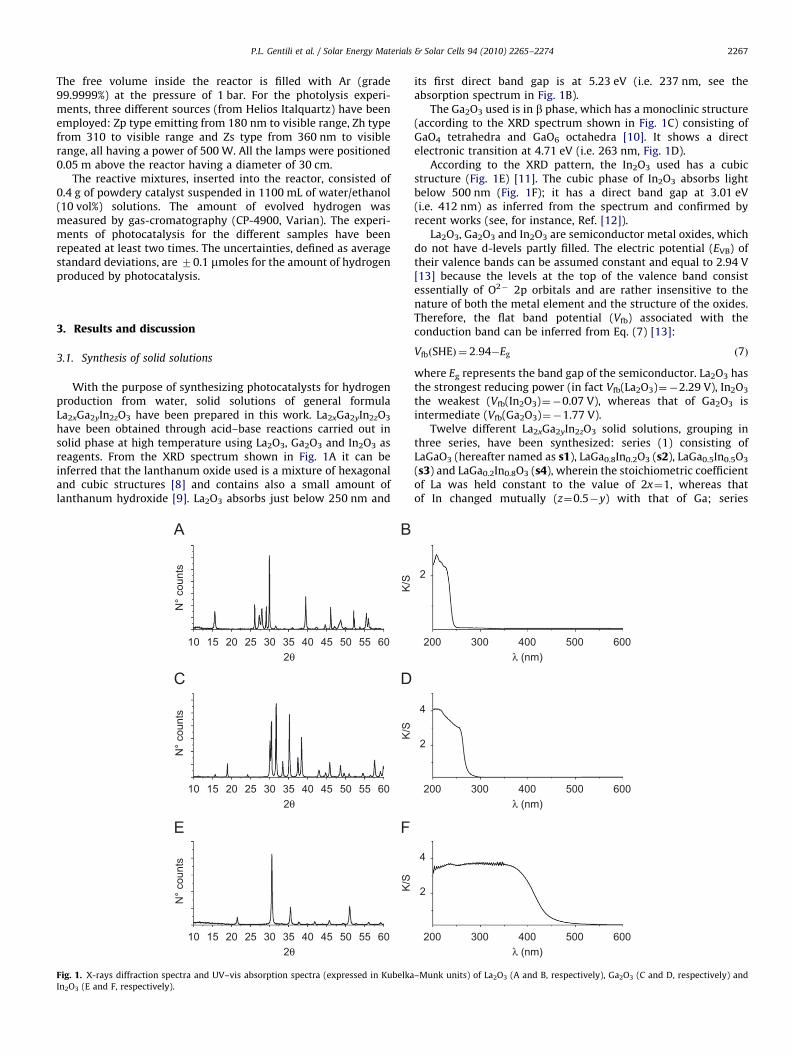
Water absorbs only some IR frequencies of solar radiationreaching the biosphere; however, these frequencies are not soenergetic to split water molecules. To overcome this hindrance, aphotocatalyst is required, i.e. a species that, absorbing a portion asbroad as possible of solar spectrum, induces the redox reaction(1). Among the different types of photocatalysts, the hetero-geneous ones appear advantageous for large-scale application ofsolar water splitting [2] due to the structural simplicity of possibletechnical solutions involving them. Many heterogeneous photo-catalysts have semiconductor properties. They absorb photonsthat have energy equal to or larger than semiconductors bandgaps (BGs), storing electrons in their conduction band (CB) andholes in their valence band (VB). The electrons in CB reduce thehydrogen of water molecules if they have an electric potentialmore negative than the redox potential of the H+/H2 couple,whereas the holes in VB oxidize the oxygen of H2O if they have anelectric potential more positive than that of the O2/H2O couple.Therefore, in order to limit the waste of solar energy, it isnecessary to appropriately engineer the band gaps of thesemiconductor photocatalysts. When the goal is simply tophotosynthesize hydrogen from water, a trick to facilitate theexploitation of solar energy consists in using a sacrificial reagent,i.e. a chemical species that can be oxidized more easily than theoxygen of water (see Scheme 1). This strategy is convenient
Scheme 1. Photo-production of H2 through a semiconductor as photocatalyst.
P.L. Gentili et al. / Solar Energy Materials & Solar Cells 94 (2010) 2265–22742266
especially when the reducing agent is a biomass and abundantcompound in nature.
In this paper, we present the structural and photophysicalcharacterization of newly synthesized La2xGa2yIn2zO3 solid solu-tions. Based on the X-ray powder diffraction and micro-Ramanspectra, the poly-phasic composition of the different La2xGa2yIn2-
zO3 samples has been determined. Changing the relative amountsof lanthanum, gallium and indium, it is possible to control thecrystal structure and the band gap of the ternary solid solutions.Moreover, herein we report the results of some photocatalyticexperiments of H2 production from solutions of water and bio-ethanol (the latter used as a sacrificial reagent), using three out oftwelve prepared solid solutions, i.e. LaGa0.5In0.5O3, La0.5GaIn0.5O3
and La0.5Ga0.5InO3. Finally, this paper sheds light on the relationamong the activities, structures and absorption spectra of thetested photocatalysts.
2. Experimental
2.1. Preparation of catalysts
The chemical reagents, Ga2O3 (grade 99.99+%), In2O3 (grade99.999%), La2O3 (grade 99.999%) and ethanol (499.8%) werepurchased from Sigma Aldrich and used as received. To synthesizethe solid solutions La2xGa2yIn2zO3, the reagents, Ga2O3, In2O3 andLa2O3 were mechanically mixed under the appropriate molarratios and ground by a miller. The mixtures were calcinedat 1373 K under air atmosphere, in a platinum crucible, for24 h through a muffle furnace. The products formation has beenproven to be reproducible, all the synthesis were repeated atleast twice.
2.2. Structural characterization
The synthesis of the catalysts was ascertained by recording theX-ray diffraction spectra (XRD) of the powders through aPanalytical X’PERT PRO diffractometer, equipped with theXcelerator fast detector. From the XRPD patterns, the phasespresent in the ternary samples were defined. The indexedstructures of the binary compounds, i.e. LaInO3, LaGaO3 andGaInO3, allowed lattice parameters of the unit cell for everyknown phase, present in the ternary samples, to be estimated. Thelattice parameters of the different structures were calculated fromseveral diffraction peaks over a wide range of diffraction angles,using Eqs. (2)–(4) for orthorhombic, cubic and monoclinic lattices,respectively:
1
d2h,k,l
¼h2
a2þ
k2
b2þ
l2
c2ð2Þ
1
d2h,k,l
¼h2þk2þ l2
a2ð3Þ
1
d2h,k,l
¼h2
a2 sin2bþ
k2
b2þ
l2
c2 sin2b�
2hlcosbacsin2b
ð4Þ
where dh,k,l is the interplanar distance and (h k l) are the Millerindices for the corresponding d-spacing; a, b, c and b are thelattice parameters. In order to index the unknown phasesappearing in some samples, we used the TREOR software [3].The TREOR program is based on a ‘‘trial-and-error’’ procedure thatsearches the best calculated unit cell that could index the highernumber of observed reflections using the lower number ofcalculated parameters. A figure of merit (MZ10) [4] is also usedin order to evaluate physical correctness and reliability of thefound solutions.
Micro-Raman sampling was performed by means of anOLYMPUS microscope model BX40 connected to an ISA JobinYvon model TRIAX320 single monochromator, resolution 2 cm�1.The exciting source was a Melles Griot 25LHP925 He–Ne laserused in single line excitation mode at 632.8 nm. The powerfocused on the samples was always less than 2 mW. The scatteredRaman photons were detected by a liquid-nitrogen cooled CCD,Jobin Yvon model SPECTRUM ONE.
SEM images revealed that the average dimensions of the solidparticles were hundreds of nanometers.
2.3. Photophysical characterization
UV–vis reflectance spectra of the powdery samples wererecorded through a Cary 4000 spectrophotometer, equipped witha DRA900 diffuse reflectance accessory. First of all, the reflectancevalues have been transformed to Kubelka–Munk units accordingto the following algorithm [5]:
K
S¼½1�Rl0
�2
2Rl0
¼ FðRl0Þ ð5Þ
In Eq. (5), K and S represent the apparent absorption andscattering coefficients, respectively, and S is assumed to bewavelength-independent; Rl0
is the reflectance value experimen-tally recorded at l0 and FðRl0
Þ is dubbed the re-emission functionat l0. To pinpoint the band gap energies of our semiconductors,we performed the first derivatives of the recorded spectra.On plotting dFðRl0
Þ=dl as a function of l, the band gap transitionsgave rise to negative bands. These bands were fitted by Gaussianfunctions whose centres were chosen as the best estimations ofthe band gap energies.
In order to discern direct and indirect electronic transitions, weused
ahn¼ Bðhn�EgÞn
ð6Þ
where a, n, B and Eg are the absorption coefficient (proportional tothe K/S ratio), light frequency, proportional constant and band gapenergy, respectively. The exponential n rules the character of thetransition: if it is equal to 1/2, the transition is direct, whereas if itis equal to 2, the transition is indirect [6]. In order to discernbetween the two kinds of transitions, we plotted [(K/S)hn]1/n as afunction of hn, obtaining a straight line. The ratio of theintercept to the slope gave the right band gap only for one valueof n, 1/2 or 2.
2.4. Photocatalytic experiments
The experimental setup, employed to carry out the experi-ments of photocatalysis, is described in detail in Ref. [7]. Itconsists of a reactor made of AISI 304 stainless steel with a highpure quartz glass plate as a cover and a source of UV–viselectromagnetic radiation. It is surrounded by a cooling systemthat maintains the temperature at 298 K during the experiments.
P.L. Gentili et al. / Solar Energy Materials & Solar Cells 94 (2010) 2265–2274 2267
The free volume inside the reactor is filled with Ar (grade99.9999%) at the pressure of 1 bar. For the photolysis experi-ments, three different sources (from Helios Italquartz) have beenemployed: Zp type emitting from 180 nm to visible range, Zh typefrom 310 to visible range and Zs type from 360 nm to visiblerange, all having a power of 500 W. All the lamps were positioned0.05 m above the reactor having a diameter of 30 cm.
The reactive mixtures, inserted into the reactor, consisted of0.4 g of powdery catalyst suspended in 1100 mL of water/ethanol(10 vol%) solutions. The amount of evolved hydrogen wasmeasured by gas-cromatography (CP-4900, Varian). The experi-ments of photocatalysis for the different samples have beenrepeated at least two times. The uncertainties, defined as averagestandard deviations, are 70.1 mmoles for the amount of hydrogenproduced by photocatalysis.
3. Results and discussion
3.1. Synthesis of solid solutions
With the purpose of synthesizing photocatalysts for hydrogenproduction from water, solid solutions of general formulaLa2xGa2yIn2zO3 have been prepared in this work. La2xGa2yIn2zO3
have been obtained through acid–base reactions carried out insolid phase at high temperature using La2O3, Ga2O3 and In2O3 asreagents. From the XRD spectrum shown in Fig. 1A it can beinferred that the lanthanum oxide used is a mixture of hexagonaland cubic structures [8] and contains also a small amount oflanthanum hydroxide [9]. La2O3 absorbs just below 250 nm and
10
K/S
K/S
N°
coun
tsN
° co
unts
N°
coun
ts
K/S
2θ15 20 25 30 35 40 45 50 55 60
102θ
15 20 25 30 35 40 45 50 55 60
102θ
15 20 25 30 35 40 45 50 55 60
Fig. 1. X-rays diffraction spectra and UV–vis absorption spectra (expressed in Kubelka
In2O3 (E and F, respectively).
its first direct band gap is at 5.23 eV (i.e. 237 nm, see theabsorption spectrum in Fig. 1B).
The Ga2O3 used is in b phase, which has a monoclinic structure(according to the XRD spectrum shown in Fig. 1C) consisting ofGaO4 tetrahedra and GaO6 octahedra [10]. It shows a directelectronic transition at 4.71 eV (i.e. 263 nm, Fig. 1D).
According to the XRD pattern, the In2O3 used has a cubicstructure (Fig. 1E) [11]. The cubic phase of In2O3 absorbs lightbelow 500 nm (Fig. 1F); it has a direct band gap at 3.01 eV(i.e. 412 nm) as inferred from the spectrum and confirmed byrecent works (see, for instance, Ref. [12]).
La2O3, Ga2O3 and In2O3 are semiconductor metal oxides, whichdo not have d-levels partly filled. The electric potential (EVB) oftheir valence bands can be assumed constant and equal to 2.94 V[13] because the levels at the top of the valence band consistessentially of O2� 2p orbitals and are rather insensitive to thenature of both the metal element and the structure of the oxides.Therefore, the flat band potential (Vfb) associated with theconduction band can be inferred from Eq. (7) [13]:
VfbðSHEÞ ¼ 2:94�Eg ð7Þ
where Eg represents the band gap of the semiconductor. La2O3 hasthe strongest reducing power (in fact Vfb(La2O3)¼�2.29 V), In2O3
the weakest (Vfb(In2O3)¼�0.07 V), whereas that of Ga2O3 isintermediate (Vfb(Ga2O3)¼�1.77 V).
Twelve different La2xGa2yIn2zO3 solid solutions, grouping inthree series, have been synthesized: series (1) consisting ofLaGaO3 (hereafter named as s1), LaGa0.8In0.2O3 (s2), LaGa0.5In0.5O3
(s3) and LaGa0.2In0.8O3 (s4), wherein the stoichiometric coefficientof La was held constant to the value of 2x¼1, whereas thatof In changed mutually (z¼0.5�y) with that of Ga; series
200
2
2
4
2
4
λ (nm)300 400 500 600
200λ (nm)
300 400 500 600
200λ (nm)
300 400 500 600
–Munk units) of La2O3 (A and B, respectively), Ga2O3 (C and D, respectively) and
o2o2o2 o1o1
o1
o1
o1o1o1
o1
o1
s2
33
s1
P.L. Gentili et al. / Solar Energy Materials & Solar Cells 94 (2010) 2265–22742268
(2) consisting of LaInO3 (s5), La0.8Ga0.2InO3 (s6), La0.5Ga0.5InO3
(s7) and La0.2Ga0.8InO3 (s8), wherein the stoichiometric coefficientof In was held constant to the value of 2z¼1, whereas that of Gachanged mutually (y¼0.5�x) with that of La; series (3) consistingof GaInO3 (s9), La0.2GaIn0.8O3 (s10), La0.5GaIn0.5O3 (s11) andLa0.8GaIn0.8O3 (s12), wherein the stoichiometric coefficient of Gawas held constant to the value of 2y¼1, whereas that of Lachanged mutually (x¼0.5�z) with that of In.
18 21 24 27 30 33 36 39 42 45 48 51 54 57 60
o1 o1 o1
o1
o1
o1
o1
o1 o1o2o2
o1 o1 o1
o1
o1
o2
o2
o2
o2o2
o2
o2
o2 o2
o2o2o2
o2
o1 o1o1
o1o1o1
o1
3
22
2 2 2
222
cc
c
c
1111
1
1111ccccc
c
1111
11 cc
ccccc
c
c
cc
ccccc
c
cccc
s12
s11
s10
s8
s7
s6
s4
s3
s9
s5
222 3 3 3
3333
22
22
22
22
ccccccc
c
c 1111
1
11111
22
22
333
33
3
33
coun
ts (a
.u.)
2θ (degree)
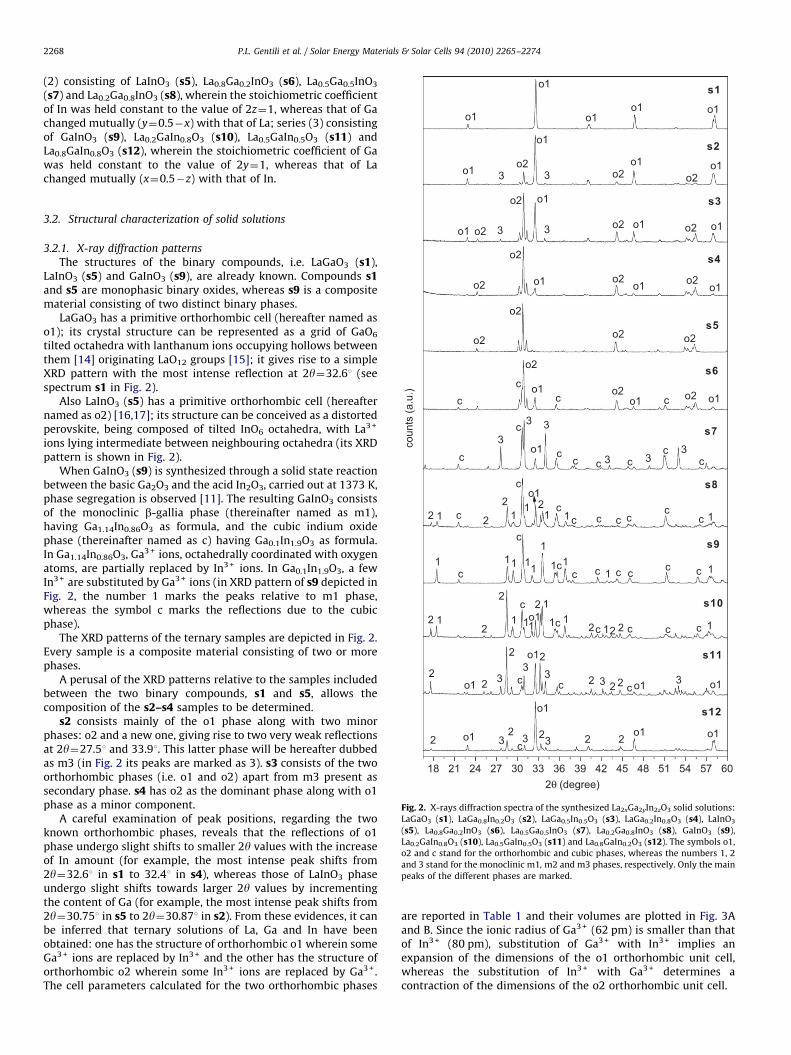
Fig. 2. X-rays diffraction spectra of the synthesized La2xGa2yIn2zO3 solid solutions:
LaGaO3 (s1), LaGa0.8In0.2O3 (s2), LaGa0.5In0.5O3 (s3), LaGa0.2In0.8O3 (s4), LaInO3
(s5), La0.8Ga0.2InO3 (s6), La0.5Ga0.5InO3 (s7), La0.2Ga0.8InO3 (s8), GaInO3 (s9),
La0.2GaIn0.8O3 (s10), La0.5GaIn0.5O3 (s11) and La0.8GaIn0.2O3 (s12). The symbols o1,
o2 and c stand for the orthorhombic and cubic phases, whereas the numbers 1, 2
and 3 stand for the monoclinic m1, m2 and m3 phases, respectively. Only the main
peaks of the different phases are marked.
3.2. Structural characterization of solid solutions
3.2.1. X-ray diffraction patterns
The structures of the binary compounds, i.e. LaGaO3 (s1),LaInO3 (s5) and GaInO3 (s9), are already known. Compounds s1and s5 are monophasic binary oxides, whereas s9 is a compositematerial consisting of two distinct binary phases.
LaGaO3 has a primitive orthorhombic cell (hereafter named aso1); its crystal structure can be represented as a grid of GaO6
tilted octahedra with lanthanum ions occupying hollows betweenthem [14] originating LaO12 groups [15]; it gives rise to a simpleXRD pattern with the most intense reflection at 2y¼32.61 (seespectrum s1 in Fig. 2).
Also LaInO3 (s5) has a primitive orthorhombic cell (hereafternamed as o2) [16,17]; its structure can be conceived as a distortedperovskite, being composed of tilted InO6 octahedra, with La3 +
ions lying intermediate between neighbouring octahedra (its XRDpattern is shown in Fig. 2).
When GaInO3 (s9) is synthesized through a solid state reactionbetween the basic Ga2O3 and the acid In2O3, carried out at 1373 K,phase segregation is observed [11]. The resulting GaInO3 consistsof the monoclinic b-gallia phase (thereinafter named as m1),having Ga1.14In0.86O3 as formula, and the cubic indium oxidephase (thereinafter named as c) having Ga0.1In1.9O3 as formula.In Ga1.14In0.86O3, Ga3 + ions, octahedrally coordinated with oxygenatoms, are partially replaced by In3 + ions. In Ga0.1In1.9O3, a fewIn3 + are substituted by Ga3 + ions (in XRD pattern of s9 depicted inFig. 2, the number 1 marks the peaks relative to m1 phase,whereas the symbol c marks the reflections due to the cubicphase).
The XRD patterns of the ternary samples are depicted in Fig. 2.Every sample is a composite material consisting of two or morephases.
A perusal of the XRD patterns relative to the samples includedbetween the two binary compounds, s1 and s5, allows thecomposition of the s2–s4 samples to be determined.
s2 consists mainly of the o1 phase along with two minorphases: o2 and a new one, giving rise to two very weak reflectionsat 2y¼27.51 and 33.91. This latter phase will be hereafter dubbedas m3 (in Fig. 2 its peaks are marked as 3). s3 consists of the twoorthorhombic phases (i.e. o1 and o2) apart from m3 present assecondary phase. s4 has o2 as the dominant phase along with o1phase as a minor component.
A careful examination of peak positions, regarding the twoknown orthorhombic phases, reveals that the reflections of o1phase undergo slight shifts to smaller 2y values with the increaseof In amount (for example, the most intense peak shifts from2y¼32.61 in s1 to 32.41 in s4), whereas those of LaInO3 phaseundergo slight shifts towards larger 2y values by incrementingthe content of Ga (for example, the most intense peak shifts from2y¼30.751 in s5 to 2y¼30.871 in s2). From these evidences, it canbe inferred that ternary solutions of La, Ga and In have beenobtained: one has the structure of orthorhombic o1 wherein someGa3 + ions are replaced by In3 + and the other has the structure oforthorhombic o2 wherein some In3 + ions are replaced by Ga3 +.The cell parameters calculated for the two orthorhombic phases
are reported in Table 1 and their volumes are plotted in Fig. 3Aand B. Since the ionic radius of Ga3 + (62 pm) is smaller than thatof In3 + (80 pm), substitution of Ga3 + with In3 + implies anexpansion of the dimensions of the o1 orthorhombic unit cell,whereas the substitution of In3 + with Ga3 + determines acontraction of the dimensions of the o2 orthorhombic unit cell.
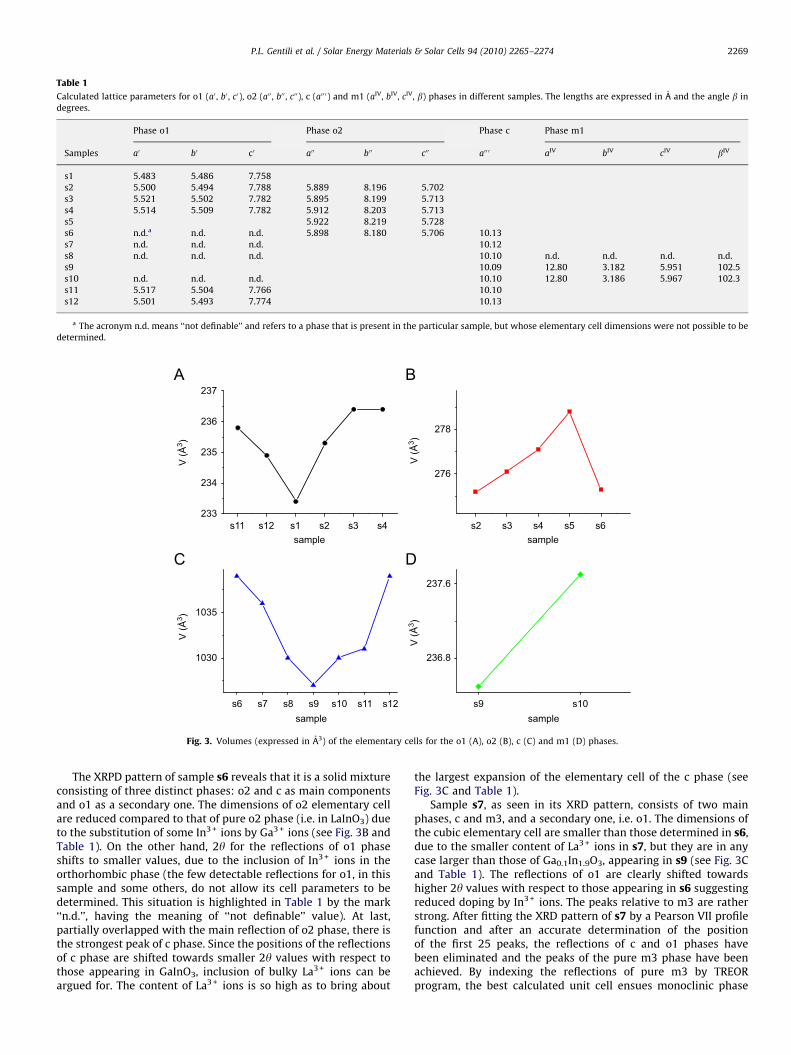
Table 1
Calculated lattice parameters for o1 (a0, b0 , c0), o2 (a00 , b00 , c00), c (a00 0) and m1 (aIV, bIV, cIV, b) phases in different samples. The lengths are expressed in A and the angle b in
degrees.
Phase o1 Phase o2 Phase c Phase m1
Samples a0 b0 c0 a00 b00 c00 a00 0 aIV bIV cIV bIV
s1 5.483 5.486 7.758
s2 5.500 5.494 7.788 5.889 8.196 5.702
s3 5.521 5.502 7.782 5.895 8.199 5.713
s4 5.514 5.509 7.782 5.912 8.203 5.713
s5 5.922 8.219 5.728
s6 n.d.a n.d. n.d. 5.898 8.180 5.706 10.13
s7 n.d. n.d. n.d. 10.12
s8 n.d. n.d. n.d. 10.10 n.d. n.d. n.d. n.d.
s9 10.09 12.80 3.182 5.951 102.5
s10 n.d. n.d. n.d. 10.10 12.80 3.186 5.967 102.3
s11 5.517 5.504 7.766 10.10
s12 5.501 5.493 7.774 10.13
a The acronym n.d. means ‘‘not definable’’ and refers to a phase that is present in the particular sample, but whose elementary cell dimensions were not possible to be
determined.
s11233
234
235
236
237
V (Å
3 )
V (Å
3 )
samples2
276
278
V (Å
3 )
s6
1030
1035
V (Å
3 )
s10s9
236.8
237.6
samplesample
samples12 s1 s2 s3 s4 s3 s4 s5 s6
s7 s8 s9 s10 s11 s12
Fig. 3. Volumes (expressed in A3) of the elementary cells for the o1 (A), o2 (B), c (C) and m1 (D) phases.
P.L. Gentili et al. / Solar Energy Materials & Solar Cells 94 (2010) 2265–2274 2269
The XRPD pattern of sample s6 reveals that it is a solid mixtureconsisting of three distinct phases: o2 and c as main componentsand o1 as a secondary one. The dimensions of o2 elementary cellare reduced compared to that of pure o2 phase (i.e. in LaInO3) dueto the substitution of some In3 + ions by Ga3 + ions (see Fig. 3B andTable 1). On the other hand, 2y for the reflections of o1 phaseshifts to smaller values, due to the inclusion of In3 + ions in theorthorhombic phase (the few detectable reflections for o1, in thissample and some others, do not allow its cell parameters to bedetermined. This situation is highlighted in Table 1 by the mark‘‘n.d.’’, having the meaning of ‘‘not definable’’ value). At last,partially overlapped with the main reflection of o2 phase, there isthe strongest peak of c phase. Since the positions of the reflectionsof c phase are shifted towards smaller 2y values with respect tothose appearing in GaInO3, inclusion of bulky La3 + ions can beargued for. The content of La3 + ions is so high as to bring about
the largest expansion of the elementary cell of the c phase (seeFig. 3C and Table 1).
Sample s7, as seen in its XRD pattern, consists of two mainphases, c and m3, and a secondary one, i.e. o1. The dimensions ofthe cubic elementary cell are smaller than those determined in s6,due to the smaller content of La3 + ions in s7, but they are in anycase larger than those of Ga0.1In1.9O3, appearing in s9 (see Fig. 3Cand Table 1). The reflections of o1 are clearly shifted towardshigher 2y values with respect to those appearing in s6 suggestingreduced doping by In3 + ions. The peaks relative to m3 are ratherstrong. After fitting the XRD pattern of s7 by a Pearson VII profilefunction and after an accurate determination of the positionof the first 25 peaks, the reflections of c and o1 phases havebeen eliminated and the peaks of the pure m3 phase have beenachieved. By indexing the reflections of pure m3 by TREORprogram, the best calculated unit cell ensues monoclinic phase
650
o1 o1
1
o1
o1 o1o1o2 o2 o2 o2 o2
o2
o1
o1
o1
o2
o2 o2 o2 o2o2
o2
o2 o2 o2 o2 o2
o2
o2o2 o2 o2 o2
o2
o1o1
o1 o1o1
o1
o1 o1 o1o1
c
cc
c
c
111
cc
c
cc
c
2 2
c
c
c1
1 1 2
2
1 2
2
3 3 3
s12
s11
s10
1111
cccs9
s8
s7
s6
s5
s4
s3
s2
Inte
nsity
(a.u
.)
s1
c
1
3
2
2
c
Raman shift (cm-1)200 250 300 350 400 450 500 550 600 700 750 800
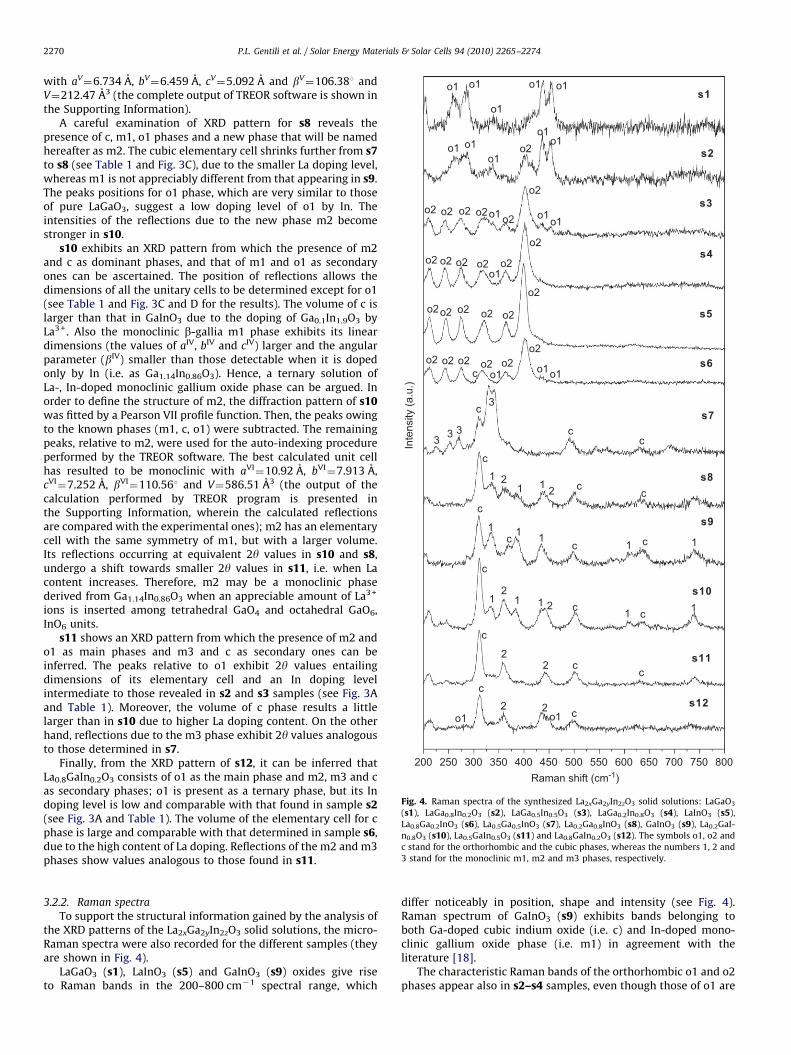
Fig. 4. Raman spectra of the synthesized La2xGa2yIn2zO3 solid solutions: LaGaO3
(s1), LaGa0.8In0.2O3 (s2), LaGa0.5In0.5O3 (s3), LaGa0.2In0.8O3 (s4), LaInO3 (s5),
La0.8Ga0.2InO3 (s6), La0.5Ga0.5InO3 (s7), La0.2Ga0.8InO3 (s8), GaInO3 (s9), La0.2GaI-
n0.8O3 (s10), La0.5GaIn0.5O3 (s11) and La0.8GaIn0.2O3 (s12). The symbols o1, o2 and
c stand for the orthorhombic and the cubic phases, whereas the numbers 1, 2 and
3 stand for the monoclinic m1, m2 and m3 phases, respectively.
P.L. Gentili et al. / Solar Energy Materials & Solar Cells 94 (2010) 2265–22742270
with aV¼6.734 A, bV
¼6.459 A, cV¼5.092 A and bV
¼106.381 andV¼212.47 A3 (the complete output of TREOR software is shown inthe Supporting Information).
A careful examination of XRD pattern for s8 reveals thepresence of c, m1, o1 phases and a new phase that will be namedhereafter as m2. The cubic elementary cell shrinks further from s7to s8 (see Table 1 and Fig. 3C), due to the smaller La doping level,whereas m1 is not appreciably different from that appearing in s9.The peaks positions for o1 phase, which are very similar to thoseof pure LaGaO3, suggest a low doping level of o1 by In. Theintensities of the reflections due to the new phase m2 becomestronger in s10.
s10 exhibits an XRD pattern from which the presence of m2and c as dominant phases, and that of m1 and o1 as secondaryones can be ascertained. The position of reflections allows thedimensions of all the unitary cells to be determined except for o1(see Table 1 and Fig. 3C and D for the results). The volume of c islarger than that in GaInO3 due to the doping of Ga0.1In1.9O3 byLa3 +. Also the monoclinic b-gallia m1 phase exhibits its lineardimensions (the values of aIV, bIV and cIV) larger and the angularparameter (bIV) smaller than those detectable when it is dopedonly by In (i.e. as Ga1.14In0.86O3). Hence, a ternary solution ofLa-, In-doped monoclinic gallium oxide phase can be argued. Inorder to define the structure of m2, the diffraction pattern of s10was fitted by a Pearson VII profile function. Then, the peaks owingto the known phases (m1, c, o1) were subtracted. The remainingpeaks, relative to m2, were used for the auto-indexing procedureperformed by the TREOR software. The best calculated unit cellhas resulted to be monoclinic with aVI
¼10.92 A, bVI¼7.913 A,
cVI¼7.252 A, bVI
¼110.561 and V¼586.51 A3 (the output of thecalculation performed by TREOR program is presented inthe Supporting Information, wherein the calculated reflectionsare compared with the experimental ones); m2 has an elementarycell with the same symmetry of m1, but with a larger volume.Its reflections occurring at equivalent 2y values in s10 and s8,undergo a shift towards smaller 2y values in s11, i.e. when Lacontent increases. Therefore, m2 may be a monoclinic phasederived from Ga1.14In0.86O3 when an appreciable amount of La3 +
ions is inserted among tetrahedral GaO4 and octahedral GaO6,InO6 units.
s11 shows an XRD pattern from which the presence of m2 ando1 as main phases and m3 and c as secondary ones can beinferred. The peaks relative to o1 exhibit 2y values entailingdimensions of its elementary cell and an In doping levelintermediate to those revealed in s2 and s3 samples (see Fig. 3Aand Table 1). Moreover, the volume of c phase results a littlelarger than in s10 due to higher La doping content. On the otherhand, reflections due to the m3 phase exhibit 2y values analogousto those determined in s7.
Finally, from the XRD pattern of s12, it can be inferred thatLa0.8GaIn0.2O3 consists of o1 as the main phase and m2, m3 and cas secondary phases; o1 is present as a ternary phase, but its Indoping level is low and comparable with that found in sample s2(see Fig. 3A and Table 1). The volume of the elementary cell for cphase is large and comparable with that determined in sample s6,due to the high content of La doping. Reflections of the m2 and m3phases show values analogous to those found in s11.
3.2.2. Raman spectra
To support the structural information gained by the analysis ofthe XRD patterns of the La2xGa2yIn2zO3 solid solutions, the micro-Raman spectra were also recorded for the different samples (theyare shown in Fig. 4).
LaGaO3 (s1), LaInO3 (s5) and GaInO3 (s9) oxides give riseto Raman bands in the 200–800 cm�1 spectral range, which
differ noticeably in position, shape and intensity (see Fig. 4).Raman spectrum of GaInO3 (s9) exhibits bands belonging toboth Ga-doped cubic indium oxide (i.e. c) and In-doped mono-clinic gallium oxide phase (i.e. m1) in agreement with theliterature [18].
The characteristic Raman bands of the orthorhombic o1 and o2phases appear also in s2–s4 samples, even though those of o1 are
m1
c
s12s11s10s9
s8
s7
s6
s5
s4
s3
s2
s1
series (2): La2x
Ga2(0.5-x)
InO3
series (3): La2(0.5-z)
GaIn2z
O3
GaInO3
LaInO3
series (1): LaGa2y
In2(0.5-y)
O3
La2O
3In
2O
3
LaGaO3
χGa
χIn
0 1
1 0
0 1χLa
Ga2O
3
o2
o1m2
c
m3
m1
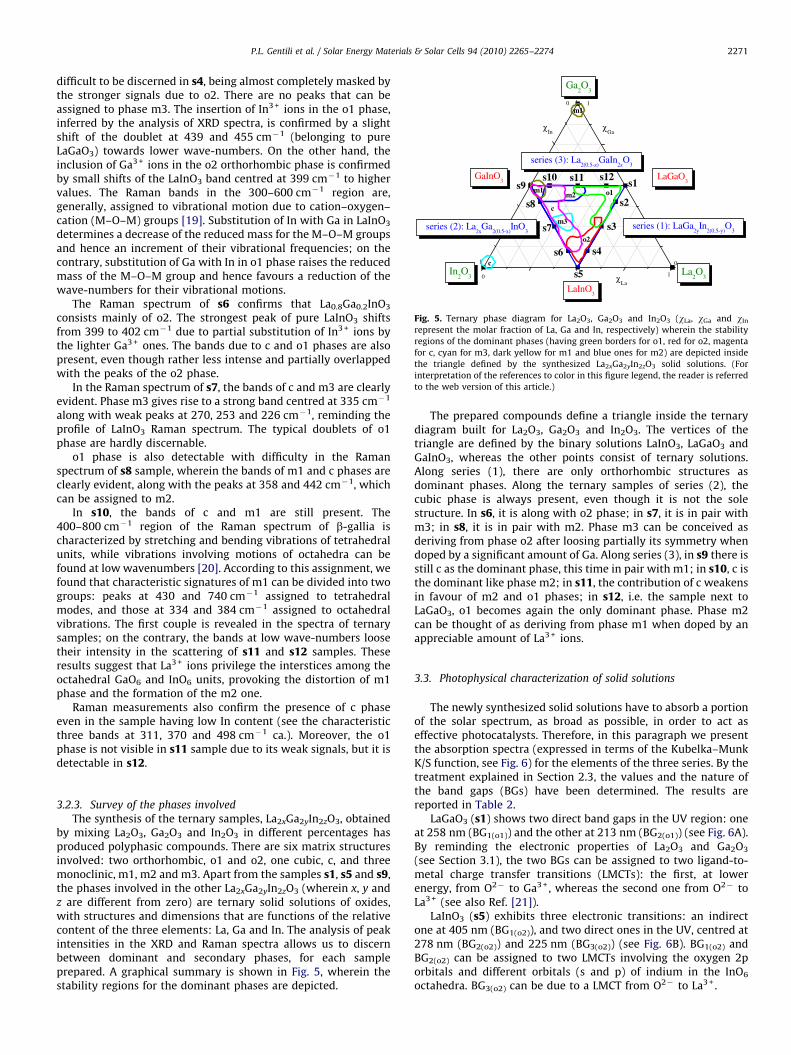
Fig. 5. Ternary phase diagram for La2O3, Ga2O3 and In2O3 (wLa, wGa and wIn
represent the molar fraction of La, Ga and In, respectively) wherein the stability
regions of the dominant phases (having green borders for o1, red for o2, magenta
for c, cyan for m3, dark yellow for m1 and blue ones for m2) are depicted inside
the triangle defined by the synthesized La2xGa2yIn2zO3 solid solutions. (For
interpretation of the references to color in this figure legend, the reader is referred
to the web version of this article.)
P.L. Gentili et al. / Solar Energy Materials & Solar Cells 94 (2010) 2265–2274 2271
difficult to be discerned in s4, being almost completely masked bythe stronger signals due to o2. There are no peaks that can beassigned to phase m3. The insertion of In3 + ions in the o1 phase,inferred by the analysis of XRD spectra, is confirmed by a slightshift of the doublet at 439 and 455 cm�1 (belonging to pureLaGaO3) towards lower wave-numbers. On the other hand, theinclusion of Ga3 + ions in the o2 orthorhombic phase is confirmedby small shifts of the LaInO3 band centred at 399 cm�1 to highervalues. The Raman bands in the 300–600 cm�1 region are,generally, assigned to vibrational motion due to cation–oxygen–cation (M–O–M) groups [19]. Substitution of In with Ga in LaInO3
determines a decrease of the reduced mass for the M–O–M groupsand hence an increment of their vibrational frequencies; on thecontrary, substitution of Ga with In in o1 phase raises the reducedmass of the M–O–M group and hence favours a reduction of thewave-numbers for their vibrational motions.
The Raman spectrum of s6 confirms that La0.8Ga0.2InO3
consists mainly of o2. The strongest peak of pure LaInO3 shiftsfrom 399 to 402 cm�1 due to partial substitution of In3 + ions bythe lighter Ga3 + ones. The bands due to c and o1 phases are alsopresent, even though rather less intense and partially overlappedwith the peaks of the o2 phase.
In the Raman spectrum of s7, the bands of c and m3 are clearlyevident. Phase m3 gives rise to a strong band centred at 335 cm�1
along with weak peaks at 270, 253 and 226 cm�1, reminding theprofile of LaInO3 Raman spectrum. The typical doublets of o1phase are hardly discernable.
o1 phase is also detectable with difficulty in the Ramanspectrum of s8 sample, wherein the bands of m1 and c phases areclearly evident, along with the peaks at 358 and 442 cm�1, whichcan be assigned to m2.
In s10, the bands of c and m1 are still present. The400–800 cm�1 region of the Raman spectrum of b-gallia ischaracterized by stretching and bending vibrations of tetrahedralunits, while vibrations involving motions of octahedra can befound at low wavenumbers [20]. According to this assignment, wefound that characteristic signatures of m1 can be divided into twogroups: peaks at 430 and 740 cm�1 assigned to tetrahedralmodes, and those at 334 and 384 cm�1 assigned to octahedralvibrations. The first couple is revealed in the spectra of ternarysamples; on the contrary, the bands at low wave-numbers loosetheir intensity in the scattering of s11 and s12 samples. Theseresults suggest that La3 + ions privilege the interstices among theoctahedral GaO6 and InO6 units, provoking the distortion of m1phase and the formation of the m2 one.
Raman measurements also confirm the presence of c phaseeven in the sample having low In content (see the characteristicthree bands at 311, 370 and 498 cm�1 ca.). Moreover, the o1phase is not visible in s11 sample due to its weak signals, but it isdetectable in s12.
3.2.3. Survey of the phases involved
The synthesis of the ternary samples, La2xGa2yIn2zO3, obtainedby mixing La2O3, Ga2O3 and In2O3 in different percentages hasproduced polyphasic compounds. There are six matrix structuresinvolved: two orthorhombic, o1 and o2, one cubic, c, and threemonoclinic, m1, m2 and m3. Apart from the samples s1, s5 and s9,the phases involved in the other La2xGa2yIn2zO3 (wherein x, y andz are different from zero) are ternary solid solutions of oxides,with structures and dimensions that are functions of the relativecontent of the three elements: La, Ga and In. The analysis of peakintensities in the XRD and Raman spectra allows us to discernbetween dominant and secondary phases, for each sampleprepared. A graphical summary is shown in Fig. 5, wherein thestability regions for the dominant phases are depicted.
The prepared compounds define a triangle inside the ternarydiagram built for La2O3, Ga2O3 and In2O3. The vertices of thetriangle are defined by the binary solutions LaInO3, LaGaO3 andGaInO3, whereas the other points consist of ternary solutions.Along series (1), there are only orthorhombic structures asdominant phases. Along the ternary samples of series (2), thecubic phase is always present, even though it is not the solestructure. In s6, it is along with o2 phase; in s7, it is in pair withm3; in s8, it is in pair with m2. Phase m3 can be conceived asderiving from phase o2 after loosing partially its symmetry whendoped by a significant amount of Ga. Along series (3), in s9 there isstill c as the dominant phase, this time in pair with m1; in s10, c isthe dominant like phase m2; in s11, the contribution of c weakensin favour of m2 and o1 phases; in s12, i.e. the sample next toLaGaO3, o1 becomes again the only dominant phase. Phase m2can be thought of as deriving from phase m1 when doped by anappreciable amount of La3 + ions.
3.3. Photophysical characterization of solid solutions
The newly synthesized solid solutions have to absorb a portionof the solar spectrum, as broad as possible, in order to act aseffective photocatalysts. Therefore, in this paragraph we presentthe absorption spectra (expressed in terms of the Kubelka–MunkK/S function, see Fig. 6) for the elements of the three series. By thetreatment explained in Section 2.3, the values and the nature ofthe band gaps (BGs) have been determined. The results arereported in Table 2.
LaGaO3 (s1) shows two direct band gaps in the UV region: oneat 258 nm (BG1(o1)) and the other at 213 nm (BG2(o1)) (see Fig. 6A).By reminding the electronic properties of La2O3 and Ga2O3
(see Section 3.1), the two BGs can be assigned to two ligand-to-metal charge transfer transitions (LMCTs): the first, at lowerenergy, from O2� to Ga3 +, whereas the second one from O2� toLa3 + (see also Ref. [21]).
LaInO3 (s5) exhibits three electronic transitions: an indirectone at 405 nm (BG1(o2)), and two direct ones in the UV, centred at278 nm (BG2(o2)) and 225 nm (BG3(o2)) (see Fig. 6B). BG1(o2) andBG2(o2) can be assigned to two LMCTs involving the oxygen 2porbitals and different orbitals (s and p) of indium in the InO6
octahedra. BG3(o2) can be due to a LMCT from O2� to La3 +.
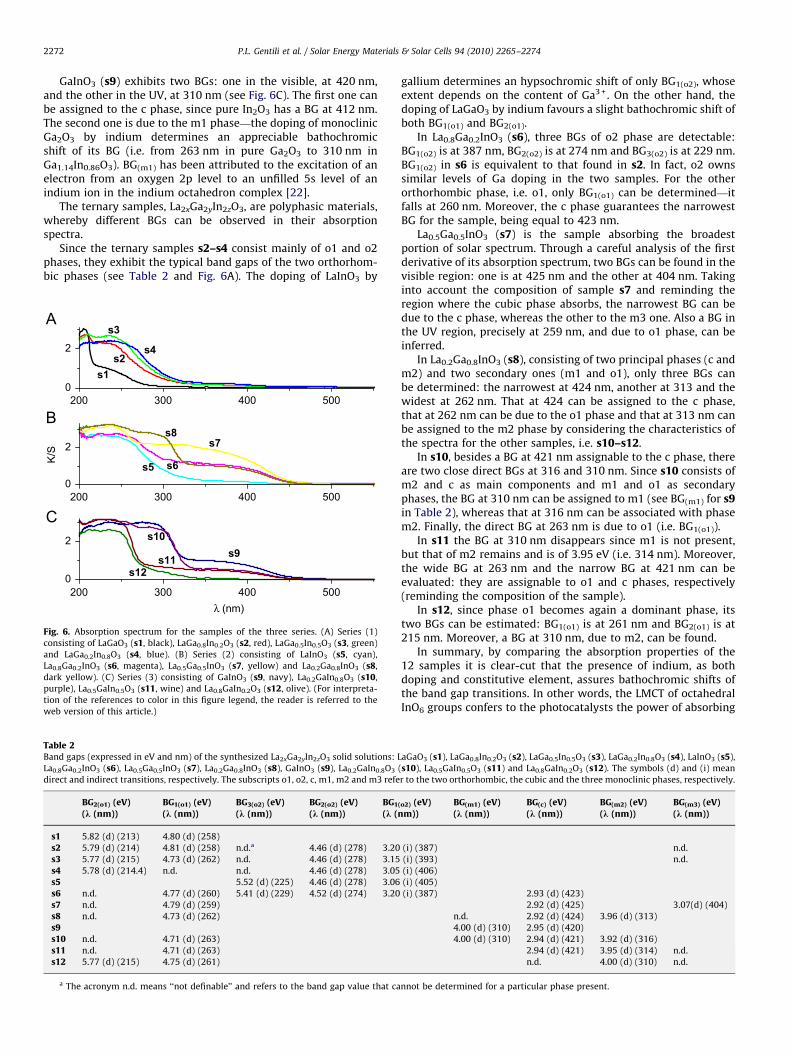
P.L. Gentili et al. / Solar Energy Materials & Solar Cells 94 (2010) 2265–22742272
GaInO3 (s9) exhibits two BGs: one in the visible, at 420 nm,and the other in the UV, at 310 nm (see Fig. 6C). The first one canbe assigned to the c phase, since pure In2O3 has a BG at 412 nm.The second one is due to the m1 phase—the doping of monoclinicGa2O3 by indium determines an appreciable bathochromicshift of its BG (i.e. from 263 nm in pure Ga2O3 to 310 nm inGa1.14In0.86O3). BG(m1) has been attributed to the excitation of anelectron from an oxygen 2p level to an unfilled 5s level of anindium ion in the indium octahedron complex [22].
The ternary samples, La2xGa2yIn2zO3, are polyphasic materials,whereby different BGs can be observed in their absorptionspectra.
Since the ternary samples s2–s4 consist mainly of o1 and o2phases, they exhibit the typical band gaps of the two orthorhom-bic phases (see Table 2 and Fig. 6A). The doping of LaInO3 by
Table 2Band gaps (expressed in eV and nm) of the synthesized La2xGa2yIn2zO3 solid solutions: L
La0.8Ga0.2InO3 (s6), La0.5Ga0.5InO3 (s7), La0.2Ga0.8InO3 (s8), GaInO3 (s9), La0.2GaIn0.8O3
direct and indirect transitions, respectively. The subscripts o1, o2, c, m1, m2 and m3 refe
BG2(o1) (eV)
(k (nm))
BG1(o1) (eV)
(k (nm))
BG3(o2) (eV)
(k (nm))
BG2(o2) (eV)
(k (nm))
BG1
(k (n
s1 5.82 (d) (213) 4.80 (d) (258)
s2 5.79 (d) (214) 4.81 (d) (258) n.d.a 4.46 (d) (278) 3.20
s3 5.77 (d) (215) 4.73 (d) (262) n.d. 4.46 (d) (278) 3.15
s4 5.78 (d) (214.4) n.d. n.d. 4.46 (d) (278) 3.05
s5 5.52 (d) (225) 4.46 (d) (278) 3.06
s6 n.d. 4.77 (d) (260) 5.41 (d) (229) 4.52 (d) (274) 3.20
s7 n.d. 4.79 (d) (259)
s8 n.d. 4.73 (d) (262)
s9s10 n.d. 4.71 (d) (263)
s11 n.d. 4.71 (d) (263)
s12 5.77 (d) (215) 4.75 (d) (261)
a The acronym n.d. means ‘‘not definable’’ and refers to the band gap value that ca
0
2
K/S
s9s10
s11s12
0
2
s5 s6
s7s8
0
2
s1s2
s3
s4
200 300 400 500
200 300 400 500
200 300 400 500λ (nm)
Fig. 6. Absorption spectrum for the samples of the three series. (A) Series (1)
consisting of LaGaO3 (s1, black), LaGa0.8In0.2O3 (s2, red), LaGa0.5In0.5O3 (s3, green)
and LaGa0.2In0.8O3 (s4, blue). (B) Series (2) consisting of LaInO3 (s5, cyan),
La0.8Ga0.2InO3 (s6, magenta), La0.5Ga0.5InO3 (s7, yellow) and La0.2Ga0.8InO3 (s8,
dark yellow). (C) Series (3) consisting of GaInO3 (s9, navy), La0.2GaIn0.8O3 (s10,
purple), La0.5GaIn0.5O3 (s11, wine) and La0.8GaIn0.2O3 (s12, olive). (For interpreta-
tion of the references to color in this figure legend, the reader is referred to the
web version of this article.)
gallium determines an hypsochromic shift of only BG1(o2), whoseextent depends on the content of Ga3 +. On the other hand, thedoping of LaGaO3 by indium favours a slight bathochromic shift ofboth BG1(o1) and BG2(o1).
In La0.8Ga0.2InO3 (s6), three BGs of o2 phase are detectable:BG1(o2) is at 387 nm, BG2(o2) is at 274 nm and BG3(o2) is at 229 nm.BG1(o2) in s6 is equivalent to that found in s2. In fact, o2 ownssimilar levels of Ga doping in the two samples. For the otherorthorhombic phase, i.e. o1, only BG1(o1) can be determined—itfalls at 260 nm. Moreover, the c phase guarantees the narrowestBG for the sample, being equal to 423 nm.
La0.5Ga0.5InO3 (s7) is the sample absorbing the broadestportion of solar spectrum. Through a careful analysis of the firstderivative of its absorption spectrum, two BGs can be found in thevisible region: one is at 425 nm and the other at 404 nm. Takinginto account the composition of sample s7 and reminding theregion where the cubic phase absorbs, the narrowest BG can bedue to the c phase, whereas the other to the m3 one. Also a BG inthe UV region, precisely at 259 nm, and due to o1 phase, can beinferred.
In La0.2Ga0.8InO3 (s8), consisting of two principal phases (c andm2) and two secondary ones (m1 and o1), only three BGs canbe determined: the narrowest at 424 nm, another at 313 and thewidest at 262 nm. That at 424 can be assigned to the c phase,that at 262 nm can be due to the o1 phase and that at 313 nm canbe assigned to the m2 phase by considering the characteristics ofthe spectra for the other samples, i.e. s10–s12.
In s10, besides a BG at 421 nm assignable to the c phase, thereare two close direct BGs at 316 and 310 nm. Since s10 consists ofm2 and c as main components and m1 and o1 as secondaryphases, the BG at 310 nm can be assigned to m1 (see BG(m1) for s9in Table 2), whereas that at 316 nm can be associated with phasem2. Finally, the direct BG at 263 nm is due to o1 (i.e. BG1(o1)).
In s11 the BG at 310 nm disappears since m1 is not present,but that of m2 remains and is of 3.95 eV (i.e. 314 nm). Moreover,the wide BG at 263 nm and the narrow BG at 421 nm can beevaluated: they are assignable to o1 and c phases, respectively(reminding the composition of the sample).
In s12, since phase o1 becomes again a dominant phase, itstwo BGs can be estimated: BG1(o1) is at 261 nm and BG2(o1) is at215 nm. Moreover, a BG at 310 nm, due to m2, can be found.
In summary, by comparing the absorption properties of the12 samples it is clear-cut that the presence of indium, as bothdoping and constitutive element, assures bathochromic shifts ofthe band gap transitions. In other words, the LMCT of octahedralInO6 groups confers to the photocatalysts the power of absorbing
aGaO3 (s1), LaGa0.8In0.2O3 (s2), LaGa0.5In0.5O3 (s3), LaGa0.2In0.8O3 (s4), LaInO3 (s5),
(s10), La0.5GaIn0.5O3 (s11) and La0.8GaIn0.2O3 (s12). The symbols (d) and (i) mean
r to the two orthorhombic, the cubic and the three monoclinic phases, respectively.
(o2) (eV)
m))
BG(m1) (eV)
(k (nm))
BG(c) (eV)
(k (nm))
BG(m2) (eV)
(k (nm))
BG(m3) (eV)
(k (nm))
(i) (387) n.d.
(i) (393) n.d.
(i) (406)
(i) (405)
(i) (387) 2.93 (d) (423)
2.92 (d) (425) 3.07(d) (404)
n.d. 2.92 (d) (424) 3.96 (d) (313)
4.00 (d) (310) 2.95 (d) (420)
4.00 (d) (310) 2.94 (d) (421) 3.92 (d) (316)
2.94 (d) (421) 3.95 (d) (314) n.d.
n.d. 4.00 (d) (310) n.d.
nnot be determined for a particular phase present.
P.L. Gentili et al. / Solar Energy Materials & Solar Cells 94 (2010) 2265–2274 2273
a broader portion of the solar spectrum. The exact position andnature of that transition depend on the overall structureand composition of the phase wherein the octahedral InO6 areembedded. It is the c phase that allows the limit towards the redto be reached (425 nm in s7). Also the InO6 groups of o2 and m3phases give rise to BG in the visible, although the transition isindirect in the case of o2 phase. On the other hand, the InO6
groups present in the m1 and m2 phases originate band gaps inthe near-UV. The fact that m3 shows a BG similar to that of o2 andm2 similar to that of m1 confirms the hypothesis, put forward inSection 3.2, that m3 derives from o2 when it is doped by ahigh content of Ga, whereas m2 derives from m1 when it is dopedby a high content of La. Moreover, it is worthwhile noticing thatthe cubic phase shrinks its band gap when it is doped bylanthanum ions.
Determining the flat band potential (Vfb) of the conductionbands for the newly synthesized samples (see Eq. (7) in Section 3.1)shows that only the c phase of the s6–s8 samples has positivevalues. The other phases guarantee sufficiently negative flat bandpotential to reduce the hydrogen of water.
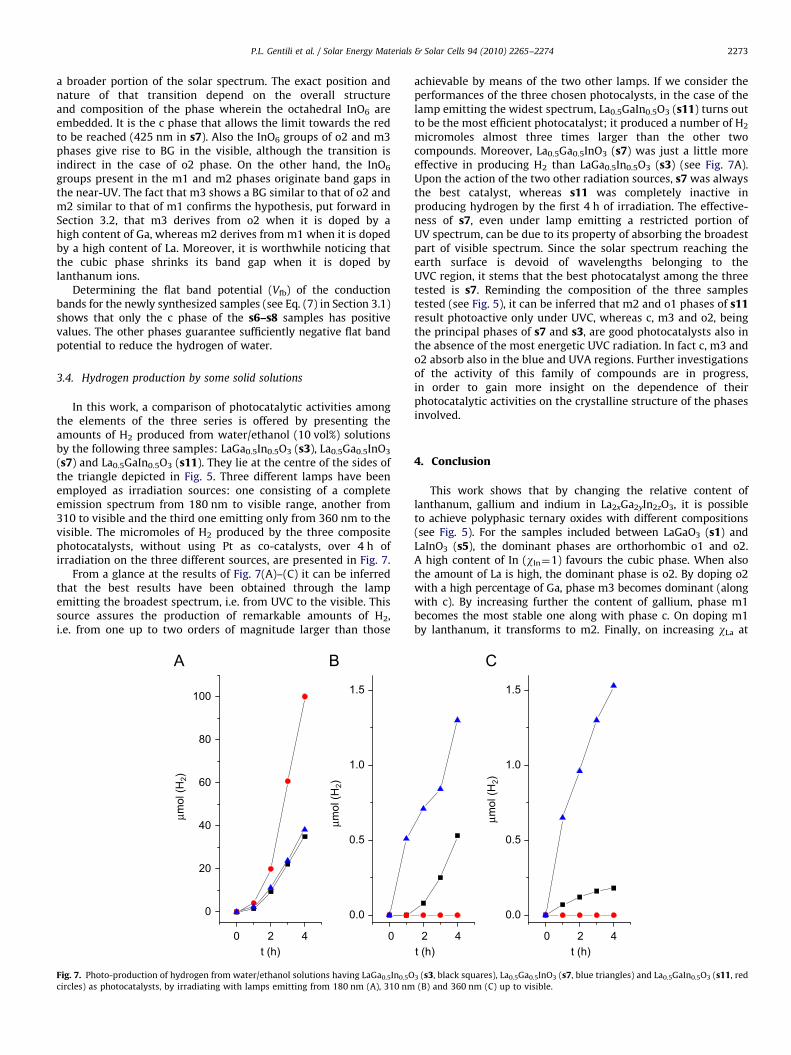
3.4. Hydrogen production by some solid solutions
In this work, a comparison of photocatalytic activities amongthe elements of the three series is offered by presenting theamounts of H2 produced from water/ethanol (10 vol%) solutionsby the following three samples: LaGa0.5In0.5O3 (s3), La0.5Ga0.5InO3
(s7) and La0.5GaIn0.5O3 (s11). They lie at the centre of the sides ofthe triangle depicted in Fig. 5. Three different lamps have beenemployed as irradiation sources: one consisting of a completeemission spectrum from 180 nm to visible range, another from310 to visible and the third one emitting only from 360 nm to thevisible. The micromoles of H2 produced by the three compositephotocatalysts, without using Pt as co-catalysts, over 4 h ofirradiation on the three different sources, are presented in Fig. 7.
From a glance at the results of Fig. 7(A)–(C) it can be inferredthat the best results have been obtained through the lampemitting the broadest spectrum, i.e. from UVC to the visible. Thissource assures the production of remarkable amounts of H2,i.e. from one up to two orders of magnitude larger than those
0
0
20
40
60
80
100
μmol
(H2)
0.0
0.5
1.0
1.5
μmol
(H2)
t (h)2 4 0
Fig. 7. Photo-production of hydrogen from water/ethanol solutions having LaGa0.5In0.5O
circles) as photocatalysts, by irradiating with lamps emitting from 180 nm (A), 310 nm
achievable by means of the two other lamps. If we consider theperformances of the three chosen photocalysts, in the case of thelamp emitting the widest spectrum, La0.5GaIn0.5O3 (s11) turns outto be the most efficient photocatalyst; it produced a number of H2
micromoles almost three times larger than the other twocompounds. Moreover, La0.5Ga0.5InO3 (s7) was just a little moreeffective in producing H2 than LaGa0.5In0.5O3 (s3) (see Fig. 7A).Upon the action of the two other radiation sources, s7 was alwaysthe best catalyst, whereas s11 was completely inactive inproducing hydrogen by the first 4 h of irradiation. The effective-ness of s7, even under lamp emitting a restricted portion ofUV spectrum, can be due to its property of absorbing the broadestpart of visible spectrum. Since the solar spectrum reaching theearth surface is devoid of wavelengths belonging to theUVC region, it stems that the best photocatalyst among the threetested is s7. Reminding the composition of the three samplestested (see Fig. 5), it can be inferred that m2 and o1 phases of s11result photoactive only under UVC, whereas c, m3 and o2, beingthe principal phases of s7 and s3, are good photocatalysts also inthe absence of the most energetic UVC radiation. In fact c, m3 ando2 absorb also in the blue and UVA regions. Further investigationsof the activity of this family of compounds are in progress,in order to gain more insight on the dependence of theirphotocatalytic activities on the crystalline structure of the phasesinvolved.
4. Conclusion
This work shows that by changing the relative content oflanthanum, gallium and indium in La2xGa2yIn2zO3, it is possibleto achieve polyphasic ternary oxides with different compositions(see Fig. 5). For the samples included between LaGaO3 (s1) andLaInO3 (s5), the dominant phases are orthorhombic o1 and o2.A high content of In (wIn¼1) favours the cubic phase. When alsothe amount of La is high, the dominant phase is o2. By doping o2with a high percentage of Ga, phase m3 becomes dominant (alongwith c). By increasing further the content of gallium, phase m1becomes the most stable one along with phase c. On doping m1by lanthanum, it transforms to m2. Finally, on increasing wLa at
μmol
(H2)
0.0
0.5
1.0
1.5
t (h)2 4 0
t (h)2 4
3 (s3, black squares), La0.5Ga0.5InO3 (s7, blue triangles) and La0.5GaIn0.5O3 (s11, red
(B) and 360 nm (C) up to visible.
P.L. Gentili et al. / Solar Energy Materials & Solar Cells 94 (2010) 2265–22742274
the expense of wIn, with wGa¼1, o1 becomes again the most stablephase.
In terms of photophysical properties, the presence of indiumions guarantees bathochromic shifts of the absorption spectra.The electronic levels relative to the p and s orbitals of In shrink theband gaps of the synthesized semiconductors. The structures ofthe c, o2 and m3 phases, which are based on InO6 octahedra,assure to the catalysts, the ability of absorbing the blue portion ofthe visible spectrum.
From the preliminary photocatalytic experiments carried outuntil now with samples s3, s7 and s11 it can be inferred that,upon an irradiation source emitting from the UVC, the most activephases are m2 and o1 of sample s11. On the other hand, when thelamp is devoid of the UVC wavelengths, the best photocatalyst issample s7, which has m3 and c as the main phases. These phasesconfer to the composite material the property of absorbing thebroadest portion of solar spectrum.
Further studies are in progress with the aim of elucidating thecomplex relation between structure and activity of this family ofphotocatalysts in producing hydrogen from water.
Acknowledgments
This work was supported by the Progetto Nazionale FISR‘‘Vettore Idrogeno: Sistemi Innovativi di Produzione di Idrogenoda Energie Rinnovabili’’ and by the Ministero per l’Universit�a e laRicerca Scientifica e Tecnologica (Rome, Italy) and the Universityof Perugia [PRIN 2008, 20088NTBKR].
Appendix A. Supporting Information
Supplementary data associated with this article can be foundin the online version at doi:10.1016/j.solmat.2010.07.024.
References
[1] M. Mikkelsen, M. Jørgensen, F.C. Krebs, The teraton challenge. A review of fixationand transformation of carbon dioxide, Energy Environ. Sci. 3 (2010) 43–81.
[2] A. Kudo, Y. Miseki, Heterogeneous photocatalyst materials for water splitting,Chem. Soc. Rev. 38 (2009) 253–278.
[3] P.E. Werner, L. Eriksson, M.C. Westdahl, TREOR, a semi-exhaustive trial-and-error powder indexing program for all symmetries, J. Appl. Crystallogr. 18(1985) 367–370.
[4] P.M. De Wolff, A simplified criterion for the reliability of a powder patternindexing, J. Appl. Crystallogr. 1 (1968) 108–113.
[5] (a) C. Clementi, B. Doherty, P.L. Gentili, C. Miliani, A. Romani, B.G. Brunetti, A.Sgamellotti, Vibrational and electronic properties of painting lakes, Appl.Phys. A 92 (1) (2008) 25–33;
(b) P.L. Gentili, C. Clementi, A. Romani, Ultraviolet–visible absorption andluminescence properties of quinacridone–barium sulfate solid mixtures,Appl. Spectrosc., 64 (8), in press.
[6] J. Tauc, R. Grigorovici, A. Vancu, Optical properties and electronic structure ofamorphous germanium, Phys. Status Solidi 15 (1966) 627–637.
[7] P.L. Gentili, M. Penconi, F. Ortica, F. Cotana, F. Rossi, F. Elisei, Synergisticeffect in hydrogen production through water sonophotolysis catalyzed bynew La2xGa2yIn2(1�x�y)O3 solid solutions, Int. J. Hydrogen Energy 34 (2009)9042–9049.
[8] N. Imanaka, T. Masui, Y. Kato, Preparation of the cubic-type La2O3 phase bythermal decomposition of LaI3, J. Solid State Chem. 178 (2005) 395–398.
[9] C. Hu, H. Liu, W. Dong, Y. Zhang, G. Bao, C. Lao, Z.L. Wang, La(OH)3 andLa2O3 Nanobelts—synthesis and physical properties, Adv. Mater. 19 (2007)470–474.
[10] A. Kudo, I. Mikami, Photocatalytic activities and photophysical propertiesof Ga2�xInxO3 solid solution, J. Chem. Soc. Faraday Trans. 94 (1998)2929–2932.
[11] D.D. Edwards, P.E. Folkins, T.O. Mason, Phase equilibria in the Ga2O3–In2O3
System, J. Am. Ceram. Soc. 80 (1997) 253–257.[12] P.D.C. King, T.D. Veal, F. Fuchs, Ch.Y. Wang, D.J. Payne, A. Bourlange, H. Zhang,
G.R. Bell, V. Cimalla, O. Ambacher, R.G. Egdell, F. Bechstedt, C.F. McConville,Band gap, electronic structure, and surface electron accumulation of cubicand rhombohedral In2O3, Phys. Rev. B 79 (2009) 205211–205221.
[13] D.E. Scaife, Oxide semiconductors in photoelectrochemical conversion ofsolar energy, Sol. Energy 25 (1980) 41–54.
[14] P. Datta, P. Majewski, F. Aldinger, Structural studies of Sr- and Mg-dopedLaGaO3, J. Alloys Compd. 438 (2007) 232–237.
[15] M. Zinkevich, S. Geupel, F. Aldinger, A. Durygin, S.K. Saxena, M. Yang, Z.-K. Liu,Phase diagram and thermodynamics of the La2O3–Ga2O3 system revisited, J.Phys. Chem. Solids 67 (2006) 1901–1907.
[16] E- Ruiz-Trejo, G. Tavizon, A. Arroyo-Landeros, Structure, point defects and ionmigration in LaInO3, J. Phys. Chem. Solids 64 (2003) 515–521.
[17] H.M. Park, H.J. Lee, S.H. Park, H.I. Yoo, Lanthanum indium oxide from X-raypowder diffraction, Acta Crystallogr. C59 (2003) il31-il32.
[18] C. Vigreux, L. Binet, D. Gourier, B. Piriou, Formation by laser impact ofconducting b-Ga2O3–In2O3 solid solutions with composition gradients, J.Solid State Chem. 157 (2001) 94–101.
[19] A.A. Kharlamov, R.M. Almeida, J. Heo, Vibrational spectra and structure ofheavy metal oxide glasses, J. Non-Cryst. Solids 202 (1996) 233–240.
[20] D. Dohy, G. Lucazeau, A. Revcolevschi, Raman spectra and valence force fieldof single-crystalline b Ga2O3, J. Solid State Chem. 45 (1982) 180–192.
[21] N. Lakshminarasimhan, U.V. Varadaraju, Luminescent host lattices, LaInO3
and LaGaO3—a reinvestigation of luminescence of d10 metal ions, Mater. Res.Bull. 41 (2006) 724–731.
[22] V.I. Vasyltsiv, Ya.I. Rym, Ya.M. Zakharko, Optical absorption and photo-conductivity at the band edge of b-Ga2�xInxO3, Phys. Status Solidi B 195(1996) 653–658.
Copyright © 2022 FDOKUMEN