Structural and Geomorphological Aspects of the Kat Landslides (Tokat—Turkey) and Susceptibility...
12
Introduction Kat County is located in the slope of a hilly region 14 km NW of Tokat (Turkey) (Fig. 1). It is located on the side of a mountain along the North Anatolian Fault Zone. Rainfall is the significant source of water in the study area, and it is the most important element in the hydrological cycle. This area receives a mean annual rainfall of 396 mm. The minimum recorded value was 5.3 mm and the maximum, which was recorded in the wet season, was 55.4 mm. Meteorological records showed that the mean maximum temperature in August was 30.7ŶC, the mean minimum temperature was re- corded in December and was )0.4ŶC. The annual mean value of temperature was 13.1ŶC (Table 1). The study area was divided into the two parts, namely, down Kat County and upper Kat County. Upper Kat County is nearer the hills, and down Kat County is lo- cated in the plains of the Yesilirmak river, having slopes ranging between 0 and 5%. In the upper Kat, the slopes change from 5 to 45%, and have very steep topography, especially in the northern part of the county (Fig. 2). This paper describes and analyses the results of the detailed study of the landslides in the Kat County of Is ßık Yilmaz Mustafa Yildirim Structural and geomorphological aspects of the Kat landslides (Tokat—Turkey) and susceptibility mapping by means of GIS Received: 25 February 2005 Accepted: 20 September 2005 Published online: 17 November 2005 ȑ Springer-Verlag 2005 Abstract Kat County, which is lo- cated in a slope of hilly region and constructed in the side of a moun- tain along the North Anatolian Fault Zone, is frequently subject to landslides. The slides occur during periods of heavy rainfall, and these events cause destruction to property, roads, agricultural lands and build- ings. In the last few decades, a lot of houses and buildings have been damaged and destroyed. Settlement areas have remained evacuated for a long time. The slope instabilities in the study area are a complex land- slide extending from north to south containing a lot of landslides. Field investigations, interpretation of aer- ial photography, analyses of geo- logical data and laboratory tests suggest that some factors have acted together on the slopes to cause the sliding. In the wet season, the slopes became saturated. As the saturation of the earth material on the slope causesa rise in water pressure, the shear strength (resisting forces) de- creases and the weight (driving for- ces) increases; thus, the net effect was to lower the safety factor. Pre- vious failures have affected the rock mass, leading to the presence of al- ready sheared surfaces at residual strengths. The relation between the joint planes and the instability of the slope in the study area was discussed and it was found that the potential slope instabilities are mainly in the directions of NW–SE, NE–SW and N–S. The landslide susceptibility map obtained by using the geo- graphical information system showed that a large area is suscep- tible and prone to landslides in the northern part of the study area. Keywords GIS Æ Landslide Æ North Anatolian fault Æ Susceptibility Æ Tectonic Environ Geol (2006) 50: 461–472 DOI 10.1007/s00254-005-0107-y ORIGINAL ARTICLE I. Yilmaz (&) Æ M. Yildirim Department of Geology, Faculty of Engineering, Cumhuriyet University, 58140 Sivas, Turkey E-mail: [email protected] Tel.: +90-346-2191010 Fax: +90-346-2191171
-
Upload
independent -
Category
Documents
-
view
1 -
download
0
Transcript of Structural and Geomorphological Aspects of the Kat Landslides (Tokat—Turkey) and Susceptibility...
Introduction
Kat County is located in the slope of a hilly region14 km NW of Tokat (Turkey) (Fig. 1). It is located onthe side of a mountain along the North Anatolian FaultZone. Rainfall is the significant source of water in thestudy area, and it is the most important element in thehydrological cycle. This area receives a mean annualrainfall of 396 mm. The minimum recorded value was5.3 mm and the maximum, which was recorded in thewet season, was 55.4 mm. Meteorological recordsshowed that the mean maximum temperature in August
was 30.7�C, the mean minimum temperature was re-corded in December and was )0.4�C. The annual meanvalue of temperature was 13.1�C (Table 1).
The study area was divided into the two parts, namely,down Kat County and upper Kat County. Upper KatCounty is nearer the hills, and down Kat County is lo-cated in the plains of the Yesilirmak river, having slopesranging between 0 and 5%. In the upper Kat, the slopeschange from 5 to 45%, and have very steep topography,especially in the northern part of the county (Fig. 2).
This paper describes and analyses the results of thedetailed study of the landslides in the Kat County of
Is�ık Yilmaz
Mustafa YildirimStructural and geomorphological aspectsof the Kat landslides (Tokat—Turkey)and susceptibility mapping by means of GIS
Received: 25 February 2005Accepted: 20 September 2005Published online: 17 November 2005� Springer-Verlag 2005
Abstract Kat County, which is lo-cated in a slope of hilly region andconstructed in the side of a moun-tain along the North AnatolianFault Zone, is frequently subject tolandslides. The slides occur duringperiods of heavy rainfall, and theseevents cause destruction to property,roads, agricultural lands and build-ings. In the last few decades, a lot ofhouses and buildings have beendamaged and destroyed. Settlementareas have remained evacuated for along time. The slope instabilities inthe study area are a complex land-slide extending from north to southcontaining a lot of landslides. Fieldinvestigations, interpretation of aer-ial photography, analyses of geo-logical data and laboratory testssuggest that some factors have actedtogether on the slopes to cause thesliding. In the wet season, the slopesbecame saturated. As the saturationof the earth material on the slope
causesa rise in water pressure, theshear strength (resisting forces) de-creases and the weight (driving for-ces) increases; thus, the net effectwas to lower the safety factor. Pre-vious failures have affected the rockmass, leading to the presence of al-ready sheared surfaces at residualstrengths. The relation between thejoint planes and the instability of theslope in the study area was discussedand it was found that the potentialslope instabilities are mainly in thedirections of NW–SE, NE–SW andN–S. The landslide susceptibilitymap obtained by using the geo-graphical information systemshowed that a large area is suscep-tible and prone to landslides in thenorthern part of the study area.
Keywords GIS Æ Landslide Æ NorthAnatolian fault Æ Susceptibility ÆTectonic
Environ Geol (2006) 50: 461–472DOI 10.1007/s00254-005-0107-y ORIGINAL ARTICLE
I. Yilmaz (&) Æ M. YildirimDepartment of Geology,Faculty of Engineering,Cumhuriyet University,58140 Sivas, TurkeyE-mail: [email protected].: +90-346-2191010Fax: +90-346-2191171

Tokat (Turkey), based on field and laboratory mea-surements and the monitoring of the slide area. It hasbeen recognized that the Kat County is frequently sub-ject to landslides. The slides occur during periods ofheavy rainfall, and these events cause destruction toproperty, roads, agricultural lands and buildings. In thelast few decades, a lot of houses and buildings have beendamaged and destroyed. Settlement areas have remainedevacuatedfor a long time.
Movement of the Kat County was caused by reacti-vation of the pre-existing slides or activation of recentslides. Clays in the slip surfaces are highly plastic, havehigh swelling potential and active containing the smectite.
Also, clayey debris material in the landslide area acts likea fluid when it is saturated with water in the rainy seasons.
Geological framework and tectonic setting
Stratigraphical geology
The study area encompasses four units ranging in agefrom Triassic to Quaternary. From the oldest to theyoungest, they are: the Triassic Tokat metamorphics,Eocene sedimentary series, alluvium and debris, respec-tively (Fig. 3).
Fig. 1 Location map of thestudy area
Table 1 Meteorological data
Jan Feb Mar April May June July Aug Sept Oct Nov Dec AMV
Temperature (�C) 3.0 4.6 7.3 12.5 17.6 21.3 23.3 23.0 19.4 13.5 8.5 4.1 13.1Rainfall (mm) 50.5 37.9 41.8 40.8 55.4 36.3 9.4 5.3 16.2 24.9 38.9 38.6 396.0
AMV annual mean value
Fig. 2 Topography of the study area
462
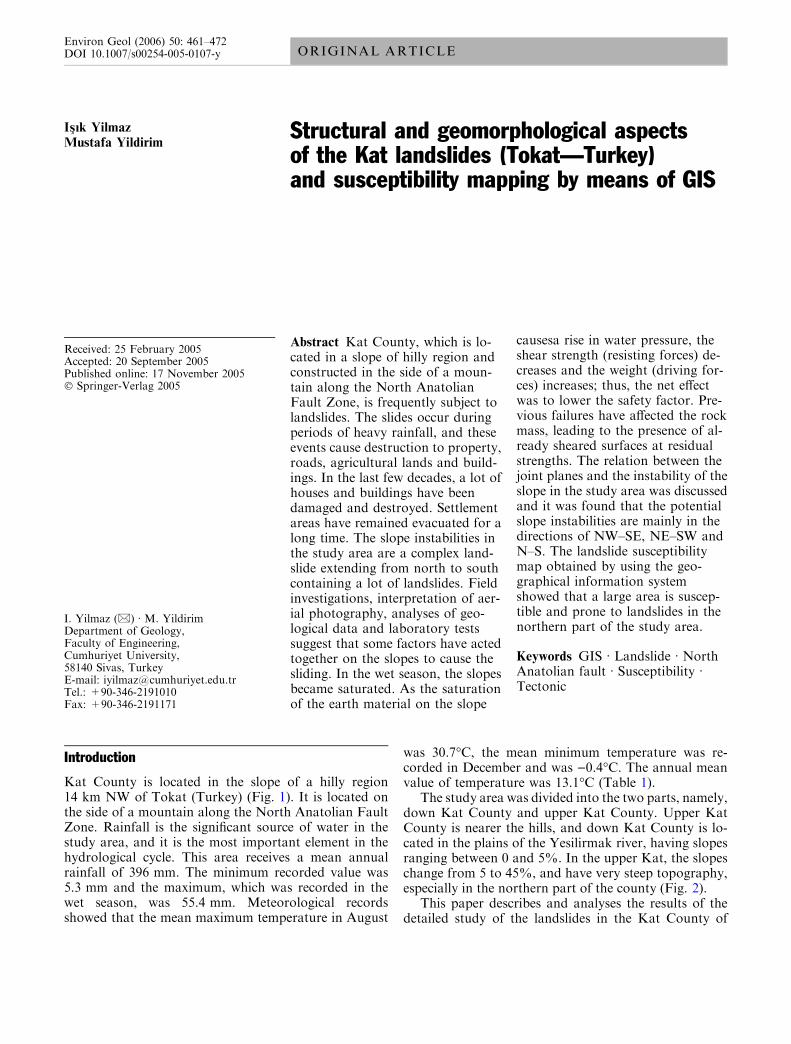
Crushed and jointed, greyish green Tokat metamor-phics crops out widespread in the northern part of thestudy area. This unit consists of metabasalts and is of the
Triassic age. Yellowish brown, bedded sedimentaryseries occurs as an alternation of conglomerates, sand-stone and claystone.
Fig. 3 Geological map of the study area
463
The age of this unit is Eocene, and overlies the Tokatmetamorphics with an unconformity. The sedimentaryseries extensively outcrops in the middle part of thestudy area, having a bedding plane of 15/30. Red-col-oured clays derived from this unit were observed over-lying the sedimentary series, and some of the landslidesoccur in these clayey levels.
Alluvium crops out most extensively in the southernpart of the study area. They consist of gravel, sand, siltand clay. The alluvium consists of stratified material ofheterogeneous grain sizes, derived from various geo-
logical units in the vicinity. Their continuity cannot beestablished laterally and vertically. Alluvium is alsocovered by thick (�1–1.5 m) organic topsoil.
There is a widespread cropping out of debrismaterials in the central part of the study area, and itlies from north to south. They comprise materialshaving varied grain-size from clay to block especiallyderived from the metamorphic units in the vicinity.Debris materials having a thickness of 30 m have apoor grading, and grains and block were angular andsemi-rounded.
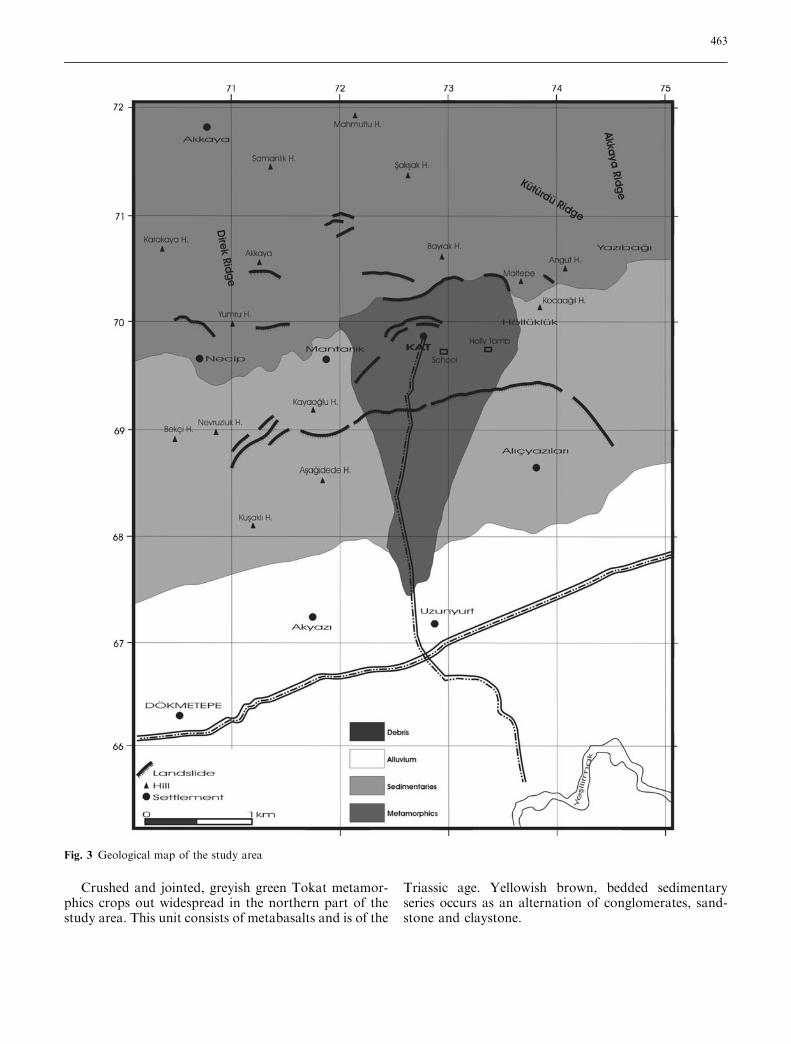
Fig. 4 Tectonic situation of the study area and its environment
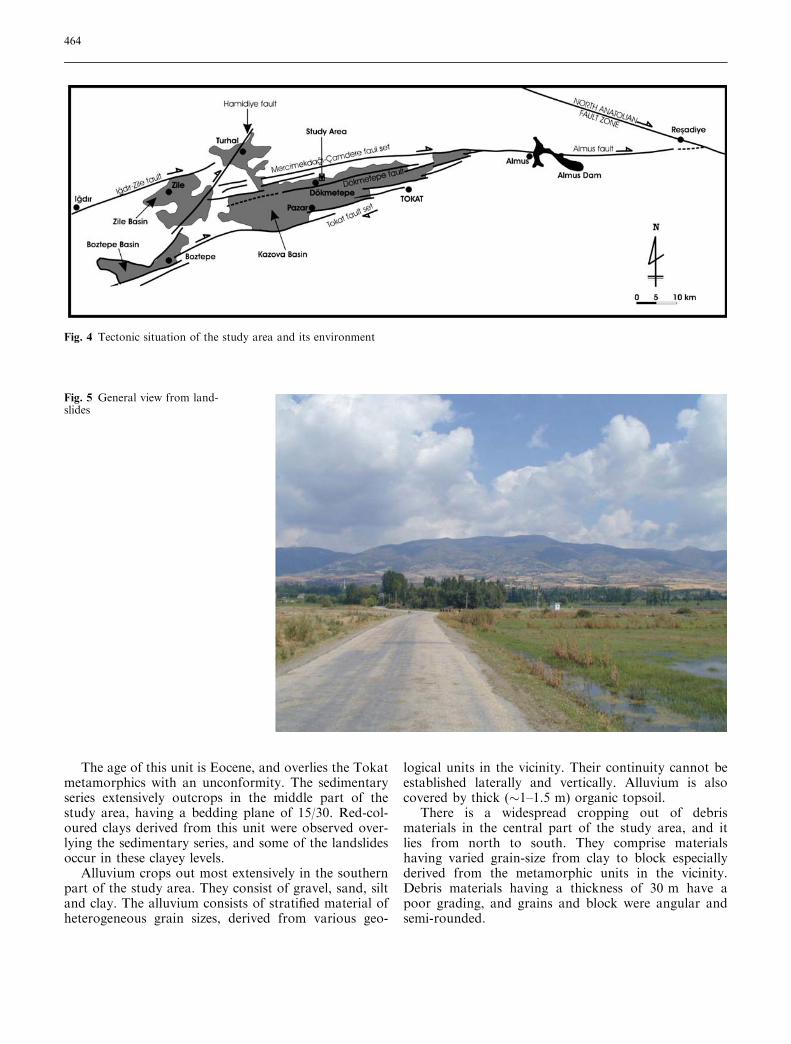
Fig. 5 General view from land-slides
464
Tectonic setting
The Kazova basin is a 0.7–10-km-wide, 60-km-long,active, right-lateral strike-slip depression with its longaxis oriented in a 077� direction. The basin is a typicalwedge-shaped depression along the Almus Fault zone(AFZ) and becomes wider from east to west. AFZ hasmostly an E–W-trending, single fault trace character forabout 50 km from the southeast of Res�adiye in the east,where it branches off the North Anatolian Fault MasterStrand, and Bakımlı village in the west. AFZ bifurcatesfrom the west of Bakımlı village into numerous parallelto subparallel smaller fault segments resulting in a sim-ple horse-tail strike-slip fault pattern. The kazova basinis bounded by the Mercimekdagı-Camdere fault set onthe north and the Tokat fault set in the south, while theactive Dokmetepe fault, the master strand of the AFZ,lies within the basin. The two fault sets control and
bound both the margins, the Turhal block in the south,and are composed of numerous parallel to subparallelfault segments. The ground ruptures of the Erzincanearthquake of 1939 moved the fault sets, and thesouthern blocks were moved relatively downwards(Bozkurt and Kocyigit 1996). The landslide in the KatCounty occurred between the Mercimekdagı-Camderefault set in the north and the Dokmetepe fault in thesouth (Fig. 4).
Mercimekdagı-Camdere fault set
The Mercimekdagı-Camdere fault set is approximately70 km long and 4 km wide. It is composed of numerousparallel to subparallel fault segments together withsynthetic R-shears and antithetic R¢-shears, which areoblique to the general trend of the fault set. The fault setclearly defines and controls the northern margin of theKazova basin.
Dokmetepe fault
The Dokmetepe fault is composed of 075� trending anden-echelon fault segments and is well exposed at thenorthern margin of the Kazova basin. The groundruptures of the 1939 Erzincan earthquake also movedthis fault. Although it is not in the catalogues, this faultwas reactivated two or three times in the past (Bozkurtand Kocyigit 1995). The activity of the Dokmetepe faultis indicated by a active tectonic creep along which aconcrete bridge is dextrally offset by about 1.6 cm (Bo-zkurt and Kocyigit 1996).
The ground ruptures of the 1939 Erzincan earth-quake affected the following fault segments: the Merci-
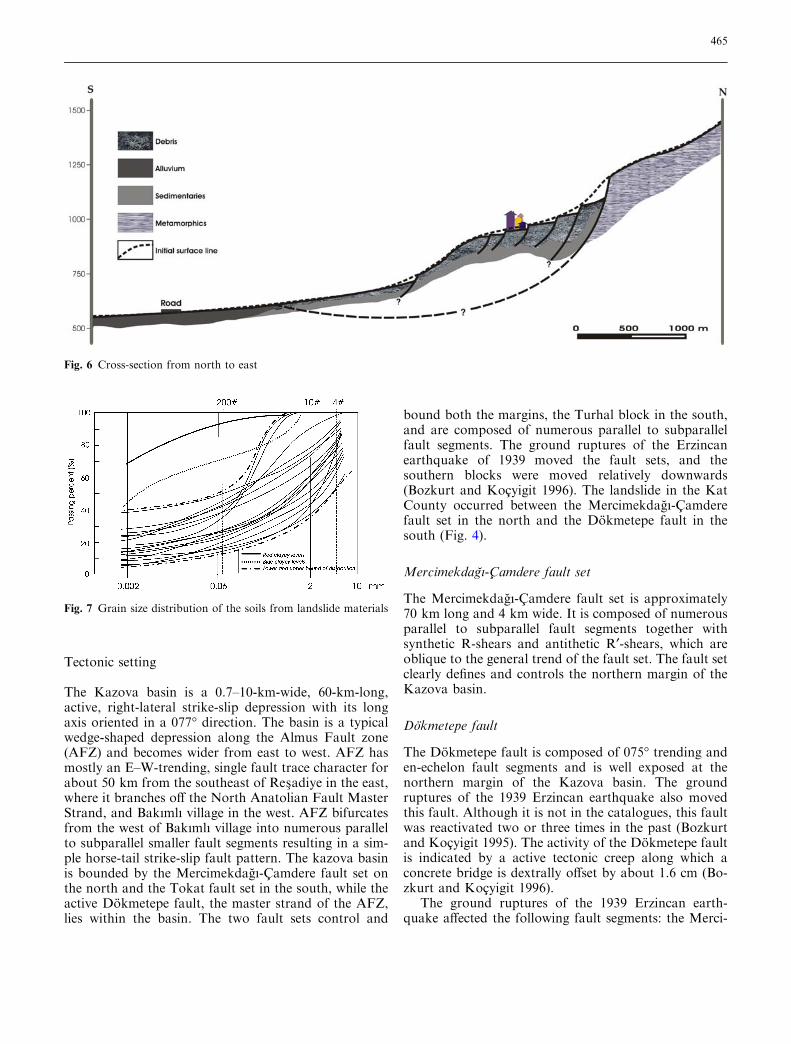
Fig. 6 Cross-section from north to east
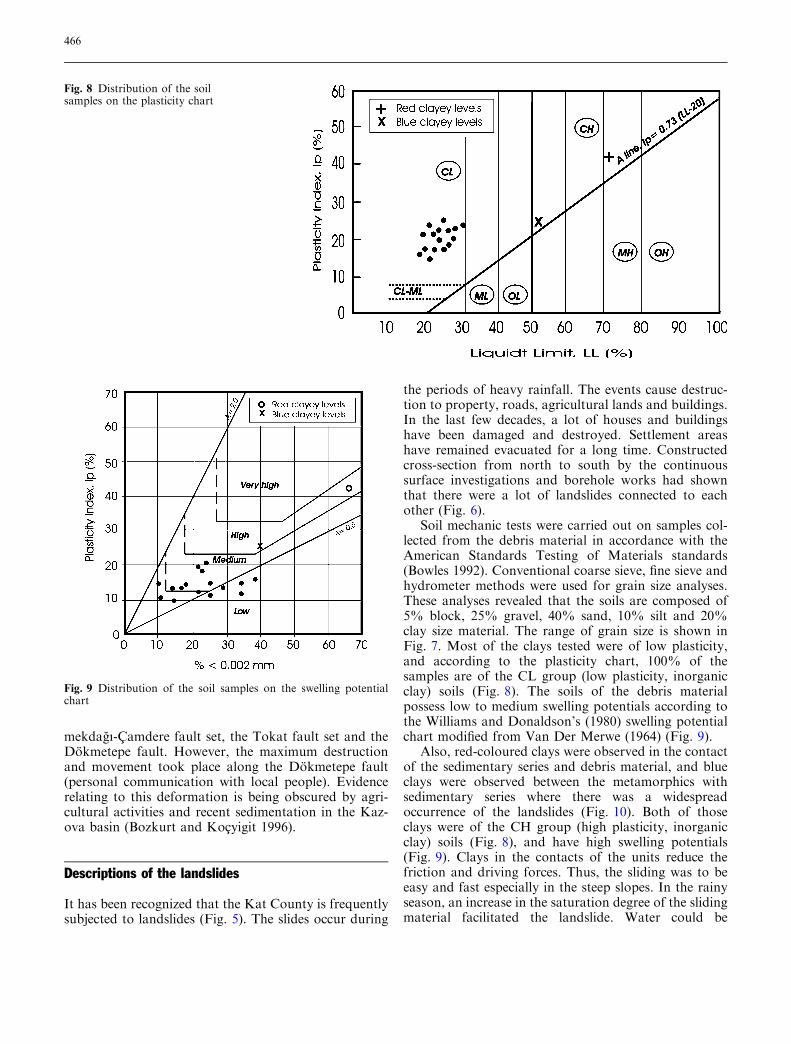
Fig. 7 Grain size distribution of the soils from landslide materials
465
mekdagı-Camdere fault set, the Tokat fault set and theDokmetepe fault. However, the maximum destructionand movement took place along the Dokmetepe fault(personal communication with local people). Evidencerelating to this deformation is being obscured by agri-cultural activities and recent sedimentation in the Kaz-ova basin (Bozkurt and Kocyigit 1996).
Descriptions of the landslides
It has been recognized that the Kat County is frequentlysubjected to landslides (Fig. 5). The slides occur during
the periods of heavy rainfall. The events cause destruc-tion to property, roads, agricultural lands and buildings.In the last few decades, a lot of houses and buildingshave been damaged and destroyed. Settlement areashave remained evacuated for a long time. Constructedcross-section from north to south by the continuoussurface investigations and borehole works had shownthat there were a lot of landslides connected to eachother (Fig. 6).
Soil mechanic tests were carried out on samples col-lected from the debris material in accordance with theAmerican Standards Testing of Materials standards(Bowles 1992). Conventional coarse sieve, fine sieve andhydrometer methods were used for grain size analyses.These analyses revealed that the soils are composed of5% block, 25% gravel, 40% sand, 10% silt and 20%clay size material. The range of grain size is shown inFig. 7. Most of the clays tested were of low plasticity,and according to the plasticity chart, 100% of thesamples are of the CL group (low plasticity, inorganicclay) soils (Fig. 8). The soils of the debris materialpossess low to medium swelling potentials according tothe Williams and Donaldson’s (1980) swelling potentialchart modified from Van Der Merwe (1964) (Fig. 9).
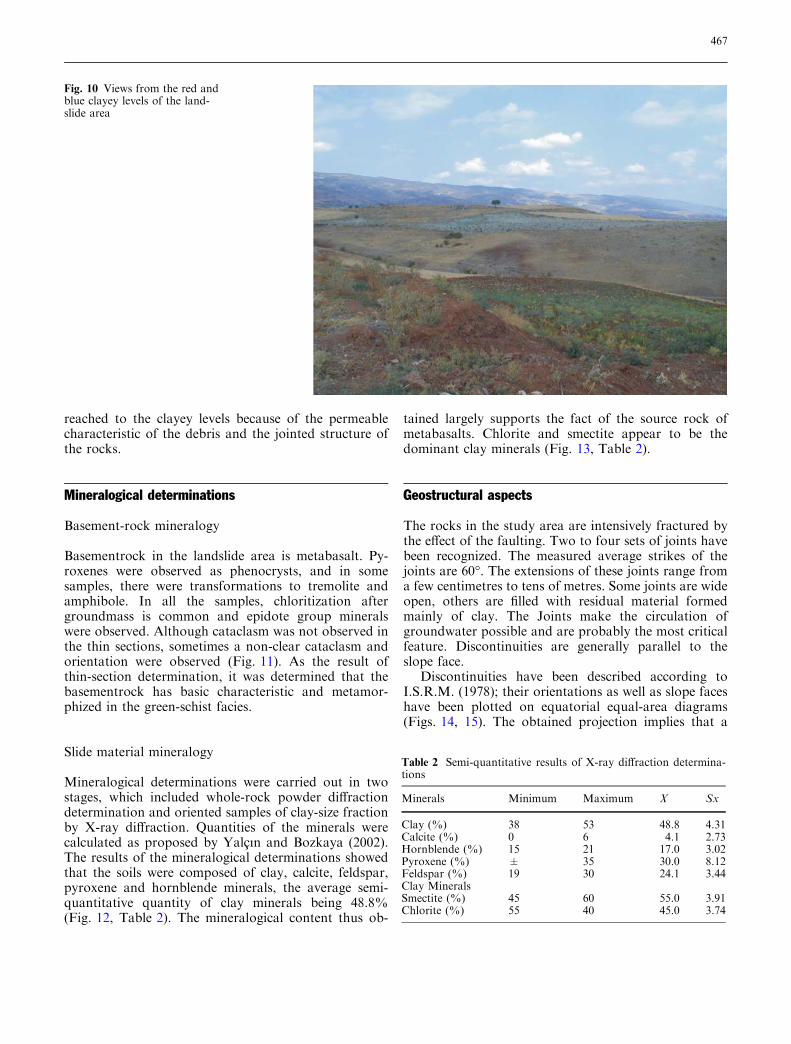
Also, red-coloured clays were observed in the contactof the sedimentary series and debris material, and blueclays were observed between the metamorphics withsedimentary series where there was a widespreadoccurrence of the landslides (Fig. 10). Both of thoseclays were of the CH group (high plasticity, inorganicclay) soils (Fig. 8), and have high swelling potentials(Fig. 9). Clays in the contacts of the units reduce thefriction and driving forces. Thus, the sliding was to beeasy and fast especially in the steep slopes. In the rainyseason, an increase in the saturation degree of the slidingmaterial facilitated the landslide. Water could be
Fig. 8 Distribution of the soilsamples on the plasticity chart
Fig. 9 Distribution of the soil samples on the swelling potentialchart
466
reached to the clayey levels because of the permeablecharacteristic of the debris and the jointed structure ofthe rocks.
Mineralogical determinations
Basement-rock mineralogy
Basementrock in the landslide area is metabasalt. Py-roxenes were observed as phenocrysts, and in somesamples, there were transformations to tremolite andamphibole. In all the samples, chloritization aftergroundmass is common and epidote group mineralswere observed. Although cataclasm was not observed inthe thin sections, sometimes a non-clear cataclasm andorientation were observed (Fig. 11). As the result ofthin-section determination, it was determined that thebasementrock has basic characteristic and metamor-phized in the green-schist facies.
Slide material mineralogy
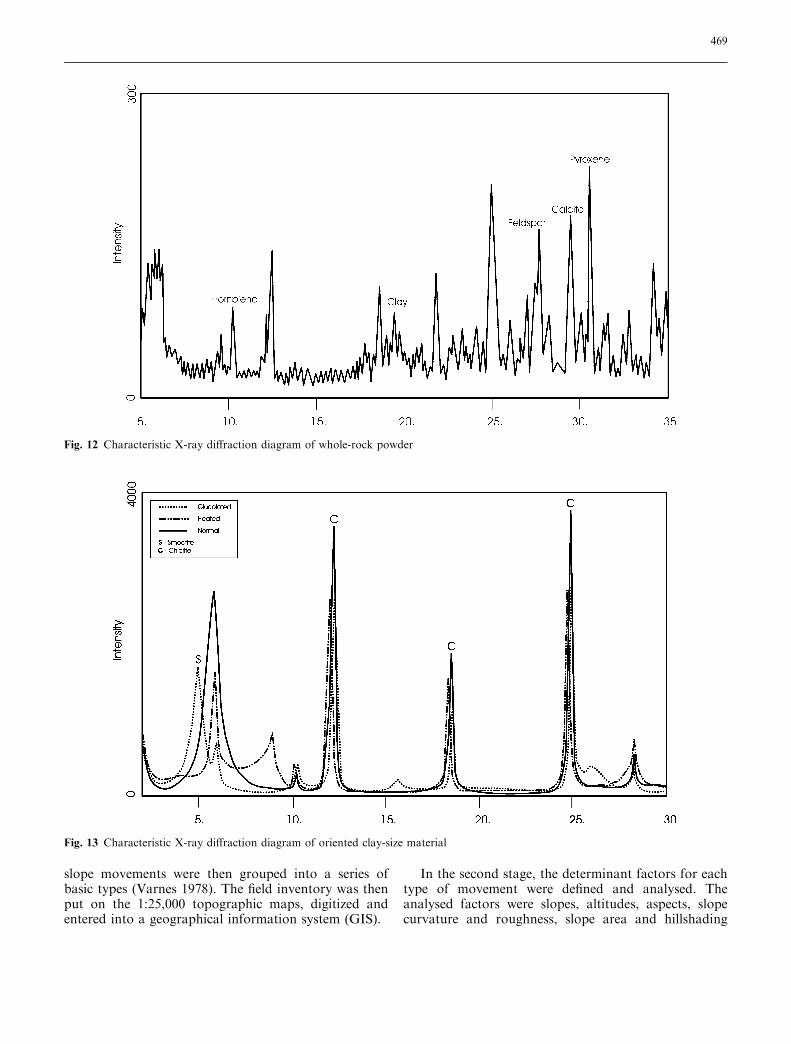
Mineralogical determinations were carried out in twostages, which included whole-rock powder diffractiondetermination and oriented samples of clay-size fractionby X-ray diffraction. Quantities of the minerals werecalculated as proposed by Yalcın and Bozkaya (2002).The results of the mineralogical determinations showedthat the soils were composed of clay, calcite, feldspar,pyroxene and hornblende minerals, the average semi-quantitative quantity of clay minerals being 48.8%(Fig. 12, Table 2). The mineralogical content thus ob-
tained largely supports the fact of the source rock ofmetabasalts. Chlorite and smectite appear to be thedominant clay minerals (Fig. 13, Table 2).
Geostructural aspects
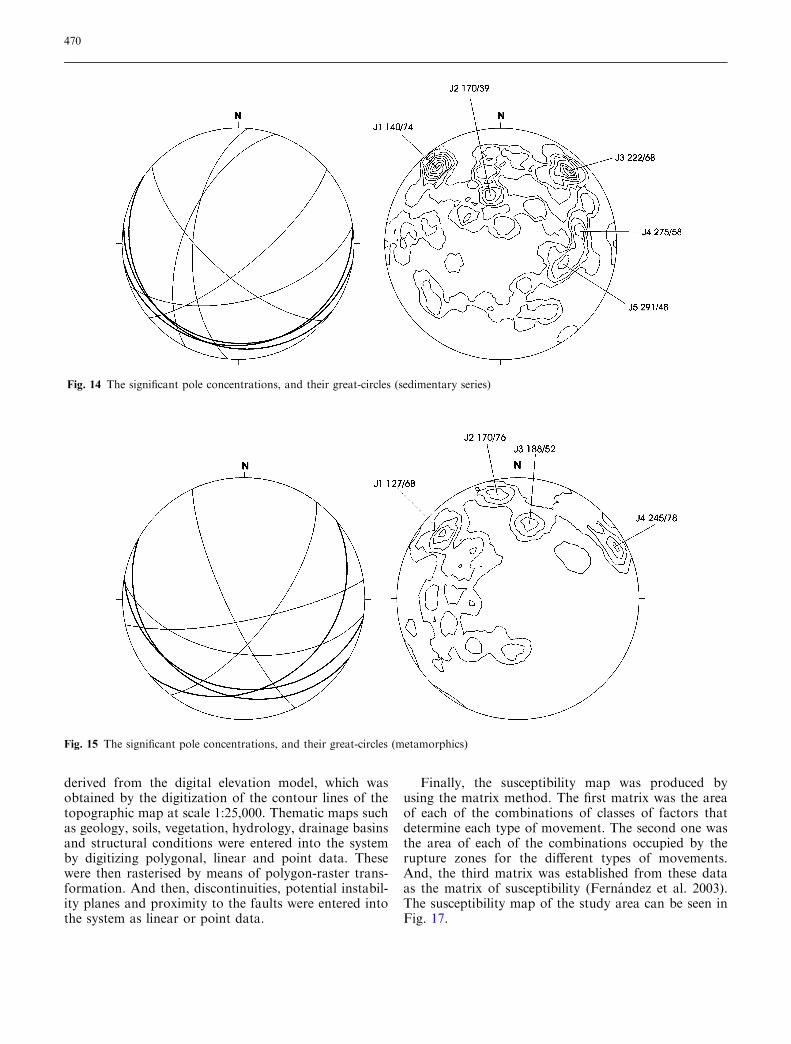
The rocks in the study area are intensively fractured bythe effect of the faulting. Two to four sets of joints havebeen recognized. The measured average strikes of thejoints are 60�. The extensions of these joints range froma few centimetres to tens of metres. Some joints are wideopen, others are filled with residual material formedmainly of clay. The Joints make the circulation ofgroundwater possible and are probably the most criticalfeature. Discontinuities are generally parallel to theslope face.
Discontinuities have been described according toI.S.R.M. (1978); their orientations as well as slope faceshave been plotted on equatorial equal-area diagrams(Figs. 14, 15). The obtained projection implies that a
Fig. 10 Views from the red andblue clayey levels of the land-slide area
Table 2 Semi-quantitative results of X-ray diffraction determina-tions
Minerals Minimum Maximum X Sx
Clay (%) 38 53 48.8 4.31Calcite (%) 0 6 4.1 2.73Hornblende (%) 15 21 17.0 3.02Pyroxene (%) ± 35 30.0 8.12Feldspar (%) 19 30 24.1 3.44Clay MineralsSmectite (%) 45 60 55.0 3.91Chlorite (%) 55 40 45.0 3.74
467

number of significant pole concentrations are presentand indicates the range of strikes and dips of the jointsas well as their mean directions.
According to Hutchinson (1988) and Goodman(1989), the presence of the fractures, joints, their exten-sions, attitudes and their intersections all affect the sta-bility of the slope in an area because they form pre-existing surfaces along which sliding may take place(Abderahman 1998). The orientations of the joints andthe slope faces were presented as great circles. Thesecircles show different intersections between themselves.They represent the intersection of joints. These planesinfluence the stability of the slope.
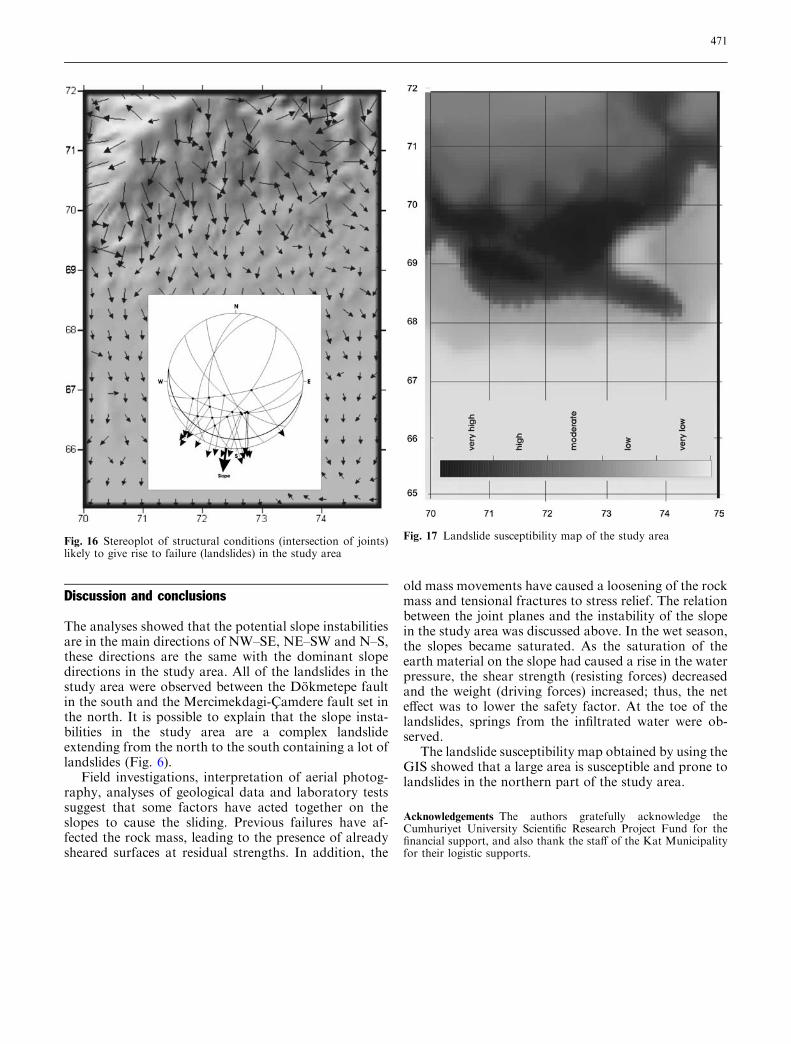
The connection between the dominant strike of dis-continuities and the dominant slope directions wererepresented in Fig. 16. Different intersections between
fractures indicated some potential failure directions ofNE–SW, NW–SE and N–S. These directions are similarto the principle slope directions in the study area. In thekinematical analyses, geometrical conditions were satis-fied according to Hoek and Bray (1981).
Landslide susceptibility mapping
The methodology of susceptibility mapping included themaking, the inventory and the database of slope move-ments, analyses of the factors that determine suscepti-bility, and the production of the susceptibility maps.
First, the slope movements were identified accordingto their mechanism, involved materials and sizes by theuse of aerial photography and ground surveys. Identified
Fig. 11 Thin sections of themetamorphics
468
slope movements were then grouped into a series ofbasic types (Varnes 1978). The field inventory was thenput on the 1:25,000 topographic maps, digitized andentered into a geographical information system (GIS).
In the second stage, the determinant factors for eachtype of movement were defined and analysed. Theanalysed factors were slopes, altitudes, aspects, slopecurvature and roughness, slope area and hillshading
Fig. 12 Characteristic X-ray diffraction diagram of whole-rock powder
Fig. 13 Characteristic X-ray diffraction diagram of oriented clay-size material
469
derived from the digital elevation model, which wasobtained by the digitization of the contour lines of thetopographic map at scale 1:25,000. Thematic maps suchas geology, soils, vegetation, hydrology, drainage basinsand structural conditions were entered into the systemby digitizing polygonal, linear and point data. Thesewere then rasterised by means of polygon-raster trans-formation. And then, discontinuities, potential instabil-ity planes and proximity to the faults were entered intothe system as linear or point data.
Finally, the susceptibility map was produced byusing the matrix method. The first matrix was the areaof each of the combinations of classes of factors thatdetermine each type of movement. The second one wasthe area of each of the combinations occupied by therupture zones for the different types of movements.And, the third matrix was established from these dataas the matrix of susceptibility (Fernandez et al. 2003).The susceptibility map of the study area can be seen inFig. 17.
Fig. 14 The significant pole concentrations, and their great-circles (sedimentary series)
Fig. 15 The significant pole concentrations, and their great-circles (metamorphics)
470
Discussion and conclusions
The analyses showed that the potential slope instabilitiesare in the main directions of NW–SE, NE–SW and N–S,these directions are the same with the dominant slopedirections in the study area. All of the landslides in thestudy area were observed between the Dokmetepe faultin the south and the Mercimekdagi-Camdere fault set inthe north. It is possible to explain that the slope insta-bilities in the study area are a complex landslideextending from the north to the south containing a lot oflandslides (Fig. 6).
Field investigations, interpretation of aerial photog-raphy, analyses of geological data and laboratory testssuggest that some factors have acted together on theslopes to cause the sliding. Previous failures have af-fected the rock mass, leading to the presence of alreadysheared surfaces at residual strengths. In addition, the
old mass movements have caused a loosening of the rockmass and tensional fractures to stress relief. The relationbetween the joint planes and the instability of the slopein the study area was discussed above. In the wet season,the slopes became saturated. As the saturation of theearth material on the slope had caused a rise in the waterpressure, the shear strength (resisting forces) decreasedand the weight (driving forces) increased; thus, the neteffect was to lower the safety factor. At the toe of thelandslides, springs from the infiltrated water were ob-served.
The landslide susceptibility map obtained by using theGIS showed that a large area is susceptible and prone tolandslides in the northern part of the study area.
Acknowledgements The authors gratefully acknowledge theCumhuriyet University Scientific Research Project Fund for thefinancial support, and also thank the staff of the Kat Municipalityfor their logistic supports.
Fig. 16 Stereoplot of structural conditions (intersection of joints)likely to give rise to failure (landslides) in the study area
Fig. 17 Landslide susceptibility map of the study area
471
References
Abderahman NB (1998) Landslides at km56.4 along the Irbid–Amman highway,Northern Jordan. AAPG Div EnvironGeosci 5(3):103–113
Bowles JE (1992) Engineering properties ofsoils and their measurement. McGraw-Hill Inc., New Jersey, pp 241
Bozkurt E, Kocyigit A (1995) Almust faultzone: its age, total offset and relation tothe North Anatolian fault zone. Turk JEarth Sci 4:93–104
Bozkurt E, Kocyigit A (1996) The Kazovabasin: an active negative flower struc-ture on the Almus Fault Zone, a splayfault system of the North AnatolianFault Zone, Turkey. Tectonophysics265:239–254
Fernandez T, Irigaray C, Hamdouni RE,Chacon J (2003) Methodology forlandslide susceptibility mapping bymeans of a GIS. Application to theContraviesa Area (Granada, Spain).Nat Hazards 30:297–308
Goodman RE (1989) Introduction to rockmechanics, 2nd edn. Wiley, New York
Hoek E, Bray J (1981) Rock slope engi-neering. Institution of mining andmetalurgy, London
Hutchinson JN (1988) General report:morphological and geotechnicalparameters of landslides in relation togeology and hydrogeology. Landslides1:3–35
I.S.R.M. (1978) Suggested methods for thequantitative description of the discon-tinuities in rock masses. Int J RockMech Min Sci Geomech Abstr 15:319–368
Van Der Merwe DH (1964) The predictionof heave from the plasticity index andpercentage clay fraction of soils. CivilEng S Afr 6(6):103–106
Varnes DJ (1978) Slope movement typesand processes. In: Schuster RL, KrizekRJ (eds) Landslides analysis and con-trol. Special report, vol 176. Transpor-taion Research Board, NationalAcademy of Sciences, New York, pp12–33
Williams AAB, Donaldson G (1980)Building on expansive soils in SouthAfrica. In: Proceedings of 4th Interna-tional Conference, vol 2. ExpansiveSoils, Denver, pp 234–238
Yalcın H, Bozkaya O (2002) Hekimhan(Malatya) cevresindeki Ust Kretaseyas�lı volkaniklerin alterasyon mineral-ojisi ve jeokimyası: denizsuyu-kayacetkiles�imine bir ornek. C.U. Muhen-dislik Fakultesi Dergisi Seri-A Yerbi-limleri 19:81–98
472