Strongly magnetic soil developed on a non-magnetic rock basement: a case study from NW Bulgaria
20
Stud. Geophys. Geod., 55 (2011), 697716, DOI: 10.1007/s11200-009-0489-5 697 © 2011 Inst. Geophys. AS CR, Prague Strongly magnetic soil developed on a non-magnetic rock basement: a case study from NW Bulgaria HANA GRISON 1 , EDUARD PETROVSKÝ 1 , NELI JORDANOVA 2 AND ALEŠ KAPIČKA 1 1 Institute of Geophysics, Acad. Sci. Czech Republic, Boční II/1401, 141 31 Prague 4, Czech Republic ([email protected], [email protected], [email protected]) 2 National Institute of Geophysics, Geodesy and Geography BAS, Acad. Bonchev Str., Bl.3, 1113 Sofia, Bulgaria ([email protected]) Received: June 17, 2009; Revised: November 22, 2010; Accepted: February 25, 2011 ABSTRACT The enhanced magnetic susceptibility of modern soils is assumed to have several reasons including, e.g., weathering of an iron-rich geological basement, natural fires, bacterial processes and atmospheric deposition of anthropogenic particles. We report on a case where none of the above sources of magnetic enhancement is evident: a modern soil with high magnetic susceptibility over the whole soil profile, developed on non- magnetic limestones, in an area with no industrial activities. The surface magnetic susceptibility varies from 60 to 110 10 5 SI, while that of the rock basement is nearly zero. Moreover, significant frequency-dependent magnetic susceptibility (> 12%) suggests that superparamagnetic secondary magnetite/maghemite plays an important role. Possible mechanisms, responsible for this magnetic enhancement, are discussed. K e y w o r d s : magnetic susceptibility, magnetite, soil, pollution, climate, limestone, Fe-ooids 1. INTRODUCTION Soils are widely studied for their specific magnetic properties (e.g., Mullins, 1977; Evans and Heller, 2003). Among the magnetic properties, magnetic susceptibility (MS) is often used as the primary parameter, due to the simplicity, rapidness and low costs of the measurements. Moreover, it can be measured in situ (e.g., Kapička et al., 1999, 2003; Boyko et al., 2004). Under specific conditions, a combination of magnetic methods/techniques is considered a very effective tool for evaluating industrial pollution in the environment. These methods are able to detect and characterize iron oxides and to assess their relative abundance and origin. The application of magnetic methods is closely connected with each particular site due to the source-specific properties of magnetic minerals (Fialová et al., 2006). In soils, generally three major mechanisms, responsible for increasing the MS, are known. The first mechanism is caused by the weathering of magnetically rich parent rocks, usually referred to as the lithogenic contribution; this mechanism has already been described by Le Borgne (1955).
Transcript of Strongly magnetic soil developed on a non-magnetic rock basement: a case study from NW Bulgaria

Stud. Geophys. Geod., 55 (2011), 697716, DOI: 10.1007/s11200-009-0489-5 697 © 2011 Inst. Geophys. AS CR, Prague
Strongly magnetic soil developed on a non-magnetic rock basement: a case study from NW Bulgaria
HANA GRISON1, EDUARD PETROVSKÝ1, NELI JORDANOVA2 AND ALEŠ KAPIČKA1
1 Institute of Geophysics, Acad. Sci. Czech Republic, Boční II/1401, 141 31 Prague 4, Czech
Republic ([email protected], [email protected], [email protected])
2 National Institute of Geophysics, Geodesy and Geography BAS, Acad. Bonchev Str., Bl.3, 1113 Sofia, Bulgaria ([email protected])
Received: June 17, 2009; Revised: November 22, 2010; Accepted: February 25, 2011
ABSTRACT
The enhanced magnetic susceptibility of modern soils is assumed to have several reasons including, e.g., weathering of an iron-rich geological basement, natural fires, bacterial processes and atmospheric deposition of anthropogenic particles. We report on a case where none of the above sources of magnetic enhancement is evident: a modern soil with high magnetic susceptibility over the whole soil profile, developed on non-magnetic limestones, in an area with no industrial activities. The surface magnetic susceptibility varies from 60 to 110 105 SI, while that of the rock basement is nearly zero. Moreover, significant frequency-dependent magnetic susceptibility (> 12%) suggests that superparamagnetic secondary magnetite/maghemite plays an important role. Possible mechanisms, responsible for this magnetic enhancement, are discussed.
Ke y wo rd s : magnetic susceptibility, magnetite, soil, pollution, climate, limestone,
Fe-ooids
1. INTRODUCTION
Soils are widely studied for their specific magnetic properties (e.g., Mullins, 1977; Evans and Heller, 2003). Among the magnetic properties, magnetic susceptibility (MS) is often used as the primary parameter, due to the simplicity, rapidness and low costs of the measurements. Moreover, it can be measured in situ (e.g., Kapička et al., 1999, 2003; Boyko et al., 2004). Under specific conditions, a combination of magnetic methods/techniques is considered a very effective tool for evaluating industrial pollution in the environment. These methods are able to detect and characterize iron oxides and to assess their relative abundance and origin. The application of magnetic methods is closely connected with each particular site due to the source-specific properties of magnetic minerals (Fialová et al., 2006). In soils, generally three major mechanisms, responsible for increasing the MS, are known. The first mechanism is caused by the weathering of magnetically rich parent rocks, usually referred to as the lithogenic contribution; this mechanism has already been described by Le Borgne (1955).

H. Grison et al.
698 Stud. Geophys. Geod., 55 (2011)
The second mechanism, typically represented by the accumulation of atmospherically deposited dust in top-soil layers, is related to various human activities. In many cases, the positive correlation between MS and heavy metal concentration can be used for environmental monitoring, provenance assessment and screening (e.g., Strzyszcz and Magiera, 1998; Lecoanet et al., 2001; Hanesch et al., 2003; Jordanova et al., 2003; Spassov et al., 2004; Spiteri et al., 2005; Davila et al., 2006; Magiera et al., 2008; Kapička et al., 2008).
The third contribution is associated with soil forming processes, in which, under specific conditions, very fine-grained magnetic minerals are formed through biogenic or biogenically-mediated processes. The bacterial mechanism is based on principles already observed by Blakemore (1975, 1982). Very tiny crystals of pure magnetite (e.g., Frankel and Blakemore, 1990; Hanzlik et al., 1996b; Hanesch and Petersen, 1999; Fortin and Langley, 2005; Posfai et al., 2006; Roh et al., 2006; Bharde et al., 2008) and/or greigite (e.g., Mann et al., 1990a; Heywood et al., 1990) are formed by magnetotactic bacteria. Bacterial activities can produce both single-domain (SD) and superparamagnetic (SP) magnetite, which may be responsible for the magnetic enhancement of soils. Significant contribution of SP magnetite can be easily assessed using measurements at two frequencies (Dearing at al., 1996). For example, Guyodo et al. (2006) reported on the magnetic enhancement of soil developed over loess in Alaska. The enhancement was partly due to SP magnetite. The authors suggested bacterially-mediated top-soil magnetite formation through the iron-reduction of iron hydroxides. Contrary to that, Dearing et al. (2001) failed to detect magnetotactic bacteria in magnetically enhanced British soils. A recent review of controling factors of soil magnetic susceptibility is provided by Blundell et al. (2009).
In this study, we report on the magnetic enhancement of soils at a locality, where the bedrock is composed of limestones, which are considered weakly magnetic with a near-zero magnetic susceptibility. However, the soils appear to exhibit a very high magnetic susceptibility, rather homogeneously distributed with depth down to about 1 m. Possible sources for the observed magnetic enhancement of these soils are discussed.
2. AREA DESCRIPTION
2 . 1 . L o c a t i o n a n d G e n e r a l C l i m a t i c C o n d i t i o n s
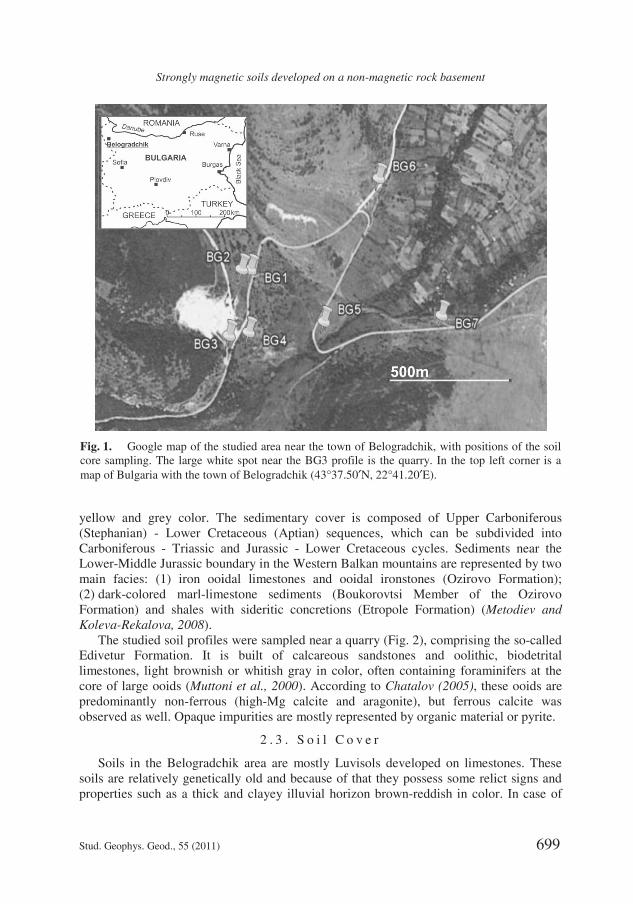
The studied area is situated in NW Bulgaria, 115 km north of Sofia, near the town of Belogradchik (43°37.50N, 22°41.20E, Vidin Region, Dimovo, Fig. 1). The altitude of the studied area is 345410 m a.s.l. There is neither heavy industry in the region, nor other important sources of pollution, which could supply significant amounts of anthropogenic iron oxides. According to official information from the Ministry of Environment and Water, a few forest fires occurred in the Belogradchik area in 20002001. The mean annual temperature is 10.0°C (Velev, 1990) and the mean annual precipitation is 694 mm (Koleva and Peneva, 1990).
2 . 2 . G e o l o g y
The geological background rocks in the studied area consist of limestones of Jurassic or Triassic age. The parent rock is outcropping in a large area; the limestone has white,
Strongly magn
Stud. Geophys. Geod., 55 (2011)
yellow and grey color. T(Stephanian) - Lower CreCarboniferous - Triassic aLower-Middle Jurassic boumain facies: (1) iron ooi(2) dark-colored marl-limFormation) and shales wiKoleva-Rekalova, 2008).
The studied soil profilesEdivetur Formation. It ilimestones, light brownish core of large ooids (Muttonpredominantly non-ferrousobserved as well. Opaque im
Soils in the Belogradchsoils are relatively geneticaproperties such as a thick
Fig. 1. Google map of the score sampling. The large whimap of Bulgaria with the town
netic soils developed on a non-magnetic rock basement
The sedimentary cover is composed of Upper Carbonetaceous (Aptian) sequences, which can be subdividand Jurassic - Lower Cretaceous cycles. Sediments nundary in the Western Balkan mountains are representedidal limestones and ooidal ironstones (Ozirovo Form
mestone sediments (Boukorovtsi Member of the Oth sideritic concretions (Etropole Formation) (Metod
s were sampled near a quarry (Fig. 2), comprising the ss built of calcareous sandstones and oolithic, bio or whitish gray in color, often containing foraminiferni et al., 2000). According to Chatalov (2005), these os (high-Mg calcite and aragonite), but ferrous calcmpurities are mostly represented by organic material or
2 . 3 . S o i l C o v e r
hik area are mostly Luvisols developed on limestonesally old and because of that they possess some relict siand clayey illuvial horizon brown-reddish in color. In
studied area near the town of Belogradchik, with positions ofite spot near the BG3 profile is the quarry. In the top left con of Belogradchik (43°37.50N, 22°41.20E).
699
niferous ded into near the d by two mation); Ozirovo
diev and
o-called odetrital rs at the
ooids are cite was pyrite.
s. These igns and case of
f the soil
orner is a

H. Grison et al.
700 Stud. Geophys. Geod., 55 (2011)
lack of erosion, the Luvisols in Bulgaria are fully developed, deep soils with an A-B-C solum varying in depth between 90100 cm and 150200 cm. Lessivage is the most important soil process which takes place in these soils. The Luvisols developed on limestones are characterized by the enhancement of illuvial horizons with montmorillonite - clay mineral with extensive Fe substitutions.
Our sampled profiles are classified as Orthic Luvisols (FAO, 2006). The soil profiles sampled in this study comprise only humic (A) horizon and the illuvial (B) horizon. In a quarry, which was abandoned in the time of this study, we could observe a system of veins containing many brown ferrous carbonate concretions. In the following, the soil profiles are divided into three zones: the top-, mid- and sub-soil part. The top-soil corresponds to the A horizon, the mid-soil corresponds to the transition between the A and B horizon and the sub-soil to the B horizon. The thickness of the soil cover varies from a few centimeters to a few meters.
3. METHODS
3 . 1 . S o i l S a m p l i n g , F i e l d M e a s u r e m e n t s
We measured the spatial distribution of the magnetic susceptibility of the top-soils over an area of about 1 km2 using a Bartington MS2D field loop according to the recommendations for magnetic susceptibility mapping (Schibler et al., 2002). Altogether 14 sites were measured. The vertical distribution of magnetic susceptibility was measured each 2 cm manually along profiles down to the C-horizon in 7 soil pits using the MS2F (Bartington) stratigraphic probe, and also each 5 cm using a KT-5 (Geofyzika) probe. The depth of investigated profiles was about 80 to 100 cm. Moreover, 6 soil profiles, about
Fig. 2. Geology of the surroundings of the quarry from Fig. 1 (sedimentary rocks, comprising the so-called Edivetur Formation).

Strongly magnetic soils developed on a non-magnetic rock basement
Stud. Geophys. Geod., 55 (2011) 701
30 cm in depth, were measured using a MAGPROX SM400 meter (Petrovský et al., 2004). Soil samples were collected each 25 cm for further laboratory analysis. In addition, we also sampled a soil layer, a few cm thick, covering the outcropping rock (BG6). In this paper, we show the results obtained mostly along two soil profiles (BG3 - 43°39.09N, 22°42.34E; BG7 - 43°39.09N, 22°43.13E), which represent the most typical trends in magnetic susceptibility behavior. The distance between the two profiles is about 870 m (Fig. 1).
3 . 2 . L a b o r a t o r y M e a s u r e m e n t s a n d I n s t r u m e n t a t i o n
In the laboratory, samples were dried, sieved through a 2-mm mesh size, put into the plastic containers, 10 cm3 in volume, and weighed. The samples were measured using three different instruments. The volume magnetic susceptibility was measured with a Bartington Instruments Ltd MS2B Dual Frequency Sensor at two frequencies: 465 Hz (labeled B1) and 4650 Hz (B2) and a magnetic field amplitude of 80 Am1, with a sensitivity of 105 SI units. This instrument is considered as standard for frequency-dependent susceptibility measurements, but its rather low sensitivity does not allow for a precise and reproducible determination of the frequency-dependent susceptibility in weak samples. Although our samples show high susceptibility (well above 50 105 SI), for verification we have used two other instruments by AGICO and ZHInstruments, with a sensitivity about one order of magnitude higher than that of the Bartington instrument. The AGICO apparatus MFK1-F measurements were carried out at three frequencies of 976, 3904 and 15616 Hz (denoted as A1, A2 and A3, respectively) and AC magnetic field amplitude of 200 Am1. Finally, we used ZHInstruments portable susceptibility meters SM100 and SM105. The SM100 instrument operates at frequencies of H1 = 500 Hz, H2 = 1000 Hz, H3 = 2000 Hz, H4 = 4000 Hz, H5 = 8000 Hz, the SM105 at more frequencies of H6 = 16000 Hz, H7 = 32000 Hz, H8 = 64000 Hz, H9 = 128000 Hz, H10 = 256000 Hz. Both the instruments apply fields of 6 amplitudes: 10, 20, 40, 80, 160, and 320 Am1. The sensitivity of these two devices is 106 SI units. Measurements carried out at the same frequencies as those available in the Bartington MS2B meter (H1 and H4, with an AC magnetic field amplitude of 80 Am1) are denoted as ZH/B1 and ZH/B2, whereas those performed at frequencies available in the Agico MFK1-F instrument (H2, H4 and H6, with an AC magnetic field amplitude of 160 Am1) are denoted as ZH/A1, ZH/A2 and ZH/A3. The percentage frequency-dependent susceptibility is expressed as
%FD LF HF LF , where κLF is measured at the lower and κHF at the higher
frequency. For the Bartington instrument, we have taken the mean value of 4 independent
measurements for every sample. The measurements were always corrected for temperature drift. As regards the AGICO instrument, due to the higher sensitivity, the average of only 2 independent measurements was used. In the case of the ZHInstruments (SM100 and SM105), the average of 3 values was used.
After completing the susceptibility measurements of all samples, about 0.1 g of top- and sub-soil samples was subjected to extraction by hand magnet for measuring the high-temperature dependence of magnetic susceptibility. The measurements were carried out using a low-field KLY-4 kappabridge with a CS-3 oven. The measurements were carried

H. Grison et al.
702 Stud. Geophys. Geod., 55 (2011)
out during heating up to 700°C at a rate of ~8.5°C/min and cooling down to room temperature. Curie-point temperatures were assessed using the paramagnetic Curie-Weiss law, as described by Petrovský and Kapička (2005, 2006). All these measurements were done at the Institute of Geophysics ASCR, Prague, Czech Republic.
In order to analyze the individual features on the susceptibility vs. temperature curves, the magnetic susceptibility of the samples were measured after step-wise heating at the National Institute of Geophysics, Geodesy and Geography, Sofia, Bulgaria. Cubic 8 cm3 samples were prepared from soil material by mixing 2 g of soil with calcium sulphate and water. A blank gypsum sample was also prepared for correcting the magnetic susceptibility (0.451 108 m3/kg) measurements. The samples were magnetized in 3 orthogonal directions with different field strengths (hard: 0.462.0 T, intermediate: 0.230.46 T, and soft component: 00.23 T) (3-D IRM, Lowrie, 1990) and step-wise heated in 12 temperature steps up to 600°C. The remanent magnetization and magnetic susceptibility were measured after each heating step. Samples were heated in a shielded furnace to a specific temperature, held for 30 minutes and cooled down. The applied temperature steps were 100, 150, 200, 250, 300, 350, 400, 450, 500, 550, 570 and 600°C. The magnetic susceptibility after each heating was normalized by the initial room-temperature value.
Hysteresis loops were measured using a Quantum Design MPMS LX-5 instrument (at the Institute of Geology and Geophysics, Chinese Academy of Science, Beijing, China) on top- and sub-soil samples at temperatures of 300K, 100K and 5K. Altogether, 5 samples were analysed, including a raw top- and sub-soil sample from the BG7 profile, the raw sample from the BG6 site and two magnetic extracts from BG6.
Finally, some non-magnetic analyses are included in the paper in order to provide additional information on the enhanced magnetic signature of the studied soils. Scanning Electron Microscopy (SEM) with Wavelength Dispersive Spectrometry (WDS) was carried out on the magnetic extract using a CAMECA SX100 electron microscope. The soil reaction (pH) was measured using a digital HANNA pH meter (model pH-113, Kehl am Rhein, Germany), in distilled water, applying the ratio of 1:5 (soil material:distilled water). Measurements were carried out for top-, mid- and sub-soil layers.
4. RESULTS
Profile BG3 is located on a slope with grass cover, therefore, it most probably suffers from a certain degree of erosion. Contrary to that, the BG7 profile is located on a flat area. The humic A horizon of the two profiles is dark brown in color, with a dense structure and is characterized by the presence of various vegetation roots and small rock pieces. The transition between the A and B horizons is diffuse. The illuvial B horizon of the two profiles starts 40 cm under the humic A horizon, is of a lighter brown color, heavily clayey and dense. Rock pieces of limestones are also present in all B horizons.
The outcropping limestone showed practically zero magnetic susceptibility; all the readings were within the noise level of the Bartington MS2D loop sensor and could not be discriminated from the ambient air measurements. The mass-specific magnetic susceptibility (χLF), determined from the measurements using the KLY-4 kappameter, is
Strongly magnetic soils developed on a non-magnetic rock basement
Stud. Geophys. Geod., 55 (2011) 703
less than 0.8 107 m3/kg (0.09 105 SI). Brown concretions, contained in the limestones, were magnetically stronger, with χLF about 5.4 107 m3/kg (0.4 105 SI).
4 . 1 . B a s i c M e a s u r e m e n t s o f M a g n e t i c S u s c e p t i b i l i t y
The in-situ magnetic susceptibility of top-soils over the studied area, measured with the Bartington MS2D probe, varies from 60 to 110 105 SI units. Samples collected directly on the rock, where there are only few centimeters of soil, exhibit the highest surface κLF (> 100 105 SI units). The magnetic susceptibility measured in soil pits,
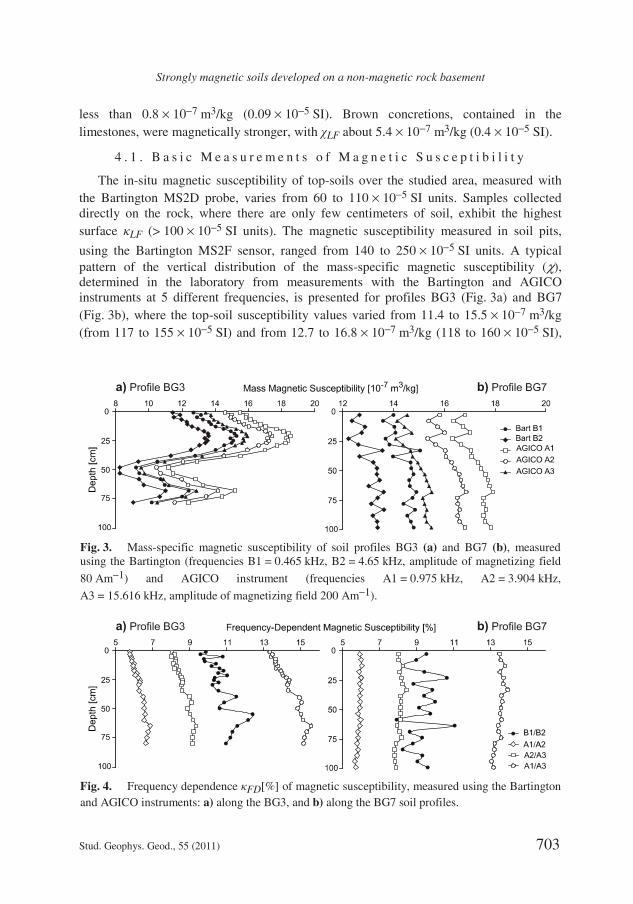
using the Bartington MS2F sensor, ranged from 140 to 250 105 SI units. A typical pattern of the vertical distribution of the mass-specific magnetic susceptibility (), determined in the laboratory from measurements with the Bartington and AGICO instruments at 5 different frequencies, is presented for profiles BG3 (Fig. 3a) and BG7 (Fig. 3b), where the top-soil susceptibility values varied from 11.4 to 15.5 107 m3/kg (from 117 to 155 105 SI) and from 12.7 to 16.8 107 m3/kg (118 to 160 105 SI),
Fig. 3. Mass-specific magnetic susceptibility of soil profiles BG3 (a) and BG7 (b), measured using the Bartington (frequencies B1 = 0.465 kHz, B2 = 4.65 kHz, amplitude of magnetizing field
80 Am1) and AGICO instrument (frequencies A1 = 0.975 kHz, A2 = 3.904 kHz,
A3 = 15.616 kHz, amplitude of magnetizing field 200 Am1).
Fig. 4. Frequency dependence κFD[%] of magnetic susceptibility, measured using the Bartington and AGICO instruments: a) along the BG3, and b) along the BG7 soil profiles.

H. Grison et al.
704 Stud. Geophys. Geod., 55 (2011)
respectively. Neither distinct enhancement, typical for the atmospheric deposition of anthropogenic dust, nor unambiguous depth control of susceptibility due to magnetite-rich lithology was observed. In order to better assess the possible depth control of magnetic susceptibility, linear regression was applied to these two profiles. While negative values of correlation coefficient R were obtained consistently for the BG3 profile, positive values were observed for the BG7 profile (Table 1). Frequency-dependent magnetic susceptibility κFD[%] is elevated for the whole area, and there is no significant difference between the top- and sub-soil (Figs. 4a and 4b). Opposite tendencies are observed along the two profiles also for correlation between κFD[%] and depth (Table 2): BG3 shows a positive and BG7 shows a negative correlation. We do not attribute any specific meaning to these simple observations. They support the previous notion on nonspecific variations of susceptibility with depth, observed in two close soil profiles on the same basement rock.
In order to compare the values of the frequency-dependent magnetic susceptibility measured using different instruments at different frequencies, we have normalized the data for each instrument and pair of frequencies to the value of the frequency-dependent magnetic susceptibility of the uppermost (surface) sample of the corresponding soil profiles BG3 (Fig. 5a) and BG7 (Fig. 5b). From this point of view, all three instruments agree well in the basic downward trend. Along the BG3 profile the frequency-dependent susceptibility linearly increases with depth, showing an increase of about 1015% at a depth of about 80 cm, whereas along the BG7 it is practically stable or decreases slightly along the whole 100 cm long profile.
Table 1. Correlation coefficients R between the mass-specific magnetic susceptibility and depth along the two typical profiles BG3 and BG7 shown in Figs. 3a,b. All Bartington and AGICO instrument measurements at different frequencies and amplitudes of the magnetizing field show the same trend: decrease with depth along BG3 and increase along BG7.
BG3 BG7
Bartington B1 0.645 0.701 Bartington B2 0.664 0.700
AGICO A1 0.649 0.845 AGICO A2 0.662 0.855 AGICO A3 0.677 0.868
Table 2. Correlation coefficients R between the frequency-dependent magnetic susceptibility and depth along the two typical profiles BG3 and BG7 shown in Figs. 4a,b.
BG3 BG7
Bartington B1/B2 0.719 0.107 AGICO A1/A2 0.950 0.818 AGICO A2/A3 0.950 0.625 AGICO A1/A3 0.957 0.751

Strongly magnetic soils developed on a non-magnetic rock basement
Stud. Geophys. Geod., 55 (2011) 705
4 . 2 . T e m p e r a t u r e D e p e n d e n c e o f M a g n e t i c S u s c e p t i b i l i t y
Typical thermomagnetic curves of top- and sub-soil samples from the BG3 profile are depicted in Figs. 6a,b. The top-soil sample represents the uppermost 02 cm, the sub-soil sample was collected from a depth of 7580 cm. The heating curves of the two samples show significantly different patterns (Fig. 6a). The top-soil sample shows a distinct maximum at about 250°C, followed by a decay of susceptibility of about 50% of the peak value over an interval of 170C, a rather wide peak at about 500°C, and a Curie point estimated at about 570°C. The sub-soil sample shows rather stable values up to about 310°C, followed by a gradual decrease. Susceptibility vanishes above 575°C, with the Curie point estimated at about 520°C. The top-soil sample displays a behavior similar to that observed for top-soils in other regions and other soil types (Kapička et al., 2001, 2003). It seems that the top-soil is richer in organic matter, which burns at about 250°C and results in the neoformation of maghemite and, at higher temperatures, of magnetite. The second peak at about 500C could be the Hopkinson peak of newly formed magnetite, or may reflect the ongoing transformation, or combination of both effects. This second maximum is absent for the sub-soil sample (Fig. 6a), although a slight change in the slope of the heating curve may be observed at 500C. The fact that this peak is absent for the sub-soil sample suggests a wide grain-size distribution for the newly formed mineral. The cooling curves of the two samples show similar shape features and end-values, suggesting that the type and concentration of the end-product of the thermally induced transformations is the same. Repeated heating did not reveal any further mineralogical changes.
Figs. 7a,b show the normalized magnetic susceptibility measured after step-wise heating for samples from different depths of the BG3 and BG7 profiles. They suggest that mineralogical changes take place predominantly in the same temperature interval for all the samples. The intensity of the changes seems to be practically the same, except for one sample (from a depth of 55 cm along the BG3 profile). This temperature interval
Fig. 5. Curves of κFD[%] normalized to the first value, measured using the Bartington, AGICO and ZHInstruments apparatuses: a) BG3 and b) BG7 soil profiles. A12 stands for κFD[%]
calculated as A1 A2 A1 ; ZH as A12 means κFD[%] defined as
ZH A1 ZH A2 ZH A1 , etc.

H. Grison et al.
706 Stud. Geophys. Geod., 55 (2011)
corresponds to the second peak in Fig. 6a. This means that the mineralogical transformation to maghemite/magnetite takes place mostly in this temperature interval and is not necessarily reflected in the rather fast, dynamic measurements of the temperature dependence of magnetic susceptibility at higher temperatures.
4 . 3 . T h e r m a l D e m a g n e t i z a t i o n o f 3 - D I R M
Two unblocking temperatures for the soft component are observed for all samples: Tub1 = 300°C and Tub2 = 600°C. The intermediate component has a much lower intensity than the soft one, and this is the reason for the larger scatter on the demagnetization curves. Nevertheless, again for all samples a maximum Tub = 700°C is evident. Tub around 300°C can also be inferred for most samples. The hard component has a negligible contribution for all samples, hence only soft and intermediate components are plotted. Figs. 8a,b and Figs. 9a,b present the data of profiles BG3 and BG7 from top-, mid- and sub-soil layers.
Thus, the thermal demagnetization of IRM suggests that soil samples from all profiles and depths contain magnetite and hematite and probably some maghemite, which is missing only in sample BG7-95 cm, from the deepest level sampled.
Fig. 6. a) Heating, and b) cooling curves of top- and sub-soil samples from the BG3 profile. The Curie temperature is estimated at 580°C for the top-soil sample. The sharp peak at 250°C is the possible effect of burning of organic material.
Fig. 7. Magnetic susceptibility changes after step-wise heating: a) BG3, and b) BG7 profile. Values are normalized to the room-temperature susceptibility for each sample.

Strongly magnetic soils developed on a non-magnetic rock basement
Stud. Geophys. Geod., 55 (2011) 707
4 . 4 . H y s t e r e s i s L o o p s
The hysteresis loops of top- and sub-soil samples from the BG7 profile, measured at room temperature, 100K and 5K, are shown in Figs. 10a,b. The hysteresis loops measured at room temperature show magnetically much softer behavior than those acquired at low temperatures. The coercive force (Bc) at 100K and 5K is, in principle, constant and about twice as high as at room temperature (Table 3). The saturation remanence (Mrs) increases at 100K and further at 5K. The paramagnetic slope in the linear (saturation) section of the loop also increases with decreasing temperature, which is in agreement with the temperature effect acting against magnetic aligning due to the applied magnetic field. Both the top- and sub-soil samples show identical trends. These measurements imply strong paramagnetic behavior at room temperature, which is blocked at low temperatures, suggesting a significant portion of superparamagnetic particles.
Fig. 8. Step-wise thermal demagnetization: a) soft, b) intermediate components of 3-D IRM of Profile BG3 for top- (2 cm), mid- (55 cm) and sub-soil (80 cm) layers. In Fig. 8a the soft component unblocking temperatures are Tub1 = 300°C and Tub2 = 600°C. In Fig. 8b the intermediate
component shows unblocking temperature Tub1 300°C and Tub2 = 700°C for all layers.
Fig. 9. The same as in Fig. 8, but for Profile BG7 for top- (5 cm), mid- (40 cm) and sub-soil (95 cm) layers. In a), Tub1 = 300°C and Tub2 = 600°C are evident. In b), the unblocking temperature Tub = 700°C is not present in the sub-soil layer, Tub around 300°C can be inferred in all samples.

H. Grison et al.
708 Stud. Geophys. Geod., 55 (2011)
4 . 5 . N o n - M a g n e t i c D a t a : S o i l p H
The pH values were studied for samples from three profiles (BG2, BG3 and BG7). All the three top-soil samples are slightly acidic (from 5.75 to 6.84), with an average of 6.29, and their pH slightly increases with depth (average sub-soil pH is 6.62).
Fig. 10. Detail of hysteresis loops measured at 300, 100 and 5K for BG7: a) top-soil sample, b) sub-soil sample. Parameters Bc, Mrs and Ms are listed in Table 3.
Strongly magnetic soils developed on a non-magnetic rock basement
Stud. Geophys. Geod., 55 (2011) 709
4 . 6 . N o n - M a g n e t i c D a t a : S E M O b s e r v a t i o n s
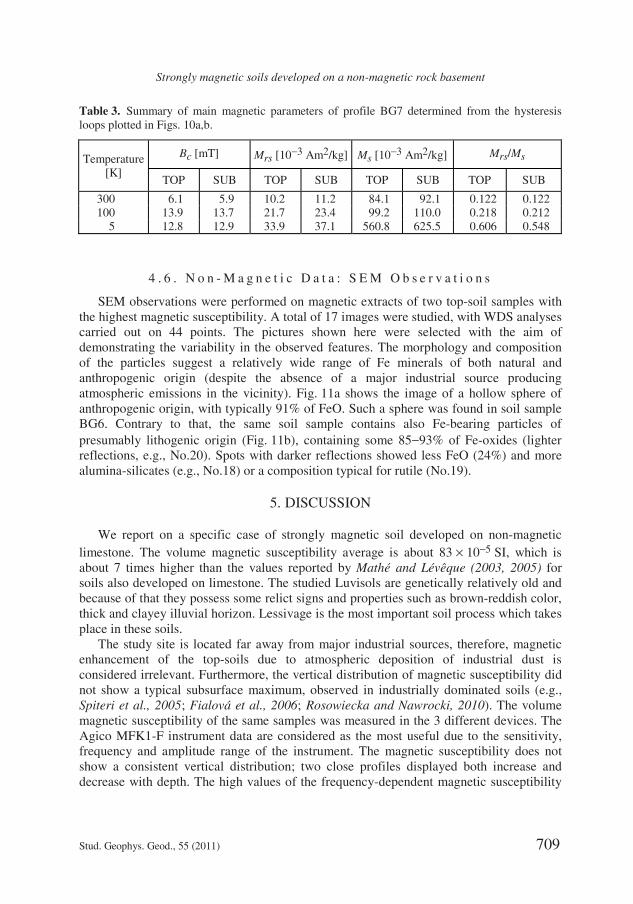
SEM observations were performed on magnetic extracts of two top-soil samples with the highest magnetic susceptibility. A total of 17 images were studied, with WDS analyses carried out on 44 points. The pictures shown here were selected with the aim of demonstrating the variability in the observed features. The morphology and composition of the particles suggest a relatively wide range of Fe minerals of both natural and anthropogenic origin (despite the absence of a major industrial source producing atmospheric emissions in the vicinity). Fig. 11a shows the image of a hollow sphere of anthropogenic origin, with typically 91% of FeO. Such a sphere was found in soil sample BG6. Contrary to that, the same soil sample contains also Fe-bearing particles of presumably lithogenic origin (Fig. 11b), containing some 8593% of Fe-oxides (lighter reflections, e.g., No.20). Spots with darker reflections showed less FeO (24%) and more alumina-silicates (e.g., No.18) or a composition typical for rutile (No.19).
5. DISCUSSION
We report on a specific case of strongly magnetic soil developed on non-magnetic limestone. The volume magnetic susceptibility average is about 83 105 SI, which is about 7 times higher than the values reported by Mathé and Lévêque (2003, 2005) for soils also developed on limestone. The studied Luvisols are genetically relatively old and because of that they possess some relict signs and properties such as brown-reddish color, thick and clayey illuvial horizon. Lessivage is the most important soil process which takes place in these soils.
The study site is located far away from major industrial sources, therefore, magnetic enhancement of the top-soils due to atmospheric deposition of industrial dust is considered irrelevant. Furthermore, the vertical distribution of magnetic susceptibility did not show a typical subsurface maximum, observed in industrially dominated soils (e.g., Spiteri et al., 2005; Fialová et al., 2006; Rosowiecka and Nawrocki, 2010). The volume magnetic susceptibility of the same samples was measured in the 3 different devices. The Agico MFK1-F instrument data are considered as the most useful due to the sensitivity, frequency and amplitude range of the instrument. The magnetic susceptibility does not show a consistent vertical distribution; two close profiles displayed both increase and decrease with depth. The high values of the frequency-dependent magnetic susceptibility
Table 3. Summary of main magnetic parameters of profile BG7 determined from the hysteresis loops plotted in Figs. 10a,b.
Temperature [K]
Bc [mT] Mrs [103 Am2/kg] Ms [103 Am2/kg] Mrs/Ms
TOP SUB TOP SUB TOP SUB TOP SUB
300 6.1 5.9 10.2 11.2 84.1 92.1 0.122 0.122 100 13.9 13.7 21.7 23.4 99.2 110.0 0.218 0.212
5 12.8 12.9 33.9 37.1 560.8 625.5 0.606 0.548

H. Grison et al.
710 Stud. Geophys. Geod., 55 (2011)
Fig. 11a. SEM of hollow spherical particle found in the BG6 top-soil sample; analyzed point No.16 (91% FeO; 1.5% Al2O3).
Fig. 11b. SEM of particle found in the BG6 top-soil sample; analyzed points No.18 (24.6% SiO2; 23.8% FeO; 19.% Al2O3 ;16.6% MgO), No.19 (96% TiO2; 2.5% FeO), No.20 (86.9% FeO; 4.2% TiO2), No.21 (56.7% TiO2; 35.2% FeO), No.22 (24.7% SiO2; 24.3% FeO; 16.5% Al2O3; 19.8% MgO; 1.4% TiO2).

Strongly magnetic soils developed on a non-magnetic rock basement
Stud. Geophys. Geod., 55 (2011) 711
were observed along the vertical profiles, the values being practically constant or increasing with depths. The relative changes of these values with depth were practically independent of the applied frequency and instrument used. To sum up, the frequency-dependent susceptibility suggests a dominant contribution of superparamagnetic magnetite/maghemite (Torrent at al., 2010a,b).
The thermomagnetic curves of top-soil samples showed a behavior similar to that observed for top-soils from other regions and for other soil types, with a typical maximum at about 350°C, and Curie point corresponding to magnetite. It seems that thermomagnetic analyses alone are not able to discriminate between the anthropogenic and pedogenic origin of ferrimagnets in soil samples rich in organic matter. The sub-soil samples showed a rather stable mineralogy. Besides this maximum, the magnetic susceptibility measured after step-wise heating-cooling runs (Fig. 7) suggests that the top- and sub-soil have the same composition in terms of magnetic minerals. Except for one case, the thermal demagnetization of 3-D IRM suggests that all the soil samples contain magnetite, coarse grain hematite and probably some maghemite. The hysteresis loops measured at room temperature, 100K and 5K exhibit a behavior typical for superparamagnetic particles. We suggest that superparamagnetic magnetite and/or maghemite is responsible for magnetic enhancement of this particular soil. It seems that its concentration slightly increases with depth and is not connected with a specific soil layer.
The Belogradchik area is considered as region with relatively high risk of wild fires, therefore the possibility of fire-induced magnetic enhancement cannot be excluded. However, in such a case we would expect magnetic enhancement to be clearly limited to a distinct soil layer. Therefore, we believe that forest fire at this site as a possible source of SP magnetite is unlikely. Moreover, as shown by Nornberg et al. (2009), experimental forest fires affect the composition of iron oxides in the top 10 cm of soil. Therefore, we do not suppose that human activities and/or fire would provide an important contribution to the magnetic enhancement of the soil, which is quite constant along the whole profile.
Vertical profiles of frequency-dependent susceptibility, indicating an increase with depth, may suggest a significant role of dark concretions in the limestones, which can provide a source of iron for magnetite/maghemite formation. However, such a trend was not observed systematically, nor was convincing. The other possible source might be Fe as coating on silicates. Considering the value of the mass-specific susceptibility of sub-micron magnetite between 3 and 5 104 m3/kg (http://www.irm.umn.edu/bestiary2 /material.php), our samples contain around 0.5% magnetite. It is rather uncertain whether iron oxide as coating of silicates would yield such an amount of magnetite.
Mechanisms responsible for the increase of magnetic susceptibility may be connected with reduction-oxidation processes. It is known that anoxic microenvironment favors effective formation of Fe2+. For instance, in anoxic rice field soil, ferric iron reduction is one of the most important terminal electron accepting processes, yet little is known about the identity of iron-reducing microorganisms (Hori et al., 2010). After flooding the rice fields, reduction of iron oxides occurs at water-soil interfaces (Conrad and Frenzel, 2002). After flooding, oxidants (oxygen>nitrate>sulfate and Fe3+ oxides) are reduced sequentially according to the thermodynamic theory (Ponnamperuma, 1972; Patrick and Reddy, 1978). However, in the soils we studied, this mechanism of Fe2+ formation is very

H. Grison et al.
712 Stud. Geophys. Geod., 55 (2011)
unlikely. Another possible mechanism involves the reduction of biologically unstable Fe3+-hydroxysulfates to Fe-sulfides under anoxic conditions (Gramp et al., 2009).
Another possible mechanism of magnetic enhancement may be related to the transformation of iron-(oxy)hydroxides and/or clay minerals, migrating from the upper part of the profile and exposed to elevated temperatures. For example, Jelenska et al. (2010) showed that heating up to 200400C resulted in the transformation of hydroxides such as goethite, lepidocrocite and ferrihydrite to magnetite/maghemite. However, their thermomagnetic curves do not exclude that this transformation could start at a lower temperature, around 100C. For example, a low-temperature hydrothermal environment can cause the transformation of clay minerals (Giorgetti et al., 2009) and increased soil magnetic susceptibility was observed near fumaroles (Diaz et al., 2010). Although there were no indicators of a hydrothermal environment on the studied site, long-term effects of slightly elevated temperature cannot be excluded. The controled laboratory experiments by Liu et al. (2010) showed that ferrihydrite-2 can be easily transformed to magnetite at neutral pH, provided enough Fe2+ is introduced, at temperatures below 60C. Microbially facilitated reductive biotransformation of akageneite at near ambient temperatures may result in magnetite nano-particles (Roh et al., 2007). However, at this stage we have no proof of the existence of the iron-(oxy)hydroxide precursors.
Blundell et al. (2009) provided an extensive review of factors controling the spatial variability of magnetic susceptibility of soils in Wales and England. They concluded that one of the most significant factors affecting the magnetic susceptibility of soil is the parent material. From the point of view of mean LF and FD[%], ooidal limestones ranked second out of the top 10 parent materials underlying magnetically enhanced soils. The soils we studied show mass specific susceptibility of about 15 107 m3/kg (Bartington measurements yielded ~13 107 m3/kg), which is practically the same as 13.2 107 m3/kg, the mean value of Blundell et al. (2009). As regards FD[%], our soils show values from about 8% to 12% (Bartington measurements), which is slightly above the mean value of 8.74%, reported by Blundell et al. (2009). Although we did not perform detailed analyses of the parent material in our study area, it is quite probable that, despite low magnetic susceptibility, the basement rock may be ooidal limestone, the Fe-ooids being represented by dark concretions. This suggestion is supported by the presence of Fe-ooidal limestones in two sections in the western Balkan Mts., 26 km to the north of Sofia, and about 100 km away from our study area (Koleva-Rekalova and Metodiev, 2007). Moreover, Chatalov (2005) identified several types of ooids in the Triassic carbonate sediments from NW Bulgaria, including the Edivetur and Toshkovdol Formations of the Iskur Carbonate Group, outcropping also near Belogradchik.
6. CONCLUSIONS
We have observed soils developed on non-magnetic limestone, displaying high values of magnetic susceptibility and its frequency-dependent values. Magnetic susceptibility, as well as its frequency-dependent value, showed neither zonation typical for enhancement due to atmospheric deposition of Fe-rich dust, nor a pattern typical for lithologically controled mineralogy. Our magnetic measurements clearly indicate prevalence of

Strongly magnetic soils developed on a non-magnetic rock basement
Stud. Geophys. Geod., 55 (2011) 713
superparamagnetic magnetite/maghemite. At this moment, we cannot be specific with regard to the mechanism of SP magnetite production. Climatic conditions as well as forest fire seem to be less probable. In addition, SEM observations revealed large particles of both anthropogenic and lithogenic origin, the latter rich in Fe-Al-Si and Fe-Ti-oxides. The source of these particles remains unclear, because close significant sources of pollution and/or Fe-rich basement rocks are absent.
It is quite probable that the magnetic enhancement is caused by ooidal limestones, reported in this region by other studies. However, more analyses, such as Mössbauer spectroscopy, are needed in order to determine and characterize this magnetic phase and to propose which of the discussed mechanisms of magnetic enhancement is the most probable. These analyses will be the subject of our further study.
The finding of a magnetically enhanced soil (with susceptibility about one order of magnitude higher than in typical industrial regions) developed on an apparently Fe-poor basement in a clean environment is important for further studies of the magnetic properties of soil, especially from the point of view of site considerations.
Acknowledgment: This work has been supported by the Grant Agency of the Academy of
Sciences of the Czech Republic, Grant No. KJB300120604.
References
Bharde A.A., Parikh R.Y., Baidakova M., Jouen, S., Hannoyer B., Enoki T., Prasad B.L.V., Shouche Y.S., Ogale S. and Sastry M., 2008. Bacteria-mediated precursor-dependent biosynthesis of superparamagnetic iron oxide and iron sulfide nanoparticles. Langmuir, 24, 57875794.
Blakemore R.P., 1975. Magnetotactic bacteria. Science, 190, 377379.
Blakemore R.P., 1982. Magnetotactic bacteria. Ann. Rev. Microbiol., 36, 217238.
Blundell A., Dearing J.A., Boyle J.F. and Hannam J.A., 2009. Controlling factors for the special variability of soil magnetic susceptibility across England and Wales. Earth Sci. Rev., 95, 158188.
Boyko T., Schölger R., Stanek H. and MAGPROX Team, 2004. Topsoil magnetic susceptibility mapping as a tool for pollution monitoring: repeatability of in situ measurements. J. Appl Geophys., 55, 249259.
Chatalov A., 2005. Monomineralic carbonate ooid types in the Triassic sediments from Northwestern Bulgaria. Geologica Balcanica, 35, 6391.
Conrad R. and Frenzel P., 2002. Flooded soils. In: Bitton G. (Ed), Encyclopedia of Environmental Microbiology. John Wiley & Sons, Inc., New York, 13161333.
Davila A.F., Rey D., Mohamed K., Rubio B. and Guerra A.P., 2006. Mapping the sources of urban dust in a coastal environment by measuring magnetic parameters of Platanus hispanica leaves. Environ. Sci. Technol., 40, 39223928.
Dearing J.A., Hay K.L., Baban S.M.J., Huddleston A.S., Wellington E.M.H. and Loveland P.J., 1996. Magnetic susceptibility of soil: An evaluation of conflicting theories using a national data set. Geophys. J. Int., 127, 728734.

H. Grison et al.
714 Stud. Geophys. Geod., 55 (2011)
Dearing J.A.; Hannam J.A.; Anderson A.S. and Wellington E.M.H., 2001. Magnetic, geochemical and DNA properties of highly magnetic soils in England. Geophys. J. Int., 144, 183196.
Diaz F.J., O´Green A.T., Rasmussen C. and Dahlgren R.A., 2010. Pedogeneses along a thermal gradient in a geothermal region of the southern Cascades, California. Geoderma, 154, 495507.
Evans M.E. and Heller F., 2003. Environmental Magnetism: Principles and Applications of Enviromagnetics. Academic Press, San Diego, CA.
FAO, 2006. World Reference Base for Soil Resources 2006. World Soil Resources Reports No. 103. Food and Agriculture Organization of the United Nations, Rome, ISBN: 92-5-105511-4.
Fialová H., Maier G., Petrovský E., Kapička A., Boyko T., Schölger R. and MAGPROX Team, 2006. Magnetic properties of soils from sites with different geological and environmental settings. J. Appl Geophys., 59, 273283.
Fortin D. and Langley S., 2005. Formation and occurrence of biogenic iron-rich minerals. Earth Sci. Rev., 72, 119.
Frankel R.B. and Blakemore R.P., 1990. Iron Biominerals. Plenum Press, New York.
Giorgetti G., Monecke T., Kleeberg R. and Hannington M.D., 2009. Low-temperature hydrothermal alteration of trachybasalt at conical seamount, Papua New Guinea: Formation of smectite and metastable precursor phases. Clay Clay Min., 57, 725741.
Gramp J.P., Wang H.M., Bigham J.M., Jones F.S. and Tuovinen O.H., 2009. Biogenic Synthesis and Reduction of Fe(III)-hydrosulfates. Geomicrobiol. J., 24, 275280.
Guyodo Y.; LaPara T.M.; Anschutz A.J., Penn R.L., Banerjee S.K., Geiss C.E. and Zanner W., 2006. Rock magnetic, chemical and bacterial community analysis of a modern soil from Nebraska. Earth Planet. Sci. Lett., 251, 168178.
Hanesch M. and Petersen N., 1999. Magnetic properties of a recent parabrown-earth from Southern Germany. Earth Planet. Sci. Lett., 169, 8597.
Hanesch M., Scholger R. and Rey D., 2003. Mapping dust distribution around an industrial site by measuring magnetic parameters of tree leaves. Atmos. Environ., 37, 51255133.
Hanzlik M., Winklhofer M. and Petersen N., 1996b. Spacial arrangement of chains of magnetosomes in magnetotactic bacteria. Earth Planet. Sci. Lett., 145, 125134.
Heywood B.R., Bazylinski D.A., Garratt-Reed A., Mann S. and Frankel R.B., 1990. Controlled biosynthesis of greigite (Fe3S4) in magnetotactic bacteria. Naturwissenschaften, 77, 536538.
Hori T., Müller A., Igarashi Y., Conrad R. and Friedrich M.W., 2010. Identification of iron-reducing microorganisms in anoxic rice paddy soil by 13C-acetate probing. The ISME Journal, 4, 267278.
Jelenska M., Hasso-Agopsowicz A. and Kopcewicz B., 2010. Thermally induced transformation of magnetic minerals in soil based on rock magnetic study and Mossbauer analysis. Phys. Earth Planet. Inter., 179, 164177.
Jordanova N.V., Jordanova D.V., Veneva L., Yorova K. and Petrovský E., 2003. Magnetic response of soils and vegetation to heavy metal pollution - A case study. Environ. Sci. Technol., 37, 44174424.

Strongly magnetic soils developed on a non-magnetic rock basement
Stud. Geophys. Geod., 55 (2011) 715
Kapička A., Petrovský E., Ustjak S. and Macháčková K., 1999. Proxy mapping of fly-ash pollution of soils around a coal-burning power plant: a case study in the Czech Republic. J. Geochem. Explor., 66, 291297.
Kapička A., Jordanova N., Petrovský E. and Podrázský V., 2001. Effect of different soil conditions on magnetic parameters of power-plant fly ashes. J. Appl.Geophys., 48, 93102.
Kapička A., Jordanova N., Petrovský E. and Podrázský V., 2003. Magnetic study of weakly contaminated forest soils. Water Air Soil Pollut., 148, 3144.
Kapička A., Petrovský E., Fialová H. and Podrázský V., 2008. High resolution mapping of anthropogenic pollution in the Giant Mountains National Park using soil magnetometry. Stud. Geophys. Geod., 52, 271284.
Koleva E. and Peneva R., 1990. Climate Reference Book. Precipitation in Bulgaria. Bulgarian Academy of Sciences, Sofia, Bulgaria (in Bulgarian).
Koleva-Rekalova E. and Metodiev L., 2007. Diagenetic evolution of the Toarcian iron-ooidal limestones and the Upper Pliensbachian - Lower Bajocian hemipelagic sediments. evidence from two sections of western Balkan Mts (Bulgaria) on the base of isotope (13C and 18O) data. Comptes Rendus de l’Academie Bulgare des Sciences, 60, 10851092.
Le Borgne E., 1955. Susceptibilité magnétique anormale du sol superficiel. Ann. Géophys., 11, 399419.
Lecoanet H., Lévêque F. and Ambrosi J.P., 2001. Magnetic properties of salt-marsh soils contaminated by iron industry emissions (southeast France). J. Appl. Geophys., 48, 6781.
Liu H., Ma M.R., Qin M., Yang L.J. and Wie Y., 2010. Studies on the controllable transformation on ferryhydrite. J. Solid State Chem., 183, 20452050.
Lowrie W., 1990. Identification of ferromagnetic minerals in a rock by coercivity and unblocking temperature properties. Geophys. Res. Lett., 17, 159162.
Mageira T., Kapička A., Petrovský E., Strzyszcz Z, Fialová H. and Rachwal M., 2008. Magnetic anomalies of forest soils in the Upper Silesia-Northern Moravia region. Environ. Pollut., 156, 618628.
Mann S., Sparks N.H.C., Frankel R.B., Bazylinski D.A. and Jannasch H.W., 1990a. Biomineralization of ferrimagnetic greigite (Fe3S4) and iron pyrite (FeS2) in a magnetotactic bacterium. Nature, 343, 258261.
Mathé V. and Lévêque F., 2003. High resolution magnetic survey for soil monitoring: detection of drainage and soil tillage effects. Earth Planet. Sci. Lett., 212, 241251.
Mathé V. and Lévêque F., 2005. Trace magnetic minerals to detect redox boundaries and drainage effects in a marshland soil in western France. Eur. J. Soil Sci., 56, 737751.
Metodiev L. and Koleva-Rekalova E., 2008. Stable isotope records (18O and 13C) of Lower-Middle Jurassic belemnites from the Western Balkan mountains (Bulgaria): palaeoenvironmental application. Appl. Geochem., 23, 28452856.
Mullins C.E., 1977. Magnetic susceptibility of the soil and its significance in soil science - A review. J. Soil Sci., 28, 223246.
Muttoni G., Gaetani M., Buduriv K., Zagorchev I., Trifonova E., Ivanova D., Petrounova L. and Lowrie W., 2000. Middle Triassic paleomagnetic data from northern Bulgaria: constrains on Tethian magnetostratigraphy and paleogeography. Palaeogeogr. Palaeoclimatol. Palaeoecol., 160, 223237.
H. Grison et al.
716 Stud. Geophys. Geod., 55 (2011)
Nornberg P., Vendelboe A.L., Gunnlaugsson H.P., Merrison J.P., Finster K. and Jensen S.K., 2009. Comparison of the mineralogical effects of an experimental forest fire on a goethite/ferrihydrite soil with a topsoil that contains hematite, maghemite and goethite. Clay Min., 44, 239247.
Patrick Jr. W.H. and Reddy C.N., 1978. Chemical Changes in Rice Soils. International Rice Institute, Los Banos, Phillipines, 361379.
Ponnamperuma F.N., 1972. The chemistry of submerged soils. Adv. Agronom., 24, 2996.
Petrovský E., Hůlka Z., Kapička A. and MAGPROX Team, 2004. New tool for in-situ measurements of vertical distribution of magnetic susceptibility in soils as basis for mapping deposited dust. Environ. Technol., 25, 10211029.
Petrovský E. and Kapička A., 2005. Comments on “The use of field dependence of magnetic susceptibility for monitoring variations in titanomagnetite composition - a case study on basanites from the Vogelsberg 1996 drillhole, Germany” by de Wall and Nano. Stud. Geophys. Geod., 48, 767776.
Petrovský E. and Kapička A., 2006. On determination of the Curie point from thermomagnetic curves. J. Geophys. Res., 111, B12S27.
Posfai M., Moskowitz B.M., Arato B., Schuler D., Flies C., Bazylinski D.A. and Frankel R.B., 2006. Properties of intracellular magnetite crystals produced by Desulfovibrio magneticus strain RS-1. Earth Planet. Sci. Lett., 249, 444455.
Roh Y.,Vali H.,Phelps TJ. and Moon J.W., 2006. Extracellular synthesi of magnetite and metal-substituted magnetite nanoparticies. J. Nanosci. Nanotechnol., 6, 35173520.
Roh Y., Jang H.D. and Suh Y., 2007. Microbial synthesis of magnetite and mn-substituted magnetite nanoparticles: Influence of bacteria and incubation temperature. J. Nanosci. Nanotechnol., 7, 39383943.
Rosowiecka O. and Nawrocki J., 2010. Assessment of soils pollution extent in surroundings of ironworks based on magnetic analysis. Stud. Geophys. Geod., 54, 185194.
Schibler L., Boyko T., Ferdyn M., Gajda B., Höll S., Jordanova N., Rosler W. and MAGPROX Team, 2002. Topsoil magnetic susceptibility mapping: data reproducibility and compatibility, measurement strategy. Stud. Geophys. Geod., 46, 4357.
Spassov S., Egli R., Heller F., Nourgaliev D.K. and Hannam J., 2004. Magnetic quantification of urban pollution sources in atmospheric particulate matter. Geophys. J. Int., 159, 555564.
Spiteri C., Kalinami V., Rosler W., Hoffmann V., Appel E. and MAGPROX Team, 2005. Magnetic screening of a pollution hotspot in the Lausitz area, Eastern Germany: correlation analysis between magnetic proxies and heavy metal contamination in soils. Environ. Geol., 49, 19.
Strzyszcz Z. and Magiera T., 1998. Magnetic susceptibility and heavy metals contamination in soils of southern Poland. Phys. Chem. Earth., 23, 11271131.
Torrent J., Liu Q.S. and Barron V., 2010. Magnetic minerals in Calcic Luvisols (Chromic) developed in a warm Mediterranean region of Spain: Origin and paleoenvironmental significance. Geoderma, 154, 465472.
Torrent J., Liu Q.S. and Barron V., 2010. Magnetic susceptibility changes in relation to pedogenesis in a Xeralf chronosequence in northwestern Spain. Eur. J. Soil Sci., 61, 161173.
Velev S., 1990. Climate in Bulgaria. Narodna prosveta, Sofia, Bulgaria (in Bulgarian).