
Imaging the basement architecture across the Cork Fault in Queensland using magnetic and gravity...
19
Precambrian Research 264 (2015) 63–81 Contents lists available at ScienceDirect Precambrian Research jo ur nal homep ag e: www.elsevier.com/locate/precamres Imaging the basement architecture across the Cork Fault in Queensland using magnetic and gravity data Giovanni P.T. Spampinato ∗ , Laurent Ailleres, Peter G. Betts, Robin J. Armit Monash University, School of Earth, Atmosphere and Environment, Building 28, Clayton Campus, Wellington Road, Clayton, VIC 3800, Australia a r t i c l e i n f o Article history: Received 5 December 2014 Received in revised form 2 March 2015 Accepted 2 April 2015 Available online 9 April 2015 Keywords: Mount Isa terrane Thomson Orogen Gravity Magnetic Cork Fault Tasman Line a b s t r a c t The basement rocks in central Queensland are largely obscured by the Phanerozoic sedimentary succes- sion and direct information comes only from sparse geological data. 2.5D forward modelling of regional aeromagnetic and Bouguer gravity data has been undertaken to unveil the crustal architecture at the junc- tion of the Proterozoic Mount Isa terrane and the Phanerozoic Thomson Orogen in Queensland. The most prominent geophysical character is represented by the abrupt termination of positive NNW-trending geo- physical anomalies of the Mount Isa terrane against NE-trending, low amplitude gravity and magnetic anomalies of the Diamantina River Domain of the Thomson Orogen. Potential field forward modelling indicates that the lower basement crust of the Thomson Orogen is petrophysically indistinguishable from the crust of the Proterozoic Mount Isa terrane. We interpret that the prominent gradients associated with the Cork Fault represent the displacement and burial of the Mount Isa terrane crust under the Thomson Orogen. In this context, the Cork Fault is inferred to represent a fundamental crustal discontinuity but does not represent the eastern margin of Rodinia because the Thomson Orogen is floored by Precambrian continental crust. Initiation of the Cork Fault might have occurred as early as the Mesoproterozoic. At that time, the Cork Fault was a major structure that developed during the separation of the Mount Isa terrane and the Curnamona Province. It is inferred that this break-up occurred during initial N-S to NNW-SSE extension. The Cork Fault formed part of a network of major north- and south-dipping normal faults active at that time. The Cork Fault was repeatedly reactivated during the Neoproterozoic Rodinia break-up and during the Phanerozoic evolution of the Tasmanides. We suggest that the segment of the inferred ‘Tasman Line’ along the southern termination of the Mount Isa terrane should be regarded as a set of structures offset- ting the Proterozoic crust rather than a simple lineament dividing the Proterozoic and the Phanerozoic Australian continent. © 2015 Elsevier B.V. All rights reserved. 1. Introduction The Cork Fault divides the Proterozoic Mount Isa terrane (Betts et al., 2006; Blake et al., 1984; O’Dea et al., 1997b) from the Phanero- zoic Thomson Orogen (Finlayson et al., 1988; Glen, 2005; Glen et al., 2010; Murray and Kirkegaard, 1978) in Queensland and is one of the most distinguishable geophysical features on the Australian conti- nent (Fig. 1). Because of its prominence, the Cork Fault has been interpreted to represent a major feature associated with the Neo- proterozoic break-up of Rodinia (Finlayson et al., 1988; Gunn et al., ∗ Corresponding author at: P.O. Box 8059, Monash University LPO, Wellington Road, Clayton, VIC 3168, Australia. Tel.: +61 403500330. E-mail addresses: [email protected] (G.P.T. Spampinato), [email protected] (L. Ailleres), [email protected] (P.G. Betts), [email protected] (R.J. Armit). 1997; Murray and Kirkegaard, 1978; Shaw et al., 1996; Veevers, 2000; Veevers and Powell, 1984). However, the architecture of the Cork Fault as well as the timing of its initiation is still poorly under- stood because the geological record of the fault is incomplete or sparsely preserved (Murray, 1994; Murray and Kirkegaard, 1978; Wellman, 1990). In this study we use high resolution magnetic and gravity datasets to investigate the architecture of the Cork Fault and constrain the boundary between the Mount Isa terrane and the Thomson Orogen. Regional potential field datasets are increasingly used to unravel the crustal architecture of ancient tectonic sys- tems in regions with little or no geological exposure (Betts et al., 2003a; McLean and Betts, 2003). The method, although ambigu- ous, provides insights into structural architecture and kinematics and can be used to map the geology of buried terranes (Gunn et al., 1997). 2.5D potential field forward modelling has been undertaken to determine the architecture and kinematics of the Cork Fault and http://dx.doi.org/10.1016/j.precamres.2015.04.002 0301-9268/© 2015 Elsevier B.V. All rights reserved.
Transcript of Imaging the basement architecture across the Cork Fault in Queensland using magnetic and gravity...

IQ
GM
a
ARRAA
KMTGMCT
1
ez2mnip
R
LR
h0
Precambrian Research 264 (2015) 63–81
Contents lists available at ScienceDirect
Precambrian Research
jo ur nal homep ag e: www.elsev ier .com/ locate /precamres
maging the basement architecture across the Cork Fault inueensland using magnetic and gravity data
iovanni P.T. Spampinato ∗, Laurent Ailleres, Peter G. Betts, Robin J. Armitonash University, School of Earth, Atmosphere and Environment, Building 28, Clayton Campus, Wellington Road, Clayton, VIC 3800, Australia
r t i c l e i n f o
rticle history:eceived 5 December 2014eceived in revised form 2 March 2015ccepted 2 April 2015vailable online 9 April 2015
eywords:ount Isa terrane
homson Orogenravityagnetic
ork Faultasman Line
a b s t r a c t
The basement rocks in central Queensland are largely obscured by the Phanerozoic sedimentary succes-sion and direct information comes only from sparse geological data. 2.5D forward modelling of regionalaeromagnetic and Bouguer gravity data has been undertaken to unveil the crustal architecture at the junc-tion of the Proterozoic Mount Isa terrane and the Phanerozoic Thomson Orogen in Queensland. The mostprominent geophysical character is represented by the abrupt termination of positive NNW-trending geo-physical anomalies of the Mount Isa terrane against NE-trending, low amplitude gravity and magneticanomalies of the Diamantina River Domain of the Thomson Orogen. Potential field forward modellingindicates that the lower basement crust of the Thomson Orogen is petrophysically indistinguishable fromthe crust of the Proterozoic Mount Isa terrane. We interpret that the prominent gradients associated withthe Cork Fault represent the displacement and burial of the Mount Isa terrane crust under the ThomsonOrogen. In this context, the Cork Fault is inferred to represent a fundamental crustal discontinuity butdoes not represent the eastern margin of Rodinia because the Thomson Orogen is floored by Precambriancontinental crust.
Initiation of the Cork Fault might have occurred as early as the Mesoproterozoic. At that time, theCork Fault was a major structure that developed during the separation of the Mount Isa terrane and theCurnamona Province. It is inferred that this break-up occurred during initial N-S to NNW-SSE extension.The Cork Fault formed part of a network of major north- and south-dipping normal faults active at that
time. The Cork Fault was repeatedly reactivated during the Neoproterozoic Rodinia break-up and duringthe Phanerozoic evolution of the Tasmanides. We suggest that the segment of the inferred ‘Tasman Line’along the southern termination of the Mount Isa terrane should be regarded as a set of structures offset-ting the Proterozoic crust rather than a simple lineament dividing the Proterozoic and the PhanerozoicAustralian continent.. Introduction
The Cork Fault divides the Proterozoic Mount Isa terrane (Bettst al., 2006; Blake et al., 1984; O’Dea et al., 1997b) from the Phanero-oic Thomson Orogen (Finlayson et al., 1988; Glen, 2005; Glen et al.,010; Murray and Kirkegaard, 1978) in Queensland and is one of theost distinguishable geophysical features on the Australian conti-
ent (Fig. 1). Because of its prominence, the Cork Fault has beennterpreted to represent a major feature associated with the Neo-roterozoic break-up of Rodinia (Finlayson et al., 1988; Gunn et al.,
∗ Corresponding author at: P.O. Box 8059, Monash University LPO, Wellingtonoad, Clayton, VIC 3168, Australia. Tel.: +61 403500330.
E-mail addresses: [email protected] (G.P.T. Spampinato),[email protected] (L. Ailleres), [email protected] (P.G. Betts),[email protected] (R.J. Armit).
ttp://dx.doi.org/10.1016/j.precamres.2015.04.002301-9268/© 2015 Elsevier B.V. All rights reserved.
© 2015 Elsevier B.V. All rights reserved.
1997; Murray and Kirkegaard, 1978; Shaw et al., 1996; Veevers,2000; Veevers and Powell, 1984). However, the architecture of theCork Fault as well as the timing of its initiation is still poorly under-stood because the geological record of the fault is incomplete orsparsely preserved (Murray, 1994; Murray and Kirkegaard, 1978;Wellman, 1990).
In this study we use high resolution magnetic and gravitydatasets to investigate the architecture of the Cork Fault andconstrain the boundary between the Mount Isa terrane and theThomson Orogen. Regional potential field datasets are increasinglyused to unravel the crustal architecture of ancient tectonic sys-tems in regions with little or no geological exposure (Betts et al.,2003a; McLean and Betts, 2003). The method, although ambigu-
ous, provides insights into structural architecture and kinematicsand can be used to map the geology of buried terranes (Gunn et al.,1997). 2.5D potential field forward modelling has been undertakento determine the architecture and kinematics of the Cork Fault and
6 mbria
aicd
2
2
pB2raitt1ie22tOO
detes(
Ff
4 G.P.T. Spampinato et al. / Preca
ssociated structures. The results provide insights in understand-ng the Precambrian tectonic evolution of the Eastern Australianontinent and have implications for unravelling the nature of theeep crust of the Thomson Orogen.
. Regional geology
.1. The Mount Isa terrane
The Mount Isa terrane (Figs. 1 and 2) forms part of the Palaeo-roterozoic North Australian Craton (Betts et al., 2006; Bierlein andetts, 2004; Giles et al., 2006a; MacCready, 2006; Spikings et al.,001). The exposed Mount Isa inlier (Fig. 2) preserves a geologicalecord that spans more than 350 million years between ca. 1870nd 1500 Ma (Betts et al., 2006). The Mount Isa Inlier is dividedn an Eastern and Western fold belts (Fig. 2a) in which sedimen-ation and subsequent deformation have been heterogeneous inime and space (Betts et al., 2006; MacCready, 2006; O’Dea et al.,997b). Palaeoproterozoic supra-crustal rocks were deposited dur-
ng multiple superimposed rifting and subsidence events (Bettst al., 2006; Bierlein and Betts, 2004; Blake, 1987; Giles et al.,006a; MacCready, 2006; O’Dea et al., 1997a, 1997b; Spikings et al.,001) and overlie basement rocks deformed and metamorphosedo amphibolite facies during the ca. 1900–1870 Ma Barramundirogeny (Betts et al., 2006; Blake, 1987; Etheridge et al., 1987;’Dea et al., 1997b; Page and Williams, 1988).
The ca. 1790–1725 Ma Leichhardt Superbasin (Fig. 3) formeduring an E-W crustal extension event (Betts et al., 2006; O’Deat al., 1997a, 1997b) and was characterized by bimodal magma-
ism and clastic fluvial sedimentation (Jackson et al., 1990; O’Deat al., 1997b). A following ca. 1725–1690 Ma NW-directed exten-ional event marks the imposition of the Calvert Superbasin (Fig. 3)Jackson et al., 2000). The Calvert Superbasin is well representedig. 1. Area of study over a TMI magnetic grid; on the bottom right, TMI magnetic map ofrom Geoscience Australia (© Commonwealth of Australia – Geoscience Australia 2009).
n Research 264 (2015) 63–81
in the Western Fold Belt and was characterized by significant fel-sic magmatism and deposition of fluvial to shallow marine rocks onSE-thickening half graben (Betts et al., 1999; Southgate et al., 2000).A ca. 1675 Ma switch in the regional extension direction resultedin the development of the Isa Superbasin (Fig. 3) (Betts et al., 2006;Hutton et al., 2012). The Isa Superbasin is interpreted to reflect aperiod of thermal subsidence (Betts and Lister, 2001; Betts et al.,1999, 2001) and fault reactivation (Andrews, 1998; Betts, 2001;Krassay et al., 2000; Scott et al., 1998) during NNE-SSW-directedextension (Gibson et al., 2008).
The ca. 1800–1600 Ma basinal evolution was terminated by theonset of the Isan Orogeny (Fig. 3) (Bell, 1983; Betts et al., 2006;Blake, 1987; Giles et al., 2006b; O’Dea et al., 1997b, 2006; Pageand Bell, 1986). This shortening event strongly overprinted previ-ous tectonic fabrics and resulted in reactivation of existing normalfaults as reverse faults (Giles et al., 2006b). The early stage of theIsan Orogeny occurred during a ca. 1600–1580 Ma N-S- to NW-directed crustal shortening (Betts et al., 2006; Giles et al., 2006b;O’Dea et al., 2006). The following ca. 1570–1550 Ma Middle IsanOrogeny developed through a major E-W crustal shortening event(Giles et al., 2006b; O’Dea et al., 1997b). Crustal-scale upright foldsand major N-S-trending reverse faults and thrusts were imposedat this time (Giles et al., 2006b; MacCready et al., 1998). The sub-sequent ca. 1550–1540 Ma wrenching tectonic stage defined thetransition from ductile folding to brittle deformation (Giles et al.,2006b; O’Dea et al., 1997b). The ca. 1530–1500 Ma final stage of theIsan Orogeny is characterized by E-W- to ESE-directed deformation(Betts et al., 2006) and emplacement of A-type and I-type granitesin the eastern part of the exposed inlier (Wyborn, 1998).
The Mount Isa terrane is considered to be cratonised after theIsan Orogeny and the architecture of the region has not changedsince the Late Mesoproterozoic (Fig. 4) (Betts et al., 2006; O’Deaet al., 1997b).
the Australian continent. Values in the legend bar are in nT. Magnetic data sourced

G.P.T. Spampinato et al. / Precambrian Research 264 (2015) 63–81 65
Fig. 2. (a) Tectonic subdivision of the Mount Isa Inlier, modified from Blake (1987) and O’Dea et al. (1997b); (b) simplified tectonic map showing the position and extent oft 92); af
2
a(1tKd1
ca(iMtsKsBto
pawL(ab2eiesTLD2
he Mount Isa Inlier along with its geophysical domain, modified from Wellman (19rom Glen (2005).
.2. The Thomson Orogen
Neoproterozoic to Ordovician meta-siltstone, quartzite, schistnd igneous intrusive rocks of the adjacent Thomson OrogenFigs. 1–4) (Draper, 2006; Murray, 1994; Murray and Kirkegaard,978; Withnall et al., 1995) are concealed by Middle Palaeozoico Mesozoic sedimentary successions (Glen, 2005; Murray andirkegaard, 1978). The basement rocks of the Thomson Orogeneposited predominantly in a deep water environment (Murray,994).
On the north-western margin of the Thomson Orogen and adja-ent to the southern margin of the Mount Isa terrane, U–Pb SHRIMPnalyses on detrital zircons from basement-intersecting drill holesGSQ Machattie 1 and HPP Goleburra 1, Fig. 5) indicated a max-mum depositional age of ca. 650 Ma (Carr et al., 2014). In the
aneroo Platform, drill hole AAP Fermoy 1 (Fig. 5) intersected Earlyo Late Cambrian (K–Ar and Rb–Sr analyses on muscovite phyllite)chistose and phyllitic basement rocks (Murray, 1994; Murray andirkegaard, 1978). U–Pb (SHRIMP) zircon analyses on basementamples from AAO Beryl 1, GSQ Maneroo 1 (Maneroo Platform), Dioetoota 1 (western Thomson Orogen) and GSQ Eromanga 1 (cen-ral Thomson Orogen, Fig. 5) indicated a maximum deposition agef ca. 495 Ma (Brown et al., 2014; Carr et al., 2014).
Initial deposition is likely to have occurred during the Neo-roterozoic to Middle Cambrian (Fig. 3) (Draper, 2006; Murraynd Kirkegaard, 1978; Withnall et al., 1995). The rock packageas subsequently deformed and metamorphosed by Middle to
ate Cambrian tectonic event coeval with the Delamerian OrogenyDraper, 2006; Murray and Kirkegaard, 1978). Renewed depositionnd emplacement of volcanic rocks occurred during Late Cam-rian to Middle Ordovician (Fig. 3) (Brown et al., 2014; Draper,006; Murray and Kirkegaard, 1978). At this time, rocks of north-astern Australia have been interpreted to represent a back-arcgneous province associated with a convergent margin furtherast (Fergusson et al., 2007a). Middle Silurian (ca. 428 Ma) fel-ic magmatism occurred in the Thomson Orogen (Draper, 2006).
he emplacement of intrusive bodies may have occurred during aate Benambran contractional deformation (Champion et al., 2009;raper, 2006) which has been recorded to the east (Fergusson et al.,005, 2007b) and south (Foster and Gray, 2000; Glen, 2005; Glennd (c) distribution of some of the central and eastern Australian orogens, modified
et al., 2007) of the Thomson Orogen. However, Spampinato et al.(2015a) suggested that Middle Silurian felsic magmatism mightreflect a period of crustal extension due to the retreat of a congestedplate margin located further southeast (Moresi et al., 2014).
Early Devonian intra-continental trans-tension resulted in thedevelopment of the widespread Adavale Basin (Figs. 3 and 4) (Evanset al., 1992; McKillop et al., 2007). During the Middle Carbonif-erous, the Adavale Basin was deformed and exhumed (Finlaysonet al., 1990b). The remnant synclinal structures reflecting thedeepest sedimentary deposition and recorded in deep seismic sur-veys (Leven et al., 1990; Wake-Dyster et al., 1983), are termed –from west to east – the Warrabin, Quilpie, Cooladdi and Westgatetroughs (Hoffmann, 1988; Mathur, 1983; Pinchin and Senior, 1982).
A hiatus of ca. 70 Myrs separates the Devonian sediments ofthe Adavale Basin from the Late Carboniferous to Middle TriassicGalilee Basin (Figs. 3 and 4) (Finlayson et al., 1988). The GalileeBasin is a large intra-cratonic basin which is predominantly filledby fluvial deposits (Van Heeswijck, 2010). In the Lovelle Depression(Fig. 4) over 700 m of Permian and Triassic sediments accumulatedover Precambrian and Early Palaeozoic metamorphic and graniticrocks (Hawkins and Harrison, 1978). The Galilee Basin was invertedduring the Hunter-Bowen Orogeny which resulted in the develop-ment of large-scale thrust faults (Van Heeswijck, 2010).
The Early Jurassic to Late Cretaceous Eromanga Basin uncon-formably overlies the northern part of the Mount Isa terrane, thebasement rocks of the Thomson Orogen, the Devonian sedimentarysequences and the Galilee Basin (Finlayson et al., 1988; Mathur,1983; Senior et al., 1978; Spence and Finlayson, 1983). Terres-trial to shallow marine sedimentary rocks of the Eromanga Basinextend over an area of approximately 1,200,000 km2 and have beenaffected by minor deformation associated with Cenozoic shorten-ing events which mostly reactivated the existing fault architecture(Leven et al., 1990; Moss and Wake-Dyster, 1983).
3. Previous geophysical surveys
3.1. The Mount Isa terrane
In 2006, deep crustal seismic reflection survey was undertakenalong six transects across North Queensland (Fig. 5). The survey

66 G.P.T. Spampinato et al. / Precambria
Fig. 3. Time–space diagram illustrating the major depositional sequences and defor-mation events across the Mount Isa terrane and the Thomson Orogen from thePalaeoproterozoic to Late Palaeozoic.
MA
h(COam
took a seismic survey in the western part of the Galilee Basin
odified from Murray (1990), O’Dea et al. (1997b), Betts et al. (2006) and Foster andustin (2008).
as been conducted by the Geological Survey of QueenslandGSQ), Geoscience Australia (GA), the Predictive Mineral Discoveryooperative Research Centre (PMD*CRC) and Zinifex Pty Ltd (now
Z Minerals). Signals were recorded to 20 s two-way travel timepproximately equivalent to 60 km in depth. The aim was to deter-ine, among other goals, a geodynamic framework of the Northn Research 264 (2015) 63–81
Queensland (Murray, 2007). In addition, two previous transectsfrom the Mount Isa deep seismic lines shot by the AustralianGeological Survey Organisation (AGSO) in 1994 were reprocessedto standardize the methodology and uniform the available data.
The Mount Isa terrane is characterized by weakly reflective andseismically homogeneous crust extending to ∼55 km depth (Fig. 6)(Korsch et al., 2012). The region can be divided in two broad tectonicdomains having contrasting tectonic styles and regional vergences(Betts et al., 2006; MacCready, 2006; O’Dea et al., 1997b). TheEastern Fold Belt is characterized by west-directed deformationslocated above the crystalline basement rock (MacCready, 2006).The Western Fold Belt instead shows east-directed deformationsthat affect the basement rocks (MacCready, 2006). Seismic dataindicate that major fault zones, including the west-dipping MountIsa, Rufus and Quilalar faults in the Western Fold Belt (Korsch et al.,2008; O’Dea et al., 1997a) and the east-dipping Pilgrim and Clon-curry faults (Austin and Blenkinsop, 2010; Blenkinsop et al., 2008)in the Eastern Fold Belt (Figs. 2a and 6), controlled the architectureof the area. These are interpreted to represent major structuresthat accommodated the Late Palaeoproterozoic basinal depositionand were reactivated as reverse faults during the Early Mesopro-terozoic Isan Orogeny (Betts et al., 2006; Blenkinsop et al., 2008;Gibson et al., 2006; MacCready, 2006; O’Dea et al., 1997b).
3.2. The Thomson Orogen
Over the period 1980–1986 the Australian Bureau of MineralResources (BMR) recorded deep reflection surveys across the cen-tral part of the Eromanga Basin (Fig. 5). The results providednew insights into the crustal architecture of the Thomson Oro-gen. ∼1400 km of new seismic reflection data were obtained and∼2300 km of existing data over the Eromanga Basin were repro-cessed (Moss and Wake-Dyster, 1983; Wake-Dyster et al., 1983).
Seismic data indicate that high angle thrust faults form thedominant deformation style (Fig. 7) (Finlayson et al., 1988). Thetop reflective zone at 1–2 s represents the shallow sedimentarysequences (Pinchin and Senior, 1982). The underlying basementrocks show heterogeneous seismic fabric and have been divided ina non-reflective upper crust extending between 2.5 and 8 s and areflective lower crust between 8 and 12 s (Finlayson et al., 1990a,1990b; Mathur, 1983, 1984, 1987). The bottom zone with no reflec-tions and refraction velocities of 8.2 km/s is interpreted to representthe seismically homogeneous upper mantle (Mathur, 1983). Thenon-reflective character of the upper crust may be due to the severedeformation of meta-sedimentary and meta-volcanic rocks (Locket al., 1986; Mathur, 1983; Spence and Finlayson, 1983). Mathur(1983) and Finlayson et al. (1989) suggested that the reflectiv-ity in the lower crust may be due to mafic intrusions related toLate Neoproterozoic to Middle Palaeozoic extensional events. Glenet al. (2013) suggested that the lower crust may represent igneousoceanic crust equivalent to the crust that floors most of the LachlanOrogen (Fig. 2) in the southern Tasmanides.
3.3. The Cork Fault zone
The architecture of the deep crust along the Cork Fault zone isunresolved because there are no deep seismic transects across thestructure. However, several 4 s two-way travel time seismic surveyshave been conducted within the region and a number of these crossthe Cork Fault, providing insights into the shallow tectonic settingof the fault (Fig. 8).
In 1975, The Bureau of Mineral Resources (BMR) under-
(Figs. 4 and 8). The seismic survey recorded ∼320 km of contin-uous single-coverage reflection recording. The aim was to obtaininformation on the extent and thickness of the western part of

G.P.T. Spampinato et al. / Precambrian Research 264 (2015) 63–81 67
atures
tABtaom
Fi
M
Fig. 4. Map of the geological domains and major structural fe
he Galilee Basin (Harrison and Bauer, 1976). In the 1980s, Essoustralia recorded ∼6436 km of lines to investigate the Galileeasin and the Maneroo Platform of the Thomson Orogen (Fig. 8). Inhe 1982, Crusader Ltd completed a series of seismic surveys across
portion of the Eromanga–Galilee basins on the down thrown sidef the Cork Fault/Holberton Structure complex (Fig. 8). Further seis-ic surveys were undertaken in the Galilee–northern Eromanga
ig. 5. Location of some of the 2006 Deep Seismic Transects crossing the Mount Isa terrantersecting drill holes over a composite total magnetic and tilt derivative magnetic map.
agnetic data sourced from Geoscience Australia (© Commonwealth of Australia – Geosc
of the southern Mount Isa terrane and the Thomson Orogen.
basins over the plateau area formed by the Nisbet Range and Kan-garoo Mountains (Fig. 8). The Opalton Seismic Survey operated byMinora Resources NL is located south of the Lovelle Depressionwithin the Galilee Basin and covers an area of ∼5990 km2 (Fig. 8).
Within the Cork Fault zone – Diamantina River Domain, thedominant structural grain trends northeast. The faulting pat-tern is generally more complicated within the basement rocks
ne; 1980–1984 BMR Central Eromanga deep seismic reflection profiles; basement- Values in the legend bar are in nT.
ience Australia 2009).
68 G.P.T. Spampinato et al. / Precambrian Research 264 (2015) 63–81
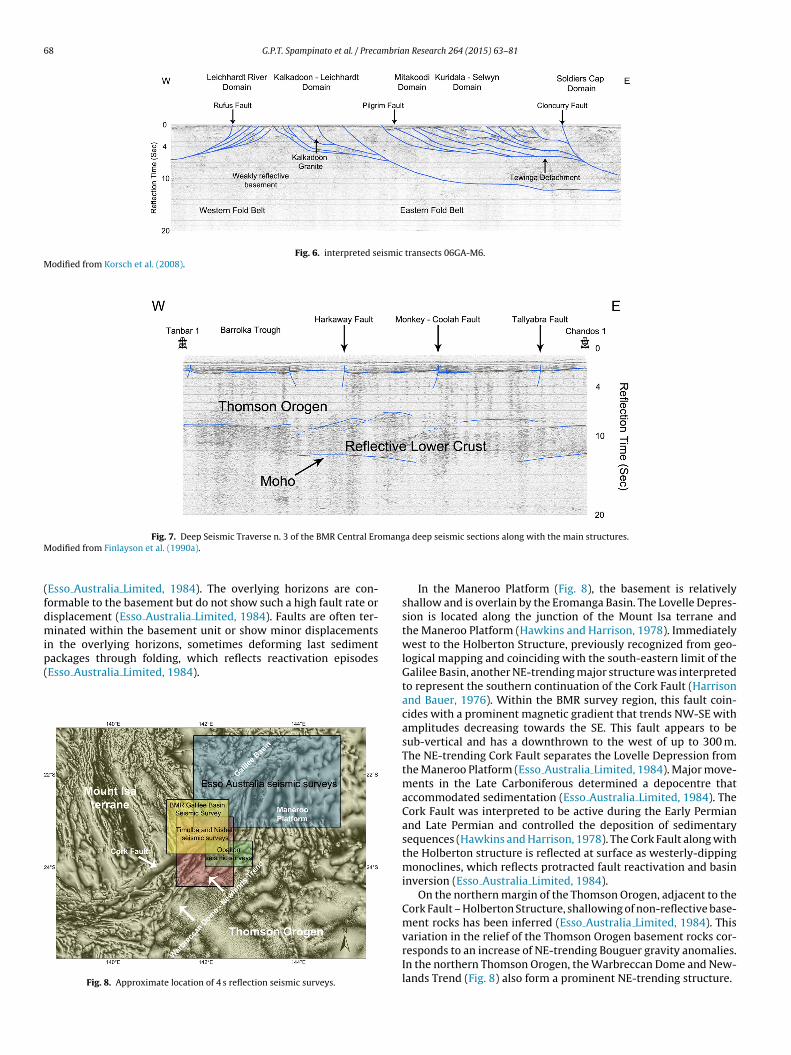
Fig. 6. interpreted seismic transects 06GA-M6.Modified from Korsch et al. (2008).
mangM
(fdmip(
Fig. 7. Deep Seismic Traverse n. 3 of the BMR Central Eroodified from Finlayson et al. (1990a).
Esso Australia Limited, 1984). The overlying horizons are con-ormable to the basement but do not show such a high fault rate orisplacement (Esso Australia Limited, 1984). Faults are often ter-inated within the basement unit or show minor displacements
n the overlying horizons, sometimes deforming last sediment
ackages through folding, which reflects reactivation episodesEsso Australia Limited, 1984).Fig. 8. Approximate location of 4 s reflection seismic surveys.
a deep seismic sections along with the main structures.
In the Maneroo Platform (Fig. 8), the basement is relativelyshallow and is overlain by the Eromanga Basin. The Lovelle Depres-sion is located along the junction of the Mount Isa terrane andthe Maneroo Platform (Hawkins and Harrison, 1978). Immediatelywest to the Holberton Structure, previously recognized from geo-logical mapping and coinciding with the south-eastern limit of theGalilee Basin, another NE-trending major structure was interpretedto represent the southern continuation of the Cork Fault (Harrisonand Bauer, 1976). Within the BMR survey region, this fault coin-cides with a prominent magnetic gradient that trends NW-SE withamplitudes decreasing towards the SE. This fault appears to besub-vertical and has a downthrown to the west of up to 300 m.The NE-trending Cork Fault separates the Lovelle Depression fromthe Maneroo Platform (Esso Australia Limited, 1984). Major move-ments in the Late Carboniferous determined a depocentre thataccommodated sedimentation (Esso Australia Limited, 1984). TheCork Fault was interpreted to be active during the Early Permianand Late Permian and controlled the deposition of sedimentarysequences (Hawkins and Harrison, 1978). The Cork Fault along withthe Holberton structure is reflected at surface as westerly-dippingmonoclines, which reflects protracted fault reactivation and basininversion (Esso Australia Limited, 1984).
On the northern margin of the Thomson Orogen, adjacent to theCork Fault – Holberton Structure, shallowing of non-reflective base-ment rocks has been inferred (Esso Australia Limited, 1984). This
variation in the relief of the Thomson Orogen basement rocks cor-responds to an increase of NE-trending Bouguer gravity anomalies.In the northern Thomson Orogen, the Warbreccan Dome and New-lands Trend (Fig. 8) also form a prominent NE-trending structure.
mbria
3
2ta2et2witTasrbfm2
4
4
fwStsghm
adGeAg
tiMdaatofitabtweftTgbdtl
G.P.T. Spampinato et al. / Preca
.4. Tomographic data
Surface wave tomography imaging indicated that, within50 km depth, the Archaean and Proterozoic geological domains ofhe Australian continent, including the Mount Isa terrane, are char-cterized by high wave speeds (Fichtner et al., 2009; Fishwick et al.,008; Kennett et al., 2004; Simons et al., 1999). In the Phanerozoicastern Australia, including the Thomson Orogen, wave propaga-ion appears relatively slow (Fishwick et al., 2008; Kennett et al.,004), although the Thomson Orogen is characterized by higherave speed lithosphere when compared to the rest of the Tasman-
des (Fishwick et al., 2008; Kennett et al., 2004). In this scenario,he Cork Fault, separating the Proterozoic crust of the Mount Isaerrane from the Phanerozoic Thomson Orogen, would represent
fundamental crustal boundary in which rock packages on eitheride of the fault are different. However, the higher speed velocitiesecorded in the Thomson Orogen suggest that the latter is flooredy thinned Precambrian continental crust at depth and, thus, dif-ers from the rest of the Tasmanides, where lower velocities may
ostly reflect younger oceanic lithosphere (Fishwick et al., 2005,008; Kennett et al., 2004).
. Methods
.1. Image interpretation
Aeromagnetic and gravity data interpretation is a powerful toolor regional geology and large-scale characterization in regionsith little or no geological exposure (Aitken and Betts, 2009;
tewart and Betts, 2010b). The method provides insights into struc-ural architecture and kinematics although it does not have uniqueolution (Betts et al., 2003b; Stewart and Betts, 2010b). However,eological and geophysical constraints such as seismic data, drilloles, geochemical data and observations in the surrounding areasay reduce significantly the ambiguity.In 2006, the Geological Survey of Queensland started new
cquisition of high resolution gravity and airborne geophysicsata throughout Queensland including the Mount Isa terrane andalilee/Thomson regions. Over 50% of Queensland has been cov-red by high resolution gravity data having 2–4 km station spacing.eromagnetic data were collected at a line spacing of 400 m and around clearance of 80 m (Chopping and Henson, 2009).
Magnetic and gravity datasets have been processed in ordero enhance the geophysical signal and to assist in the geologicalnterpretation. Image processing has been carried out using Oasis
ontajTM which allows viewing and processing of potential fieldatasets, grids and images within one integrated environment. In
total magnetic intensity (TMI) grid, the shape of the magneticnomalies is function of the geometrical and petrophysical proper-ies of the source bodies as well as the inclination and declinationf the main magnetic field (the Earth’s magnetic field). We haverstly applied a reduced to the pole filter to the TMI grid. This fil-er reconstructs the magnetic field of a given region as if it weret the pole. As a result, anomalies are brought over their sourceodies and their shape can be associated with geometries or varia-ion of magnetic susceptibility of the source bodies. Further filtersere applied to the RTP magnetic and Bouguer gravity grids to
nhance the geophysical signal and identify source bodies at dif-erent crustal levels. The vertical derivative filter has been appliedo better determine the boundaries of the potential source bodies.his filter calculates the vertical rate of change in the magnetic orravity signal. As a result, boundaries between source bodies have
een sharpened and have been identified more accurately. The tilterivative filter calculates the ratio of the vertical gradient and theotal horizontal gradient irrespective of the amplitude or wave-ength of the magnetic field. As a result, this filter can be appliedn Research 264 (2015) 63–81 69
as an edge detection method and also enhances weak magneticanomalies. The tilt filtered grid has been superimposed onto thevertical derivative grid in order to highlight the structural architec-ture of the region and to interpret overprinting relationships. Lowpass filter has been used to remove the noise that may arise whenderivative filters are applied and to retain the longest wavelengths.GIS based structural and lithological interpretation mapping fromthese filtered grids was then undertaken.
4.2. Forward modelling
Forward modelling technique allows testing the validity of theinterpretation in 2–2.75 dimensions (Gunn et al., 1997). Geologicalmodels have been built using GM-SYSTM Profile Modelling whichallows for comparison between the calculated (modelled) gravityand magnetic responses to observed measurements. Cross sectionsare extracted along selected profiles that orthogonally intersectthe major structures in the study area. Rock packages are thendivided in geological units and are assigned unique geometricaland petrophysical properties (McLean and Betts, 2003; McLeanet al., 2008). This generates calculated magnetic and gravity profilesalong the cross sections which are compared to the observed geo-physical response. The parameters are adjusted until the calculatedand observed geophysical profiles show an acceptable correlation(Blakely, 1995).
Total magnetic and Bouguer gravity data have been extractedalong two profiles crossing the Cork Fault (profiles 1 and 3, Fig. 9).Profile n. 2 lies entirely within the Thomson Orogen (Fig. 9). Theforward model n. 1 extends through the Warbreccan – Newlandstrend and the Canaway Ridge because the architecture of the lat-ters are well known from seismic reflection imaging and this allowsa priori structuring of the region. Profile n. 2 has been built alongthe Central Eromanga deep seismic surveys n. 7E and 7W (Fig. 5).The seismic data constrain the interpretation and provides a prioristructural modelling of the region. Although the forward model n.3 is unconstrained, sparse data provided by basement-intersectingdrill holes located in the vicinity of the profile and 4 s reflection seis-mic data within the area can been used to gain information aboutthe geometries of the sedimentary succession and the shallow base-ment rocks. Furthermore, the southern ending of the forward modeln. 3 intersects the constrained forward model n. 2. The intersectionpoint can be used as a constrained reference point.
The forward models cover a total linear distance of ∼725 kmand have been modelled to 50 km depth. The Curie depth variesfrom ∼40 km in the southern Mount Isa terrane to ∼24 km in thenorthern Thomson Orogen (Maule et al., 2009).
5. Geophysical signature of the region
The Mount Isa terrane shows the highest amplitude geophys-ical signature (up to 2200 nT and 450 �m s−2) when compared tothe surrounding regions. The adjacent Thomson Orogen is char-acterized instead by lower magnetic (between 180 and −650 nT)and Bouguer gravity (between 200 and −500 �m s−2) amplitudesand smoother magnetic texture. The Mount Isa terrane shows aprominent N-S- to NNW-trending structural grain while the Thom-son Orogen is characterized by a network of NE- and NW-trendinganomalies mostly evident in the Bouguer gravity grid (Fig. 10). Onthe magnetic map, the boundary between the two provinces isdefined by a prominent NE-trending anomaly that extends for morethan 500 km and is associated with the Cork Fault (Fig. 9). In the RTP
magnetic grid, The Cork Fault zone is defined by steep NW-orientedgradients of ∼150 nT/km, decreasing towards the south. The promi-nent NW-oriented Bouguer gravity gradients (∼50 �m s−2/km)which separates the high amplitude gravity anomalies of the Mount
70 G.P.T. Spampinato et al. / Precambrian Research 264 (2015) 63–81
F straini monw
IOaz
Ft
GG
ig. 9. Location of the forward models 1 (Fig. 13), 2 (Fig. 14) and 3 (Fig. 15) and conn the scale bar are in nT. Magnetic data sourced from Geoscience Australia (© Com
sa terrane from the low intensity gravity anomalies of the Thomsonrogen (Fig. 10) define a prominent NE-trending gravity anomaly,
lthough the latter occurs ∼30 km south of the inferred Cork Faultone.ig. 10. Bouguer gravity map of the boundary between the Mount Isa terrane andhe Thomson Orogen. Values in the legend bar are in �m s−2.
ravity data sourced from Geoscience Australia (© Commonwealth of Australia –eoscience Australia 2009).
ing drill holes over a composite RTP and vertical derivative magnetic map. Valuesealth of Australia – Geoscience Australia 2009).
The Diamantina River Domain of the Thomson Orogen showsa persistent low magnetic signature with amplitude valuescomprised between −100 nT and −650 nT and Bouguer gravityanomalies of up to ∼200 �m s−2 that decrease to ∼−350 �m s−2
towards the southeast of the domain (Figs. 9 and 10). An arcuate
NE-trending high gravity belt with amplitudes between −100 and200 �m s−2 but little magnetic expression characterizes the north-ern Diamantina River Domain and lies immediately adjacent to theCork Fault (Figs. 10 and 11).Fig. 11. Vertical derivative Bouguer gravity map over a grey tilt and vertical deriva-tive magnetic map of the boundary between the Mount Isa terrane and the ThomsonOrogen. CoF, Cork Fault; WaF, Warbreccan Fault; CaF, Canaway Fault; HF, Hark-away Fault. Values in the legend bar are in �m s−2/m. Magnetic and gravity datasetssourced from Geoscience Australia (©Commonwealth of Australia – GeoscienceAustralia 2009).

mbria
buNdTFmcpsoFtS
tmsNl
6
trd(oarRrbltNta(S
G.P.T. Spampinato et al. / Preca
Further south, a series of NE-trending structures are definedy NE-trending Bouguer gravity anomalies with amplitude val-es between −20 and −260 �m s−2. These structures include theW-dipping Warbreccan Fault, which has been imaged in seismicata and delimits the north-western extent of the Devonian Barcoorough (Finlayson et al., 1988). On the RTP map, the Warbreccanault is less well defined and corresponds to a regional increase ofagnetic anomalies above −100 nT. Finlayson et al. (1988) indi-
ated that the trend of the Warbreccan Fault is approximatelyarallel to the edge of the Precambrian Craton (the Cork Fault) anduggested that this fault initiated during the early tectonic historyf the Thomson Orogen. Similar to the Cork Fault, the Warbreccanault is considered a major lithospheric structure and may pene-rate the entire crust (Finlayson and Leven, 1987; Passmore andexton, 1984).
Short wavelength, magnetic anomalies are superimposed ontohe regional magnetic signal. These anomalies show a variety of
agnetic responses and appear to be focused along NE-trendingtructures, including the Cork Fault and the Warbreccan Dome –ewlands Trend. These anomalies are co-located with short wave-
ength, either positive or negative gravity responses.
. Regional interpretation
High amplitude geophysical anomalies located to the north ofhe Cork Fault might represent magnetic rocks of the Mount Isa ter-ane, which have been intersected by several drill holes at a shallowepth (∼1–4 km) (Chopping and Henson, 2009). Spampinato et al.2015b) suggested that the intensely positive magnetic responsesf the Mount Isa terrane are most likely related to Barramundi-ged basement rocks and meta-volcanic and meta-sedimentaryocks associated with the formation of the Leichhardt Superbasin.egions with more subdued magnetic and gravity anomalies mayeflect the distribution of the non-magnetic Calvert and Isa super-asins (Betts et al., 2004; Spampinato et al., 2015b) or shallow,
ow magnetic granitic intrusions. The N-S to NNW structural grainhat characterizes the Mount Isa terrane correlates well with major-S- to NNW-trending fault zones interpreted to accommodate
he Palaeoproterozoic deposition and subsequently reactivateds reverse thrusts during the ca. 1600–1500 Ma Isan OrogenyBetts et al., 2006; Giles et al., 2006a, 2006b; O’Dea et al., 2006;pampinato et al., 2015b; Wellman, 1992).
Fig. 12. Lithological map of the southernmost part of the M
n Research 264 (2015) 63–81 71
The Thomson Orogen is characterized by lower amplitudesand long wavelength anomalies suggesting thicker sedimentarysequences and deeper magnetic source bodies when comparedto the Mount Isa terrane. Combined potential field and seis-mic interpretation indicate that Bouguer gravity anomalies below−300 �m s−2 define the distribution of the Devonian basinalsequences (Collins and Lock, 1990; Spampinato et al., 2015a).Long wavelength magnetic signatures are likely to reflect magneticsource bodies at mid- to low crustal level, above the Curie depth.
The steep regional gradients that characterize the Cork Faultreflect high petrophysical contrast between the crusts of the MountIsa terrane and the Thomson Orogen. The prominent geophysicalsignatures that define the boundary of these two terranes are likelyto reflect either two fundamentally different juxtaposed terranesor the burial of a magnetic crust beneath younger rock packages.In both cases, the Cork Fault marks a tectonic boundary betweenthe cratonised Proterozoic Mount Isa terrane (Betts et al., 2006)and the Thomson Orogen which was a tectonically active regionuntil the Carboniferous (Murray and Kirkegaard, 1978). ENE- toNE-trending, short wavelength positive magnetic and co-locatedhigh frequency gravity anomalies bounding the northern flank ofthe Cork Fault are interpreted to represent low density graniticintrusions or dense mafic rocks (Fig. 12). These granitic and maficbodies do not trend N-S in alignment with the major structuralfabric of the Mount Isa terrane and it is likely that the inferredemplacement of granitoids and mafic rocks occurred at the time ofinitiation or reactivation of the Cork Fault. K–Ar analysis on graniticrocks in drill holes CPC Ooroonoo 1 (Fig. 5) yielded a isotopic ageof ca. 858 Ma (Murray and Kirkegaard, 1978), supporting that post-Mesoproterozoic tectonics affected the southern termination of theMount Isa terrane, although post-Isan Orogenic events did not sig-nificantly change the architecture of the region (Betts et al., 2006).The NE-trending, high amplitude gravity anomaly lying the imme-diate south of the Cork Fault (Fig. 10) might reflect a belt of shallowand dense basement rocks (Fig. 12). This belt of high density rockshows poor magnetic expression, thus it is inferred that the shal-low basement of the Diamantina River Domain must be formedby weakly magnetized rocks when compared to the rocks of thesouthern Mount Isa terrane. This belt bounds the NE-trending geo-
physical anomalies associated with the Cork Fault and this suggeststhat the two structures may be related. The positive regional grav-ity signature associated with the Warbreccan Dome – NewlandsTrend is interpreted to represent shallowing of basement rocks ofount Isa terrane and the northern Thomson Orogen.

7 mbria
th
bsstcBmpaa
7
7
ltsba
mbmiPret2l1mot2mif
rMase1IMdwft
7
sBFDWl
2 G.P.T. Spampinato et al. / Preca
he Thomson Orogen, as confirmed by basement-intersecting drilloles and seismic data.
Variation in the regional magnetic signature across the War-reccan Fault suggests that the latter may represent a majortructure within the Thomson Orogen. The orientation and exten-ion of the Warbreccan Dome – Newlands Trend are comparableo that of the Cork Fault suggesting that these two structures mayorrelate. Short wavelength, positive magnetic and low amplitudeouguer gravity anomalies focused along NE-trending structuresay reflect source bodies at shallow crustal level and are inter-
reted to represent granitic intrusions (Fig. 12). The orientationnd alignment of these intrusions suggest that their geometriesre controlled by the regional structural architecture.
. Forward models
.1. Parameters and seismic constraints
The crust and the upper mantle are modelled as six discreteayers to honour the constraining seismic data and to best representhe vertical heterogeneities in petrophysical characteristics at thecale of the models. The shallowest geological unit is representedy the sedimentary sequence of the reflective Eromanga, Coopernd Galilee basins (Pinchin and Senior, 1982).
In the Mount Isa terrane, the underlying poorly reflective base-ent rocks has been sparsely drilled at a shallow level and has
een modelled to extend from approximately 1 km to approxi-ately 42 km in depth. The basement crust of the Mount Isa terrane
ncludes the Barramundi-aged crystalline basement as well asalaeo- to Mesoproterozoic meta-sedimentary and meta-volcanicocks, which have been mapped in the exposed inlier (Beardsmoret al., 1988; Blake et al., 1984; O’Dea et al., 1997b) and imaged inhe 2006 Deep Seismic Transects (Korsch et al., 2008; MacCready,006). In the Thomson Orogen, the non-reflective zone under-
ying the reflective sedimentary rocks (Finlayson et al., 1990a,990b; Mathur, 1983, 1984, 1987) corresponds to the upper base-ent which extends from ∼1 to 4 km depth to a maximum depth
f ∼20 km. Mathur (1987) indicated that the upper basement ofhe Thomson Orogen has a range of densities from 2.55 g/cm3 to.85 g/cm3. Best fit models are achieved dividing the upper base-ent of the Thomson Orogen in two discrete layers, which takes
nto account the density increases with increasing depth inferredrom the seismic velocities (Mathur, 1987).
The transition to the lower crust is defined by an increase ineflectivity and seismic velocities (Finlayson et al., 1990a, 1990b;athur, 1983, 1984, 1987) and has been imaged to extend to
pproximately 39–45 km depth. The underlying upper mantlehows poor reflectivity in both the Mount Isa terrane (Korscht al., 2012; MacCready, 2006) and the Thomson Orogen (Mathur,983). Deep seismic profiles show that the Moho under the Mount
sa terrane is deeper (∼42–45 km depth) (Korsch et al., 2012;acCready, 2006) than beneath the Thomson Orogen (∼38–42 km
epth) (Mathur, 1983). NW-oriented forward models n. 1 and n. 3ere created to intersect orthogonally the Cork Fault (Fig. 9). The
orward model n. 2 is oriented ENE and has been extracted alonghe 1983 BMR Deep Seismic Transects n. 7E and 7W (Fig. 9).
.2. Forward model n. 1
Profile n. 1 is ∼310 km long and is oriented northwest to inter-ect the Mount Isa terrane, the Lovelle Depression in the Galileeasin, the Cork Fault, the Diamantina River Domain, the Canaway
ault and the Adavale Basin within the Thomson Orogen (Fig. 13).rill holes EAL Cork 1, EHN Holberton 1, AAP Mayneside 1, MANaterloo 1 and LOL Belmore 1 constrain the geometries of the shal-ow basement rocks (Fig. 9). The Central Eromanga deep seismic
n Research 264 (2015) 63–81
profiles n. 2, 5 and 6 and shallow seismic surveys (Fig. 5) provideinformation about the geometries under the Lovelle Depression,Barcoo Trough and Canaway Ridge and allow for a priori structuringof the region.
The observed gravity profile (Fig. 13) shows a peak of∼150 �m s−2 associated with the crust of the mount Isa terrane,which regionally decreases towards the Diamantina River Domainwith gradients of ∼3 �m s−2/km. This trend is interpreted to reflectthe deepening of a basement crust towards the southeast. Tothe south of the Diamantina River Domain, the Thomson Oro-gen shows gravity anomalies with amplitude values comprisedbetween −420 and −130 �m s−2. Positive structures or shallow-ing of the upper basement under the depositional sequences areassociated with relatively high intensity Bouguer gravity anomalieswith amplitude values comprised between −300 and −130 �m s−2.The lowest amplitude values reflect regions where the sedimen-tary sequences are thicker. The Devonian Adavale Basin and BarcooTrough are characterized by gravity anomalies below −300 �m s−2.By inference we interpret that regions characterized by low gravityanomalies ranging between −300 until −420 �m s−2 may reflectsignificant thickening (up to 4.5 km) of the sedimentary sequencesand might contain remnants of the Devonian sedimentary deposi-tion (Fig. 12).
Positive regional magnetic anomalies with peak amplitudes of∼620 nT decrease towards the southeast. The Cork Fault is associ-ated with a steep gradient of ∼20 nT/km that decreases towardsthe southeast. Under the Thomson Orogen, the observed magneticprofile shows low amplitude and smooth magnetic responses. Thepotential field forward model supports a scenario in which a mag-netic crust is shallower in the Mount Isa terrane and deeper in theThomson Orogen.
In the Thomson Orogen, variations in the relief of the upperbasement is well represented in the observed gravity profile butcorrelates poorly with the magnetic signature along the pro-file, indicating that its magnetic contribution might be negligible.Instead, the long wavelength magnetic signature is likely to reflectmagnetic source bodies at mid- to low crustal level, above the Curiedepth.
The shallower unit has been modelled as a non-magnetic sed-imentary sequence (D = 2.55 g/cm3) extending up to 3.7 km depth.The shallow (within ∼2 km of the surface), non-reflective basementcrust of the Mount Isa terrane extends down to ∼44 km depth (Curiedepth) and is modelled with a magnetic susceptibility of 0.069 SI.To the southeast, the upper basement rocks of the Thomson Oro-gen (D = 2.73 and 2.79 g/cm3) have been assigned zero magneticsusceptibility and regionally thicken towards the southeast. Thistwo-layered block corresponds to the non-reflective upper base-ment rocks imaged in the seismic data. In the Thomson Orogen,a high density, two-layered block (D = 2.80–2.90 g/cm3; S = 0.069SI) has magnetic susceptibility of 0.069 above the Curie depth andextends to a maximum depth of ∼41 km. This two-layered blockcorresponds to the reflective lower crust imaged in the seismic data.The lower crust of the Thomson Orogen cannot be petrophysicallydistinguished from the basement crust of the Mount Isa terrane.Relatively short wavelength (∼25 km wide) positive geophysicalanomalies under the Diamantina River Domain might be due tomagmatic intrusions. Our preferred interpretation is that they rep-resent remnants of the magnetized Proterozoic meta-sedimentaryand meta-volcanic rocks of the Mount Isa terrane. The upper mantle(D = 3.25 g/cm3) has been modelled to shallow under the ThomsonOrogen and is non-magnetic because it lies well below the Curiedepth.
Prominent SE- and NW-dipping listric structures are modelledto connect into a major detachment zone possibly extending tothe Moho (Fig. 13). The Cork Fault is modelled as a high angle SE-dipping fault with listric geometry at depth.

G.P.T. Spampinato et al. / Precambrian Research 264 (2015) 63–81 73
F ; MF,m cm3 a
timmum
(etoti(c
7
taiewm(a(ocs
ig. 13. Forward model n. 1; MI, Mount Isa terrane; DR, Diamantina River Domainagnetic crust; NMC, non-magnetic crust; Yellow line, Curie depth. Density is in g/
Thrust faults which deform the sedimentary sequence and uplifthe basement rocks are modelled from a series of positive grav-ty anomalies. High angle structures penetrating and offsetting the
agnetic crust are associated with variations in both the regionalagnetic and gravity signature. Shallow faults terminating at the
pper crust result in positive gravity anomalies but have a minimalagnetic expression.The connection between the east-dipping Canaway Fault
Finlayson et al., 1988) and a major SE-dipping fault is only appar-nt in the profile. Uplift of the upper basement and deformation ofhe sedimentary sequences are interpreted to reflect reactivationf structures that accommodated basinal deposition. The sedimen-ary rocks progressively thin towards the Canaway Ridge whichs inferred to have been a structural high during the DevonianHoffmann, 1989) dividing the depositional sequences of the Bar-oo Trough from those in the Adavale Basin.
.3. Forward model n. 2
Profile n. 2 (Fig. 14) is ∼155 km long and it is oriented east–westo intersect the northern part of the Cooper Basin, the Harkawaynd Windorah-Ingella faults. Towards the eastern end, the profilentersects also the Moothandella Fault, which represents the east-rn limit of the Devonian Barcoo Trough. This profile lies entirelyithin the Thomson Orogen and crosses a major NW-trendingagnetic anomaly that is prominent in the RTP magnetic grid
Fig. 9). The Deep Seismic Profiles n.7E and 7W have been useds constraints. The Central Eromanga Deep Seismic Transect n. 3
Fig. 5) is located further south and runs parallel to the orientationf the forward model. This seismic profile intersects the southernontinuation of NW-oriented structures that cross the modelledection thus providing additional constraints.major SE-dipping fault; CR, Canaway Fault; TO, Thomson Orogen basement; MC,nd susceptibility is in SI units.
The observed gravity profile shows amplitude values rangingbetween −330 and −160 �m s−2 decreasing from west to eastwith a regional gradient of ∼1 �m s−2/km. The regional gravitytrend correlates with the deepening of the Moho eastward from 37to 39 km depth. Regions showing thicker sedimentary sequences(D = 2.55 g/cm3) are associated with lower gravity signature (upto −330 �m s−2) while shallowing of the upper basement rocks(D = 2.73 g/cm3) are reflected by positive gravity anomalies.
The observed magnetic profile shows a prominent anomaly withpeak amplitude of ∼30 nT and a wavelength of ∼100 km, decreasingtowards the east and west with a gradient of ∼1.3–1.4 nT/km. Theseismic data suggest that the reflective lower crust, which extendsfrom ∼19–22 km to ∼37–39 km, is shallower beneath this promi-nent magnetic source body (Finlayson et al., 1990a). The best fitmodel is achieved with a lower crust consisting of densities ran-ging between 2.82 and 2.92 g/cm3 and a magnetic susceptibility of0.069 SI above the Curie depth.
The observed gravity and magnetic profiles show little corre-lation. In the western part of the profile, major shallowing of theupper basement is associated with positive gravity signature butcorresponds to the lowest magnetic amplitude values. In the cen-tre of the profile, the upper crust is modelled to be sub-horizontal,which reflects the near-flat trend of the observed gravity profile.However, regional peak anomalies in the magnetic profile occur.Thus, it is inferred that the non-reflective upper crust has a signifi-cantly lower magnetization when compared to the reflective lowercrust. Positive magnetic shallow granitic rocks (D = 2.67 g/cm3;S = 0.037–0.069 SI) lying at ∼6–14 km depth have been modelledto take into account short wavelength variations in the observed
magnetic profile. These modelled felsic intrusives are associatedwith low gravity anomalies.The Harkaway, Windorah-Ingella and Moothandella faults areimaged as major high angle, west-dipping structures. Variations

74 G.P.T. Spampinato et al. / Precambrian Research 264 (2015) 63–81
F F, Mom its.
itaafW
st
7
CrNCBp
2∼Iibwtdfttat
ig. 14. Forward model n. 2; HF, Harkaway Fault; WIF, Windorah-Ingella Fault; Magnetic crust; Curie depth, 24 km. Density is in g/cm3 and susceptibility is in SI un
n regional gravity and magnetic anomalies in correspondence tohese structures suggest that the latter displace the entire crust. Rel-tively short wavelength positive gravity anomalies are interpreteds reflecting positive flower structures consisting of east-dippingaults connecting into major west-dipping faults including the
indorah-Ingella and Moothandella faults.Generally, the forward model along with the deep seismic data
hows that west-dipping detachments appear to control the archi-ecture of the region.
.4. Forward model n. 3
Profile n. 3 (Fig. 15) is ∼260 km long and extends across theork Fault to intersect the Mitakoodi Domain of the Mount Isa ter-ane, the Diamantina River Domain and the Warbreccan Dome –ewlands Trend of the Central Thomson Orogen. Drill holes GSQonnemara 1, AEI Great Northern 1, IOR Canterbury 1 and the 1983MR Deep Seismic Transects n. 7E and 7W (Fig. 9) constrain therofile.
Regional Bouguer gravity anomalies ranging between −270 and60 �m s−2 decrease towards the southeast with a gradient of5 �m s−2/km. Since the Moho is regionally deeper in the Mount
sa terrane and shallower under the Thomson Orogen, this grav-ty trend is likely to mostly reflect the burial at depth of a denseasement crust beneath the Thomson Orogen. Relatively shortavelength (∼20 km wide), low gravity signatures may reflect the
hickening of the sedimentary deposition that extends to a maxepth of ∼3.2 km. Shallowing of the upper basement is interpretedrom large positive gravity anomalies and is associated – from south
o north – with the Warbreccan Structure (∼−140 �m s−2), NE-rending structures in the Diamantina River Domain (∼70 �m s−2)nd the Mount Isa terrane basement crust (∼250 �m s−2) north ofhe Cork Fault.othandella Fault; TO, Thomson Orogen basement; MC, magnetic crust; NMC, non-
The regional magnetic anomalies show a prominent ampli-tude peak of ∼820 nT coincident with the Mount Isa terrane. Tothe immediate south, a steep gradient of ∼33 nT/km, decreasingtowards the southeast, is interpreted to represent the terminationof the Mount Isa terrane crust against the adjacent Thomson Oro-gen. Within the Thomson Orogen, the observed magnetic profileshows amplitudes values of ∼10 nT and a smooth magnetic signa-ture. Similar to profile n. 1, best fit reconstruction suggests thatthe prominent gradient and the smooth texture represent the dis-placement and the burial at depth of a high density crust whichhas magnetic susceptibility of 0.069 above the Curie depth. Thishigh density and magnetic crust links to the reflective lower crustof the Thomson Orogen, imaged in the seismic profiles n. 7W and7E.
Similar to models 1 and 2, the topography of the upper basementcrust beneath the Thomson Orogen correlates well with the trendof the observed gravity profile but show little magnetic expres-sion, suggesting that along the profile the upper basement may bepoorly magnetized or non-magnetic. The shallowest unit is repre-sented by non-magnetic sedimentary sequences (D = 2.55 g/cm3)which conceal the basement rocks. The basement crust underthe Mount Isa terrane extends down to a depth of ∼42 km andis magnetized (0.069 SI) above the Curie depth. The basementrocks of the Thomson Orogen can be divided in a non-magneticupper crust (D = 2.72–2.79 g/cm3), which thickens to the south andextend to a maximum depth of ∼19 km and a magnetic lower crust(D = 2.80–2.90 g/cm3; S = 0.069 SI) overlying the Moho. These twocrustal blocks are inferred to correspond to the non-reflective upperbasement and the reflective lower basement imaged in the deep
seismic transects. The lower basement crust of the Thomson Oro-gen is petrophysically indistinguishable from the Mount Isa terranecrust. The Moho regionally deepens from the Thomson Orogen(∼39 km depth) towards the Mount Isa terrane (∼42 km depth).
G.P.T. Spampinato et al. / Precambrian Research 264 (2015) 63–81 75
Fig. 15. Forward model n. 3; MI, Mount Isa terrane; CF, Cork Fault; DR, Diamantina River Domain; WF, Warbreccan Fault; TO, Thomson Orogen basement; MC, magneticc suscepa
Tb
lFmgwdst
8
OtnoTtamttTg
cHo
rust; NMC, non-magnetic crust; Yellow line, Curie depth. Density is in g/cm3 and
lways 2.73 g/cm3 unless otherwise specified.
he non-reflective upper mantle (D = 3.25 g/cm3) is non-magneticecause it is it is well below the Curie depth.
The Cork Fault is modelled as a major high angle, south-dippingistric fault. Major high angle structures, including the Warbreccanault, displace the entire crust and are modelled to connect into aajor detachment surface. This results in variation of the regional
ravity and magnetic signal. Positive gravity anomalies co-locatedith poor magnetic expression represent shallow structures thateform the non-magnetic, upper basement. They have been con-trained to the upper crust in the modelling as they do not appearo affect the regional magnetic signature of the region.
. Validity of the interpretation
The boundary between the Mount Isa terrane and the Thomsonrogen is characterized by sharp magnetic gradients decreasing
owards the southeast. In the Thomson Orogen, variations in thick-ess and displacement of the upper crust appear to have little effectn the magnetic trend. This suggests that the upper crust of thehomson Orogen is significantly less magnetic than the Mount Isaerrane crust, which results in the prominent magnetic signaturelong the boundary. Instead, long wavelengths and low amplitudeagnetic anomalies in the Thomson Orogen suggest greater depth
o the source rocks. The constrained forward models indicate thathe Thomson Orogen can be represented by a two-layered crust.he non-reflective, non-magnetic upper crust of the Thomson Oro-en overlies a reflective and magnetic lower crust.
The basement rocks of the Mount Isa terrane and the lowerrust of the Thomson Orogen are petrophysically indistinguishable.owever, even though potential field data can discriminate rocksf different densities and magnetic susceptibilities, this is not
tibility is in SI units. The density of the upper (non-reflective) Thomson Orogen is
necessary diagnostic of particular rock types. Many rock typesshow a wide range of magnetic susceptibility and can exhibitsimilar response on a survey grid (Clark, 1981).
The Cork Fault is interpreted to belong to a network of majorNE-trending, north-dipping and south-dipping listric faults thatdisplace the magnetic crust at depth. The steep magnetic gradientsthat characterize the Cork Fault result from displacement of theshallowest portion of the magnetic crust. In the Thomson Orogen,the thinning and burial at depth of the magnetic crust is reflectedin the regional smoother magnetic signature. In this context, theCork Fault would be a major SE-dipping normal fault which dis-places the magnetic crust at depth. The high gravity structuralbelt bounding the southern termination of the Mount Isa terranemight represent a NW-dipping fault zone that connects into a majorSE-dipping detachment surface that appears to control the archi-tecture of the area. The NE-trending Warbreccan Dome – NewlandsTrend is interpreted to be a major NW-dipping listric fault thatconnects into a major detachment surface. This structure is asso-ciated with regional variation of gravity and magnetic anomaliesand inferred displacement of both the upper and lower crusts. Weinterpret the geophysical maps and 2.5D forward model profiles tosuggest that the northeast-trending Warbreccan Dome – NewlandsTrend and the Cork Fault might be related.
The basement crust is concealed by less dense and non-magnetic shallow depositional sequences of the Eromanga, Galileeand Adavale basins as confirmed by the sparse geological record.Regions showing significant thickening of the sedimentary rocksare inferred to contain remnants of the Devonian sedimentary
sequence. The major listric faults appear to control the architec-ture of the area and have been repeatedly reactivated resulting ina series of vertical offsets, which decrease towards the upper unitsas imaged in the seismic data.
7 mbria
9
wnae2rs
9
tbne2iGViie2
alcadtt1O
9C
aritMGStwatfsrtC2sta1Irsa
6 G.P.T. Spampinato et al. / Preca
. Discussion
The configuration of the Proterozoic supercontinent Rodinia asell as palaeogeographical reconstructions of the Australian conti-ent are based on common geological character, tectonic elementsnd crustal age of nowadays divided geological provinces (Bettst al., 2008; Karlstrom et al., 2001; Li et al., 1995; Wingate et al.,002). However, the lack of exposed piercing points and intenseeworking of the Australian continent add ambiguities in the under-tanding of the Precambrian geodynamic evolution.
.1. Timing of initiation and reactivation of the Cork Fault
The Cork Fault has been interpreted to represent a segment ofhe much debated Tasman Line (Direen and Crawford, 2003) whichroadly divides the Proterozoic provinces of the Australian conti-ent from Phanerozoic rocks of the Tasmanides (Fig. 2) (Fergussont al., 2007a; Glen, 2005; Murray and Kirkegaard, 1978; Veevers,000). The Cork Fault is widely inferred to play a major role dur-
ng the Neoproterozoic Rodinia break-up (Finlayson et al., 1988;unn et al., 1997; Murray and Kirkegaard, 1978; Shaw et al., 1996;eevers and Powell, 1984) and, in most geodynamic reconstruct-
ons of the Proterozoic re-organization of the Australian continent,s also envisaged as an active feature (Betts and Giles, 2006; Gibsont al., 2008; Giles et al., 2004; Henson et al., 2011; Williams et al.,010).
The forward modelled profiles indicate that the Cork Fault is high angle, south-dipping listric fault dividing thick and shal-ow magnetic crust to the north from thinned and buried magneticrust to the south. The Cork Fault can be consistently interpreted asn extensional fault. The time of initiation of the Cork Fault post-ates the ca. 1600–1500 Ma Isan Orogeny, since the fault abruptlyerminates the N-S- to NNW-trending anomalies of the Mount Isaerrane. Therefore, the time of initiation is constrained between ca.500 Ma and ca. 650 Ma (maximum depositional age of Thomsonrogen basement rocks).
.1.1. Time of initiation: the Palaeoproterozoic Mount Isa –urnamona Province link
Lithological, metamorphic and metallogenic similarities as wells comparable geophysical features recorded in the Mount Isa ter-ane, the Curnamona Province and the Gawler Craton (Fig. 16)ndicate that these terranes or parts thereof, might have sharedhe same tectonic history during the Palaeoproterozoic to Early
esoproterozoic (Betts et al., 2002, in press; Betts and Giles, 2006;iles et al., 2004; Henson et al., 2011). The ca. 1850 Ma Doningtonuite, which is recorded in the eastern Gawler Craton, forms a N-S-rending granitoid belt (Hand et al., 2007) and temporally correlatesith the Kalkadoon Batholith (Blake et al., 1990; Page, 1983; Page
nd Sun, 1998) of the Mount Isa terrane. Giles et al. (2004) arguedhat the Donington Suite and Kalkadoon Batholith could haveormed one continuous belt at ca. 1850 Ma. The Palaeoproterozoicuperimposed basinal evolution recorded in the Mount Isa ter-ane can be correlated with sedimentary successions preserved inhe Curnamona Province, Georgetown-Yambo-Coen Inliers, Gawlerraton and McArthur Basin (Betts and Giles, 2006; Giles et al.,004). The ca. 1700–1600 Ma Willyama and Maronan supergroupshow remarkable similarities in timing, processes and sedimen-ary facies (Giles et al., 2004). Both successions were followed by
ca. 1600–1580 Ma major tectono-thermal event (Page and Laing,992; Page and Sun, 1998) including the Isan Orogeny in the Mount
sa terrane and the Olarian Orogeny in the Curnamona Province,espectively (Giles et al., 2004). The timing and the deformationtyle of the Isan Orogeny and the Olarian Orogeny show strikingnalogies as well (Giles et al., 2004; O’Dea et al., 1997b).n Research 264 (2015) 63–81
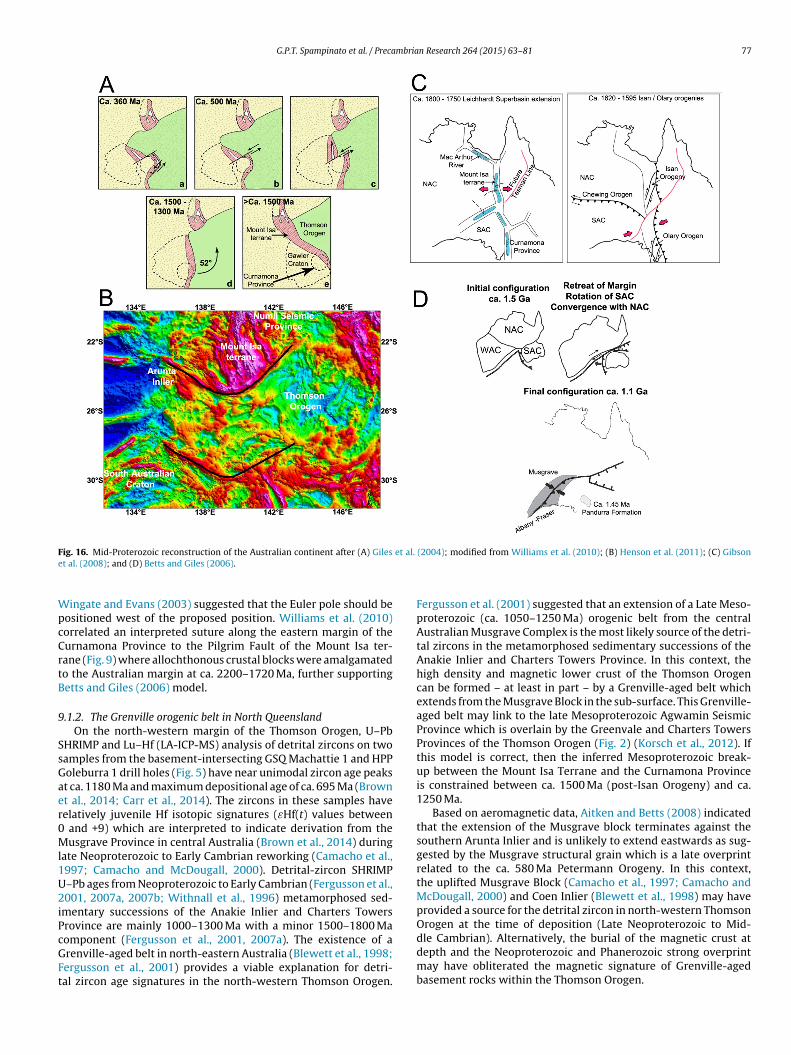
To honour the geological similarities between the twoprovinces, Giles et al. (2004) and Betts and Giles (2006) proposeda reconstruction in which the South Australian Craton (SAC, con-sisting of the Gawler Craton and Curnamona Province after Myerset al. (1996)), was rotated 52◦ counter clockwise about an Euler polelocated at 136◦ E 25◦ S relative to its current position (Fig. 16a). Theirreconstruction aligns the Palaeo-Mesoproterozoic orogenic beltsincluding the ca. 1800–1700 Ma Strangways–Kimban orogenies(Collins and Shaw, 1995; Parker, 1993), the ca. 1700–1600 Ma EarlyKararan–Leibig events in the western Gawler Craton and in thesouthern Arunta Inlier (Daly et al., 1998) and the ca. 1620–1500 MaOlarian, Wartaken and Isan orogenies (Betts et al., 2002, 2006; Gileset al., 2004; Stewart and Betts, 2010a).
Henson et al. (2011) observed that the shape of the bound-aries that truncate the southern Mount Isa terrane – AruntaProvince and northern Curnamona Province are superimposable.They inferred that a N-S structural grain characterizes bothprovinces and suggested that the Curnamona Province can besimply translated and restored next to the Mount Isa terrane(Fig. 16b). In their reconstruction, the Curnamona Province and theMount Isa terrane are not directly juxtaposed since it is inferredthat the two provinces may have been separated by attenuatedcrust.
The inferred Late Mesoproterozoic re-organization that led toseparation between the Mount Isa terrane and the CurnamonaProvince (Betts and Giles, 2006; Henson et al., 2011) is likely tobe recorded at the southern margin of the Mount Isa terrane andwould correspond to the time of initiation of the Cork Fault. Thearchitecture of the Cork Fault and adjacent structures indicate N-S to NNW-SSE crustal extension, burial of the continental crust atdepth and crustal attenuation within the Thomson Orogen. If thismodel is correct, then the Mount Isa crust may be – at least in part– represented under the Thomson Orogen and would correspondto the thinned and magnetic lower crust.
Gibson et al. (2008) indicated that there is no need for the MountIsa terrane and the Curnamona Province to be contiguous during thePalaeoproterozoic and suggested that the two terranes occupieddifferent part of a single continental scale rift system that extendedfrom northern to southern Australia from ca. 1800 Ma to 1640 Ma(Fig. 16c). In this scenario, the Cork Fault acted as a transfer faultand was an active feature during the Early Mesoproterozoic IsanOrogeny.
However, recent detrital zircon ages, Hf and Nd isotopic data onthe ca. 1760–1700 Ma cover sequences from the northern and west-ern Gawler Craton have found that source characteristics are likelyto be derived from the North Australian Craton (NAC) (Howardet al., 2011; Payne et al., 2006). This along with the well-establishedcorrelation of the ca.1720–1640 Ma basin systems between the Cur-namona Province and North Australian Craton, implies that theSAC and the NAC where physically connected at ca. 1780–1720 Ma(Howard et al., 2011).
Although the geophysical anomalies at the southern margin ofthe Mount Isa terrane may reflect Late Mesoproterozoic extension,the V-shaped geophysical signature highlighted in Henson et al.(2011) may result from a variety of tectonic processes rather thanreflecting a single Mesoproterozoic event. For example, the north-western structural grain of the southern Arunta Inlier might havebeen imposed during the Late Palaeoproterozoic Aileron Event andMiddle Palaeozoic Alice Springs Orogeny (Collins and Shaw, 1995;Floettmann et al., 2004; Lechler and Greene, 2006; Shaw et al.,1984). The northwest-trending geophysical signature in SouthAustralia may reflect Neoproterozoic extensional event followed by
several episodes of reactivation (Powell et al., 1994; Preiss, 2000).In light of these observations, our favourite model is the oneproposed by Betts and Giles (2006). Palaeomagnetic data provideindependent support to Betts and Giles’ (2006) model, although
G.P.T. Spampinato et al. / Precambrian Research 264 (2015) 63–81 77
F et al.
e
WpcCrtB
9
SsGaer0Ml1U2iPcGFt
ig. 16. Mid-Proterozoic reconstruction of the Australian continent after (A) Gilest al. (2008); and (D) Betts and Giles (2006).
ingate and Evans (2003) suggested that the Euler pole should beositioned west of the proposed position. Williams et al. (2010)orrelated an interpreted suture along the eastern margin of theurnamona Province to the Pilgrim Fault of the Mount Isa ter-ane (Fig. 9) where allochthonous crustal blocks were amalgamatedo the Australian margin at ca. 2200–1720 Ma, further supportingetts and Giles (2006) model.
.1.2. The Grenville orogenic belt in North QueenslandOn the north-western margin of the Thomson Orogen, U–Pb
HRIMP and Lu–Hf (LA-ICP-MS) analysis of detrital zircons on twoamples from the basement-intersecting GSQ Machattie 1 and HPPoleburra 1 drill holes (Fig. 5) have near unimodal zircon age peakst ca. 1180 Ma and maximum depositional age of ca. 695 Ma (Brownt al., 2014; Carr et al., 2014). The zircons in these samples haveelatively juvenile Hf isotopic signatures (εHf(t) values between
and +9) which are interpreted to indicate derivation from theusgrave Province in central Australia (Brown et al., 2014) during
ate Neoproterozoic to Early Cambrian reworking (Camacho et al.,997; Camacho and McDougall, 2000). Detrital-zircon SHRIMP–Pb ages from Neoproterozoic to Early Cambrian (Fergusson et al.,001, 2007a, 2007b; Withnall et al., 1996) metamorphosed sed-
mentary successions of the Anakie Inlier and Charters Towersrovince are mainly 1000–1300 Ma with a minor 1500–1800 Ma
omponent (Fergusson et al., 2001, 2007a). The existence of arenville-aged belt in north-eastern Australia (Blewett et al., 1998;ergusson et al., 2001) provides a viable explanation for detri-al zircon age signatures in the north-western Thomson Orogen.(2004); modified from Williams et al. (2010); (B) Henson et al. (2011); (C) Gibson
Fergusson et al. (2001) suggested that an extension of a Late Meso-proterozoic (ca. 1050–1250 Ma) orogenic belt from the centralAustralian Musgrave Complex is the most likely source of the detri-tal zircons in the metamorphosed sedimentary successions of theAnakie Inlier and Charters Towers Province. In this context, thehigh density and magnetic lower crust of the Thomson Orogencan be formed – at least in part – by a Grenville-aged belt whichextends from the Musgrave Block in the sub-surface. This Grenville-aged belt may link to the late Mesoproterozoic Agwamin SeismicProvince which is overlain by the Greenvale and Charters TowersProvinces of the Thomson Orogen (Fig. 2) (Korsch et al., 2012). Ifthis model is correct, then the inferred Mesoproterozoic break-up between the Mount Isa Terrane and the Curnamona Provinceis constrained between ca. 1500 Ma (post-Isan Orogeny) and ca.1250 Ma.
Based on aeromagnetic data, Aitken and Betts (2008) indicatedthat the extension of the Musgrave block terminates against thesouthern Arunta Inlier and is unlikely to extend eastwards as sug-gested by the Musgrave structural grain which is a late overprintrelated to the ca. 580 Ma Petermann Orogeny. In this context,the uplifted Musgrave Block (Camacho et al., 1997; Camacho andMcDougall, 2000) and Coen Inlier (Blewett et al., 1998) may haveprovided a source for the detrital zircon in north-western ThomsonOrogen at the time of deposition (Late Neoproterozoic to Mid-
dle Cambrian). Alternatively, the burial of the magnetic crust atdepth and the Neoproterozoic and Phanerozoic strong overprintmay have obliterated the magnetic signature of Grenville-agedbasement rocks within the Thomson Orogen.
7 mbria
9
teMI(ees1t–tew(bOeeatrmt
iaMiacTWeTtdEaCbI2a
FD
8 G.P.T. Spampinato et al. / Preca
.1.3. Neoproterozoic reactivationGeological evidence indicates that the Thomson Orogen was a
ectonically active area during the Rodinia break-up (Fergussont al., 2007a; Glen, 2005; Murray and Kirkegaard, 1978). Early toiddle Cambrian deposition is recorded in the adjacent Anakie
nlier (Anakie Metamorphic Group) and Charters Towers ProvinceWynyard Metamorphic) (Fergusson et al., 2001, 2007a; Withnallt al., 1995). Middle Cambrian deformation occurred in the north-rn Thomson Orogen and post-dates deposition of pre-Delamerianedimentary successions (Draper, 2006; Murray and Kirkegaard,978; Spampinato et al., 2015a). Finlayson et al. (1988) suggestedhat the major NE-trending structures of the Thomson Orogen
including the Cork Fault – initiated during the Late Neopro-erozoic and are associated with SE-directed rifting. Spampinatot al. (2015a) correlated the Neoproterozoic architecture of theestern Thomson Orogen and the south-eastern Arunta Inlier
Figs. 1 and 16b) (Greene, 2010) and indicated that the Rodiniareak-up might have occurred further to the east of the Thomsonrogen (Fergusson et al., 2009), which instead recorded the interiorxtensional architecture in response to a NE-directed extensionalvent. In this model, the Cork Fault might have been reactivateds a Neoproterozoic strike-slip fault. If this model is correct, thenhe NW-trending structural grain in the western Thomson Orogeneflecting the west-dipping detachments imaged in the forwardodels and the BMR Deep Seismic Surveys might have occurred at
his time.Steeply dipping slate, phyllite and quartzite were intersected
n several wells located over the NE-trending high gravity beltssociated with the Warbreccan – Newland Structure and in theaneroo Platform (Murray and Kirkegaard, 1978). Rb–Sr and K–Ar
sotopic date on basement phyllite in AAP Fermoy 1 gave Cambrianges (Harding, 1969; Murray and Kirkegaard, 1978). Late Cambrianrustal shortening is recorded in the Anakie Inlier and Chartersower Province further to the east (Fergusson et al., 2001, 2007a;ithnall et al., 1995, 1996). This suggests that a deformational
pisode coeval to the Delamerian Orogeny affected the northernhomson Orogen (Draper, 2006; Spampinato et al., 2015a). Thisectonic event is interpreted to have initiated or reactivated north-ipping faults that connect to the Cork Fault. The Neoproterozoic toarly Cambrian sedimentary sequences might have been invertednd uplifted (Fig. 17) resulting in the high gravity belt bounding theork Fault. However, the Late Ordovician to Early Silurian Benam-
ran Orogeny, which is recorded in the Greenvale Province, Anakienlier and Charters Towers Province to the east (Fergusson et al.,005, 2007b) and the Koonenberry Belt (Greenfield et al., 2011)nd Lachlan Orogen (Burton, 2010; Cayley, 2011; Cayley et al.,
ig. 17. Sketch showing the inferred Late Cambrian shortening event within theiamantina River Domain.
n Research 264 (2015) 63–81
2011; Foster and Gray, 2000) to the south of the Thomson Oro-gen along with the Carboniferous Kanimblan Orogeny that affectedthe Thomson Orogen (Finlayson, 1993; Leven and Finlayson, 1986;Leven et al., 1990) could have also reactivated the existing faultarchitecture and contributed to the inversion of meta-sedimentarybasement rocks of the Thomson Orogen.
10. Conclusions
Geophysical interpretation and potential field forward mod-elling across the Cork Fault indicate that the boundary between theMount Isa terrane and the Thomson Orogen is not sharp. High angle,listric faults displace the magnetic crust which gradually deepenstowards the southeast. The lower crust of the Thomson Orogen ispetrophysically indistinguishable from the continental crust of theMount Isa terrane. We suggest that the lower crust of the ThomsonOrogen is attenuated continental crust with Precambrian affinities.
The timing of initiation of the Cork Fault might be dated tothe Mesoproterozoic and may be related to the continental re-organization of the Australian continent that led to the separationof the Mount Isa terrane from the Curnamona Province. The mech-anism of separation involves initial N-S to NNW-SSE extensionand development of normal faults. During the Rodinia break-up,the Cork Fault might have been reactivated as a strike-slip fault,being in a favourable orientation and formed part of the NE-strikingstrike-slip faults and NW-oriented normal faults that accommo-dated the deposition of the Late Neoproterozoic to Early Cambrianstratigraphy. The northern part of the Thomson Orogen was likelyaffected by Early Palaeozoic deformational events. Deformationwas controlled by the pre-existing fault network and resulted inthe formation of a positive gravity belt that bound the southerntermination of the Mount Isa terrane.
The protracted tectonic history of the Cork Fault results in avariety of geophysical responses that should be regarded as theexpression of a complex interaction between several geologicalelements.
Acknowledgements
The 2006 Mount Isa Deep Crustal Seismic Survey (© Common-wealth of Australia – Geoscience Australia 2009) was acquiredby Geoscience Australia under the Onshore Energy Security Pro-gram, in collaboration with the Queensland Geological Survey, thepmd*CRC and Zinifex which are gratefully acknowledged. Geo-science Australia is thanked and acknowledged for access to theCentral Eromanga Basin Seismic Surveys (© Commonwealth ofAustralia – Geoscience Australia) which were conducted by TheBureau of Mineral Resources. TMI magnetic and Bouguer gravitygrids (© Commonwealth of Australia – Geoscience Australia 2009)were thankfully obtained from Geoscience Australia. We wouldlike to thank the reviewers of this paper for providing constructivefeedback.
References
Aitken, A.R.A., Betts, P.G., 2008. High-resolution aeromagnetic data over centralAustralia assist Grenville-era (1300–1100 Ma) Rodinia reconstructions. Geo-phys. Res. Lett. 35.
Aitken, A.R.A., Betts, P.G., 2009. Multi-scale integrated structural and aeromag-netic analysis to guide tectonic models: an example from the eastern MusgraveProvince, Central Australia. Tectonophysics 476, 418–435.
Andrews, S.J., 1998. Stratigraphy and depositional setting of the upper McNamaraGroup, Lawn Hills region, Northwest Queensland. Econ. Geol. Bull. Soc. Econ.Geol. 93, 1132–1152.
Austin, J.R., Blenkinsop, T.G., 2010. Cloncurry fault zone: strain partitioning andreactivation in a crustal-scale deformation zone, Mt Isa Inlier. Aust. J. Earth Sci.57, 1–21.
Beardsmore, T.J., Newbery, S.P., Laing, W.P., 1988. The Maronan Supergroup: aninferred early volcanosedimentary rift sequence in the Mount Isa Inlier, and its

mbria
B
B
B
B
B
B
B
B
B
B
B
B
B
B
B
B
B
B
B
B
B
B
C
C
C
C
C
C
C
G.P.T. Spampinato et al. / Preca
implications for ensialic rifting in the Middle Proterozoic of northwest Queens-land. Precambrian Res. 40–41, 487–507.
ell, T.H., 1983. Thrusting and duplex formation at Mount Isa, Queensland, Australia.Nature 304, 493–497.
etts, P.G., 2001. Three-dimensional structure along the inverted Palaeoprotero-zoic Fiery Creek fault system, Mount Isa Terrane, Australia. J. Struct. Geol. 23,1953–1969.
etts, P.G., Armit, R.J., Stewart, J., Aitken, A.R.A., Ailleres, L., Donchak, P., Hutton, L.,Withnall, I.W., Giles, D., 2015. Australia and Nuna. Geol. Soc. Lond. Spec. Publ.,Special Publication Supercontinents through time, in press.
etts, P.G., Giles, D., 2006. The 1800–1100 Ma tectonic evolution of Australia. Pre-cambrian Res. 144, 92–125.
etts, P.G., Giles, D., Lister, G.S., 2003a. Tectonic environment of shale-hosted mas-sive sulfide Pb–Zn–Ag deposits of Proterozoic northeastern Australia. Econ. Geol.98, 557–576.
etts, P.G., Giles, D., Lister, G.S., 2004. Aeromagnetic patterns of half-graben andbasin inversion: implications for sediment-hosted massive sulfide Pb–Zn–Agexploration. J. Struct. Geol. 26, 1137–1156.
etts, P.G., Giles, D., Lister, G.S., Frick, L.R., 2002. Evolution of the Australian litho-sphere. Aust. J. Earth Sci. 49, 661–695.
etts, P.G., Giles, D., Mark, G., Lister, G.S., Goleby, B.R., Aillères, L., 2006. Synthe-sis of the proterozoic evolution of the Mt. Isa Inlier. Aust. J. Earth Sci. 53,187–211.
etts, P.G., Giles, D., Schaefer, B.F., 2008. Comparing 1800–1600 Ma accretionary andbasin processes in Australia and Laurentia: possible geographic connections inColumbia. Precambrian Res. 166, 81–92.
etts, P.G., Lister, G.S., 2001. Comparison of the “strike-slip” versus the “episodic-rift-sag” models for the origin of the Isa Superbasin. Aust. J. Earth Sci. 48, 265–280.
etts, P.G., Lister, G.S., Giles, D., 2001. Tectonic environment of shale-hosted mas-sive sulphide Pb–Zn mineralisation in the Western fold belt, Mount Isa Terrane.Contrib. Econ. Geol. Res. Unit 59, 20–21.
etts, P.G., Lister, G.S., Pound, K.S., 1999. Architecture of a Palaeoproterozoic RiftSystem: evidence from the Fiery Creek Dome region, Mt Isa terrane. Aust. J.Earth Sci. 46, 533–534.
etts, P.G., Valenta, R.K., Finlay, J., 2003b. Evolution of the Mount Woods Inlier,northern Gawler Craton, southern Australia: an integrated structural and aero-magnetic analysis. Tectonophysics 366, 83–111.
ierlein, F.P., Betts, P.G., 2004. The Proterozoic Mount Isa fault zone, northeasternAustralia: is it really a ca. 1.9 Ga terrane-bounding suture? Earth Planet. Sci. Lett.225, 279–294.
lake, D.H., 1987. Geology of the Mount Isa Inlier and Environs, Queensland andNorthern Territory, vol. 225. Bulletin – Bureau of Mineral Resources, Geology &Geophysics, Australia.
lake, D.H., Bultitude, R.J., Donchak, P.J.T., Wyborn, L.A.I., Hone, I.G., 1984. Geol-ogy of the Duchess-Urandangi region, Mount Isa Inlier, Queensland. AustralianGeological Survey Organization, Canberra, A.C.T., Australia.
lake, D.H., Etheridge, M.A., Page, R.W., Stewart, A.J., Williams, P.R., Wyborn, L.A.I.,1990. Mount Isa Inlier: Regional Geology and Mineralisation. Monograph Series14, Australasian Institute of Mining and Metallurgy, pp. 915–925.
lakely, R.J., 1995. Potential Theory in Gravity and Magnetic Applications. CambridgeUniversity Press, New York.
lenkinsop, T.G., Huddlestone-Holmes, C.R., Foster, D.R.W., Edmiston, M.A., Lep-ong, P., Mark, G., Austin, J.R., Murphy, F.C., Ford, A., Rubenach, M.J., 2008. Thecrustal scale architecture of the Eastern Succession, Mount Isa: the influence ofinversion. Precambrian Res. 163, 31–49.
lewett, R.S., Black, L.P., Sun, S.S., Knutson, J., Hutton, L.J., Bain, J.H.C., 1998. U–Pbzircon and Sm–Nd geochronology of the Mesoproterozoic of North Queens-land: Implications for a Rodinian connection with the Belt supergroup of NorthAmerica. Precambrian Res. 89, 101–127.
rown, D., Purdy, D., Carr, P., Cross, A., Kositcin, N., 2014. New isotopic data fromthe Thomson Orogen basement cores: a possible link with the Centralian Super-basin. Geol. Soc. Aust. Abstr. 110, 243–244.
urton, G.R., 2010. New structural model to explain geophysical features in north-western new south wales: implications for the tectonic framework of thetasmanides. Aust. J. Earth Sci. 57, 23–49.
amacho, A., Compston, W., McCulloch, M., McDougall, I., 1997. Timing andexhumation of eclogite facies shear zones, Musgrave Block, central Australia.J. Metamorph. Geol. 15, 735–751.
amacho, A., McDougall, I., 2000. Intracratonic, strike-slip partitioned transpressionand the formation and exhumation of eclogite facies rocks: an example from theMusgrave Block, central Australia. Tectonics 19, 978–996.
arr, P., Purdy, D., Brown, D., 2014. Peeking under the covers: undercover geologyof the Thomson Orogen. Geol. Soc. Aust. Abstr. 110, 244–245.
ayley, R.A., 2011. Exotic crustal block accretion to the eastern Gondwanaland mar-gin in the Late Cambrian-Tasmania, the Selwyn Block, and implications forthe Cambrian-Silurian evolution of the Ross, Delamerian, and Lachlan orogens.Gondwana Res. 19, 628–649.
ayley, R.A., Korsch, R.J., Moore, D.H., Costelloe, R.D., Nakamura, A., Willman, C.E.,Rawling, T.J., Morand, V.J., Skladzien, P.B., O’Shea, P.J., 2011. Crustal architectureof central Victoria: results from the 2006 deep crustal reflection seismic survey.Aust. J. Earth Sci. 58, 113–156.
hampion, D.C., Kositcin, N., Huston, D.L., Mathews, E., Brown, C., 2009. Geody-namic Synthesis of the Phanerozoic of Eastern Australia and Implications forMetallogeny. Geoscience Australia, Canberra, A.C.T., Australia.
hopping, R., Henson, P.A.E., 2009. 3D Map and Supporting Geophysical Studies inthe North Queensland Region. Geoscience Australia, Canberra, A.C.T., Australia.
n Research 264 (2015) 63–81 79
Clark, D.A., 1981. A system for regional lithofacies mapping. Bull. Can. Petrol. Geol.29, 197–208.
Collins, C.D.N., Lock, J., 1990. Velocity Variations within the Upper Crustal Basementof the Central Eromanga Basin, vol. 232. Bulletin – Bureau of Mineral Resources,Geology & Geophysics, Australia, pp. 177–188.
Collins, W.J., Shaw, R.D., 1995. Geochronological constraints on orogenic events inthe Arunta Inlier: a review. Precambrian Res. 71, 315–346.
Daly, S.J., Fanning, C.M., Fairclough, M.C., 1998. Tectonic evolution and explorationpotential of the Gawler Craton, South Australia. AGSO J. Aust. Geol. Geophys. 17,145–168.
Direen, N.G., Crawford, A.J., 2003. The Tasman Line: where is it, what is it, and is itAustralia’s Rodinian breakup boundary? Aust. J. Earth Sci. 50, 491–502.
Draper, J.J., 2006. The Thomson fold belt in Queensland revisited. Geol. Soc. Aust.Abstr. 82, 6.
Esso Australia Limited, 1984. A-P 166P, W80A & W81A Seismic Surveys, FinalReport. Esso Australia Limited.
Etheridge, M.A., Rutland, R.W.R., Wyborn, L.A.I., 1987. Orogenesis and tectonic pro-cess in the early to middle Proterozoic of northern Australia. Geodyn. Ser. 17,131–147.
Evans, P.R., Hoffmann, K.L., Remus, D.A., Passmore, V.L., 1992. Geology of the Ero-manga Sector of the Eromanga-Brisbane Geoscience Transect, vol. 232. Bulletin– Bureau of Mineral Resources, Geology & Geophysics, Australia, pp. 83–104.
Fergusson, C.L., Carr, P.F., Fanning, C.M., Green, T.J., 2001. Proterozoic-Cambriandetrital zircon and monazite ages from the Anakie Inlier, Central Queensland:Grenville and pacific-gondwana signatures. Aust. J. Earth Sci. 48, 857–866.
Fergusson, C.L., Henderson, R.A., Fanning, C.M., Withnall, I.W., 2007a. Detrital zirconages in Neoproterozoic to Ordovician siliciclastic rocks, northeastern Australia:implications for the tectonic history of the East Gondwana continental margin.J. Geol. Soc. 164, 215–225.
Fergusson, C.L., Henderson, R.A., Lewthwaite, K.J., Phillips, D., Withnall, I.W., 2005.Structure of the Early Palaeozoic Cape River Metamorphics, Tasmanides of northQueensland: evaluation of the roles of convergent and extensional tectonics.Aust. J. Earth Sci. 52, 261–277.
Fergusson, C.L., Henderson, R.A., Withnall, I.W., Fanning, C.M., 2007b. Structuralhistory of the Greenvale Province, north Queensland: early Palaeozoic exten-sion and convergence on the Pacific margin of Gondwana. Aust. J. Earth Sci. 54,573–595.
Fergusson, C.L., Offler, R., Green, T.J., 2009. Late Neoproterozoic passive margin ofEast Gondwana: geochemical constraints from the Anakie Inlier, central Queens-land, Australia. Precambrian Res. 168, 301–312.
Fichtner, A., Kennett, B.L.N., Igel, H., Bunge, H.P., 2009. Full seismic waveformtomography for upper-mantle structure in the Australasian region using adjointmethods. Geophys. J. Int. 179, 1703–1725.
Finlayson, D.M., 1993. Crustal architecture across Phanerozoic Australia along theEromanga-Brisbane Geoscience Transect: evolution and analogues. Tectono-physics 219 (191–200), 205–211.
Finlayson, D.M., Leven, J.H., 1987. Lithospheric structures and possible processes inPhanerozoic eastern Australia from deep seismic investigations. Tectonophysics133, 199–215.
Finlayson, D.M., Leven, J.H., Etheridge, M.A., 1988. Structural styles and basin evolu-tion in Eromanga region, eastern Australia. Am. Assoc. Pet. Geol. Bull. 72, 33–48.
Finlayson, D.M., Leven, J.H., Wake-Dyster, K.D., 1989. Large-scale lenticles in thelower crust under an intra-continental basin in eastern Australia. Geophys.Monogr. 51, 1–16.
Finlayson, D.M., Leven, J.H., Wake-Dyster, K.D., Johnstone, D.W., 1990a. A CrustalImage under the Basins of Southern Queensland Along the Eromanga-BrisbaneGeoscience Transect, vol. 232. Bulletin – Australia, Bureau of Mineral Resources,Geology and Geophysics, pp. 153–175.
Finlayson, D.M., Wake-Dyster, K.D., Leven, J.H., Johnstone, D.W., Murray, C.G., Har-rington, H.J., Korsch, R.J., Wellman, P., 1990b. Seismic imaging of major tectonicfeatures in the crust of Phanerozoic eastern Australia. Tectonophysics 173,211–230.
Fishwick, S., Heintz, M., Kennett, B.L.N., Reading, A.M., Yoshizawa, K., 2008. Stepsin lithospheric thickness within eastern Australia, evidence from surface wavetomography. Tectonics 27.
Fishwick, S., Kennett, B.L.N., Reading, A.M., 2005. Contrasts in lithospheric structurewithin the Australian craton – insights from surface wave tomography. EarthPlanet. Sci. Lett. 231, 163–176.
Floettmann, T., Hand, M., Close, D., Edgoose, C., Scrimgeour, I., 2004. Thrust tec-tonic styles of the intracratonic Alice Springs and Petermann Orogenies, centralAustralia. AAPG Mem. 82, 538–557.
Foster, D.A., Gray, D.R., 2000. Evolution and Structure of the Lachlan Fold Belt (Oro-gen) of Eastern Australia., pp. 47–80.
Foster, D.R.W., Austin, J.R., 2008. The 1800–1610 Ma stratigraphic and magmatic his-tory of the Eastern Succession, Mount Isa Inlier, and correlations with adjacentPaleoproterozoic terranes. Precambrian Res. 163, 7–30.
Gibson, G.M., Neumann, N.L., Southgate, P.N., Hutton, L.J., Foster, D., 2006. Geody-namic Evolution of the Mount Isa Inlier and Its Influence on the Formation,Timing and Localisation of Fluid Flow. Geoscience Australia Record, pp. 36–40.
Gibson, G.M., Rubenach, M.J., Neumann, N.L., Southgate, P.N., Hutton, L.J., 2008. Syn-and post-extensional tectonic activity in the Palaeoproterozoic sequences of
Broken Hill and Mount Isa and its bearing on reconstructions of Rodinia. Pre-cambrian Res. 166, 350–369.Giles, D., Ailléres, L., Jeffries, D., Betts, P., Lister, G., 2006a. Crustal architecture ofbasin inversion during the Proterozoic Isan Orogeny, Eastern Mount Isa Inlier,Australia. Precambrian Res. 148, 67–84.

8 mbria
G
G
G
G
G
G
G
G
G
H
H
H
H
H
H
H
H
H
J
J
K
K
K
K
K
L
L
L
L
L
0 G.P.T. Spampinato et al. / Preca
iles, D., Betts, P.G., Aillères, L., Hulscher, B., Hough, M., Lister, G.S., 2006b. Evolutionof the Isan Orogeny at the southeastern margin of the Mt, Isa Inlier. Aust. J. EarthSci. 53, 91–108.
iles, D., Betts, P.G., Lister, G.S., 2004. 1.8-1.5-Ga links between the North and SouthAustralian Cratons and the Early-Middle Proterozoic configuration of Australia.Tectonophysics 380, 27–41.
len, R.A., 2005. The Tasmanides of eastern Australia. Geol. Soc. Spec. Publ. 246,23–96.
len, R.A., Korsch, R.J., Hegarty, R., Saeed, A., Djomani, Y.P., Costelloe, R.D., Belousova,E., 2013. Geodynamic significance of the boundary between the Thomson Oro-gen and the Lachlan Orogen, northwestern New South Wales and implicationsfor Tasmanide tectonics. Aust. J. Earth Sci. 60, 371–412.
len, R.A., Meffre, S., Scott, R.J., 2007. Benambran Orogeny in the eastern LachlanOrogen, Australia. Aust. J. Earth Sci. 54, 385–415.
len, R.A., Saeed, A., Hegarty, R., Percival, I.G., Bodorkos, S., Griffin, W.L., 2010.Preliminary Zircon Data and Tectonic Framework for the Thomson Orogen,Northwestern NSW., pp. 1–26.
reene, D.C., 2010. Neoproterozoic rifting in the southern Georgina Basin, centralAustralia: implications for reconstructing Australia in Rodinia. Tectonics 29.
reenfield, J.E., Musgrave, R.J., Bruce, M.C., Gilmore, P.J., Mills, K.J., 2011. The MountWright Arc: a Cambrian subduction system developed on the continental mar-gin of East Gondwana, Koonenberry Belt, eastern Australia. Gondwana Res. 19,650–669.
unn, P.J., Maidment, D., Milligan, P.R., 1997. Interpreting aeromagnetic data in areasof limited outcrop. AGSO J. Aust. Geol. Geophys. 17, 175–185.
and, M., Reid, A., Jagodzinski, L., 2007. Tectonic framework and evolution of theGawler craton, Southern Australia. Econ. Geol. 102, 1377–1395.
arding, R.R., 1969. Catalogue of Age Determinations on Australian Rocks, 1962–65.Australian Geological Survey Organisation, Canberra, A.C.T., Australia.
arrison, P.L., Bauer, J.A., 1976. Galilee Basin Seismic Survey, Queensland – Opera-tional Report. BMR Record 27., pp. 24.
awkins, P.J., Harrison, P.L., 1978. Stratigraphic and seismic investigations intheLoveIle Depression, western Galilee Basin. Qld. Gov. Min. J. 79 (926), 623–650.
enson, P.K., Kositcin, N., Huston, D., 2011. Broken Hill and Mount Isa: linked butnot rotated. AusGeo News June 2011.
offmann, K.L., 1988. Revision of the Limits of the Adavale Basin and Warra-bin Trough, Southwest Queensland. Queensland Department of Mines Record1988/18.
offmann, K.L., 1989. Tectonic Setting and Structural Analysis of the Southern Ero-manga Basin, Queensland. Queensland Department of Mines Record 1989/15.
oward, K.E., Hand, M., Barovich, K.M., Payne, J.L., Cutts, K.A., Belousova, E.A., 2011.U–Pb zircon, zircon Hf and whole-rock Sm-Nd isotopic constraints on the evolu-tion of Paleoproterozoic rocks in the northern Gawler Craton. Aust. J. Earth Sci.58, 615–638.
utton, L.J., Denaro, T.J., Dhnaram, C., Derrick, G.M., 2012. Mineral systems in theMount Isa Inlier. Episodes 35, 120–130.
ackson, M.J., Scott, D.L., Rawlings, D.J., 2000. Stratigraphic framework for the Leich-hardt and Calvert superbasins: Review and correlations of the pre-1700 Masuccessions between Mt Isa and McArthur River. Aust. J. Earth Sci. 47, 381–403.
ackson, M.J., Simpson, E.L., Eriksson, K.A., 1990. Facies and sequence stratigraphicanalysis in an intracratonic, thermal-relaxation basin: the early Proterozoic,Lower Quilalar Formation and Ballara Quartzite, Mount Isa Inlier, Australia.Sedimentology 37, 1053–1078.
arlstrom, K.E., Ahall, K.-I., Harlan, S.S., Williams, M.L., McLelland, J., Geissman,J.W., 2001. Long-lived (1.8–1.0 Ga) convergent orogen in southern Laurentia,its extensions to Australia and Baltica, and implications for refining Rodinia.Precambrian Res. 111, 5–30.
ennett, B.L.N., Fishwick, S., Reading, A.M., Rawlinson, N., 2004. Contrasts in mantlestructure beneath Australia: relation to Tasman Lines? Aust. J. Earth Sci. 51,563–569.
orsch, R., Henson, P., Gibson, G., Withnall, I., Hutton, L., Saygin, E., Jones, L., Stewart,L., Huston, D., Maidment, D., 2008. Results from the central and southern Mt IsaInlier (Lines 06GA-MI6 and 94AGS-MTI1). In: Mt Isa Seismic Workshop 24 June2008.
orsch, R.J., Huston, D.L., Henderson, R.A., Blewett, R.S., Withnall, I.W., Fergusson,C.L., Collins, W.J., Saygin, E., Kositcin, N., Meixner, A.J., Chopping, R., Henson, P.A.,Champion, D.C., Hutton, L.J., Wormald, R., Holzschuh, J., Costelloe, R.D., 2012.Crustal architecture and geodynamics of North Queensland, Australia: insightsfrom deep seismic reflection profiling. Tectonophysics 572–573, 76–99.
rassay, A.A., Bradshaw, B.E., Domagala, J., Jackson, M.J., 2000. Siliciclastic shorelineto growth-faulted, turbiditic sub-basins: the Proterozoic River Supersequenceof the upper McNamara group on the Lawn Hill Platform, northern Australia.Aust. J. Earth Sci. 47, 533–562.
echler, A.R., Greene, D.C., 2006. Fault reactivation during intracontinental defor-mation: the Toko syncline and Toomba fault, Georgina Basin, central Australia.Geol. Soc. Am. Abstr. Prog. 38, 11.
even, J.H., Finlayson, D.M., 1986. Basement thrusts in the southern Adavale Basin.Geol. Soc. Am. Abstr. 15, 123–124.
even, J.H., Finlayson, D.M., Wake-Dyster, K., 1990. Mid-crustal detachmentscontrolling basin deformation: ramp synforms in southwestern Queensland.Tectonophysics 173 (231–234), 239–246.
i, Z.X., Zhang, L., Powell, C.M., 1995. South China in Rodinia: part of the missing linkbetween Australia-East Antarctica and Laurentia? Geology 23, 407–410.
ock, J., Collins, C.D.N., Finlayson, D.M., 1986. Basement structure and velocitiesunder the central Eromanga Basin from seismic refraction studies (Australia).
n Research 264 (2015) 63–81
In: Contributions to the Geology and Hydrocarbon Potential of the EromangaBasin., pp. 155–162.
MacCready, T., 2006. Structural cross-section based on the Mt. Isa deep seismictransect. Aust. J. Earth Sci. 53, 5–26.
MacCready, T., Goleby, B.R., Goncharov, A., Drummond, B.J., Lister, G.S., 1998. Aframework of overprinting orogens based on interpretation of the Mount Isadeep seismic transect. Econ. Geol. 93, 1422–1434.
Mathur, S.P., 1983. Deep crustal reflection results from the central Eromanga Basin,Australia. Tectonophysics 100, 163–173.
Mathur, S.P., 1984. Tectonic Evolution of the Central Eromanga Basin Area fromReflection Data. Bureau Mineral Resources 1984/28., pp. 25–29.
Mathur, S.P., 1987. Deep seismic reflection data suggest major compressionaldeformation of the crust in the central Eromanga Basin area during the mid-Carboniferous. Tectonophysics 134, 311–321.
Maule, C.F., Purucker, M.E., Olsen, N., 2009. Inferring Magnetic Crustal Thicknessand Geothermal Heat Flux from Crustal Magnetic Field Models. Danish ClimateCentre Report 09.
McKillop, M.D., McKellar, J.L., Draper, J.J., Hoffmann, K.L., 2007. The Adavale Basin:stratigraphy and depositional environments. In: Special Publication – NorthernTerritory Geological Survey., pp. 82–107.
McLean, M.A., Betts, P.G., 2003. Geophysical constraints of shear zones and geometryof the Hiltaba Suite granites in the western Gawler Craton, Australia. Aust. J. EarthSci. 50, 525–541.
McLean, M.A., Rawling, T.J., Betts, P.G., Phillips, G., Wilson, C.J.L., 2008. Three-dimensional inversion modelling of a Neoproterozoic basin in the southernPrince Charles Mountains, East Antarctica. Tectonophysics 456, 180–193.
Moresi, L., Betts, P.G., Miller, M.S., Cayley, R.A., 2014. Dynamics of continental accre-tion. Nature 508, 245–248.
Moss, F.J., Wake-Dyster, K.D., 1983. The Australian central Eromanga Basin project:an introduction. Tectonophysics 100, 131–145.
Murray, C., 2007. Deep crustal seismic reflection profiling. Qld. Gov. Min. J. 2007,92–94.
Murray, C.G., 1990. Summary of Geological Developments Along the Eromanga-Brisbane Geoscience Transect, vol. 232. Bulletin – Bureau of Mineral Resources,Geology & Geophysics, Australia, pp. 11–20.
Murray, C.G., 1994. Basement Cores from the Tasman Fold Belt System Beneaththe Great Artesian Basin in Queensland. Department of Minerals and Energy,Brisbane, QLD, Australia.
Murray, C.G., Kirkegaard, A.G., 1978. The Thomson Orogen of the Tasman orogeniczone. Tectonophysics 48, 299–325.
Myers, J.S., Shaw, R.D., Tyler, I.M., 1996. Tectonic evolution of Proterozoic Australia.Tectonics 15, 1431–1446.
O’Dea, M.G., Betts, P.G., MacCready, T., Aillères, L., 2006. Sequential development ofa mid-crustal fold-thrust complex: evidence from the Mitakoodi Culmination inthe eastern Mt. Isa Inlier, Australia. Aust. J. Earth Sci. 53, 69–90.
O’Dea, M.G., Lister, G.S., Betts, P.G., Pound, K.S., 1997a. A shortened intraplate rift sys-tem in the Proterozoic Mount Isa terrane, NW Queensland, Australia. Tectonics16, 425–441.
O’Dea, M.G., Lister, G.S., Maccready, T., Betts, P.G., Oliver, N.H.S., Pound, K.S., Huang,W., Valenta, R.K., 1997b. Geodynamic Evolution of the Proterozoic Mount IsaTerrain., pp. 99–122.
Page, R.W., 1983. Timing of superposed volcanism in the Proterozoic Mount Isa Inlier,Australia. Precambrian Res. 21, 223–245.
Page, R.W., Bell, T.H., 1986. Isotopic and structural responses of granite to successivedeformation and metamorphism (Australia). J. Geol. 94, 365–379.
Page, R.W., Laing, W.P., 1992. Felsic metavolcanic rocks related to the Broken HillPb–Zn–Ag orebody, Australia: geology, depositional age, and timing of high-grade metamorphism. Econ. Geol. 87, 2138–2168.
Page, R.W., Sun, S.S., 1998. Aspects of geochronology and crustal evolution in theEastern Fold Belt, Mt Isa Inlier. Aust. J. Earth Sci. 45, 343–361.
Page, R.W., Williams, I.S., 1988. Age of the barramundi orogeny in northern Australiaby means of ion microprobe and conventional U–Pb zircon studies. PrecambrianRes. 40–41, 21–36.
Parker, A.J., 1993. The Geology of South Australia, Vol. 1. The Precambrian. GeologicalSurvey of South Australia, Adelaide, SA, Australia.
Passmore, V.L., Sexton, M.J., 1984. Structural development and hydrocarbon poten-tial of Palaeozoic source rocks in the Adavale Basin region. APEA J. 24, 393–411.
Payne, J.L., Barovich, K.M., Hand, M., 2006. Provenance of metasedimentary rocksin the northern Gawler Craton, Australia: implications for Palaeoproterozoicreconstructions. Precambrian Res. 148, 275–291.
Pinchin, J., Senior, B.R., 1982. The Warrabin Trough, western Adavale Basin, Queens-land. J. Geol. Soc. Aust. 29, 413–424.
Powell, C.M., Preiss, W.V., Gatehouse, C.G., Krapez, B., Li, Z.X., 1994. South Australianrecord of a Rodinian epicontinental basin and its mid-Neoproterozoic breakup(∼700 Ma) to form the Palaeo-Pacific Ocean. Tectonophysics 237, 113–140.
Preiss, W.V., 2000. The Adelaide Geosyncline of South Australia and its significancein Neoproterozoic continental reconstruction. Precambrian Res. 100, 21–63.
Scott, D.L., Bradshaw, B.E., Tarlowski, C.Z., 1998. The tectonostratigraphic history ofthe Proterozoic northern Lawn Hill Platform, Australia: an integrated intracon-tinental basin analysis. Tectonophysics 300, 329–358.
Senior, B.R., Mond, A., Harrison, P.L., 1978. Geology of the Eromanga Basin. Australian
Geological Survey Organization, Canberra, A.C.T., Australia.Shaw, R.D., Stewart, A.J., Black, L.P., 1984. The Arunta inlier: a complex ensialicmobile belt in central Australia. Part 2: tectonic history. Aust. J. Earth Sci. 31,457–484.

mbria
S
S
S
S
S
S
S
S
S
V
G.P.T. Spampinato et al. / Preca
haw, R.D., Wellman, P., Gunn, P., Whitaker, A.J., Tarlowski, C.Z., Morse, M., 1996.Guide to Using the Australian Crustal Elements Map. AGSO – Australian Geolog-ical Survey Organisation, Canberra, A.C.T., Australia.
imons, F.J., Zielhuis, A., Van Der Hilst, R.D., 1999. The Deep Structure of the Aus-tralian Continent from Surface Wave Tomography., pp. 17–43.
outhgate, P.N., Bradshaw, B.E., Domagala, J., Jackson, M.J., Idnurm, M., Krassay,A.A., Page, R.W., Sami, T.T., Scott, D.L., Lindsay, J.F., McConachie, B.A., Tar-lowski, C., 2000. Chronostratigraphic basin framework for Palaeoproterozoicrocks (1730–1575 Ma) in northern Australia and implications for base-metalmineralisation. Aust. J. Earth Sci. 47, 461–483.
pampinato, G.P.T., Betts, P.G., Ailleres, L., Armit, R.J., 2015a. Early tectonic evolu-tion of the Thomson Orogen in Queensland inferred from constrained magneticand gravity data. Tectonophysics, http://dx.doi.org/10.1016/j.precamres.2015.04.002
pampinato, G.P.T., Aillères, L., Betts, P.G., 2015b. Deep Australia – understandingplate architecture and evolution of the transition between Proterozoic Australiaand the eastern margin of Gondwana., pp. 63–113, Monash University Theses.
pence, A.G., Finlayson, D.M., 1983. The resistivity structure of the crust and uppermantle in the central Eromanga Basin, Queensland, using magnetotelluric tech-niques (Australia). J. Geol. Soc. Aust. 30, 1–16.
pikings, R.A., Foster, D.A., Kohn, B.P., Lister, G.S., 2001. Post-orogenic (<1500 Ma)thermal history of the proterozoic Eastern Fold Belt, Mount Isa Inlier, Australia.Precambrian Res. 109, 103–144.
tewart, J.R., Betts, P.G., 2010a. Implications for Proterozoic plate margin evolu-tion from geophysical analysis and crustal-scale modeling within the westernGawler Craton, Australia. Tectonophysics 483, 151–177.
tewart, J.R., Betts, P.G., 2010b. Late Paleo-Mesoproterozoic plate margin deforma-tion in the southern Gawler Craton: insights from structural and aeromagneticanalysis. Precambrian Res. 177, 55–72.
an Heeswijck, A., 2010. Late paleozoic to early Mesozoic deformation in the north-eastern Galilee Basin, Australia. Aust. J. Earth Sci. 57, 431–451.
n Research 264 (2015) 63–81 81
Veevers, J.J., 2000. Billion-Year Earth History of Australia and Neighbours in Gond-wanaland. GEMOC Press, Sydney, N.S.W., Australia.
Veevers, J.J., Powell, C.M., 1984. In: Veevers, J.J. (Ed.), Comparative Tectonics of theTransverse Structural Zones of Australia and North America, Oxford GeologicalSciences Series No. 2. Phanerozoic Earth History of Australia.
Wake-Dyster, K.D., Moss, F.J., Sexton, M.J., 1983. New seismic reflection results inthe central Eromanga Basin, Queensland, Australia: the key to understanding itstectonic evolution. Tectonophysics 100, 147–162.
Wellman, P., 1990. A Tectonic Interpretation of the Gravity and Magnetic Anoma-lies in Southern Queensland, vol. 232. Bulletin – Australia, Bureau of MineralResources, Geology and Geophysics, pp. 21–35.
Wellman, P., 1992. Structure of the Mount Isa Region Inferred from Gravity andMagnetic Anomalies. Detailed Studies of the Mount Isa Inlier., pp. 15–27.
Williams, H.A., Betts, P.G., Ailleres, L., Burtt, A., 2010. Characterization of a pro-posed Palaeoproterozoic suture in the crust beneath the Curnamona Province,Australia. Tectonophysics 485, 122–140.
Wingate, M.T.D., Evans, D.A.D., 2003. Palaeomagnetic Constraints on the ProterozoicTectonic Evolution of Australia., pp. 77–91.
Wingate, M.T.D., Pisarevsky, S.A., Evans, D.A.D., 2002. Rodinia connections betweenAustralia and Laurentia: No SWEAT, no AUSWUS? Terra Nova 14, 121–128.
Withnall, I.W., Blake, P.R., Crouch, S.B.S., Woods, K.T., Grimes, K.G., Hayward, M.A.,Lam, J.S., Garrad, P., Rees, I.D., 1995. Geology of the Southern Part of theAnakie Inlier, Central Queensland. Department of Resource Industries, Brisbane,Australia.
Withnall, I.W., Golding, S.D., Rees, I.D., Dobos, S.K., 1996. K–Ar dating of the AnakieMetamorphic Group: evidence for an extension of the Delamerian Orogeny into
central Queensland. Aust. J. Earth Sci. 43, 567–572.Wyborn, L., 1998. Younger ca 1500 Ma granites of the Williams and Narakubatholiths, Cloncurry District, eastern Mt Isa Inlier: geochemistry, origin,metallogenic significance and exploration indicators. Aust. J. Earth Sci. 45,397–411.