
Strides cover Volume 5 - SRCC
216
VOLUME 5 – ISSUE1 & 2 JULY 2020 - JUNE 2021 Effects of Globalization on The Indian Health Sector Will America Sustain The Wave of Automation? Recycling Hoax The Role of Corporate Social Responsibility towards Sustainable Education with reference to the FMCG Companies Covid-19 and Mental Health of Adolescents Cryptocurrency- The Rise of Tokens Population Trends in India: Demographic Dividend or Demographic Drag? An Analysis of Thrift Industry in India Discussion of the Link Between Air Pollution and Economic Growth in Indian States The Nexus Between Economic Growth and Public Outlays and Deficits in India: An Econometric Analysis Vidhi Sethi Anmol Bhagat Ashish Kumar Nikunj Singhal & Aastha Garg Dipali Nishad Aayush Jain & Ishika Kamani Nirikta Mukherjee Pragati Agrawal, Tanya Goel & Prachi Yadav Rajsi Sah & Prachi Yadav Somya Garg SHRI RAM COLLEGE OF COMMERCE STRIDES - A STUDENTS' JOURNAL OF SHRI RAM COLLEGE OF COMMERCE ISSN: 2581-4931 (Print)
-
Upload
khangminh22 -
Category
Documents
-
view
1 -
download
0
Transcript of Strides cover Volume 5 - SRCC
VOLUME 5 – ISSUE1 & 2 JULY 2020 - JUNE 2021
Effects of Globalization on The Indian Health Sector
Will America Sustain The Wave of Automation?
Recycling Hoax
The Role of Corporate Social Responsibility towards Sustainable Education with reference to the FMCG Companies
Covid-19 and Mental Health of Adolescents
Cryptocurrency- The Rise of Tokens
Population Trends in India: Demographic Dividend or Demographic Drag?
An Analysis of Thrift Industry in India
Discussion of the Link Between Air Pollution and Economic Growth in Indian States
The Nexus Between Economic Growth and Public Outlays and Deficits in India: An Econometric Analysis
Vidhi Sethi
Anmol Bhagat
Ashish Kumar
Nikunj Singhal & Aastha Garg
Dipali Nishad
Aayush Jain & Ishika Kamani
Nirikta Mukherjee
Pragati Agrawal, Tanya Goel & Prachi Yadav
Rajsi Sah & Prachi Yadav
Somya Garg
SHRI RAM COLLEGE OF COMMERCE
STRIDES - A STUDENTS' JOURNAL OF SHRI RAM COLLEGE OF COMMERCE
ISSN: 2581-4931 (Print)


STRIDES - A STUDENTS' JOURNAL OF SHRI RAM COLLEGE OF COMMERCEISSN 2581-4931 (Print)
Shri Ram College of Commerce is well known for its academic excellence and dedicated approach towards dissemination of knowledge in the academic world. The college appreciates the role of research in education and is committed to developing an inclination towards research in both faculty and students. In this pursuit, the college has taken the initiative to launch a new Journal named 'Strides - A Students' Journal of Shri Ram College of Commerce'.
ABOUT THE JOURNAL
It is a double blind reviewed bi-annual Journal launched exclusively to encourage students to pursue research on the contemporary topics and issues in the area of commerce, economics, management, governance, polices etc. The journal provides an opportunity to the students and faculty of Shri Ram College of Commerce to publish their academic research work.
PUBLICATION POLICY
Shri Ram College of Commerce is committed to upholding the high academic standards. Therefore, the Committee on Publication Ethics (COPE) follows a 3-Stage Selection Process while approving a paper for publication in this Journal. The policy is as follows:
Stage-1. Screening of Plagiarism
To maintain high academic standards, academic ethics and academic integrity each research paper received by COPE (Committee on Publication Ethics) is sent for screening of plagiarism on “Turnitin”. The committee adheres to the maximum tolerance limit of 25%.
After screening for plagiarism, research papers are sent to the Referees (Subject Experts) for double blind review
Stage-2. Double Blind Review
The journal adheres to a rigorous double-blind review policy. Each research paper received by COPE is sent for review to the Referee (Subject Expert). The reports submitted by the Referees are sent to the respective students for improvement (if any, suggested by the Referees). After reporting all the suggestions recommended by the Referees, the revised and improved version of the papers are re-submitted by the students to the COPE.
If a research paper is rejected by the Referee, no further proceedings are taken into account. Once rejected by the expert means cannot be published at all.
i

Stage-3. Approval by Committee on Publication Ethics (COPE)
After double blind review and screening of plagiarism, research papers are submitted for final approval to the Committee on Publication Ethics (COPE). The research papers approved by COPE are finally sent for publication.
Since COPE is the apex authority to take all decisions related to publication of research papers and articles in 'Strides – A Students' Journal of Shri Ram College of Commerce', the decision of COPE is final and binding.
INSTRUCTIONS FOR MANUSCRIPT DRAFT
The following guidelines are to be carefully adhered by the students before final submission of the manuscript. The submitted manuscripts not conforming to the following guidelines are not taken into consideration for any further processing.
Format
Format of the article on the front page should be:
1. Title2. Name(s) of the student(s) and mentor along with their details3. Abstract4. Keywords
Abstract
The abstract should capture the essence of the article and entice the reader. It should typically be of 100 -150 words, and in Italics.
Font type and word limit
The research paper is to be typed on A-4 size paper with single line spacing. The complete length of the paper should not exceed 5000 words including endnotes and references. The font size should be 12 and font style should be Times New Roman.
Referencing style
The Journal adheres to the APA (American Psychological Association) Referencing Style, Sixth Edition. Students must refer to the APA Referencing Guidelines to ensure conformance to this reference style. For further information you may visit the following link - http://www.apastyle.org
Endnotes
Endnotes should be serially arranged at the end of the article well before the references and after conclusion.
ii
Table, Figures, Graphs
The first letter of the caption for table, figure, graph, diagram, picture etc. should be in capital letter and the other words should be in small letter - e.g. Table-1: Demographic Data of Delhi, Figure-1: Pictorial Presentation of Population etc.
MANUSCRIPT SUBMISSION GUIDELINES
Soft Copy
The soft copy of the manuscript should be sent through e-mail to the editor at [email protected] and cc to [email protected].
Hard Copy
The hard copy (3-Sets) of the manuscripts should be submitted in the Administrative Office of the College.
Declaration
As part of the submission process, the student and mentor needs to declare that they are submitting original work for first publication in the Journal and that their work is not being considered for publication elsewhere and has not already been published elsewhere. Again, the paper should not have been presented in any seminar or conference. The scanned copy of duly signed declaration by the students and their respective mentors has to be emailed along with the research paper.
COPYRIGHT
The student(s) remain the whole and sole author of their respective research papers published in 'Strides – A Students' Journal of Shri Ram College of Commerce' and hold its copyright. Also, the 'author' is wholly and solely responsible for plagiarism caught after publication (if any). The Editor, Referees, Mentors, COPE, SRCC, Printer, Publisher and Printing Press shall not be responsible for any plagiarism.
For further details visit:
https://www.srcc.edu/publications/students-publications
iii

Principal's Message
Through the Journal, students get an excellent platform to enhance their research calibre, display their academic perspective, and practically apply their classroom learnings to real-world situations. The present Issue includes s e v e r a l m u l t i - d i s c i p l i n a r y a n d contemporary topics such as “Effects of Globalization on the Indian Health Sector”, “Will America Sustain the Wave of Automation?”, “Recycling Hoax”, “The Role of Corporate Social Responsibility towards Sustainable Education with reference to the FMCG Companies”, “COVID-19 and Mental Health of Adolescents”, “Cryptocurrency-The Rise of Tokens”, and “Discussion of the Link Between Air Pollution and Economic Growth in Indian States”.
I wholeheartedly congratulate the Editor, Strides, Dr. Rajeev Kumar and students whose research papers got published in Volume 5 Issue 1and 2 of the Journal. Simultaneously, I encourage more students to contribute their research papers for the successive Issues.
My best wishes for your future endeavours!
Prof. Simrit KaurPrincipal
Visit: http://www.srcc.edu/publications/students-publications
To achieve and promote excellence in research and publish quality academic as well as educational resources as guided by the Mission Statement of the College, Shri Ram College of Commerce had launched a Journal, “Strides- A Students' Journal of Shri Ram College of Commerce” on the occasion of 91st Annual Day of the College held on 13th April, 2017. The Journal was released by then the Hon'ble Union Minister of Human Resource Development, Shri Prakash Javadekar. The Journal publishes the research papers and articles written by students of the College under the mentorship of Faculty Members which go through an intense review mechanism before getting published.
iv
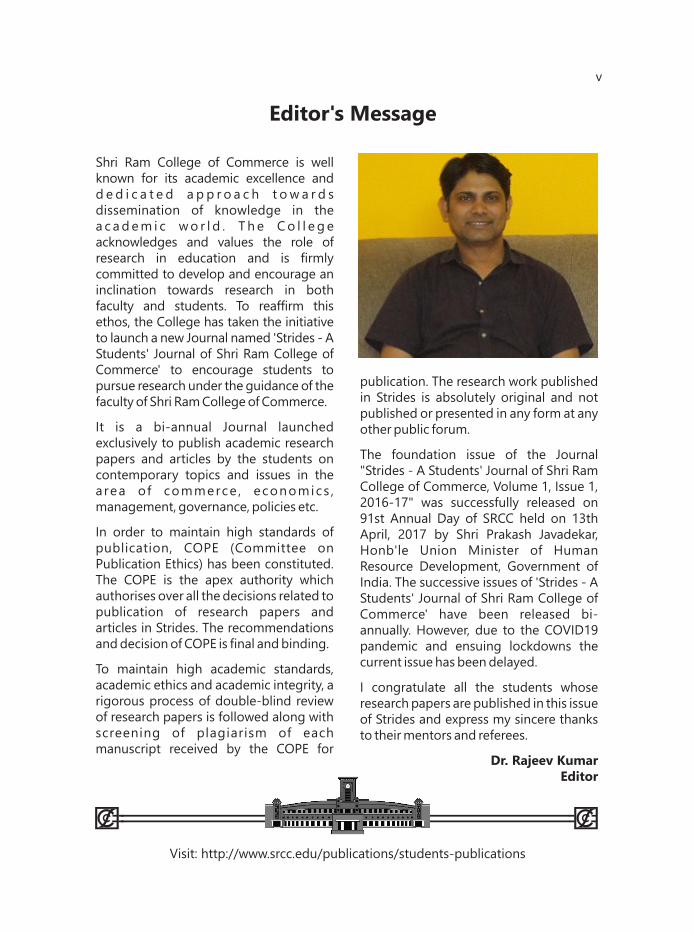
Editor's Message
publication. The research work published in Strides is absolutely original and not published or presented in any form at any other public forum.
The foundation issue of the Journal "Strides - A Students' Journal of Shri Ram College of Commerce, Volume 1, Issue 1, 2016-17" was successfully released on 91st Annual Day of SRCC held on 13th April, 2017 by Shri Prakash Javadekar, Honb'le Union Minister of Human Resource Development, Government of India. The successive issues of 'Strides - A Students' Journal of Shri Ram College of Commerce' have been released bi-annually. However, due to the COVID19 pandemic and ensuing lockdowns the current issue has been delayed.
I congratulate all the students whose research papers are published in this issue of Strides and express my sincere thanks to their mentors and referees.
Dr. Rajeev KumarEditor
Visit: http://www.srcc.edu/publications/students-publications
Shri Ram College of Commerce is well known for its academic excellence and d e d i c a t e d a p p r o a c h t o w a r d s dissemination of knowledge in the a c a d e m i c w o r l d . T h e C o l l e g e acknowledges and values the role of research in education and is firmly committed to develop and encourage an inclination towards research in both faculty and students. To reaffirm this ethos, the College has taken the initiative to launch a new Journal named 'Strides - A Students' Journal of Shri Ram College of Commerce' to encourage students to pursue research under the guidance of the faculty of Shri Ram College of Commerce.
It is a bi-annual Journal launched exclusively to publish academic research papers and articles by the students on contemporary topics and issues in the a rea of commerce , economics , management, governance, policies etc.
In order to maintain high standards of publication, COPE (Committee on Publication Ethics) has been constituted. The COPE is the apex authority which authorises over all the decisions related to publication of research papers and articles in Strides. The recommendations and decision of COPE is final and binding.
To maintain high academic standards, academic ethics and academic integrity, a rigorous process of double-blind review of research papers is followed along with screening of plagiarism of each manuscript received by the COPE for
v
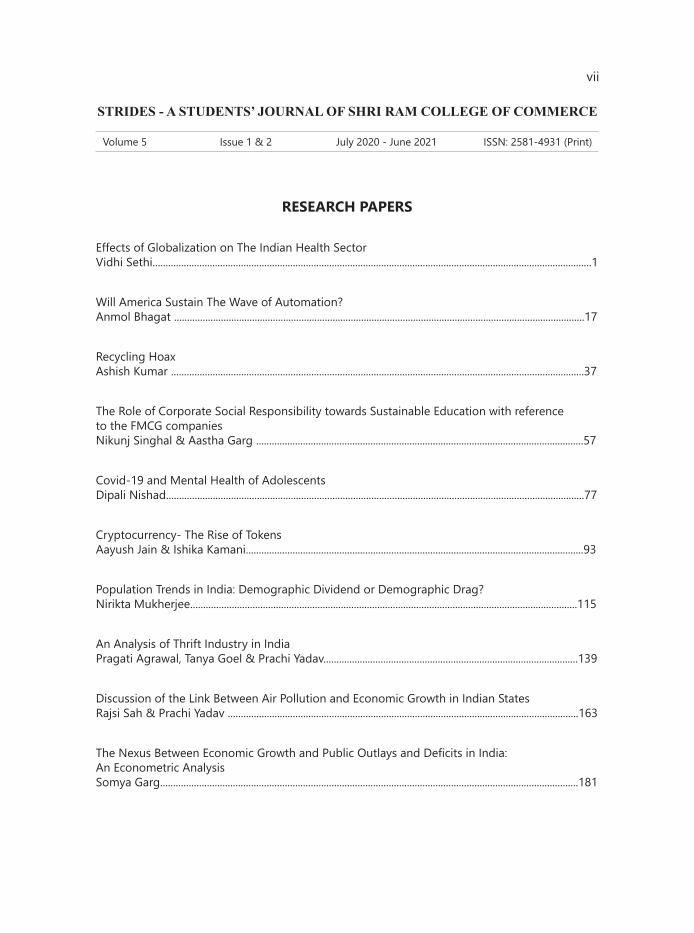
STRIDES - A STUDENTS’ JOURNAL OF SHRI RAM COLLEGE OF COMMERCE
Volume 5 Issue 1 & 2 July 2020 - June 2021 ISSN: 2581-4931 (Print)
RESEARCH PAPERS
Vidhi Sethi.........................................................................................................................................................................1
Anmol Bhagat ..............................................................................................................................................................17
Ashish Kumar ...............................................................................................................................................................37
Nikunj Singhal & Aastha Garg ..............................................................................................................................57
Dipali Nishad.................................................................................................................................................................77
Aayush Jain & Ishika Kamani..................................................................................................................................93
Nirikta Mukherjee.....................................................................................................................................................115
Pragati Agrawal, Tanya Goel & Prachi Yadav..................................................................................................139
Rajsi Sah & Prachi Yadav .......................................................................................................................................163
Somya Garg.................................................................................................................................................................181
Effects of Globalization on The Indian Health Sector
Will America Sustain The Wave of Automation?
Recycling Hoax
The Role of Corporate Social Responsibility towards Sustainable Education with reference to the FMCG companies
Covid-19 and Mental Health of Adolescents
Cryptocurrency- The Rise of Tokens
Population Trends in India: Demographic Dividend or Demographic Drag?
An Analysis of Thrift Industry in India
Discussion of the Link Between Air Pollution and Economic Growth in Indian States
The Nexus Between Economic Growth and Public Outlays and Deficits in India: An Econometric Analysis
vii

Effects of
Globalization on
The Indian Health
Sector
Globalization is the integration of world
economies into a common global economy. It has
far-reaching effects on the healthcare sector. In a
country like India, where around 23% of the
population lives below the poverty line, adoption
of neo-liberal policies after the 1991 economic
crisis, has had both positive and negative impacts.
Though the overall figures have improved
exponentially, a major section of the society still
doesn't have access to proper healthcare owing to
the scarcity of hospitals and dispensaries in rural
areas and the exorbitant charges of the private
hospitals. The out-of-pocket expenditure forces
the poor to incur debts or even sell their assets.
There is a clear development of consumerist
culture where only those who have resources can
access good healthcare and those who don't, are
at the mercy of Government run hospitals and
dispensaries, which often lack basic infrastructure
despite the fact that health is a fundamental right
of every human-being, irrespective of social
status. Medical tourism is a sector that has
developed due to globalization and the ability of
Vidhi Sethi
B.Com. (Hons.)
SRCC, DU
Mentor:
Dr. Hijam Liza Dallo Rihmo
Assistant Professor
Department of Pol. Science
SRCC, DU
1
ABSTRACT
people to travel to foreign countries to seek medical attention. India is a major
player in this industry due to its low cost and high-quality services. The growth
rate of the medical tourism industry is around 25% and this attracts a lot of
Foreign Direct Investment (FDI) from Non-Resident Indians (NRIs). The country
is able to generate a lot of revenue through this industry which it uses in its
further development rather than the development of the public health services
unlike the Cuban government which uses the revenue generated to provide free
treatment to its citizens and some allied nations. This paper is an attempt to
analyze the shortfalls in the Indian Health sector and measures to improve the
prevailing situation.
Keywords: Globalization. Neo-Liberal Policies, User-Fees, Out-of-Pocket
Expenditure, Medical Tourism
INTRODUCTION
Anthony McGrew (1992) defines globalization as “the multiplicity of linkages
and interconnections between the states and societies that make up the
present world system. It describes the process by which events, decisions, and
activities in one part of the world come to have significant consequences for
individuals and communities in quite distant parts of the globe.” In simple
words, globalization is the process by which the world is becoming
increasingly interconnected as a result of massively increased trade and
cultural exchange. Some argue that globalization is the sharing of cultures,
norms, values, traditions and ideologies, while some believe it is a mere
westernization or more particularly, Americanization of societies around the
world marked in particular by the adoption of neo-liberal policies namely
privatization, de-regulation of capital markets, lowering of trade barriers by
states across the world and the concept of reduced government
interventions. One of the areas where the effect of globalization and
adoption of neo-liberal policies is most prominent is the field of healthcare.
The World Health Organization defines health as “The state of complete
physical, mental and social well-being and not merely the absence of disease
or infirmity.” The WHO also states that the “enjoyment of the highest
attainable standard of health is one of the fundamental rights of every human
being without distinction of race, religion, political belief, economic or social
condition.” Globalization is causing profound changes to the very nature of
STRIDES - A Students' Journal of Shri Ram College of Commerce, Vol.5, Issue 1 & 22

healthcare in the world. It has its own opportunities and threats. This article
shall look at the effect of globalization on the health sector of India and try to
critically analyze whether the statements given by WHO have been properly
implemented and achieved or not.
LITERATURE REVIEW
This article has been inspired from Marianne Emler's (2008) article
'Globalization and Health: A blessing or a curse? A case review of the Indian
healthcare system' which gives a brief account of the effects of globalization
on the social fabric of the nation and how it has impacted the health status of
the population after independence. The article also discusses medical
tourism and states how the benefits of it are not able to trickle down to the
poor. Tikki Pang and G. Emmanuel Gondon (2004) in the article 'Globalization
and risks to health' talked about the negative impacts of globalization and
movement of people, goods and services across nations. They argued that
because of globalization there is a huge disparity within nations. They also
discussed how any disease becomes a global disease and has to be dealt at an
international level. Maud Huynen and Pim Martins (2005) in their work 'The
Health Impacts of Globalization: A Conceptual Framework' developed a
framework to how globalization affects the institutional, economic and
ecological aspects of health. Along the same line of argument Neil Lunt,
Richard Smith, Mark Exworthy, Stephen T. Green, Daniel Horsfall and Russell
Mannion (2005) in their book 'Medical Tourism: Treatments, Markets and
Health System Implications: A scoping review' give a detailed description of
medical tourism; how it originated; it's present condition in different parts of
the world; the different dimensions of medical travel and how it is impacting
individual nations and the world economy in general. The book has, using
numerous statistical tools, explained the positive and negative impacts of
medical tourism.
This paper 'Effects of Globalization on the Indian Health Sector' shall primarily
focus on the changes that the Indian health sector went through post-
independence and how further development like introduction of user-fees
and medical tourism are acting as a double-edged sword in a country like
India where there are clear economic disparities.
3Effects of Globalization on The Indian Health Sector
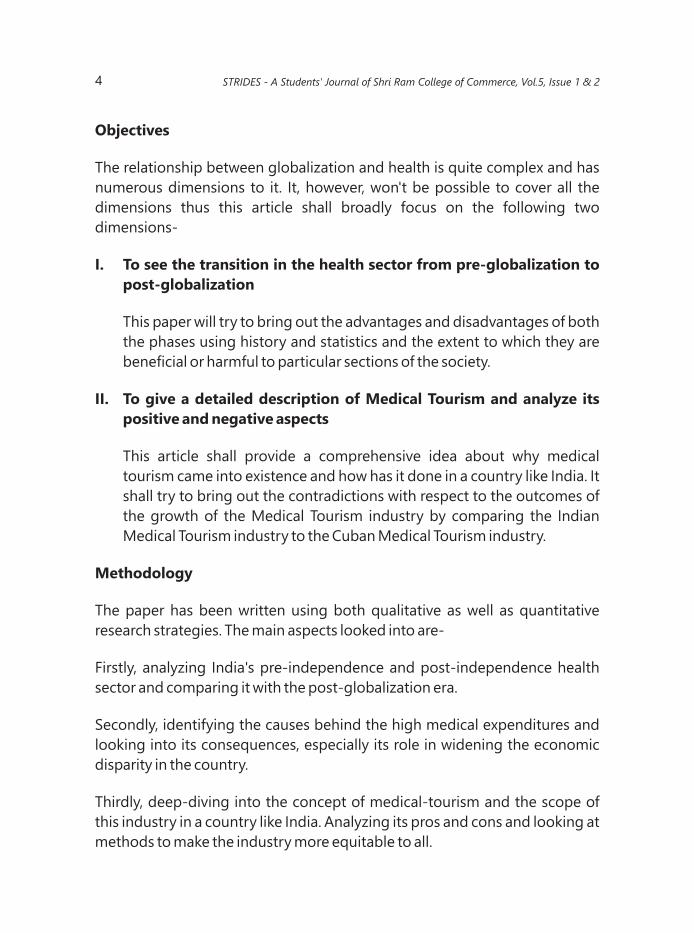
Objectives
The relationship between globalization and health is quite complex and has
numerous dimensions to it. It, however, won't be possible to cover all the
dimensions thus this article shall broadly focus on the following two
dimensions-
I. To see the transition in the health sector from pre-globalization to
post-globalization
This paper will try to bring out the advantages and disadvantages of both
the phases using history and statistics and the extent to which they are
beneficial or harmful to particular sections of the society.
II. To give a detailed description of Medical Tourism and analyze its
positive and negative aspects
This article shall provide a comprehensive idea about why medical
tourism came into existence and how has it done in a country like India. It
shall try to bring out the contradictions with respect to the outcomes of
the growth of the Medical Tourism industry by comparing the Indian
Medical Tourism industry to the Cuban Medical Tourism industry.
Methodology
The paper has been written using both qualitative as well as quantitative
research strategies. The main aspects looked into are-
Firstly, analyzing India's pre-independence and post-independence health
sector and comparing it with the post-globalization era.
Secondly, identifying the causes behind the high medical expenditures and
looking into its consequences, especially its role in widening the economic
disparity in the country.
Thirdly, deep-diving into the concept of medical-tourism and the scope of
this industry in a country like India. Analyzing its pros and cons and looking at
methods to make the industry more equitable to all.
4 STRIDES - A Students' Journal of Shri Ram College of Commerce, Vol.5, Issue 1 & 2
5
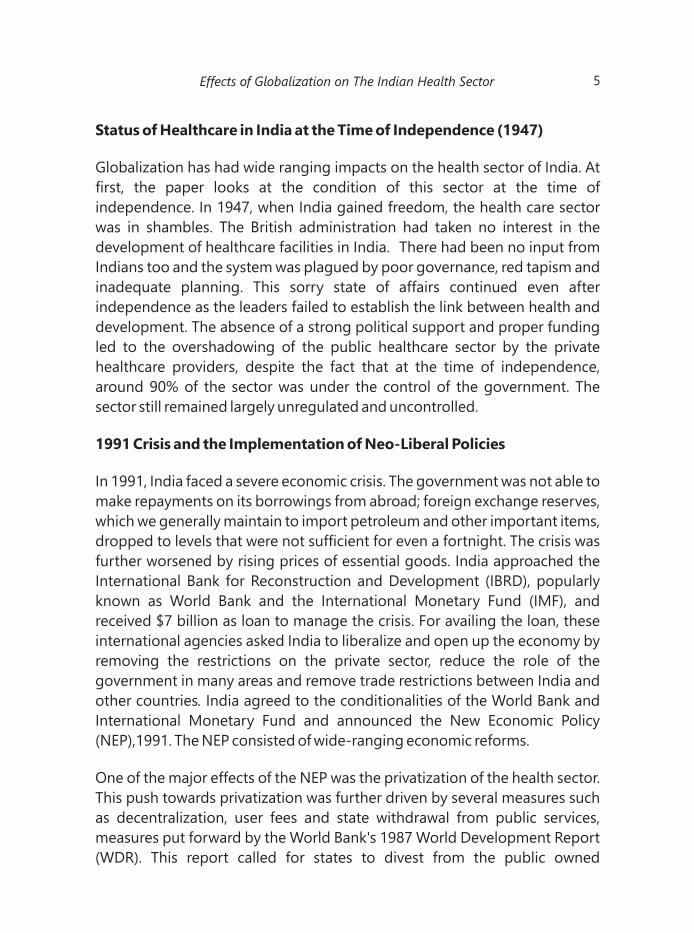
Status of Healthcare in India at the Time of Independence (1947)
Globalization has had wide ranging impacts on the health sector of India. At
first, the paper looks at the condition of this sector at the time of
independence. In 1947, when India gained freedom, the health care sector
was in shambles. The British administration had taken no interest in the
development of healthcare facilities in India. There had been no input from
Indians too and the system was plagued by poor governance, red tapism and
inadequate planning. This sorry state of affairs continued even after
independence as the leaders failed to establish the link between health and
development. The absence of a strong political support and proper funding
led to the overshadowing of the public healthcare sector by the private
healthcare providers, despite the fact that at the time of independence,
around 90% of the sector was under the control of the government. The
sector still remained largely unregulated and uncontrolled.
1991 Crisis and the Implementation of Neo-Liberal Policies
In 1991, India faced a severe economic crisis. The government was not able to
make repayments on its borrowings from abroad; foreign exchange reserves,
which we generally maintain to import petroleum and other important items,
dropped to levels that were not sufficient for even a fortnight. The crisis was
further worsened by rising prices of essential goods. India approached the
International Bank for Reconstruction and Development (IBRD), popularly
known as World Bank and the International Monetary Fund (IMF), and
received $7 billion as loan to manage the crisis. For availing the loan, these
international agencies asked India to liberalize and open up the economy by
removing the restrictions on the private sector, reduce the role of the
government in many areas and remove trade restrictions between India and
other countries. India agreed to the conditionalities of the World Bank and
International Monetary Fund and announced the New Economic Policy
(NEP),1991. The NEP consisted of wide-ranging economic reforms.
One of the major effects of the NEP was the privatization of the health sector.
This push towards privatization was further driven by several measures such
as decentralization, user fees and state withdrawal from public services,
measures put forward by the World Bank's 1987 World Development Report
(WDR). This report called for states to divest from the public owned
Effects of Globalization on The Indian Health Sector
enterprises such as hospitals in order to increase their efficiency and
profitability. Following this, the Indian government began to decrease its
grants to states, with these dropping from 19.9% to 3.3% in the period 1984-
1993.
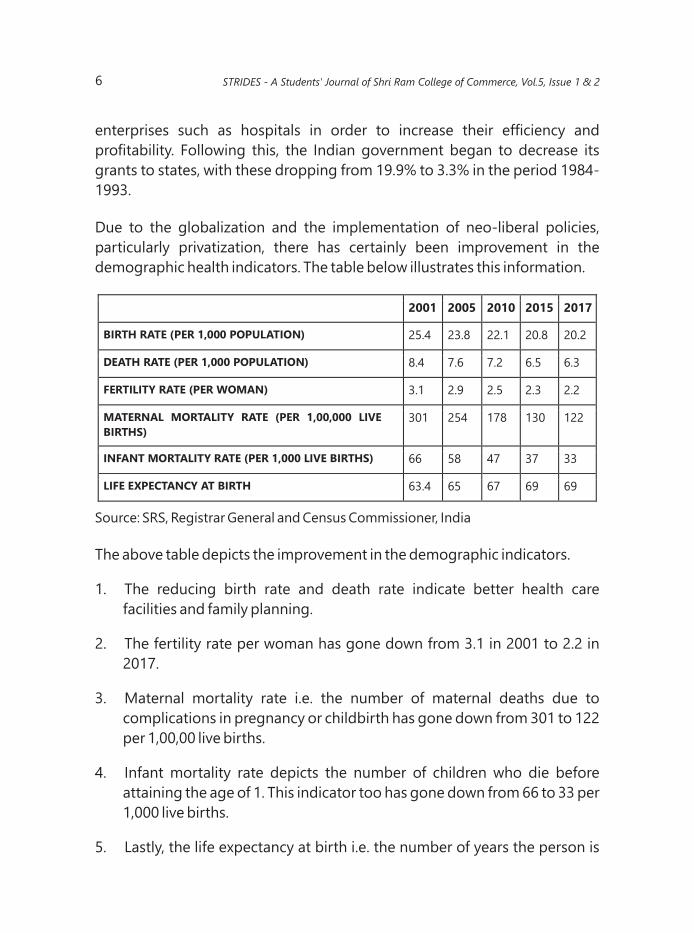
Due to the globalization and the implementation of neo-liberal policies,
particularly privatization, there has certainly been improvement in the
demographic health indicators. The table below illustrates this information.
Source: SRS, Registrar General and Census Commissioner, India
The above table depicts the improvement in the demographic indicators.
1. The reducing birth rate and death rate indicate better health care
facilities and family planning.
2. The fertility rate per woman has gone down from 3.1 in 2001 to 2.2 in
2017.
3. Maternal mortality rate i.e. the number of maternal deaths due to
complications in pregnancy or childbirth has gone down from 301 to 122
per 1,00,00 live births.
4. Infant mortality rate depicts the number of children who die before
attaining the age of 1. This indicator too has gone down from 66 to 33 per
1,000 live births.
5. Lastly, the life expectancy at birth i.e. the number of years the person is
6
2001 2005 2010 2015 2017
BIRTH RATE (PER 1,000 POPULATION) 25.4 23.8 22.1 20.8 20.2
DEATH RATE (PER 1,000 POPULATION) 8.4 7.6 7.2 6.5 6.3
FERTILITY RATE (PER WOMAN) 3.1 2.9 2.5 2.3 2.2
MATERNAL MORTALITY RATE (PER 1,00,000 LIVE
BIRTHS)
301 254 178 130 122
INFANT MORTALITY RATE (PER 1,000 LIVE BIRTHS) 66 58 47 37 33
LIFE EXPECTANCY AT BIRTH 63.4 65 67 69 69
STRIDES - A Students' Journal of Shri Ram College of Commerce, Vol.5, Issue 1 & 2
expected to live has gone up from 63.4 years to 69 years. All of these
parameters have shown improvement which can be attributed to the
betterment and expansion of healthcare facilities.
India's Three-Tier Healthcare Structure
Before going further, it is important to know about the three-tier healthcare
system in India. (nhm.gov.in)
Tier 1: Primary Health Centres (PHCs), Community Health Centres
(CHCs) And Sub Centres
These are small hospitals and healthcare centres set up mostly in small towns
and rural areas, and are managed by a single doctor and an Auxiliary Nursing
Midwife (ANM). These centres focus mainly on educating people on issues
relating to healthcare, and provide immunization facilities against infectious
diseases. Here, preliminary treatment is offered to patients within
manageable limits.
Tier 2: Secondary Healthcare Institutions
These institutions are upgraded (compared to PHCs) and have facilities for
surgery, electrocardiogram (ECG) and X-Rays. They are located in big towns
and district headquarters.
Tier 3- Tertiary Healthcare Centres
These are high end and fully equipped medical centres, offering specialised
medical facilities. The tertiary sector also includes educational and research
centres such as All India Institute of Medical Sciences (AIIMS), Delhi and Post
Graduate Institute of Medical Education and Research (PGIMER), Chandigarh.
Now, we can observe the following table. Here we can see how over a period
of 60 years (1951-2011), India has been able to improve the overall situation
of its health sector.
7Effects of Globalization on The Indian Health Sector
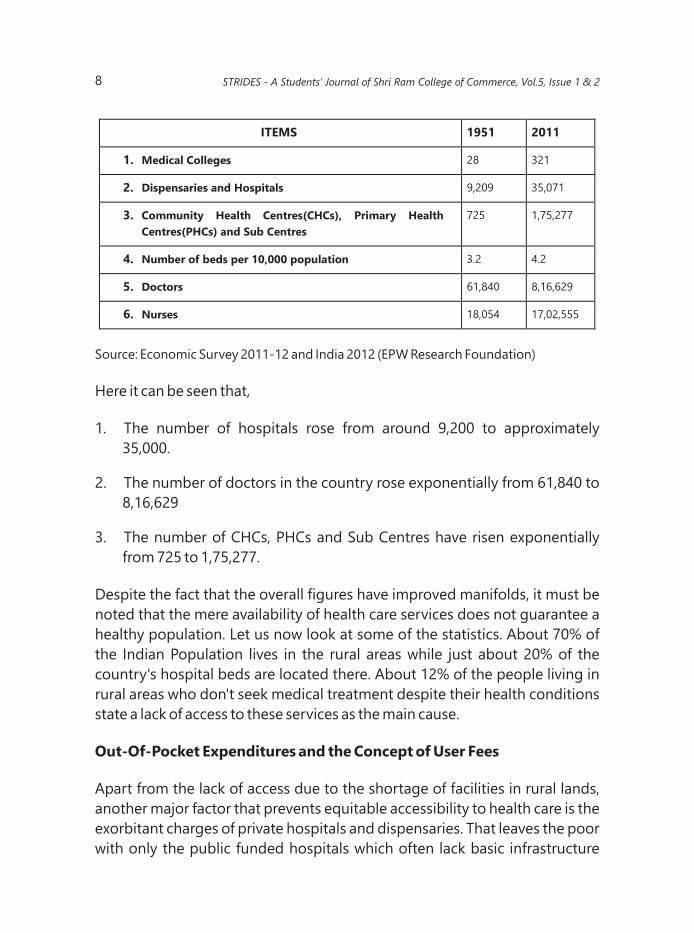
Source: Economic Survey 2011-12 and India 2012 (EPW Research Foundation)
Here it can be seen that,
1. The number of hospitals rose from around 9,200 to approximately
35,000.
2. The number of doctors in the country rose exponentially from 61,840 to
8,16,629
3. The number of CHCs, PHCs and Sub Centres have risen exponentially
from 725 to 1,75,277.
Despite the fact that the overall figures have improved manifolds, it must be
noted that the mere availability of health care services does not guarantee a
healthy population. Let us now look at some of the statistics. About 70% of
the Indian Population lives in the rural areas while just about 20% of the
country's hospital beds are located there. About 12% of the people living in
rural areas who don't seek medical treatment despite their health conditions
state a lack of access to these services as the main cause.
Out-Of-Pocket Expenditures and the Concept of User Fees
Apart from the lack of access due to the shortage of facilities in rural lands,
another major factor that prevents equitable accessibility to health care is the
exorbitant charges of private hospitals and dispensaries. That leaves the poor
with only the public funded hospitals which often lack basic infrastructure
8
ITEMS 1951 2011
1. Medical Colleges 28 321
2.
Dispensaries and Hospitals
9,209
35,071
3. Community Health Centres(CHCs), Primary Health
Centres(PHCs) and Sub Centres
725 1,75,277
4. Number of beds per 10,000 population 3.2 4.2
5. Doctors 61,840 8,16,629
6. Nurses 18,054 17,02,555
STRIDES - A Students' Journal of Shri Ram College of Commerce, Vol.5, Issue 1 & 2
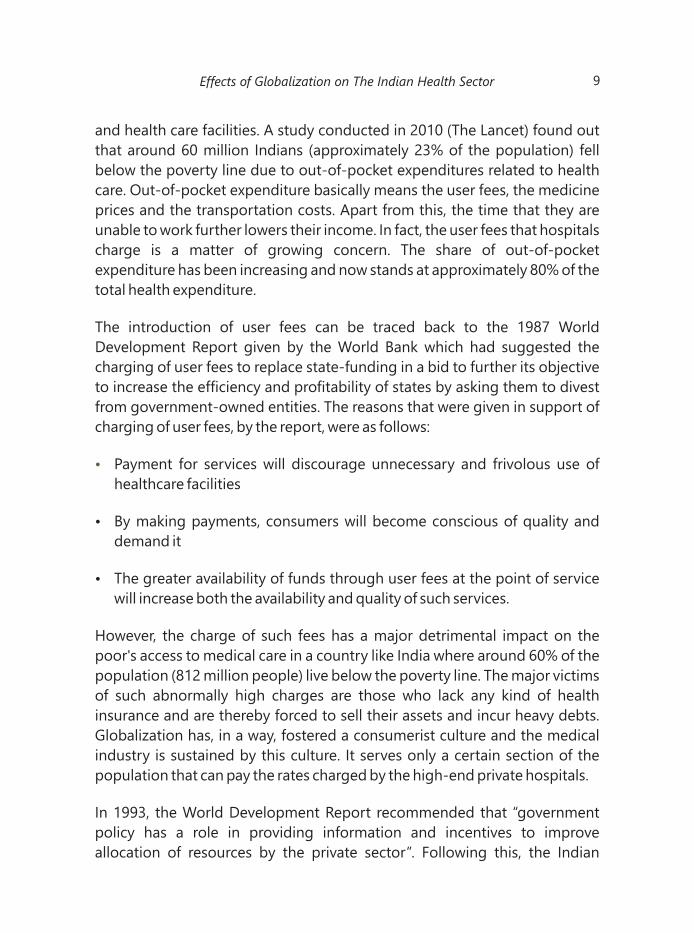
and health care facilities. A study conducted in 2010 (The Lancet) found out
that around 60 million Indians (approximately 23% of the population) fell
below the poverty line due to out-of-pocket expenditures related to health
care. Out-of-pocket expenditure basically means the user fees, the medicine
prices and the transportation costs. Apart from this, the time that they are
unable to work further lowers their income. In fact, the user fees that hospitals
charge is a matter of growing concern. The share of out-of-pocket
expenditure has been increasing and now stands at approximately 80% of the
total health expenditure.
The introduction of user fees can be traced back to the 1987 World
Development Report given by the World Bank which had suggested the
charging of user fees to replace state-funding in a bid to further its objective
to increase the efficiency and profitability of states by asking them to divest
from government-owned entities. The reasons that were given in support of
charging of user fees, by the report, were as follows:
Payment for services will discourage unnecessary and frivolous use of
healthcare facilities
Ÿ By making payments, consumers will become conscious of quality and
demand it
Ÿ The greater availability of funds through user fees at the point of service
will increase both the availability and quality of such services.
However, the charge of such fees has a major detrimental impact on the
poor's access to medical care in a country like India where around 60% of the
population (812 million people) live below the poverty line. The major victims
of such abnormally high charges are those who lack any kind of health
insurance and are thereby forced to sell their assets and incur heavy debts.
Globalization has, in a way, fostered a consumerist culture and the medical
industry is sustained by this culture. It serves only a certain section of the
population that can pay the rates charged by the high-end private hospitals.
In 1993, the World Development Report recommended that “government
policy has a role in providing information and incentives to improve
allocation of resources by the private sector”. Following this, the Indian
Ÿ
9Effects of Globalization on The Indian Health Sector
Government introduced allocations, favorable tax policies, decreased import
levies and personnel training to encourage the private sector to invest in the
health sector. However, to improve the allocation issue, it laid down the
condition that private hospitals and nursing homes need to set aside some
percentage of their beds for treating the poor, free of cost. However, the
major issue with this was that it was left to the hospitals to decide for
themselves who they considered poor enough to be treated for free. The
Indian government had granted access to subsidized land to nearly 40 private
hospitals out of which around 10 hospitals did not treat the poor for free. The
Supreme Court of India gave the ruling in 2018 that the private hospitals
which have received subsidized land from the Government needed to
allocate 25% of their Out Patient Department (OPD) facilities and 10% of their
In-Patient Department (IPD) facilities for the poor. However, another ruling in
2014 was in favor of the private hospitals and prevented them from such
allocation. The major culprit for this unsystematic approach towards
equitable health care allocation remains the poor governance on this issue.
The government is yet to take a firm stand on this as its decision is governed
on numerous factors. One such factor is Medical Tourism.
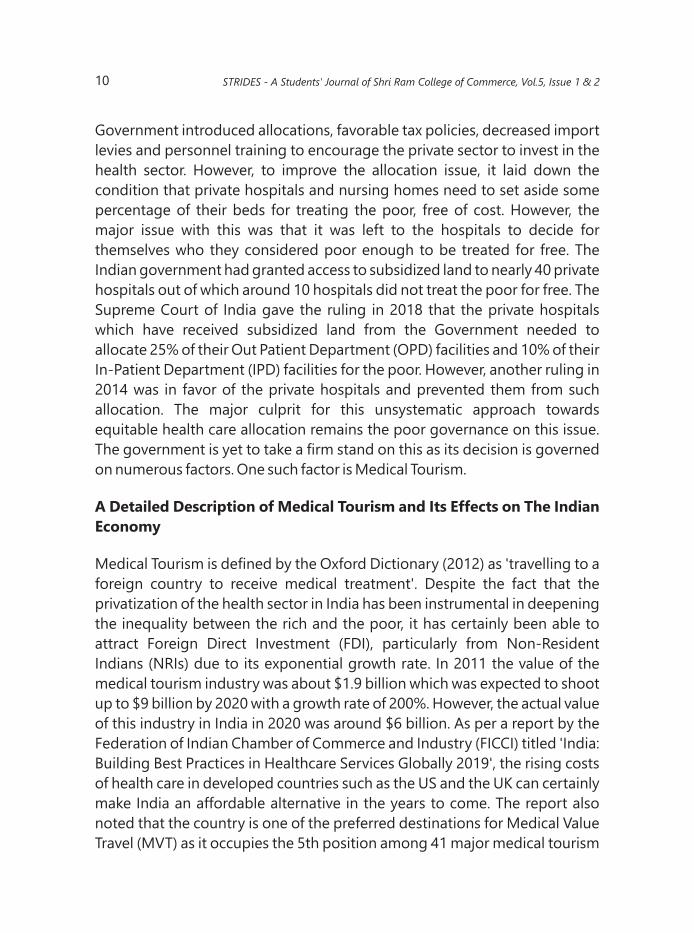
A Detailed Description of Medical Tourism and Its Effects on The Indian
Economy
Medical Tourism is defined by the Oxford Dictionary (2012) as 'travelling to a
foreign country to receive medical treatment'. Despite the fact that the
privatization of the health sector in India has been instrumental in deepening
the inequality between the rich and the poor, it has certainly been able to
attract Foreign Direct Investment (FDI), particularly from Non-Resident
Indians (NRIs) due to its exponential growth rate. In 2011 the value of the
medical tourism industry was about $1.9 billion which was expected to shoot
up to $9 billion by 2020 with a growth rate of 200%. However, the actual value
of this industry in India in 2020 was around $6 billion. As per a report by the
Federation of Indian Chamber of Commerce and Industry (FICCI) titled 'India:
Building Best Practices in Healthcare Services Globally 2019', the rising costs
of health care in developed countries such as the US and the UK can certainly
make India an affordable alternative in the years to come. The report also
noted that the country is one of the preferred destinations for Medical Value
Travel (MVT) as it occupies the 5th position among 41 major medical tourism
10 STRIDES - A Students' Journal of Shri Ram College of Commerce, Vol.5, Issue 1 & 2

destinations, as per Medical Tourism Index Overall ranking, 2016. The
phenomenal growth rate of this industry can be attributed to the well-trained
English-speaking medical staff, state-of-the-art medical facilities and
attractive prices of medical interventions. It is estimated that the medical
tourism industry has the potential to grow to represent 25% of India's GDP.
The main factor that attracts foreign tourists as pointed out by the 2019
report is the affordable pricing of medical intervention in comparison to the
rest of the world. The following table depicts the cost of various medical
procedures in different countries that are also among the most preferred
countries among medical tourists. It can be noted that India has the lowest
cost in 13 out of 19 procedures. (The lowest prices have been highlighted)
COSTS OF MEDICAL TOURISM (IN USD)
11
INDIA THAILAND MALAYSIA SINGAPORE TURKEY S. KOREA
HEART BYPASS 7900
15000
12100
17200
13900
26000
ANGIOPLASTY 5700 4200
8000
13400
4800
17700
HEART VALVE
REPLACEMENT
9500
17200
13500
16900
17200
39900
HIP REPLACEMENT 7200
17000
8000
13900
13900
21000
HIP RESURFACING 9700 13500 12500 16350 10100 19500
KNEE
REPLACEMENT
6600 14000 7700 16000 10400 17500
SPINAL FUSION 10300 9500 6000
12800
16800
16900
DENTAL IMPLANT 900
1720
1500
2700
1100
1350
LAP BAND 7300
11500
8150
9200
8600
10200
GASTRIC SLEEVE 6000
9900
8400
11500
12900
9950
GASTRIC BYPASS 7000
16800
9900
13700
13800
10900
HYSTERECTOMY 3200 3650 4200 10400 7000 10400
Effects of Globalization on The Indian Health Sector
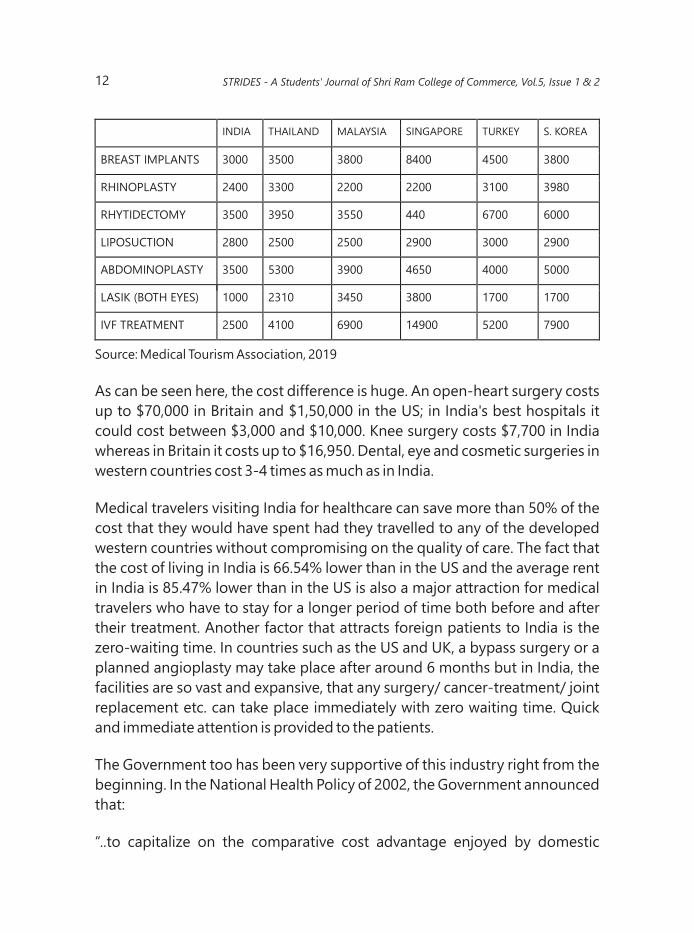
INDIA THAILAND MALAYSIA SINGAPORE TURKEY S. KOREA
BREAST IMPLANTS 3000
3500
3800
8400
4500
3800
RHINOPLASTY 2400 3300 2200
2200
3100 3980
RHYTIDECTOMY 3500 3950 3550 440 6700 6000
LIPOSUCTION 2800 2500 2500 2900 3000 2900
ABDOMINOPLASTY 3500
5300
3900
4650
4000 5000
LASIK (BOTH EYES) 1000
2310
3450
3800
1700
1700
IVF TREATMENT 2500 4100 6900 14900 5200 7900
Source: Medical Tourism Association, 2019
As can be seen here, the cost difference is huge. An open-heart surgery costs
up to $70,000 in Britain and $1,50,000 in the US; in India's best hospitals it
could cost between $3,000 and $10,000. Knee surgery costs $7,700 in India
whereas in Britain it costs up to $16,950. Dental, eye and cosmetic surgeries in
western countries cost 3-4 times as much as in India.
Medical travelers visiting India for healthcare can save more than 50% of the
cost that they would have spent had they travelled to any of the developed
western countries without compromising on the quality of care. The fact that
the cost of living in India is 66.54% lower than in the US and the average rent
in India is 85.47% lower than in the US is also a major attraction for medical
travelers who have to stay for a longer period of time both before and after
their treatment. Another factor that attracts foreign patients to India is the
zero-waiting time. In countries such as the US and UK, a bypass surgery or a
planned angioplasty may take place after around 6 months but in India, the
facilities are so vast and expansive, that any surgery/ cancer-treatment/ joint
replacement etc. can take place immediately with zero waiting time. Quick
and immediate attention is provided to the patients.
The Government too has been very supportive of this industry right from the
beginning. In the National Health Policy of 2002, the Government announced
that:
“..to capitalize on the comparative cost advantage enjoyed by domestic
12 STRIDES - A Students' Journal of Shri Ram College of Commerce, Vol.5, Issue 1 & 2
health facilities in the secondary and tertiary sector, the policy will encourage
the supply of services to patients of foreign origin on payment. The rendering
of such services on payment in foreign exchange will be treated as 'deemed
exports' and will be made eligible for all fiscal incentives extended to export
earnings..”
Apart from this, the visa application process is being further simplified by the
government to attract medical tourists. A new category of visas aimed
specifically for those intending to travel to India for medical purposes (M
visas) and for their spouses (MX visas) have been rolled out. The medical
tourists also get a package deal that includes flights, hotels, treatment and
often, a postoperative vacation.
The booming industry of medical tourism has helped retain well-qualified
medical personnel in the country. This is known as 'brain-regain' and is
helping to counter the 'brain-drain' that had negatively impacted India's
growth rate since decades. However, at the same time there has been the
phenomenon of 'internal brain-drain' where there has been a substantial shift
of medical personnel from Government hospitals to private hospitals that
offer treatment to foreign tourists. The attractive salaries in such hospitals
lures well-qualified medical practitioners. Also, they get a chance to
specialize and rise higher which is not that easy in Government hospitals.
Well- qualified medical professionals who have graduated from esteemed
public institutions for a very nominal fee go on to serve private hospitals. This
phenomenon of internal brain-drain again deprives the poor in the rural
areas from the chance of getting treated by good doctors as they are unable
to afford the private hospitals.
The revenue that the country is able to generate from the medical tourism
industry reflects its high potential and a promising future. However, a major
flip side is the fact that the revenue generated is not being used in the
betterment of the public health facilities. Corporate hospitals do not conform
to the government's conditions for granting subsidies by refusing to treat the
poor for free and have gotten away scot-free. The extra revenue from medical
tourism could benefit healthcare in India if allocated appropriately. Instead,
the medical tourism industry is being provided tax concessions; the
government gives private hospitals treating foreign patients benefits such as
13Effects of Globalization on The Indian Health Sector
lower import duties and an increased rate of depreciation (25-40%) for life-
saving medical equipment. Thus, the price advantage of the medical tourism
industry is paid for by the Indian tax payers who receive nothing in return.
This was, quite aptly, reflected by the Indian government's Public Accounts
Committee which had said that-
“What started with a grand idea of benefiting the poor turned out to be a
hunting ground for the rich in the garb of public charitable institutions.”
Contrast Example of Cuban Medical Tourism Industry
To illustrate this point, we can look at a contrast example of the Cuban
medical tourism industry. Cuba has been a pioneer in the healthcare industry
for almost 4 decades now. It has hospitals for residents and others for
foreigners and diplomats. Both kinds of hospitals are run by the government.
Cubans receive free healthcare while tourists have to pay for it. Hospitals
equipped with top quality medical equipment, highly proficient doctors,
nurses and other medical staff, abundant sunlight, well organized healthcare
departments and heartfelt hospitality, all add up to the growth of the Cuban
Medical Tourism industry. The prices of the treatment are around 80% lower
than those in the US. Despite this, the country is able to earn around $11
billion for its services per year. Apart from the medical treatment it provides
to foreign patients, it also earns money from contracts that it has with other
countries wherein the Cuban government sends doctors to other countries to
work there and in return the governments of these countries pay the Cuban
government for the doctors' efforts. Some countries like Venezuela, where
Cuba sends its doctors, pay in terms of oil in place of money which again is
beneficial to Cuba. The Cuban government has thus tried to generate income
and then plough it back to benefit its country's citizens. Alongside all this, it
has been able to achieve remarkable numbers in the demographic indicators.
Its life expectancy is around 77 for men and 81 for women which is among the
best in the world. It also has the lowest infant mortality rates in the world with
a 100% vaccination rate. This shows that the Cuban government has ensured
that the growth of the medical tourism industry does not lead to class
inequalities among its own population. Its policies have paved the way for a
holistic development of the health sector.
14 STRIDES - A Students' Journal of Shri Ram College of Commerce, Vol.5, Issue 1 & 2
In contrast, it is not that the Indian Government has not formulated policies or
laid down plans of action but it is due to the extreme negligence in
implementation of these plans and policies that the health sector is largely
unregulated and is further widening the economic disparities in the
population. It is important that the Government now steps in and ensures
that the privatization of the health sector along with the booming of the
medical tourism industry does not conflict with every person's basic right
given by the World Health Organization “...The enjoyment of the highest
attainable standards of health is one of the fundamental rights of every
human being without distinction of race, religion, political belief, economic or
social conditions…”
CONCLUSION
From the above discussion, we can draw the following conclusions -
Firstly, the condition of our health sector was quite poor at the time of
independence and it didn't quite improve until the 1991 crisis and the
consequent adoption of neo-liberal policies.
Secondly, although the post-globalization and post-privatization era led to
the overall betterment of the health indicators, yet the availability and
accessibility to equitable health care remained an issue.
Thirdly, the medical tourism industry, which has a great scope in India, has
helped generate huge revenues, most of which has been re-invested for its
further development. This has further exacerbated the rich-poor divide,
denying the lower strata of the country the benefits of improved health
infrastructure.
Thus, as a nation it is important that efforts to improve the medical tourism
industry are made but at the same time it is ensured that there are adequate,
well-maintained hospitals and nursing-homes in rural areas too.
Incentives like subsidized lands, lower taxes and free electricity can be
provided by the government to the private sector to set up health institutions
on the rural lands and provide free treatment to the poor. Also, the hospitals
which take benefits of these incentives must adhere to the conditions of the
15Effects of Globalization on The Indian Health Sector
government regarding free or subsidized treatment to the poor and there
should be stringent penalties for non-conformity.
The government should also invest in improving the current standards of the
public run healthcare institutions and set up more such institutions so that
the fruits of the economic growth can be enjoyed equitably by all.
REFERENCES
Marianne Emler (2017); Globalization and health- a blessing or a curse? A
case review of the Indian health system
Mario J. Azevedo, Barbara H. Johnson (2011); The impact of Globalization
Determinants and the health of the World's population
Neil Lunt, Richard Smith, Mark Exworthy, Stephen T. Green, Daniel Horsfall
and Russell Mannion; Medical Tourism: Treatments, Markets and Health
System Implications: A scoping review
Maud Huynen, Pim Martins, B M Hilderink (2005); The health impacts of
globalization: a conceptual framework
Tikki Pang, G. Emmanuel Guindon (2004); Globalization and Risks to Health
Kelly Lee (2004); Globalization - What is it and how does it affect health?
Arialys Hernandez Narino (2008); Developing an improvement strategy in
health research innovation and quality based on technology watch adoption:
a Cuban case study
16 STRIDES - A Students' Journal of Shri Ram College of Commerce, Vol.5, Issue 1 & 2
17
Will America Sustain
The Wave of
Automation?
Artificial Intelligence is at its peak and it's growing
day by day. The expansion of AI and Robotics has
reached in each and every profession and AI has
taken those jobs which were previously
considered uncomputerizable. The paper takes
you through historical references of automation
and how the transition took place at that time.
The effect of the CoronaVirus pandemic on
Business automation and how it will shape the
future of jobs is also taken into account. The
Critical analysis of The United States on ARI
(Automation Readiness Index) tests the capability
of preparing its workforce for the coming wave of
automation. The paper proposes the necessary
changes in the Education policy of The US which
should be implemented to reduce the job loss of
workers.
Keywords: Automation, AI, Education, Labour,
Future, Skills.
INTRODUCTION
“Public discussions around unemployment
typically focus on weak demand and
outsourcing to developing countries, with
Anmol Bhagat
B.Com. (Hons.)
SRCC, DU
ABSTRACT
Mentor:
Mr. Soumitra Kumar Choudhary
Associate Professor,
Department of English
SRCC, DU

18 STRIDES - A Students' Journal of Shri Ram College of Commerce, Vol.5, Issue 1 & 2
limited attention given to structural changes in the economy that result from
technological development” (Brynjolfsson & McAfee, 2011). Technological
developments are always seen as a staircase for the development of a nation
in all sectors i.e. Health sector, Education Sector, etc.
“Artificial Intelligence” (AI) – a term that was first used in 1956 by computer
scientist John McCarthy during a conference to discuss if machines could be
made intelligent”(Rossi, 2016) Artificial Intelligence defined as Intelligence
which gives the capability to machines to imitate human thinking pattern on
basis of data entered in it. AI can perform all the hard tasks with greater
efficiency with zero error.
The tempting world of automation attracts the attention of all but it comes
with a serious threat of unemployment. According to a Deloitte study, 50% of
all jobs are potentially open to automation in the coming decades. Does the
above statement make you skeptical about your job? Similarly, workers feel
when a new machine is brought into use at the workplace. An article
published in New York Times had an anecdote about a Kid who wanted to
become a soldier in the future and later gets to know from his father that there
are high chances that robots may replace humans in the Army profession.
So this anecdote gave me a very critical issue to ponder upon i.e. will a human
invention be able to take on humans itself.
History of Jobs occupation Displacement due to Automation
- Luddites:
Humans have long feared automation since it threatens to replace them in
unskilled labour with machines. Humans have always reacted negatively to
new inventions in the field of automation, according to historical evidence.
One such example is the Luddites, a group of people named after Ned Ludd, a
weaver from Anstey, England, who was the first to break the weaving
machine. The Luddites were a group of people who destroyed textile
machines in Nottingham, England in the nineteenth century.. “They protested
against manufacturers who used machines in what they called a fraudulent
and deceitful manner to get around standard labour practices'' (Connif,
2011). Luddites mostly consisted of the workshop owners who found it
Will America Sustain The Wave of Automation? 19
difficult to sell their products at the rate at which factory products were sold.
Luddites called it a deceitful manner to get around standard labour practices
for manufacturers using machinery as it was not possible to produce the
same product at the same cost with few workers in a workshop. “ Luddites
feared that the time spent learning the skills of their craft would go to waste,
as machines would replace their role in the industry” (History, 2015). One of
the main reasons why Luddites rebelled against employing machines was
because it was their lifetime to learn the weaving talent which was now readily
replaced by an unqualified man utilising the manufacturing technology.
- Neo Luddism
“Neo-Luddism or new Luddism is a philosophy opposing many forms of
modern technology”. (E.Jones, 2006). Neo Luddism is an ideology which, due
to its technology development, just has a concern of technology and a sense
of work insecurity. The automation transition phase has now begun. Many
employees anticipate job loss just because their task is easily automatic.
Compared with the other two industrializations, agricultural one and the
factory one, this shift of profession would not be smoother. The fear of the
machine has come again and is the severe, never seen before. Luddism st
movement is being rapidly reactivated by the automation boom in 21
century. Human beings now can react to technological advances in two ways:
firstly, to adapt slowly to the new technology and attempt to enhance the soft
skills which cannot be automatically achieved. Governments can also play a
major influence by reducing taxes on human labour and raising taxes on
machines in the adoption of such technologies. Governments should also
concentrate on changing education policies and focus more on vital abilities,
such as language skills, critical thinking and analysis.. Training and Vocational
Programmes will also be helpful for a smooth transition in other fields. The
second way to react to technological progress is by implementing new
technologies and seeing people's reactions against them. Suppose we were
in 2030 and we knew that employees burn computers and protest against
huge firms when they open news. They do this because even after having the
best skills conceivable, they are replaced from work. The similar occurred in
the 19th century, leading to the Luddites' mass revolution. If required efforts
in reaction to technological changes are not performed, then the mass
revolution can lead to loss of life and possessions.
- Invention of ATMs
The invention of the ATM (Automated Teller Machines) brought a disaster in
the lives of bank tellers in the US. “In the U.S., Dallas-based engineer Donald
Wetzel pioneered the development and deployment of the ATM, with the first
being installed at the Chemical Bank branch in Rockville Center, New York, in
September 1969.” (NCR, 2021).In 1970, approximately 300,000 worked as
bank tellers in the United States. They had a fear of losing their jobs but
something much unexpected happened. “In the United States, tellers held
approximately 608,000 jobs in 2006” (US bureau of Labour, 2008) This
shocking figure brings a paradox in the situation of how the number of tellers
increased in banks despite automation taking place. The answer to this
question is that banks found it easy to open new branches because ATMs
reduced the number of tellers required in a single bank. In this particular
situation, the tellers changed their repetitive work of counting cash to more
service-based like promoting sales and customer services. This brings us to
the O-Ring principle.
- O-Ring Principle
In 1986, the space transport Challenger detonated and smashed down to
Earth under two minutes after take-off. The reason for that crash turned out to
be a modest elastic O-ring in the sponsor rocket that had frozen on the
Launchpad the prior night and flopped calamitously minutes after departure.
In this multibillion-dollar endeavour that straightforward elastic O-ring made
the distinction between mission achievement and the catastrophic demise of
seven astronauts.An astute analogy for this sad setting is the O-ring creation
function named by Harvard market analyst Michael Kremer after the
Challenger disaster. The O-ring creation work thinks about the work as a
progression of interlocking advances. This principle of O-ring puts emphasis
that every single part of the mission is equally important to make the mission
successful. This situation shows the positive side of automation that
improvement in a single link leads to improvement of every part in the link. If
we take the example of Bank tellers from above we can observe that the
invention of ATMs brought a change in the whole banking system and also
transferred the work of Bank tellers from counting cash to other important
activities. This shows that the improvement in a single link(ATM's) improved
20 STRIDES - A Students' Journal of Shri Ram College of Commerce, Vol.5, Issue 1 & 2
21
the importance of other link Bank tellers in this case.
Major Threat of Artificial Intelligence is Job Loss
“AI is far more dangerous than Nukes'' (Musk, 2018) .This statement shows
how artificial intelligence exponentially grows and becomes dangerous for
people. In direct and indirect media, AI has reached every element of our life.
Robots receive enough of data and the ability to keep the data and deliver
outstanding outcomes, because human beings don't possess such quality up
until now. In several domains robots have already exceeded humans, with a
cluster of data and superior performance efficiency.. “Success in creating
effective AI could be the biggest event in the history of our civilization. Or the
worst We just don't know. So we cannot know if we will be infinitely helped by
AI, or ignored by it and side-lined, or conceivably
destroyed by it.” (Hawking, 2017), Elon Musk and Stephen Hawking are one of
those people who constantly remind us how much AI is dangerous for the
human race. They seem to have been afraid of AI progress because robots do
not have general intelligence so far, and if they
can flexibly think, it can lead to difficulties for people as we humans lose the
upper hand over robots.
On the contrary, AI developers try to safeguard the threats posed over AI by
stating that they will never develop general intelligence in Robots and
humans will have sole control over robots.” Worrying about evil AI killer
robots today is a little bit like worrying about overpopulation over planet
mars” (Ng, 2017)Andrew Ng, Computer Scientist, AI developer says that AI
still faces image detection problems, one needed and one not. Thinking
about evil AI robots that will destroy the earth is far away from today's time
and he compares this situation of Evil AI with overpopulation over mars. “AI
software will be in direct competition with a lot of people for jobs” (Ng, 2017).
According to Andrew Ng, more of concern to him is the social impact of AI,
the robots will be in direct competition with humans in many jobs. Therefore
many of them have to change their job occupation. The emphasis is more on
redesigning the education policy this will help us to face the future crisis of
unemployment.
Will America Sustain The Wave of Automation?
SCOPE OF THE STUDY
THE UNITED STATES OF AMERICA- SAMPLE FOR RESEARCH
The reason behind choosing the U.S.A as a sample for my research was that
The US is the supreme leader in the RPA (Robotics Process Automation).
Artificial Intelligence is on a boom in this country for many years which makes
it a perfect sample to study automation replacing human labour.
DISCUSSION
U.S.A boosting Automation industry
Tax Structure favouring Automation Industry: The Tax structure of the
USA has always been biased and in favour of automation. A heavy Tax rate
above 28.5% is implied on companies using labour whereas the tax on
equipment is below 15% after 2005.The tax rate has been very low from 1980
for structure, software and Equipment as compared to the tax rate on human
labour. These tax rates encourage companies to bring automation into use
and neglect human labour. Companies in the USA find it easy to replace
human labour with machines as machines are highly productive, efficient and
also get the tax benefit. The low tax rate on machines has been acting like a
catalyst in transforming the labour-intensive companies into Capital
intensive companies. the effective tax rate on capital invested in equipment
and software has declined to about 5 per cent today, largely as a result of
favourable depreciation provisions in a series of tax laws enacted from 2002
through 2017 under the George W. Bush, Barack Obama, and Donald Trump
administrations” (Daron Acemoglu, 2020). Even the depreciation provision in
a series of tax laws have always encouraged companies to automate their
work which was earlier done by human labour.
“
22 STRIDES - A Students' Journal of Shri Ram College of Commerce, Vol.5, Issue 1 & 2
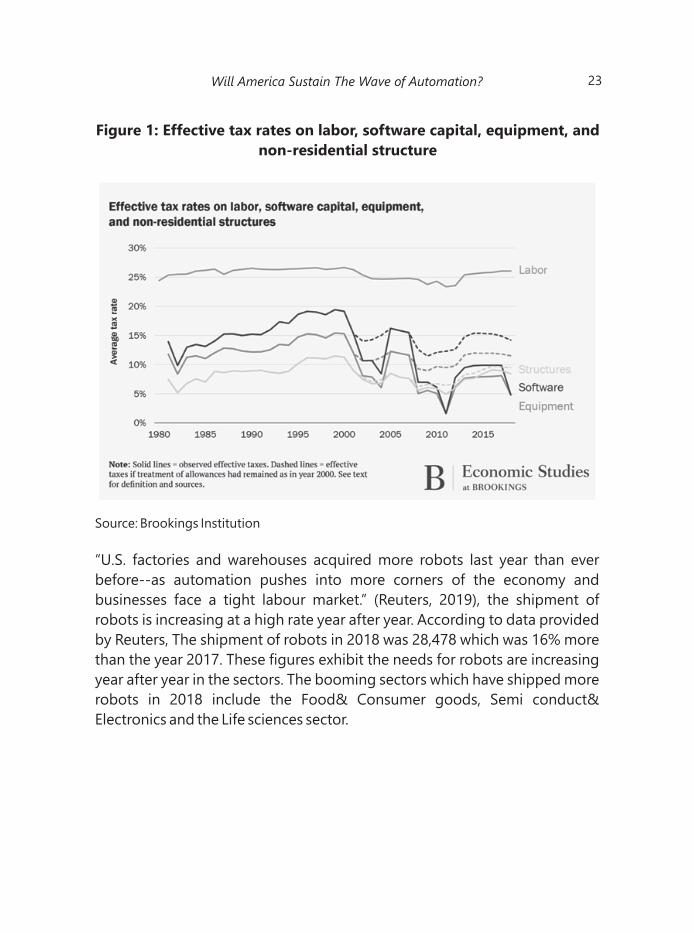
Figure 1: Effective tax rates on labor, software capital, equipment, and
non-residential structure
Source: Brookings Institution
“U.S. factories and warehouses acquired more robots last year than ever
before--as automation pushes into more corners of the economy and
businesses face a tight labour market.” (Reuters, 2019), the shipment of
robots is increasing at a high rate year after year. According to data provided
by Reuters, The shipment of robots in 2018 was 28,478 which was 16% more
than the year 2017. These figures exhibit the needs for robots are increasing
year after year in the sectors. The booming sectors which have shipped more
robots in 2018 include the Food& Consumer goods, Semi conduct&
Electronics and the Life sciences sector.
23Will America Sustain The Wave of Automation?
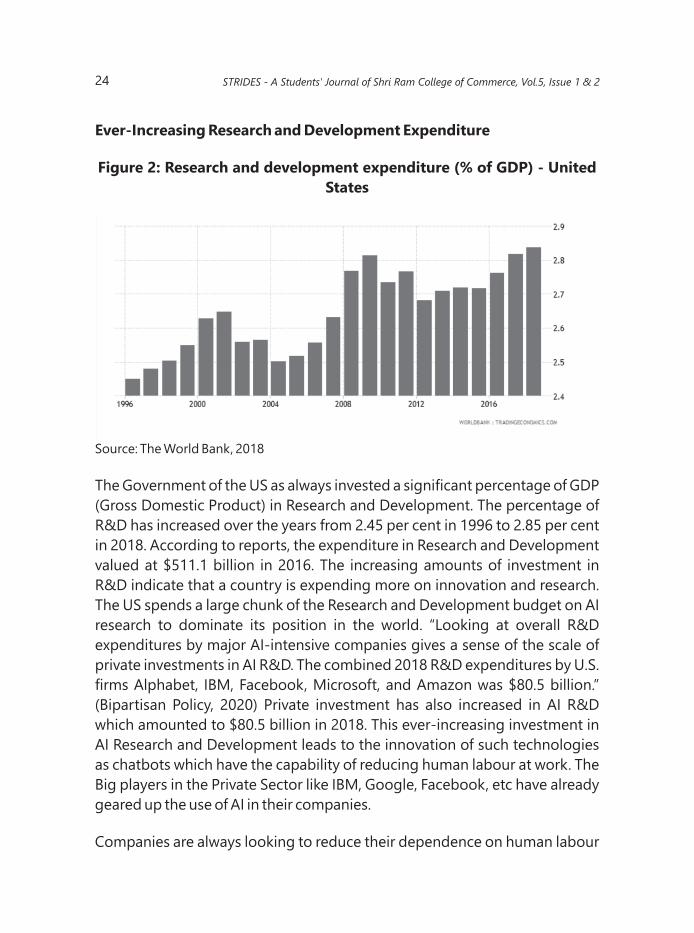
Ever-Increasing Research and Development Expenditure
Figure 2: Research and development expenditure (% of GDP) - United
States
Source: The World Bank, 2018
The Government of the US as always invested a significant percentage of GDP
(Gross Domestic Product) in Research and Development. The percentage of
R&D has increased over the years from 2.45 per cent in 1996 to 2.85 per cent
in 2018. According to reports, the expenditure in Research and Development
valued at $511.1 billion in 2016. The increasing amounts of investment in
R&D indicate that a country is expending more on innovation and research.
The US spends a large chunk of the Research and Development budget on AI
research to dominate its position in the world. “Looking at overall R&D
expenditures by major AI-intensive companies gives a sense of the scale of
private investments in AI R&D. The combined 2018 R&D expenditures by U.S.
firms Alphabet, IBM, Facebook, Microsoft, and Amazon was $80.5 billion.”
(Bipartisan Policy, 2020) Private investment has also increased in AI R&D
which amounted to $80.5 billion in 2018. This ever-increasing investment in
AI Research and Development leads to the innovation of such technologies
as chatbots which have the capability of reducing human labour at work. The
Big players in the Private Sector like IBM, Google, Facebook, etc have already
geared up the use of AI in their companies.
Companies are always looking to reduce their dependence on human labour
24 STRIDES - A Students' Journal of Shri Ram College of Commerce, Vol.5, Issue 1 & 2
for the very simple reason that they want to decrease their expenditure and
increase the speed of work by employing machines at work. Thus this gives us
an alarm that sooner or later humans will get replaced from the work and they
have to look for new occupations.
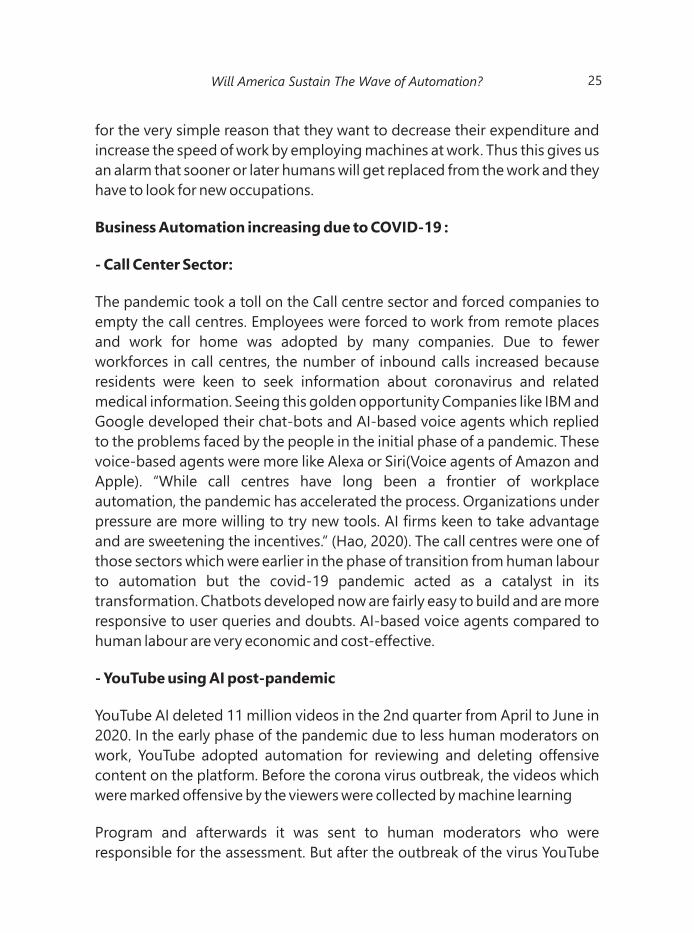
Business Automation increasing due to COVID-19 :
- Call Center Sector:
The pandemic took a toll on the Call centre sector and forced companies to
empty the call centres. Employees were forced to work from remote places
and work for home was adopted by many companies. Due to fewer
workforces in call centres, the number of inbound calls increased because
residents were keen to seek information about coronavirus and related
medical information. Seeing this golden opportunity Companies like IBM and
Google developed their chat-bots and AI-based voice agents which replied
to the problems faced by the people in the initial phase of a pandemic. These
voice-based agents were more like Alexa or Siri(Voice agents of Amazon and
Apple). “While call centres have long been a frontier of workplace
automation, the pandemic has accelerated the process. Organizations under
pressure are more willing to try new tools. AI firms keen to take advantage
and are sweetening the incentives.” (Hao, 2020). The call centres were one of
those sectors which were earlier in the phase of transition from human labour
to automation but the covid-19 pandemic acted as a catalyst in its
transformation. Chatbots developed now are fairly easy to build and are more
responsive to user queries and doubts. AI-based voice agents compared to
human labour are very economic and cost-effective.
- YouTube using AI post-pandemic
YouTube AI deleted 11 million videos in the 2nd quarter from April to June in
2020. In the early phase of the pandemic due to less human moderators on
work, YouTube adopted automation for reviewing and deleting offensive
content on the platform. Before the corona virus outbreak, the videos which
were marked offensive by the viewers were collected by machine learning
Program and afterwards it was sent to human moderators who were
responsible for the assessment. But after the outbreak of the virus YouTube
25Will America Sustain The Wave of Automation?
completely relied on the AI and all the videos got deleted without checking
human moderators. “Just 382,000 videos were flagged for removal by users,
167,000 by individual trusted flaggers, 2,220 by NGOs and 25 by government
agencies. Three-quarters were removed before they got more than 10 views.”
(Reichert, 2020). The volume of removed videos was very high and removed nd
videos in the 2 quarter were double than the videos removed in the 1st
quarter.
YouTube, a multibillion-dollar company, The biggest video sharing platform
which will never compromise on the quality which it provides to its
customers. In the wake of the pandemic, YouTube changed its video
reviewing structure from human moderators to Machine learning algorithm
completely. YouTube officially accepted that its algorithm for reviewing
videos was in some cases inaccurate as compared to human moderators to
delete the flagged video. They entirely relied on an algorithm but they had no
other option left to choose from. This shows that the Machine learning
algorithm which is only designed to collect the reported videos is having the
potential to displace human workers from the company. Thus, AI which will be
developed in future years will come with a wave of job displacement for both
technical and manual jobs.
ANALYSIS
Is the US Education System Enough to Meet the Job Crisis due to
Automation?
Automation has been an integral part of our lives since the age of
industrialization. Every time the automation took place there has been a shift
from one sector to another. The mechanization of agriculture led to the shift
from agriculture to the Manufacturing Sector. Less than 1% of the US
workforce working on farms is the result of mechanization in agriculture
which came in the
19th century. Later automation came into the industrial sector that led to the
shift of the job occupation of the workforce from the industrial sector to the
Service sector. Whenever there has been advancement in automation in
different sectors there has been a difficult phase of transition which leads to
job losses and agitation of people. The change in occupation we will be going
26 STRIDES - A Students' Journal of Shri Ram College of Commerce, Vol.5, Issue 1 & 2

through in the 21st century will depend a lot on the changes that will be
adopted in the education system.
- Highly Automatable Skills, By Education
“The group, an advocacy organization dedicated to bringing together
schools and businesses, argues that American schools have failed to prepare
their charges for the jobs they will need to fill in the future.” (Mahnken, 2017)
The future belongs to automation and Artificial intelligence thus we have the
only choice for us to prepare for it and adapt ourselves to automation
Figure 3: Share of Jobs with Highly Automatable Skills by Education
Source: Executive office of the President of the United States
The graph shows that people working in jobs that require less qualification
are prone to the risk of automation. For instance, Jobs like assembling parts of
automobiles that require no prior education are 44% to be automated in the
coming years. Whereas, Professions like Computer Science engineering
which requires a bachelor degree in the field of Computer science has a
probability of 1% to be automated. Thus, having a bachelor degree in the field
27Will America Sustain The Wave of Automation?

of study still makes you prone to the risk of job loss in the future. One of the
major problems which can be forecasted from this graph is that jobs which
are performed by high school degree owners are prone to 19% automation
which comprises a large chunk of the workforce of the United States. It also
directly demands changes in the high school curriculum. From this study, the
US can conclude that if they want to reduce the risk of job loss in the future
there have to be certain changes brought in the Education system. An
important reason for curriculum change is necessary because a very less
fraction of students can gain a graduate degree in the US. Therefore a very
small part of the above share of jobs gets assured of the risk of job loss. The
changes thus brought will not only help us to reduce the risk of job loss but
also open the gate of certain various new jobs that can be taught in steps
curriculum in upcoming years.
The boom in automation in future will lead to an increase in jobs that require
soft skills like problem-solving which robots cannot easily replicate. Very few
countries are bringing changes in their education system which will help
them to tackle future uncertainties caused by Automation.
- Automation Readiness Index
“The Automation Readiness Index measures countries' preparedness for the
coming wave of intelligent automation The Study included the Countries
which are part of G-20 and five other countries which are representing diverse
parts of the world. The index provides a snapshot across a set of 25 countries
of current government-led efforts to anticipate the resulting changes and
shape the outcomes of technological progress”. The Automation Readiness
Index study is about the difference we would see in the next 20-30 years. It
measures policies that promote technological progress, the creation of new
businesses, the development of skills and policies that can help manage
transitions in the labour market. Policies are grouped in three main
categories: innovation environment, education policies and labour market
policies.” (The Economists, 2018)
1. Innovation Environment: The category of Innovation environment keeps a
check on policies and strategies that countries use to boost research, and the
environment (i.e. infrastructure) required to carry out innovation, and steps to
28 STRIDES - A Students' Journal of Shri Ram College of Commerce, Vol.5, Issue 1 & 2
safely adopt the opportunities of Automation. Looking at the statistics Japan
leads the individual index of Innovation environment due to whooping total
budget allocation for artificial intelligence development in 2017 was
approximately US$817m.
2. Education Policy: The upcoming wave of automation requires humans to
constantly update their skills and education requirements. This category
measures the readiness of the countries in terms of essential changes in
educational policies. The results of this index indicate that South Korea
dominates the index due to changes brought in educational policies like The
implementation of the Character Education Promotion Act 2015 which
emphasizes building soft skill, and also Third Basic Plan for Science and
Technology Talent Development which provides strategies to boost talent in
the field of science and technology in the era of globalization.
3. Labour Market Policies: The automation of works in future will lead to the
displacement of workers engaged in automatable work. This category
measures the readiness of Countries in terms of policies that increase
mobility and flexibility of workers, changes thus implemented will help the
smooth transition of workers from one industry to another. This also includes
the initiatives which inculcate new skills in workers. South Korea is at the top
of this index as it provides subsidies to its jobless workers for vocational
education and training
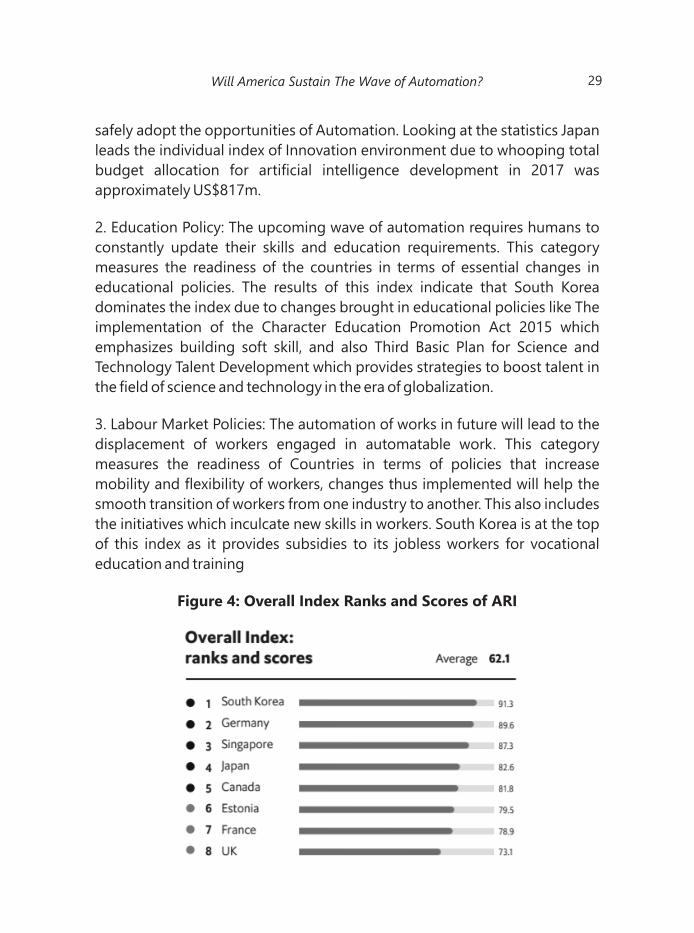
Figure 4: Overall Index Ranks and Scores of ARI
29Will America Sustain The Wave of Automation?

Source: The Economist, 2018
By looking at the index we can say that developed countries or high-income
countries have dominated the index. This means that these countries have
formulated policies that are capable of facing challenges posed by
automation in the coming future. South Korea is the leader of the index and
has been number one in all the three segments of the ARI (Automation
Readiness Index) i.e innovation environment, education policies and labour
market policies.
- Where does the U.S stand in the Education policy category in ARI
(Automation Readiness Index)?
The United States is one of the most technologically advanced countries in th the world is ranked 9 on the ARI Index. One of the critical indicators in the
index is education policy. Countries like South Korea have already started
bringing important changes in their education policy to reduce the
30 STRIDES - A Students' Journal of Shri Ram College of Commerce, Vol.5, Issue 1 & 2
uncertainties that will be caused by Automation in future. At the same time,
the US remained behind when significant changes to education policy were
being brought about.“Very few countries are taking the bull by the horns
when it comes to adapting education systems for the age of automation,”
(The Economists, 2018). The question which arises is how can the US take the
bull by the horns? Or which key changes should be brought in the education
policy to fight the upcoming pandemic that will be caused by automation.
1. Emphasis on Soft skills: Soft skills like communication, critical thinking,
analysis, civic thinking are the skills in which Humans have an upper hand
over Machines. Even in the future, humans who will possess these skills
will not be jobless as these are the key skills that are needed in every field
of study. The US education system is still not providing such skills in its
high school curriculum. A student needs to become a master of both
hard and soft skills in the era of automation to equally stand with
machines.
2. More Creators and Innovators: The existing education system focuses
more on learning the already existing studies and finding jobs in that
domain only. The future demands us to create more innovators and
Creative Artists (Musicians, Painters, etc). New Innovations bring more
jobs. For Instance, Zomato, The food delivery startup has given
employment for both skilled and unskilled labour. A curriculum that
promotes innovation and creative activities should be implemented by
the US to reduce the uncertainties of jobs that will be in future.
3. Lifelong learning: The Government of the US should promote lifelong
learning and should encourage people to update their skills to sustain in
the long run. This lifelong learning can be promoted by a programme
adopted by the Government of South Korea where they provide
subsidies to jobless people to learn vocational training. Such initiatives
can help the people of the US to keep a place in the dynamic labour
market.
CONCLUSION
The time has come for countries to take strict actions against the boom of
automation. The developing countries are also now witnessing the expansion
31Will America Sustain The Wave of Automation?

of automation and are implementing new technologies to increase
productivity. There is a high focus on increasing automation in every field but
very less on preparing the next generation for the unemployment crisis that
will be caused by the wave of automation in the future. The paper is based on
the hypothesis that the many jobs including white collar and blue collar will
be automated and humans will have to search for new jobs and change their
job occupation accordingly. Tracing back the history of automation, the
paper gives an overview of how the transition from one occupation to
another happens when new technology comes into existence. The advantage
we have this time is that we have still some time left for preparation.
The critical analysis of The United States of America on the basis of ARI
(Automation Readiness Index) brings the conclusion that the World Leader is
itself not ready for the wave of automation that is waiting for it in the future in
terms of preparing its workforce. The main loophole is in the educational
policy of the country. If necessary changes like building soft skills (critical
thinking, language skills, civic thinking), curriculum enhancing lifelong
learning are taken into account then the risk of job loss in future can be
reduced to an extent.
In addition, the effect of the Corona Virus pandemic is also brought into
consideration. The pandemic has accelerated the use of automation in
business and gives us a preview of the future. The transition from human
labour to Machinery is not far in many industries. Therefore it's an alarm for
many countries to look upon their educational policies and do the key
changes to sustain their workforce in future.
REFERENCES
Hawking, S. (2017, November 6). Stephen Hawking: AI will 'transform or
destroy' society.
Musk, E. (2018, March 12). Elon Musk Answers Your Questions! | SXSW 2018.
(J. Nolan, Interviewer)
Ng, A. (2017, March 11). Andrew Ng: Why AI is the new electricity. Retrieved
from https://www.gsb.stanford.edu/:
32 STRIDES - A Students' Journal of Shri Ram College of Commerce, Vol.5, Issue 1 & 2
https://www.gsb.stanford.edu/insights/andrew-ng-why-ai-new-electricity
Ng, A. (2017, March 11). Andrew Ng: Why AI is the new electricity. Retrieved
from https://www.gsb.stanford.edu/:
https://www.gsb.stanford.edu/insights/andrew-ng-why-ai-new-electricity
Connif, R. (2011, March). What the Luddites Really Fought Against. Retrieved
from https://www.smithsonianmag.com/:
https://www.smithsonianmag.com/history/what-the-luddites-really-
fought-against-264412/
E.Jones, S. (2006). Against Technology: From the Luddites to Neo-Luddism. In
S. E.Jones, Against Technology: From the Luddites to Neo-Luddism (p. 20). New
York
History. (2015, August 7). Who were the Luddites? Retrieved from
history.com: https://www.history.com/news/who-were-the-luddites
NCR. (2021, January 12). History of ATM Invention. Retrieved from
ncr.com: https://www.ncr.com/blogs/banking/history-atm-innovation
US Bureau of Labour. (2008, May 16). tellers. Retrieved from www.bls.gov:
https://web.archive.org/web/20080516200541/http://www.bls.gov/oco/oc
os126.ht m
ANdrea Manera, D. A. (2020, March 18). Does the US tax code favour
automation? Retrieved from brookings.edu:
https://www.brookings.edu/bpea-articles/does-the-u-s-tax-code-favor-
automation/#:~:text=The %
20U.S.%20tax%20code%20systematically,while%20only%20marginally%20i
mproving%20effi ci ency
Daron Acemoglu, A. M. (2020, March 18). DOES THE US TAX CODE FAVOR
33Will America Sustain The Wave of Automation?
AUTOMATION? Retrieved from brookings.edu:
https://www.brookings.edu/bpea-articles/does-the-u-s-tax-code-favor-
automation/#:~:text=The %
20U.S.%20tax%20code%20systematically,while%20only%20marginally%20i
mproving%20effi ci ency
Bipartisan Policy. (2020, August 6). Cementing American Artificial Intelligence
Leader sh ip : A I Research & Deve lopment . Ret r ieved f rom
https://bipartisanpolicy.org/: https://bipartisanpolicy.org/report/ai-
research-deve lopment/# :~ : tex t=That%20sa id%2C%20loo k i
ng%20at%20overall,and%20Amazon%20was%20%2480.5%20billion.
World Bank. (2018). Research and development expenditure (% of GDP) -
United States. Retrieved from https://data.worldbank.org/:
https://data.worldbank.org/indicator/GB.XPD.RSDV.GD.ZS?end=2018&loca
tions=US&start=1 99 6&view=chart
Reuters. (2019, Feburary 28). U.S. companies put record number of robots to
work in 2018. Retrieved from reuters.com:
https://www.reuters.com/article/us-usa-economy-robots-idUSKCN1QH0K0
Hao, K. (2020, May 24). The pandemic is emptying call centers. AI chatbots are
swooping in. Retrieved from https://www.technologyreview.com/:
https://www.technologyreview.com/2020/05/14/1001716/ai-chatbots-
take-call-center-jobs-duri ng -coronavirus-pandemic/
Reichert, C. (2020, August 25). Youtube automation removes 11 million videos
in 3 months. Retrieved from
https://www.cnet.com/news/youtube-automation-removes-11m-videos-
in-3-months/ 19
Mahnken, K. (2017, October 5). The Age of Automation Demands a New
34 STRIDES - A Students' Journal of Shri Ram College of Commerce, Vol.5, Issue 1 & 2
Amer ican School Sys tem, S tudy Dec lares . Ret r ieved f rom
https://www.the74million.org/:
https://www.the74million.org/article/the-age-of-automation-demands-a-
new-american-school-s ys tem-study-declares/
The Economists. (2018). WHO IS READY FOR THE COMING WAVE OF THE
AUTOMATION.
Rossi, F. (2016). Artificial intelligence: Potential benefits and ethical
considerations. European parliament briefing PE 571.380. Retrieved from:
http://www.europarl.europa.eu/thinktank/en/document.html?reference=IP
OL_BRI(2016)5713 80.
Brynjolfsson, E., & McAfee, A. (2011). Race against the machine: How the
digital revolution is accelerating innovation, driving productivity, and
irreversibly transforming employment. Lexington, MA: Digital Frontier Press
35Will America Sustain The Wave of Automation?


37
Recycling Hoax
Plastics are the best invention of human history.
Plastics are the worst invention of human history.
From cars to airplanes, electronics to medical
equipment, furniture, and food packaging, plastic
permeates every aspect of our lives. Its production
skyrocketed – from just 2.3 million tonnes in 1950
to 162 million tonnes in 1993, which more than
doubled to 448 million tonnes by 2015, and half of
all plastics ever made have been produced since
2005. The sheer volume of plastic has
overwhelmed the waste-management systems
all across the world, they have simply reached
their saturation point. Today, plastic is present on
almost every surface of the planet – from the
deepest abysses to the highest mountains and
remotest islands – causing an unprecedented
crisis for wildlife. It is the durability of plastics that
makes them an industry choice for packaging but
also makes them a nightmare for the planet. They
have become infamous for choking, ensnaring,
and poisoning everything from plankton to
porpoises. A staggering 79% of whatever plastic is
produced in the last 50 years has been directly
thrown into landfills or open landfills. The
question which arises is how did we end up here?
This paper is a comprehensive study about how
the plastics and petrochemicals industry of the
1970s and 1980s knew that the world was
heading into a global waste crisis and remained
Ashish Kumar
B.Com. (Hons.)
SRCC, DU
Abstract
Mentor:
Mr. Soumitra Kumar Choudhary
Associate Professor,
Department of English
SRCC, DU
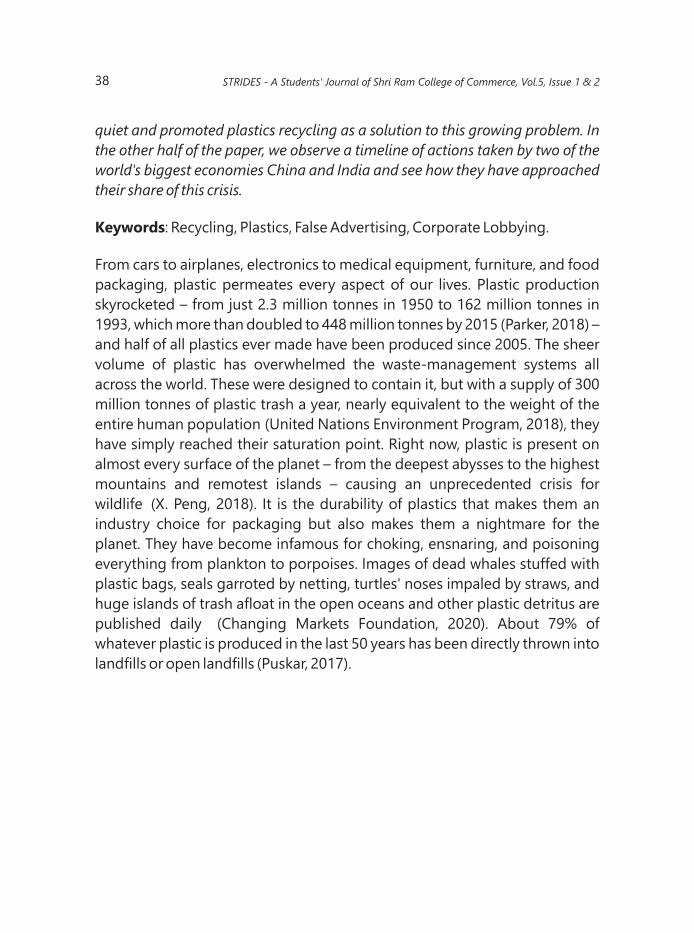
38 STRIDES - A Students' Journal of Shri Ram College of Commerce, Vol.5, Issue 1 & 2
quiet and promoted plastics recycling as a solution to this growing problem. In
the other half of the paper, we observe a timeline of actions taken by two of the
world's biggest economies China and India and see how they have approached
their share of this crisis.
Keywords: Recycling, Plastics, False Advertising, Corporate Lobbying.
From cars to airplanes, electronics to medical equipment, furniture, and food
packaging, plastic permeates every aspect of our lives. Plastic production
skyrocketed – from just 2.3 million tonnes in 1950 to 162 million tonnes in
1993, which more than doubled to 448 million tonnes by 2015 (Parker, 2018) –
and half of all plastics ever made have been produced since 2005. The sheer
volume of plastic has overwhelmed the waste-management systems all
across the world. These were designed to contain it, but with a supply of 300
million tonnes of plastic trash a year, nearly equivalent to the weight of the
entire human population (United Nations Environment Program, 2018), they
have simply reached their saturation point. Right now, plastic is present on
almost every surface of the planet – from the deepest abysses to the highest
mountains and remotest islands – causing an unprecedented crisis for
wildlife (X. Peng, 2018). It is the durability of plastics that makes them an
industry choice for packaging but also makes them a nightmare for the
planet. They have become infamous for choking, ensnaring, and poisoning
everything from plankton to porpoises. Images of dead whales stuffed with
plastic bags, seals garroted by netting, turtles' noses impaled by straws, and
huge islands of trash afloat in the open oceans and other plastic detritus are
published daily (Changing Markets Foundation, 2020). About 79% of
whatever plastic is produced in the last 50 years has been directly thrown into
landfills or open landfills (Puskar, 2017).
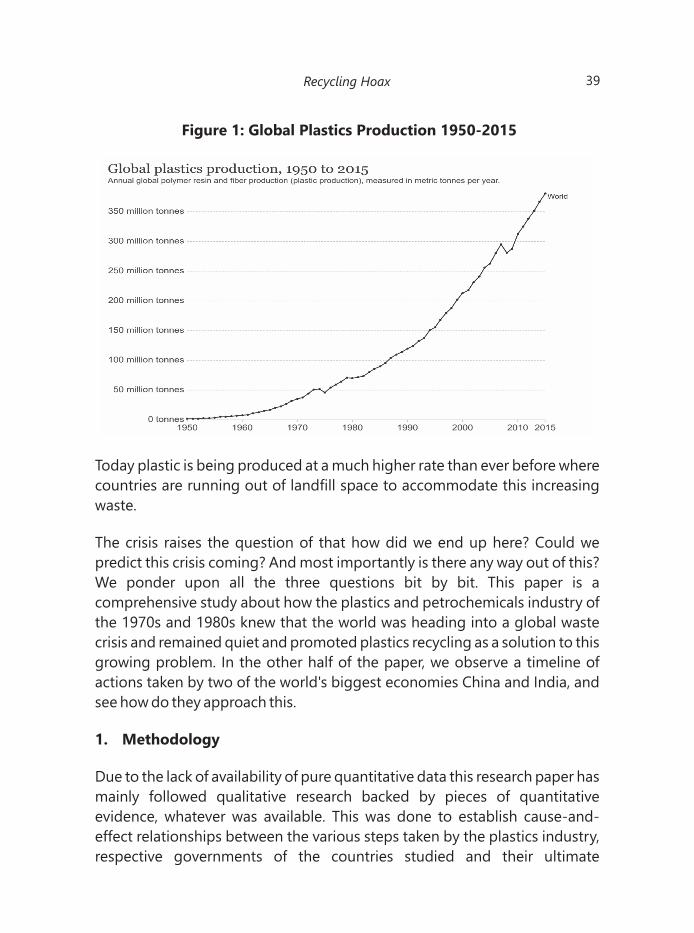
39Recycling Hoax
Today plastic is being produced at a much higher rate than ever before where
countries are running out of landfill space to accommodate this increasing
waste.
The crisis raises the question of that how did we end up here? Could we
predict this crisis coming? And most importantly is there any way out of this?
We ponder upon all the three questions bit by bit. This paper is a
comprehensive study about how the plastics and petrochemicals industry of
the 1970s and 1980s knew that the world was heading into a global waste
crisis and remained quiet and promoted plastics recycling as a solution to this
growing problem. In the other half of the paper, we observe a timeline of
actions taken by two of the world's biggest economies China and India, and
see how do they approach this.
1. Methodology
Due to the lack of availability of pure quantitative data this research paper has
mainly followed qualitative research backed by pieces of quantitative
evidence, whatever was available. This was done to establish cause-and-
effect relationships between the various steps taken by the plastics industry,
respective governments of the countries studied and their ultimate
Figure 1: Global Plastics Production 1950-2015
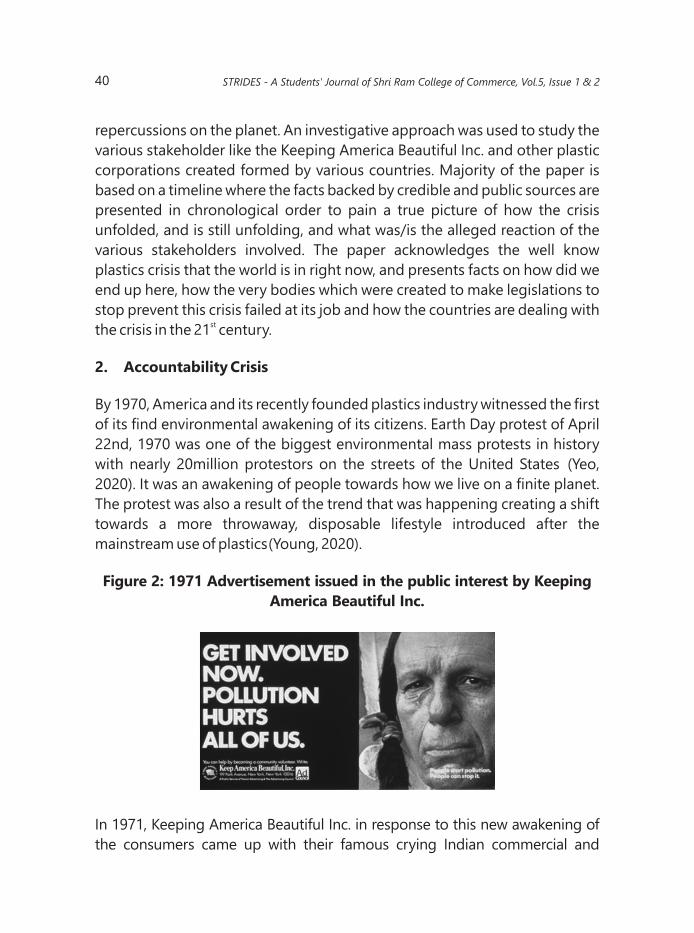
repercussions on the planet. An investigative approach was used to study the
various stakeholder like the Keeping America Beautiful Inc. and other plastic
corporations created formed by various countries. Majority of the paper is
based on a timeline where the facts backed by credible and public sources are
presented in chronological order to pain a true picture of how the crisis
unfolded, and is still unfolding, and what was/is the alleged reaction of the
various stakeholders involved. The paper acknowledges the well know
plastics crisis that the world is in right now, and presents facts on how did we
end up here, how the very bodies which were created to make legislations to
stop prevent this crisis failed at its job and how the countries are dealing with stthe crisis in the 21 century.
2. Accountability Crisis
By 1970, America and its recently founded plastics industry witnessed the first
of its find environmental awakening of its citizens. Earth Day protest of April
22nd, 1970 was one of the biggest environmental mass protests in history
with nearly 20million protestors on the streets of the United States (Yeo,
2020). It was an awakening of people towards how we live on a finite planet.
The protest was also a result of the trend that was happening creating a shift
towards a more throwaway, disposable lifestyle introduced after the
mainstream use of plastics (Young, 2020).
In 1971, Keeping America Beautiful Inc. in response to this new awakening of
the consumers came up with their famous crying Indian commercial and
Figure 2: 1971 Advertisement issued in the public interest by Keeping
America Beautiful Inc.
40 STRIDES - A Students' Journal of Shri Ram College of Commerce, Vol.5, Issue 1 & 2
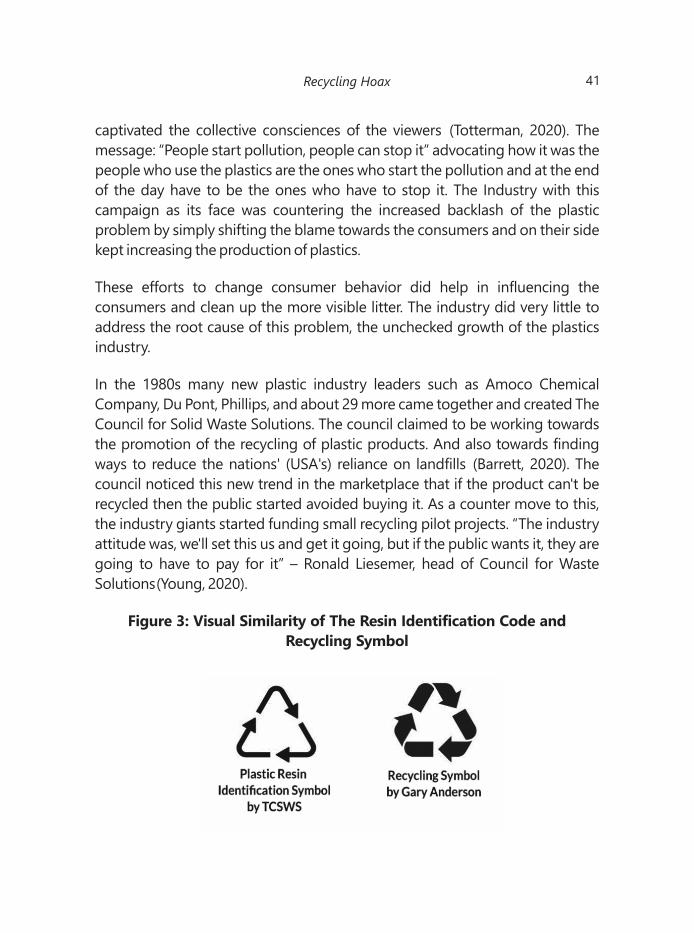
captivated the collective consciences of the viewers (Totterman, 2020). The
message: “People start pollution, people can stop it” advocating how it was the
people who use the plastics are the ones who start the pollution and at the end
of the day have to be the ones who have to stop it. The Industry with this
campaign as its face was countering the increased backlash of the plastic
problem by simply shifting the blame towards the consumers and on their side
kept increasing the production of plastics.
These efforts to change consumer behavior did help in influencing the
consumers and clean up the more visible litter. The industry did very little to
address the root cause of this problem, the unchecked growth of the plastics
industry.
In the 1980s many new plastic industry leaders such as Amoco Chemical
Company, Du Pont, Phillips, and about 29 more came together and created The
Council for Solid Waste Solutions. The council claimed to be working towards
the promotion of the recycling of plastic products. And also towards finding
ways to reduce the nations' (USA's) reliance on landfills (Barrett, 2020). The
council noticed this new trend in the marketplace that if the product can't be
recycled then the public started avoided buying it. As a counter move to this,
the industry giants started funding small recycling pilot projects. “The industry
attitude was, we'll set this us and get it going, but if the public wants it, they are
going to have to pay for it” – Ronald Liesemer, head of Council for Waste
Solutions (Young, 2020).
Figure 3: Visual Similarity of The Resin Identification Code and
Recycling Symbol
41Recycling Hoax
The industry found another way to promote recycling. During that time, the
environmentalists all around the USA were angry as there was no way to
identify the type of resin used in the plastics. To counter this the industry found
a creative way out to this problem and came up with a code to tell them apart.
That code was a numbering system placed within the well-known existing
recycling symbol; the chasing arrows symbol. This symbol was often even
accompanied by texts like “Recyclable” or “100% recyclable”. The symbol would
give a false picture to the consumers that the packaging is recyclable creating
an impression in the general public that the plastic they were buying can be
recycled due to its visual similarity to the recycling symbol. Some even believed
that the plastics they are buying are already made from recycled plastics.
Environmentalists like Coy Smith, Director of the Recycling Program in the city
of San Diego started facing a new problem “Customers would bring it in and
not only say it has the triangle, they would flat-out say “It says it's recyclable
right on it”. And I'd be, like, "I can tell you I can't give this away. There's no one
that would even take it if I paid for them to take it. That's how unrecyclable it
was.” (Young, 2020)
There had always been serious doubts about whether recycling could even
ever work or not on a large scale. Discussions over these were usually just
avoided by the industry. The first serious discussion about the feasibility of
recycling as a solution to the growing crisis by the industry professionals was
done at the Society of Plastics Industry convention in January 1973. Many
leaked documents from this meeting discuss how the industry was aware that
the techniques of cleaning and separating mixed plastics in major kinds of
resins had not been developed for large-scale application. There were
questions that whether recycling could ever be made viable on an economic
basis (Taddonio, 2020). Lewis Freeman, the former Vice President of the
Society of the Plastics Industry in a 2020 PBS Documentary talks about how
the people within the industry were divided, with some being skeptical that
recycling could ever even work while the others were hopeful that they
should start promoting recycling by investing in small pilot projects now
[1980's] and be optimistic that the crisis will resolve over time. Larry Thomas,
the head of the society addresses the executives from Exxon, Chevron,
Amoco, DuPont, and a few more top plastics producers about how "The
image of plastics is deteriorating at an alarming rate," he wrote. "We are
approaching a point of no return." He told the executives they needed to act.
42 STRIDES - A Students' Journal of Shri Ram College of Commerce, Vol.5, Issue 1 & 2
The "viability of the industry and the profitability of your company" are at
stake in one of the leaked documents uncovered by the Public Broadcasting
Service - America (Sullivan, 2020).
By the end of 1974, the plastics industry found itself again in this new crisis
with yet another uprising against plastics and was looking for another
creative way out of this problem. Freeman says "I remember this is one of
those exchanges that sticks with me 35 years later or however long it's been ...
and it was what we need to do is ... advertise our way out of it. That was the
idea thrown out." (Sullivan, 2020). The industry decided to find its way out by
again not addressing the core problem but by simply buying a way out
through misleading advertising. Campaigns with taglines such as “Plastics
make it possible” or simply showcasing all the wonderful things that plastics
brought to us like how you didn't have to care about dropping glass bottles
on the kitchen floor now because now they were made from plastics. To an
extent, there was nothing wrong with these advertisements as they were just
promoting the benefits of plastics. The only alarming trend that could be seen
was that the industry had never really answered the question of the
recyclability of plastics, or how were the plastics were carefully sorted by the
consumers and put into different color bins for 'recycling' being recycled.
In 1995, the American Plastics Council along with Garten Foundation
unveiled an automatic state-of-the-art sorting machine in Oregon, USA, the
first of its kind all over the world. At the time, costing about $1 million in its
erection. “They wanted us to sort plastics when people thought plastics
might be starting to be a problem” Will Posegate, Chief Operations Officer,
Garten Foundation, “Years later, we shut it down because there was no way to
make money at it. And we sold that $1.5 million machine for scrap” (Posegate,
2020).
This unchecked production of plastics with minimum to no efforts towards
recycling coupled with an everlasting trend of pushing the blame on
consumerism rather than holding the capitalists and capitalism within the
industry accountable has covered the world in a layer of trash that now has
simply become too thick to ignore. With a cumulative plastic waste
amounting to more than 7.8 billion tonnes (as of 2015) – more than one tonne
of plastic for every person alive today. With only 19.50% of it ever recorded to
43Recycling Hoax
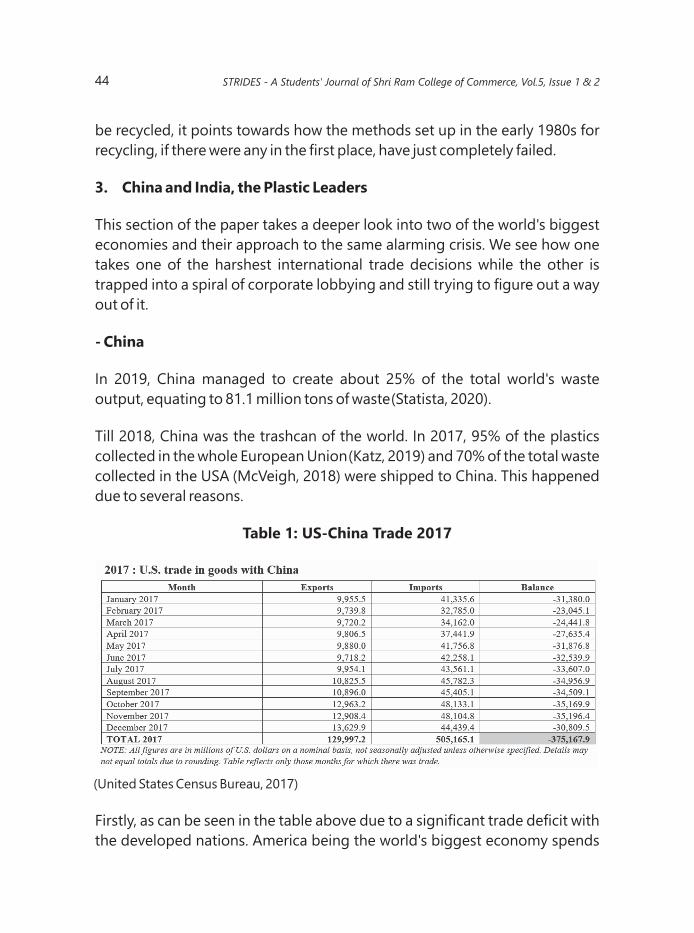
be recycled, it points towards how the methods set up in the early 1980s for
recycling, if there were any in the first place, have just completely failed.
3. China and India, the Plastic Leaders
This section of the paper takes a deeper look into two of the world's biggest
economies and their approach to the same alarming crisis. We see how one
takes one of the harshest international trade decisions while the other is
trapped into a spiral of corporate lobbying and still trying to figure out a way
out of it.
- China
In 2019, China managed to create about 25% of the total world's waste
output, equating to 81.1 million tons of waste (Statista, 2020).
Till 2018, China was the trashcan of the world. In 2017, 95% of the plastics
collected in the whole European Union (Katz, 2019) and 70% of the total waste
collected in the USA (McVeigh, 2018) were shipped to China. This happened
due to several reasons.
(United States Census Bureau, 2017)
Firstly, as can be seen in the table above due to a significant trade deficit with
the developed nations. America being the world's biggest economy spends
Table 1: US-China Trade 2017
44 STRIDES - A Students' Journal of Shri Ram College of Commerce, Vol.5, Issue 1 & 2
much more than any country in the world to fuel its ever-growing demand.
This when put against the second-biggest economy China, also known as the
world's factory (Gifford, 2020) opens up room for a relationship where
countries like America and other western countries buy much more from
China than China ever does from them. This puts a significant strain on the
shipping industries where loaded ships regularly leave from Chinese ports
but have to come back empty. This creates a trade deficit towards China in
countries like the USA (Office of the United States Trade Representative, 2019)
and other European superpowers. So, in such a situation it becomes very easy
for Americans and other Western Countries to ship their waste to China for
next to nothing as compared to what it will cost them to recycle it in their
inhouse facilities.
Another reason why China accepted this unsorted waste was that China has
always needed resources to fuel its industries. With the availability of quite
literally the world's largest labor force standing at around 811.04 million
(Textor, 2021) and with one of the cheapest and most exploited labor. A huge
number of private companies specialized in handling and sorting this
imported waste came up in the last two decades. Anything which could be of
value was scavenged from this trash, brought down to its simplest form by
processes like refining and melting, then just transported to some other
corner of the country where it was in demand. This all was done on a very thin
margin of profit, but there was a profit. Whatever was left of this 'valueless
trash' was just simply dumped around in the oceans and landfills
(Productions, 2020).
For the last couple of decades this system of collecting valueless plastic trash
and shipping it to China, which had cheap labor and especially a good
demand for this trash, seemed to work well.
However, this system came to an end with a two-page notification sent to the th World Trade Organisation's Committee on Technical Barriers to Trade on 18
July 2017 by Chinese state officials. This document simply stated that China,
by the end of 2017 China was effectively banning the import of twenty-four
products enlisted in the notification via their HS Codes (China, 2017). The list
included five notable products that broke the world's recycling these were
“Other Waste, Pairings of Polymers of Ethylene”, “Of Polymers of Styrene,” “Of
45Recycling Hoax
Polymers of Vinyl Chloride,” “Of Polyethylene Glycol Terephthalate,” “, and of
Plastics”. With the ban on these, they effectively banned almost all plastic
imports in the country. As a result, plastic imports in China dropped 99.1%
from 2017 to 2018 (Staub, 2019). This massive global industry came to an end
overnight.
The explanation that the Chinese government gave for this ban was that this
import was proving to be a health hazard. This was true as the healthcare
system in China is owned and run by the state. So, ultimately the cost of
numerous health complications caused by the enormous imports and
constant exposure during activities like sorting and refining, of plastics was
being borne by the state itself. This made the government officials realize that
this expense on healthcare was much more than the thin margin of profits to
which these waste recycling units were contributing. This along with the fact
that the world was shifting its focus to China had now started blaming China
for trash in the ocean and the miserable heal conditions of its citizens due to
its plastics import. The only way out was to ban the imports of plastics, which
China ultimately did. This again connects China to a worldwide pattern of the
modern-day hoax termed recycling. This ultimately proves that recycling
plastics was never a viable option, to begin within the first place. China
realized that processing and sorting plastic trash may be beneficial for a
company but it is not for a country.
This ban was the end of a whole industry in China, but other nearby countries
like Malaysia ever since China banned plastics import tripled its plastics
import between 2017 and 2018 (Reed, 2018). However, Malaysia soon
realized that what they looked upon as an economic opportunity isn't one, to
begin with, and found itself in the same crisis as china. Ultimately Malaysia
following China's footsteps banned the majority of its plastics imports (Lee,
2019).
- India
According to the Central Pollution Control Board (CPCB), 60 major Indian
cities generate 25,940 tons of plastics, of this around 60% is recycled and the
rest, about 9400 tons end us in the environment (Shrivastav, 2019). India's
leading plastic industry body, Plastics India Foundation, has estimated annual
consumption of 16.5 million tons (2017-2018) of plastics amongst which a
46 STRIDES - A Students' Journal of Shri Ram College of Commerce, Vol.5, Issue 1 & 2

staggering 43% or 7 million tons of this is just single-use plastics that have no
recyclability (Banerjee, 2019).
Multi-Layered Packaging (MLP) plays a huge role in the sector. MLP having a
variety of plastics, majorly Polyethylene (PE), Polypropylene (PP),
Polyvinylchloride (PVC), and PET. This complex mixture of plastics makes MLP
cheap and flexible especially for the packaging, thus making MLP the
industry's choice. But the very quality that makes MLP good for the industry
which is its complex structure also makes it bad for the environment. The
complex composition poses a significant challenge in its recycling and
disposal. Another significant issue with the use of MLP in the Indian markets
has been that due to its economic and easy to mass-produce characteristics,
the industry has been pushing them into the markets for several decades now
(Changing Markets Foundation, 2020). This has been done to a point where
the earlier much more environmentally friendly reuse and refill systems have
been completely dismantled and abolished from the Indian markets.
Confused Lawmakers and Legislations
The industry giants not only use some rather unconventional methods to
exercise their influence on the lawmakers and the law-making process itself
but they also seem to use the well-established tactics to distract, delay and
derail unfavorable legislation of the plastics industries in the west.
India's first legal action against the plastic problem was implemented in the
form of The Plastics Manufacture, Sale and Usage Rules, 1999 by the Ministry nd
of Environment and Forests on 2 September 1999. This legislation aimed to
restrict the growing use of plastic bags and preventing the packing of food in
recycled plastics. This was done by limiting the thickness of plastic bags to 20
microns or less (Ministry of Environment and Forests, 1999).
In 2003, the legislature passed in 1999 was amended, and the restriction on
the size and thickness of the plastic bags was scraped off effectively
promoting the use of plastic bags and now the bags could be thicker thus be
more widely used in the markets (Ministry of Environment and Forests, 2003).
With the plastics crisis moving beyond control, the government decided to
47Recycling Hoax

take its most ambitious legislation yet aiming at regulating and effectively
eliminating the use of multi-layered plastics packaging. This legislation first
made its appearance in the first draft of the Plastics (Manufacture, Usage and
Waste Management) Rules of 2009. (Ministry of Environment and Forests ,
2009).
However, when the final draft of the aforementioned law was brought under
the expert committee review in 2011, the clause which restricted multi-
layered plastics in the markets was deleted from the draft and the final law
(Ministry of Environment and Forests , 2009). This was done following the
representation from the Federation of Indian Chambers of Commerce and
Industry (FICCI) and the Indian Institute of Packaging (IIP).
The Indian Institute of Packaging though being an autonomous body under
the Ministry of Commerce and Industry is still not free from corporate
lobbying as it gives out membership to private companies within the country
after paying a membership fee. In 2010, its member's list comprised of big
FMCG manufacturers such as Hindustan Unilever Ltd., Marico Industries,
Saap Packaging Pvt Ltd., and many more. (Indian Institute of Packaging, 2010)
In 2016, the government introduced its next version of laws to continue its
“battle” against the rising plastic crisis in the country. The Plastic Waste
Management (PWM) Rules, 2016 were introduced as a replacement of the
existing Plastic Waste (Management & Handling) Rules, 2011. The main focus
of this new legislature was its emphasis on identifying the responsibility and
accountability of the manufactures. This was accompanied by an ambitious
deadline to phase out all multi-layered packaging from the market by 2018.
The main phrase of the law being clause 9(3) which stated; “manufacture and
use of non-recyclable multi-layered plastic if any should be phased out in two
years”. (Ministry of Environment, Forest and Climate Change, 2016)
However, the pattern of opposing the legislation as done with the previous
iterations of the same law continued. This time, due to the intense and
effective lobbying by the bodies such as the All India Plastic Manufacturers
Association (AIPMA) and the PET Packaging Association for Clean
Environment (PACE), the Plastic Waste Management (Amendment) Rules,
2018 were brought into effect. This amendment effectively changed clause
48 STRIDES - A Students' Journal of Shri Ram College of Commerce, Vol.5, Issue 1 & 2
9(3) to “non-recyclable multi-layered plastic if any' with 'multi-layered plastic
which is non-recyclable or non-energy recoverable or with no alternate use”
rendering the previously passed legislation to stop the use of MLP
incompetent in doing so.
Another key feature of the PWM Rules of 2016 was that it empowered the
state governments and the local bodies that now they could initiate a ban on
plastics in their respective boundaries. Since then, several states have passed
a partial or complete ban on plastics. Amongst these states the state of
Maharashtra passed one of the most comprehensive bans on plastic items,
banning items like PET bottles of less than 200ml capacity, plastic bags, and
also initiated a buyback culture as an extended producer responsibility (EPR)
for thermocol used for wrapping (Departement of Environment Govt. of
Maharashtra, 2019).
th In March 2019, at the 4 session of the UN Environment Assembly in Nairobi,
Indian again initiated an ambitious resolution to phase out single-use plastics
from the environment by 2025, and a ban on single-use plastics by 2022
(Ministry of Environment, Forest and Climate Change, 2019). Both these
announcements were diluted due to economic and political complications
(Koshy, 2019).
The key takeaway from this long chain of efforts to ban MLP by the
government and then constant amendments made to these laws by the
autonomous bodies which are directly influenced by the main stakeholders
that are the plastic producers of the country, is that at this point an average
consumer may even start to question the lawmakers itself. That whether
these laws were actually ever created to fight the plastics crisis in the first
place or these were just created to win the confidence of the more
environmentally woke general public in the short term before being
amended and bringing back everything to what it was before these
environmental laws.
CONCLUSION
The paper concludes by proving the topic statement highlighted in the
introduction which is to show that plastic recycling was never a viable
49Recycling Hoax
solution to the plastic crisis. Evidence as to how plastics recycling can never
work can be seen throughout this paper whether it is the leaked documents,
miss-directed marketing, or lack of confidence in the leaders of the very
corporations created to control the plastics pollution. We see the approaches
of two of the biggest economies of the world towards this crisis, discovering
how one country found itself in a position where the cost of this waste
becomes more than the profit of recycling it, while the other one still seems to
be lost in methods to fight this crisis.
We find out how the whole plastics industry saw this crisis coming decades
ago but still choose the direction of the capitalists and not the
environmentalists and thus putting the production of this very poison that is
killing our planet today, upfront.
The timelines presented in the paper prove how the crisis didn't happen
overnight rather had almost half a century in its making and becoming one of
the most alarming global crises.
Maybe far far ahead in the future after our civilization has collapsed, and
maybe one after it has collapsed too and some then interstellar
archaeologists dig up the earth and just find this layer of microplastics
covering the whole planet. Chocking the literal life out of it and just
wondering in awe that was it the attack of some other sentient being or is it
just that it was our civilization that has brought us to our doom. Today plastics
are a growing global crisis and the world needs to find a way out of it before
we find ourselves covered in it.
REFERENCES
Banerjee, A. (2019, April 02). India Is Generating Much More Plastic Waste
Than I t Repor ts . Here's Why . Retr ieved from IndiaSpend:
https://www.indiaspend.com/india-is-generating-much-more-plastic-
w a s t e - t h a n - i t - r e p o r t s - h e r e s -
why/#:~:text=There%20are%20two%20main%20reasons,only%20about%2
04%20million%20tonnes.
Barrett, A. (2020, July 9). Another Skeleton in the Recycling Closet. Retrieved
from Bioplastics News: https://bioplasticsnews.com/2020/07/09/council-
50 STRIDES - A Students' Journal of Shri Ram College of Commerce, Vol.5, Issue 1 & 2
s o l i d - w a s t e - s o l u t i o n s / # : ~ : t e x t = T h e % 2 0 C o u n c i l % 2 0
for%20Solid%20Waste%20Solutions%2C%20was%20a%20Washington%20
D.C.,was%20sponsored%20by%20plastics%20manufacturers.&text=Some
%20people%20claims%20that%20in,The%20g
Changing Markets Foundation. (2020). Talking Trash India. Netherlands.
China. (2017, July 18). Retrieved from Wrold Trade Organisation :
https://docs.wto.org/dol2fe/Pages/SS/directdoc.aspx?filename=q:/G/TBTN
17/CHN1211.pdf&Open=True
Departement of Environment Govt. of Maharashtra. (2019, September 23).
Guidebook for Plastic and Thermocol Ban. Retrieved from Sujal Swachh
Sangraha: https://sujal-swachhsangraha.gov.in/node/3035
Gifford, C. (2020, Spetember 21). Top 5 countries to be world's next
m a n u f a c t u r i n g h u b s . R e t r i e v e d f r o m W o r l d F i n a n c e :
https://www.worldfinance.com/home/top-5/top-5-countries-poised-to-
b e c o m e - t h e - w o r l d s - n e x t - m a n u f a c t u r i n g -
hub#:~:text=There's%20a%20reason%20China%20has,global%20manufact
uring%20output%20in%202018.&text=But%20the%20US%2DChina%20tra
de,re%2Dexamine%20global%20
Indian Institute of Packaging. (2010). Yumpu. Retrieved from INDEX
GOVERNING BODY MEMBERS - Indian Institute of Packaging:
https://www.yumpu.com/en/document/read/22574359/index-governing-
body-members-indian-institute-of-packaging
Katz, C. (2019, March 7). Piling Up: How China's Ban on Importing Waste Has
Stalled Global Recycling. Retrieved from Yale Environment 360:
https://e360.yale.edu/features/piling-up-how-chinas-ban-on-importing-
waste-has-stalled-global-recycling
Koshy, J. (2019, March 16). U.N. meet dilutes Indian plan to phase out single-
use plastic. The Hindu.
Lee, Y. N. (2019, January 25). Malaysia, following in China's footsteps, bans
i m p o r t s o f p l a s t i c w a s t e . R e t r i e v e d f r o m C N B C :
51Recycling Hoax
https://www.cnbc.com/2019/01/25/climate-change-malaysia-following-
china-bans-plastic-waste-imports.html#:~:text=Malaysia%2C%20
following%20in%20China's%20footsteps%2C%20bans%20imports%20of%
20plastic%20waste&text=Malaysia%20announced%20in%20October%20it'
s,t
McVeigh, K. (2018, October 5). Huge rise in US plastic waste shipments to poor
countries following China ban. Retrieved from The Guardian :
https://www.theguardian.com/global-development/2018/oct/05/huge-
rise-us-plastic-waste-shipments-to-poor-countries-china-ban-thailand-
malaysia-vietnam
Ministry of Environment and Forests . (2009). The Plastics (Manufacture,
Usage and Waste Management) Rules, 2009 - draft . Retrieved from India
Environment Por tal : http://www.indiaenvironmentpor tal .org.
in/files/Plastics%20(Manufacture,%20Usage%20and%20Waste).pdf
Ministry of Environment and Forests. (1999, September 2). The Plastics
Manufature, Sale and Usage Rules, 1999. Retrieved from Punjab Pollution
C o n t r o l B o a r d : h t t p : / / w w w . p p c b . g o v . i n / A t t a c h m e n t s /
Plastic%20Waste/2nd.pdf
Ministry of Environment and Forests. (2003, June 17). Gazette of India
Extrarodinary Part II, Section 3, Sub-section (ii) Published by Authority No. 540.
Re t r i e v e d f r o m M a h a r a s h t r a Po l l u t i o n C o n t r o l B o a r d :
h t t p s : / / w w w . m p c b . g o v . i n / s i t e s / d e f a u l t / f i l e s / p l a s t i c -
waste/rules/Amendrule2003.pdf
Ministry of Environment, Forest and Climate Change. (2016, March 18).
Plastic Waste Management Rules, 2016. Retrieved from Madhya Pradesh
Pollution Control Board: http://www.mppcb.nic.in/proc/Plastic%20
Waste%20Management%20Rules,%202016%20English.pdf
Ministry of Environment, Forest and Climate Change. (2019, March 16). India
pilots resolutions on Single-use Plastics... Retrieved from Press Information
Bureau: https://pib.gov.in/PressReleasePage.aspx?PRID=1568929
Office of the United States Trade Representative. (2019). The People's Republic
52 STRIDES - A Students' Journal of Shri Ram College of Commerce, Vol.5, Issue 1 & 2

of China. Retrieved from Office of the United States Trade Representative:
https://ustr.gov/countries-regions/china-mongolia-taiwan/peoples-
repub l i c -ch ina# :~ : tex t=U .S .%20goods%20and%20ser v i ces%
20trade,was%20%24308.8%20billion%20in%202019.
Parker, L. (2018, June). WE MADE PLASTIC. WE DEPEND ON IT. NOW WE'RE
DROWNING IN IT . Retr ieved from National Geographic :
https://www.nationalgeographic.com/magazine/2018/06/plastic-planet-
waste-pollution-trash-crisis/
Posegate, W. (2020, April 1). Plastic Wars. (L. Sullivan, Interviewer)
Productions, W. (Director). (2020). How China Broke the World's Recycling
[Motion Picture]. Retrieved from https://www.youtube.com/watch?v=
KXRtNwUju5g&t=6s
Puskar. (2017). How Plastic is Entering into our Food Chain. Retrieved from
Green Clean Guide: https://greencleanguide.com/how-plastic-is-entering-
into-our-food-chain/
Reed, L. H. (2018, October 25). Why the world's recycling system stopped
working. Retrieved from Financial Times: https://www.ft.com/content/
360e2524-d71a-11e8-a854-33d6f82e62f8
Shrivastav, R. (2019, October 02). India's plastic waste situation wasn't created
today. Retrieved from DownToEarth: https://www.downtoearth.org.in/blog/
waste/india-s-plastic-waste-situation-wasn-t-created-today-67061
Statista. (2020, October). Amount of disposed garbage in China from 1990 to
2 0 1 9 . R e t r i e v e d f r o m S t a t i s t a :
https://www.statista.com/statistics/279117/amount-of-disposed-garbage-
i n - c h i n a / # : ~ : t e x t = A m o u n t % 2 0 o f % 2 0 d i s p o s e d % 2 0 w a s t e %
20in%20China%201990%2D2019&text=In%20the%20last%20decades%2C
%20the,million%20tons%20as%20of%202019.
Staub, C. (2019, January 29). China: Plastic imports down 99 percent, paper
down a third. Retrieved from Resource Recycling : https://resource-
recycling.com/recycling/2019/01/29/china-plastic-imports-down-99-
53Recycling Hoax
percent-paper-down-a-third/
Sullivan, L. (2020, September 11). How Big Oil Misled The Public Into Believing
P l a s t i c W o u l d B e R e c y c l e d . R e t r i e v e d f r o m N P R :
https://www.npr.org/2020/09/11/897692090/how-big-oil-misled-the-
public-into-believing-plastic-would-be-recycled
Taddonio, P. (2020, March 31). Plastics Industry Insiders Reveal the Truth About
R e c y c l i n g . R e t r i e v e d f r o m F R O N T L I N E :
https://www.pbs.org/wgbh/frontline/article/plastics-industry-insiders-
reveal-the-truth-about-recycling/
Textor, C. (2021, January 6). Labor force in China from 2009 to 2019. Retrieved
from Statista: https://www.statista.com/statistics/282134/china-labor-
force/#:~:text=In%202019%2C%20China's%20labor%20force,the%20labor
%20force%20is%20foreseeable.
Totterman, A. (2020, Spetember 18). The disturbing truth about plastic
r e c y c l i n g . R e t r i e v e d f r o m C N N O p i n i o n :
https://edition.cnn.com/2020/09/18/opinions/the-disturbing-truth-about-
plastic-recycling-totterman/index.html
United Nations Environment Program. (2018). Beat Plastic Pollution.
Re t r i e ve d f ro m U n i te d N a t i o n s E n v i ro n m e n t P ro g r a m e :
https://www.unep.org/interactive/beat-plastic-pollution/
United States Census Bureau. (2017). Trade in Goods with China. Retrieved
from United States Census Bureau: https://www.census.gov/foreign-
trade/balance/c5700.html
X. Peng, M. C. (2018, November 27). Microplastics contaminate the deepest
part of the world's ocean. Microplastics contaminate the deepest part of the
world's ocean. Geochemicals Perspective Letters.
Yeo, S. (2020, April 22). How the largest environmental movement in history
w a s b o r n . R e t r i e v e d f r o m B B C F u t u r e :
https://www.bbc.com/future/article/20200420-earth-day-2020-how-an-
e n v i r o n m e n t a l - m o v e m e n t - w a s -
54 STRIDES - A Students' Journal of Shri Ram College of Commerce, Vol.5, Issue 1 & 2

born#:~:text=It%20is%20the%20largest%20environmental%20movement
%20in%20history.&text=On%2022%20April%201970%2C%2020,the%20Ea
rth%20taken%20by%20astronauts.
Young, R. (Director). (2020). Plastic Wars | FRONTLINE [Motion Picture].
55Recycling Hoax


57
The Role of
Corporate Social
Responsibility
towards Sustainable
Education with
reference to the
FMCG companies
The economic success of developing countries like
India is directly proportional to the quality of
education. Since Independence, India has
improved a lot in the education sector but there is
still a need for greater accountability and
transparency with the increased role of schools
and colleges to foster the development of
children. FMCG companies have become an
integral part of our lifestyle as they have a great
propulsion on the lifestyle of Indian citizens. This
paper is to provide an overview on ingenuity and
activities undertaken by FMCG Companies in the
education sector. The data has been extracted
from the annual reports and CSR policies of
various FMCG companies. The study reveals that
though education has been the sector of focus of
CSR policy of many FMCG companies, there is still
Nikunj Singhal
B.Com. (Hons.)
SRCC, DU
Aastha Garg
B.Com. (Hons.)
SRCC, DU
Mentor:
Ms. Ruchika Choudhary
Assistant Professor
Department of Commerce
SRCC, DU
ABSTRACT

58 STRIDES - A Students' Journal of Shri Ram College of Commerce, Vol.5, Issue 1 & 2
a need for more active actions to achieve the goal of 'Education for all'. Some
companies are yet to see CSR as social responsibility rather than legal
obligation.
Keywords: CSR, EDUCATION, FMCG, ITC, HUL, P&G, DABUR, NIRMA,
MARICO
INTRODUCTION
Since the beginning of the 21st century, Corporate Social Responsibility (CSR)
has become a matter of concern for the leading companies. Now, it is not only
about earning higher profits and sustaining market share; it's also about how
to achieve social and sustainable growth through CSR initiatives. Since the
business houses are an integral part of society, the government believes that
the former also owe something in return to the latter, resources of which
they're consuming.
The term Corporate Social Responsibility may be new to India but this term
dates back to the Mauryan Empire where many dialecticians like Kautilya and
Chanakya emphasised on the need of creating shared values and set the
business responsibility for business working in the empire. The Indian
scriptures also highlight the importance of CSR and mentioned the need of
sharing the earnings with the deprived section of the society. CSR has been
deeply imbibed in the history of India and always has been a focal point of our
rich culture and heritage.
CSR policies are advantageous and important for the company and the
society. It helps the company in building brand image and achieving high
growth along with fulfilling the needs of the customers and the society. Many
companies believe that CSR is the most important part of their brand image
and customers tend to get influenced towards those companies which work
ethically. They feel emotionally attached to the company as it never fails to
take care of the difficulties and needs of the former.
“I believe that with great wealth comes great responsibility, a responsibility to
give back to society and a responsibility to see that those resources are put to
work in the best possible way to help those most in need.” says Bill Gates, the
founder of Microsoft Corporation.
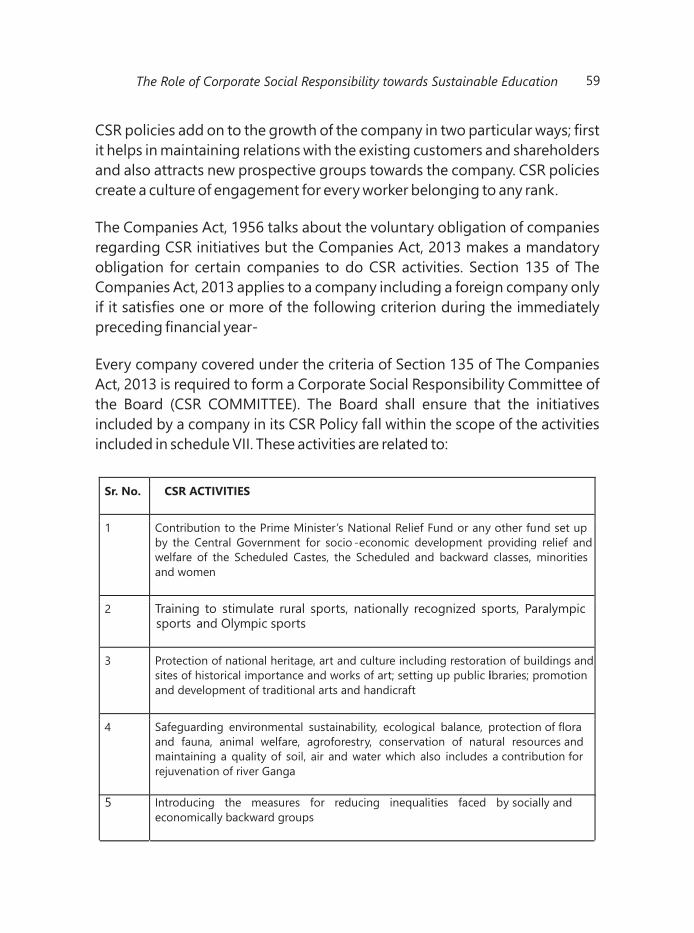
59The Role of Corporate Social Responsibility towards Sustainable Education
CSR policies add on to the growth of the company in two particular ways; first
it helps in maintaining relations with the existing customers and shareholders
and also attracts new prospective groups towards the company. CSR policies
create a culture of engagement for every worker belonging to any rank.
The Companies Act, 1956 talks about the voluntary obligation of companies
regarding CSR initiatives but the Companies Act, 2013 makes a mandatory
obligation for certain companies to do CSR activities. Section 135 of The
Companies Act, 2013 applies to a company including a foreign company only
if it satisfies one or more of the following criterion during the immediately
preceding financial year-
Every company covered under the criteria of Section 135 of The Companies
Act, 2013 is required to form a Corporate Social Responsibility Committee of
the Board (CSR COMMITTEE). The Board shall ensure that the initiatives
included by a company in its CSR Policy fall within the scope of the activities
included in schedule VII. These activities are related to:
Sr. No. CSR ACTIVITIES
1 Contribution to the Prime Minister’s National Relief Fund or any other fund set up
by the Central Government for socio -economic development providing relief and
welfare of the Scheduled Castes, the Scheduled and backward classes, minorities
and women
2 Training to stimulate rural sports, nationally recognized sports, Paralymp ic sports and Olympic sports
3 Protection of national heritage, art and culture including restoration of buildings and
sites of historical importance and works of art; setting up public libraries; promotion
and development of traditional arts and handicraft
4 Safeguarding environmental sustainability, ecological balance, protection of flor a
and fauna, animal welfare, agroforestry, conservation of natural resources and
maintaining a quality of soil, air and water which also includes a contribution f or
rejuvenation of river Ganga
5 Introducing the measures for reducing inequalities faced by socially and
economically backward groups
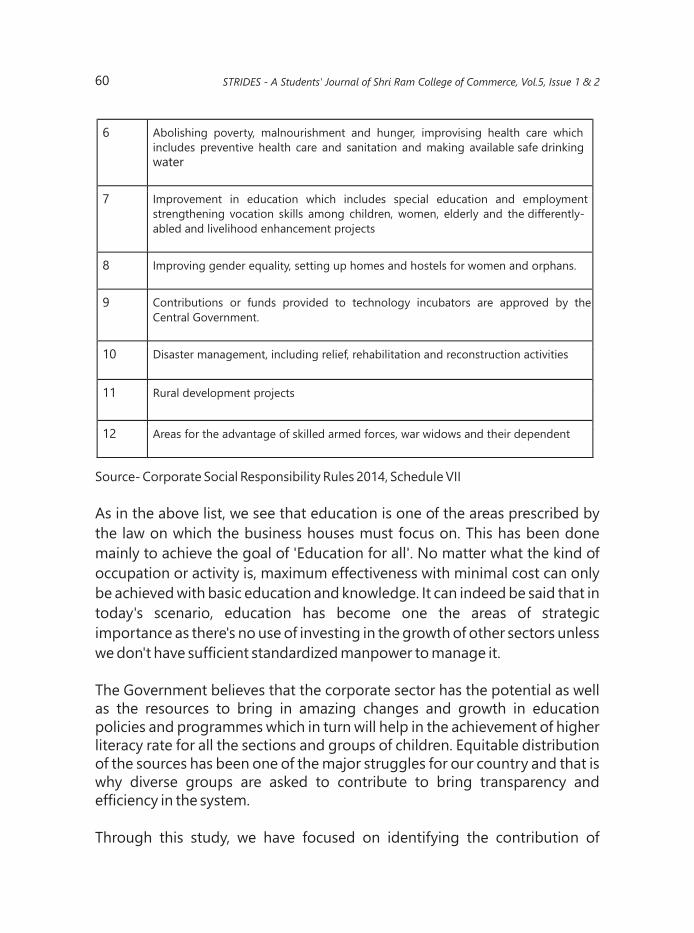
60
Source- Corporate Social Responsibility Rules 2014, Schedule VII
As in the above list, we see that education is one of the areas prescribed by
the law on which the business houses must focus on. This has been done
mainly to achieve the goal of 'Education for all'. No matter what the kind of
occupation or activity is, maximum effectiveness with minimal cost can only
be achieved with basic education and knowledge. It can indeed be said that in
today's scenario, education has become one the areas of strategic
importance as there's no use of investing in the growth of other sectors unless
we don't have sufficient standardized manpower to manage it.
The Government believes that the corporate sector has the potential as well as the resources to bring in amazing changes and growth in education policies and programmes which in turn will help in the achievement of higher literacy rate for all the sections and groups of children. Equitable distribution of the sources has been one of the major struggles for our country and that is why diverse groups are asked to contribute to bring transparency and efficiency in the system.
Through this study, we have focused on identifying the contribution of
6 Abolishing poverty, malnourishment and hunger, improvising health care which
includes preventive health care and sanitation and making available safe drinkin g
water
7 Improvement in education which includes special education and employment
strengthening vocation skills among children, women, elderly and the differently-
abled and livelihood enhancement projects
8 Improving gender equality, setting up homes and hostels for women and orphans.
9 Contributions or funds provided to technology incubators are approved by the
Central Government.
10 Disaster management, including relief, rehabilitation and reconstruction activities
11 Rural development projects
12 Areas for the advantage of skilled armed forces, war widows and their dependent
STRIDES - A Students' Journal of Shri Ram College of Commerce, Vol.5, Issue 1 & 2

61
leading FMCG companies in the education sector under their CSR policy. We aim to examine whether the crucial yet poor state of the education sector in our country has managed to attract the attention of big business houses or not. Here, we have analysed the CSR contributions of some of the leading companies of the FMCG sector to conduct our study and derive our conclusion.
LITERATURE REVIEW
CSR has always been a philanthropic activity by companies but with the implementation of Companies Act 2013, the motto behind CSR has been shifted towards community building. The study of Anupam & Ravi (2012) and S Vijay Kumar (2017) also examined the importance of CSR spending by different Auto Industry and FMCG sectors in context to education, healthcare and environment. The study found that CSR by IT and Auto industry is more focusing on above-mentioned parameters while the FMCG sector has not yet focused too much into social responsibility initiatives.
CSR strengthens a company's relationship with its stakeholders by integrating CSR activities in its day to day operations and creates a brand value for its product. An overview of research study by C Vethirajan & C Ramu (2019) was also aimed at scrutinizing the impact of CSR activities by FMCG companies based on the perception of consumers of the FMCG Companies. The analysis revealed that the consumer's perception is based on their social, economic & demographic factors; hence there is inconsistency on the perceived impact of CSR by FMCG companies.
Many companies are actively participating in the CSR by earmarking a certain percentage of their annual profits for CSR activities. The paper by Loknath Mishra (2020) tries to examine the relationship between CSR and sustainable development goals (SDG's) and also tries to review the implementation of CSR by Indian Companies since its implementation in the year 2013 by Indian Companies Act 2013. The study shows that the contribution of Indian Companies is generally concentrated on Health, Education and other sectors while every meager amount is diverted towards environment and other SDGs goals. It also reveals that states with larger industry concentration get the highest CSR spending as compared to the states with less concentration of industries. In a research conducted by Vineet Singh (2016) also provides an overview about the CSR spending of the FMCG Sector and their impact on the society by analysing more than 5 FMCG Companies. The study provides that
The Role of Corporate Social Responsibility towards Sustainable Education

62
though many FMCG companies have increased their spending on CSR, it is mainly focusing on women empowerment and clean environment and playing a very important role in social welfare.
CSR has changed the dimensions between state, company and society by companies being in the forefront for community development. The research by Parvat R Patel (2020) and Abilasha. N & Madhu Tyagi (2019) and talks about the changing pattern of CSR expenditure and working on a goal to achieve sustainable education through a successful partnership with NGOs, communities and government and making it a more realisable goal. Corporations are integrating CSR initiatives in their business processes in order to make it more accountable and transparent.
Though there are legal reservations regarding CSR activities, many companies contravene and falsely escalate their CSR expenditure. The study conducted by Ramanna & Narayana Reddy (2017) discussed the lack of CSR expenditure by different companies in proportion to their phenomenal growth in their businesses. Still many companies consider CSR as their legal obligation and do not consider it as their social obligation, thus CSR has a long way to progress.
CSR has evolved as a ubiquitous topic in the 21st century as many corporations are exploiting society for their business. In all the research papers stated, one thing in common is that CSR has become a foundation stone for a company's sustainable growth. Through this study, we have focused on CSR initiatives in the education sector by FMCG companies as education is one of the key pillars for a country's growth and tried to analyse the FMCG companies' nudging behaviour for achieving the goal of “Education for All".
RESEARCH OBJECTIVES
Ÿ To examine the level, nature and activeness of the various initiatives taken
by the leading FMCG companies for the Education sector under the
Corporate Social Responsibility policy.
Ÿ To identify whether the growing yet struggling education sector is
receiving the much required attention from the business houses or not.
STRIDES - A Students' Journal of Shri Ram College of Commerce, Vol.5, Issue 1 & 2
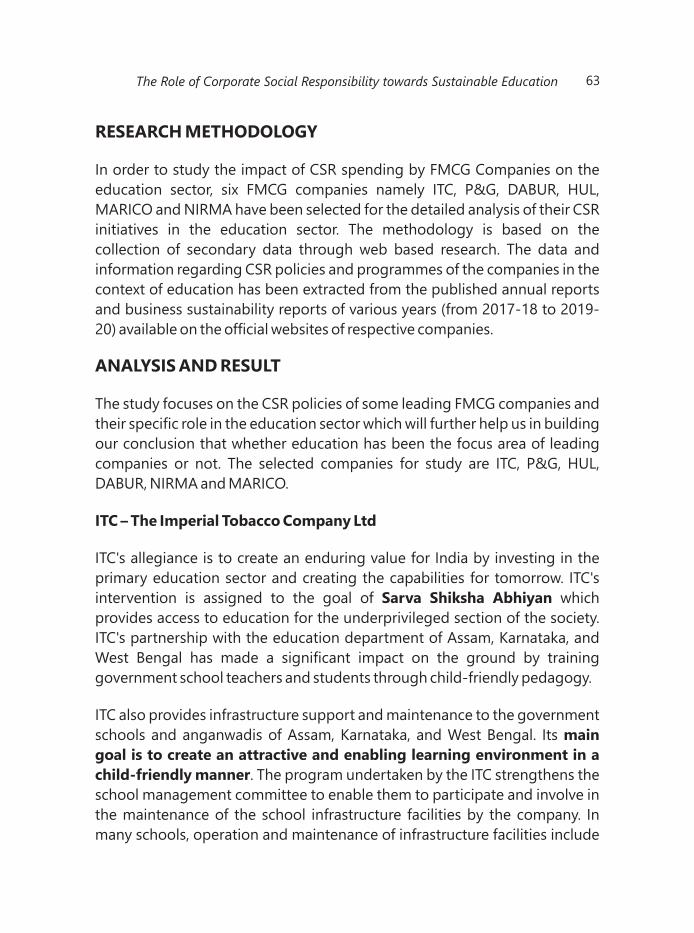
63
RESEARCH METHODOLOGY
In order to study the impact of CSR spending by FMCG Companies on the
education sector, six FMCG companies namely ITC, P&G, DABUR, HUL,
MARICO and NIRMA have been selected for the detailed analysis of their CSR
initiatives in the education sector. The methodology is based on the
collection of secondary data through web based research. The data and
information regarding CSR policies and programmes of the companies in the
context of education has been extracted from the published annual reports
and business sustainability reports of various years (from 2017-18 to 2019-
20) available on the official websites of respective companies.
ANALYSIS AND RESULT
The study focuses on the CSR policies of some leading FMCG companies and
their specific role in the education sector which will further help us in building
our conclusion that whether education has been the focus area of leading
companies or not. The selected companies for study are ITC, P&G, HUL,
DABUR, NIRMA and MARICO.
ITC – The Imperial Tobacco Company Ltd
ITC's allegiance is to create an enduring value for India by investing in the
primary education sector and creating the capabilities for tomorrow. ITC's
intervention is assigned to the goal of Sarva Shiksha Abhiyan which
provides access to education for the underprivileged section of the society.
ITC's partnership with the education department of Assam, Karnataka, and
West Bengal has made a significant impact on the ground by training
government school teachers and students through child-friendly pedagogy.
ITC also provides infrastructure support and maintenance to the government
schools and anganwadis of Assam, Karnataka, and West Bengal. Its main
goal is to create an attractive and enabling learning environment in a
child-friendly manner. The program undertaken by the ITC strengthens the
school management committee to enable them to participate and involve in
the maintenance of the school infrastructure facilities by the company. In
many schools, operation and maintenance of infrastructure facilities include
The Role of Corporate Social Responsibility towards Sustainable Education
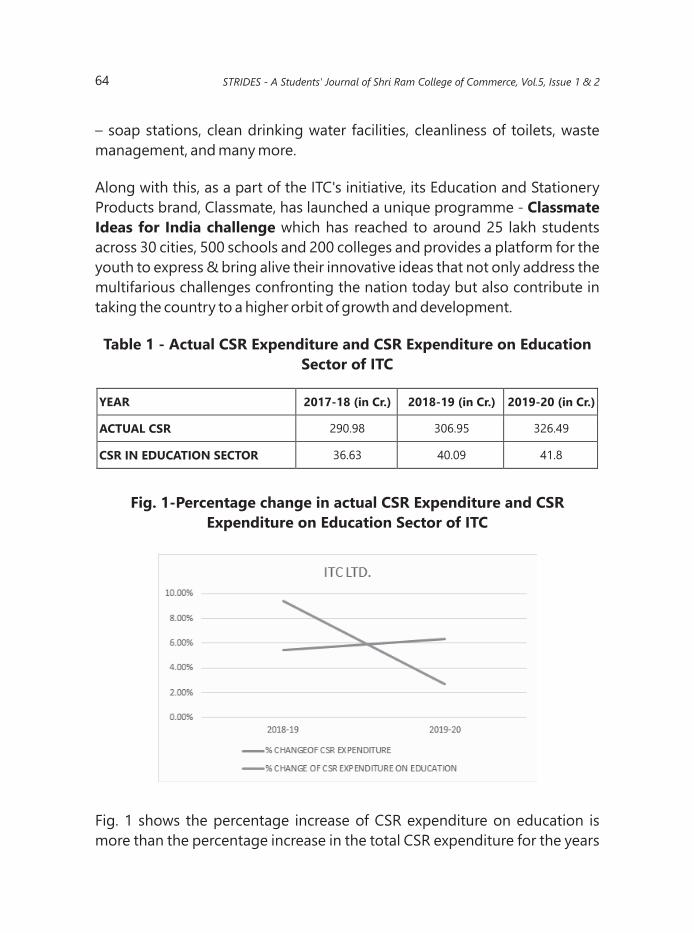
64
– soap stations, clean drinking water facilities, cleanliness of toilets, waste
management, and many more.
Along with this, as a part of the ITC's initiative, its Education and Stationery
Products brand, Classmate, has launched a unique programme - Classmate
Ideas for India challenge which has reached to around 25 lakh students
across 30 cities, 500 schools and 200 colleges and provides a platform for the
youth to express & bring alive their innovative ideas that not only address the
multifarious challenges confronting the nation today but also contribute in
taking the country to a higher orbit of growth and development.
Table 1 - Actual CSR Expenditure and CSR Expenditure on Education
Sector of ITC
Fig. 1-Percentage change in actual CSR Expenditure and CSR
Expenditure on Education Sector of ITC
Fig. 1 shows the percentage increase of CSR expenditure on education is
more than the percentage increase in the total CSR expenditure for the years
YEAR 2017-18 (in Cr.) 2018-19 (in Cr.) 2019-20 (in Cr.)
ACTUAL CSR 290.98 306.95 326.49
CSR IN EDUCATION SECTOR 36.63 40.09 41.8
STRIDES - A Students' Journal of Shri Ram College of Commerce, Vol.5, Issue 1 & 2
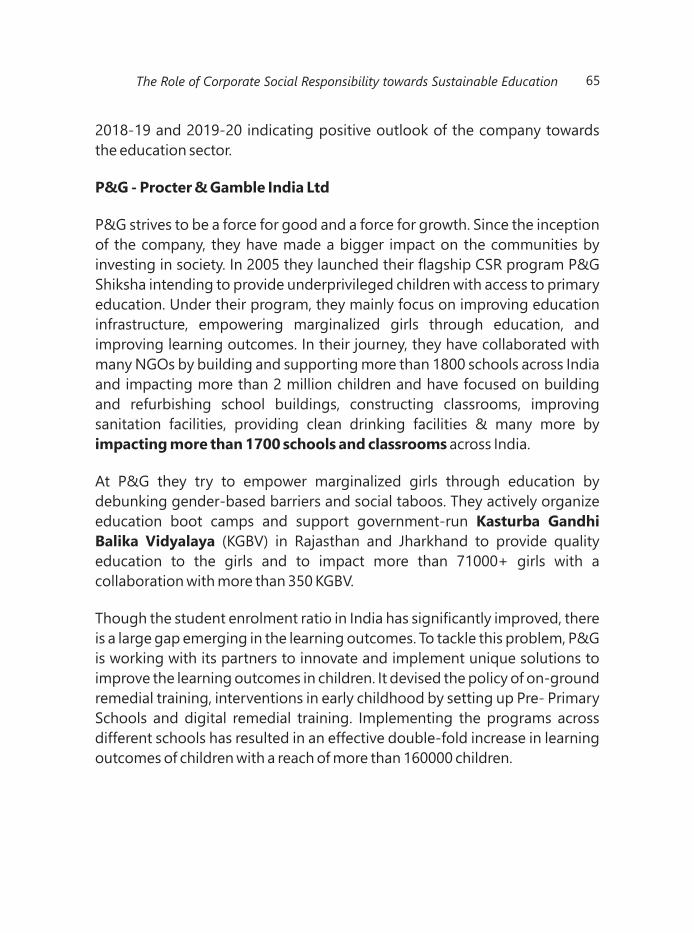
65
2018-19 and 2019-20 indicating positive outlook of the company towards
the education sector.
P&G - Procter & Gamble India Ltd
P&G strives to be a force for good and a force for growth. Since the inception
of the company, they have made a bigger impact on the communities by
investing in society. In 2005 they launched their flagship CSR program P&G
Shiksha intending to provide underprivileged children with access to primary
education. Under their program, they mainly focus on improving education
infrastructure, empowering marginalized girls through education, and
improving learning outcomes. In their journey, they have collaborated with
many NGOs by building and supporting more than 1800 schools across India
and impacting more than 2 million children and have focused on building
and refurbishing school buildings, constructing classrooms, improving
sanitation facilities, providing clean drinking facilities & many more by
impacting more than 1700 schools and classrooms across India.
At P&G they try to empower marginalized girls through education by
debunking gender-based barriers and social taboos. They actively organize
education boot camps and support government-run Kasturba Gandhi
Balika Vidyalaya (KGBV) in Rajasthan and Jharkhand to provide quality
education to the girls and to impact more than 71000+ girls with a
collaboration with more than 350 KGBV.
Though the student enrolment ratio in India has significantly improved, there
is a large gap emerging in the learning outcomes. To tackle this problem, P&G
is working with its partners to innovate and implement unique solutions to
improve the learning outcomes in children. It devised the policy of on-ground
remedial training, interventions in early childhood by setting up Pre- Primary
Schools and digital remedial training. Implementing the programs across
different schools has resulted in an effective double-fold increase in learning
outcomes of children with a reach of more than 160000 children.
The Role of Corporate Social Responsibility towards Sustainable Education

66
Table 2 - Actual CSR Expenditure and CSR Expenditure on Education
Sector of P&G
Fig.2 - Percentage change in actual CSR Expenditure and CSR
Expenditure on Education Sector of P&G
Fig. 2 shows P&G is the only company in which the majority of CSR
expenditure is spent on the upliftment of the education sector and the
company is raising its CSR expenditure on education in line with the
percentage increase of CSR expenditure.
Dabur India Ltd.
The CSR activities of Dabur basically can be reflected from the words of its
founder Dr. S K Burman who said "What is that life worth which cannot bring
comfort to others". Whilst accomplishing its endeavors of increasing market
size and high profits, it not only has maximized the gains of shareholders but
also managed to minimize its adverse effects on the environment and society.
Dabur exhibits a clearly stated CSR policy with its vision, mission, the process
of implementation, and effects. It works in the areas of environmental
ACTUAL CSR 10.80 12.20 12.74
CSR IN EDUCATION SECTOR 10.57 11.98 12.52
YEAR 2017-18 (in Cr.) 2018-19 (in Cr.) 2019-20(in Cr.)
STRIDES - A Students' Journal of Shri Ram College of Commerce, Vol.5, Issue 1 & 2
67
sustainability and the socio-economic development of society. It aims to
eradicate hunger, poverty, and malnutrition by providing food, shelter,
nutrition, supplement, clothes to the deprived sections of the society and
promotes sanitation by making available safe drinking water. It works in
promoting health care including preventive health care through awareness
programs, health check-ups, etc.
Adding on to this, Dabur works in creating employment and livelihood by
enhancing vocational skills and projects including tailoring, beautician,
beekeeping, food processing and preservation, vermicomposting, and other
Life Skill Training and livelihood enhancement projects. It also tries to
ensure environmental sustainability and ecological balance through
plantation drives, promoting alternative energy resources, conservation of
biodiversity, and natural resources.
Table 3 - Actual CSR Expenditure and CSR Expenditure on Education
Sector of Dabur
Fig.3 - Percentage change in actual CSR Expenditure and CSR
Expenditure on Education Sector of Dabur
CSR IN EDUCATION SECTOR 1.31 3.33 3.08
(in Cr.)2019-20 YEAR 2017-18 (in Cr.) 2018-19 (in Cr.)
ACTUAL CSR 23.74 26.35 27.8
The Role of Corporate Social Responsibility towards Sustainable Education
Fig. 3 shows the percentage change in Dabur's CSR expenditure is similar over
the years but its percentage change in CSR expenditure on education has
fallen exponentially over the three mentioned years.
HUL- Hindustan Unilever Ltd
Hindustan Unilever Limited (HUL) is committed to operate and grow its
business in a socially responsible way. In the last 10 years, through the
Unilever Sustainable Living Plan (USLP) the company has made a positive
impact on the environment and the society. It has always strived to serve the
communities through various initiatives.
HUL's CSR Policy is supported by the principle that it is committed to
conducting its operations with integrity and respect, in the interest of its
stakeholders, and in line with their Code of Business Principles. Instead, its
business model is designed to deliver sustainable growth. The company also
collaborates and engages with different stakeholders including
Governments, NGOs, IGOs, Suppliers, Farmers, and Distributors to tackle the
challenges faced by the society. The activeness of CSR policies and programs
of HUL over the past few years, Project Ankur is specifically designed for
providing special education and vocational training to the differently-
abled children and more than 30% of HUL's CSR contribution goes into this.
Table 4 - Actual CSR Expenditure and CSR Expenditure on Education
Sector of HUL
STRIDES - A Students' Journal of Shri Ram College of Commerce, Vol.5, Issue 1 & 2
YEAR 2017-18 (in Cr.) 2018-19 (in Cr.) 2019-20 (in Cr.)
ACTUAL CSR 116.09 126.45 143.74
CSR IN EDUCATION SECTOR 42.05 43.68 53.92

69
Fig.4 - Percentage change in actual CSR Expenditure and CSR
Expenditure on Education Sector of HUL
Fig. 4 shows the percentage increase of CSR expenditure on education is
increasing at an increasing rate whereas the percentage increase of actual
CSR expenditure is increasing at a decreasing rate indicating HUL's active
investing in education infrastructure and implementing new schemes and
initiatives.
Marico India Ltd
Marico has clearly stated that its purpose is to “Make a Difference” and this
purpose is the reason for its existence. It believes that it belongs to an
interdependent ecosystem comprising Shareholders, Consumers,
Associates, Employees,Government, Environment and Society. It feels that it
has the implied commitment to benefit all these stakeholders and it exists to
benefit the ecosystem of which it is an integral part.
It believes in the inter-linkage of social and economic values. It states the fact
that the firm cannot survive in isolation, it needs the participation and
support of the ecosystem and thus the gain must be a win-win situation for all
the involved constituents of the ecosystem.
Marico believes that one of the most significant industries of social
progress is education as it plays a decisive role for a society to achieve self-
The Role of Corporate Social Responsibility towards Sustainable Education

sustainable and equitable development. Furthermore, it supports that with
an increasing global realization of how the business community can and
should contribute to social objectives, education deserves a higher level of
corporate involvement. It has established “Ekal Vidyalayas” in various parts
of the country to promote and support education and training. Along with
this, it also provides funds to existing institutions and other assistance like
study material, stationery, etc. to the deprived children.
Table 5-Actual CSR Expenditure and CSR Expenditure on Education
Sector of Marico
Fig.5- Percentage change in actual CSR Expenditure and CSR
Expenditure on Education Sector of Marico
Fig. 5 shows Marico Ltd is negatively inclined towards the education sector
despite an increase in percentage change of CSR expenditure the company
hasn't increased the CSR expenditure on education sector and it is decreasing
year by year.
70
YEAR 2017-18 (in Cr.) 2018-19 (in Cr.) 2019-20 (in Cr.)
ACTUAL CSR 16.52 18.2 18.45
CSR IN EDUCATION SECTOR 10.51 9.54 7.94
STRIDES - A Students' Journal of Shri Ram College of Commerce, Vol.5, Issue 1 & 2
Nirma
Nirma's mission visualises itself as the socially vibrant and ethically admired
corporate citizen and therefore has always been committed to the
responsibility of CSR. With the goal of profit maximisation and increasing
shareholders wealth they are also acutely aware of the importance of social
stewardship. Towards this goal they have an aim to improve and enrich the
lives of future generations - the impoverished children of our country
through the better network of schools and infrastructure. A major section of
Nirma's CSR contributions goes for the betterment of the education sector of
the country. It works in the establishment and management of
educational and knowledge enhancement sectors. It also focuses on
providing financial or any other sort of assistance (like clothing, study
materials, books, tuition facilities) to the existing campuses of Nirma
University including the state-of-art academic institution such as Institute of
Technology, Institute of Law, Institute of management, Institute of
pharmaceutical sciences and institute of Diploma Engineering, etc. It also
works in funding the academic and sports scholarships to deserving
candidates including those from economically disadvantaged backgrounds.
The company has also been actively funding technology incubators located
within academic institutions which are approved by the Centre Government.
Besides education, Nirma also contributes actively in the health and
sanitation areas.
So, These are education centred initiatives taken by some of the leading
FMCG companies under their CSR policies. We've seen that all the above
mentioned companies have worked for education in one or the other way. If
one company is focusing majorly on building and establishing more schools
then the other is focusing equally on providing financial and other sort of
assistance to the students. From the small level research conducted, it's clear
that even after CSR being a legal obligation for the corporate sector, many
companies have genuinely started considering it as more of a moral and
social responsibility.
71The Role of Corporate Social Responsibility towards Sustainable Education

Table 6 - Actual CSR Expenditure and CSR Expenditure on Education
Sector of Nirma
Fig.6 - Percentage change in actual CSR Expenditure and CSR
Expenditure on Education Sector of Nirma
Fig. 6 shows the percentage change in the total CSR expenditure of Nirma is
increasing at an increasing rate but the same in its CSR on the Education
sector is increasing at a decreasing rate indicating that it hasn't been in
proportion to the percentage increase in the overall CSR expenditure.
CONCLUSION
In the small research undertaken with the sole objective of figuring out
whether the business houses of the FMCG sector are concerned for the
growth of Education facilities in the country or not, we have clearly seen the
awareness and contribution of companies in the area of education through
their different programmes and initiatives.
The contribution of ITC towards the education policies and programmes has
72
YEAR 2017-18 (in Cr.) 2018-19 (in Cr.) 2019-20 (in Cr.)
ACTUAL CSR 7.66 8.07 9.92 Cr
CSR IN EDUCATION SECTOR 5.9 6.54 7.59
STRIDES - A Students' Journal of Shri Ram College of Commerce, Vol.5, Issue 1 & 2
been continuously rising over the years. It is involved in funding the
establishment and infrastructural development of the sector which is shown
by its steady increase in CSR expenditure on education sector over the years
which surpasses its percentage change in CSR expenditure.
P&G is the only company to spend its majority of funds in the education
sector and has launched its own flagship programme 'P&G Shiksha' with the
motive of providing education and related facilities to the unprivileged
sections of the society.
Dabur has its clear CSR policy stating the mission, vision and implementation
process of various initiatives and programmes. It has succeeded in enhancing
vocational skills and has provided various Life Skill Training and Livelihood
Enhancement Projects.Dabur's CSR expenditure on the education sector is
increasing at an increasing rate with respect to the actual CSR expenditure of
the company.
HUL, through its strategically designed CSR policy, has initiated various
projects from time to time to cater the needs of all the concerned areas. More
than 30% of its CSR contributions goes towards Project Shakti, Project Ankur
and Technology Business Incubator Program. HUL's interest towards the
education sector is shown by its continuous contribution to the education
sector out of the actual CSR expenditure.
Marico, with the motto of 'Make a difference', believes that economic growth
cannot be achieved without social growth and considers education as the
prerequisite for any kind of growth. Despite the increase in CSR expenditure
of the company over the years, the company has steadily decreased its CSR
expenditure on the education sector.
Under its CSR policy, Nirma has contributed significantly to the education
sector by providing financial assistance to already established educational
institutions and by also establishing more such schools and universities. It's
CSR expenditure on the education sector is continuously rising in alignment
to the increase in CSR expenditure.
Considering aforementioned facts and details, it won't be wrong to say that
the shift of corporations from being 'profit centric' to 'earning profit while
73The Role of Corporate Social Responsibility towards Sustainable Education

taking care of social welfare & sustainable growth' is traceable and
commendable. The companies have clearly understood that in order to
sustain in the market for the long run, business ethics and social
responsibilities are to be equally taken care of. The big companies also
understand the importance of educated and skilled manpower for their own
businesses as it isn't possible for them to achieve what they aim at without an
efficient workforce and thus, they have started paying heed to the growing
yet poor status of India's education system and it's clearly a win-win situation
for all. If we all aim to wholeheartedly focus on the betterment of the country,
the days ain't far when our country will once again become the 'golden
sparrow, we used to be!
REFERENCES
Agrawal, S. (2020, MAY). A Study to Measure the Dimensions of CSR in FMCG
Companies:An Application of AHP Model. Mukt Shabd Journal, pp. 984-997.
Bidwai, S. V. (2011, March 6). CSR at ITC LTD - Viewing Through Strategic Lens.
National Conference on Corporate Social Responsibility Issues and Challenges,
pp. 288-298.
C. Ramu, C. V. (2019, March 31). CUSTOMERS PERCEPTION OF CSR IMPACT
ON FMCG COMPANIES – AN ANALYSIS . International Journal of Research in
Business Management, pp. 39-48.
Chandilyan, D. M. (2016, April). The Impact of Corporate Social Responsibility
(CSR) on Consumer Satisfaction with Reference. International Journal for
Innovative Research in Science & Technology| , pp. 636-640.
Grover, A. (2014, November 27). Importance of CSR in Inclusive Development.
Procedia- Social and Behavioral Sciences, pp. 103-108.
Khan, M. A. (2017, September). To Evaluate the Role of CSR (Corporate Social
Responsibility) Programs on the Buying Behavior of Consumers of FMCG
Sector Companies in Lucknow. Amity Global Business Review, pp. 46-50.
Khan, S. (2009). Corporate Social performance of FMCG Companies. Social
and Environment Accounting, pp. 180-201.
74 STRIDES - A Students' Journal of Shri Ram College of Commerce, Vol.5, Issue 1 & 2
Kiran, A. S. (2012, October). Corporate Social Responsibilities Automobile,
FMCG and IT Sectors in North West India. The Indian Journal Of Social Work,
pp. 520-534.
Kumar, S. V. (2017, January- June). CORPORATE SOCIAL RESPONSIBILITY IN
INDIA: AN OVERVIEW. JOURNAL OF ASIAN BUSINESS MANAGEMENT, pp. 54-67.
Mrs. Sharma Preeti Umesh, D. K. (2018, August 8). The Impact of Corporate
Social Responsibility on Business Performance: A Case Study of Some
Selected FMCG Companies in Pune City. International Journal in Management
& Social Science.
Prof. Vivek Swami, D. V. (n.d.). An empirical study: Influence of Corporate
Social Responsibility activities undertaken by FMCG companies towards the
loyalty of organized retail. Chronicle of the Neville Wadia Institute of
Management Studies & Research, pp. 138-152.
PUNJANI, P. K. (n.d.). INFLUENCE OF SOCIAL ADVERTISING ON CONSUMER
BEHAVIOR TOWARDS FMCG BRANDS.
Rajeshwari Panigrahi, E. M. (2020, January - June). CSR: A Tool for Rural
Development - An Indian Paradigm. IPE Journal of Management, pp. 65-87.
Sharma, A. (2016, May 9). Key drivers endorsing CSR: a transition from
economic to holistic approach. Asian Journal Of Business Ethics, pp. 165- 184.
Silpa.G, P. D. (2017, June). Corporate Social Responsibility of Indian IT
Companies- A Study on CSR Activities of Select Companies. International
Journal of Latest Technology in Engineering, Management & Applied Science,
pp. 18-21
Shivam Shukla, A. K. (2016, January). Corporate Social Responsibility Practices
in India: A Study of Top Fast Moving Consumer Goods Companies. Indira
Management Review Annual Research & Academic Journal.
Tyagi, A. N. (2019). Impact of CSR on Financial Performance of Top 10
Performing CSR Companies In India. Journal of Economics and Finance, pp.
49-55.
75The Role of Corporate Social Responsibility towards Sustainable Education

Yokeshwar Iyanar, R. P. (2018, December 3). Impact of CSR Activities on
Shareholders' Wealth in Indian Companies. International Conference on
Advances in Computing, Communications and Informatics (ICACCI).
Industry Reports of DABUR, HUL, P&G, ITC, NIRMA, PARLE AND MARICO
published on companies' official websites
Indian Companies Act 2013 , Corporate Social Responsibility Rules 2014 ,
Schedule VII
76 STRIDES - A Students' Journal of Shri Ram College of Commerce, Vol.5, Issue 1 & 2
77
Covid-19 and Mental
Health of
Adolescents
The novel coronavirus (Covid-19) pandemic has
portrayed alarming results on every adolescent's
emotional and social functioning. However, more
prospective studies are required to detect the
exact magnitude of the impact. The motive of the
study is to understand the mental health of the
adolescent in COVID-19 pandemic and to
determine the diverse factors that influenced their
psychological health. This research paper used
the narrative approach. The data is collected from
various articles, research papers, books and
theories as a framework to uncover the global
mental distress of pandemics in children. The
Covid-19 pandemic took an unprecedented toll
on the mental health of adolescents. The fear of
contamination, loss of loved ones, lockdowns,
grief, domestic violence, no outdoors, no physical
activities, overuse of mobile phones, increased
internet surfing, scrolling social media feeds, poor
economic conditions were the factors influencing
the mental health of adolescents. The pandemic
resulted in increasing psychological, stress, post-
traumatic and anxiety disorders. Pro-active
efforts by counsellors at educational institutions
and family members are required to support the
psychological health and welfare of the youth.
Dipali Nishad
B.Com. (Hons.)
SRCC, DU
Mentor:
Mr. Ashish Gautam
Assistant Professor
Department of English
SRCC, DU
ABSTRACT
78 STRIDES - A Students' Journal of Shri Ram College of Commerce, Vol.5, Issue 1 & 2
More specific research is required on youth mental disorders during the time of
pandemics.
Keywords: Mental Health, Children, Pandemic, COVID-19, Children
In December 2019, a cluster of pneumonia cases was recorded in Wuhan,
China. Later on, the World Health Organisation declared the novel
coronavirus (COVID-19) outbreak a global pandemic on March 11, 2020, all
over the world. As of May 31, 2021, the number of confirmed cases of
coronavirus has reached 17 crores. The pandemic- and the social distancing
measures that many countries have implemented - have caused disruptions
to daily routines (Lee J., 2020). As cases continue to spread across the world, it
became clear that the outbreak of the virus didn't only affect the lives of
people physically and economically but also mentally.
The way the pandemic took a toll on the psychological health of human
beings is no longer an unknown fact. Globally, there are concerns that COVID-
19 is already having and will continue to impact the mental health of
populations as lockdowns, job losses, overwhelmed health systems, and fear
of contracting the virus exacerbate stress and isolation (Smith, 2020). Many
types of research and discussions have been done about people's mental
health. Generation Z (born 1996-current) reported high rates of anxiety,
depression and high levels of worry (Seemiller, 2020). As per a UNESCO report,
87% of students across the world were disturbed due to university closures
(Collins, Helen M, 2020). The education and learning of 67.6% of students are
impacted globally due to coronavirus in 143 countries (Shah K, 2020). Even
population-based studies not directly investigating student mental health
found that being a student increased the risk of experiencing mental health
issues during the pandemic (Solomou, 2020). The above statistics gave a
glance at how badly the pandemic posed an unprecedented threat to the
mental health of individuals across the world. Did the Covid-19 outbreak and
lockdown heighten the risk of mental disorders among adolescents?
METHODOLOGY
The study is based on the literature review done by using various search
engines like Jstor, Medium, Statista and Google Scholar by searching the
following terms: “mental health”, “covid-19”, “youth”, “pandemics”. Followed

79Covid-19 and Mental Health of Adolescents
up by the search of specific factors and consequences found in the first
search's result for instance “physical health, “screen time”, “anxiety”,
“depression”, “suicide rates'', “gender discrimination”. This paper aimed to
explore and conceptualize the youth's experience as represented in articles,
research papers, books and theories as a framework.
The Covid-19 pandemic is continuing even during the time this research
paper is being written. Due to the stay-at-home condition, the children are
compelled to stay inside the four walls and always maintain physical distance
outside their homes. A bunch of articles are available on different websites
discussing the impact on mental health. However, not much specific research
is done on adolescents' mental health across the nations. The literature used
in the paper is based on the articles stating information on factors that
pushed the new generation towards anxiety and stress. It includes
information and figures from various papers indirectly providing the data on
how the previous pandemics or epidemics had made a long term
psychological impact on the survivors.
REFLECTIONS FROM PAST
The research done during the Severe Acute Respiratory Syndrome (SARS),
Middle East Respiratory Syndrome (MERS) and Ebola pandemic portrays that
these diseases pose unique challenges to one's psychological health.
Regrettably, to understand the impact of past outbreaks on young minds,
studies weren't done purposely for children and adolescents. Still, Covid-19
and Adolescents 6 some basic understandings can be derived. Since the
situation and condition prevailing during the current pandemic is quite
similar to SARS and MERS, the same mental impact is expected in the demic.
A study on SARS survivors with psychiatric disorders revealed that about 25%
of the patients showed signs of post-traumatic stress disorder (PTSD), and
15.6% of them had worsening depression (Shah K, 2020). The people who
survived the MERS pandemic experienced a low quality of life.
To assess the effect of COVID-19 on mental health, a research team examined
the literature on the recent Ebola epidemic in sub-Saharan Africa. As per their
research, the survivors of Ebola were disturbed by the traumatic memories.
The rejection by society, while those who never came in contact with the

80
disease grieved for lost relatives or struggled to cope with extreme anxiety
(Semo B, 2020)
It can be concluded through history; pandemics have always shown drastic
and long-term effects on the lifestyle and mindset of people all over the
world.
GLOBAL MENTAL IMPACT
Generally, the people influenced by mental health grievances will be more
eminent than the people who are affected by the Covid-19. Studies have
demonstrated that the emotional wellness effects can continue for a longer
period. Adolescence, particularly mid to late adolescence (15-19 years), when
numerous overlapping transitions can define the future, is a critical period for
all young people.. (Plan International, 2020) The impact on mental health is a
silent perpetrator and not less than an unseen virus. The strict lockdown
measures caused unrest and stress among young children. Overnight they all
were away from the school campus, friends, libraries, their daily routine. The
social distancing led to unwanted adverse effects on the academics and
mental health of students. They developed anxiety, panic attacks, mood
disorder, depression and other mental illnesses.
1) Contamination Fear
With an increase in the number of positive cases and losing one's beloved and
even a just known person, the grief and anxiety were affecting youths' mental
health. According to a report Generation Z (the current generation) is
significantly more likely (about 27 %) than other generations to report their
mental health as poor (Muzammil, 2020). The people born in this group were
badly affected. They had rarely heard of such a vast level of a worldwide
pandemic. Everyone has heard about communicable diseases but this one
showed the real picture of how terrible a communicable disease can get. Even
a sneeze was enough to doubt whether it's the flu or Covid-19. This fear of
getting ill or having a family member or a friend sick was a heavy burden to
bear. This was not less than any trauma for young people. Anxiety followed
social distancing everywhere. The health institutions had advised washing
every item that is brought inside the house. Children were so afraid that in the
pandemic they didn't even touch their favourite candies stored in the
STRIDES - A Students' Journal of Shri Ram College of Commerce, Vol.5, Issue 1 & 2
81
refrigerator for days. Xenophobia, the fear of foreigners who might be
carrying infection unfurled across the countries especially in the initial phase.
People had Xenophobia from every foreigner or urban residing citizen where
Covid-19 cases were multiplying daily.
2) Opportunities Lost
Last year in March with the announcement of a worldwide pandemic the
schools and universities were put to shut down. Initially, no study or classes
were followed as the institutions were still deciding on this. Later on, when
countries were not able to see any end to rising cases. They decided to teach
on virtual platforms and that's continuing with the second wave of the
pandemic.
Daily, young minds from elementary to college students were adjusting to
virtual platforms. For children and adolescents with mental health needs,
such closures meant a lack of access to the resources they usually have
through schools. (Lee J., 2020) Students lost many experiences, some
essential activities, chance to study abroad, sports seasons, couldn't apply or
couldn't reach the entrance exams of jobs and institutions. University
students were stressed about dormitory evacuation and the cancellation of
anticipated events such as exchange studies and graduation ceremonies (Lee
J., 2020). Graduates lost their employment opportunities. As companies
couldn't afford to pay a new employee. Freshers lost their chance to
experience on campus matters. Especially the knowledge that could be
shared in physical mode is impossible to give in virtual mode. Adolescence is
the phase where students tend to learn discipline and figure out their goals.
All these things didn't happen just because of the pandemic. Although these
reasons seemed to be nothing in front of the people who lost their lives. But,
this loss of opportunity will impact the coming years in students' life.
3) Change in behaviours of youth during this pandemic
The separation from school and colleges caused emotional discomfort, it was
hard to adapt to this new environment and behavioural problems among the
youths became quite common. This pandemic was different for every
individual. For some, it proved to be productive and for others non-
productive. The news channel and social media were flooded with only two
Covid-19 and Mental Health of Adolescents
82
things, either the Covid-19 current status or people utilising the shutdown.
First talking about the positive aspect, the quarantine phase flourished most
of the people well spent time with family. Although financial issues were
going on in the families, one pretty clear thing is that everyone relieved their
childhood. People enjoyed their hobbies. Social media was loaded with
pictures portraying the joy of reading your favourite novel, baking a cake,
cooking a new dish, writing a poem, exploring various gaming apps. Most of
the people made the best out of hard times. They created precious memories
with loved ones.
The other side of the coin was terrible. Not everyone was enjoying this family
time. Moreover, not everyone had their family next to them. Not everyone
had a hobby to spend in quarantine. For those people, it was horrible to
manage their mental health. They faced many behavioural issues like short
temper, frustration, anxiety, feeling of being useless.
4) Lost some precious connections
In the pandemic, young people didn't lose their loved ones only due to Covid-
19. They also lost some friends due to distance. It was an effortless task to stay
connected through social media. The first few months of the pandemic led to
Zoom hangouts and remote celebrations, deepening and visible divisions in
how people are handling the ongoing pandemic have become the source of
growing tension and sometimes outright conflict. Many people were happy
as their relationships got strengthened in this pandemic because they
somehow prioritized whom they care about and how often they kept
checking on them. But as 2020 came to end, many people noticed distance as
well as differences in their friendship, which has changed the relationships
and not necessarily for the better. Due to the lack of physical contact young
people weren't able to make each other understand their situation. This
resulted in bitterness in the relationship. The feeling of loneliness led to the
loss of some precious connections which was unexpected. It's nonetheless a
trauma for young minds.
5) Impact on Physical Health
To reduce the contamination of the Covid-19 virus, all over the world
STRIDES - A Students' Journal of Shri Ram College of Commerce, Vol.5, Issue 1 & 2

83
lockdowns were announced. As a result, children had no access to even
school sports. Fitness and activity classes for youth such as gymnastics,
dance, and martial arts were also cancelled or postponed (Genevieve F.
Dunton, 2020). It led to increased obesity, diabetes and cardiovascular
diseases in children. Although these were necessary to slow the spread of
COVID-19, they limited children's ability to engage insufficient levels of
physical activity (PA) to maintain health and prevent disease (Genevieve F.
Dunton, 2020).
6) Economic Conditions
As per a report by StanCan, the families who faced poor economic conditions
were more likely to have hyperactive and anxious kids (Kong, 2020). The
stress due to financial problems was huge. The financial problems were a real
burden to families because the necessities were getting fulfilled from scarce
savings. With 29% of single-parent families living in poverty, economic stress
puts their children in a more disadvantaged situation (Kong, 2020). They also
found that the insecurity regarding the economic conditions affected
children in single-parent families more than the children who have both
parents. Mental illness and substance abuse of parents significantly
influenced our parent-child relation and increased the risk for mental health
problems in children. Poor mental health and a negative environment in a
family affected the relationship between parents and children. As a result, the
mental health of children was also at risk. They had no source to make both
ends meet. Students were in heavy fear and anxiety of whether they will be
able to continue their studies or not. Not everyone was in a position to afford
the expensive data packs, smartphones and even the costly books for
competitive examinations. This constrained the development of children and
youth.
7) Traumatic Stress due to Quarantine
Children developed severe mental health conditions, including post-
traumatic stress, because of the coronavirus pandemic, a charity has warned
(Ashitha, 2020). Children are extremely vulnerable. Children are extremely
vulnerable. While struggling through the loss of a loved one, inaccessibility to
the internet for studies, poverty, opportunity, they were not even able to take
Covid-19 and Mental Health of Adolescents
84
online therapy or any counsellors' help. The children experienced symptoms
of anxiety, depression, PTSD, dissociation, emotional, etc. A prevalence of
28.2% for PTSD and 14.1% for depression was observed (Singh SP, 2020).
Psychiatric symptoms were alarmingly prevalent: 67.05% reported traumatic
stress, 46.55% had depressive symptoms, and 34.73% reported anxiety
symptoms (Shufang Sun, 2021). Indeed, the pandemic proved to be a
traumatic experience for many adolescents.
8) Increase in Suicidal Rates
With the new stay-at-home restrictions to curb the spread of covid-19, there
are concerns that rates of suicide have increased. Muzammil researched the
topic “Effect of Generation on Suicide” with the motive of determining the
rise in the number of cases of suicide during the pandemic (Muzammil, 2020)
They took the generations for the project on the respective periods given
below:
1. G.I. Generation: 1901–1927
2. Silent Generation: 1928–1945
3. Boomer Generation: 1946–1964
4. Generation X: 1965–1980
5. Millennial Generation: 1981–1996
6. Generation Z: 1996-current
The result of the project was as follow:
It is usually seen that suicide practices are generally basic in the elderly
population. They are generally inclined to sadness, dejection, and other
emotional well-being issues. According to the report, almost 27% of
Generation Z (the current age) felt their emotional wellness was poor amidst
the pandemic. In any case, simultaneously, they are 37% bound to get
psychological well-being treatment contrasted with different ages.
According to the graph, amongst all the generations, the suicide number is
highest among the Silent and second-highest among the Boomers
generation (Muzammil, 2020)
STRIDES - A Students' Journal of Shri Ram College of Commerce, Vol.5, Issue 1 & 2
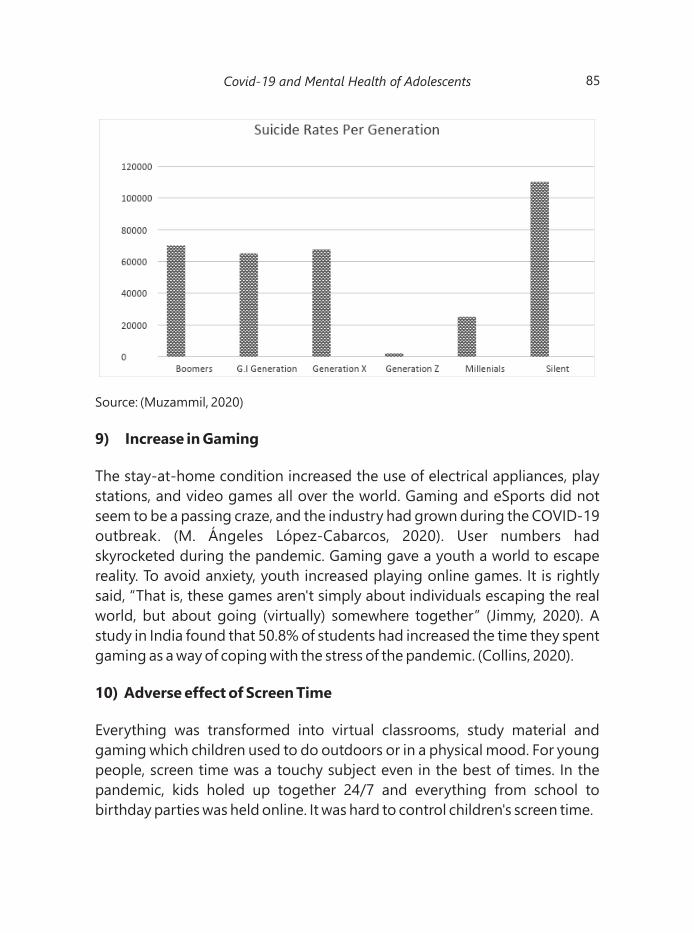
85
Source: (Muzammil, 2020)
9) Increase in Gaming
The stay-at-home condition increased the use of electrical appliances, play
stations, and video games all over the world. Gaming and eSports did not
seem to be a passing craze, and the industry had grown during the COVID-19
outbreak. (M. Ángeles López-Cabarcos, 2020). User numbers had
skyrocketed during the pandemic. Gaming gave a youth a world to escape
reality. To avoid anxiety, youth increased playing online games. It is rightly
said, “That is, these games aren't simply about individuals escaping the real
world, but about going (virtually) somewhere together” (Jimmy, 2020). A
study in India found that 50.8% of students had increased the time they spent
gaming as a way of coping with the stress of the pandemic. (Collins, 2020).
10) Adverse effect of Screen Time
Everything was transformed into virtual classrooms, study material and
gaming which children used to do outdoors or in a physical mood. For young
people, screen time was a touchy subject even in the best of times. In the
pandemic, kids holed up together 24/7 and everything from school to
birthday parties was held online. It was hard to control children's screen time.
Covid-19 and Mental Health of Adolescents
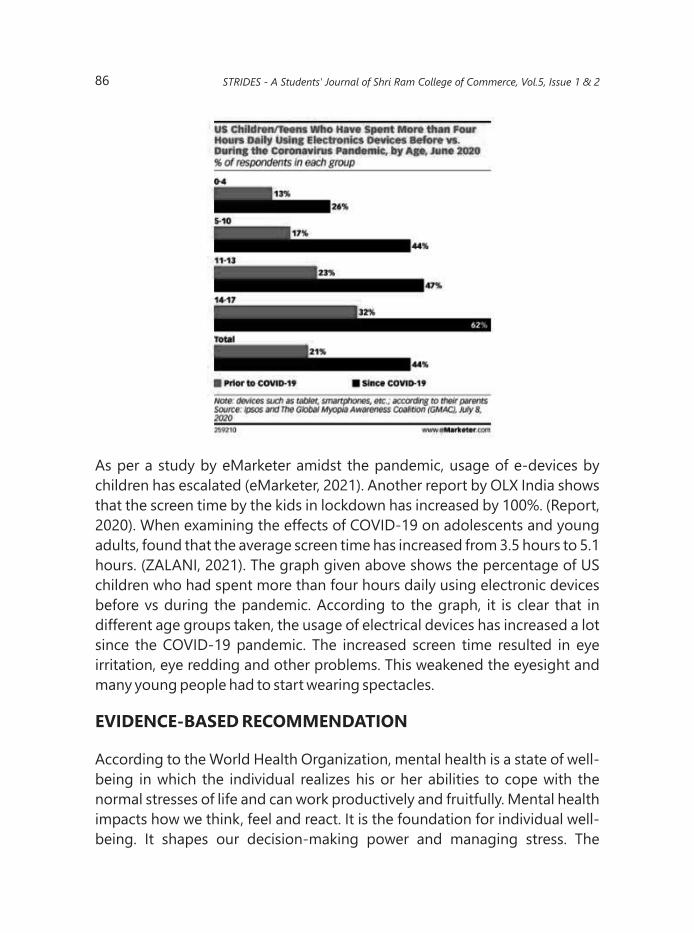
86
As per a study by eMarketer amidst the pandemic, usage of e-devices by
children has escalated (eMarketer, 2021). Another report by OLX India shows
that the screen time by the kids in lockdown has increased by 100%. (Report,
2020). When examining the effects of COVID-19 on adolescents and young
adults, found that the average screen time has increased from 3.5 hours to 5.1
hours. (ZALANI, 2021). The graph given above shows the percentage of US
children who had spent more than four hours daily using electronic devices
before vs during the pandemic. According to the graph, it is clear that in
different age groups taken, the usage of electrical devices has increased a lot
since the COVID-19 pandemic. The increased screen time resulted in eye
irritation, eye redding and other problems. This weakened the eyesight and
many young people had to start wearing spectacles.
EVIDENCE-BASED RECOMMENDATION
According to the World Health Organization, mental health is a state of well-
being in which the individual realizes his or her abilities to cope with the
normal stresses of life and can work productively and fruitfully. Mental health
impacts how we think, feel and react. It is the foundation for individual well-
being. It shapes our decision-making power and managing stress. The
STRIDES - A Students' Journal of Shri Ram College of Commerce, Vol.5, Issue 1 & 2
87
various aspects of our lives are affected by our mental health. Like adults,
children and adolescents also have mental health disorders. The disorders
come in the way of what they think, observe and decide. All these things
when summed up could lead to bad mental health, feeling of loneliness,
traumatic experience, childhood abuse, discrimination and stigma. They lead
to anxiety, distress or disability in social, work or family activities. “Physical
illness” is a term to describe the range of physical health problems. Similarly,
“mental Illness” is the term to depict poor mental health conditions. It is
significant for children to maintain a healthy balance of their physical and
mental health.
It is a known and still ignored fact that being a teenager is difficult no matter
what. The COVID19 Pandemic had added up to the mental illness of young
minds. They have faced some unexpected and life-changing things in their
life at a very early age. It led to a rise in anxiety, stress, and depression levels.
Since the pandemic is still not over and the conditions for youth are as similar
as the initial phase of the pandemic, youth should be guided well in the
dynamic environment.
The schools and colleges are continuing the academic session through virtual
mode. They should undertake the responsibility of their students' mental
health. With their usual course or subjects, they should take counselling
sessions. Not everyone can afford the psychologists' fees. Many schools and
colleges have taken initiative in this field but there is a lot of scope for the rest
of the educational institutions to organise one Counselling session for
students.
Also, the part of the youth who are lacking awareness or understanding
regarding why the pandemic is not coming to an end is likely to have stress
and nervousness. Subsequently, youngsters must read or hear the data about
COVID-19 through a reliable source like a news channel. It will spread more
awareness among them. They will not only understand why we are still
practising social distancing but also make them understand a wider picture of
COVID-19. Parents or adults should talk to their children regarding their life
and difficulties. This will provide them emotional support in the prevailing
negative environment.
Covid-19 and Mental Health of Adolescents
88
Moreover, every single young mind must know how to manage their
emotions without depending on others. They should participate in the
activities they love to do. It will keep them distracted from the stress.
Indulging in more physical activities have always been the best remedy to
cope with distress. Meditation is the key activity for anyone at any age to
balance their mental health. It makes an individual calmer and more efficient.
In this pandemic, if youth inculcated these practices in their life, they would
be relied upon to succeed better in the future.
Protecting and maintaining the mental health of people in the future is only
possible when the pandemic will end completely. Though no one can go back
and normalise the situation, everyone can start from now to make a better
and healthier life. Although it is impossible to bring back our loved ones who
lost their lives due to coronavirus, suicides, hypertension and various other
factors of pandemics. Every youngster must understand the need for
investment and savings for unexpected and unpredictable times. It is said
that “One should remember that life's greatest lessons are usually learned at
the worst times and from worst mistakes”. Many people lost great
opportunities but one should never give up on their dream.
CONCLUSION
The COVID-19 pandemic impacted the psychological health of adolescents
as many students from school, colleges reported to family members, friends,
psychologists and took part in interviews. They confronted how badly their
mental health is affected in this awful time. Pandemic posed an
unprecedented threat to the mental health of individuals across the world.
Overall, results from the study suggest that the Covid-19 outbreak and
lockdown heightened the issues and grievances regarding mental disorders
among adolescents. The pandemic resulted in the increased mental distress
and instability such as stress, anxiety, depression due to the fear of
contamination, grief and loss of loved ones, lockdown, no physical activity, no
social contact, increase in screen-time, overuse of social media and internet,
domestic violence, transform to virtual studies from the traditional one, poor
finances. This led to increasing in alcohol consumption and suicide rates.
There is a need for the reliable and latest information about the pandemic.
More research and counsellors at educational institutions are required to
STRIDES - A Students' Journal of Shri Ram College of Commerce, Vol.5, Issue 1 & 2
89
rebuild a positive mental attitude among adolescents. More specific research
is required on youth mental disorders during the time of pandemics
REFERENCES
Jimmy, P. C. (2020). Video games and mental health during Covid-19:
Opportunities and precautions. The University of Auckland, 7. Retrieved from
https://www.auckland.ac.nz/en/news/2020/07/13/video-games-mental-
health-covid-19.html
Ashitha, N. (2020, June 22). Coronavirus; Children 'developing post-traumatic
stress' from the pandemic. BBC News , 3 . Retr ieved from
https://www.google.com/amp/s/www.bbc.com/news/amp/education-
53097289
Collins, H. M. (2020). A mental health crisis: the psychological impact of
Covid-19 of university students. Medium.com, 13. Retrieved from
https://helencollins1996.medium.com/a-mental-health-crisis-the-
psychological-impact-of-covid-19-of-university-students-1b0ccb0ee12c
Elyse R, G. S.-N. (2020, December 9). Alcohol Consumption during the covid-
19 pandemic: A cross- Sectional Survey of Us adults. International Journal of
Environment Research and Public Health , 9. Retrieved from
https://www.ncbi.nlm.nih.gov/pmc/articles/PMC7763183/
eMarketer. (2021) . _ . Ins ider Inte l l igence , Retr ieved f rom
https://www.emarketer.com/content/electronic-device-usage-nearly-
doubledamong-us-kids-during-pandemic
Fitzsimmons, C. (2020). Teenage girls are more stressed and anxious under
lockdown than boys. The Sydney Morning HeHerald2. Retrieved from
https://www.google.com/amp/s/amp.smh.com.au/lifestyle/life-and-
relationships/teenage-girls-more-stressed-and-anxious-under-lockdown-
than-boys-20200515-p54tg8.html
Genevieve F. Dunton, B. D. (2020, September 04). Early effects of the COVID-
19 pandemic on physical activity and sedentary behaviour in children living in
t h e U . S . B M C P u b l i c H e a l t h , 2 3 . R e t r i e v e d f r o m
Covid-19 and Mental Health of Adolescents
90
https://bmcpublichealth.biomedcentral.com/articles/10.1186/s12889-020-
09429-3
Jörg M. Fegert, B. V. (2020). Challenges and burden of the Coronavirus 2019
(COVID-19) pandemic for child and adolescent mental health: a narrative
review to highlight clinical and research needs in the acute phase and the
long return to normality. Child and Adolescent Psychiatry and Mental Health,
1 1 . Re t r i e v e d f r o m h t t p s : / / w w w. n c b i . n l m . n i h . g o v / p m c /
articles/PMC7216870/
Kong, N. (2020). Covid-19's economic impact could be stressing out our kids.
The Conversation, 3. Retrieved from https://www.google.com/amp/s/
theconversation.com/amp/covid-19s-economic-impact-could-be-
stressing-out-our-kids-142258
Lee, J. (2020, 4). Mental health effects of school closures during COVID-19.
R e t r i e v e d f r o m T h e L a n c e t c h i l d & a d o l e s c e n t :
https://doi.org/10.1016/S2352-4642(20)30109-7
Lee, J. (2020, april 14). Mental health effects of school closures during COVID-
19. Retrieved from The Lancet Child & Adolescent Health:
ht tps : / /www.the lancet .com/journa ls/ lanch i/ar t i c le/P I IS2352-
4642 (20 )30109-7/ fu l l tex t# :~ : tex t=26%25%20sa id%20they%
20were%20unable,people%20with%20mental%20health%20issues
M. Ángeles López-Cabarcos, D.-S.-C. (2020). All that glitters is not gold. The
rise of gaming in the COVID-19 pandemic. Journal Of Innovation &
Knowledge, 8. Retrieved from https://www.sciencedirect.com/science/
article/pii/S2444569X20300408
Michael, E. (2020, October 1). The survey shows an increase in alcohol use
during the Covid-19 pandemic. Healio Slack Journals, 3. Retrieved from
https://www.healio.com/news/primary-care/20201001/survey-shows-
increase-in-alcohol-use-during-covid19-pandemic
Mull, A. (2021, January 27). The pandemic has erased entire categories of
friendship. The Atlantic, 10. Retrieved from https://www.theatlantic.
com/health/archive/2021/01/pandemic-goodbye-casual-friends/617839/
STRIDES - A Students' Journal of Shri Ram College of Commerce, Vol.5, Issue 1 & 2
91
Muzammil. (2020). Effect of Generation on Suicide. The Startup, 28. Retrieved
from https://medium.com/swlh/effect-of-generation-on-suicide-
253571b81778
Plan International. (2020, September 1). Halting lives: The impact of COVID-
19 on girls and young women. Plan International, 5. Retrieved from
https://plan-international.org/publications/halting-lives-impact-covid-19-
girls
Savage, M. (2020). Coronavirus: The possible long-term mental health
impacts. BBC, 12. Retrieved from https://www.bbc.com/worklife/article/
20201021-coronavirus-the-possible-long-term-mental-health-impacts
Seemiller, C. (2020, April 22). The Psychological Effects of COVID-19 on Young
People. The Gen Hub, 4. Retrieved from https://medium.com/the-gen-z-
hub/the-psychological-effects-of-covid-19-on-young-people-
ae10607ae45d
Semo B, F. S. (2020). The Mental Health Impact of the COVID-19 Pandemic:
Implications for Sub-Saharan Africa. Dove press, 7. Retrieved from
https://www.dovepress.com/the-mental-health-impact-of-the-covid-19-
pandemic-implications-for-sub-peer-reviewed-fulltext-article-PRBM
Shah K, M. S. (2020). Impact of COVID-19 on the Mental Health of. Cureus
12(8), 6. Retrieved from https://www.cureus.com/articles/38703-impact-of-
covid-19-on-the-mental-health-of-children-and-adolescents
Shufang Sun, S. B. (2021, January 25). Psychiatric symptoms, risk and
protective factors among university students in quarantine during the
COVID-19 pandemic in China. Globalization and Health. Retrieved from
https://globalizationandhealth.biomedcentral.com/articles/10.1186/s12992
-021-00663-x
Singh SP, K. A. (2020, November). Prevalence of Posttraumatic Stress Disorder
and Depression in General Population in During COVID-19 Pandemic Home
Quarant ine. As ia Pac J Publ ic Health , 1 . Retr ieved from
https://pubmed.ncbi.nlm.nih.gov/33198479/
Covid-19 and Mental Health of Adolescents
92
Smith, E. (2020). The pandemic takes its toll on women and girls' mental
health. Devex, 7. Retrieved from https://www.devex.com/news/the-
pandemic-takes-its-toll-on-women-and-girls-mental-health-98314/amp
Solomou, I. a. (2020). , Prevalence and Predictors of Anxiety and Depression
Symptoms during the COVID-19 Pandemic and Compliance with
Precautionary Measures: Age and Sex Matter. Int J Environ Res Public Health,
17. Retrieved from https://pubmed.ncbi.nlm.nih.gov/32650522/
ZALANI, R. (2021). ScreenTimeStatistics 2021: Your Smartphone is Hurting
y o u . E l i t e C o n t e n t M a r k e t e r , 1 4 . R e t r i e v e d f r o m
https://elitecontentmarketer.com/screen-time-statistics/
STRIDES - A Students' Journal of Shri Ram College of Commerce, Vol.5, Issue 1 & 2

93
Cryptocurrency-
The Rise of Tokens
Ever since bitcoin, the pioneer anarchic
cryptocurrency gained momentum in 2019, the
attention to the market has drastically increased.
A number of currencies have come up bringing
with them a huge number of investors. This paper
seeks to provide a concise yet comprehensive
analysis of the basics of blockchain technology
and the growth of cryptocurrency over the years.
It takes you through the timeline of evolution of
the industry along with how the bank issued
currency differs from this currency. With
particular analysis of Bitcoin, the first
decentralized cryptocurrency, the paper also
highlights investments in various countries. It
presents the government stance on this trending
topic across the world along with problems and a
description of the networks on which it works.
Keywords: Cryptocurrency; Blockchain
Technology; Bitcoin; Decentralisation
INTRODUCTION
The paper presents a critical comparison of the
blockchain industry against the banking arm of
the world economies. We've tried to understand
how can the rise of cryptocurrency have an
impact on the banking sector and can it a
possible substitute for the future. Further, the
Aayush Jain
B.Com. (Hons.)
SRCC, DU
Ishika Kamani
B.Com. (Hons)
SRCC, DU
Mentor:
Ms. Kinneri Jain
Associate Professor
SRCC, DU
ABSTRACT
94 STRIDES - A Students' Journal of Shri Ram College of Commerce, Vol.5, Issue 1 & 2
relevance of cryptocurrency in the financial world has been discussed.
Another area of concern for trading in this market has been the taxation
schemes. We've touched upon possible ways to tax the income earned out of
the trades made in the market. We've also analysed the stance of the Indian
government on cryptocurrency and mentioned a few reasons behind the
opinion.
A number of research reports shed light on several aspects of Cryptocurrency
worldwide. An interesting study was conducted titled 'An Analysis of
Cryptocurrency Industry' by an author from University of Pennsylvania, that
analysed the various networks on which different cryptocurrencies work. The
report also incorporated attempts made by various governments to define
legal parameters for cryptocurrency. The study estimated that bitcoin may
dominate the industry in the long run. (Ryan Farell. 2015) Research has also
been undertaken to understand the various applications of cryptocurrency
other than as a monetary commodity.
Another report by Corporate Finance Institute discussed the working of
cryptocurrency and how it can be an investment opportunity. They touched
upon possible ways to evaluate means of arriving at the value of these
currencies. An understanding of how cryptocurrency can act as an addition to
a portfolio was also presented.
A Deloitte report empirically studied the top 5 trends for bitcoin and
blockchain technology. The report comprised of gradual shifts, in the
industry, from experimenting to developing robust enterprise solutions. It
also studied the adoption rates across various industries and how the role of
government would be critical in reaching the goals.
It was 2009, when a new way to transfer money over the internet emerged.
Words like Bitcoin, blockchain and cryptocurrencies gradually unfolded. In
the decade-plus since, the crypto industry observed all classic episodes of a
disruptive technology; reaching new all-time highs and crushing pullbacks,
chapters of euphoria and moments of despair, fear, and everything in
between.
Although the concept of digital currencies dates back to the 1980s, Bitcoin,
launched in 2009, is said to be the first successful decentralized

95Cryptocurrency-The Rise of Tokens
cryptocurrency. The journey started, when a pseudonymous developer;
Satoshi Nakamoto (identity of whom is still unknown) published their idea in
a paper titled 'Bitcoin: A Peer-to-Peer Electronic Cash System'. In the
paper, Satoshi Nakamoto demonstrated an electronic payment model based
on cryptographic proof instead of a trust. The launch of Bitcoin aimed at
freeing the currency market from the hierarchical power structures by
decentralizing it electronically using a peer-to-peer network. In simple
language, cryptocurrency is a virtual coinage system that functions similar
to money, enabling the users to trade goods and services, free of a central
trusted authority.
Exhibit 1: Asset Class Total Returns Over Last 10 Years
Source: Yahoo Finance
From the humble beginning of $1 in 2011, bitcoin leapfrogged to an all-time
high of $55,863 (Source: Coinbase) this year, delivering a mind-boggling
return of 20037142% in the process, as can be seen from the table above. In
contrast, BSE rose by 210% in absolute terms during the same decade
whereas gold prices delivered a return of only 16%. As a matter of fact,
amongst all the asset classes listed above bitcoin was the best performing
asset of the last decade.
As we progress, with more than 4,000 currencies in circulation, one thing is
clear: Crypto and blockchain technology are not going anywhere, and might
be the way forward.
RESEARCH METHODOLOGY
For any research paper the research methodology forms the base to translate
the data into a relevant conclusion. The nature of research in this paper is

analytical. We have followed an observational method catching currencies at
their prices for a specific period. Our analysis is sampled from the behaviour
at large of the elements of the industry.
For the study, we have primarily used the relevant data that was provided by
international organizations such as Dow Jones Charts, Nasdaq charts and
other government reports of nations across the globe. Other reports in
particular the 'Blockchain Trends 2020' by Deloitte, 'An Analysis of
Cryptocurrency Industry' by University of Pennsylvania and 'Cryptoassets' by
CFA Research Institute have also been analysed in this academic study.
The data analysed of the past ten year's performance has been worked out to
produce a timeline, tables and graphs. The data has helped us understand the
network mechanism of Cryptocurrency and its working through the
Blockchain Technology. It has also served as an instrument to assess the
future course of action for the sustainability of the currency.
The Foundation of Cryptocurrency; Blockchain Technology
The crypto network works on blockchain technology. A blockchain is a
distributed ledger (Exhibit 2) that is completely open to anyone. They have
an interesting property of storing data and once anything is recorded in it, it
becomes very difficult to change it.
Each block contains three things:
1. Data
2. Hash
3. Hash of the previous block
Exhibit 2: A Distributed Ledger (With 3 Blocks)
96 STRIDES - A Students' Journal of Shri Ram College of Commerce, Vol.5, Issue 1 & 2

97
Exhibit 3: Elements In A Block
The data that is stored inside each block largely depends on the type of
blockchain. For instance, the bitcoin blockchain stores the details about the
transactions between the buyer and the seller, number of coins traded, and
other relevant details. The block also contains a hash. The length of hashes is
fixed which makes it impossible for someone to crack it and hack the system.
Hashes are just like are our fingerprints, as they are unique to one-selves, so
are hashes to their blocks. The third element of every block is the 'hash of the
previous block', which is responsible for creating the entire chain of blocks
and the technique makes the blockchain so secure.
How does it work?
The core idea behind all blockchain databases aims at creating a single
distributed ledger that is accessible to everyone. However, this database is
not controlled by any single corporation, government, person, or entity,
unlike the traditional systems. Exhibit 4 shows how the decentralized
database is structured and how values transfer directly on a peer-to-peer
basis, without a trusted central intermediary. In contrast, in the existing
traditional networks, a central authority is present and it validates the printing
and regulation of the currency in circulation.
Cryptocurrency-The Rise of Tokens
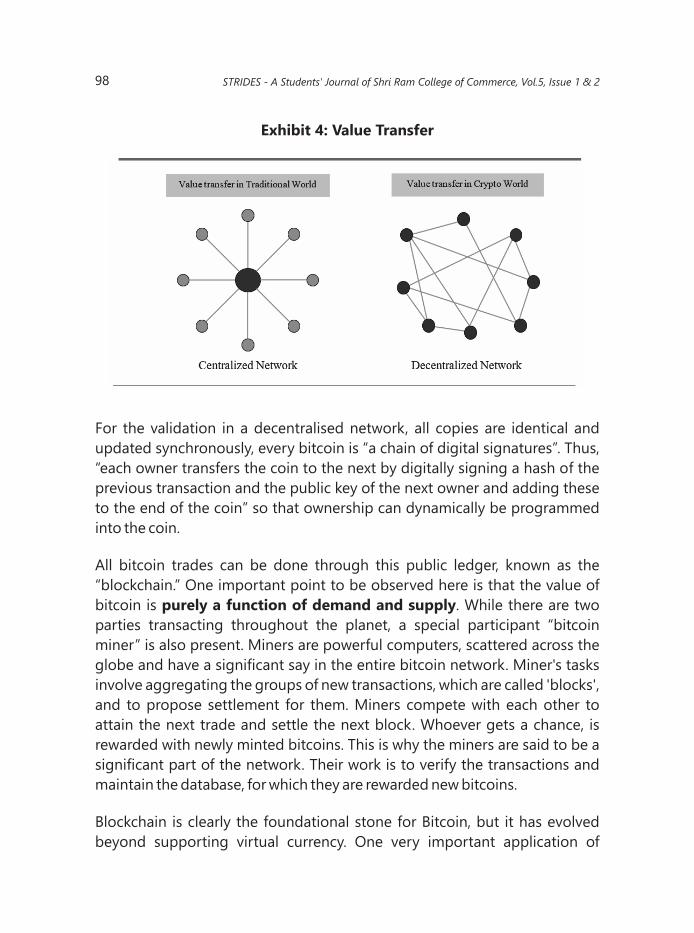
Exhibit 4: Value Transfer
For the validation in a decentralised network, all copies are identical and
updated synchronously, every bitcoin is “a chain of digital signatures”. Thus,
“each owner transfers the coin to the next by digitally signing a hash of the
previous transaction and the public key of the next owner and adding these
to the end of the coin” so that ownership can dynamically be programmed
into the coin.
All bitcoin trades can be done through this public ledger, known as the
“blockchain.” One important point to be observed here is that the value of
bitcoin is purely a function of demand and supply. While there are two
parties transacting throughout the planet, a special participant “bitcoin
miner” is also present. Miners are powerful computers, scattered across the
globe and have a significant say in the entire bitcoin network. Miner's tasks
involve aggregating the groups of new transactions, which are called 'blocks',
and to propose settlement for them. Miners compete with each other to
attain the next trade and settle the next block. Whoever gets a chance, is
rewarded with newly minted bitcoins. This is why the miners are said to be a
significant part of the network. Their work is to verify the transactions and
maintain the database, for which they are rewarded new bitcoins.
Blockchain is clearly the foundational stone for Bitcoin, but it has evolved
beyond supporting virtual currency. One very important application of
98 STRIDES - A Students' Journal of Shri Ram College of Commerce, Vol.5, Issue 1 & 2

Blockchain is smart contracts. A smart contract is a self-executing contract
with the terms of the agreement between buyer and seller being directly
written into lines of code. In simple words, smart contracts are contracts that
are contained in a distributed decentralized blockchain network. They permit
trusted transactions amongst anonymous parties without the need of a
central authority or a legal system. The reason they are important is because
they are digital. With that being said, there comes speed, efficiency and
accuracy. Not only that, but also more trustworthiness, transparency and
security in the transactions that we will be observing in our day-to-day lives.
The Underlying Network Mechanism of Cryptocurrencies:
- Proof-of-Work Network
Proof of work (PoW) is a type of cryptographic zero-knowledge proof. In it,
one party can prove to another party that they are aware of a value without
conveying any more information. Basically, the knowledge of something
possessed in release without releasing any information on the same. Cynthia
Dwork and Moni Naor invented this concept in 1993. It helps in deterring any
denial-of-service-attacks or spams on a network. It became popular through
Bitcoin. It is the first adopted application of the concept. PoW helps
cryptocurrency like bitcoin to be decentralized. It is widely used in
cryptocurrency mining, for validating the transactions and mining of new
tokens. Every bitcoin transaction gets stored in a blockchain. The network
accepts a new block every time the miner comes up with a winning proof-of-
work which is in about every 10 minutes. They need to find the winning PoW
to get a bitcoin for which they need to find matching computations. So, they
basically try to find the matching computation by forming a hash function
which is the winning PoW which will ultimately give them bitcoin.
- Proof-of-Stake Network
Proof-of-Stake (PoS) mechanism is an alternative to POW mechanism. In
this a person mines or validates transactions on the basis of how many coins
they already hold. Hence, in order to verify a transaction and receive the coin
reward, a miner must own some coin himself. The mining power is given on
the basis of the percentage of coins held. Hence, there are very little energy
costs in this transaction. PoS systems face the challenge of how to initially
99Cryptocurrency-The Rise of Tokens

distribute the coin. Whereas in PoW the coins are distributed to the miners
who add value to the network. It is more energy efficient as compared to
proof-of-work.
- Hybrid POW/POS Network
A hybrid consensus basically starts with having PoW miners to create new
blocks containing transactions to be added to the blockchain. After these
blocks are created, PoS miners decide whether to confirm them or not. PoS
miners need to purchase votes by staking a portion of their tokens. But the
total vote count is not examined. The hybrid PoW/PoS randomly chooses 5
'votes' to determine the efficacy of the newly created block; if 3 of the 5
chosen votes are affirmative, the block is added to the blockchain. In
exchange for these services, PoW miners receive 60% of the block reward,
PoS miners receive 30%, and the remaining 10% is dedicated to
developmental efforts. It brings the security of PoW and the energy efficiency
of PoS together.
- Byzantine Consensus Network
A Byzantine fault is a condition of a computer system where components may
fail. Also, there is imperfect information on whether a component has failed.
The term basically takes its name from an allegory, the "Byzantine Generals
Problem''. It was developed to describe a situation in which, to avoid failure of
the system, the system's actors must agree on a concerted strategy, but some
of these actors are unreliable. The server appears both failed and functioning.
Basically, a consensus needs to be reached in order to decide that.
Milestones of Cryptocurrency & Bitcoin (2008-2020)
2008
The journey of cryptocurrency started with the publishing of a paper titled
'Bitcoin: A Peer-to-Peer Electronic Cash System' by a developer by the name
of Satoshi Nakamoto. The paper explained applications of a peer-to-peer
network to generate a system for electronic transactions.
100 STRIDES - A Students' Journal of Shri Ram College of Commerce, Vol.5, Issue 1 & 2

2009
Satoshi Nakamoto mined the genesis block of bitcoin (block number 0). It
had a reward of 50 bitcoins. That is how the network of bitcoin came into
existence. It is estimated that around 1 million bitcoins were mined in the
early days. Two pizzas of Papa John's were exchanged with 10,000 coins.
Before these bitcoins were only mined and never traded; so, this was the first
time a cash value was attached to a cryptocurrency.
2010
A problem, in the sense of transactions not being properly verified before
including in the transaction log or blockchain, were detected. This enabled
users to bypass bitcoin's economic restrictions and create an indefinite
number of bitcoins. Exploiting the vulnerability, over 184 billion bitcoins were
generated in a transaction, and sent to two addresses on the network. Within
hours, the transaction was spotted and erased from the transaction log after
the bug was fixed and the network forked to an updated version of the bitcoin
protocol. This was the only major security flaw found and exploited in
bitcoin's history.
2011
Bitcoin gained traction this year and was also caught up in a controversy of
being used for buying guns and drugs among other things. Litecoin, was
launched in the fall of Bitcoin, and gained modest success due to its modified
protocol, improving the idea of day-to-day transactions. Namecoin was also
launched this year, and like bitcoin, it also has a limit of 21 million coins to be
traded.
2012
This year saw a lot of fluctuations in the price of Bitcoin. Following a decline of
94% in the year 2011 (falling to $2), the prices began to rise and rose to $7.20
in early January. The Bitcoin Foundation was launched in September, for
“accelerating the global growth of bitcoin through standardisation,
protection and promotion of the open-source protocol.” In August, peercoin
emerged as another cryptocurrency, which uses a hybrid of PoW technology
101Cryptocurrency-The Rise of Tokens
(used by Bitcoin) and PoS (used by Litecoin) for employing the network
security mechanism. It was the first cryptocurrency to use such a hybrid
model.
2013
Cryptocurrency gained a lot of momentum in 2013. A total of 5
cryptocurrencies were launched this year, the list comprising Dogecoin,
Gridcoin, Primecoin, Ripple and Nxt. While Dogecoin was introduced on the
famous Doge internet meme, Ripple (XRP) introduced a wholly unique
model, which was not based on bitcoin. Year 2013 was also named as the
“Year of Bitcoin”. The price of Bitcoin hit great highs at this time. A major
reason for such a spike was the Cyprus Banking Crisis. This year bitcoin made
headlines by reaching $1242 per coin where gold came to $1240 per ounce.
This period also saw cryptocurrency exchanges mushroom in India, the list
comprising companies like Zebpay, Unocoin, Koinex, Pocket Bits and
Coinsecure. The month of October saw the launch of the world's first bitcoin
ATM in Vancouver, BC, Canada. In December, RBI released two press
statements disregarding cryptocurrencies; saying that they are not backed by
a central bank and their value isn't underpinned by any asset.
2014
The competition in the cryptocurrency industry evolved since the inception
of Bitcoin in 2009 and users saw nine cryptocurrencies being launched this
year. Some of these were Dash, Stellar, Titcoin among others. 2014 saw scams
and thefts in cryptocurrencies. Mt. Gox, one of the largest exchanges of
cryptocurrencies went offline and filed for bankruptcy. Bitcoins worth $460
million were stolen or hacked. This was a messy year as people lost their coins
and the exchange halted withdrawals for further investigations. Most reports
concluded that the coins were directly stolen from the company wallet.
2015
This year saw the launch of the Ethereum network - that brought the concept
of smart contracts to the cryptocurrency world. Ethereum was proposed by
Vitalik Buterin, a programmer, and went live in July, with an initial supply of 72
million coins. It is said to have its own programming language running on a
102 STRIDES - A Students' Journal of Shri Ram College of Commerce, Vol.5, Issue 1 & 2
blockchain, thereby empowering developers for running and building
distributed applications. Ether had two-folded uses; traded as a digital
currency like others, and also used in the Ethereum network for running
applications. Another currency, launched in 2015, attaining a lot of traction
was Tether. Tether claimed to have been backed by US Dollars at a 1 to 1 ratio.
Due to this very reason, Tether was said to be stablecoin (value pegged by US
Dollars, a fiat currency) and the most controversial cryptocurrency as well.
Later in the year 2019, after various investigations, the claims made by Tether
Limited (founding company of cryptocurrency; Tether) were false. They were
only using these for manipulating the prices of Bitcoin.
2016
Year 2016 saw the launch of Zcash, the first to develop an open and
permissionless financial system, with zero knowledge security. Zcash also
aimed at providing enhanced privacy to its users. Apart from the launch of
Zcash, the year 2016 saw two important announcements:
The cabinet of Japan, recognized virtual currencies as legal, and claimed them
to be somewhat similar to the real currency. Bitfinex, a major bitcoin
exchange, got hacked and around 120,000 BTC ($60M) were stolen.
2017
With people increasingly getting familiar with the concept, the number of
enterprises accepting bitcoins continued to increase. Bitcoins gained
legitimacy among the lawmakers and financial companies. The year 2017 was
the turning point for bitcoin, as their prices went above $10,000. Bitcoin Cash
was also launched, splitting bitcoin into two derivatives - Bitcoin (BTC) and
Bitcoin Cash (BCH). Another important observation was the launch of the
Bitcoin futures contract by CME, the world's largest future exchange. Despite
the prices of cryptocurrencies being at their all-time highs, the Indian
government with the RBI compared them to ponzi schemes. A committee
was also established for studying issues revolving around cryptocurrencies
and to propose actions.
103Cryptocurrency-The Rise of Tokens

2018
With an increase in investment in the crypto-market, some professional
investors and amateur traders predicted a further rise in its price in the
coming years. However, in the month of January & February bitcoin's price
dropped by 65%. The line graph displays the drop:
While this dip was a matter of concern for a few, others saw this as a healthy
point of entering in the market, as they were getting 40-45% discounts.
2019
The past year proved to be nothing but a roller-coaster ride for the
cryptocurrency market. From the major hacks to an exchange floor crash,
some coins saw a surge in value while others floundered. The value of bitcoin
spiked in value, on the news, when Facebook and other organisations were
planning to launch their own cryptocurrencies. Alongside these
developments, a lot of financial institutions, technology firms and other
organisations, started accepting and acknowledging Bitcoin's value and
potential.
104
0
10000
20000
30000
40000
50000
60000
(in
$)
The 2018 Crypto Bubble
STRIDES - A Students' Journal of Shri Ram College of Commerce, Vol.5, Issue 1 & 2
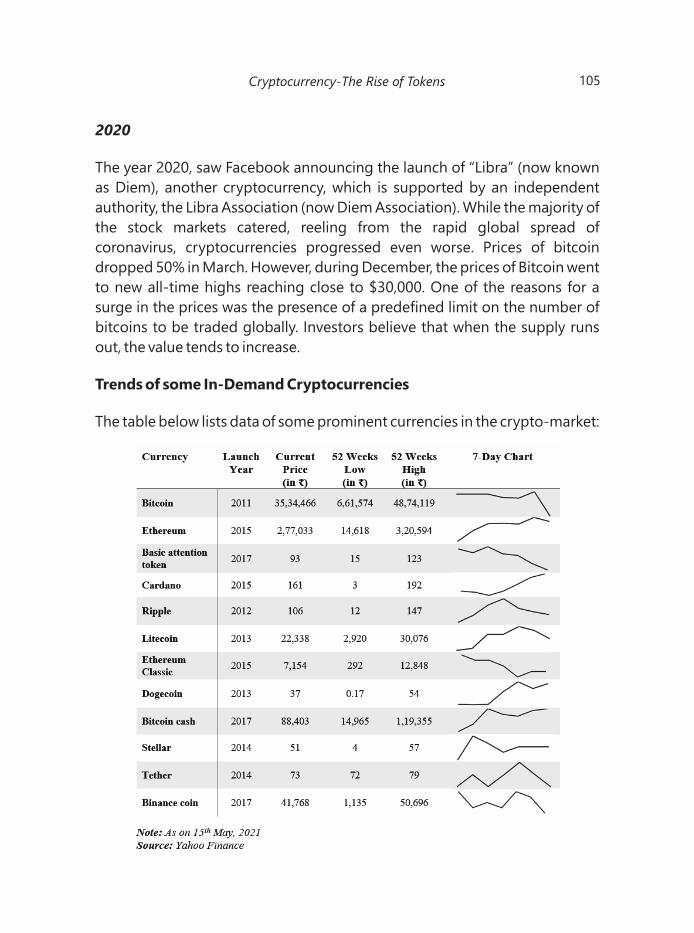
2020
The year 2020, saw Facebook announcing the launch of “Libra” (now known
as Diem), another cryptocurrency, which is supported by an independent
authority, the Libra Association (now Diem Association). While the majority of
the stock markets catered, reeling from the rapid global spread of
coronavirus, cryptocurrencies progressed even worse. Prices of bitcoin
dropped 50% in March. However, during December, the prices of Bitcoin went
to new all-time highs reaching close to $30,000. One of the reasons for a
surge in the prices was the presence of a predefined limit on the number of
bitcoins to be traded globally. Investors believe that when the supply runs
out, the value tends to increase.
Trends of some In-Demand Cryptocurrencies
The table below lists data of some prominent currencies in the crypto-market:
105Cryptocurrency-The Rise of Tokens
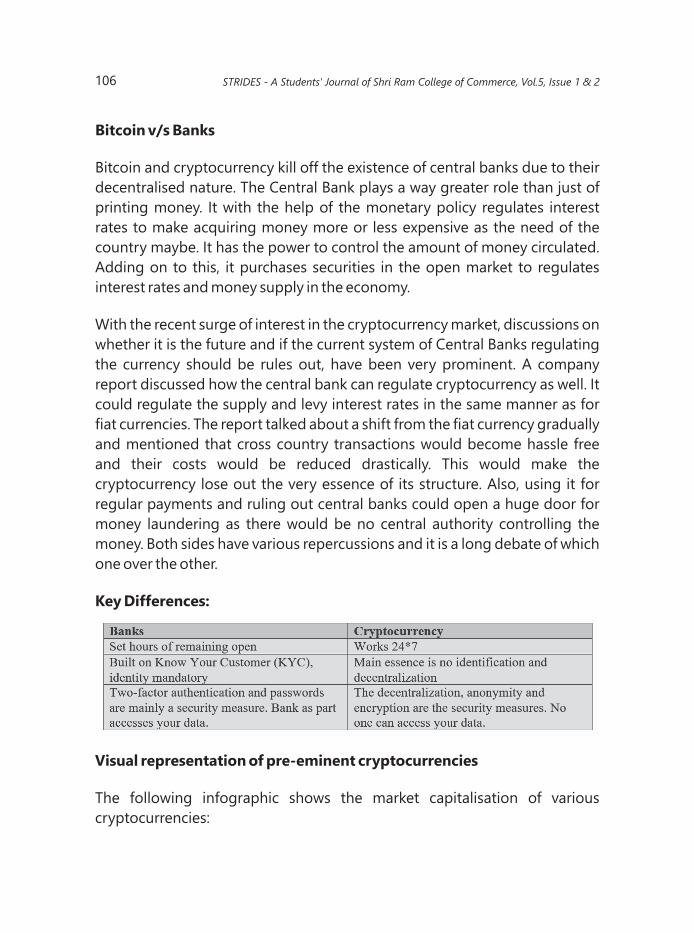
Bitcoin v/s Banks
Bitcoin and cryptocurrency kill off the existence of central banks due to their
decentralised nature. The Central Bank plays a way greater role than just of
printing money. It with the help of the monetary policy regulates interest
rates to make acquiring money more or less expensive as the need of the
country maybe. It has the power to control the amount of money circulated.
Adding on to this, it purchases securities in the open market to regulates
interest rates and money supply in the economy.
With the recent surge of interest in the cryptocurrency market, discussions on
whether it is the future and if the current system of Central Banks regulating
the currency should be rules out, have been very prominent. A company
report discussed how the central bank can regulate cryptocurrency as well. It
could regulate the supply and levy interest rates in the same manner as for
fiat currencies. The report talked about a shift from the fiat currency gradually
and mentioned that cross country transactions would become hassle free
and their costs would be reduced drastically. This would make the
cryptocurrency lose out the very essence of its structure. Also, using it for
regular payments and ruling out central banks could open a huge door for
money laundering as there would be no central authority controlling the
money. Both sides have various repercussions and it is a long debate of which
one over the other.
Key Differences:
Visual representation of pre-eminent cryptocurrencies
The following infographic shows the market capitalisation of various
cryptocurrencies:
106 STRIDES - A Students' Journal of Shri Ram College of Commerce, Vol.5, Issue 1 & 2

Note: Values as on 15 May 2021
Source: Yahoo Finance
- Countrywise Bitcoin Value (in $)
Demonstrated below is the bitcoin investment of various countries:
107Cryptocurrency-The Rise of Tokens
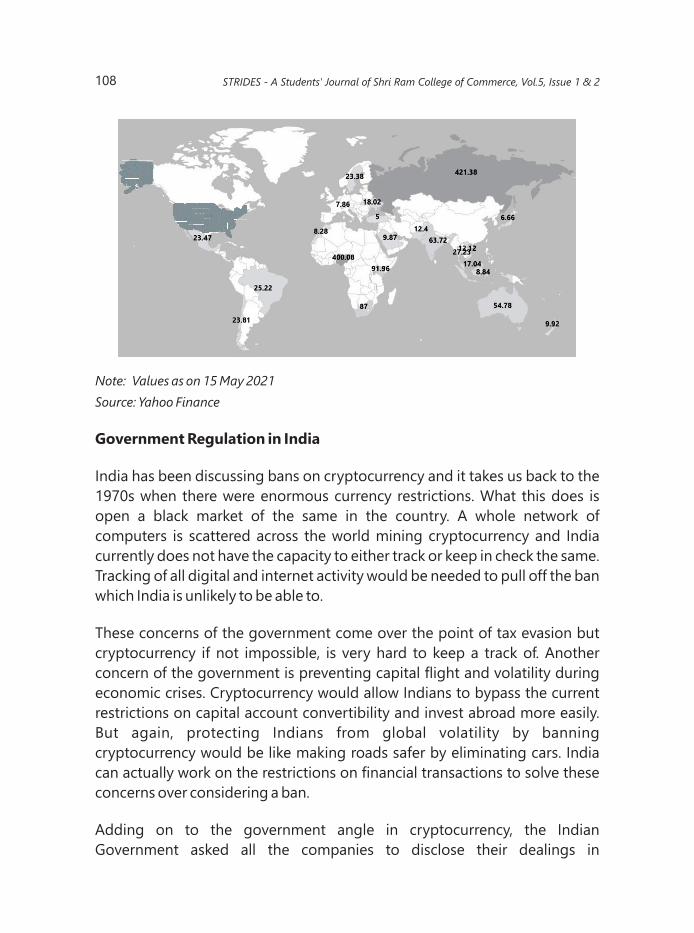
Note: Values as on 15 May 2021
Source: Yahoo Finance
Government Regulation in India
India has been discussing bans on cryptocurrency and it takes us back to the
1970s when there were enormous currency restrictions. What this does is
open a black market of the same in the country. A whole network of
computers is scattered across the world mining cryptocurrency and India
currently does not have the capacity to either track or keep in check the same.
Tracking of all digital and internet activity would be needed to pull off the ban
which India is unlikely to be able to.
These concerns of the government come over the point of tax evasion but
cryptocurrency if not impossible, is very hard to keep a track of. Another
concern of the government is preventing capital flight and volatility during
economic crises. Cryptocurrency would allow Indians to bypass the current
restrictions on capital account convertibility and invest abroad more easily.
But again, protecting Indians from global volatility by banning
cryptocurrency would be like making roads safer by eliminating cars. India
can actually work on the restrictions on financial transactions to solve these
concerns over considering a ban.
Adding on to the government angle in cryptocurrency, the Indian
Government asked all the companies to disclose their dealings in
108
1523.6
.6.6.6.6.6.6.6.6.6.6.6.6.6.6.6.6.6.615215215215215233333.6.6.6.6.6.615215233333.6.6.6.6.6
STRIDES - A Students' Journal of Shri Ram College of Commerce, Vol.5, Issue 1 & 2
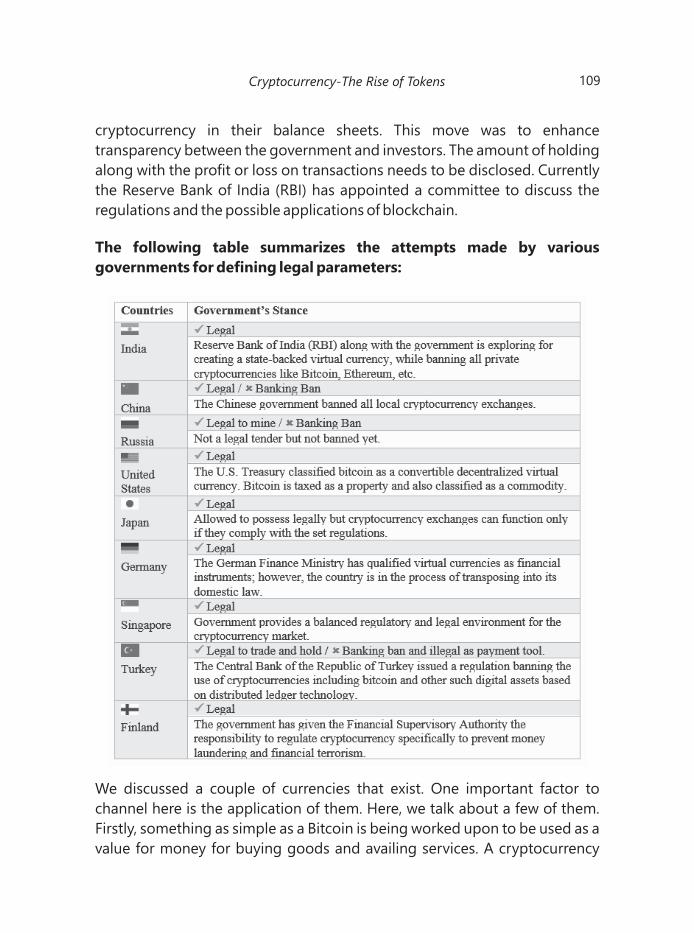
cryptocurrency in their balance sheets. This move was to enhance
transparency between the government and investors. The amount of holding
along with the profit or loss on transactions needs to be disclosed. Currently
the Reserve Bank of India (RBI) has appointed a committee to discuss the
regulations and the possible applications of blockchain.
The following table summarizes the attempts made by various
governments for defining legal parameters:
We discussed a couple of currencies that exist. One important factor to
channel here is the application of them. Here, we talk about a few of them.
Firstly, something as simple as a Bitcoin is being worked upon to be used as a
value for money for buying goods and availing services. A cryptocurrency
109Cryptocurrency-The Rise of Tokens
Dash functions faster than Bitcoin. A currency Cardano is being developed to
allow sending and receiving funds for minimal fees and instantly. BitTorrent is
developed on the lines of enabling payments. On the other hand, Ripple can
be used for asset exchanges, remittances and such other applications of the
financial world. The network of Matic provides a user interface for payments
to be instantly made in cryptocurrency. Ethereum is a public ledger used for
verifying and recording transactions. It works on the blockchain technology
therefore supporting decentralization and enhancing security.
Primarily, these currencies are being worked upon to have an actual
application in our regular walks of life. Ways are being worked upon to use
them in contracts, networks and so on and so forth.
What is important to understand here is, the blockchain industry is trying to
modernize our ways of finance, it is looking for loopholes in the security of
transactions and their privacy and trying to come up with solutions to them.
This is what the whole stigma around cryptocurrencies is.
This new development has come a long way, yet has a long one to go.
Countries like India are now adapting to online payments but a huge
population of the country does not have a smartphone let alone being
comfortable with online payments. For a traditional mindset like here, these
developments still have a far road to travel.
FACTORS TO BE INCORPORATED WHILE DISCUSSING THE
INDUSTRY
One of the major factors to consider is the custody of assets in the market.
Every block has a private key but if you lose it, your data is lost forever. The two
basic ways are storing it either online in your database or offline on a paper.
Online storage might be riskier as data breaches are commonly heard of.
Another approach is to purchase a dedicated hardware “wallet,” such as a
Ledger or a Trezor, which uses hardware chip design to create an offline-like
experience. In fact, most retail investors use investing apps which provide all-
in-one brokerage services for buying and selling crypto assets and store
them for users, often in a setting that is partially online and partially offline.
STRIDES - A Students' Journal of Shri Ram College of Commerce, Vol.5, Issue 1 & 2110

111
TAX IMPLICATIONS IN INDIA
One very important of aspect of the cryptocurrency saga here in India is its
taxation. There are many discussions on ways to tax it. So, if you are an
investor, it could be taxed under short-term or long-term capital gain
depending upon your period of holding. If you are a trader, it can be taxed
under the head profits and gains from business and profession. And if you are
someone who is into the process of mining bitcoins, you will not be taxed at
all. If not these, cryptocurrency could also be declared as a digital asset and
taxed in that conventional manner.
CONCLUSION
The cryptocurrency market has been growing with increased volumes of
trading in the past months. But it is prone to multiple risk factors which are yet
to be worked out. The foremost highlight of these currencies are their
extreme volatility and instability which differ them from conventional asset
classes and also makes it a risky investment. Like all rich investors say, “Invest
only that amount of money which you are ready to lose.”
To further the impact of volatility another thing that can be drawn out is high
and uncertain returns. Currencies have risen as high as 70 lakhs from 35 lakhs
and have fallen back to 30 lakhs. That is the amount of uncertainty of returns
which makes it difficult to be currently adopted as a means of payment.
Having spoken of the two major highlights, one thing that is going to be
inevitable is the incoming importance of the blockchain technology
irrespective of whether cryptocurrencies adapted or not. Coming to the
legalisation and government angle, a decision is yet to be taken. There are
discussions and deliberations on the topic both against and in favour which
gives us a light at the end of the tunnel.
Coming from 2008 when we talked whether or not the technology would
work, we are finally at a point where the mindset has changed to, “How can
we make the technology work for us?”
Cryptocurrency-The Rise of Tokens
REFERENCES
Ryan Farell. 2015, “An Analysis of the Cryptocurrency Industry”
Matt, David. 2020, “Cryptoassets the Guide to Bitcoin, Blockchain and
cryptocurrency for investment professionals”
Jim et al, 2015, “State-sponsored cryptocurrency: Adopting the best of
Bitcoin's Innovation to Payment Ecosystem”
Shaktikanta Das. 2021, “RBI has major concerns on cryptocurrencies, flagged
it to govt” Available at: https://economictimes.indiatimes.com/
news/economy/policy/rbi-has-major-concerns-on-cryptocurrencies-
flagged-it-to-govt-shaktikanta-das/articleshow/81686997.cms
Jake Frankenfield. 2021, “Proof of Work (PoW)” Available at:
https://www.investopedia.com/terms/p/proof-work.asp
Wikipedia. 2021, Available at: https://en.wikipedia.org/wiki/
Proof_of_work#:~:text=Proof%20of%20work%20(PoW)%20is,minimal%20e
ffort%20on%20their%20part
Alyssa Hertig. 2020, “What Is Proof-of-Work?”Available at:
https://www.coindesk.com/what-is-proof-of-work
Jake Frankenfield. 2021, “Proof of Stake (PoS)”
Available at: https://www.investopedia.com/terms/p/proof-stake-pos.asp
Alyssa Hertig. 2020, “What Is Proof-of-Stake?”
Available at: https://www.coindesk.com/proof-of-stake
Toshendra Kumar Sharma. 2020, “A Brief Introduction To Hybrid Pow+Pos
Consensus Mechanism” Available at: https://www.blockchain-
council.org/blockchain/a-brief-introduction-to-hybrid-powpos-consensus-
mechanism/
112 STRIDES - A Students' Journal of Shri Ram College of Commerce, Vol.5, Issue 1 & 2
Timothy B. Lee. 2013, “An Illustrated History Of Bitcoin Crashes” Available at:
An-illustrated-history-of-bitcoin-crashes
Raynor De Best. 2021, “Bitcoin (BTC) price history from 2013 to May 17, 2021”
Available at: https://www.statista.com/statistics/326707/bitcoin-price-
index/.
W ik iped i a . 2021 . Ava i l ab l e a t : h t tp s : / / en .w i k iped i a .o rg /
wiki/Cryptocurrency_bubble.
Wikipedia. 2021. Available at: https://en.wikipedia.org/wiki/
History_of_bitcoin#:~:text=On%203%20January%202009%2C%20the,this%
20block%20was%20the%20text%3A&text=The%20first%20open%20sourc
e%20bitcoin,January%202009%2C%20hosted%20at%20SourceForge
Abhinav Kaul. 2021, “Bitcoin first hit $1 level 10 years ago, it has surged
48,22,525% since then” Available at: https://www.livemint.com/market/
cryptocurrency/bitcoin-first-hit-1-level-10-years-ago-it-has-surged-48-22-
525-since-then-11613021790751.html
2021. “Government makes first move to regulate Bitcoin, asks companies to
d i s c l o s e a l l c r y p t o c u r r e n c y d e a l i n g s ” A v a i l a b l e a t :
https://www.indiatoday.in/technology/news/story/government-makes-
first-move-to-regulate-bitcoin-asks-companies-to-disclose-all-
cryptocurrency-dealings-1783821-2021-03-26.
Shruti Rajagopalan. 2021, “View: India bitcoin ban would be a terrible idea”
A v a i l a b l e a t : h t t p s : / / e c o n o m i c t i m e s . i n d i a t i m e s . c o m /
markets/stocks/news/view-india-bitcoin-ban-would-be-a-terrible-
idea/articleshow/81580332.cms
Charlie Bilello. 2019, “Diversification & US Dominance with Charlie Bilello”
Available at: https://get.ycharts.com/diversification-us-dominance-with-
charlie-bilello/.
Kayla Matthews. 2019, “5 Financial Problems Cryptocurrency Could Solve”
Available at: https://www.etftrends.com/5-financial-problems-
cryptocurrency-could-solve/.
113Cryptocurrency-The Rise of Tokens
Ammar. 2019, “What problems do cryptocurrencies solve? Here's Six”
Available at: https://medium.com/the-capital/what-problems-do-
cryptocurrencies-solve-heres-six-5470ef0dd278.
Amitava Chakrabarty. 2020, “Cryptocurrency Dilemma: How to show crypto
earnings in ITR?” Available at: https://www.financialexpress.com/
money/income-tax/cryptocurrency-dilemma-how-to-show-crypto-
earnings-in-itr/2149744/.
Jon Matonis. 2012, “Bitcoin Foundation Launches To Drive Bitcoin's
Advancement” Ava i lab le at : ht tps : //www.forbes .com/s i tes/
jonmatonis/2012/09/27/bitcoin-foundation-launches-to-drive-bitcoins-
advancement/#3fbfe7d1d868
Alex Lashkov. 2018 “'2013 Vs 2018': The Top 10 Cryptocurrencies Five Years
Ago And Today” Available at: https://medium.com/hackernoon/2013-vs-
2018-the-top-10-cr yptocurrencies-f ive-years-ago-and-today-
8ef474aa18b8.
Raynor de Best. 2021. “Bitcoin trading volume on online exchanges in various
countries worldwide in 2020” Available at: https://www.statista.com/
statistics/1195753/bitcoin-trading-selected-countries/
Dan Murphy. 2017, “Bitcoin could hit $60,000 in 2018 but another crash is
c o m i n g , s a y s s t a r t u p e x e c ” A v a i l a b l e a t :
https://www.cnbc.com/2017/12/26/bitcoin-price-in-2018-could-hit-
60000-but-another-crash-is-coming.html.
Tom Wilson. Anna Irrera. 2020, “Analysis: Another Bitcoin bubble? This time
it's different, backers up” Available at:
https://www.reuters.com/ar ticle/us-crypto-currencies-analysis-
idUSKBN27Y2L1.
h t t p s : / / w w w . f o r b e s . c o m / s i t e s /
francescoppola/2018/03/20/bitcoins-bubble-is-bursting-how-low-will-
prices-fall/?sh=46c7075e724e
Frances Coppola. 2018, “Bitcoin's Bubble is Bursting. How low Will Prices
F a l l ? ” A v a i l a b l e a t :
.
114 STRIDES - A Students' Journal of Shri Ram College of Commerce, Vol.5, Issue 1 & 2

115
Population Trends in
India: Demographic
Dividend or
Demographic Drag?
Being the world's second-most populous country,
India's rapidly rising population is certainly a
unique feature for the country. India's economic
growth story is also of importance as it is a
developing nation and one of the fastest-growing
economies. While some argue that the rising
population is a menace for economic growth in
India due to the decline in capital per worker, this
paper aims to analyse how a growing population
can have a positive impact on the nation's
economic growth. To facilitate this objective, the
paper focuses on the demographic transition
experienced by India and the various aspects
through which the country can reap its
demographic dividend. However, there exist
certain obstacles that may convert the
demographic dividend into demographic drag,
making population growth a burden over the
economy. The paper also takes into account
experiences from across the globe in the form of
empirical evidence and studies various policy
implementations necessary to take advantage of
the demographic dividend.
Nirikta Mukherjee
B.A. (Hons.) Economics
SRCC, DU
Mentor:
Dr. Ravi Kant
Assistant Professor
Department of Economics
SRCC, DU
ABSTRACT
116 STRIDES - A Students' Journal of Shri Ram College of Commerce, Vol.5, Issue 1 & 2
Keywords: Demographic Dividend, Demographic Drag, Demographic
Transition, Economic Growth, Population Growth
INTRODUCTION
In the 1990s, several scholars and researchers used the empirical
convergence models à la Barro to isolate the effect of demography on
economic growth (Kelley and Schmidt 1995; Bloom and Williamson 1997,
1998). The major finding of these studies stated that there remains a strong
and positive effect of demography on economic growth when the working-
age population grows faster than the dependent population of a nation
(Sanchez- Romero et al 2017). However, with time, the importance of
demography was clearly stated in terms of the fact that changes in the age
distribution affect the productivity of workers in the nation (Kelley and
Schmidt 2005). Apart from this, the absolute importance of demography is
three-fold. Firstly, it acts as a 'predictive tool' and ensures powerful insights
about future trends. Secondly, it also helps scholars and policymakers to
estimate future challenges that may be faced by a nation. Thirdly and most
importantly, demographic changes provide conditions conducive to
economic development, providing nations the opportunity to embark on the
journey of rapid economic growth (Singh & Paliwal 2015).
Against this backdrop, it becomes pertinent to study the case of Indian
demographics in relation to its economics, considering India is the second
most populated country in the world. An analysis of its population and age
structure becomes imperative as 'population' can be that factor in India,
which can be flipped from a burden to a boon.
Before focusing on the case of India, it is necessary to understand the
economic rationale behind the process of demographic transition and
demographic dividend, which has been elaborated upon in section 2. Section
3 focuses on the implications for growth in the case of a demographic
dividend and section 4 supports the theoretical analysis with empirical
evidence of cases from across the globe. The next section has been dedicated
to the Indian case of demographic transition, followed by policy
prescriptions. Finally, section 7 concludes the paper.

Population Trends in India: Demographic Dividend or Demographic Drag? 117
LITERATURE REVIEW
The discussion dates back to the time of the Marx-Malthus debate, wherein
Marx and Engel undertook an onslaught of the Malthusian theory, which
stated that population growth was the reason behind mass poverty and
hunger. Marx and Engel's problem with the theory was that they considered it
to be 'ahistorical'. Marx accused Malthus of using the “external laws of Nature
to explain the problem of overpopulation, rather than the historical laws of
capitalist production” (Wiltgen 1998). Thus, according to Marx, the reason
behind mass poverty and hunger was capitalism rather than population
growth. Marx argued that in a well-ordered society, a rise in population
growth would lead to greater wealth rather than misery.
This discourse has given rise to two sides of the coin based on the stance
around the impact of population growth on economic growth. While citing
Cassen's 1994 work, Desai observes that on one hand, the 'population
pessimists' believe that rapid population growth poses a threat to economic
growth and development by reducing the capital per worker and dampening
productivity. There are two broad reasons due to which population might be
an obstacle for the economy (Desai 2010). Firstly, low levels of per capita
income and scarce resources thinly spread across a large number of people
make population growth a constraint for economic growth and the
improvement of living standards. The concise response to an increase in
population growth is that “every mouth to be fed has two hands that can be
put to work.” The second reason stems from this and it can be stated that the
problem of development is considered to be the challenge of “employing
more workers in more productive work to yield larger surplus without
depriving people of the basket of goods that they currently consume”
(Chandrasekhar, Ghosh & Roychowdhury 2006).
On the other hand, “population optimists” and scholars like Kelley & Schmidt
(1996) and Johnson & Lee (1986) believe that population growth can be a
boon as a rapidly growing population can increase human and intellectual
capital and facilitate the expansion of markets, leading to rapid economic
growth. However, Desai throws light on the recent third approach wherein the
population composition is more important than the population size of a
country. This approach pertains to the theory of demographic dividend and
118
the ability of a nation to reap its benefits (Desai 2010).
- Demographic Dividend
Also known as demographic gift or bonus or demographic window, the
demographic dividend is the rise in the economic growth rate due to the
rising share of working-age people in a nation's population (James 2008). In
other words, a 'bulge' in the working-age population, irrespective of the size
of the total population, is an “inevitable advantage” called the demographic
dividend, making age structure matter more than the size of population
(Chandrasekhar, Ghosh & Roychowdhury 2006). However,
Changes in the age structure of the population of a nation lead to a period of
demographic dividend, by impacting the dependency ratio of a population.
Dependency ratio is defined by the United Nations as “the number of children
(0-14 years old) and older persons (65 years or over) to the working-age
population (15-64 years old)” (United Nations 2006). Thus, in a nation with a
large young population and/or a large old population, the dependency ratio
will be high and vice versa. This demographic window emerges for a nation
due to a demographic transition.
- Demographic Transition
Demographic transition is “a population's shift from high mortality and high
fertility to low mortality and low fertility” (Blue & Espenshade 2011). The
scholars state that a consequence of this is robust population growth. This
feature of the demographic transition can be explained by the fact that death
rates fall before a decline in birth rates set in (Chandrasekhar, Ghosh &
Roychowdhury 2006). The authors, in their paper, explain in detail the reason
behind this pattern of birth rates and death rates.
Initially, death rates decline due to lower infant and child mortality rates
which is a result of better policy interventions pertaining to public health,
water and sanitation and medical health interventions related to vaccination
and antibiotics. High levels of knowledge and low costs facilitate these
if the growth rate
of the working-age population is slower than that of the total population, the
demographic dividend turns into demographic drag or burden. This happens
due to a lower share of the working-age population (Gaag & Beer).
STRIDES - A Students' Journal of Shri Ram College of Commerce, Vol.5, Issue 1 & 2
119
factors to be taken advantage of at even low levels of per capita income in a
country (Bloom & Canning 2004). With time, a reduced dependency ratio in
the middle and older age groups causes the death rate to fall further and the
average life expectancy increases. This reduction in the dependency ratio can
be attributed to an increase in income, improved lifestyles and better medical
technology. On the other hand, reduction in birth rates depends on two
factors- age of marriage and fertility rate, both of which depend on a level of
development. While high levels of development translate into no social
norms prescribing early marriage for women, fertility rates decline due to
higher child survival rates, better female education levels and labour market
opportunities, reducing the desired family size. Further, the authors stated
that the relationship between birth rates and death rates and development
not only impacts the rate of population growth but also the age structure of
the population (Chandrasekhar, Ghosh & Roychowdhury 2006).
Demographic transition consists of three phases that give rise to three
unique age structures. The first phase is characterized by high fertility rates
and declining child mortality rates. This leads to a larger young population,
particularly below 15 years of age, causing the dependency ratio to rise
(James 2008). Apart from lower child mortality rates, child survival increases,
causing a baby boom (Chandrasekhar, Ghosh & Roychowdhury 2006).
The second phase experiences a rapid decline in the fertility rates, causing the
child population to fall. However, due to high fertility in the past (during the
first phase of the transition), the working-age population continues to
increase with a high growth rate (James 2008). The lagged fall in fertility rate
reverses the baby boom, causing a 'bulge' in the younger age group. This
results in the working-age group rising more than it was previously or
subsequently will be (Chandrasekhar, Ghosh & Roychowdhury 2006). As a
result of this, the dependency ratio of the nation falls as the population
consists of more working people than non-working or 'dependents'.
Gradually with time, the bulge created by the baby boom climbs up the age
structure. Finally, the bulge enters the old age bracket and the third phase is
characterised by a high dependency ratio due to a large old-age population
(James 2008).
Population Trends in India: Demographic Dividend or Demographic Drag?

120
It is important to note that it is the second phase wherein the demographic
dividend can be exploited. This is because, during this phase, the proportion
of the working-age population is the highest in the total population
(Chandrasekhar, Ghosh & Roychowdhury 2006).
WINDOW OF OPPORTUNITY
Scholars and economists agree on the fact that there is no element of
'automacity' or surety, empirically or theoretically, of the benefits of
demographic dividend being exploited to achieve economic growth (James
2008; Chandrasekhar, Ghosh & Roychowdhury 2006; Bloom & Canning
2004). Bloom & Canning (2004) state that the transition in the age structure
merely creates the “potential for economic growth” and whether it is taken
advantage of or not, depends on the “policy environment” of the nation. The
failure to provide conducive conditions for a nation to reap the benefits of its
demographic dividend may lead to a demographic drag. A classic example of
this is the case of East Asian economies in comparison to the Latin American
economy. While a third of the “miracle growth” of the East Asian economies
has been observed to stem from their demographic transition, the Latin
American case experienced no such growth in the 1950s till the 1980s, even
though its demographic trends were similar to that of East Asia. Thus, it
becomes imperative to analyse the implications for growth arising from the
transition as well as the practical component of realising the benefits of the
demographic dividend.
Chandrasekhar, Ghosh & Roychowdhury (2006) analyse the challenge of
demography from the angle of generating surpluses over consumption,
needed for investment. Due to this approach, the scholars state that the
dependency ratio influences the surplus available for investment after
current consumption as what is produced by the currently employed is partly
consumed by those outside the workforce. Thus, other things remaining
constant, a fall in the dependency ratio indicates a higher surplus in the
economy. Focusing on the implications for growth, the authors state that the
periods with a low dependency ratio are characterized by higher growth,
provided the inducement to invest surplus exists. Conversely, in the case of
fewer workers in the economy, it is noted that unless the productivity increase
raises the output of the smaller proportion of workers enough to neutralise
STRIDES - A Students' Journal of Shri Ram College of Commerce, Vol.5, Issue 1 & 2

121
demographic deficit, economic growth cannot be achieved (Chandrasekhar,
Ghosh & Roychowdhury 2006).
This lack of certainty and the conditions around realising the benefits of the
demographic bonus nudges one to examine how demographic changes spur
economic growth.
- Demographic Changes and Economic Growth
The first aspect to ignite economic growth is that of increased savings. Due to
a lower dependency ratio associated with the demographic dividend and
partly due to a rise in life expectancy savings of a nation tend to increase
(James 2008). A fall in the nation's dependency ratio is associated with a rise in
the average savings rate because people save the most when they are
working, whereas children and older people (who are the dependents in the
dependency ratio) consume more than they earn or rather only consume
(Singh & Paliwal 2015). Increased savings at the household level will translate
into higher savings for the economy leading to an increase in investment, an
aspect imperative to economic growth.
Secondly, with a fall in fertility rates, women are more likely to enter the
labour market during this stage, leading to an increase in economic activity,
facilitating economic growth. Scholars mention that the reason behind this is
that the major obstacle faced by women in joining the workforce was high
fertility and consequently, the high amount of time spent in childcare (James
2008).
Thirdly, at the micro-level, people invest more in their own health when they
have fewer children as the cost of child-rearing (in terms of the need for the
child to be clothed, fed, provided healthcare services, educated and taken
care of) falls. This leads to a rise in worker productivity due to better health
conditions of the workers, enabling economic benefits for the household. On
a similar dimension, at the macro-level, the government can spend more on
productive activities because, with a fall in the number of children, public
spending on education and health can be diverted by the government to
more productive services that promote economic growth (James 2008).
Population Trends in India: Demographic Dividend or Demographic Drag?
122
Apart from these factors, the “demographic dividend” school of thought
elaborates that there exists some degree of automacity about the
relationship between demographic trends and economic outcomes of a
nation (Chandrasekhar, Ghosh & Roychowdhury 2006). The authors
emphasised on high savings rate being a prerequisite for economic growth
and investments in the health and education sectors to ensure a better
quality workforce, in terms of skills, health conditions and productivity. They
stated that the policy environment of the nation is important and the country
must practice encouraging export-oriented policies as a prerequisite, rather
than following inward-looking policies. They further elaborated that a rise in
life expectancy brings about the need to fund retirement income causing
savings to increase. This helps to prove that high savings are related to
demographic factors. With high longevity, the private incentive to invest in
education also increases by increasing the period over which such
investment may be regained. However, the importance is again laid on the
government's ability to ensure a flexible economy that can absorb the rapidly
expanding labour force. Therefore, it is stated that the benefits of
demographic dividend depend on “good policies” which can be captured by
the indices of openness of the economy as well as the quality of government
institutions in the country.
EMPIRICAL EVIDENCE
Having studied the theoretical aspect of the relationship between
demographic trends and economic growth and development, it becomes
pertinent to support these theories by the practical component of empirical
evidence. Although the relationship between demographic changes and
economic development has been analysed in the context of a limited number
of countries, most of the studies portray a positive association between the
two (James 2008). However, based on the experience of certain countries,
there also remain certain exceptions to this theory.
Firstly, an analysis of 78 Asian and non-Asian countries portrayed a strong
positive effect of the growth of the working-age population on economic
growth. The study contributed to the popular finding that about one-third of
the “miracle growth” of East Asia was attributed to the demographic dividend
(Bloom & Williamson 1998). Another study that found a powerful positive
STRIDES - A Students' Journal of Shri Ram College of Commerce, Vol.5, Issue 1 & 2
123
association between the age structure pattern and various economic
variables, used panel data from several countries since the 1950s to examine
the relationship between the average age of the population and economic
variables (Behrman et al 1999). Thirdly, a study of the Scandinavian countries
that used data from 1980 also found a strong positive association between
the “share of economic growth and the share of the working-age population”
(Andersson 2001). Another instance that James (2008) quotes is the case of
Ireland. Even though the country faced an obstacle of lagging behind in
fertility transition among European countries, as the fertility rates began
declining faster in the 1980s, Ireland entered a phase of augmented growth
which clearly shows a positive association between demographic trends and
economic growth (James 2008). Furthermore, a study using panel data of
countries from 1960 to 2000 portrays a strong positive association between
age structure transition and economic growth in India and China. This
remains an important study for India as it states that India is expected to have
higher growth prospects than China due to a sharper fall in fertility rates and a
bulge in India's working-age population (Bloom et al 2003; Bloom et al 2006).
These are the studies quoted to support the positive relationship between
demographic changes and economic growth (James 2008).
On the other hand, in the case of several developing countries, such an
optimistic association has not been observed. A study established a positive
impact of the demographic transition on economic growth in south-east Asia
but it failed to find a similar result in the case of South Asian countries
(Navaneetham 2002). Another popular instance is that of the experience of
Latin America. Its age structure transition is reported to have failed to spur
economic growth (Bloom et al 2003). Apart from this, studies focusing on the
Indian case state that the demographic transition is not sufficient to augment
Indian economic growth (Mitra & Nagarajan 2005; Chandrasekhar et al
2006).
However, it is important to note that even pessimists of demographic
dividend do not deny the benefits of it but are only concerned about the
institutional bottlenecks existing in countries that may not let the benefits be
exploited. For instance, in the study conducted by Navaneetham (2002), the
author states that the absence of a clear association between demographic
changes and economic growth in South Asia is due to a lack of openness to
Population Trends in India: Demographic Dividend or Demographic Drag?
124
trade as compared to south-east Asia, with relatively more openness to trade.
Similarly, Bloom et al (2006) mention that the age structure changes create
the potential for economic growth but whether it is realised or not, depends
on the policy environment, especially openness to trade. In addition to this,
Chandrasekhar (2006) also quotes the bottlenecks related to education and
health in India that stop the country from ensuring a quality workforce, an
important aspect of economic growth (James 2008).
Even though there are studies that do not portray the positive association
between demographic changes and economic growth, those studies focus
on the bottlenecks in the countries that constrain the beneficial demographic
dividend. Therefore, the positive association between age structure
transition and economic growth in a nation is supported by sufficient
empirical evidence.
Having studied the theoretical and the empirical aspects of the concept, the
paper now focuses on the case of India.
THE INDIAN CONTEXT
Being the second most populous country in the world, India had a population
of 136.6 crore or 1.366 billion as of 2019 (United Nations 2019). In addition to
this, as mentioned earlier, growth prospects for India have been estimated to
be better than that of China, the most populous country of the world. These
factors make it pertinent to study India's growth story and analyse the role of
demographic changes in India's economic growth.
- Demographic Transition in India
For the first two decades of development in the country, post-independence,
the infant mortality rate started declining but the fertility rates remained
somewhat stagnant. This would have led to a rise in the population of young
people due to higher child survival. During the next three decades, the
fertility rate and the infant mortality rate dropped sharply in India. This had a
similar effect on the population as stated above. The ramification of this,
complemented by a fall in mortality in the higher age groups as well, was a
sharper decline in crude death rates than birth rates in the country. Thus, due
to a bulge in the working-age population, India got its window of
STRIDES - A Students' Journal of Shri Ram College of Commerce, Vol.5, Issue 1 & 2

125
opportunity in the mid-1970s or early 1980s, as per this study. This
demographic dividend was expected to extend till 2025 due to a projected
low dependency ratio of 48. Thus, as the dependency ratio in India fell from
79 in 1970 and the baby boomer generation transitioned into the working-
age population, the country entered the phase of demographic dividend in
the 1970s (Chandrasekhar, Ghosh & Roychowdhury 2006).
As per the World Bank estimates, India's population of 15-59 years is
expected to increase dramatically from 757 million in 2010 to 972 million in
2030, causing the addition of over 200 million workers in the economy. This
will also lead India to contribute immensely to the global workforce by
increasing the global labour supply. During this period, the working-age
population is expected to fall in most developed regions of the world,
including China (a decline from 913 million to 847 million workers) (Thomas
2014). Similarly, as per the UN projections for 2050, India's dependency ratio
falls to 47.6% but China's ratio spikes to 63% and Korea's ratio increases to
88.2%. In the developed world, the US will have a dependency ratio of 65.6%,
Western Europe's will be as high as 76.7% and Japan's ratio will increase to a
staggering 96.4%. Figure 1 shows the estimated dependency ratios for
various countries for the years 2010 and 2050, to compare. Thus, with the
world's dependency ratio being 58.5%, India among the only handful of other
countries will remain with a dependency ratio below 50%. Thus, while India's
demographic dividend provides the economy an opportunity to benefit from
it, most of the economies in the world “turn grey”.
Thus, this will not only help India reap the benefits of its demographic bonus,
but also give the country an edge over other superpowers and developing
countries by being a major labour supplier in the global markets (Chakravarty
2014).
Population Trends in India: Demographic Dividend or Demographic Drag?
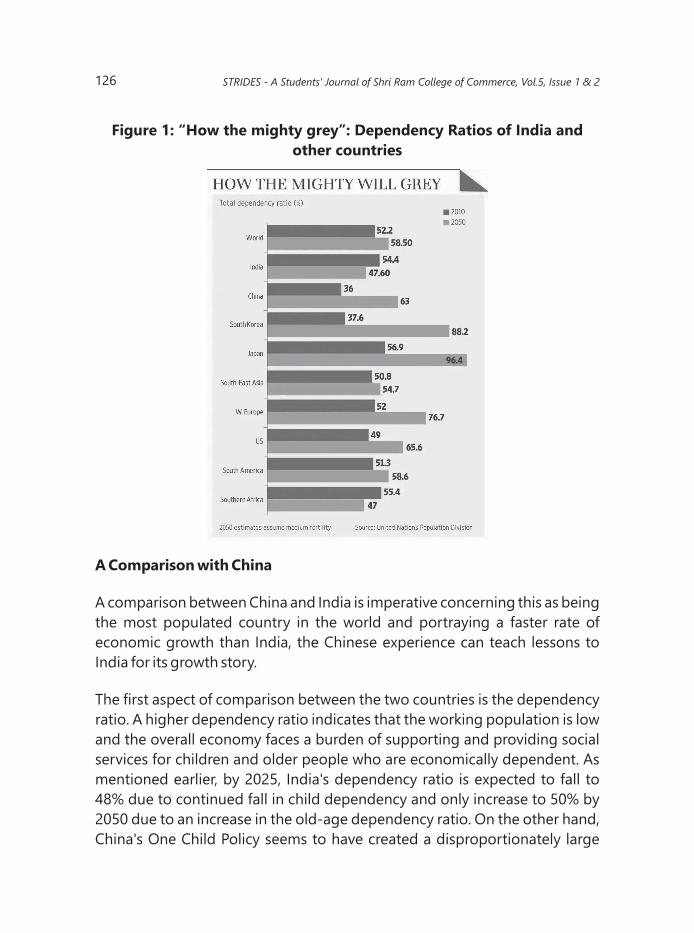
126
Figure 1: “How the mighty grey”: Dependency Ratios of India and
other countries
A Comparison with China
A comparison between China and India is imperative concerning this as being
the most populated country in the world and portraying a faster rate of
economic growth than India, the Chinese experience can teach lessons to
India for its growth story.
The first aspect of comparison between the two countries is the dependency
ratio. A higher dependency ratio indicates that the working population is low
and the overall economy faces a burden of supporting and providing social
services for children and older people who are economically dependent. As
mentioned earlier, by 2025, India's dependency ratio is expected to fall to
48% due to continued fall in child dependency and only increase to 50% by
2050 due to an increase in the old-age dependency ratio. On the other hand,
China's One Child Policy seems to have created a disproportionately large
STRIDES - A Students' Journal of Shri Ram College of Commerce, Vol.5, Issue 1 & 2

127
elderly population. This is expected to pose a burden for China around 2030
with a staggering 400 million people aged above 60 years. Thus, while China
expects to face hurdles due to a large old age population in 2030, during the
same time, India is set to experience high economic growth with an
increasing young population, giving India an edge over China (Singh &
Paliwal 2015). Figure 1 throws light on this more clearly, showing that by 2050,
while China's dependency ratio will become as high as 63% (large old age
population), India's dependency ratio will remain lower than 50%, setting
India at an advantage (Chakravarty 2014).
Secondly, the savings rate is the factor of comparison. This is because, with a
fall in the dependency ratio, as in the case of India in the future, the average
savings rate of the nation is observed to rise. India's saving rate has been
rising since 2003. Increasing from 29.5 in 2011 to 33% in 2015, India's saving
rate is comparable to that of the 'Asian Superpowers', where most countries
save above 30%. Even though China's saving rate was 40% in 2015, people are
less willing to spend due to limited social safety nets. However, the reason for
India's saving rate increase is not mere unwillingness to spend, but it is due to
significant improvements in the government's fiscal conditions and high
corporate savings. However, scholars state that even in the absence of these
factors, India is expected to increase its savings rate above the 30%
benchmark in the next 25 years due to its falling dependency ratio (Singh &
Paliwal 2015). Figure 2 throws light on the rise in personal savings in the
country to Rs. 26099.21 billion in 2016.
Figure 2: Increase in Personal Savings in India (2010-2016)
Population Trends in India: Demographic Dividend or Demographic Drag?
128
Along similar lines, the third basis of comparison is the investment to output
ratio. Even though India's investment to output ratio was 31% in 2015 as
compared to China's 48%, India is expected to raise this ratio significantly in
the future (Singh & Paliwal 2015).
Thus, the aforementioned arguments by Singh and Paliwal (2015) show that
India's dependency ratio is expected to decline sharply as compared to China.
The scholars state that this an important implication for Indian economic
growth as India is believed to enter its “Goldilocks” period, while that of China
is over. India seems to have this advantage over China because India's dip in
the dependency ratio is 'more gradual and longer lasting' than that of China,
as per the scholars.
Limitations to India's Demographic Dividend
Even though the previous section throws light on the growth prospects of
India and compares them to be better than that of China, in reality, there exist
certain factors that limit the potential of benefiting from the demographic
dividend in India. Rather, these factors, if not amended or focused on, may
cause a demographic drag. The paper analyses these factors and their
implications, one by one.
Unemployment in India
The first and foremost obstacle is that the extent of growth that has occurred
in India is not enough to absorb a rapidly rising workforce, generated by the
demographic dividend. Between 1993 to 2000, employment generation in
India experienced a drastic deceleration, with the lowest rates of rural
employment growth post-independence and urban employment generation
falling as well. It has also been stated that despite employment growth,
unemployment levels rose in India. As of 2006, an 8% increase in
unemployment was recorded for urban and rural males and a 9-12% increase
for the female labour force (Chandrasekhar, Ghosh & Roychowdhury 2006).
Subsequently, in 2019-20, the total unemployment rate in the country was
39.4%, indicating the health of the Indian economy (Sharma 2020). Figure 3
shows the fluctuations in the unemployment rate in India from 1999 to 2020.
STRIDES - A Students' Journal of Shri Ram College of Commerce, Vol.5, Issue 1 & 2
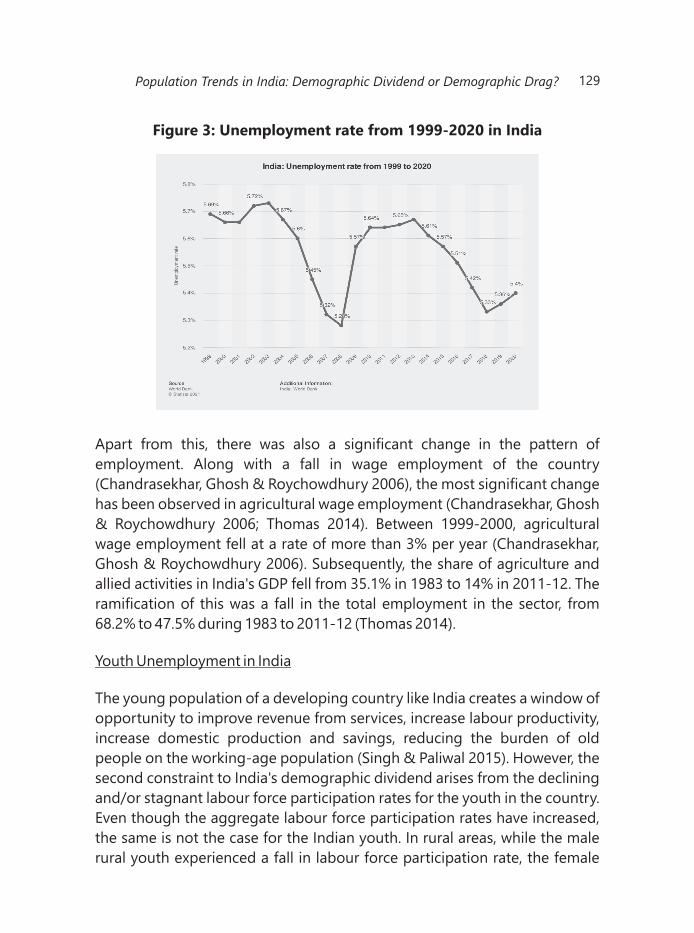
129
Figure 3: Unemployment rate from 1999-2020 in India
Apart from this, there was also a significant change in the pattern of
employment. Along with a fall in wage employment of the country
(Chandrasekhar, Ghosh & Roychowdhury 2006), the most significant change
has been observed in agricultural wage employment (Chandrasekhar, Ghosh
& Roychowdhury 2006; Thomas 2014). Between 1999-2000, agricultural
wage employment fell at a rate of more than 3% per year (Chandrasekhar,
Ghosh & Roychowdhury 2006). Subsequently, the share of agriculture and
allied activities in India's GDP fell from 35.1% in 1983 to 14% in 2011-12. The
ramification of this was a fall in the total employment in the sector, from
68.2% to 47.5% during 1983 to 2011-12 (Thomas 2014).
Youth Unemployment in India
The young population of a developing country like India creates a window of
opportunity to improve revenue from services, increase labour productivity,
increase domestic production and savings, reducing the burden of old
people on the working-age population (Singh & Paliwal 2015). However, the
second constraint to India's demographic dividend arises from the declining
and/or stagnant labour force participation rates for the youth in the country.
Even though the aggregate labour force participation rates have increased,
the same is not the case for the Indian youth. In rural areas, while the male
rural youth experienced a fall in labour force participation rate, the female
Population Trends in India: Demographic Dividend or Demographic Drag?
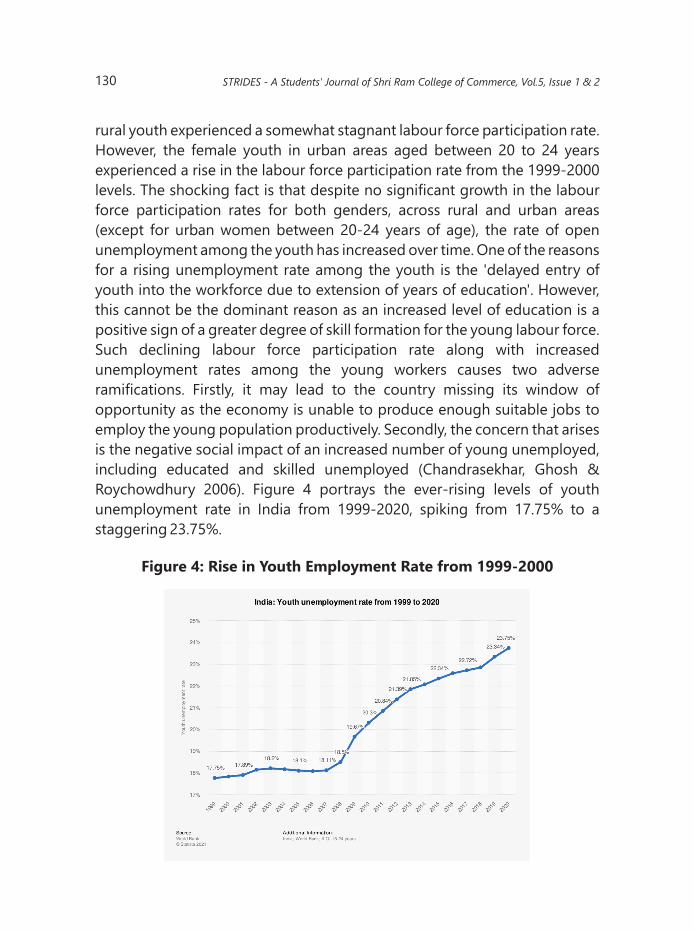
130
rural youth experienced a somewhat stagnant labour force participation rate.
However, the female youth in urban areas aged between 20 to 24 years
experienced a rise in the labour force participation rate from the 1999-2000
levels. The shocking fact is that despite no significant growth in the labour
force participation rates for both genders, across rural and urban areas
(except for urban women between 20-24 years of age), the rate of open
unemployment among the youth has increased over time. One of the reasons
for a rising unemployment rate among the youth is the 'delayed entry of
youth into the workforce due to extension of years of education'. However,
this cannot be the dominant reason as an increased level of education is a
positive sign of a greater degree of skill formation for the young labour force.
Such declining labour force participation rate along with increased
unemployment rates among the young workers causes two adverse
ramifications. Firstly, it may lead to the country missing its window of
opportunity as the economy is unable to produce enough suitable jobs to
employ the young population productively. Secondly, the concern that arises
is the negative social impact of an increased number of young unemployed,
including educated and skilled unemployed (Chandrasekhar, Ghosh &
Roychowdhury 2006). Figure 4 portrays the ever-rising levels of youth
unemployment rate in India from 1999-2020, spiking from 17.75% to a
staggering 23.75%.
Figure 4: Rise in Youth Employment Rate from 1999-2000
STRIDES - A Students' Journal of Shri Ram College of Commerce, Vol.5, Issue 1 & 2
131
Gender Bias
In India, there exist enormous disparities in the areas of education, literacy
and employment between women and men. These differences not only occur
in the opportunities provided to men and women but also in terms of
attitudes and outdated social norms that prescribe women to not take up
jobs, not complete their education and other issues rooted in family
responsibilities (Chandrasekhar, Ghosh & Roychowdhury 2006). A classic
example of this is the fact that urban males benefited disproportionately
from the growth of non-agricultural employment, other than construction, as
compared to women in urban areas, during the period of 2004-05 to 2011-12
(Thomas 2014).
Apart from this, a bigger hurdle is the problem of low women's labour force
participation rate in India. In a comparison study with China, there seems to
exist huge differences between the women labour force participation rates of
the two countries. As per estimates of the International Labour Organisation,
for women aged 15 years or above, 68.9% of Chinese women are in the labour
force as compared to a mere 34.2% of Indian women in the Indian workforce.
The author attributes this to the fact that in India, home-based activities for
women are not accounted for in the labour market statistics. Furthermore, a
comparison of work participation rates of Chinese women and Indian women
shows that Indian women of all age groups lag behind Chinese women. The
study further discusses that when the Indian dependency ratio is looked at
from the angle of non-working age to working-age population, India's
advantage is clear with 0.48 in 2030 as compared to China's dependency ratio
of 0.50. However, when the women work participation rate is taken into
account to estimate the dependency ratio, India's dependency ratio expected
in 2030 is way higher at 1.26 than that of China's at 0.89. Thus, the author
claims that there exists no reason for India to reap its demographic dividend
as compared to China (Desai 2010).
Health
The next field wherein India experiences a deficit is the health sector.
Changing age structure can lead to a rise in the supply of workers in the
country but that is not enough to reap the country's demographic dividend
till significant improvements are ensured in the health status of both the
Population Trends in India: Demographic Dividend or Demographic Drag?
132
working-age population and non-working-age population. This is because,
with bad health conditions, there will neither be an increase in labour
productivity nor a decline in worker absenteeism. Also, lack of proper health
services and improvement in health indicators may even refute the savings-
growth causality such that increased longevity may not be accompanied by
higher savings of the working-age population due to a rise in disease burden
across all age groups, causing increased healthcare expenditure. While some
health problems like asthma and tuberculosis may be concentrated to the
younger and/or older age population and others like malaria and jaundice
are evenly distributed across age groups, reproductive health problems,
HIV/AIDS and mental health issues are likely to affect the bulge in the
working-age population. As a result, maternal mortality and child and infant
deaths must be worked upon to reduce, through investment in infrastructure
and advocacy in India (Chandrasekhar, Ghosh & Roychowdhury 2006).
Education
This is another sector where the country faces a deficit. The quantity, quality
and relevance of education is important as it determines the quality and skills
of the future workforce of the nation. Literacy and education in India suffered
setbacks during the period of liberalisation due to an ignorance of the
importance of the two in determining the degree of economic growth and
development of the economy. The spread of literacy rates over the years of
globalisation till 2004-05 remained slow. As of 2004-05, only 21.2% of rural
males and 10.2% of rural females aged 15 years or above possessed the
minimum education of secondary school or more. The corresponding figures
for urban areas were 48.3% and 35.6% respectively. The added problem to
this was that even the educated of India found it difficult to get jobs,
appropriate to skills or otherwise along with little to no vocational training in
the country (Chandrasekhar, Ghosh & Roychowdhury 2006). Figure 5 shows
the literacy rates in India since the period of economic reforms in 1991 when
the education sector was neglected to as recent as 2018. It can be imputed
from the chart that even though the literacy rate in India has been rising over
the years, the annual changes since 2001 have not been very significant.
STRIDES - A Students' Journal of Shri Ram College of Commerce, Vol.5, Issue 1 & 2
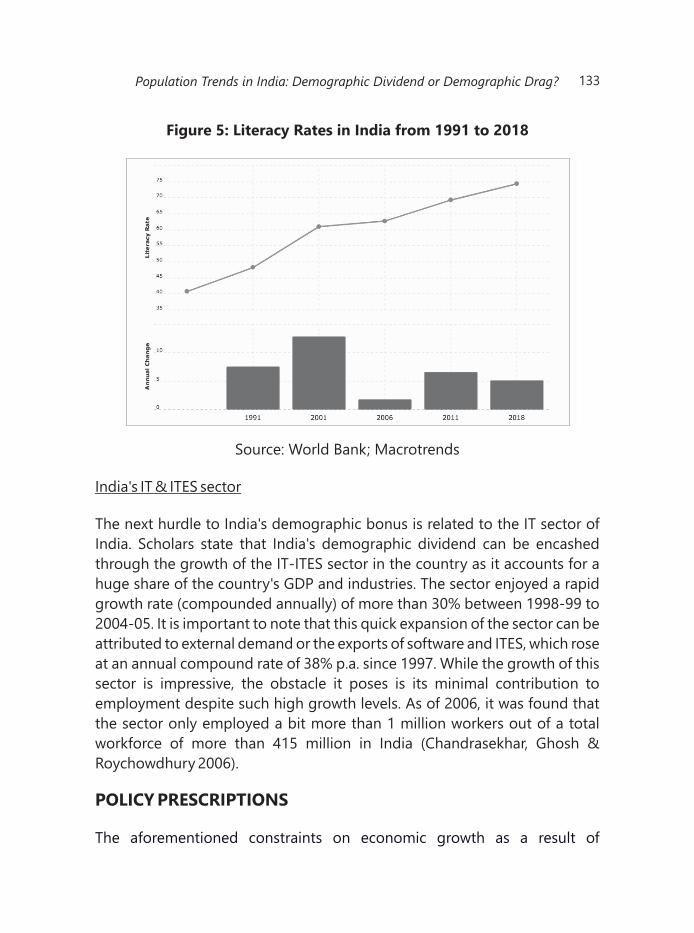
133
Figure 5: Literacy Rates in India from 1991 to 2018
Source: World Bank; Macrotrends
India's IT & ITES sector
The next hurdle to India's demographic bonus is related to the IT sector of
India. Scholars state that India's demographic dividend can be encashed
through the growth of the IT-ITES sector in the country as it accounts for a
huge share of the country's GDP and industries. The sector enjoyed a rapid
growth rate (compounded annually) of more than 30% between 1998-99 to
2004-05. It is important to note that this quick expansion of the sector can be
attributed to external demand or the exports of software and ITES, which rose
at an annual compound rate of 38% p.a. since 1997. While the growth of this
sector is impressive, the obstacle it poses is its minimal contribution to
employment despite such high growth levels. As of 2006, it was found that
the sector only employed a bit more than 1 million workers out of a total
workforce of more than 415 million in India (Chandrasekhar, Ghosh &
Roychowdhury 2006).
POLICY PRESCRIPTIONS
The aforementioned constraints on economic growth as a result of
Population Trends in India: Demographic Dividend or Demographic Drag?
134
demographic dividend and the claims of the policy environment being a
determinant of the benefits of demographic dividend in a country, make it
imperative to study various suggestions and policies that need to be
undertaken.
Firstly, Chandrasekhar, Ghosh & Roychowdhury state certain general
suggestions which can enable a country to reap the benefits of its
demographic dividend. The experts suggest that the dependency ratio
should be defined as the ratio of actual non-workers to workers rather than
the ratio of non-working age population to the working-age population. This
will take into account the problems of unemployment and underemployment
leading to better policy-making for employment generation. Their second
recommendation states that even in periods with a bulge in the working-age
population, large-scale unemployment and low expenditure on education,
both by the governments and households, erodes the ability of a country to
exploit the demographic dividend as and when it emerges (Chandrasekhar,
Ghosh & Roychowdhury 2006).
While the aforementioned recommendations are in general for countries to
reap the demographic dividend, the next set of policy prescriptions is
specifically for India's growth story. Firstly it has been identified that there
exists a deficit in the areas of education and health in India. This needs to be
resolved by increasing and improving education at the primary and
secondary levels, especially in the less developed areas of the country.
Similarly, higher public spending in health is also required to curb the deficit
in the health sector. As observed earlier, another obstacle faced by the Indian
economic growth is that many women in the working-age population choose
not to take up jobs due to personal or family responsibilities. Scholars
elaborate that household work must be reduced with the help of appropriate
technologies and women must be empowered by reducing gender
disparities in society. In order to do this, it is suggested that narrow
mentalities and social norms should be broken down through proactive
policies and interventions. An instance of such intervention is the reservation
of positions for women in the public sector jobs and higher grade positions.
Furthermore, a 'gender-equitable environment' is emphasized upon so that
women are free to access and use family planning methods without any social
or physical barriers. Implementation of policies needs to be undertaken that
STRIDES - A Students' Journal of Shri Ram College of Commerce, Vol.5, Issue 1 & 2
135
help women improve their education and equip them with skills to compete
for higher-paying jobs. Proactive policies should ensure that women have
equal access to mass media and technology. This will be an important step
towards enabling women to make more informed decisions for themselves as
well as their children. Finally, the most important aspect of employment,
without which economic growth cannot be achieved, has been focused upon.
The authors identify the need to create “remunerative and productive
employment” for new entrants into the workforce by ensuring mobility of
labour both from rural to urban areas, and across and within sectors of the
economy. This in turn requires a 'smooth functioning labour market' and
availability of skills that are in demand along with better-educated and skilled
workers, earning higher incomes. Apart from this, it is also necessary to create
jobs in the 'knowledge-intensive sector' of the country by adding more value
to it as the level of education in the country increases. The experts conclude
by saying that in addition to this, the reaping of the benefits of demographic
dividend depends on whether the public and private sector of the economy
have the “political will and foresight” to not only create new jobs but also
honour them with quality training to the new workforce, encouraging trade,
reforming the education system, raising capital to support innovation and
implementing policies that instill a sense of confidence in the nation
regarding the economy (Singh & Paliwal 2015).
CONCLUSION
With regard to the aforementioned arguments, it is clear that India's growth
prospects in alignment with its demography look optimistic. However, the
factors discussed that cause obstacles in the economic growth, may lead the
population growth to be a burden on the economy or the case of
demographic drag, rather than reaping the benefits of the demographic
bonus. Thus, it is pertinent for the government to work on policies in the areas
of education, health, women empowerment and creating a more gender-
equitable environment. This will ensure that the bottlenecks in the way of
India benefiting from its demographic dividend are reduced and removed,
setting India's path towards a high economic growth rate due to a bulge in
the working-age population of the country.
Population Trends in India: Demographic Dividend or Demographic Drag?
REFERENCES
Bloom, D. E., & Canning, D. (2004, October 04). Global demographic change:
Dimensions and economic significance. Retrieved May 02, 2021, from
https://www.nber.org/papers/w10817
Bloom, D. E., & Williamson, J. G. (1997, November). Demographic Transitions
and Economic Miracles in Emerging Asia. Retrieved May 2, 2021, from
https://www.nber.org/system/files/working_papers/w6268/w6268.pdf
Bloom, D. E., Canning, D., Mansfield, R., & Moore, M. (2006, October).
Demographic Change, Social Security Systems, and Savings. Retrieved May 2,
2 0 2 1 , f r o m
https://www.nber.org/system/files/working_papers/w12621/w12621.pdf
Bloom, D., Canning, D., & Sevilla, J. (2003, January 01). The Demographic
Dividend. Retrieved May 02, 2021, from https://doi.org/10.7249/mr1274
Blue, L., & Espenshade, T. J. (2011, December 13). Population Momentum
Across the Demographic Transition. Retrieved May 2, 2021, from
https://onlinelibrary.wiley.com/doi/10.1111/j.1728-4457.2011.00454.x
Chakravarty, M. (2014, October 10). Making India's demography its destiny.
Mint. Retrieved May 4, 2021, from https://www.livemint.com/Opinion/
3aGTvnsOvqfu22cfQbS4KN/Making-Indias-demography-its-destiny.html
Chandrasekhar, C. P., Ghosh, J., & Roychowdhury, A. (2006, December 9-15).
The 'Demographic Dividend' and Young India's Economic Future. Economic
and Political Weekly, 41(49), 5055-5064. doi:https://www.jstor.org/
stable/4419004
Desai, S. (2010, October 2-8). The Other Half of the Demographic Dividend.
Economic and Political Weekly, 45(40), 12-14. doi:https://www.jstor.org/
stable/25742137
Gaag, N. V., & Beer, J. D. (2015, February). From Demographic Dividend to
Demographic Burden: The Impact of Population Ageing on Economic Growth
in Europe. Journal of Economic and Human Geography, 106(1), 94-109.
doi:https://onlinelibrary.wiley.com/doi/epdf/10.1111/tesg.12104
136 STRIDES - A Students' Journal of Shri Ram College of Commerce, Vol.5, Issue 1 & 2
137
James, K. S. (2008, June 21-27). Glorifying Malthus: Current Debate on
'Demographic Dividend' in India. Economic and Political Weekly, 43(25), 63-
69. doi:https://www.jstor.org/stable/40277590
Kelley, A. C., & Schmidt, R. M. (1995, November). Aggregate Population and
Economic Growth Correlations: The Role of the Components of Demographic
Change. Demography, 32(4), 543-555. doi:https://doi.org/10.2307/2061674
Kelley, A. C., & Schmidt, R. M. (2005, June). Evolution of recent economic-
demographic modeling: A synthesis. Journal of Population Economics, 18,
275-300. doi:https://doi.org/10.1007/s00148-005-0222-9
Nations, U. (2007, June 15). Dependency Ratio [PDF]. United Nations.
Nations, U. (2019). World Population Prospects 2019 [XLSX]. United Nations,
Department of Economic and Social Affairs, Population Division.
Sanchez-Romero, M., Abio, G., Patxot, C., & Souto, G. (2017, October 12).
Contribution of demography to economic growth. SERIEs, 9, 27-64.
doi:https://link.springer.com/content/pdf/10.1007/s13209-017-0164-y.pdf
Sharma, Y. S. (2020, November 26). India's unemployment rate rises further,
employment rate lowest since June. The Economic Times. Retrieved May 3,
2 0 2 1 , f r o m
https://economictimes.indiatimes.com/news/economy/indicators/indias-
unemployment-rate-rises-further-employment-rate-lowest-since-
june/articleshow/79428634.cms
Singh, S., & Paliwal, M. (2015, Spring). India's Demographic Dividend. World
Affairs: The Journal of International Issues, 19(1), 146-157.
doi:https://www.jstor.org/stable/48505143
Thomas, J. J. (2014, February 8). The Demographic Challenge and
Employment Growth in India. Economic and Political Weekly, 49(6), 15-17.
doi:https://www.jstor.org/stable/24479252
Wiltgen, R. J. (1998, December 1). Marx's and Engels's Conception of Malthus:
The Heritage of a Critique. Organization and Environment, 11(4), 451-460.
doi:https://doi.org/10.1177/0921810698114010
Population Trends in India: Demographic Dividend or Demographic Drag?


139
An Analysis of Thrift
Industry in India
Growing concerns about worsening climatic
conditions have created a need to revolutionize
the way industries have been working
traditionally and in the wake of this fashion
industry has undergone a major change too. The
inclination towards thrift culture is increasing
across the globe and the same prompts this study.
It focuses on the emergence of thrifting practices
and assesses the scope of its future in India. The
paper analyses the existing and potential demand
and supply aspects of the thrifting industry by
conducting a survey, and the theoretical and
business models further support the observations.
It also involves understanding the marketing
practices, sourcing strategies, and plans adopted
by various budding second-hand retailers to lead
their business.
The research concludes by highlighting the
existing challenges in the industry and
recommendations for overcoming those
challenges. This paper focuses on understanding
customer/seller psychology through conducting
primary research in the form of questionnaires
and interviews.
This study also inspires and encourages other
researchers to conduct future studies by utilizing
the findings from this study.
Mentor:
Dr. Monica Bansal
Assistant Professor
Department of Commerce
SRCC, DU
ABSTRACTPragati Agrawal B.Com. (Hons.)SRCC, DU
Tanya Goel B.Com. (Hons.)SRCC, DU
Prachi Yadav B.A. (Hons.) EconomicsSRCC, DU
Keywords: Thrifting, Second-Hand Markets, Shopping, Sustainability,
Fashion Industry, Pop Up Stores
INTRODUCTION
The fashion industry has been growing at an insurmountable rate, and it
expects to become a $3.3 trillion industry by 2030. But at what cost? Is it the
92 million tons of waste annually generated or the excessive consumption of
natural resources during the production? The paper starts by giving a brief
overview of the fashion industry and its societal costs, ultimately leading to a
thrift culture.
Exploring, Experimenting and Adopting have become new normal for all of
us. The fashion industry is no different from this. Earlier, the collection of
fashion stores changed according to the seasons. However, now with trend-
centric collections, the frequency of change has increased to about 50 times a
year, implying that a piece of cloth becomes trendy and goes out of fashion
almost instantly. Following these trends has led to the emergence of
numerous fast fashion stores, which in turn proved to be detrimental to the
environment. Sustainability being the center of concern for the fashion
industry and rising consumer awareness has led to the evolution of the 4Rs of
the fashion industry- Reduce, Reuse, Repair and Recycle. Thrift stores are a
culmination of the need to combat this huge global fashion consumption
problem. Selling old clothes is an invention for the age-old textile industry,
but it is gaining rounds due to its huge value creation for socially responsible
customers. Over the past decade, we have seen thrift stores going from rags
to riches, quite metaphorically as well as literally.
Thrifting is a popular concept in western counterparts globally; however,
India is still exploring potential opportunities. This paper extensively explores
the emergence of the resale industry in India in the wake of the above-stated
reasons and further analyses its prospects and success.
140 STRIDES - A Students' Journal of Shri Ram College of Commerce, Vol.5, Issue 1 & 2
1 Boston Consultancy Group. (2019). Pulse of the Fashion Industry. Retrieved from http://media-publications.bcg.com/france/Pulse-of-the-Fashion-Industry2019.pdf
2 BBC. (2020, 7 13). Why clothes are so hard to recycle. Retrieved 2020, from https://www.bbc.com/future/article/20200710-why-clothes-are-so-hard-to-recycle
OBJECTIVES
1. To understand the constraints in the development of thrifting in India.
2. To analyze the needs and requirements of the target market.
3. To assess the future of thrifting in India.
REVIEW OF LITERATURE
The literature review and theoretical frameworks served as a basis for
generating research questions used to provide focus and guidance during
the study. Several studies have taken place that shed light on several aspects
of thrifting.
Jinhee Han (2013) conducted a study to understand second-hand retailing
where he examined unidentified second-hand retailers' business practices
and marketing strategies leading to business successes. It was found out that
although all types of thrift stores have similarities in terms of dealing with
used items, however, there are several participants like consignment and
vintage store owners who operate for profit. At the same time, many others
run as non-profit organizations and contribute to their neighbors and
communities. The study also presented findings of second-hand retailers'
unique resources by classifying them into "physical capital resources",
"organizational capital resources", and "human capital resources". The study
also discusses the Product strategy, Price strategy, Promotional Strategy, and
Customer relationships strategy to understand the marketing and
management plans.
The students of the NIFM, Mumbai, conducted an interesting study, which
assessed the feasibility of thrift stores in College Campuses in Kharagpur.
Their results indicated that approximately 37.2% of consumers were only
ready to convert into 100% thrift store customers. Hence, the future of the
concept seems dubious. They also concluded that the consignment model of
business is a successful model with low investment as nothing is paid for
inventory until sold, making thrifting an excellent startup idea.
To analyze the scope of the thrift industry in future, it is essential to study the
141An Analysis of Thrift Industry in India
factors impacting the customers' behaviour (Darley & Lim, 1999) examines
the effects of store image and general attitude toward second-hand stores on
"shopping frequency'' and "distance travelled''. The results of the study
depicted that the more frequent the shopper is, the higher is the inclination
towards the specific store and its merchandise quality. Favourable quality
perception and store image also convince the customers to drive the extra
distance to patronize their stores. Concludingly, managers must ensure a
broad-based level of awareness among the target audience about the
changing face of second-hand goods stores, hereby enhancing their general
attitude toward second-hand stores.
EMERGENCE
Since its inception, the second-hand apparel industry has seen growth and
potential, estimated to reach a $51 billion mark by 2023.
While traditional methods of shopping burdened the pockets of the growing
middle class and had catastrophic impacts on the environment, there was a
need to find an alternative, and hence it led to the emergence of the second-
hand market or what we now call "thrifting". THE SALVATION ARMY and
GOODWILL INDUSTRIES were the two pioneers of the industry. During
1889, these non-profit organizations conceptualized thrifting to mobilize the
impoverished people and to recycle unused and unwanted clothes. Despite
the financial crunch faced by a vast majority of the population during the
great depression, thrifting enabled them to afford fashionable clothes at
reasonable prices. The concept of thrift stores further intensified in the US,
due to widespread endorsement by celebrities such in programs like
America's next top model. Over the period, the industry has attracted global
attention across all countries, including India. Lately, the Indian second-hand
apparel industry has transitioned from street-side pop-ups to online thrift
stores and has now become a secondary source of income for many.
However, the concept is still in its nascent stage in India.
5.UNDERSTANDING THE DEMAND & SUPPLY SIDE OF THE
THRIFT INDUSTRY
This section talks about the demand and supply mechanism of the thrift
industry and presents the rationale for engaging in thrifting.
142 STRIDES - A Students' Journal of Shri Ram College of Commerce, Vol.5, Issue 1 & 2
Demand
The growing popularity of thrifting among the masses is due to a plethora of
reasons. First of all, the increasing appetite for fashionable and trendy
clothing has led to fast fashion stores' evolution. These stores mass-produce
the clothes at low cost in response to the latest trends that will be going out of
cycle the next week, and this business model itself is detrimental to the
environment. Hence, due to the enormous production amount, the apparel
industry's carbon emissions might cross 60% by 2030.
The second-hand apparels provide a solution to the disastrous
environmental impact created by the textile industry from its production to
its disposal. According to the World Wildlife Fund (WWF), 2700 litres of water
is required to produce the cotton needed to make a single t-shirt thereby
consuming millions of gallons of water and tons of harmful pesticides. The
thrift industry facilitates sustainability by exporting used textile, which results 3
in estimated annual savings of 190000 tonnes of Co and reduces water 2
consumption by 18 billion gallons. Access to a wide variety of cheap clothing
has led the consumers to shop more frequently, but each garment is kept half
as long as it used to be, and as a result, 57% of all discarded clothing ends up
in a landfill. Though the foundations of thrifting lie in environmental
sustainability and reusing and recycling, it has now gained popularity among
Gen Y and Gen Z because of their desire of owning a vintage collection,
exclusive celebrity and designer clothing at affordable prices. For whom
shopping is a therapy, thrifting has proven to be a blessing. Hence, ranging
from being pocket-friendly to environmentally sustainable and satisfying the
longing of vintage closets, thrifting seems to be the resort to all the
inefficiencies of the fashion industry.
Supply
Thrifting is not just benefitting the consumers, but it is also an attractive
proposition for aspiring entrepreneurs to enter this industry. Many people
usually have some extra clothing in their wardrobes that is left unused over
years even though they are in good condition, though donating is a lucrative
143
3 Planet Aid. (2017, January 20). Retrieved from Benefits of the Secondhand Clothing Industry: https://www.planetaid.org/blog/benefits-of-the-second-hand-clothing-industry
An Analysis of Thrift Industry in India
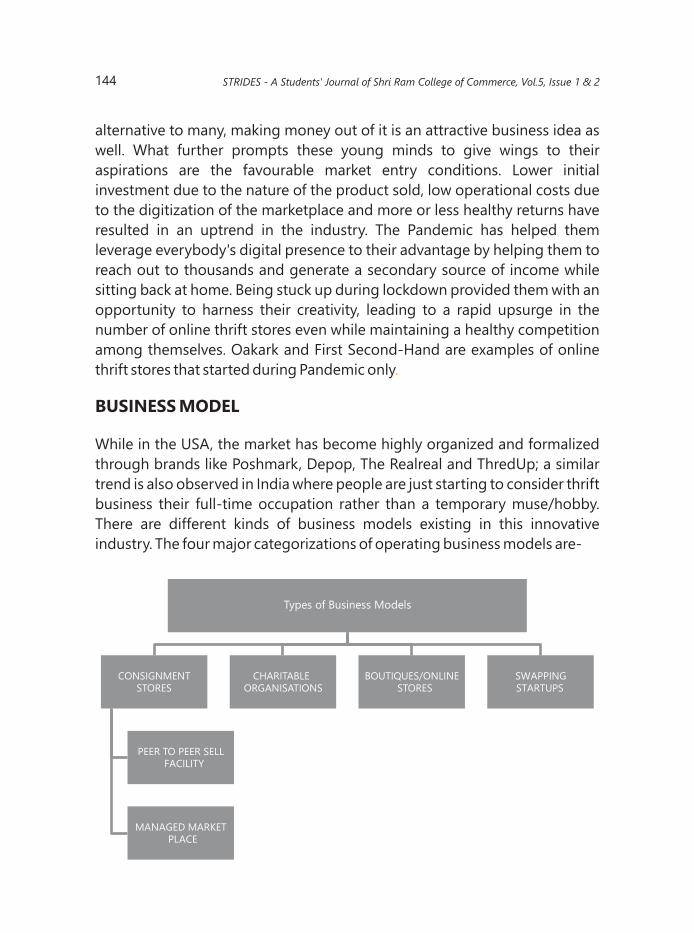
alternative to many, making money out of it is an attractive business idea as
well. What further prompts these young minds to give wings to their
aspirations are the favourable market entry conditions. Lower initial
investment due to the nature of the product sold, low operational costs due
to the digitization of the marketplace and more or less healthy returns have
resulted in an uptrend in the industry. The Pandemic has helped them
leverage everybody's digital presence to their advantage by helping them to
reach out to thousands and generate a secondary source of income while
sitting back at home. Being stuck up during lockdown provided them with an
opportunity to harness their creativity, leading to a rapid upsurge in the
number of online thrift stores even while maintaining a healthy competition
among themselves. Oakark and First Second-Hand are examples of online
thrift stores that started during Pandemic only
BUSINESS MODEL
While in the USA, the market has become highly organized and formalized
through brands like Poshmark, Depop, The Realreal and ThredUp; a similar
trend is also observed in India where people are just starting to consider thrift
business their full-time occupation rather than a temporary muse/hobby.
There are different kinds of business models existing in this innovative
industry. The four major categorizations of operating business models are-
.
144
Types of Business Models
CONSIGNMENT STORES
PEER TO PEER SELL FACILITY
MANAGED MARKET PLACE
CHARITABLE ORGANISATIONS
BOUTIQUES/ONLINE STORES
SWAPPING STARTUPS
STRIDES - A Students' Journal of Shri Ram College of Commerce, Vol.5, Issue 1 & 2

A. CONSIGNMENT STORES: These stores provide a platform for sellers to
sell their used goods to buyers and earn a percentage of sales revenue.
Such stores operate either on a peer to peer sell facility or as a managed
marketplace.
i. Peer-to-peer sell facility: Such stores do not maintain any inventory of
their own and merely act as facilitators of transactions by providing a
platform to upload goods on the website from where the buyers can
browse the required items.
Examples-Poshmark, Tradesy, Goat, Grailed. These companies might
intervene in the transaction by performing certain quality checks on the
products sold under particular circumstances. For example-A brand
named Poshmark provides authentication services for articles sold
above $500.
ii. Managed marketplace: These stores collect second-hand clothing
from various sources and perform significant quality control and
inspections, ensuring only standardized goods are available to their
customers.
Examples- Thredup, Fashionphile, TheRealReal and Rebag
B. CHARITABLE ORGANIZATIONS: Several non-profit organizations fund
their services not through grants but also by earning revenue through
alternative means such as by operating a thrift store. Such stores usually
establish independent stores at diversified locations where they collect
donations in-kind, serving as its inventory.
Example-Goodwill Industries International, "Out of the Closet”, etc.
C. BOUTIQUE/ONLINE STORES: Such unorganized stores dominate the
Indian thrift market. These stores usually source their inventory from rag
shops, vintage fair, swap-meets; however, in India, they are majorly
dependent on their own overfilled wardrobes or reach out to their close
friends and relatives to generate supplies.
Example- "First Secondhand"-an Indian thrift store that is also operating
145An Analysis of Thrift Industry in India

through social media platforms.
D. SWAPPING STARTUPS: There is a peer-to-peer service available in this
mode, which helps people swap their closets by providing a sharing
platform.
Example -This for that, a one of its kind India-based startup is a "place for
like-minded women to share their closets, tastes and trust.
OPERATION CYCLE
Even the most informal form of thrift stores follow a step-by-step process to
enhance their sales right from decoding pricing strategies, upscaling supplies
and managing customer grievances. Every kind of store has its specific
approval process to decide which goods they shall pass on to their customers,
ensuring that only authentic goods reach out to them.
While managed marketplaces have a standardized policy to serve only
newish second-hand clothes to customers, the local thrift stores also do not
leave any stone unturned to gain their customer's trust by ensuring proper
fixing and mending of even slightly damaged cloth. In the wake of the
Pandemic, the need for proper sanitation has even enhanced. After
upscaling, certain factors like original MRP, life, usage and condition of the
product are kept in mind while pricing the goods. Other brands that even
refurbish or redesign the goods before selling them also consider its costs to
determine final prices. After determining these prices, the final sale is either
made at these predetermined rates or through an auction-based model
(where the highest bidder becomes the lucky winner of that clothing).
However, this sale is not as smooth as it appears to be and comes up with
various customer queries and grievances that these thrift store operators
need to look after personally. The way they tackle the grievances varies from
store to store
COMPETITION
Since the market is fragmented in small business units, they provide tough
but healthy competition to each other. This increase in the number of sellers
also helped in the rapid expansion of thrifting. E-commerce websites pose
.
146 STRIDES - A Students' Journal of Shri Ram College of Commerce, Vol.5, Issue 1 & 2
heavy competition to these thrift stores by their aggressive discounting
policies and making their new products available to customers at similar
prices to that of thrift stores. However, thrift store owners believe that the
personalized nature of thrift stores will always have the edge over the generic
goods of e-commerce websites in the consumers' minds. They also believe
that people will always give preference to this ethical and sustainable slow
fashion. The study by YouGov further backs this belief as its recent survey
shows that 83% of people emphasize sustainability while buying fashion
items. However, the material, fit, design and price also have a more
controlling influence.
RESEARCH METHODOLOGY
The data collected through both primary and secondary sources has been
analysed using quantitative as well as qualitative approaches. To analyze
customers' points of view, the researchers conducted a questionnaire survey
(google form) for a sample size of 236 well-diversified respondents. Though
the respondents majorly belonged to Gen Z and includes disproportionately
more females but it depicts actual shopper practices. The questions included
were based on the studies conducted by the students of the NIFM and Darley
and Lim,1999. The google form aimed to analyze consumer behaviour and
the factors impacting shopping practices. The data collected from
questionnaires has been worked out to produce graphs which are further
analyzed to derive observations.
Further to understand the thrift store operators' views, two telephonic
interviews with the founders of "First Second Hand" and "The Thrift Shop"
and a google form-based interview of the founder of Oakark were also
conducted. The discussion revolved around understanding their business
models, customer demographics, challenges in the industry and growth
prospects of the industry.
Secondary research was also done based on the literature review of various
academic journals, research papers and articles written on the topic of thrift
shopping and ideas surrounding it, which helped us analyze the prospects of
this segment of the fashion industry.
147An Analysis of Thrift Industry in India

DATA ANALYSIS
A descriptive analysis of primary data collected through questionnaires and
interviews-
A. QUANTITATIVE RESEARCH
The data analysis is based on the information gathered from the responses
collected through the Google forms (e-survey) portal. The results are then
presented in the form of graphs and charts.
The researchers collected the data through questionnaires that were filled
manually across the country and then analyzed.
Based on the responses of the survey conducted-
This shows that approximately 42% of respondents (99 out of 236
respondents) merely relate thrifting with cheap shopping.
Note: Others include views like Changing, unusual, limited use, no idea, sale,
and many more.
Figure 1- What comes to your mind when you see the word thrifting?
148 STRIDES - A Students' Journal of Shri Ram College of Commerce, Vol.5, Issue 1 & 2
42%
22%
12%
12%
12%
Cheap Eco friendly Treasure hunt Vintage Others
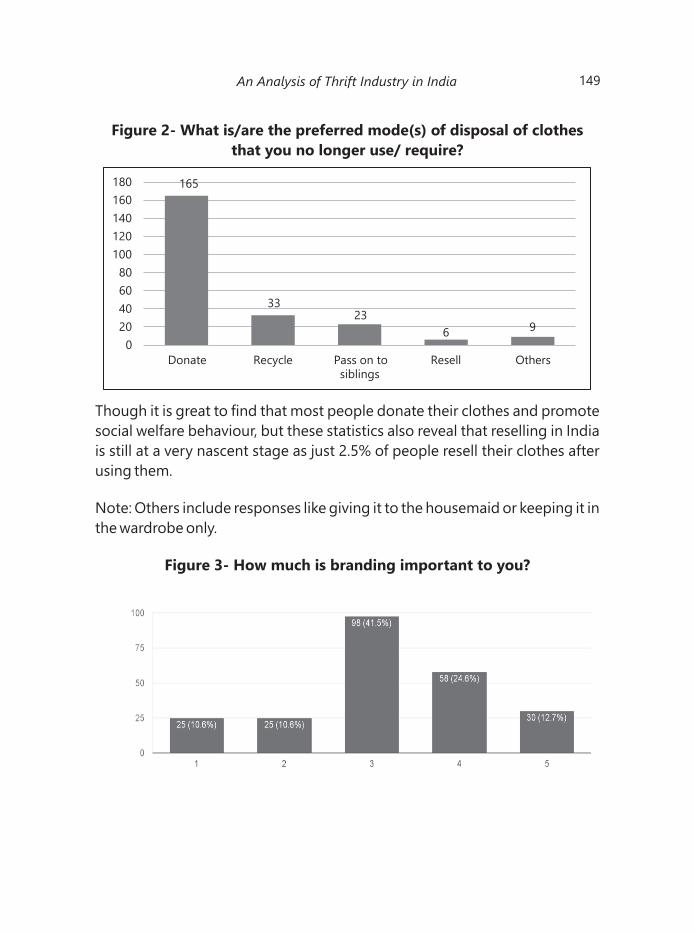
Figure 2- What is/are the preferred mode(s) of disposal of clothes
that you no longer use/ require?
Figure 3- How much is branding important to you?
Though it is great to find that most people donate their clothes and promote
social welfare behaviour, but these statistics also reveal that reselling in India
is still at a very nascent stage as just 2.5% of people resell their clothes after
using them.
Note: Others include responses like giving it to the housemaid or keeping it in
the wardrobe only.
149
165
3323
6 9
0
20
40
60
80
100
120
140
160
180
Donate Recycle Pass on to siblings
Resell Others
An Analysis of Thrift Industry in India

Figure 4 – Why is branding important to you?
Figure 5- What convinces you to get involved in thrifting?
Others here include reasons like – Variety of colours , trendy outfits, or
branding is not at all important to them.
The charts placed above clearly indicate that a considerable chunk of people
opt for branded goods because of quality assurance. However, thrifting in
India lacks branding and recognition, which could assure the customers that
these products have been inspected and upcycled properly and are safe to
use.
The survey indicates that only 21.6% of total respondents were practising
thrifting for genuine reasons, and 82.4% of them were doing it just to reduce
the heavy burden of expensive clothing from their pockets. Though it should
be noted that what arises out of need might die sooner or later however what
150
65%10%
18%
7%
Quality Assurance Social status Size/Fitting Others
STRIDES - A Students' Journal of Shri Ram College of Commerce, Vol.5, Issue 1 & 2

arises out of desire lasts long.
Out of 51 respondents who practice thrifting, the chart above replicates that
thrift shop owners are available through various mediums to their target
customers like online stores, NGOs, local thrift stores, and even avenues for
celebrity closets.
Others include reasons like -Lack of belongingness, Uncomfortable in
wearing them, Lack of availability of thrift stores, no particular reason.
Figure 6– What mode of thrifting is usually adopted by you?
Figure 7– Why don't you engage in thrifting?
151
94
41
5
33
63
0
10
20
30
40
50
60
70
80
90
100
U N A W A R E O F T H I S
C O N C E P T
B E LO W P A R Q U A L T I Y
S O C I E T A L F A C TO R S
S E E M S U N H Y G E N I C
OT H E R S
An Analysis of Thrift Industry in India
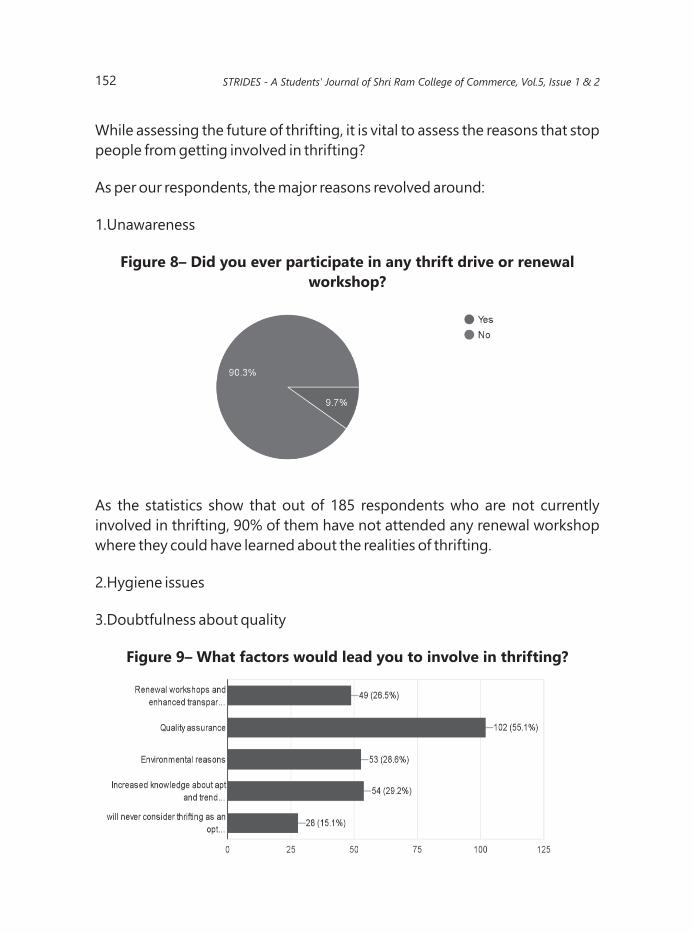
While assessing the future of thrifting, it is vital to assess the reasons that stop
people from getting involved in thrifting?
As per our respondents, the major reasons revolved around:
1.Unawareness
As the statistics show that out of 185 respondents who are not currently
involved in thrifting, 90% of them have not attended any renewal workshop
where they could have learned about the realities of thrifting.
2.Hygiene issues
3.Doubtfulness about quality
Figure 8– Did you ever participate in any thrift drive or renewal
workshop?
Figure 9– What factors would lead you to involve in thrifting?
STRIDES - A Students' Journal of Shri Ram College of Commerce, Vol.5, Issue 1 & 2152
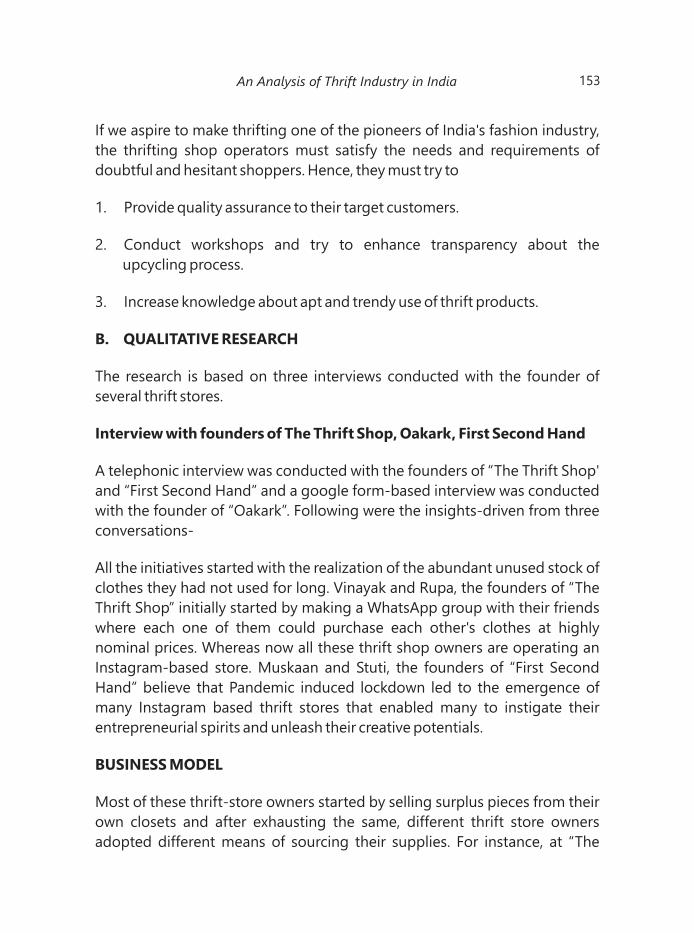
153
If we aspire to make thrifting one of the pioneers of India's fashion industry,
the thrifting shop operators must satisfy the needs and requirements of
doubtful and hesitant shoppers. Hence, they must try to
1. Provide quality assurance to their target customers.
2. Conduct workshops and try to enhance transparency about the
upcycling process.
3. Increase knowledge about apt and trendy use of thrift products.
B. QUALITATIVE RESEARCH
The research is based on three interviews conducted with the founder of
several thrift stores.
Interview with founders of The Thrift Shop, Oakark, First Second Hand
A telephonic interview was conducted with the founders of “The Thrift Shop'
and “First Second Hand” and a google form-based interview was conducted
with the founder of “Oakark”. Following were the insights-driven from three
conversations-
All the initiatives started with the realization of the abundant unused stock of
clothes they had not used for long. Vinayak and Rupa, the founders of “The
Thrift Shop” initially started by making a WhatsApp group with their friends
where each one of them could purchase each other's clothes at highly
nominal prices. Whereas now all these thrift shop owners are operating an
Instagram-based store. Muskaan and Stuti, the founders of “First Second
Hand” believe that Pandemic induced lockdown led to the emergence of
many Instagram based thrift stores that enabled many to instigate their
entrepreneurial spirits and unleash their creative potentials.
BUSINESS MODEL
Most of these thrift-store owners started by selling surplus pieces from their
own closets and after exhausting the same, different thrift store owners
adopted different means of sourcing their supplies. For instance, at “The
An Analysis of Thrift Industry in India
Thrift Shop” they reach out to general people having surplus clothing, willing
to sell it while the founder of “Oakark, Ishita Singh” is reaching out to dealers
and vendors for creating inventory and the founders of “First Second Hand”
also plan to do the same. For “The Thrift Shop”, their customer base includes
both the sellers (Ones with unused clothes in their closets & willing to sell)
and buyers (who are interested in buying those second-hand clothes) and
have majorly women as the customer base.
At “The Thrift Shop”, they frequently announce that they are open for
collections and through which people can tell the founders about the
clothing they are willing to sell. The founders arrange a pickup facility for the
stuff if they find the product to be in a resalable condition. After assessing the
quality and managing the upcycling of received clothes, they approve the
product and reach out to the customer to ask about specifications like
frequency of usage, original MRP, etc and accordingly decide a resell price. If
the product gets sold, they send the decided amount to the selling customer
and keep back a specific amount as a return for the convenience services like
dry-cleaning and shipping. They even add a small note to the clothes while
shipping them to customers to add a personal touch and make the customers
feel proud because of the eco-friendly approach of shopping they opted for.
Unlike “The Thrift Shop”, the founder of Oakark takes the help of her mother
for
At “The Thrift Shop” they keep monitoring their products, and if there is any
particular product that could not find a buyer within 45 days of uploading,
then founders get back to the selling party to discuss a price reduction or to
upcycle it into scrunchies, bags and other products.
CUSTOMER GRIEVENCES
All these thrift stores handle customer queries and grievances via Instagram
DMs themselves. If a complaint arises, they provide their customers with a
return policy or compensate the customers for the mending and fixing.
Hence, a disciplined after service is being provided to customers
mending, fixing, sanitizing and packing all the products and decides the
prices on her own.
154 STRIDES - A Students' Journal of Shri Ram College of Commerce, Vol.5, Issue 1 & 2

COMPETITION FROM E-COMMERCE SITES
The founders of “The Thrift Shop” believe that in the long run, thrifting is
sustainable only if more people spread awareness about its benefits and the
positive impact it creates on society. While the founder of Oakark mentioned
that
TO ENHANCE AWARENESS
The owners of “The Thrift Shop” believe that other operators should
collaborate to open up certain pop-up shops/live stores so that these thrift
store owners could even reach out to customers who are not active on
Instagram but might be interested in such products. Other than this, Rupa,
the founder of “The thrift Shop” believes word-of-mouth marketing is one of
the most potent weapons that thrift shop owners all over the nation could
use to make people aware of this concept. Founders of “First Second Hand”
believe that promotional drives should be oriented towards convincing
people to ignore societal factors that are a hurdle in thrifting for a long time.
They also mentioned the regional disparity thrifting is facing, as it is pretty
trendy in northeastern areas of India but has not gained much popularity in
the other parts of the country, especially northern India
MAJOR_ISSUES_FACED
Since both the founders of “The Thrift Shop” already have a full-time job,
managing a complementary business along with it becomes a hectic job to
perform. Since they both are the only operators of the store, meeting the
urgent deadlines or immediate delivery demands becomes difficult to
manage and at times results in bearing extra costs.
she believes fast fashion stores are not a competition to the thrifting
community as people who thrift know what good they are doing to the
environment by choosing slow fashion. Also, the quality of items sold in thrift
stores is generally better than the ones found at cheap e-commerce websites
that do not care about their workers' rights at all. Hence the founders were
highly optimistic about the future of thrift industry.
While the founders of “The Thrift Shop” are facing an operational challenge,
Ishita Singh on the other hand is facing difficulty to curb down the prevailing
social stigma and make people realize that thrifting does not mean clothes
155An Analysis of Thrift Industry in India
that are all worn out or unhygienic.
REPURCHASES
Approximately 44% of customers of “The Thrift Shop” engage in
repurchasing. The high repurchase rate is a testament to the sanguine future
of the thrift industry.
Overall, these thrift shop owners have a long way to go to establish their stake
in the industry.
INDUSTRY_CHALLENGES
1. Compared to well-established e-commerce websites, which offer
products on a similar pricing scale as thrift stores, the customer base of
these thrift stores is less in number and only a few customers engage in
repurchasing. These thrift stores in India still lack the credibility and
loyalty in the minds of people that sites like Flipkart, Amazon and Myntra
have successfully established.
2. The thrift stores have enormous potential to establish themselves as a
significant part of the fashion industry, but it is currently underutilized
due to low scale of operations, lesser capital investment and a highly
disorganized market. Since most of the Indian thrift stores have been
initiated by the middle-class millennials inspired by their huge piles of
unused clothes in the closet, therefore they face the problem of limited
variety and quantity, narrowing their customer base.
3. Due to their conservative approaches to marketing (social media or
word of mouth only), potential customers are still unaware of the latest
trend prevalent in society. As deduced in our interview with the founders
of First Second Hand, thrifting also faces regional disparity. Though it has
been able to mark its footprints in the country's northeastern region, the
northern region is far behind in the race.
4. The expansion of the second-hand industry is challenging and limited
until people keep it viewing as a secondary source of income despite
finding avenues for making it a full-time business.
156 STRIDES - A Students' Journal of Shri Ram College of Commerce, Vol.5, Issue 1 & 2
5. Absence of a standard return policy makes first-time shoppers hesitant
to make the purchase. For first-time purchasers, this acts as an entry
barrier. The primary concerns revolve around size and quality, which they
cannot be assured of while making online purchases. Since they are
already used items and not too many sizing options are available, it
becomes difficult for the customer to find the perfect size. Therefore, a
proper return mechanism should be in place to make it a pleasant
experience even if the customer is not satisfied with the product
6. Another major potential threat to the industry might be the unsold items
left with these thrift stores, and if not appropriately treated, then we will
be back to square one and the problem of increasing landfills will
continue to persist, as has been observed in the relatively more
established US thrift industry.
RECOMMENDATIONS
1. CAMPUS THRIFT STORES
One such way to create traction for thrift stores among the millennials is to
organize campus thrift drives. These thrift drives have multifold benefits:
ensuring sustainability, spreading awareness and nurturing entrepreneurs
out of young minds. Campus thrift stores usually reach out to their campus
students for donations of laundry, stationery, furniture, household items and
kitchenware. These donated items are purchased by the college students
only, and the revenue generated can be used to provide scholarships and
help needy students. Two such examples are the St. Lawrence University
ReCellar and the campus thrift store at Western Michigan; however, the
concept is still unintroduced to India.
2. Since an individual thrifting unit is too small to become a significant
contributor to the fashion industry, consolidation of distinct units to
become a bigger corporate unit is necessary to establish their
distinguished position in the market. To make it more appealing, thrift
store operators can also collaborate with well-recognized retailers to
distribute discount coupons in exchange for used clothes of that brand to
their customers.
157An Analysis of Thrift Industry in India
3. To keep up with the increasing trend of theme-based parties like
Halloween, Christmas, marriages, these thrift stores can attract such
shoppers. Since these items are meant for just Event-specific use, hence
people do not want to spend much on them and shall opt for thrifting.
4. Celebrities to keep up with the fashionable trend usually have the most
expensive closets abundant in rare and exclusive designer pieces, which is
over the budget for a middle-class consumer to afford, hence thrift stores
could act as a mediator to make celebrity fashion more sustainable
along with simultaneously satisfying the craze of a middle-class
consumer at affordable and economical rates. Emerging thrift stores like
Coutloot are already finding opportunities in this direction.
5. After establishing a presence on various social media platforms, thrift
stores should try to expand their horizon in a more formal and
organized manner, such as by building up a website, launching an app
for reaching out to more customers to source inventory, and being more
diligent with industry standards. They can further expand through
fundraising and increasing their investment opportunities. To expand in a
scalable manner, they should send email alerts to their consumers
whenever new inventory arrives to keep their customers intact.
6. Thrift stores should try that even the unsold inventory is not doomed to
the trash, and such products should be recycled and repurposed to
enhance their utility. Since the forms operating in a managed marketplace
do not have their inventories, they do not have to worry about dispensing
with the unsold inventory. However, firms that follow other business
models apply various methods of disposing off the unsold inventory,
which are as follows-
a) If the ownership of unsold items lies with the thrift shop operator,
which usually happens either with large-scale charitable organizations
like Goodwill or with the nascent stage stores, the owners could
donate these products.
b) However, if the thrift store owner does not own the product, they
could negotiate the further course of action with the actual owning
party before taking any decision on their own for the product.
158 STRIDES - A Students' Journal of Shri Ram College of Commerce, Vol.5, Issue 1 & 2
7. For physical expansion, these online thrift stores can also set up their
pop-up stores in fests and carnivals and avoid the enormous fixed costs
and long-term commitments simultaneously. They can even conduct
workshops, campaign and publicize themselves to spread awareness
about the concept of thrifting and its benefits. Such initiatives can help
the thrift store make its potential customers comfortable with the
concept of thrifting which is relatively new and difficult to adapt in case of
online presence only. A chain of physical thrift stores running under a
single brand name having a pan-India presence will catch the attraction of
many.
CONCLUSION
Over the period, we have seen a surge in the number of thrift stores all over
the globe, but how far will the thrift stores be able to retain their growing
popularity? Will the urge to adopt a cost-saving mode of fashion ever
overcome the social stigmas and taboos associated with second-hand
purchasing? Though Pandemic has already been successful in creating a
craze in mind for many for thrifting in the short run, reports cited by ThredUp
also suggest that the Second-hand market will hit $64bn by 2024.
Thrifting is still a small fish in a big pond of the fashion industry constantly
competing with dominant and technocratic retailers. Moreover, these thrift
stores need to innovate and bring some major transitions to their existing
business models to survive.
Thrifting is a road that is not explored thoroughly, and there are still many
untapped opportunities that, if taken care of, then thrifting has a booming
future ahead. According to our survey,
1. Out of all those, who were currently not involved in thrifting, 84.9% of the
respondents were ready to change their views and start thrifting if
provided with necessary information and conditions.
2. Approximately 55.1% believed that if convinced of the quality of the
goods, they would also be willing to thrift. To establish assurance about
quality, these brands should develop their brand value by engaging
appropriately with the target customers, making the upscaling process
159An Analysis of Thrift Industry in India

more transparent, offering something more valuable than competitors to
your customers and designing a mission statement that is a replica of
your values of carrying out business. This brand value can also help
eliminate the social stigma which is often associated with second-hand
shopping.
Thrifting is no longer just about the money, but about the value it creates.
Conventionally these thrift stores were conceived to be not so presentable,
dark and damp filthy stores. However, if continued in the same manner, these
thrift stores would never be able to face the competition exerted by the fancy
and innovatively designed retail stores. Currently, only a limited number of
customers engage in repurchasing at these thrift stores. Until people keep
associating with thrift just for one-time purchases, it will not ensure a secured
future for the thrifting industry. Thrifting stores need to establish more long-
term and strong relationships with their customers, keeping in mind the
sellers' perspective.
REFERENCES
BBC. (2020, 7 13). Why clothes are so hard to recycle. Retrieved 2020, from
https://www.bbc.com/future/article/20200710-why-clothes-are-so-hard-
to-recycle
Bhatia, D. (2019, August 6). More than 8 in 10 Indians are open to buying
sustainable fashion items . YouGov. https://in.yougov.com/en-
hi/news/2019/08/06/more-8-10-indians-are-open-buying-sustainable-
fash/
Bird, J. (2018, Sept 9). Fashion's Dirty Little Secret And How It's Coming Clean.
Forbes. https://www.forbes.com/sites/jonbird1/2018/09/09/fashions-dirty-
little-secret-and-how-its-coming-clean/?sh=3fa41f201771
Boston Consultancy Group. (2019). Pulse of the Fashion Industry. Retrieved
from http://media-publications.bcg.com/france/Pulse-of-the-Fashion-
Industry2019.pdf
Darley, W. K., & Lim, J. S. (1999, October 1). Effects of store image and attitude
towards second-hand stores on shopping frequency and distance traveled.
160 STRIDES - A Students' Journal of Shri Ram College of Commerce, Vol.5, Issue 1 & 2
International Journal of Retail and Distribution Management, 27(8), 311-318.
Planet Aid. (2017, January 20). Retrieved from Benefits of the Secondhand
Clothing Industry: https://www.planetaid.org/blog/benefits-of-the-second-
hand-clothing-industry
Sabhani, A. (2017). The Feasibility Of Thrift Store In College Campuses In
Kharghar . Academia . ht tps : //www.academia .edu/37050767/
THE_FEASIBILITY_OF_THRIFT_STORE_IN_COLLEGE_CAMPUSES_IN_KHARGH
AR_BY_ANSHIKA_SABHANI
Down to Earth. (2020, October 18). Down to Earth. Retrieved from Fashion
industry may use quarter of world's carbon budget by 2050:
https://www.downtoearth.org.in/news/environment/fashion-industry-may-
use-quarter-of-world-s-carbon-budget-by-2050-61183
Goodwill Industries International. (n.d.). https://www.goodwill.org/about-us/
Hale, K. (2020, June 1). Walmart Taps Inti $32 Billion Second Hand Clothing
Market. Forbes. https://www.forbes.com/sites/korihale/2020/06/01/
w a l m a r t - t a p s - i n t o - 3 2 - b i l l i o n - s e c o n d - h a n d - c l o t h i n g -
market/?sh=296ab93b1fa9
Han, Jinhee, "Understanding second-hand retailing: A resource based
perspective of best practices leading to business success" (2013). Graduate
Theses and Dissertations. 13636. https://lib.dr.iastate.edu/etd/13636/
The Impact Of a Cotton T-Shirt. (2013, January 16). World Wild Life.
https://www.worldwildlife.org/stories/the-impact-of-a-cotton-t-shirt
Nautiyal, R. (2015, December 30). Coutloot's pre-loved fashion platform is
second to none. Yourstory. https://yourstory.com/2015/12/coutloot?utm_
pageloadtype=scroll
Shahbandeh , M . (2020 , dec 2 ) . Globa l Appare l Marke t .
https://www.statista.com/topics/5091/apparel-market-worldwide/
Taskin, B. (2019, August 19). Eco-friendly fashion: India's sustainable apparel
161An Analysis of Thrift Industry in India
market is finding more takers. Money Control.
https://www.moneycontrol.com/news/india/eco-friendly-fashion-indias-
sustainable-apparel-market-is-finding-more-takers-4344381.html
The Salvation Army International. (n.d.). https://www.salvationarmy.org/
T h r e a d U P. ( n . d . ) . C a r e e r s a t t h r e d U P . C L E V E R I S M .
https://www.cleverism.com/company/thredup/#:~:text=thredUP%20has%2
0a%20multi%2Dsided,have%20been%20vetted%20for%20quality
2020 Resale Report. (2020, June). ThreadUp.
https://www.thredup.com/resale/
Viktor. (2020, November 3). The Poshmark Business Model – How Does
Poshmark Work & Make Money? Productmint.
https://productmint.com/the-poshmark-business-model-how-does-
poshmark-make-money/
162 STRIDES - A Students' Journal of Shri Ram College of Commerce, Vol.5, Issue 1 & 2
163
Discussion of the
Link Between Air
Pollution and
Economic Growth in
Indian States
The paper discusses the global scenario of
environmental pollution and its impact on
society. It builds the link between environmental
pollution and economic development by
reviewing the existing academic literature.
Further, we discuss the level of air pollution in
India, particularly PM concentration, and its 10
effect on the states' economic activity using panel
data regression. The paper concludes that the
increasing PM concentration has a negative 10
impact on the state net domestic product, thus on
the states' economic activity.
Keywords: Environmental Pollution, Economic
Development, PM Concentration, State Net 10
Domestic Product
INTRODUCTION
Environmental pollution is one of the most
significant problems facing humanity today,
even when it is certainly not a new phenomenon.
Rajsi Sah
B.A. (Hons.) Economics
SRCC, DU
Prachi Yadav
B.A. (Hons.) Economics
SRCC, DU
Mentor:
Ms.
Assistant Professor
Department of Economics
SRCC, DU
Anushruti
ABSTRACT
164 STRIDES - A Students' Journal of Shri Ram College of Commerce, Vol.5, Issue 1 & 2
It refers to the contamination of the physical and biological components of
the earth or atmosphere system to such an extent that environmental
processes are adversely affected. There are three significant primary forms of
pollution: air, water, and soil pollution, whereas other recognised forms
include radioactive, noise, light, and thermal pollution.
The causes of environmental pollution are industrialisation, urbanisation,
population growth, mining, and exploration. Additionally, transboundary
movement of pollutants, for instance, non-functional electrical and
electronic equipment, contribute significantly to air, water and soil pollution.
Furthermore, gaseous pollutants, toxic metals, and particulate matter (PM)
into the atmosphere trigger air pollution. The release of industrial effluents,
agricultural run-offs, sewage, and dumping of electronic waste contaminates
water. Lastly, activities such as mining, deforestation, illegal dumping and the
creation of landfills are responsible for soil pollution.
Of all the forms, air pollution is the most prominent threat to health and the
environment. It develops in two contexts, indoor or household air pollution
and outdoor air pollution and is a significant negative externality as it
imposes an external cost to people who are external to the transaction of
polluting product. The existing figures on its impact on society reinstate the
claim. According to World Health Organisation (WHO) estimates, 9 out of 10
people breathe air that exceeds WHO guideline limits containing pollutants'
high level. In contrast, more than 50 per cent of the people reside in areas that
do not fulfil the least stringent air quality target set by WHO. Globally, it is the
low and middle-income countries that have the highest exposure to
contaminated air.
Outdoor air pollution is reported to cause approximately 4.2 million deaths.
Combined with household air pollution, it results in around 7 million
premature deaths every year. The impact is even more severe among low-
income earners, children and other vulnerable groups, mainly in developing
nations. The fact above depicts the daunting state of the environment and its
consequences at a global level, which necessitates the focus on the impact of
air pollution.
The paper therefore aims to analyse the impact of air pollution on the
economic activity of India.
165
- AIR POLLUTION IN INDIA
The world's sixth-largest economy by nominal gross domestic product (GDP)
and third-largest by purchasing power parity (PPP), India currently struggles
with tackling the extent of pollution across the nation. According to the
World Air Quality Report (2020) published by Swiss organisation IQAir, India
is the third most polluted country globally. The report finds that 22 of the 30
most polluted cities globally are in India, with Delhi ranking as the most
polluted capital city in the world. The situation is no different in the case of
water pollution. It is reported that nearly 70 per cent of India's surface water is
contaminated and unfit for consumption. According to a report published by
World Bank, poor water quality impedes economic progress, stymies human
potential, and reduces food production.
Air pollution is an important cause of premature deaths and several related
diseases. The high incidence of deaths and illnesses associated with this
menace and its adverse impact on the Indian economy through reduced
productivity and decreased labour supply, added health expenditures, and
lost welfare can impede the nation's aspiration to be a 5 trillion dollar
economy by 2024. In 2020, India was reported as the third most polluted
country globally with a PM concentration, five times above World Health 2.5
Organisation (WHO) exposure recommendation.
A few significant causes of air pollution in India are unchecked growth of
human population, industrialisation, urbanisation and uncontrolled
exploitation of nature. Air pollution is further aggravated by increasing traffic,
rapid and unsustainable economic development, and burning of fossil fuels.
Carbon monoxide released due to incomplete combustion of carbon-based
fuels slows human reflexes. Vehicular emissions are the largest
anthropogenic source of Carbon monoxide. The greenhouse gases, ozone,
methane, carbon dioxide and nitrous oxides released from industries,
vehicles, fossil fuels further lead to the Greenhouse effect that causes climate
change.
Transportation air pollution, caused by automobiles, has seen a great rise in
India. The number of motorised vehicles in India has increased 29 times in
the last few decades, from 1.9 million in 1971 to 55.0 million in 2001, as shown
Discussion of the Link Between Air Pollution and Economic Growth in Indian States

166
in Figure 1. This increase was not consistent across all vehicle types: buses had
a 7-fold increase; trucks saw a 9-fold increase; cars, Jeeps, and taxis saw a 10-
fold increase; and two-wheelers witnessed an astounding 67-fold increase.
Further, the quality of fuel and lubricating oil has also had a key role in India's
transportation air pollution. Indian gasoline has high volatility and vast
majority of gasoline automobiles in India are carbureted. These
characteristics, together with India's high ambient temperatures, raise the
potential production of ground-level ozone.
Consequentially, studies have shown that the adverse effects of air pollution
on health have been growing in India. It has been observed that short-term
and long-term exposure to polluted air is associated with a higher disease
burden and mortality, as shown in Figure 1.
Figure 1: Deaths due to air pollution
Source: The India State-Level Disease Burden Initiative as part of the Global Burden of
Disease Study (2019)
Another impact of the high air pollution levels is the overwhelming increase
in chronic respiratory diseases, contributing to the total disability-adjusted 1
life-years (DALYs), as highlighted in Figure 2 .
1.67 million deaths in
India were due to air
pollution
17.8 per cent of the
total deaths in India
1 DALY is a composite metric that combines the years of life lost due to premature death (YLLs) and the years lived with disability (YLDs).
STRIDES - A Students' Journal of Shri Ram College of Commerce, Vol.5, Issue 1 & 2

167
Figure 2: Chronic respiratory diseases due to air pollution
Source: The India State-Level Disease Burden Initiative as part of the Global Burden of
Disease Study (2019)
The Global Burden of Disease Study (2019) estimated the economic loss of
US$ 28.8 billion due to lost output from premature deaths and US$ 8.0 billion
due to morbidity due to air pollution. This loss is equivalent to 1.36 per cent of
India's GDP in 2019. The per capita economic loss due to air pollution in India
was 26·50 dollars. Among the Indian states, the economic loss attributable to
air pollution as a percentage of state GDP varied from 0·67per cent to 2·15 per
cent. Figure 3 (below) illustrates the states which experienced high losses.
Figure 3: Economic loss attributable to air pollution as a percentage of
state GDP
Source: The India State-Level Disease Burden Initiative as part of the Global Burden of
Disease Study (2019)
Total DALYs from lung diseases
Total DALYs due to air pollution
Total DALYs
39.5 %
11.5 %
2.15%
1.95%
1.70% 1.70%1.55% 1.52% 1.50%
0.00%
0.50%
1.00%
1.50%
2.00%
2.50%
Uttar Pradesh
Bihar Madhya Pradesh
Rajasthan Chattisgarh Punjab Uttarakhand
In p
er
cen
t
States
Discussion of the Link Between Air Pollution and Economic Growth in Indian States

168
LITERATURE REVIEW
In today's highly globalised world with countries integrating various
dimensions, economic growth is often accompanied by its harmful effects.
One of the most conspicuous of these effects is environmental degradation.
It is often discussed that there exists a two-way relationship between
economic growth and environmental pollution. While focusing on economic
growth leads to higher levels of pollution in the environment, pollution and
pollution reduction measures adversely impact economic growth and
development. This section aims to review the existing academic literature in
understanding the link between the two.
Over the years, it has been a widespread belief that rich nations pollute the
most. Grossman & Krueger (1995) contradicted this widely held notion by
introducing the concept of Environmental Kuznets Curve (EKC) in their study
on the potential impacts of North Atlantic Free Trade Agreements, popularly
known as NAFTA. It is an inverted U-shaped curve that hypothesises the
relationship between various indicators of environmental degradation and
per capita income.
Figure 4: The Environmental Kuznets Curve
Source: MacDermott et al. (2011)
STRIDES - A Students' Journal of Shri Ram College of Commerce, Vol.5, Issue 1 & 2
169
As depicted in figure 4 above, the pollution levels increase with the increase in
per capita income and declines after crossing a threshold of income. The low-
income countries with low levels of industrialisation and consumption rely
heavily on agriculture and have relatively more minor environmental
degradation. As the development begins and industries dot the economy,
the emission of pollutants increases. However, as the process continues and
wealthy nations become service-oriented, more resources are used to adopt
cleaner technologies, leading to a fall in pollution levels.
Over the years, several pollution measures have been employed to
demonstrate the inverted U-shape of the Environmental Kuznets's Curve.
Sulphur dioxide emissions, toxic wastes, and water pollution appear to rise
and then decline with per capita GDP. However, the researchers do not
observe this pattern in all pollution measures (MacDermott et al., 2011).
Shafik (1994) also claimed that urban waste and carbon emissions also fail to
show an inverted U-shaped relation with per capita income. Plausible reasons
might be that the turning point has not reached yet or maybe that the
threshold has already been crossed. Therefore, the universal validity of the
Environmental Kuznets Curve is dubious. The relationship might hold for
some countries or some pollutants whilst failing for others.
Environmental pollution and economic development affect each other in
three ways.
The first aspect in the relationship between the two is the role of economic
development in environmental degradation. It can play out in two ways: first,
the development of infrastructure using the existing resource base and
second, the increased use of pollution-intensive resources, and an outcome
of increased disposable incomes (Ali & Puppim de Oliveira, 2018).
Infrastructure development, in particular, has remained to be one of the
direct determinants of pollution in absolute terms. Even though
infrastructure structure leads to positive social development, roads and
transport infrastructure construction are also considered channels for other
forms of pollution-intensive infrastructure development.
Muyibi et al. (2007), in their paper, have discussed the impact of economic
development on water pollution in Malaysia using econometric analysis
Discussion of the Link Between Air Pollution and Economic Growth in Indian States
170
tools. Development in terms of industrialisation, urbanisation and population
growth accounts for various changes in the yearly level of pollution in rivers in
Malaysia. For instance, GDP per capita accounted for 81% variances in rivers'
pollution episode over the period under consideration. Population,
accounted for 74% of total pollution in rivers, and industrial production
accounted for 78%.
Davis (2012) hypothesised that economic activity significantly impacts
exposure to air pollution and, ultimately, human health. Using county-level
employment statistics in California (1980–2000), along with significant
regulatory periods and other controlling factors, to estimate local
concentrations of the coefficient of haze, carbon monoxide, and nitrogen
dioxide using a mixed regression model approach, Davis found that the
relationship between employment measures and air pollution was
statistically significant, suggesting that air quality improves during economic
downturns. Additionally, major air quality regulations significantly reduced
air pollution levels over the study period.
The second way is the direct impact of environmental pollution on economic
development by hindering the process itself. The report published by OECD,
'The economic consequences of air pollution policy highlights', focuses on
projected economic consequences of outdoor air pollution for the period
2015-2060. It assesses the market costs of air pollution, which includes labour
productivity, health expenditures, and changes in crop yields. It also discusses
the non-market health impacts of outdoor air pollution, i.e. increased
mortality and morbidity. Rising emissions of air pollutants are projected to
increase the concentration of particulate matter and ground-level ozone. The
report finds that countries of South and East Asia, especially China and India,
witness a high average population-weighted concentration of these
pollutants. The most dangerous consequence of this is the rising number of
premature deaths. The projections reveal that the number of premature
deaths will increase to 6-9 million annually in 2016, in line with the latest
Global Burden of Disease estimates. This implies more hospital admissions,
additional health expenditures, and a high number of lost working days.
Consequently, the market costs of air pollution are projected to lead to global
annual economic costs of 1% of global gross domestic product (GDP) by
STRIDES - A Students' Journal of Shri Ram College of Commerce, Vol.5, Issue 1 & 2
171
2060. On the other hand, the non-markets costs are projected using
estimates of the individual willingness-to-pay to reduce the risk of premature
death and the annual global welfare costs associated with pain and suffering
from illness. These numbers are projected to be around USD 18-25 trillion
and USD 2.2 trillion in 2060, respectively. It is evident from the above
estimates that pollution can have a severe negative impact on the global
economy.
The third way in which environmental pollution and economic development
interact with each other is through abatement policies. Environmental
damage is the opportunity cost for initial development, which later subsides
through self-correcting mechanisms. Stringent environmental regulations
have led to better outcomes lately. Rich nations are more environmentally
conscious while poor are more environment-friendly (Martinez-Alier, 2003).
It is contested that expenditure incurred on pollution abatement has a low
cost-benefit ratio. A detailed study on the impact of pollution abatement
costs on plant-level productivity in the U.S. shows unpleasant results. It was
found that an increase in abatement costs has led to a decline in productivity
in various sectors (Gray & Shadbegian, 2003).
Resources to be spent on infrastructure investment and R&D are now being
diverted towards environment conservation. However, public benefits in the
long term tend to surpass the private costs incurred. The productivity of
workers is enhanced, and new cost-effective technologies emerge.
Inclination towards cleaner and greener environments helps in building
sustainable economies. Studies show that pollution tax helps achieve the
dual objectives of reducing pollution while spurring economic growth (Fisher
& Van Marrevijk, 1998). Therefore, the impact of environmental regulations
varies across different governance structures and economic systems.
RESEARCH METHODOLOGY
Description of data
This section aims to analyse the relationship between the level of air pollution
in India and its impact on the state net domestic product. This study compiles
Discussion of the Link Between Air Pollution and Economic Growth in Indian States
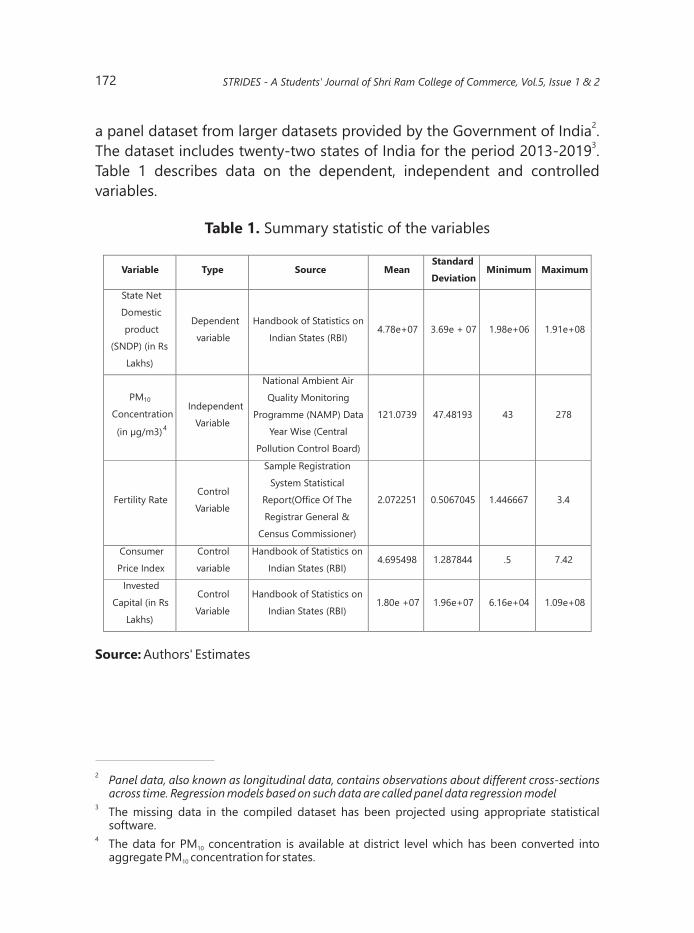
172
2a panel dataset from larger datasets provided by the Government of India .
3The dataset includes twenty-two states of India for the period 2013-2019 .
Table 1 describes data on the dependent, independent and controlled
variables.
Table 1. Summary statistic of the variables
Source: Authors' Estimates
2 Panel data, also known as longitudinal data, contains observations about different cross-sections
across time. Regression models based on such data are called panel data regression model3
The missing data in the compiled dataset has been projected using appropriate statistical software.
4The data for PM concentration is available at district level which has been converted into 10
aggregate PM concentration for states. 10
Variable Type Source Mean Standard
Deviation Minimum Maximum
State Net
Domestic
product
(SNDP) (in Rs
Lakhs)
Dependent
variable
Handbook of Statistics on
Indian States (RBI)4.78e+07 3.69e + 07 1.98e+06 1.91e+08
PM10
Concentration
(in µg/m3)4
Independent
Variable
National Ambient Air
Quality Monitoring
Programme (NAMP) Data
Year Wise (Central
Pollution Control Board)
121.0739 47.48193 43 278
Fertility Rate Control
Variable
Sample Registration
System Statistical
Report(Office Of The
Registrar General &
Census Commissioner)
2.072251 0.5067045 1.446667 3.4
Consumer
Price Index
Control
variable
Handbook of Statistics on
Indian States (RBI)4.695498 1.287844 .5 7.42
Invested
Capital (in Rs
Lakhs)
Control
Variable
Handbook of Statistics on
Indian States (RBI)1.80e +07 1.96e+07 6.16e+04 1.09e+08
STRIDES - A Students' Journal of Shri Ram College of Commerce, Vol.5, Issue 1 & 2
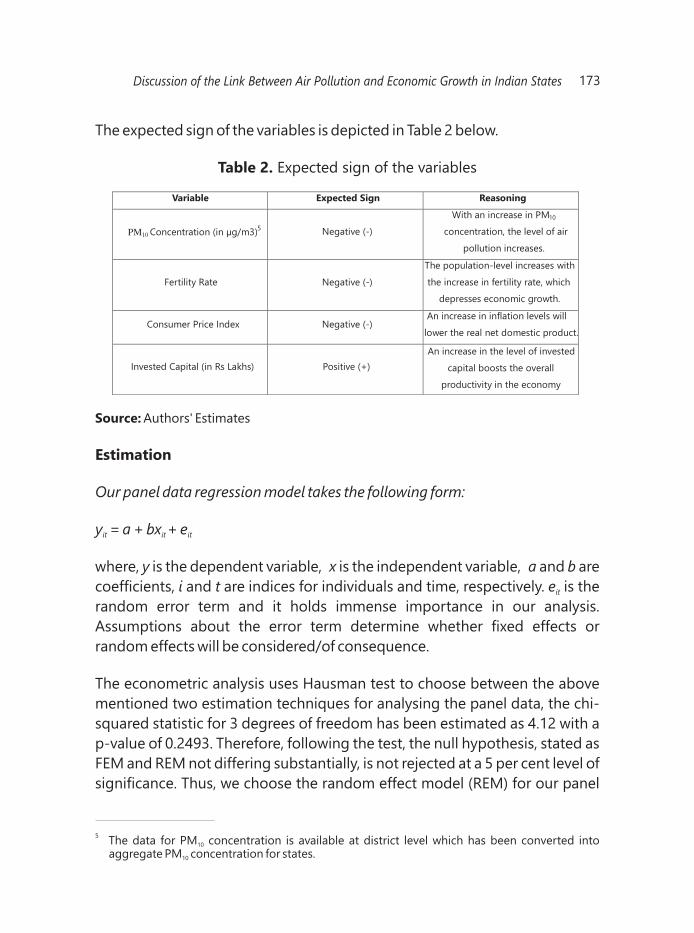
Variable Expected Sign Reasoning
PM10 Concentration (in µg/m3)5
Negative (-)
With an increase in PM10
concentration, the level of air
pollution increases.
Fertility Rate Negative (-)
The population-level increases with
the increase in fertility rate, which
depresses economic growth.
Consumer Price Index Negative (-) An increase in inflation levels will
lower the real net domestic product.
Invested Capital (in Rs Lakhs) Positive (+)
An increase in the level of invested
capital boosts the overall
productivity in the economy
173
The expected sign of the variables is depicted in Table 2 below.
Table 2. Expected sign of the variables
Source: Authors' Estimates
Estimation
Our panel data regression model takes the following form:
y = a + bx + eit it it
where, y is the dependent variable, x is the independent variable, a and b are
coefficients, i and t are indices for individuals and time, respectively. e is the it
random error term and it holds immense importance in our analysis.
Assumptions about the error term determine whether fixed effects or
random effects will be considered/of consequence.
The econometric analysis uses Hausman test to choose between the above
mentioned two estimation techniques for analysing the panel data, the chi-
squared statistic for 3 degrees of freedom has been estimated as 4.12 with a
p-value of 0.2493. Therefore, following the test, the null hypothesis, stated as
FEM and REM not differing substantially, is not rejected at a 5 per cent level of
significance. Thus, we choose the random effect model (REM) for our panel
5 The data for PM concentration is available at district level which has been converted into 10
aggregate PM concentration for states. 10
Discussion of the Link Between Air Pollution and Economic Growth in Indian States
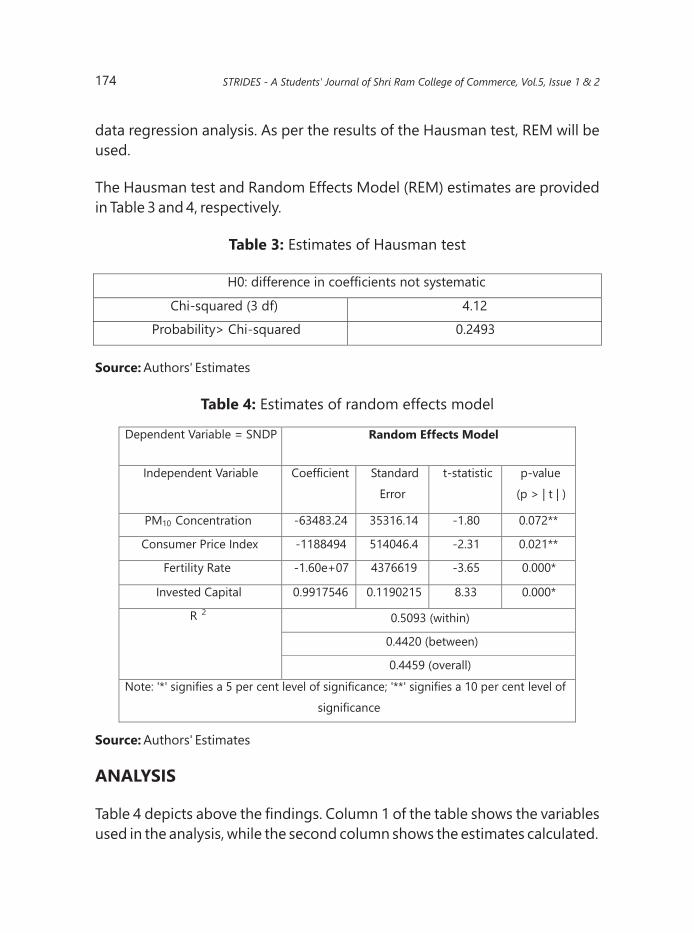
Dependent Variable = SNDP Random Effects Model
Independent Variable Coefficient Standard
Error
t-statistic p-value
(p > | t | )
PM10 Concentration -63483.24 35316.14 -1.80 0.072**
Consumer Price Index -1188494 514046.4 -2.31 0.021**
Fertility Rate -1.60e+07 4376619 -3.65 0.000*
Invested Capital 0.9917546 0.1190215 8.33 0.000*
R 2 0.5093 (within)
0.4420 (between)
0.4459 (overall)
Note: '*' signifies a 5 per cent level of significance; '**' signifies a 10 per cent level of
significance
174
data regression analysis. As per the results of the Hausman test, REM will be
used.
The Hausman test and Random Effects Model (REM) estimates are provided
in Table 3 and 4, respectively.
Table 3: Estimates of Hausman test
Source: Authors' Estimates
Table 4: Estimates of random effects model
Source: Authors' Estimates
ANALYSIS
Table 4 depicts above the findings. Column 1 of the table shows the variables
used in the analysis, while the second column shows the estimates calculated.
Probability> Chi-squared 0.2493
H0: difference in coefficients not systematic
Chi-squared (3 df) 4.12
STRIDES - A Students' Journal of Shri Ram College of Commerce, Vol.5, Issue 1 & 2
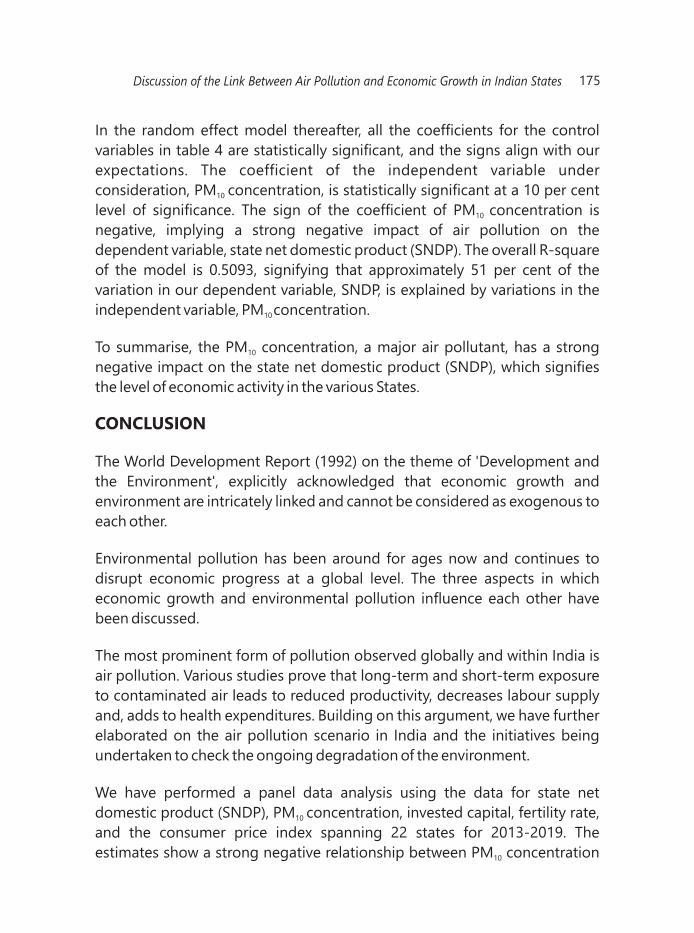
175
In the random effect model thereafter, all the coefficients for the control
variables in table 4 are statistically significant, and the signs align with our
expectations. The coefficient of the independent variable under
consideration, PM concentration, is statistically significant at a 10 per cent 10
level of significance. The sign of the coefficient of PM concentration is 10
negative, implying a strong negative impact of air pollution on the
dependent variable, state net domestic product (SNDP). The overall R-square
of the model is 0.5093, signifying that approximately 51 per cent of the
variation in our dependent variable, SNDP, is explained by variations in the
independent variable, PM concentration. 10
To summarise, the PM concentration, a major air pollutant, has a strong 10
negative impact on the state net domestic product (SNDP), which signifies
the level of economic activity in the various States.
CONCLUSION
The World Development Report (1992) on the theme of 'Development and
the Environment', explicitly acknowledged that economic growth and
environment are intricately linked and cannot be considered as exogenous to
each other.
Environmental pollution has been around for ages now and continues to
disrupt economic progress at a global level. The three aspects in which
economic growth and environmental pollution influence each other have
been discussed.
The most prominent form of pollution observed globally and within India is
air pollution. Various studies prove that long-term and short-term exposure
to contaminated air leads to reduced productivity, decreases labour supply
and, adds to health expenditures. Building on this argument, we have further
elaborated on the air pollution scenario in India and the initiatives being
undertaken to check the ongoing degradation of the environment.
We have performed a panel data analysis using the data for state net
domestic product (SNDP), PM concentration, invested capital, fertility rate, 10
and the consumer price index spanning 22 states for 2013-2019. The
estimates show a strong negative relationship between PM concentration 10
Discussion of the Link Between Air Pollution and Economic Growth in Indian States
176
and SNDP when controlled for other variables. It implies that air pollution
negatively influences the level of output produced across the states in India.
There is a direct linkage between rising pollution levels in Indian cities and
expanding urbanisation. Several notable initiatives and policies have come
into force in recent years to fight this menace.
The step to launch the National Clean Air Programme, 2019, is laudable. The
programme aims to reduce the particulate matter concentrations to 20%-
30% by 2024, keeping 2017 as the base year. The scrapping policy of vehicles
announced in February 2021 will help combat the problem of air pollution
and provide impetus to growth.
Another significant initiative was the launch of Decarbonizing Transport in
Emerging Economies project in India by Niti Aayog, jointly with the
International Transport Forum of OECD. The project will help India to turn its
climate ambitions into reality. As estimated, CO2 emissions are likely to
increase to 6% annually in India by 2030. The Decarbonisation project will
help remove the legacy of obstacles that lie in the pathway of zero-emission
targets and create a cleaner, healthier and more affordable future for
everyone through improved design planning systems and more investment
in clean energy infrastructure.
While these policies exist, certain loopholes need to be addressed. For
example, The National Clean Air Program suffers from severe challenges. In a
study conducted by Council on Energy, Environment and Water (CEEW) and
Urban Emissions, there is no legal framework for reviewing and updating
plans and a lack of clear delineation of responsibilities. A second drawback is
the city planning approach that limits the scope. Roughly 30 per cent of air
pollution is by sources outside the city. The system, therefore, should be
inclined towards regional coordination among cities and states. Most of the
pollution control measures focus on transport emissions. The International
Energy Agency predicts that India's future emissions will mostly come from
transport infrastructure, industry and buildings and points out the
opportunity to grow green. However, there are substantial local differences in
the contribution of each polluting source which the planners fail to capture.
Further, only 25 per cent of the city plans have access to data on the local
emission sources, which points towards the limitation of missing data. India is
STRIDES - A Students' Journal of Shri Ram College of Commerce, Vol.5, Issue 1 & 2
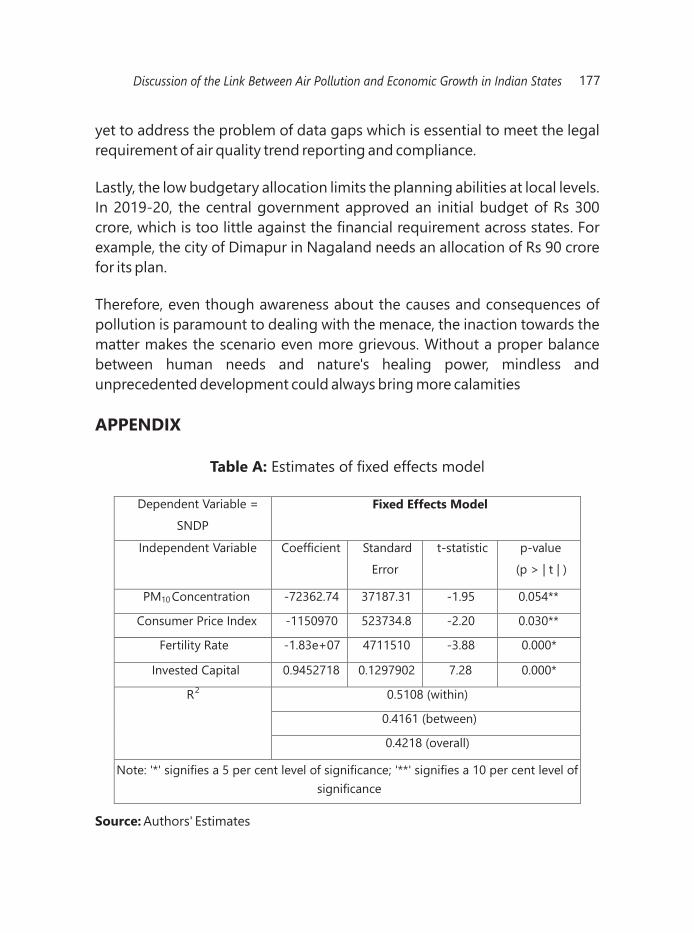
177
yet to address the problem of data gaps which is essential to meet the legal
requirement of air quality trend reporting and compliance.
Lastly, the low budgetary allocation limits the planning abilities at local levels.
In 2019-20, the central government approved an initial budget of Rs 300
crore, which is too little against the financial requirement across states. For
example, the city of Dimapur in Nagaland needs an allocation of Rs 90 crore
for its plan.
Therefore, even though awareness about the causes and consequences of
pollution is paramount to dealing with the menace, the inaction towards the
matter makes the scenario even more grievous. Without a proper balance
between human needs and nature's healing power, mindless and
unprecedented development could always bring more calamities
APPENDIX
Table A: Estimates of fixed effects model
Source: Authors' Estimates
Dependent Variable =
SNDP
Fixed Effects Model
Independent Variable Coefficient Standard
Error
t-statistic p-value
(p > | t | )
PM10 Concentration -72362.74 37187.31 -1.95 0.054**
Consumer Price Index -1150970 523734.8 -2.20 0.030**
Fertility Rate -1.83e+07 4711510 -3.88 0.000*
Invested Capital 0.9452718 0.1297902 7.28 0.000*
R2 0.5108 (within)
0.4161 (between)
0.4218 (overall)
Note: '*' signifies a 5 per cent level of significance; '**' signifies a 10 per cent level of
significance
Discussion of the Link Between Air Pollution and Economic Growth in Indian States
178
REFERENCES
Ali, S. H., & Puppim de Oliveira, J. A. (2018). Pollution and economic
development: An empirical research review. Environmental Research Letters,
13(12), 123003. https://doi.org/10.1088/1748-9326/aaeea7
Central Pollution Control Board. (2012). Epidemiological Study on Effect of
A i r P o l l u t i o n o n H u m a n H e a l t h ( A d u l t s ) i n D e l h i .
https://cpcb.nic.in/uploads/healthreports/Epidemiological_study_Adult_Pe
er%20reviewed-2012.pdf
Conrad, K., & Morrison, C. (1985). The impact of pollution abatement
investment on productivity change: An Empirical comparison of the U.S.,
Germany, and Canada. https://doi.org/10.3386/w1763
Cruze, D. C. (2021, February 7). Vehicle scrapping policy: 10 points car owners
and buyers should know. Mint. https://www.livemint.com/auto-
news/vehicle-scrapping-policy-ten-key-points-car-owners-and-buyers-
should-know-11612695052084.html
Davis, M. E. (2012). Recessions and health: The impact of economic trends on
air pollution in California. American Journal of Public Health, 102(10), 1951-
1956. https://doi.org/10.2105/ajph.2012.300658
Fisher, E. O., & Marrewijk, C. V. (1998). Pollution and economic growth. The
Journal of International Trade & Economic Development, 7(1), 55-69.
https://doi.org/10.1080/09638199800000004
Gray, W. B., & Shadbegian, R. J. (2003). Plant vintage, technology, and
environmental regulation. Journal of Environmental Economics and
Management , 46(3), 384-402. https://doi.org/10.1016/s0095-
0696(03)00031-7
Grossman, G. M., & Krueger, A. B. (1995). Economic growth and the
environment. The Quarterly Journal of Economics, 110(2), 353-377.
https://doi.org/10.2307/2118443
Gujarati, D. N., & Porter, D. C. (2012). Panel Data Regression Models. In Basic
STRIDES - A Students' Journal of Shri Ram College of Commerce, Vol.5, Issue 1 & 2
179
Econometrics (5th ed., pp. 591-616). Douglas Reiner.
India air quality index (AQI) and air pollution information | AirVisual. (n.d.).
Empower ing the Wor ld to Breathe C leaner A i r | IQAi r.
https://www.iqair.com/us/india
India State-Level Disease Burden Initiative Air Pollution Collaborators.
(2020). Health and economic impact of air pollution in the states of India: the
Global Burden of Disease Study 2019. The Lancet Planetary Health, 5(1), E25-
E38. https://doi.org/10.1016/S2542-5196(20)30298-9
Kelkar, U. (2021, March 26). Net-zero emission with economic growth? Yes,
i t ' s p o s s i b l e f o r I n d i a . T h e I n d i a n E x p r e s s .
https://indianexpress.com/article/opinion/columns/india-net-zero-
emission-climate-change-ghg-emissions-economic-growth-7245401/
Long-term, time-bound, national level strategy to tackle air pollution-
national clean air programme (NCAP). Press Information Bureau.
https://pib.gov.in/PressReleasePage.aspx?PRID=1655203#:~:text=The%20
Central%20Government%20launched%20National,2017%20as%20the%20
base%20year
MacDermott, R., Basuchoudhary, A., & Bang, J. (2011). Trade, trade
agreements and the environment. Encyclopedia of Environmental Health,
394-399. https://doi.org/10.1016/b978-0-444-52272-6.00566-3
Martínez-Alier, J. (2003). The environmentalism of the poor: A study of
ecological conflicts and valuation. Edward Elgar Publishing.
Mujtaba, G., & Shahzad, S. J. (2020). Air pollutants, economic growth and
public health: Implications for sustainable development in OECD countries.
Environmental Science and Pollution Research, 28(10), 12686-12698.
https://doi.org/10.1007/s11356-020-11212-1
Muyibi, S. A., Ambali, A. R., & Eissa, G. S. (2007). The impact of economic
development on water pollution: Trends and policy actions in Malaysia.
W a t e r R e s o u r c e s M a n a g e m e n t , 2 2 ( 4 ) , 4 8 5 - 5 0 8 .
https://doi.org/10.1007/s11269-007-9174-z
Discussion of the Link Between Air Pollution and Economic Growth in Indian States
180
NITI Aayog, ITF launch decarbonising transport project in India. Press
I n f o r m a t i o n B u r e a u .
https://pib.gov.in/PressReleasePage.aspx?PRID=1634052
OECD. (2016). The economic consequences of outdoor air pollution. OECD
Publishing, Paris. https://doi.org/10.1787/9789264257474-en
Shafik, N. (1994). Economic development and environmental quality: An
econometric analysis. Oxford Economic Papers, 46(Supplement_1), 757-773.
https://doi.org/10.1093/oep/46.supplement_1.757
Stern, D. I. (2017). The environmental Kuznets curve. Oxford Research
E n c y c l o p e d i a o f E n v i r o n m e n t a l S c i e n c e .
https://doi.org/10.1093/acrefore/9780199389414.013.401
Ukaogo, P. O., Ewuzie, U., & Onwuka, C. V. (2020). Environmental pollution:
Causes, effects, and the remedies. Microorganisms for Sustainable
Environment and Health, 419-429. https://doi.org/10.1016/b978-0-12-
819001-2.00021-8
World Bank. (1992). World Development Report 1992: Development and the
Environment. New York: Oxford University Press © World Bank.
https://openknowledge.worldbank.org/handle/10986/5975
World's most polluted cities in 2019 - PM2.5 ranking | AirVisual. Empowering
the World to Breathe Cleaner Air | IQAir. https://www.iqair.com/world-most-
polluted-cities
Zaveri, E., Damania, R., Desbureaux, S., Rodella, A. S., & Russ, J. (2019). Quality
unknown: The invisible water crisis. Washington, DC: World Bank.
https://openknowledge.worldbank.org/handle/10986/32245
STRIDES - A Students' Journal of Shri Ram College of Commerce, Vol.5, Issue 1 & 2
181
The Nexus Between
Economic Growth
and Public Outlays
and Deficits in India:
An Econometric
Analysis
In recent years there has been a slew of debate
about the impact of fiscal deficit on GDP growth.
Different theories describe different processes
behind this impact, thus creating contradictory
results in terms of magnitude and even the
direction of the impact. This paper examines the
relationship between fiscal deficit and GDP
growth rate in the Indian economy. We also
determine whether the capital expenditure is
more successful in boosting economic activity
than revenue expenditure as propounded by
many. The study conducts a regression analysis
using data covering the period of 1978-2019 by
using the Autoregressive Distributed Lag (ARDL)
and Error Correction Model (ECM) technique.
Both the long-run and short-run analysis is done.
The results of the study showed that both the
revenue expenditure and capital expenditure
positively impact GDP growth rate in the long run
Somya Garg
B.A. (Hons.) Economics
SRCC, DU
Mentor:
Dr. Ravi Kant
Assistant Professor
Department of Economics
SRCC, DU
ABSTRACT
182 STRIDES - A Students' Journal of Shri Ram College of Commerce, Vol.5, Issue 1 & 2
whereas fiscal deficit does not have a significant long-run relationship with
GDP growth.
Keywords: Fiscal Deficit, Government Expenditure, Capital Expenditure,
Revenue Expenditure, Autoregressive Distributed Lag, Error Correction
Model, India.
INTRODUCTION
A government incurs various kinds of expenditures to ensure the provision of
public welfare schemes, boost the economy, and bring in economic stability.
These outflows sometimes result in deficits as well. India has been getting
high levels of fiscal deficit even after the adoption of the Fiscal Responsibility
and Budget Management Act (FRBM) in 2003. This has in turn posed a major
threat to the stability of the economy. However, the impact is widely
contested in terms of magnitude and direction. Thus, the question of interest
is how have fiscal deficits impacted India's economic growth?
A large fiscal deficit can affect a country's economic growth adversely. It
forces the government to take on large amounts of loans and a high debt
servicing cost which leads to a cut back in spending on sectors like health,
education, and infrastructure. This reduces the growth prospects of a country
because of a reduction in the investments in human and physical capital.
Large public borrowing can also lead to crowding out of private investment
and higher inflation. However, if public and private investments are
complementary, then the impact of high public borrowings on private
investments and consequently economic growth may be positive. Also,
different kinds of expenditures are expected to affect the economy in
different ways. Fiscal deficit used for creating infrastructure and human
capital will have a greater positive impact on the economy than if it is used for
financing ill-targeted subsidies and recurrent expenditure. Therefore, the
fear about a high fiscal deficit is justified if the government incurs a deficit to
finance its current expenditure rather than capital expenditure.
In this context, it is important to understand the consequences of rising fiscal
deficit, current expenditure, and capital expenditure on the GDP of a country.
This analysis will also contribute to the rules vs discretion debate. In other

183The Nexus Between Economic Growth and Public Outlays and Deficits in India
words, whether the government should keep its commitment on a balanced
budget strategy (rule) or run a deficit in case of need (discretion). If the
analysis results in favour of a balanced budget then it means that it is more
beneficial to follow the rule and not practice any discretion. On the other
hand, budget deficits may not impact the economy in a negative way
significantly which makes it worthwhile for a government to practice
discretion.
LITERATURE REVIEW
- Fiscal Deficit and Economic Growth
Schools of thought-
There are many theories around the subject of fiscal deficit and its impact on
growth. It has invited considerable debate but there is no conclusive answer.
Even the empirical results have been contradictory to each other. Fiscal deficit
is the excess of public expenditure over public revenue. It is a significant
variable that may have an impact on economic activity by boosting the
economy through demand creation. On the other hand, it may prove to be
detrimental because an increase in fiscal deficit implies increased financing
needs of the government which may hamper economic activity through
various processes. There are different schools of thought in economics that
confirm different impacts of fiscal deficit on economic growth.
According to the Keynesian theory (Eisner, 1989), government expenditure
is one of the determinants of aggregate demand of the economy. An increase
in government expenditure either through consumption expenditure or
investment expenditure raises the aggregate demand which in turn causes
the output to expand when the resources are not fully employed. The
multiplier effect further increases the output which leads to an increase in
money demand and if money supply is fixed then interest rates would rise,
thus partially offsetting the multiplier effect. However, increased aggregate
demand enhances the profitability of private investment and leads to higher
investment at any given rate of interest. The effect of an interest rate rise is
thus more than offset by an increase in the prospect of profitability of
investment. Thus, investment and savings may rise even after an increase in

interest rate when there is less than full employment. In the case of full
employment, fiscal deficit may lead to crowding out in Keynesian economics
as well.
In contrast, the classical theory posits that increased government
expenditure financed by borrowings (with no increase in money supply)
increase government investment at the cost of private investment. When the
government borrows from the market interest rates increase due to
competition which then decreases the private investment. Thus it doesn't
lead to any increased growth in the long run. This is called crowding out
effect. Classical economists believe that the invisible hand guarantees full
employment equilibrium in the economy and thus it should be left to operate
on its own. They saw government intervention in the economy as a serious
problem which can stifle growth and therefore lead to less output.
In the neo-classical view the crowding out effect of the government
borrowing is given pre-eminence. The increase in government expenditure is
thus detrimental on economic growth. Also any increase in taxes to make up
for this increased expenditure is believed to have distortionary effects.
Neoclassical economists favour low taxes and limited government spending.
They believe in spending on national defense, but not for welfare policies like
Social Security and Medicare.
Under classical and neoclassical theories the long run impact is postulated to
be negative. However under the short run, the impact depends upon the
transmission of increased interest rates on private investment and any
increase in tax rates.
The difference between Keynesian theory and classical and neoclassical
theories lies in the fact that classical economists believe in a fixed flow of
savings. In Keynesian economics, government deficits also raise output,
resulting in increased income and savings. This increased saving will ensure
an increase in government expenditure without decreasing private
investment, or even increasing it in some cases.
Another school of thought is the Ricardian Equivalence (e.g. Barro, 1974,
1976, 1979, 1987, 1989), which views fiscal deficit as being neutral in terms of
stimulating economic activity. The increased deficits imply increased future
184 STRIDES - A Students' Journal of Shri Ram College of Commerce, Vol.5, Issue 1 & 2

185
taxes and the present value of these taxes is exactly equal to the amount of
the deficit. Thus, government deficit just implies postponement of taxes. In
this theory, fiscal deficits are used as a device for smoothening out the public
expenditure in case of revenue shocks over a period of time. As household
spending decisions are based on the present value of their incomes, the
aggregate demand remains unaffected. Households should be long-sighted
under this model. This is in contrast to the Keynesian theory where individuals
are myopic.
Besides these the Modern Monetary Theory posits that the government
can spend as much as possible without incurring any debt or applying
increased taxes. As there is no limit to the quantity of money that can be
created by a central bank, the governments can pay using new money
creation. But this view has the problem that an economy can run into
inflation. Then the only option to finance the expenditure will be by
increasing taxes. It is a relatively new theory but in this study this theory can't
be taken in its full scope as the basis of it is that the government finances
through money creation which is not true for India at present.
Empirical Studies-
Baskins' (1987) showed that fiscal policy can affect real economic activity.
Federal deficits increase private savings and decrease domestic and foreign
net investment. These results indicate that an increase in public capital stock
increases private capital efficiency and private investment rises.
Navaratnam and Mayandy (2016) examined the impact of fiscal deficit on
economic growth in Bangladesh, India, Nepal, Pakistan, and Sri Lanka, using
time series annual data over the period 1980–2014. The results from their
study confirmed that the fiscal deficit had a negative impact on economic
growth in these South Asian countries except Nepal, which confirmed the
positive impact.
Ramu and Gayithri (2016) found that fiscal deficit negatively affected the
short-run and long-run economic growth prospects while studying the data
covering the time period from 1970–1971 to 2011–2012 in India.
The Nexus Between Economic Growth and Public Outlays and Deficits in India

Mohanty (2012) also examined the short and long-run relationship between
fiscal deficit and economic growth in India from 1970 to 2012. The study
found a significant negative relationship between fiscal deficits and
economic growth in the long run while no significant relationship was found
in the short run.
- Disaggregated Government Expenditure and Economic Growth
Government capital and revenue expenditure are imperative from the
standpoint of economic policy. While capital expenditure results in asset
creation, employment expansion, and thus economic development, revenue
expenditure essentially helps in the smooth functioning of government and
helps in the redistribution of income through subsidies and other grants to
the weaker sections of the country.
In economic literature, capital expenditure has been viewed as a productive
component of government outlays and revenue expenditure has been
looked down upon because more revenue expenditure corresponds to lower
expenditure on activities that would have helped in asset creation and
economic development. However, public capital expenditure is also an area
where grossly unproductive white elephants can be found. However the
economic theories do not explicitly mention the preferences of the kind of
expenditures but according to the theories of economic development capital
acts as a primary source of growth and thus given primary importance. The
empirical studies have found mixed results regarding the impact of these two
kinds of expenditures on economic development.
Empirical Studies-
R.J. Barro (1999) carried out an empirical investigation into the determinants
of economic growth for a panel of 100 countries (1960 to 1995). Government
investment expenditure was proven to have a positive impact on economic
growth and an increase in investment spending by a government was
recommended.
M.I.J. Attari and A.Y. Javed (2013) explored the relationship between
government expenditure and economic growth in Pakistan using time series
186 STRIDES - A Students' Journal of Shri Ram College of Commerce, Vol.5, Issue 1 & 2
data from 1980 to 2010. The results of the study revealed that both types of
government expenditure have a positive impact on economic growth in the
study country, both in the short run and in the long run.
S. Ghosh and A. Gregoriou (2008) also investigated the relationship between
disaggregated government expenditure and economic growth in developing
countries. Capital spending had a negative impact on economic growth as
opposed to current spending which contributed to growth. Also, government
expenditure on operations and maintenance had a stronger positive impact
on economic growth than expenditure on education and health which had a
significant negative effect. These results conform to Devarajan et al. (1996).
They explained that expenditures that are considered productive could
become unproductive if they are carried out in an excessive amount, and
excessive capital spending may have brought current spending to a non-
optimal level.
Ghosh and Gregoriou argued against this reasoning by claiming that current
spending as a proportion of GDP has typically been above 17% in contrast to
capital spending as a ratio of GDP, which has been below 3%. Countries that
have correctly perceived current spending as being more productive have
increased the share of spending on this category which has led to higher
growth, and countries that have not done this have faced negative
consequences.
The other reason was that countries that have allocated funds towards capital
spending have done it for reasons other than productivity considerations,
and this is where the role of corruption assumes importance. Tanzi and
Davoodi (1997) noted that private enterprises often get contracts for large
public investment projects by paying a hefty commission to government
officials. Capital spending is highly discretionary but current spending reflects
spending on previous commitments (for example, wages, salaries, pensions,
subsidies) allowing limited discretion to the politicians in the short run.
DATA SOURCE AND METHODOLOGY
The study is based on secondary data. The objectives of the study are
examined by using time series data covering the period from 1977-78 to
2018-19. Relevant data for the study are obtained from Handbook on Indian
187The Nexus Between Economic Growth and Public Outlays and Deficits in India
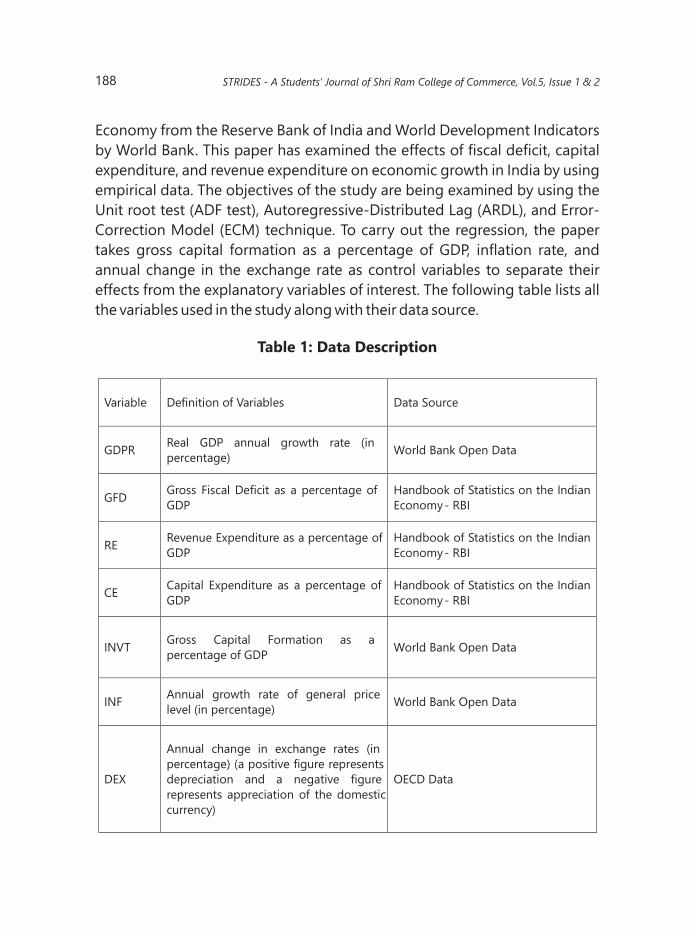
Economy from the Reserve Bank of India and World Development Indicators
by World Bank. This paper has examined the effects of fiscal deficit, capital
expenditure, and revenue expenditure on economic growth in India by using
empirical data. The objectives of the study are being examined by using the
Unit root test (ADF test), Autoregressive-Distributed Lag (ARDL), and Error-
Correction Model (ECM) technique. To carry out the regression, the paper
takes gross capital formation as a percentage of GDP, inflation rate, and
annual change in the exchange rate as control variables to separate their
effects from the explanatory variables of interest. The following table lists all
the variables used in the study along with their data source.
Table 1: Data Description
188
Variable Definition of Variables Data Source
GDPR Real GDP annual growth rate (in
percentage)World Bank Open Data
GFD Gross Fiscal Deficit as a percentage of
GDP
Handbook of Statistics on the Indian
Economy- RBI
RERevenue Expenditure as a percentage of
GDP
Handbook of Statistics on the Indian
Economy- RBI
CECapital Expenditure as a percentage of
GDP
Handbook of Statistics on the Indian
Economy- RBI
INVT Gross Capital Formation as a
percentage of GDPWorld Bank Open Data
INFAnnual growth rate of general price
level (in percentage)World Bank Open Data
DEX
Annual change in exchange rates (in
percentage) (a positive figure represents
depreciation and a negative figure
represents appreciation of the domestic
currency)
OECD Data
STRIDES - A Students' Journal of Shri Ram College of Commerce, Vol.5, Issue 1 & 2
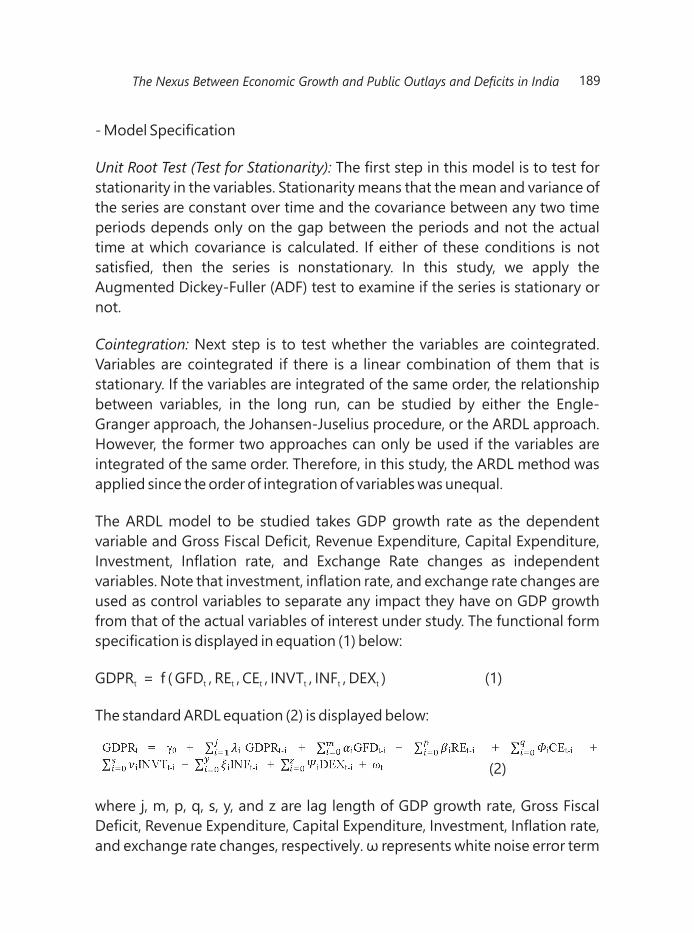
- Model Specification
Unit Root Test (Test for Stationarity): The first step in this model is to test for
stationarity in the variables. Stationarity means that the mean and variance of
the series are constant over time and the covariance between any two time
periods depends only on the gap between the periods and not the actual
time at which covariance is calculated. If either of these conditions is not
satisfied, then the series is nonstationary. In this study, we apply the
Augmented Dickey-Fuller (ADF) test to examine if the series is stationary or
not.
Cointegration: Next step is to test whether the variables are cointegrated.
Variables are cointegrated if there is a linear combination of them that is
stationary. If the variables are integrated of the same order, the relationship
between variables, in the long run, can be studied by either the Engle-
Granger approach, the Johansen-Juselius procedure, or the ARDL approach.
However, the former two approaches can only be used if the variables are
integrated of the same order. Therefore, in this study, the ARDL method was
applied since the order of integration of variables was unequal.
The ARDL model to be studied takes GDP growth rate as the dependent
variable and Gross Fiscal Deficit, Revenue Expenditure, Capital Expenditure,
Investment, Inflation rate, and Exchange Rate changes as independent
variables. Note that investment, inflation rate, and exchange rate changes are
used as control variables to separate any impact they have on GDP growth
from that of the actual variables of interest under study. The functional form
specification is displayed in equation (1) below:
GDPR = f ( GFD , RE , CE , INVT , INF , DEX ) (1)t t t t t t t
The standard ARDL equation (2) is displayed below:
(2)
where j, m, p, q, s, y, and z are lag length of GDP growth rate, Gross Fiscal
Deficit, Revenue Expenditure, Capital Expenditure, Investment, Inflation rate,
and exchange rate changes, respectively. ω represents white noise error term
189The Nexus Between Economic Growth and Public Outlays and Deficits in India
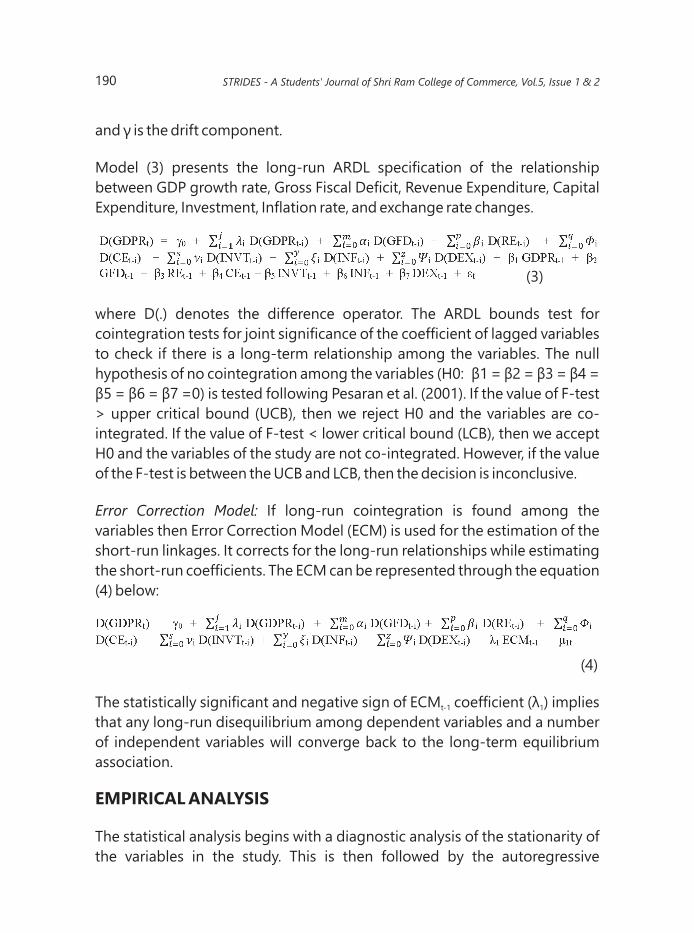
and γ is the drift component.
Model (3) presents the long-run ARDL specification of the relationship
between GDP growth rate, Gross Fiscal Deficit, Revenue Expenditure, Capital
Expenditure, Investment, Inflation rate, and exchange rate changes.
(3)
where D(.) denotes the difference operator. The ARDL bounds test for
cointegration tests for joint significance of the coefficient of lagged variables
to check if there is a long-term relationship among the variables. The null
hypothesis of no cointegration among the variables (H0: β1 = β2 = β3 = β4 =
β5 = β6 = β7 =0) is tested following Pesaran et al. (2001). If the value of F-test
> upper critical bound (UCB), then we reject H0 and the variables are co-
integrated. If the value of F-test < lower critical bound (LCB), then we accept
H0 and the variables of the study are not co-integrated. However, if the value
of the F-test is between the UCB and LCB, then the decision is inconclusive.
Error Correction Model: If long-run cointegration is found among the
variables then Error Correction Model (ECM) is used for the estimation of the
short-run linkages. It corrects for the long-run relationships while estimating
the short-run coefficients. The ECM can be represented through the equation
(4) below:
(4)
The statistically significant and negative sign of ECM coefficient (λ ) implies t-1 1
that any long-run disequilibrium among dependent variables and a number
of independent variables will converge back to the long-term equilibrium
association.
EMPIRICAL ANALYSIS
The statistical analysis begins with a diagnostic analysis of the stationarity of
the variables in the study. This is then followed by the autoregressive
190 STRIDES - A Students' Journal of Shri Ram College of Commerce, Vol.5, Issue 1 & 2
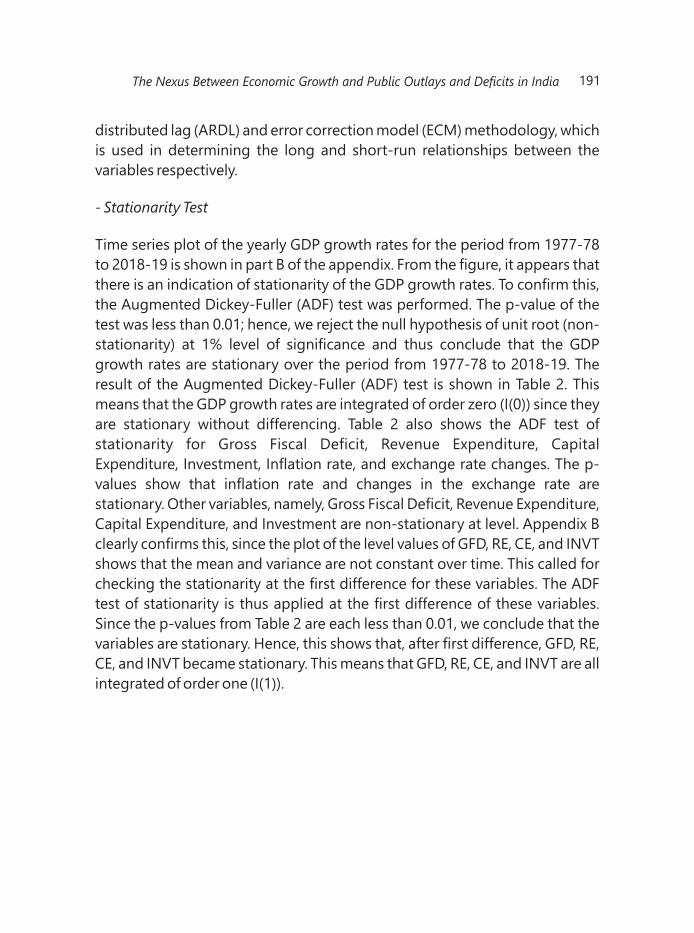
distributed lag (ARDL) and error correction model (ECM) methodology, which
is used in determining the long and short-run relationships between the
variables respectively.
- Stationarity Test
Time series plot of the yearly GDP growth rates for the period from 1977-78
to 2018-19 is shown in part B of the appendix. From the figure, it appears that
there is an indication of stationarity of the GDP growth rates. To confirm this,
the Augmented Dickey-Fuller (ADF) test was performed. The p-value of the
test was less than 0.01; hence, we reject the null hypothesis of unit root (non-
stationarity) at 1% level of significance and thus conclude that the GDP
growth rates are stationary over the period from 1977-78 to 2018-19. The
result of the Augmented Dickey-Fuller (ADF) test is shown in Table 2. This
means that the GDP growth rates are integrated of order zero (I(0)) since they
are stationary without differencing. Table 2 also shows the ADF test of
stationarity for Gross Fiscal Deficit, Revenue Expenditure, Capital
Expenditure, Investment, Inflation rate, and exchange rate changes. The p-
values show that inflation rate and changes in the exchange rate are
stationary. Other variables, namely, Gross Fiscal Deficit, Revenue Expenditure,
Capital Expenditure, and Investment are non-stationary at level. Appendix B
clearly confirms this, since the plot of the level values of GFD, RE, CE, and INVT
shows that the mean and variance are not constant over time. This called for
checking the stationarity at the first difference for these variables. The ADF
test of stationarity is thus applied at the first difference of these variables.
Since the p-values from Table 2 are each less than 0.01, we conclude that the
variables are stationary. Hence, this shows that, after first difference, GFD, RE,
CE, and INVT became stationary. This means that GFD, RE, CE, and INVT are all
integrated of order one (I(1)).
191The Nexus Between Economic Growth and Public Outlays and Deficits in India

Table 2: Unit root test (Augmented Dickey-Fuller test)
Null hypothesis: Existence of unit root, *denotes rejection of null at 1% level of
significance, **denotes rejection of null at 5% level of significance.
Note: the figures reported are t-statistics
As some variables are I(0) and some are I(1), we will use the ARDL approach to
check long-run cointegration between variables, if any.
ARDL Bounds Cointegration Test
The result of the cointegration test, based on the ARDL bound testing
approach, is presented in Table 3. From the table, the calculated F-statistic is
23.65262. This value is above the upper bounds critical value of 3.99 at the 1%
significance level. This means that the null hypothesis of no cointegrating
relationship can be rejected. This implies that the GDP growth rate is
cointegrated with the chosen independent variables (GFD, RE, CE, INVT, INF,
192
GFD -2.526635 -3.669296* -6.337335* -6.464919* I(1)
RE -2.351275 -1.422859 -5.094722* -5.367626* I(1)
CE -0.745823 -1.935289 -6.206365* -6.109339* I(1)
INVT -1.290246 -1.302306 -6.723786* -6.730371* I(1)
INF -3.904939* -4.321073* ***** ***** I(0)
DEX -4.658827* -4.868248* ***** ***** I(0)
Variables Level 1st Difference
Conclusion Intercept
Trend and Intercept
Intercept Trend and Intercept
GDPR -6.140879* -7.104942* ***** ***** I(0)
STRIDES - A Students' Journal of Shri Ram College of Commerce, Vol.5, Issue 1 & 2
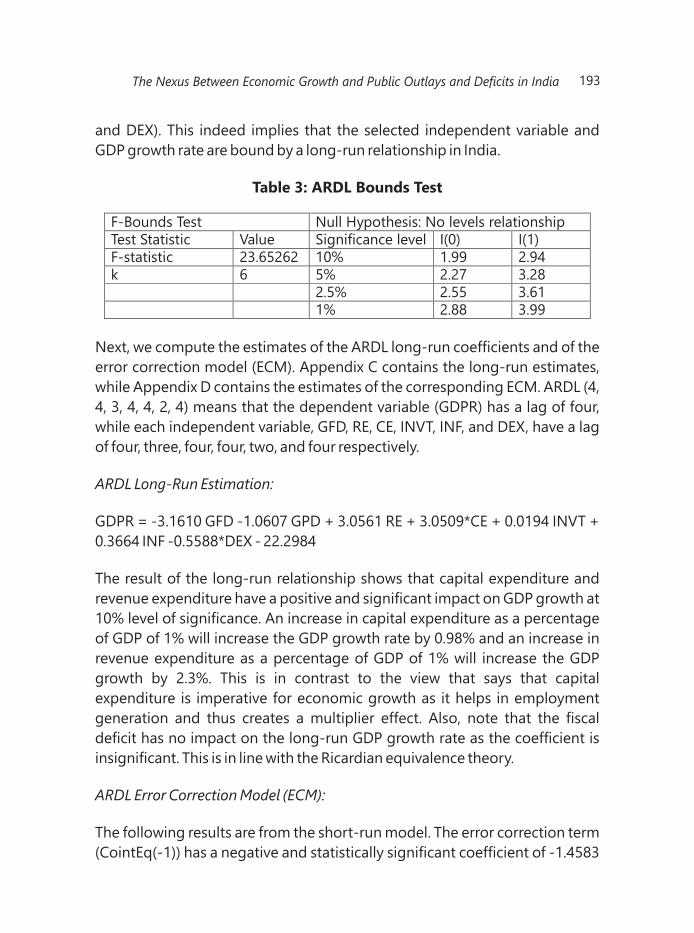
F-Bounds Test Null Hypothesis: No levels relationship Test Statistic Value Significance level I(0) I(1) F-statistic 23.65262 10% 1.99 2.94 k 6 5% 2.27 3.28
2.5% 2.55 3.61 1% 2.88 3.99
and DEX). This indeed implies that the selected independent variable and
GDP growth rate are bound by a long-run relationship in India.
Table 3: ARDL Bounds Test
Next, we compute the estimates of the ARDL long-run coefficients and of the
error correction model (ECM). Appendix C contains the long-run estimates,
while Appendix D contains the estimates of the corresponding ECM. ARDL (4,
4, 3, 4, 4, 2, 4) means that the dependent variable (GDPR) has a lag of four,
while each independent variable, GFD, RE, CE, INVT, INF, and DEX, have a lag
of four, three, four, four, two, and four respectively.
ARDL Long-Run Estimation:
GDPR = -3.1610 GFD -1.0607 GPD + 3.0561 RE + 3.0509*CE + 0.0194 INVT +
0.3664 INF -0.5588*DEX - 22.2984
The result of the long-run relationship shows that capital expenditure and
revenue expenditure have a positive and significant impact on GDP growth at
10% level of significance. An increase in capital expenditure as a percentage
of GDP of 1% will increase the GDP growth rate by 0.98% and an increase in
revenue expenditure as a percentage of GDP of 1% will increase the GDP
growth by 2.3%. This is in contrast to the view that says that capital
expenditure is imperative for economic growth as it helps in employment
generation and thus creates a multiplier effect. Also, note that the fiscal
deficit has no impact on the long-run GDP growth rate as the coefficient is
insignificant. This is in line with the Ricardian equivalence theory.
ARDL Error Correction Model (ECM):
The following results are from the short-run model. The error correction term
(CointEq(-1)) has a negative and statistically significant coefficient of -1.4583
193The Nexus Between Economic Growth and Public Outlays and Deficits in India
(p-value = 0.000). It suggests a high speed of convergence of GDP growth
rate to its long-run equilibrium after a change in other variables. The results
also show that gross fiscal deficit has a negative impact on GDP growth rate in
the short run. An increase in the fiscal deficit as a percentage of GDP of 1% will
decrease the GDP growth rate by 1.01%. This confirms the theory of classicals
and neo-classicals. Revenue expenditure has a positive impact on GDP
growth in the short run while the lagged values of the same have a negative
impact. On the other hand, capital expenditure of the same period does not
impact the GDP growth while the lagged values of the same impact GDP
growth positively.
*NOTE- The lag length of different variables in the model was selected using
the Akaike Info Criterion (AIC). It compares various models and selects the
best one out of them. A low AIC score is expected to ensure that the model fits
the data well without overfitting it.
Diagnostic and Stability Tests
The adjusted R-square value of the Error Corrected model is 0.9723 which
confirms that the model is a good fit. The Jarque-Bera normality test has a p-
value of 0.9695 which is greater than 0.05 and hence it implies that the
residuals are normally distributed. The LM serial correlation test implies that
there is no autocorrelation between the residuals as the probability of chi-
square (0.1448) is greater than 0.05. The data is also homoscedastic as the
probability of chi-square (0.3386) is greater than 0.05 under the Breusch-
Pagan-Godfrey test. Ramsey RESET test is conducted to test the linearity
between variables. The t-statistic, F-statistic, and Likelihood ratio are all
insignificant i.e. they are greater than 0.05, therefore there are no
specification errors. The study also conducts two stability tests, namely,
CUSUM and CUSUMSQ to investigate the stability of long and short-run
parameters. The graphs of both stability tests presented in Figure 1 identify
that plots for both stability tests are between critical boundaries at 5% level of
significance. This confirms the accuracy of long-run and short-run
parameters which have an impact on GDP growth rate over the period 1978-
2019.
From the diagnostic test results, there is no evidence of serial correlation,
194 STRIDES - A Students' Journal of Shri Ram College of Commerce, Vol.5, Issue 1 & 2

absence of normality, or heteroscedasticity and the model is well specified.
The results also indicate the absence of any instability of the coefficients.
Figure 1: CUSUM and CUSUMSQ test of stability
POLICY PRESCRIPTIONS
According to the econometric analysis, the fiscal deficit doesn't affect the
economic growth rate in the long run significantly however it has a negative
impact in the short run. This result reinforces the idea of the classical and
195The Nexus Between Economic Growth and Public Outlays and Deficits in India
neoclassical economists although only in the short run. The insignificant
effect of government deficit in the long run may be due to the fact that it was
not financed through increased taxation and that the productivity of
government expenditure is not far off from that of the private sector. Keeping
in mind these results, a balanced budget policy is recommended. A fiscal
policy to boost the economy or stabalize it may not have long-lasting impact
but it negatively impact the economy in the short run and thus deficits should
be avoided.
Given the results, we should also emphasize on the quality of government
expenditure. In the long run, revenue expenditure has a greater positive
impact on GDP growth than capital expenditure. Low effectivity of capital
expenditure on long-run growth is due to an ineffective utilization of public
funds. The reason for low productivity might be corruption by politicians and
officials in the government. The funds for capital expenditure get transferred
from the central government to the state government and then to the local
governments. At each stage in this process, the grant provided keeps on
reducing due to the fact that the politicians and officials pocket most of the
money for their personal benefits. Thus, the actual amount of money spent is
very low and doesn't add much value to the economy in terms of productive
capacity. Also, very often private enterprises often get contracts for large
public investment projects by paying a hefty 'commission' to government
officials. This shows that capital spending is highly discretionary in
opposition to current spending which reflects spending on previous
commitments (for example, wages, salaries, pensions, subsidies) allowing
limited discretion to politicians and government officials. Noting all these
possibilities, there are crucial steps to be taken to make the process of
investing in projects more seamless. Firstly, useful and rightful projects
should be recognized which can be done through consulting with experts in
the field and getting more diverse views. Second, the process of funds
transfer should be made more transparent so that the possibility of
corruption becomes unlikely. And lastly, allocating projects to private entities
should not be the responsibility of a single person. A committee could be
formed whose members can then decide the allocation of the project with
their votes. It should be effectively implemented so that benefits of such
projects are substantial.
196 STRIDES - A Students' Journal of Shri Ram College of Commerce, Vol.5, Issue 1 & 2
These suggestions and prescriptions are important to consider but it should
also be seen that this study is limited in its scope with regards to the real
practice. Although capital expenditures are not perfectly efficient they are
very important for the purpose of economic development. Also, when the
economy is in a big slump, the government needs to run a deficit atleast to
appeal to the masses. All the points need to be contemplated on before
taking any decisions and not only the economic but the social and political
ramifications should be taken into account.
REFERENCES
Adam, C S and D L Bevan (2005). Fiscal Deficits and Growth in Developing
Countries. Journal of Public Economics, 89: 571-97.
Al Sharif, Basema and Bino, Adel. (2019). The Role of Government Capital
Expenditures in Economic Growth in Jordan. International Journal of Business
and Economics Research. 8. 69-77. 10.11648/j.ijber.20190802.15.
Anantha Ramu M R and K Gayithri. (2016). Relationship Between Fiscal Deficit
Composition and Economic Growth in India: A Time Series Econometric
Analysis. Institute for Social and Economic Change.
Attari, M.I.J., Javed, A.Y. (2013). Inflation, Economic Growth and Government
Expenditure of Pakistan: 1980–2010. Procedia Economics and Finance, 5,
58–67. DOI: 1016/S2212-5671(13)00010-5.
Barro, R J (1996). Determinants of Economic Growth: A Cross-Country
Empirical study. NBER Working Paper No. 5698. NBER, Cambridge.
Devarajan, S. Swaroop, V. and Zou, H. (1996). The composition of public
expenditure and economic growth. Journal of Monetary Economics, 37 (2),
313-344. DOI: 10.1016/S0304-3932(96)90039-2.
Ghosh, S., Gregoriou, A. (2008). The composition of government spending
and growth: Is current or capital spending better? Oxford Economic Papers, 60
(3), 484–516. DOI: 10.1093/oep/gpn005.
Gupta, Sonika and Singh, Kalpana. November. 2016. Fiscal Deficit and its
197The Nexus Between Economic Growth and Public Outlays and Deficits in India
Trends in India. International Journal of Business and Management Invention.
Volume 5 Issue 11. pp—63-75.
Gyasi, Genevieve (2020): The Impact of Fiscal Deficit on Economic Growth:
Using the Bounds Test Approach in The Case of Morocco. Munich Personal
RePEc Archive.
Handbook of Statistics on Indian Economy, RBI Publications.
https://www.rbi.org.in/Scripts/AnnualPublications.aspx?head=Handbook%
20of%20Statistics%20on%20Indian%20Economy.
Hussain, Mohammed & Haque, Mahfuzul. (2017). Fiscal Deficit and Its Impact
on Economic Growth: Evidence from Bangladesh. Economies. 5. 37.
10.3390/economies5040037.
Leshoro, T.L.A. (2017). An empirical analysis of disaggregated government
expenditure and economic growth in South Africa. UNISA Economic Research
Working Paper Series. Working Paper 10/2017.
Maddala, G S and Kim, In-Moo. (1998). Unit Roots, Cointegration and
Structural Change. United Kingdom: Cambridge University Press.
Mishra, Amritkant. (2019). How Does Economic Growth React to Fiscal Deficit
and Inflation? An ARDL Analysis of China and India. Arthshastra Indian
Journal of Economics & Research. 8. 10.17010/aijer/2019/v8i4/148068.
Nyasha, Sheilla & Odhiambo, Nicholas. (2019). The Impact of Public
Expenditure on Economic Growth: A Review of International Literature. Folia
Oeconomica Stetinensia. 19. 81-101. 10.2478/foli-2019-0015.
Onwe, Uche Basil. (2014). Implication of Deficit Financing on Economic
Growth in Nigeria. European Journal of Accounting, Auditing and Finance
Research. Vol.2, No.10, pp.122-135.
World Bank Open Data. https://data.worldbank.org/
198 STRIDES - A Students' Journal of Shri Ram College of Commerce, Vol.5, Issue 1 & 2
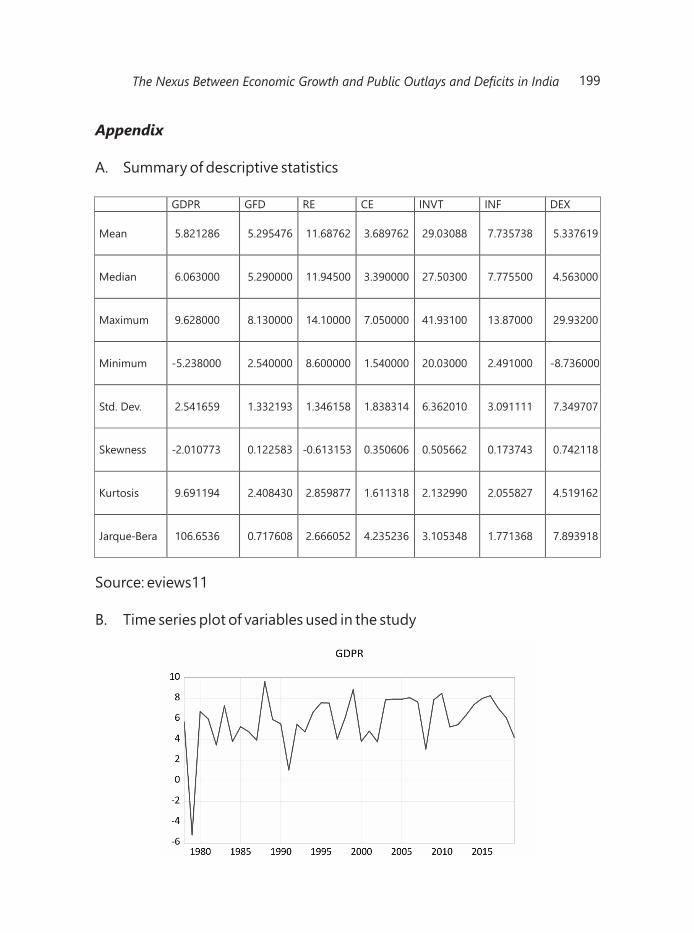
Appendix
A. Summary of descriptive statistics
Source: eviews11
B. Time series plot of variables used in the study
199
GDPR GFD RE CE INVT INF DEX
Mean 5.821286 5.295476 11.68762 3.689762 29.03088 7.735738 5.337619
Median 6.063000 5.290000 11.94500 3.390000 27.50300 7.775500 4.563000
Maximum 9.628000 8.130000 14.10000 7.050000 41.93100 13.87000 29.93200
Minimum -5.238000 2.540000 8.600000 1.540000 20.03000 2.491000 -8.736000
Std. Dev. 2.541659 1.332193 1.346158 1.838314 6.362010 3.091111 7.349707
Skewness -2.010773 0.122583 -0.613153 0.350606 0.505662 0.173743 0.742118
Kurtosis 9.691194 2.408430 2.859877 1.611318 2.132990 2.055827 4.519162
Jarque-Bera 106.6536 0.717608 2.666052 4.235236 3.105348 1.771368 7.893918
The Nexus Between Economic Growth and Public Outlays and Deficits in India

200 STRIDES - A Students' Journal of Shri Ram College of Commerce, Vol.5, Issue 1 & 2
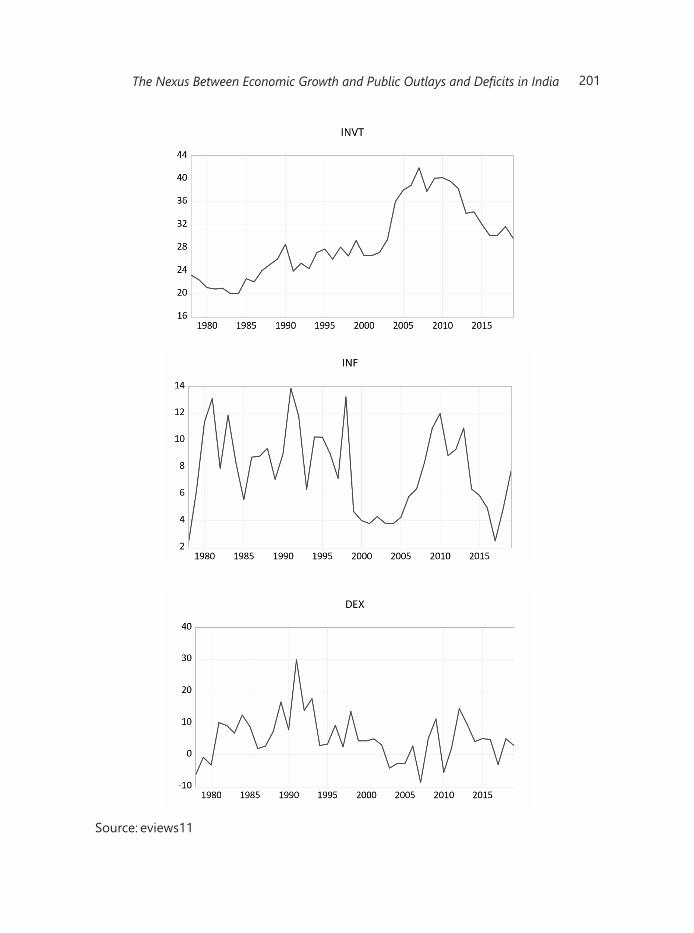
Source: eviews11
201The Nexus Between Economic Growth and Public Outlays and Deficits in India
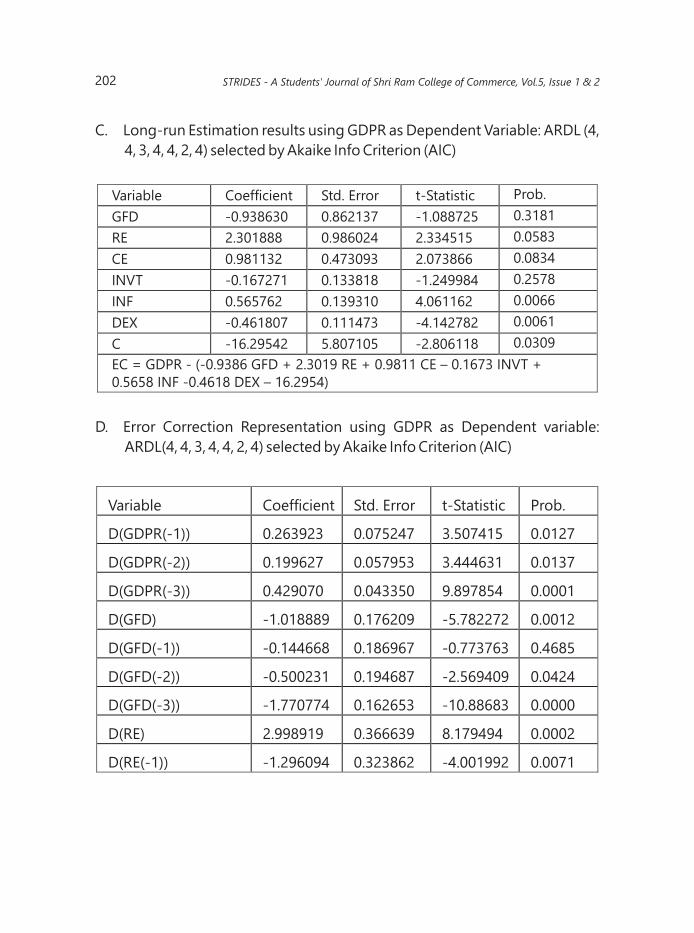
Variable Coefficient Std. Error t-Statistic Prob.
D(GDPR(-1)) 0.263923 0.075247 3.507415 0.0127
D(GDPR(-2)) 0.199627 0.057953 3.444631 0.0137
D(GDPR(-3)) 0.429070 0.043350 9.897854 0.0001
D(GFD) -1.018889 0.176209 -5.782272 0.0012
D(GFD(-1)) -0.144668 0.186967 -0.773763 0.4685
D(GFD(-2)) -0.500231 0.194687 -2.569409 0.0424
D(GFD(-3)) -1.770774 0.162653 -10.88683 0.0000
D(RE) 2.998919 0.366639 8.179494 0.0002
D(RE(-1)) -1.296094 0.323862 -4.001992 0.0071
C. Long-run Estimation results using GDPR as Dependent Variable: ARDL (4,
4, 3, 4, 4, 2, 4) selected by Akaike Info Criterion (AIC)
D. Error Correction Representation using GDPR as Dependent variable:
ARDL(4, 4, 3, 4, 4, 2, 4) selected by Akaike Info Criterion (AIC)
202
EC = GDPR - (-0.9386 GFD + 2.3019 RE + 0.9811 CE – 0.1673 INVT + 0.5658 INF -0.4618 DEX – 16.2954)
Variable Coefficient Std. Error t-Statistic Prob.
GFD -0.938630 0.862137 -1.088725 0.3181
RE 2.301888 0.986024 2.334515 0.0583
CE 0.981132 0.473093 2.073866 0.0834
INVT -0.167271 0.133818 -1.249984 0.2578
INF 0.565762 0.139310 4.061162 0.0066
DEX -0.461807 0.111473 -4.142782 0.0061
C -16.29542 5.807105 -2.806118 0.0309
STRIDES - A Students' Journal of Shri Ram College of Commerce, Vol.5, Issue 1 & 2
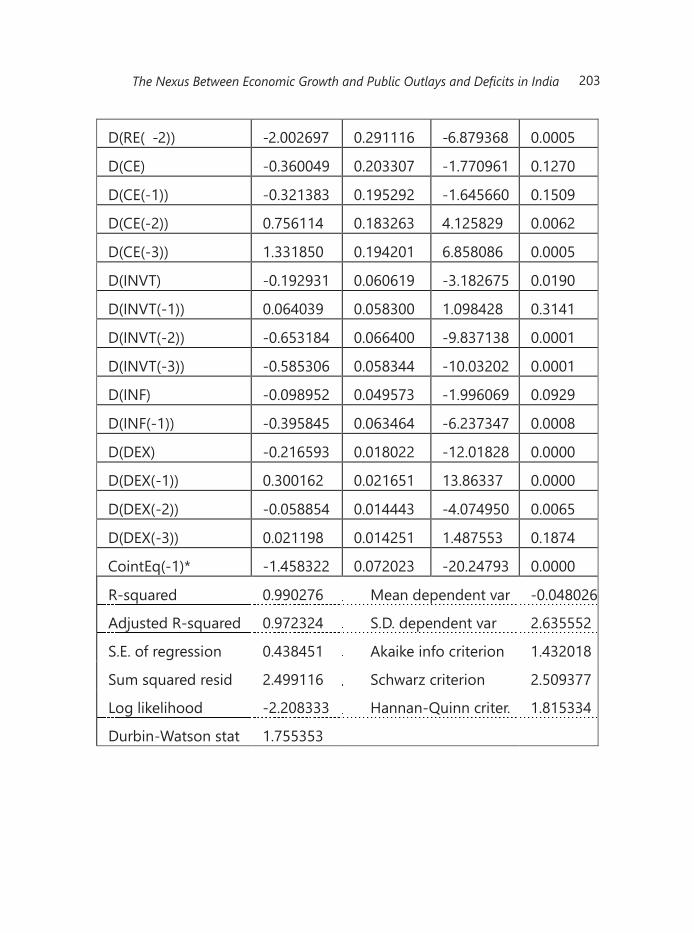
D(RE( -2)) -2.002697 0.291116 -6.879368 0.0005
D(CE) -0.360049 0.203307 -1.770961 0.1270
D(CE(-1)) -0.321383 0.195292 -1.645660 0.1509
D(CE(-2)) 0.756114 0.183263 4.125829 0.0062
D(CE(-3)) 1.331850 0.194201 6.858086 0.0005
D(INVT) -0.192931 0.060619 -3.182675 0.0190
D(INVT(-1)) 0.064039 0.058300 1.098428 0.3141
D(INVT(-2)) -0.653184 0.066400 -9.837138 0.0001
D(INVT(-3)) -0.585306 0.058344 -10.03202 0.0001
D(INF) -0.098952 0.049573 -1.996069 0.0929
D(INF(-1)) -0.395845 0.063464 -6.237347 0.0008
D(DEX) -0.216593 0.018022 -12.01828 0.0000
D(DEX(-1)) 0.300162 0.021651 13.86337 0.0000
D(DEX(-2)) -0.058854 0.014443 -4.074950 0.0065
D(DEX(-3)) 0.021198 0.014251 1.487553 0.1874
CointEq(-1)* -1.458322 0.072023 -20.24793 0.0000
R-squared 0.990276 Mean dependent var -0.048026
Adjusted R-squared 0.972324 S.D. dependent var 2.635552
S.E. of regression 0.438451 Akaike info criterion 1.432018
Sum squared resid 2.499116 Schwarz criterion 2.509377
Log likelihood -2.208333 Hannan-Quinn criter. 1.815334
Durbin-Watson stat 1.755353
203The Nexus Between Economic Growth and Public Outlays and Deficits in India


SHRI RAM COLLEGE OF COMMERCEUniversity of Delhi, Maurice Nagar Delhi - 110 007
Phone: 11 - 27667905 Fax: 11 - 27666510
STRIDES - A STUDENTS' JOURNAL OF SHRI RAM COLLEGE OF COMMERCEISSN 2581-4931 (Print)
RELEASE OF FOUNDATION ISSUE OF STRIDES
The foundation issue of the Journal "Strides - A Students' Journal of Shri Ram College of Commerce, Volume 1, Issue 1, 2016-17" was successfully released on 91st Annual Day of SRCC held on 13th April, 2017 by Shri Prakash Javadekar, Honb'le Union Minister of Human Resource Development, Government of India.