Strength assessment of spot-welded sheets of interstitial free steels
13
journal of materials processing technology 209 ( 2 0 0 9 ) 1995–2007 journal homepage: www.elsevier.com/locate/jmatprotec Strength assessment of spot-welded sheets of interstitial free steels G. Mukhopadhyay a,1 , S. Bhattacharya b , K.K. Ray a,∗ a Department of Metallurgical and Materials Engineering, Indian Institute of Technology, Kharagpur, Kharagpur 721302, India b R&D and Scientific Services, Tata Steel, Jamshedpur 831001, India article info Article history: Received 17 September 2007 Received in revised form 18 March 2008 Accepted 26 April 2008 Keywords: Spot-weld Interstitial free steel Tensile strength Nugget diameter Fusion zone Heat-affected zone abstract The effects of nugget diameter, mode of loading and alloy chemistry have been studied on the strength of spot-welds in thin sheets of interstitial free steels. Spot-welds with three nugget diameters have been fabricated by alteration of the welding current while two inter- stitial free steels with different chemistry have been selected. The mode of loading has been varied either as sliding using tensile-shear and pure-shear specimens or as opening using cross-tension specimens. The results unambiguously infer that the strength values of spot- welds remain same in a specific mode of loading, while the load-bearing capacity increases with increasing nugget size. The strength values in different sliding mode of loading are similar but are higher than that in opening mode; these observations have been explained using Von Mises’ criterion of yielding. The strength of the spot weld is found higher than that of the base metal with an interesting observation that the former bears a constant ratio with the latter. © 2008 Elsevier B.V. All rights reserved. 1. Introduction The resistance spot-welding is a process for joining sheet met- als which are widely used in current automotive industry due to their excellent techno-economic benefits. In auto- components, spot-welded materials are exposed to different forces; and stress concentration occurs at the edge of the spot-welds due to the presence of the inherent notch at the interface between the sheet metals. Cracking and subsequent failures tend to occur around these joints, specifically around the heat-affected zone (HAZ). Spot-welds can fail under quasi- static, impact or fatigue loading conditions due to sudden braking, vehicle crash, rough roads, etc. Therefore, under- standing the nature of the integrity of spot-welds under these ∗ Corresponding author. Tel.: +91 3222 283278; fax: +91 3222 282280/255303. E-mail addresses: [email protected], [email protected] (K.K. Ray). 1 On study leave from R&D and Scientific Services, Tata Steel, Jamshedpur 831001, India. varied loading conditions is important to avoid failure in these joints, and as a consequence, one finds several investigations being focused in this direction over the last decade. For exam- ple, (i) Zuniga and Sheppard (1997), Lee et al. (1998), Barkey and Kang (1999), Wung and co-workers (Wung, 2001; Wung et al., 2001), and Lin et al. (2002) have studied the problem related to the failure of spot-welds under quasi-static loading conditions, (ii) Zhang et al. (2001) and Bayraktar et al. (2004) have examined the failure of spot-welds under impact load- ing conditions, and (iii) fatigue life of spot-welds have been examined by Lee and Kim (2004), Lee and Choi (2005), Long and Khanna (2007) and Choi et al. (2007). But the existing state of understanding related to the strength of spot-welds is yet to crystallize in order to establish any commonly accepted stan- 0924-0136/$ – see front matter © 2008 Elsevier B.V. All rights reserved. doi:10.1016/j.jmatprotec.2008.04.065
Transcript of Strength assessment of spot-welded sheets of interstitial free steels
Si
Ga
Kb
a
A
R
R
1
A
K
S
I
T
N
F
H
1
Tadcfsiftsbs
0d
j o u r n a l o f m a t e r i a l s p r o c e s s i n g t e c h n o l o g y 2 0 9 ( 2 0 0 9 ) 1995–2007
journa l homepage: www.e lsev ier .com/ locate / jmatprotec
trength assessment of spot-welded sheets ofnterstitial free steels
. Mukhopadhyaya,1, S. Bhattacharyab, K.K. Raya,∗
Department of Metallurgical and Materials Engineering, Indian Institute of Technology,haragpur, Kharagpur 721302, IndiaR&D and Scientific Services, Tata Steel, Jamshedpur 831001, India
r t i c l e i n f o
rticle history:
eceived 17 September 2007
eceived in revised form
8 March 2008
ccepted 26 April 2008
eywords:
a b s t r a c t
The effects of nugget diameter, mode of loading and alloy chemistry have been studied on
the strength of spot-welds in thin sheets of interstitial free steels. Spot-welds with three
nugget diameters have been fabricated by alteration of the welding current while two inter-
stitial free steels with different chemistry have been selected. The mode of loading has been
varied either as sliding using tensile-shear and pure-shear specimens or as opening using
cross-tension specimens. The results unambiguously infer that the strength values of spot-
welds remain same in a specific mode of loading, while the load-bearing capacity increases
with increasing nugget size. The strength values in different sliding mode of loading are
similar but are higher than that in opening mode; these observations have been explained
pot-weldnterstitial free steel
ensile strength
ugget diameter
usion zone
using Von Mises’ criterion of yielding. The strength of the spot weld is found higher than
that of the base metal with an interesting observation that the former bears a constant ratio
with the latter.
© 2008 Elsevier B.V. All rights reserved.
examined by Lee and Kim (2004), Lee and Choi (2005), Long
eat-affected zone
. Introduction
he resistance spot-welding is a process for joining sheet met-ls which are widely used in current automotive industryue to their excellent techno-economic benefits. In auto-omponents, spot-welded materials are exposed to differentorces; and stress concentration occurs at the edge of thepot-welds due to the presence of the inherent notch at thenterface between the sheet metals. Cracking and subsequentailures tend to occur around these joints, specifically aroundhe heat-affected zone (HAZ). Spot-welds can fail under quasi-
tatic, impact or fatigue loading conditions due to suddenraking, vehicle crash, rough roads, etc. Therefore, under-tanding the nature of the integrity of spot-welds under these∗ Corresponding author. Tel.: +91 3222 283278; fax: +91 3222 282280/255E-mail addresses: [email protected], kalyankumarry@yah
1 On study leave from R&D and Scientific Services, Tata Steel, Jamshe924-0136/$ – see front matter © 2008 Elsevier B.V. All rights reserved.oi:10.1016/j.jmatprotec.2008.04.065
varied loading conditions is important to avoid failure in thesejoints, and as a consequence, one finds several investigationsbeing focused in this direction over the last decade. For exam-ple, (i) Zuniga and Sheppard (1997), Lee et al. (1998), Barkeyand Kang (1999), Wung and co-workers (Wung, 2001; Wunget al., 2001), and Lin et al. (2002) have studied the problemrelated to the failure of spot-welds under quasi-static loadingconditions, (ii) Zhang et al. (2001) and Bayraktar et al. (2004)have examined the failure of spot-welds under impact load-ing conditions, and (iii) fatigue life of spot-welds have been
303.oo.com (K.K. Ray).dpur 831001, India.
and Khanna (2007) and Choi et al. (2007). But the existing stateof understanding related to the strength of spot-welds is yet tocrystallize in order to establish any commonly accepted stan-
1996 j o u r n a l o f m a t e r i a l s p r o c e s s i n g t e c h n o l o g y 2 0 9 ( 2 0 0 9 ) 1995–2007
Table 1 – Chemical composition of the investigated EIF and HIF steels (in wt%)
Steels C Mn S P Si Al Cr Ni Ti Nb N Fe
0.040.03
EIF 0.002 0.05 0.008 0.007 0.011HIF 0.003 0.40 0.007 0.06 0.015
dard. The present report aims to critically examine this aspectemphasizing only on the strength of spot-welds in quasi-staticloading.
The existing works related to strength of spot-welds pri-marily consider force-based failure criteria. Wung and hisco-workers (Wung, 2001; Wung et al., 2001) have carried outtests with different loading modes, e.g., lap-shear, in-planerotation, coach-peel and normal separation, and have pro-posed a force-based failure criterion to predict the failureof spot-welds under general quasi-static loading conditions.The load carrying capacity of spot-welds have been reportedby Barkey and Kang (1999), Lee et al. (1998) and Lin et al.(2002) using experiments with the help of a special fixturein which a force-based failure criterion can be determinedunder combined tension and shear loading conditions. Inaddition, Zuniga and Sheppard (1997) have investigated thefailure modes of spot-welds in coach-peel and lap-shear spec-imens.
The limitation of the force-based failure criterion of spot-welds is that the failure-load of spot-welds changes withseveral variables like welding parameters, sheet thickness,weld nugget size, electrode-indentation, loading mode andmaterial property (VandenBossche, 1977; Ewing et al., 1982).Lee et al. (1998) have showed that the nugget diameter hasthe major contribution (more than 70%) to the total variationin the failure loads. Thus, for a given material, defining thestrength of spot-welds which is independent of all these vari-ables, is essential for industrial practice primarily for designpurposes. Such an assessment of the strength of spot-weldsin quasi-static loading will save cost and time by reducing therequirement of numerous tests to predict failure of spot-weldswith different nugget diameters and sheet thicknesses underdifferent loading modes. The present work is aimed to achievesuch a design criterion.
Studies related to specify the strength of spot-welds as amaterial property in a unified manner from different types ofexperimental measurements is limited. The failure behaviourof spot-welds under quasi-static overload condition in slidingmode (tensile-shear and pure-shear sample) and in open-ing mode (cross-tension sample) has been considered in thisreport. The strengths of spot-welds for two varieties of inter-stitial free (IF) steels, commonly used in body structure, innerand outer panels of automotives, have been examined. The IFsteels contain ultra-low carbon (usually having <0.005 mass%C) and the interstitials like carbon and nitrogen atoms arealmost completely kept in combination with alloying ele-ments such as titanium, niobium or combinations of theseelements. The examinations of the strength of the spot weldshave been carried out using specimens with varying nugget
diameters and subjecting these to both sliding and open-ing loading modes. Specific emphasis has been laid on theassessment of statistical variations associated with such mea-surements. Metallographic examinations of the cross-sections7 0.021 0.013 0.07 0.001 0.0028 Bal.6 0.033 0.012 0.04 – 0.0035 Bal.
of the spot-welds before and after the failure of the specimenshave been carried out in order to understand the failure pro-cesses under different loading conditions. Characterizationsof the microstructure and the mechanical properties of theselected steels have remained as essential supplement to theprimary goal of the investigation.
2. Experimental details
2.1. Selected materials and their microstructures
Two interstitial free (IF) steels have been selected for thisstudy whose chemical compositions have been determinedusing X-ray fluorescence spectroscopy (model: ARL 8680) andLECO carbon sulphur determinator. The chemical composi-tions of the steels are shown in Table 1. Both the selectedsteels are 0.75 mm in thickness and are referred here as “extrainterstitial free (EIF)” and “high strength interstitial free (HIF)”based on their composition and strength values, as per cur-rent industrial practice. Titanium used in these ultra-lowcarbon steels usually combines with the interstitials carbonand nitrogen, and forms various types of precipitate particles,e.g., nitrides, carbides, carbonitrides, sulphides and carbosul-phides of titanium. Depending upon the application, thesesteels exhibit adequate levels of strength, formability andweldability. EIF steel is the low strength, soft, high formabilityversion whereas HIF steel is the high strength version obtainedthrough additions of manganese and phosphorous.
Representative specimens from the as-received steelsheets were cut for microstructural studies in the throughthickness, transverse and longitudinal directions. The speci-men blanks were mounted using phenolic resin, ground up to400-grade emery paper, polished first using 0.6 �m and thenusing 0.25 �m diamond pastes. The polished specimens wereetched with freshly prepared 3% Nital to reveal the microstruc-tures, which were examined using an optical microscope(model: Leica, BMRX). The microstructures of both the steelsshow predominantly ferritic structure. The grain size of fer-rite was determined using linear intercept method followingASTM Standard E112-96 (2004).
2.2. Tensile testing of the base metal
Flat tensile specimens as shown in Fig. 1 were made fromthe steel sheets having loading axes in both the longitudi-nal and the transverse directions of rolling following ASTMStandard E8M-03 (2003) with gage length and width as 50and 12.5 mm, respectively. Tensile tests were carried out
with the help of a 10 t capacity electro-mechanically oper-ated Instron testing machine (model: 5582) with a cross-headvelocity of 10 mm/min at room temperature of approximately300 K. For each test, the load–displacement signals were auto-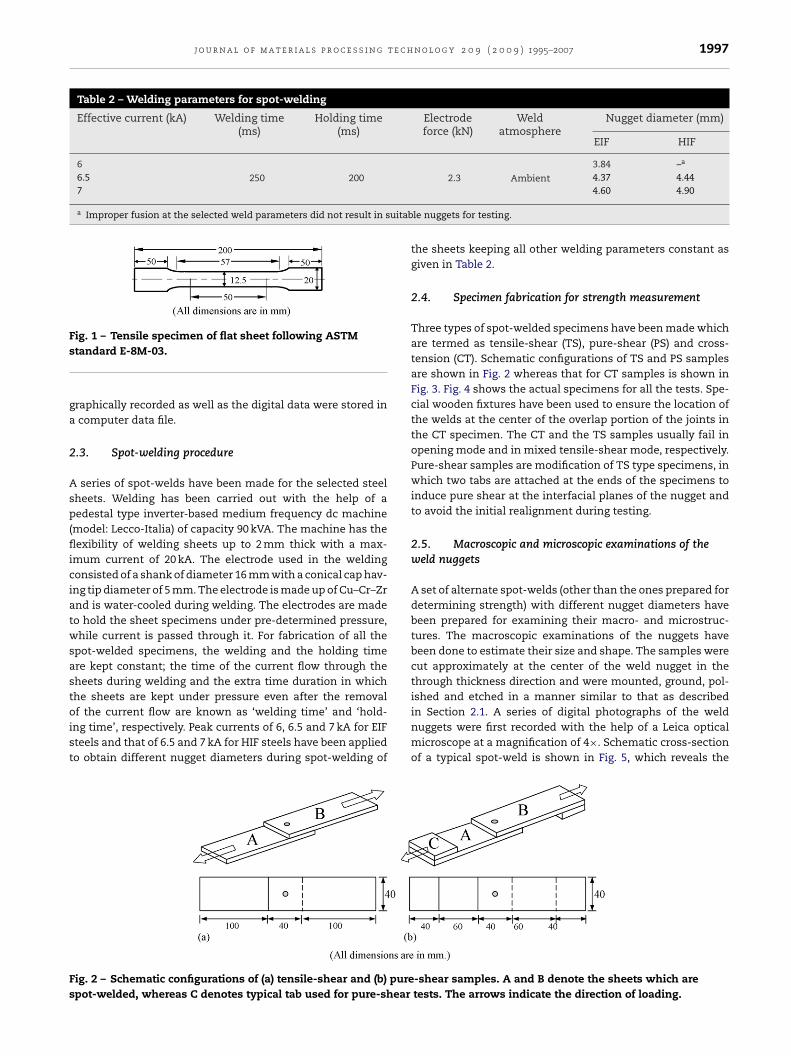
j o u r n a l o f m a t e r i a l s p r o c e s s i n g t e c h n o l o g y 2 0 9 ( 2 0 0 9 ) 1995–2007 1997
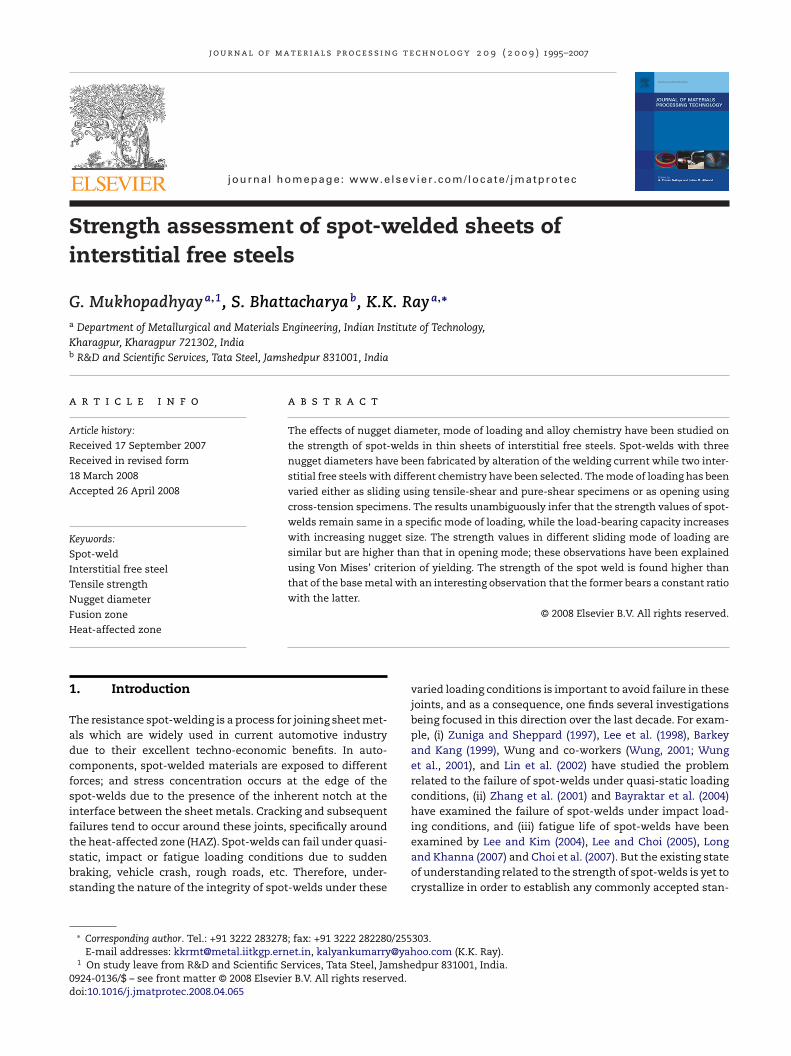
Table 2 – Welding parameters for spot-welding
Effective current (kA) Welding time(ms)
Holding time(ms)
Electrodeforce (kN)
Weldatmosphere
Nugget diameter (mm)
EIF HIF
6250 200 2.3 Ambient
3.84 –a
6.5 4.37 4.447
a Improper fusion at the selected weld parameters did not result in suitab
Fig. 1 – Tensile specimen of flat sheet following ASTMs
ga
2
Asp(fliciatwsastoist
Fs
tandard E-8M-03.
raphically recorded as well as the digital data were stored incomputer data file.
.3. Spot-welding procedure
series of spot-welds have been made for the selected steelheets. Welding has been carried out with the help of aedestal type inverter-based medium frequency dc machine
model: Lecco-Italia) of capacity 90 kVA. The machine has theexibility of welding sheets up to 2 mm thick with a max-
mum current of 20 kA. The electrode used in the weldingonsisted of a shank of diameter 16 mm with a conical cap hav-ng tip diameter of 5 mm. The electrode is made up of Cu–Cr–Zrnd is water-cooled during welding. The electrodes are madeo hold the sheet specimens under pre-determined pressure,hile current is passed through it. For fabrication of all the
pot-welded specimens, the welding and the holding timere kept constant; the time of the current flow through theheets during welding and the extra time duration in whichhe sheets are kept under pressure even after the removal
f the current flow are known as ‘welding time’ and ‘hold-ng time’, respectively. Peak currents of 6, 6.5 and 7 kA for EIFteels and that of 6.5 and 7 kA for HIF steels have been appliedo obtain different nugget diameters during spot-welding of
ig. 2 – Schematic configurations of (a) tensile-shear and (b) purepot-welded, whereas C denotes typical tab used for pure-shear
4.60 4.90
le nuggets for testing.
the sheets keeping all other welding parameters constant asgiven in Table 2.
2.4. Specimen fabrication for strength measurement
Three types of spot-welded specimens have been made whichare termed as tensile-shear (TS), pure-shear (PS) and cross-tension (CT). Schematic configurations of TS and PS samplesare shown in Fig. 2 whereas that for CT samples is shown inFig. 3. Fig. 4 shows the actual specimens for all the tests. Spe-cial wooden fixtures have been used to ensure the location ofthe welds at the center of the overlap portion of the joints inthe CT specimen. The CT and the TS samples usually fail inopening mode and in mixed tensile-shear mode, respectively.Pure-shear samples are modification of TS type specimens, inwhich two tabs are attached at the ends of the specimens toinduce pure shear at the interfacial planes of the nugget andto avoid the initial realignment during testing.
2.5. Macroscopic and microscopic examinations of theweld nuggets
A set of alternate spot-welds (other than the ones prepared fordetermining strength) with different nugget diameters havebeen prepared for examining their macro- and microstruc-tures. The macroscopic examinations of the nuggets havebeen done to estimate their size and shape. The samples werecut approximately at the center of the weld nugget in thethrough thickness direction and were mounted, ground, pol-ished and etched in a manner similar to that as described
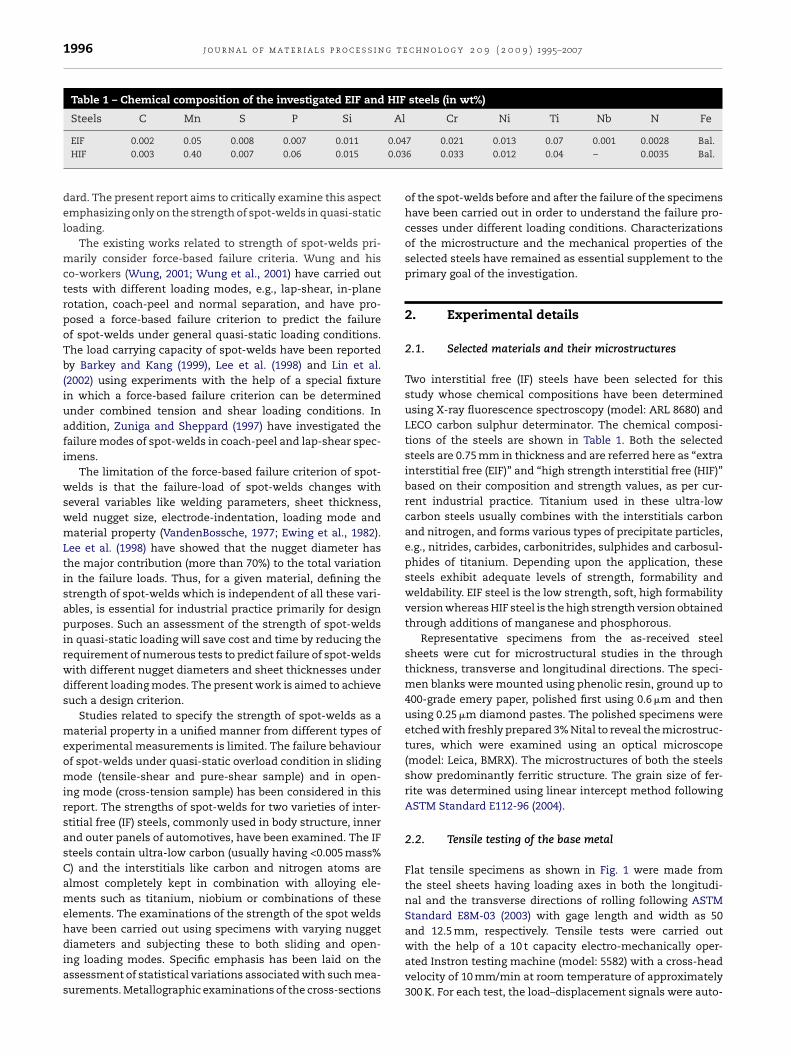
in Section 2.1. A series of digital photographs of the weldnuggets were first recorded with the help of a Leica opticalmicroscope at a magnification of 4×. Schematic cross-sectionof a typical spot-weld is shown in Fig. 5, which reveals the-shear samples. A and B denote the sheets which aretests. The arrows indicate the direction of loading.
1998 j o u r n a l o f m a t e r i a l s p r o c e s s i n g t e c h n o l o g y 2 0 9 ( 2 0 0 9 ) 1995–2007
Fig. 5 – Schematic cross-section of a spot-weld.
Fig. 6 – Testing of TS (or PS) and CT specimens: (a) testing
Fig. 3 – Schematic configuration of a cross-tensionspecimen. A and B denote the two parts of a CT specimen.The arrows indicate the direction of loading.different zones of the spot-weld apart from exhibiting thediameter of the weld nugget. The diameter of the fusion zoneis popularly called as the “nugget diameter”. The nugget diam-eters have been measured from these photographs using animage analyzer coupled to the microscope having the Leica-Qwin commercial software. At least five spot-welds have beenexamined to obtain the average nugget diameter for each peakcurrent value. The microstructures of these specimens havebeen next examined using the same microscope at highermagnifications to reveal the possible differences in the sizeand morphology of the ferrite phase present in the differentzones of the spot-weld.
2.6. Determination of hardness distribution around
the spot-weldsMicro-hardness profile across the spot-welds has been deter-mined in a few representative specimens using a Vickers
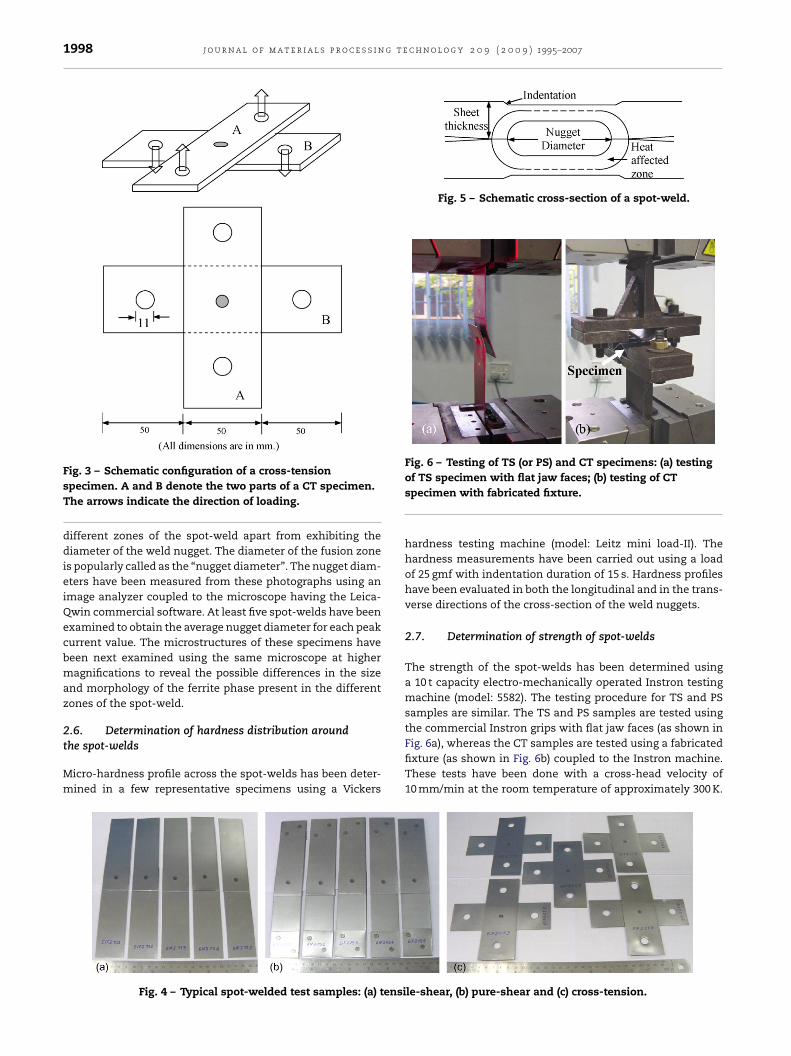
Fig. 4 – Typical spot-welded test samples: (a) tensi
of TS specimen with flat jaw faces; (b) testing of CTspecimen with fabricated fixture.
hardness testing machine (model: Leitz mini load-II). Thehardness measurements have been carried out using a loadof 25 gmf with indentation duration of 15 s. Hardness profileshave been evaluated in both the longitudinal and in the trans-verse directions of the cross-section of the weld nuggets.
2.7. Determination of strength of spot-welds
The strength of the spot-welds has been determined usinga 10 t capacity electro-mechanically operated Instron testingmachine (model: 5582). The testing procedure for TS and PSsamples are similar. The TS and PS samples are tested usingthe commercial Instron grips with flat jaw faces (as shown in
Fig. 6a), whereas the CT samples are tested using a fabricatedfixture (as shown in Fig. 6b) coupled to the Instron machine.These tests have been done with a cross-head velocity of10 mm/min at the room temperature of approximately 300 K.le-shear, (b) pure-shear and (c) cross-tension.
j o u r n a l o f m a t e r i a l s p r o c e s s i n g t e c h n o l o g y 2 0 9 ( 2 0 0 9 ) 1995–2007 1999
Fl
Tsdmctocs
2
Tftplot
3
3s
Tw
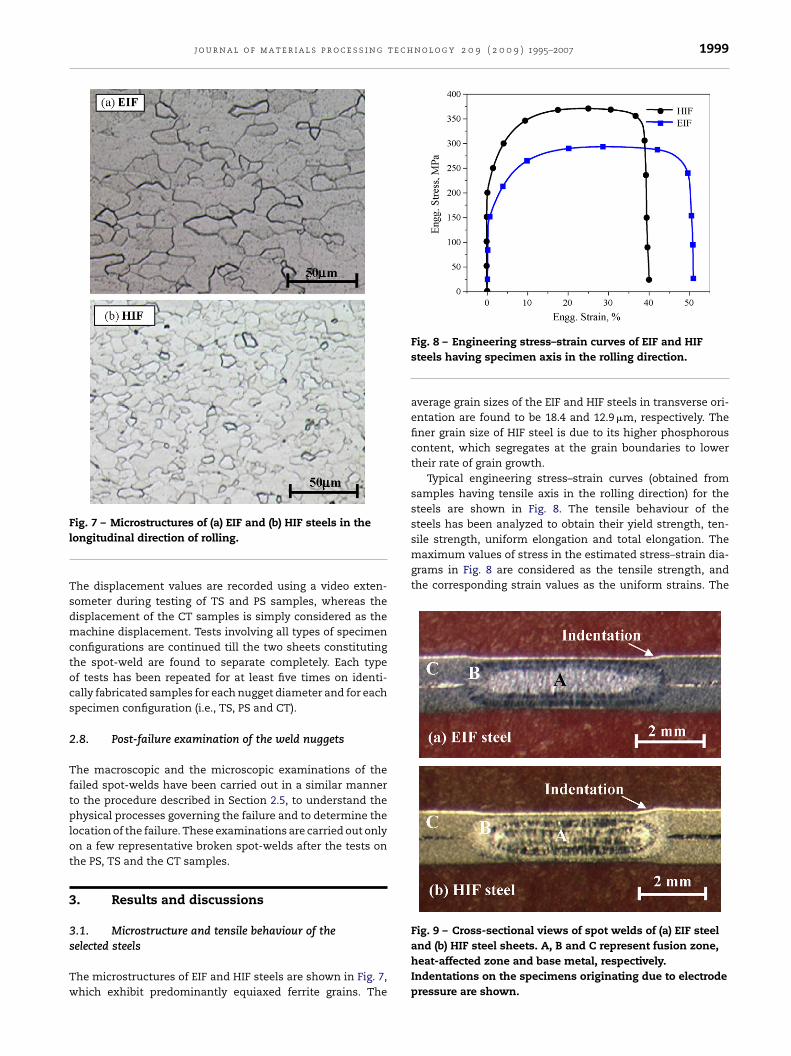
sile strength, uniform elongation and total elongation. Themaximum values of stress in the estimated stress–strain dia-grams in Fig. 8 are considered as the tensile strength, andthe corresponding strain values as the uniform strains. The
Fig. 9 – Cross-sectional views of spot welds of (a) EIF steel
ig. 7 – Microstructures of (a) EIF and (b) HIF steels in theongitudinal direction of rolling.
he displacement values are recorded using a video exten-ometer during testing of TS and PS samples, whereas theisplacement of the CT samples is simply considered as theachine displacement. Tests involving all types of specimen
onfigurations are continued till the two sheets constitutinghe spot-weld are found to separate completely. Each typef tests has been repeated for at least five times on identi-ally fabricated samples for each nugget diameter and for eachpecimen configuration (i.e., TS, PS and CT).
.8. Post-failure examination of the weld nuggets
he macroscopic and the microscopic examinations of theailed spot-welds have been carried out in a similar mannero the procedure described in Section 2.5, to understand thehysical processes governing the failure and to determine the
ocation of the failure. These examinations are carried out onlyn a few representative broken spot-welds after the tests onhe PS, TS and the CT samples.
. Results and discussions
.1. Microstructure and tensile behaviour of the
elected steelshe microstructures of EIF and HIF steels are shown in Fig. 7,hich exhibit predominantly equiaxed ferrite grains. The
Fig. 8 – Engineering stress–strain curves of EIF and HIFsteels having specimen axis in the rolling direction.
average grain sizes of the EIF and HIF steels in transverse ori-entation are found to be 18.4 and 12.9 �m, respectively. Thefiner grain size of HIF steel is due to its higher phosphorouscontent, which segregates at the grain boundaries to lowertheir rate of grain growth.
Typical engineering stress–strain curves (obtained fromsamples having tensile axis in the rolling direction) for thesteels are shown in Fig. 8. The tensile behaviour of thesteels has been analyzed to obtain their yield strength, ten-
and (b) HIF steel sheets. A, B and C represent fusion zone,heat-affected zone and base metal, respectively.Indentations on the specimens originating due to electrodepressure are shown.
2000 j o u r n a l o f m a t e r i a l s p r o c e s s i n g t e c h n o l o g y 2 0 9 ( 2 0 0 9 ) 1995–2007
Table 3 – Tensile properties of EIF and HIF steel
Steels 0.2% offset yield strength(MPa)
Ultimate tensilestress (MPa)
Uniformelongation (%)
Totalelongation (%)
r-Value n-Value
EIF 145 294HIF 204 371
yield strengths of the specimens are estimated by the 0.2%strain offset method following ASTM Standard E8M-03 (2003).The total elongation for each specimen was estimated as the
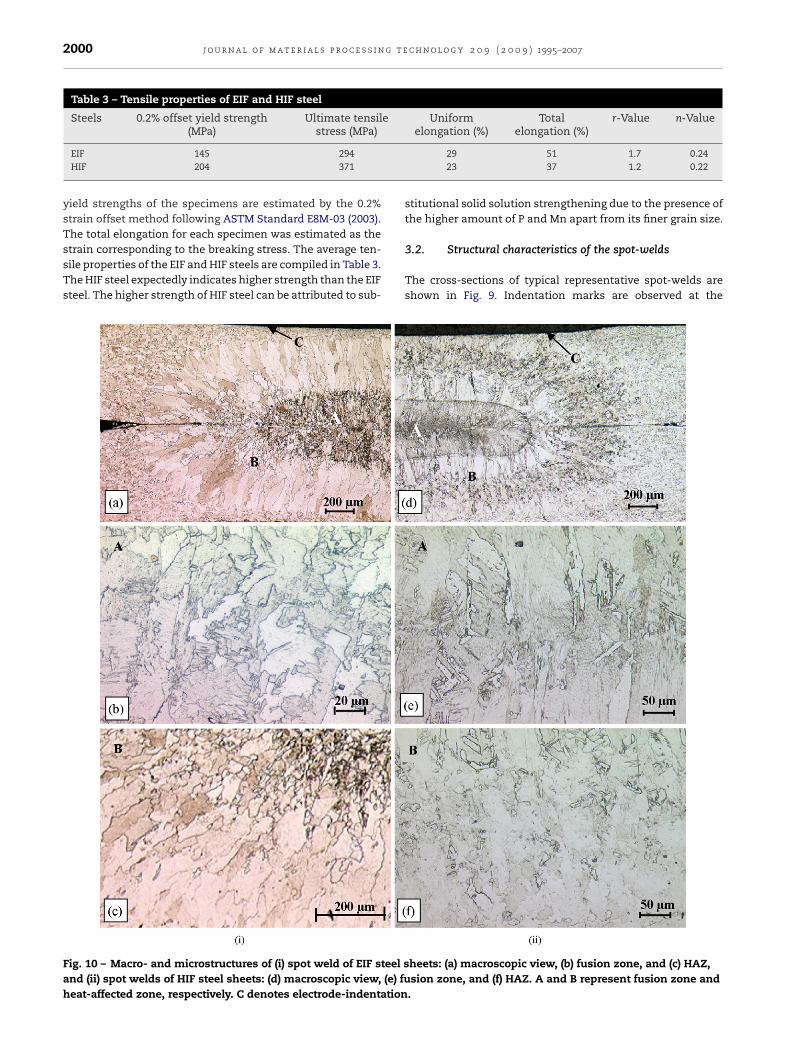
strain corresponding to the breaking stress. The average ten-sile properties of the EIF and HIF steels are compiled in Table 3.The HIF steel expectedly indicates higher strength than the EIFsteel. The higher strength of HIF steel can be attributed to sub-Fig. 10 – Macro- and microstructures of (i) spot weld of EIF steel sand (ii) spot welds of HIF steel sheets: (d) macroscopic view, (e) fuheat-affected zone, respectively. C denotes electrode-indentation
29 51 1.7 0.2423 37 1.2 0.22
stitutional solid solution strengthening due to the presence ofthe higher amount of P and Mn apart from its finer grain size.
3.2. Structural characteristics of the spot-welds
The cross-sections of typical representative spot-welds areshown in Fig. 9. Indentation marks are observed at the
heets: (a) macroscopic view, (b) fusion zone, and (c) HAZ,sion zone, and (f) HAZ. A and B represent fusion zone and.

t e c h n o l o g y 2 0 9 ( 2 0 0 9 ) 1995–2007 2001
owiztmttpatr
iTbfTRr2stmdcc(TmoupgddfR
3
ToapL(whTwnfihasihz
in general, is higher than that of EIF steel in all the weld zonesbecause of the solid solution strengthening of ferrite due toadditional amounts of Mn and P in the base metal of the formersteel.
Table 4 – Average hardness of different zones of spotweld
Steels Average hardness (kg/mm2)
j o u r n a l o f m a t e r i a l s p r o c e s s i n g
uter surfaces of the spot-welds in the cross-sectional view,hich are known to form due to the electrode pressure dur-
ng the welding process. The sheet thickness at the weldedone is thus reduced due to the indentation at this loca-ion. The macro-graphs in Fig. 9 reveal three distinct zones
arked as A, B and C, which represent the fusion zone,he heat-affected zone (HAZ) and the base metal, respec-ively. The nugget diameters corresponding to the differenteak currents have been measured from these photographsnd are given in Table 2. The results in Table 2 indicatehat nugget diameter increases with increasing peak cur-ent.
The micrographs of the fusion zone and the HAZ are shownn Fig. 10, whereas that for the base metal is shown in Fig. 7.he fusion zone of EIF steel exhibits quasi-polygonal andainitic ferrite; the classification of ferrite has been madeollowing the report of Bayraktar et al. (2007), Krauss andhompson (1995), Xiao et al. (2005), Lee et al. (2005b) andauf and Boyd (1997). The fusion zone of HIF steel in contrasteveals widmanstatten ferrite (Bhadeshia and Honeycombe,006). The microstructures of the HAZ of both EIF and HIFteels reveal coarse elongated grains parallel to the direc-ion of heat flow. Bayraktar et al. (2007) have discussed the
echanism of excessive grain growth at the HAZ along theirection in which heat flows away from the weld pool toooler parts during the cooling cycle of the welding pro-ess. The grain size along the direction of heat flow is morealmost three times) than that in the transverse direction.his phenomenon gets manifested in the regions where theaximum temperature is just over Ac3. The grain growth
ccurring along the thermal gradient can be interpretedsing the amplitude of the thermal gradient (G) and the dis-lacement rate of the Ar3 isotherm (R). The excessive grainrowth at HAZ is due to higher amplitude of thermal gra-ient, which increases with distance from the weld pooluring the cooling cycle. Grain growth dominates nucleationor the � → � transformation when G is larger compared to.
.3. Hardness profile across the spot-weld
ypical distributions of microhardness across the spot-weldsf EIF and HIF steel sheets along the longitudinal directionre shown in Fig. 11. The observed nature of the hardnessrofiles are similar to the ones reported by Lee et al. (2005a),amouroux et al. (2007), Choi et al. (2007) and Chang et al.2001). The base metal, HAZ and the fusion zone of the spot-elds are considered to exhibit some characteristic averageardness value; these are estimated and are compiled inable 4. The mean hardness of the fusion zone is the highest,hile that of the base metal is the lowest. The microhard-ess of HAZ exhibits considerable increase in its magnitude
rom the base metal side to the fusion zone side and hencets mean is associated with large standard error (S.E.). Theardness of the fusion zone and the HAZ is found to be 60%nd 24% higher than the hardness of the base metal in EIF
teel; the corresponding increase of hardness for these zonesn HIF steel are 64% and 27%, respectively. Lee et al. (2005a)ave reported 76% and 38% higher hardness of the fusionone and HAZ, respectively, than that of the base metal inFig. 11 – Hardness profiles across the spot-welded zones ofHIF and EIF steel.
SPRC35 (C-0.1, Si-0.05, P-0.1, S-0.04, Fe-bal.%) steel. Thus theobserved order of increase in the estimated hardness valuesof the fusion zone and the HAZ over that of the base metalfor the selected steels is similar to that reported in the litera-ture.
The base metal, HAZ and the fusion zone exhibit pre-dominantly ferrite. But there exists some difference in themorphology of ferrite in the different zones of spot-weldas discussed in the preceding section. The base metal hasnearly equiaxed ferrite, whereas, the fusion zone has quasi-polygonal and bainitic ferrite in EIF steel and widmanstattenferrite in HIF steel; the HAZ contains elongated columnarferrite in both the steels. The variation of hardness at differ-ent weld zones is because of these morphological variationsin ferrite. Quasi-polygonal ferrite contains higher disloca-tion density and is infested with numerous sub-boundariesthan that of the equiaxed ferrite and hence exhibits higherhardness than the base metal (Krauss and Thompson, 1995).Bainitic ferrite and widmanstatten ferrite is known to format faster cooling rates and have lower temperatures of trans-formation compared to quasi-polygonal ferrite or polygonalferrite as per the continuous cooling transformation (CCT) dia-grams for ultra-low carbon steels as reported by the ISIJ BainiteCommittee (Krauss and Thompson, 1995). This phenomenonresults in higher residual stress leading to higher hardness inbainitic and widmanstatten ferrite. The hardness of HIF steel,
Base metal HAZ Fusion zone
EIF 75 ± 2.89 93 ± 8.79 120 ± 6.57HIF 105 ± 2.82 133 ± 10.89 172 ± 9.02
2002 j o u r n a l o f m a t e r i a l s p r o c e s s i n g t e c h n o l o g y 2 0 9 ( 2 0 0 9 ) 1995–2007
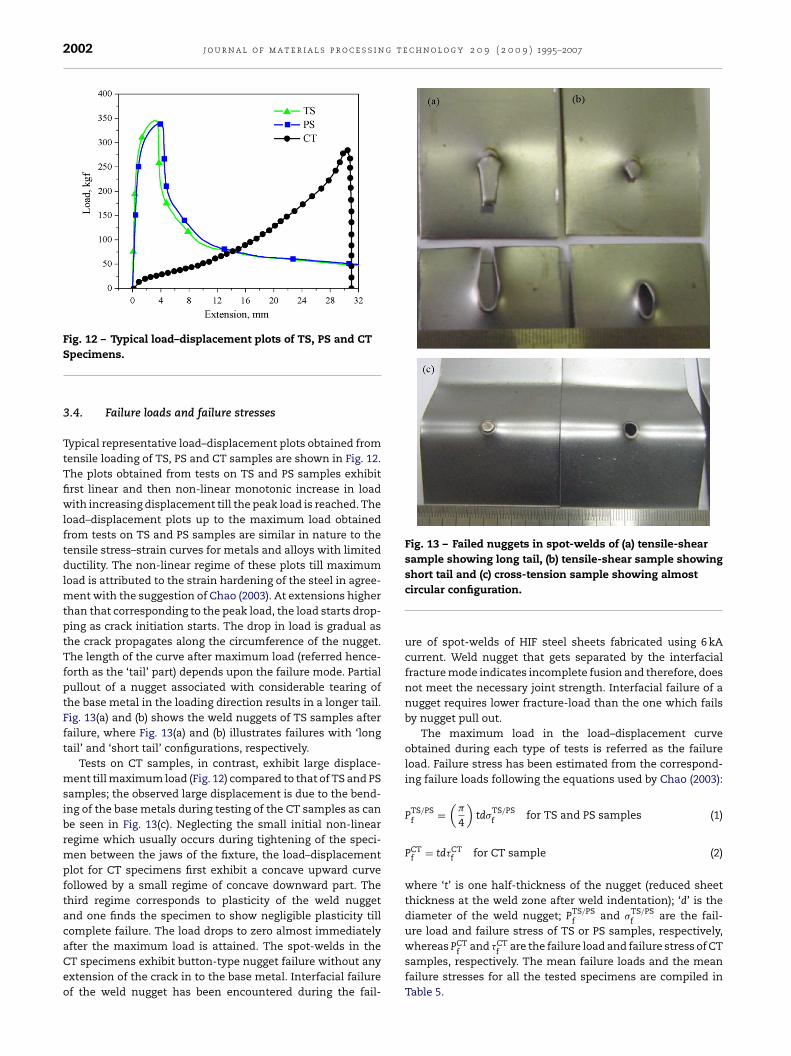
Fig. 12 – Typical load–displacement plots of TS, PS and CT
Fig. 13 – Failed nuggets in spot-welds of (a) tensile-shearsample showing long tail, (b) tensile-shear sample showing
CT CT
Specimens.
3.4. Failure loads and failure stresses
Typical representative load–displacement plots obtained fromtensile loading of TS, PS and CT samples are shown in Fig. 12.The plots obtained from tests on TS and PS samples exhibitfirst linear and then non-linear monotonic increase in loadwith increasing displacement till the peak load is reached. Theload–displacement plots up to the maximum load obtainedfrom tests on TS and PS samples are similar in nature to thetensile stress–strain curves for metals and alloys with limitedductility. The non-linear regime of these plots till maximumload is attributed to the strain hardening of the steel in agree-ment with the suggestion of Chao (2003). At extensions higherthan that corresponding to the peak load, the load starts drop-ping as crack initiation starts. The drop in load is gradual asthe crack propagates along the circumference of the nugget.The length of the curve after maximum load (referred hence-forth as the ‘tail’ part) depends upon the failure mode. Partialpullout of a nugget associated with considerable tearing ofthe base metal in the loading direction results in a longer tail.Fig. 13(a) and (b) shows the weld nuggets of TS samples afterfailure, where Fig. 13(a) and (b) illustrates failures with ‘longtail’ and ‘short tail’ configurations, respectively.
Tests on CT samples, in contrast, exhibit large displace-ment till maximum load (Fig. 12) compared to that of TS and PSsamples; the observed large displacement is due to the bend-ing of the base metals during testing of the CT samples as canbe seen in Fig. 13(c). Neglecting the small initial non-linearregime which usually occurs during tightening of the speci-men between the jaws of the fixture, the load–displacementplot for CT specimens first exhibit a concave upward curvefollowed by a small regime of concave downward part. Thethird regime corresponds to plasticity of the weld nuggetand one finds the specimen to show negligible plasticity tillcomplete failure. The load drops to zero almost immediately
after the maximum load is attained. The spot-welds in theCT specimens exhibit button-type nugget failure without anyextension of the crack in to the base metal. Interfacial failureof the weld nugget has been encountered during the fail-short tail and (c) cross-tension sample showing almostcircular configuration.
ure of spot-welds of HIF steel sheets fabricated using 6 kAcurrent. Weld nugget that gets separated by the interfacialfracture mode indicates incomplete fusion and therefore, doesnot meet the necessary joint strength. Interfacial failure of anugget requires lower fracture-load than the one which failsby nugget pull out.
The maximum load in the load–displacement curveobtained during each type of tests is referred as the failureload. Failure stress has been estimated from the correspond-ing failure loads following the equations used by Chao (2003):
PTS/PSf =
(�
4
)td�
TS/PSf for TS and PS samples (1)
PCTf = td�CT
f for CT sample (2)
where ‘t’ is one half-thickness of the nugget (reduced sheetthickness at the weld zone after weld indentation); ‘d’ is thediameter of the weld nugget; P
TS/PSf and �
TS/PSf are the fail-
ure load and failure stress of TS or PS samples, respectively,
whereas Pf and �f are the failure load and failure stress of CTsamples, respectively. The mean failure loads and the meanfailure stresses for all the tested specimens are compiled inTable 5.
j o u r n a l o f m a t e r i a l s p r o c e s s i n g t e c h
Tabl
e5
–A
vera
gelo
ads
and
stre
sses
for
nu
gget
pu
llou
tfa
ilu
reof
spot
-wel
ded
spec
imen
sh
avin
gd
iffe
ren
tn
ugg
etd
iam
eter
sfo
rH
IFan
dEI
Fst
eels
Mat
eria
lSa
mp
leco
de
Nu
gget
dia
met
er(m
m)
Fail
ure
load
s(k
N)
Fail
ure
stre
sses
(MPa
)
Ten
sile
-sh
ear
Pure
-sh
ear
Cro
ss-t
ensi
onTe
nsi
le-s
hea
rPu
re-s
hea
rC
ross
-ten
sion
EIF
D1
3.84
2.81
±0.
062.
76±
0.03
2.24
±0.
0612
83±
2712
58±
1380
2±
20D
24.
373.
18±
0.05
3.13
±0.
052.
63±
0.07
1273
±19
1254
±19
827
±23
D3
4.60
3.36
±0.
043.
31±
0.05
2.71
±0.
0812
78±
1712
59±
1980
9±
25
HIF
D4
4.44
3.93
±0.
063.
92±
0.04
3.23
±0.
0815
76±
2615
75±
1810
16±
25D
54.
904.
20±
0.05
4.20
±0.
053.
43±
0.11
1577
±19
1579
±19
1010
±33
Red
uce
dth
ickn
ess
atel
ectr
ode-
ind
enta
tion
for
D1,
D2
and
D3
spec
imen
sis
0.72
8m
mw
her
eas
thes
eva
lues
for
D4
and
D5
spec
imen
sar
e0.
715
and
0.69
1m
m,r
esp
ecti
vely
.
n o l o g y 2 0 9 ( 2 0 0 9 ) 1995–2007 2003
Failure load for nugget pull out (Table 5) increases withincreasing nugget diameter. While the failure load of a par-ticular specimen configuration is found to be dependent onthe nugget diameter, the calculated failure stress of a spot-weld remains identical for all the nugget diameters for anyof the selected specimen configurations like TS, PS or CT.This implies that the failure stress is representative of thestrength of a spot-weld so long the failure is by nuggetpull out. Alternately, once the strength is determined, thefailure load of a spot-weld for any nugget diameter canbe predicted from Eqs. (1) and (2) for the identical failuremode.
The failure load or failure stress of CT specimen is foundto be lower than that of TS or PS specimens. Though theglobal loading mode for CT and TS or PS samples are ten-sile and shear, respectively, at localized domain the failure isgoverned by shear stresses in CT specimens and by tensilestresses in TS or PS specimens (Chao, 2003). This is consid-ered as the reason for the lower failure stress of CT samples.For ductile materials, the relation between the fracture stressin tension �f (TS or PS sample) and the fracture stress inshear �f (CT sample) is �f = 0.577�f according to Von Misesfailure criterion and �f = 0.5�f according to Tresca criterion(Dieter, 2001). Using the above failure criteria and using Eqs. (1)and (2), one finds that the failure load in cross-tension to beeither PCT
f = 0.735PTS/PSf or PCT
f = 0.64PTS/PSf according to Von
Mises’ criterion and Tresca criterion, respectively. The ratiosof failure loads and stresses for different spot-welded sam-ples are summarized in Table 6. The results in Table 6 showthat �CT
f = 0.638�TSf , PCT
f = 0.814PTSf , �CT
f = 0.644�PSf , and PCT
f =0.822PPS
f . The estimated experimental values of the ratiosbetween shear and tensile stresses (�CT
f /�TSf ) are within 12%
of the theoretical estimates obtained using Von Mises’ crite-rion. The magnitude of PCT
f is found to be reported as equalto 0.821 PTS
f for spot-weld joints of DQSK steel (C: 0.023%, Mn:0.23%, P: 0.006%, S: 0.015%) sheets with base metal strength of340 MPa by Rathbun et al. (2003). Similar report by Kavamuraand Batalha (2008) indicates the ratio of failure loads underpure-shear (PPS
f ) and pure-tension (PCTf ) configurations as 0.811
(0.8 mm thickness) and 0.818 (1.2 mm thickness) for sheets ofa mild steel of 170 MPa yield strength. The present results(Table 6) of PCT
f /PTSf (=0.819) for the HIF steel and of PCT
f /PPSf
(= 0.823) for the EIF steel are thus in excellent agreement withearlier reports on materials of similar strength. However, forspot-welded joints of SPRC35 (TS: 365 MPa) steel sheets, theresults reported by Lee et al. (2005a) indicate higher valuesof PCT
f /PTSf as 0.908 and 0.870 for weld nugget diameters of
4.95 and 5.9 mm, respectively. The above analyses show thatthe experimental results are closer to the theoretical predic-tions of PCT
f /PTSf (=0.735) based on Von Mises’ criterion. These
ratios are of significance because failure strength or load for aparticular specimen configuration can be predicted from thatof the other specimen configurations using these ratios. Theratio of PTS
f /PPSf for different specimens, on the other hand, is
found to be between 1 and 1.01. The marginally higher valueof PTS over PPS emerges from the loading configurations of
f fthe specimens. The loading of TS specimens involves smallamount of shear because of the misalignment in tensile load-ing and hence requires higher failure load than that for PSspecimens.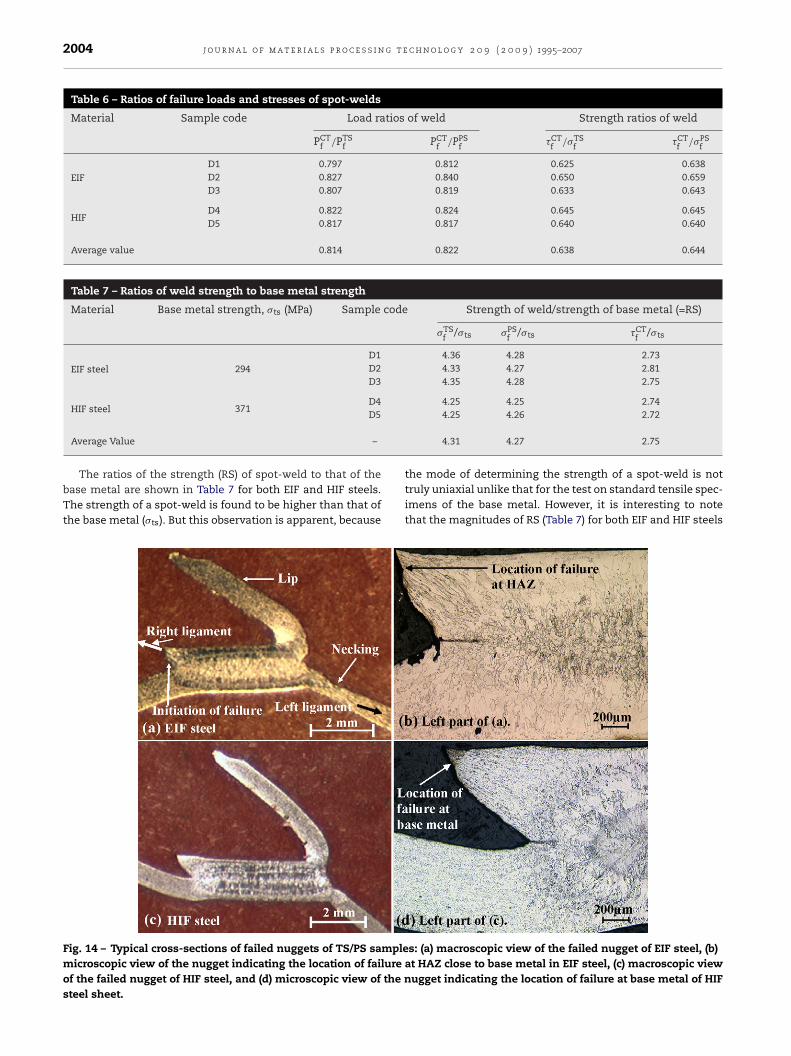
2004 j o u r n a l o f m a t e r i a l s p r o c e s s i n g t e c h n o l o g y 2 0 9 ( 2 0 0 9 ) 1995–2007
Table 6 – Ratios of failure loads and stresses of spot-welds
Material Sample code Load ratios of weld Strength ratios of weld
PCTf /PTS
f PCTf /PPS
f �CTf /�TS
f �CTf /�PS
f
EIFD1 0.797 0.812 0.625 0.638D2 0.827 0.840 0.650 0.659D3 0.807 0.819 0.633 0.643
HIFD4 0.822 0.824 0.645 0.645D5 0.817 0.817 0.640 0.640
Average value 0.814 0.822 0.638 0.644
Table 7 – Ratios of weld strength to base metal strength
Material Base metal strength, �ts (MPa) Sample code Strength of weld/strength of base metal (=RS)
�TSf /�ts �PS
f /�ts �CTf /�ts
EIF steel 294D1 4.36 4.28 2.73D2 4.33 4.27 2.81D3 4.35 4.28 2.75
D4 4.25 4.25 2.74
HIF steel 371D5
Average Value –
The ratios of the strength (RS) of spot-weld to that of thebase metal are shown in Table 7 for both EIF and HIF steels.The strength of a spot-weld is found to be higher than that ofthe base metal (�ts). But this observation is apparent, because
Fig. 14 – Typical cross-sections of failed nuggets of TS/PS samplemicroscopic view of the nugget indicating the location of failureof the failed nugget of HIF steel, and (d) microscopic view of the nsteel sheet.
4.25 4.26 2.72
4.31 4.27 2.75
the mode of determining the strength of a spot-weld is nottruly uniaxial unlike that for the test on standard tensile spec-imens of the base metal. However, it is interesting to notethat the magnitudes of RS (Table 7) for both EIF and HIF steels
s: (a) macroscopic view of the failed nugget of EIF steel, (b)at HAZ close to base metal in EIF steel, (c) macroscopic view
ugget indicating the location of failure at base metal of HIF

t e c h n o l o g y 2 0 9 ( 2 0 0 9 ) 1995–2007 2005
asrtrpstirtwetmtabtb
3
PutoFIaabtthowsmZsm
ss(uotssZoeitti
vail
able
stre
ngt
hd
ata
for
spot
wel
ds
and
the
esti
mat
edra
tios
ofw
eld
toba
sem
etal
stre
ngt
h
Fail
ure
load
s(k
N)
�ts
a(M
Pa)
Shee
tth
ickn
ess
(mm
)N
ugg
etd
ia.(
mm
)C
alcu
late
dw
eld
stre
ngt
h(M
Pa)
RSb
Ref
.
PT
Sf
PPS f
PC
Tf
�T
Sf
�PS f
�CT
f�
TS
f/�
ts�
PS f/�
ts�C
Tf
/�ts
12.3
–10
.134
01.
507.
613
74–
886
4.04
–2.
61
Rat
hbu
net
al.(
2003
)16
.9–
11.6
440
1.50
7.9
1817
–97
94.
13–
2.22
18.7
–11
.262
51.
407.
921
54–
1013
3.45
–1.
6222
.8–
9.2
610
1.40
8.4
2470
–78
24.
05–
1.28
–20
.95
–67
11.
537
–24
92–
–3.
71–
Lon
get
al.(
2007
)–
23.5
8–
673
1.64
7–
2617
––
3.89
––
17.8
2–
448
1.78
7–
1822
––
4.07
–
––
5.95
302
1.00
6.4
––
930
––
3.1
Lin
etal
.(20
02)
––
9.31
302
1.50
6.4
––
970
––
3.2
est
ren
gth
ofth
eba
sem
etal
.th
ofsp
ot-w
eld
/str
engt
hof
base
met
al.
j o u r n a l o f m a t e r i a l s p r o c e s s i n g
re almost similar for all nugget diameters; RS ≈ 4.31 for TSamples and ≈2.75 for CT samples. In order to examine theseesults with the available reports, related data from the litera-ure are compiled in Table 8. Most of the earlier investigationseport only the values of failure loads. These data are nextrocessed using Eqs. (1) and (2), and the magnitudes of RS foreveral steels in the existing reports are first estimated andhen compiled in Table 8. The results presented in Table 8ndicate that RS corresponding to TS specimens are in theange 3.15–4.13; the estimated values of RS corresponding tohe TS specimens for the EIF and HIF steels are found to lieithin this domain, and hence these results can be consid-
red appropriate. Similar inference can also be drawn relatedo the results of RS corresponding to CT specimens. In sum-
ary, it can be inferred from the results in Tables 7 and 8hat for EIF and HIF steels, the strengths of the spot-welds arepproximately 4.31 and 2.75 times higher than those of thease metal when one considers TS and CT samples, respec-ively. The results are in close agreement with that suggestedy Rathbun et al. (2003).
.5. Post failure examination of the spot-weld
ost failure examinations of the welds have been done tonderstand the physical processes governing the failure ando identify the location of the failure. Typical cross-sectionsf failed spot-welds in TS and CT specimens are shown inigs. 14 and 15, respectively, for both EIF and HIF steels.n TS or PS specimens, localized necking at one of the lig-ments on the nuggets is observed as shown in Fig. 14(a)nd (c). It appears from these figures that failure initiatesy necking at one of the ligaments in the HAZ close tohe base metal for EIF steel, and at the base metal forhe HIF steel. The initiated crack then propagates aroundalf the circumference of the nugget followed by tearingf the sheet metal which leaves behind a lip on the spot-eld. Fig. 15(a) and (c) shows button-type nuggets failed by
hear in the thickness direction at the HAZ of CT speci-ens. Similar failure mechanisms have been reported by
uniga and Sheppard (1997) and Kocabekir et al. (2008) for TSpecimens and by Lin et al. (2002) for both TS and CT speci-ens.The locations of failures for the tested specimens can be
ummarized as: (i) For CT specimens of both EIF and HIFteels, the location of failure is in the HAZ (Fig. 15b and d).ii) For TS or PS specimens of HIF steel, the location of fail-re is in the base metal (Fig. 14d). (iii) For TS or PS specimensf EIF steel, the location of failure is in the HAZ closer tohe base metal (Fig. 14b). The locations of failures for CTpecimens of both EIF and HIF steels and that for TS or PSpecimens of HIF steel are in agreement with the reports ofuniga and Sheppard (1997) and Lin et al. (2002). But for TSr PS specimens of EIF steel, the location of failure is differ-nt (in HAZ closer to the base metal). The location of failure
s governed by the type of specimen configuration which con-rols the nature of stresses active during loading, apart fromhe microstructure and the residual stresses at the regions ofnterest.Tabl
e8
–A
Stee
ls
DQ
SKH
SLA
50D
P590
TR
IP59
0
DP6
00G
IT
RIP
600
HSL
A34
0G
I
MS
MS
a�
ts=
ten
sil
bR
S=
stre
ng

2006 j o u r n a l o f m a t e r i a l s p r o c e s s i n g t e c h n o l o g y 2 0 9 ( 2 0 0 9 ) 1995–2007
Fig. 15 – Typical cross-sections of failed nuggets of CT samples: (a) macroscopic view of the failed nugget of EIF steel, (b)microscopic view of the nugget showing location of failure in the HAZ (EIF steel), (c) macroscopic view of the nugget of HIF
on o
steel, and (d) microscopic view of the nugget showing locati4. Conclusions
A series of experiments have been carried out first to deter-mine the failure loads of spot-welds of extra interstitial free(EIF) and high strength interstitial free (HIF) steels with variednugget diameters using tensile-shear (TS), pure-shear (PS) andcross-tension (CT) specimens. The failure loads obtained fromthese experiments have been used to estimate the strength ofthe spot-welds following the expressions suggested of Chao(2003). In addition, the locations at which the failure occurredin each type of specimens have been examined to detect thenature of microstructure in the joints responsible for crack ini-tiation. The following major conclusions can be drawn fromthe obtained results and their analyses:
• The estimated failure loads of tensile-shear specimens ofEIF steels are 2.81, 3.18 and 3.36 kN for nugget diametersof 3.84, 4.37 and 4.6 mm, respectively. Failure loads of pure-shear and cross-tension specimens of EIF steel and all thethree specimen configurations of HIF steel show similarincrease in failure load with the increase in nugget diam-eter. The generated results thus assist one to infer that theload-bearing capacity of spot-welds increases with increas-ing nugget size for a specific mode of loading (e.g., TS, PS orCT), in agreement with a few earlier reports.
• The average values of failure stress estimated from spec-imens with different nugget sizes can be represented as1278 ± 5, 1257 ± 3 and 813 ± 13 MPa for TS, PS and CT spec-
imens of EIF steel, respectively, and the correspondingvalues for HIF steel are 1576 ± 1, 1577 ± 3 and 1013 ± 4 MPa,respectively. The failure stress, referred as the strength ofspot-welds, is thus found to remain almost identical for var-f failure at the HAZ (HIF steel).
ied nugget diameters for specific specimen geometry. Thestrength values determined under sliding mode using TSand PS samples of thin sheets of EIF and HIF steels arefound to be approximately identical. But the strength ofspot-welds determined under opening mode using CT sam-ples is lower than that measured under sliding mode usingTS or PS samples. These imply that the strength values ofspot-welds are independent of nugget size but are depen-dent on the mode of loading or the type of material. Theratio of the strength values in opening and sliding mode is≈0.64. These results have been explained with the help ofVon Mises’ criterion of yielding.
• The strength of the investigated spot-welds is found higherthan the tensile strength of the base metal. The spot-weldsof HIF steel exhibit higher strength than that of EIF steel forthe investigated loading modes. The strength of spot-weldsthus increases with increase in base metal strength; but theratio of the strength of spot-welds to that the base metal isfound similar for both the steels.
• Failure is observed to occur by tearing in the heat-affectedzone (HAZ) of the CT samples made from both the steels,while for TS and PS samples, failure occurs from the basemetal in HIF steel and from the HAZ close to base metal inEIF steel.
Acknowledgements
The authors would like to thank Tata Steel Ltd. for provid-
ing support to carry out this investigation. One of the authors(G.M.) would specifically like to thank Tata Steel Ltd. forsponsoring his graduate studies at the Indian Institute of Tech-nology, Kharagpur.
t e c h
r
A
A
B
B
B
B
C
C
C
D
E
K
K
K
j o u r n a l o f m a t e r i a l s p r o c e s s i n g
e f e r e n c e s
STM Standard E112-96, 2004. Standard Test Methods forDetermining Average Grain Size. Annual Book of ASTMStandards. West Conshohocken, PA, USA.
STM Standard E-8M-03, 2003. Standard Test Methods forTension testing of Metallic Materials (Metric). Annual Book ofASTM Standards. West Conshohocken, PA, USA.
arkey, M.E., Kang, H., 1999. Testing of spot welded coupons incombined tension and shear. Exp. Tech. 23 (5), 20–22.
ayraktar, E., Kaplan, D., Grumbachb, M., 2004. Application ofimpact tensile testing to spot welded sheets. J. Mater. Process.Technol. 153–154, 80–86.
ayraktar, E., Kaplan, D., Devillers, L., Chevalier, J.P., 2007. Graingrowth mechanism during the welding of interstitial free (IF)steels. J. Mater. Process. Technol. 189 (1–3), 114–125.
hadeshia, H.K.D.H., Honeycombe, R.W.K., 2006. Steels:Microstructures and Properties, 3rd ed. Elsevier Ltd., GreatBritain, 43 pp.
hang, B., Shi, Y., Lu, L., 2001. Studies on the stress distributionand fatigue behavior of weld-bonded lap shear joints. J. Mater.Process. Technol. 108, 307–313.
hao, Y.J., 2003. Ultimate strength and failure mechanism ofresistance spot weld subjected to tensile, shear, or combinedtensile/shear loads. J. Eng. Mater. Technol. ASME 125, 125–132.
hoi, B.H., Joob, D.H., Song, S.H., 2007. Observation and predictionof fatigue behavior of spot welded joints with triple thin steelplates under tensile-shear loading. Int. J. Fatigue 29 (4),620–627.
ieter, G.E., 2001. Mechanical Metallurgy, SI Metric ed. McGraw-Hill Book Company, Singapore, pp. 76–79.
wing, K.W., Cheresh, M., Thompson, R., Kukuchek, P., 1982.Static and Impact Strengths of Spot-Welded HSLA and LowCarbon Steel Joints. SAE Technical Paper 820281. SAEInternational, Warrendale, PA.
avamura, H.A., Batalha, G.F., 2008. Mechanical strengthevaluation for Nd-YAG laser and electric resistance spot weld(ERSW) joint under multiaxial loading. J. Mater. Process.Technol. 201, 507–514.
ocabekir, B., Kacar, R., Gunduz, S., Hayat, F., 2008. An effect ofheat input, weld atmosphere and weld cooling conditions on
the resistance spot weldability of 316L austenitic stainlesssteel. J. Mater. Process. Technol. 195, 327–335.rauss, G., Thompson, S.W., 1995. Ferritic microstructures incontinuously cooled in low- and ultra-low carbon steels. ISIJInt. 35, 937–945.
n o l o g y 2 0 9 ( 2 0 0 9 ) 1995–2007 2007
Lamouroux, E.H.J., Coutellier, D., Doelle, N., Kuemmerlen, P., 2007.Detailed model of spot-welded joints to simulate the failure ofcar assemblies. Int. J. Interact. Des. Manuf. 1,33–40.
Lee, H., Choi, J., 2005. Overload analysis and fatigue lifeprediction of spot-welded specimens using an effectiveJ-integral. Mech. Mater. 37, 19–32.
Lee, H., Kim, N., 2004. Fatigue life prediction of multi-spot-weldedpanel structures using an equivalent stress intensity factor.Int. J. Fatigue 26, 403–412.
Lee, H., Kim, N., Lee, T.S., 2005a. Overload failure curve andfatigue behavior of spot-welded specimens. Eng. Fract. Mech.72, 1203–1221.
Lee, Y.K., Hong, J.M., Choi, C.S., Lee, J.K., 2005b. Continuouscooling transformation temperatures and microstructures ofniobium bearing microalloyed steels. Mater. Sci. Forum475–479, 65–68.
Lee, Y., Wehner, T., Lu, M., Morrissett, T., Pakalnins, E., 1998.Ultimate strength of resistance spot welds subjected tocombined tension and shear. J. Test. Eval. 26, 213–219.
Lin, S.H., Pan, J., Wu, S.R., Tyan, T., Wung, P., 2002. Failure loads ofspot welds under combined opening and shear static loadingconditions. Int. J. Solids Struct. 39, 19–39.
Long, X., Khanna, S.K., 2007. Fatigue properties and failurecharacterization of spot welded high strength steel sheet. Int.J. Fatigue 29 (5), 879–886.
Rathbun, R.W., Matlock, D.K., Speer, J.G., 2003. Fatigue behavior ofspot welded high-strength sheet steels. Weld. J. 82, 207s–218s.
Rauf, I.A., Boyd, J.D., 1997. Microstructural evolution duringthermomechanical processing of a Ti–Nb interstitial-free steeljust below the Ar3 temperature. Metall. Mater. Trans. A 28A,1437–1443.
VandenBossche, D.J., 1977. Ultimate Strength and Failure Mode ofSpot Welds in High Strength Steels. SAE Technical paper770214. SAE International, Warrendale, PA.
Wung, P., 2001. A force-based failure criterion for spot welddesign. Exp. Mech. 41 (4), 107–113.
Wung, P., Walsh, T., Ourchane, A., Stewart, W., Jie, M., 2001.Failure of spot welds under in-plane static loading. Exp. Mech.41 (1), 100–106.
Xiao, F., Liao, B., Shan, Y., Yang, K., 2005. Isothermaltransformation of low-carbon micro-alloyed steels. Mater.Charact. 54, 417–422.
Zhang, H., Zhou, M., Hu, S.J., 2001. Impact strength measurementof spot welds. Proc. Inst. Mech. Eng. 215B, 403–414.
Zuniga, S., Sheppard, S.D., 1997. Resistance spot weld failureloads and modes in overload conditions. ASTM STP 1296,469–489.