
Strategies to improve the energy performance of multiple-skin facades
13
Building and Environment 43 (2008) 638–650 Strategies to improve the energy performance of multiple-skin facades Dirk Saelens a, , Staf Roels b , Hugo Hens b a VK Engineering, Building Services, Clemenceaulaan 87, B-1070 Brussel, Belgium b Laboratory for Building Physics, Department of Civil Engineering, K.U. Leuven, Kasteelpark Arenberg 40, B-3001 Leuven, Belgium Received 30 November 2005; received in revised form 6 April 2006; accepted 15 June 2006 Abstract This paper describes how to optimize the energy performance of single-story multiple-skin facades (MSF) by changing the settings of the fac - ades and HVAC-system according to the net energy demand of the building. The annual energy performance is analyzed for typical Belgian climatic conditions using a whole building simulation tool. Three MSF are scrutinised: a mechanically ventilated airflow window, a naturally ventilated double-skin fac - ade and a mechanically ventilated supply window. Their performance is compared against the performance of two traditional facades: a traditional window with exterior and interior shading device. It is shown that both the heating and cooling demand may significantly be improved by implementing control strategies such as controlling the airflow rate and the recovery of air returning from the multiple-skin facades. r 2006 Elsevier Ltd. All rights reserved. 1. Introduction The awareness for environmental friendly and energy conscious building design urges the need to develop new facade technologies. In the search towards energy efficient and visually attractive facades, multiple-skin facades (MSFs) are regularly presented as being valuable solutions to follow the desires of modern architecture. MSFs (also known as active envelopes, second skin facades, twin- facades, etc.) consist of two panes separated by a cavity through which air flows. The driving force for the airflow is natural or mechanical ventilation. In the cavity, usually a shading device is provided. Generally, distinction is made between naturally and mechanically ventilated MSFs. Extensive literature on MSF-typologies can, for example, be found in [1–6]. In literature, numerous papers describe how MSFs should work to improve the building’s energy efficiency. As many variants exist, the principles to reduce the energy demand strongly depend on the chosen typology. Some authors sum up the working principles and ideas to improve the energy efficiency (e.g. [7,8]). However, calculation results or experimental results are seldom given. Other researchers present sophisticated models to simulate specific MSF typologies [9–15]. They, however, lack to link the envelope level results to the building energy performance or do not couple the model to a building energy simulation program. The coupled simulation of the building and the building components is however impera- tive to come to a correct assessment of the energy performance. It is the only way to model and assess the complex interaction between air flow in the fac - ade and the HVAC system and the building energy management system. Especially when the settings of the different systems change to optimize different performances, whole building simulations are essential. Only few combinations of MSF-modelling and building energy simulation are available. Most of this research is restricted to only one MSF-typology. Mu¨ller and Balowski [16] analyze airflow windows, Oesterle et al. [5] give a comprehensive survey of double skin facades and Haddad and Elmahdy [17] discuss the behavior of supply air windows. Recent studies have recognized that an optimal control strategy combined with an overall building analysis is necessary to increase the energy efficiency of MSFs [18–21]. In this paper, the energy demand of an office equipped with three MSF-typologies is discussed and optimized. The optimization strategies in this paper are restricted to the settings of the HVAC-system. Further optimizations which ARTICLE IN PRESS www.elsevier.com/locate/buildenv 0360-1323/$ - see front matter r 2006 Elsevier Ltd. All rights reserved. doi:10.1016/j.buildenv.2006.06.024 Corresponding author. Tel.: +32 2 414 07 77; fax: +32 475 98 07 36. E-mail address: [email protected] (D. Saelens).
Transcript of Strategies to improve the energy performance of multiple-skin facades

ARTICLE IN PRESS
0360-1323/$ - se
doi:10.1016/j.bu
�CorrespondE-mail addr
Building and Environment 43 (2008) 638–650
www.elsevier.com/locate/buildenv
Strategies to improve the energy performance of multiple-skin facades
Dirk Saelensa,�, Staf Roelsb, Hugo Hensb
aVK Engineering, Building Services, Clemenceaulaan 87, B-1070 Brussel, BelgiumbLaboratory for Building Physics, Department of Civil Engineering, K.U. Leuven, Kasteelpark Arenberg 40, B-3001 Leuven, Belgium
Received 30 November 2005; received in revised form 6 April 2006; accepted 15 June 2006
Abstract
This paper describes how to optimize the energy performance of single-story multiple-skin facades (MSF) by changing the settings of
the fac-ades and HVAC-system according to the net energy demand of the building. The annual energy performance is analyzed for
typical Belgian climatic conditions using a whole building simulation tool. Three MSF are scrutinised: a mechanically ventilated airflow
window, a naturally ventilated double-skin fac-ade and a mechanically ventilated supply window. Their performance is compared against
the performance of two traditional facades: a traditional window with exterior and interior shading device. It is shown that both the
heating and cooling demand may significantly be improved by implementing control strategies such as controlling the airflow rate and
the recovery of air returning from the multiple-skin facades.
r 2006 Elsevier Ltd. All rights reserved.
1. Introduction
The awareness for environmental friendly and energyconscious building design urges the need to develop newfacade technologies. In the search towards energy efficientand visually attractive facades, multiple-skin facades(MSFs) are regularly presented as being valuable solutionsto follow the desires of modern architecture. MSFs (alsoknown as active envelopes, second skin facades, twin-facades, etc.) consist of two panes separated by a cavitythrough which air flows. The driving force for the airflow isnatural or mechanical ventilation. In the cavity, usually ashading device is provided. Generally, distinction is madebetween naturally and mechanically ventilated MSFs.Extensive literature on MSF-typologies can, for example,be found in [1–6].
In literature, numerous papers describe how MSFsshould work to improve the building’s energy efficiency.As many variants exist, the principles to reduce the energydemand strongly depend on the chosen typology. Someauthors sum up the working principles and ideas toimprove the energy efficiency (e.g. [7,8]). However,calculation results or experimental results are seldom
e front matter r 2006 Elsevier Ltd. All rights reserved.
ildenv.2006.06.024
ing author. Tel.: +322 414 07 77; fax: +32475 98 07 36.
ess: [email protected] (D. Saelens).
given. Other researchers present sophisticated models tosimulate specific MSF typologies [9–15]. They, however,lack to link the envelope level results to the building energyperformance or do not couple the model to a buildingenergy simulation program. The coupled simulation of thebuilding and the building components is however impera-tive to come to a correct assessment of the energyperformance. It is the only way to model and assess thecomplex interaction between air flow in the fac-ade and theHVAC system and the building energy managementsystem. Especially when the settings of the differentsystems change to optimize different performances, wholebuilding simulations are essential. Only few combinationsof MSF-modelling and building energy simulation areavailable. Most of this research is restricted to only oneMSF-typology. Muller and Balowski [16] analyze airflowwindows, Oesterle et al. [5] give a comprehensive survey ofdouble skin facades and Haddad and Elmahdy [17] discussthe behavior of supply air windows. Recent studies haverecognized that an optimal control strategy combined withan overall building analysis is necessary to increase theenergy efficiency of MSFs [18–21].In this paper, the energy demand of an office equipped
with three MSF-typologies is discussed and optimized. Theoptimization strategies in this paper are restricted to thesettings of the HVAC-system. Further optimizations which

ARTICLE IN PRESS
Table 1
Glass and shading device properties
Glass Glass properties
U-value (W/(m2K)) g-value (�)
Single 5.67 0.85
Double 1.23 0.43
Shading device properties at normal incidence
Device a(�) r(�) t(�)Roller blind 0.83 0.09 0.08
D. Saelens et al. / Building and Environment 43 (2008) 638–650 639
are not discussed here include the analysis of the systemparameters such as the geometry of the fac-ade and theproperties of the glazing and shading device. First, thebuilding geometry and different models are presented.Then, different optimization strategies for all three MSF-typologies are derived from the energy performance of thenon-optimized base case MSFs. Many of the optimizationstrategies need specific measuring equipment and have animpact on the construction of the HVAC-system. For allsuggested strategies these implications are highlighted andcommented on. Finally, the results are compared with theenergy performance of optimized traditional solutions.
2. Case description
Three multiple-skin fac-ades and two traditional claddingsystems are analysed. The first MSF is a mechanicallyventilated airflow window (AFW) (Fig. 1(a)). The outerglass is an argon filled low emission glass. The shadingdevice is a roller blind, positioned in the cavity. Theinner glass is a normal clear float glass. The cavity ismechanically ventilated with interior air. The second MSFis a naturally ventilated double-skin fac-ade (DSF) (Fig.1(b)). The outer glass is a normal clear float glass. Theshading device is the same roller blind and is alsopositioned in the cavity. The inner glass is a similar argonfilled low emission glass. The cavity is naturally ventilatedwith exterior air. The third MSF is a supply window (SUP)(Fig. 1(c)). The glass configuration is similar as for theDSF, but the cavity is now mechanically ventilated withexterior air. The two traditional cladding systems have an
a b c
d e
Fig. 1. Schematic representation of the multiple skin facades and the
traditional solutions.
argon filled low emission glass. The shading device is anexterior (IGUe) (Fig. 1(d)) or interior (IGUe) (Fig. 1(e))roller blind. Table 1 summarizes the properties of the glassand shading device.These five fac-ade systems are used in a narrow office
building. The main facades look north-east and south-west.Fig. 2 shows a section of a typical floor equipped with anAFW. The fac-ade consists of an opaque part that coversthe false ceiling zone (height ¼ 0.75m) and a transparentpart that runs from the floor covering to the false ceiling(height ¼ 3.25m). The false ceiling contains the HVACsupply and return ducts. The floor is subdivided in threezones: a north-east external zone, an internal zone and asouth-west external zone. Each zone has a depth of 4.50m.In the analysis, the load or energy demand is presented asan average per unit of office floor and is subdivided perzone. It is defined as all the sensible energy needed to keepthe office temperature between the setpoints. The energydemand includes the energy to make up the ventilation air,control inefficiencies and distribution losses or gains ofthe air ducts but excludes the energy needed to powerthe fans nor does it take into account the efficiency of theHVAC-plant.The setpoint temperature for heating is 21 1C with a
night set-back to 16 1C. The setpoint temperature forcooling is 26 1C. There is no cooling during night-time.The office hours run from 7 a.m. till 7 p.m. Also during theweekend the set-back settings are applied. To maintain thetemperatures between the setpoints a PID (proportional,integrating and differentiating) controller that senses theoperative temperatures of each zone is implemented. Theoperative temperature is defined as a weighted average ofthe air temperature and mean surface temperature.Weighting factors are 0.55 and 0.45, respectively. Typicalinternal gains due to occupancy (7W/m2), lighting (10W/m2) and office appliances (20W/m2) are used. On top of theair conditioning, the offices are equipped with chilledceilings, which is a common feature in offices with MSFs.All simulations use the climatic conditions of the TestReference Year of Uccle, Belgium.
3. Modelling
To analyze the energy demand of offices equipped withMSFs, a modelling environment has been developed. The

ARTICLE IN PRESS
Fig. 2. Schematic representation of the simulated office floor for a typical AFW configuration.
D. Saelens et al. / Building and Environment 43 (2008) 638–650640
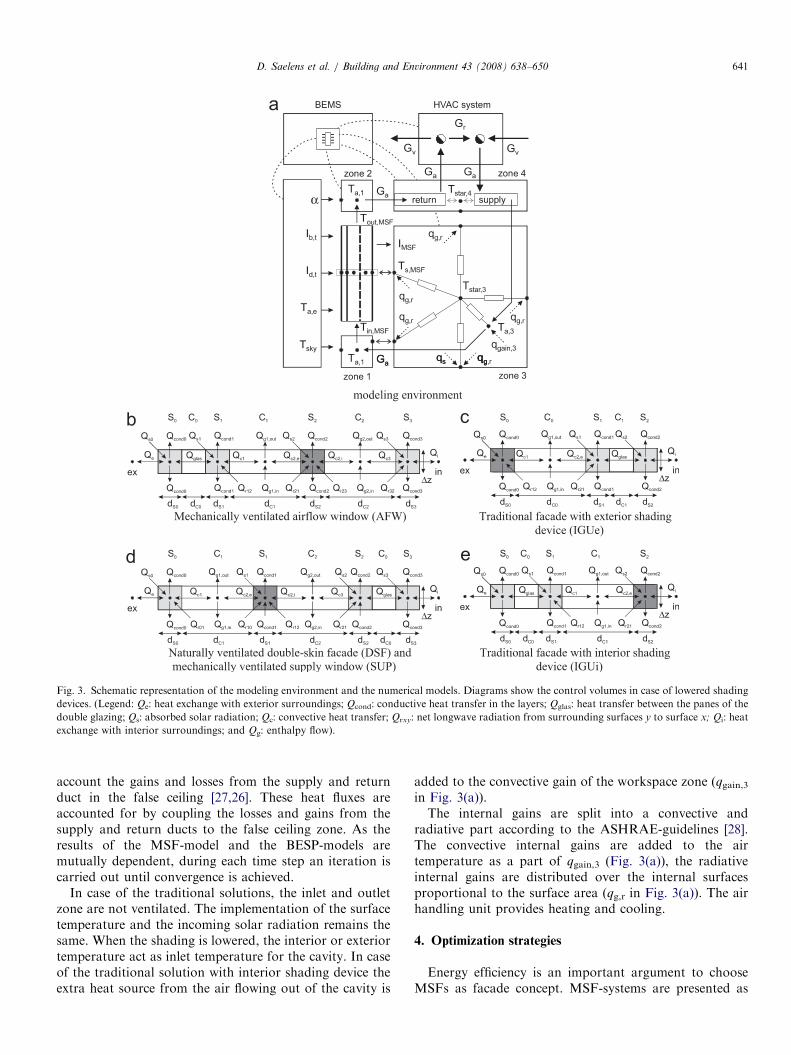
environment consists of a model of the facades, a model ofthe office zones, a model of the heating and cooling systemand a model of the building energy management system(Fig. 3).
All models are combined into a commercially availabledynamic building energy simulation program (BESP)TRNSYS 15.3 [22]. The thermal behavior of the MSFand traditional facades is calculated with a cell centeredfinite volume method [18] (Figs. 3(b)–(e)). The MSFs aredivided into four or five vertical layers (depending on theposition of the roller blind: raised or lowered) which are inturn divided into 32 parts along the height. For eachvolume, the heat balance is written. The thermal systemconstructed that way is then solved. At the cavity surfaces(S1, S2 and S3), three heat transfer modes are taken intoaccount: conduction (Qcond), convection (Qc) and radiation(Qr). The convective heat transfer (Qconv) depends on theflow regime, the airflow rate and the temperature differencebetween the surface and the air. An elaborate overview ofthe used equations can be found in [18]. Radiation heattransfer (Qr) for each surface is calculated with the net-radiation method [23]. In the cavities (C1 and C2), the heattransfer is governed by convection and enthalpy transportdue to the airflow. Heat transfer between both panes of thedouble glazing (Qglass) is a combination of conduction,convection and radiation and is calculated using manu-facturers data. The absorbed solar energy (Qs) is calculatedfor each separate layer with an embedded techniquedescribed by Edwards [24]. It is function of the angle ofincidence and also accounts for partial shading of thepanes. The heat transfer with the surroundings (Qe and Qi)is described with a combined heat transfer coefficient. Longwave radiation is taken into account by means of anequivalent outdoor temperature. Finally, it is assumed thatthe roller blind, applied in this set-up, perfectly obstructsair exchange between both cavities. This assumption wasconfirmed by measurements [18] and CFD-simulations[25]. A comparison of the presented model for themechanically ventilated airflow window and the naturally
ventilated double-skin facades against measurements ispresented in [18]. The same study also analyzes thesensitivity of the energy demand to different modellingassumptions.A similar model is used to calculate the thermal behavior
of the traditional solutions (IGUs). When the shadingdevice is lowered, a naturally ventilated cavity is formedbetween the glazing and the roller blind. The cavityof the variant with exterior shading device is ventilatedwith exterior air (Fig. 3(d)). That of the variantwith interior shading device is ventilated with interiorair (Fig. 3(e)). The airflow rate in the mechanical flowvariant is a known variable and hence the thermalsystem can be solved easily. As the airflow rate and thetemperature profiles in the naturally ventilated cavity aremutually dependent, an iterative solution of the thermalsystem is used.Fig. 3(a) further shows the interconnection between the
fac-ade model and the office zone for the mechanicallyventilated airflow window. The MSF-model passes theinner pane average surface temperature (Ts,MSF), the cavityexhaust air temperature (Tout,MSF) and the total trans-mitted solar energy (IMSF) to the BESP. The latter isdistributed over the floor area (qs in Fig. 3(a)). Thesimulation program in turn provides the MSF-model withthe incident direct (Ib,t) and diffuse (Id,t) solar radiation,the angle of solar incidence (a), the zone air (Ta,3) andaverage surface temperature (part of Tstar,3), the exteriorair (Ta,e) and sky temperature (Tsky). Saelens et al. [26]stress the importance of the inlet temperature on the energyperformance of multiple-skin facades. Similarly, in caseswhere the return air of the multiple-skin fac-ade is to bereused, a correct modelling of the outlet temperature isequally important. Therefore the inlet (zone 1 in Fig. 3(a))and outlet (zone 2 in Fig. 3(a)) zone have been modelledseparately. The office zone is subdivided in a workspacezone (zone 3 in Fig. 3(a)) and a false ceiling zone (zone 4 inFig. 3(a)) in which the HVAC return and supply ducts areplaced. Several studies show the importance of taking into
ARTICLE IN PRESS
a
b c
ed
Fig. 3. Schematic representation of the modeling environment and the numerical models. Diagrams show the control volumes in case of lowered shading
devices. (Legend: Qe: heat exchange with exterior surroundings; Qcond: conductive heat transfer in the layers; Qglas: heat transfer between the panes of the
double glazing; Qs: absorbed solar radiation; Qc: convective heat transfer; Qrxy: net longwave radiation from surrounding surfaces y to surface x; Qi: heat
exchange with interior surroundings; and Qg: enthalpy flow).
D. Saelens et al. / Building and Environment 43 (2008) 638–650 641
account the gains and losses from the supply and returnduct in the false ceiling [27,26]. These heat fluxes areaccounted for by coupling the losses and gains from thesupply and return ducts to the false ceiling zone. As theresults of the MSF-model and the BESP-models aremutually dependent, during each time step an iteration iscarried out until convergence is achieved.
In case of the traditional solutions, the inlet and outletzone are not ventilated. The implementation of the surfacetemperature and the incoming solar radiation remains thesame. When the shading is lowered, the interior or exteriortemperature act as inlet temperature for the cavity. In caseof the traditional solution with interior shading device theextra heat source from the air flowing out of the cavity is
added to the convective gain of the workspace zone (qgain,3in Fig. 3(a)).The internal gains are split into a convective and
radiative part according to the ASHRAE-guidelines [28].The convective internal gains are added to the airtemperature as a part of qgain,3 (Fig. 3(a)), the radiativeinternal gains are distributed over the internal surfacesproportional to the surface area (qg,r in Fig. 3(a)). The airhandling unit provides heating and cooling.
4. Optimization strategies
Energy efficiency is an important argument to chooseMSFs as facade concept. MSF-systems are presented as

ARTICLE IN PRESSD. Saelens et al. / Building and Environment 43 (2008) 638–650642
being superior to single-skin facades both during theheating and the cooling season. The energy efficiencyobjectives obviously depend on the MSF-typology. Never-theless, two main principles can be distinguished:(1) multiple skin facades may reduce the transmissionlosses in winter and the transmission gains in summer;and (2) MSFs can either expel the return air to avoidoverheating or reuse the return air in order to use theabsorbed solar energy and recover some of the transmis-sion losses.
Fig. 4 shows the energy demand per unit of floor area forthe different fac-ade solutions without optimization strate-gies. For each fac-ade solution the results are split up perzone. In the non-optimized cases, the cavity ventilation ofthe mechanically ventilated MSFs (AFW and SUP) equalsthe hygienic ventilation rate (Ga ¼ Gv ¼ 20m3/(h.m)). Theairflow rate (Ga) through the naturally ventilated cavity(DSF) depends on the weather conditions and varies withtime. As for the traditional cladding systems (IGUe andIGUi) the office zones are mechanically ventilated with thehygienic ventilation rate (Gv). During night-time andweekends the airflow rate is set back to a minimum airflowrate which equals half the required ventilation rate.
0
10
20
30
40
50
60
IGUe IGUi AFW DSF SUP
he
ati
ng
de
ma
nd
(k
Wh
/(m
2.a
))
QH_I
QH_SW
QH_NE38.0
35.331.6
36.2
17.9
Heating demand
-60
-50
-40
-30
-20
-10
0
IGUe IGUi AFW DSF SUP
co
oli
ng
de
ma
nd
(k
Wh
/(m
2.a
))
QC_I
QC_SW
QC_NE
-17.8
-39.2-36.9
-19.8
-45.3
Cooling demand
a
b
Fig. 4. Energy demand of non-optimized facades. (Legend: IGUe:
exterior shading device; IGUi: interior shading device; AFW: airflow
window; DSF: double-skin fac-ade; SUP: supply window; QH: heating
demand; QC cooling demand; I: internal zone; SW: southwest zone; NE:
northeast zone).
Analyzing the heating demand results (Fig. 4(a)), theIGUe shows to be the most energy consuming solution.Nevertheless, the traditional solutions—which have thehighest transmission losses—are not really outperformedby the AFW and DSF. Much can be attributed to thedifferences in solar gains. Compared to the IGUe, the IGUihas an 8% lower heating demand due to the position of theroller blind at the inside. This produces higher indirectsolar gains. The direct solar gains of the MSFs areconsiderably lower than that of the IGUs because of theextra pane. For the DSF this compensates for the lowertransmission losses. The inner pane of the AFW has alower thermal resistance than that of the DSF andmoreover the AFW is ventilated with interior air, whichresults in even lower transmission losses. As a consequencethe heating demand is about 20% lower compared to theIGUe. Because of the preheating of the ventilation air, theSUP outperforms all other variants and requires roughlyhalf the heating energy needed by the other facadesolutions.The cooling demand (QC in Table 1) strongly depends
on the indirect solar gains. Despite the higher directsolar gains, the IGU with exterior shading device (IGUe onFig. 4(b)) has the lowest cooling demand. The best optionto reduce to indirect gains is to prevent the solar radiationfrom entering the building. The IGU with interior shadingdevice (IGUi) not only has a high direct solar gain but alsosuffers from high indirect solar gains. As a result itconsumes 55% more cooling energy than the IGUe. TheAFW does not perform much better. It has lower directsolar gains compared to the IGUs and it also has lowerindirect gains than the IGUi. However, the higher overallinsulation level prevents the building to cool down duringnight-time. As a result, the AFW only performs somewhatbetter than the IGUi. The DSF is able to approach theperformance of the IGUe as it has an inner pane withqhigh thermal resistance. This prevents the absorbed solarradiation from entering the office. The SUP has the poorestcooling performance and requires 2.5 times more energythan the IGUe. The advantage of preheating the ventila-tion now becomes a major disadvantage.Unfortunately, most MSF-typologies are incapable of
lowering the heating and cooling demand simultaneously.Only by combining typologies or by changing systemsettings according to the particular situation, a substantialoverall improvement over the traditional solutions ispossible. This implies that control mechanisms areinevitable to make MSFs work efficiently throughout theentire year. Two important optimization strategies forMSFs are identified and will be explored and implemented.Where possible both strategies will be combined to achievean optimal solution.
4.1. Airflow rate control
The airflow rate in the office zones as well as in the MSF-cavities may be changed to improve the energy efficiency.

ARTICLE IN PRESSD. Saelens et al. / Building and Environment 43 (2008) 638–650 643
According to the fac-ade typology, these changes may notbe independent. For the AFW and the SUP there is arelation between the overall building airflow rate and theairflow rate through the MSF-cavity. For the DSF, thecavity airflow rate is independent of the airflow ratethrough the office zones. Changing the airflow rate will alsobe used to allow free cooling of the building.
4.2. Recuperation of the return air
The air passing through an MSF-cavity is heated bytransmission losses through the inner pane and byimpinging solar radiation. During heating conditions itmay be interesting to use the return air from the MSF-cavity as an energy source to heat the building. Some fac-ade typologies use the MSF-cavity as a heat-exchanger topreheat the ventilation air.
During cooling conditions there is no need to recoverenergy. Instead, the hot air returning from the MSF-cavities is expelled.
5. Air flow window
In this analysis we will discuss four strategies to improvethe energy efficiency of AFWs:
(1)
Tab
Ene
1. A
1A.
Ga (
QH
QC
1B.
Ga (
QH
QC
2. A
Ga,m
QH
QC
3. A
Gr,,m
QH
QC
4. A
Ga,,m
Gr,,m
QH
QC
a fixed change of the AFW cavity airflow rate;
(2) a controlled change of the AFW cavity airflow rate; (3) recuperation of the air returning from the cavity; (4) A combination of airflow rate and recuperationcontrol.
le 2
rgy demand of AFWs
FW fixed airflow rate
No distribution from internal zone
m3/(hm)) 20 4
(kWh/(m2 a)) 31.6 6
(kWh/(m2 a)) �36.9 �2
Distribution from internal zone
m3/(hm)) 20 4
(kWh/(m2 a)) 30.1 6
(kWh/(m2 a)) �33.7 �2
FW controlled airflow rate
ax (m3/(hm)) 20 4
(kWh/(m2 a)) 31.6 3
(kWh/(m2 a)) �36.9 �2
FW recuperation
ax (m3/(hm)) 0 2
(kWh/(m2 a)) 31.6 2
(kWh/(m2 a)) �36.9 �3
FW controlled airflow rate and recuperation
ax (m3/(hm)) 20 4
ax (m3/(hm)) 0 2
(kWh/(m2 a)) 31.6 2
(kWh/(m2 a)) �36.9 �3
5.1. Fixed airflow rate
Let us first analyze the influence of the airflow rateassuming that the airflow rate is fixed throughout the entiresimulation. In principle the three office zones are treatedindependently. As a consequence the airflow rate in a zoneequals the cavity airflow rate in that zone. In this analysiswe also consider what happens if the return air from theinternal zone (Zone I in Fig. 2) is distributed towards theexternal zones. This distribution increases the airflow ratein the external zones and the AFW-cavity by 50%. There isno recuperation in the HVAC-system: the recuperationairflow rate (Gr in Fig. 2) equals zero.An increase of the airflow rate increases the cavity
temperature and reduces the transmission losses. As longas the airflow rate does not exceed the total ventilation rateof the building, an increase of the cavity airflow rate isfavorable to lower the heating demand. This is illustratedby the reduction of the heating demand for the cases withdistribution (Table 2, comparison between case 1A and1B). If the total AFW airflow rate exceeds the totalbuildings ventilation rate, extra exterior air has to beinserted into the building. The heating of this extra air hasa higher energy cost than the reduction of the transmissionlosses. An optimal situation is achieved when the airflowrate through the facades equals the total ventilation airflowof the building. In such a way, AFWs are used as a heatexchanger for the exhaust air.In summer, an increase of the airflow rate helps to lower
the cooling demand. Two effects are important: (1) thereduction of the indirect solar gains due to the increasedairflow in the AFW; and (2) the free cooling effect by
0 80 120
7.1 121.4 155.2
4.7 �19.6 �18.6
0 80 120
3.3 112.8 142.3
3.1 �18.7 �17.5
0 80 120
0.6 30.4 31.0
9.7 �26.0 �25.4
0 60 100
9.4 27.3 25.4
4.8 �34.8 �34.9
0 80 120
0 60 100
9.7 27.6 25.8
1.1 �27.1 �26.5

ARTICLE IN PRESSD. Saelens et al. / Building and Environment 43 (2008) 638–650644
increasing the exterior ventilation. Comparison of theresults with and without distribution of the internal zonereturn air indicates that the latter is far more important.
5.2. Controlled airflow rate
The airflow rate based on the ventilation rate is the mostfavorable option to reduce the heating demand. Insummer, it is favorable to increase the airflow rate tolower the cooling demand. As a consequence, it is useful toimplement a controller which chooses an optimal airflowrate according to the energy needs. By using a speedcontrollable fan or adjustable diaphragms in the airducts,the controller is able to change the airflow rate of each zoneseparately. The decision of the airflow rate controller isbased on the energy mode of a particular zone. If a zone isin heating mode, the ventilation airflow is set. If a zone is incooling mode, the maximum airflow rate is set as long asthe exterior temperature is lower than the setpoint forcooling. The definitions of heating and cooling modeshould be carefully chosen. Monitoring of the energydemand in the terminal units of a particular zone mayresult in an instable and non-optimal behavior. Anexample illustrates this. If the temperature of a particularzone surpasses the setpoint for cooling, the HVAC-systemwill provide active cooling. Now the HVAC-system is incooling and the airflow rate will be increased. As soonas the temperature drops below the cooling setpoint,the cooling will stop and the airflow rate will return tonormal. It is however desirable that the free cooling of theoffice continues to avoid the need for active cooling.Therefore the energy regime is determined from the interiortemperature: as long as the interior temperature is lowerthan the average between the heating and cooling setpoint,the system is in heating mode. Otherwise, the system is incooling.
Table 2 (case 2) shows the heating (QH) and coolingdemand (QC) as a function of the maximum allowedairflow rate. Note that during night-time and weekends theairflow rate is set back to a minimum airflow rate whichequals half the required ventilation rate. Again, there is norecuperation in the HVAC-system: the recuperation airflowrate (Gr in Fig. 2) equals zero. During heating demand, thecontroller chooses the minimal ventilation rate and theheating demand hardly changes compared to the base caseAFW (Ga,max equals 20m3/(hm)). During cooling condi-tions the airflow rate is increased whenever useful. Withoutchanging the heating demand the cooling demand may bereduced by up to 45%. As for the previous case, it shouldbe noted that the cooling effect is mainly caused by freecooling.
5.3. Recuperation
As a further step to save heating energy, recuperation ofthe return air is implemented. Recuperation tries to lowerthe energy demand by reusing that part of the return air
which is not needed for ventilation. Only when the totalairflow rate exceeds the required ventilation airflow rate,recuperation of the AFW return air is possible. On top ofthe speed adjustable fan and the diaphragms, a mixingchamber allowing recuperation should be added to theHVAC-system. As the northeast and southwest facadeshave a different thermal behaviour, the system should beable to control both orientations separately. We analyzethree methods of recuperation:
(1)
Continuous recuperation during heating demand.The Building Energy Management System (BEMS)always recuperates whenever a zone is in heating mode.The recuperation airflow rate equals maximum airflowrate minus the hygienic ventilation airflow rate. Thedefinition of heating and cooling mode is again basedon the interior zone temperature. During coolingconditions, recuperation is not useful and thereforedisabled.(2)
Recuperation based upon the outlet temperature of thecavity air.In the outlet temperature based strategy, the BEMSincreases the airflow rate of a zone to the maximumrecuperation rate whenever the outlet temperature iswarmer than the setpoint temperature for heating andthe system is in heating mode. The definition of heatingand cooling mode is again based on the interior zonetemperature. As in the previous case, recuperation isdisabled during cooling conditions.(3)
Recuperation based upon the sensible energy content ofthe supply air.The energy content algorithm minimizes the sensibleenergy content of the supply air to the HVAC-system.To do so, the BEMS has to be able to compare thesensible energy content of different settings. This is onlypossible if the BEMS can predict the outlet temperatureof the different AFWs. By using the airflow windowmodel, a correlation between the incoming solarradiation, the exterior and interior temperature, theairflow rate and the outlet temperature was establishedand implemented in the BEMS. At each timestep, theBEMS predicts the sensible energy content of thesupply air based on the conditions during the previoustimestep. Based on this information the BEMS choosesthe airflow rate settings, which minimize the sensibleenergy content of the supply air to the HVAC-system.Fig. 5 shows for the three strategies the energy demandas a function of the maximum allowed recuperation airflowrate. The reduction of the heating demand stronglydepends on the chosen strategy and the maximum allowedrecuperation airflow rate.Implementing a system which always recuperates part of
the return air during heating demand (strategy 1) proofs tobe inefficient to lower the heating demand. The overallheating demand slightly increases while increasing therecuperation airflow rate (Fig. 5, cases AFW Rxx a). Closer

ARTICLE IN PRESSD. Saelens et al. / Building and Environment 43 (2008) 638–650 645
analysis of the results shows that the heating demand forthe internal zone decreases while the energy demand for theexternal zones increases. As the airflow rate towards theinternal zone does not change, the lower heating demandfor the internal zone is caused by the higher supplytemperature for the HVAC-system. Recuperation has twoeffects on the external zones: (1) the transmission lossesdecrease because the airflow rate through the fac-adeincreases; and (2) the energy content of the supply air forthe HVAC-system changes. The first effect causes theheating demand of the external zones to be lower. Thiseffect is however rather small. The second effect mayboth cause an increase or decrease of the heatingdemand. Let us consider the sensible energy content of
0
10
20
30
40
50
60
AF
W B
C
AF
W R
20 a
AF
W R
20 t
AF
W R
20 e
AF
W R
60 a
AF
W R
60 t
AF
W R
60 e
AF
W R
10
0 a
AF
W R
100 t
AF
W R
10
0 e
heating d
em
and (
kW
h/(
m2.a
)) QH_I
QH_SW
QH_NE
31.6 31.8 30.9 29.432.9
28.2 27.3
34.7
26.8 25.4
Fig. 5. Heating demand of AFWs as a function of maximum allowed
recuperation airflow rate and recuperation strategy. (Legend: BC: base
case; Rxx: maximum allowed recuperation airflow rate; a: always
recuperation, strategy 1; t: recuperation based on return temperature,
strategy 2; e: recuperation based on supply air energy content, strategy 3,
QH: heating demand; I: internal zone; SW: southwest zone; NE: north-east
zone).
-1500
-1000
-500
0
768 774 780 786 792
time (hours of the year)
en
erg
y c
on
ten
t su
pp
ly a
ir (
W)
E vent
E a (strategy 1)
E t (strategy 2)
E e (strategy 3)
E a (strategy 1)
other strategies
6:00 h 12:00 h 18:00 h
cloudy winter day
a b
Fig. 6. Energy content of the supply air for different settings of the recupera
(Legend: vent: energy content in case of hygienic ventilation rate; a: energy con
recuperation based on return temperature, strategy 2; e: energy content in cas
the supply air in point r in Fig. 2:
Esupply ¼X
i
ca � Ga;i � ðysupply � ya;iÞ,
where ca is the specific heat of the air, Ga,i is the total airflowrate to zone i and ya,i is the air temperature of zone i. Morenegative energy contents indicate that the air needs moreheating. The sensible energy content of the supply air withstrategy 1 (always recuperation) during a cloudy day ismore negative than the sensible energy content of outsideventilation air (compare Event and Ea in Fig. 6(a)). As aconsequence, the heating demand increases by using strategy1 during the cloudy day. During a sunny day, the sensibleenergy content of outside ventilation air is more negativeduring the afternoon when the sun shines on the southwestfac-ade than the sensible energy content of the recuperationstrategies (compare Event and Ea,t and e in Fig. 6(b)). In thiscase, recuperation is useful to lower the heating demand.An optimal recuperation strategy only recuperates
whenever it is useful. The decision whether recuperationis useful may be based on the outlet temperature of theairflow windows (strategy 2) or on the sensible energycontent of the supply air in the HVAC-system (strategy 3).The temperature-based algorithm avoids to recuperatewhen on cloudy days. Nevertheless, it misses someopportunities during sunny days. Hence it performs betterthan continuous recuperation but is not yet optimal.Using the sensible energy content strategy (strategy 3),
the advantages of full recuperation are exploited and thesituation where the temperature of the return air from theAFWs is too low to improve the sensible energy content isavoided. A reduction of the heating demand up to 20%is now possible. Given the fact that the implementation isnot straightforward and that the fan consumption againraises, recuperation may not necessarily be an economical
-1500
-1000
-500
0
1056 1062 1068 1074 1080
time (hours of the year)
en
erg
y c
on
ten
t su
pp
ly a
ir (
W)
E vent
E a (strategy1)
E t (strategy 2)
E e (strategy3)
E a (strategy 1)
E e (strategy 3)
E t (strategy 2)
6:00 h 12:00 h 18:00h
sunny winter day
tion algorithm. The maximum recuperation rate (Gr) equals 60m3/(hm).
tent in case of always recuperation, strategy 1; t: energy content in case of
e of recuperation based on supply air energy content, strategy 3).

ARTICLE IN PRESSD. Saelens et al. / Building and Environment 43 (2008) 638–650646
solution. It may be noted that as a side effect also thecooling demand decreases with approximately 5%.
5.4. Controlled airflow rate and recuperation
A logical step to optimize both the heating and coolingdemand is combining the airflow rate control andrecuperation strategy. Table 4 indicates that both theheating and cooling load decrease with increasing airflowrate. The maximum heating load (QH) reduction equals22%, the maximum cooling load (QC) reduction is 39%.These reductions are somewhat smaller than what isachieved when both strategies are used separately. Todraw an overall conclusion it should again be noted that anincrease of the airflow rate raises the fan energy consump-tion substantially. Hence, the reductions have to beweighed against this extra energy.
6. Supply window
To optimize the SUP results, important modifications tothe HVAC-plant are necessary. Fig. 7 gives a schematicrepresentation of the HVAC-plant. In winter the heating
a
b
Fig. 7. Schematic representation of the simulated
demand decreases dramatically by supplying the ventila-tion air for the HVAC-system through the supply window(Ga,sup in Fig. 7(a) and Fig. 2). This allows to capture solarradiation and to reuse part of the transmission losses. Onlyone fan (F1 in Fig. 7(a)) is operated in this situation. Ifnecessary, part of the air can be recirculated (Gr in Fig. 7).In summer, the additional energy from the SUPs is notneeded. However it may be desirable to ventilate the SUPsto prevent overheating. To achieve this, a second fan (F2 inFig. 7(b)) has to be operated and the mixing chamber hasto be positioned in such a way that exterior air is suppliedto the HVAC-plant instead of air coming from the SUPs(Fig. 7(b)). Three operation modes are analyzed:
(1)
offi
always recuperation;
(2) controlled recuperation; (3) controlled recuperation and free cooling.6.1. Always recuperation
This case is a variant on the base case. The supply air forthe HVAC-plant is supplied through the SUP at all times.Also the airflow for the internal zones is supplied through
ce floor for typical SUP configurations.
ARTICLE IN PRESSD. Saelens et al. / Building and Environment 43 (2008) 638–650 647
the SUPs. As a consequence the airflow rate in theSUPs is 50% higher than the airflow rate in the zones(Ga,sup ¼ 1.5�Ga). The airflow rate and HVAC-settingsare fixed throughout the year. Recirculation is not possible(Gr ¼ 0 in Fig. 5). The optimal airflow rate through theSUPs equals the ventilation airflow rate (Table 3). Both theheating and cooling load increase when the airflow ratethrough the SUPs increases. During heating conditions, theenergy content drops with increasing airflow rate andconcurrently the cavity is colder which increases thetransmission losses. During cooling conditions, the energycontent increases with increasing airflow rate. This negativeeffect is not countered by the lower cavity temperaturewhich lowers transmission gains.
6.2. Controlled recuperation
In this case the BEMS can extract the supply air for theHVAC-system from the exterior environment or from theSUPs. As long as the system is in heating mode, the supplyair is provided through the SUPs and equals the hygienicventilation rate (including the ventilation air needed for theinternal zones) (Fig. 7(a)). The definition of the heating andcooling mode is the same as for the AFWs. Furthermore,the system may increase the supply airflow rate to Ga,sup,max
to take advantage of high outlet temperatures in the SUPs.Note that this maximum airflow rate equals 1.5�Ga,max
because the internal zone has to be ventilated as well. Asfor the AFWs, this control is based on the energy contentof the return air rather than on the temperature of thereturn air. If the system is in cooling mode, the BEMScloses the connection between the SUPs and the HVAC-system (Fig. 7(b)). The airflow rate through the SUPs ofthe zones with cooling equals the maximal airflow rate(Ga,sup ¼ Ga,sup,max). The supply air to the HVAC-systemequals the buildings ventilation airflow rate. Note that theSUPs are now ventilated with the second fan.
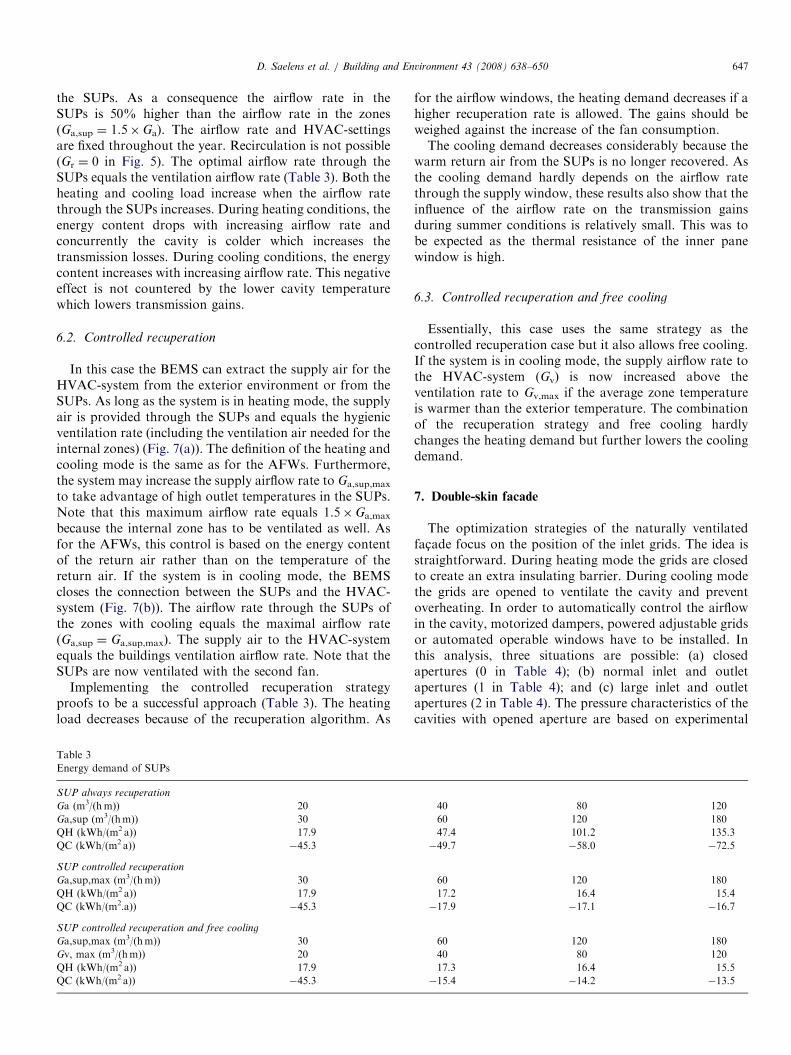
Implementing the controlled recuperation strategyproofs to be a successful approach (Table 3). The heatingload decreases because of the recuperation algorithm. As
Table 3
Energy demand of SUPs
SUP always recuperation
Ga (m3/(hm)) 20
Ga,sup (m3/(hm)) 30
QH (kWh/(m2 a)) 17.9
QC (kWh/(m2 a)) �45.3
SUP controlled recuperation
Ga,sup,max (m3/(hm)) 30
QH (kWh/(m2 a)) 17.9
QC (kWh/(m2.a)) �45.3
SUP controlled recuperation and free cooling
Ga,sup,max (m3/(hm)) 30
Gv, max (m3/(hm)) 20
QH (kWh/(m2 a)) 17.9
QC (kWh/(m2 a)) �45.3
for the airflow windows, the heating demand decreases if ahigher recuperation rate is allowed. The gains should beweighed against the increase of the fan consumption.The cooling demand decreases considerably because the
warm return air from the SUPs is no longer recovered. Asthe cooling demand hardly depends on the airflow ratethrough the supply window, these results also show that theinfluence of the airflow rate on the transmission gainsduring summer conditions is relatively small. This was tobe expected as the thermal resistance of the inner panewindow is high.
6.3. Controlled recuperation and free cooling
Essentially, this case uses the same strategy as thecontrolled recuperation case but it also allows free cooling.If the system is in cooling mode, the supply airflow rate tothe HVAC-system (Gv) is now increased above theventilation rate to Gv,max if the average zone temperatureis warmer than the exterior temperature. The combinationof the recuperation strategy and free cooling hardlychanges the heating demand but further lowers the coolingdemand.
7. Double-skin facade
The optimization strategies of the naturally ventilatedfac-ade focus on the position of the inlet grids. The idea isstraightforward. During heating mode the grids are closedto create an extra insulating barrier. During cooling modethe grids are opened to ventilate the cavity and preventoverheating. In order to automatically control the airflowin the cavity, motorized dampers, powered adjustable gridsor automated operable windows have to be installed. Inthis analysis, three situations are possible: (a) closedapertures (0 in Table 4); (b) normal inlet and outletapertures (1 in Table 4); and (c) large inlet and outletapertures (2 in Table 4). The pressure characteristics of thecavities with opened aperture are based on experimental
40 80 120
60 120 180
47.4 101.2 135.3
�49.7 �58.0 �72.5
60 120 180
17.2 16.4 15.4
�17.9 �17.1 �16.7
60 120 180
40 80 120
17.3 16.4 15.5
�15.4 �14.2 �13.5

ARTICLE IN PRESS
Table 4
Energy demand of DSFs
DSF fixed grids
Aperture 0 1 2
QH (kWh/(m2 a)) 34.5 36.2 36.9
QC (kWh/(m2 a)) �22.2 �19.8 �18.5
DSF controlled grids
Aperture 0–1 0–2 0–1–2 0–2–F
QH (kWh/(m2 a)) 34.4 34.3 34.3 34.0
QC (kWh/(m2 a)) �20.0 �18.7 �18.7 �11.8
SUP without recuperation
Ga, sup (m3/(hm)) 30 60 120 180
QH (kWh/(m2 a)) 36.1 36.4 36.7 36.9
QC (kWh/(m2 a)) �18.2 �17.7 �16.8 �16.5
0
10
20
30
40
50
60
IGU
e B
C
IGU
e O
PT
Ui B
CIG
IGU
i O
PT
AF
W B
C
AF
W O
PT
DS
F B
C
DS
F O
PT
SU
P B
C
SU
P O
PT
he
atin
g d
em
an
d (
kW
h/(
m2.a
))
QH_I
QH_SW
QH_NE 38.0
19.9 20.8
28.0
34.0
18.2
35.331.6
36.2
17.9
Heating demand
-60
-50
-40
-30
-20
-10
0
IGU
e b
c
IGU
e b
est
IGU
i b
c
Ui b
estI
G
AF
W b
c
AF
W b
est
DS
F b
c
DS
F b
est
SU
P b
c
SU
P b
est
co
olin
g d
em
an
d (
kW
h/(
m2.a
))
QC_I
QC_SW
QC_NE
-17.8
-7.0
-14.5
-26.5
-11.8 -13.5
-39.2-36.9
-19.8
-45.3
Cooling demand
a
b
Fig. 8. Energy demand of optimized facades compared against non-
optimized variants. (Legend: IGUe: exterior shading device; IGUi: interior
shading device; AFW: airflow window; DSF: double-skin fac-ade; SUP:
supply window; QH: heating demand; QC cooling demand; I: internal
zone; SW: southwest zone; NE: northeast zone).
D. Saelens et al. / Building and Environment 43 (2008) 638–650648
data available in [18]. The situation with normal aperturesrepresents the base case.
First we analyze the energy demand when the aperturesare fixed at one position throughout the year. Closing thecavity decreases the heating demand, while increasing thecooling load compared with the results of the base case.Maximizing the ventilation decreases the cooling load butincreases the heating load.
This conflicting situation is resolved by implementing theabove mentioned control mechanism. Now, both theheating and cooling demand are optimized. Increasingthe maximum airflow rate in summer proves to besuccessful to control the cooling loads. Allowing thesystem to toggle between open, normal and large opening(0–1–2 in Table 4) does not produce better results.Implementing a simple open/close algorithm is hencesufficient to achieve an optimal result. Finally, also freecooling of the office is implemented (0–2–F in Table 4) andcombined with the control mechanism. This techniquesignificantly lowers the cooling demand, but is not a meritof the DSF.
As an illustration, Table 4 compares the results of theSUP window where no recuperation is allowed withthe results of the DSF with fixed apertures. Expectedly,the heating demand of both MSF-types is comparable. Thecooling demand of the DSF is somewhat higher but needsno fan. As a consequence the overall energy efficiency ofthe DSF will probably outperform that of the SUP.
8. Traditional facades
A comparison of the base case traditional facadesagainst the optimized MSFs shows that the optimizationprovides a considerable improvement of the MSF heatingdemand (Fig. 8). Only the heating demand of the DSF isonly marginally improved. Except for the AFW, also thecooling demand of the optimized MSFs outperforms thecooling demand of the IGUe (Fig. 8). From an energypoint of view, the optimized multiple-skin fac-ades maycompete with non-optimized traditional fac-ade systems. Itcan be argued that this is no longer a fair comparison if the
energy performance of the IGUs is not optimized as well.We consider three optimization strategies for the tradi-tional facades: (1) a heat exchanger (HE) to decrease theventilation energy; (2) night-time ventilation (NV); and (3)free cooling (FC) to temper the cooling demand.

ARTICLE IN PRESSD. Saelens et al. / Building and Environment 43 (2008) 638–650 649
8.1. Heat exchanger
In order to recover part of the ventilation energy, a cross-flow heat exchanger system is positioned between the supplyand exhaust ducts. As a result the heating demand decreasessignificantly (Table 5, HE). Due to the heating of the supplyair when the exterior temperature is higher than the exhausttemperature, the cooling demand somewhat raises. For aBelgian climate, the effect is rather limited (Table 5, HE).
8.2. Night ventilation
The algorithm for night ventilation increases theventilation during night-time whenever the maximum zonetemperature of the previous day surpassed the averagebetween the setpoint for heating and cooling and theinstantaneous exterior temperature is lower than theinstantaneous interior temperature. To avoid the need toturn on the heating during the morning, the night-ventilation is turned off as soon as the zone temperaturedrops below the setpoint for heating. The algorithm is ableto control each zone separately. This allows to ensure amaximal cooling of each zone and minimizes the fanenergy. The cooling demand decreases substantially.Despite the temperature cut-off for ventilation there is asmall raise of the heating demand.
8.3. Free cooling
Whenever the building is in cooling mode and theexterior temperature is lower than the interior temperaturethe building is intensively ventilated. Implementation offree cooling decreases the cooling load and hardly changesthe heating demand (Table 5, FC).
8.4. Combinations of heat exchanger, night ventilation and
free cooling
Optimizing both the heating and cooling demand isachieved by combining the heat-exchanger and the night-
Table 5
Energy demand of IGUs
IGUE
Case BC HE NV
QH (kWh/(m2 a)) 38.0 26.0 38.4
Case FC HE+NV H+N+FC
QH kWh/(m2 a)) 38.2 27.0 26.6
QC (kWh/(m2 a)) �11.6 �10.1 �7.0
IGUI
Case BC HE NV
QH (kWh/(m2 a)) 35.3 23.0 35.7
QC (kWh/(m2 a)) �39.2 �43.9 �22.0
Case FC HE+NV H+N+FC
QH kWh/(m2 a)) 35.5 23.5 23.6
QC (kWh/(m2 a)) �25.1 �22.7 �14.5
time ventilation (Table 5, HE+NV). Implementation offree cooling further decreases the cooling load withoutchanging the heating demand (Table 5, H+N+FC).
9. Conclusions
In this paper, different strategies to optimize the energyefficiency of multiple-skin facades are studied and com-pared with the results of traditional cladding systemsunder typical Belgian climate conditions. By implementingcontrol strategies the energy efficiency of all facade systemswas significantly improved. Further optimization is possi-ble though by optimizing the system properties such as thegeometry and the properties of the glazing and solarshading device.Using an algorithm based on the energy content of the
return air, recuperation of the air returning from theairflow and supply window showed to be the most usefulstrategies to lower the heating demand. For the naturallyventilated double-skin facade controlled apertures with asimple open–close strategy were found beneficial. Control-ling the airflow rate showed to be a successful approach tolower the cooling demand for all facade typologies.Though it must be noted that in most cases the cooling ismainly caused by free cooling rather than being a merit ofthe multiple-skin facades.Optimizing the naturally ventilated double-skin facade
resulted in an efficient control of the cooling demand butcould hardly improve the heating demand. For the airflowwindow, the optimization significantly lowered the heatingdemand but the optimized airflow window still suffers fromhigh cooling demands. The supply window has the highestpotential to benefit from the optimization techniques. It isable to considerably reduce the heating demand whileproviding an acceptable cooling demand. The traditionalfacade with exterior shading device, however, was found toprovide the best solar protection.
Acknowledgments
This research is funded by a research grant of theFlemish Institute for the Promotion of Industrial Scientificand Technological Research (IWT: Vlaams Instituutter Bevordering en Promotie van het Wetenschappelijk-Technologisch Onderzoek in de Industrie). Their financialcontribution is gratefully acknowledged.
References
[1] Compagno A. Intelligent glass facades- material, practice, design.
Basel: Verlag fur Architektur; 1995.
[2] Lang W, Zur typology mehrschaliger Gebaudehullen aus glass.
Detail, 1998;7:1125–232 [in German].
[3] Gertis K, Sind neuere Fassadenentwickelungen bauphysikalisch
sinnvoll.? Teil 2: Glas-Doppelfassaden (GDF). Bauphysik 1999; 21:
54–66 [in German].

ARTICLE IN PRESSD. Saelens et al. / Building and Environment 43 (2008) 638–650650
[4] Ziller C. Modellversuche und Berechnungen zur Optimierung der
naturlichen Luftung durch Doppelfassaden. PhD thesis, Aachen:
Shaker Verlag; 1999 [in German].
[5] Oesterle E, Lieb R-D, Lutz M, Heusler W. Double-skin facades—
integrated planning. Munich: Prestel; 2001.
[6] Poirazis H. Double skin facades for office buildings. Literature
review. Department of Construction and Architecture, Lund
University; 2004.
[7] Lieb R.-D. Building physical values of double skin facades. In:
Proceedings of ICBEST 2001 international conference on building
envelope systems and technologies. Ottawa, Canada, 2001;1:51–4.
[8] den Boer TLJ, Ham M. Facade Orientation as a major design
consideration. In: Proceedings of ICBEST 2001, international
conference on building envelope systems and technologies, Ottawa,
Canada, 2001; vol. 1. 2001. p. 45–9.
[9] Holmes MJ. Optimisation of the thermal performance of mechani-
cally and naturally ventilated glazed facades. Renewable Energy
1994;5:1091–8.
[10] Park S-D, Suh HS, Cho SH. The analysis of thermal performance in
an airflow window system model. In: Proceedings of the ASHRAE/
DOE/BTECC/CIBSE conference. Thermal performance of the
exterior envelopes of buildings IV 1989;14:361–75.
[11] Tanimoto J, Kimura K. Simulation study on an airflow window
system with an integrated roll screen. Energy and Buildings 1997;
26:317–25.
[12] Helbig S, Energetische Bewertung von Zuluftfenstern. In: Proceed-
ings of the tenth international symposium for building physics,
Dresden, 1999. p. 539–48 [in German].
[13] Manz H, Shaelin A, Simmler H. Airflow patterns and thermal
behavior of mechanically ventilated glass double fac-ades. Building
and Environment 2004;39:1023–33.
[14] Safer N, Woloszyn M, Roux J-J. Influence of solar radiation on heat
and air flow transfers in double-skin facades with venetian blinds. In:
Ninth international conference on air distribution in rooms (ROOM-
VENT 2004), Coimbra, Portugal; 2004a.
[15] Safer N, Woloszyn M, Rusaouen G, Roux J-J. Numerical studies
with CFD approach of the heat and air flow transfers combined with
solar radiation in double-skin facades. In: The 21th conference on
passive and low energy architecture (PLEA 2004), Eindhoven, The
Netherlands; 2004b.
[16] Muller H, Balowski M. Waste air ventilated windows for offices.
Heizung Luftung Haustechnik 1983;34(10):412–7.
[17] Haddad KH, Elmahdy AH. Comparison of the monthly thermal
performance of a conventional window and a supply-air window.
ASHRAE Transactions 1998;104(Part 1B):1261–70.
[18] Saelens D. Energy performance assessment of single storey multiple-
skin facades. PhD dissertation. K.U. Leuven, Leuven, Belgium 2002.
[19] Park C-S. Occupant responsive optimal control of smart fac-ade
systems, PhD dissertation. Georgia Institute of Technology, College
of Architecture; 2003.
[20] Gratia E, De Herde A. Natural cooling strategies efficiency in an
office building with a double-skin facade. Energy and Buildings
2004;36:1139–52.
[21] Stec WJ, van Paassen AHC. Symbiosis of the double skin fac-ade with
the HVAC system. Energy and Buildings 2005;37:461–9.
[22] TRNSYS. TRNSYS: a transient simulation program, reference
manual. Wisconsin: Solar Energy Lab, University of Wisconsin-
Madison; 2000.
[23] Siegel R, Howell JR. Thermal radiation heat transfer. London:
Taylor and Francis; 1992.
[24] Edwards DK. Solar absorption by each element in an absorber-
coverglass array. Solar Energy 1977;19:401–2.
[25] Janssens B. Numerieke simulatie van stromingen in de buurt van
ventilatiemonden in het kader van de energiehuishouding van een
beschermde ruimte/gebouw. MSc dissertation. Brussel: Royal Mili-
tary School; 2003 [in Dutch].
[26] Saelens D, Roels S, Hens H. Optimization of the energy performance
of airflow windows. In: Proceedings of the performance of exterior
envelopes of whole buildings IX. FL, USA; 2004.
[27] De Bleeckere H, Zobec M, Simonella A. Accurate thermal
performance prediction of innovative double skin fac-ades and
conflicts with current standards. In: Proceedings of the ICBEST
conference. Sydney, Australia 2004.
[28] ASHRAE. ASHRAE handbook—fundamentals. Atlanta: American
Society of Heating, Refrigerating, and Air-Conditioning Engineers,
Inc; 2005.


![Menschenhaut [Human skin]](https://static.fdokumen.com/doc/165x107/6326d24f24adacd7250b1364/menschenhaut-human-skin.jpg)