
Strategic Globalizing Centres and Sub-Network Geometries: A Social Network Analysis of Multi-scalar...
12
Strategic globalizing centers and sub-network geometries: A social network analysis of multi-scalar energy networks Kirsten Martinus a,⇑ , Thomas J. Sigler b , Glen Searle b , Matthew Tonts a a School of Earth and Environment, The University of Western Australia, 35 Stirling Highway, Crawley, WA 6009, Australia b School of Geography, Planning and Environmental Management, The University of Queensland, St Lucia, Brisbane, Queensland 4072, Australia article info Article history: Received 5 September 2014 Received in revised form 2 June 2015 Accepted 4 June 2015 Keywords: Economic geography Social network analysis Corporate geographies Urban networks Energy Natural resources abstract Over the past three decades, a multitude of studies have examined the relational properties of corporate networks as a proxy for analyzing interurban hierarchies and structures. While this has been important in illuminating the nature of global connectivity, a significant conceptual lacuna exists in understanding how a multi-scalar analysis of interurban networks informs a more complete understanding of the geographies of globalization, and how cities within these networks act as regional globalizing centers. Building upon the theoretical and methodological foundations of ‘world city network’ (WCN) research, this paper investigates the corporate networks of the energy industry as a historic driver of globalization using social network analysis from an Australia geographical perspective. Globally and nationally scaled energy networks derived from the Platts and Australian Securities Exchange (ASX) corporate lists are used to explore the convergence of nationally and globally articulated networks, and identify cities instrumental in the globalization of the national industry sub-networks. These are strategic ‘globalizing centers’ which, in contradistinction to ‘global cities’ or ‘world cities’ as broad classifications, play nuanced roles in anointing industry-specific circuits of capital and information. The analysis of two complemen- tary yet distinct networks provides theoretical insight into how scale plays an integral role in defin- ing/articulating interurban relations. Crown Copyright Ó 2015 Published by Elsevier Ltd. All rights reserved. 1. Introduction Understandings of the global distribution of cities and their rel- ative positionality in the world system has now enjoyed at least three fruitful decades of research. At the forefront of this research are relational empiricists and theorists whose focus is largely on networks, albeit articulated at multiple scales (Taylor, 2001). This ‘new metageography’ (Beaverstock et al., 2000) has opened up novel possibilities to overcome the territorial trap (Agnew, 1994; Brenner, 1999) of geographical embeddedness and has placed rela- tional perspectives on urbanism at the forefront of the discourse on place, scale, space, and territory (Jessop et al., 2008; Paasi, 2004). Given the rise of firms, and in particular multinational corpora- tions, as globally connected articulators of resources, capital, and information (Dicken and Malmberg, 2001), the relationships between headquarters and branch locations have been opera- tionalized as a proxy for understanding urban relations through a corporate lens. This explains both firms’ strategic locational strate- gies (Derudder and Witlox, 2004) as well some of the logics underlying the global structuration of interurban relations and the strategic positionality of cities (Bassens and van Meeteren, 2014; Beaverstock et al., 1999; Taylor et al., 2014). While there is no consensus on the ‘best’ means by which to understand socio-spatial relations through urban networks (Liu and Derudder, 2013; Neal, 2012; Hennemann and Derudder, 2014), a broad range of scholarly perspectives has advocated that regionalization should be considered alongside globalization as a meaningful underlying process (Bunnell, 2013; Good et al., 2011) by investigating the relational contours of overlapping scales (Taylor et al., 2012), the complex interplay of dispersion and con- centration driving the globalization of cities (Rossi et al., 2007) and non-advanced producer services (non-APS) industries (Toly et al., 2012). Notwithstanding this, a significant theoretical lacuna exists in understanding how regionally articulated sub-networks complement global ones, and the role that particular cities play within multi-scalar networks. If so-called ‘global cities’ and ‘world cities’ retain the command-and-control functions of the global cor- porate hierarchy as ‘basing points for capital’, then globalizing cen- ters serve as active pathways for flows of capital and information that connect national and supra-national regional systems to glob- alized circuits (cf. Bassens and van Meeteren, 2014; Taylor et al., http://dx.doi.org/10.1016/j.geoforum.2015.06.006 0016-7185/Crown Copyright Ó 2015 Published by Elsevier Ltd. All rights reserved. ⇑ Corresponding author. E-mail address: [email protected] (K. Martinus). Geoforum 64 (2015) 78–89 Contents lists available at ScienceDirect Geoforum journal homepage: www.elsevier.com/locate/geoforum
Transcript of Strategic Globalizing Centres and Sub-Network Geometries: A Social Network Analysis of Multi-scalar...
Geoforum 64 (2015) 78–89
Contents lists available at ScienceDirect
Geoforum
journal homepage: www.elsevier .com/locate /geoforum
Strategic globalizing centers and sub-network geometries: A socialnetwork analysis of multi-scalar energy networks
http://dx.doi.org/10.1016/j.geoforum.2015.06.0060016-7185/Crown Copyright � 2015 Published by Elsevier Ltd. All rights reserved.
⇑ Corresponding author.E-mail address: [email protected] (K. Martinus).
Kirsten Martinus a,⇑, Thomas J. Sigler b, Glen Searle b, Matthew Tonts a
a School of Earth and Environment, The University of Western Australia, 35 Stirling Highway, Crawley, WA 6009, Australiab School of Geography, Planning and Environmental Management, The University of Queensland, St Lucia, Brisbane, Queensland 4072, Australia
a r t i c l e i n f o a b s t r a c t
Article history:Received 5 September 2014Received in revised form 2 June 2015Accepted 4 June 2015
Keywords:Economic geographySocial network analysisCorporate geographiesUrban networksEnergyNatural resources
Over the past three decades, a multitude of studies have examined the relational properties of corporatenetworks as a proxy for analyzing interurban hierarchies and structures. While this has been important inilluminating the nature of global connectivity, a significant conceptual lacuna exists in understandinghow a multi-scalar analysis of interurban networks informs a more complete understanding of thegeographies of globalization, and how cities within these networks act as regional globalizing centers.Building upon the theoretical and methodological foundations of ‘world city network’ (WCN) research,this paper investigates the corporate networks of the energy industry as a historic driver of globalizationusing social network analysis from an Australia geographical perspective. Globally and nationally scaledenergy networks derived from the Platts and Australian Securities Exchange (ASX) corporate lists areused to explore the convergence of nationally and globally articulated networks, and identify citiesinstrumental in the globalization of the national industry sub-networks. These are strategic ‘globalizingcenters’ which, in contradistinction to ‘global cities’ or ‘world cities’ as broad classifications, play nuancedroles in anointing industry-specific circuits of capital and information. The analysis of two complemen-tary yet distinct networks provides theoretical insight into how scale plays an integral role in defin-ing/articulating interurban relations.
Crown Copyright � 2015 Published by Elsevier Ltd. All rights reserved.
1. Introduction
Understandings of the global distribution of cities and their rel-ative positionality in the world system has now enjoyed at leastthree fruitful decades of research. At the forefront of this researchare relational empiricists and theorists whose focus is largely onnetworks, albeit articulated at multiple scales (Taylor, 2001). This‘new metageography’ (Beaverstock et al., 2000) has opened upnovel possibilities to overcome the territorial trap (Agnew, 1994;Brenner, 1999) of geographical embeddedness and has placed rela-tional perspectives on urbanism at the forefront of the discourse onplace, scale, space, and territory (Jessop et al., 2008; Paasi, 2004).Given the rise of firms, and in particular multinational corpora-tions, as globally connected articulators of resources, capital, andinformation (Dicken and Malmberg, 2001), the relationshipsbetween headquarters and branch locations have been opera-tionalized as a proxy for understanding urban relations through acorporate lens. This explains both firms’ strategic locational strate-gies (Derudder and Witlox, 2004) as well some of the logics
underlying the global structuration of interurban relations andthe strategic positionality of cities (Bassens and van Meeteren,2014; Beaverstock et al., 1999; Taylor et al., 2014).
While there is no consensus on the ‘best’ means by which tounderstand socio-spatial relations through urban networks (Liuand Derudder, 2013; Neal, 2012; Hennemann and Derudder,2014), a broad range of scholarly perspectives has advocated thatregionalization should be considered alongside globalization as ameaningful underlying process (Bunnell, 2013; Good et al., 2011)by investigating the relational contours of overlapping scales(Taylor et al., 2012), the complex interplay of dispersion and con-centration driving the globalization of cities (Rossi et al., 2007)and non-advanced producer services (non-APS) industries (Tolyet al., 2012). Notwithstanding this, a significant theoretical lacunaexists in understanding how regionally articulated sub-networkscomplement global ones, and the role that particular cities playwithin multi-scalar networks. If so-called ‘global cities’ and ‘worldcities’ retain the command-and-control functions of the global cor-porate hierarchy as ‘basing points for capital’, then globalizing cen-ters serve as active pathways for flows of capital and informationthat connect national and supra-national regional systems to glob-alized circuits (cf. Bassens and van Meeteren, 2014; Taylor et al.,

K. Martinus et al. / Geoforum 64 (2015) 78–89 79
2014). It is now relatively clear that ‘global’ functions are at bestmerely one facet of interurban connectivity (Surborg, 2011;Smith, 2014), and that more refined understandings ofless-than-global networks must be considered. In other words, ifwe conceive of national and regional systems as sprockets of vary-ing sizes within a ‘global’ machine, globalizing centers would findthemselves at the axels, and global cities would turn the largest ofthe gears. However, the smaller and medium sized gears, as well asthe cogs that connect them, are of equal importance.
We argue that regional globalizing centers emerge in comple-ment to the widely theorized global/world city meta-geography,and posit that by focusing on the convergence of nationally andglobally articulated networks; we can identify cities that areinstrumental within regional- and industry-specificsub-networks. In the sections that follow, we explicate how thisunfolds within the energy sector through global andAustralia-based corporate networks. The spatial distribution ofthe energy sector is tied to a diverse range of logistical, political,and economic constraints associated with the geography of naturalresources and large consumption markets. After a deeper focus onthe theoretical underpinnings of this research project, we delveinto the specificities of the Australian urban system as well asthe energy sector. Following well-established network analysismethodology, we explain how this empirical analysis lends itselfto broader theorization regarding how regional globalizing centersplay nuanced roles within industry-specific sub-networks, and tothis end provide strategic sites for understanding broader politicaland economic processes.
2. The past and present of WCN
WCN research is fundamentally situated in the long-running dis-course of a multi-disciplinary group of academics examining thespatial connectedness of cities through various urban, economicand social measures (Acuto, 2011). It is sometimes pinned as aderivative of central place theory (Beaverstock et al., 2000), whosepreoccupation with hierarchies and service functions (Berry andGarrison, 1958; Christaller, 1933) had a strong influence on contem-porary scholars. As tightly bound national systems became liberal-ized and internationalized, world-systems theorists from the1970s onward increasingly related urban geographic changes toprocesses of global integration of economic, social and political net-works. Wallerstein (2011 [1974]) conceived of cities as being notmaterially but socially organized according to a hierarchy of capital-ist power and technological advancement, and Friedmann’s seminalpaper (1986) drew on Wallerstein and others (see Acuto, 2011;Knox, 1996), suggesting that capital accumulated in linkages formedthrough processes of urbanization and economic restructuring suchthat cities became basing points for capital.
Castells (2011 [1996]) added that cities, as network mediatorynodes of information flows, could be viewed as processes ratherthan places. This was elaborated upon by Sassen (2001), whodeveloped this envisioning a global network of new political andeconomic relations that could be organized, not only as nodes (asper Friedmann), but strategic advanced production locations (e.g.,finance and technology). She proposed that global power and con-trol was concentrated in certain command and control cities, form-ing a hierarchy with the cities of London, New York and Tokyo atthe apex. Though there are multiple germane dimensions toSassen’s book, her argument that ‘unlike other types of services,[advanced producer services (APS)] are only weakly dependenton proximity to the consumers served’ (2001, p.11) helped to reori-ent the decades-old Christallerian focus on consumer-oriented net-works and urban functions. Though Friedmann and Sassen saidnothing of the network relations between cities (Beaverstock
et al., 2000), they facilitated discussion on the cities themselves,which led to renewed attempts to quantify the world city systemthrough the identification of a spatial command and control hierar-chy of cities.
Seeking a more empirical approach than had come previously,Taylor (1997) reasoned that the nationally oriented nature ofattribute-based data only allowed for the ‘comparative analysisof objects’, and that any ‘statement that [places] objects in a rankedlist constitute a hierarchy is conjecture and nothing more’ (p. 325).Lyons and Salmon (1995) concurred, noting that using corporateheadquarter counts as a proxy for strategic location did not gener-ate a nuanced understanding of city relations and the emergingimportance of regional over national cities for corporate strategiclocation. Driven by comparability issues between national and glo-bal data sets to describe urban and economic network relationalgeographies, scholars attempted to describe information flowsand linkages between cities (see Alderson and Beckfield, 2004;Good et al., 2011; Smith and Timberlake, 2001; Taylor, 1997)through either labor migration and communications networks(business and social) (e.g., Choi et al., 2006; Keeling, 1995; Smithand Timberlake, 2001) or corporate data on eitherheadquarter-subsidiary and headquarter-branch office locations(e.g., Alderson and Beckfield, 2004; Beaverstock et al., 2000;Godfrey and Zhou, 1999).
Responding to critiques (Godfrey and Zhou, 1999; Robinson,2002; Short, 2004) of an initial focus on APS (cf. Derudder andTaylor, 2005; Hoyler et al., 2008; Taylor, 2001; Taylor et al.,2002) and pre-determined industry lists thereof (Beckfield andAlderson, 2006), contemporary studies reflect a variety of industrysectors as a means to better scope the complex processes of glob-alization. For example, the mapping of the media industry byHoyler and Watson (2013) and Krätke and Taylor (2004) attemptsto understand the globalizing role of culture to development andthe use of advanced manufacturing by Krätke (2014), Lüthi et al.(2013) and Schmitt and Smas (2012) is used to call attention to dri-vers of modern economic development. Measuring the spatial con-centration of specialized firms and non-governmental actors(Taylor, 2004) within cities has enabled a less hierarchical under-standing of cities and increasingly complex mapping of networksvis-a-vis regional nodes, inter-urban networks and geographicrelational flows (cf. Carroll, 2007; Felsenstein et al., 2002; Jacobset al., 2010; Martinus and Tonts, 2015; Taylor et al., 2002).
Certainly, the world cities research agenda continues to bestrongly linked to seminal notions of cities as a ‘command and con-trol’ centers, ‘basing points for capital’ or, most crudely, ‘globalcities’ and ‘world cities’. Beyond purely economistic nomencla-tures, however, there is an increasing understanding that the glo-bal urban network is subject to competing social, economic andpolitical forces being largely influenced by state-specific factorsthat govern how cities actually globalize and connect to one other.This has important scalar implications: the world-system is com-prised of multiple sub-systems each of which operate in highlyspecific and asynchronous, yet inter-dependent ways. Coe et al.(2004) noted regional development resulted from the actions ofboth local and non-local actors involved in the global productionprocess, which can be ‘differentiated by their degree of territorialembeddedness’ (p. 471, italics in original version). Others, such asMa and Timberlake (2013) argue that territorialization betweenglobal cities and less global urban counterparts may depend uponthe national balance between market-based and political forceswith strong development states (e.g. Japan, Korea) able to ‘bufferthe adverse effects of globalization’ (p. 268) better than moreextroverted economies (e.g. USA, UK), while Dicken et al. (2001)assert that understanding the global economy has meant ‘incorpo-rat[ing] multiple scales . . . to avoid privileging specific organiza-tional loci of analysis’ (p. 91). Indeed:
80 K. Martinus et al. / Geoforum 64 (2015) 78–89
Any singular geographic scale is an inadequate means for ana-lyzing the global economy because what we have in reality isa complex intermingling of different geographical scales (global,regional, national and local) in network formation and networkprocesses.
[Dicken et al., 2001, p. 95]
The infinite complexity of the world thus lends itself to furtherinvestigation into networks at multiple scales and from novel geo-graphic perspectives. Energy in particular provides a novel lens, asthe industry’s geographical scope and nuanced financial landscape(see Bassens et al., 2010) alongside the strong geopolitical impera-tives of large producer and consumer nations (Brumberg andAhram, 2007; Labban, 2011) and state-based energy conglomer-ates (Harris, 2012) deviates significantly from how most of theWCN literature has been framed under conditions of neo-liberalcapitalism. The laissez-faire assumptions inherent to global corpo-rate hierarchies run counter to the reality that energy security isof critical national interest and that both energy reserves as wellas distribution rights are often commanded by national monopo-lies, not to speak of the cartels (e.g. OPEC) and trading blocs thatwield great influence in the industry. Indeed, while global corpo-rate lists might outline something of the overarching WCN frame-work, particularly in the case of free-market economies,nationally-based corporate lists are likely to generate moredescriptive analytical frameworks for understanding urban rela-tional networks at the role that globalizing centers play in comple-ment to global/world cities. As such, this investigation into the rolethat cities play in industry-specific sub-networks fills a significantlacuna in understanding the strategic role of cities as globalizingpoints for a nation.
3. The geographies of energy: Australia and beyond
Human energy consumption has increased dramatically sincethe industrial revolution, with various sources of energy (e.g. fossilfuels, renewables) linked to large-scale industrial, domestic, trans-portation, and agricultural uses (UN, 2011). Global consumption isprojected to further increase by 56% between 2010 and 2040 to820 quadrillion British thermal units (Btus) driven primarily byan ever-increasing global population, sustained demand in devel-oped countries, and commensurate gains in economic wealth inemerging economies (EIA, 2013). Though consumption is largelytied to wealth and population, the distribution of energy resourcesis determined primarily by geography (both naturally and politi-cally) with depleting energy reserves pushing production towardevermore difficult-to-access locations. The economic activities ofthe industry are decidedly complex ranging from exploration anddevelopment to transport to processing and production, some ofwhich are coordinated on-site and others from remotedecision-making centers. Critical across the entirety of our socialand economic lives, the energy sector brings with it strong politicaldimensions. Many governments have nationalized all or parts ofenergy production, while others have sought de-regulation as ameans of optimizing industry performance (Williams andGhanadan, 2006). Therefore, as the industry extends across theentirety of the globe making its way into homes, office buildings,and factories in specific ways tied to economic, political, and geo-graphic constraints, it has simultaneously globalized and localizeddimensions making it a highly appropriate sector in which to seatthis research (cf. Martinus and Tonts, 2015).
The geographical context for this analysis is Australia – a nationwhose colonial beginnings as a settler outpost for Britain havebeen transformed into an economically prosperous country bythe resource wealth of its immense national territory. It has awell-established extractive economy which is far more reliant on
natural resource exports than most countries of similar levels ofincome, save Norway, Brunei, and a few Gulf States (World Bank,2014). As an energy consumer, Australia is one of the world’s lar-gest with an energy intensity ratio of 5.93 toe (ton of oil equiva-lent) per capita above the respective OECD and world ratios of4.28 toe and 1.80 toe per capita (ABS, 2012). Over the last fiveyears, oil consumption has grown by 10.6% and gas by 1.2%, whilecoal has declined by 2.3% and renewables 2.8%. Coal has slowlyreplaced oil as an energy source with coal comprising of 34.2%,oil 38.9%, gas 22.6% and renewables 4.3% of national energy con-sumption in 2011–2012 (Che et al., 2013). Since the 1990s,Australia has been diversifying its energy imports outside of theMiddle East to include Asia, primarily from Vietnam, Malaysia,Indonesia and Singapore (Falk and Settle, 2011).
As a strong energy producer, there are limited concerns offuture energy security in Australia outside of a vulnerability to pet-roleum shortages given that it imports 47% of domestically con-sumed crude oil and LPG (Falk and Settle, 2011). Its stability as afuture key energy supplier makes it well placed to supply predictedrapid growth nations, in particular in northeast Asia (China, Korea,Japan and Taiwan) which holds one per cent of the world’s naturalgas supply but eight per cent of its demand (Cabalu, 2010; vonHippel et al., 2011). In 2010–2011, it exported 79% of energy pro-duced; of exports, coal comprises 60% and uranium 26%. In termsof energy production, it is ninth in the world contributing to 2.5%of global production and five per cent of global exports (ABS,2013). It is largest producer of black coal (Che et al., 2013), the sec-ond largest uranium exporter (Pham, 2009), and the third largestliquid natural gas (LNG) exporter with plans to expand liquefactioncapabilities by 2017 to become the largest (IGU, 2013).
4. Methodology
In the past decades, WCN research has focused on developingand applying network analysis to firm and city relational data tobetter understand the way overlapping and interlocking networksof city nodes and connections play out across space (see Derudderand Taylor, 2005; Good et al., 2011; Hennemann and Derudder,2014). This research builds on a growing body of work using socialnetwork analysis (SNA), such as Alderson and Beckfield (2004),Hennemann and Derudder (2014) and Krätke (2014), as well asusing ‘global’ lists of corporations from all industries (Aldersonand Beckfield, 2004) or at the sub-industrial sector level, for exam-ple, Krätke (2003, 2014), Martinus and Tonts (2015) and Toly et al.(2012). In order to understand the geographic and relationaldimensions of inter-urban corporate energy networks at overlap-ping scales, this paper marries bottom-up approaches (Schmittand Smas, 2012) to the top-down perspective of a global dataset. It does so by applying SNA to two different energy networks,one derived from a global data set and the other nation-based, toidentify alternative landscapes of globalization, key globalizingcities as well as relational sub-networks.
One source of nation-based data is the domestic andforeign-based corporate listings of high-profile national securitiesexchanges. Indeed, understanding corporate spatial geometries ofnational money markets allows alternative nation-based networksto emerge which extend beyond the key global hubs of London andNew York into territorial and regional sub-markets. The historyand development of stock and securities exchanges as a means tofinance international trade is a narrative of a nations’ transitionfrom an emerging economy to one with an increasingly globallyintegrated market (Wójcik, 2011). Corporates listed on a nationalexchange will reflect development trajectories, memberships andgoverning rules of exchanges directed by the government eco-nomic regulations and rules shaping their respective national

K. Martinus et al. / Geoforum 64 (2015) 78–89 81
financial systems (Neal and Davies, 2005). While Wójcik (2009)noted a propensity for corporates to list on their home stockexchange, there has been a rise in the level of foreign-listings onstock exchanges, where the corporations of one country list inthe stock exchanges of another (Pagano et al., 2002). This emergesfrom a mutual strategic advantage – corporations gain betteraccess to foreign capital markets and stock exchanges becomemore competitive in global markets (Pagano et al., 2002).
As such, energy corporate headquarter location data weredrawn from sources on two scales, with the 2014 list ofAustralian Securities Exchange (ASX) energy corporations (244firms) reflecting primarily Australia-based firms and the 2013Platts 100 Global Energy Company Rankings1 (hereafter ‘Platts’).While the Platts represents a commercially assembled register ofthe world’s most powerful companies as ranked by an index weight-ing assets, profits, revenues, and return on investment, theSydney-based ASX is an amalgamation of several previousAustralian state-based exchanges that serves as the primaryexchange for Oceania. The ASX is one of the world’s ten largest bytrading volume and hosts a variety of stocks, bonds, and othersecurities.
The ASX and Platts derived data sets were used to construct twounique two-mode city/firm matrices of corporate headquartersand branch city locations for each listed corporation (small localsales offices or offices of part or jointly owned subsidiary firmswere excluded). This matrix documented corporate office servicevalues according to the following criteria (see Hennemann andDerudder, 2014; Taylor et al., 2002):
– Firm global headquarters – 5.– Regional headquarters with extra-territorial function – 4.– National headquarter – 3.– Ordinary office with minimal function – 2.– Ordinary office with reduced function – 1.– No office – 0.
This matrix assigned offices to their closest metropolitan area ifwithin 50 km of a major city; such that Sandton and Randburgwere coded as Johannesburg and the entire Bay Area was reducedto represent San Francisco. In extended metropolitan or polynucle-ated regions where important yet clearly distinct cities werelocated in close proximity, judgment calls were made regardingclassification (e.g. grouping the cities within the Dutch Randstadas one). The final numbers of ASX and Platts derived cities in therespective matrices were 190 and 425. The two-modefirm-by-city matrices of office service values (v) were manuallytransformed into ASX and Platts one-mode respective 190 � 190and 425 � 425 city-by-city directed matrices, where cities in thefirst column (a) reported to cities across the top row (b).Directionality was assigned to represent regional informationbeing transferred between smaller to larger offices, and then ontoheadquarters. Exact corporate communication flows dependedupon individual corporate territorial structures, but generally fol-lowed the regions of Asia, Americas, Europe and Africa/MiddleEast (see Hennemann and Derudder, 2014). For example, localoffices in a cities of Perth (v = 2) and Auckland (v = 3) wereassumed to report to a regional office in the b city of Singapore(v = 4), which would in turn become the a city reporting to globalheadquarters in the b city of Houston (v = 5). The service valuesof each a city were added to the respective a–b city-pair cells.This emphasizes the importance of local ‘knowledge’ to global cor-porate operations and strategies and reflects the territorial embed-dedness of corporate networks. In this way, the cell of eachdirected matrix (V) denoted the aggregate sum of services values
1 Lists top performing energy corporations of the world.
2 In-degree and out-degree in this analysis runs opposite to that of Alderson andBeckfield as their directed matrix specifies command and control flows rather thanreporting flows.
(v) for all m firms between each city dyad (a, b), where a and b arethe respective locations of the lower and higher service value cor-porate offices for firm j. That is:
V ¼Xm
j¼0
v jða;bÞ
The social network analysis program NodeXL was applied to theresulting directed matrices to calculate key SNA metrics of (seeAlderson and Beckfield, 20042; Scott and Carrington, 2011; Walland van der Knaap, 2011) centrality, which is commonly used to cal-culate the relative importance of a node (also referred to as a vertex)within a network. Three centrality measures were applied, each ofwhich reveal a unique indicator of importance.
(1) Out-degree centrality: An indicator of city influence being ameasure of information outflows from lower offices tohigher ones (measures a city’s influence over the global eco-nomic network). It is aggregated sum of out-going connec-tions, where an out-degree of five means a particular cityreports to five other cities. It does not factor in the weightof city-pair connections.
(2) In-degree centrality: The direct opposite to out-degree, it isan indicator of city prominence being a measure of informa-tion inflows from higher to lower level offices (measures acity’s prominence in or control over global economic networkwith larger numbers of reporting cities associated with citieswhere there are a larger number of higher order serviceoffices).
(3) Betweenness centrality: measures the portion of all connec-tions between two cities passing through a specific city. It isan indicator of a city’s strategic power in local networks (i.e.,the degree to which it acts as a bridge between other citypairs) being a measure of lost connections if it was cut fromthe network.
These measures enabled the relative importance of each city tobe compared between to two networks. Betweenness centralitywas used to identify cities which acted as interlocking agents (orglobalizing centers) between the two networks. The scale of andfunction in globalization at which each city operated was derivedfrom a comparison of a city’s relative rank in both networks. Forexample, a highly ranked city in both Platts and ASX networkswas seen to central for globalization of the entire energy sector,while a city that ranked secondary in Platts but high in ASX wasseen as central in Australia’s globalization of the energy sector.City sub-network groups were identified via the Clauset–Newman–Moore algorithm (see Fig. 1). This algorithm was developed inorder to identify the sub-network community structures of largenetwork data sets by positioning cities ‘into groups such that thereis a higher density of [connections] within groups than betweenthem’ (Clauset et al., 2004, p. 1). These calculations employ anundirected matrix as ‘any link between two [cities], regardless ofdirection, [is] an indication of their similarity’ (p4). This allowedthe geographic dimensions of sub-networks to be visualized (viashapes/gray scale). Retaining these sub-network visualizations,the Fruchterman–Reingold algorithm was applied to generate aforce-directed graph where cities of greatest importance werelocated next to each other via weights assigned according to con-nections strength. This combination of attraction (in equilibriumformed uniform length connections) and repulsion (pushed uncon-nected cities apart) forces between city-pairs generated a graph
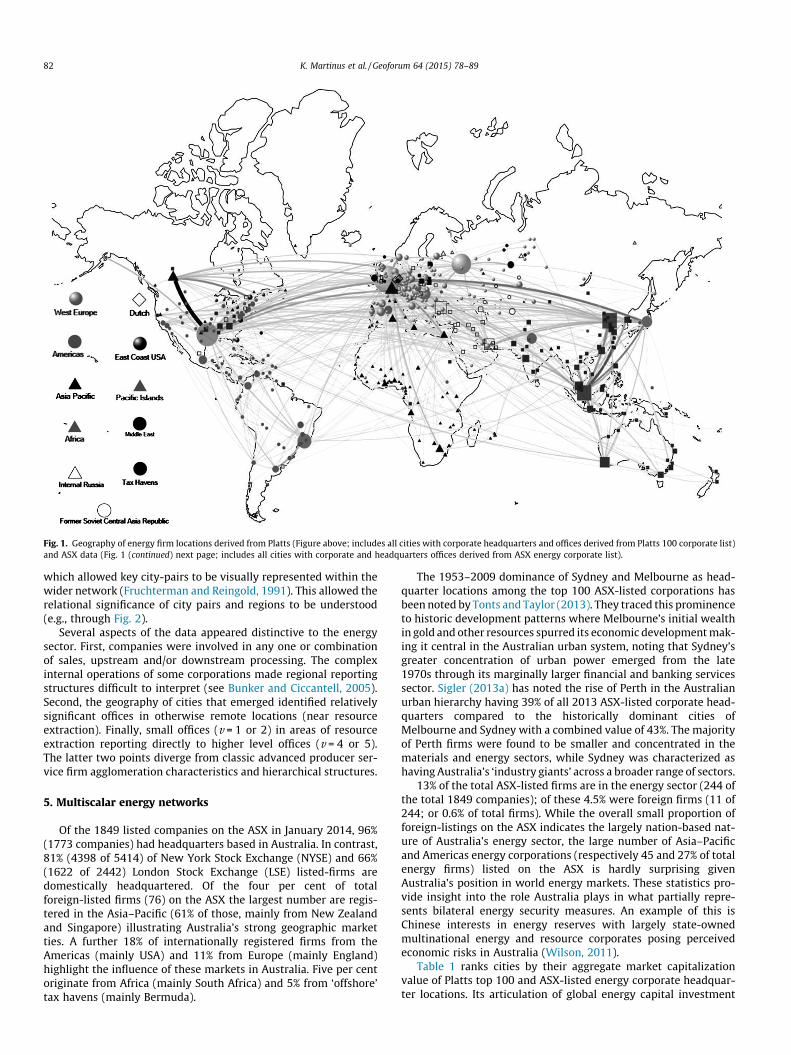
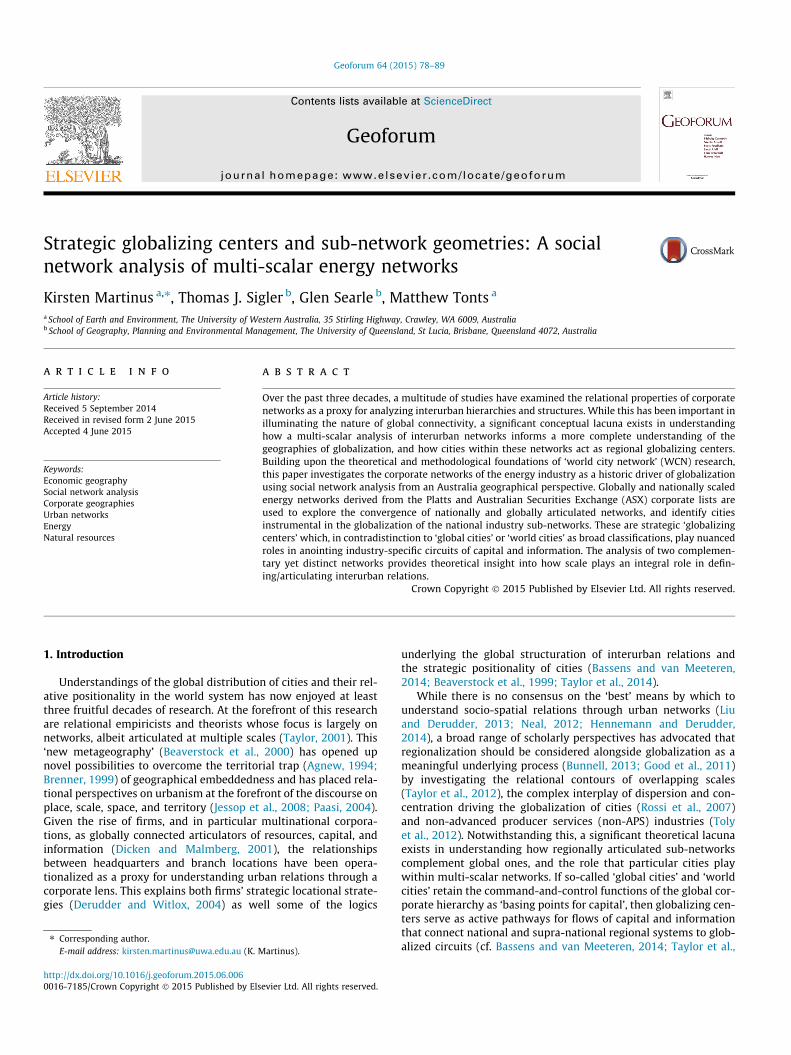
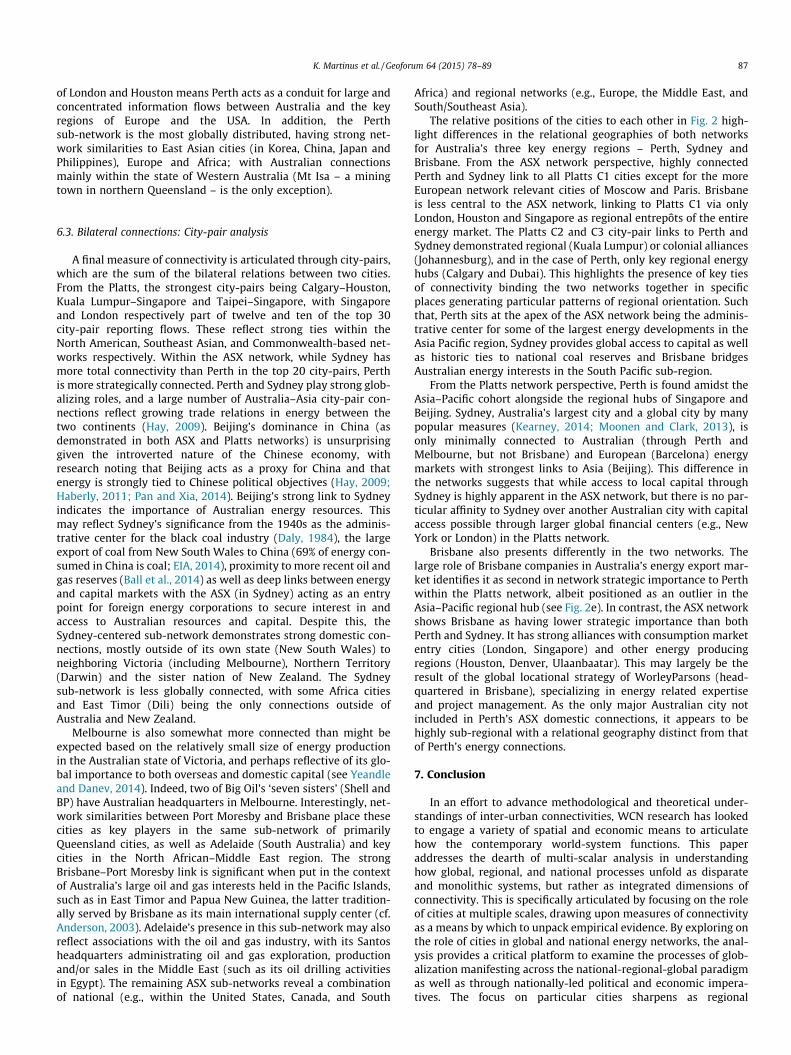
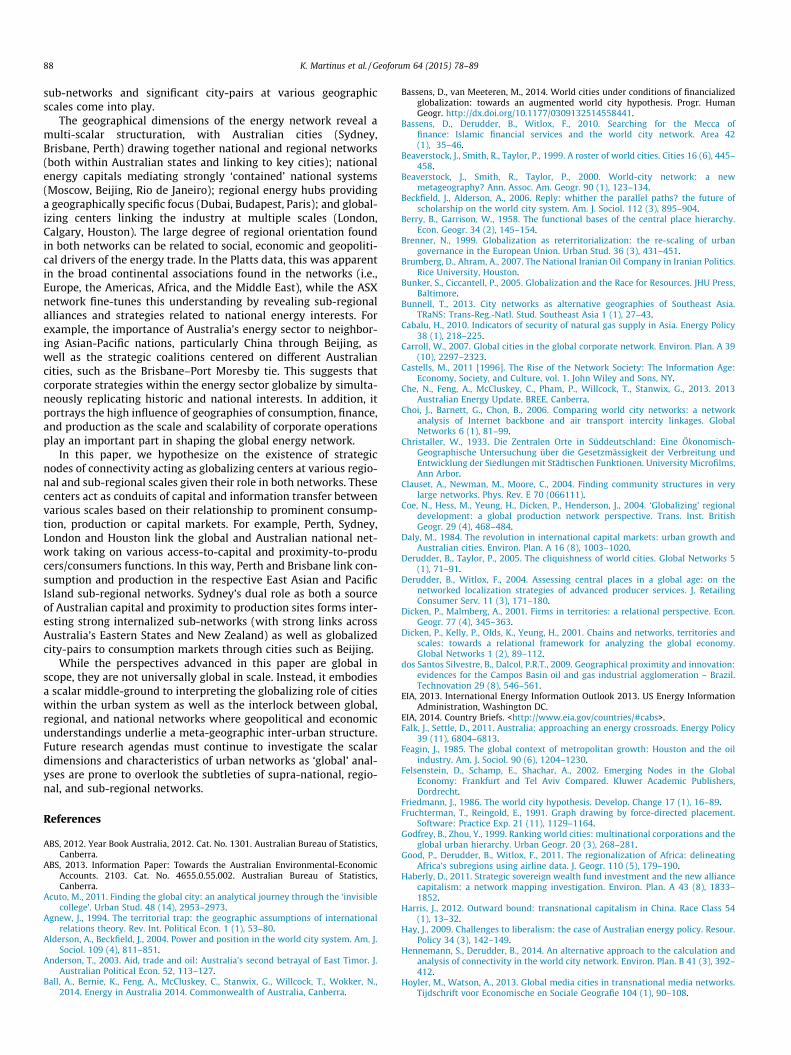
Fig. 1. Geography of energy firm locations derived from Platts (Figure above; includes all cities with corporate headquarters and offices derived from Platts 100 corporate list)and ASX data (Fig. 1 (continued) next page; includes all cities with corporate and headquarters offices derived from ASX energy corporate list).
82 K. Martinus et al. / Geoforum 64 (2015) 78–89
which allowed key city-pairs to be visually represented within thewider network (Fruchterman and Reingold, 1991). This allowed therelational significance of city pairs and regions to be understood(e.g., through Fig. 2).
Several aspects of the data appeared distinctive to the energysector. First, companies were involved in any one or combinationof sales, upstream and/or downstream processing. The complexinternal operations of some corporations made regional reportingstructures difficult to interpret (see Bunker and Ciccantell, 2005).Second, the geography of cities that emerged identified relativelysignificant offices in otherwise remote locations (near resourceextraction). Finally, small offices (v = 1 or 2) in areas of resourceextraction reporting directly to higher level offices (v = 4 or 5).The latter two points diverge from classic advanced producer ser-vice firm agglomeration characteristics and hierarchical structures.
5. Multiscalar energy networks
Of the 1849 listed companies on the ASX in January 2014, 96%(1773 companies) had headquarters based in Australia. In contrast,81% (4398 of 5414) of New York Stock Exchange (NYSE) and 66%(1622 of 2442) London Stock Exchange (LSE) listed-firms aredomestically headquartered. Of the four per cent of totalforeign-listed firms (76) on the ASX the largest number are regis-tered in the Asia–Pacific (61% of those, mainly from New Zealandand Singapore) illustrating Australia’s strong geographic marketties. A further 18% of internationally registered firms from theAmericas (mainly USA) and 11% from Europe (mainly England)highlight the influence of these markets in Australia. Five per centoriginate from Africa (mainly South Africa) and 5% from ‘offshore’tax havens (mainly Bermuda).
The 1953–2009 dominance of Sydney and Melbourne as head-quarter locations among the top 100 ASX-listed corporations hasbeen noted by Tonts and Taylor (2013). They traced this prominenceto historic development patterns where Melbourne’s initial wealthin gold and other resources spurred its economic development mak-ing it central in the Australian urban system, noting that Sydney’sgreater concentration of urban power emerged from the late1970s through its marginally larger financial and banking servicessector. Sigler (2013a) has noted the rise of Perth in the Australianurban hierarchy having 39% of all 2013 ASX-listed corporate head-quarters compared to the historically dominant cities ofMelbourne and Sydney with a combined value of 43%. The majorityof Perth firms were found to be smaller and concentrated in thematerials and energy sectors, while Sydney was characterized ashaving Australia’s ‘industry giants’ across a broader range of sectors.
13% of the total ASX-listed firms are in the energy sector (244 ofthe total 1849 companies); of these 4.5% were foreign firms (11 of244; or 0.6% of total firms). While the overall small proportion offoreign-listings on the ASX indicates the largely nation-based nat-ure of Australia’s energy sector, the large number of Asia–Pacificand Americas energy corporations (respectively 45 and 27% of totalenergy firms) listed on the ASX is hardly surprising givenAustralia’s position in world energy markets. These statistics pro-vide insight into the role Australia plays in what partially repre-sents bilateral energy security measures. An example of this isChinese interests in energy reserves with largely state-ownedmultinational energy and resource corporates posing perceivedeconomic risks in Australia (Wilson, 2011).
Table 1 ranks cities by their aggregate market capitalizationvalue of Platts top 100 and ASX-listed energy corporate headquar-ter locations. Its articulation of global energy capital investment

Fig. 1 (continued)
K. Martinus et al. / Geoforum 64 (2015) 78–89 83
decisions and resource allocation provides a simple measure ofmetropolitan status and power distribution for cities across theglobe. A cursory snapshot of headquarters locations within theenergy industry reveals the decidedly globalized geography of bothPlatts and ASX lists, reflecting economic power hierarchies of theenergy industry as well as idiosyncrasies in the distribution ofenergy sources. For example, Stavanger, Norway (metro pop.320,000) and Oklahoma City (metro pop. 1.3 million) are neitherglobal cities nor recognized centers of global economic power,yet due to their strong historical positions within respective pro-ductive oil regions they are found in the global energy network.
Although production of energy in Australia is fundamentally anon-urban activity, the vast majority of energy corporations arelocated in its largest cities, paralleling the distribution of industrymore broadly (Tonts and Taylor, 2013; Sigler, 2013a). The majorAustralian cities of Perth, Sydney Adelaide, Melbourne andBrisbane sit at the top of the ASX-derived energy hierarchy, withregional and extra-regional energy hubs such as Port Moresby,Singapore, Denver, and Beijing occupying strong complementaryroles. Smaller Australian metropolitan areas (Newcastle, Darwinand Gold Coast) also hold important positions. The majority of cor-porate headquarters are found in ten medium-sized Australiancities and six Asia–Pacific cities, with the rest in the US, Europe,Africa and ‘offshore’ tax havens. In contrast, the Platts-derived cityrank is more global, spread across 65 cities with the top elevencities having significantly higher concentrations of market capital-ization (all over $100bn). Top cities are Beijing, the two Texas citiesof Houston and Dallas, Moscow, London, The Hague, Calgary andParis – all either national capitals or major cities within productiveenergy regions. The rankings identify particular concentrations ofpower within the energy sector in the Americas, Western Europe,
and Asia, to some degree mirroring the global distribution of cor-porate power more broadly (see Beaverstock et al., 1999). Table 1reveals the geographic distribution of energy headquarters pro-vides a simple measure of metropolitan status and power for citiesacross the industry. The disparities between the cumulative mar-ket capitalization in some cities compared to others emphasizesthe uneven allocation and concentration of power of companiesacross the globe and, in the ASX case, the strategic alliance ofAustralia with other cities in the world.
6. Globalizing centers, regional sub-networks, and city Pairs
An SNA of the Platts and ASX derived directed matrices relays fur-ther information of the geographic and regional network character-istics of the energy sector by identifying strategic globalizing cities,regional sub-networks and their geographic dimensions. The fol-lowing subsections dissect both networks (Platts and ASX) fromthe three different analytical perspectives – rankings of cities, geo-graphic sub-groups and relational positioning of cities. The first usescentrality measures to benchmark the strategic position of cities,identifying inter-network nodes of connectivity at different scalesbetween the Platts and ASX derived networks. This informs the anal-ysis of the proceeding subsections which describes geographicsub-network regional geometries as well as key bilateral city-pairconnections.
6.1. Localized strategic network power of cities: Identifying inter-network nodes of connectivity
By any measure, both networks reveal a decidedly globalizedgeography, which is not unexpected given the characteristics of
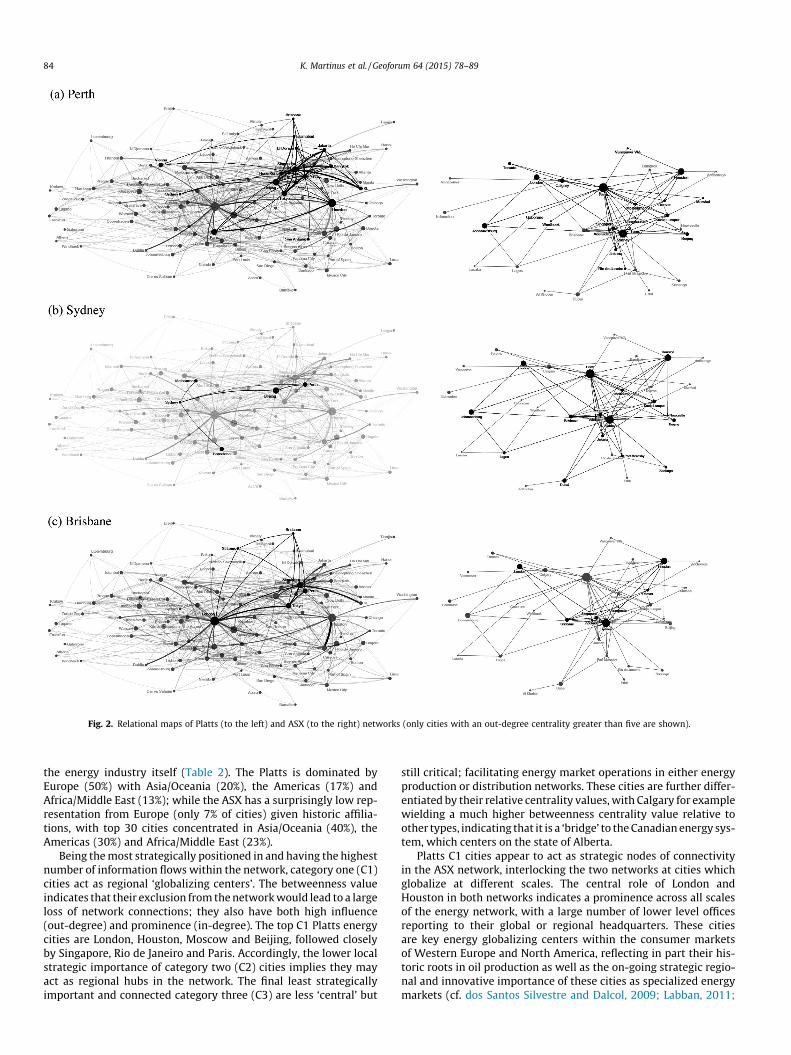
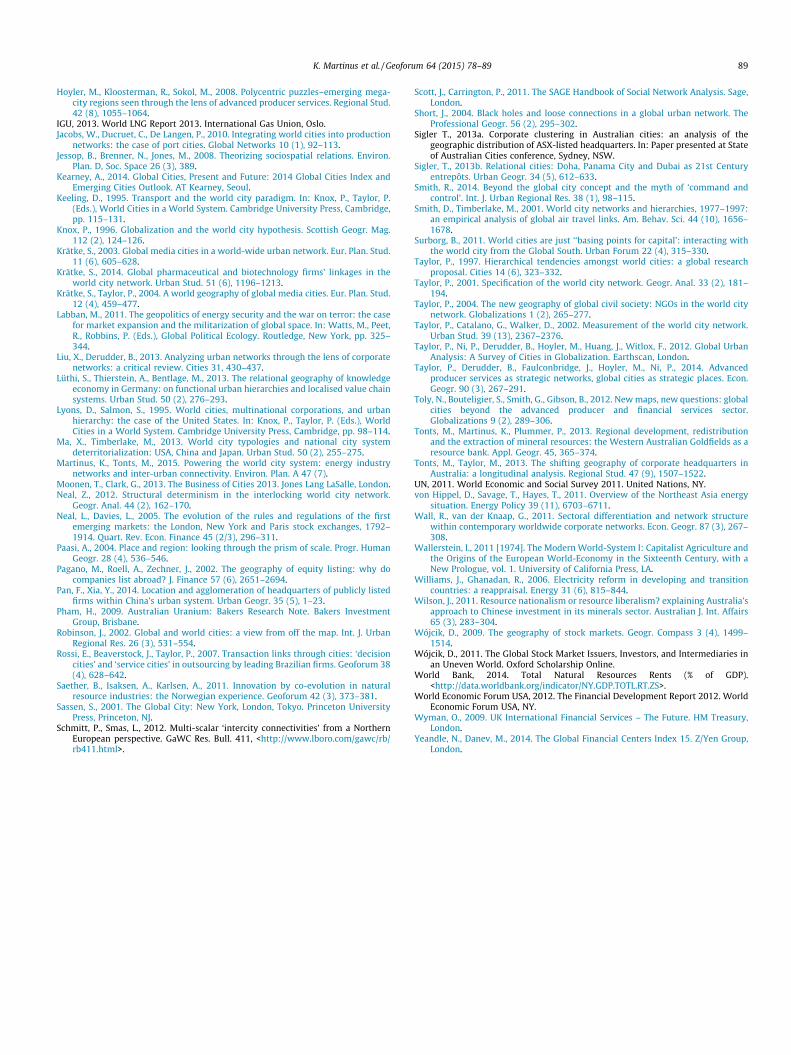
Fig. 2. Relational maps of Platts (to the left) and ASX (to the right) networks (only cities with an out-degree centrality greater than five are shown).
84 K. Martinus et al. / Geoforum 64 (2015) 78–89
the energy industry itself (Table 2). The Platts is dominated byEurope (50%) with Asia/Oceania (20%), the Americas (17%) andAfrica/Middle East (13%); while the ASX has a surprisingly low rep-resentation from Europe (only 7% of cities) given historic affilia-tions, with top 30 cities concentrated in Asia/Oceania (40%), theAmericas (30%) and Africa/Middle East (23%).
Being the most strategically positioned in and having the highestnumber of information flows within the network, category one (C1)cities act as regional ‘globalizing centers’. The betweenness valueindicates that their exclusion from the network would lead to a largeloss of network connections; they also have both high influence(out-degree) and prominence (in-degree). The top C1 Platts energycities are London, Houston, Moscow and Beijing, followed closelyby Singapore, Rio de Janeiro and Paris. Accordingly, the lower localstrategic importance of category two (C2) cities implies they mayact as regional hubs in the network. The final least strategicallyimportant and connected category three (C3) are less ‘central’ but
still critical; facilitating energy market operations in either energyproduction or distribution networks. These cities are further differ-entiated by their relative centrality values, with Calgary for examplewielding a much higher betweenness centrality value relative toother types, indicating that it is a ‘bridge’ to the Canadian energy sys-tem, which centers on the state of Alberta.
Platts C1 cities appear to act as strategic nodes of connectivityin the ASX network, interlocking the two networks at cities whichglobalize at different scales. The central role of London andHouston in both networks indicates a prominence across all scalesof the energy network, with a large number of lower level officesreporting to their global or regional headquarters. These citiesare key energy globalizing centers within the consumer marketsof Western Europe and North America, reflecting in part their his-toric roots in oil production as well as the on-going strategic regio-nal and innovative importance of these cities as specialized energymarkets (cf. dos Santos Silvestre and Dalcol, 2009; Labban, 2011;

Table 1City ranking by summed market capitalization of ASX and Platts list.
ASX energy headquarters (April 2014)a Platts energy corporations (March 2014)
Rank City No.HQs
Market cap($m)b
Rank City No.HQs
Market cap($bn)
Rank City No.HQs
Market cap($bn)
1 Perth 117 38,163 1 Beijing 5 530 34 Buenos Aires 1 292 Sydney 48 30,502 2 Houston 7 432 35 Johannesburg 1 293 Adelaide 7 14,530 3 Dallas 1 404 36 Madrid 1 264 Port Moresby 2 11,822 4 Moscow 6 280 37 Taipei 1 255 Melbourne 26 15.07 5 London 4 264 38 Vienna 1 256 Brisbane 21 1024 6 The Hague 1 209 39 Columbus, OH 1 247 Singapore 3 680 7 Calgary 6 201 40 Essen,
Germany1 23
8 Darwin 2 668 8 Paris 3 196 41 Hong Kong 1 229 Denver 2 498 9 Rio de Janeiro 2 118 42 Barcelona 1 20
10 Beijing 1 214 10 Bogota,Colombia
1 116 43 San Francisco 1 20
11 Gold Coast 2 163 11 Rome 2 113 44 San Diego 1 1912 Newcastle 1 161 12 Stavanger 1 77 45 Allentown, PA 1 1913 Chongqing 1 132 13 Los Angeles 1 63 46 Helsinki 1 1814 London 1 33 14 Charlotte, NC 1 51 47 Akron, OH 1 1815 Dallas 1 29 15 Dehradun, India 1 51 48 Newark 1 1716 Houston 1 18 16 Mumbai 1 46 49 Seoul 2 1717 Johannesburg 1 13 17 Tokyo 4 42 50 Prague 1 1618 Wellington 1 10 18 New York 2 42 51 Almetievsk 1 1519 Bermuda 1 5 19 Atlanta 1 41 52 Minneapolis 1 1420 Los Angeles 1 2 20 Oklahoma City 2 38 53 El Dorado, AR 1 1221 Mt Barker 1 2 21 Toronto 1 38 54 Jining, China 1 1222 Kuala
Lumpur1 0.37 22 Kolkata 1 37 55 Lisbon 1 12
23 Sugut, Russia 1 37 56 Baton Rouge,LA
1 11
24 New Delhi 2 36 57 Ufa, Russia 1 1125 Richmond, VA 1 34 58 Dallas 1 1126 San Antonio 2 33 59 Belo Horizonte 1 1127 Juno Beach, FL 1 33 60 Warsaw,
Poland1 11
28 Bangkok 1 32 61 Astana 1 829 Perth 1 31 62 Budapest 1 830 Tarko-sale,
Russia1 31 63 Plock, Poland 1 7
31 Findlay, OH 1 30 64 St Louis, MO 1 632 Chicago 1 30 65 Korfez, Turkey 1 433 Bilbao 1 29
a Companies listed on the stock exchange are continually changing. Data used in this paper is based on January 2014 corporate listings and April, 2014 market capital-ization. Some companies had delisted from and new ones listed on stock exchange from January 2014 causing a decrease in the decrease in total corporations used (244–242).Despite this decrease, there was an overall increase in the total level of capitalization between 2013 and 2014 (excluding these companies). The computation of marketcapitalization is used only as an indicator of economic concentration and structure within the Australian urban system. A change of companies does not significantly changethe overall analysis.
b Market cap is converted at $1AD = $0.934USD.
K. Martinus et al. / Geoforum 64 (2015) 78–89 85
Saether et al., 2011). Houston’s role as an energy center, specificallyfor oil, has emerged through sustained growth from the 1800s, pro-motion of entrepreneurial activity, and centrality to both the USASunbelt expansion and global oil markets (Feagin, 1985).Likewise, London’s role can be linked to its long intertwined his-tory of globalization, industrial development and securing of for-eign resources (including energy) for British economic andpolitical interests (Bunker and Ciccantell, 2005).
The remaining ASX C1 cities appear to globalize at a regionallevel. As the administrative, political and economic hub ofresource-rich Western Australia (Tonts et al., 2013), Perth is the onlyAustralian city to rank in the Platts network (C2), also sitting at theapex of the ASX network immediately above Sydney. The Perth–Sydney nexus evinces the strong and interwoven relationshipbetween energy and access to domestic capital, given Sydney’sprominence in global financial market markets in terms of inwardflows of capital and overall activity (World Economic Forum USA,2012; Wyman, 2009). Sydney’s ranking is also due to its locationfor headquarters of coal mining companies operating at some stagein the wider Sydney region, a major coal producing area for over200 years, though its importance in the Australian energy market
is not reflected in the Platts network. The ASX C1 position ofJohannesburg (Platts C3), Calgary and Dubai (both Platts C2) revealAustralia’s strong links to energy producing regions in Africa,North America and the Middle East, suggesting their respective rolesas regional globalizing centers. This aligns with research by Wyman(2009) and Yeandle and Danev (2014) who found these cities actedas specialized regional hubs in their respective regions.
Other Platts C1 cities, Beijing and Singapore appear as ASX C2cities along with Australian cities of Brisbane and the significantlylower ranked Melbourne, which plays a secondary financial role toSydney (see Yeandle and Danev, 2014). They appear to be keynodes of convergence, serving as strategic cities in theSinosphere and Southeast Asia, respectively. Rio de Janeiro (PlattsC1) is an ASX C3 city (along with Australian city of Adelaide), indi-cating its lower importance in the national network compared tothe global one. Key hubs in the European system (Platts C1),Moscow (with a concentration of foreign corporates and particularinterests in the supply of energy to Western Europe) and Paris (act-ing as energy conduit between Western Europe and Africa) do notappear in the top 30 ASX-derived cities indicating the lower signif-icance of Western Europe to the Australian-based network. The
Table 2Centrality measures of the Platts and ASX networks, top 30 cities ranked by betweenness centrality.
Rank Platts network ASX network
Node In-degree Out-degree Betweenness Node In-degree Out-degree Betweenness
Category 1 (C1)1 London 71 27 49,142 Perth 44 10 16,2582 Houston 59 27 36,087 Sydney 34 9 13,1093 Moscow 39 20 28,442 Houston 26 7 72164 Beijing 40 10 15,729 London 20 4 59235 Singapore 24 23 14,792 Johannesburg 17 6 55926 Rio de Janeiro 26 17 14,102 Calgary 4 3 40397 Paris 30 8 13,835 Dubai 9 3 3625
Category 2 (C2)8 Budapest 24 11 9022 Brisbane 13 4 27199 Calgary 19 13 8724 Kuala Lumpur 11 5 2315
10 Tokyo 28 7 8140 Beijing 9 4 221711 New Delhi 20 6 7073 Edmonton 6 1 219012 Randstad 23 8 6769 Singapore 10 5 215313 Dubai 16 13 6618 Toronto 4 2 146814 Perth 18 11 6616 Jakarta 6 5 140215 Vienna 19 5 5864 Lagos 6 1 134616 Warsaw 9 13 5205 Melbourne 9 3 1195
Category 3 (C3)17 Johannesburg 7 7 4811 Santiago 4 1 119318 Mexico City 10 10 4748 Port Moresby 6 3 117019 Madrid 17 6 4557 Denver 6 5 91820 Kuala Lumpur 10 7 4454 Rio de Janeiro 2 2 90521 Algiers 7 9 4402 Vancouver 2 1 73822 Cairo 14 11 4163 Newcastle 3 2 37023 Barcelona 17 3 4150 Al Khobar 1 1 37024 Brussels 12 12 3670 Portland OR 1 2 37025 Bilbao 18 1 3622 Erbil 1 1 37026 Bogota 13 11 3287 Mumbai 1 2 37027 Prague 10 7 3263 Bangkok 1 2 37028 Rome 19 4 3198 Adelaide 6 4 35229 Stavanger 13 7 3078 Gaborone 1 1 16730 Tripoli 8 11 2851 Windhoek 1 2 123
86 K. Martinus et al. / Geoforum 64 (2015) 78–89
regional nature of the ASX network is specified by the centralizedrole Perth assumes compared to its C2 (regional hub) position inthe Platts network, as well as the higher prominence of KualaLumpur (C2 in ASX list) compared to its C3 Platts position. Theremaining ASX cities are all absent from the top 30 Platts cities,portraying instead a high connectivity of the ASX network toAsia–Pacific’s regional energy market.
6.2. Network geographies: Key patterns of regionally orientedglobalizing centers
Fig. 13 illustrates network geographic patterns and networksub-groups. The complexity of the networks and number of citiesis the most obvious difference between the two networks with thePlatts generating a more global set of evenly distributed cities thanthe ASX, albeit focused on USA and Europe.
The identification of key cities that serve as globalizing centerswithin multi-scalar networks presents a particularistic energy sec-tor meta-geography of globally or regionally orientedsub-networks. In terms of the Platts regional sub-groups,Houston assumes a prominent global role as well as a regionalone for the Americas, with much of Latin America and theCaribbean reporting to it. London is equally important in thePlatts network acting as the control point for much of Europe.Networks of Moscow, as well as the secondary center of
3 Figs. 1 and 2 city node sizes indicative of betweenness centrality. Larger nodes(also more translucent in Fig. 1) signify cities with high overall strategic power inlocal networks. The thickness and darkness of city-pair connecting lines specifyoverall strength of information flows (in and out). Shapes and gray scale indicate‘groups’ or ‘regions’ determined by the community detection algorithm.
Budapest, are strongly associated with Europe being the conduitbetween consumption markets in Europe (East and West) and pro-duction markets in the former Eastern Bloc. Paris is strongly linkedto Africa, as well as pulling together much of the Francophoneworld with connections to Antananarivo (Madagascar), Libreville(Gabon), and Ouagadougou (Burkina Faso). Istanbul and Dubai‘book-end’ the Middle East, supporting the relational cities theory(Sigler, 2013b) that companies would more favorably conductbusiness in regional entrepôts rather than (often politically unsta-ble) large national capitals. The Asia–Pacific region is controlled bythe nodes of Singapore (as intermediary market), Tokyo and Beijing(both major consumption markets; though Tokyo’s networks arelargely similar to those in the Americas). A small but significantnetwork that emerged was that of tax-friendly jurisdictions,including Bermuda, Dublin, The Randstad (Amsterdam–Rotterdam–The Hague) and the Faroe Islands. Various Australian cities,mainly Perth, were found to report to a range of Asian, European,and/or American headquarters, despite being firmly associatedwith Asian cities.
In contrast, the ASX network is essentially regional with astrong Australian focus providing greater detail in how Australiancities form sub-regional networks connected to the rest of theglobe through specific city-pairs. Regional sub-networks emergingfrom the ASX network centered on each major Australian city (plusAuckland), but primarily focused on Perth, Sydney and Brisbane.London, Houston, Johannesburg, and Calgary formed secondarysub-networks in their respective regions, corroborating their roleas globalizing centers linking the Australian and global networks.
Identified as the most significant Australian city in the Plattsnetwork, Perth sits atop the ASX network followed by Sydney,Melbourne and Brisbane. Its high linkages to global energy centers
K. Martinus et al. / Geoforum 64 (2015) 78–89 87
of London and Houston means Perth acts as a conduit for large andconcentrated information flows between Australia and the keyregions of Europe and the USA. In addition, the Perthsub-network is the most globally distributed, having strong net-work similarities to East Asian cities (in Korea, China, Japan andPhilippines), Europe and Africa; with Australian connectionsmainly within the state of Western Australia (Mt Isa – a miningtown in northern Queensland – is the only exception).
6.3. Bilateral connections: City-pair analysis
A final measure of connectivity is articulated through city-pairs,which are the sum of the bilateral relations between two cities.From the Platts, the strongest city-pairs being Calgary–Houston,Kuala Lumpur–Singapore and Taipei–Singapore, with Singaporeand London respectively part of twelve and ten of the top 30city-pair reporting flows. These reflect strong ties within theNorth American, Southeast Asian, and Commonwealth-based net-works respectively. Within the ASX network, while Sydney hasmore total connectivity than Perth in the top 20 city-pairs, Perthis more strategically connected. Perth and Sydney play strong glob-alizing roles, and a large number of Australia–Asia city-pair con-nections reflect growing trade relations in energy between thetwo continents (Hay, 2009). Beijing’s dominance in China (asdemonstrated in both ASX and Platts networks) is unsurprisinggiven the introverted nature of the Chinese economy, withresearch noting that Beijing acts as a proxy for China and thatenergy is strongly tied to Chinese political objectives (Hay, 2009;Haberly, 2011; Pan and Xia, 2014). Beijing’s strong link to Sydneyindicates the importance of Australian energy resources. Thismay reflect Sydney’s significance from the 1940s as the adminis-trative center for the black coal industry (Daly, 1984), the largeexport of coal from New South Wales to China (69% of energy con-sumed in China is coal; EIA, 2014), proximity to more recent oil andgas reserves (Ball et al., 2014) as well as deep links between energyand capital markets with the ASX (in Sydney) acting as an entrypoint for foreign energy corporations to secure interest in andaccess to Australian resources and capital. Despite this, theSydney-centered sub-network demonstrates strong domestic con-nections, mostly outside of its own state (New South Wales) toneighboring Victoria (including Melbourne), Northern Territory(Darwin) and the sister nation of New Zealand. The Sydneysub-network is less globally connected, with some Africa citiesand East Timor (Dili) being the only connections outside ofAustralia and New Zealand.
Melbourne is also somewhat more connected than might beexpected based on the relatively small size of energy productionin the Australian state of Victoria, and perhaps reflective of its glo-bal importance to both overseas and domestic capital (see Yeandleand Danev, 2014). Indeed, two of Big Oil’s ‘seven sisters’ (Shell andBP) have Australian headquarters in Melbourne. Interestingly, net-work similarities between Port Moresby and Brisbane place thesecities as key players in the same sub-network of primarilyQueensland cities, as well as Adelaide (South Australia) and keycities in the North African–Middle East region. The strongBrisbane–Port Moresby link is significant when put in the contextof Australia’s large oil and gas interests held in the Pacific Islands,such as in East Timor and Papua New Guinea, the latter tradition-ally served by Brisbane as its main international supply center (cf.Anderson, 2003). Adelaide’s presence in this sub-network may alsoreflect associations with the oil and gas industry, with its Santosheadquarters administrating oil and gas exploration, productionand/or sales in the Middle East (such as its oil drilling activitiesin Egypt). The remaining ASX sub-networks reveal a combinationof national (e.g., within the United States, Canada, and South
Africa) and regional networks (e.g., Europe, the Middle East, andSouth/Southeast Asia).
The relative positions of the cities to each other in Fig. 2 high-light differences in the relational geographies of both networksfor Australia’s three key energy regions – Perth, Sydney andBrisbane. From the ASX network perspective, highly connectedPerth and Sydney link to all Platts C1 cities except for the moreEuropean network relevant cities of Moscow and Paris. Brisbaneis less central to the ASX network, linking to Platts C1 via onlyLondon, Houston and Singapore as regional entrepôts of the entireenergy market. The Platts C2 and C3 city-pair links to Perth andSydney demonstrated regional (Kuala Lumpur) or colonial alliances(Johannesburg), and in the case of Perth, only key regional energyhubs (Calgary and Dubai). This highlights the presence of key tiesof connectivity binding the two networks together in specificplaces generating particular patterns of regional orientation. Suchthat, Perth sits at the apex of the ASX network being the adminis-trative center for some of the largest energy developments in theAsia Pacific region, Sydney provides global access to capital as wellas historic ties to national coal reserves and Brisbane bridgesAustralian energy interests in the South Pacific sub-region.
From the Platts network perspective, Perth is found amidst theAsia–Pacific cohort alongside the regional hubs of Singapore andBeijing. Sydney, Australia’s largest city and a global city by manypopular measures (Kearney, 2014; Moonen and Clark, 2013), isonly minimally connected to Australian (through Perth andMelbourne, but not Brisbane) and European (Barcelona) energymarkets with strongest links to Asia (Beijing). This difference inthe networks suggests that while access to local capital throughSydney is highly apparent in the ASX network, but there is no par-ticular affinity to Sydney over another Australian city with capitalaccess possible through larger global financial centers (e.g., NewYork or London) in the Platts network.
Brisbane also presents differently in the two networks. Thelarge role of Brisbane companies in Australia’s energy export mar-ket identifies it as second in network strategic importance to Perthwithin the Platts network, albeit positioned as an outlier in theAsia–Pacific regional hub (see Fig. 2e). In contrast, the ASX networkshows Brisbane as having lower strategic importance than bothPerth and Sydney. It has strong alliances with consumption marketentry cities (London, Singapore) and other energy producingregions (Houston, Denver, Ulaanbaatar). This may largely be theresult of the global locational strategy of WorleyParsons (head-quartered in Brisbane), specializing in energy related expertiseand project management. As the only major Australian city notincluded in Perth’s ASX domestic connections, it appears to behighly sub-regional with a relational geography distinct from thatof Perth’s energy connections.
7. Conclusion
In an effort to advance methodological and theoretical under-standings of inter-urban connectivities, WCN research has lookedto engage a variety of spatial and economic means to articulatehow the contemporary world-system functions. This paperaddresses the dearth of multi-scalar analysis in understandinghow global, regional, and national processes unfold as disparateand monolithic systems, but rather as integrated dimensions ofconnectivity. This is specifically articulated by focusing on the roleof cities at multiple scales, drawing upon measures of connectivityas a means by which to unpack empirical evidence. By exploring onthe role of cities in global and national energy networks, the anal-ysis provides a critical platform to examine the processes of glob-alization manifesting across the national-regional-global paradigmas well as through nationally-led political and economic impera-tives. The focus on particular cities sharpens as regional
88 K. Martinus et al. / Geoforum 64 (2015) 78–89
sub-networks and significant city-pairs at various geographicscales come into play.
The geographical dimensions of the energy network reveal amulti-scalar structuration, with Australian cities (Sydney,Brisbane, Perth) drawing together national and regional networks(both within Australian states and linking to key cities); nationalenergy capitals mediating strongly ‘contained’ national systems(Moscow, Beijing, Rio de Janeiro); regional energy hubs providinga geographically specific focus (Dubai, Budapest, Paris); and global-izing centers linking the industry at multiple scales (London,Calgary, Houston). The large degree of regional orientation foundin both networks can be related to social, economic and geopoliti-cal drivers of the energy trade. In the Platts data, this was apparentin the broad continental associations found in the networks (i.e.,Europe, the Americas, Africa, and the Middle East), while the ASXnetwork fine-tunes this understanding by revealing sub-regionalalliances and strategies related to national energy interests. Forexample, the importance of Australia’s energy sector to neighbor-ing Asian-Pacific nations, particularly China through Beijing, aswell as the strategic coalitions centered on different Australiancities, such as the Brisbane–Port Moresby tie. This suggests thatcorporate strategies within the energy sector globalize by simulta-neously replicating historic and national interests. In addition, itportrays the high influence of geographies of consumption, finance,and production as the scale and scalability of corporate operationsplay an important part in shaping the global energy network.
In this paper, we hypothesize on the existence of strategicnodes of connectivity acting as globalizing centers at various regio-nal and sub-regional scales given their role in both networks. Thesecenters act as conduits of capital and information transfer betweenvarious scales based on their relationship to prominent consump-tion, production or capital markets. For example, Perth, Sydney,London and Houston link the global and Australian national net-work taking on various access-to-capital and proximity-to-producers/consumers functions. In this way, Perth and Brisbane link con-sumption and production in the respective East Asian and PacificIsland sub-regional networks. Sydney’s dual role as both a sourceof Australian capital and proximity to production sites forms inter-esting strong internalized sub-networks (with strong links acrossAustralia’s Eastern States and New Zealand) as well as globalizedcity-pairs to consumption markets through cities such as Beijing.
While the perspectives advanced in this paper are global inscope, they are not universally global in scale. Instead, it embodiesa scalar middle-ground to interpreting the globalizing role of citieswithin the urban system as well as the interlock between global,regional, and national networks where geopolitical and economicunderstandings underlie a meta-geographic inter-urban structure.Future research agendas must continue to investigate the scalardimensions and characteristics of urban networks as ‘global’ anal-yses are prone to overlook the subtleties of supra-national, regio-nal, and sub-regional networks.
References
ABS, 2012. Year Book Australia, 2012. Cat. No. 1301. Australian Bureau of Statistics,Canberra.
ABS, 2013. Information Paper: Towards the Australian Environmental-EconomicAccounts. 2103. Cat. No. 4655.0.55.002. Australian Bureau of Statistics,Canberra.
Acuto, M., 2011. Finding the global city: an analytical journey through the ‘invisiblecollege’. Urban Stud. 48 (14), 2953–2973.
Agnew, J., 1994. The territorial trap: the geographic assumptions of internationalrelations theory. Rev. Int. Political Econ. 1 (1), 53–80.
Alderson, A., Beckfield, J., 2004. Power and position in the world city system. Am. J.Sociol. 109 (4), 811–851.
Anderson, T., 2003. Aid, trade and oil: Australia’s second betrayal of East Timor. J.Australian Political Econ. 52, 113–127.
Ball, A., Bernie, K., Feng, A., McCluskey, C., Stanwix, G., Willcock, T., Wokker, N.,2014. Energy in Australia 2014. Commonwealth of Australia, Canberra.
Bassens, D., van Meeteren, M., 2014. World cities under conditions of financializedglobalization: towards an augmented world city hypothesis. Progr. HumanGeogr. http://dx.doi.org/10.1177/0309132514558441.
Bassens, D., Derudder, B., Witlox, F., 2010. Searching for the Mecca offinance: Islamic financial services and the world city network. Area 42(1), 35–46.
Beaverstock, J., Smith, R., Taylor, P., 1999. A roster of world cities. Cities 16 (6), 445–458.
Beaverstock, J., Smith, R., Taylor, P., 2000. World-city network: a newmetageography? Ann. Assoc. Am. Geogr. 90 (1), 123–134.
Beckfield, J., Alderson, A., 2006. Reply: whither the parallel paths? the future ofscholarship on the world city system. Am. J. Sociol. 112 (3), 895–904.
Berry, B., Garrison, W., 1958. The functional bases of the central place hierarchy.Econ. Geogr. 34 (2), 145–154.
Brenner, N., 1999. Globalization as reterritorialization: the re-scaling of urbangovernance in the European Union. Urban Stud. 36 (3), 431–451.
Brumberg, D., Ahram, A., 2007. The National Iranian Oil Company in Iranian Politics.Rice University, Houston.
Bunker, S., Ciccantell, P., 2005. Globalization and the Race for Resources. JHU Press,Baltimore.
Bunnell, T., 2013. City networks as alternative geographies of Southeast Asia.TRaNS: Trans-Reg.-Natl. Stud. Southeast Asia 1 (1), 27–43.
Cabalu, H., 2010. Indicators of security of natural gas supply in Asia. Energy Policy38 (1), 218–225.
Carroll, W., 2007. Global cities in the global corporate network. Environ. Plan. A 39(10), 2297–2323.
Castells, M., 2011 [1996]. The Rise of the Network Society: The Information Age:Economy, Society, and Culture, vol. 1. John Wiley and Sons, NY.
Che, N., Feng, A., McCluskey, C., Pham, P., Willcock, T., Stanwix, G., 2013. 2013Australian Energy Update. BREE, Canberra.
Choi, J., Barnett, G., Chon, B., 2006. Comparing world city networks: a networkanalysis of Internet backbone and air transport intercity linkages. GlobalNetworks 6 (1), 81–99.
Christaller, W., 1933. Die Zentralen Orte in Süddeutschland: Eine Ökonomisch-Geographische Untersuchung über die Gesetzmässigkeit der Verbreitung undEntwicklung der Siedlungen mit Städtischen Funktionen. University Microfilms,Ann Arbor.
Clauset, A., Newman, M., Moore, C., 2004. Finding community structures in verylarge networks. Phys. Rev. E 70 (066111).
Coe, N., Hess, M., Yeung, H., Dicken, P., Henderson, J., 2004. ‘Globalizing’ regionaldevelopment: a global production network perspective. Trans. Inst. BritishGeogr. 29 (4), 468–484.
Daly, M., 1984. The revolution in international capital markets: urban growth andAustralian cities. Environ. Plan. A 16 (8), 1003–1020.
Derudder, B., Taylor, P., 2005. The cliquishness of world cities. Global Networks 5(1), 71–91.
Derudder, B., Witlox, F., 2004. Assessing central places in a global age: on thenetworked localization strategies of advanced producer services. J. RetailingConsumer Serv. 11 (3), 171–180.
Dicken, P., Malmberg, A., 2001. Firms in territories: a relational perspective. Econ.Geogr. 77 (4), 345–363.
Dicken, P., Kelly, P., Olds, K., Yeung, H., 2001. Chains and networks, territories andscales: towards a relational framework for analyzing the global economy.Global Networks 1 (2), 89–112.
dos Santos Silvestre, B., Dalcol, P.R.T., 2009. Geographical proximity and innovation:evidences for the Campos Basin oil and gas industrial agglomeration – Brazil.Technovation 29 (8), 546–561.
EIA, 2013. International Energy Information Outlook 2013. US Energy InformationAdministration, Washington DC.
EIA, 2014. Country Briefs. <http://www.eia.gov/countries/#cabs>.Falk, J., Settle, D., 2011. Australia: approaching an energy crossroads. Energy Policy
39 (11), 6804–6813.Feagin, J., 1985. The global context of metropolitan growth: Houston and the oil
industry. Am. J. Sociol. 90 (6), 1204–1230.Felsenstein, D., Schamp, E., Shachar, A., 2002. Emerging Nodes in the Global
Economy: Frankfurt and Tel Aviv Compared. Kluwer Academic Publishers,Dordrecht.
Friedmann, J., 1986. The world city hypothesis. Develop. Change 17 (1), 16–89.Fruchterman, T., Reingold, E., 1991. Graph drawing by force-directed placement.
Software: Practice Exp. 21 (11), 1129–1164.Godfrey, B., Zhou, Y., 1999. Ranking world cities: multinational corporations and the
global urban hierarchy. Urban Geogr. 20 (3), 268–281.Good, P., Derudder, B., Witlox, F., 2011. The regionalization of Africa: delineating
Africa’s subregions using airline data. J. Geogr. 110 (5), 179–190.Haberly, D., 2011. Strategic sovereign wealth fund investment and the new alliance
capitalism: a network mapping investigation. Environ. Plan. A 43 (8), 1833–1852.
Harris, J., 2012. Outward bound: transnational capitalism in China. Race Class 54(1), 13–32.
Hay, J., 2009. Challenges to liberalism: the case of Australian energy policy. Resour.Policy 34 (3), 142–149.
Hennemann, S., Derudder, B., 2014. An alternative approach to the calculation andanalysis of connectivity in the world city network. Environ. Plan. B 41 (3), 392–412.
Hoyler, M., Watson, A., 2013. Global media cities in transnational media networks.Tijdschrift voor Economische en Sociale Geografie 104 (1), 90–108.
K. Martinus et al. / Geoforum 64 (2015) 78–89 89
Hoyler, M., Kloosterman, R., Sokol, M., 2008. Polycentric puzzles–emerging mega-city regions seen through the lens of advanced producer services. Regional Stud.42 (8), 1055–1064.
IGU, 2013. World LNG Report 2013. International Gas Union, Oslo.Jacobs, W., Ducruet, C., De Langen, P., 2010. Integrating world cities into production
networks: the case of port cities. Global Networks 10 (1), 92–113.Jessop, B., Brenner, N., Jones, M., 2008. Theorizing sociospatial relations. Environ.
Plan. D, Soc. Space 26 (3), 389.Kearney, A., 2014. Global Cities, Present and Future: 2014 Global Cities Index and
Emerging Cities Outlook. AT Kearney, Seoul.Keeling, D., 1995. Transport and the world city paradigm. In: Knox, P., Taylor, P.
(Eds.), World Cities in a World System. Cambridge University Press, Cambridge,pp. 115–131.
Knox, P., 1996. Globalization and the world city hypothesis. Scottish Geogr. Mag.112 (2), 124–126.
Krätke, S., 2003. Global media cities in a world-wide urban network. Eur. Plan. Stud.11 (6), 605–628.
Krätke, S., 2014. Global pharmaceutical and biotechnology firms’ linkages in theworld city network. Urban Stud. 51 (6), 1196–1213.
Krätke, S., Taylor, P., 2004. A world geography of global media cities. Eur. Plan. Stud.12 (4), 459–477.
Labban, M., 2011. The geopolitics of energy security and the war on terror: the casefor market expansion and the militarization of global space. In: Watts, M., Peet,R., Robbins, P. (Eds.), Global Political Ecology. Routledge, New York, pp. 325–344.
Liu, X., Derudder, B., 2013. Analyzing urban networks through the lens of corporatenetworks: a critical review. Cities 31, 430–437.
Lüthi, S., Thierstein, A., Bentlage, M., 2013. The relational geography of knowledgeeconomy in Germany: on functional urban hierarchies and localised value chainsystems. Urban Stud. 50 (2), 276–293.
Lyons, D., Salmon, S., 1995. World cities, multinational corporations, and urbanhierarchy: the case of the United States. In: Knox, P., Taylor, P. (Eds.), WorldCities in a World System. Cambridge University Press, Cambridge, pp. 98–114.
Ma, X., Timberlake, M., 2013. World city typologies and national city systemdeterritorialization: USA, China and Japan. Urban Stud. 50 (2), 255–275.
Martinus, K., Tonts, M., 2015. Powering the world city system: energy industrynetworks and inter-urban connectivity. Environ. Plan. A 47 (7).
Moonen, T., Clark, G., 2013. The Business of Cities 2013. Jones Lang LaSalle, London.Neal, Z., 2012. Structural determinism in the interlocking world city network.
Geogr. Anal. 44 (2), 162–170.Neal, L., Davies, L., 2005. The evolution of the rules and regulations of the first
emerging markets: the London, New York and Paris stock exchanges, 1792–1914. Quart. Rev. Econ. Finance 45 (2/3), 296–311.
Paasi, A., 2004. Place and region: looking through the prism of scale. Progr. HumanGeogr. 28 (4), 536–546.
Pagano, M., Roell, A., Zechner, J., 2002. The geography of equity listing: why docompanies list abroad? J. Finance 57 (6), 2651–2694.
Pan, F., Xia, Y., 2014. Location and agglomeration of headquarters of publicly listedfirms within China’s urban system. Urban Geogr. 35 (5), 1–23.
Pham, H., 2009. Australian Uranium: Bakers Research Note. Bakers InvestmentGroup, Brisbane.
Robinson, J., 2002. Global and world cities: a view from off the map. Int. J. UrbanRegional Res. 26 (3), 531–554.
Rossi, E., Beaverstock, J., Taylor, P., 2007. Transaction links through cities: ‘decisioncities’ and ‘service cities’ in outsourcing by leading Brazilian firms. Geoforum 38(4), 628–642.
Saether, B., Isaksen, A., Karlsen, A., 2011. Innovation by co-evolution in naturalresource industries: the Norwegian experience. Geoforum 42 (3), 373–381.
Sassen, S., 2001. The Global City: New York, London, Tokyo. Princeton UniversityPress, Princeton, NJ.
Schmitt, P., Smas, L., 2012. Multi-scalar ‘intercity connectivities’ from a NorthernEuropean perspective. GaWC Res. Bull. 411, <http://www.lboro.com/gawc/rb/rb411.html>.
Scott, J., Carrington, P., 2011. The SAGE Handbook of Social Network Analysis. Sage,London.
Short, J., 2004. Black holes and loose connections in a global urban network. TheProfessional Geogr. 56 (2), 295–302.
Sigler T., 2013a. Corporate clustering in Australian cities: an analysis of thegeographic distribution of ASX-listed headquarters. In: Paper presented at Stateof Australian Cities conference, Sydney, NSW.
Sigler, T., 2013b. Relational cities: Doha, Panama City and Dubai as 21st Centuryentrepôts. Urban Geogr. 34 (5), 612–633.
Smith, R., 2014. Beyond the global city concept and the myth of ‘command andcontrol’. Int. J. Urban Regional Res. 38 (1), 98–115.
Smith, D., Timberlake, M., 2001. World city networks and hierarchies, 1977–1997:an empirical analysis of global air travel links. Am. Behav. Sci. 44 (10), 1656–1678.
Surborg, B., 2011. World cities are just ‘‘basing points for capital’: interacting withthe world city from the Global South. Urban Forum 22 (4), 315–330.
Taylor, P., 1997. Hierarchical tendencies amongst world cities: a global researchproposal. Cities 14 (6), 323–332.
Taylor, P., 2001. Specification of the world city network. Geogr. Anal. 33 (2), 181–194.
Taylor, P., 2004. The new geography of global civil society: NGOs in the world citynetwork. Globalizations 1 (2), 265–277.
Taylor, P., Catalano, G., Walker, D., 2002. Measurement of the world city network.Urban Stud. 39 (13), 2367–2376.
Taylor, P., Ni, P., Derudder, B., Hoyler, M., Huang, J., Witlox, F., 2012. Global UrbanAnalysis: A Survey of Cities in Globalization. Earthscan, London.
Taylor, P., Derudder, B., Faulconbridge, J., Hoyler, M., Ni, P., 2014. Advancedproducer services as strategic networks, global cities as strategic places. Econ.Geogr. 90 (3), 267–291.
Toly, N., Bouteligier, S., Smith, G., Gibson, B., 2012. New maps, new questions: globalcities beyond the advanced producer and financial services sector.Globalizations 9 (2), 289–306.
Tonts, M., Martinus, K., Plummer, P., 2013. Regional development, redistributionand the extraction of mineral resources: the Western Australian Goldfields as aresource bank. Appl. Geogr. 45, 365–374.
Tonts, M., Taylor, M., 2013. The shifting geography of corporate headquarters inAustralia: a longitudinal analysis. Regional Stud. 47 (9), 1507–1522.
UN, 2011. World Economic and Social Survey 2011. United Nations, NY.von Hippel, D., Savage, T., Hayes, T., 2011. Overview of the Northeast Asia energy
situation. Energy Policy 39 (11), 6703–6711.Wall, R., van der Knaap, G., 2011. Sectoral differentiation and network structure
within contemporary worldwide corporate networks. Econ. Geogr. 87 (3), 267–308.
Wallerstein, I., 2011 [1974]. The Modern World-System I: Capitalist Agriculture andthe Origins of the European World-Economy in the Sixteenth Century, with aNew Prologue, vol. 1. University of California Press, LA.
Williams, J., Ghanadan, R., 2006. Electricity reform in developing and transitioncountries: a reappraisal. Energy 31 (6), 815–844.
Wilson, J., 2011. Resource nationalism or resource liberalism? explaining Australia’sapproach to Chinese investment in its minerals sector. Australian J. Int. Affairs65 (3), 283–304.
Wójcik, D., 2009. The geography of stock markets. Geogr. Compass 3 (4), 1499–1514.
Wójcik, D., 2011. The Global Stock Market Issuers, Investors, and Intermediaries inan Uneven World. Oxford Scholarship Online.
World Bank, 2014. Total Natural Resources Rents (% of GDP).<http://data.worldbank.org/indicator/NY.GDP.TOTL.RT.ZS>.
World Economic Forum USA, 2012. The Financial Development Report 2012. WorldEconomic Forum USA, NY.
Wyman, O., 2009. UK International Financial Services – The Future. HM Treasury,London.
Yeandle, N., Danev, M., 2014. The Global Financial Centers Index 15. Z/Yen Group,London.