
Stott, T. A. (1997) A Comparison of Stream Bank Erosion Processes on Forested and Moorland Streams...
17
EARTH SURFACE PROCESSES AND LANDFORMS, VOL 22, 383–399 (1997) CCC 0197-9337/97/040383–17 $17.50 1997 by John Wiley & Sons, Ltd. A COMPARISON OF STREAM BANK EROSION PROCESSES ON FORESTED AND MOORLAND STREAMS IN THE BALQUHIDDER CATCHMENTS, CENTRAL SCOTLAND TIM STOTT School of Education and Community Studies, Liverpool John Moores University, I. M. Marsh Campus, Barkhill Road, Liverpool, L17 6BD, U.K. Received 22 May 1995; Revised 27 February 1996; Accepted 15 April 1996 ABSTRACT Stream bank erosion rates measured over a two-year period on a moorland and a forested stream in the Institute of Hydrology’s Balquhidder Paired Catchments in central Scotland were compared. Bank erosion rates are generally higher on the mainstream of the moorland catchment and highest in winter on both streams. Bank erosion is correlated with the incidence of frost: minimum temperatures measured on stream banks of the forested stream were an average of 3·7°C higher than on stream banks both outside the forest and on the moorland stream. This makes the incidence of frost on forested stream banks half as frequent. Volumes of material eroded from the mainstreams were combined with bulk density measurements and it is estimated that erosion of the mainstream banks is contributing 1·5 and 7·3 per cent of the sediment yield of the forested and moorland catchments, respectively. Analysis of the vertical distribution of erosion on the banks of both streams suggests an undercutting mechanism which is more pronounced in the moorland stream. The influence of trees on bank erosion and possible implications for the management of forest streams are discussed. 1997 by John Wiley & Sons, Ltd. Earth surf. processes landf., 22, 383–399 (1997) No. of figures: 8 No. of tables: 8 No. of refs: 75 KEY WORDS stream bank erosion; forest; frosts; uplands; minimum temperatures; sediment yield; Scotland INTRODUCTION Land use change by afforestation has been the largest single type of such change in modern Britain, and reached a peak rate of 40000 ha ya -1 in the early 1970s (Robinson and Blyth, 1982). Until contradictory evidence began to emerge in the 1950s (Law, 1956) it was presumed that forestry was complementary to water supply interests, providing protection against pollution and soil erosion (Cuthbertson, 1948). Law’s (1956) findings demonstrated, in financial terms, the ‘cost’ of forestry to water suppy interests. Further adverse impacts of afforestation on water resources began to be demonstrated in the 1970s and 1980s when investigations reported increased suspended sediment concentrations (Austin and Brown, 1982; Burt et al., 1984; Painter et al., 1974; Stretton, 1984), increased bed load transport (Newson, 1980a) and higher rates of channel bank erosion (Murgatroyd and Ternan, 1983). Moffat (1988) and Soutar (1989) have reviewed the effects of British forestry on soil erosion, and Table I summarizes the main British studies which have investigated the effects of afforestation on sediment yields. The factors controlling stream bank erosion have attracted attention from geomorphologists, hydrologists and river engineers for several decades. In some landscapes, bank erosion may be an important, if not the dominant process in terms of its contribution to river sediment loads. Investigations in southwest Scotland, for example, revealed that 93 per cent of the total sediment removed from the Water of Deugh, a mountain grassland drainage basin, resulted from erosion of river bluffs (Kirkby, 1967). Though upland streams have received a great deal of attention from fluvial geomorphologists in the past two decades (Carling and Reader, 1982; Ferguson and Stott, 1987; Stott et al., 1986; Werritty, 1984), direct measurements of stream bank erosion Contract grant sponsor: Natural Environment Research Council
Transcript of Stott, T. A. (1997) A Comparison of Stream Bank Erosion Processes on Forested and Moorland Streams...

EARTH SURFACE PROCESSES AND LANDFORMS, VOL 22, 383–399 (1997)
CCC 0197-9337/97/040383–17 $17.50 1997 by John Wiley & Sons, Ltd.
A COMPARISON OF STREAM BANK EROSION PROCESSES ONFORESTED AND MOORLAND STREAMS IN THE BALQUHIDDER
CATCHMENTS, CENTRAL SCOTLAND
TIM STOTT
School of Education and Community Studies, Liverpool John Moores University, I. M. Marsh Campus, Barkhill Road,Liverpool, L17 6BD, U.K.
Received 22 May 1995; Revised 27 February 1996; Accepted 15 April 1996
ABSTRACT
Stream bank erosion rates measured over a two-year period on a moorland and a forested stream in the Institute ofHydrology’s Balquhidder Paired Catchments in central Scotland were compared. Bank erosion rates are generally higheron the mainstream of the moorland catchment and highest in winter on both streams. Bank erosion is correlated with theincidence of frost: minimum temperatures measured on stream banks of the forested stream were an average of 3·7°Chigher than on stream banks both outside the forest and on the moorland stream. This makes the incidence of frost onforested stream banks half as frequent. Volumes of material eroded from the mainstreams were combined with bulk densitymeasurements and it is estimated that erosion of the mainstream banks is contributing 1·5 and 7·3 per cent of the sedimentyield of the forested and moorland catchments, respectively. Analysis of the vertical distribution of erosion on the banks ofboth streams suggests an undercutting mechanism which is more pronounced in the moorland stream. The influence oftrees on bank erosion and possible implications for the management of forest streams are discussed. 1997 by John Wiley& Sons, Ltd.
Earth surf. processes landf., 22, 383–399 (1997)No. of figures: 8 No. of tables: 8 No. of refs: 75KEY WORDS stream bank erosion; forest; frosts; uplands; minimum temperatures; sediment yield; Scotland
INTRODUCTION
Land use change by afforestation has been the largest single type of such change in modern Britain, and reacheda peak rate of 40000ha ya−1 in the early 1970s (Robinson and Blyth, 1982). Until contradictory evidence beganto emerge in the 1950s (Law, 1956) it was presumed that forestry was complementary to water supply interests,providing protection against pollution and soil erosion (Cuthbertson, 1948). Law’s (1956) findingsdemonstrated, in financial terms, the ‘cost’ of forestry to water suppy interests. Further adverse impacts ofafforestation on water resources began to be demonstrated in the 1970s and 1980s when investigations reportedincreased suspended sediment concentrations (Austin and Brown, 1982; Burt et al., 1984; Painter et al., 1974;Stretton, 1984), increased bed load transport (Newson, 1980a) and higher rates of channel bank erosion(Murgatroyd and Ternan, 1983). Moffat (1988) and Soutar (1989) have reviewed the effects of British forestryon soil erosion, and Table I summarizes the main British studies which have investigated the effects ofafforestation on sediment yields.
The factors controlling stream bank erosion have attracted attention from geomorphologists, hydrologistsand river engineers for several decades. In some landscapes, bank erosion may be an important, if not thedominant process in terms of its contribution to river sediment loads. Investigations in southwest Scotland, forexample, revealed that 93 per cent of the total sediment removed from the Water of Deugh, a mountaingrassland drainage basin, resulted from erosion of river bluffs (Kirkby, 1967). Though upland streams havereceived a great deal of attention from fluvial geomorphologists in the past two decades (Carling and Reader,1982; Ferguson and Stott, 1987; Stott et al., 1986; Werritty, 1984), direct measurements of stream bank erosion
Contract grant sponsor: Natural Environment Research Council

384 T. STOTT
Table I. British studies of the effects of afforestation on sediment yields
Catchment Report Area(km2)
Land use Years of data Yield (t km−2 a−1)
Suspendedsediment
Bedload
Southern UplandsCoalburn Robinson and
Blyth (1982)3·1 moorland
ploughingplanted
1·50·254
32513
NANANA
YorkshireHades Clough Burt et al (1984) 0·2 moorland
ditched0·51·5
not quoted but greatly increased
Plynlimon, mid-WalesCyffTanllwyth
Moore and Newson(1986)
3·10·98
pasturemature forest
1212
6·111·8
6·438·4
Lake Vyrnwy, mid-WalesMarchnant Newson (1980a) mature forest
+10yrs of harvestingNA 113
Balquhidder, central ScotlandMonachyleandKirkton
Stott et al. (1986)Johnson (1988,1993)
7·76·85
moorlandploughingmature forestfelling
4488
43·8137·148·2409·2
0·30·42·22·5
Plynlimon, mid-WalesHafren Leeks and Roberts
(1987)3·67 mature forest 35·2 NA
Llanbrynmair Moors, mid-WalesCeunant Ddu(Catchment A)Nant Ysguthan(Catchment B)
Francis and Taylor(1989)Francis and Taylor(1989)
0·340·14
unforestedploughedunforestedploughed
0·7510·75
3·79·01·13·1
NANANANA
Loch Ard, central Scotland(Catchment 10) Ferguson et al
(1991)0·84 mature forest
clearfellingpost-clearfelling
120·25
55·289·698·4
NANANA
Plynlimon, mid-WalesHore Leeks (1992) 3·08 mature forest
felling21
24·457·1
11·8(×5)
NA=data not available, i.e. not measured or reported.
in upland streams have been relatively uncommon (Blacknell, 1981). This study is a contribution to ourunderstanding of stream bank erosion processes in upland streams which have been subject to land use changeby forestry.
This study aims to (i) compare stream bank erosion rates of a typical mountain moorland stream with asimilar afforested stream, (ii) to investigate the temporal and spatial variations in stream bank erosion rates, and(iii) to assess the importance of stream flow and frost in controlling erosion rates.
STUDY AREA
The streams selected for this study are in the upper Monachyle and Kirkton Glens in the Southern Highlands ofScotland and form part of the Balquhidder Catchments Experiment (Figure 1). This 10 year experiment, fundedby a consortium of interested organizations, was instrumented and intensively monitored during the 1980s bythe Institute of Hydrology (IH). The study formed an extension of previous water balance studies, such as the

385STREAM BANK EROSION
Figure 1. Location map showing the Balquhidder catchments, central Scotland
Plynlimon Catchments Experiment (mid-Wales), into the Scottish Highlands where both climate (see Johnson,1985), vegetation and topography differed greatly from previous studies. The hydrological results of the long-term experiment are reported in a special issue of the Journal of Hydrology Vol. 145, 1993, while Stott et al.(1986) and Johnson (1988, 1993) have reported on the sedimentological investigations which are summarized inTable I. The characteristics of the catchments are given in Table II.
Mean annual precipitation totals (1983–1989) are 2798mm in Monachyle and 2372mm in Kirkton. Winterprecipitation contains significant amounts of snow and there are, on average, 185 days each year when somesnow is lying on the hills. At a low altitude weather station (Tulloch Farm, 135m above ordnance datum) theaverage number of days with ground frosts is 141 (Johnson, 1985). Both streams flow approximately north–south in steep sided, previously glaciated valleys with similar catchment areas, height ranges and topography.Mean slope angles estimated from 1:10000 topographic maps are 22°, though rock outcrops are common andthere are vertical cliffs on parts of the valley sides. In both catchments, shallow peats, peaty gleys and uplandbrown earths overlie Dalradian mica schists. Both streams flow through areas of peat and glacial till andsamples of bank material analysed for their grain size distribution showed that material was predominantly finegrained with 72 and 93 per cent finer than 2mm in the forest and moorland streams, respectively. Although thereare local variations in stream bank material, no attempt was made to quantify or compare any differences. Thetwo streams flow in similar highland glens with similar relief, soils and climate but with different land uses

386 T. STOTT
Table II. Balquhidder catchment characteristics
Catchment name Monachyle Kirkton
Area (km2) 7·70 6·85Forest cover (%) 0 40Relief (m) 594 552Average altitude (m) 607 576Stream flow characteristics (1983–1985)
Peak discharge (m3s−1)Mean discharge (m3s−1)
15·730·51
11·330·40
Length of mainstreamchannel studied (km)per cent of mainstream afforested
5·00
2·2100
(planation forestry and moorland) and so it was felt that a comparison of erosion rates on the two streams overthe same time period would be fair comparison.
In Monachyle Glen, upland grasses (Molinia caerulea, Agrostis setacea) dominate the riparian vegetationbut these give way to bracken (Pteridium aquilinum) and then heather (Calluna vulgaris) as altitude increases.The lower part of Kirkton Glen was afforested in the 1930s and the section of the Kirkton stream studied waslined with mature Sitka spruce (Picea sitchenis) planted next to and overhanging the stream along most of itscourse.
MEASUREMENT METHODS
Studies elsewhere have shown that channel banks can be a significant source of sediment in a catchment system(Coldwell, 1957; Dietrich and Dunne, 1978), and numerous previous studies have employed erosion pins tomeasure both slope erosion (Haigh, 1977) and channel bank erosion (Cummins and Potter, 1972; Harvey, 1974;Hill, 1973; Hooke, 1979, 1980; Knighton, 1973; Leopold et al., 1966; Lawler, 1984, 1986; Lewin and Brindle,1977; McGreal and Gardiner, 1977; Murgatroyd and Ternanm 1983; Wolman, 1959). Lawler (1978, 1993a) hasreviewed the use of erosion pins and other methods of measuring river bank erosion and made some cautionarycomments on the use of erosion pins. Recent developments in river bank erosion monitoring using aphotoelectric erosion pin (Lawler, 1991) vastly increase the temporal resolution of measurements.Nevertheless, the principle of the erosion pin is still employed and is a well tried and tested technique.
In this study, 5mm diameter galvanized fencing wire was used to make erosion pins. The wire was cut into0·3–0·4m lengths, pointed at one end and bent through 90° at the other. This helped to make the installationeasier (the pins could be pushed into the bank using the palm of the hand) and subsequent measurements taken1–2cm away from the pin (Figure 2a) since Lawler (1978) noted increased scour in the immediate vicinity oferosion pins and the formation of ‘pin craters’ (Lawler, 1993). Each pin was then pushed into the stream bankperpendicular to the eroding surface until between 20 and 50mm was protruding. The amount of protrusion wasthen measured (see Figure 2) with a ruler and subsequent recession of the bank at that point was calculated fromlater measurements of the length of exposed pin. Large numbers of pins were installed over considerablelengths of stream bank in order to take account of the spatial variability of erosion rather than to gain a moredetailed insight into temporal variations as studied elsewhere (Hooke, 1979; Lawler, 1986, 1991). A systematicsampling design was chosen in an attempt to obtain adequate spatial representation of erosion along a 5·5kmsection of the Monachyle Glen (moorland) mainstream and 2·2km section of the Kirkton Glen (forested)mainstream. Pins were installed in banks in vertical lines from low water level to the top of the bank with a 0·1mspacing. Thus, variable numbers of pins were used at each site depending on the height of the bank. A yellowpainted and numbered wooden peg was placed on the bank approximately 1m from the top of the line of pins asa marker (see Figure 2b). Verticals of pins were installed at approximately 50m intervals on whichever bankshowed most evidence of erosion. The Monachyle mainstream extends for 5·5km from the IH gauging station

387STREAM BANK EROSION
Figure 2. Installation of erosion pins in stream banks at Balquhidder: (a) the curved erosion pin perpendicular to the eroding bank surface,L is the length of pin protruding; (b) the vertical line of pins and marker peg at each site. Sites are spaced approximately 50m apart
(Figure 1). After 4km, IH have installed a second Crump weir, the upper Monachyle weir, and the upper part ofthe catchment above this becomes a flatter peaty plateau (see Figure 1). Erosion pins were installed in verticalsat a total of 62 sites (13 in the upper catchment). This made a total of 304 pins. The Kirkton mainstream extendedfor only 2·2km above the IH gauging station. Pins were therefore only installed at 29 sites on the Kirkton stream(a total of 126 pins). Protrusion of pins was measured at the time of installation (September 1984) and at three-monthly intervals for two years (nine surveys in all giving c. 3800 individual pin measurements during the studyperiod). Where significant amounts of erosion had occurred, pins were reset after measurement (i.e. pushedback into the bank).
At the outset of the project (autumn 1984), 11 maximum/minimum mercury thermometers were fixed ontostream banks (by hanging them from an erosion pin) to record near-bank surface maximum and minimumtemperatures. Five of these thermometers were installed on banks of the forested stream and six were positionedon banks of the moorland stream (see Figure 1). Minimum temperatures were recorded on all thermometers on13 occasions between October 1984 and March 1985.
Eight bank material samples were taken, four from the banks of each stream. The sample locations areindicated on Figure 1. Samples were collected by pushing a copper cylinder (40mm diameter × 100mm long)into the bank to sample a known volume of bank material. Samples were then bagged and later dried andweighed. Bank material bulk density was calculated and these calculations of average density were later used toestimate the total sediment input to the catchment system from bank erosion.
Both streams had rectangular Crump weir gauging structures installed in 1981 and monitored by IH. Thelocations of the weirs and the catchment boundaries are shown on Figure 1. Stream flow recorded at 15minintervals was used for the analysis reported later in this study.
RESULTS
Rates of erosion
Table III compares the results for Monachyle and Kirkton mainstreams. Mean bank erosion rates weresignificantly higher in Monachyle (moorland). The difference between the means is significant at the 0·05 level(using the t test). Figure 3 compares the erosion rates for the two streams over the two year period and shows thegenerally higher average erosion rate in the moorland stream, the higher erosion rate on both streams in the

388 T. STOTT
Table III. Stream bank erosion rates on Monachyle and Kirkton mainstreams
Monachyle(moorland)
Kirkton (forested)
Mean annual bank erosion rate (mm a−1) 59 47
Maximum erosion in any 3 month period (mm) 35 29
Minimum erosion in any 3 month period (mm) 3 2
Figure 3. Mean rates of bank erosion for three-monthly periods from October 1984 to September 1986
second year and the strong seasonality in bank erosion rates, with maximum erosion occurring in the January–March period on both streams in both years and the minimum rates occurring in the July–September period.
Figure 4 shows the average seasonal percentages of stream bank erosion for both streams. Almost half of thebank erosion occurs in the winter (January–March) period with least (less than 12 per cent) occurring in thesummer (July–September). The proportion of bank erosion in spring (April–June) and autumn (October–December) is similar, with 20–25 per cent of the annual erosion occurring in each period.
Influence of frost and stream flow
To investigate the relative importance of frost and stream flow on bank erosion processes and to attempt toexplain the observed variations in erosion rates over the study period, the mean daily erosion rate over the three-monthly periods (ERRATE) was correlated with various frost and stream flow indices. These were: FROST,which is simply the number of days on which the grass minimum temperature at the nearby Tulloch Farm

389STREAM BANK EROSION
Figure 4. Average seasonal percentages of stream bank erosion in Monachyle and Kirkton
Weather Station (see Figure 1) fell below 0°C, FROST <−1, FROST <−3 and FROST <−5 are the number ofdays on which grass minimum temperatures of below −1, −3 and −5°C respectively were recorded. Stream flowindices used were: QMEAN, the mean stream discharge during the period, and QMAX, the maximuminstantaneous discharge recorded during the period. In addition to these two stream flow indices, further indiceswere calculated from the time over which various flow thresholds were exceeded. On both streams T >QMEAN was the time in hours when the stream discharge exceeded the mean annual discharge, T > 2 and T > 4(for Kirkton stream) and T > 4 and T > 8 (for Monachyle) are times in hours when stream flow exceededdischarge thresholds of 2, 4 and 8m3 s−1. These stream flow indices were estimated from the IH records. TableIV presents the Pearson product moment correlation coefficients for ERRATE with the various indicesmentioned above. The asterisks in the table indicate the level at which the coefficients are significant and it is
Table IV. Pearson product moment correlation coefficients for mean daily bank erosion rate (ERRATEin mm) over eight three-monthly periods with various frost and stream flow indices for Monachyle and
Kirkton mainstreams (1984–1986)
Index MonachyleERRATE
KirktonERRATE
FROST 0·785* 0·504FROST <−1 0·761* 0·499FROST <−3 0·801** 0·602FROST <−5 0·760* 0·591QMEAN 0·166 0·140QMAX 0·033 0·363T>QMEAN 0·029 −0·094T>2 + 0·090T>4 0·099 0·329T>8 0·341 –
−, no flows exceeded this threshold; +, not estimatedCoefficients greater than 0·666 are significant at the 5 per cent level (indicated by *), coefficientsgreater than 0·798 are significant at the 1 per cent level (indicated by **)
QMEAN, QMAX and all flow thresholds are in m3s−1

390 T. STOTT
Table V. Summary of stream bank temperatures recorded at 11 sites in the Balquhidder catchments
Monachyle KirktonMinimum Maximum Minimum Maximum
Mean (°C) −5·5 6·4 −1·8 5·6n 28 28 28 28Lowest (°C) −14 −1 −10 0Highest (°C) 4 12 0 2
Range (°C) 26 12
Table VI. Mean bank erosion rates at different heights on stream banks for two three-monthly periods on Monachyle and Kirktonmainstreams
Height from top of bank(m)
Mean erosion
Oct.–Dec. 1984(mm) n
Dec.–Mar. 1985(mm) n
Monachyle 0·10·20·30·40·50·60·7
4·111·311·514·811·016·13·2
5565614928169
6·017·336·143·546·527·55·0
343835312282
Kirkton 0·10·20·30·40·50·6
4·34·86·25·15·65·5
1318161484
4·87·1
20·217·630·418·0
1513131084
clear that the frost indices correlate better with erosion rate than any of the stream flow indices. All the frostindices in the Monachyle stream have coefficients significant at the 5 per cent level, with the FROST <−3having marginally the best correlation which is significant at the 1 per cent level.
The records of minimum temperatures on the stream banks during the 1984/85 winter period (20 October1984 to 21 March 1985) are summarized in Table V. Minimum temperatures recorded on stream banks duringwinter 1984–85 were on average 3·7°C higher under the forest canopy in Kirkton compared with the openmoorland in Monachyle. Stream bank temperature ranges are also much greater for this period in Monachyle(26°C) compared to Kirkton (12°C). Frost data for the whole study period are presented in Figure 5. Forty-nineper cent of all frosts exceed the FROST <−3 threshold.
Spatial distribution of bank erosion
Since erosion pins were installed on banks in vertical lines with a 0·1m spacing, it was possible to analysevertical differences in erosion rate on the banks. Figure 6 shows the average amount of erosion at each height(0·1m intervals) above low water level on Monachyle and Kirkton streams for two representative three-monthperiods (September–December 1984 and January–March 1985). The number of erosion pin measurementsaveraged to produce each point on the graph is given in Table VI. Average erosion rate is highest in the region0·1m above low water level in the forest stream and 0·3m above low water level in the moorland stream, wherethe erosion rate may be up to six times greater than at the bank top. Analysis of the vertical distribution oferosion on the banks of both streams indicates that the dominant erosion mechanism is undercutting, with theprocess being more pronounced in the moorland stream. This is followed by slumping and collapse of largeblocks by cantilever failure (toppling) of smaller ones (see Figure 7, right). Collapsed blocks, where 0·5–1·0mof land had been lost, were evident on meander bends eroding the peat further down the Monachyle stream,

391STREAM BANK EROSION
Figure 5. Sub-zero grass minimum temperature data (ground frosts) from the IH Tulloch Farm weather station for the study period
Figure 6. Vertical profiles of mean bank erosion for three-monthly survey periods for Monachyle and Kirkton mainstreams. Thehorizontal scale is exaggerated. The number of erosion pin measurements averaged to give these plots is presented in Table VI

392 T. STOTT
Figure 7. Photograph of Monachyle stream showing the undercut nature of the stream banks, with examples of cantileverfailure on the right
though these were too large to topple and had entered the channel by sliding. Failed blocks sometimes remain inthe channel and temporarily protect the bank from further erosion. This mechanism of undermining, cantileverfailure and fluvial scour of the toe, as identified by Thorne and Tovey (1981) and Thorne (1982), seems tooperate over several flood events and has important implications for channel changes, land loss and themovement of sediment through the catchment system (Ashbridge, 1995; Darby and Thorne, 1994). Indeed,improved understanding of this mechanism may help to explain temporal and spatial patterns in sediment loadsand thus improve prediction of changes in sediment yield connected with land use and climatic change.
Contribution of channel bank erosion to the sediment budget
To estimate the contribution of sediment to the catchment sediment budget and thus to assess the importanceof bank erosion as a source of sediment, it was necessary to extrapolate the average measured forest andmoorland bank erosion rates of 47 and 59mm a−1, respectively, to the estimated areas of actively eroding bank.The area of actively eroding bank was assessed during the course of the final erosion pin survey in September1986 by measuring the height of actively eroding bank every 5m (on right and left banks) along the total lengthof channel sampled by the erosion pins (5km in Monachyle and 2·2km in Kirkton). The actively eroding area ofbank was then the product of mean bank height and total bank length, which was calculated to be 240m2 on theforest stream and 350m2 on the moorland stream. These estimates are equivalent to 10m2 per 100m of channelfor Kirkton and 6m2 per 100m of channel for Monachyle. The difference may be due to the suppression ofvegetation growth beneath the trees in Kirkton, which may go some way to explaining the higher suspendedsediment yields from forested catchments as reported in Table I. The relatively low estimates are due to the factthat for much of their course the streams flow on rock beds with little or no evidence of bank erosion.
The product of the average erosion rates and the estimated area undergoing erosion produced volumes ofsediment equivalent to 11·3 and 20·7m3 for the forest and moorland streams respectively. The average bulkdensities of four samples taken at mid-height from the channel banks of each stream (see Figure 1 for locations)were estimated to be 1·16tm−3 for Kirkton and 1·04tm−3 for Monachyle, which gave total sediment inputestimates of 13·1 and 21·5ta−1 for the forest and moorland streams, respectively. When averaged over the wholecatchment area for the purpose of constructing sediment budgets (Stott et al., 1986), this corresponds tosediment yields of 1·9 and 2·8 tkm−2 a−1 for Kirkton and Monachyle, respectively. These figures represent 1·5and 7·3 per cent of the total catchment sediment yield as estimated using the corrected rating curve method (seeStott et al. (1986) and Johnson (1988) and also by an independent group averaging method (Johnson, 1993).

393STREAM BANK EROSION
DISCUSSION
Bank erosion rates compared to other U.K. studies
The average rates of bank erosion, 47mma−1 in Kirkton (forested) and 59mma−1 in Monachyle (moorland),are broadly comparable with average rates measured by other workers using erosion pins on broadly similar-sized catchments. These and numerous other studies have recently been reviewed by Lawler (1993a) in his tableV. For comparative purposes, bank erosion rates from other British studies are given in Table VII. The results ofthis study are reported first, otherwise they are in order of increasing catchment area. Erosion rates generallyincrease with stream catchment area, but comparisons with the findings of other U.K. studies included in TableVII are, however, fraught with problems. Although all studies in Table VII used erosion pins, different bankerosion rates measured could be due to a range of factors which may include: differences in bank material (grainsize, organic content), climate (precipitation, frosts and freeze–thaw cycles) and topography (altitude, relief,stream gradient); stream hydraulic conditions (meanders, sinuosity); and methods and approach of theobservers (e.g. sampling design, erosion pin measurement error). For example, few other studies have adopted asystematic sampling system as used at Balquhidder. Instead, many of the rates reported in the literature areaverage maximum rates, where measurements of processes have been made on the most rapidly erodingsections rather than systematic sampling of all banks as in this study.
The estimated contributions of the channel bank erosion sediment source to the total catchment sedimentyields of 1·5 and 7·3 per cent for forest and moorland streams, respectively. In constructing sediment budgetsfor the catchments, Stott et al. (1986) found good agreement between the sediment contribution from tributariesand the total catchment output of sediment. No measurements of bank erosion on tributary streams wereundertaken and so it is not possible to comment on what proportion of the total tributary sediment yield comesfrom tributary bank erosion. Other possible sources of sediment were landslides (in the moorland catchmentonly), wash load and sediment transported by overland flow, forest ditches and roads (in the forested catchmentonly) and in-channel abrasion and attrition in both streams
Influence of frost and precipitation
Figure 3 shows the strong seasonality which has been noted in other studies (Lawler, 1986), with maximumbank erosion in the January–March period on both streams in both years. Frost action has been suggested as animportant process responsible for bank erosion in previous studies (Wolman, 1959), and more recently Lawler(1986) conducted detailed regression analyses which statistically demonstrated the dominance of frost-related
Table VII. British studies of bank erosion rates
Reference LocationCatchment area
(km2)Erosion rate
(mm a−1)
This study Kirkton (forest)Monachyle (moorland)
6·857·7
4759
Lewin et al. (1974) Maesnant, mid-Wales 0·54 30Hill (1973) Clady and Crawfordsburn,
N. Ireland3·4 30–66
Murgatroyd and Ternan (1983) Narrator Brook 4·75 5·2 in forest0·7 outside forest
Lawler (1984, 1986) R. Ilston, S. Wales 6·75 and 13·18 38–310Cummins and Potter (1972) Bradgate Brook, Leicestershire <20 25McGreal and Gardiner (1977) R. Lagan, N. Ireland 85 80–140Hooke (1979) Various rivers, Devon 9·6–620 80–1180Knighton (1973) R. Bollin-Dean, Cheshire ∼260 230Thorne and Lewin (1979) Upper Severn, mid-Wales 375 300–600

394 T. STOTT
variables over other factors on the River Ilston in south Wales. These findings are fully supported in this study,where the steep-sided valleys and altitude increase the incidence of frost (120 days in the first year of the studyand 155 days in the second year) and the freeze–thaw frequency (Harrison and Harrison, 1988). The intensity offrosts is shown to be important since the number of days with ground frosts colder than −3°C (FROST <−3)correlates best with bank erosion in the Monachyle stream (significant at the 0·01 level). This is presumablybecause more intense frost is needed to freeze moisture in the forested stream banks and initiate needle icedevelopment. This form of segregated ice, observed after hard frosts on the banks in the study area, growsexternally to the bank surface as a collection of ice filaments which grow at right angles to the bank surface.Although observed on the banks studied, no direct measurements of size, frequency or amount of sedimentmobilized was undertaken. Controls of needle ice growth, including the important role of an unfrozen moisturesupply, are reviewed by Outcalt (1971) and Meentemeyer and Zippin (1981), while Lawler (1993b) hasinvestigated its importance in mobilizing bank sediment. As growth of the needles occurs, sediment may beforced away from the bank, both on the surface and within growing needles. Lawler (1986) found weights ofextruded material on the River Ilston to be more than 4kgm−2 for needles 50mm long. On melting of theneedles, some of this material may fall to the foot of the bank while the remainder is left as a loosely bound layeron the surface, easily washed away by the next rise in stage.
The incidence of freezing of material in the banks of the forested Kirkton stream is approximately only halfof that in the moorland stream, which may go some way towards explaining both the higher average erosionrates in the moorland stream and the fact that the highest erosion rates occur in the January–March (winter)periods in both years.
Analyses of suspended sediment dynamics in rivers have often revealed hysteresis effects, with higherconcentrations of sediment on the rising limbs of flood hydrographs (Bogen, 1980; Walling, 1974) and seasonaleffects where concentrations following frosts in winter are highest (Stott et al., 1986). These observations maybe linked to the supply of fine sediment from channel banks as described in this study and elsewhere (Lawler,1986).
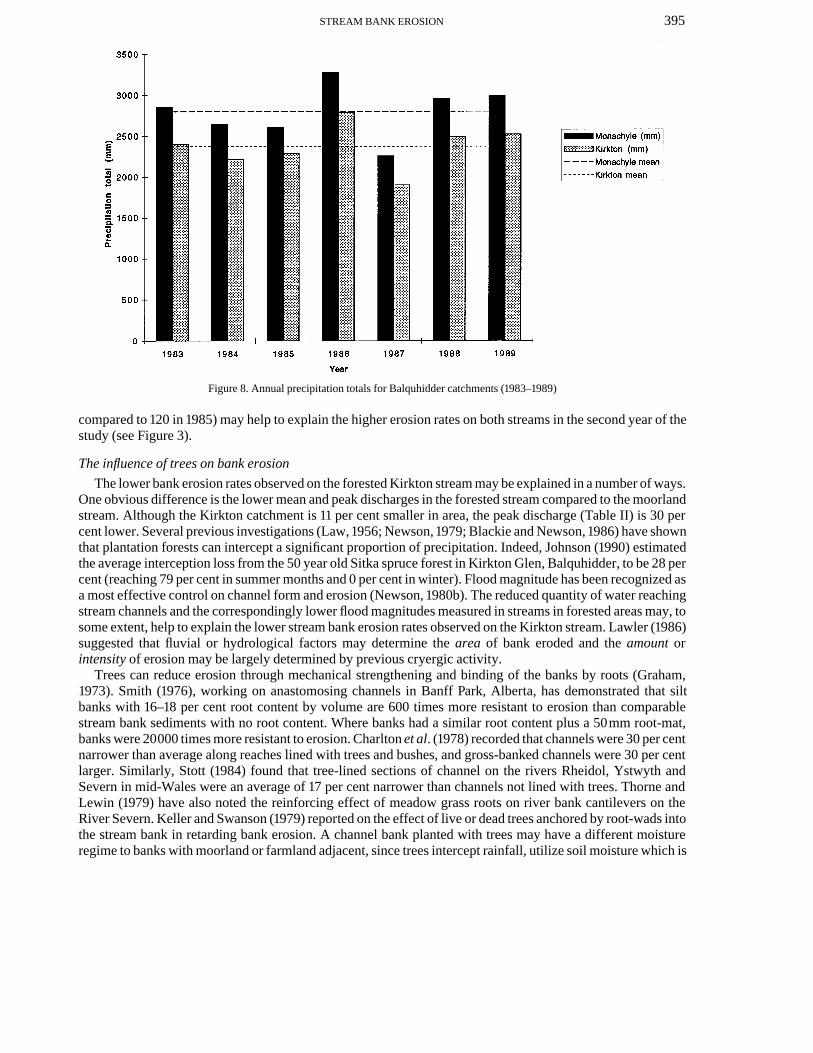
The annual precipitation total given in Table VIII and illustrated in Figure 8 provide some insight into therepresentativeness of the study years (October 1984–September 1986) compared with the seven-year period ofthe Balquhidder Experiment.
The bank erosion study began in October 1984. The first complete year studied was 1985, for which theannual precipitation totals were 93·4 and 96·3 per cent of the 1983–1989 mean for Monachyle and Kirkton,respectively. The second year of the study, 1986, had significantly higher precipitation totals, which were 117per cent of the 1983–1989 mean in both catchments. The lower than average 1985 precipitation total and thehigher than average 1986 precipitation total combined with the greater number of frost days in 1986 (155
Table VIII. Balquhidder annual precipitation (1983–1989)
Year Monachyle KirktonMean annual
precipitation (mm)Mean annual
precipitation aspercentage of
1983–1989 mean
Mean annualprecipitation (mm)
Mean annualprecipitation aspercentage of
1983–1989 mean
198319841985*1986*198719881989
2857264826123280225529522985
102·194·693·4
117·280·6
105·5106·7
2401221522852789189924932519
101·293·496·3
117·680·1
105·1106·2
1983–1989Mean
2798 100·0 2372 100·0
* Study years (Oct. 1984–Sep. 1986)
395STREAM BANK EROSION
Figure 8. Annual precipitation totals for Balquhidder catchments (1983–1989)
compared to 120 in 1985) may help to explain the higher erosion rates on both streams in the second year of thestudy (see Figure 3).
The influence of trees on bank erosion
The lower bank erosion rates observed on the forested Kirkton stream may be explained in a number of ways.One obvious difference is the lower mean and peak discharges in the forested stream compared to the moorlandstream. Although the Kirkton catchment is 11 per cent smaller in area, the peak discharge (Table II) is 30 percent lower. Several previous investigations (Law, 1956; Newson, 1979; Blackie and Newson, 1986) have shownthat plantation forests can intercept a significant proportion of precipitation. Indeed, Johnson (1990) estimatedthe average interception loss from the 50 year old Sitka spruce forest in Kirkton Glen, Balquhidder, to be 28 percent (reaching 79 per cent in summer months and 0 per cent in winter). Flood magnitude has been recognized asa most effective control on channel form and erosion (Newson, 1980b). The reduced quantity of water reachingstream channels and the correspondingly lower flood magnitudes measured in streams in forested areas may, tosome extent, help to explain the lower stream bank erosion rates observed on the Kirkton stream. Lawler (1986)suggested that fluvial or hydrological factors may determine the area of bank eroded and the amount orintensity of erosion may be largely determined by previous cryergic activity.
Trees can reduce erosion through mechanical strengthening and binding of the banks by roots (Graham,1973). Smith (1976), working on anastomosing channels in Banff Park, Alberta, has demonstrated that siltbanks with 16–18 per cent root content by volume are 600 times more resistant to erosion than comparablestream bank sediments with no root content. Where banks had a similar root content plus a 50mm root-mat,banks were 20000 times more resistant to erosion. Charlton et al. (1978) recorded that channels were 30 per centnarrower than average along reaches lined with trees and bushes, and gross-banked channels were 30 per centlarger. Similarly, Stott (1984) found that tree-lined sections of channel on the rivers Rheidol, Ystwyth andSevern in mid-Wales were an average of 17 per cent narrower than channels not lined with trees. Thorne andLewin (1979) have also noted the reinforcing effect of meadow grass roots on river bank cantilevers on theRiver Severn. Keller and Swanson (1979) reported on the effect of live or dead trees anchored by root-wads intothe stream bank in retarding bank erosion. A channel bank planted with trees may have a different moistureregime to banks with moorland or farmland adjacent, since trees intercept rainfall, utilize soil moisture which is

396 T. STOTT
lost by transpiration, and shade the soil surface during sunny weather. Stream banks under trees are likely toundergo fewer wetting and drying cycles, which may be important in loosening material and ‘preparing’ banksfor future erosion (Lawler, pers. comm.).
Minimum temperatures measured on stream banks in this study were an average of 3·7°C higher on theforested stream than on the moorland stream. This suggests that a frost 3·7°C colder would be needed to start tofreeze moisture in the banks of the forested stream. On average, the forested stream banks at Balquhidder aresubjected to around half as many freezing cycles as the open moorland stream. Hurst (1966), working in theforest of Thetford Chase, found that minimum temperatures were higher under the forest than over bare soil inthe open. Smith (1970) reported that the range of air temperature from mean monthly maximum to meanmonthly minimum was less under forest cover than in the open. Soil temperatures at 0·1m depth under forestcover, he noted, were higher in winter than those at the open site, and lower in summer. These observations,combined with the fact that there may be less moisture available for freezing in the forested stream banks, pointsto the likelihood of reduced effectiveness of cryergic activity in the forested stream banks.
There is, however, a need to distinguish between banks only vegetated by coniferous trees, as in this study(which shade out light and suppress undergrowth), and banks vegetated by deciduous trees with undergrowth.In contrast to the findings of this study, Murgatroyd and Ternan (1983), working on the Narrator Brook inDartmoor, found that more active bank erosion was taking place in their forested reach and that the channelcapacity was double that predicted from the basin area. This they attributed largely to the suppression by theforest of a thick grass turf and its associated dense network of fine roots. This was also observed to be the case atBalquhidder. Zimmerman et al. (1967) working in small catchments in New England, U.S.A., observed thatdifferent reaches on the same stream varied in width depending on whether the banks were lined with trees orsod (a thick grass mat). They found that the mean width of stream reaches with forested banks was up to 10 timesgreater than that of reaches with sod banks.
Clearly, there are conflicting reports within the literature regarding the effects of trees on channel bankstability. Other factors, such as the bank material composition and strength (Thorne, 1981), local channel formand organic debris dams (Gregory and Davies, 1992; Gregory et al., 1985; Mosley, 1981), the streamhydrological regime (Blackie and Newson, 1986), the role of groundwater and antecedent soil moisture, theincidence of frost and formation of needle ice (Lawler, 1987, 1993b) and the species of trees (conifers ordeciduous) and type of understory vegetation, can all influence bank erosion rates. In recent years, rivermanagers have tended to remove trees from banks for fear of them increasing channel roughness during timesof flood and the possibility of them being added to the debris carried by a flooding river and jamming in bridges,weirs and other such structures downstream. In the uplands, such concerns are less justified. Studies presentedin Table I point to the association which has developed over the last two decades between forestry and increasedsediment yields. The Forestry Commission has changed its policies in the last decade (Forestry Commission,1988) and amenity tree planting is now high on its agenda. It is now policy to leave an unplanted ‘buffer zone’ (a15–30m strip) alongside channels to act as a sediment trap for eroded material from upslope plough furrows(Mills, 1980). Unplanted buffer zones may result in a loss of the protective influence of trees on stream banksboth in terms of reducing cryergic activity and mechanical strengthening by roots. Planting of buffer strips withbroad-leaved trees, such as willow or alder, is in its early stages and more research into the effects of this kind ofamenity planting on bank erosion on upland streams is needed. Further investigations are also needed to assessthe role of such factors as bank moisture regime (e.g. wetting and drying frequency), temperature extremes(freezing frequency and needle ice formation) as well as the bank material strength and composition on streambank erosion on upland streams affected by these land use changes.
CONCLUSIONS
Bank erosion rates measured using erosion pins on two upland streams in the Balquhidder catchments in centralScotland over a two year period were found to be significantly lower on an afforested stream than on a nearbyunforested stream. Erosion rates were highest in the winter (January–March) in both study years. Erosion ratewas correlated with a number of stream flow and frost indices and was found to correlate best with frosts(significant at the 1 per cent level). Minimum temperatures measured on stream banks of the forested stream

397STREAM BANK EROSION
were an average of 3·7°C higher than minimum temperatures measured on stream banks both outside the forestand on the moorland stream. Frosts on forested stream banks are estimated to occur half as frequently as they doon the banks of the moorland stream and so the forest appears to be offering stream banks protection from frosts.Analysis of the vertical distribution of erosion on the banks of both streams points to the mechanism ofundercutting (Thorne and Tovey, 1981), which is more pronounced in the moorland stream. This is followed byslumping and collapse of blocks which sometimes remain in place and protect the bank from further erosion.Mainstream channel bank erosion is estimated to be contributing 1·5 and 7·3 per cent of the sediment load of theforested and moorland streams, respectively. Although the balance of evidence from the literature seems to bein favour of trees on stream banks having a moderating effect on bank erosion, there are also notable exceptionsand the evidence is far from conclusive. Other factors which must also be considered include type andcomposition of bank material, stream hydrological regime, the role of groundwater and antecedent moisture inthe banks, the incidence of frost and subsequent formation of needle ice, the role of in-channel organic debrisand the type of trees and understory vegetation.
ACKNOWLEDGEMENTS
The fieldwork for this study was carried out while the author was in receipt of a Natural Environment ResearchCouncil CASE Award Studentship with the Institute of Hydrology. Professor R. I. Ferguson and Professor M.D. Newson supervised the project. The Institute of Hydrology provided stream flow data and the ForestryCommission gave access permission to their land in Monachyle and Kirkton Glens. Dr D. Lawler and ProfessorD. Huddart provided many useful comments on an early draft of the manuscript and I am also very grateful forcomments from two anonymous referees.
REFERENCES
Ashbridge, D. 1995. ‘Processes of river bank erosion and their contribution to the suspended sediment load of the River Culum, Devon’, inFoster, I. D. L., Gurnell, A. M. and Webb, B. W. (Eds), Sediment and Water Quality in River Catchment Systems, John Wiley,Chichester, 229–245.
Austin, R. and Brown, D. 1982. ‘Solids contamination resulting from drainage works in an upland catchment, and its removal byflotation’, Journal of the Institution of Water Engineers and Scientists, 36, 281–288.
Blackie, J. R. and Newson, M. D. 1986. ‘The effects of forestry on the quantity and quality of runoff in upland Britain’, de L. G. Solbe, J. F.(Ed.), Effects of Land Use on Fresh Waters, Ellis Horwood, Chichester, 398–412.
Blacknell, C. 1981. ‘River erosion in an upland catchment’, Area, 13, 39–44.Bogen, J. 1980. ‘The hysteresis effect of sediment transport systems’, Norsk Geogr. Tiddsskr., 34, 45–54.Burt, T. P., Donohoe, M. A. and Vann, A. R. 1984. ‘A comparison of suspended sediment yields from two small upland catchments
following open ditching for forestry drainage’, Zeikschrift fur Geomorphologie N.F. Suppl. Bd., 51, 51–62.Carling, P. A. and Reader, N. A. 1982. ‘Structure, composition and bulk properties of upland stream gravels’, Earth surface Processes and
Landforms, 7, 349–365.Charlton, F. G., Brown, P. M. and Benson, R. W. 1978. The hydraulic geometry of some gravel rivers in Britain, Hydraulics Research
Station, Report IT 180, Wallingford.Coldwell, A. E. 1957. ‘Importance of channel erosion as a source of sediment’, Transactions of the American Geophysical Union, 38,
1908–1912.Cummins, W. A. and Potter, H. R. 1972. ‘Rates of erosion in the catchment area of Cropston Reservoir, Charnwood Forest,
Leicestershire’, Mercian Geologist, 4, 149–157.Cuthbertson, R. H. 1948. ‘The present case for the afforestation of gathering grounds’, Journal of the Institution of Water Engineers and
Scientists, 2, 284–292.Darby, S. E. and Thorne, C. R. 1994. ‘Prediction of tension crack location and riverbank erosion hazards along destabilized channels’,
Earth Surface Processes and Landforms, 19, 233–245.Dietrich, W. E. and Dunne, T. 1978. ‘Sediment budget of a small catchment in mountainous terrain’, Zeitschrift fur Geomorphologie N.F.
Suppl. Bd., 29, 191–206.Ferguson, R. I. and Stott, T. A. 1987. ‘Forestry effects on suspended sediment and bedload in the Balquhidder catchments’, in Hydrology
in Scotland, Special Publication of the Transactions of the Royal Society of Edinburgh, 78(4), 379–385.Ferguson, R. I., Grieve, I. C. and Harrison, D. J. 1991. ‘Disentangling land use effects on sediment yield from year to year climatic
variation’, Sediment and Stream Water Quality in a Changing Environment: Trends and Explanation (Proceedings of the ViennaSymposium, August 1991), IAHS Publication, 203, 13–20.
Forestry Commission 1988. Forests and Water Guidlines, HMSO, London. Francis, I. S. and Taylor, J. A. 1989. ‘The effect of forestry drainage operations on upland sediment yields: a study of two peat covered
catchments’, Earth Surface Processes and Landforms, 14(1), 73–83.Graham, M. 1973. A Natural Ecology, Manchester University Press, 196–206.

398 T. STOTT
Gregory, K. J. and Davies, R. J. 1992. ‘Coarse woody debris in stream channels in relation to river channel management in woodlandareas’, Regulated Rivers Research and Management, 7, 117–136.
Gregory, K. J., Gurnell, A. M. and Hill, C. T. 1985. ‘The permanence of debris dams related to river channel processes’, HydrologicalSciences Journal, 30(3), 371–380.
Haigh, M. J. 1977. ‘The use of erosion pins in the study of slope evolution’, BGRG Technical Bulletin, 18, 31–49.Harrison, S. J. and Harrison, D. J. 1988. ‘The effect of altitude on freeze–thaw frequency’, Journal of Meteorology, 13(133), 341–344.Harvey, A. M. 1974. ‘Gully erosion and sediment yield in the Howgill Gells, Westmorland’, in Gregory, K. J. and Walling, D. E. (Eds),
Fluvial Processes in Instrumented Watersheds, Institute of British Geographers Special Publication 6, 45–58.Harvey, A. M. 1991. ‘The influence of sediment supply on the channel morphology of upland streams: Howgill Fells, Northwest England’,
Earth Surface Processes and Landforms, 16, 675–684.Hill, A. R. 1973. ‘Erosion of river banks composed of glacial till near Belfast, Northern Ireland’, Zeitscrift fur Geomorphologie, 17, 428–
422.Hooke, J. M. 1979. ‘An analysis of the processes of river bank erosion’, Journal of Hydrology, 42, 39–62.Hooke, J. M. 1980. ‘Magnitude and distribution of rates of river bank erosion’, Earth Surface Processes and Landforms, 5, 143–157.Hurst, G. W. 1966. ‘Temperatures in the forest of the Thetford Chase’, Meteorological Magazine, London, 95, 123.Johnson, R. C. 1985. ‘Mountain and glen contrasts at Balquhidder’, Journal of Meteorology, 10(98), 105–108.Johnson, R. C. 1988. ‘Changes in the sediment output of two upland drainage basins during forestry land use changes’, in Sediment
Budgets, Proceedings of the Porto Alegre Symposium, IAHS Publication, 174, 463–471.Johnson, R. C. 1990. ‘The interception, throughfall and stemflow in a forest in Highland Scotland and comparison with other upland
forests in the U.K.’, Journal of Hydrology, 118, 281–287.Johnson, R. C. 1993. ‘Effects of forestry on suspended solids and bedload yields in the Balquhidder catchments’, Journal of Hydrology,
45, 404–417.Keller, E. A. and Swanson, F. J. 1979. ‘Effects of large organic material on channel form and fluvial processes’, Earth Surface Processes
and Landforms, 4, 361–380.Kirkby, M. J. 1967. ‘Measurement and theory of soil creep’, Journal of Geology, 75, 359–378.Knighton, A. D. 1973. ‘Riverbank erosion in relation to streamflow conditions, river Bollin-Dean, Cheshire’, East Midland Geographer,
5(8), 416–426.Law, F. 1956. ‘The effect of afforestation upon the yield of water catchment areas’, Journal of the British Waterworks Association, 11,
489–494.Lawler, D. M. 1978. ‘The use of erosion pins in river banks’, Swansea Geographer, 16 9–18.Lawler, D. M. 1984. Processes of river bank erosion: the River Ilston, South Wales, U.K.’ unpublished PhD thesis, University of Wales,
518 pp.Lawler, D. M. 1986. ‘River bank erosion and the influence of frost: a statistical examination’, Transactions of the Institute of British
Geographers, 11, 227–242.Lawler, D. M. 1991. ‘A new technique for the automatic monitoring of erosion and deposition rates’, Water Resources Research, 27,
2125–2128.Lawler, D. M. (1993a). ‘The measurement of river bank erosion and lateral change: a review’, Earth Surface Processes and Landforms,
18, 777–821.Lawler, D. M. 1993b. ‘Needle ice processes and sediment mobilisation on river banks: the River Ilston, West Glamorgan, UK’, Journal of
Hydrology, 15, 81–114.Leeks, G. J. L. 1992. ‘Impact of plantation forestry on sediment transport processes’, in Billi, P. et al. (Eds), Dynamics of Gravel-bed
Rivers, Wiley, Chichester, Ch. 33, 651–670.Leeks, G. J. L. and Roberts, G. 1987. ‘The effects of forestry on upland streams with special reference to water quality and sediment
transport’, in Good, J. E. G. and Institute of Terrestrial Ecology (Eds), Environmental Aspects of Plantation Forestry in Wales, 22, 9–24.
Leopold, L. B., Emmett, W. W. and Myrick, R. M. 1966. Channel and Hill Slope Processes in a Semi-arid Area, New Mexico, U.S.Geological Survey Professional Paper, 352-G, 193–253.
Lewin, J. and Brindle, B. J. 1977. ‘Confined meanders’, in Gregory, K. J. (Ed.), River Channel Changes, Wiley, Chichester, 221–233.Lewin, J., Cryer, R. and Harrison, D. I. 1974. ‘Sources for sediments and solutes in mid-Wales’, in Gregory, K. J. and Walling, D. E. (Eds),
Fluvial Processes in Instrumented Watersheds, Institute of British Geographers Special Publication, 6, 73–85.McGreal, W. S. and Gardiner, T. 1977. ‘Short-term measurements of erosion from a marine and fluvial environment in County Down,
Northern Ireland’, Area, 9, 282–289.Meetemeyer, V. and Zippin, J. 1981. ‘Soil moisture and texture controls of selected parameters of needle ice growth’, Earth Surface
Processes and Landforms, 6, 113–125.Mills, D. H. 1980. The Management of Forest Streams, Forestry Commission Leaflet, 78, HMSO, London.Moffat, A. J. 1988. ‘Forestry and soil erosion in Britain – a review’, Soil Use and Management, 4(2), 41–44.Moore, R. J. and Newson, M. D. 1986. ‘Production, storage and output of coarse upland sediments: natural and artificial influences
revealed by research catchment studies’, Journal of the Geological Society, London, 143, 921–926.Mosley, M. P. 1981. ‘The influence of organic debris on channel morphology and bedload transport in a New Zealand forest stream’, Earth
Surface Processes and Landforms, 6, 571–579.Murgatroyd, A. L. and Ternan, J. L. 1983. ‘The impact of afforestation on stream bank erosion and channel form’, Earth Surface
Processes and Landforms, 8, 357–369.Newson, M. D. 1979. ‘The results of ten years experimental study on Plynlimon, mid-Wales and their importance for the water industry’,
Journal of the Institution of Water Engineers and Scientists, 33, 321–333.Newson, M. D. 1980a. ‘The erosion of drainage ditches and its effect on bedload yields in mid-Wales: Reconnaissance case studies’,
Earth Surface Processes and Landforms, 5, 275–290.Newson, M. D. 1980b. ‘The geomorphological effectiveness of floods – a contribution stimulated by two recent events in mid-Wales’,
Earth Surface Processes and Landforms, 5, 1–16.

399STREAM BANK EROSION
Outcalt, S. I. 1971. ‘An algorithm for needle ice growth’, Water Resources Research, 7, 394–400.Painter, R. B., Blyth, K., Mosedale, J. C. and Kelly, M. 1974. The Effect of Afforestation on Erosion Processes and Sediment Yield, IAHS
Publication, 113, 62–67.Robinson, M. and Blyth, K. 1982. ‘The effect of forest drainage operations on upland sediment yields: a case study’, Earth Surface
Processes and Landforms, 7, 85–90.Smith, D. G. 1976. ‘Effect of vegetation on lateral migration of a glacier meltwater river’, Geological Society of America Bulletin, 87,
857–860.Smith, K. 1970. ‘The effects of a small upland plantation on air and soil temperatures’, Meteorological Magazine, 99, 45–49.Soutar, R. G. 1989. ‘Afforestation and sediment yields in British fresh waters’, Soil Use Management, 2, 82–86.Stott, T. A. 1984. ‘Vegetation as a factor affecting river bank erosion on three rivers in mid-Wales’, Nature in Wales, 3(1 and 2), 65–68.Stott, T. A. 1987. Forestry Effects on Sediment Sources, Dynamics and Yields in the Balquhidder Catchments, Central Scotland,
unpublished PhD thesis, University of Stirling, 273 pp.Stott, T. A., Ferguson, R. I., Johnson, R. C. and Newson, M. D. 1986. ‘Sediment budgets in forested and unforested basins in upland
Scotland’, in Hadley, R. F. (Ed.), Drainage Basin Sediment Delivery, Proceedings of the Albuquerque Symposium, Albuquerque 1986,IAHS Publication 159, 57–68.
Stretton, C. 1984. ‘Water supply and forestry – a conflict of interests: Cray reservoir, a case study’, Journal of the Institution of WaterEngineers and Scientists, 38, 323–330.
Thorne, C. R. 1981. ‘Field measurements of rates of bank erosion and bank material strength’, in Erosion and Sediment TransportMeasurement, Proceedings of the Florence Symposium, Florence 1981, IAHS Publication 133, 504–512.
Thorne, C. R. 1982. ‘Processes and mechanisms of river bank erosion’, in Hey, R. D., Bathurst, J. C. and Thorne, C. R. (Eds), Gravel-bedRivers, Wiley, Chichester, 227–259.
Thorne, C. R. and Lewin, J. 1979. ‘Bank processes, bed material movement and planform development in a meandering river’, in Rhodes,D. D. and Williams, G. P. (Eds), Adjustments of the Fluvial System, Kendall/Hunt, Dubuque, Iowa, 117–137.
Thorne, C. R. and Tovey, N. K. 1981. ‘Stability of composite river banks’, Earth Surface Processes and Landforms, 6, 469–484.Walling, D. E. 1974. ‘Suspended sediment and solute yields from a small catchment prior to urbanisation’, Transactions of the Institute of
British Geographers, 64, 141–147.Werritty, A. 1984. ‘Stream response to flash floods in upland Scotland’, in Burt, T. P. and Walling, D. E. (Eds), Catchment Experiments in
Fluvial Geomorphology (Proceedings of the I.G.U. Commission on Field Experiments in Geomorphology), Geobooks, Norwich, 537–560.
Wolman, M. G. 1959. ‘Factors influencing erosion of a cohesive river bank’, American Journal of Science, 257, 204–216.Zimmerman, R. C., Goodlett, J. C. and Comer, G. H. 1967. The Influence of Vegetation on Channel form of Small Streams, IAHS
Publication 75, 255–275.