The nicotinic acetylcholine receptor gene family of the silkworm, Bombyx mori
Biochemistry 1986, 25, 395-404 395
Mikami, H., & Ishida, Y. (1983) Bunseki Kagaku 32, E207. Mitsui, T., Akazawa, A., Christeller, J. T., & Tartakoff, A.
Nishibe, H., & Takahashi, N. (1981) Biochim. Biophys. Acta
Nishigaki, M., Yamashita, K., Matsuda, I . , Arashima, S., & Kobata, A. (1978) J . Biochem. (Tokyo) 84, 823-834.
Takahashi, N. (1977) Biochem. Biophys. Res. Commun. 76,
Takahashi, N., & Nishibe, H. (1981) Biochim. Biophys. Acta
Takahashi, N., Ishihara, H., Tejima, S., Oike, Y., Kimata,
M. (1985) Arch. Biochem. Biophys. 241, 315-328.
661, 274-279.
1194-1201.
657, 457-467.
K., Shinomura, T., & Suzuki, S. (1985) Biochem. J . 229,
Tarentino, A. L., & Plummer, T. H., Jr. (1982) J. Biof. Chem.
Vitale, A., Warner, T. G., & Chrispeels, M. J. (1 984) Planta
Vliegenthart, J. F. G., Dorland, L., & Halbeek, H. van (1983)
Yasuda, Y., Takahashi, N., & Murachi, T. (1970) Biochem-
Yoshima, H., Takasaki, S., Ito-Mega, S., & Kobata, A. (1979)
561-571.
257, 10776-10780.
160, 256-263.
Adv. Carbohydr. Chem. Biochem. 41, 209-374.
istry 9 , 25-32.
Arch. Biochem. Biophys. 194, 394-398.
Stopped-Flow Fluorescence Studies on Binding Kinetics of Neurotoxins with Acetylcholine Receptor
Toshiya Endo*
Department of Chemistry, College of Technology, Gunma University, Kiryu 376, Japan
Mamoru Nakanishi
Faculty of Pharmaceutical Sciences, University of Tokyo, Hongo. Bunkyo-ku, Tokyo 113, Japan
Shoei Furukawa
National Center for Nervous, Mental and Muscular Disorders, Ogawa- Higashi, Kodaira. Tokyo 187, Japan
Fransois J. Joubert
National Chemical Research Laboratory, Council for Scientific and Industrial Research, Pretoria, Republic of South Africa
Nobuo Tamiya
Department of Chemistry, Faculty of Science, Tohoku University, Aobayama, Sendai 980, Japan
Kyozo Hayashi
Department of Biology, Gifu Pharmaceutical University, Mitahora, Gifu 502, Japan Received March 28, 1985; Revised Manuscript Received August 6, I985
ABSTRACT: Acetylcholine receptor from Narke japonica electroplax exhibits a fluorescence change upon binding of snake neurotoxins. This fluorescence change primarily arises from the conformational change of the acetylcholine receptor and reflects the binding process of the toxin with the receptor. The time dependence of the fluorescence change has been monitored for 28 short neurotoxins and 8 long neurotoxins by using a stopped-flow technique. The steady-state fluorescence change is of the same order of magnitude for the short neurotoxins but varies among the long neurotoxins. Nha 10, a short neurotoxin with weak neurotoxicity, causes no fluorescence change in the receptor but can still bind to the receptor with sufficiently high affinity. The substitution of the conserved residue Asp-31 to Gly-31 in Nha 10 is probably responsible for the reduced neurotoxicity. The rate constants for the binding of the neurotoxins to the receptor have been obtained by analyzing the transient fluorescence change. The rate constants show surprisingly a wide range of distribution: (1.0-20.5) X lo6 M-' s-l for short neurotoxins and (0.26-1.9) X lo6 M-' s-l for long neurotoxins. Examination of the relationship between the rate constants of fluorescence change of the short neurotoxins and their amino acid sequences, thermal stability, hydrogen-deuterium exchange behavior, overall net charge, etc. reveals the following. Positive charges on the side chains of residues 27 and 30 and overall net charge of the neurotoxin govern the magnitude of the binding rate of the neurotoxin with the receptor.
'E, nicotinic acetylcholine receptor (AChR)' from fish electric organ and from mammalian skeletal muscle is a
complex of four homologous membrane proteins, in the mole ratio of a&& All of the five subunits are required to elicit
0006-2960/86/0425-0395$01.50/0 0 1986 American Chemical Society
E N D 0 E T A L . 396 B I O C H E M I S T R Y
A B
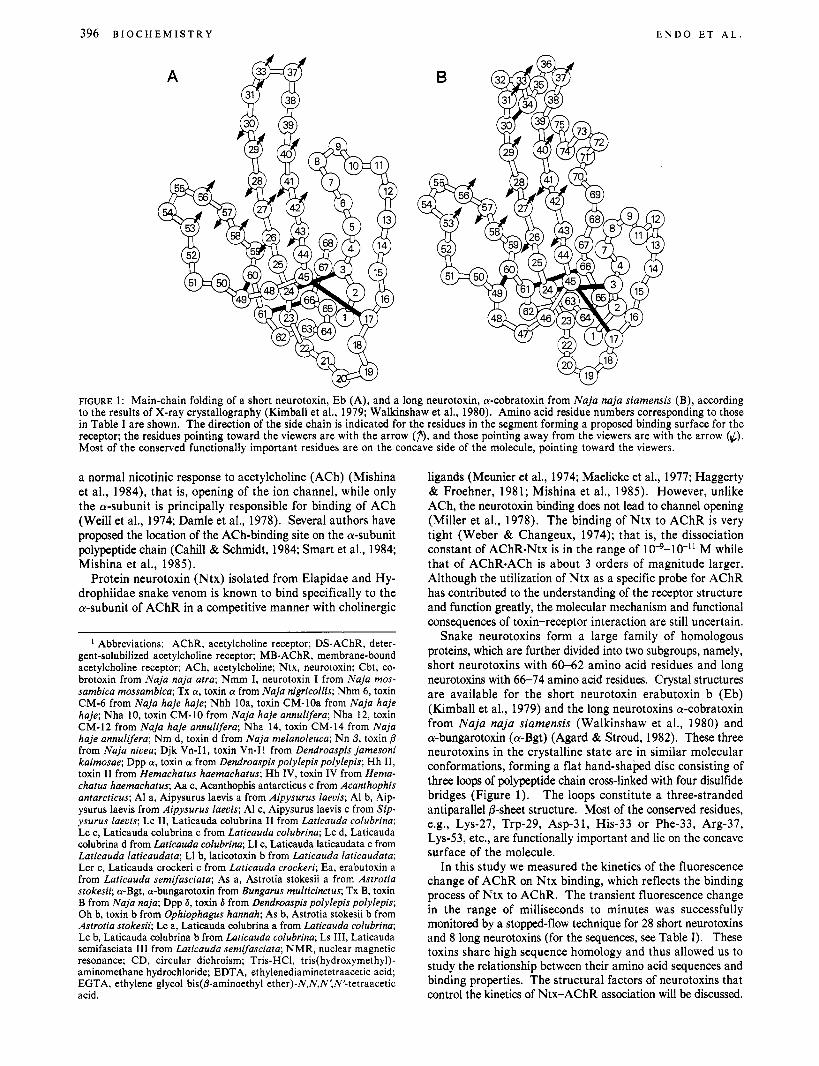
FIGURE 1: Main-chain folding of a short neurotoxin, Eb (A), and a long neurotoxin, a-cobratoxin from Naja naja siamensis (B), according to the results of X-ray crystallography (Kimball et al., 1979; Walkinshaw et al., 1980). Amino acid residue numbers corresponding to those in Table I are shown. The direction of the side chain is indicated for the residues in the segment forming a proposed binding surface for the receptor; the residues pointing toward the viewers are with the arrow (i”,, and those pointing away from the viewers are with the arrow (d) . Most of the conserved functionally important residues are on the concave side of the molecule, pointing toward the viewers.
a normal nicotinic response to acetylcholine (ACh) (Mishina et al., 1984), that is, opening of the ion channel, while only the a-subunit is principally responsible for binding of ACh (Weill et al., 1974; Damle et al., 1978). Several authors have proposed the location of the ACh-binding site on the a-subunit polypeptide chain (Cahill & Schmidt, 1984; Smart et al., 1984; Mishina et al., 1985).
Protein neurotoxin (Ntx) isolated from Elapidae and Hy- drophiidae snake venom is known to bind specifically to the a-subunit of AChR in a competitive manner with cholinergic
I Abbreviations: AChR, acetylcholine receptor; DS-AChR, deter- gent-solubilized acetylcholine receptor; MB-AChR, membrane-bound acetylcholine receptor; ACh, acetylcholine; Ntx, neurotoxin; Cbt, co- brotoxin from Naja naja atra; Nmm I, neurotoxin I from Naja mos- sambica mossambica; Tx a, toxin a from Naja nigricollis; Nhm 6 , toxin CM-6 from Naja haje haje; Nhh loa, toxin CM-loa from Naja haje haje; Nha 10, toxin CM-10 from Naja haje annulifera; Nha 12, toxin CM-12 from Naja haje annulifera; Nha 14, toxin CM-14 from Naja haje annulifera; Nm d, toxin d from Naja melanoleuca; Nn i3, toxin @ from Naja niuea; Djk Vn-11, toxin Vn-I1 from Dendroaspis jamesoni kaimosae; Dpp a, toxin a from Dendroaspis polylepis polylepis; Hh 11, toxin I1 from Hemachatus haemachatus; Hh IV, toxin IV from Hema- chatus haemachatus; Aa c, Acanthophis antarcticus c from Acanthophis antarcticus; AI a, Aipysurus laevis a from Aipysurus laevis; AI b, Aip- ysurus laevis from Aipysurus laeuis; AI c, Aipysurus laevis c from Sip- ysurus laevis; Lc 11, Laticauda colubrina I1 from Laticauda colubrina; Lc c, Laticauda colubrina c from Laticauda colubrina; Lc d, Laticauda colubrina d from Laticauda colubrina; LI c, Laticauda laticaudata c from Laticauda laticaudata; LI b, laticotoxin b from Laticauda laticaudata; Lcr c, Laticauda crockeri c from Laticauda crockeri; Ea, erabutoxin a from Laticauda semifasciata; As a, Astrotia stokesii a from Astrotia stokesii; a-Bgt, a-bungarotoxin from Bungarus multicinctus; Tx B, toxin B from Naja naja; Dpp 6 , toxin 6 from Dendmaspis polylepis polylepis; Oh b, toxin b from Ophiophagus hannah; As b, Astrotia stokesii b from Astrotia stokesii; Lc a, Laticauda colubrina a from Laticauda colubrina; Lc b, Laticauda colubrina b from Laticauda colubrina; Ls 111, Laticauda semifasciata 111 from Laticauda semifasciata; NMR, nuclear magnetic resonance; CD, circular dichroism; Tris-HC1, tris(hydroxymethy1)- aminomethane hydrochloride; EDTA, ethylenediaminetetraacetic acid; EGTA, ethylene glycol bis(j3-aminoethyl ether)-N,N,N’,N’-tetraacetic acid.
ligands (Meunier et al., 1974; Maelicke et al., 1977; Haggerty & Froehner, 1981; Mishina et al., 1985). However, unlike ACh, the neurotoxin binding does not lead to channel opening (Miller et al., 1978). The binding of Ntx to AChR is very tight (Weber & Changeux, 1974); that is, the dissociation constant of AChR-Ntx is in the range of 10-9-10-11 M while that of AChR-ACh is about 3 orders of magnitude larger. Although the utilization of Ntx as a specific probe for AChR has contributed to the understanding of the receptor structure and function greatly, the molecular mechanism and functional consequences of toxin-receptor interaction are still uncertain.
Snake neurotoxins form a large family of homologous proteins, which are further divided into two subgroups, namely, short neurotoxins with 60-62 amino acid residues and long neurotoxins with 66-74 amino acid residues. Crystal structures are available for the short neurotoxin erabutoxin b (Eb) (Kimball et al., 1979) and the long neurotoxins a-cobratoxin from Naja naja siamensis (Walkinshaw et al., 1980) and a-bungarotoxin (a-Bgt) (Agard & Stroud, 1982). These three neurotoxins in the crystalline state are in similar molecular conformations, forming a flat hand-shaped disc consisting of three loops of polypeptide chain cross-linked with four disulfide bridges (Figure 1). The loops constitute a three-stranded antiparallel @-sheet structure. Most of the conserved residues, e.g., Lys-27, Trp-29, Asp-31, His-33 or Phe-33, Arg-37, Lys-53, etc., are functionally important and lie on the concave surface of the molecule.
In this study we measured the kinetics of the fluorescence change of AChR on Ntx binding, which reflects the binding process of Ntx to AChR. The transient fluorescence change in the range of milliseconds to minutes was successfully monitored by a stopped-flow technique for 28 short neurotoxins and 8 long neurotoxins (for the sequences, see Table I). These toxins share high sequence homology and thus allowed us to study the relationship between their amino acid sequences and binding properties. The structural factors of neurotoxins that control the kinetics of Ntx-AChR association will be discussed.
B I N D I N G K I N E T I C S O F N E U R O T O X I N W I T H A C H R V O L . 2 5 , N O . 2 , 1 9 8 6 397
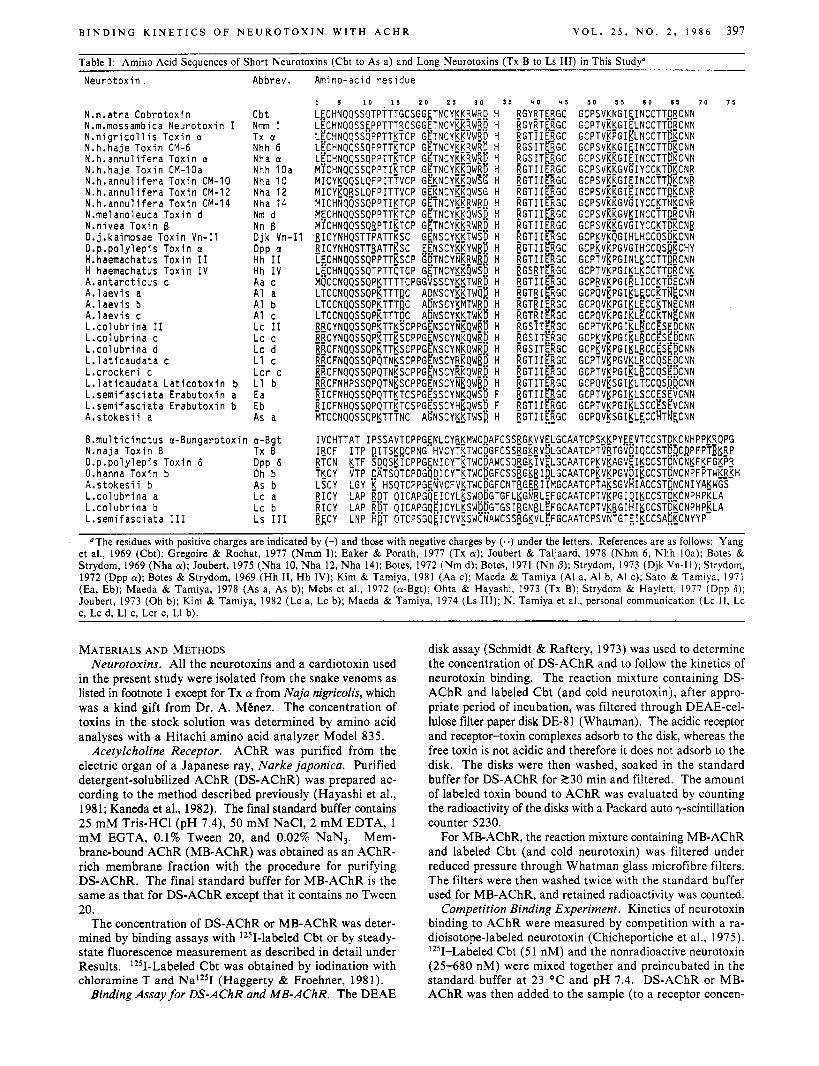
Table I: Amino Acid Sequences of
N e u r o t o x i n
N.n.at ra Cobro tox in N.m.mossambica N e u r o t o x i n I N . n i g r i c o l l i s T o x i n a N.h.haje T o x i n CM-6 N .h .annu l i f e ra T o x i n a N.h.haje T o x i n CM-loa N .h .annu l i f e ra T o x i n CM-10 N . h . a n n u l i f e r a T o x i n CM-12 N .h .annu l i f e ra T o x i n CM-14 N.melanoleuca T o x i n d N.nivea T o x i n 5 D.j .kaimosae T o x i n Vn-I1 D.p.poly lep is Tox in a H.haemachatus T o x i n I 1 H haemachatus T o x i n I V A . a n t a r c t i c u s c A . l a e v i s a A . l a e v i s b A . l a e v i s c L - c o l u b r i n a I 1 L . c o l u b r i n a c L . c o l u b r i n a d L . l a t i c a u d a t a c L . c r o c k e r i c L . l a t i c a u d a t a L a t i c o t o x i n b L . s e m i f a s c i a t a E r a b u t o x i n a L . s e m i f a s c i a t a E r a b u t o x i n b A . s t o k e s i i a
Short Neurotoxins (Cbt to As a) and Long Neurotoxins (Tx B to L s 111) in This StudyD
Abbrev. Amino-acid residue
7 0
Cbt Nmm I Tx a Nhh 6 Nha a Nhh 10a Nha 10 Nha 12 Nha 14 Nm d Nn 5
DPP a Hh I 1 Hh I V Aa c A1 a A1 b A1 c Lc I 1 Lc c Lc d L1 c L c r c L1 b Ea Eb As a
D jk Vn- I1
3 5
H H H H H H H H H H H H H H H H H H H H H H H H H F F H
4 0 4 5
RGYRTEqGC F! GY ET LJGC RGTIIERGC
RGS ITE_RGC _RGT I I E l G C RGTIIE_RGC RGTIIERGC
BGS I TFGJ GC
R G T I IGGC PGTI I@GC
RGTI I ~ G C RGTII~GC [GTII@GC g GS RT~JGC
BGTRI~GC RGTBIZRGC ~ ~ G S I T ~ ~ ~ G C
RGS ITFL'GC RGTII~T~GC RGTITQGC BGTI IDGC RGTI @GC
RGTIIERGC
RGTIIERGC
RGTRIERGC
RGSITERGC
RGTIIERGC
RGTIIERGC
-
7 5
B . m u l t i c i n c t u s a -Bungaro tox in a-Bgt IVCHTTAT IPSSAVTCPPGENLCYS_KMWCDAFCSS_RG_KVVELGCAATCPS_K_KPYE~VTCCST~~CNHPP_K~qPG
D .p .po ly lep i s T o x i n 6 Dpp 6 RTCN KTF S ' D Q S E l C P P G E N I C Y T E T W C b ' A W C S q ~ G _ K I V ~ L G C A A T C P K V K A G V E I K C C S T D N C N ~ F K F G K P ~ O.hanna Tox in b Oh b f K C Y TTP ~ ~ T S Q T C P D G q ~ I C Y T K T W C ~ G F C S S _ R G ~ ~ I ~ L G C A A T C P ~ V _ K P G V D I ~ C C S T D N C N P F ~ T W K R K H A . s t o k e s i i b As b LSCY LGY H S Q T C P P G E N V C F V _ K T W C D G F C N T ~ G ~ B I I M G C A A T C P T A K S G V ~ I A C C S T ~ N C N I Y A _ K W ~ ~ - L . c o l u b r i n a a Lc a R I C Y LAP RDT QICAPGqEICYLKSWDBGTGFLKGNBLEFGCAATCPTV_KPGI~I~CCSTDKCNPHPKLA L . c o l u b r i n a b Lc b [ I C Y LAP RDT q I C A P G q E I C Y L K S W i S b T G S I _ R G N B L ~ F G C A A T C P T V _ K I j G I H I _ K C C S T ' d ~ C N P H P R L A L . s e m i f a s c i a t a I11 Ls 111 &CY LNP HDT Q T C P S G q ~ I C Y V ~ S W C N A W C S S g c Y V L ~ F G C A A T C P S V N T G T ~ I K C C S A ~ ~ C N Y Y P -
N.naja T o x i n B Tx B ISCF ITP DITSKDCPNG"HVCYTKTWCDGFCSSBG_KRVDLGCAATCPTV~TGVDIQCCST~DCRPFPTB~_RP
"The residues with positive charges are indicated by (-) and those with negative charges by (.e) under the letters. References are as follows: Yang et al., 1969 (Cbt); Gregoire & Rochat, 1977 (Nmm I); Eaker & Porath, 1977 (Tx a) ; Joubert & Taljaard, 1978 (Nhm 6, Nhh loa); Botes & Strydom, 1969 (Nha a) ; Joubert, 1975 (Nha 10, Nha 12, Nha 14); Botes, 1972 (Nm d); Botes, 1971 (Nn 0); Strydom, 1973 (Djk Vn-11); Strydom, 1972 (Dpp a) ; Botes & Strydom, 1969 (Hh 11, Hh IV); Kim & Tamiya, 1981 (Aa c); Maeda & Tamiya (AI a, AI b, AI c); Sato & Tamiya, 1971 (Ea, Eb); Maeda & Tamiya, 1978 (As a, As b); Mebs et al., 1972 (a-Bgt); Ohta & Hayashi, 1973 (Tx B); Strydom & Haylett, 1977 (Dpp 6); Joubert, 1973 (Oh b); Kim & Tamiya, 1982 (Lc a, Lc b); Maeda & Tamiya, 1974 ( L s 111); N. Tamiya et al., personal communication (Lc 11, L c c. Lc d. LI c. Lcr c. LI b).
MATERIALS AND METHODS Neurotoxins. All the neurotoxins and a cardiotoxin used
in the present study were isolated from the snake venoms as listed in footnote 1 except for Tx a from Naja nigricolis, which was a kind gift from Dr. A. Minez. The concentration of toxins in the stock solution was determined by amino acid analyses with a Hitachi amino acid analyzer Model 835.
Acetylcholine Receptor. AChR was purified from the electric organ of a Japanese ray, Narke japonica. Purified detergent-solubilized AChR (DS-AChR) was prepared ac- cording to the method described previously (Hayashi et al., 1981; Kaneda et al., 1982). The final standard buffer contains 25 mM Tris-HC1 (pH 7.4), 50 mM NaCl, 2 mM EDTA, 1 mM EGTA, 0.1% Tween 20, and 0.02% NaN,. Mem- brane-bound AChR (MB-AChR) was obtained as an AChR- rich membrane fraction with the procedure for purifying DS-AChR. The final standard buffer for MB-AChR is the same as that for DS-AChR except that it contains no Tween 20.
The concentration of DS-AChR or MB-AChR was deter- mined by binding assays with 1251-labeled Cbt or by steady- state fluorescence measurement as described in detail under Results. lZS1-Labeled Cbt was obtained by iodination with chloramine T and NalZ51 (Haggerty & Froehner, 1981).
Binding Assay for DS-AChR and MB-AChR. The DEAE
disk assay (Schmidt & Raftery, 1973) was used to determine the concentration of DS-AChR and to follow the kinetics of neurotoxin binding. The reaction mixture containing DS- AChR and labeled Cbt (and cold neurotoxin), after appro- priate period of incubation, was filtered through DEAE-cel- lulose filter paper disk DE-81 (Whatman). The acidic receptor and receptor-toxin complexes adsorb to the disk, whereas the free toxin is not acidic and therefore it does not adsorb to the disk. The disks were then washed, soaked in the standard buffer for DS-AChR for 230 min and filtered. The amount of labeled toxin bound to AChR was evaluated by counting the radioactivity of the disks with a Packard auto y-scintillation counter 5230.
For MB-AChR, the reaction mixture containing MB-AChR and labeled Cbt (and cold neurotoxin) was filtered under reduced pressure through Whatman glass microfibre filters. The filters were then washed twice with the standard buffer used for MB-AChR, and retained radioactivity was counted.
Competition Binding Experiment. Kinetics of neurotoxin binding to AChR were measured by competition with a ra- dioisotope-labeled neurotoxin (Chicheportiche et al., 1975). lZ5I-Labeled Cbt (5 1 nM) and the nonradioactive neurotoxin (25-680 nM) were mixed together and preincubated in the standard buffer at 23 OC and pH 7.4. DS-AChR or MB- AChR was then added to the sample (to a receptor concen-

398 B I O C H E M I S T R Y E N D 0 E T A L .
tration of 20 nM) to initiate the reaction and incubated for 10 min, which was long enough to reach a high degree of complex formation. The amount of labeled toxin bound to AChR was then determined by the binding assay described above.
Fluorescence Measurement. Steady-state fluorescence was measured on a Hitachi 850 spectrofluorometer at 20 OC. The time dependence of the fluorescence intensity was followed with a Union Giken stopped-flow spectrophotometer, RA-401. After a rapid mixing of equal volumes of the solution of Ntx (2.0 pM) and AChR (0.28 pM), the sample solution was led into a 2-mm quartz cell, and the time-dependent change of fluorescence intensity was monitored by the stopped-flow method. The fluorescence was excited at 280 nm and observed through a Hoya Y33 cut-off filter, which allowed emitted light with wavelengths longer than 330 nm to come into the detector. For each measurement, 6-18 scans were accumulated in the computer memory to improve the signal-to-noise ratio. One to five independent measurements with different sampling were carried out for each neurotoxin. The time dependence of fluorescence change was analyzed by a least-squares method on a Hitachi M-280H computer of the University of Tokyo.
Treatment of Kinetic Data. Neurotoxins are known to bind to both of the two a-subunits of AChR. However, to simplify the calculation, the receptor concentration will be expressed in moles of toxin-binding sites.
The simplest reaction scheme for the association of AChR and neurotoxin (Ntx) is given by
k
kb AChR + Ntx AChReNtx (1)
where kf and kb are the forward and backward rate constants of the reaction, respectively. When the initial concentration of neurotoxin, [Ntx],, is much higher than that of AChR, [AChRIo, the reaction follows the pseudo-first-order kinetics and the apparent rate constant kobsd is expressed as
kobsd = kf[NtxlO + kb (2) The dissociation constant Kd (=kb/kf) of reaction 1 is esti- mated to be smaller than M (Weber & Changeux, 1974; Ishikawa et al., 1977), and [Ntx], N 1.0 X low6 M. The apparent rate constant, kobsd, is then approximated by
kobsd = kf[Ntx10 (3) If the association of AChR and a neurotoxin is accompanied
by a fluorescence change, the kinetic parameter kobsd may be directly obtained by the stopped-flow fluorescence measure- ment. The semilogarithmic plot of the fluorescence change against time will give a straight line whose slope is kobs,j.
In the competition binding experiment of labeled Cbt and a nonradioactive neurotoxin with AChR, the association re- action is described as
k'
kb*
k
AChR + Cbt* & AChR.Cbt*
AChR + Ntx & AChR-Ntx
(4a)
(4b)
where Cbt* is labeled Cbt and kf* and kb* are the association and dissociation rate constants of labeled Cbt. The period of incubation should be long enough for complex formation of all the receptor molecules but must not be long enough for significant replacement of labeled toxin from the receptor- labeled toxin complex by the nonradioactive toxin, or vice versa. In this study, incubation for 10 min fitted both the conditions. The association kinetics follows the relationship (Chicheportiche et al., 1975):
k b
where [Cbt]* and [Ntx] are the concentrations of free Cbt* and Ntx, respectively, and [Cbt*], and [Ntx], are the initial concentrations of Cbt* and Ntx, respectively. [Cbt*],, [Ntx],, and [AChR], are known, and [AChR.Cbt*] can be deter- mined by the binding assay described above. kf/kf* can be calculated from eq 5 with the relationships [Cbt*] = [Cbt*], - [AChR.Cbt*], [Ntx] = [Ntx], - [AChReNtx], and [AChR.Cbt*] + [AChR-Ntx] = [AChR],. Practically, [AChRIo and [Cbt*], are kept constant, and [Ntx], is varied. log ( [ N t ~ ] ~ / [ N t x ] ) is plotted against log ([Cbt*],/[Cbt*]), and then the slope of the straight line gives the ratio kf/kf*.
N M R Measurement. Proton nuclear magnetic resonance (NMR) spectra at 270 MHz were recorded on a Bruker WH-270 spectrometer. For the denaturation experiment, the neurotoxins were dissolved in 0.4 M deuterated acetate buffer at pH 4.5 with 0.1 M NaCl, and the temperature dependence of the NMR spectra was followed up to 98 OC. The dena- turation temperatures were determined by plotting the native or denatured fraction against temperature.
Hydrogen-deuterium exchange rates in 2 H z 0 solution at 37 "C were measured of slowly exchanging amide protons of various neurotoxins. The proteins were dissolved in 2H20 at pH 6.5, and preexchange was carried out for 1 h at 23 "C for removing the signals of fast-exchanging protons. Then, the temperature was raised to and kept at 37 "C, and the hy- drogen-deuterium exchange was monitored by measuring the amide proton resonance intensity at 23 "C at appropriate intervals.
RESULTS Competition Binding Experiment. First, the labeled-toxin
titration of AChR was carried out to determine the dissociation constant Kd of the toxin-receptor complex. An increasing amount of the 1251-labeled Cbt solution was added to a con- stant-concentration (20 nM) solution of DS-AChR or MB- AChR at 23 OC and pH 7.4. Scatchard plots of the binding data allowed us to obtain the dissociation constants as 4.9 X
M for DS-AChR and MB-AChR, re- spectively, with labeled Cbt.
The time course of the binding of labeled Cbt (50 nM) to DS-AChR (20 nM) was followed in the concentration range as used for the competition binding experiment. At 0.5 min after mixing of the toxin and the receptor, about 80% of the receptor was found to be saturated by the toxin. And, 3.5 min after mixing, nearly 100% saturation of the receptor was at- tained.
Then, a competition binding experiment was performed for DS-AChR and MB-AChR at 23 OC and pH 7.4. The as- sumption required for the present treatment of the kinetic data in the competition binding experiment is that there is only one class of binding sites for labeled and cold toxins in AChR. For most of the toxins, only a single phase of the reaction was observed in the fluoresence change kinetics on toxin binding to the receptor as described later. However, biphasic kinetics was observed for the binding of 1251-labeled a-Bgt to both DS-AChR and MB-AChR (Blanchard et al., 1979; Leprince et al., 1981), and we still do not know if there is any fast phase preceding the observed slow fluorescence change. Thus, we interpret the ratio of association rates, obtained by the treatment described under Materials and Methods, as the ratio of apparent association rates, (kf/kf*)app. The plot of log ( [NtxIo/ [Ntx]) against log ( [Ntx*Io/ [Ntx*]) exhibited little deviation from a straight line in the competition binding ex-
and 3.3 X
B I N D I N G K I N E T I C S O F N E U R O T O X I N W I T H A C H R V O L . 2 5 , N O . 2 , 1 9 8 6 399
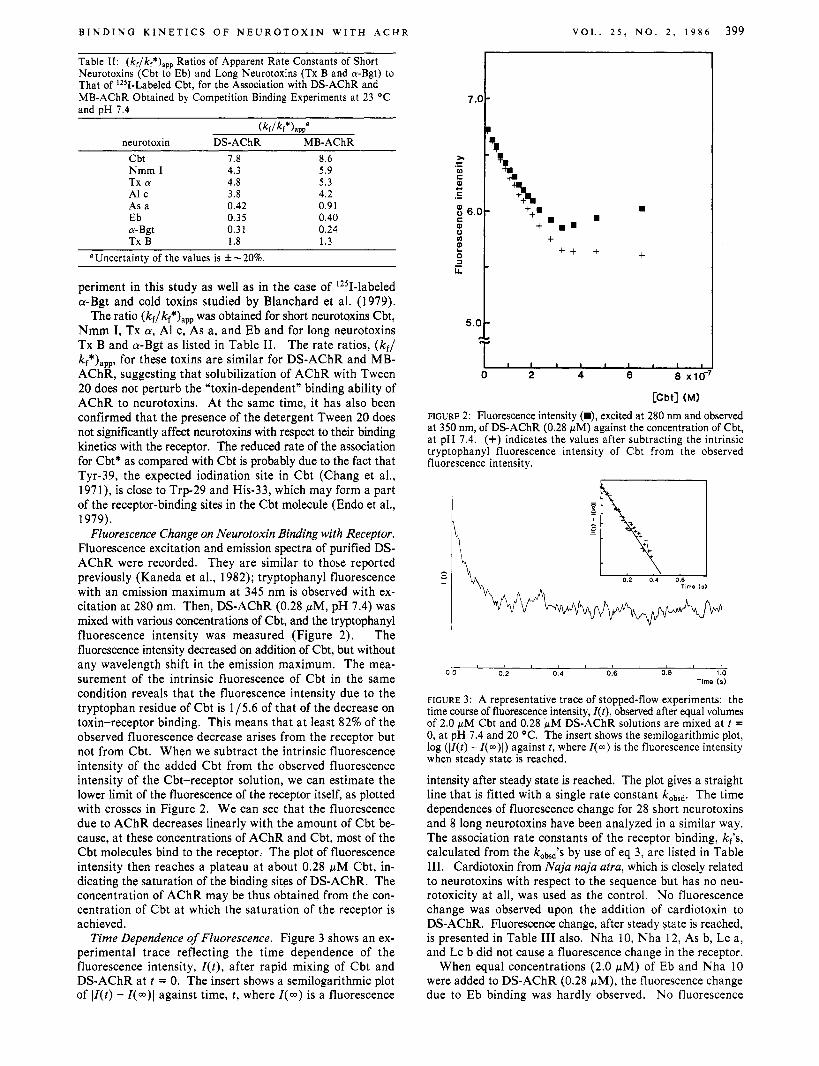
Table 11: ( k f / k r * ) a p p Ratios of Apparent Rate Constants of Short Neurotoxins (Cbt to Eb) and Long Neurotoxins (Tx B and a-Bgt) to That of I2’I-Labeled Cbt, for the Association with DS-AChR and MB-AChR Obtained by Competition Binding Experiments at 23 O C
and DH 7.4
( k f / k f * ) a p t
neurotoxin DS-AChR MB-AChR Cbt Nmm I Tx a AI c As a Eb
Tx B a-Bgt
7.8 4.3 4.8 3.8 0.42 0.35 0.31 1.8
8.6 5.9 5.3 4.2 0.91 0.40 0.24 1.3
“Uncertaintv of the values is *-2O%.
periment in this study as well as in the case of 1251-labeled a-Bgt and cold toxins studied by Blanchard et al. (1979).
The ratio (kf/kf*),, was obtained for short neurotoxins Cbt, Nmm I, Tx a, A1 c, As a, and Eb and for long neurotoxins Tx B and a-Bgt as listed in Table 11. The rate ratios, (kf/ kf*)app, for these toxins are similar for DS-AChR and MB- AChR, suggesting that solubilization of AChR with Tween 20 does not perturb the “toxin-dependent” binding ability of AChR to neurotoxins. At the same time, it has also been confirmed that the presence of the detergent Tween 20 does not significantly affect neurotoxins with respect to their binding kinetics with the receptor. The reduced rate of the association for Cbt* as compared with Cbt is probably due to the fact that Tyr-39, the expected iodination site in Cbt (Chang et al., 1971), is close to Trp-29 and His-33, which may form a part of the receptor-binding sites in the Cbt molecule (Endo et al., 1979).
Fluorescence Change on Neurotoxin Binding with Receptor. Fluorescence excitation and emission spectra of purified DS- AChR were recorded. They are similar to those reported previously (Kaneda et al., 1982); tryptophanyl fluorescence with an emission maximum at 345 nm is observed with ex- citation at 280 nm. Then, DS-AChR (0.28 pM, pH 7.4) was mixed with various concentrations of Cbt, and the tryptophanyl fluorescence intensity was measured (Figure 2). The fluorescence intensity decreased on addition of Cbt, but without any wavelength shift in the emission maximum. The mea- surement of the intrinsic fluorescence of Cbt in the same condition reveals that the fluorescence intensity due to the tryptophan residue of Cbt is 1/5.6 of that of the decrease on toxin-receptor binding. This means that at least 82% of the observed fluorescence decrease arises from the receptor but not from Cbt. When we subtract the intrinsic fluorescence intensity of the added Cbt from the observed fluorescence intensity of the Cbt-receptor solution, we can estimate the lower limit of the fluorescence of the receptor itself, as plotted with crosses in Figure 2. We can see that the fluorescence due to AChR decreases linearly with the amount of Cbt be- cause, at these concentrations of AChR and Cbt, most of the Cbt molecules bind to the receptor. The plot of fluorescence intensity then reaches a plateau at about 0.28 pM Cbt, in- dicating the saturation of the binding sites of DS-AChR. The concentration of AChR may be thus obtained from the con- centration of Cbt at which the saturation of the receptor is achieved.
Time Dependence of Fluorescence. Figure 3 shows an ex- perimental trace reflecting the time dependence of the fluorescence intensity, Z(t), after rapid mixing of Cbt and DS-AChR at t = 0. The insert shows a semilogarithmic plot of IZ( t ) - Z(m)I against time, t , where Z(m) is a fluorescence
I
‘z tr
+ + + + +
2 4 6 8 x l d
[Cbt] (MI
FIGURE 2: Fluorescence intensity (W), excited at 280 nm and observed at 350 nm, of DS-AChR (0.28 wM) against the concentration of Cbt, a t pH 7.4. (+) indicates the values after subtracting the intrinsic tryptophanyl fluorescence intensity of Cbt from the observed fluorescence intensity.
I k
0.2 0.4 0.6
0 0 0 2 0 4 0.6 0 8 1 0 Time (SI
FIGURE 3: A representative trace of stopped-flow experiments: the time course of fluorescence intensity, Z(t), observed after equal volumes of 2.0 fiM Cbt and 0.28 wM DS-AChR solutions are mixed at t = 0, at pH 7.4 and 20 O C . The insert shows the semilogarithmic plot, log ( IZ ( t ) - Z(m)l) against t, where I ( m ) is the fluorescence intensity when steady state is reached.
intensity after steady state is reached. The plot gives a straight line that is fitted with a single rate constant kobsd. The time dependences of fluorescence change for 28 short neurotoxins and 8 long neurotoxins have been analyzed in a similar way. The association rate constants of the receptor binding, kf‘s, calculated from the kobsd’s by use of eq 3, are listed in Table 111. Cardiotoxin from Nuju nuju atra, which is closely related to neurotoxins with respect to the sequence but has no neu- rotoxicity at all, was used as the control. No fluorescence change was observed upon the addition of cardiotoxin to DS-AChR. Fluorescence change, after steady state is reached, is presented in Table I11 also. Nha 10, Nha 12, As b, Lc a, and Lc b did not cause a fluorescence change in the receptor.
When equal concentrations (2.0 pM) of Eb and Nha 10 were added to DS-AChR (0.28 wM), the fluorescence change due to Eb binding was hardly observed. No fluorescence
400 B I O C H E M I S T R Y E N D 0 ET A L .
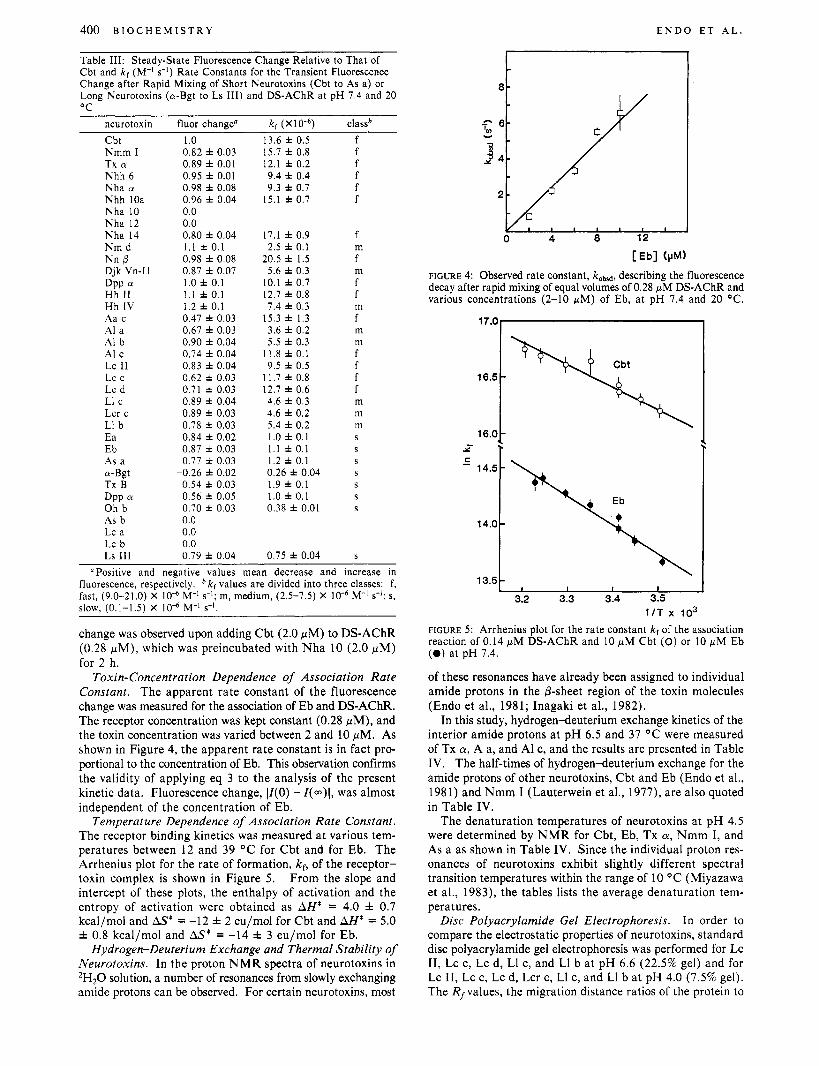
Table 111: Steady-State Fluorescence Change Relative to That of Cbt and kl (M-I s-I) Rate Constants for the Transient Fluorescence Change after Rapid Mixing of Short Neurotoxins (Cbt to As a) or Long Neurotoxins (a-Bgt to Ls 111) and DS-AChR at pH 7.4 and 20 OC
neurotoxin fluor changeo kf (XlO“) class’ Cbt Nmm I Tx a Nhh 6 Nha a Nhh 10a Nha 10 Nha 12 Nha 14 Nm d
Djk Vn-I1
Hh I1 Hh IV Aa c AI a AI b AI c Lc 11 Lc c Lc d LI c Lcr c L1 b Ea Eb As a
Tx B DPP ff Oh b As b Lc a Lc b Ls 111
Nn P
DPP a
a-Bgt
1 .o 0.82 i 0.03 0.89 f 0.01 0.95 f 0.01 0.98 i 0.08 0.96 i 0.04 0.0 0.0 0.80 f 0.04 1.1 f 0.1 0.98 i 0.08 0.87 i 0.07 1.0 f 0.1 1.1 i 0.1 1.2 i 0.1 0.47 i 0.03 0.67 i 0.03 0.90 i 0.04 0.74 i 0.04 0.83 f 0.04 0.62 f 0.03 0.71 f 0.03 0.89 i 0.04 0.89 i 0.03 0.78 f 0.03 0.84 i 0.02 0.87 i 0.03 0.77 1 0 . 0 3
-0.26 i 0.02 0.54 f 0.03 0.56 f 0.05 0.70 f 0.03 0.0 0.0 0.0 0.79 f 0.04
13.6 f 0.5 15.7 f 0.8 12.1 h 0.2 9.4 i 0.4 9.3 f 0.7
15.1 i 0.7
17.1 i 0.9 2.5 i 0.1
20.5 f 1.5 5.6 f 0.3
10.1 f 0.7 12.7 i 0 . 8 7.4 i 0.3
15.3 i 1.3 3.6 i 0.2 5.5 f 0.3
11.8 f 0.1 9.5 i 0.5
11.7 i 0.8 12.7 i 0.6 4.6 i 0.3 4.6 f 0.2 5.4 i 0.2 1.0 i 0.1 1.1 f 0.1 1.2 f 0.1 0.26 i 0.04 1.9 i 0.1 1.0 i 0.1 0.38 I 0.01
0.75 i 0.04
f f f f f f
f m f m f f m f m m f f f f m m m S
S
S
S
S
S S
S
RPositive and negative values mean decrease and increase in fluorescence, respectively. kf values are divided into three classes: f , fast, (9.0-21.0) X IO” M” s-l; m, medium, (2.5-7.5) X 10” M-I S-I. 9 1 s slow. (0.1-1.5) X 10” M-’ S - ’ .
change was observed upon adding Cbt (2.0 pM) to DS-AChR (0.28 pM), which was preincubated with Nha 10 (2.0 pM) for 2 h.
Toxin-Concentration Dependence of Association Rate Constant. The apparent rate constant of the fluorescence change was measured for the association of Eb and DS-AChR. The receptor concentration was kept constant (0.28 pM), and the toxin concentration was varied between 2 and 10 pM. As shown in Figure 4, the apparent rate constant is in fact pro- portional to the concentration of Eb. This observation confirms the validity of applying eq 3 to the analysis of the present kinetic data. Fluorescence change, IZ(0) - I(..)\, was almost independent of the concentration of Eb.
Temperature Dependence of Association Rate Constant. The receptor binding kinetics was measured at various tem- peratures between 12 and 39 OC for Cbt and for Eb. The Arrhenius plot for the rate of formation, kf, of the receptor- toxin complex is shown in Figure 5. From the slope and intercept of these plots, the enthalpy of activation and the entropy of activation were obtained as AH* = 4.0 f 0.7 kcal/mol and AS* = -12 f 2 eu/mol for Cbt and AH* = 5.0 f 0.8 kcal/mol and AS* = -14 f 3 eu/mol for Eb.
Hydrogen-Deuterium Exchange and Thermal Stability of Neurotoxins. In the proton NMR spectra of neurotoxins in 2 H 2 0 solution, a number of resonances from slowly exchanging amide protons can be observed. For certain neurotoxins, most
FIGURE 4: Observed rate constant, kobad, describing the fluorescence decay after rapid mixing of equal volumes of 0.28 pM DS-AChR and various concentrations (2-10 pM) of Eb, a t pH 7.4 and 20 OC.
16.5 -
16.0 -
1 I T x I O 3 FIGURE 5: Arrhenius plot for the rate constant kf of the association reaction of 0.14 pM DS-AChR and 10 pM Cbt (0) or 10 pM E b (0 ) a t p H 7.4.
of these resonances have already been assigned to individual amide protons in the P-sheet region of the toxin molecules (Endo et al., 1981; Inagaki et al., 1982).
In this study, hydrogen-deuterium exchange kinetics of the interior amide protons at pH 6.5 and 37 OC were measured of Tx a, A a, and A1 c, and the results are presented in Table IV. The half-times of hydrogen-deuterium exchange for the amide protons of other neurotoxins, Cbt and Eb (Endo et al., 1981) and Nmm I (Lauterwein et al., 1977), are also quoted in Table IV.
The denaturation temperatures of neurotoxins at pH 4.5 were determined by N M R for Cbt, Eb, Tx cy, Nmm I, and As a as shown in Table IV. Since the individual proton res- onances of neurotoxins exhibit slightly different spectral transition temperatures within the range of 10 OC (Miyazawa et al., 1983), the tables lists the average denaturation tem- peratures.
In order to compare the electrostatic properties of neurotoxins, standard disc polyacrylamide gel electrophoresis was performed for Lc 11, Lc c, Lc d, L1 c, and L1 b at pH 6.6 (22.5% gel) and for Lc 11, Lc c, Lc d, Lcr c, LI c, and L1 b at pH 4.0 (7.5% gel). The R,values, the migration distance ratios of the protein to
Disc Polyacrylamide Gel Electrophoresis.

B I N D I N G K I N E T I C S O F N E U R O T O X I N W I T H A C H R V O L . 2 5 , N O . 2 , 1 9 8 6 401
except for Aa c. But for long neurotoxins, the decrease in fluorescence is much smaller than that for short neurotoxins, and the fluorescence even increases in the case of a-Bgt. The steady-state fluorescence change relative to that of Cbt is between -0.3 and 0.8 for long neurotoxins. These findings indicate that the binding mode to the receptor is somewhat different between short and long neurotoxins.
In Table I11 we also find that no fluorescence change is induced in the receptor by the binding of the short neurotoxins Nha 10 and Nha 12 or of the long neurotoxins Lc a, Lc b, and As b. This observation could be interpreted in two ways: these neurotoxins do not bind to AChR, or they do bind to the receptor without causing a change in fluorescence. With concern to the lethal toxicity of the neurotoxins used in the present work, Nha 10, Nha 12 (Joubert, 1975), Ls I11 (Maeda & Tamiya, 1974), and Oh b (Joubert, 1973) have reduced neurotoxicity; LD,, values are 5.0, 63, 0.85, and 0.35 pg/g of mouse for Nha 10, Nha 12, Ls 111, and Oh b, respectively. Therefore, long neurotoxins Ls I11 and Oh b with weak neu- rotoxicity can bind to AChR and Lc a, Lc b, and As b with full toxicity bind to AChR without causing any fluorescence change in the receptor.
A weak short neurotoxin, Nha 10, was found to bind to AChR in a competitive manner with Eb. Once Nha 10 makes a complex with AChR, Nha 10 could not be easily replaced from the complex by Cbt. These observations suggest that, in spite of its weak neurotoxicity, Nha 10 can still bind to AChR with sufficiently high affinity. This is consistent with the results of the test of Nha 10 for neuromuscular activity on chick biventer cervicis nerve-muscle preparations (Harvey et al., 1984). Comparison of amino acid sequences (Table I) allows us to find that Asp-3 1, which is conserved in most of the neurotoxins except for Nha 10 and Nha 12 with Gly-31, is probably involved in the toxin-receptor interaction specific to blocking the neuromuscular transmission. Asp-3 1 (or Asn-31 in Ls 111) appears to be also responsible for the tox- in-induced conformational change in the receptor, which ac- companies fluorescence change as observed in this study. However, interestingly, the substitution of Asp-3 1 to Gly-3 1 in Nha 10 does not alter the binding ability of Nha 10 to AChR.
Another weak short neurotoxin with Gly-3 1, Nha 12, does not cause fluorescence change in AChR either. In this case, when equal concentrations of Eb and Nha 12 were added to AChR or when Cbt was added to AChR that was preincu- bated with Nha 12, fluorescence change was observed but with much lower rates than those for Eb or Cbt binding to AChR without Nha 12 (T. Endo et al., unpublished results). Thus, Nha 12 can also bind to AChR but with significantly reduced affinity, which may then result in low neurotoxicity. The difference in the neurotoxicity and the affinity with AChR between Nha 10 and Nha 12 should be due to the single substitution of Gln-7 in Nha 10 to Arg-7 in Nha 12. Thus, Gln-7 or Pro-7 in most of the short neurotoxins except for Nha 12 is likely important for tight binding with AChR.
Transient Fluorescence Change. The apparent second-order rate constant k f describing the neurotoxin binding to the re- ceptor was directly obtained by the stopped-flow fluorescence measurement and is listed in Table 111. The fluorescence change in Figure 3 is closely related to a single rate constant, kP The rather small values of kf for simple bimolecular as- sociation suggest that the binding process presumably involves some conformational change.
We now extend reaction 1 to those involving a conforma- tional change in the receptor. Conformational changes may
Table IV: Td ("C), Average Denaturation Temperatures, and Half-Times (h) of Hydrogen-Deuterium Exchange Reactions of Interior Amide Protons" for Short Neurotoxins
distribution of half-timesc neurotoxin T~~ > I O O 100-10 1 ~ 1 - 1 ~ 10-0 .1~
Cbt 62 0 0 11 N m m I 80 4 8-9 10 Tx CY 85 1 4 6 AI c e 4 5 2 Eb 63 0 0 9 As a 80 3 7 2
Half-times of hydrogen-deuterium exchange are quoted: Cbt and Eb (Endo et al., 1981); Nmm I (Lauterwein et al., 1977). bAt pH 4.5. 'Numbers of protons are shown. At pH 6.2 and 35 "C for Nmm I and at pH 6.5 and 37 "C for others. dOverlapping ranges. eDenaturation experiment was not performed.
the front, were obtained as 0.40 (Lc 11), 0.44 (Lc c), 0.45 (Lc d), 0.32 (L1 c), and 0.33 (L1 b) at pH 6.6 and 0.75 (Lc 11), 0.75 (Lc c), 0.78 (Lc d), 0.67 (Lcr c), 0.65 (L1 c), and 0.63 (L1 b) at pH 4.0.
DISCUSSION Origin of Fluorescence Change. The binding of neurotoxins
to AChR is described by reaction 1. This process probably involves a conformational change in neurotoxin and/or AChR. The conformational change may enhance the affinity of the neurotoxin and the receptor by an optimum rearrangement of their local structures and/or allow them to produce a mu- tually locked complex.
Previously, association kinetics was compared for various neurotoxins with AChR by performing a competition binding experiment of radioisotope-labeled and cold neurotoxins in the complex with AChR (Chicheportiche et al., 1975). In this study, a similar approach was taken at first. The relative apparent on-rates of neurotoxin binding to the receptor were obtained (Table 11), with 1251-labeled Cbt as a reference, in the competition binding experiment. We can clearly see that the neurotoxins are classified into three groups with respect to their apparent association rates with AChR; Cbt, Nmm I, Tx a , and A1 c show large values of (kf/kf*),,, while As a, Eb, and a-Bgt exhibit much smaller rate ratios and Tx B is in between the two groups. This is in good correlation with the classification of the apparent rate constants of fluorescence change after rapid mixing of neurotoxin with AChR (Table 111), which were obtained by the stopped-flow technique. Thus, the observed change of fluorescence intensity is reasonably ascribed to the process of toxin-receptor association, which probably accompanies a conformational change as discussed later.
Furthermore, we find that the fluorescence change is mainly due to the Trp residues in AChR because the decrease in fluorescence intensity is much larger than the intrinsic fluorescence of neurotoxin itself (Figure 2). The a-subunits of the Torpedo californica AChR (Noda et al., 1982) and the Torpedo marmorata AChR (Sumikawa et al., 1982; Devil- lers-Thiery et al., 1983) contain eight Trp residues in their putative extracellular portions. Some of these Trp residues, if conserved in AChR of Narkejaponica, will be responsible for the fluorescence change upon neurotoxin binding observed in the present study.
Steady-State Fluorescence Change. The steady-state fluorescence change (Table 111) reveals the different effect on the receptor by the binding of two classes of toxins, namely, short and long neurotoxins. Short neurotoxins decrease the fluorescence intensity of AChR, and the fluorescence change relative to that of Cbt is in the range between 0.6 and 1.2,
402 B I o c H E M I s T R Y E N D 0 E T A L .
as indicated with “s”, “m”, and “P while kf‘s of long neuro- toxins have relatively small values as shown with only “s”. Previously, Ishikawa et al. (1977) compared the equilibrium dissociation constants Kd of a toxin-DS-AChR complex. In their experiments, Kd’s were obtained by a competition binding experiment with the incubation of the reaction mixture for as long as 46.5 h at 20-22 OC, which was expected to be long enough to achieve equilibria between the receptor-toxin com- plex and the labeled and cold toxins. We have found that this assumption does not hold for certain neurotoxins; an equilib- rium state cannot be reached with labeled neurotoxin and DS-AChR even after a 200-h incubation of the reaction mixture at 23 OC (T. Endo et al., unpublished experiments). However, we may at least examine whether there is any correlation between the equilibrium constants, Kd, and rate constants, kf, for various neurotoxins. Ishikawa et al. (1977) found the Kd values of neurotoxins to be in the order Cbt < AI c C A1 a N Tx a < A1 b N Eb < Ec < Ea < a-Bgt < Ls 111. The tendency of this rank order is well correlated with that of the association rate constants obtained in this study. Therefore, the affinity of neurotoxin binding to the receptor seems to be reflected in kf, the on-rate, rather than kb, the off-rate.
Conformational Change in AChR. Since the two groups of neurotoxins, long and short neurotoxins, are even more homologous within each group, we hereafter confine direct comparison of kf values only to short neurotoxins. First, temperature dependences of kf‘s were compared between the two short neurotoxins Cbt and Eb. The results show that the receptor binding is characterized by the enthalpy of activation AH* = 4.0 f 0.7 kcal/mol and the entropy of activation AS* = -12 f 2 eu/mol for Cbt and AH* = 5.0 f 0.8 kcal/mol and AS* = -14 f 3 eu/mol for Eb. The difference in kf between Cbt and Eb originates not only from the entropic term but also from the enthalpic term of activation in the association reaction. This is consistent with the indication of the con- formational change induced in the receptor, described in the preceding section. Maelicke et al. (1977) also suggested the change in the conformation of AChR from the thermodynamic analyses of the toxin-receptor binding.
AChR is known to undergo a conformational change on binding with small agonists or antagonists, and this change can be detected by monitoring the fluorescence change of the receptor on ligand binding (Bonner et al., 1976; Barrantes, 1978; Kaneda et al., 1982). Most of the agonists quench the intrinsic fluorescence of the receptor (Kaneda et al., 1982), as short neurotoxins do. However, the different pharmaco- logical action for the two classes of the ligands, nicotinic agonists and neurotoxins as antagonists, implies that the re- sulting conformations after ligand binding are different in the two cases. The conformational change induced by the neu- rotoxin binding will not lead to the channel activation of AChR.
Role of Positive Charge on Residues 27 and 30. Now it is intriguing to know how the association rates of short neu- rotoxins are controlled. Previously, on the basis of the limited data available at that time (Chicheportiche et al., 1975), we proposed a hypothesis that the overall structural rigidity, re- flected in the amide proton exchange rates, of long and short neurotoxins is related to the reversibility of the binding; the more rigid toxins are the less reversible (Endo et al., 1981). However, this does not seem to be valid for the receptor binding of short neurotoxins. In Table IV, half-times of hy- drogen-deuterium exchange of interior amide protons and overall denaturation temperatures are listed for several neu-
occur either prior to or subsequent to the Ntx binding: mechanism I
k - AChR + Ntx & AChR-Ntx (6b)
k-1
mechanism I1 ki - k
k-1 k-2 AChR + Ntx .& AChR-Ntx e AChRSNtx (7)
We consider only the conformational change in AChR, where AChR represents the receptor after a conformational change.
In mechanism I, if the preequilibrium isomerization of the receptor is sufficiently rapid, the apparent first-order rate constant for the reaction is given by
[Ntx], + k-2 k2
1 + k-l/kl kobsd =
If there is a rapid association reaction followed by a slower unimolecular isomerization of the complex (mechanism II), the rate of the reaction may follow the two first-order kinetics. The first-order rate constant for the first step is expressed as follows and will show a linear dependence on the concentration of Ntx:
kfast = kl[N:x]o + k-1 (9) The first step of the reaction may not be observed in the stopped-flow fluorescence measurement, if fluorescence change is not associated with this bimolecular association reaction or the initial phase is too rapid to be measured by the stopped- flow technique. The first-order rate constant for the slower conversion of AChRSNtx - AChR-Ntx is expressed as
At high concentration of Ntx, ksl0, should tend toward a plateau with a value equal to k2 + k-2. However, when k-l/k-l >> [Ntx],, kslOw will show a linear dependence upon the con- centration of Ntx:
Equations 8 and 11 are apparently identical with eq 2. In both cases, if k-, is negligible, the plots of the apparent first-order rate constant vs. concentration of Ntx will be linear, as observed in Figure 4. However, the slope of the plot, kf in Table 111, is reduced to k2/(l + k-,/k,) in mechanism I and to k2kl/k-l in mechanism 11. Thus, the rather small values of kf in Table I11 may be compatible with either mechanism I or mechanism 11.
In mechanism 11, if the preceding rapid bimolecular asso- ciation is associated with fluorescence change within the time resolution of the stopped-flow technique (1-2 ms), the fast phase of the reaction will change the fluorescence intensity at t = 0, resulting in that the observed fluorescence change, II(0) - I (m) l , depends on k, and [Ntx],. However, this is not the present case since the fluorescence change for Eb does not depend on the concentration of Eb.
In Table I11 we can see that neurotoxins show surprisingly a large distribution of rate constants. In addition, there is a tendency, as previously pointed out, that short neurotoxins associate with the receptor much faster than long neurotoxins (Chicheportiche et al., 1975); short neurotoxins have kf values

B I N D I N G K I N E T I C S O F N E U R O T O X I N W I T H A C H R V O L . 2 5 , N O . 2 , 1 9 8 6 403
Role of Overall Net Charge. As discussed above, we have found a rule that, if a toxin lacks a positive charge at one of the two residues 27 and 30, the binding rate is in the “m” or ”s” range. However, the converse of this rule is not always valid. These exceptional cases are for Lcr c, L1 c, and L1 b, which have both Lys-27 and Arg-30 but associate with the receptor with medium rates rather than with fast rates. Ob- viously, there is at least another factor that controls the as- sociation kinetics of Ntx and AChR. A slight difference in the local structures, in the distribution of charges, etc. may well be such factors. The association kinetics and amino acid sequences of Lcr c, L1 c, and L1 b may be compared with those of highly homologous toxins, Lc 11, Lc c, and Lc d, which bind to AChR with fast rates. Glu-12, Asn-14, Thr-39, and Gln-62 in Lcr c, L1 c, and L1 b are replaced by Lys- 12, Thr- 14, Ser-39, and Glu-62 in Lc 11, Lc c, and Lc d (Table I), and one or some of these residues may be responsible for the difference in the association rates.
Indeed, a remarkable difference in the electrostatic prop- erties between these two groups of toxins was found by per- forming disc polyacrylamide gel electrophoresis at pH 6.6 and at pH 4.0. The toxins with fast kf, namely, Lc 11, Lc c, and Lc d, exhibit larger R/’s than those with medium kf, namely, Lcr c, L1 c, and L1 b. Since the effective molecular sizes of these six toxins are nearly the same, such differences in Rr values are due to their overall net charge; the more positive a toxin is, the faster it associates with the receptor. Accord- ingly, the net charge of the neurotoxin molecule probably plays an important role in the process of interaction with the binding sites in AChR, which are expected to have several negative charges. The relationship between the association kinetic properties and the distribution of charges, including those of residues 27 and 30, on the toxin molecule remains to be ex- amined in future studies.
rotoxins. The hydrogendeuterium exchange rates of interior amide protons reflect the conformational rigidity with respect to such motions as make buried amide protons come into contact with the solvent molecules, and denaturation tem- peratures may be indexes of overall conformational stability. The hydrogen-deuterium exchange kinetics generally show a good correlation with the denaturation temperatures; a toxin with a faster exchange rate shows a lower denaturation tem- perature. However, no correlation is found between amide proton exchange rates and the binding rates of neurotoxin and AChR. For example, Eb and As b bind to AChR with much smaller rates than Cbt, Nmm I, Tx a, and A1 c, while Cbt and Eb clearly show fast exchange kinetics as compared to Nmm I, Tx a, As a, and A1 c.
Then what is the most probable factor that controls the binding rates of a toxin to AChR? This question may be answered by comparing the association kinetics and the amino acid sequences of A1 a, A1 b, and A1 c. These toxins differ in sequence in only two positions: A1 a has Lys-27 and Gln-30, A1 b has Met-27 and Arg-30, and A1 c has Lys-27 and Lys-30 (Table I). Their secondary structures are very similar since they exhibit similar circular dichroism (CD) spectra (data not shown). However, A1 c binds to the receptor 2.5-3.5 times as fast as A1 a and A1 b (Table 111). This suggests that Lys-27 and Lys-30 or Arg-30 play important roles in the association with the receptor. From this point of view, we readily find, in Tables I and 111, that Nm d, Djk Vn-11, Hh IV, A1 a, Ea, Eb, and As a, which have Ser-30 instead of Lys-30 or Arg-30, bind to AChR with medium or slow rates. Therefore, we may conclude that if residue 27 or 30 is replaced by amino acids other than Lys or Arg, the binding rate falls in the class “m” or “s”. There is no evidence that Lys-27 and Lys-30 or Arg-30 modify the binding ability to AChR by affecting the tertiary structure of the toxin molecule because no correlation has been bound between the variation of their CD spectra and the binding kinetics (T. Endo et al., unpublished experiments). Accordingly, Lys-27 and Lys-30 or Arg-30 with positive charges are directly involved in the process of binding to the receptor.
It is interesting to note that residues 27 and 30 are expected to lie in the anti-parallel P-sheet region and their side chains are oriented in the opposite directions to each other (see Figure 1). The side chain of residue 27 is on the proposed binding surface of the toxin molecule, while that of residue 30 is on the opposite side. Tsetlin et al. (1979) directly observed the electron spin resonance signals of spin-labeled derivatives of neurotoxin I1 from Naja naja oxiana interacting with DS- AChR. Their results showed that both Lys-26 and Lys-27 on the opposite sides of the molecule lose their mobility to some extent on binding with the receptor. Boulain et al. (1982) prepared a monoclonal antibody specific for Tx a and iden- tified their epitope as the region involving the N-terminal, residues 15, 16, and 18 on the toxin molecule. This antigenic site is at the basis of the protruding P-sheet loops, the core part of the molecule (Figure 1). Interestingly, this antibody can bind to the toxin-receptor complex (Boulain & Mtnez, 1982). These observations and ours imply that the neurotoxin-re- ceptor binding is not a simple surface-to-surface contact, al- though the toxin-receptor complex still leaves the antigenic region open to the antibody binding. Therefore, in the tran- sition or final state of the receptor binding process, the neu- rotoxin molecule probably embeds, at least, its tip of the protruding main-chain loops (Figure 1) into the narrow cavity of the receptor molecule, allowing both sides of the tip to be buried.
ACKNOWLEDGMENTS
We express our thanks to Prof. T. Miyazawa (University of Tokyo) for the use of an NMR spectrometer and stimulating discussions, Prof. M. Tsuboi (University of Tokyo) for the use of a stopped-flow spectrophotometer, and Dr. A. Mtnez (CEN, Saclay) for his generous gift of Tx a. We are also grateful to Prof. M. Oya (Gunma University) for his discussion and encouragements.
Registry No. Cbt, 11103-42-7; Nmm I, 65216-15-1; Tx a, 54992-19-7; Nhh 6, 69071-95-0; Nhh loa, 69071-96-1; Nha 10, 55608-68-9; Nha 12, 55574-93-1; Nha 14, 55574-92-0; Nm d, 37239-94-4; Nn 0, 9078-28-8; Djk Vn-11, 52365-14-7; Dpp a, 99604-47-4; Hh 11,99604-42-9; Hh IV, 99604-43-0; Aa c, 80940-61-0; AI a, 58857-05-9; AI b, 58857-06-0; A1 c, 58857-07-1; Lc 11,
Lcr c, 99604-46-3; LI b, 99604-44-1; Ea, 11091-63-7; Eb, 9083-23-2; As a, 74350-65-5; a-Bgt, 19633-24-2; Tx B, 61584-78-9; Dpp 6, 99604-49-6; Oh b, 50863-85-9; As b, 99604-48-5; Lc a, 85255-42-1; Lc b, 85255-41-0; Ls 111, 75433-28-2; acetylcholine, 51-84-3.
REFERENCES
Agard, D. A., & Stroud, R. M. (1982) Acta Crystallogr., Sect. A : Cryst. Phys., Diffr., Theor. Gen. Crystallogr. A38,
88813-48-3; LC C, 88813-49-4; LC d, 88813-50-7; L1 C, 99604-45-2;
186-194. Barrantes, F. J. (1978) J . Mol. Biol. 124, 1-26. Blanchard, S. G., Quast, U., Reed, K., Lee, T., Schimerlik,
M. I . , Vandlen, R., Claudio, T., Strader, C. D., Moore, H.-P. H., & Raftery, M. A. (1979) Biochemistry 18,
Bonner, R., Barrantes, F. J., & Jovin, T. M. (1976) Nature 1875-1 885.
(London) 263, 429-43 1.
404 B I oc H E M I ST R Y E N D 0 E T A L .
Botes, D. P. (1971) J . Biol. Chem. 246, 7383-7391. Botes, D. P. (1972) J . Biol. Chem. 247, 2866-2871. Botes, D. P., & Strydom, D. J. (1969) J . Biol. Chem. 244,
Boulain, J.-C., & MBnez, A. (1982) Science (Washington,
Boulain, J.-C., Minez, A,, Couderc, J., Faure, G., Liacopoulos, P., & Fromageot, P. (1982) Biochemistry 21, 2910-2915.
Cahill, S., & Schmidt, J. (1984) Biochem. Biophys. Res. Commun. 122, 602-608.
Chang, C. C., Yang, C. C., Hamaguchi, K., Nakai, K., & Hayashi, K. (1971) Biochim. Biophys. Acta 236, 164-173.
Chicheportiche, R., Vincent, J.-P., Kopeyan, C., Schweitz, H., & Lazdunski, M. (1975) Biochemistry 14, 2081-2091.
Damle, V. N., McLaughlin, M., & Karlin, A. (1978) Biochem. Biophys. Res. Commun. 84, 845-85 1.
Devillers-Thiery, A., Giraudat, J., Bentaboulet, M., & Changeux, J.-P. (1983) Proc. Natl. Acad. Sci. U.S.A. 80,
Faker, D., & Porath, J. (1967) Jpn. J. Microbiol. 11, 353-355. Endo, T., Inagaki, F., Hayashi, K., & Miyazawa, T. (1979)
Endo, T., Inagaki, F., Hayashi, K., & Miyazawa, T. (1981)
Gregoire, J., & Rochat, H. (1977) Eur. J . Biochem. 80,
Haggerty, J. G., & Froehner, S. C. (1981) J . Biol. Chem. 256,
Harvey, A. L., Hider, R. C., Hodges, S. J., & Joubert, F. J. (1 984) Br. J . Pharmacol. 82, 709-7 16.
Hayashi, K., Ohta, M., Matsubara, F., & Kohno, M. (1981) in Myasthenia Gravis-Pathogenesis & Treatment (Satoy- oshi, E., Ed.) pp 117-137, University of Tokyo Press, Tokyo.
Inagaki, F., Clayden, N. J., Tamiya, N., & Williams, R. J. P. (1982) Eur. J . Biochem. 123, 99-104.
Ishikawa, Y., Minez, A., Hori, H., Yoshida, H., & Tamiya, N. (1977) Toxicon 15, 477-488.
Joubert, F. J. (1973) Biochim. Biophys. Acta 317, 85-98. Joubert, F. J. (1975) Hoppe-Seyler’s Z . Physiol. Chem. 356,
Joubert, F. J., & Taljard, N. (1978) Biochim. Biophys. Acta
Kaneda, N., Tanaka, F., Kohno, M., Hayashi, K., & Yagi,
Kim, H. S., & Tamiya, N. (1981) Biochem. J. 199, 211-218. Kim, H. S., & Tamiya, N. (1982) Biochem. J . 207,215-223. Kimball, M. R., Sato, A., Richardson, J. S., Rosen, L. S., &
Low, B. W. (1979) Biochem. Biophys. Res. Commun. 88,
Lauterwein, J., Wiithrich, K., Schweitz, H., Vincent, J.-P., & Lazdunski, M. (1977) Biochem. Biophys. Res. Commun.
41 47-41 57.
D.C.) 21 7, 732-733.
2067-207 1.
Eur. J . Biochem. 102, 417-430.
Eur. J . Biochem. 120, 117-124.
28 3-293.
8294-8 297.
53-72.
537, 1-8.
K. (1982) Arch. Biochem. Biophys. 218, 376-383.
9 50-9 5 9.
76, 1071-1078.
Leprince, P., Noble, R. L., & Hess, G. P. (1981) Biochemistry
Maeda, N., & Tamiya, N. (1974) Biochem. J . 141,389-400. Maeda, N., & Tamiya, N. (1976) Biochem. J . 153, 79-87. Maeda, N., & Tamiya, N. (1 978) Biochem. J. 175, 507-51 7. Maelicke, A., Fulpius, B. W., Klett, R. P., & Reich, E. (1977)
J . Biol. Chem. 252, 481 1-4830. Mebs, D., Narita, K., Iwanaga, S., Samejima, Y., & Lee, C.
Y. (1972) Hoppe-Seyler’s Z . Physiol. Chem. 353,243-262. Meunier, J. C., Sealock, R., Olsen, R., & Changeux, J. P.
(1974) Eur. J . Biochem. 45, 371-394. Miller, D., Moore, H.-P., Hartig, P., & Raftery, M. A. (1978)
Biochem. Biophys. Res. Commun. 85, 632-640. Mishina, M., Kurosaki, T., Tobimatsu, T., Morimoto, T.,
Noda, M., Yamamoto, T., Terao, M., Lindstrom, J., Tak- ahashi, T., Kuno, M., & Numa, S. (1984) Nature (London)
Mishina, M., Tobimatsu, T., Imoto, K., Tanaka, K., Fujita, Y., Fukuda, K., Kurasaki, M., Takahashi, H., Morimoto, Y., Hirose, T., Inayama, S., Takahashi, T., Kuno, M., & Numa, S . (1985) Nature (London) 313, 364-369.
Miyazawa, T., Endo, T., Inagaki, F., Hayashi, K., & Tamiya, N. (1983) Biopolymers 22, 139-145.
Noda, M., Takahashi, H., Tanabe, T., Toyosato, M., Furu- tani, Y., Hirose, T., Asai, M., Inayama, S., Miyata, T., & Numa, S. (1982) Nature (London) 299, 793-797.
Ohta, M., & Hayashi, K. (1973) Biochem. Biophys. Res. Commun. 55, 431-438.
Sato, S., & Tamiya, N. (1971) Biochem. J . 122, 453-461. Schmidt, J., & Raftery, M. A. (1973) Anal. Biochem. 52,
Smart, L., Meyers, H.-W., Hilgenfeld, R., Saenger, W., &
Strydom, A. J. C. (1973) Biochim. Biophys. Acta 328,
Strydom, D. J. (1972) J . Biol. Chem. 247, 4029-4042. Strydom, D. J., & Haylett, T. (1977) S . Afr. J . Chem. 30,
Sumikawa, K., Houghton, M., Smith, J. C., Rochards, B. M., & Barnard, A. (1982) Nucleic Acids Res. 10, 5809-5822.
Tsetlin, V. I., Karlsson, E., Arseniev, A. S., Utkin, Yu. N., Surin, A. M., Pashkov, V. S., Pluzhnikov, K. A., Ivanov, V. T., Bystrov, V. F., & Ovchinnokov, Yu. A. (1979) FEBS Lett. 106, 47-52.
Walkinshaw, M. D., Saenger, W., & Maelicke, A. (1980) Proc. Natl. Acad. Sci. U.S .A. 77, 2400-2404.
Weber, M., & Changeux, J. P. (1 974) Mol. Pharmacol. 10,
Weill, C. L., McNamee, M. G., & Karlin, A. (1979) Biochem.
Yang, C. C., Yang, H. J., & Huang, J. S. (1969) Biochim.
20, 5565-5570.
307, 604-608.
349-354.
Maelicke, A. (1984) FEBS Lett. 178, 64-68.
491-509.
40-48.
1-14.
Biophys. Res. Commun. 61, 997-1003.
Biophys. Acta 188, 65-77.
Copyright © 2022 FDOKUMEN