Bactericidal Activity of Psidiumguajava Leaves Against Some ...
Upload
independentCategory
view
2download
0
1 23
TreesStructure and Function ISSN 0931-1890Volume 26Number 2 Trees (2012) 26:571-579DOI 10.1007/s00468-011-0620-4
Stomatal density distribution patterns inleaves of the Jatobá (Hymenaea courbarilL.)
Giordane Augusto Martins, AngelaMaria Soares, João Paulo RodriguesAlves Delfino Barbosa, José Marcio deMello, Evaristo Mauro de Castro, et al.

1 23
Your article is protected by copyright and
all rights are held exclusively by Springer-
Verlag. This e-offprint is for personal use only
and shall not be self-archived in electronic
repositories. If you wish to self-archive your
work, please use the accepted author’s
version for posting to your own website or
your institution’s repository. You may further
deposit the accepted author’s version on a
funder’s repository at a funder’s request,
provided it is not made publicly available until
12 months after publication.

ORIGINAL PAPER
Stomatal density distribution patterns in leaves of the Jatoba(Hymenaea courbaril L.)
Giordane Augusto Martins • Angela Maria Soares •
Joao Paulo Rodrigues Alves Delfino Barbosa • Jose Marcio de Mello •
Evaristo Mauro de Castro • Antonio Carlos Ferraz Jr.
Received: 13 January 2011 / Revised: 22 August 2011 / Accepted: 2 September 2011 / Published online: 28 September 2011
� Springer-Verlag 2011
Abstract Stomata are leaf structures that are essential for
regulating gas exchange and water balance in terrestrial
plants. Accurately quantifying stomatal characteristics is
consequently of great importance for understanding the
physiological processes of plants under different environ-
mental conditions. The objective of this study was to
investigate the spatial distribution pattern of stomata on
leaflet surfaces, and the possible mechanisms that influence
this pattern, particularly leaf expansion. To achieve this,
we used geostatistical tools combined with an analysis of
biometric relationships of leaves from Hymenaea courbaril
L. Our analysis indicates that stomata show a clear spatial
structure in this species: average values of foliar expansion
rates (ERs) were different on right and left-hand sides of
the primary venation of each leaflet and there was a close
relationship between the spatial pattern of stomatal density
and leaf expansion rate. Such differences in lateral
expansion may therefore be partially responsible for the
heterogeneous distribution of stomata documented here
and in other studies.
Keywords Stomata � Geostatistics � Leaf expansion
Introduction
Stomata are structures found in the above ground parts of
all terrestrial plants and account for approximately 95% of
gas exchange. Stomata are epidermal valves that control
the plant’s carbon dioxide input and water output, directly
influencing carbon assimilation, plant water status and
water use efficiency. These structures are therefore key
components for the survival of terrestrial plants (Berger
and Altmann 2000; Nadeau and Sack 2002) and play a
major role in the response of plants to environmental stress
(Slavik 1963).
During development of the leaves, the stomata are
formed by the simultaneous processes of asymmetric cell
division and cell differentiation—the stomatal density
(SD) and spatial distribution of stomata on the leaf surface
being genetically regulated during this period (Nadeau and
Sack 2002). However, the ontogeny of stomata is also
modulated by environmental factors that may change
through time, such as the intensity and quality of radiation,
humidity, temperature, carbon dioxide and ozone levels in
the atmosphere, soil moisture and nutritional availability,
and by internal architecture and leaf position (Garcıa-
Nunez et al. 1995; Maurer et al. 1997; Assmann and Wang
2001; Chen et al. 2001; Gratani et al. 2006; Leroy et al.
2009).
The heterogeneity of the spatial distribution of the
stomata on the epidermis (caused by genetic and environ-
mental factors) is a characteristic of plants that has been
known for some time (Salisbury 1928; Slavik 1963;
Smith et al. 1989; Croxdale 2000; Dong and Zhang 2000;
Zhao et al. 2006). However, there have been few pub-
lished studies that provide detailed information about the
number, size and location of sample sites on the leaf
surface (Poole et al. 1996). Furthermore, the most
Communicated by R. Guy.
G. A. Martins (&) � A. M. Soares �J. P. R. A. D. Barbosa � E. M. de Castro
Departamento de Biologia, Universidade Federal de Lavras,
Caixa Postal 3037, Lavras-MG 37200-000, Brazil
e-mail: [email protected]
J. P. R. A. D. Barbosa
e-mail: [email protected]
J. M. de Mello � A. C. Ferraz Jr.
Departamento de Ciencias Florestais, Universidade Federal de
Lavras, Caixa Postal 3037, Lavras-MG 37200-000, Brazil
123
Trees (2012) 26:571–579
DOI 10.1007/s00468-011-0620-4
Author's personal copy

frequently used sampling strategies do not permit a statis-
tical analysis of the spatial characteristics of the stomata:
typical analyses are based on the variance of the mean,
which can lead to a loss in information that could com-
promise interpretations of processes. Indeed, Amzallag
(2001) argues that an analysis based only on the variance of
the mean may exclude important factors of biological
significance for the investigated variable. This also applies
to cases where the investigated variable possesses spatio-
temporal continuity.
The spatial distribution of developing stomata is
reportedly random, although an exclusionary distance is
present around each stomata (Sachs 1974; Rasmussen
1986). However, it is not clear if the term random is being
used by the authors in a strict mathematical sense or sig-
nifies that an ordered pattern is not visually obvious. In the
former case, the assertion that a pattern is mathematically
random must be based on a standard statistical method
(Croxdale 2000). Often the method developed by Clark and
Evans (1954) has been used to determine spatial pattern
possibilities (ordered, random, or clustered). Authors uti-
lizing Clark and Evans’s method have typically found an
ordered patterning of the stomata (cited in Croxdale 2000).
However, while this method indicates the type of pattern, it
yields no detailed quantitative information or spatial
aspects of the pattern. Here, we suggest a new method to
analyze the spatial distribution pattern of stomata on a leaf
surface. We use this method to address the following
fundamental questions: Is spatial stomatal distribution
random, as suggested by Sachs (1974) and Rasmussen
(1986) or ordered, as suggested by Croxdale (2000)? Is it
possible to accurately and precisely quantify this pattern?
How do developmental processes influence the spatial
pattern of stomata?
We conducted a case study using H. courbaril leaflets to
test the method and to address the above questions. Our
new method is based on geostatistics, a relatively recent
statistical analysis tool capable of generating information
regarding the spatial distribution of a given variable.
Geostatistics is one of a number of more sophisticated
mathematical techniques (facilitated by access to comput-
ers with large processing capacity) that has led to better
comprehension of seemingly chaotic phenomena. Geosta-
tistics theory was formalized by the French scientist G.
Matheron at the beginning of the 1960s (Cressie 1989), and
since then it has been applied to a diverse range of phe-
nomena including the spatial distribution of a field’s tin
levels (Clark 1979), behavior of carbon dioxide flow in the
atmosphere (Gourdji et al. 2010), and the distribution of
termite mounds on an African savanna (Pringle et al.
2010).
Materials and methods
Plant material
Hymenaea courbaril (Fabaceae: Caesalpinioideae) is an
evergreen canopy (sometimes emergent) tree of tropical
and subtropical forests and has a distribution that stret-
ches from Mexico and the Caribbean, through Bolivia
to south-central Brazil (Francis 1990). The wood is an
economically valuable hard wood (Patterson 1988;
Francis 1990) that is commercially exploited in the
Peruvian Amazon (Peters et al. 1989). Moreover, the fruit
pulp is edible raw or prepared as a beverage (Francis
1990) and the resinous gum is used in some areas in the
manufacture of varnishes or as incense (Schultes and
Raffauf 1990). Both the bark and pulp are used medici-
nally (Francis 1990).
Leaf samples of H. courbaril were taken from mature
trees and saplings. Eight leaflets were collected from four
mature trees (two leaves per tree, one leaflet per leaf) in a
fragment of Atlantic Rain Forest, in southeastern Brazil
(21�4403800S, 46�2801600W) in September 2008. In October
2008 one mature leaflet was collected from ten H. courb-
aril saplings of 10 months age cultivated under nursery
conditions.
All leaflets were collected from the first fully expanded
leaf. Leaves with signs of herbivore and/or pathogen
attack were excluded. All plants studied were fully sun
exposed.
Sampling and database
To spatially sample SD the leaflet was referenced in a
Cartesian plane, along with the sample points. For this
process, a sheet of graph paper was perforated to form a
sample grid of 5 9 5 mm with random clusters of
2.5 9 2.5 mm (Fig. 1a). Using this sample grid, points on
the abaxial epidermis of the leaflet were marked with a
porous tip pen, transferring the sampling grid to the surface
of the leaflet (Fig. 1b).
The marked leaflet was then scanned at 600 dpi with an
HP Deskjet F4100 (Hewlett-Packard Development Com-
pany, L.P., Brazil (Fig. 1b). With the aid of the software
UTHSCSA ImageTool (University of Texas Health Sci-
ences Center at San Antonio), the leaf blade’s image was
transformed into a Cartesian plane with true dimensions
(Fig. 1d). The x and y coordinates for each point of the
sample grid and a series of points pertaining to the
perimeter of the leaflet were then recorded.
For the assessment of the SD of each point from the
sample grid, ‘‘superglue’’ impressions were made using the
572 Trees (2012) 26:571–579
123
Author's personal copy

technique of Wilson (1981). Digital images of the prints
were then captured using a Canon PowerShot A-630 digital
camera (Canon inc., China), coupled to the optic micro-
scope Olympus BX60 (Olympus Optical Corporation, Ltd.,
Tokyo, Japan). The obtained images measured 0.768 9
0.576 mm (Fig. 1c) and consisted of the basic sampling
units used for the geostatistic analyses. Stomata count in
the sampling units was carried out with the software
UTHSCSA ImageTool. Stomata that were only partial in
the image were also counted. Each SD data was associated
with its respective coordinates, thus forming the spatial
database.
Leaf expansion
Hymenaea courbaril mature leaflets are clearly asymmetric
between right and left-hand sides of the primary venation.
However, this asymmetry is less apparent in younger
leaflets (Fig. 2).
Average values of foliar expansion rate (ER) were
estimated on right and left-hand sides of primary venation
of the saplings cultivated under nursery conditions. Mea-
surements of the leaflets were obtained at six positions
(Lr1,2,3 and Ll1,2,3) (Fig. 2). This procedure was performed
in leaflets at two development stages—approximately
10 days old and 50 days old.
The average Lr1,2,3 and Ll1,2,3 at 10 days old (Lri and
Lli) and for mature leaves (Lrm and Llm) was calcu-
lated. Expansion rate was calculated by the following
equation:
ER ¼ Li � Lm
D:
where D is time between two assessments (40 days).
Fig. 1 Mapping of the sampled
points: sampling grid (a); leaflet
with the points to be sampled
(b); leaflet impression under a
microscope (c); leaflet with
sampled points in a Cartesian
plane (d)
Trees (2012) 26:571–579 573
123
Author's personal copy

Data analysis
A semivariogram was calculated for each leaflet as follows
(Journel and Huijbregts 1978):
cðhÞ ¼ 1
2NðhÞXNðhÞ
i¼1
zðxðiÞ � zðxi þ hÞ2h i
:
where c(h) is the experimental semivariogram value at the
distance interval h; N(h) is number of sample value pairs
within the distance interval h; z(xi), z(xi ? h) are sample
values at two points separated by the distance interval
h. Semivariograms were calculated both isotropically and
anisotropically. The anisotropic calculations were per-
formed in four directions (0�, 45�, 90� and 135�) with a
tolerance of 22.5� to determine whether semivariogram
functions depended on sampling orientation and direction
(i.e., they were anisotropic) or not (i.e., they were isotro-
pic). The parameters of the model were then determined:
nugget effect (s2), structured variation (r2), sill (s2 ? r2)
and range (U).
The nugget is usually assumed to be non-spatial varia-
tion due to measurement error and variations in the data
that relate to shorter ranges than the minimum sampled
data spacing; sill is the lag distance between measurements
in which one value for a variable does not influence
neighboring values; structured variation is the semivari-
ance range attributed from spatial continuity and range is
the distance in which values of one variable become
spatially independent from the others. Structured variance,
expressed as the percentage of sill, was used to define
spatial dependency of the variables. To define different
classes of spatial dependence for the SD variables, we used
the classification following Cambardella et al. (1994). The
R statistical software (R Development Core Team 2008)
with the GeoR package (Ribeiro and PJ 2001) was used to
conduct semivariogram and spatial structure analysis for
the variables.
Stomatal density was interpolated using the Ordinary
Kriging method (Matheron 1963). Splancs package for R
(Rowlingson and Digglle 1993) was used to plot stomatal
density maps.
We used a t test to compare ER averages on left and
right-hand sides of primary venation in terms of expansion.
Finally, Pearson’s correlation test was conducted to test the
strength of the correlation between the values of the
expansion rate of each side of the leaflets and the range (U)
of the semivariogram.
Results
Stomatal density
Average stomatal density was 308 ± 16.5 (n = 8) for adult
H. courbaril leaflets and 254 ± 22.3 (n = 10) for sapling
H. coubaril leaflets. In both cases there were no differences
in the SD between right and left-hand sides of the primary
vein.
The data obtained in this study provided optimum
conditions for the implementation of geostatistics tech-
niques that depend on a previously established model
(Mello et al. 2005). The variogram analysis of the adult tree
samples demonstrated that stomatal density in H. courbaril
leaflets was characterized by spatial continuity, enabling
the modeling of the semivariance.
The exponential model was the model that best adjusted
to the experimental semivariogram. The spatial depen-
dence of SD in leaflets of H. courbaril can be inferred from
the high level of model accuracy (Fig. 3 illustrates the SD
semivariogram for one of the H. courbaril leaflets and the
model adjusted by the Weighted Least Squares method).
There is a spatial continuity of the data at the micro-
scale, as indicated by low-nugget values (Table 1). The
structured variation values were 1,583–3,260. The combi-
nation of low-nugget effect values and high-structured
variation values is responsible for the high spatial depen-
dence index values (79.4–97.3%)—classified as a strong
level of spatial dependence according to Cambardella et al.
(1994). The range (U) values (3.40–9.34 mm) indicated
that the size of the sampling grid (5 9 5 mm) was
adequate.
Fig. 2 Hymenaea courbaril leaflets at approximately 10 days old
(a) and 50 days old (b). Leaflets were measured at three positions in
right side (Lr1,2,3) and three positions in left side (Ll1,2,3)
574 Trees (2012) 26:571–579
123
Author's personal copy

Maps of the SD of the leaflets were plotted using spatial
interpolator Kriging, to allow for a better visualization of
the spatial distribution of that variable (Fig. 4). In addition
to the provision of a visual analysis of the SD distribution
in the leaf surface, the SD maps also allow for the esti-
mation of the spatial average of the variable.
Directional analysis
Directional semivariograms were plotted using the fol-
lowing directions: 0�, 45�, 90� and 135� (Fig. 5). A similar
behavior of semivariance was recorded in all the four
directions for the eight leaflets analyzed. Such a pattern
indicates directional isotropy of SD distribution in the leaf
surface, since the same spatial dependence structure exists
in all the four directions (Cressie 1993). This result reflects
the two-dimensional growth of dicotyledon leaves.
Leaf expansion
The average expansion rate was 0.17 cm day-1 (±0.020)
for the right-hand side of leaflets and 0.06 cm day-1
Sem
ivar
ianc
e
0
400
800
1200
1600
2000
2400
2800
3200
3600
4000
Distance (mm)
Sem
ivar
ianc
e
0
400
800
1200
1600
2000
2400
2800
Distance (mm) Distance (mm) Distance (mm)
20 20 200 10 20 30 40 0 10 30 0 10 30 40 0 10 30 40
0 5 10 15 20 25 0 5 10 15 20 25 0 5 10 15 20 0 4 8 12 16
Fig. 3 Stomatal density semivariogram for eigth Hymenaea courbaril (adults) leaflets, along with the exponential model adjusted by the
Weighted Least Squares method. The x and y axes represent distance (mm) and semivariance values, respectively
Table 1 Semivariance model’s
parameters estimate for nugget
effect (s2), structured variation
(r2), sill (s2 ? r2), range (U),
and spatial dependence index
(%) for stomatal density (SD) of
eight leaflets of Jatoba
Leaflets s2 r2 s2 ? r2 U (mm) Spatial dependence
index (%)
A 58 2,112 2,170 6 97.3
B 260 1,930 2,190 3.81 88.1
C 370 2,340 2,710 8.94 86.3
D 110 3,260 3,370 4.52 96.7
E 368 1,902 2,270 8.19 83.8
F 477 1,833 2,310 3.40 79.4
G 407 1,913 2,320 6.12 82.5
H 357 1,583 1,940 9.34 81.6
Trees (2012) 26:571–579 575
123
Author's personal copy

(±0.012) for the left-hand side of leaflets. A significant
difference was observed (t = 4.89 and p \ 0.01) between
the right and left average foliar expansion rate.
A strong positive correlation was observed between
the expansion rate values on each side of the leaflet and
the theoretical range values (U) of the semivariograms
(r = 0.84, p = 0.02, n = 20). This result indicates a strong
relationship between expansion rate and the spatial distri-
bution structure of the stomata.
Discussion
Sampling frame
The directional analysis of semivariance is of great
potential importance for planning sampling frames, the
shape of sample units, and in the case of a systematic
sampling, the analysis also informs the definition of best
shape and size of the sample grid. For a variable with
isotropic spatial distribution, rectangle-shaped sampling
units are most frequently indicated. This is because the
largest side of the rectangle ensures a good representivity
of the targeted variable and the smaller side reduces the
area sampled, thereby avoiding excessive sampling effort.
In the case of a variable with an anisotropic spatial distri-
bution the square or the circle is the best sampling unit
shape since it ensures equivalent representativeness in all
directions.
With regard to the sampling grid, a regular grid would
be most appropriate for variables with anisotropic distri-
butions for the same reason that justifies the use of square
or circular sampling units. On the other hand, variables
with an isotropic spatial distribution allow the elimination
of one or more rows (transects) of a sample grid, reducing
the sample intensity without a major loss of representa-
tiveness of the sample. Thus, rectangle-shaped sampling
units are most appropriate for sampling SD in H. courbaril
leaves.
According to the geostatistical analyses, SD cannot be
treated as a random variable, since a strong spatial
dependence index exists (79.4–97.3%). This finding pre-
cludes the use of classical statistics for the analysis of SD,
since these types of tests make the assumption that the
events (samples) are independent. Thus, there are two
possible methods to estimate SD with statistical accuracy:
(1) samples taken from the leaf must have a distance equal
to or greater than the estimated theoretical range of the
semivariogram, and; (2) use the SD estimated by geosta-
tistics, since this provides precise estimates of variance. In
summary, when sampling SD it is necessary to consider the
spatial characteristics of the data for the analysis, or to
formulate a sampling plan that generates data that can be
analyzed with classical statistics.
Spatial and physiological processes
The right side of the leaflet has an ER 2.75 times larger
than the left side. It can therefore be assumed that a
determined area on the right side of the leaflet develops in a
time interval of 2.75 times shorter than the same area on
the left. Thus, all other things being equal, the developed
area on the right side of the leaflet experiences less envi-
ronmental variability than the left side. This finding may
explain the strong relationship among ER and range,
despite there being no differences in stomatal density
between right and left-sides of the primary vein. However,
these observations should be taken with care, since what
we found was a strong correlation between the ER and the
spatial distribution pattern of stomata and not an explicit
relationship between ER and SD. This relationship, as well
as the role of the ER in defining the SD, should be clarified
in further studies.
Smith et al. (1989) found heterogeneous distribution
of stomata in Commelina communis leaves and suggested
three hypotheses to explain this heterogeneity: (1) stomata
differentiation in the leaf surface differs between regions
(differentiation hypothesis); (2) following stomata diff-
erentiation, a differentiated cellular expansion occurs
(expansion hypothesis), and; (3) the two previous hypotheses
are both true (mixed hypothesis). Based on the correlation
between SD and stomatal index in Alnus glutinosa leaves,
Poole et al. (1996) argued that the differentiation hypothesis
is most probable. However, Zhao et al. (2006) investigated
stomata formation and distribution in Cinnamomum cam-
phora leaves and concluded that the mixed hypothesis was
Fig. 4 Stomatal density Kriging map of a Hymenaea courbaril leaflet
with a resolution of 1 9 1 mm
576 Trees (2012) 26:571–579
123
Author's personal copy

more probable. In the present study, the rate of leaf expansion
was observed to influence SD distribution patterns in
H. courbaril leaflets thereby supporting the expansion
hypothesis, however, it should be noted that the differenti-
ation hypothesis was not directly evaluated.
The existence of an irregular spatial distribution of
stomata in leaves has long been known, although little
progress has made in identifying the factors that can cause
these variations in SD. This lack of progress is reflected in
the small number of studies dealing with the spatial char-
acteristics of stomata, and is probably also influenced by
the large number of environmental variables which directly
or indirectly influence these characteristics and by the lack
of tools required for this type of research. It is important to
note that the environmental variables that affect stomata
characteristics operate on different timescales.
By differentiating the analysis of SD spatial distribution
in a single leaf (characterized by different rates of expan-
sion between the right and left-hand sides of the primary
venation), the effect of environmental and genetic factors
that cannot be easily controlled in experimental conditions
was minimized. However, the stomatal index was not
Sem
ivar
ianc
e
0
500
1000
1500
2000
2500
3000
3500
4000
04590135
0
500
1000
1500
2000
2500
300004590135
Sem
ivar
ianc
e
0
500
1000
1500
2000
2500
3000
04590135
0
500
1000
1500
2000
2500
3000
3500
400004590135
Sem
ivar
ianc
e
0
1000
2000
3000
4000
500004590135
0 10 20 30 40 50 0 10 20 30 40 50
0 5 10 15 20 25 30 35 0 5 10 15 20 25 30 35 40
0 5 10 15 20 25 0 5 10 15 20 25 300
500
1000
1500
2000
2500
3000
3500
04590135
Distance
Sem
ivar
ianc
e
0
1000
2000
300004590135
Distance
0 5 10 15 20 25 30 35 0 10 20 30 40 500
1000
2000
3000
4000
5000 04590135
(a) (b)
(d)
(f)
(h)(g)
(e)
(c)
Fig. 5 Directional variograms for eight leaflets. The x and y axes represent distance (mm) and semivariance values, respectively
Trees (2012) 26:571–579 577
123
Author's personal copy
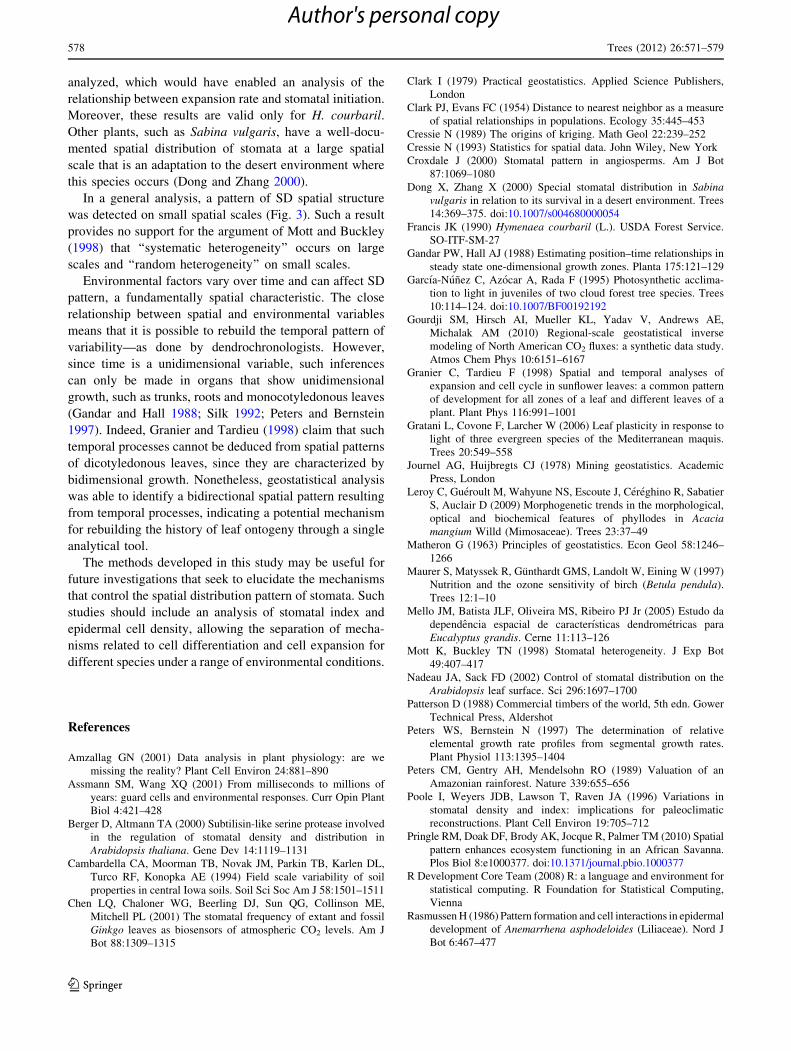
analyzed, which would have enabled an analysis of the
relationship between expansion rate and stomatal initiation.
Moreover, these results are valid only for H. courbaril.
Other plants, such as Sabina vulgaris, have a well-docu-
mented spatial distribution of stomata at a large spatial
scale that is an adaptation to the desert environment where
this species occurs (Dong and Zhang 2000).
In a general analysis, a pattern of SD spatial structure
was detected on small spatial scales (Fig. 3). Such a result
provides no support for the argument of Mott and Buckley
(1998) that ‘‘systematic heterogeneity’’ occurs on large
scales and ‘‘random heterogeneity’’ on small scales.
Environmental factors vary over time and can affect SD
pattern, a fundamentally spatial characteristic. The close
relationship between spatial and environmental variables
means that it is possible to rebuild the temporal pattern of
variability—as done by dendrochronologists. However,
since time is a unidimensional variable, such inferences
can only be made in organs that show unidimensional
growth, such as trunks, roots and monocotyledonous leaves
(Gandar and Hall 1988; Silk 1992; Peters and Bernstein
1997). Indeed, Granier and Tardieu (1998) claim that such
temporal processes cannot be deduced from spatial patterns
of dicotyledonous leaves, since they are characterized by
bidimensional growth. Nonetheless, geostatistical analysis
was able to identify a bidirectional spatial pattern resulting
from temporal processes, indicating a potential mechanism
for rebuilding the history of leaf ontogeny through a single
analytical tool.
The methods developed in this study may be useful for
future investigations that seek to elucidate the mechanisms
that control the spatial distribution pattern of stomata. Such
studies should include an analysis of stomatal index and
epidermal cell density, allowing the separation of mecha-
nisms related to cell differentiation and cell expansion for
different species under a range of environmental conditions.
References
Amzallag GN (2001) Data analysis in plant physiology: are we
missing the reality? Plant Cell Environ 24:881–890
Assmann SM, Wang XQ (2001) From milliseconds to millions of
years: guard cells and environmental responses. Curr Opin Plant
Biol 4:421–428
Berger D, Altmann TA (2000) Subtilisin-like serine protease involved
in the regulation of stomatal density and distribution in
Arabidopsis thaliana. Gene Dev 14:1119–1131
Cambardella CA, Moorman TB, Novak JM, Parkin TB, Karlen DL,
Turco RF, Konopka AE (1994) Field scale variability of soil
properties in central Iowa soils. Soil Sci Soc Am J 58:1501–1511
Chen LQ, Chaloner WG, Beerling DJ, Sun QG, Collinson ME,
Mitchell PL (2001) The stomatal frequency of extant and fossil
Ginkgo leaves as biosensors of atmospheric CO2 levels. Am J
Bot 88:1309–1315
Clark I (1979) Practical geostatistics. Applied Science Publishers,
London
Clark PJ, Evans FC (1954) Distance to nearest neighbor as a measure
of spatial relationships in populations. Ecology 35:445–453
Cressie N (1989) The origins of kriging. Math Geol 22:239–252
Cressie N (1993) Statistics for spatial data. John Wiley, New York
Croxdale J (2000) Stomatal pattern in angiosperms. Am J Bot
87:1069–1080
Dong X, Zhang X (2000) Special stomatal distribution in Sabinavulgaris in relation to its survival in a desert environment. Trees
14:369–375. doi:10.1007/s004680000054
Francis JK (1990) Hymenaea courbaril (L.). USDA Forest Service.
SO-ITF-SM-27
Gandar PW, Hall AJ (1988) Estimating position–time relationships in
steady state one-dimensional growth zones. Planta 175:121–129
Garcıa-Nunez C, Azocar A, Rada F (1995) Photosynthetic acclima-
tion to light in juveniles of two cloud forest tree species. Trees
10:114–124. doi:10.1007/BF00192192
Gourdji SM, Hirsch AI, Mueller KL, Yadav V, Andrews AE,
Michalak AM (2010) Regional-scale geostatistical inverse
modeling of North American CO2 fluxes: a synthetic data study.
Atmos Chem Phys 10:6151–6167
Granier C, Tardieu F (1998) Spatial and temporal analyses of
expansion and cell cycle in sunflower leaves: a common pattern
of development for all zones of a leaf and different leaves of a
plant. Plant Phys 116:991–1001
Gratani L, Covone F, Larcher W (2006) Leaf plasticity in response to
light of three evergreen species of the Mediterranean maquis.
Trees 20:549–558
Journel AG, Huijbregts CJ (1978) Mining geostatistics. Academic
Press, London
Leroy C, Gueroult M, Wahyune NS, Escoute J, Cereghino R, Sabatier
S, Auclair D (2009) Morphogenetic trends in the morphological,
optical and biochemical features of phyllodes in Acaciamangium Willd (Mimosaceae). Trees 23:37–49
Matheron G (1963) Principles of geostatistics. Econ Geol 58:1246–
1266
Maurer S, Matyssek R, Gunthardt GMS, Landolt W, Eining W (1997)
Nutrition and the ozone sensitivity of birch (Betula pendula).
Trees 12:1–10
Mello JM, Batista JLF, Oliveira MS, Ribeiro PJ Jr (2005) Estudo da
dependencia espacial de caracterısticas dendrometricas para
Eucalyptus grandis. Cerne 11:113–126
Mott K, Buckley TN (1998) Stomatal heterogeneity. J Exp Bot
49:407–417
Nadeau JA, Sack FD (2002) Control of stomatal distribution on the
Arabidopsis leaf surface. Sci 296:1697–1700
Patterson D (1988) Commercial timbers of the world, 5th edn. Gower
Technical Press, Aldershot
Peters WS, Bernstein N (1997) The determination of relative
elemental growth rate profiles from segmental growth rates.
Plant Physiol 113:1395–1404
Peters CM, Gentry AH, Mendelsohn RO (1989) Valuation of an
Amazonian rainforest. Nature 339:655–656
Poole I, Weyers JDB, Lawson T, Raven JA (1996) Variations in
stomatal density and index: implications for paleoclimatic
reconstructions. Plant Cell Environ 19:705–712
Pringle RM, Doak DF, Brody AK, Jocque R, Palmer TM (2010) Spatial
pattern enhances ecosystem functioning in an African Savanna.
Plos Biol 8:e1000377. doi:10.1371/journal.pbio.1000377
R Development Core Team (2008) R: a language and environment for
statistical computing. R Foundation for Statistical Computing,
Vienna
Rasmussen H (1986) Pattern formation and cell interactions in epidermal
development of Anemarrhena asphodeloides (Liliaceae). Nord J
Bot 6:467–477
578 Trees (2012) 26:571–579
123
Author's personal copy

Ribeiro PJ, Diggle PJ (2001) The geoR package functions for
geostatistical data analysis: R. News 1:15–18
Rowlingson B, Digglle P (1993) Splancs: spatial point pattern
analysis code in S-Plus. Comput Geosci 9:627–655
Sachs T (1974) The developmental origin of stomata pattern in
Crinum. Bot Gaz 135:314–318
Salisbury EJ (1928) On the causes and ecological significance of
stomatal frequency with special reference to the woodland flora.
Phil Trans R Soc B 216:1–65
Schultes R, Raffauf R (1990) The healing forest: medicinal and toxic
plants of northwestern Amazonia. Dioscorides Press, Portland
Silk WK (1992) Steady form from changing cells. Int J Plant Sci
153:49–58
Slavik B (1963) The distribution pattern of transpiration rate, water
saturation deficit, stomata number and size, photosynthetic
respiration rate in the area of the tobacco leaf blade. Biol Plant
5:143–153
Smith S, Weyers DB, Berry WG (1989) Variation in stomatal
characteristics over the lower surface of Commelina communisleaves. Plant Cell Environ 12:653–659
Wilson CL (1981) Plant epidermal sections and imprints using
cyanoacrylate adhesives. Can J Plant Sci 61:781–783
Zhao XZ, Daı XF, Wang GX, Shen ZX, Zhang H, Qiu MQ (2006)
Developmental mechanism and distribution pattern of stomatal
clusters in Cinnamomum camphora. Russ J Plant Physl 53:89–98
Trees (2012) 26:571–579 579
123
Author's personal copy
Copyright © 2022 FDOKUMEN