Stomatal control of water use in olive tree leaves
14
Plant and Soil 190: 179–192, 1997. 179 c 1997 Kluwer Academic Publishers. Printed in the Netherlands. Stomatal control of water use in olive tree leaves J.E. Fern´ andez, F. Moreno, I.F. Gir´ on and O.M. Bl´ azquez Instituto de Recursos Naturales y Agrobiolog´ ıa de Sevilla (CSIC), Apartado 1052, 41080-Sevilla, Spain Received 23 September 1996. Accepted in revised form 27 February 1997 Key words: irrigation, leaf age, leaf water potential, leaf water relations, Olea europaea L., var. Manzanillo, stomatal conductance Abstract Little is known about the strategies used by olive trees to overcome the long dry periods typical of the areas where they are cropped. This makes it difficult to optimize the water supply in orchards. To study the control of water consumption by olive trees, measurements of leaf water potential ( ) and stomatal conductance to H 2 O(g) were made on 26-year-old Manzanillo olive trees under three irrigation treatments. The first treatment provided enough water to cover the crop water demand, the next treatment supplied one third of that rate, and the final treatment was no irrigation at all, typical of dry-farming conditions. Under conditions of high vapour pressure deficit of the air (D ), the olive trees prevented excessive water loss by closing their stomata. Leaves of the current year showed better stomatal control than did the 1-year-old leaves. The upper-bound functional relationships between g and D and photon flux density (I ) were obtained by boundary-line analysis, based on a technique of non-linear least squares. Maximum values of g were observed at relatively low levels of I , from about 500 mol m 2 s 1 , and a proportional decrease in g with increasing D was also found, at least for values of up to approximately 3.5 kPa. Higher values of g were observed in the morning than in the afternoon, for similar levels of I and D . Unirrigated olive trees recovered quickly after the dry season, showing values of and g similar to those of irrigated trees after just two days. Introduction Many mediterranean fruit tree species are known to adopt drought tolerance, or drought avoidance, strate- gies to overcome the long dry periods that are typical of the region (Larsen et al., 1989; Lo Gullo and Salleo, 1988; Rieger, 1995). In most cases, however, current information is insufficient for a complete understand- ing of how the mechanisms involved actually work. This applies mainly to the short-term water-use dynam- ics, from hours to days - the time scale appropriate for micro-irrigation systems, which are widely used for the water supply of fruit trees in these areas. There- fore, more information is needed to optimize water supply in orchards. In the case of the olive tree (Olea europaea L.), several aspects concerning its capacity to withstand arid environments have already been studied. Abd- FAX No: +345624002. E-mail: [email protected] El-Rahman et al. (1966) measured the water con- tent of olive leaves at saturation, finding a value, 1.59 g water g 1 dry weight, extremely low com- pared with other species growing in the same envi- ronment (5.77 g g 1 for fig, 5.85 g g 1 for grape). Olive leaves contain a high amount of cuticular wax, which should significantly increase the diffusion resis- tance of the cuticular membrane (Leon and Bukovac, 1978). Specialized cells at the base of the peltate stalks are also effective at limiting water loss (Bongi et al., 1987a). The dense packing of the mesophyll layer in olive leaves of the commercial variety Ascolana leads to a low cellular wall conductance thereby pro- viding an efficient system to limit cellular water loss under stress (Bongi et al., 1987b). Lo Gullo and Salleo (1988), however, observed that despite all this protec- tion against water loss, leaves of the wild olive tree Olea oleaster underwent a substantial water loss under conditions of water stress. Regarding changes in the
-
Upload
independent -
Category
Documents
-
view
1 -
download
0
Transcript of Stomatal control of water use in olive tree leaves

Plant and Soil 190: 179–192, 1997. 179c 1997 Kluwer Academic Publishers. Printed in the Netherlands.
Stomatal control of water use in olive tree leaves
J.E. Fernandez, F. Moreno, I.F. Giron and O.M. BlazquezInstituto de Recursos Naturales y Agrobiologıa de Sevilla (CSIC), Apartado 1052, 41080-Sevilla, Spain�
Received 23 September 1996. Accepted in revised form 27 February 1997
Key words: irrigation, leaf age, leaf water potential, leaf water relations, Olea europaea L., var. Manzanillo,stomatal conductance
Abstract
Little is known about the strategies used by olive trees to overcome the long dry periods typical of the areas wherethey are cropped. This makes it difficult to optimize the water supply in orchards. To study the control of waterconsumption by olive trees, measurements of leaf water potential () and stomatal conductance to H2O (g) weremade on 26-year-old Manzanillo olive trees under three irrigation treatments. The first treatment provided enoughwater to cover the crop water demand, the next treatment supplied one third of that rate, and the final treatmentwas no irrigation at all, typical of dry-farming conditions. Under conditions of high vapour pressure deficit of theair (Da), the olive trees prevented excessive water loss by closing their stomata. Leaves of the current year showedbetter stomatal control than did the 1-year-old leaves. The upper-bound functional relationships between g and Da
and photon flux density (IP ) were obtained by boundary-line analysis, based on a technique of non-linear leastsquares. Maximum values of g were observed at relatively low levels of IP , from about 500 �mol m�2 s�1, and aproportional decrease in g with increasing Da was also found, at least for values of up to approximately 3.5 kPa.Higher values of g were observed in the morning than in the afternoon, for similar levels of IP and Da. Unirrigatedolive trees recovered quickly after the dry season, showing values of and g similar to those of irrigated trees afterjust two days.
Introduction
Many mediterranean fruit tree species are known toadopt drought tolerance, or drought avoidance, strate-gies to overcome the long dry periods that are typicalof the region (Larsen et al., 1989; Lo Gullo and Salleo,1988; Rieger, 1995). In most cases, however, currentinformation is insufficient for a complete understand-ing of how the mechanisms involved actually work.This applies mainly to the short-term water-use dynam-ics, from hours to days - the time scale appropriate formicro-irrigation systems, which are widely used forthe water supply of fruit trees in these areas. There-fore, more information is needed to optimize watersupply in orchards.
In the case of the olive tree (Olea europaea L.),several aspects concerning its capacity to withstandarid environments have already been studied. Abd-
� FAX No: +345624002. E-mail: [email protected]
El-Rahman et al. (1966) measured the water con-tent of olive leaves at saturation, finding a value,1.59 g water g�1 dry weight, extremely low com-pared with other species growing in the same envi-ronment (5.77 g g�1 for fig, 5.85 g g�1 for grape).Olive leaves contain a high amount of cuticular wax,which should significantly increase the diffusion resis-tance of the cuticular membrane (Leon and Bukovac,1978). Specialized cells at the base of the peltate stalksare also effective at limiting water loss (Bongi et al.,1987a). The dense packing of the mesophyll layerin olive leaves of the commercial variety Ascolanaleads to a low cellular wall conductance thereby pro-viding an efficient system to limit cellular water lossunder stress (Bongi et al., 1987b). Lo Gullo and Salleo(1988), however, observed that despite all this protec-tion against water loss, leaves of the wild olive treeOlea oleaster underwent a substantial water loss underconditions of water stress. Regarding changes in the
ICPC: PIPS No.: 133381 BIO2KAPplso6583.tex; 18/06/1997; 9:43; v.7; p.1

180
Figure 1. Relative extractable water (REW, see Equation 2 in Mate-rials and methods) measured in the soil of the three treatments onthe measurement days of April, July and September ( treatmentI: weekly irrigation to cover the crop water demand - see Materialsand methods for details; O treatment I/3: the same as in treatmentI, but with about 1/3 of the water applied; # treatment D: unirri-gated trees, with rainfall as the only water supply). The dotted lineindicates the REW value considered to be the water deficit threshold(see Figure 2).
sap osmotic potential, Abd-El-Rahman et al. (1966)observed a marked rise in the osmotic pressure of theolive sap throughout the dry season, exceeding thevalues observed in other xerophytes. Rieger (1995)also observed osmotic adjustment in expanding oliveleaves, finding values of osmotic potential similar tothose reported by Abd-El-Rahman and El-Sharkawi(1974). The increase in sap osmotic pressure enablesthe roots to extract more water when the soil dries(Abd-El-Rahman et al., 1966).
The xerophytic nature of olive roots has beenobserved in anatomical studies (Fernandez et al., 1994)and by the analysis of their hydraulic functioning(Moreno et al., 1996). Salleo et al. (1985) observedthat the vessel lumina, when expressed as percentageof the total xylem cross-sectional area, was half thatmeasured in other xerophytic Mediterranean speciessuch as Vitis vinifera. The low hydraulic conductivityof olive xylem is a feature that seems to play an impor-tant role in the tree’s water relations. For instance,Lo Gullo and Salleo (1988) considered that the water-saving feature of the wild olive tree (Olea oleaster)is due mainly to the low hydraulic conductance of thexylem, which allows the tree to avoid water loss ondays of high atmospheric demand. Larsen et al. (1989)recognized the existence of this feature in the commer-
Figure 2. Relationship between relative extractable water (REW)and predawn leaf water potential (pd) measured on trees underdifferent irrigation treatments. See Figure 1 for definitions of treat-ments. Data from this experiment and from the experiment byFernandez (1989) carried out in the same orchard (4 unirrigatedtrees), have been used. Each point represents the average of sixpdmeasurements per treatment. The mean value of pd is -0.46 MPafor REW� 0.4.
cial olive tree Nabali, but they also observed a stomatalclosure early in the day. The hydraulic conductivityof olive xylem can become even lower under certaincircumstances. Salleo and Lo Gullo (1993) observedlosses of about 10% of hydraulic conductivity in one-year-old twigs of young Olea oleaster trees, whenthese became stressed, due to xylem cavitation. Rieger(1995) observed that drought stress caused a reductionin root hydraulic conductivity. Moreno et al. (1996)observed cavitation in the xylem vessels of the outerannuli of a main near-surface root belonging to a treeresident in dry soil for over three months. After recov-ery by a single irrigation, the xylem vessels nonethelessremained cavitated, and water continued to be drawnfrom deep in the velocity profile.
It seems evident that the olive tree has certain struc-tural features for drought tolerance and it also possess-es active mechanisms which allow it some degree ofcontrol over water loss. However, more research isneeded to establish the degree to which these featuresand active mechanisms act to play a role in the par-simonious character of the olive tree as a water user.For instance, (i) as yet there is no clear evidence ofstomatal control in Manzanillo olive trees (the maincommercial variety for table consumption) as a wayof avoiding losses of water (ii) the stomatal responseto atmospheric vapor pressure deficit and radiation has
plso6583.tex; 18/06/1997; 9:43; v.7; p.2

181
yet to be quantified, and (iii) the influence of leaf ageon the stomatal behaviour has also not been studied yet.The objective of this work was to identify water usestrategies of Manzanillo olive trees by studying howleaf water relations are affected by changes in envi-ronmental water status, radiation, and leaf age. Theresults we present here contribute to answer the threemain points mentioned above. The recovery of unir-rigated olive trees after a lengthy drought period wasalso studied.
Material and methods
Orchard site and irrigation treatments
The experiments were carried out at the experimentalfarm of the Instituto de Recursos Naturales y Agro-biologıa, at Coria del Rıo near Seville in Spain (37�
170 N, 6� 30 W, elevation 30 m). The 1 ha experi-mental orchard was planted in 26-year-old olive trees(Olea europaea L., var. Manzanillo) at a spacing of7�7 m. The soil is a sandy loam of about 2 m depth,with 27.5% coarse sand, 36.5% fine sand, 13.4% siltand 22.6% clay. The volumetric soil water content is0.33 m3 m�3 for a soil matric potential of 0 MPa,and 0.10 m3 m�3 for -1.5 MPa. More details on thesoil characteristics are shown in Moreno et al. (1983,1988).
Three water regimes were imposed during theexperiment: (a) Treatment I involved a weekly irri-gation to replace the crop water demand (ETc, mm) ascalculated by the equation
ETc = KrKcETo (1)
where Kr is the coefficient relating the degree oforchard floor plant cover with the evapotranspiration(Fereres and Castel, 1981). In our case, Kr = 0.69%,since the trees covered 34% of the orchard floor. Kc
is the crop coefficient obtained by Pastor and Orgaz(1994) for olive trees in an area close to our experi-mental orchard (0.6 in April; 0.55 in May and Septem-ber; 0.5 in June; 0.45 in July and August), and ETo(mm) is the potential evapotranspiration as calculat-ed by the FAO-Penman equation, which Mantovani(1994) evaluated as the best for the area. (b) TreatmentI/3 was similar to treatment I, but with only about 1/3of the water applied (Table 1). (c) Treatment D usedsome unirrigated trees, which had rainfall as their onlysource of water supply (Table 1).
Table 1. Water supplied during the experimental peri-od for the three irrigation treatments (a) irrigation dur-ing the dry season (b) irrigation during the recoveryexperiment (c) rainfall events
Water (litres per tree)
Date I I/3 D
(a) Weekly average
from 18 March
to 19 September 815 312 0
(b) 26 September 1418 2269 9500
3 October 1513 1513 2424
Date Rainfall (mm)
(c) 22 April 3.0
27 April 14.0
5 May 4.5
6 June 16.0
26 June 10.0
23 August 29.0
5 September 2.5
The two irrigation treatments were applied to treesin a part of the orchard which had been irrigated regu-larly since they were young. The unirrigated trees werein a different part of the orchard which had been main-tained under dry-farming conditions from the begin-ning. Three representative trees were chosen for eachtreatment. Irrigation treatments I and I/3 were carriedout during the dry season of 1995, from the middle ofMarch to the middle of September (Table 1). The waterwas applied in a 2.5 m radius pond around each treethat was contained by a small earthen dyke. Near theend of the experiment, all the trees were abundantlyirrigated and their recovery after the long drought peri-od was subsequently studied. Two recovery irrigationswere made: the first was on the 26th of September andthe second was on the 3rd of October. Enough waterwas applied to return the rootzone back to field capaci-ty (Table 1, Figure 9). For the irrigation of the D trees,a 3.5 radius pond was built around each tree. With thisbig pond we were trying to avoid dry roots in the root-zone, since dry roots may send a signal for the tree tolimit its water use (Moreno et al., 1996; Tardieu andDavies, 1993). In the irrigated trees, the 2.5 m radiuspond was deemed to be large enough, due to the morerestricted root system of the trees (Fernandez et al.,1991).
plso6583.tex; 18/06/1997; 9:43; v.7; p.3

182
Figure 3. Diurnal time course of leaf water potential () and stomatal conductance (g) measured in April in trees of the three treatments. SeeFigure 1 for definitions of treatments. Each point represents the average of six values per treatment. Vertical bars indicate twice the standarderror. Values of photon flux density (IP ) and vapour pressure deficit of the air (Da) recorded on the measurement days are also plotted. t = timeof day.
Soil water and plant measurements
Soil water measurements were carried out around onetree in each treatment. Measurements were taken 10-15 days apart, and on the same day as plant measure-ments were made. The volumetric water content ofthe soil (�, m3 m�3) from 0.2 m down to 1.5 m wasmeasured every 0.1 m using a neutron probe (Troxler3300, Research Triangle Park, North Carolina, USA)in access tubes installed at 0.5, 1.5 and 2.5 m awayfrom the tree trunk. For the top layer of the soil, �was measured by time-domain-reflectrometry (TDR)using a Tektronix cable tester (Model 1502C, Beaver-ton, Oregon, USA). The TDR waveguides comprised
three parallel stainless steel rods, 2 mm in diameterand 0.15 m long. A portable computer was used torecord and analyse the TDR wave-forms using an anal-ysis similar to that of Baker and Allmaras (1990). Themeasurement points were at the same distance from thetrunk as were the access tubes, and at 0.2 m on eachside of the tube. Soil moisture profiles were used tocalculate a depth equivalent of water, expressed hereas the level of relative extractable water (REW, mm)defined by the equation (Granier, 1987):
REW = (R�Rmin)=(Rmax �Rmin) (2)
where R is the actual soil water content (mm), Rmin
the minimum soil water content measured during the
plso6583.tex; 18/06/1997; 9:43; v.7; p.4

183
Figure 4. Diurnal time course of leaf water potential () and stomatal conductance (g) measured in July in trees of the three treatments. SeeFigure 1 for definitions of treatments. Each point represents the average of six values per treatment. Vertical bars indicate twice the standarderror. Values of photon flux density (IP ) and vapour pressure deficit of the air (Da) recorded on the measurement days are also plotted. t = timeof day.
experiments (mm), and Rmax is the soil water contentat field capacity (mm). Total soil extractable watercalculated from Rmax - Rmin was 306 mm.
The soil matric potential head (h, MPa) was mea-sured by a set of two mercury tensiometers installed atdepths of 0.45 and 0.90 m, and a distance of 1.5 m fromthe trunk. When tensiometers were out of range, h wasobtained from the � measurements and the soil waterretention curve determined by Moreno et al. (1996) inthe same orchard. In the soil of treatment I which waswell watered, the h values were always higher than -0.05 MPa throughout the experimental period, typicalvalues being around -0.03 MPa most of the time. Fortreatment I/3, the values of h were usually higher than-0.09 MPa. In the unirrigated treatment, values of h
decreased throughout the experimental period, due toplant uptake and the scarce rainfall (Table 1). Values aslow as -0.5 MPa were already observed by May, whilevalues lower than -1.5 MPa were reached by the endof the dry season.
Leaf water potential (, MPa) and stomatal con-ductance to H2O (g, mm s�1) were measured in leavesof the current year, which were sunny and healthy.The olive is an evergreen tree in which leaves abscisewhen they are two or three years old. Developmentof new leaves was noted at the end of February, andthey were fully expanded after about four weeks. Leafwater potential was assumed to be equal to the xylempressure potential at the petiole, as measured witha pressure chamber (Soilmoisture Equipment Corp,
plso6583.tex; 18/06/1997; 9:43; v.7; p.5

184
Figure 5. Diurnal time course of leaf water potential () and stomatal conductance (g) measured in September in trees of the three treatments.See Figure 1 for definitions of treatments. Each point represents the average of six values per treatment. Vertical bars indicate twice the standarderror. Values of photon flux density (IP ) and vapour pressure deficit of the air (Da) recorded on the measurement day are also plotted. t = timeof day.
Santa Barbara, California, USA). Measurements of gwere made with a steady-state porometer (LI-1600, LI-COR, Lincoln, Nebrasca, USA) on the abaxial surfaceof leaves. The Manzanillo variety has stomata on theabaxial surface only, and the adaxial surface is coveredby a thick, waterproof cuticle, which prevented waterlosses (Leon and Bukovac, 1978). Hence, no vapourdiffusion was detected on the adaxial surface.
During the three irrigation treatments, leaf mea-surements were made twice in April and July, and threetimes in September, every 2.5 hours from dawn to sun-set. Two leaves were sampled from each experimentaltree, at 1.6-1.9 m above soil level. After analysingthe data from all the experimental period, we foundthat the coefficients of variation were 15.2 for and19.4 for g, which shows that six leaves per treatmentwere enough to calculate the averages of both param-eters. In April and July, leaf measurements were madethe first and third days after irrigation, to check theinfluence of soil drying. In September, measurementswere made six days after irrigation, which was oneday before the recovery experiment began. After thefirst recovery irrigation, and g were measured ear-ly in the morning, just before dawn for , and about8:00 h for g - when the relative humidity of the airdecreased below the operating value of the porometer.Subsequent leaf measurements were made at midday
(about 12:00 h) on days 1, 2, 3, 6 and 9 after irriga-tion. Functional relationships between g and photonflux density (IP ) and vapour pressure deficit of the air(Da) were determined by boundary-line analysis basedon field data and a technique of non-linear least squares(Jarvis, 1976).
On the 30th of April 1996, measurements of ,g and photosynthesis rate (PN , �mol CO2 m�2 s�1)were made in 1-year-old leaves and in leaves of the cur-rent year, to study the influence of leaf age on stom-atal behaviour. Age-related changes in the stomatalbehaviour have been observed in different tree species(Benecke et al., 1981; Reich 1984a, b; Reich andBorchert, 1988). Measurements were made in threetrees of treatment I, every 2 hours from 8:00 to 14:00h. Three young and three old leaves per tree were sam-pled each time. Measurements of PN were made witha portable photosynthesis system (LI-6400, LI-COR,Lincoln, Nebrasca, USA). In addition, ten 1-year-old leaves and ten leaves from the current year weredetached from the trees. The subsequent water loss ofthese leaves was monitored during bench-drying, byfrequent weight measurements with a 10�4 g balance.
plso6583.tex; 18/06/1997; 9:43; v.7; p.6

185
Table 2. Potential evapotranspiration (ETo) for the experimental periodcalculated by the FAO-Penman equation (Doorenbos and Pruitt, 1977).Data from the weather station located some 50 m away from the experi-mental trees were used to calculate ETo
10-day averages Daily values
10-day
Month period ETo (mm) Date ETo (mm)
April 1 5.5 18 April 6.0
2 5.7 20 6.1
3 4.5
25 July 6.9
July 1 6.0 27 8.3
2 7.9
3 8.1 25 September 5.2
27 4.8
September 1 5.6 28 5.4
2 5.0 29 4.7
3 4.8
2 October 1.7
October 1 3.7 5 4.2
2 3.8
3 2.8
Weather measurements
Weather variables were measured with an automat-ic weather station located some 50 m away from theexperimental trees. Thirty-minute averages of glob-al solar radiation, photosynthetically active radiation,wind speed, rainfall, air temperature, and relativehumidity were recorded. These data were used to cal-culate ETo by the FAO-Penman equation (Doorenbosand Pruitt, 1977) (Table 2), and for the calculation ofDa. Values of IP used in the analysis of the stomatalconductance response were measured by the photonsensor on the porometer, so as to record the radiationnormal to the leaf surface.
Results and discussion
Influence of drought stress on and g
In April, at the beginning of the dry season, relativeextractable water was still high enough in the soil ofunirrigated trees to prevent significant water stress, asindicated by Figure 1. We assumed a REW thresholdfor soil water deficit of around 0.4, after plotting REWagainst predawn leaf water potential (pd), which wasused as an indicator of water stress (Figure 2). Data
obtained by Fernandez (1989) on unirrigated trees ofthe experimental orchard have also been included, toincrease the number of datapoints. Figure 2 shows thatpd remains constant for values of REW higher than0.4. A REW threshold of 0.3-0.4 seems to be a generalfeature for many tree species, as reported by Bredaet al. (1995). The daily curves of and g observedon the measurement days of April are shown in Fig-ure 3. Some significant differences between treatmentswere found, especially in the g values measured beforenoon. Smaller differences were observed in . Mea-surements of and g made in July (Figure 4) show thatthe olive tree is able to restrict water loss by closingits stomata. The 25th of July was somewhat fresh, andpartially cloudy day, as can be seen from the recordsof Da and IP . The 27th, however, was a clear, dry,hot day, with a very high Da. On the 25th, the val-ues of decreased quickly in the morning, showingthe lowest values around the middle of the day, andlate in the afternoon. The maximum values of g werereached before midday, in general, decreasing after-wards throughout the day. On the 27th, however, thehigh levels of radiation and atmospheric water demandcaused a different and g response. Thus, decreasedvery quickly early in the morning, for all treatments,reaching minimum values before midday. It remainedmore or less constant throughout the day until late in the
plso6583.tex; 18/06/1997; 9:43; v.7; p.7

186
afternoon, when a sharp increase was observed. Thevalues of g remained fairly constant throughout mostof the day, and they were lower than on the 25th for alltreatments. This shows that the olive trees restrictedwater loss on a day of high atmospheric water demandby closing the stomata early in the morning, preventingan excessive drop in . This agrees with the findingsof Larsen et al. (1989) in Nabali olive trees, thoughthe diurnal patterns of g reported by them are differentfrom those found in Manzanillo variety (Figures 3, 4and 5). Larsen et al. (1989) found maximum values ofg relatively late in the day, whereas Figures 3 to 5 showmaximum values of g before noon, but in the case ofthe 27th of July already commented. The peak valuesof g found by Larsen et al. (1989) are also lower thanthose shown in this work. Thus, Larsen et al. (1989)reported maximum average values of about 1.8 mms�1 in watered olives trees on the 20th of June 1987, acloudless day with a maximum Da of 2.3 kPa. A maxi-mum average value for g of 8 mm s�1 was measured inthe Manzanillo trees of treatment I on the 25th of July(Figure 4), a day of similar weather characteristics tothose on the 20th of June 1987. Lo Gullo and Salleo(1988) observed large diurnal changes in the leaf rel-ative water content of wild olives (Olea oleaster), inspite of their low g. They mentioned that a rapid recov-ery from water loss was probably impossible becauseof the very low hydraulic conductance of the xylem.This feature may be responsible for the tree to preventwater loss on days of high atmospheric demand. A highresistance to water flow has also been observed in thecommercial olive (Rieger, 1995; Salleo et al. 1985). Ifthis were the only mechanism involved in the preven-tion of water losses shown in Figure 4, however, therewould be no reason for the g values measured on the27th to be lower than on the 25th, at least for the case ofunirrigated trees where no appreciable change in REWwas detected between the two measurement days (Fig-ure 1). This decrease in g must be due, therefore, topartial stomatal closure.
The daily curves of and g recorded in July andSeptember (Figures 4 and 5) show the influence of thesoil water supply on both parameters. The values of were much lower in the unirrigated trees than in theirrigated ones. This is in agreement with the valuesof REW measured in each treatment (Figure 1). TheREW value of 0.87 measured in July in treatment Ione day after irrigation shows that the supplied waterwas slightly lower than ETc. This may be due to thefact that soil evaporation was greater in our case thanwhen Pastor and Orgaz (1994) did their experiments to
Figure 6. Stomatal conductance (g) in relation to leaf water potential(). Points represent single observations measured in April and July,between 11:00 and 13:00 h, and in trees of treatments I and D. SeeFigure 1 for definitions of treatments.
obtain the Kc values used in Equation (1). As explainedin Materials and methods, we used irrigation ponds of19.6 m2. The low REW recorded in September in treat-ment I is due to the fact that measurements were madesix days after irrigation, as explained in Materials andmethods. Values of pd never went below -0.50 MPain the I trees. In treatment I/3, the lowest average pd
value was -0.82 MPa, observed in September (Fig-ure 5). In the unirrigated trees, however, the averagevalue of pd was below -1.60 MPa in both July andSeptember. At midday, the lowest average values of were above -2.47 MPa for the irrigated trees, observedin September, but the unirrigated trees reached averagevalues as low as -3.63 MPa in July and -3.62 in Septem-ber. Considerable differences were also observed in gvalues between treatments I and D, throughout most ofthe day. Values of g for treatment I/3 were intermedi-ate. The highest average value of g was 0.86 cm s�1,recorded in July in trees of treatment I.
plso6583.tex; 18/06/1997; 9:43; v.7; p.8

187
Figure 6 shows g in relation to for treatments Iand D and for the months of April and July. Data ofSeptember have not been plotted because we made themeasurements six days after irrigation, as explained inMaterials and methods. A similar relationship betweeng and could be established for both treatments inApril, though treatments were not well established bythat time of the year, as has already been mentioned. InJuly, data of the two treatments appeared clearly sepa-rated, but the scatter of the data and the narrow range of in both treatments make it difficult to establish anyrelationship. The trend of g to decrease as becomesmore negative has also been observed in orange treesby Fereres et al. (1979), and in almond trees by Casteland Fereres (1982) and Torrecillas et al. (1988). Allthose authors also found a wide scatter when plotting gversus. The stomatal response to other environmen-tal factors (Jarvis, 1976) can be responsible for thisscatter.
Higher values of g were observed in the morning,during the opening phase, than in the afternoon, fora similar level of Da. This is clearly shown in Fig-ure 7, where the relationships between g and Da foundin treatments I and D during the course of the 20thof April and the 25th of July have been plotted. Thesame tendency has been observed in the relationshipsbetween g and IP (not shown) though not so clearly,perhaps because Da is the main driving variable forstomatal closure. This behaviour could be due to thefact that the maximum values of IP occurs earlier inthe day than the maximum values of Da (Jarvis, 1976).This sort of response seems to be a common featurein trees. It has also been observed in oak by Hinckleyet al. (1975), in apple by Jarvis (1976), in peach byPunthakey et al. (1984), and by other authors workingwith other species.
and g following rewatering
The evolution of the and g recorded in the morningand at midday throughout the recovery experiment isshown in Figure 8. The corresponding climatic condi-tions and REW values for the measurement days areshown in Figure 9. After only two days we observed lit-tle difference between treatments in the values of pd
(Figure 8). Six days after irrigation any differences inpd were not significant. At midday, similar valuesof were observed just one day after rewatering forall three treatments. Also, and strikingly, we observedhigher values of in the D trees throughout the rest ofthe experiment. The g values (Figure 8) become simi-
Figure 7. The relation between the stomatal conductance (g) of olivetrees of treatments I and D and the vapour pressure deficit of the air(Da) during the course of two experimental days. See Figure 1 fordefinitions of treatments. The arrows show the course of time fromdawn to dusk. Each point represents the average of six values pertreatment. Vertical bars indicate twice the standard error.
lar to those of I trees only two days after irrigation, andremained so afterwards. The low values of g measuredin the morning of the 25th of September were due todifficulties in reaching the null point on the porometer,because of high air humidity. The drop in the middayvalues of g observed on the second and third day afterirrigation (Figure 8) was due to the high Da values ofthose days (Figure 9).
These responses of and g in stressed trees afterrewatering show an remarkable capacity of the olivetree for a quick use of water when this is eventual-ly available, even when the tree has been for a longperiod under very dry conditions. Salleo and Lo Gul-lo (1993) found that stressed Olea oleaster plants lostonly about 10% of hydraulic conductivity of 1-year-old twigs, and that the plants were able to recover fromxylem embolization in a short period. Some features
plso6583.tex; 18/06/1997; 9:43; v.7; p.9

188
Figure 8. Evolution of leaf water potential () and stomatal conduc-tance (g) measured in trees of all the treatments during the recoveryexperiment. See Figure 1 for definitions of treatments. Each pointrepresents the average of six values per treatment. Vertical barsindicate twice the standard error. The arrows indicate the recoveryirrigations (see Table 1). Corresponding traces of IP and Da areshown in Figure 9.
of the olive root system, as observed by Fernandez etal. (1991, 1994), which give it a high adaptability towater stress conditions, may be also partly responsi-ble for the quick recovery of and g. Fernandez etal. (1991) found, in our experimental orchard, that theroot system of olive trees growing under dry-farmingconditions was well developed, exploring a greater soilvolume that those of drip-irrigated trees. Fernandez etal. (1994) observed a more rapid maturation of the tis-sues close to the apex in unirrigated trees than in irrigat-ed ones. This may increase water movement throughthe root system due to the increased water flux associ-ated with secondary vascular development. They alsofound that the metaxylem vessel and central cylindersize were not reduced under drought. Jorba et al. (1985)mentioned the possibility of hormones playing somerole in the stomatal control of stressed trees after rewa-tering. They found that values of previously-wettrees were similar to those of irrigated trees three days
Figure 9. Relative extractable water (REW) measured in the soil ofthe three treatments during the recovery experiment. See Figure 1for definitions of treatments. The dotted line indicates the REWvalue considered to be the water deficit threshold. Values of vapourpressure deficit (Da) and photon flux density (IP ) are also shown.The arrows indicate the recovery irrigations (see Table 1).
after rewatering. Fernandez et al. (1993) found thesame in trees of the same orchard where the presentwork has been carried out. No measurements of gwere made by any of those authors. Kaufmann andLevy (1976) studied the recovery of and g in lemontrees. They found that maximum conductances did notoccur until two or three days after rewatering, althoughrecovery from leaf water stress was complete after oneday. Fereres et al. (1979) observed in orange trees thatrehydration began immediately after irrigation, nor-mal values being observed in less than a week. Therecovery of g was much slower. On trees which had leafwater potentials of less than -5 MPa before dawn, priorto irrigation, g did not fully recover in two months.
Relationships between g and IP and Da
The values of g measured in April and July have beenplotted in Figure 10 together with their counterparts ofIP . The upper-bound functional relationships between
plso6583.tex; 18/06/1997; 9:43; v.7; p.10

189
Figure 10. Stomatal conductance (g) plotted against photon flux den-sity (IP ) measured normal to the leaf surface, in trees of treatmentsI and D. See Figure 1 for definitions of treatments. The upper-boundrelationship between g and IP , as given by Equation (3) (see Resultsand Discussion) has been drawn in the figure. The points representsingle measurements made in April (top) and July (bottom).
g and IP shown in the figure have been obtained byfitting the equation of Jarvis (1976) to our field data,as explained in Materials and methods. The curve cor-responds to the equation
g =b1 b2 Ip
b1 + b2 Ip(3)
where b1 is the asymptotic value of g at infinite IP , andb2 is dg/dIP at IP = 0. We measured g = 0 in the dark,so the parameter b10 mentioned by Jarvis (1976) is notincluded in Equation (3). When the maximum valuesof g were measured in April in treatments I and S, Da
was 0.8 kPa and 1.6 kPa respectively. In July, Da was1.1 kPa when maximum values of g were measured inboth treatments. The curves show a marked response ofg to the increase in IP , from 0 to about 200 �mol m�2
s�1. Few data of g were obtained in April for lowvalues of IP , but in July maximum values of g wereobtained at a relatively low photon flux density, fromabout 500 �mol m�2 s�1. This is in accord with thehigh g values measured early in the morning (Figures3, 4 and 5).
Figure 11. Stomatal conductance (g) plotted against vapour pressuredeficit of the air (Da), in trees of treatments I and D. See Figure 1for definitions of treatments. The upper-bound relationship betweeng and Da, as given by Equation (4) (see Results and Discussion) hasbeen drawn in the figure. The points represent single measurementsmade in April and July, for IP greater than 500 �mol m�2 s�1.
In Figure 11, the g values measured in April andJuly in trees I and trees D have been represented withtheir counterparts of Da, after removing the data forIP below 500 �mol m�2 s�1 to be sure that radiationwas not a limiting factor. The upper-bound functionalrelationships show a linear reduction of g versus Da,similar to that observed by Jarvis (1976) and Thorpeet al. (1980), among others. The equation is
g = 1� �Da (4)
were � is the slope of the relation. A linear reductionin g with increasing Da is generally assumed, fromits maximum value to g = 0 (Jarvis, 1976). Equation(4) shows a proportional decrease in g with increasingDa, for Da values of up to approximately 3.5 kPa. Thestomata, however, remained partly opened at higherDa, as shown in Figure 11.
The curves shown in Figures 10 and 11 show theprobable upper-limit of g versus IP and Da. It has tobe taken into account, however, that IP and Da tendto be correlated, causing some bias in the estimatedparameters of Equations (3) and (4) (Jarvis, 1976). It
plso6583.tex; 18/06/1997; 9:43; v.7; p.11

190
Figure 12. Water loss of detached, bench-dried 1-year-old leavesand the current season leaves. A group of 10 leaves was weighed ineach case. Fresh weight of the 10 old leaves: 2.1706 g; fresh weightof the 10 young leaves: 1.8190 g. Water content of the 10 old leaves:1.0256 g: water content of the 10 young leaves: 1.0898 g.
is also known that there are other variables influencingg, which cause the wide scatter shown in the figures.It seems clear, however, that higher values of g wereobserved in July than in April, for similar values of Da
and IP . This may be due to a lower stomatal closurein aged leaves, which would agree with the resultsshown in the next Section. In July, when the watertreatments are already well established, the upper-limitcurves were lower for the unirrigated trees than for theirrigated ones, showing the effect of the soil moistureon g.
Changes in stomatal control with leaf age
Measurements of , g and PN and water loss ofdetached leaves showed marked differences between1-year-old leaves and leaves of the current year. Aver-ages of were -1.11 MPa for young leaves and -1.35for old leaves. A Student’s t test showed no signifi-cant differences between those averages at p = 0.05,but was significantly different by a narrow margin (p= 0.06). The averages of g (young leaves: 5.2 mms�1; old leaves: 6.3 mm s�1) and PN (young leaves:14.57 �mol CO2 m�2 s�1; old leaves: 20.66 �molCO2 m�2 s�1) were found to be significantly different(p = 0.05 for g; p = 0.01 for PN ). Considering that noH2O or CO2 diffusion takes place through the cuticle(Leon and Bukovac, 1978), these results seem to show
that stomatal closure is more marked in young than inold leaves.
Results from the measurement of water loss bydetached leaves are shown in Figure 12. Young and oldleaves lost water at the same rate soon after detachment.When the water lost exceeded about 10% of the totalleaf water content, the rate of water loss in youngleaves decreased, while it remained about the same inold leaves. 210 minutes after detachment, old leaveshad lost more than twice the amount of water comparedto the young leaves. It appears that 1-year-old leaves donot have the same capacity for stomatal control. Theyremain open under adverse conditions, while stomatalclosure occurs in leaves of the current year.
In hybrid poplar leaves, stomatal conductance wasobserved to decline with leaf age (Reich,1984a). Reichand Borchert (1988) measured changes with leaf agein stomatal conductance and xylem pressure potentialin leaves of five tropical tree species, finding differ-ences between species. In Tabebuia rosea older leaveshad higher conductance and greater water deficits thanyounger leaves. In mature leaves of Mangifera indi-ca and Licania arborea, however, midday values ofconductance were found to decrease with leaf age. Theexperiments with excised leaves of Tabebuia rosea andCordia glabra showed that transpiration was higher inolder than in younger leaves. The older leaves of bothspecies lost about 80% of their water content by 3 hafter excision, while young leaves lost only about 40%.For the olive tree, a xerophytic species, the water lostby 3 h after excision was 35% for 1-year-old leavesand 15% for leaves of the year (Figure 12).
Conclusions
Manzanillo olive trees are able to prevent excessivewater loss on days of high water demand by closing thestomata early in the morning. This capacity for stom-atal control reduces with leaf age. When water was sup-plied after a long dry period, they were able to recoverquickly from water stress. The trees showed a goodresponse to the deficit irrigation. With the frequentbut reduced water supplies of treatment I/3, valuesof leaf water potential and stomatal conductance werequite close to those measured in the trees of treatmentI. Considerable differences in both parameters wereobserved between irrigated and unirrigated trees. Max-imum values of stomatal conductance were observed atphoton flux densities of about 500�mol m�2 s�1 whichequates to about 1/4 full sun. A proportional decrease
plso6583.tex; 18/06/1997; 9:43; v.7; p.12
191
in conductance with increasing vapour pressure deficitwas also observed, for values of up to approximately3.5 kPa.
Acknowledgements
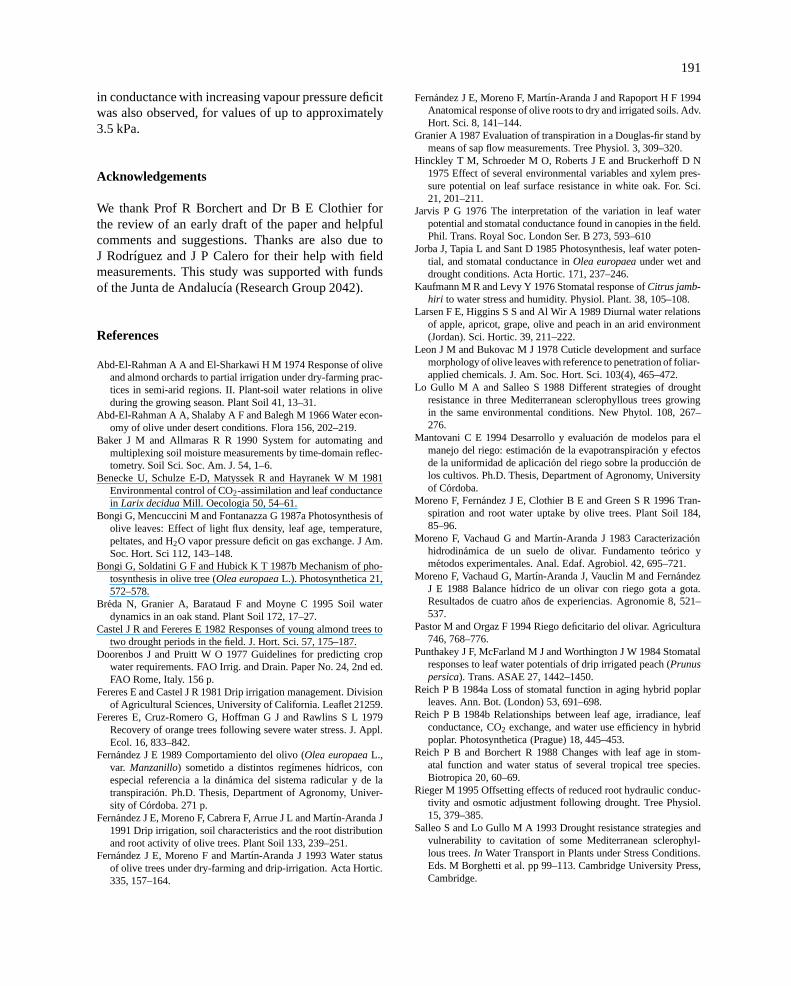
We thank Prof R Borchert and Dr B E Clothier forthe review of an early draft of the paper and helpfulcomments and suggestions. Thanks are also due toJ Rodrıguez and J P Calero for their help with fieldmeasurements. This study was supported with fundsof the Junta de Andalucıa (Research Group 2042).
References
Abd-El-Rahman A A and El-Sharkawi H M 1974 Response of oliveand almond orchards to partial irrigation under dry-farming prac-tices in semi-arid regions. II. Plant-soil water relations in oliveduring the growing season. Plant Soil 41, 13–31.
Abd-El-Rahman A A, Shalaby A F and Balegh M 1966 Water econ-omy of olive under desert conditions. Flora 156, 202–219.
Baker J M and Allmaras R R 1990 System for automating andmultiplexing soil moisture measurements by time-domain reflec-tometry. Soil Sci. Soc. Am. J. 54, 1–6.
Benecke U, Schulze E-D, Matyssek R and Hayranek W M 1981Environmental control of CO2-assimilation and leaf conductancein Larix decidua Mill. Oecologia 50, 54–61.
Bongi G, Mencuccini M and Fontanazza G 1987a Photosynthesis ofolive leaves: Effect of light flux density, leaf age, temperature,peltates, and H2O vapor pressure deficit on gas exchange. J Am.Soc. Hort. Sci 112, 143–148.
Bongi G, Soldatini G F and Hubick K T 1987b Mechanism of pho-tosynthesis in olive tree (Olea europaea L.). Photosynthetica 21,572–578.
Breda N, Granier A, Barataud F and Moyne C 1995 Soil waterdynamics in an oak stand. Plant Soil 172, 17–27.
Castel J R and Fereres E 1982 Responses of young almond trees totwo drought periods in the field. J. Hort. Sci. 57, 175–187.
Doorenbos J and Pruitt W O 1977 Guidelines for predicting cropwater requirements. FAO Irrig. and Drain. Paper No. 24, 2nd ed.FAO Rome, Italy. 156 p.
Fereres E and Castel J R 1981 Drip irrigation management. Divisionof Agricultural Sciences, University of California. Leaflet 21259.
Fereres E, Cruz-Romero G, Hoffman G J and Rawlins S L 1979Recovery of orange trees following severe water stress. J. Appl.Ecol. 16, 833–842.
Fernandez J E 1989 Comportamiento del olivo (Olea europaea L.,var. Manzanillo) sometido a distintos regımenes hıdricos, conespecial referencia a la dinamica del sistema radicular y de latranspiracion. Ph.D. Thesis, Department of Agronomy, Univer-sity of Cordoba. 271 p.
Fernandez J E, Moreno F, Cabrera F, Arrue J L and Martın-Aranda J1991 Drip irrigation, soil characteristics and the root distributionand root activity of olive trees. Plant Soil 133, 239–251.
Fernandez J E, Moreno F and Martın-Aranda J 1993 Water statusof olive trees under dry-farming and drip-irrigation. Acta Hortic.335, 157–164.
Fernandez J E, Moreno F, Martın-Aranda J and Rapoport H F 1994Anatomical response of olive roots to dry and irrigated soils. Adv.Hort. Sci. 8, 141–144.
Granier A 1987 Evaluation of transpiration in a Douglas-fir stand bymeans of sap flow measurements. Tree Physiol. 3, 309–320.
Hinckley T M, Schroeder M O, Roberts J E and Bruckerhoff D N1975 Effect of several environmental variables and xylem pres-sure potential on leaf surface resistance in white oak. For. Sci.21, 201–211.
Jarvis P G 1976 The interpretation of the variation in leaf waterpotential and stomatal conductance found in canopies in the field.Phil. Trans. Royal Soc. London Ser. B 273, 593–610
Jorba J, Tapia L and Sant D 1985 Photosynthesis, leaf water poten-tial, and stomatal conductance in Olea europaea under wet anddrought conditions. Acta Hortic. 171, 237–246.
Kaufmann M R and Levy Y 1976 Stomatal response of Citrus jamb-hiri to water stress and humidity. Physiol. Plant. 38, 105–108.
Larsen F E, Higgins S S and Al Wir A 1989 Diurnal water relationsof apple, apricot, grape, olive and peach in an arid environment(Jordan). Sci. Hortic. 39, 211–222.
Leon J M and Bukovac M J 1978 Cuticle development and surfacemorphology of olive leaves with reference to penetration of foliar-applied chemicals. J. Am. Soc. Hort. Sci. 103(4), 465–472.
Lo Gullo M A and Salleo S 1988 Different strategies of droughtresistance in three Mediterranean sclerophyllous trees growingin the same environmental conditions. New Phytol. 108, 267–276.
Mantovani C E 1994 Desarrollo y evaluacion de modelos para elmanejo del riego: estimacion de la evapotranspiracion y efectosde la uniformidad de aplicacion del riego sobre la produccion delos cultivos. Ph.D. Thesis, Department of Agronomy, Universityof Cordoba.
Moreno F, Fernandez J E, Clothier B E and Green S R 1996 Tran-spiration and root water uptake by olive trees. Plant Soil 184,85–96.
Moreno F, Vachaud G and Martın-Aranda J 1983 Caracterizacionhidrodinamica de un suelo de olivar. Fundamento teorico ymetodos experimentales. Anal. Edaf. Agrobiol. 42, 695–721.
Moreno F, Vachaud G, Martın-Aranda J, Vauclin M and FernandezJ E 1988 Balance hıdrico de un olivar con riego gota a gota.Resultados de cuatro anos de experiencias. Agronomie 8, 521–537.
Pastor M and Orgaz F 1994 Riego deficitario del olivar. Agricultura746, 768–776.
Punthakey J F, McFarland M J and Worthington J W 1984 Stomatalresponses to leaf water potentials of drip irrigated peach (Prunuspersica). Trans. ASAE 27, 1442–1450.
Reich P B 1984a Loss of stomatal function in aging hybrid poplarleaves. Ann. Bot. (London) 53, 691–698.
Reich P B 1984b Relationships between leaf age, irradiance, leafconductance, CO2 exchange, and water use efficiency in hybridpoplar. Photosynthetica (Prague) 18, 445–453.
Reich P B and Borchert R 1988 Changes with leaf age in stom-atal function and water status of several tropical tree species.Biotropica 20, 60–69.
Rieger M 1995 Offsetting effects of reduced root hydraulic conduc-tivity and osmotic adjustment following drought. Tree Physiol.15, 379–385.
Salleo S and Lo Gullo M A 1993 Drought resistance strategies andvulnerability to cavitation of some Mediterranean sclerophyl-lous trees. In Water Transport in Plants under Stress Conditions.Eds. M Borghetti et al. pp 99–113. Cambridge University Press,Cambridge.
plso6583.tex; 18/06/1997; 9:43; v.7; p.13

192
Salleo S, Lo Gullo M A and Oliveri F 1985 Hydraulic parametersmeasured in 1-year-old twigs of some Mediterranean species withdiffuse-porous wood: Changes in hydraulic conductivity and theirpossible functional significance. J. Exp. Bot. 36, 1–11.
Tardieu F and Davies W J 1993 Integration of hydraulic and chemicalsignalling in the control of stomatal conductance and water statusof droughted plants. Plant Cell Environ. 16, 341–349.
Thorpe M R, Warrit B and Landsberg J J 1980 Responses of appleleaf stomata: a model for single leaves and a whole tree. PlantCell Environ. 3, 23–27.
Torrecillas A, Ruiz-Sanchez M C, Leon A and Garcia A L 1988Stomatal response to leaf water potential in almond trees underdrip irrigated and non irrigated conditions. Plant Soil 112, 151–153.
Section editor: B E Clothier
plso6583.tex; 18/06/1997; 9:43; v.7; p.14