Effect of Bamboo Leaves Extract Concentration ...
36
International Journal Of Science, Engineering, And Information Technology Volume 03, Number 02, July 2019 Journal homepage: https://journal.trunojoyo.ac.id/ijseit * Corresponding author. E-mail address: [email protected] E-ISSN 2548-4214 Effect of Bamboo Leaves Extract Concentration (Dendrocalamus sasper L.) as Bioherbicide on Nutsedge (Cyperus rotundus L.) Nur Hidayatullah a , Mochammad Hoesain b dan Saifuddin Hasjim c a,b,c, Program Studi Agroteknologi, Fakultas Pertanian, Universitas Jember A B S T R A C T Cyperus rotundus one cause of the decline in crop production due to the nature of parasitism in plants cultivation. Cyperus rotundus including important weeds in various types of plants that can cause reduced farming production. The use of chemical herbicides continuous and not wisely, today raises many problems, especially in environmental pollution and health. Alternatives that are used to control weeds in addition to using bioherbisida is with bamboo leaf ekstrrak (Dendrocalamus sasper) containing phenolic compounds, coumarin and flavonoids. Based on the results of previous studies, the use of biohersida quite effective in controlling Cyperus rotundus. In this study will test the effectiveness of bamboo leaf extract (Dendrocalamus sasper) against Cyperus rotundus. The study used a completely randomized design (CRD) 7 treatments with 5 replicates. Research that has been carried out bamboo leaf extract (Dendrocalamus sasper) capable mengperhambat growth of sedges, it is evident from the parameters is done on research that has been carried out. Of the various parameters of observation, bamboo leaf extract treatment with a concentration of 90% real effect on all parameters and is the most effective treatment of all treatments. Keywords: Cyperus rotundus, Bioherbicide, bamboo leaf extract. Article History Received 07 April 18 Received in revised form 01 February 19 Accepted 20 July 19 1. Introduction Weed is a type of plant whose presence is undesirable on agricultural land because it can reduce productivity in cultivated plants, in addition to that weeds are also parasitic to plants in taking nutrients, water, space, CO2, and light (Lestari et al, 2012). Weeds on agricultural land cause competition in nutrients and water, so that the main crops cannot grow optimally and reduce agricultural production. The size (degree) of weed competition against the main crop will affect both the good and bad growth of staple crops and in turn will affect the high and low yields of staple crops (Harsono, 1993). Cyperus rotundus is one of the weeds whose existence is detrimental to other plants, C. rotundus is included that is often found in various agricultural land. C. rotundus reduces production from various crops, such as corn 41%, onions 89%, okra 62%, carrots 50%, green beans 41%, cucumbers 48%, cabbage 35%, tomatoes 38%, rice 38% and cotton 34% (Kristanto, 2006). Control that is often done by farmers using synthetic herbicides farmers do not pay attention to the impact of the use of synthetic herbicides continuously that can pollute the environment. An alternative that needs to be done is to look for control techniques to control weeds, from using chemicals to switching to environmentally friendly pesticides called bioherbicides. Bioherbicides are weed control that exploits the potential of phenol compounds from plants that are able to inhibit growth or kill weeds that are able to provide phytotoxicity (poisoning) to weeds. . One that can be used as an ingredient of making bioherbicides is bamboo leaf extract (Dendrocalamus sasper). Bamboo (D. sasper) is a type of plant that is often found in various regions and almost all regions of Indonesia have bamboo plants. According to the results of research Yanda et al (2013) bamboo leaves (D. sasper) contain phenolic compounds flavonoids, coumarin and phenolic. Bamboo plants are plants belonging to the genus Dendrocalamus, in the genus Dendrocalamus contain compounds of coumarin, flavonoids, anthraquinone, polysaccharides, phenolic and amino acids. According to the results of research Riskitavani and Purwani (2013) plants that contain phenolic compounds flavonoids, coumarin and phenolic can be indicated as bioherbicides or vegetable herbicides because compounds such as phenols, phenolic acids, coumarin, and flavonoids can provide phytotoxicity effects on weed puzzles (C. Rotundas)). 2. Methods This research was conducted from August 2016 to October 2016 at GreenHouse University of Jember
-
Upload
khangminh22 -
Category
Documents
-
view
3 -
download
0
Transcript of Effect of Bamboo Leaves Extract Concentration ...
International Journal Of Science, Engineering, And
Information Technology Volume 03, Number 02, July 2019
Journal homepage: https://journal.trunojoyo.ac.id/ijseit
* Corresponding author.
E-mail address: [email protected]
E-ISSN 2548-4214
Effect of Bamboo Leaves Extract Concentration (Dendrocalamus sasper
L.) as Bioherbicide on Nutsedge (Cyperus rotundus L.)
Nur Hidayatullaha, Mochammad Hoesainb dan Saifuddin Hasjimc
a,b,c,Program Studi Agroteknologi, Fakultas Pertanian, Universitas Jember
A B S T R A C T
Cyperus rotundus one cause of the decline in crop production due to the nature of parasitism in plants cultivation. Cyperus rotundus including important weeds in
various types of plants that can cause reduced farming production. The use of chemical herbicides continuous and not wisely, today raises many problems,
especially in environmental pollution and health. Alternatives that are used to control weeds in addition to using bioherbisida is with bamboo leaf ekstrrak
(Dendrocalamus sasper) containing phenolic compounds, coumarin and flavonoids. Based on the results of previous studies, the use of biohersida quite effective
in controlling Cyperus rotundus. In this study will test the effectiveness of bamboo leaf extract (Dendrocalamus sasper) against Cyperus rotundus. The study
used a completely randomized design (CRD) 7 treatments with 5 replicates. Research that has been carried out bamboo leaf extract (Dendrocalamus sasper)
capable mengperhambat growth of sedges, it is evident from the parameters is done on research that has been carried out. Of the various parameters of
observation, bamboo leaf extract treatment with a concentration of 90% real effect on all parameters and is the most effective treatment of all treatments.
Keywords: Cyperus rotundus, Bioherbicide, bamboo leaf extract.
Article History
Received 07 April 18 Received in revised form 01 February 19 Accepted 20 July 19
1. Introduction
Weed is a type of plant whose presence is undesirable on agricultural
land because it can reduce productivity in cultivated plants, in addition to
that weeds are also parasitic to plants in taking nutrients, water, space,
CO2, and light (Lestari et al, 2012). Weeds on agricultural land cause
competition in nutrients and water, so that the main crops cannot grow
optimally and reduce agricultural production. The size (degree) of weed
competition against the main crop will affect both the good and bad
growth of staple crops and in turn will affect the high and low yields of
staple crops (Harsono, 1993).
Cyperus rotundus is one of the weeds whose existence is detrimental
to other plants, C. rotundus is included that is often found in various
agricultural land. C. rotundus reduces production from various crops, such
as corn 41%, onions 89%, okra 62%, carrots 50%, green beans 41%,
cucumbers 48%, cabbage 35%, tomatoes 38%, rice 38% and cotton 34%
(Kristanto, 2006).
Control that is often done by farmers using synthetic herbicides
farmers do not pay attention to the impact of the use of synthetic
herbicides continuously that can pollute the environment. An alternative
that needs to be done is to look for control techniques to control weeds,
from using chemicals to switching to environmentally friendly pesticides
called bioherbicides. Bioherbicides are weed control that exploits the
potential of phenol compounds from plants that are able to inhibit growth
or kill weeds that are able to provide phytotoxicity (poisoning) to weeds. .
One that can be used as an ingredient of making bioherbicides is
bamboo leaf extract (Dendrocalamus sasper). Bamboo (D. sasper) is a
type of plant that is often found in various regions and almost all regions
of Indonesia have bamboo plants. According to the results of research
Yanda et al (2013) bamboo leaves (D. sasper) contain phenolic
compounds flavonoids, coumarin and phenolic. Bamboo plants are plants
belonging to the genus Dendrocalamus, in the genus Dendrocalamus
contain compounds of coumarin, flavonoids, anthraquinone,
polysaccharides, phenolic and amino acids. According to the results of
research Riskitavani and Purwani (2013) plants that contain phenolic
compounds flavonoids, coumarin and phenolic can be indicated as
bioherbicides or vegetable herbicides because compounds such as
phenols, phenolic acids, coumarin, and flavonoids can provide
phytotoxicity effects on weed puzzles (C. Rotundas)).
2. Methods
This research was conducted from August 2016 to October 2016 at
GreenHouse University of Jember

International journal of science, engineering and information technology
Volume 03, Issue 02, July 2019
97
2.1. Tools and materials.
The tools used are stationery, paper labels, knives, scissors, measuring
cup, seeding tub, blender, filter paper, 1000 ml Elyenmeyer, Buchner
Funnel, Ruler, Analytical Scales, and Handsprayer. Materials that will be
used in this study are Polybag (size 35 x 35), bamboo leaves
(Dendrocalamus asper), Aquades, 70% Ethanol, and Teki Grass Bulbs.
2.2. Planting Media Preparation.
The planting media used in this study were soil, sand, and compost
with a participation of 1: 1: 1. The planting media to be used were divided
into two parts, the first in the planting tub to plant puzzles and the second
was soil for polybags.
2.3. Seeding.
The soil is put into a tub of puzzles and tubers of puzzles that will be
sown as many as 500 tubers of puzzles, then planted in a planting tub that
has available soil and then watered every day during seeding glass.
Seeding is done for 15 days, then transferred to a polybag in the form of a
plot to be applied.
2.4. Making Bamboo Leaf Extract.
Making the first bamboo leaf extract that must be done is taking
bamboo leaves obtained from the Tenggarang Bondowoso area. Bamboo
leaves are taken at the shoots, middle and bottom of the tree. According to
the leaves that have been taken then weighed as much as 3500 grams, then
needed to use air and rinsed, then air-dried for 24 hours (reducing air
content on bamboo leaves (H2O)). The dried leaves are then cut into small
pieces using scissors, then bamboo leaves are weighed according to each
of 150 grams, 300 grams, 450 grams, 600 grams, 750 grams, and 900
grams, then spent to use a blender. The results of the blender from each
aid are then extracted using polar solvents, namely 70% ethanol as much
as 1000 ml in 2000 ml Erlenmeyer until the powder is completely
submerged. Soaking is done at room temperature for 24 hours. The results
of the bamboo leaf extract were filtered with a Buchner funnel lined with
filter paper. This bamboo leaf extract is used in space until when it is used
for applications.
2.5. Removal.
Puzzle grass, bulbs that have been sown for 15 days are then
transferred to polybags. The transfer was carried out during the sick days
and each polybag gave 10 plants of puzzles. After 2 days the turf is ready
to be applied with a bamboo leaf extract solution.
2.6. Bamboo Leaf Extract Application.
The application is carried out in the morning in accordance with the
pesticide application technique, the application of bamboo leaf extract
bioherbicides is done every 2 days until the 30th day after planting so that
it takes 15 times the application on the turf. The application of bamboo
leaf extract on puzzle grass is done using a hand sprayer of 3 spray parks
so that each polybag gets 24 times the treatment of bamboo leaf extract.
2.7. Observation Parameters
a. Plant height
The height observed in the turf began from day 2 after transfer from
the nursery to polybags and was measured with a frequency of 2 days.
Plant height measurements were measured from the base of the plant stem
to the top of the puzzle leaves and measured using a ruler.
b. Growth rate
The growth rate parameter is carried out 3 times, namely within a
period of 10 days in a 30-day research period. The growth rate is carried
out to find out how many nutrients are absorbed by the Cyperus rotundus
plant or it can be said that the dry weight of the puzzle grass plant. Phase
parameters of the growth rate are carried out by removing plants in the
study polybag as much as 2 plants/parameters, then cutting the roots of the
puzzle grass plants. Parts of the puzzle grass that have been cut so that
only the base of the plant leaves to the tops of the leaves, then dried using
an oven with a temperature of 105o C (Sutaryo, 2009) for 24 hours and
then weighed using analytical scales.
c. Phytotoxicity
This parameter is performed 2 HSA (days after application) which is
the 3rd day with a frequency of 3 days and uses observation techniques
with a truelove score system, namely:
0 = no poisoning (with 0-5% poisoning, leaf shape and color are not
normal).
1 = mild poisoning (with 6-10% poisoning rate, abnormal leaf shape, and
color)
2 = moderate poisoning (with 11-20% poisoning rate, abnormal leaf
shape, and color)
3 = severe poisoning (with 21-50% poisoning rate, abnormal leaf shape,
and color)
4 = poisoning is very heavy (with a level of poisoning> 50%, the shape
and color of the leaf is not normal, so the leaves dry and fall to death)
(Rizkitavani and Purwani, 2013)
d. Gross weight
Puzzle grass that has been treated for 30 days with a frequency of 3
days treatment, after 30 days the puzzle grass (Cyperus rotundus) is
removed from the poly bag and weighed wet using analytical scales.
e. Root Length
The puzzle grass that has been treated for 30 days with a frequency of
3 days treatment, after 30 days the puzzle grass (Cyperus rotundus) is
removed from the polybag and measured the length of the root by using a
ruler from the root base to the longest root.
3. Result and Discussion
Research on the Effect of Concentration of Bamboo Leaf Extract
(Dendrocalamus sasper L.) as Bioherbicides on Teki Grass (Cyperus
rotundus L.) was conducted as an alternative in controlling weed puzzle
grass. Variance Analysis Table (Table 1) of the observed variables of
plant height, growth rate, wet weight, and root length.

International journal of science, engineering and information technology
Volume 03, Issue 02, July 2019
98
Table 1. Summary of F-Calculations Variable Analysis of Plant
Height Variables
Note: * = significantly different, ** = very real different, ns = not
significantly different
The results of the analysis of variance (Table 1) show that the
observed variables of plant height, growth rate, wet weight, and root
length. The results of the analysis of variance on all observed variables
above the time of emergence of shoots showed a real effect so that further
tests were used using the Duncan 5% test.
Table 2. Effect of bamboo leaf extract concentration on plant
height variables.
Note: Numbers followed by different letters show significantly
different results on the Duncan Test of 5%.
Based on Duncan's 5% test results (Table 2) it is known that the
treatment of bamboo leaf extracts affects plant height. The last
observation (day 30) of treatment A received the highest average of 45.35
cm, while the plants receiving treatment in treatment F gave the lowest
average of 31.70 cm. Day 30 in Table 4.2 shows that treatment A was
significantly different from treatment C, D, E, F and G and was not
significantly different from treatment B. treatment F was significantly
different from treatment A, B, and C.
These results are in accordance with Ariestiani's report (2000) that,
herbicide treatment has been shown to show a very significant effect on
weed height, which is to inhibit the process of growth in weeds so that
growth occurs abnormally due to the presence of active compounds
contained in the herbicide that is reversed in weeds. According to Khotib
(2002) states that flavonoid compounds contained in bamboo leaves have
a role in the process of growth inhibition, which acts as a strong inhibitor
of IAA-oxidase. Astutik et. al. (2012) states that this inhibitory
mechanism includes a series of complex processes through several
metabolic activities which include growth regulation through disruption in
growth regulators, nutrient uptake, photosynthesis, respiration, stomata
opening, protein synthesis, carbon stockpiling, and pigment synthesis.
Table 3. Effect of bamboo leaf extract concentration on the
variable rate of growth of puzzles
Note: Numbers followed by different letters show significantly
different results on the Duncan Test of 5%.
Duncan test results 5% last observation (30th day) treatment A is the
highest average of 0.10 grams / 10 days, while treatment G gets the lowest
value of 0.02 grams / 10 days. The average of the two treatments shows
that weeds that get treated, absorb fewer nutrients.
The results of the research that have been carried out are getting
significantly different results showing that the occurrence of
photosynthesis that takes place in the turfgrass plants is disturbed or
hampered due to the active substances contained in bamboo leaves
(Dendrocalamus sasper) namely phenols, phenolic acids, coumarins, and
flavonoids, in certain concentrations of phenol compounds used as
bioherbicides can inhibit and reduce yields in major plant processes.
These obstacles occur in the formation of nucleic acids, proteins, and
ATP. The reduced amount of ATP can suppress almost all cell metabolic
processes, so the synthesis of other substances needed by plants will also
be reduced (Salisbury and Ross, 1995). Reducing the amount of ATP will
thus create abnormal growth of the turf that affects the rate of growth of
the turf.
Table 4. Effect of bamboo leaf extract concentration on the wet
weed grass variable
Note: Numbers followed by different letters show significantly
different results on the Duncan Test of 5%.
Duncan test results of 5% on the variable number of roots (Table 4)
Treatment A gave the highest average of 4.33 grams, while plants that
received treatment on treatment G gave the lowest average of 2.77 grams.
Treatment A was significantly different from treatments C, D, E, F and G
and was not significantly different from treatment B. Treatment C was
significantly different from treatments A, B, E and G and was not
significantly different from treatments D and F. Treatment G was
significantly different with all treatments.
Bamboo leaf extract contains phenol compounds, causing abnormal
growth in puzzles of weeds. Salisbury and Ross (1995) state that phenol
acids can be toxic to plants so that they interfere with the growth of puzzle
grass weeds. According to Devi et al (1997) states that phenol compounds
inhibit plant growth through several ways, including inhibiting cell
division and elongation, inhibiting the work of hormones, changing the
working pattern of enzymes, inhibiting the process of respiration,

International journal of science, engineering and information technology
Volume 03, Issue 02, July 2019
99
reducing the ability of photosynthesis, reducing the opening of stomata,
inhibiting absorption water and nutrients and reduce membrane
permeability. phenol is a chemical compound that is widely used as an
insecticide, herbicide, and fungicide. These results are consistent with the
opinion of Oudejans (1991) phenol is very high in toxicity, is non-
selective and works effectively as an organic herbicide and is largely
inhibited weed growth.
Table 5. Effect of bamboo leaf extract concentration on the
variable length of the puzzle grassroots
Note: Numbers followed by different letters show significantly
different results on the Duncan Test of 5%.
Based on table 4.5 the data obtained from each treatment and in
treatment A get the highest average compared to all treatments with a
value of 20.45 cm, while in treatment G gets the lowest average of 17.90
cm.
The results of the treatment of bamboo leaf extracts applied to the
puzzle grass get significantly different results because of the phenol
compounds contained in the bamboo leaves. According to Devi et al
(1997) states that phenol compounds inhibit plant growth, one of which is
to reduce the ability of photosynthesis, the decreased process of
photosynthesis in puzzle weeds will affect the growth of the puzzle weeds,
including the roots of weeds. This is due to the inhibition of
photosynthesis results which are translocated at the root (Haryanti, 2013)
so that it affects the growth of roots in the weeds of puzzles.
Phytotoxicity (poisoning) is a parameter that is observed to determine
the level of poisoning experienced by puzzle weeds and to see the
effectiveness of bamboo leaf extracts used as plant-based herbicides by
looking at the symptoms of poisoning arising from weed puzzles.
Symptoms can be seen on the leaves of weed puzzles because the
application stage is sprayed on the leaves that work systemically (entering
through plant tissue).
Graph 1. Effect of bamboo leaf extract of various concentrations on
phytotoxicity of puzzles
The administration of bamboo leaf extract (Dendrocalamus sasper) to
the weed puzzle (Cyperus rotundus) affects the physical condition of the
weed puzzle. Graph 3.1 shows the higher concentration of bamboo leaf
extract shows the difference in the results of weed poisoning levels.
Bamboo leaf extract is effective in controlling weed puzzles, this can be
seen in the graph above which shows that bamboo leaf extract is toxic in
weed puzzles. Treatment F (concentration level 75%) and G
(concentration level 90%) were the most effective treatments compared to
other treatments, namely getting a high poisoning score compared to other
treatments. Treatment G (concentration level 90%) is the best treatment
that is able to give an average poisoning score of 3.4. Graph 3.1 shows
that the 90% of treatment was the fastest phytotoxicity treatment.
Symptoms of poisoning that occur in puzzle grass plants that begin at
the tip of the leaves of plants, yellow color and dries on the leaves of
puzzles weeds are caused by the presence of active ingredients derived
from bamboo leaf extracts that are sprayed on the leaves of puzzle weeds
that enter through plant tissue. Bamboo leaf extract (Dendrocalamus
sasper) containing flavonoids, coumarin, and phenolic can provide
phytotoxicity to Cyperus rotundus. Bioherbicides derived from bamboo
leaves are systemic, generally systemic bio-herbicides. According to
Doflanmingo (2013) the disruption of physiological processes in Cyperus
rotundus plants responds in several forms of symptoms, including the
main symptoms (Main Symptoms) seen abnormal growth, can exceed
normal size or smaller than normal size, then discoloration (symptoms
phytotoxicity), both in the leaves, stems, roots, fruits, flowers, besides that
there is also the death of tissue, plant parts become dry and are marked
with the withering of the leaves of plants. Withered events are caused by
the absorption of water that cannot keep up with the rate of evaporation of
water from plants.
4. Conclusion
Based on the research results obtained, bamboo leaf extract
(Dendrocalamus sasper L) is effective in suppressing the growth of puzzle
grass (Cyperus rotundus L) and the concentration of 90% bamboo leaf
extract (Dendrocalamus sasper L) is the best in inhibiting the growth of
weed puzzles (Cyperus rotundus L) and get the fastest level of
phytotoxicity than other treatments.
REFERENCES
[1] Ariestiani. 2000. Kajian Efektiivitas Herbisida Glifosat-2,4D
120/240 AS, Glifosat-2,4-D 120/120 AS, dan 2,4-D 865 AS untuk
Pengendalian Gulma pada Tanaman Jagung (Zea Mays L). Bogor:
Institut Pertanian Bogor
[2] Astutik, A., Raharjo., dan Purnomo, T. 2012. Pengaruh Ekstrak
Daun Beluntas Pluchea Indica L. terhadap Pertumbuhan Gulma
Meniran (Phyllanthus Niruri L.) dan Tanaman Kacang Hijau
(Phaseolus Radiatus L.). LenteraBio, 1(1): 9-16
[3] Devi, S.R., Pellisier and Prasad. 1997. Allelochemical. In:
M.N.V.Prasad (Eds).1997. Plant Ecophysiology. John Willey and
Sons, Inc. Toronto, Canada. 253-303.
[4] Doflamingo, A. 2013. Fungsi Air Bagi Tanaman. Jakarta: Perduli
Pertanian Indonesia
[5] Harsono, A. 1993. Gulma pada Tanaman Kacang Tanah. Dalam
Kasno, A., A. Winarto, Sunardi. Kacang Tanah (Hal. 153-170).
Monograf Balittan Malang No. 12. Balai Penelitian Tanaman
Pangan Malang.

International journal of science, engineering and information technology
Volume 03, Issue 02, July 2019
100
[6] Haryanti, S. 2013. Respon Pertumbuhan Jumlah dan Luas Daun
Nilam (Pogostemon cablin Benth) pada Tingkat Naungan yang
Berbeda. Respon Pertumbuhan Jumlah, 1(1): 20-26
[7] Kristanto, B. 2006. Perubahan Karakter Tanaman Jagung (Zea
mays L.) AKIBAT Alelopati dan Persaingan Teki (Cyperus
rotundus L.). Indon. Trop. Anim. Agric. 31 (3): 189-194
[8] Khotib, M. 2002. Potensi Alelokimia Daun Jati untuk
Mengendalikan Echinocloa crusgalli. Bogor: Program Studi Kimia
Institut Pertanian Bogor
[9] Lestari, D., Indradewa, D., dan Rogomulyo, R. 2012. Gulma di
Pertanian Padi (Oryza sativa L.) Konvensional, Transisi, dan
Organik. Yogyakarta
[10] Oudejans, JH. 1991. Agro Pesticides: Properties and Function in
Integrated Crop Protection. Bangkok: United Nations Bangkok.
[11] Riskitavani, D. dan Purwani, K. 2013. Studi Potensi Bioherbisida
Ekstrak Daun Ketapang (Terminalia catappa) terhadap Gulma
Rumput Teki (Cyperus rotundus). Sains dan Seni Pomits, 2(2): 59-
63
[12] Salisbury, F.B. dan C.W. Ross. 1995. Fisiologi Tumbuhan,
Biokimia Tumbuhan, jilid 2. Penerjemah: Lukman, D.R. dan
Sumaryono. Bandung: Penerbit ITB.
[13] Sutaryo, D. 2009. Perhitungan Biomassa Sebuah Pengantar untuk
Studi Karbon dan Perdagangan Karbon. Bogor: Wetlands
Internasional Indonesia Programme
[14] Yanda, M., Nurdin, H., Santoni, A., 2013. Isolasi dan Karakteristik
Senyawa Fenolik dan Uji Aktioksidan dari Ektrak Daun Bambu
(Dendrocalamus asper). Kimia Unand, 2(2): 51-55

International Journal Of Science, Engineering, And
Information Technology Volume 03, Number 02, July 2019
Journal homepage: https://journal.trunojoyo.ac.id/ijseit
* Corresponding author.
E-mail address: [email protected].
E-ISSN 2548-4214
Streaming Performance Analysis of Virtual Objects in Augmented
Reality Cloud Based on X86 and ARM Processor Types
Arda Surya Editya
Nahdatul Ulama University, Sidoarjo, Indonesia
A B S T R A C T
Augmented Reality is a technology that makes it possible to create 3D objects in the real world with the help of a camera on a gadget. In its
development, Augmented Reality technology began to be developed and combined with cloud computing technology. With the existence of Cloud
computing technology Augmented reality can work more efficiently because all 3D objects can be stored on the Cloud. With the development of this
technology, the author feels the need to conduct an analysis to determine the right processor in making the Augmented Reality Cloud application,
because there is no research that is used as a reference in developing hardware and software used for Augmented Reality Cloud. Result of this
experiment can be concluded CISC architecture processors have faster time in detecting markers compared to RISC architecture processors, because
CISC processor speeds are faster than RISC processors.
Keywords: Augmented reality, Cloud, CISC, Processor, RISC.
Article History
Received 20 February 19 Received in revised form 12 March 19 Accepted 22 June 19
1. Main text
Today the development of the computer world has made a lot of
progress. The application of computers at this time almost becomes a
necessity in every activity carried out by humans, almost in every activity
we will not be separated from the computer. Image processing is one
example of the development of the computational world which is now
starting to be applied one of its applications, namely Augmented R eality
technology . [1] Augmented Reality is an experience that brings out a
form in the real world that is enhanced by computer-generated content
that is intertwined with specific locations or activities, many uses of
Augmented Reality ranging from being applied to education, health, and
others. Along with the development of Augmented Reality technology
and the many applications that utilize Augmented Reality technology, it
shows great enthusiasm among users. From time to time the development
of Augmented Reality has had many developments so that Augmented
Reality began to be combined with many other technologies, one of which
is Augmented Reality combined with Cloud technology.
With this Cloud technology makes it easy to store objects that will be
displayed on Augmented Reality, making it easier for users to experience
this Augmented Reality technology even with very small memory
capacity gadgets. With the combination of Augmented Reality Cloud, it
raises new problems, which are difficult for developers to develop
applications based on X86 processors or ARM-based processors because
there is no reference for what processor is good to use in implementing
Augmented Reality Cloud . In this paper I will discuss the processor
whether it is optimal to be used for devices that use Augmented Reality
Cloud technology
2. STATE OF THE ART
[1] Augmented reality is an experience in which a form emerges in the
real world that is enhanced by computer generated content that is
intertwined with specific locations or activities. [4] Augmented Reality is
a technology that combines the virtual world with the real world so that it
can bring an image of virtual objects to the real world with an Augmented
Reality Environment. While the Augmented Reality Environment can be a
computer, smartphone, or all computer-based equipment.
The framework for the Augmented Reality process can be described as
follows.
Figure 1. System Scheme
International journal of science, engineering and information technology
Volume 03, Issue 02, July 2019
102
In figure 1, the process of Augmented Reality is explained so that
detection of markers is needed to be able to bring up Augmented Reality
objects.
2.1. Cloud
Cloud computing is internet-based computing which means storing
and accessing data, programs, and other computing devices via the
internet.
Characteristics [5] cloud computing Users access data, applications, or
other services with the help of a browser. The infrastructure provided by
third parties is accessed using the internet. It doesn't have to require high
level IT skills. Reliable services can be obtained by using several sites.
Maintenance is easier because it doesn't need to be installed on each user's
computer. Payments based on facilities used Performance can be
monitored. Security can be as good or better than traditional systems.
Mobile Cloud is a cloud implementation that is implemented on
mobile devices [6] mobile cloud also allows users to use all cloud
resources on mobile devices.
2.2. Processor X86 and ARM
Broadly speaking, many processors on the market are types of X86
and ARM for X86-based processors using CISC (Complex Instruction Set
Computing) instructions, while ARM-based processors use RISC (Reduce
Instruction Set Computing) instructions. [7] CISC has characteristics. Has
a very large and complex set of instructions.
1) Instructions generally take more than 1 clock cycle for execution.
2) The instructions have different sizes.
3) Complex addressing methods.
4) Works very well in simple compilers.
While RISC has the following characteristics:
1) Simple old instructions
2) The instruction is executed at 1 clock cycle
3) Format fixed instructions / fix
4) Experience instruction uses a fixed mechanism (load and store).
5) Need complexity before entering into the compiler.
2.3. Augmented Reality Cloud
Augmented Reality Cloud has the same process in the process of
reading markers to bring up 3D objects but in Augmented Reality Cloud
3D objects are stored on the Cloud so that it can streamline memory on
local devices. [2] The process of Augmented reality Cloud starts with
capturing the marker using the camera on the device, then the data that has
been processed on the local process is sent to the cloud. In the processed
cloud data the local process is matched to the database, the corresponding
results will be sent back to the device and bring up 3d objects. Below is a
working chart for Augmented Reality Cloud.
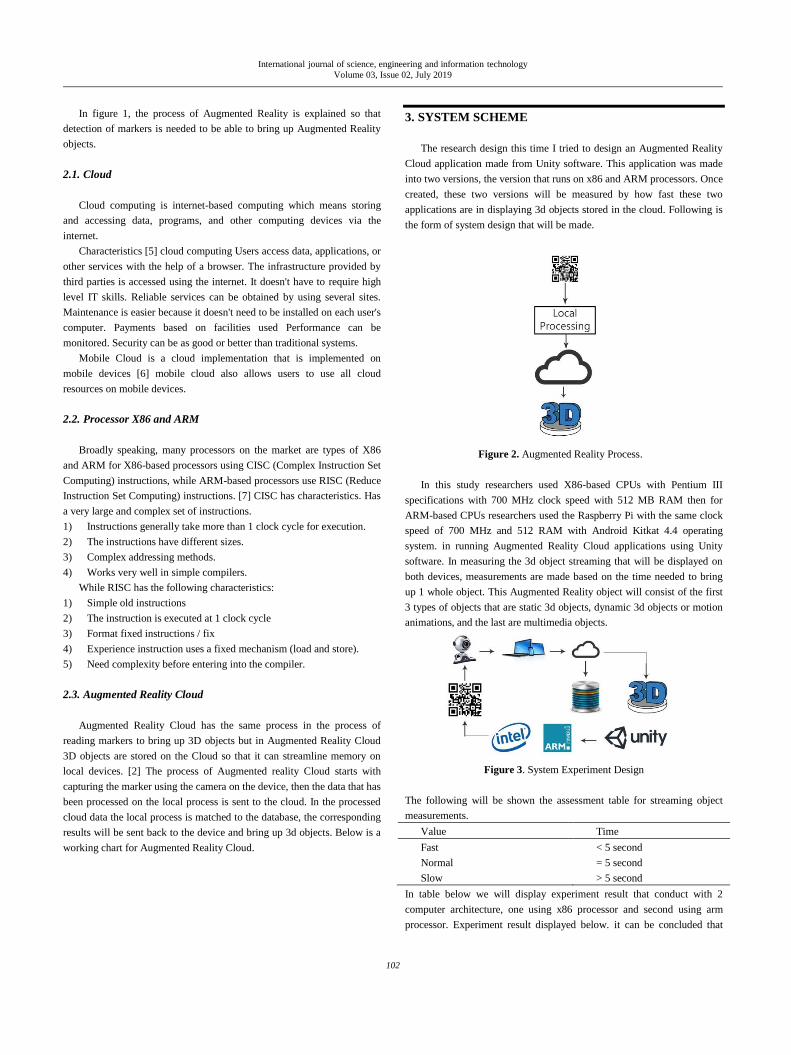
3. SYSTEM SCHEME
The research design this time I tried to design an Augmented Reality
Cloud application made from Unity software. This application was made
into two versions, the version that runs on x86 and ARM processors. Once
created, these two versions will be measured by how fast these two
applications are in displaying 3d objects stored in the cloud. Following is
the form of system design that will be made.
Figure 2. Augmented Reality Process.
In this study researchers used X86-based CPUs with Pentium III
specifications with 700 MHz clock speed with 512 MB RAM then for
ARM-based CPUs researchers used the Raspberry Pi with the same clock
speed of 700 MHz and 512 RAM with Android Kitkat 4.4 operating
system. in running Augmented Reality Cloud applications using Unity
software. In measuring the 3d object streaming that will be displayed on
both devices, measurements are made based on the time needed to bring
up 1 whole object. This Augmented Reality object will consist of the first
3 types of objects that are static 3d objects, dynamic 3d objects or motion
animations, and the last are multimedia objects.
Figure 3. System Experiment Design
The following will be shown the assessment table for streaming object
measurements.
Value Time
Fast < 5 second
Normal = 5 second
Slow > 5 second
In table below we will display experiment result that conduct with 2
computer architecture, one using x86 processor and second using arm
processor. Experiment result displayed below. it can be concluded that

International journal of science, engineering and information technology
Volume 03, Issue 02, July 2019
103
x86 processors have very fast detection speed when detecting markers
compared to arm processors because there is a difference between the two
architectures where x86 is a CISC architecture processor even though the
CISC architecture program has properties requiring several cycles to run a
program line but the CISC architecture has a very fast processing speed so
that even though it is done in several cycles there is no significant delay.
On ARM processors that have RISC architecture seen in the graph, it
takes a long time to detect a marker because RISC architecture requires 1
cycle to run a program line, but the constraints of RISC architecture
processors when the research took place have no processor that has a
clock speed which quickly affects the results of the experiment.
Figure 4. Experiment Result
But according to researchers if the RISC processor has a higher speed and
the number of cores in the processor added does not rule out the
possibility that RISC will be faster in detecting markers than CISC
architecture processors.
4. Conclusion
The conclusions in this study can be described as follows:
CISC architecture processors have fast marker detection speeds
compared to RISC architecture processors for AR Cloud technology.
Judging from the characteristics of the RISC processor, it can be
concluded that RISC processors can be faster in detecting markers
on AR Cloud technology with the condition that the number of cores
and clock speed is fast so that program line execution can be done
quickly thereby reducing process delay.
REFERENCES
[1] Yuen Yin, Yaouyuneong Gallayanee and Johnson Erik, “Augmented
Reality: An Overview and Five Directions for AR in Education,”
Journal of Educational Technology Development and Exchange,
October 2011.
[2] Huang Bai-Ruei, Lin Chang-Hong and Lee Cia-Han, “Mobile
Augmented Reality Based on Cloud Computing,” IEEE Trans. Anti-
Counterfeiting, Security and Identification (ASID) , August 2012.
[3] Camba Jorge, Contero Manuel and Herranz Gustavo Salvador,
“Desktop vs. Mobile: A Comparative Study of Augmented Reality
Systems for Engineering Visualizations in Education,” IEEE Trans.
Frontiers in Education Conference (FIE) , October 2014.
[4] Editya Arda Surya, “Pengembangan Media Pembelajaran Dengan
Menggunakan Teknologi Augmented Reality Untuk Meningkatkan
Prestasi Belajar Pada Mata Pelajaran Teknik Dasar Elektronika Pada
Smk Negeri 1 Sidoarjo,” Unesa Journal , October 2014.
[5] J.Yashpalsinh, and M. Kirit, “Cloud Computing - Concepts,
Architecture and Challenges,” 2012 International Conference on
Computing, Electronics and Electrical Technologies [ICCEET], pp.
877-880, March 2012.
[6] Chen Ming, Ling Chen and Zhang Wenjun, “Analysis of Augmented
Reality Application based on cloud Computing,” 2012 International
Conference on Image and Signal Processing, October 2012.
[7] Blem Emily, Menon Jaikrishnan and Sangkaralingam Karthikeyan, “A
Detailed Analysis of Contemporary ARM and X86 Architectures,”
IEEE Intl. Symposium on High Performance Computer Architecture
(HPCA 2013), October 2013.

International Journal Of Science, Engineering, And
Information Technology Volume 02, Number 01, July 2018
Journal homepage: https://journal.trunojoyo.ac.id/ijseit
* Corresponding author.
E-mail address: [email protected].
E-ISSN 2548-4214
An angle velocity of blade and lift force relationship of the single rotor
system
Al Ala, Arfita Yuana Dewib, Taufal Hidayatc
a,b,cElectrical Engineering, FTI ITP Padang, Padang, Indonesia
A B S T R A C T
Problems in utilizing Quadcopter, either as a hobby or as special needs are still many obstacles or weaknesses such as; plane easy to fall; plane easy
hit; the battery is not durable; vulnerable to weather conditions and others. In this regard, Quadcopter's research and development has grown to include
weaknesses of existing Quadcopter planes and to improve aircraft facilities and capabilities. In developing the knowledge and information about the
Quadcopter aircraft, the data or parameters related to aircraft lift capability factors; fly long; flying high; type of motor used; the type of propeller used;
including the sensors and control systems used. Thus, this study was to find the relationship between changes in the BLDC motor voltage source to the
rotor angle velocity (ω); Change of rotor speed to wind velocity through rotor (v); change of rotor speed to rotor lift (Ft); change of wind speed to rotor
lift; push the following rotor (Ct). In this study, empirical testing was conducted in the laboratory to determine the relationship among others: changes
in the BLDC motor voltage source to the rotor angle velocity (ω); Change of rotor speed to wind velocity through rotor (v); change of rotor speed to
rotor lift (Ft); change of wind speed to rotor lift; push the following rotor (Ct). Test and measurement results data show that; the relationship between
lift power generated with rotational speed is not proportional Nonlinearity occurs when the rotor is released from the self and starts pulling the strain
gauge when the rotation speed reaches around 65 rps. Once the rotation speed of the rotor is able to reach up to 1.5 Newton lift then the thrust rising
trend increasing sharply to the increasing the speed of rotation of the rotor. A special rotor that has BLDC motor specifications such as; 1200 KV, 5
Volt and 30 Ampere; blade with a radius of r 0.12 m; at a temperature of about 27 oC; in the condition there are no other wind currents then obtained
thrust (Ct) of 1.732.
Keywords: Rotation Speed, Quadcopter, Thrust Coefficient.
Article History
Received 25 October 18 Received in revised form 12 February 19 Accepted 20 Juny 19
1. Introduction
Today, Quadcopter aircraft has become a trend of the world's people,
whether used as a special purpose or as a hobby. The special use of
Quadcopter aircraft such as military interests, the interests of mapping
surveys and other purposes such as natural disaster relief (Al Al, 2017).
The use of Quadcopter as a hobby has spawned a community of
Quadcopter maniac societies, almost covering any country in the world as
a Quadcopter. Quadcopter existence will become more important to take a
bigger role in various purposes including business. They will be an
integral part of everyday human life activities, such as from small things
to greater interests such as defense and security (Parhar 2016).
In the use of Quadcopter, both as a hobby or as a special need are still
many obstacles or weaknesses such as; plane easy to fall; the plane is easy
to hit; the battery is not durable; vulnerable to weather conditions and
others. In relation to that, Quadcopter's research and development is
becoming more and more developed to cover the weaknesses of the
existing Quadcopter aircraft as well as to improve aircraft facilities and
capabilities (Magnussen, 2015). The Vertical Take off Landing (VTOL)
Aircraft is a type of aircraft that can do take off and landing perpendicular
to the earth so it can be done in a narrow place. The UAV of this type is
suitable for the survey location function in a narrow area such as urban
residential areas or many shrubs areas (Al Al, 2016).
Pounds 2006 has been researching about Pilot, quad-rotor robot
chassis and avionics using custom-built motor and battery off-the-shelf,
into a highly reliable experimental platform. This vehicle uses the plant
dynamics are tuned with mounted on board attitude control to stabilize
flight. SISO linear controller is designed to regulate the conduct flyer.The
UAV has more dynamic stability than helicopters. Therefore, this aircraft
does not require a special pilot to mengopersikannya. They are mostly
used in different interests such as logistic purposes, agriculture, fire
sensing, military exercises etc. Propeller and BLDC motors are integrated
UAV rotor drive devices that generate a drive for takeoff. The process of
rotor lift analysis is very complex and complicated. Analysis results this
style is important, in choosing a motor for use on the UAV systems (Patel
at. al 2017). Tao in 2016, examines the air traffic management system is

International journal of science, engineering and information technology
Volume 03, Issue 02, July 2019
105
unmanned. The purpose of this research is to: define the system; current
system practices; how pilots use the system, and who has the authority;
determine the physical architecture of what is needed in a system that
handles a wide variety of aircraft.In developing the knowledge and
information about the Quadcopter aircraft, the data or parameters related
to the lifting ability factor of the aircraft; long flight; high fly; type of
motor used; the type of propeller used; including the sensors and control
systems used. Accordingly, this study proposes to find a relationship
between changes in BLDC motor voltage source to rotor angle velocity
(ω); changes in rotor angle velocity to wind speed through the rotor (v);
the change in the angular velocity of the rotor to the rotor lifts (Ft);
changes in wind speed to rotor lift; rotor thrust coefficient (Ct).
2. Literaure Review
The ability of aircraft to fly in the air is in principle based on;
Newton's law; Archimedes; Pascal; Bernoulli, and the law of continuity.
Newton's law describes the relationship between forces acting on an
object and its motion. The law of Archimedes explains the upward
pressure on an object when immersed in a liquid. Pascal's law states that
the pressure given to the liquid is passed in all directions.
Bernoulli Law explains that the increase in fluid velocity causes a
decrease in pressure on the flow. The Law of Continuity suggests the fact
that the mass of the fluid moves will not change when the negative
(Hydrodynamics 2006).
Newton's Law I states: every object will remain in perpendicular
motion or remain in a static state if there is a resultant, force (F) works on
that object:
(constant)
Newton's law II, states that the force is equal to the difference in
momentum (mass multiplied by the speed) of each time change.
Newton's Law III states: that every action must have a reaction in the
same direction and opposite direction (F1 = F1’). The law of Archimedes
says that: If an object is immersed in a liquid thing, it will be pressured
upward as large as the weight of a liquid dampened by it.
Where:
FA = Archimedes pressure (N/m3)
ρ = Mass Type of liquid (Kg/m3)
g = Gravitasion (N/Kg)
V = Volume of Dyed Objects (m3)
Pascal's law states that "the pressure given by liquids in a confined
space is passed in all directions equally." The difference in pressure due to
differences in the increase in the liquid is formulated as follows:
Where :
ΔP: hydrostatic pressure (Pa)
Ρ: fluid speed (kg/m3)
G: sea level rise against earth gravitation (m/s2)
¬¬¬ΔH: altitude difference of fluid (m)
According to Bernoulli, an increase in the fluid velocity will cause a
decrease in pressure on the flow. This principle is actually a simplification
of the Bernoulli Equation, which states that the amount of energy at a
point in a closed stream is equal to the amount of energy at another point
on the same flow path. There are generally two forms of the Bernoulli
equation; the first applies to incompressible flow, and the other is for
compressible flow fluids.
Incompressible flow is a fluid flow characterized by an unchanged
mass density (density) of the fluid along the stream. The form of the
Bernoulli Equation for non-compressed streams is as follows:
(1)
where:
v = fluid speed
g = earth gravitation
h = altitude relative to a reference
p = fluid pressure
ρ = fluid density
The above equation applies to non-compressed streams with the
following assumptions: that the flow is steady state and there is no
inviscid friction. In another form, the Bernoulli Equation can be written as
follows:
(2)
The compressible flow fluid is a fluid flow characterized by changing
the mass density of the fluid along the stream. The Bernoulli equation for
compressed streams is as follows:
(3)
where:
= gravitational potential energy per unit mass; if gravity is
constant then
= enthalpy of fluid per mass unit
(4)
where: s the thermodynamic energy per unit mass, also referred to
as the specific internal energy.
The moving fluid mass does not change as it flows. This fact leads us
to an important quantitative relation called the continuity equation.To
clarify the details of this centre pay attention to Figure 1
Figure 1. Mass Flow Rate
The volume of fluid flowing in the first part, V1, which passes through
the area of A1 at rate v1 over the time range Δt is A1v1 Δt. By knowing
the relationship of Volume and Mass type, the mass flow rate through the
area A1 is
(5)

International journal of science, engineering and information technology
Volume 03, Issue 02, July 2019
106
The same situation occurs in the second part. The mass flow rate
passing through A2 for the time span Δt is:
The volume of fluid flowing over the time span Δt in the area A1 will
have an amount equal to the volume flowing in A2. Therefore:
or ρ.A.V is constant.
Guido at. all 2016, investigates UAV Uses for capturing reliable GPS
technology as a benchmark. Video processing algorithm for vehicle track
acquisition based on OpenCV libraries. Assessment of the accuracy of
video processing algorithms of an instrumentation vehicle is equipped
with high precision GPS. The video capture experiment was conducted in
two case studies. The results of this experiment highlight the flexibility of
UAV technology combined with video processing techniques in
monitoring real-time traffic data. The Interests area is defined in which all
points of the target vehicle trajectory collected through the GPS receiver
are mapped.
Comparing this path monitored by the UAV with GPS traces used as a
benchmark, the analysis shows that: Root Mean Square Equations
Percentage in velocity evaluations equals 3.96% and 3.57%, for case
studies 1 and 2 respectively. While on the other hand, more deeply
analyzes various error ranges such as: camera position; angle of incident;
the position of the object or the fetch frame. The results are used for the
measurement and eligibility of the obvjek position (Babinec 2016).
Research on lifts and drag force of a UAV by using Computational Fluid
Dynamics (CFD) technique is proposed (by Karna S. Patel et al. 2014 ),
because wind tunnel experiments are very difficult and additional cost
more. This technique shows a close proximity to the real experiment. In
the principle, when the aircraft is on the air, there are four main forces
acting on the plane, the thrust T, drag D, lift and weight of the plane
(weight W). The four aerodynamic forces in flight are discussed by
George Cayley, 2008.
Meanwhile, the quadcopter movements such as back and forth; Left
and right; up and down, influenced by variations in direction, speed and
acceleration of four rotors. for a quadcopter that has fixed blade
parameters that can change is the speed and acceleration of the propeller
angle [kranik 2011]. The propeller serves to transfer power by converting
rotational motion into thrust to propel a vehicle like an aeroplane, through
a mass of air, by rotating two or more twin blades from the main axle. A
propeller acts as a rotating wing and produces a force that applies
Bernoulli principles and Newton's laws of motion, resulting in a
difference in pressure between the front and back or top-down or left-right
surfaces. The size of the blade used in quadcopter varies depending on
the size of the quadcopter and the load to be lifted by the quadcopter.
Therefore to take into account how much the lifting power and the speed
of a quadcopter it is important to know a relation between size, rotational
speed with the lift of a propeller. The relationship between lift power size
and speed such as equation 6 and 7 [Brandt, 2011].
T = (Ct .π.ρ.r2.v2)/2 (6)
On the line, Coefficient thrust (Ct) can be expressed as equation 7
Ct= 2.T/(π.ρ.r2.v2) (7)
Where: Ct is thrust coefficient; T is rotor thrust; π is 3.14; ρ is density
of air = 1.225; r is radius of blade; v is air speed.
3. Methodos
In this study, empirical testing was done in the laboratory to find out
the relationship amongst other things: changes in BLDC motor voltage
source to rotor angle velocity (ω); changes in rotor angle velocity to
wind speed through the rotor (v); the change in the angular velocity of
the rotor to the rotor lifts (Ft); changes in wind speed to rotor lift; rotor
thrust coefficient (Ct). To obtain the results of these measurements than
required materials and equipment as follows:
1200 Kv BLDC Motor
30 Amper Electronic speed controller (ESC)
Voltage sensor
500 K Ohm Potentiometer
Arduino Uno Microcontroller
Mekanik stand up
LCD display
Blade propeller with radius (r) is 0.12 meter
Digital Anemometer
Digital Tachometer
Digital Strain Gauge
Implementation of this rotor parameter measurement is done in
accordance with the block diagram as in Figure 2.
Figure 2. Block diagram of measurement system
The material and measurement equipment are shown as in Figure 3.
International journal of science, engineering and information technology
Volume 03, Issue 02, July 2019
107
Figure 3.The material and measurement equipmen
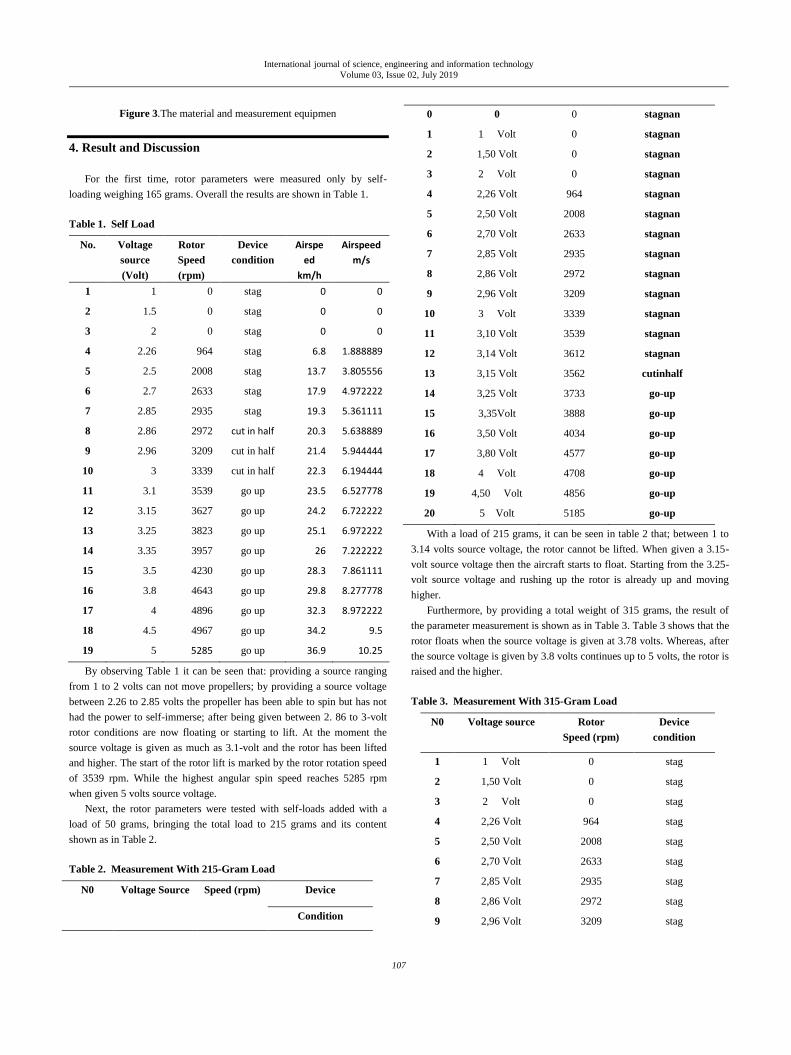
4. Result and Discussion
For the first time, rotor parameters were measured only by self-
loading weighing 165 grams. Overall the results are shown in Table 1.
Table 1. Self Load
No. Voltage
source
(Volt)
Rotor
Speed
(rpm)
Device
condition
Airspe
ed
km/h
Airspeed
m/s
1 1 0 stag 0 0
2 1.5 0 stag 0 0
3 2 0 stag 0 0
4 2.26 964 stag 6.8 1.888889
5 2.5 2008 stag 13.7 3.805556
6 2.7 2633 stag 17.9 4.972222
7 2.85 2935 stag 19.3 5.361111
8 2.86 2972 cut in half 20.3 5.638889
9 2.96 3209 cut in half 21.4 5.944444
10 3 3339 cut in half 22.3 6.194444
11 3.1 3539 go up 23.5 6.527778
12 3.15 3627 go up 24.2 6.722222
13 3.25 3823 go up 25.1 6.972222
14 3.35 3957 go up 26 7.222222
15 3.5 4230 go up 28.3 7.861111
16 3.8 4643 go up 29.8 8.277778
17 4 4896 go up 32.3 8.972222
18 4.5 4967 go up 34.2 9.5
19 5 5285 go up 36.9 10.25
By observing Table 1 it can be seen that: providing a source ranging
from 1 to 2 volts can not move propellers; by providing a source voltage
between 2.26 to 2.85 volts the propeller has been able to spin but has not
had the power to self-immerse; after being given between 2. 86 to 3-volt
rotor conditions are now floating or starting to lift. At the moment the
source voltage is given as much as 3.1-volt and the rotor has been lifted
and higher. The start of the rotor lift is marked by the rotor rotation speed
of 3539 rpm. While the highest angular spin speed reaches 5285 rpm
when given 5 volts source voltage.
Next, the rotor parameters were tested with self-loads added with a
load of 50 grams, bringing the total load to 215 grams and its content
shown as in Table 2.
Table 2. Measurement With 215-Gram Load
N0 Voltage Source Speed (rpm) Device
Condition
0 0 0 stagnan
1 1 Volt 0 stagnan
2 1,50 Volt 0 stagnan
3 2 Volt 0 stagnan
4 2,26 Volt 964 stagnan
5 2,50 Volt 2008 stagnan
6 2,70 Volt 2633 stagnan
7 2,85 Volt 2935 stagnan
8 2,86 Volt 2972 stagnan
9 2,96 Volt 3209 stagnan
10 3 Volt 3339 stagnan
11 3,10 Volt 3539 stagnan
12 3,14 Volt 3612 stagnan
13 3,15 Volt 3562 cutinhalf
14 3,25 Volt 3733 go-up
15 3,35Volt 3888 go-up
16 3,50 Volt 4034 go-up
17 3,80 Volt 4577 go-up
18 4 Volt 4708 go-up
19 4,50 Volt 4856 go-up
20 5 Volt 5185 go-up
With a load of 215 grams, it can be seen in table 2 that; between 1 to
3.14 volts source voltage, the rotor cannot be lifted. When given a 3.15-
volt source voltage then the aircraft starts to float. Starting from the 3.25-
volt source voltage and rushing up the rotor is already up and moving
higher.
Furthermore, by providing a total weight of 315 grams, the result of
the parameter measurement is shown as in Table 3. Table 3 shows that the
rotor floats when the source voltage is given at 3.78 volts. Whereas, after
the source voltage is given by 3.8 volts continues up to 5 volts, the rotor is
raised and the higher.
Table 3. Measurement With 315-Gram Load
N0 Voltage source Rotor
Speed (rpm)
Device
condition
1 1 Volt 0 stag
2 1,50 Volt 0 stag
3 2 Volt 0 stag
4 2,26 Volt 964 stag
5 2,50 Volt 2008 stag
6 2,70 Volt 2633 stag
7 2,85 Volt 2935 stag
8 2,86 Volt 2972 stag
9 2,96 Volt 3209 stag

International journal of science, engineering and information technology
Volume 03, Issue 02, July 2019
108
10 3 Volt 3339 stag
11 3,10 Volt 3539 stag
12 3,14 Volt 3612 stag
13 3,15 Volt 3562 stag
14 3,25 Volt 3716 stag
15 3,34Volt 3788 stag
16 3,35 Volt 3823 stag
17 3,50 Volt 3977 stag
18 3,77 Volt 4317 stag
19 3,78 Volt 4355 floating
20 3,80 Volt 4419 go-up
21 4 Volt 4581 go-up
22 4,50 Volt 4622 go-up
23 5 Volt 5079 go-up
Hereinafter, the measurement of rotor parameters with a total load of
365 grams, the results are shown in Table 4. The data in Table 4 shows
that the source voltage between 1 to 3.8 volts has not been able to hold the
rotor along with the load. The rotor begins to float at a given source
voltage of 3.81 volts with a rotor rotation speed of 4355 rpm. By
providing a voltage source of 3.8 2volts to produce a rotor rotation speed
of 4492-rpm rotor start moving upward, and so on the addition of source
voltage up to 5 volts increase the speed of the rotor is marked with a peak
rotation speed of 5079 rpm..
Table 4. Measurement With 365-Gram Load
N0
Voltage
source
Rotor Speed
(rpm)
Device
condition
1 1 Volt 0 200
2 1,50 Volt 0 200
3 2 Volt 0 200
4 2,26 Volt 964 200
5 2,50 Volt 2008 200
6 2,70 Volt 2633 200
7 2,85 Volt 2935 200
8 2,86 Volt 2972 200
9 2,96 Volt 3209 200
10 3 Volt 3339 200
11 3,10 Volt 3539 200
12 3,14 Volt 3612 200
13 3,15 Volt 3562 200
14 3,25 Volt 3716 200
15 3,34Volt 3788 200
16 3,35 Volt 3823 200
17 3,50 Volt 3977 200
18 3,77 Volt 4317 200
19 3,78 Volt 4355 200
20 3,80 Volt 4419 200
21 3,81 Volt 4578 floating
22 3,82 Volt 4492 Go-up
23 4 Volt 4523 200
24 4,50 Volt 4611 200
25 5 Volt 4944 200
By examining the results of the test table 1 already with table 4, it is
directly indicated that the increase in source voltage raises the increase to
the speed of rotation of the rotor. The speed of rotation of the rotor makes
the air velocity through it is proportional. The air velocity through the
rotor is what will generate the rotor lift, according to the concept proposed
by; Newton's law; Archimedes; Pascal; Bernoulli, and the law of
continuity.
To know directly the relationship between; rotation speed of the rotor
with a voltage source; speed of rotation of the rotor with wind speed and
the rotation speed of the rotor to the resulting thrust, then continued
simultaneous testing as a further explanation.
The rotor angular velocity and voltage source relationship test, the
wind speed and the lift produced by the rotor are performed with stand up
as Figure 4.
Figure 4 Rotor Under Testing
The preparations and test instruments in FIG. 1 comprises blades with
a radius of 0.0645 m; BLDC Motor 1200Kv; Electronic speed controller
(ESC); Arduino microcontroller UNO; Lithium 30 A 5 V Battery; LCD
display as an indicator of the voltage source; Anemometer; Digital
Tachometer and Digital strain gauge. While the test results between the
rotor angular velocities to the voltage source obtained the results such as
graphs in Figure 5.

International journal of science, engineering and information technology
Volume 03, Issue 02, July 2019
109
Figure 5. Rotor Speed vs Voltage Source
The graphic of Figure 5 shows that the increase in voltage source
raises the rotor speed but this increase is not liner as long as the increase
in voltage source. Between 2.8 volts up to 4 volts, the rotor speed has a
linear almost increase. The results of the air velocity testing of the rotor
speed are shown in the graph of figure 6. This graph illustrates that the
increase in rotor speed produces air velocity proportional to the linear
trend during the change.
Figure 6. Rotor and Air Speed Relationship
Measurement of the rotor lift to the change in rotation speed of the
rotor angle is done by measuring instrument of the digital strain gauge and
digital tachometer. The result is shown in the graph in figure 7. Figure 4
states that the increase in rotor speed causes an increase in the rotor thrust.
the relationship of both parameters increase is not linear at all. On the
graph shows that between zero to 60 rps starts with a linear trend, between
65 up to 75 rps trend occurs bend and after that greater than 75 rps
obtained linear trend back. In a non-linear condition between 65 and 75
rps, a change of thrust state is used only to elevate itself until it begins to
draw the strain gauge as a measure of the rotor's lift power.
Figure 7. A Thrust and Rotor Speed Selationship
By using 1200 Kv / 5 Volt BLDC motor and blade which is has a
radius r 0.12 m, and then according to equation Ct= 2.T/(π.ρ.r2.v2) is
obtained by the thrust coefficient (Ct) according to the wind speed as
shown in the Table 5. Where: Ct is thrust coefficient; T is rotor thrust; π is
3.14; ρ is the density of air = 1.225; r is the radius of the blade; v is
airspeed.
After measuring more than 20 times, the average measurement value
as shown in Table 3. Table 3 gives information that the conversion of
wind speed generated by the rotor produces a comparable thrust.
Convertible results are influenced by many factors such as; the
size and shape of the blade; earth gravitation; density of air; and constant
changes. With blade conditions as described earlier and at an ambient
temperature of 27o Celsius the coefficient of this rotor (Ct) of 1.723 is
obtained.
Tabel 5. Average of Ct From Thrust and Air Speed v
Total
thrust
(Newto
n
Airspeed
(m/s)
π ρ radius r
(m)
Coefficient
Thrust
(Ct)
0 0 0 0 0 0
1.225 5.5 3.14 1.225 0.12 1.462219
1.225 5.9 3.14 1.225 0.12 1.270673
1.2838 6 3.14 1.225 0.12 1.287646
1.568 6.2 3.14 1.225 0.12 1.47287
2.254 6.5 3.14 1.225 0.12 1.926322
2.597 7 3.14 1.225 0.12 1.913717
2.842 7.5 3.14 1.225 0.12 1.82433
3.675 8 3.14 1.225 0.12 2.073381
4.165 8.5 3.14 1.225 0.12 2.081512
4.312 9 3.14 1.225 0.12 1.922186
Total Ct 17.23486
Average Ct 1.723486

International journal of science, engineering and information technology
Volume 03, Issue 02, July 2019
110
5. Conclusion
After doing the measurement, testing and analysis of data then it can
be concluded as follows. The increase in the rotation speed of the rotor is
proportional to the increase of the source voltage applied to the motor bldc
and the increase is not always linear as long as the voltage changes from 1
to 5 volts. The linear range occurs between 2.5 to 4 volts. The relationship
between rotation speed and the resulting airspeed is proportional to the
trend of linear.
The relationship between lift powers produced with rotational
speed is not comparable. The nonlinearity occurs when the root is relieved
of the weight of oneself and proceeds to start pulling the strain gauge
when the rotation speed reaches around 65 rps. Once the rotation speed of
the rotor is able to generate lift to reach 1.5 Newton then increase the
endurance rotor has sharp increasingly.
Using a BLDC motor which is specifications as 1200 Kv, 5
Volt and 30 Ampere; blade with a radius of r 0.12 m; at a temperature of
about 27 oC; in the condition is no other wind currents then obtained the
thrust coefficient (Ct) of 1.732.
Acknowledgements
I would like to thank the Ministry of Research, Technology and Higher
Education of Republic Indonesia and Institut Teknologi Padang in
supporting this research.
REFERENCES
[1] A. Al, Arfita Yuana Dewi, Joko Ade Saputro, “Quadcopter capability
development for additional low voltage distribution network location
tracking”, International conference of aplied science on emngineering,
business, linguistics and information technology, Padang-Indonesia,
October 14 th , 2017.
[2] Parag Parihar, Priyanshu Bhawsar, Piyush Hargod, “Design &
Development Analysis of Quadcopter”, COMPUSOFT, An international
journal of advanced computer technology, 5 (6), June-2016 (Volume-V,
Issue-VI
[3] Oyvind Magnussen, Morten Ottestad, Geir Hovland, “Multicopter Design
Optimization and Validation”, Modeling, Identification and Control, Vol.
36, No. 2, 2015, pp. 67–79, ISSN 1890–1328
[4] A. Al, “An Improved a Quadcopter Capability for Forestall Bump with The
Ultrasonic HC SR04 Proximity Sensor Design,” International Conference
on Technology, Innovation, and Society (ICTIS) 2016.
[5]Pounds, P., Mahony, R., and Corke, P., “Modelling and Control of a Quad-
Rotor Robot,” In Proceedings of the Australasian Conference on Robotics
and Automation, 2006.
[6] Yamika Patel, Anant Gaurav, Krovvidi Srinivas, Yamal Singh, “A Review
on Design and Analysis of the propeller used in UAV”. International
Journal of Advanced Production and Industrial Engineering, 2016 IJAPIE-
SI-IDCM 605 (2017) 20–23. Available online at www.ijapie.org
[7]Tao Jiang, Jared Geller, Daiheng Ni, John Collura,” Unmanned Aircraft
System traffic management: Concept of operation and system
architecture,” International Journal of Transportation Science and
Technology 5 (2016) 123–135.
[8]Giuseppe Guido, Vincenzo Gallelli, Daniele Rogano, Alessandro
Vitale,”Evaluating the accuracy of vehicle tracking data obtained from
Unmanned Aerial Vehicles” International Journal of Transportation
Science and Technology 2016 V-5 pp.136–151.
[9] Adam Babinec a, Jiri Apeltauer, “On accuracy of position estimation from
aerial imagery captured by low-flying UAVs”, International Journal of
Transportation Science and Technology, 2016, v.5 pp. 152–166
[10]S. Patel Karana, B. Patel Saumil, “CFD Analysis of an Aerofoil”,
International Journal of Engineering Research, Volume No.3, Issue No.3,
pp : 154-158,2014.
[11] Krajn ı́k, T , Von´asek, V, Fiˇser, D & Faigl, J 2011, AR-Drone as a
Platform for Robotic Research, The Gerstner Laboratory for Intelligent
Decision Making and Control Department of Cybernetics, Faculty of
Electrical Engineering Czech Technical University, Prague
[12] Brandt, J.B. and Selig, M.S., "Propeller Performance Data at Low
Reynolds Numbers," 49th AIAA Aerospace Sciences Meeting, AIAA Paper
2011-1255, Orlando, FL, January 2011.

International Journal Of Science, Engineering, And
Information Technology Volume 02, Number 01, July 2018
Journal homepage: https://journal.trunojoyo.ac.id/ijseit
* Corresponding author.
E-mail address: [email protected], [email protected], [email protected].
E-ISSN 2548-4214
Forecasting the Number of Admission of New Students of State
Polytechnic Using Exponential Single Smoothing Methods
Eka Larasati Amaliaa, Dimas Wahyu Wibowob, Deasy Sandhya Elya Ic
a,b,cInformation Technology, Malang State Polytechnic Jalan Soekarno Hatta No 09 PO BOX 04 Malang, East Java, Indonesia
A B S T R A C T
Forecasting is a prediction of uncertain events in the future. Forecasting the number of new students is one of the things that can be used for planning
materials for the teaching and learning process, therefore it is necessary to predict the number of new students. This research was conducted at Malang
State Polytechnic. The annual data analyzed was taken from 2011 to 2017. To predict the number of new students, the Single Exponential Smoothing
method was used. This forecasting method focuses on decreasing the priority exponentially on the previous observation object. In exponential
smoothing or exponential smoothing there are one or more smoothing parameters determined explicitly, and this result determines the weight imposed
on the observation value. Based on the calculation results, the smallest error value is found at the value of α = 0.9 with MAD value 8.41, MAPE
7.21%, and RMSE 10.7.
Keywords: Forecasting, Students, Single Eksponential Smoothing
Article History
Received 25 October 18 Received in revised form 12 February 19 Accepted 20 July 19
1. Introduction
Forecasting is an activity that predicts or predicts what will happen in
the future based on past data. Forecasting is an important thing in a
company or organization in making a management decision. Whether or
not the results of a study are largely determined by the accuracy of the
predictions made.
Malang State Polytechnic is a vocational education in Malang City
which has several departments with different levels of interest. One of the
departments is Electrical Engineering, Mechanical Engineering,
Information Technology, Civil Engineering, Chemical Engineering,
Accounting, and Commerce Administration. The progress of a college is
influenced by the size of the quality of graduation. Judging from the
number of applicants for Malang State Polytechnic, they have large
applicants from within or outside the region each year. This of course
requires a prediction or forecasting system to predict the number of
prospective new students with the aim of making decisions and
prioritizing how many prospective students will be accepted.
To make a prediction system or forecasting the number of prospective
new students required a good forecasting method and sufficiently precise
calculations to predict the number of prospective students who register. In
this study, the method to be taken is single exponential smoothing. This
method is done by repeating calculations continuously using the latest
data.
2. Methodology
2.1. Forecasting
According to Heizer and Render (2009: 162), forecasting is art and
science to predict future events. Forecasting is the most important part in
making a decision in an organization or company. This is because
forecasting can be the basis of short, medium, or long-term planning for
the company. In addition, forecasting can also be used to find out when an
event will occur, so that appropriate action can be taken. In making
predictions strived for uncertainty can be minimized, by calculating
prediction errors. Forecast errors can be measured by:
Mean absolute deviation (MAD)
MAD is a value calculated by taking the number of absolute values of
each forecasting error divided by the number of periods of data (n). The
following equation 1 is the MAD calculation formula.
𝑀𝐴𝐷 =∑|𝑎𝑐𝑡𝑢𝑎𝑙−𝑓𝑜𝑟𝑒𝑐𝑎𝑠𝑡𝑖𝑛𝑔|
𝑛 (1)
Mean absolute percent (MAPE)

International journal of science, engineering and information technology
Volume 03, Issue 02, July 2019
112
It is the average of the overall percentage of errors (differences)
between actual data and forecasting data. Accuracy measures are matched
with time series data, and are shown in percentages. The following
equation 2 is the MAPE calculation formula.
𝑀𝐴𝑃𝐸 =∑(𝑎𝑏𝑠𝑜𝑙𝑢𝑡𝑒 𝑑𝑒𝑣𝑖𝑎𝑡𝑖𝑜𝑛/𝑣𝑎𝑙𝑢𝑒)∗100
𝑛 (2)
Mean squared error (MSE)
Each error or remainder is squared. Then added up and added to the
number of observations. This approach regulates large forecasting errors
because they are squared. The following equation 3 is the MSE
calculation formula.
𝑀𝑆𝐸 =∑(𝑓𝑜𝑟𝑒𝑐𝑎𝑠𝑡 𝑒𝑟𝑟𝑜𝑟)2
𝑛 (3)
Root mean squared error (RMSE)
It is rooted in the value of the MSE that has been searched before. V
The smaller the value generated the better the forecasting results will be
done. The following equation 4 is the RMSE calculation formula.
𝑅𝑀𝑆𝐸 = √∑(𝑓𝑜𝑟𝑒𝑐𝑎𝑠𝑡 𝑒𝑟𝑟𝑜𝑟)2
𝑛 (4)
2.2. Single Exponential Smoothing
The Exponential Smoothing Forecasting Method is widely used to
predict the demand for goods (demand) which is very fast. This method is
not influenced by trend and season. The formula is as follows:
St+1 = α Xt + (1 – α) St (5)
Where :
St + 1 : Prediction for period to t + 1
Xt : Real value of period to t
St : Forecast for period t
α : Weight which shows the smoothing constant
3. Result and Discussion
Many decisions can be made depending on the number of students
including the ratio of the number of lecturers and students, the building
for the teaching and learning process and other facilities on campus.
Malang State Polytechnic is one of the campuses where the number of
students increases every year. For this reason, a research system was
created to help predict the number of students accepted each year. In
collecting data, it is based on student data received in the last 7 years
starting in the 2011 school year until the school year 2017. The data used
are data from 9 D3 study programs and 8 D4 study programs. The
following table 1 is the data used.
Table 1. Student Data
Level of
Study Study Program 20
11
20
12
20
13
20
14
20
15
20
16
20
17
D3 D-III T. Elektronika 96 92 99
10
5
12
7
13
2
12
8
D-III T. Listrik
12
3
11
9
12
2
12
6
15
4
14
7
15
4
D-III T.
Telekomunikasi 93 94 96
10
4
10
0
12
2
13
0
D-III M. Informatika
14
8
14
5
13
6
18
9
16
9
18
2
18
0
D-III T. Mesin
19
6
21
9
22
6
25
3
25
3
22
5
23
7
D-III T. Sipil 92
12
2
12
7
13
0
18
2
17
4
16
4
D-III T. Kimia
10
1
12
9
13
5
16
1
16
3
15
7
15
5
D-III Akuntansi
17
0
21
7
22
1
25
4
19
7
19
5
19
3
D-III Administrasi
Bisnis
16
1
19
6
20
1
22
8
20
7
21
5
20
9
D3 Total
11
80
13
33
13
63
15
50
15
52
15
49
15
50
D4 D-IV T. Elektronika 46
10
3 87
10
6
10
9
13
1
13
4
D-IV Sistem
Kelistrikan 51 52 75
10
5
10
9
15
5
15
1
D-IV Jaringan
Telekomunikasi
Digital 59 81 78
10
5
13
7
13
1
13
6
D-IV T. Informatika 98
12
7
16
4
20
2
29
4
25
6
25
5
D-IV T. Otomotif
Elektronik 52 50 77 74 82 82 89
D-IV Manajemen
Rekayasa Konstruksi
10
2
12
0
11
7
13
7
17
5
19
0
20
3
D-IV Akuntansi
Manajemen
11
7
12
6
17
0
21
9
27
4
25
0
24
7
D-IV Manajemen
Pemasaran 86
10
9
14
5
20
1
22
7
21
6
21
0
D4 Total
61
1
76
8
91
3
11
97
14
07
14
11
14
25
Grand
Total
17
91
21
01
22
76
26
10
29
59
29
60
29
75
In doing forecasting using the single exponential smoothing method,
the amount of alpha (α) applied is 0.2, 0.5, and 0.9. In order to predict α
which results in the smallest forecast error. The following is a calculation
example for alpha constants
(α = 0.2).
D-III T. Elektronika
Year 2011 : not yet determined In 2012 : the number of prospective new students in 2011 was
determined for 96 D3 Electronics study programs
Year 2013 :
Ft+1 = a . Xt + (1 − a). St
Ft+1 = 0,2 . 92 + (1 − 0,2). 96
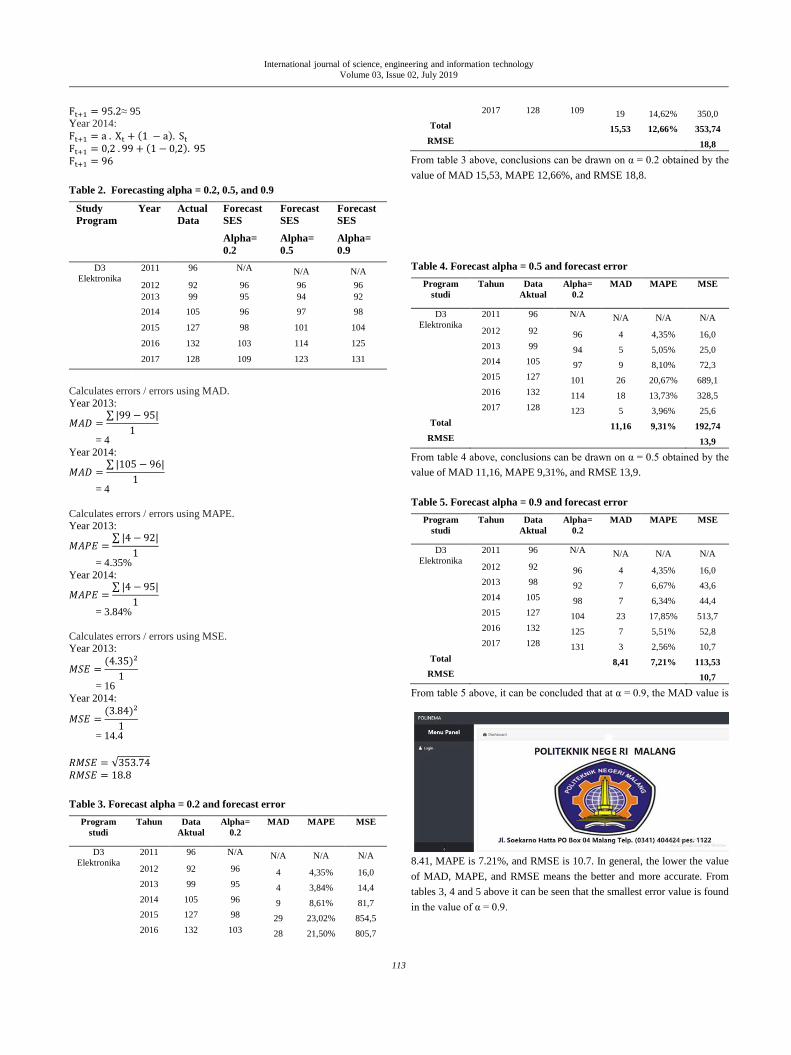
International journal of science, engineering and information technology
Volume 03, Issue 02, July 2019
113
Ft+1 = 95.2≈ 95
Year 2014:
Ft+1 = a . Xt + (1 − a). St
Ft+1 = 0,2 . 99 + (1 − 0,2). 95
Ft+1 = 96
Table 2. Forecasting alpha = 0.2, 0.5, and 0.9
Study
Program
Year Actual
Data
Forecast
SES
Alpha=
0.2
Forecast
SES
Alpha=
0.5
Forecast
SES
Alpha=
0.9
D3
Elektronika
2011 96 N/A N/A N/A
2012 92 96 96 96
2013 99 95 94 92
2014 105 96 97 98
2015 127 98 101 104
2016 132 103 114 125
2017 128 109 123 131
Calculates errors / errors using MAD.
Year 2013:
𝑀𝐴𝐷 =∑ |99 − 95|
1
= 4 Year 2014:
𝑀𝐴𝐷 =∑ |105 − 96|
1
= 4
Calculates errors / errors using MAPE. Year 2013:
𝑀𝐴𝑃𝐸 =∑ |4 − 92|
1
= 4.35%
Year 2014:
𝑀𝐴𝑃𝐸 =∑ |4 − 95|
1
= 3.84%
Calculates errors / errors using MSE. Year 2013:
𝑀𝑆𝐸 =(4.35)2
1
= 16
Year 2014:
𝑀𝑆𝐸 =(3.84)2
1
= 14.4
𝑅𝑀𝑆𝐸 = √353.74
𝑅𝑀𝑆𝐸 = 18.8
Table 3. Forecast alpha = 0.2 and forecast error
Program
studi
Tahun Data
Aktual
Alpha=
0.2
MAD MAPE MSE
D3
Elektronika
2011 96 N/A N/A N/A N/A
2012 92 96 4 4,35% 16,0
2013 99 95 4 3,84% 14,4
2014 105 96 9 8,61% 81,7
2015 127 98 29 23,02% 854,5
2016 132 103 28 21,50% 805,7
2017 128 109 19 14,62% 350,0
Total 15,53 12,66% 353,74
RMSE 18,8
From table 3 above, conclusions can be drawn on α = 0.2 obtained by the
value of MAD 15,53, MAPE 12,66%, and RMSE 18,8.
Table 4. Forecast alpha = 0.5 and forecast error
Program
studi
Tahun Data
Aktual
Alpha=
0.2
MAD MAPE MSE
D3
Elektronika
2011 96 N/A N/A N/A N/A
2012 92 96 4 4,35% 16,0
2013 99 94 5 5,05% 25,0
2014 105 97 9 8,10% 72,3
2015 127 101 26 20,67% 689,1
2016 132 114 18 13,73% 328,5
2017 128 123 5 3,96% 25,6
Total 11,16 9,31% 192,74
RMSE 13,9
From table 4 above, conclusions can be drawn on α = 0.5 obtained by the
value of MAD 11,16, MAPE 9,31%, and RMSE 13,9.
Table 5. Forecast alpha = 0.9 and forecast error
Program
studi
Tahun Data
Aktual
Alpha=
0.2
MAD MAPE MSE
D3
Elektronika
2011 96 N/A N/A N/A N/A
2012 92 96 4 4,35% 16,0
2013 98 92 7 6,67% 43,6
2014 105 98 7 6,34% 44,4
2015 127 104 23 17,85% 513,7
2016 132 125 7 5,51% 52,8
2017 128 131 3 2,56% 10,7
Total 8,41 7,21% 113,53
RMSE 10,7
From table 5 above, it can be concluded that at α = 0.9, the MAD value is
8.41, MAPE is 7.21%, and RMSE is 10.7. In general, the lower the value
of MAD, MAPE, and RMSE means the better and more accurate. From
tables 3, 4 and 5 above it can be seen that the smallest error value is found
in the value of α = 0.9.
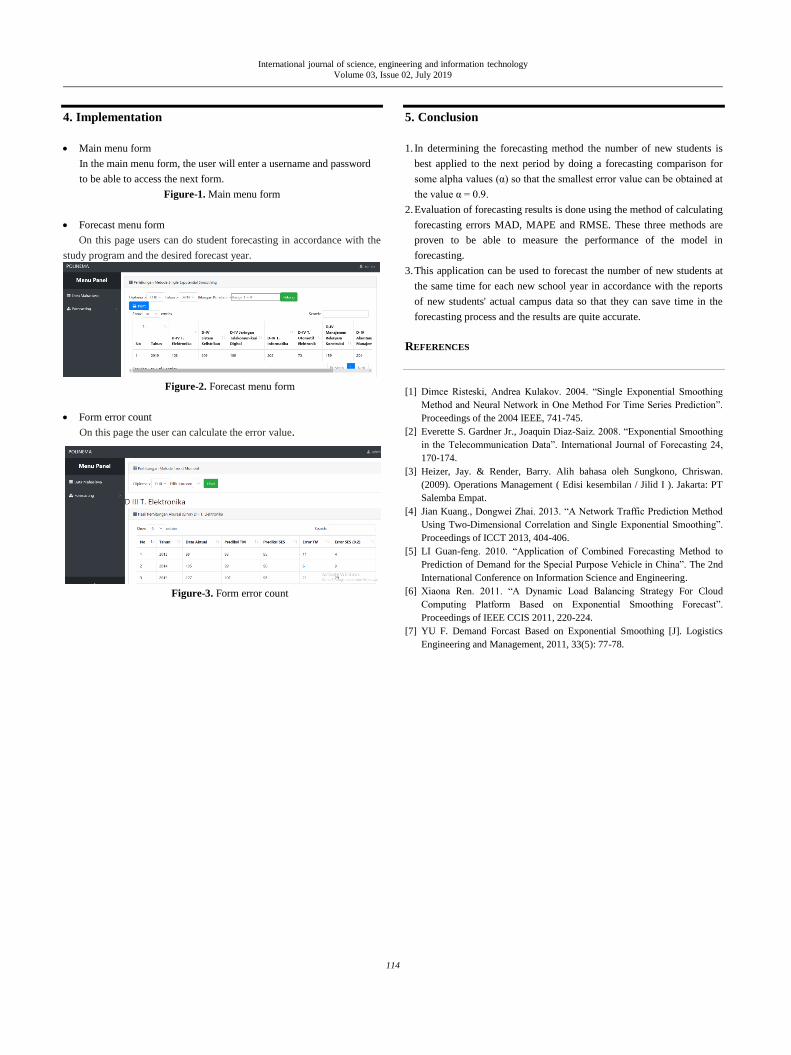
International journal of science, engineering and information technology
Volume 03, Issue 02, July 2019
114
4. Implementation
Main menu form
In the main menu form, the user will enter a username and password
to be able to access the next form.
Figure-1. Main menu form
Forecast menu form
On this page users can do student forecasting in accordance with the
study program and the desired forecast year.
Figure-2. Forecast menu form
Form error count
On this page the user can calculate the error value.
Figure-3. Form error count
5. Conclusion
1. In determining the forecasting method the number of new students is
best applied to the next period by doing a forecasting comparison for
some alpha values (α) so that the smallest error value can be obtained at
the value α = 0.9.
2. Evaluation of forecasting results is done using the method of calculating
forecasting errors MAD, MAPE and RMSE. These three methods are
proven to be able to measure the performance of the model in
forecasting.
3. This application can be used to forecast the number of new students at
the same time for each new school year in accordance with the reports
of new students' actual campus data so that they can save time in the
forecasting process and the results are quite accurate.
REFERENCES
[1] Dimce Risteski, Andrea Kulakov. 2004. “Single Exponential Smoothing
Method and Neural Network in One Method For Time Series Prediction”.
Proceedings of the 2004 IEEE, 741-745.
[2] Everette S. Gardner Jr., Joaquin Diaz-Saiz. 2008. “Exponential Smoothing
in the Telecommunication Data”. International Journal of Forecasting 24,
170-174.
[3] Heizer, Jay. & Render, Barry. Alih bahasa oleh Sungkono, Chriswan.
(2009). Operations Management ( Edisi kesembilan / Jilid I ). Jakarta: PT
Salemba Empat.
[4] Jian Kuang., Dongwei Zhai. 2013. “A Network Traffic Prediction Method
Using Two-Dimensional Correlation and Single Exponential Smoothing”.
Proceedings of ICCT 2013, 404-406.
[5] LI Guan-feng. 2010. “Application of Combined Forecasting Method to
Prediction of Demand for the Special Purpose Vehicle in China”. The 2nd
International Conference on Information Science and Engineering.
[6] Xiaona Ren. 2011. “A Dynamic Load Balancing Strategy For Cloud
Computing Platform Based on Exponential Smoothing Forecast”.
Proceedings of IEEE CCIS 2011, 220-224.
[7] YU F. Demand Forcast Based on Exponential Smoothing [J]. Logistics
Engineering and Management, 2011, 33(5): 77-78.

International Journal Of Science, Engineering, And
Information Technology Volume 03, Number 02, July 2019
Journal homepage: https://journal.trunojoyo.ac.id/ijseit
* Corresponding author.
E-mail address: [email protected].
E-ISSN 2548-4214
The Application of HAAR Wavelet and Backpropagation for Diabetic
Retinopathy Classification Based on Eye Retina Image
Arif Mudi Priyatno
Departement of Informatics Engineering, UIN Sultan Syarif Kasim Riau, Pekanbaru , Riau, Indonesia
A B S T R A C T
Diabetic Retinopathy is a disease that attacks eyes retina and can cause blindness. The severity of Diabetic Retinopathy consists of four; they are;
normal, Diabetic Retinopathy Non-proliferative, Diabetic Retinopathy Proliferative, and Macular edema. In this research, author proposes a new
strategy for Diabetic Retinopathy can be grouped by combining HAAR wavelet method and backpropagation. The number of data used were 612
images. The images size 2304x1536, 2240x1536 and 1440x960. The feature extraction of digital image used was HAAR wavelet at red image, green,
and blue at level 1 and level 4 at subband LL and grouping with backpropagation with learning rate 0,1; 0,01 dan 0,001; the division percentage of
training data and test data were 70:30, 80:20, 90:10 and 95:5, the value of MSE used was 10-6, epoch maximum 100.000 iteration. The results of this
research is the highest test accuracy obtained is 56,25% with image size 2440x1448, HAAR level 4th and the percentage of comparative training data
and test data 95:5, Learning rate 0,1;0,01 and 0,001. Thereby, HAAR wavelet algorithm cannot identify the feature of diabetic retinopathy and the
decomposition process will eliminate much information from diabetic retinopathy.
Keywords: Backpropagation, Diabetic Retinopathy, Eye Retina Image, HAAR Wavelet, RGB
Article History
Received 25 October 18 Received in revised form 12 February 19 Accepted 20 July 19
1. Introduction
The position of Indonesia as a country with diabetes explained by
Prof. Dr. Sidartawan Soegondo in 2005 that Indonesia is at number
four as the country with many cases of diabetes. He conveyed that
fact based on data of WHO (World Health Organization) about
diabetes cases in 2000 which are India with number of cases 31,7
million, China with number of cases 20,8 million, United States of
America with number of cases 17,7 million, and Indonesia with
number of cases 9,4 million people. According to WHO, the number
of diabetics in all over the world is 143 million. This number will
increase doubled in 2030 and 77% will occur in developing country
like Indonesia (Pangaribuan, 2016).
One of the consequences of diabetes mellitus disease complication is
diabetic retinopathy which is the disease that attacks eye retina and can
cause blindness (Sabrina and Buditjahjanto, 2017). Diabetics retinopathy
starts from weak or the distruction of capillary obtained at eyes retina,
then blood leaks and then thickening occurs, bleeding, and large
thickening. That causes vision becomes blur until finally blindness occurs
(Gitasari, Hidayat and Aulia, 2015). The features of diabetic retinopathy
are neovascluration, soft exudates, hard exudates, mikroneurisma and
hemorrhages (Kauppi et al., 2007).
Ophthalmologists conduct grouping towards those eye-to-eye retina
features taken by using fundus camera (Sitompul, 2011). That way is less
effective because it takes a long time in what makes an occurance in
conducting that observation. This causes the ophthalmologists to be slow
and difficult to administer to patients (Putra and Suarjana, 2010).
Therefore, this research, author of a new strategy for Diabetic Retinopathy
can be grouped by combining HAAR wavelet method and
backpropagation. To overcome that problem, image processing is
necessary to conduct the grouping of diabetic retinopathy signs. The signs
are done by conducting extraction features with wavelet HAAR for the
energy difference from the image signs. Next, the energy obtained will be
grouped by using the artificial neural network Backpropagation Neural
Network (BPNN).

International journal of science, engineering and information technology
Volume 03, Issue 02, July 2019
116
The previous research about HAAR wavelet or backpropagation is
identifying the signature by using HAAR wavelet method until 4th level
and conducting grouping with backpropagation artificial neural network
generating optimum results by using two hidden layer and each used 20
and 10 nodes that have accuracy in the amount of 95,56% and 100%
(Kumalasanti, Ernawati and Dwiandiyanta, 2015). Another research about
face identification by using HAAR wavelet and euclidean distance by
using 5 basis of data that own accuracy for each is 63,33%, 82,67%,
92,67% 95,33% and 96% (Puri, 2010). Then comparative research HAAR
wavelet and doubechies and classification of using backpropagation
produces the highest accuracy of HAAR wavelet in the amount of 93,33%
and doubechies wavelet 92,22% (Kumalasanti, Ernawati and
Dwiandiyanta, 2016). Fingerprint identification research with wavelet
transformation and classification by using backpropagation artificial
neural network produces the best accuracy in the amount of 96,36%
(Wijaya and Kanata, 2004). Java letter patterns identification research by
using backpropagation artificial neural network produces accuracy in the
amount of 99,563% (Nurmila, Sugiharto and Sarwoko, 2005). The
research that compares between Backpropagation and learning vector
quantization about diabetes mellitus classification produces higher
accuracy level of backpropagation compared to learning vector
quantization (Nurkhozin, Irawan and Mukhlash, 2011).
The previous research about diabetic retinopathy that had been
conducted is Optic Segmentation towards diabetics of diabetic retinopathy
by using GSF Snake (Ulinuha, Purnama and Hariadi, 2010). In that
research, exudate detection was conducted, spotting blood at the eyes
caused by diabetic retinopathy disease. Beside that, this research is
specialized on disc optic or eye nerve center. Eye nerve center is the
center point of eye retina and the position where all eye nerves meet.
2. Methodology
The stages or the steps in this research can be seen at Figure 1 as
follows:
Figure 1 Research Method
Pre-Processing
Pre-Processing conducted was eliminating
background manually by using photoshop application.
HAAR Wavelet
HAAR wavelet algorithm is as follows (Wijaya
and Kanata, 2004):
Figure 2 HAAR Wavelet Algorithm
The stages of HAAR wavelet algorithm in accordance with Figure 2
are as follows:
1. An image that will be used either in the form of grayscale,
colorful, or binary
2. Transformation process is conducted towards the image
𝑀 =𝑇11 𝑇21 𝑇𝑛1𝑇12 𝑇22 𝑇𝑛2𝑇1𝑛 𝑇2𝑛 𝑇𝑛𝑛
𝑀′ = 𝑇11 𝑇12 𝑇1𝑛𝑇21 𝑇22 𝑇2𝑛𝑇𝑛1 𝑇𝑛2 𝑇𝑛𝑛
(1)
3. The image result of the transformation is conducted filter
lowpass or filter highpass process (Adi et al., 2016)
towards the row.
Filter Highpass = [
1
√2−
1
√20 0
0 01
√2−
1
√2
] (2)
Filter lowpass = [
1
√2
1
√20 0
0 01
√2
1
√2
] (3)
4. The result of row filter lowpass is conducted
transformation process back, then multiplied with column
filter lowpass then it will get subband LL.
5. The result of row filter lowpass is conducted
transformation process back, then multiplied with column
filter highpass then it will get subband LH.
6. The result of row filter highpass is conducted
transformation process back, then multiplied with column
filter lowpass, then it will get subband HL.
7. The result of row filter highpass is conducted
transformation process back, then multiplied with column
filter highpass, then it will obtain subband HH.

International journal of science, engineering and information technology
Volume 03, Issue 02, July 2019
117
8. After obtaining subband the result of HAAR wavelet, then
next counting the value of energy with the equation as
follows (Chang and Jay Kuo, 1993):
𝑒 = 1
𝑀𝑁∑ ∑ |𝑥 (𝑖, 𝑗)|𝑁
𝑗=1𝑀𝑖=1 (4)
e = energy value
i = matrix row
j = matrix column
M = the number of rows
N = the number of columns
X(i,j) = the value of matrix pixel
2.1. Backpropagation Neural Network
Backpropagation process is conducted for diabetic retinopathy
grouping after the data pass normalization process. The following is
backpropagation neural network algorithm (Siang, 2005):
Step 1 initialization. Conducting weight initialization and biased
(conducted setting with random numbers take randomly. And conduct
iteration maximal initialization, learning rate, and error tolerance.
Step 2 doing it during the condition to stop before it is fulfilled. For
stop condition, it can be done with iteration maximum or with error
tolerance given. If the condition has reached maximum iteration then
the process stops or if the error tolerance condition has lacked or has
been the same then the process stops.
Step 3 Input unit (X1, X2…. Xi) obtains input signal then conduct
distribution to all existed hidden layers.
Step 4 Hidden (Z1, Z2, …. Zi) conduct input signal calculation and
with the weight and its biased by using the formula as follows:
𝑍_𝑖𝑛𝑗 = 𝑉0𝑗 + ∑ 𝑥𝑖𝑣𝑖𝑗𝑛
𝑖=1 (1)
Then by using activation function that has been determined, then will
be obtained the output of the existed hidden, the equation used is:
yk = f(z_inj) (2)
Step 5 Output (Y1, Y2, …. Yi) that conducts calculation of hidden
signal together with biased and its weight by using the equation as
follows:
𝑍_𝑖𝑛𝑘 = 𝑉0𝑘 + ∑ 𝑍𝑖𝑊𝑗𝑘𝑝
𝑗=1 (3)
Then by using activation function that has been determined since the
beginning, then obtained output signal.
yk = f(y_ink) (4)
Step 6 Next conducted error calculation between target and output
issued by using Mean Absolute Percentage Error Method. If the
requirement is still not fulfilled yet, then error correction calculation
(δk) is conducted by using the equation as follows:
δk = (tk – yk) f’(y_ink) (5)
Step 7 Hidden (Z1, Z2 …… Zj) conduct the weight calculation that
has been sent by output unit. For the first condition then the equation
used is:
𝛿_𝑖𝑛𝑗 = ∑ 𝛿𝑘𝑤𝑗𝑘𝑛
𝑘=1 (6)
Then multiplication is conducted towards the result of the equation
above with derivative from activation function in order to get error
factor. The equation used is as follows:
δj = δ_inj f’(z_inj) (7)
Step 8 Output (Y1, Y2 … Yk) conduct weight change from each
hidden unit with the equation as follows:
Wjk(new) = Wjk(old) + ΔWjk (8)
Likewise with hidden (Z1, Z2 ….. Zj) conducted weight change with
the equation as follows:
Vij(new) = Vij(old) + ΔVij (9)
Step 9 Conducting examination of stop condition.
3. Result and Discussion
In this research, testing is conducted through the design as follows:
1. The testing conducted is by grouping eye retina image to be four
groups, they are; Normal, Diabetic Retinopathy Non-
Proliferative, Diabetic Retinopathy Proliferative and Macular
Edema.
2. The feature extraction used is HAAR wavelet at level 1 and
level 4.
3. The data extraction with the choice of the number of data 612
and the choice of image size 2304 x 1536, 2204 x 1488, 1440 x
960.
4. Training with learning rate choice 0.1, 0.01, and 0,001. Epoch
maximum 100.000 iteration. Error target 10-6 and choose the
training percentage that wanted to be conducted 70%, 80%, 90%
and 95%.
5. Testing with the choice of percentage number 30%, 20%, 10%
and 5%.
6. The testing of this research is by using white box and accuracy
testing.
The result of testing by using HAAR wavelet level 1 and 4. Learning
rate 0.1, 0.01, and 0.001. Image size 2304 x 1536, 2240 x 1488 and
1440 x 960. The comparative percentage of testing data and training
data are 70:30, 80:20, 90:10 and 95:5 which can be seen at Table 1
and 2 as follows:
Table 1 The Result of Feature Extraction Test HAAR Wavelet Level
4 and Backpropagation
Image
Size
Learning
Rate
Data
30%
Data
20%
Data
10%
Data
5%
2304 x
1536
0,1 46.74% 51.61% 51.67% 40.63%
0,01
0,001
2240 x
1488
0,1 49.46% 50.81% 51.67% 56.25%
0,01
0,001
1440 x
960
0,1 49.46% 50.00% 51.67% 40.63%
0,01

International journal of science, engineering and information technology
Volume 03, Issue 02, July 2019
118
0,001
The result of the higher testing with HAAR wavelet extraction
level 4 and backpropagation reaches 56,25% at the division
percentage of training data and testing data 95:5, learning rate
0.1,0.01 and 0.001. The image size 2240 x 1536.
Table 2 The Result of Feature Extraction HAAR Wavelet Level 1 and
Backpropagation
Image
Size
Learning
Rate
Data
30%
Data
20%
Data
10%
Data
5%
2304 x
1536
0,1 46.20% 45.16% 53.33% 53.13%
0,01
0,001
2240 x
1488
0,1 46.20% 45.16% 55.00% 53.13%
0,01
0,001
1440 x
960
0,1 46.20% 45.16% 55.00% 53.13%
0,01
0,001
The result of the highest testing with extraction of HAAR wavelet
level 1 and backpropagation reaches 55% at learning rate 0.1, 0.01 and
0.001. Data division 90:10. Image size 2240 x 1536 and 140 x 960.
4. Conclusion
The level of testing accuracy with extraction of HAAR wavelet level 1,
the highest reaches 55% at learning rate 0.1, 0.01 and 0.001. Data division
90:10. Image size 2240x1536 and 140 x 960.The level of testing accuracy
with extraction of HAAR wavelet level 4, the highest reaches 56,25% at
the percentage of data training division and testing data 95:5, learning rate
0.1, 0.01, and 0.001. The image size 2240 x 1536. The algorithm result of
HAAR wavelet level 1 after conducted normalization generates the value
with the closest difference between each classes, until it complicates the
grouping process by using backpropagation neural network. Based on the
research results obtained from the research, the results of the extraction
algorithm that can't detect the features of diabetic retinopathy. HAAR
wavelet algorithm cannot conduct retinopathy detection properly and
correctly. This is because image decomposition process will eliminate
many important features of that retinopathy. Future research is expected to
add preprocessing such as only targeting to get the main characteristics of
diabetic retinopathy.
REFERENCES
[1] Adi, K. et al. (2016) ‘Identifying the Developmental Phase of Plasmodium
Falciparum in Malaria- Infected Red Blood Cells Using Adaptive Color
Segmentation And Back Propagation Neural Network’, International
Journal of Applied Engineering Research ISSN, 11(15), pp. 973–4562.
Available at: http://www.ripublication.com (Accessed: 23 October 2017).
[2] Chang, T. and Jay Kuo, C. C. (1993) ‘Texture Analysis and Classification
with Tree-Structured Wavelet Transform’, IEEE Transactions on Image
Processing, 2(4), pp. 429–441. doi: 10.1109/83.242353.
[3] Gitasari, R. A., Hidayat, B. and Aulia, S. (2015) ‘Klasifikasi Penyakit
Diabetes Retinopati Berdasarkan Citra Digital Dengan Menggunakan
Metode Wavelet Dan Support Vector Machine’, Jurnal Teknik Elektro,
2(1), pp. 1–5.
[4] Kauppi, T. et al. (2007) ‘the DiaretDB1 diabetic retinopathy database and
evaluation protocol’, Procedings of the British Machine Vision Conference
2007, 1(3), p. 15.1-15.10. doi: 10.5244/C.21.15.
[5] Kumalasanti, R. A., Ernawati and Dwiandiyanta, B. Y. (2015) ‘Identifikasi
tanda tangan statik menggunakan jaringan syaraf tiruan backpropagation
dan wavelet HAAR’, Universitas Atma Jaya Yogyakarta, 43(0274), pp.
93–100.
[6] Kumalasanti, R. A., Ernawati and Dwiandiyanta, B. Y. (2016)
‘Perbandingan Identifikasi Tanda Tangan Statik Menggunakan Aliran
Wavelet HAAR dan Daubechies’, Seminar Nasional Teknologi Informasi
dan Komunikasi, 2016(Sentika), pp. 18–19.
[7] Nurkhozin, A., Irawan, M. I. and Mukhlash, I. (2011) ‘Klasifikasi Penyakit
Diabetes Mellitus Menggunakan Jaringan Syaraf Tiruan Backpropagation
Dan Learning’, Prosiding Seminar Nasional Penelitian, Pendidikan dan
Penerapan MIPA, 1(7), pp. 1–8.
[8] Nurmila, N., Sugiharto, A. and Sarwoko, E. A. (2005) ‘Algoritma back
propagation neural network untuk pengenalan pola karakter huruf jawa’,
Jurnal Masyarakat Informatika, ISSN 2086-4930, 1(1), pp. 1–10.
[9] Pangaribuan, J. J. (2016) ‘Mendiagnosis Penyakit Diabetes Melitus
Dengan Menggunakan Metode Extreme Learning Machine’, ISD, 2(2), pp.
2528–5114.
[10] Puri, R. W. A. (2010) Pengenalan wajah menggunakan alihragam wavelet
HAAR dan jarak euclidien, Jurnal Teknik Elektro.
[11] Putra, I. K. G. D. and Suarjana, I. G. (2010) ‘Segmentasi citra retina
digital retinopati diabetes untuk membantu pendeteksian mikroaneurisma’,
Jurnal Teknik Elektro, 9(1), pp. 1–9.
[12] Sabrina, E. and Buditjahjanto, I. G. P. A. (2017) ‘Klasifikasi Penyakit
Diabetic Retinopathy menggunakan Metode Learning Vector Quantization
( LVQ )’, Jurnal Teknik Elektro, 06(02), pp. 97–104.
[13] Siang, J. J. (2005) ‘Jaringan Syaraf Tiruan Dan Pemrogramannya Dengan
Matlab’.
[14]Sitompul, R. (2011) ‘Retinopati Diabetik’, J Indon Med Assoc, 61(8)(Dm),
pp. 337–341.
[15] Ulinuha, M. A., Purnama, I. K. E. and Hariadi, M. (2010) Segementasi
Optic Disk pada Penderita Diabetic Retinopathy Menggunakan GVF
Snake, ITS Library. Available at: http://digilib.its.ac.id/segmentasi-optic-
disk-pada-penderita-diabetic-retinopathy-menggunakan-gvf-snake-
8868.html (Accessed: 6 February 2017).
[16] Wijaya, I. G. P. S. and Kanata, B. (2004) ‘Pengenalan Citra Sidik Jari
Berbasis Transformasi Wavelet dan Jaringan Syaraf Tiruan’, Jurnal
Teknik Elektro, 4(1), pp. 46–52. Available at:
http://puslit.petra.ac.id/journals/electrical/ (Accessed: 6 February 2017).
International Journal Of Science, Engineering, And
Information Technology Volume 03, Issue 02, July 2019
Journal homepage: https://journal.trunojoyo.ac.id/ijseit
* Corresponding author.
E-mail address: [email protected].
E-ISSN 2548-4214
Project Development Management of Rungkut Tower Apartments with
Critical Path Method Approach and Pert
Moh Jufriyantoa, Muhammad Zainuddin Fathona
a University of Muhammadiyah Gresik, Gresik, Indonesia
A B S T R A C T
Project management is a science that is concerned with organizing and managing resources by techniques to the results determined the purpose of this
study is to analyze the needs of the time and resources required, determine the critical path of the project, analyzing the timing of completion and cost of
the project acceleration. This study uses a CPM (critical path method) and PERT. CPM is used to plan and supervision the project with the network
system and time required to complete the project. Results of this research project scheduling with CPM can be completed earlier than conventional
scheduling the number of labor costs Rp. 220.370.000. So that project can be completed faster with less cost that the scheduling PT. Tata Bumi Raya.
Keywords: CPM, PERT, Madura, Hotel, Information System.
Article History
Received 02 December 18 Received in revised form 21 January 19 Accepted 20 March 19
1. Introduction
Projects are activities that are take place within a limited time period by
allocating certain resources and intended to produce a product or
deliverable whose quality criteria have been clearly outlined [1]. PT. Tata
Bumi Raya has several obstacles that cause disruption to the project. The
obstacles in the implementation of this project according to the field
coordinator PT. Tata Bumi Raya includes several things, for example
delays in the supply of materials, some workers who do not comply with
the project schedule, and planning schedules that are not appropriate, in this
case the contractor, namely PT. Tata Bumi Raya does not use schedules or
scheduling related to the existence of a critical path, so that activities
overlap between one activity and another.
In a project the affirmation of the relationship between activities is needed
for planning a project. In estimating time and costs, a project also needs to
be optimized, this is usually done to optimize existing resources and
minimize risks, but still obtain optimal results. The purpose of this study is
to analyze the optimal time and resource needs to complete the project, find
out the critical trajectories in the project that need to be considered smooth,
analyze the project completion time and project acceleration costs before
accelerating completion time.
2. literature review
2.1. Project
Projects in network analysis are a series of activities that aim to produce
unique products and are only carried out within a certain period
(temporary). Projects can be defined as a series of activities that only occur
once [2].
2.2. Project Management
Project management is a science and an art relating to leading and
coordinating human and material resources using modern processing
techniques to achieve predetermined targets, namely the scope, quality,
schedule, and costs, as well as the interests of the stakeholders [3].
2.3. CPM (Critical Path Method)
CPM is a network analysis which seeks to optimize the total project cost
through reduction and acceleration of the total project completion time,
Levin and Kirkpatrick (1972). With CPM the amount of time needed to
complete various stages of a project is considered known with certainty, as
well as the resources used with the time needed to complete the project.
Network planning (network work) is a relationship of dependence between
the parts of the work described in a network diagram.

International journal of science, engineering and information technology
Volume 03, Issue 02, July 2019
120
In previsius research explain that in conducting critical path analysis, two
two-pass processes are used, consisting of a forward pass and a backward
pass. ES and EF are determined during the forward pass, LS and LF are
determined during the backward pass[4]. ES (earliest start) is the time
before an activity can be started, assuming all predecessors are finished. EF
(earliest finish) is the time before an activity can be completed. LS (latest
start) is the last time an activity can be started so that it does not delay the
completion time of the entire project. LF (latest finish) is the last time an
activity can be completed so as not to delay the completion time of the
entire project.
Total Float is the difference between the time available to carry out
activities and the time required to carry out these activities (D).
Free float for an activity is the time remaining when an activity is carried
out at the earliest time, as well as the activities that follow it.
2.4. PERT
PERT or Project Evaluation and Review Technique is a Management
Science model for planning and controlling a project (Siswanto, 2007).
Method PERT (Project Evaluation and Review Technique) is a method that
aims to reduce the occurrence of delays, and production disruptions, as well
as coordinate various parts of a work as a whole in order to accelerate the
completion of the project.
3. Methods
CPM method to find out the path critical, then the calculation is done using
the PERT method with Ms. software tools. Project to calculate the cost of
time and resources needed.
4. Result and Discussion
This research was conducted in two stages, viz processing stage using CPM
Method and PERT Method. At the estimated stages of the timeframe used
to complete each of the project activities for the construction of Rungkut
Tower Apartments. Estimated time period must be based on the duration of
work activities and the relationship of each activity. The following is an
estimated table of activity periods. Shown on table 1.
In the table above it is also explained the estimated timeframe used from
each activity from the start of the activity to the end of the activity in the
order of the activities guided by the preconditions of the previous activity.
Cost budget analysis is a calculation of the total amount of costs required
for workers' wages, as well as other costs related to project implementation.
But at this time the calculation only calculates the cost of workers. The
following are the results of the planned cost of workers whose time has been
optimized based on the existing network diagram. Shown on table 2
Table 1 Period of Activity

International journal of science, engineering and information technology
Volume 03, Issue 02, July 2019
121
Table 2 Worker cost plan
The table above is the cost of construction workers in the tower
management building, but this does not include the optimization of loose
time.
The following is a comparison of the research results schedule with the
schedule from PT. Tata Bumi Raya:
In the table above we get the different calculation of labor costs, between
scheduling using CPM in research and scheduling from PT. Tata Bumi
Raya in the Rungkut tower apartment development project, the following
details:
a. PT. Tata Bumi Raya
The total labor cost is Rp. 228,820,000
The project was completed on 16 October 2015
b. Research using CPM
Total labor costs using
CPM method of Rp. 147,070,000
The total cost of workers in the optimization of Rp. 73,300,000
The total labor cost is Rp. 147,070,000 + Rp. 73,300,000 = Rp 20,370,000
The project was completed on 16 October 2015
Table 3. Ordinary Schedule Activity on PT Tata Bumi Raya
Table 3. Schedule Activity on PT Tata Bumi Raya after
implementing CPM
4. Conclusion
1. From the network diagram above of 203 activities
overall in the tower rungkut apartment development project there are 100
activities that enter the critical path and 103 activities that do not enter
the critical path.
2. Optimizing the time included in loose time by adding overtime hours for
4 working hours per day with a maximum of 6 workers per day. From the
results of optimization of loose time using funds of Rp. 109,950,000
3. From the estimated project costs the results obtained are:
a. The total amount of labor costs in scheduling PT. Tata Bumi Raya in
the amount of Rp. 228.82 million, the Project was completed on October
16, 2015
b. The total amount of labor costs by scheduling using CPM is Rp.
147,070,000 + Rp. 73,300,000 = Rp 220,370,000, the Project was
completed on October 16, 2015.

International journal of science, engineering and information technology
Volume 03, Issue 02, July 2019
122
REFERNCES
[1] Soeharto, I. 1999. Manajemen Proyek (Dari Konseptual Sampai Operasional)
Edisi Kedua Jilid 1. Penerbit Erlangga. Jakarta.
[2] Kerzner, H. 1995 Project Management: A system approach to planning,
scheduling, and controlling, 5th Edition, Van Nostrand Reinhold, New York.
[3] Kickpatrick, L. 1972. Optimalisasi Pelaksanaan Proyek Dengan Metode Pert
dan CPM
[4] Maharesi. 2002. Penjadawalan Proyek dengan Menggabungkan metode Pert
dan CPM, Proceedings, Komputer Sistem Intelejen (KOMMIT), Jakarta.
[5] Meredith, R. 2006. Management Teams: Why they succeed or fail,
Butterworth-Heinemann, Oxford.
[6] Siswanto. 2007. Operation Research Jilid II. Jakarta: Penerbit Erlangga.
Jakarta.
[7] Soeharto,.1995. Manajemen Proyek Dari Konseptual Sampai Operasional.
Penerbit Erlangga Jakarta.
[8] Aminurrahman, M. 2014. Manajemen proyek pembangunan gedung
laboratorium UTM dengan pendekatan critical path method. Fakultas
Teknik Universitas Trunojoyo Madura.
[9] Sahid, D.S.S. 2012. Implementasi Critical Path Method dan PERT
Analysis pada Proyek Global Technology for Local Community. Jurnal
teknologi Informasi dan Telematika. Vol. 5: 14-22.
[10] Dannyanti, E. 2010. Optimalisasi Pelaksanaan Proyek Dengan Metode
PERT dan CPM. Fakultas Ekonomi Univiersitas Diponegoro
Semarang.
[11] Santoso, B. 2009. Manajemen Proyek Konsep dan Implementasi.
Penerbit oleh Graha Ilmu Yogyakarta.
[12] Sugiyono. 2011. Metode Penelitian Kuantitatif Kualitatif dan R&D.
Edisi 13, Alfabeta. Bandung.
[13] Handoko, H. 2001. Manajemen Personalia dan Sumber Daya Manusia,
BPFE, Yogyakarta.
[14] Hayun, A. 2005. “Perencanaan dan Pengendalian Proyek dengan
Metode PERT-CPM: Studi Kasus Fly Over Ahmad Yani, Karawang”,
Journal The Winners, Vol. 6, No. 2, pp. 155- 174
[15] Jay, H. dan Barry, R. 2005. Operations Management. Edisi Ketujuh.
Terjemahan Setyoningsih, Dwianoegrahwati dan Alhamdy, Indra.
Jakarta: Salemba Empat.
[16] Suputra, I.G.N.O. 2011. Penjadwalan Proyek dengan Precedence
Diagram Method (PDM) dan Ranked Position Weight Method
RPWM). Jurnal Ilmiah Teknik Sipil. 15(1). 18-28.
[17] Yudha, G. A. Pujiraharjo, A. Saifoe, E.U. 2012. Analisis Multiple
Resource pada Proyek Kontruksi dengan Metode Jumlah Kuadrat
Kecil. Jurnal Rekayasa Sipil. 6(2): 188-198.

International journal of science, engineering, and
information technology Volume 03, Issue 02, July 2019
Journal homepage: https://journal.trunojoyo.ac.id/ijseit
* Corresponding author. Phone : +0-000-000-0000 ; fax: +0-000-000-0000.
E-mail address: [email protected] .
E-ISSN 2548-4214
Storage Layout on Spring Company using Shared Storage and Analysis
Market Basket
Rifky Maulana Yusrona, Emon RIfa’ib
aDepartment of Mechanical Engineering University of Trunojoyo Madura, Bangkalan, Indonesia bDepartment of lndustrial Engineering University of Trunojoyo Madura, Bangkalan, Indonesia
A B S T R A C T
Spring manufacturing company has finished goods warehouse, some storage area using manufacturing near-net-shape product. In observations made
on finished goods warehouse for preparation and arrangement of product is less neat, especially on layout of a storage area in near-net-shape
warehouse, resulting in slow arrangement of products, slow process of servicing the product, slow delivery of product, and a waste of space in finished
goods warehouse. The aim of this study is to provide proposed improvements near-net-shape warehouse layout with a combination of two methods,
namely shared storage and market basket analysis. Function of both make finished goods warehouse layout that takes into account consumer demand
for products most in demand will be placed closest to warehouse door, and products that are often purchased together will be brought closer. Result of
a combination of shared storage methods and market basket analysis can minimize mileage material handling, minimizing setup time, and service, so
process becomes smooth delivery and avoid delays. Results from this study are shaped layout proposals are made based on calculation of shared
storage methods and market basket analysis, so that layout products previously still unregulated to regulated, and service will be faster with placement
of frequently purchased products and products that are frequently purchased simultaneously when placed at front. Products are placed in front of,
among others. The most frequently purchased products BLS with 10.756 products and lowest purchased are K59 with 920 products.
Keywords: Design Layout, Market Basket Analysis, Shared Storage, Spring Manufacture, Warehouse
Article History
Received 12 January 19 Received in revised form 08 February 19 Accepted 16 March 19
1. Introduction
Facility layout and production planning, as two important phases
during flexible production mode, have a significant effect on production
efficiency and cost with the changing of consumer demand [1]. The layout
of the warehouse is one support and an important part of one system
production [2]. effective facility planning can significantly reduce the
operational costs of companies [3]. In this research we observe an
industrial companies that produce springs for vehicles, either in the form
of leaf springs or coil spring produced by the cold or hot process, with a
license from Mitsubishi Steel Manufacturing, Japan. Problems that exist
in the warehouse of goods so among other things, the structuring system
of goods which not neat where the same type of goods not in one storage
area but rather in several storage areas, poor and regular shelf placement,
less efficient storage space with service points so operators service takes a
long time to take the goods that you want to send, the narrow distance of
the rack to the operator line service and structuring so that the operator
service and structuring is difficult in the process taking and structuring,
and often late service due to a product the grouping is not good because of
the part the service must take a few items who want to be sent to a
different place with a less effective distance.
Efforts to reduce requirements storage space on dedicated storage,
several warehouse managers use a variety from dedicated storage where
placement the final product is arranged more carefully, i.e. by using the
Shared storage method which will create a warehouse layout to be
efficient due to the advantages of the method this regulates product
placement carefully and as much as possible use storage space, so it
doesn't happen waste of space [4]. Market Basket Analysis is a function of
the Rule Association Mining which is usually used for study consumer
habits [5]. Advantages Market Basket Analysis method that is can know
the frequency of items that are often purchased and items that are
frequently purchased together, which later often goods purchased and
frequently bought items simultaneously in one time purchase will be
collected and brought near, so the process service can be smooth and
minimize slow service

International journal of science, engineering and information technology
Volume 03, Issue 02, July 2019
124
2. Literature Review
Layout the factory is the procedure for organizing factory facilities to
support smooth operation in the production process. These settings will
take advantage of the area for placement machines or supporting
production facilities others, fluency in material movement, good material
storage temporary or permanent, work personnel and etc [4].
Economically. So that the main goal to be achieved from a factory
layout namely
Manufacturing process facility layout must be designed, so form
including the arrangement of machines, flow planning, so the process
manufacturing can be carried out with efficient way[6].
Minimizing the transfer of goods. The layout must be designed such
as that the transfer of goods lowered to a minimum, if possible
component in the circumstances processed when moved.
Maintain flexibility of arrangement and operation In a factory there
are circumstances where capability changes are needed production,
and this must be planned from the beginning.
Maintaining the turnover of half the goods so tall Efficiency can be
achieved if the ingredients walk through the operation process inside
the shortest time possible.
Reducing investment in layout equipment the right engine and right
department can help decrease the amount of equipment that is needed.
Save on the use of building space Every square meter of floor area
inside a factory costs money. So every square meter must be used as
well as possible.
Increase labor inequality Good layout can be among others reduce the
removal of material done manually, minimizing on foot.
Provides convenience, safety, and comfort for workers inside carry out
work.
Market basket analysis (MBA) is a technique in data mining that
usually used to predict the customers purchasing [7]. Market Basket
Analysis is a function from the usual Rule Mining Association used to
learn habits consumers by looking for item set frequencies which are often
bought and items that are purchased on a regular basis simultaneously [8].
Market Basket Analysis is mathematical techniques that are usually used
marketing survey to look for relationships Individual or group product
terms [9]. This analysis itself is a survey of the events that are it's very
common inside supermarket, namely taking goods in a way
simultaneously by customers when visiting supermarket [10]
Shared storage can be considered as fast moving goods system of a
product, if each pallets are filled inside different warehouse areas from
time to time [11]. Depends on the amount from the product in the
warehouse on time delivery arrives, it will be possible that 5 pallets the
filled will be in the storage space only 1 day. While 5 other pallets inside
the same shipment will be in the warehouse for 20 days. From a
perspective on position storage space in a warehouse, 5 pallets will very
fast-moving; leftover palette seen as slower, maybe moderate transfer.
Shared storage can take advantage of differences that can not be separated
i.e length of time from an individual pallet to live in a warehouse.
The purpose of Market Basket Analysis for identify the product, or
group products that tend to have a correlation. Market Basket Analysis is
a tool powerful to be applied in the strategy cross-selling. The results of
this analysis can be used to organize spatial planning, organizing products
that often sell together, and can also be used to increase promotion
efficiency products..
3. Methods
Data collection conducting by direct observations and measurements
dimensions and location of goods warehouse product demand during 3
months at PT. Indospring, Tbk with using a direct measure and guidance
from the field supervisor. other than that data is also obtained from
company documents such as production data and shipping data. After all
the required data has been collected, then the next step by data processing
by the method already determined. Things like lighting, noise, air
changes, dust, dirt, must become attention of the planner. The right
machine arrangement can also prevent accidents work.
4. Result
For using the Shared storage method as follows. Product used in this
study i.e. there are 45 types of products, first step we determine the
number of average product demand per month. Before calculating the
garage demand per month, the number of products K 7H we ordered for 3
months first, after that it can be counted like equation 1 and the K 7H
demand during observation can see on table 1.
(1)
Table 1. K 7H demands.
Month Demand
November 2018 535
December 2018 42
January 2019 1166
Total 1743
Average 581
Then we calculate the order frequency products can be seen from the
number of each type products ordered every month. After known
frequency of product type every month, then added up and divided by
number month. Here are the calculations
(2)
Base on equation (2) we known the average frequency orders per
month can be determined the number of products per order for each
product by means of the number of requests per month divided by the
average frequency see on equation 3.
(3)

International journal of science, engineering and information technology
Volume 03, Issue 02, July 2019
125
To find the average lead time with calculation as follows
(4)
to determine space needs using the equation
KR = 7 x 1100 = 7700 products.
Determination of the size of the storage area, namely:
1 storage area = shelf length x shelf width
= 117 cm x 94 cm = 10,998 cm²
Because 1 storage area contains 6 shelf level and 4 storey, wide 1
storage area is 10,998 cm² x 6 = 65,998 cm². While for the storage area
equation :
(5)
Determination of room allowance, i.e. to determine the area of the
alley needed is based on the longest dimension diagonal on the forklift
when carrying product
(6)
Layout storage area. Following is a layout created based on data
product demand shown on picture.1
Figure 1. layout storage area based on demands
Calculate distance traveled storage (d) from the warehouse door.
Calculation distance of storage location from the door warehouse i.e
(7)
Then we can find value of confidence (s) For using the basketball
market method analysis. first we must find road delivery data used in the
method Market Basket Analysis which is output from this method the
product will be known what types are often purchased simultaneously.
The number of product types in this travel document the same as the
request data, which is 45 types product.
(8)
Find for the following Confidence value (C).
(9)
Determination of the minimum value support pay attention to the
results of the support value. The hope, the product to be taken is not too
little so that it can cause no visible improvement effect. However also not
too much so it will only difficulty in the process of making layouts while
the impact of the improvements provided small. Whereas in this study
minimum support value of 1.5% is used.
Finding value of improvement ratio (I) by combination of products
that qualify or are valuable above the minimum Confidence value then
look for it the value of improvement ratio by using calculation as follows.
(10)
Table 2 shown Support value, confidence and improvement ratio of
all product in spring factory observed.
Table 2. Support value, confidence and improvement ratio of product
In PT. Indospring
Product Set C Order S l
K 7H K 24H 21.43% 3 0.79% 3.15
KN 7 KN 25 16.67% 3 0.79% 1.30
KN 7 K 42H 21.43% 3 0.79% 1.67
KN7 DN 16.67% 2 0.52% 1.30
K 19H KN 17 16.67% 2 0.52% 1.77
KN 19 KN 17 16.67% 2 0.52% 3.89
K 24 K 40 15,38% 1 0.52% 2.54
K 59 K 40 15,38% 9 0.26% 0.58
K 59 K 59H 17,65% 2 2.36% 1.32
K 59H K 40 15,38% 9 0.52% 1.15
K 59H K 59 17,65% 2 2.36% 1.32
D DN 16.67% 2 0.52% 2.77
DH KS 14.29% 3 0.79% 1.19
E D 17.39% 4 1.05% 0.63
E G 17.50% 7 1.83% 0.63
HN KN17 16.67% 2 0.52% 0.49
HN BLS 23.08% 3 0.79% 0.67
HN D 17.39% 4 0.52% 0.49
HN G 15.00% 6 1.05% 0.67
HN S 18.18% 6 1.83% 0.51
IZ K 40 15.38% 2 0.52% 0.44
IZ K 129 20.00% 3 0.79% 0.53
IZ BLS 16.97% 2 0.52% 0.41
IZ KS 19.05% 4 1.05% 0.54
IZ S 21.21% 7 1.83% 0.57
IZ T 16.97% 28 7.33% 0.46
S KS 19,05% 2 1.05% 2.20

International journal of science, engineering and information technology
Volume 03, Issue 02, July 2019
126
After processing data by method shared storage and market basket
analysis. The next step is making layout by combining the results of 2
methods. Here are the results of the layout of the combination method of
shared storage and basket market analysis. From figure 2 we can see this
layout model is easier to material handling and movement.
Figure 2. layout of combination shared storage and market basket
analysis
5. Conclusion
Based on the results of the analysis and discussion in the previous
chapter, a few are obtained conclusion as follows :
Proposed effective layout can seen in figure 2. Layout made from
processing the shared method storage and market basket analysis,
where products that are often bought, and products that are often
purchased simultaneously put on ahead and brought near.
Products that have been arranged in a layout Figure 4.22 has been
grouped with coding, and based on support values
By using new layout there have increasing productivity for K 7H
3,1%
REFERENCES
[1] W. Wang, Y. Hu, X. Xiao, and Y. Guan, “Joint optimization of
dynamic facility layout and production planning based on Petri
Net,” Procedia CIRP, vol. 81, pp. 1207–1212, 2019, doi:
10.1016/j.procir.2019.03.293.
[2] P. M. Farmakis and A. P. Chassiakos, “Dynamic Multi-
objective Layout Planning of Construction Sites,” Procedia
Eng., vol. 196, no. June, pp. 674–681, 2017, doi:
10.1016/j.proeng.2017.08.057.
[3] G. Kovács and S. Kot, “Facility layout redesign for efficiency
improvement and cost reduction,” J. Appl. Math. Comput.
Mech., vol. 16, no. 1, pp. 63–74, 2017, doi:
10.17512/jamcm.2017.1.06.
[4] G. Schuh, J. P. Prote, M. Luckert, and F. Sauermann,
“Determination of order specific transition times for improving
the adherence to delivery dates by using data mining
algorithms,” Procedia CIRP, vol. 72, pp. 169–173, 2018, doi:
10.1016/j.procir.2018.03.236.
[5] A. N. Sagin and B. Ayvaz, “Determination of Association Rules
with Market Basket Analysis: Application in the Retail Sector,”
Southeast Eur. J. Soft Comput., vol. 7, no. 1, 2018, doi:
10.21533/scjournal.v7i1.149.
[6] F. Kurniawan, B. Umayah, J. Hammad, S. M. S. Nugroho, and
M. Hariadi, “Market Basket Analysis to Identify Customer
Behaviours by Way of Transaction Data,” Knowl. Eng. Data
Sci., vol. 1, no. 1, p. 20, 2017, doi:
10.17977/um018v1i12018p20-25.
[7] S. Halim, T. Octavia, C. Alianto, S. Halim, T. Octavia, and C.
Alianto, “ScienceDirect ScienceDirect Designing Facility
Layout of an Amusement Arcade using Market Designing
Facility Layout of an Amusement Arcade using Market Basket
Analysis Basket Analysis,” Procedia Comput. Sci., vol. 161, pp.
623–629, 2019, doi: 10.1016/j.procs.2019.11.165.
[8] T. Kutuzova and M. Melnik, “Market basket analysis of
heterogeneous data sources for recommendation system
improvement,” Procedia Comput. Sci., vol. 136, pp. 246–254,
2018, doi: 10.1016/j.procs.2018.08.263.
[9] M. Kaur and S. Kang, “Market Basket Analysis: Identify the
Changing Trends of Market Data Using Association Rule
Mining,” Procedia Comput. Sci., vol. 85, no. Cms, pp. 78–85,
2016, doi: 10.1016/j.procs.2016.05.180.
[10] A. Mansur and T. Kuncoro, “Product Inventory Predictions at
Small Medium Enterprise Using Market Basket Analysis
Approach-Neural Networks,” Procedia Econ. Financ., vol. 4,
no. Icsmed, pp. 312–320, 2012, doi: 10.1016/s2212-
5671(12)00346-2.
[11] X. Jin, K. T. Park, and K. H. Kim, “Storage space sharing
among container handling companies,” Transp. Res. Part E
Logist. Transp. Rev., vol. 127, pp. 111–131, Jul. 2019, doi:
10.1016/j.tre.2019.05.001.

International journal Of science, engineering, and
information technology Volume 03, Issue 02, July 2019
Journal homepage: https://journal.trunojoyo.ac.id/ijseit
* Corresponding author.
E-mail address: [email protected]
E-ISSN 2548-4214
Use of Cartesius Method on Google Maps Api to Recommend Search for
Batik Crafts and Andid-Based Crafts (Case Study of Bangkalan
District)
Doni Abdul Fataha, Dewi Arini Yuliartib, Achmad Jauharic, Eza Rahmanitad
a,b,c,d Department of Informatics, Faculty of Engineering, University of Trunojoyo Madura, Indonesia
A B S T R A C T
ASmart City increasingly rife discussed in order to be a solution in solving problems arising from the dynamics of an increasingly advanced and
modern city. The purpose of applying the concept of smart city to increase the sense of security and comfort for its citizens, making the city more
effective and efficient. Madura is an island located north of Java island. The island is dubbed Salt island “Pulau Garam” is quite well known in the
field of bull race and batik handicrafts, especially in Bangkalan regency. Bangkalan regency is a developing city to realize the concept of smart city.
One way that can be done is to take advantage of the market needs of batik lovers by providing easy access to the location. Utilizing google maps
location search technology with Cartesian method on smartphone electronic devices, consumers will be easier in terms of information search and
location of batik craftsmen scattered throughout the district of Bangkalan.
Keywords: Smart City, Batik, Google Maps, Cartesian Method, Android Smartphone.
Article History
Received 03 December 18 Received in revised form 10 January 19 Accepted 25 April 19
1. Introductions
Technological developments in making smart concepts are not only
applied to various devices, but also to various systems, one of which is the
concept of smart city.
This concept presents a smart city structure that can manage resources
owned, both in the form of human resources and natural resources
efficiently and effectively to achieve high livability, comfort, and
sustainable development. With the application of this concept, the quality
of human life that lives in one city will be better. There are many
dimensions in the concept of smart city such as smart government, smart
economy, smart environment, smart living, smart people, and smart
mobility. In addition, almost all strategic sectors such as energy, industry,
environment, tourism, governance, education, and knowledge and
technology can play a role in building a smart city. [1]
Currently in Indonesia there are already 3 cities that can be called smart
cities, namely Jakarta, Bandung and Surabaya. [1]
Madura is an island located in the north of the island of Java which is
widely known as the island of salt land and the art of rapeseering. Madura
is also known for its batik products which have superior artistic essence.
Madura Batik is one of Indonesia's cultural heritages which has begun to
attract many Indonesia due to the variety of written batik motifs that have
their own uniqueness. Unique and free variety of styles while still
maintaining traditional ways of making use of environmentally friendly
natural coloring materials that make Madura batik much in demand of
batik lovers. For Madura batik is not only compared to a piece of cloth,
but also used as a cultural icon that is often used as a lot of research
objects. The motifs and colors contained in Madura batik cloth reflect the
character of the community.
Bangkalan Regency itself has a place for processing and making batik
which is famous among batik lovers, namely the Tanjung Bumi area. The
potential of Tanjung Bumi batik was turned into a tourist attraction by the
Bangkalan Regency government. Based on the statistical data of the
Bangkalan Regency government in the book "Bangkalan in Numbers"
issued by the Office of the Central Statistics Agency of Bangkalan
Regency, since 2012 there have been 7.235 percent of domestic tourists
and 15 percent of foreign tourists. Then in 2013 there were 13.469 percent
of domestic tourists and 25 percent of foreign tourists, while in 2014 there
were 11.562 percent of domestic tourists and 15 percent of foreign
tourists. Based on the statistical data above there is an increase and
decrease in the number of visitors who come to the tourist attractions of
the earth's batik itself. [2]
In addition to Tanjung Bumi Madura batik tourism, there are also many
batik tours in the form of batik handicrafts scattered in the Madura island
region, especially in the Bangkalan Regency area. Of the many batik craft
places in Bangkalan Regency, the writer tries to make a smart city in the
field of smart living and smart mobility in order to advance and introduce

International journal of science, engineering and information technology
Volume 04, Issue 01, December 2019
128
various kinds of batik craft sites in Bangkalan Regency, so we need a
system that displays the distribution map of batik crafts using technology
Google Maps can help technology users find out the location of batik
crafts in Bangkalan district. The use of Google Maps is now a good and
very appropriate solution to make it easier for users to find the location of
the desired location. Google maps itself is a free and online virtual globe
map service provided by Google, but it can make it easier for developers
to use applications that can be used to find a location. Google released an
application called the Google Maps API which is a simple Application
Programing Interface service in the form of a world map that is used to
view an area, where the API itself is a program code interface or an
application or web interface created to be able to access or run or utilize
features that are provided by Google [3].
Technological developments are also accompanied by high mobility
needs. One of the supporters of mobility in human daily life is the
presence of smartphones and the internet. Digital marketing research
institute Emaketer estimates that in 2018 the number of active smartphone
users in Indonesia will be more than 100 million people, making
Indonesia the 4th most active smartphone user country after China, India,
and America [4]. Besides the use of the internet for the people of
Indonesia is also in the stage of better improvement with the support of
the government which says the government will build internet access to
the villages [4]. With the smartphone and the internet, it can make it easier
for people to search for various desired locations. Coupled with the Global
Positioning System feature or GPS for short. GPS itself is used to provide
location information services or position instructions to smartphone users
[5].
In addition to making it easier for users to find batik handicraft locations,
a system that can recommend the closest handicraft location is also
needed, using the Cartesian method.
The Cartesian method is a mathematical equation that is used to find the
distance between two points in a flat plane and can also be used in a
geographical coordinate system to find the distance between two
coordinates [6].
Based on the problem above, the solution that can be done is to create a
smart city-based system that can provide recommendations for good batik
craft locations for batik lovers who will visit Bangkalan Regency by
utilizing the development of smartphone technology, so researchers will
conduct research under the title "Using the Cartesian Method on the
Google Maps API to recommend searching for Android-based Batik
Crafts (Case Study: Bangkalan Regency) ”.
2. Methods
2.1. Batik
According to Dalijo & Mulyadi batik is a technique to decorate cloth
with a process of closing and dipping into a dye which means that the
closed part is not affected so that it will still have the color of the fabric
[7].
2.2. Smart City
Smart City is a concept of developing smart city order that can
manage resources efficiently and effectively to achieve the comfort and
sustainable development of a city. A smart city is also one of the city
development concepts that are currently still developing. The
development of the concept of the smart city brings different definitions
from various parties. Understanding the concept of a smart city is taken by
looking and resuming the right characteristics for a smart city that tends to
be common from several sources [8].
The concept of a smart city has attributes that can be referred to as
dimensions and there are 6 dimensions of the concept of a smart city, as
shown in Figure 1 below [8]:
Figure 1. Six Dimensions of Smart Cities [8].
2.3. Google Maps API
Google Maps API which is a simple Application Programing Interface
service in the form of a world map that is used to view an area, where the
API itself is a program code interface or application or web interface that
is made to be able to access or run or utilize features provided by Google
[3].
2.4. Cartesius Method
The cartesian coordinate system of two-dimensional flat planes, the
distance between two points can be searched through equation [6]:
Where:
D: Linear distance between 2 points
xi: Position of the point i (1, 2, ..., n) on the x-axis
yi: Position of points i (1, 2, ..., n) on the y-axis
because there is a comparability between different angles of latitude and
longitude with different distances, it can be different positions in cartesian
coordinates proportional to differences in position in latitude and
longitude [6].

International journal of science, engineering and information technology
Volume 04, Issue 01, December 2019
129
Where :
DØ: Angular distance between 2 points
λi: Position of points i (1, 2, ..., n) at a latitude in degrees
φi: The position of the point i (1, 2, ..., n) on the longitude in degrees
The purpose of this formula is to find a search point, not to calculate the
distance between them so that what is compared is the value of the
angular distance between the specified coordinates and the coordinate
points created in the database [6].
2.5. Android
Android is a java based system that runs on the Linux Kernel 2.6. Android
was released by Google, under the Open Handset Alliance (OHA) in
November 2007. Along with the launch, Google also created a
Development Tool center and guide to become a developer on the system.
Software Development Kit (SDK) and development community guide
files can be obtained on the official Google Android website [9]
2.6. Web Service
Web Service is a software component that contains a modular, self-
describing application that can be published, allocated, and implemented
on the web. Web service is a technology to change the ability of the
internet by adding web transactional capabilities, namely the ability of the
web to communicate with each other with program-to-program (P2P)
patterns. The focus of the web has been dominated by the program to user
communication with business-to-consumer (B2C) interactions, while the
transactional web will be dominated by program-to-program with
business-to-business interactions [5].
2.7. System Analysis
The system is made using the concept of web service. where the admin is
useful in managing data such as adding location data for new batik crafts,
editing location data, deleting location data and seeing details of data
entered into the server.
Then the server will send location data that has been entered by the admin
to be accessed by the user using an Android smartphone that has been
installed this batik location recommendation application. In addition,
users also get a recommendation for the closest location from their
position in the form of a list of 5 closest locations. Users can also see the
entire mapping of batik craft locations in the Bangkalan district. In
addition, users can also see details of the place of batik craft such as name,
address, phone, and the advantages of these craft places. Users will also
be directed to the google maps application if they want to find the closest
route that will allow the user to get to the location of the craft.
Figure 2. Application Design
Explanation of Figure 2 application design using the web service system
above, that is, the admin manages the data and enters it into the database
server. While the user sees the recommendation data and detailed info
data from the database server that was previously entered by the admin.
2.8. Admin System Flowchart
The following below is an overview of the system admin flowchart.
Figure 3. Admin system flowchart
In picture 3 above is the system admin work process. The following
description from Figure 3.2:
1. Begin by entering your username and password to log in.
2. When you can log in there will be a check whether the username and
password are correct.
3. If the username and password are correct, they will be directed to the
admin dashboard page.
4. In the admin dashboard page, the admin can manage data such as
adding new location data, editing location data, deleting location data,
and viewing details of location data that has been entered into the
server.
5. The process is complete.
2.9. User Flowchart
The picture below is a flowchart of the user's system. Where in the user
system there are 2 main features namely Recommended Location Crafts
and Handicraft Location Data

International journal of science, engineering and information technology
Volume 04, Issue 01, December 2019
130
Figure 4. User system flowchart
In Figure 4 above is the work process of the user system. The following
description from Figure 3.3:
1. The user will be directed directly to the craft location recommendation
menu or craft location data.
2. If the user selects the craft location data, the system will display the
position of the user and map the location of the existing batik craft.
3. After the craft location mapping appears, the user can see the details of
the chosen batik craft location, then the user will also be directed to the
google maps application when clicking on the route icon.
4. If the user chooses a craft location recommendation, the system will
direct it to 5 list of the closest craft locations around the user.
5. In the location recommendation menu, this applies the Cartesian method
to determine the distance.
6. After the craft location list appears, the user can see the details of the
selected batik craft location, then the user will also be directed to the
google maps application when clicking on the route icon.
7. The process is complete
3. Result and Discussion
3.1. Admin
Admin Dashboard Page
Figure 5. Admin Dashboard Page
Figure 5 is the admin dashboard page. This page contains data on the
location of batik crafts in Bangkalan district. There are also several
buttons that can be used to add new craft location data. Besides that in
each table field, there are several action buttons that can be used to edit
craft location data, view details of craft location data, and delete location
data.
3.2. Display Location Craft Data
Figure 6. Display Location Craft Data
Figure 6 Display of Craft Location Data Figure 6 is a display of craft
location data. In the form of a map of the distribution of all craft locations
in Bangkalan district. In this feature the user will know his position is on
the map, and also can see several craft locations scattered in the
Bangkalan district.
3.3. Analysis Of Results
Based on the results of the system analysis made using the Cartesian
Method on the Google Maps API to recommend searching for android-
based batik handicraft locations in the Bangkalan Regency case study,

International journal of science, engineering and information technology
Volume 04, Issue 01, December 2019
131
there are differences in the distance results obtained from calculations
using the Cartesian Method with the Google Maps application.
The distance calculation using the Cartesian Method which calculates
through the angular distance using the cosine law equation is closer than
the distance calculation in the Google Maps application which calculates
using the distance of the route. The above statement is supported by the
picture below.
Figure 7. Distance Difference
Based on Figure 7 above the distance found in the location of Madura
Batik Charms shows a distance of 9,397 Km from the user's position
located on Jl. Raya Telang. While on the route application from google
maps the distance listed is as far as 11 km. However, there is a drawback
in this application because the resulting distance does not refer to the route
to be passed because it only refers to the angular distance generated in the
Cartesian method calculation.
4. Conclusion
The following conclusions can be drawn from the research made under
the title Use of the Cartesian Method on the Google Maps API to
Recommend Searching for Android-Based Batik Crafts Case Studies in
Bangkalan Regency is a Research This uses the Cartesian method as a
reference calculation to determine the distance of the nearest batik craft
location using the cosine law equation of spherical coordinates. Based on
the analysis of the results there are differences in the results of the
distance of the location of batik crafts after doing the calculations as
evidenced by the application screenshot that is running. By using the
Cartesian method the distance can be less than the calculation of the
distance of the route on Google Maps.
Suggestions that can be given from research for future system
development are:
1. Many methods that can be used for comparison recommend the
closest location point of the user.
2. The application is added by creating its own route, so it does not refer
to the Google Maps application.
3. This application does not refer to the actual distance contained in the
distance of the road to be traveled. That is because in the calculation
of the distance used by using angular distance. So that some batik
craft locations have visible distances close by using the Cartesian
method, but when searching for locations using the actual distance
away.
REFERENCES
[1] N. Widodo, “Perkembangan e-Government di Pemerintahan Daerah Dalam
Rangka Mewujudkan Smart City (Studi di Pemerintahan Daerah Kota
Malang),” J. Ilm. Adm. Publik, vol. 2, no. 4, pp. 221–229, 2016.
[2] B. P. Statistik, KABUPATEN BANGKALAN DALAM ANGKA 2016.
2016.
[3] M. Palabiran, D. Cahyadi, and Z. Arifin, “Sistem Informasi Geografis
Kuliiner, Seni dan Budaya Kota Balikpapan Berbasis Android,” J. Inform.
Mulawarman, vol. 10, no. 1, pp. 54–57, 2015.
[4] I. Rahmayani, “Indonesia Raksasa Teknologi Digital Asia,” diakses: 27-12-
2017, 06.35 AM. [Online]. Available:
https://www.kominfo.go.id/content/detail/6095/indonesia-raksasa-
teknologi-digital-asia/0/sorotan_media.
[5] D. Nur and A. Iwan, “Racang Bangun Aplikasi Location Based Service
untuk Pencarian Rute Terdekat Bengkel Resmi Honda pada Wilayah
Surabaya Berbasis Android,” J. Manaj. Inform., vol. 5, pp. 74–82, 2016.
[6] B. H. Sirenden and E. D. Laekha, Buat Sendiri Aplikasi Petamu
Menggunakan CodeIgniter dan Google Maps API. ANDI Yogyakarta,
2012.
[7] K. Sastrodiwirjo, Pamekasan Membatik with English Version Edisi Kedua.
PT. JEPE PRESS Media Utama, 2012.
[8] Mujiyono, M. P. Angkasa, and S. D. Rismawati, “Kesiapan Kota
Pekalongan Menuju Smart City,” J. Litbang Kota Pekalongan, vol. 11, pp.
107–116, 2016.
[9] M. M. Iqbal, R. R. Isnanto, and R. Kridalukmana, “Perancangan Aplikasi
Mobile Location Based Service ( LBS ) Untuk Lokasi Penyewaan Rumah
Kos di Kota Semarang Berbasis Android,” J. Teknol. dan Sist. Komput.,
vol. 3, no. 2, pp. 198–206, 2015.