
Stock-picking in defensive sectors will be key to ... - Davy
86
January 4, 2012 Research Report: Outlook for the year ahead Davy on 2012 Stock-picking in defensive sectors will be key to outperforming market in uncertain environment www.davy.ie Bloomberg: DAVY<GO> Research: +353 1 6148997 Institutional Equity Sales: +353 1 6792816 Davy Research Davy Research [email protected] / +353 1 6148997 Uncertain economic outlook for Europe in 2012 • The euro area sovereign debt crisis has led to a collapse in consumer and business confidence. • It is now likely that the euro area will experience a double-dip recession in 2012. • The combination of weak domestic demand and slowing exports will likely slow 2012 UK and Irish GDP growth forecasts to below those experienced in 2011. Equity markets will find it difficult to make progress • Consensus is forecasting mid-single-digit percent top-line growth and double-digit profit growth. We believe that this will be difficult to achieve in this economic environment • 2012 therefore could be another year of earnings downgrades. • In this environment, careful stock picking in defensive sectors is likely to be the key to outperforming the market. Top picks characterised by growth and balance sheets • Our top picks by sector, outlined in Table 2, are characterised by companies that can grow the top line in any environment combined with strong balance sheets and cash flow. • Our short recommendations are based on those companies with stretched balance sheets where the risk to earnings is firmly to the downside. • In absolute terms we like Kerry, Glanbia and Südzucker but we believe that Holcim, ArcelorMittal and Air France KLM will struggle in 2012. Please refer to important disclosures at the end of this report. J&E Davy, trading as Davy is regulated by the Central Bank of Ireland. Davy is a member of the Irish Stock Exchange, the London Stock Exchange and Euronext. For branches in the UK, Davy is authorised by the Central Bank of Ireland and subject to limited regulation by the Financial Services Authority. Details about the extent of our regulation by the Financial Services Authority are available from us on request. All prices are as of close of December 30th. All authors are Research Analysts unless otherwise stated. For the attention of US clients of Davy Securities, this third-party research report has been produced by our affiliate, J & E Davy. Highlighted content Equity markets – stock picking will remain a critical skill in terms of generating positive absolute and relative returns Economy – combination of weak domestic demand and slowing export growth paints grim picture for Irish economy in 2012 Construction and building materials – our top picks are Wolseley, HeidelbergCement, CRH and Geberit Steel – declining steel production in China is driving down iron ore prices Paper and packaging – a key milestone for Smurfit Kappa Group in 2012 will be refinancing its 2013 and 2014 loan maturities Food and beverage – Kerry Group should navigate the food sector headwinds and maintain growth momentum; C&C and the spirits players are our top beverage picks Pharmaceuticals and healthcare – biotechs provide exposure to organic growth potential and the prospect of ultimate partnering/acquisition by the cash-rich, legacy pharma sector Transport and logistics – low-cost carriers remain our preferred plays; Deutsche Post DHL favoured name among logistics stocks Gaming – our top picks are Paddy Power and William Hill Resources – oil price strength will help Dragon Oil, Tullow Oil and Premier Oil Financials – deleveraging remains the key to 'rightsizing' the sector Media – focus on cash generation continues for Independent News & Media Support services – DCC will continue to acquire niche, higher margin businesses
-
Upload
khangminh22 -
Category
Documents
-
view
2 -
download
0
Transcript of Stock-picking in defensive sectors will be key to ... - Davy

January 4, 2012
Research Report: Outlook for the year ahead
Davy on 2012
Stock-picking in defensive sectors will be key to outperforming market in uncertain environment
www.davy.ie Bloomberg: DAVY<GO> Research: +353 1 6148997 Institutional Equity Sales: +353 1 6792816 Davy Research
Davy Research [email protected] / +353 1 6148997
Uncertain economic outlook for Europe in 2012
• The euro area sovereign debt crisis has led to a collapse in consumer and business confidence.
• It is now likely that the euro area will experience a double-dip recession in 2012.
• The combination of weak domestic demand and slowing exports will likely slow 2012 UK and Irish GDP growth forecasts to below those experienced in 2011. Equity markets will find it difficult to make progress
• Consensus is forecasting mid-single-digit percent top-line growth and double-digit profit growth. We believe that this will be difficult to achieve in this economic environment
• 2012 therefore could be another year of earnings downgrades. • In this environment, careful stock picking in defensive sectors
is likely to be the key to outperforming the market. Top picks characterised by growth and balance sheets
• Our top picks by sector, outlined in Table 2, are characterised by companies that can grow the top line in any environment combined with strong balance sheets and cash flow.
• Our short recommendations are based on those companies with stretched balance sheets where the risk to earnings is firmly to the downside.
• In absolute terms we like Kerry, Glanbia and Südzucker but we believe that Holcim, ArcelorMittal and Air France KLM will struggle in 2012.
Please refer to important disclosures at the end of this report.
J&E Davy, trading as Davy is regulated by the Central Bank of Ireland. Davy is a member of the Irish Stock Exchange, the London Stock Exchange and Euronext. For branches in the UK, Davy is authorised by the Central Bank of Ireland and subject to limited regulation by the Financial Services Authority. Details about the extent of our regulation by the Financial Services Authority are available from us on request. All prices are as of close of December 30th. All authors are Research Analysts unless otherwise stated. For the attention of US clients of Davy Securities, this third-party research report has been produced by our affiliate, J & E Davy.
Highlighted content
Equity markets – stock picking will remain a critical skill in terms of generating positive absolute and relative returns
Economy – combination of weak domestic demand and slowing export growth paints grim picture for Irish economy in 2012
Construction and building materials – our top picks are Wolseley, HeidelbergCement, CRH and Geberit
Steel – declining steel production in China is driving down iron ore prices
Paper and packaging – a key milestone for Smurfit Kappa Group in 2012 will be refinancing its 2013 and 2014 loan maturities
Food and beverage – Kerry Group should navigate the food sector headwinds and maintain growth momentum; C&C and the spirits players are our top beverage picks
Pharmaceuticals and healthcare – biotechs provide exposure to organic growth potential and the prospect of ultimate partnering/acquisition by the cash-rich, legacy pharma sector
Transport and logistics – low-cost carriers remain our preferred plays; Deutsche Post DHL favoured name among logistics stocks
Gaming – our top picks are Paddy Power and William Hill
Resources – oil price strength will help Dragon Oil, Tullow Oil and Premier Oil
Financials – deleveraging remains the key to 'rightsizing' the sector
Media – focus on cash generation continues for Independent News & Media
Support services – DCC will continue to acquire niche, higher margin businesses

Research Report: Davy on 2012 January 4, 2012
2 Davy Research
Contents
Stock ratings 4
Outlook for equity markets 6 Top picks for 2012 6
Euro area slowdown poses clear downside risks to economic outlook for 2012 10 Outlook for the Irish economy 12 UK struggling with the fiscal adjustment 15
Market summary 16
Irish market summary 16 European market summary 18
Construction and building materials 20 Sector performance in 2011 20 Key themes for 2012 21 How key stocks are positioned for 2012 23
Steel 28 Sector performance in 2011 28 Key themes for 2012 28 How key stocks are positioned for 2012 29
Paper and packaging 32 Sector performance in 2011 32 Key themes for 2012 32
Food and beverage 34 Food sector performance in 2011 34 Key themes for 2012 34 How key stocks are positioned for 2012 35 Beverage sector performance in 2011 38 Key themes for 2012 39 How key stocks are positioned for 2012 42
Pharmaceuticals and healthcare 46 Sector performance in 2011 46 Key themes for 2012 46 How key stocks are positioned for 2012 47
Transport and logistics 51 Sector performance in 2011 51 Key themes for 2012 51 How key stocks are positioned for 2012 52
Gaming 56 Sector performance in 2011 56 Review of 2011's key events 56 Key themes for 2012 60 How key stocks are positioned for 2012 61

Research Report: Davy on 2012 January 4, 2012
3 Davy Research
Resources 63 Sector performance in 2011 63 Key themes for 2012 63 How key stocks are positioned for 2012 64
Financials 67 Sector performance in 2011 67 Key themes for 2012 68 How key stocks are positioned for 2012 69
Media 76 Sector performance in 2011 76 Key themes for 2012 76 How key stocks are positioned for 2012 77
Support services 79 Sector performance in 2011 and outlook for 2012 79 DCC – Performance in 2011 79 DCC – Key themes for 2012 79 CPL – Performance in 2011 80 CPL – Key themes for 2012 80
Important disclosures 84
Contacts 86

Research Report: Davy on 2012 January 4, 2012
4 Davy Research
Stock ratings
Table 1: Stock ratings
Sector Current rating Date of issue Previous rating Date of issue
Financials
Allied Irish Banks Under review 04/01/2011 Neutral 07/09/2010
Bank of Ireland Outperform 04/11/2011 Under review 04/01/2011
FBD Holdings Outperform 08/03/2010 Neutral 30/06/2009
IFG Group Neutral 16/09/2011 Restricted 04/05/2011
Irish Life & Permanent Neutral 04/01/2011 Outperform 30/06/2009
Airlines and other transport
Aer Lingus Outperform 23/04/2010 Neutral 30/06/2009
Air France KLM Neutral 09/09/2011 Underperform 13/01/2011
Amadeus IT Holding Outperform 08/11/2011
Deutsche Post DHL Outperform 26/01/2011
easyJet Outperform 22/07/2011 Neutral 19/04/2011
IAG Neutral 09/09/2011 Outperform 05/08/2011
Irish Continental Group Outperform 30/06/2009
Lufthansa Neutral 09/09/2011 Outperform 21/03/2011
PostNL Neutral 16/06/2011
Ryanair Holdings Outperform 07/12/2009 Neutral 02/11/2009
TNT Express Neutral 07/10/2011 Outperform 16/06/2011
Betfair Neutral 11/11/2011 Outperform 14/09/2011
bwin.party Under review 18/04/2011 Underperform 02/11/2010
Ladbrokes Outperform 14/08/2009 Underperform 30/06/2009
Paddy Power Outperform 30/06/2009
William Hill Outperform 16/02/2011 Neutral 03/09/2010
Construction and build mats
Buzzi Unicem Neutral 12/09/2011 Outperform 23/03/2011
CRH Outperform 12/09/2011 Neutral 13/06/2011
Geberit Outperform 12/09/2011 Underperform 14/01/2011
Grafton Group Underperform 12/09/2011 Neutral 03/03/2011
HeidelbergCement Outperform 04/09/2009 Underperform 30/06/2009
Holcim Neutral 22/08/2011 Outperform 19/03/2010
Italcementi Underperform 05/02/2010 Neutral 04/09/2009
Kingspan Group Outperform 12/05/2011 Neutral 30/06/2009
Lafarge Underperform 19/03/2010 Outperform 04/09/2009
Readymix Outperform 29/03/2011 Restricted 13/10/2010
Saint-Gobain Neutral 12/09/2011 Outperform 23/04/2010
SIG Neutral 12/07/2010 Outperform 30/06/2009
Siteserv Neutral 30/06/2009
Travis Perkins Neutral 03/08/2011 Underperform 16/05/2011
Wienerberger Neutral 12/09/2011 Outperform 22/02/2011
Wolseley Outperform 12/09/2011 Neutral 14/05/2010
Housebuilders
Abbey Outperform 30/06/2009
Barratt Developments Underperform 08/04/2011 Outperform 30/06/2009
Bellway Neutral 08/04/2011 Outperform 30/06/2009
Berkeley Outperform 08/04/2011 Neutral 30/06/2009
Bovis Homes Underperform 08/04/2011 Outperform 30/06/2009
Persimmon Outperform 30/06/2009
Redrow Underperform 08/04/2011 Neutral 10/09/2010
Taylor Wimpey Neutral 08/04/2011 Outperform 30/06/2009

Research Report: Davy on 2012 January 4, 2012
5 Davy Research
Ratings table continued
Steel
ArcelorMittal Underperform 10/11/2011
ThyssenKrupp Underperform 10/11/2011
Salzgitter Underperform 10/11/2011
Voestalpine Outperform 10/11/2011
Beverage
Britvic Neutral 25/02/2011 Outperform 27/09/2010
C&C Outperform 30/06/2009
Carlsberg Neutral 06/01/2010 Outperform 30/06/2009
Diageo Outperform 11/01/2010
Heineken Underperform 08/06/2010 Neutral 14/08/2009
Pernod Ricard Outperform 22/03/2011 Neutral 27/04/2010
Food
ARYZTA Outperform 14/06/2010 Neutral 30/06/2009
Associated British Foods Outperform 05/07/2011 Neutral 03/11/2010
Continental Farmers Group Outperform 05/08/2011
CSM Neutral 29/04/2011 Outperform 01/09/2010
Donegal Creameries Outperform 17/09/2010 Underperform 30/06/2009
Fyffes Outperform 27/01/2011 Neutral 18/02/2010
Glanbia Outperform 11/05/2010 Restricted 10/03/2010
Greencore Group Neutral 05/12/2011 Restricted 25/10/2011
Kerry Group Outperform 30/06/2009
Origin Enterprises Outperform 30/06/2009
Südzucker Outperform 12/02/2010
Tate & Lyle Neutral 04/04/2011 Underperform 13/08/2010
Total Produce Outperform 14/05/2010 Neutral 30/06/2009
Pharmaceuticals and healthcare
AGI Therapeutics Neutral 14/04/2010 Under Review 30/06/2009
Elan Corp Outperform 30/06/2009
ICON Neutral 27/10/2011 Outperform 05/08/2011
Merrion Pharmaceuticals Restricted 20/10/2011 Outperform 13/05/2011
Trinity Biotech Outperform 06/05/2011 Neutral 30/06/2009
United Drug Outperform 30/06/2009
Resources
Aminex Outperform 30/06/2009
Cairn Energy Underperform 25/11/2011 Outperform 25/05/2011
Dragon Oil Outperform 21/04/2011 Neutral 14/12/2009
Kenmare Outperform 06/04/2010 Restricted 12/03/2010
Ormonde Outperform 04/05/2011 Neutral 30/06/2009
Petroceltic Outperform 30/06/2009
Petroneft Outperform 18/12/2009 Neutral 30/06/2009
Premier Oil Neutral 25/03/2011 Outperform 14/07/2010
Providence Resources Outperform 09/06/11
Tullow Oil Outperform 30/06/2009
Other industrials/misc
Balmoral Intl. Land Neutral 08/03/2010 Outperform 30/06/2009
CPL Resources Outperform 30/06/2009
Datalex Outperform 13/12/2011 Neutral 30/06/2009
DCC Outperform 30/06/2009
NTR Under Review 12/11/2010 Outperform 16/10/2009
Smurfit Kappa Group Outperform 30/06/2009
TVC Holdings Outperform 30/06/2009
Independent News & Media Outperform 29/03/2010 Under Review 09/03/2010
UTV Media Neutral 30/06/2009
Source: Davy

Research Report: Davy on 2012 January 4, 2012
6 Davy Research
Outlook for equity markets Top picks for 2012
As we enter a New Year, it is difficult to see how companies can achieve top-line growth that will drive improvements in profitability. While we have become more positive on the outlook for the US relative to Europe, growth rates are likely to remain close to zero; in emerging markets, we believe that growth rates will continue to slow. Yet consensus estimates for equity markets in both the US and Europe are assuming mid-single-digit revenue growth and over 10% earnings growth in 2012. This also assumes that operating margins reach cycle-high levels. We believe these forecasts are too optimistic and will likely decline during the year. In this environment, it will be difficult for the overall market to make progress, and stock picking will remain a critical skill in terms of generating positive absolute and relative returns. In a slow/no growth environment, we look for stocks with a number of distinct characteristics:
strong cash flow and balance sheets, which will allow companies to pursue shareholder returns-enhancing activities such as acquisitions, share buybacks or more progressive dividend policies;
potential to generate positive returns over their cost of capital – in an environment of little or no growth for the foreseeable future, companies that are generating negative returns will find it difficult to restore returns and therefore will continue to destroy economic value;
ability to grow despite the macro environment – we are looking for companies providing innovation/technological solutions that will help other businesses or consumers to save money/reduce costs;
exposure to relatively more attractive end-markets – either sectorally or geographically – this may result in positive earnings revisions or at least limit negative revisions;
attractive valuation in absolute, relative and historical terms; decent income in terms of dividend yield. We have screened all of the stocks in our universe across all sectors under these criteria. We have identified the stocks we think will outperform and underperform the relevant sectors. These ideas, provided in Table 2, will help investors to generate positive relative returns in 2012. It is important to note that this analysis is based on our macro assumption of limited recovery in developed markets in 2012 and the likely slowdown in growth in most emerging markets. Of the names emerging from this analysis, on an absolute basis we like Kerry, Glanbia and Südzucker; on the short side, we think that Holcim, ArcelorMittal and Air France will struggle in 2012.
Barry Dixon, Head of Research [email protected]
Stock picking will remain a critical skill in terms of generating positive absolute and relative returns
Key stock characteristics in a slow/no growth environment
Strong cash flow and balance sheet
Potential to generate positive returns over the cost of capital
Ability to grow despite the macro environment
Exposure to relatively more attractive end-markets
Attractive valuation in absolute, relative and historical terms
Decent income in terms of dividend yield

Research Report: Davy on 2012 January 4, 2012 Table 2: Most and least preferred stocks by sector – 2012
Sector relative outperformers Sector relative underperformers
Industrials Construction and building materials
Wolseley US non-residential construction markets looking more positive. This represents almost 50% of trading profit.
Holcim Slower volume growth in India (20% of Holcim's profits), combined with excess capacity, makes for a difficult pricing and margin environment.
Substantial restructuring programme has resulted in disposal of underperforming/low-return businesses, improving profitability and returns and eliminating debt.
Low capacity utilisation levels will limit potential for cement price increases. This, combined with high input costs, will continue to put pressure on Holcim's margins in 2012 and likely result in further earnings downgrades.
Wolseley now has one of the strongest balance sheets in the sector, which will allow it to pursue returns-enhancing activities including acquisitions, share buybacks and a more progressive dividend policy.
The relatively high rating is based on its perceived low debt levels. With net debt/EBITDA of close to 3.0 times in 2012, it is not the safe haven it is perceived to be.
Lafarge With net debt of almost €12bn at end-2011 and net debt/ EBITDA of 3.6 times, Lafarge has one of the most indebted balance sheets in the sector.
Free cash flow of less than €900m will increase the pressure to continue to sell assets/businesses. We think it could struggle with execution of these deals.
Many of Lafarge's end-markets will continue to struggle, particularly in Africa-Middle East. A sluggish top-line, combined with ongoing margin pressure, could result in further downgrades to earnings forecasts.
ArcelorMittal We expect Chinese steel demand to slow from an estimated 11% in 2011 to 5% or below in 2012 as domestic demand weakens across a range of sectors.
Steel producers in Europe and North America continue to operate at c.70% capacity utilisation. Weaker domestic demand, combined with increased pressure from Chinese imports, will continue to put pressure on steel prices.
While raw material costs (mainly iron ore) will likely fall, the decline will not be sufficient to offset the impact of falling steel prices – causing margins to further contract.
With net debt of over $25bn and negative free cash flow in 2011, ArcelorMital can ill-afford any further deterioration in its earnings forecasts. However, we think that this is inevitable.
Resources
Dragon Oil Adjusted for cash set aside for abandonment, Dragon had $1.35bn in net cash at end-September. It is also producing over 62,000 barrels of oil per day with cost at the lower end of the curve. This production profile is set to grow to 100,000 barrels per day by 2015 using capital and reserves within the scope of the existing asset base.
Cairn Energy Cairn Energy’s transition from developer and producer back to a rewarding explorer is taking more time and money than originally envisaged. Instead of finding itself in a sweet-spot, Cairn has fallen between two stools.
EV per barrel is low at 2.7x if gas is included in reserves and it is trading at a material discount to our current NAV per share of 632p (which itself is built out on an $85 per barrel oil price).
Management’s focus for value creation is now on its exploration portfolio, which is narrow and dominated by Greenland. The market is suffering from Greenland fatigue, which may only be surmounted by a discovery.
New management is solid and has put in place the asset base to maximise the output potential of its Turkmen assets. While this growth trajectory produces material top-line growth in itself, we think management attention will increasingly shift to additional growth vectors. To this end, value-enhancing deals are a real possibility – especially in a market favouring cash-rich buyers.
However, drilling activity in 2012 is not guaranteed. This means the market may wait another 12 months for a drilling event to unlock substantial value.
Transport and logistics
easyJet easyJet generates £400m in free cash flow (pre-capex). As capex slows, we believe that this will be returned to shareholders in the form of special dividends similar to the £150m being paid in March 2012.
Air France KLM Air France is the most highly indebted company in the sector with net debt of over €6.5bn at end-2011 and free cash flow in 2011 estimated at just €75m. The decline in underlying profitability in 2012 will likely result in negative free cash flow.
Slower capacity growth has the added benefit of allowing more active management of fares. This will help to offset increasing costs, enhancing margins and returns.
The company is highly exposed to the premium traffic market, which we believe will continue to suffer in terms of both loads and yields in 2012. This could result in further margin and earnings pressure.
Well placed to attract business and consumer traffic down-trading from flag carriers in a difficult environment. Business offering enhanced by the launch of its 'Flexi-fare' product.
Management has few levers to pull apart from a dilutive rights issue in order to repair its balance sheet.

Research Report: Davy on 2012 January 4, 2012 Table 2 continued
Sector relative outperformers Sector relative underperformers
Ryanair Ryanair generates c.€1bn in free cash flow annually pre-capex. In the absence of a new aircraft deal and little or no debt on the balance sheet, a significant portion of this could be returned to shareholders in the form of special dividends similar to the €500m returned in 2011.
IAG IAG as a whole has c.10% premium traffic (c.45% of passenger revenue). This is clearly exposed to any downturn. Premium traffic tends to lag business confidence (PMIs) by three to six months. Of its corporate revenue, banking, professional and other services (e.g. telcos) represents 63%.
Slower growth in capacity will result in greater ability to actively manage yields upwards, which will help to offset cost increases and enhance margins.
Further earnings pressure could come from industrial relations problems in Iberia, while potential acquisitions such as BMI will take time to embed and enhance value.
Ryanair will continue to grow high-margin ancillary revenues, harvesting its 80m passenger base.
While net debt to capital is relatively low (c.31.1%), a high level of capital expenditure to renew the long-haul fleet should see this rise and we expect IAG to be free cash flow negative in 2012 and 2013. While the recovery plan is on track, the pension deficit remains at c.£2.5bn with a review due in March 2012.
Amadeus Amadeus' GDS business will benefit from growth in travel in emerging markets and from its IT Services business.
Lufthansa Representing some 25% of operating income, Lufthansa cargo is exposed to declining air cargo. The night-time flying ban at its hub at Frankfurt Main will also suppress profits.
Its transaction-based model offers exposure to the long-term growth in the global travel industry without the traditional volatility associated with the airline sector. This is reflected in its returns, which are 4x its cost of capital.
With almost 50% of long-haul passengers exposed to the premium end of the business, Lufthansa is exposed to a potential decline in this high yielding traffic.
Amadeus generates €500m in free cash flow annually, which will be used to pay down debt and enhance shareholder value.
The proposed investment of a 29.2% stake by Etihad in Air Berlin highlights the potential for increased competition by the Gulf carriers over time.
Consumer Food & Beverages
Südzucker Positive pricing environment for sugar is likely to continue as demand grows, inventories remain at low levels and the structure of EU market stays favourable for large processors.
Heineken Heineken, the most exposed of the brewers to difficult European markets (c.40% of EBIT), is likely to see little profit growth in 2012.
Supported by the cash flow of its quota sugar business, SZU's outward expansion could gather momentum. The significance of the imminent ED&F Man acquisition is under-appreciated by the market in our view. Ex-sugar additional investments may also be considered in the likes of its CropEnergies (ethanol) and Beneo (ingredients) units.
The company has flagged 2012 as a year of investment (primarily on its Global Business Services project and the funding of a needed step-up in marketing investment); combined with higher input cost pressures, potentially negative operating leverage due to declining volumes in Europe, less incremental benefit from its cost savings programme and increasing competitive threats in key emerging markets, this leads us to keep our cautious stance on Heineken's prospects for 2012.
The strength of the balance sheet (net debt/EBITDA well below 1x) will also allow SZU to fund a large increase in dividend in 2012.
Kerry Leading player in the global food ingredients market that will continue to develop and acquire ingredients technologies to drive top-line growth.
One-Kerry strategy will continue to deliver margin enhancements, helping to offset the impact of higher input costs.
The company generates €250m in free cash flow; with €1bn of debt and over €600m in EBITDA, it is well positioned to fund continued organic and acquisition-led growth.
Glanbia The company has established a leading position in whey-based global nutritionals, a sector where underlying volume growth remains strong. Product line reformulation, international expansion and further acquisitions all remain on the agenda.
There is a prospective growth opportunity for Glanbia in Irish milk processing which will arise from quota removal.
An anticipated step-up in free cash flow will provide more scope to invest for organic and acquisition-led growth.
Gaming
Paddy Power Paddy Power has by far the best earnings track record in the sector. Betfair We have concerns that when the new CEO takes over in August, he may make difficult strategic decisions that impact earnings in the short term.
This, combined with significant scope for earnings upgrades and arguably the best strategic positioning of any European gaming company, makes the stock a lock-away for portfolios.
It continues to face regulatory risk with some countries, including Spain, not allowing exchanges to operate.
Paddy Power has the least regulatory risk of all of the companies in our gaming universe. The stock trades close to our fair value of 825p.
Source: Davy estimates

Research Report: Davy on 2012 January 4, 2012
9 Davy Research
We have also identified a number of small-cap names that we think will provide significant upside in 2012.
Table 3: Small-cap opportunities in 2012
Stock Sector Comment
FBD Financials - Insurance A joint venture with its 25.6% shareholder, Farmer Business Developments, reduces FBD's exposure to property assets – a notable impediment for potential shareholders up to now – and puts the focus firmly back on the core insurance business with its dominant farming market position.
The insurance business is supported by a strong balance sheet (60% cash/bonds), a product of FBD's strategy of de-risking. 2011 looks set to be a very strong year, driven by benign claims; two upgrades (by c.19% in aggregate) since August put operating EPS guidance in a 155-165c range.
FBD has got no credit for its property JV or earnings upgrades, continuing to trade at a modest single-digit P/E. In addition, the prospect of improved returns from the core insurance business (ROE>20%) strengthens the case for a progressive dividend policy, enhancing the share’s attractiveness.
Origin Enterprises Agribusiness Management has done a great job in re-strategising the business over recent years. It is now firmly focused on agronomy and agri inputs, both of which continue to benefit from increasing farm incomes and an inexorable rise in global food demand.
With net debt/EBITDA of circa 1.2 times, it has the financial clout to invest to maintain growth around core activities (non-core activities are a potential source of cash on sale).
The share price is behaving as though activities are more strongly calibrated to commodity food prices than is in fact the case.
The shares are outstanding value.
Ormonde Mining Metals & Mining Ormonde is set to develop an important source of non-Chinese tungsten within the next 18 months. The project is located in western Spain and when fully commissioned will account for 12% of non-Chinese tungsten supply. Ormonde controls 100% of the project.
The project is technically very robust with at least ten years of mine life which can easily be extended. The price of tungsten is stable and has very solid supply demand fundamentals. The metal has strategic status.
The project will be financed over the next six months with numerous options open to management. On a pre-funding basis, the stock is worth more than twice its current value even applying a near-50% discount to current tungsten prices.
Source: Davy estimates

Research Report: Davy on 2012 January 4, 2012
10 Davy Research
Euro area slowdown poses clear downside risks to economic outlook for 2012 European recession now likely The key development since we published our last forecasts for the Ireland and UK economies has been the deteriorating outlook in Europe. The intensification of the sovereign debt crisis has led to a renewed collapse in consumer and business confidence. That deterioration in confidence appears to have led households and companies to postpone spending. Hence, purchasing manager indices (PMIs) for the European manufacturing and services sectors have fallen sharply. The PMIs have now fallen to levels that suggest eurozone GDP will contract in Q4 following a marginal 0.2% rise in Q3. With the latest EU summit agreement failing to address investors' concerns, no rebound in confidence appears likely in the near term. It is now likely that the euro area economy will experience a double-dip recession through Q4 2011 and Q1 2012.
European debt crisis will affect activity through three main channels
Funding costs As yields on sovereign debt have increased, they have passed through into bank funding costs within the euro area. This channel is likely to be less important for Ireland given that the sovereign is already reliant on official EU/IMF funding support. Similarly, Irish banks were already reliant on ESCB support and focused on aggressive deleveraging targets. So renewed tensions in European wholesale funding markets will have little direct impact on Ireland, where both banks and sovereign are already shut out of those markets.
Conall Mac Coille, Chief Economist [email protected]
A recession in the euro area now seems likely following the intensification of the European debt crisis
Figure 1: Eurozone PMIs
30
35
40
45
50
55
60
65
2007 2008 2009 2010 2011
Services Manufacturing
50 = no change
Source: Datastream
There are three key channels through which the debt crisis will affect the Irish economy, with export demand the most important

Research Report: Davy on 2012 January 4, 2012
11 Davy Research
In the case of the UK, gilt yields have remained close to historic lows as expectations for the Bank of England rate have been pushed out and the Monetary Policy Committee voted to expand its quantitative easing programme to £275bn, with expectations of additional asset purchases from February. That said, as in Europe, UK banks have seen pressure on their funding costs. In Q3, respondent to the Bank of England's Credit Conditions survey, lenders indicated that they planned to pass on higher funding costs to households and companies.
Confidence The intensification of the European debt crisis will mean that a restoration of depressed consumer confidence is less likely in the near term. Households are unlikely to reduce precautionary saving given uncertainty about employment and income growth. Similarly, uncertainty about euro area economic prospects has led firms to postpone investment plans. This trend is clearly evident in surveys of investment intentions, which have trended sharply downwards since September. In Ireland, levels of household and investor confidence were already low before the intensification of the debt crisis. Hence, household savings rates have remained about 10%, holding back consumer spending. Similarly, investment spending remains exceptionally weak in Ireland, around 25% of its peak level. While these factors have held back economic growth in Ireland, they could suggest that a sharp downward adjustment in savings behaviour is less likely in 2012. In contrast, there has been relatively little adjustment in the UK economy by households. The household savings ratio was 7.4% in Q2 2011, up from 5.9% the previous quarter. These levels are well below those in the early 1990s recession when the UK household savings rate reached a peak of 12.0%. In part, the lack of upward pressure on the UK household savings rate must reflect the historic low Bank of England rate. But if economic prospects deteriorate, a key risk for the UK is that households will respond in a more similar fashion to their counterparts in Ireland. Indeed, the GfK and Nationwide surveys of consumer confidence point to a renewed deterioration in the final quarter of 2011. Up to the third quarter, the prospects for UK investment appeared relatively promising. Respondents to the Deloitte survey of Chief Financial Officers indicated that on balance they did not plan to continue deleveraging their balance sheets or reduce their exposure to risk. Furthermore, companies felt that the cost of external finance was attractive. However, a clear trend in the UK investment intentions surveys is that uncertainty concerning economic prospects in the euro area has led companies to postpone investment spending.
Export demand Clearly weaker euro area growth will depress demand for both Irish and UK exports. Irish GDP growth in 2011 has been completely dependent on the export sector. That said, Ireland's exports are concentrated in niche sectors, some of which are defensive in nature and may fare relatively well in a recession. Nonetheless, Irish export growth is likely to slow in 2012, depressing a key platform for GDP growth.
Household savings rates have remained about 10%, holding back consumer spending. Similarly, investment spending remains exceptionally weak in Ireland, around 25% of its peak level.
Weaker euro area growth will depress demand for both Irish and UK exports

Research Report: Davy on 2012 January 4, 2012
12 Davy Research
In the UK, it had been hoped that the large depreciation in the sterling exchange rate in 2007 was finally being felt in a reallocation of resources towards the export sector. But UK export growth has clearly disappointed expectations in 2011, failing to compensate for the weakness of domestic demand and the fiscal adjustment that the coalition government has implemented. The weaker outlook for euro area demand will make it harder for the UK economy to rebalance towards the export sector as the coalition continues the planned fiscal consolidation.
But the outlook remains especially uncertain with both upside and downside risks emanating from policy responses to the debt crisis Our central view is that the ECB/EU/IMF will continue to meet the funding needs of European sovereigns and banks so that a calamitous chain of sovereign defaults and bank runs is avoided. But those funding needs are likely to be met on an ad-hoc basis so that they remain a key factor undermining confidence both in markets and the wider economy. That said, a more activist policy response that alleviated market concerns could lead to an improvement in economic prospects. EU agreements may eventually be sufficient to restore the risk-free status of European sovereign debt despite the haircuts applied to Greek sovereign debt in 2011. If so, the ECB could still expand its existing securities markets programme, in a similar fashion to the Bank of England's asset purchase facility, leading to sharp reductions in sovereign bond yields and rebounding confidence. However, such a rosy scenario seems unlikely in the near term as the adequate policy responses remain elusive. Outlook for the Irish economy
Growth slowing in the second half of 2011 Irish GDP expanded at a brisk pace in the first half of 2011 before contracting in the third quarter. Overall, the average level of GDP in 2011 is 1.0% higher than in 2010. So our current forecast for calendar year GDP growth in 2011 to equal 1.1% is broadly on track, ahead of the out-turn for the final quarter of the year. If so, 2011 will be the first year of positive GDP growth for the Irish economy since 2007. However, GDP growth has been sharply split between the buoyant export sector and weak domestic demand. In the year to Q3, consumer spending had fallen by 4.0%. Investment spending had declined by 21.9% in the year to Q3,
although this largely reflected volatile aircraft orders and may rebound in Q4.
Government consumption contracted by 3.7% in the year to Q3. Weak domestic demand pushed down on imports, which fell by 3.2%
in the year to Q3. Exports were up 2.2% on the year, and the annual rate of growth is
likely to pick up in Q4 2011 as the 2.7% quarterly fall in Q4 2010 falls out of the annual comparison.
Our central view is that the ECB/EU/IMF will continue to meet the funding needs of European sovereigns and banks so that a calamitous chain of sovereign defaults and bank runs is avoided
More aggressive policy responses
could see a rebound in growth, but this seems unlikely in the near term
2011 will be the first year of positive GDP growth since 2007
Growth was split between a buoyant export sector and weak domestic demand

Research Report: Davy on 2012 January 4, 2012
13 Davy Research
GDP growth was also split between a strong performance in the first half, with quarterly growth of 1.8% and 1.4% respectively in Q1 and Q2, and a sharp 1.9% contraction in Q3. However, the fall in Q3 may be largely erratic as it was mainly related to volatile shifts in investment spending, specifically aircraft orders. Investment could easily rebound in Q4. Nevertheless, the exceptionally strong growth in the first half will not be repeated in H2.
Combination of weak domestic demand and slowing export growth paints grim picture for Irish GDP growth in 2012 Overall we expect that Irish GDP growth will slow in 2012 below the 1.1% we are currently forecasting for GDP growth in 2011. We plan to review our forecasts for the Irish economy in the near future. Uncertainty and weakening confidence following the intensification of the European debt crisis are likely to delay investment plans by Irish companies. That said, with nominal investment spending now just 22% of its peak level at €3.1bn in Q3 2011 and down from €5bn at the beginning of 2010, there is limited room for further large downward adjustments. Similarly, Irish households are less likely to reduce their high levels of savings given concerns about economic and employment prospects. Savings rates are likely to remain depressed despite the squeeze on real incomes from the fiscal adjustment, which this year will be implemented through higher value added taxes. That said, underlying inflationary pressures are likely to fall back through 2012, helping to alleviate the squeeze on real incomes.
Figure 2: Ireland real GDP (seasonally adjusted)
38
39
40
41
42
43
44
45
46
2008 2009 2010 2011
GDP
Billions, constant prices
Source: Davy; CSO
The rate of expansion is set to slow heading into the final quarter, ahead of a challenging 2012
Irish GDP growth is likely to slow in 2012 below the 1.1% expected for this year
Household savings are likely to remain high as concerns about economic prospects remain and despite the squeeze on real incomes from the fiscal adjustment

Research Report: Davy on 2012 January 4, 2012
14 Davy Research
Figure 3: European and Irish consumer confidence
-40
-35
-30
-25
-20
-15
-10
-5
0
2007 2008 2009 2010 2011
20
40
60
80
100
120
140
European Consumer Confidence Irish Consumer Confidence
IndexIndex
Source: Datastream
However, the most worrying impact of the European debt crisis on the Irish economy will be through reduced export demand. Thus far, Irish trade in goods data up to October do not indicate any marked impact from the euro area slowdown on exports. Also, Figures 4 and 5 illustrate that Irish exports are concentrated in pharmaceuticals, food and beverages, and computer and IT services. So export prospects will in part depend on how these sectors perform in addition to aggregate global demand.
Nonetheless, reduced demand is likely to have a significant impact on Irish exports in 2012. As export growth slows, Irish GDP is likely to fall back from the rates of expansion seen in 2011 as domestic demand remains weak and as private spending growth fails to offset the ongoing fiscal adjustment.
Reduced demand is likely to have a significant impact on Irish exports in 2012
Figure 4: BOP data on services exports
Transport Tourism and Travel Communications
Insurance Financial Services Computer Services
Royalties Business Services Other Services n.e.s.
Source: Datastream
Figure 5: Disaggregated goods data by SITC
Food, Beverages and Tobacco Crude Materials, Semi-Manufactured Goods ,Fuels & Misc
Chemicals and Pharmaceutical Products Machinery and Transport Equipment
Other Finished Manufactured Articles
Source: Datastream

Research Report: Davy on 2012 January 4, 2012
15 Davy Research
UK struggling with the fiscal adjustment
Unlike Ireland, growth in the UK economy had already slowed sharply at the start of 2011. The level of GDP in the UK was broadly flat between Q4 2010 and Q2 2011 before a 0.5% increase in Q3. However, the rebound in Q3 is not expected to be sustained, with PMIs for both the manufacturing and services sectors falling back in Q4. Consumer confidence had fallen back sharply towards the end of 2010 as households realised the new coalition government's fiscal austerity plans were about to hit real incomes. Consumer spending has now contracted for the five consecutive quarters to Q3 2011.
Figure 6: UK GfK and Nationwide measures of consumer confidence
-50
-40
-30
-20
-10
0
10
2005 2006 2007 2008 2009 2010 2011
20
30
40
50
60
70
80
90
100
110
120
GfK Nationwide
BalanceIndex
Source: Datastream
Optimistic expectations for UK growth had focused on the gradual positive impact of the sterling depreciation on exports. But exports contracted in Q2 2011 and Q3 2011, and this poor performance precedes the weakening in euro area demand in Q4. In part, the weak UK export growth has reflected the specialisation of the UK in financial services exports which have been adversely affected by the global crisis. In the Autumn Budget Statement, Chancellor George Osborne was forced to dramatically revise up his projections for the UK deficit and debt over the medium term. UK general government debt is now expected to peak at 94% of nominal GDP, higher than in many of the UK's triple AAA rated peers. Hence, a key danger to the outlook for the UK is that a more severe fiscal adjustment may be required in Budget 2012 for the UK to maintain its top credit rating and hit the targets outlined in the budget statement. In our last UK economic forecast (mid-October), we expected GDP to contract in the fourth quarter, flatten off in Q1 and recover gradually thereafter. This implies calendar year GDP growth of 0.7% in 2011 and 1.0% in 2012. Since that time, however, conditions in the euro area have continued to weaken markedly and the revisions to our next UK projections are therefore likely to be to the downside.
Consumer spending has now contracted for the five consecutive quarters to Q3 2011
Measures of consumer confidence indicate that there may have been some small deterioration in the final quarter of 2011
Since our forecast in mid-October, conditions in the euro area have continued to weaken markedly so the revisions to our next UK projections our likely to be to the downside

16 Davy Research
Research Report: Davy on 2012 January 4, 2012
Irish market summary
S U M M A R Y Price Change % No. (m) Mkt Wght 11 Yr End 2011 Debt/(Cash)/EBITDA EBITDA €m* Company (c) Wk YTD Shrs Cap €m % Pr/Bk 11 12F 11 12F 13F
CRH 1536 2.7 -0.9 719 11043 25.8 Dec2011 E 1.04 2.0 1.6 1617.8 1714.7 1750.6 Ryanair Holdings 363 -3.5 -3.8 1479 5363 12.0 Mar2012 E 1.58 0.2 -0.5 881.8 878.4 955.1 Elan Corp (USc) 1374 6.6 147.4 587 6228 11.9 Dec2011 E 9.37 1.2 0.7 185.5 182.2 256.0Kerry Group 2829 2.3 13.3 176 4968 9.6 Dec2011 E 2.62 1.6 1.1 620.9 665.5 707.9 ARYZTA 3749 2.5 7.1 86 3235 7.5 Jul 2011 P 1.68 2.2 1.9 485.1 500.3 519.6 Paddy Power 4452 2.0 45.0 49 2168 4.4 Dec2011 E 6.99 -0.6 -0.9 139.5 155.7 164.0 DCC 1828 -1.2 -22.5 84 1527 3.6 Mar2012 E 1.51 0.8 0.5 268.6 289.6 298.9 Dragon Oil (USc) 548 -1.8 -12.6 511 2802 3.2 Dec2011 E 1.39 -1.4 -1.6 1100.5 1200.9 1031.4 Bank of Ireland 8 -5.8 -78.0 30133 2471 2.9 Dec2011 E 0.32 490.0 590.0 910.0 Glanbia 463 -0.5 25.7 295 1362 1.4 Dec2011 E 2.66 2.4 1.8 205.5 215.7 219.7 Top Ten Companies 1608.3 1.4 5.7 41167 82.3 1.36
Tullow Oil (USc) 1402 4.9 14.2 904 15198 Dec2011 E 4.11 1.3 1.3 2037.0 2221.0 2042.3 Kenmare (USc) 54 5.4 49.2 2410 1296 3.0 Dec2011 E 3.66 4.5 0.6 62.6 255.2 435.6 C&C 287 -0.2 -15.2 337 968 2.2 Feb 2012 E 1.36 -0.6 -1.1 133.3 139.3 145.0 Kingspan Group 636 -2.2 -15.1 167 1062 1.9 Dec2011 E 1.55 1.5 1.1 130.0 141.5 165.6 ICON (USc) 1711 2.3 -19.4 59 779 1.8 Dec2011 E 1.47 -2.4 -1.6 76.9 106.3 139.4 Smurfit Kappa Group 467 -0.2 -36.0 222 1036 1.6 Dec2011 E 0.53 2.9 2.8 1004.8 919.1 848.7 Grafton Group 239 -3.4 -30.8 231 552 1.2 Dec2011 E 0.57 2.5 2.2 95.9 97.2 110.1 United Drug 205 2.5 -2.4 239 489 1.1 Sep 2011 P 1.30 1.5 1.2 90.5 91.1 93.0 Irish Continental Grp 1517 1.1 -2.2 25 377 0.6 Dec2011 E 2.21 0.2 -0.1 49.0 55.0 58.4 Greencore Group (Stg) 62 -0.1 -38.5 385 242 0.6 Sep 2011 P 0.76 3.7 2.9 68.6 92.9 100.2 Trinity Biotech (USc) 1018 0.1 19.2 21 167 Dec2011 E 1.42 -3.6 -4.3 20.4 21.7 21.0 Aer Lingus 64 -1.4 -41.2 534 339 0.3 Dec2011 E 0.39 -2.0 -2.4 135.1 151.8 164.2 FBD Holdings 650 2.4 4.8 33 216 0.3 Dec2011 E 1.03 Total Produce 37 -2.6 -1.3 330 122 0.3 Dec2011 E 0.69 1.2 0.9 57.1 59.3 61.0 Origin Enterprises 305 1.7 -4.7 133 406 0.2 Jul 2011 E 1.86 1.3 0.9 71.2 70.4 71.0 Fyffes 36 0.6 -2.6 297 107 0.2 Dec2011 E 0.74 0.3 0.1 23.6 22.9 23.1 IFG Group (Stg) 84 0.1 -18.7 126 126 0.2 Dec2011 E 1.05 0.0 -0.5 24.9 25.7 26.0 Petroneft (USc) 18 -2.2 -74.0 412 88 0.2 Dec2011 E 1.06 1.2 0.6 20.9 42.2 68.9 Independent News & Media 21 0.0 -59.2 550 113 0.2 Dec2011 E 1.72 5.1 4.9 85.0 80.7 76.4 Allied Irish Banks 7 15.0 -77.0 513008 35398 0.2 Dec2011 E 3.11 -4.0 50.0 175.0 UTV Media (Stg) 93 -4.0 -30.5 96 106 0.2 Dec2011 E 0.68 2.0 1.4 28.7 30.9 31.4 Abbey 520 0.0 2.0 22 114 0.1 Apr2012 E 0.72 -5.2 -3.9 14.5 17.1 18.2 CPL Resources 255 0.0 0.8 37 95 0.1 Jun 2012 E 1.43 -3.6 -3.8 8.8 9.7 10.6 TVC Holdings plc 76 4.1 16.9 101 77 0.1 Mar2012 E 0.70 -23.8 -737.9 3.1 0.1 0.1 Donegal Creameries 310 -7.4 -22.4 10 31 0.1 Dec2011 E 0.49 2.2 1.7 10.0 11.8 12.0 Continental Farmers Group 28 0.0 N/A 163 46 Dec2011 E 0.65 -0.5 0.3 6.8 8.9 11.1 Datalex (USc) 35 0.1 74.7 72 25 0.0 Dec2011 E 0.99 -2.9 -2.2 4.4 7.5 8.1 Irish Life & Permanent 2 20.0 -97.8 36526 877 0.0 Dec2011 E 0.19 AGI Therapeutics (USc) 6 0.5 111.4 67 4 0.0 Dec2011 E 0.69 N/A N/A -3.3 -3.5 -3.5 Siteserv plc 2 0.0 -60.0 124 2 0.0 Apr2012 E 0.28 7.5 6.7 19.1 20.7 21.3 Readymix 4 0.0 -81.0 110 4 0.0 Dec2011 E 0.07 N/A 1.4 -6.5 6.9 8.3 Merrion Pharmaceuticals 21 13.9 -92.4 17 4 0.0 Dec2011 Total Market (ISEQ) 2901.8 1.3 0.6 86803 100.0 1.29
D A V Y S E C T O R I N D I C E S
Index Change % Mkt Wght Hist Hist
Wk YTD Cap €m % Pr/Bk ROE %
Banks 51.2 -4.8 -75.9 37868 3.1 0.32 N/A Other Financials 54.5 2.0 -57.1 1219 0.6 1.04 24.0 Total Financials 62.6 -3.8 -70.8 39087 3.6 0.34 N/A Mid-Caps 2428.9 0.9 -18.7 45636 17.7 1.02 9.2 Non-Financials 2930.4 1.6 5.1 47716 96.4 1.54 10.9 Construction 1672.2 2.1 -3.7 12778 29.0 1.02 5.3 Food & Beverage 4571.3 1.8 5.7 11443 22.0 1.91 15.8 Resource 250.8 4.1 10.2 19884 Extractive 53.6 4.0 22.2 1611
*Operating profit before provisions in place of EBITDA for Banks

17 Davy Research
Research Report: Davy on 2012 January 4, 2012
S U M M A R Y ( C O N T I N U E D ) Yield (%) Ent Value / EBITDA Dil. Adj. EPS (c) EPS Growth (%) P/E Ratio Company 11 12F 13F 11 12F 13F 11 12F 13F 11 12F 13F 11 12F 13F
CRH 4.1 4.1 4.1 8.3 7.4 6.9 83.9 93.1 96.2 1.2 11.0 3.4 18.3 16.5 16.0 Ryanair Holdings 0.0 0.0 0.0 6.3 5.6 4.2 29.9 30.2 35.5 11.3 1.0 17.3 12.1 12.0 10.2 Elan Corp (USc) 0.0 0.0 0.0 41.2 41.5 28.8 6.0 12.1 27.0 N/A 103.2 122.9 230.3 113.3 50.8 Kerry Group 1.1 1.2 1.3 9.6 8.5 7.6 211.9 228.0 243.9 10.3 7.6 7.0 13.4 12.4 11.6 ARYZTA 0.8 0.9 0.9 9.2 8.8 8.1 310.1 338.4 364.3 27.1 9.1 7.6 12.1 11.1 10.3 Paddy Power 2.2 2.7 2.8 14.9 13.0 12.0 201.9 231.6 243.0 16.5 14.7 4.9 22.0 19.2 18.3 DCC 4.1 4.3 4.5 6.5 5.8 5.2 187.9 207.6 221.0 -7.2 10.5 6.4 9.7 8.8 8.3 Dragon Oil (USc) 2.8 2.8 2.8 1.9 1.4 1.5 134.5 144.2 117.3 80.1 7.2 -18.7 5.3 4.9 6.1 Bank of Ireland 0.0 0.0 0.0 -8.6 -2.2 -0.5 N/A N/A N/A N/A N/A N/AGlanbia 1.6 1.7 1.8 8.7 7.8 7.2 43.3 45.6 46.9 13.7 5.3 2.9 10.7 10.1 9.9 Top Ten Companies 1.8 1.8 1.9 N/A N/A 28.9 N/A 18.7 14.5
Tullow Oil (USc) 0.5 0.9 1.0 11.0 10.2 11.2 94.4 106.6 91.9 N/A 12.9 -13.9 23.1 20.4 23.7 Kenmare (USc) 0.0 0.0 0.0 31.3 7.2 3.3 0.2 8.3 15.4 N/A N/A 85.0 452.3 8.4 4.5 C&C 2.7 3.0 3.0 6.5 5.6 4.7 28.4 31.1 33.2 17.1 9.5 6.9 10.1 9.2 8.6 Kingspan Group 1.9 2.3 2.7 9.7 8.6 7.0 37.0 42.5 55.2 17.4 14.7 29.9 17.2 15.0 11.5 ICON (USc) 0.0 0.0 0.0 10.8 7.9 5.8 54.1 93.3 139.7 -62.3 72.5 49.7 31.6 18.3 12.2 Smurfit Kappa Group 0.0 0.0 0.0 4.0 4.1 4.2 102.8 84.0 72.1 27.9 -18.3 -14.2 4.5 5.6 6.5 Grafton Group 3.1 3.4 3.8 8.3 7.9 6.8 15.0 16.0 21.0 -18.5 6.5 31.1 15.9 14.9 11.4 United Drug 4.2 4.4 4.5 6.7 6.3 5.8 22.8 23.9 24.8 0.0 4.9 3.5 9.0 8.6 8.3 Irish Continental Grp 8.8 6.6 6.6 7.3 6.2 5.5 110.2 136.6 152.1 -8.3 23.9 11.4 13.8 11.1 10.0 Greencore Group (Stg) 10.3 8.1 9.4 6.7 5.1 4.5 10.4 10.6 12.4 -7.4 1.9 16.2 5.0 4.9 4.3 Trinity Biotech (USc) 0.0 0.0 0.0 7.0 5.7 5.5 77.1 82.2 86.9 20.1 6.7 5.7 13.2 12.4 11.7 Aer Lingus 0.0 0.0 0.0 N/A N/A N/A 8.3 10.7 12.7 -45.7 30.2 18.3 7.7 5.9 5.0 FBD Holdings 5.1 5.4 5.7 151.4 149.3 153.7 54.7 -1.4 3.0 4.3 4.4 4.2 Total Produce 4.8 5.0 5.2 3.7 3.3 3.0 7.1 7.5 7.8 4.2 5.4 3.7 5.2 4.9 4.8 Origin Enterprises 3.1 3.3 3.4 5.1 4.7 4.3 40.2 44.4 46.8 7.7 10.6 5.4 7.6 6.9 6.5 Fyffes 5.2 5.8 5.9 2.9 2.8 2.5 5.9 6.0 6.1 7.4 1.4 1.9 6.1 6.0 5.9 IFG Group (Stg) 4.6 4.9 5.2 4.2 3.6 3.0 14.6 14.8 15.1 -3.6 1.6 2.2 5.7 5.6 5.5 Petroneft (USc) 0.0 0.0 0.0 6.7 3.4 1.7 2.1 4.7 9.1 N/A 130.6 91.3 13.5 5.9 3.1 Independent News & Media 0.0 0.0 0.0 3.0 2.7 2.3 9.0 9.4 9.2 -12.2 4.9 -2.1 2.3 2.2 2.2 Allied Irish Banks 0.0 0.0 0.0 -0.2 -0.6 -0.4 N/A N/A N/A N/A N/A N/AUTV Media (Stg) 5.4 8.6 8.6 5.1 4.3 3.7 18.3 20.3 20.9 9.7 10.8 3.0 5.0 4.6 4.4 Abbey 1.6 1.7 1.7 2.5 2.6 1.7 38.4 47.6 50.4 12.4 24.1 6.0 13.6 10.9 10.3 CPL Resources 2.4 2.7 2.7 7.2 5.9 4.9 25.4 27.5 30.2 17.6 8.5 9.6 10.0 9.3 8.5 TVC Holdings plc 0.0 0.0 0.0 N/A N/A N/A 3.9 0.9 0.9 -66.1 -77.4 -1.1 19.5 86.3 87.3 Donegal Creameries 5.2 5.2 5.2 0.5 N/A N/A 58.9 72.8 74.4 87.0 23.5 2.3 5.3 4.3 4.2 Continental Farmers Group 0.0 0.0 0.0 6.5 5.5 4.9 2.2 3.1 4.1 -31.4 38.2 34.4 12.6 9.1 6.8 Datalex (USc) 0.0 0.0 0.0 4.5 2.1 1.4 5.4 9.0 9.8 45.6 66.3 8.6 8.4 5.0 4.6 Irish Life & Permanent 0.0 0.0 0.0 -4.0 -0.7 -0.3 N/A N/A N/A N/A N/A N/AAGI Therapeutics (USc) 0.0 0.0 0.0 0.7 N/A N/A -5.0 -5.3 -5.3 N/A N/A N/A N/A N/A N/ASiteserv plc 0.0 0.0 0.0 7.7 6.8 6.5 2.3 3.6 4.5 330.6 54.6 27.7 0.9 0.6 0.4 Readymix 0.0 0.0 0.0 N/A 1.9 1.0 -11.4 0.1 1.0 N/A N/A N/A N/A 57.7 4.2 Merrion Pharmaceuticals Total Market (ISEQ) 1.9 1.9 2.0 N/A N/A N/A N/A 15.2 12.1
D A V Y S E C T O R I N D I C E S ( C O N T I N U E D ) Yield(%) 5 Year CAGR (%) EPS Growth (%) P/E Ratio 11 12F 13F EPS Dividend 11 12F 13F 11 12F 13F
Banks 0.0 0.0 0.0 N/A N/A N/A N/A N/A N/A N/A N/AOther Financials 4.9 5.2 5.5 27.7 8.9 32.2 -0.5 2.7 4.7 4.8 4.6 Total Financials 0.6 0.6 0.7 N/A N/A N/A N/A N/A N/A N/A N/AMid-Caps 2.2 2.2 2.4 -12.2 -19.3 4.0 23.9 19.8 10.0 8.1 6.7 Non-Financials 1.9 2.0 2.0 -2.0 -0.7 16.0 12.8 8.9 13.7 12.2 11.2 Construction 3.8 3.9 3.9 -17.6 2.7 2.0 13.4 7.4 18.3 16.1 15.0 Food & Beverage 1.6 1.6 1.7 7.8 0.5 14.4 7.7 6.8 11.3 10.5 9.8 Total Market (ISEQ) 1.9 1.9 2.0 -50.7 -40.5 N/A N/A N/A N/A 15.2 12.1

18 Davy Research
Research Report: Davy on 2012 January 4, 2012
European market summary S U M M A R Y
Price Change % (local) Change % (euro) Relative to E300 Mkt Cap Mkt Cap 11 Yr End EBITDA (c) Wk YTD Wk YTD Wk YTD (local m) (€m) 11 12F 13FA I R L I N E S Aer Lingus (AERL ID) 64 -1.4 -41.2 -1.4 -41.2 -2.5 -34.1 339 339 Dec 2011 E 135.1 151.8 164.2 Air France KLM (AF FP) 397 0.4 -70.9 0.4 -70.9 -0.8 -67.4 1193 1193 Dec 2011 E 1302.6 1176.5 1759.0 easyJet (EZJ LN) 393 1.8 -10.7 1.9 -8.3 0.8 2.8 1691 2027 Sep 2011 P 359.0 343.0 365.0 IAG (IAG SM) 174 -3.2 -45.3 -3.2 -45.3 -4.3 -38.7 3228 3228 Dec 2011 E 1478.5 1345.5 1529.5 Lufthansa (LHA GY) 919 0.1 -43.8 0.1 -43.8 -1.1 -37.1 4206 4206 Dec 2011 E 2483.0 2483.0 2797.0 Ryanair Holdings (RYA ID) 363 -3.5 -3.8 -3.5 -3.8 -4.6 7.8 5363 5363 Mar 2012 E 881.8 878.4 955.1
T R A N S P O R T L O G I S T I C S Amadeus IT Holding (AMS SM) 1254 3.2 -20.1 3.2 -20.1 2.0 -10.5 5610 5610 Dec 2011 E 1035.0 1148.0 1247.0 Deutsche Post DHL (DPW GY) 1188 1.9 -6.5 1.9 -6.5 0.8 4.8 14363 14363 Dec 2011 E 3782.6 3790.6 4032.4 PostNL (PNL NA) 246 5.2 -73.2 5.2 -73.2 4.0 -69.9 965 965 Dec 2011 E 533.0 551.0 595.0 TNT Express (TNTE NA) 577 1.5 7.9 1.5 7.9 0.3 5.8 3136 3136 Dec 2011 E 258.8 525.0 649.4
G A M I N G Betfair (BET LN) 753 -6.8 -21.9 -6.6 -19.8 -7.7 -10.2 787 943 Apr 2012 E 74.7 89.8 91.7 bwin.party (BPTY LN) 164 25.9 -20.2 25.9 -20.2 24.4 -10.6 1367 1638 Dec 2011 E 185.2 216.4 216.4 Ladbrokes plc (LAD LN) 130 5.9 6.0 6.0 8.9 4.8 22.0 1180 1415 Dec 2011 E 237.2 254.8 262.6 Paddy Power (PWL ID) 4452 2.0 45.0 2.0 45.0 0.9 62.4 2168 2168 Dec 2011 E 139.5 155.7 164.0 William Hill plc (WMH LN) 203 7.5 18.8 7.6 22.1 6.4 36.8 1423 1706 Dec 2011 E 296.2 301.8 307.4
C O N S T R U C T I O N Buzzi Unicem (BZU IM) 676 2.3 -20.8 2.3 -20.8 1.1 -11.3 1256 1118 Dec 2011 E 409.9 444.4 506.6 CRH (CRH ID) 1536 2.7 -0.9 2.7 -0.9 1.5 11.0 11043 11043 Dec 2011 E 1617.8 1714.7 1750.6 Geberit (GEBN VX) 18100 0.3 -16.3 1.0 -14.0 -0.2 -3.6 7212 5938 Dec 2011 E 550.0 589.0 632.5 Grafton Group (GN5 ID) 239 -3.4 -30.8 -3.4 -30.8 -4.5 -22.5 552 552 Dec 2011 E 95.9 97.2 110.1 HeidelbergCement AG (HEI GY) 3279 1.3 -30.1 1.3 -30.1 0.2 -21.7 6148 6148 Dec 2011 E 2306.0 2473.0 2631.0 Holcim (HOLN VX) 5025 0.4 -28.9 1.0 -26.9 -0.1 -18.1 16436 13532 Dec 2011 E 3856.0 4109.0 4393.0 Italcementi (IT IM) 456 -2.9 -27.9 -2.9 -27.9 -4.0 -19.3 1013 807 Dec 2011 E 751.2 784.7 870.4 Kingspan Group (KSP ID) 636 -2.2 -15.1 -2.2 -15.1 -3.3 -4.9 1062 1062 Dec 2011 E 130.0 141.5 165.6 Lafarge (LG FP) 2716 2.9 -42.1 2.9 -42.1 1.7 -35.2 7802 7802 Dec 2011 E 3299.0 3384.0 3488.0 Saint-Gobain Group (SGO FP) 2967 2.6 -23.0 2.6 -23.0 1.5 -13.7 15887 15887 Dec 2011 E 5006.0 5157.0 5557.0 SIG plc (SHI LN) 84 2.9 -34.7 3.0 -32.9 1.8 -24.9 496 595 Dec 2011 E 127.2 130.3 144.3 Travis Perkins plc (TPK LN) 796 -0.2 -24.8 -0.1 -22.7 -1.2 -13.5 1937 2322 Dec 2011 E 376.7 392.0 418.6 Wienerberger (WIE AV) 697 -0.2 -51.2 -0.2 -51.2 -1.4 -45.4 819 819 Dec 2011 E 256.7 263.5 291.5 Wolseley plc (WOS LN) 2132 2.5 4.2 2.6 7.1 1.4 19.9 6075 7282 Jul 2011 P 761.0 807.0 875.0
S T E E L ArcelorMittal (USc) (MT NA) 1413 0.9 -47.5 1.6 -45.9 0.5 -39.4 22056 22056 Dec 2011 E 9865.0 9560.0 10185.0 Salzgitter (SZG GY) 3863 -0.3 -33.1 -0.3 -33.1 -1.4 -25.1 2322 2322 Dec 2011 E 605.4 602.1 620.8 Thyssenkrupp (TKA GY) 1773 0.1 -42.8 0.1 -42.8 -1.0 -35.9 9119 9119 Sep 2011 P 3385.0 2946.0 3600.0 Voestalpine (VOE AV) 2167 1.0 -39.2 1.0 -39.2 -0.2 -31.9 3663 3663 Mar 2012 E 1662.0 1603.0 1661.0
H O U S E B U I L D I N G Abbey (ABBY ID) 520 0.0 2.0 0.0 2.0 -1.1 14.2 114 114 Apr 2012 E 14.5 17.1 18.2 Barratt Developments plc (BDEV LN) 93 2.0 4.8 2.1 7.7 1.0 20.6 897 1075 Jun 2012 E 206.1 249.4 253.8 Bellway plc (BWY LN) 713 2.5 6.3 2.7 9.3 1.5 22.4 861 1032 Jul 2011 E 76.3 89.3 96.3 Berkeley Group (BKG LN) 1276 -0.2 43.4 -0.1 47.3 -1.2 65.0 1675 2008 Apr 2012 E 131.3 151.3 177.7 Bovis Homes plc (BVS LN) 439 1.3 6.1 1.5 9.0 0.3 22.1 587 704 Dec 2011 E 31.6 47.6 64.7 Persimmon plc (PSN LN) 470 1.9 12.8 2.0 15.9 0.9 29.8 1420 1702 Dec 2011 E 173.7 229.3 234.1 Redrow plc (RDW LN) 113 -0.2 -16.5 -0.1 -14.1 -1.2 -3.8 350 419 Jun 2012 E 39.6 46.7 47.1 Taylor Wimpey plc (TW/ LN) 38 2.0 19.0 2.1 22.3 1.0 37.0 1201 1439 Dec 2011 E 153.2 172.6 190.9
F O O D ARYZTA (YZA ID) 3749 2.5 7.1 2.5 7.1 1.3 20.0 3235 3235 Jul 2011 P 485.1 500.3 519.6 Associated British Foods (ABF LN) 1107 0.3 -6.3 0.4 -3.7 -0.7 7.9 8764 10505 Sep 2011 P 1213.0 1351.0 1384.0 Continental Farmers Group (CFGP ID) 28 0.0 0.0 0.0 0.0 -1.1 -1.9 46 46 Dec 2011 E 6.8 8.9 11.1 CSM NV (CSM NA) 1208 1.2 -53.9 1.2 -53.9 0.1 -48.4 853 853 Dec 2011 E 209.5 226.5 268.3 Donegal Creameries (DCP ID) 310 -7.4 -22.4 -7.4 -22.4 -8.4 -13.1 31 31 Dec 2011 E 10.0 11.8 12.0 Fyffes (FFY ID) 36 0.6 -2.6 0.6 -2.6 -0.5 9.1 107 107 Dec 2011 E 23.6 22.9 23.1 Glanbia (GLB ID) 463 -0.5 25.7 -0.5 25.7 -1.7 40.7 1362 1362 Dec 2011 E 205.5 215.7 219.7 Greencore Group (Stg) (GNC LN) 62 -0.3 -38.7 -0.2 -37.0 -1.3 -29.4 239 242 Sep 2011 P 68.6 92.9 100.2 Kerry Group (KYG ID) 2829 2.3 13.3 2.3 13.3 1.2 26.9 4968 4968 Dec 2011 E 620.9 665.5 707.9 Origin Enterprises (OGN ID) 305 1.7 -4.7 1.7 -4.7 0.5 6.8 406 406 Jul 2011 E 71.2 70.4 71.0 Südzucker (SZU GY) 2465 0.1 23.7 0.1 23.7 -1.1 38.6 4668 4668 Feb 2012 E 1007.1 956.7 928.4 Tate & Lyle (TATE LN) 705 2.1 36.0 2.2 39.8 1.1 56.6 3287 3940 Mar 2012 E 451.0 458.0 472.0
B E V E R A G E Britvic plc (BVIC LN) 322 4.7 -32.0 4.8 -30.2 3.6 -21.8 777 931 Sep 2011 P 185.7 192.5 199.1 C&C (GCC ID) 287 -0.2 -15.2 -0.2 -15.2 -1.3 -5.0 968 968 Feb 2012 E 133.3 139.3 145.0 Carlsberg (CARLB DC) 40500 1.0 -27.5 1.1 -27.4 0.0 -18.7 61785 8316 Dec 2011 E 14167.0 15067.4 15994.6 Diageo (DGE LN) 1407 2.1 18.7 2.2 22.0 1.0 36.6 35162 42149 Jun 2012 E 3522.5 3746.2 4018.2 Heineken (HEIA NA) 3577 1.8 -2.5 1.8 -2.5 0.6 9.2 20604 20604 Dec 2011 E 3565.8 3689.0 3834.0 Pernod Ricard (RI FP) 7166 2.8 1.9 2.8 1.9 1.6 14.1 18982 18982 Jun 2012 E 2226.0 2376.0 2536.4

19 Davy Research
Research Report: Davy on 2012 Janaury 4, 2012
S U M M A R Y ( C O N T I N U E D )
2011 Debt/(Cash)/EBITDA Yield (%) Ent Value / EBITDA EPS Growth (%) P/E Ratio Pr/Bk 11 12F 11 12F 13F 11 12F 13F 11 12F 13F 11 12F 13FA I R L I N E S Aer Lingus (AERL ID) 0.39 -2.0 -2.4 0.0 0.0 0.0 N/A N/A N/A -45.7 30.2 18.3 7.7 5.9 5.0 Air France KLM (AF FP) 0.18 3.6 3.6 0.0 0.0 0.0 2.5 2.9 1.8 N/A N/A N/A N/A N/A N/AeasyJet (EZJ LN) 0.99 -0.2 0.3 11.6 1.9 2.1 4.4 5.3 4.8 75.2 -27.6 10.4 7.6 10.4 9.4 IAG (IAG SM) 0.68 1.1 1.4 0.0 0.0 0.7 1.9 2.4 2.5 265.2 -57.1 50.5 9.7 22.7 15.1 Lufthansa (LHA GY) 0.48 0.5 0.6 5.7 5.7 7.9 1.5 1.6 1.4 -57.3 -14.7 57.4 8.7 10.2 6.5 Ryanair Holdings (RYA ID) 1.58 0.2 -0.5 0.0 0.0 0.0 6.3 5.6 4.2 11.3 1.0 17.3 12.1 12.0 10.2
T R A N S P O R T L O G I S T I C S Amadeus IT Holding (AMS SM) 4.01 1.8 1.3 3.0 3.7 4.1 7.2 6.1 5.3 11.5 14.9 10.8 11.0 9.6 8.7 Deutsche Post DHL (DPW GY) 1.30 -0.4 -0.4 5.8 6.0 6.6 2.9 2.9 2.6 4.8 18.2 11.5 10.2 8.6 7.7 PostNL (PNL NA) 3.36 1.9 2.0 8.5 0.0 0.0 3.7 3.7 3.4 -46.9 4.1 13.9 4.6 4.4 3.9 TNT Express (TNTE NA) 1.47 0.2 0.1 1.1 2.0 3.0 12.4 6.1 4.8 -61.0 82.1 49.2 35.9 19.7 13.2
G A M I N G Betfair (BET LN) 4.54 -1.4 -1.5 1.9 2.1 2.1 9.2 7.3 6.8 -50.8 78.8 14.1 32.5 18.2 15.9 bwin.party (BPTY LN) 2.44 -2.9 -3.1 0.0 0.0 0.0 6.0 4.4 3.7 -3.3 24.8 0.0 13.7 11.0 11.0 Ladbrokes plc (LAD LN) 3.40 1.8 1.5 5.9 6.5 6.9 6.8 6.1 5.6 -16.6 11.2 9.4 9.0 8.1 7.4 Paddy Power (PWL ID) 6.99 -0.6 -0.9 2.2 2.7 2.8 14.9 13.0 12.0 16.5 14.7 4.9 22.0 19.2 18.3 William Hill plc (WMH LN) 1.49 1.3 1.1 3.5 5.2 5.5 6.1 5.8 5.4 -2.2 4.6 4.7 8.9 8.6 8.2
C O N S T R U C T I O N Buzzi Unicem (BZU IM) 0.54 2.8 2.4 0.0 0.7 0.9 5.8 5.2 4.4 -62.0 33.4 47.6 36.0 26.9 18.3 CRH (CRH ID) 1.04 2.0 1.6 4.1 4.1 4.1 8.3 7.4 6.9 1.2 11.0 3.4 18.3 16.5 16.0 Geberit (GEBN VX) 4.67 -0.9 -1.1 3.4 3.7 3.9 12.2 11.2 10.2 -2.1 6.5 8.8 17.7 16.6 15.3 Grafton Group (GN5 ID) 0.57 2.5 2.2 3.1 3.4 3.8 8.3 7.9 6.8 -18.5 6.5 31.1 15.9 14.9 11.4 HeidelbergCement AG (HEI GY) 0.48 3.4 3.0 1.5 3.0 3.0 6.0 5.5 5.0 -0.3 48.5 15.9 12.6 8.5 7.3 Holcim (HOLN VX) 0.90 2.8 2.4 3.0 3.0 3.0 7.4 6.8 6.0 -26.9 30.5 11.2 18.7 14.4 12.9 Italcementi (IT IM) 0.37 2.9 2.7 2.6 2.7 2.9 5.5 5.2 4.6 -5.5 7.2 18.7 29.7 27.8 23.4 Kingspan Group (KSP ID) 1.55 1.5 1.1 1.9 2.3 2.7 9.7 8.6 7.0 17.4 14.7 29.9 17.2 15.0 11.5 Lafarge (LG FP) 0.46 3.6 3.3 3.7 3.7 3.7 6.3 6.0 5.6 -24.1 8.0 12.8 9.8 9.1 8.1 Saint-Gobain Group (SGO FP) 0.84 1.4 1.3 4.2 4.7 5.6 4.6 4.4 4.0 31.1 12.1 15.1 9.0 8.0 7.0 SIG plc (SHI LN) 0.66 1.0 0.8 2.4 3.3 4.5 4.9 4.6 4.0 28.8 8.0 15.0 9.1 8.4 7.3 Travis Perkins plc (TPK LN) 0.89 1.6 1.2 2.5 2.8 3.1 6.6 6.0 5.4 16.5 4.7 9.3 9.1 8.7 8.0 Wienerberger (WIE AV) 0.26 1.9 1.8 1.7 2.0 2.3 6.5 6.4 5.7 N/A 167.4 75.1 56.9 21.3 12.1 Wolseley plc (WOS LN) 1.78 0.7 -0.1 2.1 2.8 3.3 8.6 7.5 6.6 91.4 12.9 13.1 15.0 13.3 11.8
S T E E L ArcelorMittal (USc) (MT NA) 0.42 2.6 2.5 4.1 4.1 4.1 3.8 3.7 3.5 -4.3 7.0 18.5 10.5 9.8 8.3 Salzgitter (SZG GY) 0.53 -1.0 -0.7 1.9 2.1 2.4 2.0 2.4 2.7 350.8 11.4 10.2 15.6 14.0 12.7 Thyssenkrupp (TKA GY) 0.82 1.1 1.2 2.5 1.4 2.3 3.8 4.5 3.6 N/A N/A 59.1 N/A 17.8 11.2 Voestalpine (VOE AV) 0.72 1.7 1.5 3.7 4.6 4.6 3.9 3.7 3.4 -2.6 3.8 8.3 7.3 7.0 6.5
H O U S E B U I L D I N G Abbey (ABBY ID) 0.72 -5.2 -3.9 1.6 1.7 1.7 2.5 2.6 1.7 12.4 24.1 6.0 13.6 10.9 10.3 Barratt Developments plc (BDEV LN) 0.30 2.1 1.8 0.0 0.0 0.0 6.1 5.1 5.4 265.5 49.1 3.9 11.5 7.7 7.4 Bellway plc (BWY LN) 0.81 1.7 1.6 1.5 1.7 1.8 12.9 11.1 10.1 42.7 13.2 8.9 16.9 14.9 13.7 Berkeley Group (BKG LN) 1.74 -2.4 -1.7 1.4 1.5 1.6 10.2 9.2 7.4 17.3 14.0 17.3 17.5 15.3 13.1 Bovis Homes plc (BVS LN) 0.80 0.2 1.1 1.4 1.8 1.8 18.6 13.3 12.1 43.7 59.5 39.7 28.8 18.1 12.9Persimmon plc (PSN LN) 0.78 -0.4 -0.0 1.9 2.2 2.2 7.7 6.2 6.4 47.0 39.2 2.4 13.1 9.4 9.2 Redrow plc (RDW LN) 0.74 2.6 2.1 0.0 0.0 0.0 11.4 9.6 9.0 83.2 23.6 2.5 15.6 12.6 12.3 Taylor Wimpey plc (TW/ LN) 0.66 0.7 1.1 0.0 0.0 0.0 8.5 8.1 7.3 114.7 115.3 40.2 29.1 13.5 9.6
F O O D ARYZTA (YZA ID) 1.68 2.2 1.9 0.8 0.9 0.9 9.2 8.8 8.1 27.1 9.1 7.6 12.1 11.1 10.3 Associated British Foods (ABF LN) 1.52 1.1 0.9 2.2 2.3 2.5 8.4 7.6 7.4 2.5 16.6 3.3 15.0 12.8 12.4 Continental Farmers Group (CFGP ID) 0.65 -0.5 0.3 0.0 0.0 0.0 6.5 5.5 4.9 -31.4 38.2 34.4 12.6 9.1 6.8 CSM NV (CSM NA) 0.74 3.1 2.8 7.6 8.0 8.4 7.2 6.6 5.4 -42.6 14.7 33.2 11.6 10.1 7.6 Donegal Creameries (DCP ID) 0.49 2.2 1.7 5.2 5.2 5.2 0.5 N/A N/A 87.0 23.5 2.3 5.3 4.3 4.2 Fyffes (FFY ID) 0.74 0.3 0.1 5.2 5.8 5.9 2.9 2.8 2.5 7.4 1.4 1.9 6.1 6.0 5.9 Glanbia (GLB ID) 2.66 2.4 1.8 1.6 1.7 1.8 8.7 7.8 7.2 13.7 5.3 2.9 10.7 10.1 9.9 Greencore Group (Stg) (GNC LN) 0.76 3.7 2.9 10.3 8.1 9.4 6.7 5.1 4.5 -7.4 1.9 16.2 5.0 4.9 4.3 Kerry Group (KYG ID) 2.62 1.6 1.1 1.1 1.2 1.3 9.6 8.5 7.6 10.3 7.6 7.0 13.4 12.4 11.6 Origin Enterprises (OGN ID) 1.86 1.3 0.9 3.1 3.3 3.4 5.1 4.7 4.3 7.7 10.6 5.4 7.6 6.9 6.5 Südzucker (SZU GY) 1.38 0.8 0.7 2.8 3.0 3.1 6.7 7.0 7.2 47.8 -3.5 -5.4 12.9 13.4 14.2 Tate & Lyle (TATE LN) 2.94 1.1 0.7 3.5 3.6 3.8 8.4 7.9 7.3 40.1 2.5 5.4 13.0 12.7 12.0
B E V E R A G E Britvic plc (BVIC LN) 35.23 2.4 2.3 5.5 5.8 6.1 6.7 6.3 6.1 -15.2 6.1 6.5 9.8 9.2 8.7 C&C (GCC ID) 1.36 -0.6 -1.1 2.7 3.0 3.0 6.5 5.6 4.7 17.1 9.5 6.9 10.1 9.2 8.6 Carlsberg (CARLB DC) 0.88 2.0 1.5 1.4 1.6 1.8 6.7 6.0 5.3 -1.9 14.2 12.3 11.8 10.3 9.2 Diageo (DGE LN) 5.25 2.0 1.5 3.0 3.2 3.4 11.4 10.4 9.2 8.4 9.5 8.5 15.5 14.2 13.1 Heineken (HEIA NA) 1.98 2.2 1.8 2.2 2.4 2.7 7.3 6.7 6.0 0.5 11.0 10.1 14.1 12.7 11.5 Pernod Ricard (RI FP) 1.88 3.8 3.2 2.1 2.4 2.7 12.4 11.3 10.2 13.0 12.2 10.1 15.4 13.7 12.4

Research Report: Davy on 2012 January 4, 2012
20 Davy Research
Construction and building materials Sector performance in 2011
European construction sector fell 20% in 2011
European construction stocks fell for a second year running. The E300 Construction & Building Materials Index fell 20% in 2011, which followed a 1% decline the previous year. The index has now fallen in four of the last five years and closed 2011 53% off its all-time high.
While the index gained 8% in Q4, its decline of 26% in Q3 proved decisive. The sector actually started 2011 reasonably well, gaining 2.8% in Q1, although this was given back in the second quarter.
Amongst the European construction stocks we cover, there were two discernible themes during 2011. First, the UK housebuilders outperformed. Berkeley was the clear winner last year, rising over 40%. However, all of the other UK housebuilders also gained, with the exception of Redrow (-16%). Second, the worst underperformers were typically those stocks with meaningful exposure to Continental Europe: Rockwool (-34%), SIG (-35%), Lafarge (-41%) and Wienerberger (-50%) all fell sharply.
Earnings in 2011 fell short of expectations
At the beginning of 2011, we identified what we considered would be the main themes for the European building materials sector for the year. These included: limited volume growth potential; rising energy costs; improving residential markets but a weak infrastructure sector; and the expectation that emerging markets would continue to outperform. We also suggested that if volume growth was achieved, there would a disproportionate increase in operating profits due to positive incremental margin effects.
As it turned out, 2011 operationally was another challenging year for the sector. We estimate that the sector's revenues (excluding the UK housebuilders) were up circa 3% last year; this was broadly in line with our start-of-year forecast of 3-4% growth. However, even though 2011 started well (helped by more benign weather compared to Q1 2010), there was a tangible slowdown in many markets towards year-end.
Limited revenue growth (when achieved, it was often more a function of price increases rather than volume expansion) along with the impact of higher input costs constrained the scope for margin improvement. EBITDA in 2011 was more or less unchanged year-on-year (yoy), well behind our expectation at the start of the year of circa 9% growth.
After a reasonable start to the year, evidence that tepid recovery had begun to stall by year-end
Construction markets and sectors generally performed as expected in 2011, although it became clear as the year progressed that what appeared to be the early stages of a recovery had stalled (even though activity levels in many end-markets remain well below pre-2008 levels).
Tim Cahill [email protected] Barry Dixon [email protected] Florence O'Donoghue [email protected] Robert Gardiner [email protected] Killian Murphy [email protected]
There were two discernible themes during 2011: UK housebuilders outperformed, and the worst underperformers were those with meaningful exposure to Continental Europe
Limited revenue growth along with the impact of higher input costs constrained the scope for margin improvement

Research Report: Davy on 2012 January 4, 2012
21 Davy Research
By country and region, Germany – albeit coming off a very depressed level – stood out. Residential activity in France was strong, while many Nordic end-markets did reasonably well. It was a disappointing year for the UK, with new residential and residential RMI at best remaining stable at a depressed level. Eastern European construction markets were patchy, although activity levels were healthy in Poland ahead of this year's UEFA football championships. But, overall, much of the early year momentum had long since evaporated by the end of 2011 as worries about austerity measures and the impact of the European sovereign debt crisis took centre-stage.
In contrast, there were very tentative signs of improvement in some US construction end-markets by the close of the year. Private construction volumes looked to have finally bottomed out in 2011, although concerns about infrastructure spending levels remain.
Focus on debt reduction continued
Corporate activity was, once again, extremely muted. If anything, many European building materials companies continue to be net sellers of businesses as efforts continued to lower debt levels and streamline operating structures. Lafarge, SIG, Wolseley and Italcementi all sold businesses during the year, while those that undertook significant deals in 2010 (Travis Perkins and Kingspan) focused on integration. CRH continued to undertake a number of relatively modest bolt-on transactions. Wienerberger and Saint-Gobain also acquired on a limited scale, with the latter agreeing to pay Wolseley over £310m for Brossette and Build Center.
With further disposals and no acquisitions of significance, most companies in the sector continued to lower net debt. Reflecting this, we estimate the sector closed 2011 with net debt/EBITDA of under 2x. This, however, is a weighted average; within the sector, there are some lingering potential balance sheet risks (noticeably amongst the cement companies).
Key themes for 2012
Another challenging year ahead with limited potential for volume growth
We expect that, operationally, 2012 will be another challenging year for our European construction stocks. With economic headwinds amplifying in many parts of the developed world, volume growth once again will be difficult to achieve. While demand in many end-markets remains substantially below pre-2008 levels, any real evidence of a cyclical recovery has halted – at least for now.
Entering 2012, the European building materials sector has to deal with both a fragile private sector and the effects of government austerity programmes.
For the sector overall, we are forecasting revenue growth of less than 1% in 2012. Margins, aided by a more benign input cost
There were very tentative signs of improvement in some US construction end-markets by the close of the year
Key themes for 2012
Another challenging year ahead with limited potential for volume growth
US construction market currently more attractive than Europe; we prefer Latin America over other emerging markets
Management teams to remain cautious about deployment of balance sheets

Research Report: Davy on 2012 January 4, 2012
22 Davy Research
environment, may improve – but only slightly. Our current sector forecast is for EBITDA growth of under 5% in 2012. Even if this is achieved, it will still leave EBITDA for the sector over 25% below peak levels, with margins remaining much lower than the long-term average.
US construction market currently more attractive than Europe; we prefer Latin America over other emerging markets
As noted, there was increasing evidence towards the end of the year that US construction activity had begun to stabilise and even exhibit some initial signs of modest improvement. Our view for 2012 is that modest growth, albeit off a very depressed base (circa 60% from peak), is plausible for the residential market. We expect non-residential activity to be flat to marginally higher. Even infrastructure investment, where significant declines were a possibility at one point, may only decline relatively marginally in 2012.
In contrast, there is ample reason to be worried about Europe, especially as austerity looms and the real economy effects of the lingering European sovereign debt crisis kick-in. Overall, we think it is possible that European construction volumes could contract a further 2-3% in 2012.
But within Europe, performance between countries and regions will vary significantly. We think the best-performing construction markets will be Germany, Switzerland, Austria, the Nordic region and Poland, with modest growth a realistic possibility. We expect construction activity in France, the UK, the Netherlands and Belgium to contract this year. But even worse affected will be Spain, Italy, Ireland, Portugal, the Czech Republic and much of south-east Europe (for example Romania and Bulgaria).
Emerging markets delivered reasonable top-line growth in 2011, with both volumes and prices rising. However, price increases were not enough to offset inflation and margins fell by over 400 basis points yoy on average. Looking ahead, we remain concerned about inflation, particularly in Asia, and on a relative basis would have a preference for Latin America in 2012.
Management teams to remain cautious about deployment of balance sheets
As noted, many building materials companies were net sellers of businesses during 2011. Further disposals and possible distressed sales by private companies may well create some interesting opportunities for those companies with strong balance sheets. That said, our view is that management teams will generally remain risk averse in relation to leverage.
Those that are likely to sell assets in 2012 include Lafarge, HeidelbergCement and Italcementi. Best positioned and most likely to acquire are CRH and Saint-Gobain, while Wolseley may look externally at opportunities now that its restructuring has been successfully completed. Kingspan also may look to bolster its presence
We think it is possible that European construction volumes could contract a further 2-3% in 2012
The best-performing construction markets in Europe will be Germany, Switzerland, Austria, the Nordic region and Poland, with modest growth a realistic possibility

Research Report: Davy on 2012 January 4, 2012
23 Davy Research
in markets where it has ambitious medium-term expansion plans (for example, North America).
How key stocks are positioned for 2012
Sector looks cheap but re-rating will be a struggle as long as earnings downside risk persists
The E300 Construction & Building Materials Index enters 2012 trading on a forward earnings multiple of under 11x. This compares with its long-term average of almost 13x.
The sector does not look expensive, but we are conscious of the downside risk to earnings. As long as this downside risk persists, we believe the sector will struggle to re-rate.
In this environment, stock picking is ever more important. Our stock picking criteria within the building materials sector for 2012 is weighted towards two criteria: (i) end-market and segment exposure; and (ii) financial health, including the ability to generate free cash.
Using these parameters, our favoured stocks at the present are Wolseley, HeidelbergCement, CRH and Geberit. While 'neutral' for now, we think it is likely we will upgrade our rating on Travis Perkins at some point this year. Our least preferred companies are Lafarge, Holcim, Grafton, Saint-Gobain and Italcementi.
Top picks entering year: Wolseley, HeidelbergCement, CRH and Geberit
Wolseley was the best-performing stock in the sector in Q4 2011. Despite this, we still believe that it can continue to outperform. Our investment thesis is framed on the following: improving returns; little debt; spare operating capacity; and its greater proportionate exposure to the US at present. Circa 50% of Wolseley's trading profits are now generated in the US, well above that of any of its peers.
HeidelbergCement has the most attractive geographic exposure of the cement companies. We believe its growth in 2012 will be driven by the attractive growth potential in Indonesia, Poland and Russia, while Germany and the US should be relatively solid. Despite balance sheet concerns, the group continues to generate decent levels of cash flow and recent bond issuances mean that the group now has no short-term maturity issues. Moreover, the stock is trading on a 2012 P/E multiple of under 9x. It also has a strong asset backing, which serves to underline the value at current levels.
CRH should benefit from the recent positive trends in the US construction market. Moreover, the group continues to have a healthy balance sheet; with many of its peers in distress, it is well positioned to take advantage of any forced disposals.
Geberit is by no means a cheap stock, but then this is always the case. We believe the group fully merits its premium rating. It has a best-in-class business model, generates outstanding returns and consistently converts over 50% of its EBITDA into free cash. Moreover, the group
Our favoured stocks at the present are Wolseley, HeidelbergCement, CRH and Geberit
Our least preferred companies are
Lafarge, Holcim, Grafton, Saint-Gobain and Italcementi
Wolseley was the best-performing stock in the sector in Q4 2011. Despite this, we still believe the stock can continue to outperform.
CRH should benefit from the recent positive trends in the US construction market

Research Report: Davy on 2012 January 4, 2012
24 Davy Research
has substantial net cash, which supports shareholder-friendly initiatives (generous dividend, share buybacks).
Kingspan remains an exciting and attractive play on the drive to improve the energy performance of buildings. While short-term cyclical considerations cannot be ignored, the group has an international span and is capable of generating strong returns over time.
Underweight for now on Holcim and Saint-Gobain; remaining cautious on Lafarge and Grafton
Holcim outperformed its peers in 2011 due to its high quality management and the perceived strength of its balance sheet. However, we have concerns about the outlook for key markets such as India and with weak cash flow generation the group's balance sheet remains a worry. In addition, the stock is expensive, trading on over 14x our 2012 forecast earnings.
Lafarge has outlined its 2012 strategy very clearly. It is seeking to lower costs by €500m and aggressively sell assets to fix its balance sheet (net debt/EBITDA of 3.8x). However, we think it could struggle with execution, which clearly cannot be taken for granted. In addition, geographically many of its key end-markets continue to contract (for example, Africa-Middle East). With weak underlying free cash generation and downside risk to estimates, we see no reason to own the stock at present. Successful implementation of the disposal plan would be the most likely catalyst for a change of view.
Saint-Gobain (SGO) is one of the most exposed stocks to construction activity in Continental Europe. Circa 70% of its revenues are generated in Western Europe, with almost 30% from France. Given its size – almost €30bn in revenues per annum in Western Europe – the group is vulnerable to macro economic developments and investor sentiment. Hence we are cautious on the stock for now, although this is a short-term view as two supports cannot be ignored: the first is that the stock is not expensively valued; the second is that it has a healthy financial position.
We remain cautious on Grafton for the present. With consumer sentiment fragile in the UK and Ireland, the group's recovery has stalled. Annualised revenues are stuck at the €2bn level and, without volume growth, margin recovery potential is constrained. The stock is on a 2011/2012 P/E multiple of over 15x, which is not attractive relative to its peers. There is no doubt that Grafton offers good upside as an operationally geared recovery play, but all the evidence suggests that this recovery has been delayed.
Travis Perkins one to keep on radar screen
Of the other building distribution businesses, we think Travis Perkins stands out as a stock that could well become an attractive investment at some stage this year. The stock enters 2012 trading at under 9x our current year forecasts. This is not demanding for what has been a
We remain cautious on Grafton for the present
Travis Perkins could well become an attractive investment at some stage this year

Research Report: Davy on 2012 January 4, 2012
25 Davy Research
consistently high-achieving business. Arguably, a reasonable level of potential earnings downside is already priced in. However, as long as this risk is present, we believe that in the near term the stock will struggle to re-rate and that for now 'top down' concerns about the UK economy and consumer will outweigh the ever-impressive 'bottom up' fundamentals.
Another dull year for UK housing market; stick with the quality operators
Regarding the UK housing market, we expect volumes and prices to be flat to slightly down in 2012. This is due to the ongoing problem of a lack of mortgage availability and weak consumer confidence. In addition, numerous government schemes have proved ineffective in stimulating demand.
More specifically, we remain most positive on the high-quality companies such as Berkeley and Persimmon due to strong asset backing and favourable landbank mix. Least preferred are the highly leveraged operators such as Barratt Developments and Redrow.

26 Davy Research
Research Report: Davy on 2012 January 4, 2012
S H A R E P R I C E A N D P E R F O R M A N C E Price 12 Month Mkt. Cap Change % (€) Rel to E300 sector % Pr/Bk Debt/EBITDA Local High Low €m Wk 1 Mth YTD Wk 1 Mth YTD 2011 2011 2012
B U I L D I N G M A T E R I A L S CRH (CRH ID) 1536 1700 1050 11043 2.7 7.8 -0.9 0.9 6.5 24.0 1.04 2.0 1.6 Readymix (RYX ID) 4 24 3 4 0.0 -33.3 -81.0 -1.8 -34.1 -76.2 0.07 N/A 1.4 Buzzi Unicem (BZU IM) 676 1076 566 1256 2.3 -0.7 -20.8 0.5 -1.8 -0.9 0.54 2.8 2.4 Cimpor (CPR PL) 532 549 459 3573 3.6 2.3 4.9 1.8 1.0 31.3 1.67 2.4 2.2 HeidelbergCement AG (HEI GY) 3279 5260 2457 6148 1.3 5.1 -30.1 -0.5 3.8 -12.5 0.48 3.4 3.0 Holcim (HOLN VX) 5025 7635 4344 13531 1.0 -0.1 -26.9 -0.7 -1.3 -8.5 0.90 2.8 2.4 Italcementi (IT IM) 456 765 409 1013 -2.9 -2.0 -27.9 -4.7 -3.2 -9.8 0.37 2.9 2.7 Lafarge (LG FP) 2716 4842 2300 7802 2.9 0.3 -42.1 1.1 -0.9 -27.6 0.46 3.6 3.3 European building materials (8) 879 1218 719 44371 2.0 2.7 -23.9 0.2 1.5 -4.8 0.71 3.0 2.6 Eagle Materials (EXP US) 2566 3250 1568 889 0.2 15.0 -6.3 -1.6 13.7 17.3 2.49 2.8 2.0 Martin Marietta (MLM US) 7541 9214 6162 2660 0.0 0.0 -15.7 -1.8 -1.2 5.6 2.34 2.8 2.4 Owens Corning (OC US) 2872 3851 2055 2680 2.6 3.9 -4.9 0.8 2.6 19.1 N/A 2.4 1.8 Vulcan Materials (VMC US) 3935 4698 2619 3925 0.2 25.9 -8.5 -1.6 24.4 14.5 1.33 7.8 6.2 Cemex (CX US) 539 1097 260 4327 -0.2 20.1 -48.1 -1.9 18.6 -35.0 3.82 7.0 6.2 US building materials (4) 1160 1357 814 10155 0.7 11.1 -9.1 -1.1 9.8 13.8 1.69 3.7 3.0 Global building materials (12) 989 1319 792 54526 1.7 4.2 -22.0 -0.1 2.9 -2.4 0.77 3.1 2.7
B U I L D I N G M E R C H A N T S Grafton Group (GN5 ID) 239 388 228 552 -3.4 -6.4 -30.8 -5.1 -7.5 -13.4 0.57 2.5 2.2 Hornbach Holding (HBH3 GY) 5200 6330 4435 832 -5.3 0.1 4.5 -7.0 -1.1 30.8 0.97 1.4 1.2 Travis Perkins plc (TPK LN) 796 1127 715 2322 -0.1 -1.8 -22.7 -1.8 -3.0 -3.3 0.89 1.6 1.2 Wolseley plc (WOS LN) 2132 2261 1404 7282 2.6 15.1 7.1 0.8 13.7 34.0 1.78 0.7 -0.1 Builders merchants (4) 945 1065 688 10988 1.2 8.7 -3.6 -0.6 7.4 20.7 1.29 1.1 0.6 Home Depot (HD US) 4204 4222 2851 50025 0.6 11.3 23.7 -1.1 9.9 54.8 3.71 1.2 1.1 Home Retail Group (HOME LN) 83 235 72 813 0.9 -4.5 -54.5 -0.9 -5.6 -43.1 0.25 -0.6 -0.5 Lowe's (LOW US) 2538 2728 1811 24539 1.2 9.7 4.4 -0.6 8.4 30.7 1.91 1.3 1.6 Kingfisher plc (KGF LN) 251 287 217 7105 2.0 0.7 -2.2 0.2 -0.5 22.4 1.03 0.0 -0.1
B U I L D I N G C O M P O N E N T S Kingspan Group (KSP ID) 636 770 565 1062 -2.2 -4.3 -15.1 -3.9 -5.4 6.3 1.55 1.5 1.1 Geberit (GEBN VX) 18100 21910 15000 5938 1.0 4.9 -14.0 -0.8 3.7 7.7 4.67 -0.9 -1.1 Rockwool (ROCKA DC) 46200 74200 45000 1366 -0.8 -10.8 -35.4 -2.5 -11.9 -19.1 1.14 0.3 0.1 SIG plc (SHI LN) 84 154 77 595 3.0 3.3 -32.9 1.2 2.0 -16.1 0.66 1.0 0.8 Wavin NV (WAVIN NA) 950 1218 379 482 -0.8 18.8 -16.6 -2.6 17.3 4.3 0.83 2.4 2.1 Building components (5) 1463 1832 1320 9443 0.3 1.7 -19.4 -1.4 0.5 0.9 2.04 0.2 -0.0
O T H E R B U I L D I N G Hill & Smith (HILS LN) 250 394 235 231 -1.2 0.9 -7.4 -2.9 -0.3 15.9 1.88 1.8 1.5 Saint-Gobain Group (SGO FP) 2967 4716 2702 15887 2.6 -5.5 -23.0 0.8 -6.7 -3.6 0.84 1.4 1.3 Uralita (URA SM) 157 350 156 309 -6.9 -13.1 -55.3 -8.5 -14.1 -44.0 0.96 2.4 2.0 Wienerberger (WIE AV) 697 1632 666 819 -0.2 -11.1 -51.2 -2.0 -12.2 -39.0 0.26 1.9 1.8
I R I S H H O U S E B U I L D I N G Abbey (ABBY ID) 520 538 500 114 0.0 1.0 2.0 -1.8 -0.2 27.6 0.72 -5.2 -3.9
U K H O U S E B U I L D I N G Barratt Developments plc (BDEV LN) 93 119 68 1075 2.1 -4.1 7.7 0.3 -5.3 34.8 0.30 2.1 1.8 Bellway plc (BWY LN) 713 777 541 1032 2.7 0.3 9.3 0.8 -0.9 36.8 0.81 1.7 1.6 Berkeley Group (BKG LN) 1276 1360 885 2008 -0.1 2.5 47.3 -1.9 1.3 84.4 1.74 -2.4 -1.7 Bovis Homes plc (BVS LN) 439 500 327 704 1.5 -5.4 9.0 -0.3 -6.5 36.5 0.80 0.2 1.1 Persimmon plc (PSN LN) 470 519 374 1702 2.0 -2.2 15.9 0.2 -3.4 45.0 0.78 -0.4 -0.0 Redrow plc (RDW LN) 113 138 104 419 -0.1 1.6 -14.1 -1.8 0.4 7.5 0.74 2.6 2.1 Taylor Wimpey plc (TW/ LN) 38 43 29 1439 2.1 -1.0 22.3 0.3 -2.2 53.1 0.66 0.7 1.1 Construction and Housebuilding (8) 1185 1240 893 8494 1.6 -0.9 18.1 -0.2 -2.1 47.9 0.71 0.4 0.6
U S H O U S E B U I L D I N G Beazer Homes (BZH US) 248 615 138 145 2.4 19.7 -52.5 0.6 18.3 -40.6 0.93 N/A N/A D R Horton (DHI US) 1261 1350 845 3076 2.1 9.9 9.1 0.3 8.6 36.5 1.52 8.5 2.4 KB Home (KBH US) 672 1571 527 400 2.3 -5.1 -48.6 0.5 -6.2 -35.7 1.20 N/A 17.6 Lennar (LEN US) 1965 2138 1271 2837 2.2 10.8 8.1 0.4 9.5 35.3 1.35 10.9 8.5 NVR (NVR US) 68600 80432 57528 2635 2.4 6.3 2.4 0.6 5.0 28.2 2.75 -2.4 -1.9 Pulte Homes (PHM US) 631 869 354 1864 4.6 7.2 -13.4 2.8 5.9 8.4 1.22 N/A 9.6 Ryland Group (RYL US) 1576 1906 955 540 1.8 8.8 -4.5 0.0 7.5 19.5 1.44 N/A 10.2 Toll Brothers (TOL US) 2042 2190 1375 2634 2.2 4.4 10.9 0.4 3.1 38.8 1.31 9.5 4.0 FTSE E300 Constr. & Mats. (E3CONS) 1191 1602 1041 1.8 1.2 -20.1

27 Davy Research
Research Report: Davy on 2012 January 4, 2012
V A L U A T I O N EPS (c) EPS Gth % Div Yield % Div Cover EV/EBITDA P/E 2011 2012 2013 11-13 2011 2012 2011 2011 2012 2013 2011 2012 2013
B U I L D I N G M A T E R I A L S CRH (CRH ID) 84 93 96 14.7 4.1 4.1 1.3 8.3 7.4 6.9 18.3 16.5 16.0 Readymix (RYX ID) -11 0 1 N/A 0.0 0.0 N/A N/A 1.9 1.0 N/A 57.7 4.2 Buzzi Unicem (BZU IM) 19 25 37 96.9 0.0 0.7 N/A 5.8 5.2 4.4 36.0 26.9 18.3 Cimpor (CPR PL) 40 41 46 14.1 3.8 4.3 2.0 8.0 7.4 7.0 13.2 13.0 11.6 HeidelbergCement AG (HEI GY) 260 386 447 72.1 1.5 3.0 5.2 6.0 5.5 5.0 12.6 8.5 7.3 Holcim (HOLN VX) 268 350 389 45.1 3.0 3.0 1.8 7.4 6.8 6.0 18.7 14.4 12.9 Italcementi (IT IM) 15 16 20 27.3 2.6 2.7 1.3 5.5 5.2 4.6 29.7 27.8 23.4 Lafarge (LG FP) 276 298 336 21.8 3.7 3.7 2.8 6.3 6.0 5.6 9.8 9.1 8.1 European building materials (8) 3.1 3.4 2.1 6.6 6.1 5.5 15.2 12.5 11.2 Eagle Materials (EXP US) 39 78 113 193.5 1.6 1.6 1.0 15.6 12.3 8.6 66.6 33.1 22.7 Martin Marietta (MLM US) 186 224 323 73.7 2.1 2.1 1.2 12.6 11.6 9.8 40.5 33.7 23.3 Owens Corning (OC US) 219 265 325 48.2 0.0 0.0 N/A 6.7 5.7 4.9 13.1 10.8 8.8 Vulcan Materials (VMC US) -102 -72 -10 N/A 1.9 0.1 N/A 22.9 18.6 13.6 N/A N/A N/ACemex (CX US) -73 -25 7 N/A 0.0 0.0 N/A 9.5 8.5 7.8 N/A N/A 77.0 US building materials (4) 2.0 1.0 1.9 12.0 10.3 8.4 22.0 17.6 13.7 Global building materials (12) 3.0 3.1 2.1 7.1 6.5 5.8 15.8 13.0 11.5
B U I L D I N G M E R C H A N T S Grafton Group (GN5 ID) 15 16 21 39.7 3.1 3.4 2.0 8.3 7.9 6.8 15.9 14.9 11.4 Hornbach Holding (HBH3 GY) 490 502 539 10.0 1.3 1.3 7.3 4.8 4.5 4.1 10.6 10.4 9.6 Travis Perkins plc (TPK LN) 87 91 99 14.4 2.5 2.8 4.3 6.6 6.0 5.4 9.1 8.7 8.0 Wolseley plc (WOS LN) 142 160 181 27.7 2.1 2.8 3.2 8.6 7.5 6.6 15.0 13.3 11.8 Builders merchants (4) 2.2 2.7 3.5 7.6 6.7 6.0 12.9 11.8 10.5 Home Depot (HD US) 239 275 312 30.3 2.5 2.8 2.3 9.2 8.6 8.0 17.6 15.3 13.5 Home Retail Group (HOME LN) 10 10 12 20.8 11.6 8.8 1.0 2.2 2.3 2.0 8.5 8.8 7.1 Lowe's (LOW US) 161 180 213 32.3 2.1 2.5 3.0 7.4 7.6 7.4 15.8 14.1 11.9 Kingfisher plc (KGF LN) 24 27 29 19.4 3.4 3.9 2.8 5.6 5.1 4.5 10.4 9.4 8.7
B U I L D I N G C O M P O N E N T S Kingspan Group (KSP ID) 37 42 55 49.1 1.9 2.3 3.1 9.7 8.6 7.0 17.2 15.0 11.5 Geberit (GEBN VX) 1023 1090 1186 15.9 3.4 3.7 1.7 12.2 11.2 10.2 17.7 16.6 15.3 Rockwool (ROCKA DC) 2740 3289 3830 39.8 2.1 2.4 2.9 5.6 4.7 4.1 16.9 14.0 12.1 SIG plc (SHI LN) 9 10 11 24.3 2.4 3.3 4.6 4.9 4.6 4.0 9.1 8.4 7.3 Wavin NV (WAVIN NA) 24 40 63 162.4 0.0 1.2 N/A 7.2 7.0 6.0 39.6 23.6 15.1 Building components (5) 3.0 3.2 2.1 8.9 8.0 7.1 17.0 15.3 13.3
O T H E R B U I L D I N G Hill & Smith (HILS LN) 34 35 38 11.9 5.3 5.6 2.5 5.2 4.8 4.1 7.4 7.1 6.6 Saint-Gobain Group (SGO FP) 330 370 426 29.1 4.2 4.7 2.6 4.6 4.4 4.0 9.0 8.0 7.0 Uralita (URA SM) 2 2 4 89.6 0.6 0.9 2.2 5.8 5.1 4.8 74.2 68.9 39.1 Wienerberger (WIE AV) 12 33 57 368.1 1.7 2.0 1.0 6.5 6.4 5.7 56.9 21.3 12.1
I R I S H H O U S E B U I L D I N G Abbey (ABBY ID) 38 48 50 31.5 1.6 1.7 4.5 2.5 2.6 1.7 13.6 10.9 10.3
U K H O U S E B U I L D I N G Barratt Developments plc (BDEV LN) 8 12 13 54.9 0.0 0.0 N/A 6.1 5.1 5.4 11.5 7.7 7.4 Bellway plc (BWY LN) 42 48 52 23.2 1.5 1.7 3.8 12.9 11.1 10.1 16.9 14.9 13.7Berkeley Group (BKG LN) 73 83 98 33.8 1.4 1.5 4.1 10.2 9.2 7.4 17.5 15.3 13.1 Bovis Homes plc (BVS LN) 15 24 34 122.9 1.4 1.8 2.5 18.6 13.3 12.1 28.8 18.1 12.9 Persimmon plc (PSN LN) 36 50 51 42.5 1.9 2.2 4.0 7.7 6.2 6.4 13.1 9.4 9.2 Redrow plc (RDW LN) 7 9 9 26.6 0.0 0.0 N/A 11.4 9.6 9.0 15.6 12.6 12.3 Taylor Wimpey plc (TW/ LN) 1 3 4 201.9 0.0 0.0 N/A 8.5 8.1 7.3 29.1 13.5 9.6 Construction and Housebuilding (8) 1.0 1.2 5.8 9.0 7.7 7.3 16.7 12.0 10.5
U S H O U S E B U I L D I N G Beazer Homes (BZH US) -271 -130 -68 N/A 0.0 0.0 N/A N/A N/A N/A N/A N/A N/AD R Horton (DHI US) 23 44 81 252.2 1.2 1.2 1.5 44.1 17.9 11.3 54.8 28.7 15.6 KB Home (KBH US) -246 -20 47 N/A 3.7 3.7 N/A N/A 26.5 10.3 N/A N/A 14.3 Lennar (LEN US) 49 75 120 144.9 0.8 0.8 3.1 29.0 21.6 14.5 40.1 26.2 16.4 NVR (NVR US) 2660 3411 4669 75.5 0.0 0.0 N/A 11.3 10.6 6.7 25.8 20.1 14.7 Pulte Homes (PHM US) -50 21 52 N/A 0.0 0.0 N/A N/A 20.0 11.2 N/A 30.0 12.1 Ryland Group (RYL US) -102 45 103 N/A 0.8 0.8 N/A N/A 31.8 12.7 N/A 35.4 15.2 Toll Brothers (TOL US) 24 36 74 206.3 0.0 0.0 N/A 83.9 32.7 16.5 85.1 56.7 27.8

Research Report: Davy on 2012 January 4, 2012
28 Davy Research
Steel Sector performance in 2011
The E300 Industrial Metals and Mining Index delivered an extremely poor performance in 2011 (-41.7% yoy), with the steel segment down 42.4% yoy.
The worst-performing stocks in the steel sector were the stainless steel names (Aperam -63.4% yoy, Outokumpu -63.4% yoy) and the large-cap carbon steel companies (ArcelorMittal, -47.5%, ThyssenKrupp -42.8%). Voestalpine was the best performer, but it still delivered a negative performance for the year (-39.2% yoy).
This weak performance was driven by falling earnings forecasts – 2012 EBITDA forecasts were reduced by 20% throughout the year.
2012 will be another year of downgrades as consensus numbers are far too high (we are 9% below). We expect further EBITDA declines in 2012 (20%), driven by weak demand and falling steel prices.
Key themes for 2012
Declining steel production in China is driving down iron ore prices
Chinese steel production (50% of global production) growth is slowing (-4% month-on-month in October and November), which is driving down the global iron ore price (China imports 60-65% of its iron ore requirements).
This production slowdown is occurring at a time when Chinese iron ore inventories are at all-time highs (on a relative and absolute basis). The last time such a situation occurred, the resulting inventory unwind crashed the iron ore price from $190/t to c.$60/t.
As a result, we believe that the inventory unwind in 2012 will result in the iron ore price falling to $105/t (from $135/t).
Falling steel prices in Europe due to weak fundamentals as input costs decline and inventory levels remain high
We expect European/US steel demand to be broadly flat yoy in 2012, with construction and automotive markets struggling.
With utilisation rates in Europe at 70%, steel producers have no pricing power. In a declining input cost environment, steel prices will go lower. In times of weak utilisation rates and falling input costs, steel prices tend to overshoot iron ore prices – generating losses for steel producers.
In addition, steel inventory levels in Europe are back at pre-crisis levels. We expect de-stocking to occur in H1 2012, sending the steel price even lower.
Tim Cahill [email protected]
Killian Murphy [email protected]
The steel sector fell by 42.4% yoy
in 2011
EBITDA forecasts were revised downwards by 20% throughout the year. We expect further downgrades of c.20% in 2012.
Key themes for 2012
Declining steel production in China is driving down iron ore prices
Falling steel prices in Europe due to weak fundamentals as input costs decline and inventory levels remain high
Poor free cash flow generation is resulting in asset disposals and potential rights issues

Research Report: Davy on 2012 January 4, 2012
29 Davy Research
Poor free cash flow generation is resulting in asset disposals and potential rights issues
The steel sector (with the exception of Voestalpine) is characterised by extremely poor cash generation as free cash flow is eaten up by capex and interest payments.
With sector balance sheets becoming more and more stretched due to expansion programmes, companies are attempting to dispose of their least attractive assets in order to generate cash. This will prove challenging given current market conditions, and rights issues cannot therefore be ruled out.
The sector is not attractively valued (2012 P/E of 10.5x), with consensus numbers far too high and leading indicators slowing. We forecast 30% downside from current levels.
How key stocks are positioned for 2012
ArcelorMittal is most exposed to the falling spot steel price and the falling iron ore price (circa 35% of EBITDA is generated from its mining division); consequently, we expect earnings to decline considerably from current levels (EBITDA -3% yoy in 2012). On our forecasts, the company will miss its Q4 2011 guidance of $1.6bn EBITDA (Davy: $1.45bn) and its net/debt target of $22.5bn by mid-2012. Despite recent profit warnings in the sector, the stock has traded in-line with markets. We believe that the Q4 results will highlight the difficulties facing the company.
ThyssenKrupp's Steel Americas business continues to fall short of management's expectations (the profitability timeline continues to be pushed out), driven by both quality issues and weak market conditions. Until such issues are corrected, we see no reason to hold the stock given the current valuation (18x forward P/E).
Salzgitter's strong cash pile means that it will not have to come to the market for capital. However, it is burning through its cash pile at an alarmingly fast rate (circa €200m per annum), and its strategy of diversifying away from its steel assets remains unproven. We therefore see no strong reason to hold the stock.
Voestalpine is our only 'outperform' recommendation in the European steel space. With its portfolio of high-end steel creating niche products for its diversified customer base, Voestalpine is least exposed to the spot steel and iron ore price. This strong cash generation characteristic will allow the company to reduce gearing over the short term and underpins our positive stance on the stock.
ArcelorMittal will miss its guidance in 2012
ThyssenKrupp's Steel Americas business continues to fall short of expectations
Salzgitter continues to burn through its cash pile
Voestalpine is our only 'outperform' recommendation in the European steel space

30 Davy Research
Research Report: Davy on 2012 January 4, 2012
S H A R E P R I C E A N D P E R F O R M A N C E Price 12 Month Mkt. Cap Change % (€) Rel to E300 sector % Pr/Bk Debt/EBITDA Local High Low €m Wk 1 Mth YTD Wk 1 Mth YTD 2011 2011 2012
S T E E L ArcelorMittal (USc) (MT NA) 1831 3828 1511 22056 1.1 1.4 -47.5 0.3 -0.1 -10.0 0.42 2.6 2.5 Salzgitter (SZG GY) 3863 6472 3370 2322 -0.3 0.7 -33.1 -1.0 -0.8 14.7 0.53 -1.0 -0.7 Thyssenkrupp (TKA GY) 1773 3584 1670 9119 0.1 -7.3 -42.8 -0.7 -8.7 -1.9 0.82 1.1 1.2 Voestalpine (VOE AV) 2167 3890 1838 3663 1.0 0.9 -39.2 0.2 -0.6 4.2 0.72 1.7 1.5 Acerinox (ACX SM) 991 1408 818 2471 0.6 -1.3 -24.5 -0.2 -2.7 29.5 1.38 2.9 2.4 Aperam (APAM NA) 1090 3131 970 851 0.5 -8.7 -63.4 -0.3 -10.0 -37.2 0.30 2.4 1.6 Evraz Group (EVRZ LI) 1749 4200 1305 6014 -1.3 2.0 -49.7 -2.1 0.5 -13.7 6.03 2.3 2.1 Outokumpu Oyj (OUT1V FH) 508 1445 460 930 0.2 -14.3 -63.4 -0.6 -15.5 -37.2 0.42 20.4 6.8 Rautaruukki Oyj (RTRKS FH) 712 1840 593 998 -0.2 -1.0 -59.4 -1.0 -2.5 -30.3 0.75 3.8 3.0 Severstal (SVST LI) 1139 2017 950 8860 -2.7 -12.5 -30.3 -3.5 -13.8 19.6 1.29 0.9 0.8 SSAB (SSABA SS) 6065 11420 4735 2207 2.3 1.4 -46.0 1.5 -0.1 -7.5 0.63 3.7 3.0 Tata Steel (TATA IN) 33535 69470 33535 4684 -3.1 -11.0 -57.1 -3.9 -12.3 -26.5 0.81 3.2 2.7 Tenaris (TEN IM) 1428 1844 906 16858 0.2 3.1 -22.2 -0.6 1.6 33.5 2.02 -0.2 -0.4 Vallourec (VK FP) 5016 8918 3898 6091 2.4 -1.1 -36.2 1.6 -2.6 9.4 1.77 1.0 1.1 Steel (14) 582 1038 478 87123 0.0 -2.2 -42.4 -0.8 -3.6 -1.2 0.79 1.9 1.7
M I N I N G BHP Billiton (BLT LN) 1878 2632 1667 120101 0.3 -1.1 -24.4 -0.5 -2.6 29.7 11.90 0.2 0.4 Eurasian Natural Resources (ENRC LN) 636 1125 522 9810 1.0 -1.9 -37.7 0.2 -3.3 6.9 0.36 0.1 0.1 Ferrexpo (FXPO LN) 269 499 239 1897 -0.3 -7.9 -33.6 -1.1 -9.2 13.9 1.74 -0.2 -0.4 Rio Tinto plc (RIO LN) 3125 4712 2713 70172 -0.9 -3.9 -28.4 -1.7 -5.4 22.8 2.01 0.3 0.2 Vedanta Resources (VED LN) 1015 2518 928 3233 -0.3 -1.9 -58.6 -1.0 -3.3 -28.9 7.27 2.4 1.4 Xstrata (XTA LN) 978 1551 764 34756 -0.1 -1.3 -33.2 -0.8 -2.8 14.5 0.49 0.8 0.7 Mining (6) 2552 3715 2136 239968 0.1 -2.1 -28.4 -0.7 -3.5 22.8 1.66 0.4 0.4
I N D U S T R I A L G A S E S Air Liquide (AI FP) 9559 10000 8383 27125 2.9 1.7 1.0 2.1 0.3 73.2 N/A 1.4 1.3 Linde AG (LIN GY) 11495 12580 9616 19654 1.5 0.7 1.2 0.7 -0.8 73.6 15.26 1.7 1.5 Industrial gases (2) 2089 2199 1810 46779 2.3 1.3 1.1 1.5 -0.2 73.4 22.31 1.5 1.4
M A C H I N E R Y Andritz (ANDR AV) 6410 7550 5482 3333 0.0 -1.9 -6.8 -0.8 -3.3 59.8 3.80 -3.1 -3.0 Atlas Copco (ATCOA SS) 14800 17740 11550 20440 2.4 4.5 -12.3 1.6 2.9 50.4 N/A 0.4 0.0 Cookson Group (CKSN LN) 509 725 396 1687 1.6 5.5 -20.6 0.8 4.0 36.1 1.03 1.0 0.9 Danieli (DAN IM) 1631 2458 1434 1023 0.6 -1.9 -31.9 -0.2 -3.3 16.8 1.12 -2.4 -2.8 Outotec OYJ (OTE1V FH) 3640 4573 2466 1666 3.0 8.2 -21.3 2.2 6.6 35.0 4.15 -2.1 -1.8 RHI (RHI AV) 1510 2992 1358 601 -2.0 -0.5 -48.8 -2.7 -2.0 -12.2 1.49 1.8 1.7 Sandvik AB (SAND SS) 8445 13470 7285 11252 2.7 -0.1 -35.2 1.9 -1.6 11.1 0.31 1.4 1.1 Machinery (7) 1293 1689 1033 40002 2.1 2.5 -22.0 1.3 1.0 33.8 0.97 0.4 0.1 FTSE E300 Industrial Metals & Mining (E3METL)
1060 1853 854 0.8 1.5 -41.7

31 Davy Research
Research Report: Davy on 2012 January 4, 2012
V A L U A T I O N EPS (c) EPS Gth % Div Yield % Div Cover EV/EBITDA P/E 2011 2012 2013 11-13 2011 2012 2011 2011 2012 2013 2011 2012 2013
S T E E L ArcelorMittal (USc) (MT NA) 174 186 221 26.7 4.1 4.1 2.3 3.8 3.7 3.5 10.5 9.8 8.3 Salzgitter (SZG GY) 248 276 304 22.7 1.9 2.1 3.3 2.0 2.4 2.7 15.6 14.0 12.7 Thyssenkrupp (TKA GY) -428 100 159 N/A 2.5 1.4 N/A 3.8 4.5 3.6 N/A 17.8 11.2 Voestalpine (VOE AV) 297 308 333 12.4 3.7 4.6 3.7 3.9 3.7 3.4 7.3 7.0 6.5 Acerinox (ACX SM) 55 79 96 74.5 4.5 4.5 1.2 9.0 7.2 6.1 18.0 12.5 10.3 Aperam (APAM NA) 9 85 150 N/A 5.0 5.0 0.2 5.4 3.9 3.4 N/A 12.8 7.3 Evraz Group (EVRZ LI) 31 42 56 78.3 1.4 0.7 1.3 6.4 6.3 5.2 56.0 41.3 31.4 Outokumpu Oyj (OUT1V FH) -70 1 77 N/A 2.0 3.9 N/A 29.5 9.9 6.2 N/A N/A 6.6 Rautaruukki Oyj (RTRKS FH) 22 36 93 332.2 5.6 7.0 0.5 8.5 6.9 4.7 33.1 20.0 7.7 Severstal (SVST LI) 212 152 181 -14.9 4.7 4.9 3.9 3.8 3.8 3.2 5.4 7.5 6.3 SSAB (SSABA SS) 557 679 868 55.7 4.0 4.2 2.3 7.6 6.4 5.0 10.9 8.9 7.0 Tata Steel (TATA IN) 4530 5630 7886 74.1 3.6 3.6 3.8 5.5 4.6 4.0 7.4 6.0 4.3 Tenaris (TEN IM) 87 115 125 43.7 2.0 2.5 3.1 9.1 7.2 5.8 16.4 12.4 11.4 Vallourec (VK FP) 427 473 494 15.6 5.7 6.0 1.5 7.7 6.8 5.3 11.7 10.6 10.2 Steel (14) 3.4 3.5 1.6 5.5 5.2 4.5 17.7 10.8 8.8
M I N I N G BHP Billiton (BLT LN) 40 42 42 4.7 1.0 1.0 2.2 4.4 4.2 3.8 47.0 44.4 44.9 Eurasian Natural Resources (ENRC LN) 180 218 215 19.3 18.1 19.3 1.6 3.7 3.6 3.3 3.5 2.9 3.0 Ferrexpo (FXPO LN) 68 67 59 -13.0 1.6 1.7 15.9 2.9 2.7 2.6 4.0 4.0 4.6 Rio Tinto plc (RIO LN) 294 440 460 56.6 0.5 0.6 18.2 3.5 3.3 2.9 10.6 7.1 6.8 Vedanta Resources (VED LN) 19 19 19 0.1 2.1 1.9 0.9 3.3 2.0 1.3 53.4 53.4 53.4 Xstrata (XTA LN) 232 236 241 4.0 14.8 15.3 1.6 4.6 4.2 3.4 4.2 4.1 4.1 Mining (6) 3.6 3.7 2.4 4.0 3.7 3.3 11.6 9.6 9.5
I N D U S T R I A L G A S E S Air Liquide (AI FP) -14 22 22 N/A 0.1 0.1 N/A 8.9 8.3 7.7 N/A N/A N/A Linde AG (LIN GY) 226 241 259 14.7 0.9 1.0 2.3 7.9 7.5 6.7 50.9 47.8 44.4 Industrial gases (2) 0.4 0.5 2.0 8.4 8.0 7.3 N/A N/A N/A
M A C H I N E R Y Andritz (ANDR AV) 427 481 503 17.8 3.3 3.9 2.0 5.9 5.0 4.9 15.0 13.3 12.8 Atlas Copco (ATCOA SS) 88 114 121 38.7 0.2 0.3 2.5 9.6 9.2 8.3 N/A N/A N/A Cookson Group (CKSN LN) 69 66 74 7.2 4.2 4.6 3.2 5.1 4.9 4.5 7.4 7.7 6.9 Danieli (DAN IM) 237 212 218 -8.0 2.0 2.0 7.2 0.4 0.4 0.2 6.9 7.7 7.5 Outotec OYJ (OTE1V FH) 185 226 254 37.3 2.4 2.9 2.2 10.2 7.8 7.0 19.7 16.1 14.3 RHI (RHI AV) 270 262 298 10.7 3.3 3.8 5.4 4.8 4.5 3.8 5.6 5.8 5.1 Sandvik AB (SAND SS) 7324 7937 9078 23.9 75.7 67.9 1.1 7.1 6.6 5.9 1.2 1.1 0.9 Machinery (7) 22.1 20.0 1.2 7.4 7.0 6.3 3.7 3.5 3.0

Research Report: Davy on 2012 January 4, 2012
32 Davy Research
Paper and packaging Sector performance in 2011
The European paper and packaging sector declined by almost 23% in 2011, significantly underperforming the E300.
The decline was due to a sharp turnaround in containerboard pricing in June that continued into year-end. This resulted from a build-up in inventory levels over the summer as demand weakened and lower Chinese demand for OCC led to a decline in input costs.
Smurfit Kappa Group (SKG) was the poorest performer of the containerboard players, declining by 36% and underperforming Mondi (-8.9%) and DS Smith (+0.6%).
In our view, SKG's performance was negatively impacted by the continuing debt burden despite the fact that we expect the company will have reduced net debt by over €240m by year-end.
Key themes for 2012
Corrugated prices will fall, leading to downward earnings revisions
The impact of the 2011 declines in containerboard prices, combined with further falls (10%) expected in 2012, will drive a 10% decline in corrugated prices in 2012.
We expect corrugated volumes to fall by 4% in 2012 as macroeconomic conditions in Europe continue to deteriorate. This, however, is still better than the 8% volume decline recorded in 2009.
Combined, this drives our €919m EBITDA forecast for 2012, a 9% decline on the 2011 out-turn.
Market is likely to price in trough earnings
The accuracy of our 2012 forecast depends on the timing of the decline in corrugated prices. If this happens quickly, then the risk to our numbers is firmly to the downside.
Our 2013 EBITDA forecast of €849m reflects the trough in this cycle. The real trough, however, is likely to occur between H2 2012 and H1 2013. The market will soon start to price off this number.
On this forecast, the stock looks cheap; in reality, however, it will be difficult for the share price to make progress until the earnings downgrade cycle is almost complete.
Debt refinancing likely to be completed
Given where the bonds are now trading, we believe bond investors are more confident about SKG's ability to refinance in the current market.
The share price could perform well into potential refinancing windows around quarterly results, particularly in February and May, depending on market conditions at that time.
Barry Dixon [email protected]
The decline in the European paper and packaging sector in 2011 was due to a sharp turnaround in containerboard pricing in June that continued into year-end
Smurfit Kappa Group was the poorest performer of the containerboard players
Key themes for 2012
Corrugated prices will fall, leading to downward earnings revisions
Market is likely to price in trough earnings
Debt refinancing likely to be completed

33 Davy Research
Research Report: Davy on 2012 January 4, 2012
S H A R E P R I C E A N D P E R F O R M A N C E Price 12 Month Mkt. Cap Change % (€) Rel to E300 sector % Pr/Bk Debt/EBITDA Local High Low €m Wk 1 Mth YTD Wk 1 Mth YTD 2011 2011 2012
European Sector Smurfit Kappa Group (SKG ID) 467 945 405 1036 -0.2 3.8 -36.0 -2.9 5.5 -0.6 0.53 2.9 2.8 Mondi (MNDI LN) 455 664 414 2648 1.2 2.1 -8.9 -1.5 3.8 41.5 0.91 1.0 0.8 SCA (SCAB SS) 10090 11500 7960 7991 -0.3 -0.1 -3.9 -3.0 1.6 49.4 1.05 2.3 2.0 Smith (David S.) (SMDS LN) 198 266 164 1035 2.8 1.5 0.6 0.1 3.1 56.3 1.35 0.6 0.3 Stora Enso (STERV FH) 463 884 377 3654 3.3 0.0 -39.7 0.5 1.7 -6.4 0.58 1.9 1.8 UPM-Kymmene (UPM1V FH) 851 1561 741 4467 2.8 -1.6 -35.6 0.0 0.0 0.0 0.61 2.7 2.3 European paper & packaging (6) 632 923 551 20832 1.3 0.1 -22.7 -1.4 1.8 20.0 0.78 2.1 1.9 US Sector International Paper (IP US) 2960 3286 2265 9986 2.0 8.2 12.1 -0.7 10.0 74.2 1.69 1.7 1.4 Pkg.Corp.America (PKG US) 2524 3027 2128 1938 1.6 0.7 0.8 -1.1 2.4 56.6 2.53 1.4 1.0 Temple Inland (TIN US) 3171 3185 2101 2684 1.1 3.4 54.0 -1.6 5.1 139.3 3.53 1.6 1.0 Weyerhaeuser (WY US) 1867 2520 1525 7731 3.6 15.4 1.8 0.8 17.3 58.1 2.18 3.7 3.2 US paper & packaging (4) 492 527 362 22338 2.3 9.2 10.9 -0.5 11.0 72.2 2.03 2.0 1.7 Paper & packaging (10) 485 606 397 43170 1.8 4.6 -8.4 -0.9 6.3 42.3 1.14 2.1 1.8 FTSE E300 Forestry & Paper (E3PAPR) 640 1174 557 2.8 -1.6 -35.6
V A L U A T I O N EPS (c) EPS Gth % Div Yield % Div Cover EV/EBITDA P/E 2011 2012 2013 11-13 2011 2012 2011 2011 2012 2013 2011 2012 2013
European Sector Smurfit Kappa Group (SKG ID) 103 84 72 -29.8 0.0 0.0 N/A 4.0 4.1 4.2 4.5 5.6 6.5 Mondi (MNDI LN) 58 47 50 -13.6 4.5 5.1 2.8 3.7 3.8 3.4 7.9 9.7 9.1 SCA (SCAB SS) 837 962 1031 23.2 4.0 4.3 2.1 7.0 6.3 5.8 12.1 10.5 9.8 Smith (David S.) (SMDS LN) 20 21 23 10.8 4.0 4.5 2.5 4.5 4.3 4.2 9.8 9.5 8.8 Stora Enso (STERV FH) 65 52 62 -3.9 5.4 6.5 2.6 4.6 4.8 4.5 7.2 9.0 7.5 UPM-Kymmene (UPM1V FH) 93 80 102 9.9 6.5 7.1 1.7 5.8 5.3 4.5 9.2 10.7 8.3 European paper & packaging (6) 4.6 5.2 2.4 5.2 5.1 4.7 8.9 9.7 8.6 US Sector International Paper (IP US) 308 303 312 1.2 3.3 3.5 3.2 5.2 4.9 4.7 9.6 9.8 9.5 Pkg.Corp.America (PKG US) 158 185 208 31.3 3.2 3.2 2.0 7.1 6.0 5.6 16.0 13.6 12.2 Temple Inland (TIN US) 83 133 165 98.0 1.6 1.6 1.6 10.1 7.7 7.4 38.1 23.9 19.2 Weyerhaeuser (WY US) 26 42 88 238.5 3.2 3.2 0.4 13.6 12.1 10.2 71.8 44.5 21.2 US paper & packaging (4) 3.1 3.2 2.0 7.3 6.6 6.2 16.7 15.4 13.0 Paper & packaging (10) 3.8 4.1 2.2 6.0 5.7 5.3 11.8 12.0 10.5
Research Report: Davy on 2012 January 4, 2012
34 Davy Research
Food and beverage Food sector performance in 2011
The European food producers sector outperformed the wider market again in 2011 in relative terms and also turned positive in absolute terms, posting a gain of 4.4%.
Across the Atlantic, the US food products sector continued to outperform the wider S&P 500 index and posted a strong absolute return of 11.9%.
Key themes for 2012
Volume growth will be highly prized
The presence, or threat, of austerity continues to hang over many developed markets. Economic stimuli have provided only temporary protection for demand and volumes.
In this context, volume growth will be highly prized and those companies that secure it should command superior valuation multiples.
Gross margin pressure will remain but may be different to that in 2011
It has been as much the volatility as the quantum that has defined much of the sector's challenges in gross margin management in 2011.
In 2011, rising input costs really pressured gross margin. With the recent easing in some soft commodities, companies may begin to lap easier comps through 2012. Margin pressure may come from a slowing top line in 2012 as price increases slow and volumes decline.
Our investment bias remains intact in this regard, i.e. to be closer to the farmer/producer than the retailer/consumer.
New product development and innovation will play important role
Product innovation is increasingly being used as a tool to manage pricing architecture and to sustain retailer interest.
Health and wellness is also a critical stimulus for such innovation. This has allowed companies in food and health to expand into adjacent categories, e.g. Nestlé's purchase of Prometheus Labs, GlaxoSmithKline's activity in performance nutrition, DuPont's acquisition of Danisco.
Ingredient solution companies such as Kerry can also follow clients into these markets as well as using complementary skills to attract new business in these categories.
Earnings estimates – what is the market looking for and how has it changed over the past 12 months?
2011 estimates for the European food sector declined by 7% since the start of the year and 2012 estimates also fell by a similar amount.
John O'Reilly [email protected] Foods Jack Gorman [email protected] Aiden O'Donnell [email protected] Beverages Barry Gallagher [email protected] Richard O'Donovan [email protected]
Key themes for 2012
Volume growth will be highly prized
Gross margin pressure will remain but may be different to that in 2011
New product development and innovation will play important role
Earnings estimates – what is the market looking for and how has it changed over the past 12 months?
Regulatory issues – developments expected in dairy and sugar
Balance sheets and cash flows will be closely scrutinised

Research Report: Davy on 2012 January 4, 2012
35 Davy Research
Regulatory issues – developments expected in dairy and sugar
The proposed elimination of EU dairy quotas will provide the first opportunity for volume expansion in the sector in 30 years.
Further progress will also be made on EU sugar reform. The concept of co-decision means that the Commission and Parliament must agree on final proposals. As such, the earliest suggested date for quota elimination, i.e. 2015, is not a given.
Fat taxes may become a focus for many governments as they struggle with rising health costs and lower health budgets.
Balance sheets and cash flows will be closely scrutinised
Sector balance sheets are in better shape than in 2007 when the initial credit squeeze began. However, limited availability of bank funding is likely in 2012, and investors may become even more vigorous in their analysis of companies with high debt levels.
How key stocks are positioned for 2012
Kerry Group – maintaining growth momentum
Operationally, 2012 will be a busy year for Kerry as it continues to roll out its comprehensive 'Kerry Connect' programme while bedding in the acquisition of Cargill's flavours business (this transaction is expected to complete by end-2011).
We model for organic growth of 3.7% across the group, mostly volume-driven and ingredients-led. We believe that this is achievable and will represent outperformance in a food sector context.
Kerry's evolution from primary food processor into applications technology has positioned it well to service clients' increasing demand for solutions in nutrition, health and wellness.
The continual expansion of the technology, customer, channel and geographic base should also enable Kerry to navigate the food sector headwinds and maintain growth momentum. The group's strong cash flow and ROIC characteristics underpin this view.
Glanbia – underlying volume growth remains strong
Notwithstanding Glanbia's achievements in global nutritionals in recent years, we believe its ambition is not exhausted. Product line reformulation, international expansion and further acquisitions all remain on the agenda. Underlying volume growth remains strong, and higher whey costs will be annualised in 2012.
The proposed new investment in Irish whey processing is indicative of the shifting dynamic and the prospective growth opportunity in Irish milk processing that will arise from quota removal. This may emerge as a theme this year.
Speciality baking ingredients – CSM, ARYZTA
From an operational and a share price perspective, 2011 could not have been a more different year for CSM and ARYZTA.
We model for organic growth of 3.7% for Kerry, mostly volume-driven and ingredients-led
Product line reformulation, international expansion and further acquisitions all remain on Glanbia's agenda

Research Report: Davy on 2012 January 4, 2012
36 Davy Research
CSM: CSM fell 53.9% following a number of intra-year profit warnings. Margins throughout the year collapsed as the group struggled against the backdrop of rising input costs, a weak consumer, a difficult retail environment and a very competitive market.
2012 will present further challenges for CSM as we see little scope for a huge increase in demand. However, with some of the key input costs falling and yoy comps becoming easier, there may be some scope for margin rebound.
With the commissioning of its lactide facility in Thailand, we assume that newsflow around polylactic acid will increase in 2012.
ARYZTA: In contrast to CSM, ARYZTA has performed well in a difficult trading environment. Underlying revenue grew progressively through the year. The acquisition of Fresh Start Bakeries has made its earnings more defensive given its exposure to the quick-serve restaurant sector, which grew strongly in 2011.
2012 will be another difficult year for the sector as operators try to re-align their offerings to suit the new consumer reality. ARYZTA's recent IMS suggested that the business continues to perform well and that management remains confident regarding analyst expectations for the full year.
We would not rule out further acquisitions in 2012 as the company moves closer to its earnings target of 400c EPS by 2013.
Sweetener ingredients – Associated British Foods (ABF), Südzucker (SZU), Tate & Lyle
The outlook for long-term sugar pricing remains positive given solid projected demand and ongoing structural challenges in major producing countries such as Brazil and India. In the EU, contracted pricing is set for much of the industry until September at sharply higher levels yoy.
Alongside the annual weather-related supply impacts, 2012 may also include regulatory developments in the EU (post-2015 reform debate) and the US (new Farm Bill expected).
ABF: strong advances in the group's sugar division can offset the cautious outlook that we have assumed for its consumer-facing divisions (Primark and grocery). In our view, Primark growth will be driven by store expansion with margins flat yoy. ABF's strong commitment to investment remains intact, either internally or by acquisitions (activity on the latter has been surprisingly quiet for some time).
SZU: supported by the strong ROCE momentum and cash flow in its quota sugar business, 2012 may be the year in which SZU's outward expansion could gather momentum. We believe the significance of the imminent ED&F Man acquisition is under-appreciated by the market. Excluding sugar, additional investments may also be considered in the likes of its CropEnergies (ethanol) and Beneo (ingredients) units.
2012 will present further challenges for CSM as we see little scope for a huge increase in demand
ARYZTA has performed well in a difficult trading environment
The outlook for long-term sugar pricing remains positive
Strong advances in ABF's sugar division can offset the cautious outlook that we have assumed
SZU's outward expansion could gather momentum in 2012

Research Report: Davy on 2012 January 4, 2012
37 Davy Research
Tate & Lyle: is this the year when sustainable growth in speciality food ingredients emerges? A reasonably full valuation suggests that the market is beginning to anticipate that this growth will be delivered. We would welcome this as earnings predictability would improve markedly as a result. In the meantime, the attractive yield will protect on the downside.
Origin Enterprises – well positioned for 2012 Following a number of years of change within the group's set-up,
where non-core assets were moved to the JV line, Origin is now positioned as a pure agri-services business.
In 2012, Origin will aim to leverage its scale in the UK to drive revenues across its entire portfolio of on-farm offerings.
Plantings for 2012 are expected to be higher yoy, offering a positive tailwind for Origin as we look forward into 2012.
Fyffes – ability to increase its profits base likely to continue
Fyffes returned substantial cash to shareholders in 2011 in the form of dividends and share buybacks. It has now reduced its sizeable net cash position.
Over the past few years, it has demonstrated an ability to increase its profits base despite intra-year volatility from external factors such as weather events. We expect this to continue into 2012.
Total Produce – firepower to build on its scale position makes acquisitions likely in 2012
We expect some acquisitions by Total Produce in 2012. It has the firepower to build on its scale position. Valuations at current levels make it a stand-out, long-term hold.
Greencore – revenues and profits expected to increase in 2012
2011 was a significant year of corporate activity for Greencore. Its bid for Northern Foods was rejected in favour of a rival bid, and it has spent the remainder of the year looking to add further scale to its business. It managed to raise funds via a rights issue to purchase Uniq. It is now in the process of integrating this business and releasing the proposed synergies.
At this stage it is difficult to be overly optimistic regarding the UK consumer environment, but thus far the chilled cabinet has held up fairly well. For this reason, revenues and profits are expected to increase for Greencore in 2012.
In 2012, Origin will aim to leverage its scale in the UK to drive revenues across its entire portfolio of on-farm offerings
Valuations at current levels make Total Produce a stand-out, long-term hold

Research Report: Davy on 2012 January 4, 2012
38 Davy Research
Beverage sector performance in 2011
The global beverage sector finished the year up 5.5%, outperforming the E300 and the S&P 500. While in absolute terms it has been a difficult year for equities, beverages have performed well in relative terms.
Following a year of outperformance for the brewers in 2009 and more of a stock pickers market in 2010, the big spirits companies outperformed the brewers in 2011. The largest brewers (ABI and SABMiller), with the advantages of scale and less relative exposure to low-growth markets, have in turn outperformed other major brewers like Heineken and Carlsberg.
The global beverage sector trades at a P/E multiple of 13.8x 2012 estimates. On a relative basis, the sector continues to look expensive relative to the overall market. It trades at a premium of 55% versus a historical average of 35%.
Diageo – best-performing stock in our coverage universe
Diageo's strong brand portfolio and exposure to high-growth emerging markets and cash generative developed markets allowed it to perform well in a difficult climate.
The more resilient economic position of spirits consumers versus beer consumers and the willingness of consumers to trade up in numerous markets have been key factors. Diageo’s balance sheet strength and defensive nature have also allowed it to outperform. In addition, the medium-term guidance issued by CEO Paul Walsh at the end of the financial year has helped to generate further optimism.
Another eventful year for C&C
C&C had another eventful year with the strong performance of the Tennent's brand and the continued growth of the international business helping to offset the difficult Irish consumer environment and the competitive environment in GB. C&C underperformed (-15.2%) the broader Irish market in 2011 (+0.6%) while also underperforming versus its global drinks peers (+5.5%), in line with the trend of previous years.
M&A continued with the acquisition of US cider brand Hornsby’s from E&J Gallo Winery, and more deals are possible as the company remains in a net cash position. The Hornsby's deal, while small (maximum €20m, c.9x EV/EBITDA), presents a good opportunity for C&C. Cider category volumes are growing at c.20% per annum in the US yet still account for only about 0.2% of the combined beer and cider category. This acquisition also allows C&C to leverage Magners' existing strength on the east coast in the on-trade with Hornsby's base on the west coast in the off-trade. C&C now has an estimated 20% share of the US cider category.
Management has been able to defend profitability successfully in Ireland despite the difficult economic climate, with the success of
The big spirits companies outperformed the brewers in 2011
Diageo performed well in a difficult climate
The strong performance of the Tennent's brand and the continued growth of the international business helped to offset the difficult Irish consumer environment and the competitive environment in GB

Research Report: Davy on 2012 January 4, 2012
39 Davy Research
Tennent's providing a welcome boost. In the UK, Magners has performed ahead of the market and also continues to innovate with the introduction of 'Magners Specials'. The launch of an ale brand, Caledonia Best, in Scotland is an interesting development and could provide some positive surprises heading into 2012.
Tumultuous 2011 for Britvic
Britvic, the only exclusively soft drinks-based operator within our coverage universe, has endured a tumultuous 2011 having been exposed to significant raw material cost inflation and to an increasingly challenged consumer environment in core markets.
The association between soft drinks and obesity has not only opened up the industry to the risk of negative sentiment depressing volumes but also to the risk of "soft drink taxes" as governments increasingly look for innovative ways to help balance their budgetary positions. France will implement such a tax in 2012, and Ireland is likely to follow suit. Heading into 2012, the company has agreed hedging positions for 75% of its raw material cost base, with exposure remaining for some PET requirements and for orange juice. This should mitigate some of the risk around earnings. An interesting development with Fruit Shoot in the US will help to diversify the company's geographic exposure.
On balance, group volumes are likely to remain challenged, while the pricing necessary to offset this year's input cost inflation as well as to recoup some of last year's may prove difficult to achieve. Pricing should prove especially difficult in the off-trade, where the major UK multiples appear committed to reducing prices.
Key themes for 2012
Further M&A activity likely
The biggest deal in 2011 was the acquisition of Australian brewer Fosters by the world's second-largest brewer, SABMiller, for AU$11.5bn (c.12.5x EV/EBITDA). This deal gives SABMiller more exposure to developed cash generative markets as well as a business with higher margins than the current group. Fosters had become an acquisition target since it spun off its wine business, Treasury Wine Estates, in early 2011.
Rumours of the deal to end all deals in the brewing space (the ABI acquisition of SABMiller) again resurfaced in 2011. While a potential deal could cost as much as $80bn, far exceeding the $52bn InBev paid for Anheuser Busch in 2008, it is not as unlikely as it may first appear. SABMiller has the greatest exposure of the international brewers to emerging markets, making it an attractive target. ABI also has a proven track record of integrating large deals successfully following the InBev Anheuser Busch merger in 2008 and the Interbrew and Ambev merger in 2004. While we concede that a deal may be possible in the future, we would caution that the recent acquisition of Fosters and the
Britvic's volumes are likely to remain challenged, while the pricing necessary to offset input cost inflation may prove difficult to achieve
Key themes for 2012
Further M&A activity likely
Fierce competition in emerging markets, especially for the brewers
Differentiation and innovation play increasingly important role
Trend towards premiumisation evident

Research Report: Davy on 2012 January 4, 2012
40 Davy Research
continued need of ABI to deleverage following the InBev deal will likely postpone any possible bid beyond 2012.
In 2011, Carlsberg continued its strategy of a number of smaller bolt-on transactions in its high-growth Asian division and will likely continue in this regard in 2012. With 2011 group earnings heavily exposed to difficult European markets, it remains important for the group to incrementally diversify away from this region to where opportunities exist.
The carving out of the former spirits business of Fortune Brands to create stand-alone entity Beam creates an attractive target in the spirits space. Diageo and Pernod Ricard, the industry's two largest players, both lack a US whiskey brand in their portfolios, while about one-third of Beam's sales come from bourbon through flagship brand Jim Beam and Maker's Mark.
In the spirits space, Diageo completed the acquisition of Turkish spirit company Mey Icki in 2011 for £1.3bn. According to Diageo, this doubles the group's exposure to European emerging markets and mitigates some of the exposure to tough trading conditions in eurozone markets.
Diageo remains the most likely spirits company in our coverage to pursue deals given the strength of its balance sheet relative to its main rival, Pernod, which appears committed to a strategy of deleveraging in order to maintain its recently acquired investment grade credit rating.
Other potential targets for Diageo could be the remaining 66% share of Möet Hennessey which it does not own, although LVMH does appear to be an unwilling seller for now. Another possibility could be the outright purchase of the world's largest Tequila brand, Jose Cuevo, for which Diageo has held the distribution rights for many years.
Remy Cointreau is another spirits company that is actively pursuing deals. At its interim results, it stated that it had a potential €500-€800m war chest with which to work. The company disposed of its champagne business in 2011 and now has a net debt/EBITDA margin of close to one. The company has stated that it is interested in all spirits categories excluding an additional cognac brand and a venture into a highly competitive vodka market.
Fierce competition in emerging markets, especially for the brewers
Results in the latter half of 2011 have underlined how reliant the bigger brewers are on their emerging market geographies to drive growth.
Bleak macro outlooks for the developed economies in Western Europe and America mean that cost rationalisation is the most likely road to growth in developed markets. In the emerging markets of Latin America, Africa, Asia and parts of Eastern Europe, we are seeing increasing competition as brewers begin to fight for every basis point of growth. It also appears that A&P is, in many instances, being
Carlsberg continued its strategy of a number of smaller bolt-on transactions in its high-growth Asian division
Diageo remains the most likely spirits company in our coverage to pursue deals given the strength of its balance sheet relative to its main rival, Pernod
Results in the latter half of 2011 have underlined how reliant the bigger brewers are on their emerging market geographies to drive growth

Research Report: Davy on 2012 January 4, 2012
41 Davy Research
diverted from traditional markets to areas with higher growth potential.
In the highly competitive Russian market, activation and promotion of lower-value economy brands have greatly increased in conjunction with recent tax increases. Carlsberg has blamed this activation for its recent loss of share in Russia and now intends to compete more intensely at this economy level.
Africa, in particular, looks to be becoming an important battleground: Diageo has recently placed increased pressure on SABMiller in Tanzania with the laying down of additional capacity through subsidiary East African Breweries; in Nigeria, SAB has laid down its own capacity in order to compete with Heineken and Diageo which currently dominate the market.
Differentiation and innovation play increasingly important role
Innovation has never been more important across the beverages space then it is today. Although economic conditions remain difficult in most developed markets, we are seeing numerous instances of consumers trading up for differentiated and innovative products.
Within the soft drinks market, Britvic's best performers are the stimulant and glucose ranges. Packaging innovation and clever marketing have helped Fruit Shoot to develop significant brand equity.
In the spirits space, we see constant innovation in efforts to grow share and value sales. Examples include limited edition offerings for some of the highest-end spirits such as cognac; in the more mainstream vodka, rum, tequila and scotch markets, exciting variants and flavours continue to drive growth. In addition, spirits makers are increasingly capitalising on popular culture to develop a perception of super-premium brand equity. Ciroc's remarkable performance in the premium vodka segment, buoyed by an association with music mogul Sean Combs, is the most obvious example.
Cider has greatly expanded its appeal by offering pear, berry and other fruit-flavoured variants to consumers. While in absolute terms apple remains the dominant cider, variants are growing at a much faster pace then traditional apple and therefore stimulating overall category growth. This is a trend we expect to continue heading into 2012.
In wider beer markets, the performance of differentiated craft beers in comparison with mass-produced generic products has been extraordinary. The Tenth and Blake craft beer division of MillerCoors (joint venture between SABMiller and Molson Coors) has significantly outperformed the traditional offerings of both companies. Brands such as Heineken and Budweiser have been in terminal decline in the US, while companies such as Boston Beer (the producer of craft brew Sam Adams) as well as a litany of small micro breweries have seen strong volume and value growth. This trend away from mass-produced beers towards differentiated quality brewed products is likely to continue.
Cider has greatly expanded its appeal by offering pear, berry and other fruit-flavoured variants to consumers

Research Report: Davy on 2012 January 4, 2012
42 Davy Research
The trend is far from exclusive to US markets, with the success of cask ales and craft breweries in the UK also remarkable.
• For 2012, we expect the ability to innovate successfully and to engage the consumer will be the keys to strong performance.
Trend towards premiumisation evident
• All these trends across the various categories point to a wider concept of affordable luxury for consumers in the current environment. Migration from the on-trade to the-off trade is continuing, while entertaining at home is increasingly prevalent.
• Although consumers are trading down in terms of channel, they are willing to spend extra on premium cider, craft beer or spirits. This is another trend that we expect to continue in 2012.
How key stocks are positioned for 2012
C&C and the spirits players are our top picks; continued headwinds for the brewers
• We believe that C&C continues to have some important catalysts for the year ahead and that the current valuation is very undemanding. The group's debt-free balance sheet and its financial flexibility for accretive M&A or for increasing the dividend in the absence of suitable deals are an important part of the story. The ongoing internationalisation of cider, the continued success of Tennent's and potential surprises such as Caledonia Best gaining share in the Scottish ale market are additional catalysts.
• For the spirits players, the trends of premiumisation and exposure to emerging markets are likely to continue into 2012. We also believe that the spirits consumers will cope better with the difficult economic conditions than their beer counterparts and that input costs will continue to be easier to manage for the spirits players versus the brewers.
• We see continued headwinds for the brewers, in particular for Heineken and Carlsberg. Heineken, the most exposed of the brewers to difficult European markets (c.40% of EBIT), is likely to see little profit growth in 2012. The company has flagged 2012 as a year of investment (primarily on its Global Business Services project and the funding of a step-up in needed marketing investment). Combined with higher input cost pressures, potentially negative operating leverage due to declining volumes in Europe, less incremental benefit from its cost savings programme and increasing competitive threats in key emerging markets, this leads us to retain our cautious stance on Heineken's prospects for 2012. Carlsberg’s challenges in its key Russian market for 2012 are significant, with little visibility on the regulatory environment and increasing competition a threat to its market share and the pricing environment.
• Although consumers are trading down in terms of channel, they are willing to spend extra on premium cider, craft beer or spirits

43 Davy Research
Research Report: Davy on 2012 January 4, 2012
S H A R E P R I C E A N D P E R F O R M A N C E Price 12 Month Mkt. Cap Change % (€) Rel to E300 sector % Pr/Bk Debt/EBITDA Local High Low €m Wk 1 Mth YTD Wk 1 Mth YTD 2011 2011 2012
I N G R E D I E N T S Kerry Group (KYG ID) 2829 3011 2367 4968 2.3 1.7 13.3 0.3 -2.9 8.5 2.62 1.6 1.1 Givaudan (GIVN VX) 89500 101500 70350 6804 2.1 6.7 -8.9 0.0 1.9 -12.7 2.35 1.5 1.2 IFF (IFF US) 5242 6524 5131 3273 -0.6 0.3 -2.7 -2.6 -4.3 -6.9 3.45 1.3 1.0 McCormick (MKC US) 5042 5100 4398 5163 0.9 7.5 11.8 -1.1 2.6 7.0 4.46 1.7 1.4 Sensient Tech (SXT US) 3790 3945 3092 1465 -0.6 4.2 6.5 -2.6 -0.6 1.9 N/A 1.3 1.0 Ingredients (6) 1950 1975 1685 24102 1.4 4.4 6.4 -0.6 -0.4 1.9 2.90 1.5 1.2
D A I R Y P R O C E S S I N G Donegal Creameries (DCP ID) 310 465 300 31 -7.4 -11.3 -22.4 -9.2 -15.4 -25.7 0.49 2.2 1.7 Glanbia (GLB ID) 463 502 355 1362 -0.5 -0.5 25.7 -2.5 -5.1 20.3 2.66 2.4 1.8 CHR Hansen (CHR DC) 12490 12600 10700 2320 1.9 6.9 9.7 -0.2 2.0 5.1 3.57 1.7 1.4 Dairy Crest (DCG LN) 336 416 319 537 1.6 4.3 -18.5 -0.4 -0.5 -21.9 1.16 2.5 2.4 Danone (BN FP) 4857 5272 4234 31470 2.6 -1.0 3.3 0.5 -5.5 -1.1 2.34 2.0 1.6 Dean Foods (DF US) 1120 1388 797 1588 0.9 14.4 30.7 -1.2 9.2 25.2 N/A 4.9 4.4 Koninklijke DSM (DSM NA) 3585 4682 3054 6504 1.1 -0.6 -15.9 -1.0 -5.1 -19.4 1.00 0.1 -0.1 Nestle SA (NESN VX) 5400 5485 4535 146708 2.2 6.8 1.4 0.1 1.9 -3.0 2.94 0.8 0.7 Parmalat SpA (PLT IM) 133 264 133 2334 -3.3 -11.9 -35.1 -5.2 -15.9 -37.9 0.65 -4.1 -4.4 Robert Wiseman (RWD LN) 257 357 233 218 4.8 8.4 -23.0 2.7 3.5 -26.3 1.07 0.3 0.2 Saputo (SAP CN) 3903 4802 3617 5919 1.0 6.4 -0.6 -1.0 1.5 -4.8 3.48 0.4 0.1 Dairy processing (15) 1922 2008 1715 202460 2.0 4.9 0.8 0.0 0.2 -3.5 2.54 1.0 0.8
F R U I T D I S T R I B U T I O N Fyffes (FFY ID) 36 44 34 107 0.6 -5.2 -2.6 -1.4 -9.5 -6.8 0.74 0.3 0.1 Total Produce (TOT ID) 37 46 35 122 -2.6 -3.9 -1.3 -4.6 -8.3 -5.5 0.69 1.2 0.9 Chiquita (CQB US) 834 1719 764 295 0.4 4.2 -38.6 -1.6 -0.6 -41.2 N/A N/A N/A FDP (FDP US) 2501 2858 2141 1115 1.0 3.5 3.4 -1.1 -1.3 -1.0 0.87 N/A N/A Fruit distribution (4) 4098 5043 3473 1639 0.5 2.3 -8.1 -1.5 -2.3 -12.0 0.84 0.2 0.1
S P E C I A L I T Y B A K I N G ARYZTA (YZA ID) 3749 3895 3132 3235 2.5 7.4 7.1 0.4 2.5 2.6 1.68 2.2 1.9 Canada Bread (CBY CN) 4344 4835 4150 835 2.1 0.0 -4.3 0.1 -4.6 -8.4 N/A N/A N/A CSM NV (CSM NA) 1208 2688 925 853 1.2 23.6 -53.9 -0.8 18.0 -55.9 0.74 3.1 2.8 Panera Bread (PNRA US) 14145 14338 9486 3238 1.8 2.4 44.2 -0.3 -2.3 38.1 6.12 -0.8 -1.2 Ralcorp Holdings (RAH US) 8550 9051 5940 3642 0.4 9.1 35.7 -1.7 4.2 29.9 1.64 2.6 2.2 Speciality baking (6) 6363 6494 5256 12146 1.4 6.3 10.7 -0.7 1.5 6.0 1.91 1.8 1.5
F O O D M A N U F A C T U R E R S Greencore Group (Stg) (GNC LN) 53 92 47 242 -0.1 -13.1 -38.5 -2.2 -17.1 -41.1 0.76 3.7 2.9 Associated British Foods (ABF LN) 1107 1164 940 10505 0.4 2.5 -3.7 -1.6 -2.2 -7.8 1.52 1.1 0.9 Cranswick (CWK LN) 742 882 589 424 1.4 5.2 -11.3 -0.6 0.4 -15.1 1.47 0.7 0.4 Premier Foods (PFD LN) 6 35 3 167 -1.9 1.7 -69.0 -3.9 -3.0 -70.4 0.14 3.9 3.5 UK food manufacturers (3) 949 1016 814 11097 0.6 2.6 -5.8 -1.5 -2.1 -9.8 1.32 1.5 1.3 ADM (ADM US) 2860 3765 2416 14747 -0.8 -1.5 -1.9 -2.8 -5.9 -6.1 0.99 2.4 2.4 Conagra Foods (CAG US) 2640 2662 2233 8447 0.0 8.5 20.6 -2.0 3.5 15.5 2.16 1.3 1.3 General Mills (GIS US) 4041 4066 3460 20108 0.4 5.0 17.2 -1.6 0.2 12.2 3.69 2.1 1.9 PZ Cussons (PZC LN) 350 404 309 1799 2.5 0.0 -10.2 0.5 -4.5 -14.1 2.57 -0.3 -0.6 Unilever NV (UNIA NA) 2657 2658 2100 91121 1.6 5.0 14.0 -0.4 0.3 9.2 4.64 1.0 0.8 Food manufacturers (10) 1431 1433 1165 153452 1.0 4.3 11.3 -1.1 -0.5 6.5 2.67 1.4 1.4
A G R I B U S I N E S S A N D P R I M A R Y P R O D U C E R S Continental Farmers Group (CFGP ID) 28 36 26 46 0.0 0.0 N/A -2.0 -4.6 N/A 0.65 -0.5 0.3 Origin Enterprises (OGN ID) 305 400 295 406 1.7 -4.1 -4.7 -0.4 -8.5 -8.7 1.86 1.3 0.9 Austevoll (AUSS NO) 2100 4850 1870 550 1.2 -2.1 -57.5 -0.8 -6.5 -59.3 0.64 1.4 1.9 Carrs Milling (CRM LN) 790 875 626 83 -3.8 6.2 28.6 -5.8 1.4 23.1 1.23 -0.3 -0.3 K+S (SDF GY) 3492 5860 3335 6684 -0.9 -13.3 -38.0 -2.9 -17.3 -40.7 2.21 -0.0 0.0 Nutreco (NUO NA) 5084 5577 4192 1785 2.5 4.6 -10.5 0.4 -0.2 -14.3 2.00 0.8 0.3 Agribusiness (10) 2359 2913 2080 31089 1.3 -0.6 -12.4 -0.7 -5.1 -16.1 2.59 0.4 0.3
S W E E T E N E R S Associated British Foods (ABF LN) 1107 1164 940 10505 0.4 2.5 -3.7 -1.6 -2.2 -7.8 1.52 1.1 0.9 ADM (ADM US) 2860 3765 2416 14747 -0.8 -1.5 -1.9 -2.8 -5.9 -6.1 0.99 2.4 2.4 Agrana Beteiligungs (AGR AV) 8000 8643 7230 1136 0.1 8.8 2.5 -1.9 3.9 -1.9 1.16 1.7 1.2 Corn Products (CPO US) 5259 5936 3774 3077 0.5 5.0 18.0 -1.6 0.2 12.9 1.73 1.8 1.2 Illovo Sugar (ILV SJ) 2455 2862 2265 1080 1.5 0.6 -24.8 -0.5 -4.0 -28.0 2.07 0.2 0.1 Südzucker (SZU GY) 2465 2611 1861 4668 0.1 4.5 23.7 -2.0 -0.3 18.5 1.38 0.8 0.7 Tate & Lyle (TATE LN) 705 705 520 3940 2.2 7.5 39.8 0.2 2.6 33.8 2.94 1.1 0.7 Tongaat Hulett (TON SJ) 10100 10980 8715 1015 2.3 8.4 -21.4 0.2 3.4 -24.7 1.97 1.9 1.6 Sweeteners (8) 2031 2111 1701 40168 0.2 2.1 3.3 -1.8 -2.6 -1.1 1.33 1.7 1.5 FTSE E300 Food Producers (E3FOOD) 1725 1725 1465 2.1 4.8 4.4

44 Davy Research
Research Report: Davy on 2012 January 4, 2012
V A L U A T I O N EPS (c) EPS Gth % Div Yield % Div Cover EV/EBITDA P/E 2011 2012 2013 11-13 2011 2012 2011 2011 2012 2013 2011 2012 2013
I N G R E D I E N T S Kerry Group (KYG ID) 212 228 244 15.1 1.1 1.2 7.0 9.6 8.5 7.6 13.4 12.4 11.6 Givaudan (GIVN VX) 4600 5430 6070 31.9 2.5 2.8 2.1 12.5 10.8 9.9 19.5 16.5 14.7 IFF (IFF US) 370 410 435 17.6 2.2 2.5 3.2 9.0 8.2 7.4 14.2 12.8 12.1 McCormick (MKC US) 278 310 338 21.6 2.2 2.4 2.5 11.9 10.6 10.2 18.1 16.3 14.9 Sensient Tech (SXT US) 240 255 256 6.7 2.2 2.3 2.9 9.2 8.5 8.1 15.8 14.9 14.8 Ingredients (6) 2.1 2.4 2.9 10.5 9.4 8.7 16.3 14.6 13.5
D A I R Y P R O C E S S I N G Donegal Creameries (DCP ID) 59 73 74 26.3 5.2 5.2 3.7 0.5 N/A N/A 5.3 4.3 4.2 Glanbia (GLB ID) 43 46 47 8.4 1.6 1.7 5.9 8.7 7.8 7.2 10.7 10.1 9.9 CHR Hansen (CHR DC) 625 666 757 21.0 0.0 0.0 175.1 13.2 11.8 10.5 20.0 18.7 16.5 Dairy Crest (DCG LN) 49 50 52 6.1 6.1 6.3 2.4 5.6 5.4 5.1 6.9 6.7 6.5 Danone (BN FP) 293 323 358 21.9 2.9 3.1 2.1 11.1 10.1 9.2 16.6 15.0 13.6 Dean Foods (DF US) 73 90 113 55.9 0.0 0.0 N/A 7.6 6.9 6.3 15.4 12.5 9.9 Koninklijke DSM (DSM NA) 367 331 372 1.4 3.9 4.0 2.6 5.1 5.2 4.9 9.8 10.8 9.6 Nestle SA (NESN VX) 305 328 358 17.4 3.6 3.8 1.6 12.0 11.1 10.3 17.7 16.4 15.1 Parmalat SpA (PLT IM) 10 10 11 10.6 3.7 3.8 2.0 2.2 1.9 1.7 13.4 13.1 12.1 Robert Wiseman (RWD LN) 22 24 26 19.9 7.0 7.0 1.2 3.9 3.7 3.6 11.9 10.6 9.9 Saputo (SAP CN) 246 270 303 23.2 0.0 0.0 N/A 9.6 8.9 8.4 15.9 14.5 12.9 Dairy processing (15) 3.4 3.6 1.8 10.8 10.0 9.3 16.7 15.6 14.2
F R U I T D I S T R I B U T I O N Fyffes (FFY ID) 6 6 6 3.3 5.2 5.8 3.1 2.9 2.8 2.5 6.1 6.0 5.9 Total Produce (TOT ID) 7 8 8 9.3 4.8 5.0 4.0 3.7 3.3 3.0 5.2 4.9 4.8 Chiquita (CQB US) 84 100 112 34.1 0.0 0.0 N/A 2.6 2.4 2.3 10.0 8.3 7.4 FDP (FDP US) 215 248 269 25.1 0.8 0.8 10.8 6.0 5.4 5.2 11.6 10.1 9.3 Fruit distribution (4) 1.5 1.6 8.2 4.5 4.1 3.9 9.8 8.7 8.1
S P E C I A L I T Y B A K I N G ARYZTA (YZA ID) 310 338 364 17.5 0.8 0.9 9.9 9.2 8.8 8.1 12.1 11.1 10.3 Canada Bread (CBY CN) 316 345 407 28.8 0.0 0.0 N/A 6.9 6.2 5.4 13.7 12.6 10.7 CSM NV (CSM NA) 104 120 159 52.8 7.6 8.0 1.1 7.2 6.6 5.4 11.6 10.1 7.6 Panera Bread (PNRA US) 465 547 646 38.9 0.0 0.0 N/A 13.0 10.8 9.6 30.4 25.9 21.9 Ralcorp Holdings (RAH US) 522 592 638 22.2 0.0 0.0 N/A 8.5 7.5 7.0 16.4 14.4 13.4 Speciality baking (6) 2.3 2.4 8.1 9.0 8.0 7.3 16.2 14.5 12.8
F O O D M A N U F A C T U R E R S Greencore Group (Stg) (GNC LN) 10 11 12 18.5 10.3 8.1 1.9 6.7 5.1 4.5 5.0 4.9 4.3 Associated British Foods (ABF LN) 74 86 89 20.5 2.2 2.3 3.0 8.4 7.6 7.4 15.0 12.8 12.4 Cranswick (CWK LN) 64 72 77 20.3 3.8 4.1 2.3 7.0 6.3 5.6 11.6 10.3 9.6 Premier Foods (PFD LN) 2 3 4 63.1 0.0 0.0 N/A 4.4 4.1 4.0 2.4 1.7 1.5 UK food manufacturers (3) 2.3 2.4 3.2 7.6 6.9 6.6 13.7 11.6 11.1 ADM (ADM US) 305 297 328 7.5 2.1 2.3 5.0 7.1 7.3 7.0 9.4 9.6 8.7 Conagra Foods (CAG US) 180 195 210 16.7 3.6 3.9 1.9 7.8 7.5 7.3 14.7 13.5 12.6 General Mills (GIS US) 261 283 305 16.7 3.0 3.3 2.1 9.8 9.2 8.7 15.5 14.3 13.3 PZ Cussons (PZC LN) 16 18 21 30.5 2.1 2.3 2.2 11.1 9.6 8.4 21.5 19.0 16.5 Unilever NV (UNIA NA) 155 170 183 18.1 3.3 3.5 1.7 12.4 11.6 10.9 17.1 15.6 14.5 Food manufacturers (10) 3.0 3.0 2.2 9.8 9.8 9.2 15.0 15.0 13.8
A G R I B U S I N E S S A N D P R I M A R Y P R O D U C E R S Continental Farmers Group (CFGP ID) 2 3 4 85.7 0.0 0.0 N/A 6.5 5.5 4.9 12.6 9.1 6.8 Origin Enterprises (OGN ID) 40 44 47 16.6 3.1 3.3 4.3 5.1 4.7 4.3 7.6 6.9 6.5 Austevoll (AUSS NO) 439 290 331 -24.6 5.8 5.5 3.6 3.4 4.8 3.6 4.8 7.3 6.3 Carrs Milling (CRM LN) 80 88 91 14.5 3.2 3.4 3.1 4.6 4.4 4.1 9.9 9.0 8.6 K+S (SDF GY) 355 401 433 22.0 4.3 4.9 2.4 5.5 5.0 4.8 9.8 8.7 8.1 Nutreco (NUO NA) 439 478 520 18.5 3.5 3.9 2.5 6.9 6.0 5.6 11.6 10.6 9.8 Agribusiness (10) 3.2 3.5 2.5 7.9 7.2 6.6 12.9 11.6 10.8
S W E E T E N E R S Associated British Foods (ABF LN) 74 86 89 20.5 2.2 2.3 3.0 8.4 7.6 7.4 15.0 12.8 12.4 ADM (ADM US) 305 297 328 7.5 2.1 2.3 5.0 7.1 7.3 7.0 9.4 9.6 8.7 Agrana Beteiligungs (AGR AV) 763 646 692 -9.3 3.6 3.6 2.6 6.2 5.6 5.9 10.5 12.4 11.6 Corn Products (CPO US) 470 510 549 16.8 1.2 1.2 7.6 6.5 5.7 5.4 11.2 10.3 9.6 Illovo Sugar (ILV SJ) 114 223 261 129.0 2.6 3.5 1.8 7.4 5.5 5.3 21.6 11.0 9.4 Südzucker (SZU GY) 190 184 174 -8.8 2.8 3.0 2.7 6.7 7.0 7.2 12.9 13.4 14.2 Tate & Lyle (TATE LN) 54 55 58 8.1 3.5 3.6 2.2 8.4 7.9 7.3 13.0 12.7 12.0 Tongaat Hulett (TON SJ) 763 1013 1230 61.2 2.9 3.9 2.6 7.1 6.1 5.0 13.2 10.0 8.2 Sweeteners (8) 2.4 2.5 3.6 7.1 6.8 6.6 11.6 11.2 10.4
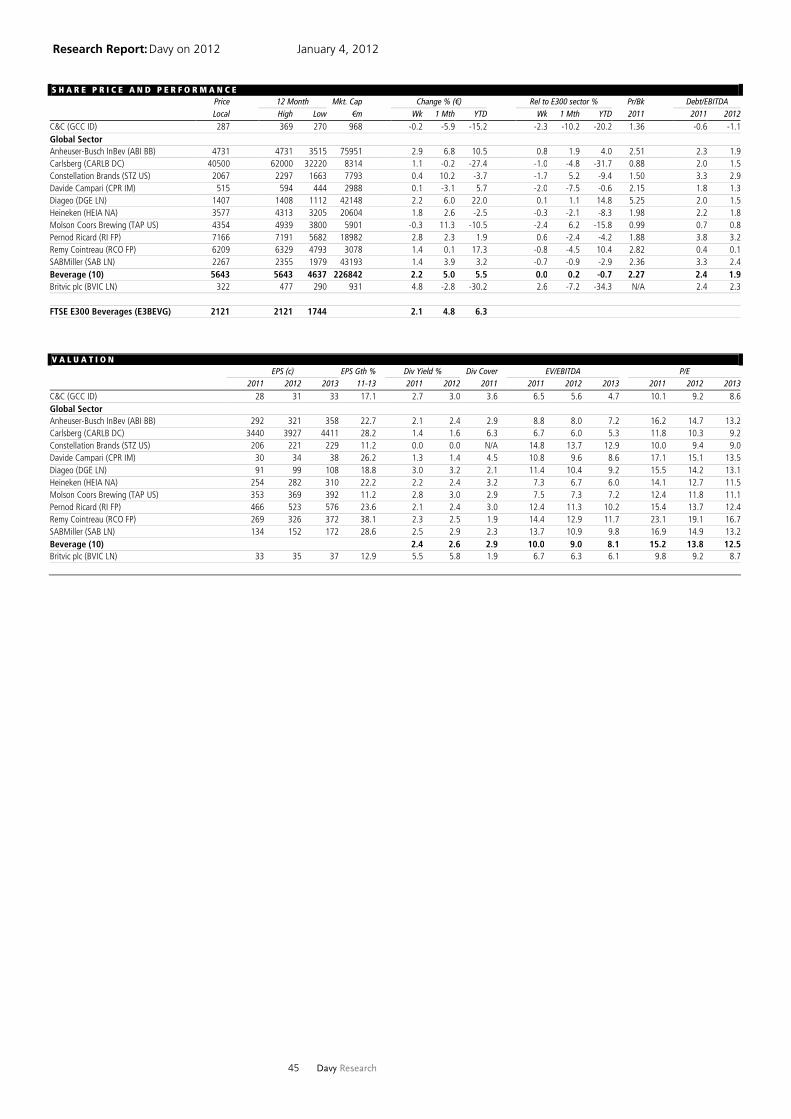
45 Davy Research
Research Report: Davy on 2012 January 4, 2012 S H A R E P R I C E A N D P E R F O R M A N C E Price 12 Month Mkt. Cap Change % (€) Rel to E300 sector % Pr/Bk Debt/EBITDA Local High Low €m Wk 1 Mth YTD Wk 1 Mth YTD 2011 2011 2012
C&C (GCC ID) 287 369 270 968 -0.2 -5.9 -15.2 -2.3 -10.2 -20.2 1.36 -0.6 -1.1 Global Sector Anheuser-Busch InBev (ABI BB) 4731 4731 3515 75951 2.9 6.8 10.5 0.8 1.9 4.0 2.51 2.3 1.9 Carlsberg (CARLB DC) 40500 62000 32220 8314 1.1 -0.2 -27.4 -1.0 -4.8 -31.7 0.88 2.0 1.5 Constellation Brands (STZ US) 2067 2297 1663 7793 0.4 10.2 -3.7 -1.7 5.2 -9.4 1.50 3.3 2.9 Davide Campari (CPR IM) 515 594 444 2988 0.1 -3.1 5.7 -2.0 -7.5 -0.6 2.15 1.8 1.3 Diageo (DGE LN) 1407 1408 1112 42148 2.2 6.0 22.0 0.1 1.1 14.8 5.25 2.0 1.5 Heineken (HEIA NA) 3577 4313 3205 20604 1.8 2.6 -2.5 -0.3 -2.1 -8.3 1.98 2.2 1.8 Molson Coors Brewing (TAP US) 4354 4939 3800 5901 -0.3 11.3 -10.5 -2.4 6.2 -15.8 0.99 0.7 0.8 Pernod Ricard (RI FP) 7166 7191 5682 18982 2.8 2.3 1.9 0.6 -2.4 -4.2 1.88 3.8 3.2 Remy Cointreau (RCO FP) 6209 6329 4793 3078 1.4 0.1 17.3 -0.8 -4.5 10.4 2.82 0.4 0.1 SABMiller (SAB LN) 2267 2355 1979 43193 1.4 3.9 3.2 -0.7 -0.9 -2.9 2.36 3.3 2.4 Beverage (10) 5643 5643 4637 226842 2.2 5.0 5.5 0.0 0.2 -0.7 2.27 2.4 1.9 Britvic plc (BVIC LN) 322 477 290 931 4.8 -2.8 -30.2 2.6 -7.2 -34.3 N/A 2.4 2.3 FTSE E300 Beverages (E3BEVG) 2121 2121 1744 2.1 4.8 6.3
V A L U A T I O N EPS (c) EPS Gth % Div Yield % Div Cover EV/EBITDA P/E 2011 2012 2013 11-13 2011 2012 2011 2011 2012 2013 2011 2012 2013
C&C (GCC ID) 28 31 33 17.1 2.7 3.0 3.6 6.5 5.6 4.7 10.1 9.2 8.6 Global Sector Anheuser-Busch InBev (ABI BB) 292 321 358 22.7 2.1 2.4 2.9 8.8 8.0 7.2 16.2 14.7 13.2 Carlsberg (CARLB DC) 3440 3927 4411 28.2 1.4 1.6 6.3 6.7 6.0 5.3 11.8 10.3 9.2 Constellation Brands (STZ US) 206 221 229 11.2 0.0 0.0 N/A 14.8 13.7 12.9 10.0 9.4 9.0 Davide Campari (CPR IM) 30 34 38 26.2 1.3 1.4 4.5 10.8 9.6 8.6 17.1 15.1 13.5 Diageo (DGE LN) 91 99 108 18.8 3.0 3.2 2.1 11.4 10.4 9.2 15.5 14.2 13.1 Heineken (HEIA NA) 254 282 310 22.2 2.2 2.4 3.2 7.3 6.7 6.0 14.1 12.7 11.5 Molson Coors Brewing (TAP US) 353 369 392 11.2 2.8 3.0 2.9 7.5 7.3 7.2 12.4 11.8 11.1 Pernod Ricard (RI FP) 466 523 576 23.6 2.1 2.4 3.0 12.4 11.3 10.2 15.4 13.7 12.4 Remy Cointreau (RCO FP) 269 326 372 38.1 2.3 2.5 1.9 14.4 12.9 11.7 23.1 19.1 16.7 SABMiller (SAB LN) 134 152 172 28.6 2.5 2.9 2.3 13.7 10.9 9.8 16.9 14.9 13.2 Beverage (10) 2.4 2.6 2.9 10.0 9.0 8.1 15.2 13.8 12.5 Britvic plc (BVIC LN) 33 35 37 12.9 5.5 5.8 1.9 6.7 6.3 6.1 9.8 9.2 8.7

Research Report: Davy on 2012 January 4, 2012
46 Davy Research
Pharmaceuticals and healthcare Sector performance in 2011
Pharma and healthcare-related sectors outperformed broader equity markets in 2011. Furthermore, modest absolute appreciation was evident in some segments, a rare occurrence in a market context.
In the US, the biotech sector outperformed its pharma counterpart. Healthcare service and equipment segments were also ahead yoy.
As ever, the performance of the Irish companies was driven by specific product or earnings performance. Elan was the winner as Tysabri grew and EDT was sold. ICON suffered as a result of margin pressure.
Table 4: 2011 performance
Stock/Sector Price 12-month high 12-month low % chg 2011
Elan ($) 13.74 13.85 5.83 +147.4
United Drug (c) 205 246 186 -2.4
ICON ($) 17.11 25.92 15.12 -19.4
Trinity Biotech ($) 10.18 10.85 8.3 +19.2
AGI (c) 5 7 3 +111.4
E300 Healthcare 1171.1 +12.9
SPX Healthcare 337.6 +13.4
Source: Davy
Key themes for 2012 End of the age of the blockbuster; biotech the driver of growth
2012 will mark the first full year of generic competition for Lipitor, the world's biggest drug. It is unlikely that we will see a primary care product of such scale for some time.
Instead, the research and commercial emphasis has switched towards specialist, personalised medicines – most of which are biologically-derived. For the investor, mid- and late-stage biotechs provide exposure to organic growth potential and the prospect of ultimate partnering/acquisition by the cash-rich, legacy pharma sector.
Budgetary crises to the forefront
National budgetary crises have placed healthcare spending in the spotlight, especially where sovereigns are the main payers (e.g. EU).
Further generic penetration and more intense scrutiny of branded products for cost-effectiveness are expected.
Further cost pressures; outsourcing will continue to grow
The industry has responded to top-line threats by expanding into consumer/OTC, emerging markets and adjacent categories (specialist food, cosmetics). This trend will continue.
From a costs perspective, outsourcing remains an attractive option and will be increasingly used across all aspects of operations (R&D, manufacturing, supply chain, marketing).
Jack Gorman [email protected] Aiden O'Donnell [email protected]
Key themes for 2012 End of the age of the blockbuster;
biotech the driver of growth
Budgetary crises to the forefront
Further cost pressures; outsourcing will continue to grow
National budgetary crises have placed healthcare spending in the spotlight
The industry has responded to top-line threats by expanding into consumer/OTC, emerging markets and adjacent categories (specialist food, cosmetics)

Research Report: Davy on 2012 January 4, 2012
47 Davy Research
How key stocks are positioned for 2012
Elan – pipeline to the forefront once again
Elan's pipeline will once again come to the forefront in 2012. Phase III data on Bapineuzumab, the Alzheimer's Disease compound that is being developed by Pfizer/Johnson & Johnson but is 25% owned by Elan, are anticipated around mid-year. The recent $11bn Gilead/Pharmasset deal indicates the lengths and valuations that buyers will go to in order to secure real innovation. To the extent that more trial work may be required on the product beyond this, biomarkers may tell us if this is justified. But there is little or no suspense built into the share price today in our view.
Tysabri sentiment will centre on securing share of the JCV-negative population in the US and managing potential choppiness in Europe as patients become aware of their status. Noise regarding other competing Multiple Sclerosis pipeline products such as BG-12 and Lemtrada is also expected.
Progress is also likely in Elan's other internal and external investments. Alkermes Plc is forecast to grow strongly in 2012 and has several important pipeline read-outs. There may also be progress in Elan's internal discovery vehicles such as Neotope.
United Drug – EPS growth anticipated in 2012
A return to EPS growth, for the first time since 2008, is anticipated in 2012. Barring any major structural change that United Drug (UDG) can exploit, Irish operations' share of group EBITA will fall again to well below 35%. This will be achieved by a combination of organic growth ex-Ireland and acquisitions.
The key to a significant re-rating will be growth acceleration at group level, something we believe is achievable. Sharp Corp, the subject of contract delays in 2008/2009, has since recovered strongly. ROIC/WACC spread has remained solid over the last decade. There are many opportunities available to build further scale in the business.
The outsourcing opportunity is clearly available to UDG and has already been demonstrated in areas like UK contract sales. Scale remains a priority so that this potential can now be exploited and thus desensitise UDG to Irish regulatory risk. Current valuations factor in very little of the earnings or rating upside that this strategic evolution will ultimately provide.
ICON – operational execution is vital
This time last year we said that stock performance would be shaped by how ICON managed its margin amidst strategic partnership development and slower backlog conversion. In the event, 2011 was a year of indigestion for ICON – best exemplified by the upfront costs and timeline issues associated with the Pfizer partnership.
Tysabri sentiment will centre on securing share of the JCV-negative population in the US and managing potential choppiness in Europe as patients become aware of their status
The key to a significant re-rating will be growth acceleration at group level, something we believe is achievable

Research Report: Davy on 2012 January 4, 2012
48 Davy Research
2012 should be a better year. We expect margins to recover towards double-digit levels, albeit weighted towards H2. Delivering margin recovery is vital for a re-rating. In the meantime, the share buyback will be supportive.
Externally, the outlook for the CRO sector remains positive. We believe that ICON will remain among the top-tier players once the industry wave of strategic partnerships is completed. Delivering on internal margin targets will be one success; another will be to secure its fair share of the ongoing shift towards deeper CRO-client relationships.
Trinity Biotech – good pipeline for 2012
Trinity Biotech had a very strong 2011. It initiated a share buyback programme and paid a dividend for the first time. Momentum gained as the year progressed and, despite the divesture of Stago, earnings increased yoy.
It has launched its new A1c instrument in Europe, and early signals are that it is performing in line with expectations. Trinity Biotech also has a good pipeline of point-of-care products that it hopes to roll out in 2012.
We expect ICON's margins to recover towards double-digit levels, albeit weighed towards H2
We believe that ICON will remain among the top-tier players once the industry wave of strategic partnerships is completed

49 Davy Research
Research Report: Davy on 2012 January 4, 2012
S H A R E P R I C E A N D P E R F O R M A N C E Price 12 Month Mkt. Cap Change % (€) Rel to S&P 500 sector % Pr/Bk Debt/EBITDA Local High Low €m Wk 1 Mth YTD Wk 1 Mth YTD 2011 2011 2012
U S B I O T E C H Elan Corp (USc) (ELN US) 1374 1385 593 6228 6.6 31.8 147.4 6.1 21.7 112.8 9.37 1.2 0.7 Alkermes (ALKS US) 1736 1952 1214 1736 -0.4 17.8 45.9 -0.9 8.8 25.5 6.67 5.2 1.0 Amgen (AMGN US) 6421 6474 4827 43445 1.6 15.1 20.7 1.1 6.3 3.8 2.63 -0.7 -0.9 Biogen Idec (BIIB US) 11005 11872 6508 20635 0.1 -0.6 69.3 -0.4 -8.3 45.7 4.50 -0.1 -0.6 Gilead Sciences (GILD US) 4093 4321 3534 23731 5.0 6.6 16.5 4.5 -1.6 0.2 4.40 -0.1 0.2 US biotech (5) 3581 3594 2567 95776 2.3 10.0 31.8 1.8 1.6 13.4 3.49 -0.3 -0.5
U S L A R G E C A P Bristol Myers Squibb (BMY US) 3524 3529 2497 46094 1.2 11.8 37.3 0.7 3.2 18.1 N/A N/A N/ALilly (Eli) (LLY US) 4156 4175 3363 37141 0.6 14.0 22.4 0.1 5.2 5.3 3.10 -0.2 -0.5 Johnson & Johnson (JNJ US) 6558 6792 5766 138239 0.2 5.2 9.4 -0.3 -2.9 -5.9 2.84 -0.7 -0.9 Merck & Co. (MRK US) 3770 3790 2981 88697 0.3 9.5 7.9 -0.3 1.1 -7.2 2.09 -0.0 -0.4 Pfizer (PFE US) 2164 2183 1666 128403 -0.1 11.9 27.5 -0.6 3.3 9.7 1.80 0.2 -0.1 US large cap (6) 654 655 497 506190 0.3 9.0 18.2 -0.2 0.6 1.7 2.43 -0.0 -0.3
E U R O P E A N P H A R M A AstraZeneca (AZN LN) 2975 3194 2544 46138 0.8 3.9 4.6 0.3 -4.1 -10.0 2.42 -0.3 -0.4 GlaxoSmithKline (GSK LN) 1472 1474 1128 89027 1.2 7.6 22.0 0.7 -0.7 4.9 8.50 0.9 0.8 Merck KGAA (MRK GF) 7711 7848 5689 16762 0.4 5.0 28.0 -0.1 -3.1 10.1 1.57 1.5 0.9 Novartis (NOVN VX) 5370 5580 3999 121384 1.4 10.4 0.4 0.9 1.9 -13.6 1.96 0.8 0.5 Roche (Sws) (ROG VX) 15920 15970 11700 134997 1.7 11.0 19.4 1.2 2.5 2.7 9.67 0.8 0.5 Sanofi-Aventis (SAN FP) 5675 5675 4419 76067 2.4 9.0 18.6 1.9 0.6 2.0 1.37 0.9 0.7 Shire Pharma (SHP LN) 2243 2243 1561 15123 2.7 8.0 49.4 2.1 -0.3 28.5 6.52 0.3 -0.4 European pharma (13) 1023 1023 852 605934 1.7 8.1 11.6 1.2 -0.2 -4.0 2.98 0.7 0.4
S M A L L C A P S P E C I A L I T Y P H A R M A AGI Therapeutics (USc) (AGI ID) 7 10 3 4 0.5 1.8 111.4 0.0 -6.0 81.8 0.69 N/A N/AMerrion Pharmaceuticals (MERR ID) 21 270 15 4 13.9 -6.8 -92.4 13.3 -14.0 -93.5 Salix Pharmaceuticals (SLXP US) 4785 4785 2618 2184 1.0 12.5 5.1 0.4 3.9 -9.6 5.69 -1.2 -1.2 Vectura Group (VEC LN) 56 104 53 223 1.5 -4.2 -17.4 1.0 -11.5 -29.0 1.21 N/A N/ASmall cap speciality pharma (12) 626 684 451 3357 0.7 7.9 -5.3 0.2 -0.4 -18.5 3.43 -1.5 -1.6
S U P P L Y C H A I N A N D D I S T R I B U T I O N United Drug (UDG ID) 205 246 186 489 2.5 6.4 -2.4 2.0 -1.7 -16.0 1.30 1.5 1.2 Arseus (RCUS BB) 1103 1289 910 344 4.6 8.1 -3.1 4.0 -0.2 -16.6 1.47 3.0 2.4 Celesio (CLS1 GY) 1224 2005 929 2082 -1.3 3.3 -34.2 -1.7 -4.6 -43.4 0.82 3.0 2.7 Mediq (MEDIQ NA) 1177 1481 1088 712 2.1 2.7 -16.0 1.6 -5.2 -27.7 1.24 1.4 1.0 Oriola (OKDBV FH) 172 369 158 260 3.0 -18.5 -46.1 2.5 -24.7 -53.6 0.86 0.8 0.4 Pharma wholesaling (8) 902 1325 767 4046 0.8 1.6 -29.0 0.3 -6.2 -39.0 0.91 2.6 2.2 Capita Group (CPI LN) 629 787 612 4622 0.4 2.4 -7.3 -0.1 -5.5 -20.2 6.23 2.3 1.8 Supply chain services (4) 647 669 544 19975 3.2 4.5 0.2 2.6 -3.5 -13.9 3.96 1.2 0.8 Owens & Minor (OMI UN) 2779 3548 2667 1361 -0.4 -6.4 -2.6 -0.9 -13.5 -16.2 1.87 0.1 -0.0 Thermo Fisher (TMO UN) 4497 6557 4354 13131 -0.8 -1.2 -16.2 -1.3 -8.8 -27.9 1.11 2.5 1.9 Medical & scientific (5) 3472 3545 2780 34700 0.4 4.7 15.5 -0.1 -3.3 -0.7 2.15 1.2 0.7 Amedisys (AMED UW) 1091 3808 959 248 0.8 -4.6 -66.4 0.3 -11.9 -71.1 0.60 0.8 1.0 Contract sales/mkting (4) 539 1146 474 593 2.0 0.9 -43.7 1.5 -6.9 -51.6 0.60 -0.4 -0.4
C R O ICON (USc) (ICLR US) 1711 2592 1512 779 2.3 4.4 -19.4 1.8 -3.6 -30.7 1.47 -2.4 -1.6 Charles River Labs (CRL US) 2733 4247 2595 1043 1.1 0.1 -20.7 0.6 -7.6 -31.8 2.46 2.4 1.9 Covance (CVD US) 4572 6323 4343 2144 -1.6 3.4 -8.3 -2.1 -4.6 -21.1 1.88 -1.1 -1.5 Parexel (PRXL US) 2074 2776 1569 947 1.3 7.4 0.8 0.8 -0.9 -13.3 2.19 1.0 0.3 CRO (4) 1920 2078 1580 4914 0.0 3.9 0.3 -0.5 -4.1 -13.7 1.94 0.3 -0.2
D I A G N O S T I C S Trinity Biotech (USc) (TRIB US) 1018 1085 830 167 0.1 5.9 19.2 -0.4 -2.3 2.5 1.42 -3.6 -4.3 Orasure (OSUR US) 911 999 607 332 0.2 -0.5 63.5 -0.3 -8.1 40.6 N/A N/A N/ASmall cap diagnostics (8) 1656 2157 1620 3764 -0.3 -5.5 -14.4 -0.7 -12.7 -26.4 2.23 0.1 -0.1 S&P 500 Pharma, Bio & Life Sc (S5PHRM) 380 382 319 0.5 8.3 16.3

50 Davy Research
Research Report: Davy on 2012 January 4, 2012
V A L U A T I O N EPS (c) EPS Gth % EV/Sales EV/EBITDA P/E 2011 2012 2013 11-13 2011 2012 2013 2011 2012 2013 2011 2012 2013
U S B I O T E C H Elan Corp (USc) (ELN US) 6 12 27 353.1 6.1 6.0 5.0 41.2 41.5 28.8 N/A N/A 50.8 Alkermes (ALKS US) 45 77 130 187.8 6.5 4.6 4.0 86.5 24.0 17.8 38.6 22.5 13.4 Amgen (AMGN US) 532 575 640 20.3 3.3 3.1 2.9 7.9 7.5 6.9 12.1 11.2 10.0 Biogen Idec (BIIB US) 589 637 715 21.4 5.3 4.8 4.2 11.3 10.6 9.2 18.7 17.3 15.4 Gilead Sciences (GILD US) 393 422 472 20.2 3.6 3.5 3.2 6.8 6.6 6.0 10.4 9.7 8.7 US biotech (5) 3.9 3.7 3.3 8.8 8.3 7.5 13.6 12.5 11.1
U S L A R G E C A P Bristol Myers Squibb (BMY US) 230 204 197 -14.3 2.7 3.1 3.2 7.4 10.1 10.9 15.3 17.3 17.9 Lilly (Eli) (LLY US) 435 353 406 -6.7 1.9 2.0 1.8 6.2 6.9 6.1 9.6 11.8 10.2 Johnson & Johnson (JNJ US) 507 540 586 15.6 2.5 2.3 2.1 8.2 7.4 6.5 12.9 12.1 11.2 Merck & Co. (MRK US) 375 375 384 2.4 2.4 2.3 2.1 5.5 5.7 5.5 10.1 10.1 9.8 Pfizer (PFE US) 228 231 238 4.4 2.6 2.6 2.5 5.1 5.2 5.2 9.5 9.4 9.1 US large cap (6) 2.5 2.4 2.2 6.4 6.5 6.1 11.1 11.1 10.5
E U R O P E A N P H A R M A AstraZeneca (AZN LN) 471 393 404 -14.3 1.7 1.8 1.8 3.6 4.3 4.3 6.3 7.6 7.4 GlaxoSmithKline (GSK LN) 114 124 136 18.9 3.0 2.9 2.8 8.4 7.8 7.3 12.9 11.9 10.9 Merck KGAA (MRK GF) 707 738 789 11.5 2.0 1.8 1.7 8.1 7.1 6.5 10.9 10.4 9.8 Novartis (NOVN VX) 524 544 562 7.3 2.9 2.8 2.7 9.9 9.2 8.9 10.3 9.9 9.6 Roche (Sws) (ROG VX) 1251 1388 1532 22.5 4.2 3.9 3.6 10.5 9.3 8.4 12.7 11.5 10.4 Sanofi-Aventis (SAN FP) 665 594 613 -7.8 2.6 2.4 2.3 6.9 7.0 6.3 8.5 9.6 9.3 Shire Pharma (SHP LN) 112 130 145 29.4 4.7 4.0 3.4 13.8 11.1 9.2 20.0 17.2 15.5 European pharma (13) 2.8 2.7 2.5 8.3 8.0 7.4 11.0 10.9 10.2
S M A L L C A P S P E C I A L I T Y P H A R M A AGI Therapeutics (USc) (AGI ID) -5 -5 -5 N/A N/A N/A N/A 0.7 N/A N/A N/A N/A N/A Merrion Pharmaceuticals (MERR ID) Salix Pharmaceuticals (SLXP US) 252 267 360 43.0 4.9 3.6 2.8 14.4 9.4 6.5 19.0 17.9 13.3 Vectura Group (VEC LN) -3 -3 2 N/A 3.7 3.4 1.8 N/A N/A 5.1 N/A N/A 35.6 Small cap speciality pharma (12) 4.3 3.4 2.5 18.2 16.1 8.9 21.1 17.7 12.6
S U P P L Y C H A I N A N D D I S T R I B U T I O N United Drug (UDG ID) 23 24 25 8.6 0.3 0.3 0.3 6.7 6.3 5.8 9.0 8.6 8.3 Arseus (RCUS BB) 114 133 156 36.9 1.1 1.0 0.9 8.2 6.9 5.9 9.7 8.3 7.1 Celesio (CLS1 GY) 121 133 154 26.9 0.2 0.2 0.1 6.6 6.1 5.4 10.1 9.2 8.0 Mediq (MEDIQ NA) 140 159 164 17.5 0.3 0.3 0.3 6.2 5.2 4.7 8.4 7.4 7.2 Oriola (OKDBV FH) 7 17 24 219.7 0.1 0.1 0.1 10.0 5.4 4.0 23.1 10.1 7.2 Pharma wholesaling (8) 0.2 0.2 0.2 6.8 5.9 5.2 9.8 8.6 7.5 Capita Group (CPI LN) 48 53 58 21.2 1.7 1.5 1.3 10.0 8.8 8.0 13.2 11.9 10.9 Supply chain services (4) 1.3 1.1 1.0 9.6 8.4 7.4 15.2 13.7 12.4 Owens & Minor (OMI UN) 194 206 227 17.0 0.2 0.2 0.2 7.2 6.6 5.7 14.3 13.5 12.2 Thermo Fisher (TMO UN) 412 475 510 23.7 2.0 1.7 1.6 9.8 8.2 7.0 10.9 9.5 8.8 Medical & scientific (5) 2.0 1.8 1.6 12.3 10.5 9.2 17.6 15.3 13.9 Amedisys (AMED UW) 194 89 77 -60.3 0.3 0.3 0.2 3.1 4.4 3.9 5.6 12.3 14.2 Contract sales/mkting (4) 0.2 0.2 0.2 3.0 3.4 3.8 9.8 13.6 12.7
C R O ICON (USc) (ICLR US) 54 93 140 158.2 0.8 0.7 0.7 10.8 7.9 5.8 31.6 18.3 12.2 Charles River Labs (CRL US) 243 265 290 19.3 1.7 1.6 1.4 7.6 7.0 6.0 11.2 10.3 9.4 Covance (CVD US) 270 305 350 29.6 1.1 1.0 0.8 7.5 6.3 5.0 16.9 15.0 13.1 Parexel (PRXL US) 95 110 155 63.2 1.1 0.9 0.7 8.9 7.5 5.2 21.8 18.9 13.4 CRO (4) 1.2 1.1 0.9 8.1 6.9 5.4 17.1 14.6 12.0
D I A G N O S T I C S Trinity Biotech (USc) (TRIB US) 77 82 87 12.7 1.8 1.5 1.3 7.0 5.7 5.5 13.2 12.4 11.7 Orasure (OSUR US) -19 -1 18 N/A 5.3 4.1 3.4 N/A N/A N/A N/A N/A 50.6 Small cap diagnostics (8) 2.1 1.9 1.7 7.9 6.9 5.9 16.1 13.9 13.5

Research Report: Davy on 2012 January 4, 2012
51 Davy Research
Transport and logistics Sector performance in 2011
Largely regarded as early cyclical plays, transport stocks – not surprisingly – underperformed in 2011. The E300 Travel & Leisure Index was down 13.3% and the E300 Industrial Transport Index was down 18.6%.
Among the airlines, the Davy global index of low-cost carriers (LCCs) was down 21.5%, and the Davy index of European network airlines was down 51.7%. This compares with a 10.7% fall for the FTSE E300 index.
The network airlines are now trading at 0.4x their book value against the LCC index at 1.2x book.
Key themes for 2012
Capacity is decelerating, but further cuts are needed given freight volumes declines and PMI signals
The latest capacity data show an increase of 0.2% in the number of flights to/from Europe and a rise of 2% in offered seats. Within Europe, flight operations and seats have decreased by 2% and 0.4% respectively.
The two main low-cost airlines have either flat growth (easyJet) or negative growth (Ryanair) this winter. We would expect further consolidation, particularly in short haul, as weaker network airlines, smaller LCCs and tour operators contract operations.
Long-haul traffic is more reliant on global GDP growth, and all the major European airlines have signalled decelerating capacity growth but no contraction as of yet. This may be required if the economic picture continues to worsen.
In the freight market, however, we are witnessing capacity reductions by some express/cargo airlines on the Asia-Europe trade lane. Air freight volumes, which tend to be a leading indicator, continue to show mid-single-digit declines that began in June.
Signals of a sharp slowdown in premium travel are also evident in the Purchasing Managers Index (PMI) of business confidence, averaged across major economies. Business confidence has been a good early warning indicator of changes in premium travel growth, leading changes by up to six months.
Operating leverage works in both directions; some uncontrollable costs rising
Companies, particularly in the airline industry, are facing the challenge of pushing through higher input costs to end-users. IAG commented on this as follows: "the challenge and opportunity of recovery though revenue remains, but should take at least another 12 months". This is likely to make 2012 a challenging year, particularly as economic conditions worsen and the fuel price remains at elevated levels.
As early cyclical plays, transport stocks underperformed in 2011
Stephen Furlong [email protected] Joshua Goldman, PhD [email protected]
Key themes for 2012 Capacity is decelerating, but further
cuts are needed given freight volume declines and PMI signals
Operating leverage works in both directions; some uncontrollable costs rising
Second wave of consolidation starting
We would expect further consolidation, particularly in short haul, as weaker network airlines, smaller LCCs and tour operators contract operations

Research Report: Davy on 2012 January 4, 2012
52 Davy Research
– Unwinding of fuel hedges is still likely to lead to double-digit increases in yoy fuel costs.
– In addition, other parties in the value chain (notably governments) are still raising taxes (e.g. the recent c.8% increases in air passenger duty (APD) taxes in the UK and the likely introduction of an EU emissions tax scheme for all airlines operating in/out of Europe in 2012).
– Charges at some regulated airports and route charges are increasing. In the absence of further revenue recovery, comparables may become
more difficult. The focus on capital expenditure reductions through deferral and
capacity and cost reductions will be needed to bolster balance sheets and prevent negative free cash flow positions. Most companies' balance sheets are healthy, but we note that Air France KLM will present a plan in Q1 to rapidly reduce debt.
Second wave of consolidation starting
Downward pressure on revenues in 2008 led to quicker consolidation in the marketplace towards the stronger players. After a pause and as revenue pressure resumes, we expect a second wave of consolidation.
Recent examples are the negotiations regarding the sale of bmi; other potential sales include TAP and Aer Lingus' government stake. After Qatar Airways' recent acquisition of a 35% stake in Cargolux, it will be interesting to see if the Gulf carriers combine organic with acquisitive growth. A recent example of this is the proposed 29.2% stake in Air Berlin by Etihad.
How key stocks are positioned for 2012
LCCs remain our preferred plays
Given their structural advantage in the marketplace, the slowing of capacity growth, their focus on returns with very young aircraft fleets and their track record, we continue to favour the LCCs (Ryanair and easyJet) over the networks with their more volatile earnings streams.
easyJet's strategy and its focus on achieving 12% ROCE appear sensible, and Ryanair should continue to benefit from a better mix of higher unit revenue bases and fewer aircraft. Both airlines are underpinned by strong cash flows and dividend potential.
Aer Lingus most interesting of networks; cautious on global players
With cash burn stabilised, a very low valuation and potential consolidation/alliances news in 2012, Aer Lingus is our preferred play of the networks (although clarity on the multi-employer pension scheme is required).
Network airlines are more reliant than LCCs on global GDP growth and have greater operational/financial leverage. Weakness in freight volumes and weak global PMIs suggest further earnings downside.
For 2012: buyers of quality companies with strong balance sheets/cash flows, market leadership positions and defensive characteristics LCCs Ryanair and easyJet are our
preferred plays
Of the networks, Aer Lingus remains a potential consolidation play
Global network airlines are vulnerable to freight/premium slowdown
ICG continues to be an attractive investment
Deutsche Post DHL (given streamlined operations, parcels and intra-Asian exposure) is preferred over TNT Express (European focus, emerging markets execution risks) and PostNL (no cash dividend)
Amadeus market leader in GDS/IT Solutions, but potential overhang (Air France KLM) is affecting sentiment

Research Report: Davy on 2012 January 4, 2012
53 Davy Research
Irish Continental Group shows value
In the shipping sector, we like Irish Continental Group (ICG). ICG remains supported by dividend yields of 7% and free cash flow yields of mid-teens and should be debt-free by 2012. Its leading cost position and financial profile should enhance its position in a downturn.
Deutsche Post DHL is favoured name among logistics stocks
Deutsche Post DHL (DPDHL) has a focused management team delivering a more streamlined strategy. At its Q3 results, it upgraded guidance above €2.4bn EBIT due to strong momentum in parcels (volumes up 11.4%) in its mail division and continued strong double-digit performance in shipments in its DHL Express division. Its emerging market exposure (particularly intra-Asian trade) and restructuring over the last several years leave it well placed. It has a 7% dividend yield with a net cash balance sheet.
TNT Express looks more exposed; EMEA, the driver of business profits, has been affected by negative mix as international economy has grown but the premium product (international express) has suffered volume declines. A value assessment of its Brazilian operations is likely in its Q4 (results on February 21st). Demerged postal partner PostNL will not be paying a cash dividend over the next few years (due to the write-downs on its TNT Express stake and the pension obligation). Instead, it will offer a dividend in the form of a scrip issue.
Volume-based revenue model and customer pipeline leave Amadeus and Datalex well positioned for 2012
At its Q3 results Amadeus announced two new contract wins for its Altéa suite. We forecast that this will bring annualised passengers boarded to over 725m by 2014. We estimate that the IT solutions business will have EBITDA CAGR of c.17% (FY2010-FY2014); even if there is no underlying passenger volume growth, we expect EBITDA CAGR of c.14% (FY2010-FY2014). The transaction-based model of the distribution business ensures relatively little impact from uncontrollable airline costs (e.g. fuel) but allows Amadeus to gain from the global growth in passenger volumes.
In addition to the already announced new customers, Datalex expects some new business wins in Q4. This would mean a doubling of its customer base in 18 months and will have a positive yoy effect on the number of transactions and thus revenue. The company looks cheap, trading on 2.1x EV/EBITDA multiple (peers trade on 9.3x multiple).
Top picks for 2012
Ryanair, easyJet (market position, balance sheet/cash flows, capacity discipline).
DPDHL (dividend yield, balance sheet, intra-Asian trade, parcels growth, valuation).
Amadeus (market position, free cash flow, customer pipeline in IT solutions, return on capital).
ICG's leading cost position and financial profile should enhance its position in a downturn
DPDHL's emerging market exposure (particularly intra-Asian trade) and restructuring over the last several years leave it well placed
Top picks for 2012
Ryanair
easyJet
DPDHL
Amadeus

54 Davy Research
Research Report: Davy on 2012 January 4, 2012
S H A R E P R I C E A N D P E R F O R M A N C E Price 12 Month Mkt. Cap Change % (€) Rel to E300 sector % Pr/Bk Debt/EBITDA Local High Low €m Wk 1 Mth YTD Wk 1 Mth YTD 2011 2011 2012
L O W C O S T A I R L I N E S Ryanair Holdings (RYA ID) 363 398 282 5363 -3.5 -4.6 -3.8 -5.3 -5.9 10.9 1.58 0.2 -0.5 Air Arabia (AIRARABI UH) 59 85 57 575 0.4 -1.3 -26.2 -1.3 -2.6 -14.9 0.52 -2.6 -1.0 AirAsia (AIRA MK) 377 414 235 2551 2.2 6.3 49.5 0.4 4.9 72.4 2.46 4.0 3.5 Air Berlin (AB1 GY) 250 415 220 213 -1.9 -4.0 -32.7 -3.6 -5.3 -22.5 0.66 N/A 28.3 easyJet (EZJ LN) 393 474 301 2027 1.9 6.4 -8.3 0.1 4.9 5.7 0.99 -0.2 0.3 Flybe (FLYB LN) 70 342 56 63 2.9 3.9 -77.4 1.1 2.5 -73.9 0.46 0.6 1.6 GOL Linhas (GOL US) 663 1631 518 1384 -3.6 -9.2 -55.5 -5.3 -10.5 -48.7 1.47 9.7 3.5 JetBlue (JBLU US) 520 710 340 1193 -1.9 31.0 -18.8 -3.6 29.2 -6.4 0.85 3.1 2.6 Norwegian Air (NAS NO) 5525 12900 5225 247 -4.0 -15.4 -52.8 -5.7 -16.6 -45.6 0.94 3.8 4.5 Southwest Airlines (LUV US) 856 1332 735 5144 0.5 6.0 -32.0 -1.2 4.6 -21.6 1.09 0.4 0.2 Tiger Airways (TGR SP) 64 166 60 310 3.9 3.4 -61.7 2.0 2.0 -55.8 1.92 N/A 9.2 Virgin Australia (VAH AU) 29 45 23 497 -3.6 -13.4 -31.7 -5.3 -14.6 -21.2 0.68 4.7 2.6 Vueling (VLG SM) 387 1199 359 116 -5.6 -7.0 -60.2 -7.3 -8.3 -54.2 0.57 -16.2 -14.6 Westjet Airlines (WJA CN) 1176 1565 1046 1229 -0.6 8.1 -15.7 -2.3 6.6 -2.9 1.21 1.4 1.3 Low cost airlines (14) 914 1242 783 20910 -0.9 2.0 -21.5 -2.7 0.6 -9.6 1.20 1.5 1.2
E U R O P E A N N E T W O R K A I R L I N E S Aer Lingus (AERL ID) 64 113 57 339 -1.4 -11.8 -41.2 -3.2 -13.0 -32.2 0.39 -2.0 -2.4 Air France KLM (AF FP) 397 1512 348 1193 0.4 -7.7 -70.9 -1.4 -8.9 -66.4 0.18 3.6 3.6 Finnair (FIA1S FH) 230 535 230 295 -4.2 -11.9 -54.4 -5.9 -13.1 -47.4 0.37 5.7 2.3 IAG (IAG SM) 174 366 153 3228 -3.2 -0.1 -45.3 -4.9 -1.4 -36.9 0.68 1.1 1.4 Lufthansa (LHA GY) 919 1739 835 4206 0.1 -4.5 -43.8 -1.7 -5.8 -35.3 0.48 0.5 0.6 SAS AB (SAS SS) 800 2780 750 296 5.4 -11.3 -64.3 3.5 -12.5 -58.8 0.18 1.7 1.6 Turk Hava Yollari AO (THYAO TI) 212 462 212 1042 -2.6 -11.1 -60.4 -4.3 -12.4 -54.3 0.65 5.8 4.1 Euro network airlines (7) 269 612 251 10599 -1.2 -5.0 -51.7 -3.0 -6.3 -44.3 0.42 1.6 1.6
O T H E R A I R L I N E S Air China (753 HK) 574 950 486 10254 0.2 4.9 -32.1 -1.6 3.5 -21.7 1.20 4.1 3.6 AMR (AMR US) 35 885 26 91 -40.7 13.5 -95.4 -41.8 12.0 -94.7 N/A 8.2 7.3 Cathay Pacific (293 HK) 1332 2310 1188 5208 1.5 2.2 -35.9 -0.3 0.8 -26.1 0.91 1.6 2.0 China Eastern Airlines (670 HK) 276 417 211 5100 -1.6 -10.3 -27.7 -3.3 -11.5 -16.6 1.21 4.5 4.1 China Southern Airlines (1055 HK) 393 537 308 7429 -1.6 2.7 -14.8 -3.3 1.3 -1.7 0.96 3.2 3.2 Delta Airlines (DAL US) 809 1300 662 5290 -2.1 3.4 -33.8 -3.9 2.0 -23.6 4.61 2.8 1.8 Qantas (QAN AU) 146 256 138 2609 -1.2 -0.5 -40.7 -3.0 -1.8 -31.7 0.54 1.3 1.7 Singapore Airlines (SIA SP) 1016 1465 1005 7139 0.2 1.6 -28.1 -1.6 0.2 -17.1 0.92 -1.8 -2.0 United Continental Holdings (UAL US) 1887 2748 1553 4819 -4.2 9.0 -18.3 -5.9 7.5 -5.8 2.47 1.0 0.5 US Airways (LCC US) 507 1147 400 634 -9.1 11.5 -47.7 -10.7 10.0 -39.8 8.74 4.0 2.5
A V I A T I O N S E R V I C E P R O V I D E R S Aeroports de Paris (ADP FP) 5300 6690 5003 5245 0.4 -2.3 -10.3 -1.4 -3.7 3.4 1.46 2.5 2.4 Amadeus IT Holding (AMS SM) 1254 1570 1155 5610 3.2 0.1 -20.1 1.3 -1.3 -7.9 4.01 1.8 1.3 Datalex (USc) (DLE ID) 45 57 24 25 0.1 2.8 74.7 -1.7 1.4 101.4 0.99 -2.9 -2.2 Fraport (FRA GY) 3800 5810 3761 3494 -1.1 -9.9 -19.4 -2.9 -11.1 -7.1 1.22 3.5 3.4
S H I P P I N G A N D P O R T S Irish Continental Grp (IR5A ID) 1517 1815 1400 377 1.1 6.8 -2.2 -0.7 5.4 12.7 2.21 0.2 -0.1 A.P. Moller-Maersk A/S (MAERSKA DC) 3584000 5250000 3096000 21200 2.5 -0.1 -27.0 0.7 -1.5 -15.8 0.81 1.1 1.1 Attica Enterprises (ATTICA GA) 23 80 20 44 0.4 -4.6 -65.3 -1.3 -5.9 -60.0 N/A N/A N/A DFDS (DFDS DC) 35500 48000 35300 710 -0.2 -7.1 -14.9 -2.0 -8.4 -2.0 0.77 1.8 1.1 Finnlines (FLG1S FH) 770 810 722 361 4.2 2.1 -3.4 2.4 0.7 11.4 0.90 9.0 N/A Viking Line (VIK1V FH) 2210 3215 2110 239 4.5 0.5 -31.3 2.6 -0.9 -20.8 1.43 2.6 N/A Shipping (5) 1363 1785 1335 1730 1.6 -1.4 -16.2 -0.2 -2.7 -3.4 1.02 3.4 0.5
T O U R O P E R A T O R S Thomas Cook (TCG LN) 15 205 10 155 -1.5 -17.2 -92.0 -3.3 -18.4 -90.8 0.07 1.9 2.0 TUI Travel (TT/ LN) 166 272 137 2222 4.6 -1.3 -30.8 2.8 -2.7 -20.2 0.97 0.1 0.1
T R A N S P O R T L O G I S T I C S Deutsche Post DHL (DPW GY) 1188 1383 913 14363 1.9 5.9 -6.5 0.1 4.5 7.8 1.30 -0.4 -0.4 DSV A/S (DSV DC) 10300 13260 9325 2633 1.5 -4.1 -16.3 -0.3 -5.4 -3.6 3.51 2.2 1.9 FedEx (FDX US) 8351 9850 6515 20272 -0.9 4.3 -7.4 -2.7 2.9 6.8 1.57 -0.1 -0.2 Kuehne & Nagle (KNIN VX) 10550 13870 9185 10423 0.0 -3.8 -16.6 -1.8 -5.1 -3.9 5.04 -1.2 -1.3 Oesterreichische Post (POST AV) 2330 2465 1893 1574 2.1 6.4 -5.8 0.3 4.9 8.6 2.22 -1.1 -1.4 Panalpina Welttransport (PWTN SW) 9620 13160 7335 1980 4.3 7.6 -18.0 2.5 6.2 -5.4 2.54 -2.4 -2.4 PostNL (PNL NA) 246 963 203 965 5.2 -4.7 -73.2 3.4 -6.0 -69.1 3.36 1.9 2.0 TNT Express (TNTE NA) 577 1000 464 3136 1.5 7.9 N/A -0.3 6.4 N/A 1.47 0.2 0.1 United Parcel Service (UPS US) 7319 7647 6170 54916 0.4 5.9 4.0 -1.4 4.4 19.9 8.77 0.9 0.6 Transport logistics (9) 962 1056 791 110263 0.4 4.3 -6.3 -1.4 2.8 8.1 2.99 0.3 0.1 FTSE E300 Travel & Leisure (E3LEIS) 1142 1377 992 1.8 1.4 -13.3

55 Davy Research
Research Report: Davy on 2012 January 4, 2012
V A L U A T I O N EPS (c) EPS Gth % EV/Sales EV/EBITDA P/E 2011 2012 2013 11-13 2011 2012 2013 2011 2012 2013 2011 2012 2013
L O W C O S T A I R L I N E S Ryanair Holdings (RYA ID) 30 30 35 18.5 1.3 1.1 0.8 6.3 5.6 4.2 12.1 12.0 10.2 Air Arabia (AIRARABI UH) 5 6 7 40.0 0.8 0.8 0.9 5.6 5.4 4.9 11.7 9.8 8.4 AirAsia (AIRA MK) 28 35 39 39.0 3.7 3.4 3.0 10.3 8.7 7.3 13.4 10.8 9.7 Air Berlin (AB1 GY) -214 -112 -91 N/A 0.2 0.2 0.2 N/A 37.2 9.5 N/A N/A N/AeasyJet (EZJ LN) 52 38 42 -20.0 0.5 0.5 0.4 4.4 5.3 4.8 7.6 10.4 9.4 Flybe (FLYB LN) 10 17 27 155.3 0.1 0.2 0.2 2.4 3.0 2.6 6.7 4.0 2.6 GOL Linhas (GOL US) -59 32 49 N/A 0.8 0.7 0.7 22.9 7.7 4.9 N/A 21.0 13.4 JetBlue (JBLU US) 24 51 65 168.8 0.8 0.7 0.7 5.4 4.5 4.2 21.7 10.3 8.1 Norwegian Air (NAS NO) 553 1110 1516 174.0 0.4 0.5 0.6 6.4 6.4 6.0 10.0 5.0 3.6 Southwest Airlines (LUV US) 41 82 101 146.3 0.5 0.4 0.3 4.2 3.0 2.7 20.9 10.4 8.5 Tiger Airways (TGR SP) -11 3 7 N/A 1.6 1.3 1.3 N/A 15.2 11.6 N/A 20.2 9.1 Virgin Australia (VAH AU) -2 3 4 N/A 0.5 0.4 0.4 8.0 4.3 3.4 N/A 11.3 6.9 Vueling (VLG SM) 34 39 89 158.3 N/A N/A N/A N/A N/A N/A 11.2 9.9 4.3 Westjet Airlines (WJA CN) 100 120 152 52.4 0.8 0.7 0.7 4.3 4.2 4.3 11.8 9.8 7.7 Low cost airlines (14) 0.7 0.6 0.6 5.8 4.9 4.2 13.2 11.1 8.9
E U R O P E A N N E T W O R K A I R L I N E S Aer Lingus (AERL ID) 8 11 13 54.0 N/A N/A N/A N/A N/A N/A 7.7 5.9 5.0 Air France KLM (AF FP) -76 -214 -71 N/A 0.2 0.1 0.1 2.5 2.9 1.8 N/A N/A N/AFinnair (FIA1S FH) -47 -11 16 N/A 0.2 0.2 0.2 12.2 4.8 3.3 N/A N/A 13.9 IAG (IAG SM) 18 8 12 -35.5 0.2 0.2 0.2 1.9 2.4 2.5 9.7 22.7 15.1 Lufthansa (LHA GY) 105 90 142 34.3 0.1 0.1 0.1 1.5 1.6 1.4 8.7 10.2 6.5 SAS AB (SAS SS) 136 105 187 37.1 0.2 0.2 0.1 2.5 2.6 2.0 5.9 7.6 4.3 Turk Hava Yollari AO (THYAO TI) -11 16 39 N/A 0.7 0.6 0.6 8.4 5.8 5.5 N/A 13.3 5.4 Euro network airlines (7) 0.2 0.2 0.2 3.0 3.0 2.6 13.6 N/A 10.6
O T H E R A I R L I N E S Air China (753 HK) 87 82 83 -4.2 1.7 1.6 1.4 8.4 7.5 7.0 6.6 7.0 6.9 AMR (AMR US) -355 -167 1 N/A 0.4 0.5 0.0 8.3 7.3 0.1 N/A N/A 35.0 Cathay Pacific (293 HK) 152 117 152 -0.1 0.7 0.8 0.7 5.8 5.8 5.2 8.8 11.4 8.8 China Eastern Airlines (670 HK) 43 48 53 22.1 1.2 1.1 1.0 7.8 7.1 6.0 6.3 5.8 5.2 China Southern Airlines (1055 HK) 67 57 67 -1.2 1.2 1.1 1.0 7.4 7.1 6.5 5.8 6.8 5.9 Delta Airlines (DAL US) 130 232 275 111.5 0.5 0.4 0.4 4.6 3.3 2.8 6.2 3.5 2.9 Qantas (QAN AU) 18 14 20 11.6 0.4 0.4 0.4 3.1 3.4 3.2 8.1 10.2 7.2 Singapore Airlines (SIA SP) 42 63 81 93.9 0.5 0.5 0.4 3.5 2.8 2.3 24.4 16.2 12.6 United Continental Holdings (UAL US) 369 545 620 68.2 0.3 0.2 0.2 2.2 1.6 1.7 5.1 3.5 3.0 US Airways (LCC US) 29 155 204 N/A 0.3 0.2 0.2 5.3 3.3 3.2 17.5 3.3 2.5
A V I A T I O N S E R V I C E P R O V I D E R S Aeroports de Paris (ADP FP) 321 346 387 20.6 2.7 2.6 2.5 7.9 7.5 6.9 16.5 15.3 13.7 Amadeus IT Holding (AMS SM) 114 131 145 27.2 2.8 2.5 2.2 7.2 6.1 5.3 11.0 9.6 8.7 Datalex (USc) (DLE ID) 5 9 10 80.6 0.7 0.5 0.3 4.5 2.1 1.4 8.4 5.0 4.6 Fraport (FRA GY) 271 271 329 21.2 2.6 2.6 2.4 7.8 7.3 6.7 14.0 14.0 11.6
S H I P P I N G A N D P O R T S Irish Continental Grp (IR5A ID) 110 137 152 38.0 1.3 1.2 1.1 7.3 6.2 5.5 13.8 11.1 10.0 A.P. Moller-Maersk A/S (MAERSKA DC) 285375 318014 444557 55.8 2.8 2.8 2.9 3.1 3.1 2.9 12.6 11.3 8.1 Attica Enterprises (ATTICA GA) N/A N/A N/A N/A N/A N/A N/A N/A N/A N/A N/A N/A N/ADFDS (DFDS DC) 4110 4388 5382 30.9 0.7 0.6 0.5 5.2 4.4 3.6 8.6 8.1 6.6 Finnlines (FLG1S FH) 5 21 38 N/A 2.0 0.6 0.6 12.8 3.2 3.0 N/A 36.0 20.1 Viking Line (VIK1V FH) 76 91 111 46.8 0.7 0.5 0.4 8.3 4.4 3.4 29.2 24.2 19.9 Shipping (5) 1.0 0.6 0.6 7.7 4.4 3.7 14.0 11.9 9.6
T O U R O P E R A T O R S Thomas Cook (TCG LN) 16 12 13 -17.5 0.1 0.1 0.1 2.2 2.3 1.9 0.9 1.2 1.1 TUI Travel (TT/ LN) 23 24 27 15.4 0.1 0.1 0.1 3.0 2.8 2.5 7.2 6.8 6.2
T R A N S P O R T L O G I S T I C S Deutsche Post DHL (DPW GY) 116 138 153 31.8 0.2 0.2 0.2 2.9 2.9 2.6 10.2 8.6 7.7 DSV A/S (DSV DC) 744 857 1018 36.8 0.6 0.6 0.5 8.8 8.2 7.2 13.8 12.0 10.1 FedEx (FDX US) 636 740 863 35.8 0.6 0.5 0.5 4.9 4.2 3.6 13.1 11.3 9.7 Kuehne & Nagle (KNIN VX) 518 557 627 21.0 0.6 0.6 0.5 11.8 10.6 9.3 20.4 18.9 16.8 Oesterreichische Post (POST AV) 197 212 190 -3.6 0.5 0.5 0.5 4.5 4.1 4.2 11.8 11.0 12.3 Panalpina Welttransport (PWTN SW) 549 590 693 26.2 0.3 0.3 0.2 8.6 7.8 6.5 17.5 16.3 13.9 PostNL (PNL NA) 54 56 63 18.6 0.5 0.5 0.4 3.7 3.7 3.4 4.6 4.4 3.9 TNT Express (TNTE NA) 16 29 44 171.8 0.4 0.4 0.4 12.4 6.1 4.8 35.9 19.7 13.2 United Parcel Service (UPS US) 423 480 548 29.6 1.5 1.4 1.3 9.3 8.2 7.6 17.3 15.2 13.4 Transport logistics (9) 0.7 0.6 0.6 6.8 6.1 5.5 15.0 13.0 11.4

Research Report: Davy on 2012 January 4, 2012
56 Davy Research
Gaming Sector performance in 2011
The gaming sector posted a second consecutive year of negative performance in 2011 as the changing regulatory environment in Europe continued to wreak havoc on company valuations. On average, stocks fell 5% (2010: -10%), with a wide disparity between the performance of the multi-channel operators and the online-only businesses.
Once again, Paddy Power was the best-performing stock (+45%), bringing its cumulative share price return over the last two years to +77%. For the second consecutive year, William Hill was the second best performing stock in the sector, posting a share price gain of +22%. The pure-play online operators suffered further sharp declines as the market digested the potential impact of European regulation.
Table 5: Gaming sector performance in 2011
Paddy Power +45%
William Hill +22%
Unibet +13%
Ladbrokes +9%
Bwin.party -18%
888 Holdings -19%
Betfair -20%
Playtech -32%
Sportingbet -47%
Gaming sector average -5%
Review of 2011's key events
The main driver of share price performance was European regulation and the news wasn’t good
Fears regarding the impact that new European online gaming regulations would have on the earnings streams of most listed operators were well-founded. The most damaging proposals came in Germany in early April when 15 of the 16 Länder (states) put forward a draft bill that left online operators reeling. The new proposals included a 16.7% turnover tax on sports (later reduced to 5%) as well as restrictions on in-play betting, online poker and online casino.
If passed, these measures would effectively make the German online gaming market commercially unviable for most operators. There was just one dissenting voice among the Länder: Schleswig-Holstein refused to go along with the proposals and instead passed its own online gambling bill in Q4 (which allows for all products at a gross profits tax of 20%).
David Jennings [email protected] Simon McGrotty [email protected]
The gaming sector posted a second consecutive year of negative performance in 2011
Once again, Paddy Power was the best-performing stock in the sector
Key events of 2011 The main driver of share price
performance was European regulation and the news wasn’t good
US-facing poker sites were finally shut down
Mobile betting enjoyed explosive growth
Consolidation – some deals done but less than were expected
Betfair started the fight-back by poaching from peers
In April, 15 of the 16 German Länder put forward a draft bill that would, if passed, make the German online gaming market commercially unviable for most operators

Research Report: Davy on 2012 January 4, 2012
57 Davy Research
As we go to print, however, the other 15 Länder are pressing ahead with their proposals, leading investors to wonder how bwin.party and its peers will now approach the German market.
If operators choose to abide by the new law as proposed, this would involve shutting down their German casino and poker operations while also dramatically reducing the number of sports betting markets they offer into the country. For bwin.party (by far the largest listed operator in the German market), we estimate that such a move would reduce its German revenues by at least 70%. Germany currently accounts for 23% of its total revenues.
The alternative approach would be to continue to offer services into Germany while challenging the new legislation in the European courts. Such an approach would likely involve applying for a licence in Schleswig-Holstein and offering services throughout Germany on that basis. That approach, however, carries with it considerable legal and political uncertainty in our view.
The political aspect of all of this is potentially more damaging to operators. We believe it is likely that concerted political pressure could be brought to bear on Schleswig-Holstein to bring its legislation into line with the remaining 15 Länder. While it is not impossible that it could continue to persist with its chosen path, it seems more probable to us that this pressure could eventually lead to it being forced into line with the rest. Indeed, even if it can resist such pressures, the resistance may be moot. The opposition in Schleswig-Holstein are on record as saying that if they win power there in May 2012, they will bring the state’s legislation into line with the other Länder.
Elsewhere, Spain and Denmark both prepared to regulate their online gaming markets in early 2012. Proposals in both countries are generally considered to be fair, although betting exchanges will not be permitted in the first phase of Spanish regulation – much to the ire of Betfair. Gross profit tax rates of 20% and 25% respectively will apply in Denmark and Spain.
In Ireland, the government reiterated its intention to impose a 1% turnover tax on online and telephone sports-betting while applying a 15% gross profits tax on betting exchanges. These taxes are now expected to come into effect in Q2 2012.
The UK government took its first steps towards taxation of offshore operators with proposals for a new licensing regime. The pace of change is likely to be slow with expectations that online operators will only recommence payment of gross profits tax from 2014 on.
In France and Italy (the two Continental European markets that are already regulated), the picture was mixed. In France, the effective turnover tax rate on sports-betting of close to 9% has clearly depressed customer demand with some operators speculating that up to 75% of amounts wagered in the country are still being placed via offshore betting websites that are non-compliant with French law. In Italy, the launch of regulated online casino and poker cash games provided a
Spain and Denmark both prepared to regulate their online gaming markets in early 2012
The UK government took its first steps towards taxation of offshore operators with proposals for a new licensing regime

Research Report: Davy on 2012 January 4, 2012
58 Davy Research
much-needed boost to revenues. The first three months post regulation have seen the overall gaming market in Italy grow 27% yoy compared with a run-rate of -5% in the first half of 2011.
Regulation in Greece has been delayed indefinitely, albeit at some point both the sale of the national lottery and the regulation of the online gaming market appear inevitable.
In the US, the most significant development happened in the very last week of 2011 when the Department of Justice (DOJ) released an opinion that stated that the US's 1961 Wire Act covers only online sports-betting (as opposed to other forms of online gaming). This opinion represented an apparent u-turn on the DOJ's previous stance and potentially paves the way for individual states to regulate online poker and/or casino should they see fit. Several states are at various stages of introducing such legislation – these include California, Nevada, Florida and New Jersey. The big question now is whether the federal government will move to introduce federal regulation for the online gaming industry rather than have regulation of an online industry set at state level. Either way, it would appear that the momentum to re-open the US online market is continuing to build.
US-facing poker sites were finally shut down
Ironically, given the above development, 2011 was the year that US federal authorities finally decided to clamp down on the largest US-facing poker sites, with the FBI effectively taking control of both Pokerstars' and Full Tilt Poker's .com domains. In addition, arrest warrants were issued against 11 individuals who face charges of breaching the Unlawful Internet Gambling Enforcement Act, operating an illegal gambling business, conspiracy to commit bank and wire fraud and conspiracy to launder money. Whether Steve Wynn's announcement the previous month that he was entering into a partnership with Pokerstars to lobby for US regulation had anything to do with the timing of the clamp-down is unclear – the upshot was that most online poker players in the US can no longer play poker online.
For the non-US poker market, the spillover effect was surprisingly limited. Pokerstars remained up and running outside the US and indeed extended its dominant market-leading position when Full Tilt lost its main European (Alderney-based) gaming licence. It emerged that there was a shortfall in Full Tilt's cash balances that meant that it was unable to repay all of its players. The prospect of a sale of Full Tilt's business to Groupe Bernard Tapie (with the blessing of the US Department of Justice) at least provides Full Tilt customers with the hope that their funds may be returned. Whether the Full Tilt brand can re-emerge as a leader in the online poker space remains doubtful.
Mobile betting enjoyed explosive growth
Sports-betting on mobile devices (smart-phones and tablets) experienced explosive growth with Paddy Power leading the way in the UK. By year-end, over 40% of its customers were using mobile devices
US federal authorities finally decided to clamp down on the largest US-facing poker sites
Sports-betting on mobile devices experienced explosive growth in 2011 with Paddy Power leading the way in the UK

Research Report: Davy on 2012 January 4, 2012
59 Davy Research
to transact (Betfair enjoyed a similar take-up), with most operators promising more mobile innovation and product roll-outs for 2012.
How the growth in mobile betting will impact retail bookmakers remains unclear, but signs were that overall online revenues were enjoying a healthy boost as a result. Interestingly, gross win margins in mobile appeared to be somewhat higher than for traditional online sports-books. Whether this apparent benefit proves long-lasting remains to be seen – we suspect that gross win margins will return to normal online levels as mobile becomes more competitive.
Consolidation – some deals done but less than were expected
2011 was as much about the deals that weren't done as the ones that were. The deals done included:
– Sportingbet acquired Centrebet in Australia, making it the clear number three in that market behind Tabcorp and Sportsbet-IAS.
– Playtech acquired PTTS from Teddy Sagi, promising that this would be the last of its related party transactions.
– bwin.party announced joint venture agreements with MGM and Boyd Gaming, subject to online poker being regulated in the US.
– There were some nice bolt-on deals too. Playtech acquired mobile technology developer Mobenga, while Paddy Power acquired online games developer Cayetano.
– Finally, subject to a pending gaming licence application in Nevada, William Hill bought three land-based businesses. The group is hopeful that it will win such a licence by the end of 2012. Incidentally, it also emerged in September that Paddy Power had applied for a Nevada gaming licence in 2010, with the group hopeful of a successful outcome as early as Q1 2012.
As for the deals that got away, there was one eager singleton that kept looking for that new special relationship.
– Ladbrokes took the 2011 Julia Roberts award, not only playing the lead role in "The Runaway Bride" but also in its highly publicised sequel, "Runaway Bride 2 - fear of the Turkish ex". The first jilted groom was 888, who Ladbrokes decided just didn't have enough sporting endeavour to keep it interested. The second potential groom was Sportingbet, who in contrast had plenty of sporting potential but also came with considerable baggage from a previous relationship in Turkey. Alas, that baggage was too much for Ladbrokes to deal with. The upshot of it all was that Ladbrokes finished the year saying that it was happy being single, but then they all say that until the next potential Mr. Right comes along.
– William Hill considered a bid for mobile technology group Probability but then mysteriously decided to shelve its plans, at least for the time being. It does retain first option to acquire the business until the end of April 2012.

Research Report: Davy on 2012 January 4, 2012
60 Davy Research
Betfair started the fight-back by poaching from peers
Betfair was busy on the recruitment front. Following David Yu's announcement of his intention to leave the group at the end of the year, the group announced that he would be replaced by Breon Corcoran, the former Chief Operating Officer of Paddy Power. As Corcoran does not take charge until August 2012, Stephen Morana (Betfair's current CFO) will take charge in the meantime. In addition, Ian Chuter left William Hill (where he was Head of International and UK Operations) to become Betfair’s Group Operations Director.
In response to Corcoran’s departure, Paddy Power announced the promotion/appointment of five senior people, including the intriguing new role of a Head of North America. A Canadian B2B deal with the British Columbia Lottery Corporation followed shortly thereafter.
Key themes for 2012
Regulation will continue to drive online operator share prices
As we see it, changes to online gaming regulation will continue to be the key driver of sector share prices.
In our view, the risk in Germany still lies to the downside; in Canada, Australia and the US, the opposite potentially applies. Of the latter three, Canada appears to be the best prospect for positive change from an operator perspective in the short term.
Elsewhere in Europe, Spain and Denmark will provide useful examples of how earnings streams develop in sensibly regulated markets. Our fear, however, would be that investors discover that these markets are not as profitable as they hoped due to intense competition and the need to invest heavily in marketing. This in turn could call into question whether the European online gaming market will ever deliver the earnings it once generated in a pre-regulation era.
Potential impact of a double-dip recession will occupy investors in the multi-channel operators
Investors in William Hill, Ladbrokes and Paddy Power will likely be pre-occupied by the challenges facing the UK consumer and the impact that this may have on retail earnings in particular. These concerns may be exacerbated early in the year if bookmakers report weak Q4 numbers due largely to unfavourable sports results.
That said, as we assess 2012 consensus earnings estimates for these names, we feel that much of the downside risk is already in the numbers. If anything, earnings may actually end up surprising to the upside.
We would expect the bears on these stocks to once again argue that retail bookmaking is in structural decline. We remain unconvinced.
Key themes for 2012 Regulation will continue to drive online
operator share prices
Potential impact of a double-dip recession will occupy investors in the multi-channel operators

Research Report: Davy on 2012 January 4, 2012
61 Davy Research
How key stocks are positioned for 2012
Given the themes that we believe will be prominent in 2012, it will come as no surprise that we are sticking to the strategy that worked so well for us in 2011. That involves being long the multi-channel operators (Paddy Power, William Hill and Ladbrokes) and avoiding the larger online names, at least until regulatory uncertainty subsides.
The valuations of both William Hill and Ladbrokes stand out to us, with free cash flow yields of well over 10% in both cases. Both have ever-strengthening balance sheets and the critical advantage that the vast majority of their earnings already come from regulated markets. Of the two, we see less execution risk at William Hill given the strength of its online offering.
The buy case for Paddy Power is not so much based on a cheap valuation (forward P/E 19.3x) but more on it having the best earnings and returns track record in the sector (by some distance). This track record, coupled with good scope for earnings upgrades and arguably the best strategic positioning of any European gaming company, makes the stock a lock-away for portfolios in our view.
In Betfair's case, we acknowledge that a good deal of progress was made during 2011. However, the stock now sits very close to our fair value of 825p. In addition, we have concerns that when Breon Corcoran takes up the mantle of CEO, he may make difficult strategic decisions that impact earnings in the short term to better position the group for the long term. There will certainly be a time to buy this stock; we just don’t think 2012 will be the year to do so.
In the case of bwin.party, positive regulatory noises in the US are undoubtedly helpful, but we fear that possible setbacks in Europe may occur before the benefits from the US kick in. As such, we feel that there is too much uncertainty attached to this name for the time being.
How key stocks are positioned for 2012 We expect multi-channel operators to
outperform
Our top picks in the sector are Paddy Power and William Hill

Research Report: Davy on 2012 January 4, 2012
62 Davy Research
S H A R E P R I C E A N D P E R F O R M A N C E Price 12 Month Mkt. Cap Change % (€) Rel to E300 sector % Pr/Bk Debt/EBITDA Local High Low €m Wk 1 Mth YTD Wk 1 Mth YTD 2011 2011 2012
Paddy Power (PWL ID) 4452 4452 2825 2168 2.0 9.9 45.0 0.2 8.4 67.1 6.99 -0.6 -0.9 888 Holdings Plc (888 LN) 43 63 29 179 19.6 29.8 -19.3 17.5 28.0 -7.0 1.69 -0.9 -0.2 Betfair (BET LN) 753 1054 567 943 -6.6 -0.3 -19.8 -8.3 -1.7 -7.5 4.54 -1.4 -1.5 bwin.party (BPTY LN) 197 254 115 1638 24.3 24.9 -17.9 22.1 23.2 -5.4 2.44 -2.9 -3.1 Ladbrokes plc (LAD LN) 130 155 114 1415 6.0 3.3 8.9 4.1 1.9 25.5 3.40 1.8 1.5 Playtech (PTEC LN) 282 420 216 978 22.0 21.9 -31.7 19.8 20.2 -21.2 2.44 -0.6 -0.8 Sportingbet (SBT LN) 32 61 28 250 -1.4 1.0 -47.5 -3.2 -0.4 -39.5 1.14 -0.5 -0.3 Unibet (UNIB SS) 15850 15900 10875 503 2.1 3.6 13.4 0.3 2.2 30.7 2.56 -1.0 -1.3 William Hill plc (WMH LN) 203 244 169 1706 7.6 3.0 22.1 5.7 1.6 40.7 1.49 1.3 1.1 Online operators (6) 207 275 161 4490 11.7 14.6 -20.3 9.7 13.0 -8.2 2.49 -1.5 -1.7 Overall gaming (9) 457 464 376 9780 7.9 9.6 3.6 6.0 8.1 19.4 2.66 0.1 -0.2 FTSE E300 Travel & Leisure (E3LEIS) 1142 1377 992 1.8 1.4 -13.3
V A L U A T I O N EPS (c) EPS Gth % Div Yield % Div Cover EV/EBITDA P/E 2011 2012 2013 11-13 2011 2012 2011 2011 2012 2013 2011 2012 2013
Paddy Power (PWL ID) 202 232 243 20.3 2.2 2.7 2.1 14.9 13.0 12.0 22.0 19.2 18.3 888 Holdings Plc (888 LN) 4 5 5 13.6 0.0 0.0 N/A 4.8 5.4 4.5 10.8 9.3 9.5 Betfair (BET LN) 23 41 47 104.1 1.9 2.1 1.6 9.2 7.3 6.8 32.5 18.2 15.9 bwin.party (BPTY LN) 14 18 18 24.8 0.0 0.0 N/A 6.0 4.4 3.7 13.7 11.0 11.0 Ladbrokes plc (LAD LN) 14 16 18 21.6 5.9 6.5 1.9 6.8 6.1 5.6 9.0 8.1 7.4 Playtech (PTEC LN) 34 36 39 12.2 5.2 4.8 2.3 7.7 6.6 6.4 8.2 7.8 7.3 Sportingbet (SBT LN) 6 4 5 -19.6 5.4 5.7 3.7 3.5 3.5 3.0 5.0 7.6 6.2 Unibet (UNIB SS) 1352 1520 1627 20.4 4.3 4.6 2.0 7.9 6.7 5.7 11.7 10.4 9.7 William Hill plc (WMH LN) 23 24 25 9.5 3.5 5.2 3.2 6.1 5.8 5.4 8.9 8.6 8.2 Online operators (6) 2.4 2.4 3.6 6.7 5.6 5.0 11.9 10.5 9.9 Overall gaming (9) 3.1 3.6 2.8 7.5 6.6 6.0 11.9 10.7 10.1

Research Report: Davy on 2012 January 4, 2012
63 Davy Research
Resources Sector performance in 2011
As evidenced by the CRB Commodity Index (-7.6%), an almost uninterrupted period of growth in commodities since 2008/2009 came to a sharp halt in 2011. This was mirrored by the performance of the various equity indices that fall under our remit.
Table 6: Commodity indices
Six-month performance 2011 performance
FTSE AIM Oil & Gas -19.5% -35.4%
FTSE 350 Oil & Gas producers 2.4% 4.8%
FTSE 350 Mining -25.1% -29.7%
CRB Commodity Index -12.6% -7.6%
Source: Davy
This performance was almost entirely due to underlying fears of a slowdown in China and the ongoing euro crisis. During 2011, fears that efforts by Chinese authorities to dampen property markets would feed through to slower demand were replaced by the euro crisis and what its contagion effects might be. The first issue clearly affects the demand for headline commodities, and the second has serious implications for global confidence and demand (note the improvement in the Vix volatility index). Equity markets picked up all these signals quite clearly, with metals down strongly and counter-cyclical 'safe haven' gold investment pushing gold prices ahead.
Most market movements pick up demand-side signals. However, there are several cases where the supply side plays a very large role – oil and gas is a case in point. Oil prices finished the year 12.9% ahead, and the FTSE 350 Producers Index finished the year marginally up – in marked contrast to most equities focussed on commodities. This demonstrates the impact that geopolitical forces (not least the actions of OPEC) have on crude oil markets.
Key themes for 2012
Outlook for 2012 affected by fears of a slowdown in China and the euro crisis
The 2012 outlook for commodities is closely tied to the outlook for China, the main engine of demand in recent years, and the evolution of the euro crisis. In fact, fears of a slowdown in China and the eurozone crisis are already being priced in to the major commodities such as steel, coal and copper.
However, in aggregate, there has been no outright collapse in global physical demand. Instead, marginal investment buying of commodities has declined and lack of confidence in equity has hit equity-related commodities very hard.
Job Langbroek [email protected] Caren Crowley [email protected]
An almost uninterrupted period of growth in commodities since 2008/2009 came to a sharp halt in 2011
The Vix Index, a common measure of market volatility, finished the year at 23.4 compared to 17.8 at the start of 2011
Key themes for 2012
Outlook for 2012 affected by fears of a slowdown in China and the euro crisis
Resilience of crude oil
Gas could break link with oil

Research Report: Davy on 2012 January 4, 2012
64 Davy Research
The outlook for 2012 is further compounded by the current euro crisis. Assuming some resolution should see a return to better commodity pricing in general; less than this will clearly lead to a much poorer outcome (regardless of Far East demand).
Resilience of crude oil
We exclude the price of oil and gas from the demand-driven view of metals and other commodities given that we feel they have their own set of important dynamics.
We have for some time thought that there are special supply-side issues that will offset any demand-side effects. Marginal production cost is an important factor with pricing of $70-80 per barrel required to cover the last 10% of the supply curve. Moreover, large elements of the supply side with much cheaper costs are affected by sociopolitical factors that require higher prices. For instance, it has been estimated that Saudi Arabia requires an oil price of $80 per barrel to provide sufficient revenue to cover the cost of its internal social programmes.
Unless demand declines very rapidly, we do not see oil pricing changing materially or, if it does, at least not for any protracted period.
Gas could break link with oil
We expect the linkage between oil and gas prices to get weaker in the future. LNG continues to act as a global price-equalising force.
Another factor is the growth of shale gas production in the US and increasingly across the globe. This also looks likely to change gas pricing dynamics.
An important unknown factor is the move away from nuclear energy (following the Fukishama nuclear disaster and the impact in Germany) and its effect on long-term pricing.
How key stocks are positioned for 2012
Oil price strength will help Dragon Oil, Tullow Oil and Premier Oil
Given our predicted relative strength in the oil price, two stocks in our universe will particularly benefit from higher cash flows: Dragon Oil is expected to grow cash production to 100,000 barrels per day by 2014, and Tullow Oil (notwithstanding delays in Jubilee commissioning) should report production levels over 100,000 barrels per day by the end of 2012.
In the case of Dragon, it will add to an even larger cash pile; in the case of Tullow, it will finance an increasingly expanding exploration and development programme.
For Premier Oil too, high oil prices will facilitate the build-out of its North Sea programmes and the growth in production levels to over 60,000 barrels per day on average throughout the year.
Unless demand declines very rapidly, we do not see oil pricing changing materially. Our view is that oil prices will average c.$100 per barrel in 2012.
We expect the linkage between oil and gas prices to get weaker in the future
Dragon Oil is expected to grow gross oil production to 100,000 barrels per day by 2014, and Tullow Oil (notwithstanding delays in Jubilee commissioning) should report production levels over 100,000 barrels per day by the end of 2012

Research Report: Davy on 2012 January 4, 2012
65 Davy Research
Exploration programmes will differentiate
• A high oil price will also ensure a continued focus on exploration and the next generation of new targets and developments. To this end, new exploration areas and high-impact programmes will continue to be investor requirements and favourites.
• Tullow Oil stands out in this regard. It is involved in three new discovery areas globally (Ghana, Uganda and earlier this year offshore French Guiana). All of these areas have still to yield their maximum potential, and we expect further progress in the coming years.
• Premier Oil has grown steadily through acquisition (Oilexco and recently EnCore), but there are signs that it is attempting to revitalise its exploration strategy. Increasing drill density and licence acquisition in East Africa point to its attempt to use the drill bit as well as corporate activity to expand. In general, Premier executes very competently but we feel it will probably be some time before the market is fully converted.
• Several stocks in our portfolio are also involved in East Africa, a region that – despite substantial gas discoveries – still looks to hold significant promise. The next phase of exploration should also answer the question as to whether oil will be discovered.
• Cairn Energy is an out-and-out explorer, but we feel its 2012 performance will hinge in part on its ability to farm out its exploration portfolio offshore Greenland.
• Separately, Kenmare Resources –a producer of titanium dioxide feedstocks for the global pigment industry – is expected to complete its expansion of the Moma mine to 1.2m tonnes by the end of 2012.
Smaller companies provide material upside potential
• Following the final ratification of the part farm-out of its Algerian gas development project to Italian utility Enel, Petroceltic will shortly receive $103m. This finances the group and allows the market to focus on its Italian and Kurdish activities.
• We expect Petroneft, a developer of oil assets in the Tomsk region in Western Siberia, to receive a material upgrade to its proven and probable reserve inventory when Scott Pickford completes its next review. This should return the EV per barrel of reserves to c.US$1.
• Offshore Ireland, Providence Resources is active in a crucial unconventional oil play off the south coast. The Barryroe well is a 60m barrel waxy oil target from which three previous wells flowed oil. The current well is geared towards demonstrating that the advent of modern technology can ensure the development of waxy crudes in a temperate marine setting. A success here will transform Providence.
• Ormonde Mining is due to initiate the development of a new tungsten mine in Western Spain. It has a 100% stake in the Barruecopardo project which, when production commences in 2013, will supply c.12% of global non-Chinese tungsten.
• A high oil price will also ensure a continued focus on exploration and the next generation of new targets and developments
• Offshore Ireland, Providence Resources is active in a crucial unconventional oil play off the south coast
• Ormonde Mining is due to initiate the development of a new tungsten mine in Western Spain

66 Davy Research
Research Report: Davy on 2012 January 4, 2012
C O M P A N Y P E R F O R M A N C E S Price 52 Week No of Market Avg Daily Price performance % (local) Quote Sector High Low Shares(m) Cap (€m) Volume(m) 1 wk 1 mth 3 mth YTD 12 mth
Tullow Oil (USc) (TLW LN) 2177.2 2431 1545 904.3 15197.6 1.916 4.1 0.0 7.9 10.7 10.7 ISE/LSE Oil and Gas Cairn Energy (CNE LN) 265.3 470 258 1406.3 4472.2 4.312 0.2 -2.6 -5.5 -36.8 -36.8 London SE Oil and gas Dragon Oil (USc) (DGO ID) 710.3 985 699 511.0 2802.0 1.065 -2.6 -8.7 -3.4 -15.3 -15.3 ISE/LSE Oil and Gas Premier Oil (PMO LN) 363.0 535 310 468.1 2036.7 1.736 0.0 -0.4 4.5 -25.5 -25.5 London SE Oil and Gas Kenmare (USc) (KMR ID) 69.7 95 44 2409.7 1296.5 8.405 4.6 25.1 30.7 44.6 44.6 ISE/LSE Mining Soco Int'l (SIA LN) 292.6 400 278 338.9 1188.8 0.421 -1.7 -5.5 -10.7 -20.8 -20.8 London SE Oil and Gas Cove Energy (COV LN) 116.0 116 61 491.0 682.7 3.508 6.9 22.4 53.1 20.2 20.2 AIM Mining Heritage Oil (HOIL LN) 192.5 486 160 256.5 591.9 0.654 8.0 0.6 -17.4 -57.1 -57.1 London SE Oil and Gas Sierra Rutile (SRX LN) 40.4 41 9 509.3 246.5 2.001 0.6 30.8 74.6 293.9 293.9 AIM Mining Bowleven (BLVN LN) 67.3 398 62 294.5 237.4 5.178 1.9 -5.6 -28.5 -82.3 -82.3 AIM Oil and Gas Petroceltic (PCI LN) 8.3 16 4 2369.6 235.8 13.901 -2.4 30.5 108.5 -36.2 -36.2 ESM/AIM Oil and Gas Circle Oil (COP LN) 20.1 41 20 563.4 135.9 1.588 -1.8 -10.6 -15.3 -42.1 -42.1 AIM Oil and Gas Providence Resources (PRP ID) 246.9 365 175 49.8 123.0 0.159 2.9 -1.3 14.8 -17.7 -17.7 ESM/AIM Oil and Gas Regal Petroleum (RPT LN) 29.5 51 24 320.6 113.4 0.125 -4.1 -14.8 -18.1 14.6 14.6 AIM Oil and Gas Petroneft (USc) (PTR LN) 27.8 115 28 411.6 88.2 1.730 -2.9 -12.2 -19.3 -74.8 -74.8 ESM/AIM Oil and Gas Lansdowne Oil & Gas (LOGP LN) 36.5 40 14 122.4 53.5 0.471 0.7 30.4 49.0 165.5 165.5 AIM Oil and Gas Mwana Africa (MWA LN) 4.3 12 4 717.9 36.7 0.885 0.5 3.4 -2.4 -59.4 -59.4 AIM Mining Aminex (AEX ID) 4.1 13 1 779.7 31.9 4.702 0.0 20.7 -38.1 -58.1 -58.1 ISE/LSE Oil and Gas Ormonde Mining (ORM ID) 9.0 15 7 339.1 30.5 0.688 0.0 12.5 12.5 -18.2 -18.2 ESM/AIM Mining Ovoca Gold (OVG ID) 28.0 46 26 87.4 24.5 0.043 0.0 0.0 -11.1 -37.8 -37.8 ESM/AIM Mining Seaenergy (SEA LN) 25.4 70 22 53.0 16.1 0.246 -0.5 1.5 -6.9 8.0 8.0 AIM Oil and Gas Minco (MIO LN) 3.0 8 2 350.0 12.6 0.551 0.0 4.4 14.3 -52.0 -52.0 AIM Mining Conroy Gold and Natural Resources (CGNR LN) 3.5 8 3 251.2 10.5 0.288 3.7 21.7 16.7 -41.7 -41.7 ESM/AIM Mining Petrel (PET LN) 6.8 34 6 76.7 6.2 0.155 1.9 -3.6 -1.8 -75.9 -75.9 AIM Oil and Gas Great Western Mining (GWMO ID) 10.8 11 11 46.5 5.0 0.000 0.0 0.0 N/A N/A N/A Irish SE Mining Karelian Diamond Resources (KDR LN) 1.8 6 2 92.2 1.9 0.077 0.0 0.0 -22.2 -58.8 -58.8 ESM/AIM Mining
K E Y S E C T O R I N D I C E S Index 52 Week Price performance % (local) level High Low 1 wk 1 mth 3 mth 6 mth YTD 12 mth 2 yr 3 yr 2008 2009 2010
FTSE AIM Index 693.2 968 658 1.1 -0.5 -1.0 -19.2 -25.8 -25.8 6.4 76.8 -62.4 65.9 42.7 FTSE AIM Oil & Gas 3419.3 5643 2798 0.4 1.6 8.9 -19.6 -35.4 -35.4 0.8 106.7 -68.9 105.1 55.9 FTSE 350 Oil & Gas Producers 8640.6 8905 7086 1.2 3.4 16.6 2.4 4.8 4.8 5.4 19.5 -16.0 13.2 0.6 FTSE ASX Mining 18860.5 27133 16500 -0.3 -4.2 8.4 -25.1 -29.7 -29.7 -9.8 87.8 -55.7 108.1 27.7 FTSE 350 Mining 19578.5 28139 17124 -0.3 -4.1 8.5 -25.1 -29.7 -29.7 -9.7 88.4 -55.7 108.5 27.8 Baltic Dry Index 1738.0 2173 1043 0.0 -5.9 -8.5 23.0 -2.0 -2.0 -42.2 124.6 -91.5 288.2 -41.0 CRB Commodity Index 481.0 580 475 0.5 -1.8 -4.5 -12.6 -7.6 -7.6 13.8 54.1 -23.8 33.7 23.6 Philadelphia Gold Index 180.6 229 176 -2.4 -13.3 -2.4 -10.2 -20.3 -20.3 7.5 49.1 -28.5 35.9 34.7 VIX Index 23.4 48 15 12.9 -15.8 -45.5 41.7 31.8 31.8 17.2 -43.8 77.8 -45.8 -18.1
C O M M O D I T Y / P R O D U C T P R I C E S Brent Oil $/bbl 107.6 127 93 -1.5 -3.4 3.2 -3.7 14.1 14.1 38.8 183.9 -55.5 84.9 22.2 Gasoline USc/gal 265.7 343 234 -1.1 3.9 4.7 -10.5 9.3 9.3 29.2 184.9 -54.2 93.3 18.4 Heating Oil USc/gal 291.4 332 249 0.8 -3.7 4.9 -1.1 14.6 14.6 37.5 123.1 -44.0 46.7 20.2 Jet Kerosene $/mt 984.0 1140 831 0.3 -3.3 1.6 -3.9 18.4 18.4 41.6 113.0 -48.5 52.4 18.0 Natural Gas GBp/therm 52.3 66 45 0.2 -8.7 16.1 -9.0 -15.7 -15.7 51.5 -18.0 16.4 -39.9 74.2 WTI Crude $/bbl 98.8 114 76 -0.9 -1.5 24.8 3.6 8.2 8.2 24.7 153.2 -51.0 77.9 15.2 Aluminum $/mt 1994.5 2786 1948 -0.3 -5.2 -6.1 -20.3 -19.0 -19.0 -9.7 36.5 -36.1 45.7 12.0 Copper USc/lb 343.6 464 306 -1.0 -3.9 9.0 -19.8 -22.7 -22.7 2.7 160.2 -53.8 137.3 32.9 Gold $/t oz 1563.7 1900 1322 -2.7 -10.4 -3.7 4.2 10.2 10.2 43.2 79.0 5.5 24.9 29.1 Nickel $/mt 18724.0 29281 16721 1.4 7.0 6.6 -20.0 -24.2 -24.2 -0.6 76.4 -55.4 59.0 33.9 Cheddar Cheese Barrel $/lb 1.6 2 1 1.3 -8.1 -3.7 -24.3 17.9 17.9 10.5 26.7 -42.9 26.6 -6.3 Coffee "C" USc/lb 226.9 306 215 3.3 -4.2 -0.9 -14.6 -5.7 -5.7 66.0 110.9 -23.8 21.3 76.9 Corn $/bu 646.5 786 579 4.4 6.3 9.1 4.2 2.8 2.8 56.3 63.2 -14.0 1.8 51.8 Soybean USc/bu 1207.8 1458 1107 3.0 6.8 2.4 -6.7 -13.9 -13.9 15.6 26.7 -13.1 7.0 33.8 Wheat USc/bu 652.8 904 579 4.9 6.3 7.1 6.3 -17.8 -17.8 19.8 7.9 -22.5 -11.3 46.7 EU ETS €/mt 7.0 14 7 0.0 -16.7 -51.1 -51.1 -49.5 -49.5 -47.8 -55.7 -29.2 -15.1 3.3
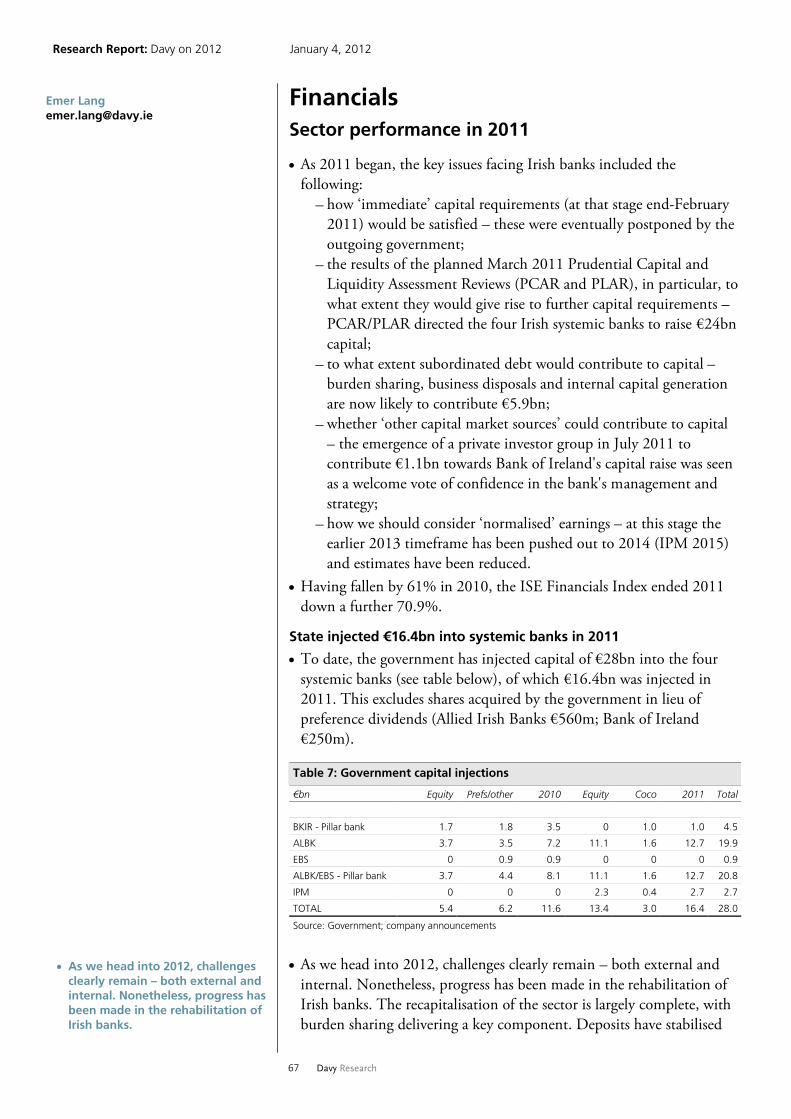
Research Report: Davy on 2012 January 4, 2012
67 Davy Research
Financials Sector performance in 2011
As 2011 began, the key issues facing Irish banks included the following:
– how ‘immediate’ capital requirements (at that stage end-February 2011) would be satisfied – these were eventually postponed by the outgoing government;
– the results of the planned March 2011 Prudential Capital and Liquidity Assessment Reviews (PCAR and PLAR), in particular, to what extent they would give rise to further capital requirements – PCAR/PLAR directed the four Irish systemic banks to raise €24bn capital;
– to what extent subordinated debt would contribute to capital – burden sharing, business disposals and internal capital generation are now likely to contribute €5.9bn;
– whether ‘other capital market sources’ could contribute to capital – the emergence of a private investor group in July 2011 to contribute €1.1bn towards Bank of Ireland's capital raise was seen as a welcome vote of confidence in the bank's management and strategy;
– how we should consider ‘normalised’ earnings – at this stage the earlier 2013 timeframe has been pushed out to 2014 (IPM 2015) and estimates have been reduced.
Having fallen by 61% in 2010, the ISE Financials Index ended 2011 down a further 70.9%.
State injected €16.4bn into systemic banks in 2011
To date, the government has injected capital of €28bn into the four systemic banks (see table below), of which €16.4bn was injected in 2011. This excludes shares acquired by the government in lieu of preference dividends (Allied Irish Banks €560m; Bank of Ireland €250m).
Table 7: Government capital injections
€bn Equity Prefs/other 2010 Equity Coco 2011 Total
BKIR - Pillar bank 1.7 1.8 3.5 0 1.0 1.0 4.5
ALBK 3.7 3.5 7.2 11.1 1.6 12.7 19.9
EBS 0 0.9 0.9 0 0 0 0.9
ALBK/EBS - Pillar bank 3.7 4.4 8.1 11.1 1.6 12.7 20.8
IPM 0 0 0 2.3 0.4 2.7 2.7
TOTAL 5.4 6.2 11.6 13.4 3.0 16.4 28.0
Source: Government; company announcements
As we head into 2012, challenges clearly remain – both external and internal. Nonetheless, progress has been made in the rehabilitation of Irish banks. The recapitalisation of the sector is largely complete, with burden sharing delivering a key component. Deposits have stabilised
Emer Lang [email protected]
As we head into 2012, challenges clearly remain – both external and internal. Nonetheless, progress has been made in the rehabilitation of Irish banks.

Research Report: Davy on 2012 January 4, 2012
68 Davy Research
while deleveraging is underway – reducing reliance on wholesale funding, including monetary authorities.
Key themes for 2012
Deleveraging remains the key to 'rightsizing' the sector
With recapitalisation of the sector now largely complete, the focus has moved to deleveraging – a crucial driver of the necessary transformation of Irish banks' funding profile out to end-2013.
Apart from wind-down entity IBRC, deleveraging is primarily concentrated on overseas operations. Both Pillar banks, Allied Irish Banks (ALBK) and Bank of Ireland (BKIR), made good progress in shedding overseas loans in 2011, and further disposals and book redemptions/run-off are anticipated in 2012.
With many European banks turning to potential asset disposals as a means of boosting capital, the market for disposals has grown more crowded. This has implications for disposal pricing, which so far has typically been better than anticipated in the banks' recapitalisation calculations. The Irish regulator has suggested that the deleveraging process could be slowed down if pricing is prohibitive.
Funding transformation underway but will take time
Deleveraging proceeds are expected to be used to pay down monetary authority reliance, with the Central Bank Emergency Liquidity Assistance (ELA) going first, followed by so called 'own-use bonds' the banks have been presenting at the European Central Bank (ECB) window. Covered banks' ECB reliance stood at €69.6bn at the end of November, while their ELA drawings were €45.7bn (largely IBRC).
Deposits have broadly stabilised since the recapitalisation as banks pay attractive rates and continue to be covered by the Irish government guarantee (ELG). Monthly trends in resident and non-resident deposits will continue to be closely watched.
As long as eurozone sovereign concerns persist, traditional unsecured wholesale debt markets are likely to remain closed to all but the strongest European banks, hence the €489bn take-up of the ECB's three-year facility. However, Irish financials (BKIR and IPM) had some success in 2011 in raising unguaranteed funding secured on UK mortgages.
The Department of Finance and the banks are examining wholesale funding opportunities in the Irish mortgage ACS market, and other forms of capital markets instruments are also being explored by the banks in order to continue the process of 'normalising' funding.
Rebuilding pre-provision profit (PPP) is a key medium-term objective
Healthy banks have a crucial role to play in Ireland's economic recovery, and rebuilding PPP from depleted 2011 levels will be key to restoring banks to more normal functioning.
Key themes for 2012
Deleveraging remains the key to 'rightsizing' the sector
Funding transformation underway but will take time
Rebuilding pre-provision profit is a key medium-term objective
Impairment losses will continue to be a key factor
With recapitalisation of the sector now largely complete, the focus has moved to deleveraging
Deposits have broadly stabilised since the recapitalisation as banks pay attractive rates and continue to be covered by the Irish government guarantee (ELG)
As long as eurozone sovereign concerns persist, traditional unsecured wholesale debt markets are likely to remain closed to all but the strongest European banks

Research Report: Davy on 2012 January 4, 2012
69 Davy Research
Loan re-pricing can play its part in the targeted net interest margin expansion from 2011 trough levels, but reducing funding costs – particularly the premium rates being paid on deposits – is also critical. Banks are determined to hold onto their deposits and understandably remain loathe to cut rates while customer confidence remains fragile. Low interest rates add to the challenge.
Extricating themselves from the costly government ELG would make a substantial difference to banks' PPP. The government proposed extending the ELG to end-2012 subject to the requisite EC approval (six-monthly). However, banks have been granted their requested option to offer deposits to corporate and institutional customers on an unguaranteed basis. Progress in attracting unguaranteed deposits will be watched closely; it would be a key indicator of confidence.
Impairment losses will continue to be a key factor
The Irish sector has been recapitalised to deal with anticipated impairment losses, a fact acknowledged by rating agency Moody's in its latest update. Moody's believes that the four domestic banks that are supported by the government now have the capital resources to cope with loan losses anticipated under its stress-case scenario.
The Central Bank plans a further round of stress testing in early 2012, which will reportedly include a 'deeper dive' into SME lending.
There has been a widespread focus on mortgage arrears (owner occupier 90 day+ arrears hit 8.1% at the end of September 2011 and are expected to continue to rise) and the potential for bank losses arising from any initiatives to ease the burden on struggling borrowers. Widespread debt forgiveness has predictably been ruled out, with a renewed emphasis on debt restructuring/forbearance. New modernised bankruptcy laws are planned for those in dire straits.
Trends in unemployment and house prices will continue to be closely watched. Ultimately, individual bank capital levels at the end of 2013 will depend on how well they manage their impairment losses relative to their respective PCAR assumptions.
How key stocks are positioned for 2012
Systemic banks
BKIR has emerged from an extensive sector restructuring and recapitalisation as one of Ireland's two designated Pillar banks and the only Irish bank to have avoided almost complete nationalisation. Following the bank's 2010 fundraising, the government owned 36% of the bank; however, the emergence of a new investor group in July 2011 that contributed €1.1bn towards the €1.7bn equity raised in the market diluted the government stake to 15.1%.
In contrast, the government owns 99.8% of the other Pillar bank, ALBK, which completed its merger with EBS in 2011. It also owns 99.5% of IPM. Both entities now trade on the junior market. ALBK's end-November IMS highlighted the protracted funding and
Rating agency Moody's believes that the four domestic banks that are supported by the government now have the capital resources to cope with loan losses anticipated under its stress-case scenario
ALBK's end-November IMS highlighted the protracted funding and impairment challenges it faces as it heads into 2012

Research Report: Davy on 2012 January 4, 2012
70 Davy Research
impairment challenges it faces as it heads into 2012. Reducing costs and extricating the bank from the funding guarantee are prerequisites to rebuilding pre-provision profitability.
The fate of IPM's life subsidiary, Irish Life, remains uncertain following the decision to suspend the disposal process 'in the context of continuing market uncertainty'. Given the unique capital structure of the group, we estimate incremental capital of circa €1.1bn is required to bridge the gap to IPM's €3.6bn equity capital requirement. The government is the likely source of this and could take Irish Life into state ownership once the planned separation process is concluded (targeted for end-Q1 2012).
Bank of Ireland
BKIR still faces challenges as we head into 2012. However, having successfully raised capital from market sources, it has retained its independence and is making steady progress towards its deleveraging target. Some €8.6bn of its planned €10bn loan disposals have now been completed at lower-than-anticipated discounts.
In a solid mid-November trading update, the bank stressed that asset quality remained broadly in line with its expectations as relatively improved performances in its unsecured consumer, UK mortgage and corporate banking books were being offset by some deterioration in Irish mortgage arrears in August/September 2011.
Our central case puts Bank of Ireland (BKIR) non-NAMA impairments at €6.7bn. Each €1bn is equivalent to 2.7c in the context of our end-2013 TNAV of 22.6c. Our PLAR estimate of €1.7bn, including €1.2bn for disposals of €10bn, looks conservative at this stage as €8.6bn has already been sold at an average discount of 7.1%.
BKIR is geared to an Irish recovery and, all going well, our end-2013 TNAV of 22.6c – which hinges on successfully negotiating a number of hurdles (both macro and bank-specific) – implies attractive upside from here.
In the context of a sector plagued by uncertainty, BKIR is progressing its recovery plan; we rate the shares 'outperform'.
FBD
FBD's mid-November IMS heralded a strong year for the core insurance business, driven by an improved loss ratio. The claims environment in the second half of 2011 was described as comparatively benign, with a continuing improvement in the frequency of both property and motor claims. In addition, FBD's large claims experience, net of reinsurance, had been better than expected.
Barring exceptional claims events during the remainder of the year, FBD expressed confidence that it could deliver full year 2011 operating earnings per share of 155-165c (up 46% to 56% on 2010), an increase of 10c on previous guidance (already raised by 10% at the interim stage). Our upgraded 2011 forecasts assume a combined
BKIR still faces challenges as we head into 2012. However, having successfully raised capital from market sources, it has retained its independence and is making steady progress towards its deleveraging target.
In the context of a sector plagued by uncertainty, BKIR is progressing its recovery plan
FBD's mid-November IMS heralded a strong year for the core insurance business, driven by an improved loss ratio

Research Report: Davy on 2012 January 4, 2012
71 Davy Research
operating ratio (COR) of 91.6%, the best outcome for the core insurance business since 2007 (COR of 83%).
During 2011 the group tackled what had become a thorny issue for investors; namely, its exposure to property in Ireland and Spain. The agreed joint venture with Farmer Business Developments to manage and control the €160m of non-core hotel and leisure assets removes related debt from the balance sheet and will reduce the downside from any further asset valuation adjustments.
The move will refocus investor attention on the solidly performing insurance company, helped by equity accounting of the joint venture. In this respect, FBD cautions that investment returns are likely to remain below historic norms but stresses that it is well positioned to deliver profitable growth and superior returns in the future.
IFG
IFG's recurring income streams have been showing their resilience in challenging markets, with overall group revenues holding up well. In its mid-November IMS, it predicted a marginally lower second half after its strong first half as the International business encountered difficult market conditions, leaving it on track for 2011 as a whole.
The UK operations, encompassing SIPP provider James Hay (JH) and Saunderson House, are the key drivers of the group's fortunes. Both businesses were trading ahead of the comparable period in 2010 at the IMS stage.
The total number of SIPPs stood at 38,513 at the end of October, in line with IFG's expectations as a slightly better-than-expected attrition rate at JH (9.5% versus 10% planned) compensated for the fact that new sales initiatives had yet to make a significant impact.
New SIPPs totalled 1,254 in H1 2011 and were running at 1,861 to end-October, implying a slowdown in the latter months.
The International Trust and Corporate Services business is operating in difficult market conditions and although fees have shown resilience, client activity has remained subdued. IFG continues to pursue business development opportunities while targeting £0.5m cost savings.
IFG's financial position has continued to strengthen with net debt expected to be down to mid-single-digit million (sterling) by year-end.
Takeover talks in summer 2010 provided some distraction for IFG and its investors. Since September, however, when it announced that both it and its suitor, Bregal, had agreed to discontinue takeover discussions (citing dislocation in global markets), it has been back to business as usual.
2012 looks set to be another challenging year, but the group will be aiming to continue to prove its resilience.
Our upgraded 2011 forecasts assume a combined operating ratio (COR) of 91.6%, the best outcome for the core insurance business since 2007 (COR of 83%)
IFG's UK operations, encompassing SIPP provider James Hay and Saunderson House, are the key drivers of the group's fortunes
IFG's financial position has continued to strengthen with net debt expected to be down to mid-single-digit million (sterling) by year-end

72 Davy Research
Research Report: Davy on 2012 January 4, 2012
S H A R E P R I C E A N D P E R F O R M A N C E Price 12 Month Mkt. Cap Change % (€) Rel to E300 sector % ROE % Local High Low €m Wk 1 Mth YTD Wk 1 Mth YTD 2011 2012 2013
Allied Irish Banks (ALBK ID) 7 33 4 35398 15.0 6.2 -77.0 15.3 4.0 -66.4 N/A N/A N/ABank of Ireland (BKIR ID) 8 40 7 2471 -5.8 -11.8 -78.0 -5.5 -13.6 -67.8 N/A N/A N/ABanks (2) 51 223 42 2471 -4.8 -11.1 -75.9 -4.6 -12.9 -64.8 UK Banks Barclays (BARC LN) 176 334 139 25738 -1.5 0.2 -30.9 -1.3 -1.8 1.1 6.4 7.1 7.9 Lloyds Banking Group (LLOY LN) 26 70 22 21366 1.0 7.1 -59.5 1.2 4.9 -40.8 N/A 4.6 7.3 RBoS (RBS LN) 20 49 17 26664 -1.6 -1.3 -46.9 -1.4 -3.3 -22.4 0.9 3.5 4.9 UK banks index (3) 69 158 57 73768 -0.7 1.6 -47.3 -0.5 -0.5 -23.0 Austrian Banks Erste Bank (EBS AV) 1359 3945 1065 5199 2.1 5.9 -61.3 2.4 3.8 -43.5 N/A 8.3 10.1 Raiffeisen Bank (RBI AV) 2007 4510 1416 3923 -3.2 14.7 -51.1 -3.0 12.4 -28.4 9.8 10.4 11.2 Austrian banks index (2) 1000 2606 750 9122 -0.2 9.5 -57.5 0.0 7.3 -37.8 Benelux Banks KBC (KBC BB) 973 3255 773 3484 -1.0 17.2 -61.8 -0.7 14.9 -44.2 7.3 12.5 14.9 Dexia (DEXB BB) 30 351 24 579 -6.3 -20.8 -88.6 -6.1 -22.4 -83.3 N/A 9.1 8.5 Benelux banks index (2) 182 825 154 4062 -1.8 9.7 -71.3 -1.5 7.5 -58.1 French Banks Credit Agricole (ACA FP) 436 1272 398 10891 -1.3 -8.3 -54.1 -1.0 -10.1 -32.9 4.8 6.3 7.6 BNP Paribas (BNP FP) 3035 5897 2306 36655 0.2 3.0 -36.3 0.4 0.9 -6.8 9.5 10.0 9.9 Societe Generale (GLE FP) 1721 5204 1505 13352 -0.1 -4.8 -57.2 0.2 -6.8 -37.5 7.0 7.6 7.5 Natixis (KN FP) 194 432 170 5992 -2.8 -9.5 -44.5 -2.6 -11.3 -18.8 7.7 7.3 7.4 French banks index (4) 422 973 356 66891 -0.4 -1.8 -45.7 -0.2 -3.8 -20.6 Greek Banks Alpha Bank (ALPHA GA) 54 533 43 287 14.5 -21.5 -85.8 14.7 -23.0 -79.3 N/A N/A 1.2 EFG Eurobank (EUROB GA) 38 526 30 210 18.4 -20.9 -89.9 18.7 -22.5 -85.2 N/A N/A N/ANatl. Bank of Greece (ETE GA) 162 776 147 1549 0.6 -18.6 -73.2 0.9 -20.2 -60.9 N/A 2.2 4.9 Greek banks index (3) 39 245 35 2046 4.0 -19.3 -79.3 4.2 -20.9 -69.8 German Banks Commerzbank (CBK GY) 130 508 115 6663 -2.8 -6.2 -70.7 -2.6 -8.1 -57.2 2.6 6.5 8.2 Deutsche Bank (DBK GY) 2944 4854 2140 27360 -1.2 2.9 -24.7 -1.0 0.8 10.1 8.8 8.5 8.7 Deutsche Postbank (DPB GY) 2414 2437 2007 5281 0.9 14.3 16.0 1.1 12.0 69.7 1.5 8.5 9.1 German banks index (3) 302 543 247 39303 -1.2 2.6 -33.6 -1.0 0.5 -3.0 Italian Banks Intesa Sanpaolo Spa (ISP IM) 129 242 87 21265 -1.2 5.4 -32.0 -1.0 3.3 -0.6 3.9 4.3 5.1 Unicredit SpA (UCG IM) 642 1998 641 12374 -7.0 -17.0 -58.5 -6.8 -18.6 -39.4 2.1 4.1 5.5 Banca Monte Dei P. (BMPS IM) 25 86 24 2908 -2.4 1.2 -65.0 -2.1 -0.9 -48.8 2.1 2.6 3.3 UBI Banca (UBI IM) 317 738 220 2855 -3.4 4.8 -48.4 -3.1 2.7 -24.5 1.7 1.9 3.0 Mediobanca (MB IM) 445 803 432 3829 -6.5 -7.2 -33.2 -6.3 -9.1 -2.4 5.5 6.8 8.5 Italian banks index (5) 1261 2942 1133 43231 -3.6 -3.5 -45.9 -3.4 -5.5 -20.9 Nordic Banks Danske Bank (DANSKE DC) 7295 14800 6375 9146 0.4 -5.2 -48.9 0.7 -7.1 -25.3 2.4 6.6 8.5 Nordea (NDA SS) 5325 7960 4803 24206 -0.6 1.2 -26.8 -0.4 -0.8 7.0 10.2 11.0 11.2 SE Banken (SEBA SS) 4009 6165 3125 9880 -1.5 4.3 -28.2 -1.2 2.2 5.1 10.7 9.1 9.3 DNB NOR ASA (DNB NO) 5855 9065 5125 12314 1.6 -1.7 -28.2 1.9 -3.7 5.0 10.6 11.1 11.2 Svenska Handelsbanken (SHBA SS) 18100 22440 15000 12687 -1.1 3.8 -15.3 -0.8 1.7 23.8 12.9 12.2 12.0 Swedbank (SWEDA SS) 8915 11890 6890 9664 0.5 1.1 -4.5 0.7 -1.0 39.7 13.6 11.0 11.3 Nordic banks index (6) 865 1254 750 77897 -0.3 0.7 -26.6 0.0 -1.4 7.3 Portuguese Banks Banco Comercial P. (BCP PL) 14 65 10 980 16.2 7.1 -76.6 16.5 4.9 -65.8 1.2 1.7 2.2 Banco Espirito Santo (BES PL) 135 328 99 1973 15.2 18.2 -53.1 15.5 15.8 -31.5 4.4 3.8 5.5 Banco BPI (BPIN PL) 48 145 40 476 8.6 1.5 -65.3 8.8 -0.6 -49.2 9.1 7.0 9.2 Portuguese banks index (3) 77 243 59 3429 14.5 13.4 -64.8 14.8 11.1 -48.5 Spanish Banks Banco Popular Espanol (POP SM) 352 465 280 4929 -1.7 11.0 -8.3 -1.5 8.8 34.0 5.3 4.8 6.5 BBVA (BBVA SM) 668 943 514 32753 1.3 6.5 -11.6 1.5 4.3 29.2 11.1 11.0 11.2 Banco Sabadell (SAB SM) 293 363 225 4078 -5.4 17.8 -0.5 -5.1 15.5 45.4 4.5 4.3 6.2 Banco Espanol Credito (BTO SM) 373 676 329 2561 0.1 4.2 -39.9 0.4 2.1 -12.2 6.5 6.8 7.9 Banco Santander (SAN SM) 587 932 513 50290 0.6 4.8 -26.0 0.8 2.7 8.3 9.7 9.7 10.4 Spanish banks index (5) 527 788 447 94610 0.4 6.2 -20.4 0.7 4.1 16.5 Swiss Banks Credit Suisse (CSGN VX) 2207 4499 1965 21858 -0.4 1.6 -39.8 -0.1 -0.4 -12.0 8.6 10.7 11.1 UBS AG (UBSN VX) 1118 1893 966 35271 -1.0 1.1 -25.2 -0.8 -0.9 9.4 8.6 9.5 9.9 EFG International (EFGN SW) 711 1465 572 859 -1.9 10.0 -42.9 -1.6 7.7 -16.5 11.7 11.7 13.6 Julius Baer Group (BAER VX) 3674 4460 2708 6250 -0.2 14.1 -13.8 0.1 11.8 26.0 10.4 11.5 12.6 Swiss banks index (4) 385 639 335 64238 -0.8 2.5 -30.2 -0.6 0.4 2.1 European banks index (41) 266 520 230 481069 -0.6 1.6 -39.7 -0.4 -0.4 -11.8 FTSE E300 Banks (E3BANK) 362 615 316 -0.2 2.1 -31.6

73 Davy Research
Research Report: Davy on 2012 January 4, 2012
V A L U A T I O N EPS (c) EPS Gth % Div Yield % Div Cover Price/Book P/E 2011 2012 2013 11-13 2011 2012 2011 2011 2012 2013 2011 2012 2013
Allied Irish Banks (ALBK ID) -0 -1 -0 N/A 0.0 0.0 N/A 3.11 4.22 5.68 N/A N/A N/A Bank of Ireland (BKIR ID) -9 -2 -1 N/A 0.0 0.0 N/A 0.32 0.35 0.35 N/A N/A N/A Banks (2) N/A N/A N/A 0.32 0.35 0.35 N/A N/A N/A UK Banks Barclays (BARC LN) 27 34 40 49.2 3.4 4.3 4.5 0.41 0.40 0.37 6.6 5.2 4.4 Lloyds Banking Group (LLOY LN) 1 3 5 N/A 0.0 0.0 N/A 0.40 0.40 0.38 50.8 9.1 5.2 RBoS (RBS LN) 1 2 4 483.3 0.0 0.0 N/A 0.31 0.31 0.29 33.6 8.8 5.8 UK banks index (3) 3.4 4.3 5.8 0.37 0.36 0.34 14.4 7.2 5.1 Austrian Banks Erste Bank (EBS AV) -114 238 322 N/A 0.0 3.7 N/A 0.50 0.48 0.44 N/A 5.7 4.2 Raiffeisen Bank (RBI AV) 350 411 482 37.6 0.0 3.7 N/A 0.53 0.50 0.47 5.7 4.9 4.2 Austrian banks index (2) N/A 3.7 N/A 0.52 0.49 0.45 5.7 5.3 4.2 Benelux Banks KBC (KBC BB) 195 411 520 166.6 1.3 7.1 15.3 0.32 0.29 0.28 5.0 2.4 1.9 Dexia (DEXB BB) -197 39 45 N/A 0.0 12.8 N/A 0.07 0.07 0.06 N/A 0.8 0.7 Benelux banks index (2) 1.3 7.9 15.3 0.21 0.20 0.18 5.0 1.8 1.5 French Banks Credit Agricole (ACA FP) 107 139 147 37.7 0.0 9.2 N/A 0.24 0.23 0.23 4.1 3.1 3.0 BNP Paribas (BNP FP) 546 619 639 17.1 5.4 5.7 3.3 0.53 0.49 0.47 5.6 4.9 4.7 Societe Generale (GLE FP) 402 446 478 19.0 0.0 7.8 N/A 0.31 0.29 0.27 4.3 3.9 3.6 Natixis (KN FP) 43 42 47 8.1 9.8 8.8 2.3 0.35 0.34 0.32 4.5 4.6 4.2 French banks index (4) 6.0 7.0 5.3 0.38 0.36 0.34 4.9 4.3 4.0 Greek Banks Alpha Bank (ALPHA GA) -21 -10 10 N/A 0.0 0.0 N/A 0.08 0.08 0.08 N/A N/A 5.4 EFG Eurobank (EUROB GA) -50 -17 -4 N/A 0.0 0.0 N/A 0.06 0.07 0.07 N/A N/A N/A Natl. Bank of Greece (ETE GA) -7 18 46 N/A 0.0 0.0 N/A 0.20 0.20 0.18 N/A 9.0 3.5 Greek banks index (3) N/A N/A N/A 0.14 0.14 0.14 N/A 9.0 3.7 German Banks Commerzbank (CBK GY) 10 31 40 300.0 0.0 0.0 N/A 0.31 0.28 0.27 13.0 4.2 3.3 Deutsche Bank (DBK GY) 493 518 570 15.5 2.5 2.5 6.6 0.52 0.49 0.45 6.0 5.7 5.2 Deutsche Postbank (DPB GY) 38 246 284 N/A 0.0 0.0 N/A 0.94 0.86 0.78 64.0 9.8 8.5 German banks index (3) 2.5 2.5 7.4 0.49 0.46 0.42 7.6 5.7 4.9 Italian Banks Intesa Sanpaolo Spa (ISP IM) 15 16 19 26.7 6.2 6.2 1.9 0.36 0.35 0.35 8.6 8.1 6.8 Unicredit SpA (UCG IM) 60 120 165 174.4 0.0 4.7 N/A 0.23 0.22 0.21 10.7 5.4 3.9 Banca Monte Dei P. (BMPS IM) 3 4 5 70.3 3.5 6.0 3.4 0.17 0.17 0.16 8.4 6.3 4.9 UBI Banca (UBI IM) 22 32 40 80.8 3.2 4.0 2.2 0.25 0.24 0.24 14.4 9.9 8.0 Mediobanca (MB IM) 43 55 71 65.1 3.8 3.8 2.5 0.57 0.55 0.53 10.3 8.1 6.3 Italian banks index (5) 5.4 5.4 2.7 0.29 0.28 0.27 9.5 7.0 5.5 Nordic Banks Danske Bank (DANSKE DC) 384 910 1298 238.5 0.9 4.1 5.6 0.54 0.51 0.48 19.0 8.0 5.6 Nordea (NDA SS) 592 668 726 22.7 4.9 5.4 2.3 0.93 0.87 0.82 9.0 8.0 7.3 SE Banken (SEBA SS) 527 468 498 -5.5 5.0 5.2 2.6 0.82 0.77 0.73 7.6 8.6 8.1 DNB NOR ASA (DNB NO) 760 849 892 17.3 6.3 6.8 2.1 0.82 0.77 0.73 7.7 6.9 6.6 Svenska Handelsbanken (SHBA SS) 1940 1952 2030 4.6 5.5 5.6 1.9 1.20 1.12 1.06 9.3 9.3 8.9 Swedbank (SWEDA SS) 1220 1054 1062 -13.0 7.0 6.1 2.0 0.99 0.94 0.91 7.3 8.5 8.4 Nordic banks index (6) 5.0 5.6 2.2 0.86 0.81 0.77 8.9 8.1 7.3 Portuguese Banks Banco Comercial P. (BCP PL) 1 1 2 93.3 0.0 0.0 N/A 0.15 0.16 0.15 13.0 13.0 6.7 Banco Espirito Santo (BES PL) 21 22 28 30.7 3.7 0.0 4.3 0.28 0.27 0.27 6.3 6.2 4.8 Banco BPI (BPIN PL) 13 11 16 20.0 0.0 0.0 N/A 0.34 0.32 0.29 3.7 4.4 3.1 Portuguese banks index (3) 3.7 N/A 7.1 0.23 0.23 0.22 6.6 6.8 4.8 Spanish Banks Banco Popular Espanol (POP SM) 30 29 38 26.7 5.1 4.6 1.7 0.62 0.60 0.60 11.7 12.1 9.3 BBVA (BBVA SM) 88 91 100 13.6 6.3 6.3 2.1 0.84 0.82 0.75 7.6 7.3 6.7 Banco Sabadell (SAB SM) 17 17 24 38.2 2.8 2.9 2.1 0.78 0.74 0.75 17.3 17.3 12.5 Banco Espanol Credito (BTO SM) 57 60 70 22.8 6.8 7.3 2.3 0.45 0.44 0.42 6.6 6.2 5.3 Banco Santander (SAN SM) 86 88 96 11.1 10.2 10.2 1.4 0.67 0.65 0.63 6.8 6.7 6.1 Spanish banks index (5) 8.2 8.2 1.7 0.71 0.69 0.66 7.4 7.2 6.5 Swiss Banks Credit Suisse (CSGN VX) 239 320 363 51.9 2.9 3.4 3.7 0.80 0.74 0.67 9.2 6.9 6.1 UBS AG (UBSN VX) 119 144 166 38.6 0.9 1.3 11.9 0.81 0.74 0.68 9.4 7.8 6.8 EFG International (EFGN SW) 66 80 102 54.5 1.4 1.4 6.6 1.32 1.11 0.95 10.8 8.9 7.0 Julius Baer Group (BAER VX) 220 260 302 37.3 1.6 1.9 3.7 1.69 1.60 1.49 16.7 14.1 12.2 Swiss banks index (4) 1.7 2.1 6.1 0.85 0.78 0.72 9.8 7.8 6.8 European banks index (41) 5.0 5.5 3.0 0.49 0.47 0.45 8.4 6.5 5.5

74 Davy Research
Research Report: Davy on 2012 January 4, 2012 S H A R E P R I C E A N D P E R F O R M A N C E Price 12 Month Mkt. Cap Change % (€) Rel to E300 sector % ROE % Local High Low €m Wk 1 Mth YTD Wk 1 Mth YTD 2011 2012 2013
Eastern European Banks Bank Pekao (PEO PW) 14120 18300 12340 8338 -2.6 -2.5 -30.0 -2.4 -4.5 2.4 13.5 13.5 14.4 BPH (BPH PW) 3170 7700 2982 547 6.3 -23.6 -60.4 6.6 -25.1 -42.1 4.4 5.4 7.0 BRE Bank (BRE PW) 24600 34900 20770 2331 2.0 -8.0 -28.2 2.2 -9.8 5.0 13.0 11.8 11.5 PKO Bank Polski (PKO PW) 3212 4630 2922 9037 -1.9 -2.9 -34.2 -1.7 -4.9 -3.8 17.0 16.5 16.4 ING Bank Slaski (BSK PW) 7860 9150 6660 2302 0.4 3.9 -22.0 0.6 1.8 14.1 14.2 13.4 13.2 Komercni Bank (KOMB CP) 332000 450700 293500 4937 2.9 6.2 -27.1 3.2 4.1 6.5 13.5 15.8 16.0 OTP Bank (OTP HB) 321800 645000 279800 2859 -6.2 -7.1 -43.8 -5.9 -9.0 -17.9 8.0 9.2 11.2 Eastern Eur. banks index (7) 2092 3327 1911 30350 -1.3 -2.3 -32.6 -1.0 -4.3 -1.4 Retail banks index (13) 176 370 151 205167 -1.0 0.8 -43.8 -0.7 -1.3 -17.8 Wholesale banks index (6) 409 795 345 141160 -0.7 1.0 -37.6 -0.5 -1.0 -8.8 US Banks Citigroup (C US) 2631 5130 2311 59377 -3.4 -0.6 -42.6 -3.2 -2.6 -16.1 6.5 6.6 7.2 Bank of America (BAC US) 556 1525 499 43501 0.1 6.1 -57.0 0.3 3.9 -37.1 0.1 4.4 5.5 BB&T Corp (BBT US) 2517 2917 1917 13544 -0.5 12.8 -1.2 -0.2 10.5 44.4 7.1 8.8 10.0 Fifth Third Bancorp (FITB US) 1272 1552 925 9031 -0.2 9.2 -10.6 0.1 7.0 30.7 8.6 9.3 9.2 Goldman Sachs Group (GS US) 9043 17500 8770 35694 -2.8 -2.1 -44.5 -2.6 -4.1 -18.9 3.9 9.1 9.1 JPMorgan Chase (JPM US) 3325 4800 2838 97524 -0.2 11.4 -19.1 0.1 9.2 18.2 9.6 9.6 9.9 KeyCorp (KEY US) 769 971 571 5656 -0.4 9.5 -10.4 -0.2 7.3 31.1 8.7 7.1 6.8 Morgan Stanley (MS US) 1513 3099 1247 22510 -3.3 6.2 -42.6 -3.0 4.0 -16.1 4.7 6.0 6.7 M&T Bank Corp (MTB US) 7634 9101 6743 7403 0.1 8.6 -9.5 0.3 6.4 32.3 10.0 9.4 9.5 PNC (PNC US) 5767 6494 4298 23420 -0.8 10.4 -2.0 -0.5 8.2 43.3 9.9 9.2 9.1 Suntrust (STI US) 1770 3259 1580 7337 0.5 1.3 -38.1 0.7 -0.7 -9.5 3.0 4.8 6.6 US Bancorp (USB US) 2705 2870 2031 39847 -0.8 8.3 3.5 -0.6 6.1 51.3 14.5 14.5 14.6 Wells Fargo (WFC US) 2756 3410 2288 112187 -0.1 10.6 -8.3 0.2 8.4 34.2 11.5 11.9 12.3 US banks index (13) 3148 4700 2670 477032 -1.1 7.2 -27.9 -0.8 5.0 5.5 Global aggregate (61) 369 630 316 988451 -0.9 4.1 -34.8 -0.6 2.0 -4.6 FTSE E300 Banks (E3BANK) 362 615 316 -0.2 2.1 -31.6
V A L U A T I O N EPS (c) EPS Gth % Div Yield % Div Cover Price/Book P/E 2011 2012 2013 11-13 2011 2012 2011 2011 2012 2013 2011 2012 2013
Eastern European Banks Bank Pekao (PEO PW) 1086 1134 1242 14.4 5.4 6.3 1.4 1.74 1.68 1.62 13.0 12.5 11.4 BPH (BPH PW) 257 336 479 86.6 0.0 0.0 N/A 0.54 0.51 0.47 12.4 9.4 6.6 BRE Bank (BRE PW) 2455 2486 2626 7.0 0.0 2.9 N/A 1.30 1.20 1.08 10.0 9.9 9.4 PKO Bank Polski (PKO PW) 310 328 358 15.8 4.3 4.7 2.2 1.76 1.60 1.46 10.4 9.8 9.0 ING Bank Slaski (BSK PW) 707 725 789 11.6 2.6 3.5 3.5 1.61 1.46 1.33 11.1 10.8 10.0 Komercni Bank (KOMB CP) 32172 34430 36874 14.6 6.2 7.6 1.6 1.60 1.52 1.44 10.3 9.6 9.0 OTP Bank (OTP HB) 38609 50476 67687 75.3 3.3 5.0 3.6 0.63 0.58 0.54 8.3 6.4 4.8 Eastern Eur. banks index (7) 4.7 5.4 2.2 1.40 1.30 1.21 10.8 9.9 8.8 Retail banks index (13) 4.7 5.5 3.0 0.43 0.41 0.40 10.8 6.8 5.4 Wholesale banks index (6) 3.0 3.7 5.8 0.55 0.51 0.47 6.7 5.6 5.1 US Banks Citigroup (C US) 396 434 500 26.3 0.1 1.3 132.0 0.43 0.40 0.38 6.6 6.1 5.3 Bank of America (BAC US) 1 96 125 N/A 0.7 0.7 0.3 0.27 0.26 0.24 N/A 5.8 4.4 BB&T Corp (BBT US) 181 236 286 58.2 2.6 3.0 2.8 0.99 0.93 0.87 13.9 10.7 8.8 Fifth Third Bancorp (FITB US) 121 140 150 24.0 2.2 2.9 4.3 0.91 0.84 0.78 10.5 9.1 8.5 Goldman Sachs Group (GS US) 519 1300 1389 167.8 1.5 1.5 3.7 0.68 0.63 0.59 17.4 7.0 6.5 JPMorgan Chase (JPM US) 450 483 538 19.6 3.0 3.6 4.5 0.71 0.66 0.61 7.4 6.9 6.2 KeyCorp (KEY US) 89 78 80 -10.1 1.3 2.3 8.9 0.75 0.70 0.65 8.6 9.9 9.6 Morgan Stanley (MS US) 147 195 235 60.3 1.3 1.3 7.3 0.48 0.46 0.43 10.3 7.8 6.4 M&T Bank Corp (MTB US) 683 685 730 7.0 3.7 3.7 2.4 1.11 1.05 0.99 11.2 11.1 10.5 PNC (PNC US) 621 620 660 6.3 2.0 2.8 5.4 0.91 0.85 0.79 9.3 9.3 8.7 Suntrust (STI US) 112 186 273 143.3 0.7 2.0 9.3 0.47 0.45 0.43 15.8 9.5 6.5 US Bancorp (USB US) 239 265 290 21.3 1.8 2.6 4.8 1.64 1.48 1.36 11.3 10.2 9.3 Wells Fargo (WFC US) 281 320 358 27.2 1.7 2.6 5.9 1.12 1.03 0.95 9.8 8.6 7.7 US banks index (13) 1.7 2.4 5.8 0.64 0.60 0.56 10.0 7.5 6.6 Global aggregate (61) 3.2 3.9 3.8 0.57 0.54 0.51 9.2 7.0 6.1

75 Davy Research
Research Report: Davy on 2012 January 4, 2012 S H A R E P R I C E A N D P E R F O R M A N C E Price 12 Month Mkt. Cap Change % (€) Rel to E300 sector % ROE % Local High Low €m Wk 1 Mth YTD Wk 1 Mth YTD 2011 2012 2013
FBD Holdings (FBD ID) 650 810 609 216 2.4 -0.8 4.8 2.4 -2.6 20.9 26.1 21.7 19.2 Irish Life & Permanent (IPM ID) 2 101 2 877 20.0 -25.0 -97.8 20.0 -26.4 -97.4 N/A N/A N/AGeneral Insurance Admiral Group (ADM LN) 852 1754 787 2766 2.6 -5.2 -42.2 2.6 -6.9 -33.3 56.0 55.7 56.1 Allianz (ALV GR) 7343 10785 5775 33431 -3.5 -3.7 -17.5 -3.5 -5.4 -4.8 7.5 10.9 10.8 Amlin (AML LN) 314 427 271 1869 0.5 -4.0 -21.1 0.5 -5.7 -9.0 N/A 13.6 14.6 AXA (CS FP) 1005 1611 816 23678 -2.1 -6.3 -19.3 -2.1 -8.0 -6.9 9.4 9.0 9.4 Catlin Group (CGL LN) 399 421 334 1725 3.1 -1.1 10.7 3.1 -2.9 27.7 N/A 10.9 10.9 Mapfre (MAP SM) 246 287 203 7560 -1.6 -1.1 18.1 -1.6 -2.9 36.3 13.8 13.9 13.4 Generali (G IM) 1163 1699 1065 18106 1.6 -5.5 -18.2 1.6 -7.2 -5.6 7.7 12.1 12.1 RSA Insurance (RSA LN) 105 144 100 4452 0.9 -0.2 -13.7 0.9 -2.0 -0.4 13.8 13.1 13.3 General insurance (9) 458 668 395 93804 -1.4 -4.3 -16.7 -1.4 -6.1 -3.9 Life Insurance Aegon (AGN NA) 310 568 268 5922 -1.5 -4.0 -32.2 -1.5 -5.7 -21.8 5.6 6.0 6.3 Aviva (AV/ LN) 301 478 275 10475 0.4 -1.0 -21.4 0.4 -2.8 -9.3 11.1 11.6 11.6ING Groep (INGA NA) 556 941 449 21303 -2.1 -3.1 -23.6 -2.1 -4.9 -11.9 12.2 10.7 10.3 Legal & General (LGEN LN) 103 124 90 7236 0.4 -0.6 9.2 0.4 -2.4 26.0 14.8 14.6 14.0 Old Mutual (OML LN) 136 145 98 9032 0.3 22.6 13.1 0.3 20.4 30.5 9.6 10.3 10.4 Prudential (PRU LN) 639 777 509 19500 2.4 5.2 -1.8 2.4 3.3 13.3 16.9 17.6 17.3 Life insurance (6) 649 905 531 73468 0.1 2.2 -13.2 0.1 0.3 0.1 European insurance (15) 390 555 329 167272 -0.8 -1.6 -15.2 -0.8 -3.4 -2.2 FTSE E300 Life Insurance (E3LIFE) 235 330 196 0.0 1.9 -13.3
V A L U A T I O N EPS (c) EPS Gth % Div Yield % Div Cover Price/Book P/E 2011 2012 2013 11-13 2011 2012 2011 2011 2012 2013 2011 2012 2013
FBD Holdings (FBD ID) 151 149 154 1.5 5.1 5.4 4.6 1.03 0.87 0.76 4.3 4.4 4.2 Irish Life & Permanent (IPM ID) -4 -1 -0 N/A 0.0 0.0 N/A 0.19 0.20 0.20 N/A N/A N/A General Insurance Admiral Group (ADM LN) 80 92 100 24.7 8.5 9.7 1.1 6.01 5.30 4.94 10.6 9.3 8.5 Allianz (ALV GR) 823 1170 1220 48.2 6.1 6.2 1.8 0.74 0.68 0.64 8.9 6.3 6.0 Amlin (AML LN) -17 47 53 N/A 7.3 7.7 N/A 1.03 0.97 0.90 N/A 6.7 5.9 AXA (CS FP) 173 192 206 19.4 6.9 7.9 2.5 0.49 0.47 0.46 5.8 5.2 4.9 Catlin Group (CGL LN) -7 57 65 N/A 7.1 7.5 N/A 0.80 0.75 0.71 N/A 7.0 6.1 Mapfre (MAP SM) 33 34 34 2.8 6.1 6.5 2.2 1.07 1.00 0.94 7.3 7.2 7.1 Generali (G IM) 83 139 150 80.5 3.0 4.7 2.4 1.12 1.02 0.93 14.0 8.4 7.7 RSA Insurance (RSA LN) 15 16 16 5.4 8.9 9.3 1.6 0.98 0.93 0.89 7.0 6.8 6.6 General insurance (9) 6.0 6.7 2.0 0.75 0.70 0.66 8.1 6.4 6.1 Life Insurance Aegon (AGN NA) 51 56 63 24.0 3.2 6.4 5.1 0.35 0.33 0.31 6.1 5.5 4.9 Aviva (AV/ LN) 54 53 58 7.8 8.9 9.4 2.0 0.64 0.62 0.58 5.6 5.6 5.2 ING Groep (INGA NA) 144 131 139 -3.0 N/A 3.6 N/A 0.47 0.45 0.40 3.9 4.3 4.0 Legal & General (LGEN LN) 13 15 15 14.1 5.8 6.5 2.3 1.14 1.04 0.95 7.7 7.1 6.7 Old Mutual (OML LN) 17 19 20 17.8 3.5 4.4 3.6 0.76 0.74 0.69 7.9 7.2 6.7 Prudential (PRU LN) 59 65 72 23.0 3.9 4.1 2.3 1.82 1.71 1.52 10.9 9.9 8.8 Life insurance (6) 5.0 5.2 4.7 0.69 0.65 0.60 6.0 6.0 5.6 European insurance (15) 5.6 6.0 2.8 0.72 0.68 0.63 7.0 6.2 5.8
Research Report: Davy on 2012 January 4, 2012
76 Davy Research
Media Sector performance in 2011
Despite a promising start to the year, concerns regarding a number of countries in the eurozone hit media stocks hard from the end of the first quarter. The FTSE E300 Media Index finished the year down 6.3%, although (perhaps surprisingly) the sector outperformed the FTSE All World, which was down 8.5%.
A more in-depth look at individual stock performances across the sector reveals that online and digitally-focused companies outperformed their newspaper-centric peers.
At the start of the year, we identified Independent News & Media (INM) as our preferred pick, supported by strong cash generation and a renewed focus on the operations of the core business. While the underlying business performed broadly as expected during the year, the group's share price performance was weighed heavily by its investment in APN News & Media, which fell 63% during the year.
INM is again our top pick within the sector. While the valuation is undemanding, strong cash generation, debt reduction and the potential for a recovery in the value of APN should support the stock in 2012.
Key themes for 2012
Broader economic conditions the driving factor
Most companies are entering 2012 on a cautious footing, as noted in the majority of recent trading updates.
The key reason for management caution relates to the unknown economic impact of the austerity measures being implemented by European governments combined with concerns for the survival of the eurozone as a whole. Either way, policies will not favour economic growth, which will directly feed through to the cyclical media sector.
We believe that a longer-term investment case for the sector remains. However, the first half of 2012 and possibly beyond is likely to be overshadowed by a delayed recovery due to adverse fiscal tightening.
Cash generation and balance sheet strength desirable
Until there is an improvement in the economic climate, particularly in Europe, most media stocks are likely to continue to find trading difficult. Despite this, the market is likely to reward those companies that can deliver strong cash generation and have strong balance sheets.
Reduced reliance on debt markets and deft financing should also be rewarded in 2012.
Simon McGrotty [email protected]
Despite a promising start to the year, concerns regarding a number of countries in the eurozone hit media stocks hard from the end of the first quarter
INM is our top pick within the sector
Key themes for 2012
Broader economic conditions the driving factor
Cash generation and balance sheet strength desirable

Research Report: Davy on 2012 January 4, 2012
77 Davy Research
How key stocks are positioned for 2012
Independent News & Media – focus on cash generation continues
INM offers more than just a play on an Irish economic recovery; often forgotten is the 49% of EBIT that is generated from its South African business. INM is one of the cheapest stocks in the sector. After adjusting for the value of its stake in APN, worth €110.4m, the core group trades on only 4.9x 2012 EBITDA.
Management's near-term focus will remain on cash generation and deleveraging. We expect the group to deliver free cash flow of c.€40m (35% yield) over the coming years, all of which will be directed towards debt reduction.
UTV – balance sheet continues to improve scope for dividend growth
UTV continues to make good progress on deleveraging. At end-2011, we see net debt of 2.0x, having come down from 3.5x in two years. The balance sheet is now in far better shape than it once was.
A more comfortable leverage position potentially allows for a more meaningful dividend to be paid to shareholders while the group continues to pay down debt. We expect dividends to rise by 26% for FY 2011 followed by further increases in 2012 and 2013 with debt still being paid down. Depending on targets for debt levels, there is scope for upside to our dividend expectations.
The group's continued growth outside Ireland, through the success of talkSPORT and Sport Magazine in particular, should mitigate weakness in this market.
TVC Holdings – discount to book value continues
TVC continues to trade at a significant discount to its book value and its book value excluding cash. Near-term performance is likely to be driven by variations in the value of its underlying assets. With €73m in cash on the balance sheet, this provides TVC with the flexibility to acquire assets at attractive prices, which should assist in closing the discount between the stock price and its book value.
Any additional shareholder returns from UTV will benefit TVC through its 18% shareholding.
INM is one of the cheapest stocks in the sector
UTV is making good progress on deleveraging
TVC Holdings continues to trade at a significant discount to its book value and its book value excluding cash

78 Davy Research
Research Report: Davy on 2012 January 4, 2012 S H A R E P R I C E A N D P E R F O R M A N C E Price 12 Month Mkt. Cap Change % (€) Rel to E300 sector % Pr/Bk Debt/EBITDA Local High Low €m Wk 1 Mth YTD Wk 1 Mth YTD 2011 2011 2012
Independent News & Media (INM ID) 21 64 20 113 0.0 -5.1 -59.2 -1.6 -6.5 -56.8 1.72 5.1 4.9 UK Sector Daily Mail (DMGT LN) 400 595 343 1835 1.9 1.5 -28.4 0.3 0.0 -24.2 N/A 2.0 1.8 Johnston Press (JPR LN) 6 13 4 48 16.4 38.7 -46.5 14.6 36.6 -43.3 0.09 4.4 4.0 Pearson (PSON LN) 1210 1222 983 11830 -0.2 7.7 23.4 -1.8 6.1 30.6 1.72 0.8 0.4 Trinity Mirror (TNI LN) 48 93 38 148 -1.9 2.6 -29.0 -3.5 1.1 -24.8 0.17 1.6 1.3 UK newspapers (5) 352 352 291 14138 0.3 7.0 11.3 -1.4 5.4 17.9 1.66 1.3 1.0 European Sector De Telegraaf (TELEG NA) 995 1620 937 475 2.8 -4.1 -33.4 1.2 -5.5 -29.5 0.89 -0.1 -0.2 Espresso (ES IM) 109 210 104 446 -0.9 -15.0 -35.8 -2.5 -16.3 -32.0 0.78 0.7 0.6 JC Decaux SA (DEC FP) 1780 2441 1500 3948 1.9 -7.9 -22.7 0.3 -9.2 -18.2 1.62 0.1 -0.2 Schibsted (SCH NO) 14890 18270 12000 2077 1.4 5.2 -13.1 -0.3 3.7 -7.9 2.34 1.0 0.5 Springer (Axel) AG (SPR GY) 3335 4142 2461 3300 0.5 0.1 -18.2 -1.1 -1.4 -13.3 1.80 0.6 0.3 European newspapers (11) 464 517 395 24578 0.6 2.4 -5.7 -1.0 0.9 -0.2 1.62 1.0 0.6 Global Sector Washington Post (WPO US) 37681 45117 31300 2249 -0.3 9.0 -11.5 -1.9 7.4 -6.3 N/A -0.3 -0.3 Gannett Company (GCI US) 1337 1719 855 2459 -0.6 27.8 -8.6 -2.1 25.9 -3.2 1.14 0.9 0.4 New York Times (NYT US) 773 1090 565 875 0.0 10.2 -18.6 -1.6 8.6 -13.8 1.51 1.2 0.7 McClatchy (MNI US) 239 555 110 158 1.6 112.0 -47.2 0.0 108.9 -44.1 N/A N/A N/AAPN News & Media (APN AU) 71 193 70 353 -0.6 -0.2 -62.2 -2.2 -1.7 -59.9 0.49 3.0 2.7 Fairfax Media (FXJ AU) 72 142 70 1336 0.8 -9.9 -47.0 -0.8 -11.2 -43.8 0.38 2.2 1.7 Seven West Media (SWM AU) 324 646 250 1650 0.0 1.4 -48.0 -1.6 -0.1 -45.0 0.79 7.3 3.2 Naspers (NPN SJ) 35393 40661 33098 13773 1.3 3.1 -22.1 -0.3 1.6 -17.5 2.92 0.6 0.3 Avusa (AVU SJ) 1811 2510 1775 216 2.4 -0.6 -31.7 0.7 -2.0 -27.7 1.02 -0.5 -0.6 Caxton and CTP (CAT SJ) 1500 1549 1320 712 2.4 4.3 -15.0 0.8 2.8 -10.0 N/A N/A N/AJagran Prakashan (JAGP IN) 9615 12780 9045 443 6.7 -6.6 -36.5 5.0 -8.0 -32.8 3.92 0.2 0.0 HT Media (HTML IN) 13000 17000 11250 445 12.2 9.2 -22.3 10.4 7.6 -17.7 2.06 -0.8 -1.3 Global newspapers (23) 587 715 511 49245 0.8 3.7 -16.4 -0.8 2.2 -11.5 1.57 1.1 0.7
T E L E V I S I O N UTV Media (Stg) (UTV LN) 93 150 93 106 -4.0 -12.3 -30.5 -5.6 -13.6 -26.4 0.68 2.0 1.4 ITV (ITV LN) 68 93 52 3177 5.9 8.0 0.0 4.2 6.4 5.9 3.19 -0.0 -0.3 Media (4) 385 439 308 18621 2.8 -0.3 1.6 1.2 -1.7 7.6 7.78 0.4 0.5 FTSE E300 Media (E3MEDA) 626 701 539 1.6 1.5 -5.6
V A L U A T I O N EPS (c) EPS Gth % Div Yield % Div Cover EV/EBITDA P/E 2011 2012 2013 11-13 2011 2012 2011 2011 2012 2013 2011 2012 2013
Independent News & Media (INM ID) 9 9 9 2.7 0.0 0.0 N/A 3.0 2.7 2.3 2.3 2.2 2.2 UK Sector Daily Mail (DMGT LN) 47 48 53 12.5 4.3 4.5 2.8 6.4 6.0 5.3 8.5 8.3 7.6 Johnston Press (JPR LN) 3 3 4 27.6 0.0 0.0 N/A 4.9 4.5 4.1 2.2 2.0 1.7 Pearson (PSON LN) 83 86 92 10.9 3.5 3.6 2.0 10.1 9.4 8.5 14.6 14.1 13.2 Trinity Mirror (TNI LN) 26 25 23 -11.6 0.0 0.0 N/A 2.5 2.3 2.1 1.8 1.9 2.1 UK newspapers (5) 3.6 3.8 2.3 8.1 7.6 6.9 11.9 11.6 10.7 European Sector De Telegraaf (TELEG NA) 118 83 88 -25.4 4.7 4.7 2.5 7.6 9.1 9.2 8.4 12.0 11.3 Espresso (ES IM) 15 14 15 2.3 7.3 6.8 1.8 3.5 3.5 3.2 7.4 7.6 7.3 JC Decaux SA (DEC FP) 99 107 124 24.7 1.1 1.7 5.0 7.1 6.4 5.6 18.0 16.6 14.4 Schibsted (SCH NO) 854 1053 1312 53.6 2.7 3.4 2.1 8.4 7.1 5.5 17.4 14.1 11.3 Springer (Axel) AG (SPR GY) 305 298 307 0.8 5.1 5.1 1.8 6.2 5.9 5.5 11.0 11.2 10.9 European newspapers (11) 3.4 3.7 2.3 7.5 7.0 6.2 12.5 12.2 11.2 Global Sector Washington Post (WPO US) 1255 1163 958 -23.7 0.0 0.0 N/A 5.0 6.1 6.9 30.0 32.4 39.3 Gannett Company (GCI US) 210 220 202 -3.9 1.8 2.4 8.8 3.6 3.0 2.7 6.4 6.1 6.6 New York Times (NYT US) 61 69 63 3.3 0.0 0.0 N/A 4.4 4.0 3.6 12.7 11.2 12.3 McClatchy (MNI US) 53 35 9 -82.4 0.0 0.0 N/A 0.6 0.7 N/A 4.5 6.8 25.7 APN News & Media (APN AU) 12 14 15 18.1 12.0 12.7 1.5 5.1 4.7 4.3 5.7 5.0 4.9 Fairfax Media (FXJ AU) 12 10 11 -3.4 4.2 6.4 3.9 5.0 4.7 4.5 6.2 7.3 6.4 Seven West Media (SWM AU) 44 40 39 -9.5 13.9 11.5 1.0 15.1 6.8 6.5 7.4 8.1 8.2 Naspers (NPN SJ) 1882 2419 3105 65.0 0.9 1.1 6.0 19.9 16.2 13.9 18.8 14.6 11.4 Avusa (AVU SJ) 157 241 287 83.2 4.4 6.7 2.0 3.9 2.7 2.3 11.6 7.5 6.3 Caxton and CTP (CAT SJ) N/A N/A N/A N/A 0.0 0.0 N/A N/A N/A N/A N/A N/A N/A Jagran Prakashan (JAGP IN) 680 805 990 45.6 3.8 4.2 1.8 8.6 7.2 6.0 14.1 11.9 9.7 HT Media (HTML IN) 870 1100 1343 54.4 0.3 0.3 21.8 7.6 5.7 5.1 14.9 11.8 9.7 Global newspapers (23) 3.0 3.2 2.8 7.7 7.0 6.6 12.7 11.9 10.8
T E L E V I S I O N UTV Media (Stg) (UTV LN) 18 20 21 14.1 5.4 8.6 3.7 5.1 4.3 3.7 5.0 4.6 4.4 ITV (ITV LN) 7 7 8 7.2 2.1 3.2 5.0 5.6 5.2 4.8 9.5 9.3 8.9 Media (4) 3.0 3.4 2.2 8.5 7.8 7.2 15.1 13.3 11.9
Research Report: Davy on 2012 January 4, 2012
79 Davy Research
Support services Sector performance in 2011 and outlook for 2012
In 2011, support services' groups sought to create value for shareholders and customers through acquisitions that broadened their portfolios and expanded their operations into new territories.
This growth strategy met with mixed reaction. For example, G4S, a security solutions firm, was forced to abandon a £5.2bn deal to buy ISS, a Danish cleaning company, after shareholders rebelled and labelled the deal 'too big and too dangerous'. Investors appeared to favour bolt-on rather than transformational deals – as evidenced by the market performance of Bunzl, the international distribution and outsourcing group.
A key theme in 2012 will be how support services' and logistics' groups create value in a period in which we expect customers will be working off stringent budgets and when lead times are likely to be shorter and volumes more volatile as a result of promotions and difficult or uncertain customer forecasting.
DCC – Performance in 2011
Since peaking in early 2011 after a successful Christmas trading period, DCC's share price has struggled. On an absolute basis, the stock is down 22.5% to end-December and has underperformed the E300 Support services sector by 18%.
Unusually mild winter weather hit trading in the group's largest division, DCC Energy. We believe this temporary but unpredictable event undermined the group's share price performance.
Looking through abnormal weather patterns, management continued to effectively pursue its strategy for growth. Most notably, it increased its share of the UK oil products' distribution market by 3%. Reassuringly for the group's business model, the UK's Office of Fair Trading reported that this market remains competitive.
DCC – Key themes for 2012
Acquisitions of niche, higher margin businesses expected to continue
Acquisitions will continue to play a role in DCC's pursuit of market-leading positions.
Following on from DCC Sercom's acquisition of Advent and DCC Environmental's purchase of Oakwood Fuels in 2011, we believe DCC will continue to seek out specialist or niche businesses which deliver enhanced operating margins.
In DCC Energy, we expect a higher proportion of ex-UK acquisitions in 2012 than occurred in 2011 now that the larger opportunities
Caren Crowley [email protected] Joshua Goldman, PhD [email protected]
Mild winter weather hit trading in the group's largest division, DCC Energy, and undermined the share price performance
Key themes for DCC for 2012
Acquisitions of niche, higher margin businesses expected to continue
DCC Energy: FY2012 to begin demonstrating benefit of acquisitions made in FY2011

Research Report: Davy on 2012 January 4, 2012
80 Davy Research
identified in the UK (namely Total Butler and Shell UK LPG) have been captured.
DCC Energy: FY2012 to begin demonstrating benefit of acquisitions made in FY2011
We think investors should look past the volatility that comes with unusual weather when assessing DCC Energy. The underlying business is in good shape, and the material benefits of acquisitions completed in the second half of 2011 (namely Pace Fuelcare and certain oil distribution assets owned by Total in Britain) will only begin to become apparent in 2012.
We see EBITA at the division going from €115m in the current fiscal year to €131.5m in the following year. The increase assumes a reversion to normal temperatures but not the full integration of oil distribution assets previously owned by Total.
DCC has described markets as 'challenging'. One, and perhaps the only, upside from this is potentially lower commodity prices. A lower oil price could help boost demand for fuel and improve margins in DCC Energy's LPG distribution business.
CPL – Performance in 2011
The global economy has experienced tepid growth and significant volatility. The Davy recruitment sector index finished the year down 33.9%, making CPL a significant outperformer (up 0.8%).
During the financial year, CPL announced a tender offer at €3.00 a share (a 20% premium to the pre-tender offer price), and €20m worth of shares were tendered.
CPL, which operates in nine countries, continues to build out its international presence. For the 2011 financial year, 33% of its permanent net fee income (the industry-specific term for gross profit) came from outside Ireland – adding to the robustness of the business.
CPL – Key themes for 2012
Irish labour market stabilising
The standardised unemployment rate in November 2011 was 14.5%, up slightly from 14.4% in October. The latest seasonally adjusted unemployment rate from the Quarterly National Household Survey was 14.4% in the third quarter of 2011.
We expect employment to fall by 1.7% in 2011 to 14.3% followed by a rise of 0.6% in 2012. We expect unemployment to fall modestly, driven largely by further declines in the labour force rather than by a significant pick-up in employment. Labour force levels are expected to fall further in 2011, driven by emigration and declining participation.
Given the macro-uncertainties and the debt burden within the EU, the question remains whether Ireland's export-driven economic growth
DCC Energy's underlying business is in good shape, and the material benefits of acquisitions completed in the second half of 2011 will only begin to become apparent in 2012
Key themes for CPL for 2012
Irish labour market stabilising
Poised for growth
Significant upside potential, but trickle-down effects of government austerity measures will have to be closely watched

Research Report: Davy on 2012 January 4, 2012
81 Davy Research
can continue. The pattern of export growth has been erratic in recent quarters, up 3.7% in Q1 2011 following a decline of 2.7% in Q4 2010. In the year to Q1, Irish export volumes were up 6.8%.
Poised for growth
CPL has demonstrated its ability to react decisively to stark changes in the revenue environment. CPL's net fee income was down 53% from peak (H1 financial year 2008) to trough (H1 financial year 2010). It responded by reducing SG&A by c.30% from financial year 2009 to financial year 2010, allowing it to maintain its cash on balance sheet.
We are encouraged by CPL's long-term prospects – it has survived the downturn and has positioned itself for growth, while other competitors (The Man Group, Robert Half, Joslin Rowe) have left Ireland.
Significant upside potential, but trickle-down effects from government's austerity measures will have to be closely watched
Although we see upside potential for CPL, the trickle-down effects from the government's austerity measures will have to be closely monitored.
CPL offers investors a fantastic growth opportunity over the longer term, with the benefit of a strong balance sheet.
Despite the unprecedented decline in the Irish economy over the past two years, CPL has continued to generate both profits and cash
CPL offers investors a fantastic growth opportunity over the longer term

82 Davy Research
Research Report: Davy on 2012 January 4, 2012
S H A R E P R I C E A N D P E R F O R M A N C E Price 12 Month Mkt. Cap Change % (€) Rel to E300 sector % Pr/Bk Debt/EBITDA Local High Low €m Wk 1 Mth YTD Wk 1 Mth YTD 2011 2011 2012
DCC (DCC ID) 1828 2410 1670 1527 -1.2 1.6 -22.5 -3.1 -3.6 -18.3 1.51 0.8 0.5 Energy Brenntag AG (BNR GY) 7195 8474 6411 3705 0.4 1.1 -5.7 -1.5 -4.0 -0.6 2.05 2.2 1.8 Buckeye Partners (BPL US) 6398 6852 5761 4244 0.6 4.1 -1.2 -1.3 -1.2 4.2 2.24 4.8 4.1 Rubis (RUI FP) 4040 4475 3435 1228 -0.3 -3.0 -7.3 -2.2 -7.9 -2.2 1.49 2.0 2.0 Healthcare United Drug (UDG ID) 205 246 186 489 2.5 6.4 -2.4 0.6 1.1 3.0 1.30 1.5 1.2 Invacare (IVC US) 1529 3429 1470 376 -2.8 -22.7 -47.7 -4.7 -26.6 -44.8 N/A N/A N/A Euromedis (EMG FP) 475 511 374 11 3.0 1.1 6.5 1.1 -4.0 12.3 0.64 2.2 1.9 Computer Distribution Ingram Micro Inc. (IM US) 1819 2150 1575 2154 -0.3 4.8 -1.7 -2.2 -0.5 3.7 0.85 -0.9 -0.6 Northamber (NAR LN) 52 62 49 18 0.1 2.6 -5.0 -1.8 -2.5 0.2 N/A N/A N/A Tech Data Inc (TECD US) 4941 5380 3908 1574 -3.3 4.2 15.8 -5.2 -1.1 22.1 0.98 -0.9 -1.3 Support Services Bunzl (BNZL LN) 884 884 677 3503 2.7 9.3 26.3 0.8 3.8 33.2 3.42 2.0 1.6
S E C U R I T Y Securitas (SECUB SS) 5940 8000 4787 2436 -0.8 2.1 -24.1 -2.7 -3.1 -19.9 2.23 2.1 1.8 Group 4 Securicor (GFS LN) 272 291 220 4596 2.9 8.9 9.7 0.9 3.4 15.7 2.29 2.2 1.8 Security (2) 888 996 723 7032 1.7 6.4 -4.8 -0.3 1.1 0.4 2.27 2.2 1.8 Unite Group (UTG LN) 168 224 153 323 1.5 -2.9 -11.1 -0.4 -7.8 -6.2 0.53 9.6 11.4
R E C R U I T M E N T CPL Resources (CPL ID) 255 310 244 95 0.0 -7.3 0.8 -1.9 -12.0 6.3 1.43 -3.6 -3.8 Adecco (ADEN VX) 3935 6605 3215 6131 0.3 1.0 -34.0 -1.7 -4.1 -30.4 1.59 0.8 0.4 Brunel Int. (BRNL NA) 2278 3495 2000 536 -2.6 -7.8 -22.8 -4.5 -12.4 -18.5 2.35 -0.8 -0.7 Harvey Nash (HVN LN) 52 97 51 46 0.6 -8.0 -3.7 -1.3 -12.6 1.5 0.57 -0.9 -1.4 Hays (HAS LN) 64 134 59 1067 3.4 -10.3 -48.9 1.4 -14.8 -46.1 4.55 1.0 1.0 Kelly Services (KELYA US) 1368 2280 1090 389 0.3 -1.9 -24.9 -1.6 -6.9 -20.8 N/A N/A N/A Manpower (MAN US) 3575 6867 3232 2251 -1.6 1.3 -41.2 -3.5 -3.8 -38.0 1.14 0.0 -0.2 Michael Page (MPI LN) 349 567 323 1268 2.5 -6.9 -35.4 0.5 -11.6 -31.9 5.53 -0.6 -1.0 Randstad (RAND NA) 2286 4280 2003 3908 -0.3 -1.1 -42.1 -2.2 -6.1 -39.0 1.33 1.8 1.5 Robert Half (RHI US) 2846 3385 2006 3141 0.5 11.5 -4.0 -1.5 5.9 1.2 4.97 -1.1 -1.2 Recruitment (10) 467 744 400 18832 0.2 0.4 -33.9 -1.8 -4.6 -30.3 1.80 0.7 0.3
F A C I L I T I E S M G M T / P R O P E R T Y M G M T ABM Industries (ABM US) 2062 2700 1729 848 -1.0 -1.5 -19.1 -2.9 -6.5 -14.7 N/A N/A N/A AMEC plc (AMEC LN) 908 1251 741 3614 0.7 7.2 -18.9 -1.2 1.8 -14.5 2.19 -1.9 -1.9 Hochtief (HOT GY) 4470 7655 3764 3442 1.3 5.4 -29.7 -0.6 0.1 -25.8 1.21 0.4 0.1 Interserve (IRV LN) 321 341 232 484 2.2 1.0 42.7 0.2 -4.1 50.5 1.50 0.6 0.7 Johnson Controls (JCI US) 3126 4271 2545 16417 1.5 3.1 -15.6 -0.5 -2.1 -11.0 1.91 1.7 1.1 Mears Group (MER LN) 220 326 206 224 2.0 5.0 -25.4 0.0 -0.3 -21.3 1.29 0.4 -0.0 Mitie Group (MTO LN) 243 258 196 1050 1.5 -3.4 6.6 -0.4 -8.3 12.4 1.99 0.5 0.2 Rentokil Initial (RTO LN) 63 105 58 1363 1.2 -3.2 -33.6 -0.8 -8.1 -29.9 N/A 2.0 1.7 Savills (SVS LN) 328 427 256 521 2.1 5.1 -12.8 0.2 -0.2 -8.1 N/A -1.4 -1.4 Serco Group (SRP LN) 474 619 458 2827 1.3 -0.8 -12.3 -0.7 -5.8 -7.5 2.41 1.7 1.2 Facilities/property mgmt (10) 67164 86806 59155 30789 1.3 2.7 -17.7 -0.6 -2.5 -13.2 1.84 1.0 0.6
P L A N T / E Q U I P M E N T H I R E Siteserv plc (SSV ID) 2 7 2 2 0.0 -9.1 -60.0 -1.9 -13.7 -57.8 0.28 7.5 6.7 Ashtead (AHT LN) 226 226 99 1364 1.9 25.7 34.3 0.0 19.4 41.7 2.15 2.4 2.1 Cape (CIU LN) 328 592 295 466 3.5 3.1 -18.7 1.5 -2.1 -14.2 0.99 0.5 0.3 H&E Equip. Services (HEES US) 1342 2013 717 363 -2.8 9.6 19.7 -4.7 4.1 26.2 1.81 1.6 1.1 Lavendon Group (LVD LN) 87 120 80 172 1.6 1.2 -22.5 -0.4 -3.9 -18.3 0.83 1.5 1.4 Ramirent (RMR1V FH) 550 1229 415 598 2.6 -5.2 -44.2 0.7 -10.0 -41.1 1.81 1.5 1.1 Speedy Hire (SDY LN) 20 34 19 124 4.0 -5.6 -27.3 2.1 -10.4 -23.3 0.45 1.1 1.0 Plant/equipment hire (7) 1251 1638 913 3090 1.9 10.2 -8.1 -0.1 4.7 -3.1 1.45 1.8 1.6 FTSE E300 Support Services (E3SUPP) 460 504 390 1.9 5.3 -5.2

83 Davy Research
Research Report: Davy on 2012 January 4, 2012 V A L U A T I O N EPS (c) EPS Gth % Div Yield % Div Cover EV/EBITDA P/E 2011 2012 2013 11-13 2011 2012 2011 2011 2012 2013 2011 2012 2013
DCC (DCC ID) 188 208 221 17.6 4.1 4.3 2.5 6.5 5.8 5.2 9.7 8.8 8.3 Energy Brenntag AG (BNR GY) 554 653 701 26.6 2.8 3.2 2.8 7.9 7.0 6.5 13.0 11.0 10.3 Buckeye Partners (BPL US) 309 355 400 29.5 6.4 6.7 0.8 15.6 13.2 12.1 20.7 18.0 16.0 Rubis (RUI FP) 240 282 300 25.0 4.0 4.6 1.5 9.4 8.3 7.3 16.8 14.3 13.5 Healthcare United Drug (UDG ID) 23 24 25 8.6 0.3 0.3 0.3 6.7 6.3 5.8 9.0 8.6 8.3 Invacare (IVC US) 201 188 174 -13.4 0.3 0.3 40.2 N/A N/A N/A 7.6 8.2 8.8 Euromedis (EMG FP) -32 28 44 N/A 0.6 0.6 N/A 4.7 4.3 3.9 N/A 17.0 10.8 Computer Distribution Ingram Micro Inc. (IM US) 172 212 246 43.0 0.0 0.0 N/A 4.9 4.5 3.9 10.6 8.6 7.4 Northamber (NAR LN) N/A N/A N/A N/A 0.0 0.0 N/A N/A N/A N/A N/A N/A N/A Tech Data Inc (TECD US) 495 570 590 19.3 0.0 0.0 N/A 4.0 3.5 3.1 10.0 8.7 8.4 Support Services Bunzl (BNZL LN) 66 71 74 12.7 3.0 3.1 2.5 10.2 9.4 8.8 13.4 12.5 11.9
S E C U R I T Y Securitas (SECUB SS) 563 620 668 18.6 5.1 5.2 1.9 7.2 6.5 5.9 10.6 9.6 8.9 Group 4 Securicor (GFS LN) 23 25 28 24.4 3.1 3.5 2.6 7.7 7.0 6.3 12.1 10.7 9.7 Security (2) 3.8 4.1 2.3 7.5 6.8 6.2 11.5 10.3 9.4 Unite Group (UTG LN) 5 7 8 57.3 0.9 0.9 3.2 15.2 17.1 14.2 35.0 24.8 22.3
R E C R U I T M E N T CPL Resources (CPL ID) 25 28 30 18.9 2.4 2.7 4.2 7.2 5.9 4.9 10.0 9.3 8.5 Adecco (ADEN VX) 355 355 394 10.8 2.9 3.1 3.1 7.4 6.7 5.9 11.1 11.1 10.0 Brunel Int. (BRNL NA) 185 203 245 32.1 4.0 4.6 2.0 7.3 6.4 5.3 12.3 11.2 9.3 Harvey Nash (HVN LN) 7 7 9 28.3 5.1 5.5 2.6 3.7 3.2 N/A 7.5 7.3 5.9 Hays (HAS LN) 5 6 6 21.6 9.0 9.0 0.9 7.6 7.0 6.6 12.6 11.3 10.3 Kelly Services (KELYA US) 159 165 184 15.7 1.1 1.5 10.6 4.9 3.8 3.5 8.6 8.3 7.4 Manpower (MAN US) 316 363 450 42.4 2.2 2.3 4.0 4.5 4.0 3.7 11.3 9.9 7.9 Michael Page (MPI LN) 18 19 22 20.9 2.9 3.0 1.8 10.0 10.8 8.4 18.9 18.8 15.6 Randstad (RAND NA) 234 246 278 18.6 5.5 5.5 1.9 7.3 6.8 6.1 9.8 9.3 8.2 Robert Half (RHI US) 105 143 182 72.9 2.0 2.1 1.9 12.5 9.4 7.2 27.1 19.9 15.7 Recruitment (10) 3.6 3.7 2.3 7.3 6.6 5.7 12.3 11.5 10.0
F A C I L I T I E S M G M T / P R O P E R T Y M G M T ABM Industries (ABM US) 139 145 163 17.3 2.7 2.8 2.5 6.1 5.7 5.4 14.8 14.3 12.7 AMEC plc (AMEC LN) 69 80 89 28.7 3.3 3.6 2.3 7.8 6.5 5.7 13.1 11.3 10.2 Hochtief (HOT GY) -129 399 434 N/A 1.0 5.1 N/A 3.9 2.5 2.3 N/A 11.2 10.3 Interserve (IRV LN) 42 44 47 13.1 5.9 6.1 2.2 4.6 4.5 4.2 7.7 7.3 6.8 Johnson Controls (JCI US) 242 300 356 47.2 2.0 2.2 3.9 9.0 6.9 5.8 12.9 10.4 8.8 Mears Group (MER LN) 25 28 31 23.2 3.4 3.8 3.3 5.4 4.4 3.7 8.8 7.8 7.1 Mitie Group (MTO LN) 22 25 26 17.1 3.9 4.1 2.3 7.1 6.4 5.7 10.9 9.9 9.3 Rentokil Initial (RTO LN) 8 9 9 25.4 2.2 3.7 5.5 4.6 4.1 3.8 8.3 7.2 6.6 Savills (SVS LN) 28 31 34 20.6 4.0 4.5 2.2 5.6 5.1 4.4 11.6 10.4 9.6 Serco Group (SRP LN) 38 43 49 27.3 1.7 1.9 4.7 8.4 7.2 6.3 12.4 11.1 9.7 Facilities/property mgmt (10) 2.2 2.9 3.3 7.1 5.5 4.8 12.3 10.4 9.1
P L A N T / E Q U I P M E N T H I R E Siteserv plc (SSV ID) 2 4 5 97.4 0.0 0.0 N/A 7.7 6.8 6.5 0.9 0.6 0.4 Ashtead (AHT LN) 13 15 19 45.1 1.4 1.6 4.0 5.6 5.0 4.6 17.6 14.9 12.1 Cape (CIU LN) 42 47 56 33.5 4.1 4.3 3.1 4.7 4.1 3.4 7.9 7.1 5.9 H&E Equip. Services (HEES US) 10 77 86 N/A 0.0 0.0 N/A 5.1 3.7 4.0 N/A 17.5 15.6 Lavendon Group (LVD LN) 10 12 13 35.2 1.3 1.4 8.8 3.4 3.2 3.0 9.1 7.5 6.7 Ramirent (RMR1V FH) 38 44 55 45.2 4.5 5.5 1.5 4.8 4.4 4.0 14.5 12.5 10.0 Speedy Hire (SDY LN) 2 3 5 194.1 2.0 2.0 4.3 2.6 2.3 2.1 11.8 7.4 4.0 Plant/equipment hire (7) 2.6 2.9 3.0 4.9 4.3 4.0 14.5 11.4 9.2

84 Davy Research
Important disclosures
Analyst certification Each research analyst primarily responsible for the content of this research report certifies that: (1) the views expressed in this research report accurately reflect his or her personal views about any or all of the subject securities or issuers referred to in this report and (2) no part of his or her compensation was, is or will be, directly or indirectly related to the specific recommendations or views expressed in this report.
Investment ratings definitions Davy ratings are indicators of the expected performance of the stock relative to its sector index (FTSE E300) over the next 12 months. At times, the performance might fall outside the general ranges stated below due to near-term events, market conditions, stock volatility or – in some cases – company-specific issues. Research reports and ratings should not be relied upon as individual investment advice. As always, an investor's decision to buy or sell a security must depend on individual circumstances, including existing holdings, time horizons and risk tolerance. Our ratings are based on the following parameters: Outperform: Outperforms the relevant E300 sector by 10% or more over the next 12 months. Neutral: Performs in-line with the relevant E300 sector (+/-10%) over the next 12 months. Underperform: Underperforms the relevant E300 sector by 10% or more over the next 12 months. Under Review: Rating is actively under review. Suspended: Rating is suspended until further notice. Restricted: The rating has been removed in accordance with Davy policy and/or applicable law and regulations where Davy is engaged in an investment banking transaction and in certain other circumstances.
Distribution of ratings/investment banking relationships Investment banking services/Past 12 months
Rating Count Percent Count Percent
Outperform 50 53 28 77
Neutral 28 30 6 16
Underperform 11 11 0 0
Under Review 3 3 1 2
Suspended 0 0 0 0
Restricted 1 1 1 2
This is a summary of Davy ratings for all companies under research coverage, including those companies under coverage to which Davy has provided material investment banking services in the previous 12 months. This summary is updated on a quarterly basis. The term 'material investment banking services' includes Davy acting as broker as well as the provision of corporate finance services, such as underwriting and managing or advising on a public offer.
Regulatory and other important information J&E Davy, trading as Davy is regulated by the Central Bank of Ireland. Davy is a member of the Irish Stock Exchange, the London Stock Exchange and Euronext. For branches in the UK, Davy is authorised by the Central Bank of Ireland and subject to limited regulation by the Financial Services Authority. Details about the extent of our regulation by the Financial Services Authority are available from us on request. No part of this document is to be reproduced without our written permission. This publication is solely for information purposes and does not constitute an offer or solicitation to buy or sell securities. This document does not constitute investment advice and has been prepared without regard to the individual financial circumstances and objectives of persons who receive it. The securities/strategy discussed in this report may not be suitable or appropriate for all investors. The value of investments can fall as well as rise and there is no guarantee that investors will receive back their capital invested. Past performance and simulated performance is not a reliable guide to future performance. Projected returns are estimates only and are not a reliable guide to the future performance of this investment. Forecasted returns depend on assumptions that involve subjective judgment and on analysis that may or may not be correct. Any information related to the tax status of the securities discussed herein is not intended to provide tax advice or to be used as tax advice. You should consult your tax adviser about the rules that apply in your individual circumstances. This document has been prepared and issued by Davy on the basis of publicly available information, internally developed data and other sources believed to be reliable. Whilst all reasonable care has been taken in the preparation of this document, we do not guarantee the accuracy or completeness of the information contained herein. Any opinion expressed (including estimates and forecasts) may be subject to change without notice. We or any of our connected or affiliated companies or their employees may have a position in any of the securities or may have provided, within the last twelve months, significant advice or investment services in relation to any of the securities or related investments referred to in this document. While reasonable care has been taken in the preparation of the information contained in this document, no warranty or representation, express or implied, is or will be provided by Davy or any of its shareholders, subsidiaries or affiliated entities or any person, firm or body corporate under its control or under common control or by any of their respective directors, officers, employees, agents, advisers and representatives, all of whom expressly disclaim any and all liability for the contents of, or omissions from, this document, the information or opinions on which it is based and/or whether it is a reasonable summary of the securities in this document and for any other written or oral communication transmitted or made available to the recipient or any of its officers, employees, agents or representatives. Neither Davy nor any of its shareholders, subsidiaries, affiliated entities or any person, form or body corporate under its control or under common control or their respective directors, officers, agents, employees, advisors, representatives or any associated entities (each an "Indemnified Party") will be responsible or liable for any costs, losses or expenses incurred by investors in connection with the information contained in this document. The investor indemnifies and holds harmless Davy and each Indemnified Party for any losses, liabilities or claims, joint or several, howsoever arising, except upon such Indemnified Party’s bad faith or gross negligence.
Share ownership policy Davy allows analysts to own shares in companies they issue recommendations on, subject to strict compliance with our internal rules governing own-account trading by staff members. Readers should be aware that analysts writing in this publication may own shares in the stocks covered. If you require further details, please contact [email protected]. We are satisfied that our internal policy on share ownership does not compromise the objectivity of analysts in issuing recommendations.

85 Davy Research
Conflicts of interest Our conflicts of interest management policy is available at www.davy.ie/ConflictsOfInterest. Davy acts as stockbroker to Abbey; AGI Therapeutics; Aminex; ARYZTA; Bank of Ireland; Boundary Capital; C&C; CPL; CRH; DCC; Dragon Oil; Elan Corporation; Fyffes; Glanbia; ICON; IFG Group; Independent News & Media; Irish Life & Permanent; Kenmare Resources; Kerry Group; Merrion Pharmaceuticals; Minco; Norish; NTR; Ormonde Mining; Ovoca Resources; Petroceltic; Petroneft; Prime Active Capital; Providence; Readymix; Ryanair; Siteserv; Smurfit Kappa Group; Total Produce; Tullow Oil; TVC Holdings and United Drug. The remuneration of the analyst(s) who prepared this report is based on various factors including company profitability, which may be affected to some extent by revenues derived from investment banking. Davy is registered to act as market-maker in the securities of certain companies by the Irish Stock Exchange and London Stock Exchange. Details are available at www.davy.ie/RegulatoryDisclosures. Davy may have acted, in the past 12 months, as lead manager/co-lead manager of a publicly disclosed offer of the securities in certain companies included in this report. Investors should be aware that Davy may have provided investment banking services to, and received compensation from, certain companies included in this report in the past 12 months or may provide such services in the future. The term investment banking services includes acting as broker as well as the provision of corporate finance services, such as underwriting and managing or advising on a public offer. Davy may have a shareholding in certain companies included in this report which exceeds 5% of their total issued share capital. Details are available at www.davy.ie/RegulatoryDisclosures. These shareholdings include proprietary positions and discretionary holdings. This disclosure represents the position of Davy as of close of business on the Friday preceding issue of this report.
Other important disclosures A description of certain companies included in this report is available at www.davy.ie/RegulatoryDisclosures. A summary of our standard valuation methods is available at www.davy.ie/ValuationMethodologies. All prices used in this report are as of close of December 30th unless otherwise indicated. A summary of existing and previous ratings for each company under coverage, together with an indication of which of these companies Davy has provided investment banking services to, is available at www.davy.ie/ratings. The data contained in this research note have been compiled by our independent analysts, based on a combination of publicly-available information and the analysts assumptions and modelling. Further information is available upon request. This document does not constitute or form part of any offer, solicitation or invitation to subscribe or purchase any securities, nor shall it or any part of it form the basis of, or be relied upon in connection with, any contract or commitment whatsoever. Any decision to purchase or subscribe for securities in any offering must be made solely on the basis of the information contained in the prospectus or other offering circular issued by the company concerned in connection with such an offering. This document has been prepared by its authors independently of the company or companies covered. Davy has no authority whatsoever to give any information, or make any representation or warranty on behalf of the company or companies. In particular, the opinions, estimates and projections expressed in it are entirely those of the analysts and are not given as an agent or financial adviser of the company or companies. In the UK this document is restricted to (i) persons who have professional experience in matters relating to investments falling within Article 19(5) of the Financial Services and Markets Act 2000 (Financial Promotion) Order 2005 (the "Order") or (ii) high net worth entities falling within Article 49(2)(a) to (d) of the Order. Please note that in accordance with the Central Bank of Ireland's Market Abuse Rules, no person, other than a market-maker, may enter into any transaction or arrangement which would have the effect of generating a net economic benefit arising from a fall in the price of the following shares: the Governor and Company of Bank of Ireland, Allied Irish Banks plc, Irish Life & Permanent plc and Anglo Irish Bank Corporation plc. Please refer to the Market Abuse Rules for full details.
US Securities Exchange Act, 1934 This report is only distributed in the US to major institutional investors as defined by S15a-6 of the Securities Exchange Act, 1934 as amended. By accepting this report, a US recipient warrants that it is a major institutional investor as defined and shall not distribute or provide this report or any part thereof, to any other person.
Distribution of research to clients of Davy Securities in the US Davy Securities distributes third-party research produced by its affiliate, J & E Davy. Davy Securities is a member of FINRA and SIPC and is regulated by the Central Bank of Ireland. Davy Securities does not act as market maker. Davy or an affiliate holds a proprietary position and/or controls on a discretionary basis more than 1% of the total issued share capital of Finance Ireland; NTR; Ormonde Mining; Siteserv and TVC Holdings. This information was current as at the last business day of the month preceding the date of the report. An affiliate of Davy Securities may have acted, in the past 12 months, as lead manager/co-lead manager of a publicly disclosed offer of the securities in certain companies included in this report. Investors should be aware that an affiliate of Davy Securities may have provided investment banking or non-investment-banking services to, and received compensation from, certain companies included in this report in the past 12 months or may provide such services in the next three months. The term investment banking services includes acting as broker as well as the provision of corporate finance services, such as underwriting and managing or advising on a public offer.
FTSE licence Davy is licensed by FTSE International Limited to publish the FTSE Indices on a delayed basis. FTSE International shall not be responsible for any error or omission in the FTSE Indices. All copyright and database rights in the FTSE Indices belong to FTSE International or its licensors. Redistribution of the data comprising the FTSE Indices is not permitted. You agree to comply with any restrictions or conditions imposed upon the use, access, or storage of the data as may be notified to you by FTSE or Davy and you may be required to enter into a separate agreement with FTSE or Davy.
Confidentiality and copyright statement Davy, Research Department, Davy House, 49 Dawson St., Dublin 2, Ireland. Confidential © Davy 2012.
86 Davy Research
Research Report: Davy on 2012 January 4, 2012
RESEARCH
Tel: +353 1 6148997 Fax:+353 1 6796341 Email: [email protected]
Head of Research
Barry Dixon [email protected]
Economic Research
Chief Economist
Conall Mac Coille [email protected]
Economist
David McNamara [email protected]
Equity Research
Financials
Emer Lang [email protected]
Stephen Lyons [email protected]
Industrials
Tim Cahill [email protected]
Barry Dixon [email protected]
Florence O’Donoghue [email protected]
Robert Gardiner [email protected]
Killian Murphy [email protected]
Food and pharmaceuticals
John O’Reilly john.o’[email protected]
Jack Gorman [email protected]
Barry Gallagher [email protected]
Aiden O'Donnell [email protected]
Richard O'Donovan richard.o'[email protected]
Resources and environment
Job Langbroek [email protected]
Caren Crowley [email protected]
Travel, gaming, media and technology
Stephen Furlong [email protected]
David Jennings [email protected]
Simon McGrotty [email protected]
Joshua Goldman [email protected]
Research Operations
Research Operations Manager
Aidan Beatty [email protected]
Editor
Orla O’Flynn orla.o’[email protected]
Publishing
Deirdre Dunne [email protected]
Bríd Frain [email protected]
Research Co-ordinator
Zara Copeland [email protected]
Research Support Unit
E-mail: [email protected]
Research Support Manager
Jim O’Neill [email protected]
Market Data Executive
Laura Chambers [email protected]
Market Data Analysts
Órla Lenehan [email protected]
Jenny Campbell [email protected]
INSTITUTIONAL EQUITY SALES TEAM
Tel: +353 1 61428167 Fax:+353 1 6796423
Email: [email protected]
Head of Equity Sales
David Smith [email protected]
Equity Sales
Brendan Byron [email protected]
Kieran Canny [email protected]
David Haslam [email protected]
John Hickey [email protected]
Peter Horgan [email protected]
Ronan Hurley [email protected]
Tomás Jones [email protected]
Niall Kearns [email protected]
Mannie Larchet [email protected]
Harry Maharaj [email protected]
Seamus Murphy [email protected]
Adam O'Maoldomhnaigh adam.o'[email protected]
Equity Trading
Stephen Church [email protected]
Fran O’Connor fran.o’[email protected]
Andrew Arnott [email protected]
John Gleeson [email protected]
Ivan Cummins [email protected]
Equity Sales Trading
Dermot Farrelly [email protected]
Turlough Carolan [email protected]
Dara Cosgrave [email protected]
Aidan McSweeney [email protected]
Colin Redmond [email protected]
Geoff McEvoy [email protected]
Fergal McSwiney [email protected]
Corporate Broking
Head of Corporate Broking
Paul Burke [email protected]
Executives
Niall Jones [email protected]
David Linehan [email protected]
Eavan Gannon [email protected]
Rosslyn Teskey [email protected]
Paula Mulhern [email protected]
Share Register Analysis
Barry Gibney barry.gibney@davy.
Administration
Lesley Riley [email protected]
Lynda Rogers [email protected]