STEM Education in South Africa
180
FINAL REPORT STEM: Country Comparisons PROJECT AUSTRALIAN ACADEMY OF THE HUMANITIES AUSTRALIAN ACADEMY OF SCIENCE ACADEMY OF THE SOCIAL SCIENCES IN AUSTRALIA AUSTRALIAN ACADEMY OF TECHNOLOGICAL SCIENCES AND ENGINEERING International comparisons of science, technology, engineering and mathematics (STEM) education.
Transcript of STEM Education in South Africa

FINAL REPORT
STEM: Country
Comparisons
PROJECT
AUSTRALIAN ACADEMY OF THE HUMANITIES
AUSTRALIAN ACADEMY OF SCIENCE
ACADEMY OF THE SOCIAL SCIENCES IN AUSTRALIA
AUSTRALIAN ACADEMY OF TECHNOLOGICAL
SCIENCES AND ENGINEERING
International comparisons of science, technology, engineering and mathematics (STEM) education.

2
SECURING AUSTRALIA’S
FUTURE
A three-year research program funded by the
Australian Research Council and conducted
by the four Learned Academies through
the Australian Council of Learned Academies
for PMSEIC, through the Office of the Chief
Scientist. Securing Australia’s Future delivers research-based evidence
and findings to support policy development in areas of importance to
Australia’s future.
EXPERT WORKING GROUP – PROJECT 2
Professor Simon Marginson FASSA (Chair)Professor Russell Tytler (Deputy)Professor Stephen Gaukroger FAHAMr David Hind FTSEProfessor Nalini Joshi FAAProfessor Geoff PrinceProfessor Sue Richardson FASSA
AUTHORS
Professor Simon Marginson FASSAProfessor Russell Tytler Brigid FreemanKelly Roberts
© Australian Council of Learned Academies (ACOLA)
ISBN 978 0 9875798 0 5
This work is copyright. Apart from any use permitted under the Copyright Act 1968, no part of it may be reproduced by any process without written permission from the publisher. Requests and inquiries concerning reproduction rights should be directed to the publisher.
DATE OF PUBLICATION May 2013
PUBLISHERAustralian Council of Learned AcademiesLevel 1, 1 Bowen CrescentMelbourne Victoria 3004 AustraliaTelephone: +61 (0)3 98640923www.acola.org.au
SUGGESTED CITATION Marginson, S, Tytler, R, Freeman, B and Roberts, K (2013). STEM: Country comparisons. Report for the Australian Council of Learned Academies, www.acola.org.au.
REPORT DESIGN Lyrebird [email protected]

3
STEM: Country
ComparisonsInternational comparisons of science, technology, engineering and mathematics (STEM) education.
ACOLA is the interface of the four Learned Academies:
Australian Academy of the Humanities
Australian Academy of Science
Academy of the Social Sciences in Australia
Australian Academy of Technological Sciences and Engineering
4
Australian Academy of the HumanitiesThe Australian Academy of the Humanities advances knowledge of, and the pursuit of excellence in, the humanities in Australia. Established by Royal Charter in 1969, the Academy is an independent organisation of more than 500 elected scholars who are leaders and experts in the humanities disciplines.
The Academy promotes the contribution of the humanities disciplines for public good and to the national research and innovation system, including their critical role in the interdisciplinary collaboration required to address societal challenges and opportunities. The Academy supports the next generation of humanities researchers and teachers through its grants programme, and provides authoritative and independent advice to governments, industry, the media and the public on matters concerning the humanities.
www.humanities.org.au
Australia’s Learned Academies
Working Together – ACOLAThe Australian Council of Learned Academies (ACOLA) combines the strengths of the four Australian Learned Academies: Australian Academy of the Humanities, Australian Academy of Science, Academy of Social Sciences in Australia, and Australian Academy of Technological Sciences and Engineering.
Australian Academy of ScienceThe Australian Academy of Science is a private organisation established by Royal Charter in 1954. It comprises ~450 of Australia’s leading scientists, elected for outstanding contributions to the life sciences and physical sciences. The Academy recognises and fosters science excellence through awards to established and early career researchers, provides evidence-based advice to assist public policy development, organises scientific conferences, and publishes scientific books and journals. The Academy represents Australian science internationally, through its National Committees for Science, and fosters international scientific relations through exchanges, events and meetings. The Academy promotes public awareness of science and its school education programs support and inspire primary and secondary teachers to bring inquiry-based science into classrooms around Australia.
www.science.org.au

5
Academy of Social Sciences in Australia The Academy of the Social Sciences in Australia (ASSA) promotes excellence in the social sciences in Australia and in their contribution to public policy. It coordinates the promotion of research, teaching and advice in the social sciences, promote national and international scholarly cooperation across disciplines and sectors, comment on national needs and priorities in the social sciences and provide advice to government on issues of national importance.
Established in 1971, replacing its parent body the Social Science Research Council of Australia, itself founded in 1942, the academy is an independent, interdisciplinary body of elected Fellows. The Fellows are elected by their peers for their distinguished achievements and exceptional contributions made to the social sciences across 18 disciplines.
It is an autonomous, non-governmental organisation, devoted to the advancement of knowledge and research in the various social sciences.
www.assa.edu.au
Australian Academy of Technological Sciences and Engineering ATSE advocates for a future in which technological sciences and engineering and innovation contribute significantly to Australia’s social, economic and environmental wellbeing. The Academy is empowered in its mission by some 800 Fellows drawn from industry, academia, research institutes and government, who represent the brightest and the best in technological sciences and engineering in Australia. Through engagement by our Fellows, the Academy provides robust, independent and trusted evidence-based advice on technological issues of national importance. We do this via activities including policy submissions, workshops, symposia, conferences parliamentary briefings, international exchanges and visits and the publication of scientific and technical reports. The Academy promotes science, and maths education via programs focusing on enquiry-based learning, teaching quality and career promotion. ATSE fosters national and international collaboration and encourages technology transfer for economic, social and environmental benefit.
www.atse.org.au
By providing a forum that brings together great minds, broad perspectives and knowledge, ACOLA is the nexus for true interdisciplinary cooperation to develop integrated problem solving and cutting edge thinking on key issues for the benefit of Australia.
ACOLA receives Australian Government funding from the Australian Research Council and the Department of Industry, Innovation, Science, Research and Tertiary Education. www.acola.org.au

6

7
List of tables 8
List of figures 9
Project aims 10
Executive summary 12
Key findings 18
1. Introduction 28
2. STEM in Australia 36
3. What country comparisons can tell us 52
4. An international view of STEM in Australia 58
5. STEM in society 68
6. Attitudes to stem 86
7. Framing national STEM policy and strategy 94
8. School curriculum and pedagogy 106
9. Teachers and teaching 114
10. The R&D workforce 120
11. Labour markets and STEM 126
12. Girls and women 134
13. Stem and indigenous students 144
14. Partnerships and enrichment activities 150
15. National STEM coordination 154
Acronyms 162
Bibliography 166
Expert Working Group 170
Acknowledgements 172
Evidence gathering 174
Review Panel 178
About Securing Australia’s Future 179
Contents

8
List of tablesTable 1: Country, regional and special interest reports on STEM commissioned for this project 32
Table 2: Schooling in Australia, 2010 37
Table 3: Educational attainment of Australians aged 25-64 years in 2010 39
Table 4: Student enrolments in year 12 science subjects, Australia 2009 40
Table 5: Tertiary education provider type profile, 2010 42
Table 6: Equivalent full-time domestic and international students by sector of education and selected course characteristics, 2010 43
Table 7: Equivalent full-time domestic and international students by sector of education and selected course characteristics for all students, males, females, aged 24 years and under, 2010 44
Table 8: The distribution of tertiary new entrants by field of education in 2010 for Australia, a selection of comparable countries, and the OECD and E21 averages 62
Table 9: The distribution of international tertiary new entrants by field of education in 2010 for Australia, and a selection of comparable countries 62
Table 10: State and Territory populations and year 12 enrolments for 2004. Data from Barrington (2006), Tables 2A, 2B, 3A, 3B, 4 83
Table 11: Percentage of respondents who Agree with statements about science, by country 87
Tables 12A and 12B: Data indicative of Australian students’ attitudes and consequent achievement scores in TIMSS international assessment of student achievement 90
Table 13: Doctoral graduation rates, select countries, 2005-2009 121
Table 14: Universities in East Asia, Singapore and Western Pacific by volume of scientific papers, 2005-2009, universities with more than 6000 papers only 125
Table 15: Anticipated future employment demand in key STEM-related sectors, EU-27 countries, 2010-2020 127
Table 16: Recruitment experiences of employers that use STEM skills intensively: 2007-11 (Proportion of vacancies unfilled six weeks after advertising) 132
Table 17: Changes in selected labour market outcomes for recent university STEM graduates, four months after completion: 2007 to 2011 132
Table 18: The percentage of qualifications awarded to women in tertiary type A and advanced research programs, by STEM field in 2010 for selected countries 137

9
List of figuresFigure 1: Year 12 science participation as a percentage of the year 12 cohort in Australian schools, 1976 to 2007 41
Figure 2: Commencing domestic bachelor’s (pass and graduate entry) enrolments: science-related fields of education 45
Figure 3: Domestic commencing HDR enrolments: science-related 46
Figure 4: Proportion of domestic commencing undergraduate enrolments, by gender: science-related fields 46
Figure 5: Number of student completions (domestic and international): science-related fields of education, by course level, 2010 47
Figure 6: Percentage of all awarded doctoral degrees from science and engineering fields in 2009 63
Figure 7: Mathematical literacy performance of students from countries above the OECD average in the 2009 PISA testing cycle 64
Figure 8: Scientific literacy performance of students from countries above the OECD average in the 2009 PISA testing cycle 65
Figure 9: The distribution of male upper secondary and vocational graduates by field of education 77
Figure 10: The distribution of female upper secondary and vocational graduates by field of education 77
Figure 11: Total study hours of mathematics and sciences in Japanese junior secondary education, 1958 to 2008 80
Figure 12: Data from the ROSE study showing students’ responses to the question ‘I like school science better than most other school subjects’. Percentage answering Agree or Strongly Agree, by gender 89
Figure 13: The percentage of participating 15 year-old students expecting a career in a science, engineering or computing field 91
Figure 14: The percentage of participating 15 year-old students expecting a career in a science, engineering or computing field by gender 91
Figure 15: The percentage of participating 15 year-old students expecting a science related career by 30 years of age, by field and gender, in PISA 2006 135
Figure 16: The percentage of qualifications awarded to women in tertiary type A and advanced research programs, by field of education, in 2010 136
Figure 17: Number of sciencerelated tertiary graduates among 25-34 years old in employment per 100 000 of this cohort by gender, in OECD 30 countries 137
Figure 18: Seventh grade student drawings of a “scientist” before (left) and after (right) their visit to a scientific research laboratory 139
Figure 19: Proficiency levels for Indigenous and non-Indigenous students in mathematical literacy 148
Figure 20: Proficiency levels for Indigenous and non-Indigenous students in scientific literacy 148

Project aimsA vibrant capacity in Science, Technology, Engineering and Mathematics
(STEM) is pivotal to increasing our nation’s productivity. Building on recent
research commissioned by Australia’s Chief Scientist to identify STEM
skills shortages, this project will critically examine existing solutions to
the STEM skills shortage in comparable countries and to ascertain which,
if any, of those solutions could be usefully applied to the formation and
maintenance of a STEM skills workforce and propose a set of options for
increasing Australia’s productivity and international competitiveness.
10

Securing Australia’s Future, Project Two, STEM:
Country Comparisons, aimed to address
the following:
• Trends in STEM enrolments
in all educational domains
• Access of STEM graduates
to the labour market
• The perceived relevance of STEM to
economic growth and well-being
• What are other countries doing to address
declining STEM uptake and its impact
on the workforce, and/or lifting national
performance? Strategies, policies and
programs used to enhance STEM at
all levels of education, and judgments
concerning the success of those programs
• Are measures put into effect in other
countries and cultures successful and
how has this been evaluated?
• Could and should such measures be
applied in the Australian context, taking
into account our cultural diversity?
• What are the implications of the application
of culturally appropriate measures in
Australia and will the policy framework need
to be modified to accommodate them?
11

Executive summary
The essential mission of the STEM: Country Comparisons project is to
discover what other countries are doing to develop participation and
performance in the disciplines of science, technology, engineering and
mathematics (STEM), and the take-up of STEM in the labour market and
research system, and to draw out possible lessons and ideas for STEM
policy and strategy in Australia. To this end, 23 specific reports were
commissioned and completed by consultants from around the world. This
has produced a body of current data of outstanding value. Most nations
are closely focused on advancing STEM and some have evolved dynamic,
potent and productive strategies. In world terms Australia is positioned
not far below the top group but lacks the national urgency found in the
United States, East Asia and much of Western Europe, and runs the risk of
being left behind.
12

STEM disciplines have become important everywhereSTEM is a central preoccupation of policy makers
across the world. In many countries discussion
about STEM is advanced in terms of claims about
shortages of high skill labour. However, the
consultants’ reports make it clear that nowhere
are there conditions of general shortage. Though
in many countries there are episodic shortages
in particular fields, such as engineering and
computing in Australia, in reality the STEM
economic policy agenda is largely driven by the
need to lift the general quality of the supply of
human capital as well as enlarge the high-skill
group capable in research, commercialisable
innovation and effective response to technological
change. STEM qualifications – in general science
in all countries, and in engineering in some
countries – prepare graduates for a broad range
of occupations, including management. STEM
plays a generic vocational role as well as enabling
entry to specific occupations. As the United States
consultants state:
STEM skills are not only needed in STEM
occupations, but in other economic sectors
as well. Given both the competitiveness of
obtaining employment in some of the highly
specialised STEM occupations, and the
transferability of STEM competencies to other
categories of occupations, it seems that part
of the STEM workforce diverts into non-STEM
– fulfilling demand in those fields, especially
when wages offered are higher than in STEM
occupations. Even in non-STEM fields, STEM
degree holders earn more on average than
non-STEM degree holders… Given this process
of diversion and the economy as a whole
demanding workers with STEM skills, a picture
emerges of a shortage in the available workforce
having STEM-related competencies.
13

14
More broadly still, governments want to lift the
overall scientific literacy of their populations
and to draw most students or all students into
senior secondary school studies in STEM (‘science
for all’). Hence the centrality of STEM. The STEM
disciplines are seen as essential for work and
citizenship, while providing the cut through
in global economic competition and social
creativity. There is a close fit between the nations
with leading and dynamic economies, and the
nations with the strongest performing education
and/or research science systems.
In the Organisation for Economic Co-operation
and Development’s (OECD’s) Programme for
International Student Assessment (PISA), which
compares student achievement in mathematics
and science at age 15, the nations/systems with
the largest group of students at the top three
proficiency levels are Shanghai in China, Singapore,
Hong Kong SAR in China, Taiwan, Korea, Finland
and Switzerland. These are also the systems with
the smallest proportion of underperformers In
PISA. It would seem that there is no need to
choose between boosting high achievement
and eliminating educational disadvantage.
Interestingly, these nations/systems are
also exceptionally strong in research and
development and are rapidly growing their
scientific output. At the same time they have
all experienced two decades of exceptional
economic performance. It is unclear whether
deep and wide intellectual formation precedes
dynamic economic performance, or sustained
economic growth is the foundation of stellar
education and science. What is clear is that all
three – science, universal learning, and economic
dynamism and prosperity – form a single inter-
dependent system.
Deepening and broadening STEMHence the goal of science (and mathematics)
for all is not necessarily in conflict with the
goal of enlarging and improving top-end
STEM performance in secondary schooling and
university research. For example, by growing
the proportion of students who stay in STEM,
including women and low socio-economic
status (SES) students, a nation expands the talent
pool from which future STEM high achievers
will be drawn. Many of the consultants’ reports
discuss this dual focus and the importance of
reconciling the two objectives. Some note that
when the senior secondary track in specialist
science and mathematics is used as a privileged
route for selection into high status university
programs (often in non STEM fields), in school
systems with a high degree of subject choice
that allow students to opt out of STEM, this tends
to both weaken overall participation in science
and mathematics and narrow the size of the
high achiever group. Arguably, this has been an
outcome in Australia. Further, evidence can be
found in the literature that ‘science for all’ types
of programs provide a superior preparation for
advanced STEM training.
A related problem is the shibboleth widespread
in Australia, that the STEM disciplines are
accessible only to students with ‘talent’ in
science and mathematics. This contrasts with
the notion prevalent in the high performance
East Asian systems, that success in education
and science is due less to talent than to hard
work. The notion that educational outcomes are
determined by pre-given talents, as if STEM was
akin to an elite sporting contest, naturalises the
social stratification of learning and undermines
social inclusion by fostering a long ‘tail’ of low
achievers. This contrasts with the position in
those nations that perform strongest in the
standardised international comparisons of
student achievement, PISA and TIMSS (Trends in
International Maths and Science Study). Whether
their social and political cultures are egalitarian
(the Nordic world) or hierarchical (as in Sinic East
Asia) they expect high standards from all students.
In China, Russia and some European countries
mathematics is compulsory until the end of school,
and many higher education students continue
with advanced mathematics. In most OECD nations
the proportion of higher education students
enrolled in engineering is significantly higher than
in Australia, led by Finland, Korea and Germany.
In part this is because these nations are strong
in manufacturing, but many of their engineering
graduates go on to work outside the profession.

15
Countries strong in STEMWhile the countries strong in STEM are diverse
in their economies, political and social cultures
and their educational traditions, certain features
recur in common. First, school teachers enjoy
high esteem, are better paid and work within
more meritocratic career structures than found
elsewhere. An outstanding example is Finland,
where all teachers have a Masters degree,
teaching is harder to enter than most other
professions, and the strongest teachers are paid
to work in school districts serving poor families
and students with the most learning difficulties.
In China, STEM teachers receive salary increases
not on the basis of seniority but via continuing
professional development programs, specific to
the discipline. To be promoted China’s teachers
must demonstrate an improving standard of work.
Second, these countries have an unbreakable
commitment to disciplinary contents. They do
not equate teaching with class management and
credentialing alone. They focus on knowledge.
STEM teachers are expected to be fully qualified
in their discipline and to teach in that field and
not others. This contrasts sharply with Australia.
Professional development is primarily focused
on the discipline rather than generic programs,
which again contrasts with Australia.
Third, the most successful countries have
instituted active programs of reform in
curriculum and pedagogy that are focused
on making science and mathematics more
engaging and practical, through problem-based
and inquiry-based learning, and emphases on
creativity and critical thinking. These themes
also run through the best Australian classrooms
in STEM. The main South Korean program for
building participation and achievement in STEM
has incorporated the arts, to strengthen the
focuses on creativity and design. The program
is titled STEAM. These more student-centred
approaches are being employed without diluting
content. In Japan, where mandatory hours and
standards in STEM were successively lowered for
two decades and PISA performance declined,
since 2008 there has been a return to stronger
content requirements and less open choice.
Fourth, many of these countries have developed
innovative policies to lift STEM participation
among formerly excluded groups. Finland’s focus
on low achieving students has been mentioned.
The consultants’ report on the strategies used
among first nations students in the Province
of Saskatchewan suggest that the Canadian
experience has lessons for indigenous STEM
education in Australia.
Finally, STEM-strong countries have developed
strategic national STEM policy frameworks which
provide favourable conditions for a range of
activities: centrally driven and funded programs,
including curriculum reform and new teaching
standards; world class university programs,
the recruitment of foreign science talent and
new doctoral cohorts; decentralised program
initiatives and partnerships and engagement
that link STEM activities in schools, vocational
and higher education with industry, business and
the professions. Often STEM programs are led
or facilitated or informed by institutes, centres
or other agencies that have been specifically
created to progress and resource the shared
national STEM agenda.
How is Australia travelling?How does Australia’s participation and performance
in STEM compare with the STEM-strong countries
and with the rest of the world? What are our
strengths and weaknesses and where might we
usefully gain from other nations’ experiences?
The news is good but not great. Australia
has travelled fairly well until now, but there
are holes in capacity and performance.
Further, many other countries are
improving STEM provision, participation
and performance more rapidly than us.
In the most recent (2009) PISA study, Australia
ranked equal 7th of all nations/systems in
science and equal 13th in mathematics.
There has been a decline in Australia’s relative
position since PISA began. This is partly due to
the entry of high performing Asian systems.
The larger problem is that our average PISA
mathematics score declined from 524 in 2003

16
to 514 in 2009. There was no significant change
in science, but the average score for reading fell
from 528 in the year 2000 to 515 in 2009. PISA
focuses on the application of STEM knowledge.
In TIMSS, which focuses more on content
knowledge in STEM, Australia is a top 20 rather
than top 10 performer. There has been no
statistically significant decline in performance
across the successive TIMSS assessments.
Perhaps the larger problem in Australia lies in the
distribution of student achievement. Participants
in both PISA and TIMSS are divided into groups
according to their demonstrated proficiency.
A benchmark performance level is set, below
which students are thought to be at risk of
having difficulty in participating work and life as
productive citizens in the twenty-first century. In
PISA, 16 per cent of Australian students fall below
this point in terms of mathematical literacy,
and 12 per cent in scientific literacy. In TIMSS
testing of mathematics at year 4, 30 per cent of
students fall below the specified benchmark.
This proportion rises to 37 per cent by year 8. By
contrast in science there is little change, from
29 per cent in year 4, to 30 per cent in year 8.
While only 3 per cent of Australian students
in the highest SES quartile fall below the PISA
international benchmark in scientific literacy,
22 per cent of students in the lowest SES
quartile fail to reach it. The difference is more
marked in mathematical literacy, at 4 per
cent and 28 per cent respectively. Students
from independent schools achieve higher
raw scores than students from Catholic and
government schools but there is not statistically
significant difference once variation in students’
SES backgrounds is taken into account.
Australia has a longer tail of under-performing
students than nearest comparator Canada. In
PISA mathematics non-indigenous students
score on average 76 points higher than
indigenous students, a gap equivalent to
almost two years’ schooling. More positively,
migrant families do better in Australia than
in most OECD countries. Young people born
in Australia to immigrant parents are the
highest achieving group in Australia. Many
have East Asian cultural backgrounds.
Turning from performance data to participation
data, in Australia the percentage of year 12
students enrolled in higher level STEM has
been declining for decades. In 1992–2010 the
proportion of year 12 students in biology fell from
35 to 24 per cent, in physics from 21 to 14 per
cent. This period coincided with a broadening of
the range of secondary subjects and a reduction
in the role of prerequisites for university entrance
into science-based programs, creating greater
scope for student choice. University faculties
want to attract the highest scoring students so as
to maximise the university’s market position, with
decreasing regard for content-based preparation.
There was a lesser decline in mathematics, from
77 per cent to 72 per cent, but most students
were enrolled in elementary mathematics
subjects. Only 10 per cent participated in
advanced mathematics at year 12 level, with
20 per cent in intermediate mathematics. A
growing proportion of high-achieving year
12 students participate in no mathematics
program at all, particularly female students.
At tertiary stage in 2010, 29.9 per cent of
Vocational Education and Training (VET ) students
were enrolled in STEM disciplines, mostly in sub-
degree engineering and related technologies.
In higher education 32.7 per cent of all higher
education students were in STEM.
Commencing higher education domestic
students in natural and physical sciences showed
little change between 2002-2008 but there was
29 per cent growth from 2008 to 2010. Between
2002 and 2010 engineering commencements
grew by 21 per cent. However, this was from a
low base, as international comparisons show.
In the average OECD country in 2010, 15.0 per
cent of new entrants to tertiary education were
in engineering, manufacturing and construction
but in Australia it was only 8.7 per cent. While
4.4 per cent of new tertiary entrants across
the OECD went into sciences compared to
6.6 per cent in Australia, 2.5 per cent were in
mathematics compared to just 0.4 per cent in
Australia. In both the average OECD country
and Australia 4.3 per cent of tertiary entrants
went into computing. In other words Australia is
relatively strong in participation in the sciences
but weak in mathematics and engineering. The

17
United Kingdom and New Zealand have a similar
profile though the United Kingdom is stronger in
mathematics. In the Westminster countries there
is a common approach to engineering as more a
professional than a generic degree (safeguarding
the labour market and salary position of
engineering graduates) in contrast with much of
Europe and Asia.
In most countries the role of STEM is larger at
doctoral level than first degrees. In Australia 26
per cent of PhDs awarded in 2008 were in science
with 14 per cent – a low figure by international
standards – in engineering. The combined total of
40 per cent was just above the OECD average and
on par with Finland. But any growth there has
been has been among international students: the
number of commencing domestic PhD students
in science and engineering in 2010 was below
the 2004 level. This was in sharp contrast with
the rapid growth of STEM doctorates in many
other countries. For example between 2005 and
2010 in Canada there was 39 per cent growth in
doctoral graduates in mathematics and statistics,
48 per cent in the physical sciences, 65 per cent
in engineering, manufacturing and construction,
and 134 per cent in life sciences.
There is severe gender imbalance in Australian
tertiary enrolments in STEM, similar to
patterns found in many countries, especially in
engineering. In VET STEM in 2010, 25 per cent
of students were women. In higher education
the female share of STEM was 44 per cent,
compared to 56 per cent in all disciplines. Once
health sciences and nursing are taken out of the
picture the imbalance looks more extreme. In
information technology in higher education in
2010, 15 per cent of students were women; in
engineering 14 per cent. In 2008, 37 per cent of
all STEM doctoral degrees, with health included,
were awarded to women. This was below
Portugal and Israel but higher than in most other
OECD nations. Gender imbalance is especially
bad in South Korea and Japan.
There is a substantial decline in Australian
students’ commitment to science and
mathematics between the middle primary
years and the end of secondary school. The
TIMSS data for 2011 show that 55 per cent
of year 4 students ‘like science’. Only 25
per cent say so in year 8. The international
average also declines, but at a slower rate,
from 53 to 35 per cent. Similarly Australian
students’ fondness for mathematics falls from
45 per cent (Year 4) to 16 per cent (Year 8).
Another concern is the capacity gaps in
STEM teaching. We do not know how many
mathematics and science teachers are trained
each year, or what proportion ‘leak’ from
teaching before they begin. What is clear is
that supply is insufficient. There are instances
of absolute shortage, especially in rural and
remote communities, but the larger problem
is teaching ‘out of field’. A 2011 study by the
Australian Council for Educational Research
(ACER) found that in years 7-10 mathematics, only
62 per cent of teachers had two or more years’
tertiary mathematics (the minimum required
to teach mathematics in most countries). More
than one third, 39 per cent, were teaching
out of field, and 23 per cent had no tertiary
mathematics at all. A May 2012 report from
the Office of the Chief Scientist found that of
teachers teaching years 11-12 mathematics,
12 per cent in metropolitan schools had no
mathematics training at university level, and 16
per cent of those working in provincial towns.
These problems are less likely to occur in high
SES schools. Faced with staffing shortages 47
per cent of government school principals ask
teachers to teach outside field, and 57 per cent
of Catholic school principals, but only 14 per
cent of independent school principals. Out of
field teaching is unusual in the countries studied.
Only in the United States, Brazil and Australia
does it occur on a large scale and it appears to
be worse in Australia than the United States.

Key findingsThis report is grounded in 22 commissioned studies of educational
policies and practices in relation to STEM around the world. The key
findings were developed drawing on analysis of the commonalities
across these reports and key points of difference or coincidence with
the Australian situation, and on the knowledge vested in the Expert
Working Group of critical contextual conditions in Australia, and of the
literature on STEM participation. Though very few international policies
and educational practices can be readily transferred into the Australian
context, the STEM strategies and practices of other countries provide an
informative window through which we can better make judgments about
key features of Australian STEM practices, and provide many potentially
useful ideas for developing STEM strategies in Australia. The main findings
of the project are summarised in Sections 1-15 that follow. The findings
highlight a number of STEM issues, emerging from the country reports and
international comparisons, together with examination of STEM in Australia,
that are key topics for discussion at the national level. This section
of the report summarises these key findings and draws out potential
implications concerning policy and practice in the Australian context. The
finding numbers reflect the relevant section of the report. For evidence
supporting each finding, and arguments concerning implications for
Australian, see the relevant numbered sections of the Report.
18

STEM in society
Key Finding 5.1: Broadening STEM engagement and achievement
In all strong STEM comparator countries,
broadening STEM engagement and
achievement entails improving participation
in the STEM disciplines through ‘T’ policies
(i.e. learning in both breadth and depth)
and covering the full spectrum of prior
student achievement levels. In particular:
• Provision of at least some discipline-
based STEM learning for all school
students, up to and including students
in senior secondary education.
• Improving the engagement and performance
of students from groups currently under-
represented in STEM, that on average perform
relatively poorly in mathematics and science.
• Lifting the size and average achievements
of the group of students engaged in
intensive STEM learning in depth, in
both schooling and higher education.
Key finding 5.2: STEM-specific tracking in secondary education
Many of Australia’s comparator countries achieve
strong participation in STEM through bifurcation
at secondary school level between STEM and
non-STEM tracks, and vocational tracks leading to
significant STEM training. There may be benefits
in significant discussion in Australia concerning
the potential for, and the pros and cons of:
• Firm bifurcation between a comprehensive
STEM track, and a non-STEM track, in the final
two years of secondary education.
• Development of STEM-heavy technical and
vocational schools and tertiary institutes,
alongside academic secondary schools and
universities (the latter also including some STEM).
19

20
Key finding 5.3: Compulsion vs choice in senior secondary mathematics and science education
There is a concerning trend in the senior
secondary and undergraduate tertiary years
in Australia away from the sciences and
particularly away from advanced mathematics.
There is a range of structural elements in the
curriculum offerings of many of our comparators
strong in STEM that offer possible models
for consideration by Australia. Many of these
countries have a more stringent approach to
curriculum offerings, for instance requiring
the study of mathematics to Year 11. An
extension of mandatory STEM curricula in senior
secondary schools has opportunity costs, by
restricting student choice and engagement
in non-STEM subjects of educational value.
Nonetheless, there may be benefits in discussion
among the states, territories, subject teacher
associations, universities and relevant science
and mathematics organisations about the pros
and cons of possible reforms to senior secondary
education certificate requirements, to enable one
or more of the following:
• Including the study of mathematics (at
any level from Essential Mathematics to
Specialist Mathematics) up to the end of year
11 – making mathematics compulsory for
everyone to the end of year 11.
• Including the study of mathematics (at
any level from Essential Mathematics to
Specialist Mathematics) up to the end of year
12 – making mathematics compulsory for
everyone to the end of year 12.
• Including the study of mathematics for
all to the end of year 12, with standards
differentiated according to pathways. For all
students, including those taking vocational
pathways, the minimum curriculum level
required would be equivalent to the Essential
Mathematics course from the Australian
Curriculum. For students to receive an
Australian Tertiary Admission Rank (ATAR) and
go to university, the minimum curriculum
level required would be equivalent to the
General Mathematics course from the
Australian Curriculum.
• Including the study of at least one science
subject up to the end of year 11 – making
science compulsory for everyone to the end
of year 11.
• Including the study of at least one science
subject up to the end of year 12 – making
science compulsory for everyone to the end
of year 12.
Key Finding 5.4: STEM-specific prerequisites for higher education
In a number of high performing countries STEM
subjects at upper secondary school level are
strongly linked to university entrance. One way
of lifting the level of study of STEM in both
senior secondary and higher education would
be the reintroduction of more comprehensive
prerequisite requirements for university programs
requiring advanced STEM knowledge, optimising
preparation in the disciplines.
Key finding 5.5: Generic role of engineering degrees
Relative to our strong comparator countries
Australia has low participation in tertiary
engineering degrees. The participation of women
in these degrees is also low.
5.5.1 Tertiary institutions and the professions
in engineering and the technologies
might consider ways and means of
strengthening the generic role of
engineering degrees in professional
labour markets, broadening the pathways
between the study of engineering and
employment in fields beyond professional
engineering, including business and
government. Such an approach would
have implications for program design,
marketing and student counselling.
5.5.2 There is potential for strategies
designed to make engineering more
attractive as a generic degree, especially
for young women.

21
Attitudes to STEM
Key finding 6.1: Building awareness of STEM disciplines and STEM-related occupations among young people
For most countries, initiatives targeted at student
attitudes and identity were a significant part
of the strategic mix. This included initiatives
to increase awareness of the nature of STEM
professions. Based on the consultants’ reports,
strategies and programs could be further
developed and extended so as to encourage
in students positive attitudes to study of
mathematics and science, and to STEM-related
work and careers. Such strategies would need
to take into account the diversity of students’
contexts, including their gender, ethnicity/
cultural background, SES status and indigeneity.
Such strategies could include:
• Awareness campaigns to enrich public
understanding of career options in STEM and
the nature of STEM work, and to alert young
people to the range of possible future STEM
lives and identities.
• Strategies at school level designed to involve
families in mathematics and science learning
and in building positive attitudes to STEM-
related careers.
• Role models, in the form of student
interaction with practicing STEM
professionals, or web-based presentations
of narratives of STEM professionals
(such as those on the Academy of
Technological Sciences and Engineering
[ATSE] Science and Technology Education
Leveraging Relevance [STELR] website).
• Career advice that includes images
of people working in STEM-related
careers, delivered through information
workshops for careers teachers, and
mathematics and science teachers.
• The inclusion, in curriculum resources,
of images of people working in
STEM-related careers.
• The inclusion, in curriculum resources, of
materials that speak to the identity needs of
the diverse range of students. This includes
girls (e.g. science material related to health, or
the environment.), indigenous students (e.g.
materials that embody respect for indigenous
knowledge), and contextual science that
relates to youth interests.
• The expansion of opportunities for families
and the general public to engage positively
with science and mathematics through
events, exhibitions and other approaches.
• Enrichment programs whereby
students are engaged in science or
mathematics projects that entail linking
to members of local communities.
Framing national STEM policy and strategy
Key finding 7.1: National STEM policy
A number of countries articulate through
national policy a government commitment
to STEM or a broader science and technology
agenda. In these cases national policy establishes
a framework for STEM-specific objectives and
facilitates the implementation of coherent STEM-
specific strategies and programs. National STEM
policy tends to span more than one government
ministry, and in many instances is supported
by structures coordinating STEM or science
and technology activity across jurisdictions
and agencies. National STEM or science and
technology policy is generally conceived in
human capital terms.
A national STEM policy could provide a coherent
framework for identifying and articulating STEM-
specific strategies and programs spanning the
school, VET, higher education and research and
development sectors, and also relevant programs
in relation to innovation, employment and
industry development.

22
School curriculum and pedagogy
Key finding 8.1: Inquiry, reasoning, and creativity and design in STEM curricula
Many comparator countries with strong STEM
agendas and results have a well-developed
curriculum focus on innovation, creativity and
reasoning, accompanied by a strong commitment
to disciplinary knowledge. In relation to school
curricula, teaching, learning and educational
policy and organisation could usefully address
elements such as:
• Strong disciplinary frameworks, noting that
disciplinary thinking and disciplinary literacies
are central to creative problem solving in
STEM-related learning and work.
• At the core of learning, methods of problem
solving, inquiry, critical thinking and creativity,
all of which can enhance both students’
attitudes to, and practical competencies, in
STEM fields.
• Design tasks into school science and
mathematics curricula, in order to support the
development in students of problem solving
skills, flexibility in thinking, and awareness of
engineering design activities.
• Consideration of the inclusion of the visual
and performing arts alongside strategies and
programs designed to enhance the orthodox
STEM-related disciplines, as in the successful
STEAM policy in Korea.
• Development of assessment regimes that
support the commitment to problem solving,
inquiry-based approaches, critical thinking
and creativity.
Key finding 8.2: Standardised tests of student achievement
A number of high performing STEM countries
monitor achievement through standardised
testing regimes. There was some evidence
presented of negative effects of high
accountability regimes in narrowing the
curriculum and de-skilling teachers. At the other
end of the standardisation-autonomy scale, most
countries had instituted initiatives that supported
local autonomy and contextual variation.
Standardised testing of student achievement
in STEM is a useful way of mapping progress at
systemic level and among sub-populations, and
can be used to diagnose gaps and problems at
macro and micro levels.
Teachers and teaching
Key finding 9.1: Career pathways for STEM teachers
STEM-strong comparator countries have in
common the high status of teachers, and high
entry level into the profession.
9.1.1 Strong STEM performing countries
particularly in Asia have meritocratic
career structures that recognise teaching
excellence. Australia could develop a
specific and integrated career pathway for
mathematics and science teachers, one
that would be common to all schools and
based on teaching effectiveness, innovation
and leadership closely tied to recognised
continuous, discipline-based professional
learning. The Australian Professional
Standards for Teachers, developed by the
Australian Institute for Teaching and School
Leadership (AITSL), provide one possible
basis for such an approach.
9.1.2 Higher degrees for teachers are a
feature of some high performing
countries such as Finland. Australia
could consider the scheme put forward
by the Academy of Science to attract
PhD graduates in mathematics and
science into a teaching career. The
Academy has recommended that:
… enhanced career pathways be
established to promote the recruitment
of science PhD graduates into teaching.
This would provide an alternative
path for PhD scientists who wish to
move out of research careers. It would
also ensure that schools have science

23
teachers who are not only passionate
about science but are able to draw on
their research skills and expertise to
engage students in ‘learning by doing’
– an approach which has already been
shown to increase student performance.
Key finding 9.2: STEM-specific salaries
There are a few examples of differential salaries or
incentives for teachers in the STEM area to attract
and retain science and mathematics teachers
particularly in hard-to-staff schools.
9.2.1 One possible incentive strategy is to
provide higher rates of pay for teachers of
mathematics and science with honours or
higher degrees.
9.2.2 Another possible incentive strategy is to
provide bonus starting pay for mathematics
and science teachers at schools in low SES
schools and regional and remote schools,
similar to the United Kingdom’s ‘golden
welcome’ scheme.
Key finding 9.3: Discipline-specific professional development in secondary education
A strong feature of some international
jurisdictions is the development of an
evidence based national approach to
professional development of mathematics
and science teachers. In high performing
Asian countries in particular there is a strong
tradition of school-based professional
learning through collaborative planning.
9.3.1 One way to strengthen depth of
content in STEM at school level is
to engage secondary school-level
science and mathematics teachers in
sustained discipline-specific professional
development programs, focused on
pedagogical content knowledge and
content knowledge that are not part
of generic professional development
programs common to all teachers.
9.3.2 Professional development for teachers
of mathematics and science could
support teachers in the implementation
of the Australian Curriculum in Science,
Mathematics and Technologies, and
include, as key characteristics:
• an evidence-based approach
• use of international experience, and
experience at state level
• a framework linking professional
development with the acquisition
of higher degrees in mathematics
and science education, supported by
financial incentives.
9.3.3 Consistent with the findings summarised
in Sections 5 and 8, discipline-specific
professional development could address
methods of problem solving, inquiry-based
approaches, critical thinking and creativity,
and other methods designed to increase
student learning and engagement with
science and mathematics; and also take
into account the diversity of the student
population and the need to enhance
inclusion and performance among students
from social groups presently under-
represented in STEM (see Section 5).
Key finding 9.4: ‘Out of field’ teaching
The incidence of ‘out of field’ teaching in
science and mathematics is especially high in
Australia by comparison with other countries.
Arguably, this is a crucial weakness of Australian
education, impairing both the breadth and depth
of STEM learning, especially in government
and Catholic schools. One possible strategy
would be a national timetable for elimination
of out of field teaching in STEM in Australia,
coupled with monitoring of graduates from
teacher training and rigorous discipline-specific
professional development training programs,
linked to monetary incentives and leading to a
qualification, for teachers currently teaching ‘out
of field’ in science and maths.

24
Key finding 9.5: Science and mathematics teaching in primary schools
There is a serious focus in all countries on the
quality of mathematics and science education at
the primary school level. Many countries mirror
concern in Australia with the adequacy of current
provision at this level.
The foundations of STEM competence are laid
in early childhood and primary education. This
suggests the need to lift the confidence and
competence of primary teachers in the teaching
of science and mathematics. One model would
be a scheme akin to that of the United Kingdom,
whereby trained specialist mathematics leaders
have responsibility within their schools for
overseeing mathematics teaching skills and
approaches, and for developing the relevant
learning resources.
Labour markets and STEM
Key finding 11.1: Specific and generic roles of STEM education and training in relation to the workplace
There is a lack of clear data in Australia
concerning destinations of STEM graduates
and the role of STEM training in a variety
of professions. There is also lack of data on
qualifications of teachers of STEM.
11.1.1 A key need is data concerning the
destinations of STEM graduates (whether
at the level of first degree, postgraduate
coursework or postgraduate research)
in the first 5-10 years after graduation,
identifying the respective roles of STEM
education and training in relation to:
• work specific to the STEM qualification
• work that is outside field but
within STEM
• work in occupations with no
specific STEM requirements that
may nonetheless draw on STEM
graduates’ skills and knowledge
in a more generic manner.
Such data gathering could also include:
• review and audit of occupations
requiring STEM qualifications
• comparison of the labour market
outcomes of STEM graduates by field,
with those of non-STEM graduates
• factors that facilitate and limit
the labour market mobility and
flexibility of graduates with STEM
qualifications, and employer take-
up of STEM qualifications.
11.1.2 A comprehensive survey of secondary
teachers in order to identify the number
and full qualifications profiles of teachers
of all STEM subjects at all year levels.
Girls and women
Key finding 12.1: Gender-based participation in STEM
Countries generally are grappling with the issue of under-representation of women and girls in STEM fields, and pursue a variety of gender equity policies and strategies to address this. In Australia, women’s participation in STEM has not altered substantially over two decades, and there is a case to be made for re-invigorating the agenda on women in STEM. Comparator countries’ initiatives could provide indications of ways forward. Measures designed to lift female participation in STEM, from first degrees to research functions, could include:
• System-wide targets designed to achieve an equitable percentage of women in STEM disciplines.
• Scholarships and fellowships specifically reserved for female students and researchers, in areas such as engineering where women are grossly under-represented. Such scholarships and fellowships would be largely provided by higher education institutions.
• Strategic reservation of funds for women to assist their study and establish themselves as researchers, and/or the allocation of greater points in funding selection processes to projects that include women researchers.

25
Key finding 12.2: Mentoring programs to encourage female participation in STEM
Mentoring programs in a number of countries
have been positively evaluated as improving
women’s participation in STEM. Examples of
mentoring programs include:
• Bringing together young women and
successful female STEM professionals
(including scientists, engineers,
mathematicians and computing specialists)
to provide authentic understanding of STEM
careers, and access to female role models.
Such contact with STEM professionals could
start as early as primary level schooling and
continue consistently through education and
early career training.
• Peer to peer support between high school
and primary students, or between tertiary and
upper secondary students, through activities
and science shows.
• Systematic linkages between professors in
STEM fields, and doctoral students or post-
doctoral level women in STEM fields.
Key finding 12.3: Gender-related elements in school curricula and pedagogies in STEM disciplines
Gender-related elements in school curricula and
pedagogies in STEM disciplines are a feature of
some countries’ initiatives that are well supported
in the literature. Strategies could include:
• Curriculum design and professional
development that could generate greater
teacher awareness about encouraging girls to
consider STEM pathways.
• Content, pedagogy and resources
suited to the learning styles and
preferences of girls as well as boys.
• An increased focus on inquiry based
science teaching, integrated; mathematics
throughout the curriculum.
• Engaging science experiences
from an early age.
Key findings 12.4 and 12.5
Further strategies for increasing women’s
participation in STEM, successfully pursued by a
number of comparator countries, include career
counselling and flexible workplace arrangements.
These suggest the following options for Australia:
Key finding 12.4: Course and career counselling designed to encourage female participation in STEM
Counselling services and promotional materials
in relation to STEM pathways designed to
effectively encourage young women to follow
STEM pathways.
Key finding 12.5: Women in the STEM-related workplace
Facilitating female participation in STEM-related
fields of work, including issues such as maternity
pay and provision for paternity pay and leave,
flexible working hours, child care provision, and
support for family mobility.
STEM and indigenous students
Key finding 13.1: National approach to STEM teaching and learning for indigenous students
The Canadian indigenous STEM education
experience presents a strong case for pursuing
‘culturally responsive teaching’ involving the
recognition of indigenous knowledge as part of
the study of science, and the active involvement
of indigenous elders in framing the curriculum
and teacher professional development. On the
basis of this report, advancing STEM teaching
and learning for Australian indigenous students
needs wide discussion, including approaches to
curriculum and pedagogy in STEM that would
more strongly engage indigenous students with
STEM subjects at school, in higher education,
and into professional STEM pathways. Such
approaches could entail, among other elements:

26
• Recognition of indigenous Australian
knowledge in science and mathematics
curricula, providing that this draws on
systematic research into indigenous
Australian perspectives, as well as appropriate
international examples such as those from
Canada, the United States and New Zealand;
• Involvement of indigenous elders
in this research, and in the ensuing
development of curriculum and teacher
professional learning support;
• Compilation of recent and existing
educational programs and practices and
support structures, which have proved
effective in Australia.
Key finding 13.2: Programs and activities designed to facilitate indigenous students’ learning and work in STEM-related disciplines
The experience of Canada, the United States
and New Zealand point to common findings
concerning the characteristics of programs
successful in attracting and retaining indigenous
students in tertiary STEM pathways. Programs
and activities designed to facilitate indigenous
students’ learning and work in STEM-related
disciplines could include:
• Courses facilitating the transitions between
schooling and tertiary education, and
between education and work;
• Outreach activities between tertiary
education and schools;
• Working with industry to establish
processes for engaging indigenous
students and graduates into the workforce,
including local work placements that
draw on STEM education and training;
• Scholarships leading to university
and/or employment;
• Higher education institutional structures
and activities including specialist societies,
mentors, and career counselling;
• Curriculum initiatives and professional
learning for higher education teaching staff.
Key finding 13.3: Professional development regarding STEM and indigenous students
The Canadian report in particular makes clear
the critical role of professional development in
successfully engaging indigenous students in
school science and mathematics. Professional
development regarding STEM and indigenous
students could include:
• Recognition and respect for indigenous
ways of knowing; and
• Culturally responsive teaching, whereby
students from indigenous backgrounds
are supported in engaging effectively with
scientific thinking and practices; and also
• Programs and activities designed to facilitate
indigenous students’ learning and work in
STEM-related disciplines.
Partnerships and enrichment activities
Key finding 14.1: STEM Partnerships
Successful partnership initiatives in a number
of STEM-strong countries demonstrate the
important role of partnerships in supporting
innovation in school mathematics and science.
While partnership activities are common in
Australia, clear understandings of their nature
and their effects is often lacking. An approach to
STEM partnerships could include:
• Developing an understanding of the scale,
scope and variety of STEM-related partnership
and enrichment initiatives in Australia – many
of which are localised in nature – and of their
nature, aims, and effectiveness.
• Coordinating the sharing of details about the
relevant initiatives, and develop advice for
science organisations, business and industry,
and school authorities, concerning how best
to manage these to good effect.

27
National STEM coordination
Key finding 15.1: Possible forms and activities in relation to national STEM coordination
There are many examples of potent policy
and coordination regimes in our comparator
countries, that express the urgency with which
national STEM agendas are being pursued, and
the benefits of coherence across STEM related
areas. National coordination could make a
significant contribution to the enhancement of
STEM provision and participation in Australia, as it
already does in many other countries.
Areas of activity in which national coordination
might add value to STEM provision and
participation include:
• The compilation of data concerning
participation and performance
in STEM education.
• The generation and dissemination of
knowledge concerning effective, evidence
based approaches to engagement with
quality learning in STEM fields, drawing on
international and Australian experience,
and on the relevant research literature.
• Coordination and networking of policies,
strategies and programs designed to enhance
approaches to STEM-related teaching
and learning in schools, consistent with
the Australian Curriculum, including the
coordination of resource development and
dissemination across the States and Territories.
• Coordination and networking of policies,
strategies and programs designed to enhance
approaches to STEM-related teaching and
learning in tertiary education, including
outreach and placement activities in
partnership with schools and with industry.
• Coordination of principles and approaches to
professional development in relation to STEM
teaching, and support structures for teachers
of mathematics and science, designed to build
the capacity and status of the profession and
to support improvements in student learning.
• Coordination of approaches to the
enhancement of knowledge and
advice regarding STEM pathways,
courses and careers.
• Coordination of approaches to partnership
and mentoring designed to support STEM
education in schools and tertiary institutions.
• Coordination of policy and program
development in relation to the
participation in STEM of students from
under-represented groups, including
girls and women (particularly in relation
to engineering), low SES students and
disadvantaged school communities,
including regional, rural and remote
communities, and indigenous communities.
• Coordination of approaches to enhancing
public, student and employer perceptions
of the potential contributions of STEM,
and better understanding of STEM
in education, work and careers.
Key finding 15.2: Possible coordination structures
In the key comparator countries there are a
variety of structural approaches to national
coordination of STEM initiatives. Australia could
productively learn from these. Approaches could
take a number of possible forms, not all mutually
exclusive, including for example:
• a specially constituted national STEM body
(i.e. an agency or centre) reporting to an
appropriate government office or department
• an advisory body with State and Territory
government representation
• an advisory body with broad representation of
peak stakeholder groups including industry,
STEM educator and research bodies, and
education systems.
The key aspects of such a body or bodies
needing considered discussion are the
national overview that would be required,
the capacity to establish working groups to
deal with distinct issues, and the capacity to
commission research and to focus resources.

IntroductionBuilding on recent research commissioned by Australia’s Chief Scientist
to investigate the health of Australian science and identify STEM skills
shortages and capacity constraints, the STEM: Country Comparisons project
critically examined approaches to STEM capacity building in countries
and regions across the world. The project set out to consider whether
any of these solutions could be usefully applied to STEM provision in
Australian education and the formation and maintenance of a STEM-
skilled workforce. Drawing on the policy interventions and programs
implemented in other countries, with due regard to issues of translation
into the Australian context, this report articulates key findings and their
implications for increasing Australia’s productivity and international
competitiveness by nurturing scientific literacy and fostering capacity and
performance in STEM.
In doing so the report pays due regard both to immediate issues and
problems, such as teaching capacity in the STEM disciplines, and issues of
longer-term development. It uses a global overview of STEM strategies and
programs, while at the same time making key findings relevant to national
and local conditions.
It was proposed by the authors of this report at the outset of the project,
and subsequently endorsed at the first meeting of the project’s Expert
28

Working Group that the project would primarily
focus on STEM in terms of human learning,
knowledge and skills (‘human capital’), and their
applications in work. It was not primarily focused
on the research, development and innovation
system, except in relation to the training of
knowledge workers, though it was recognised
that aspects of the research and development
system were part of the institutional framework
and policy conditions in which STEM
development occurs.
The project investigated all levels of education
except early childhood learning, with particular
emphasis on the senior secondary and tertiary
years, including doctoral education. Tertiary (and
in some systems, secondary) education included
both academic education (e.g. universities) and
technical/vocational training, and the interface
of each with employers, occupations/professions,
the workplace and other education sectors.
Special attention was given to the participation
of girls and women, and students from social
groups under-represented in STEM learning
or STEM-related work (e.g. students from poor
families, students from migrant communities
in some countries). Indigenous participation
in STEM was the subject of separate reports in
Canada and the United States and was included
in some national reports from other systems,
where relevant.
As the project aims suggest, the primary interest
of the project was in strategies, policies and
programs used to enhance STEM at all levels of
education and in the education/work interface.
This includes comparator countries’ systems of
measuring and monitoring STEM activity and
progress towards policy goals. The project was
particularly interested in success and/or failure
of these strategies, policies and programs,
and the factors that have affected each. The
29
30
emphasis on policy and strategy meant that
the main focus was on (primarily) national and
provincial government programs dealing with
STEM. Nevertheless, strategies and programs
developed by education institutions and some
non-government organisations were also
considered to be relevant (e.g. foundations in the
United States), and the potential of joint industry-
education bodies was seen as significant,
especially given that Australia and other English-
speaking nations have favoured such strategies.
In the outcome, however, most of the data
collected and summarised by the consultants
related to government policies and programs,
or derived from standard official statistics on
educational institutions.
Definition of STEMSTEM is defined within this project as learning
and/or work in the fields of science, technology,
engineering and mathematics, including
preliminary learning at school prior to entry
into the specific disciplines. The reports
commissioned for this project revealed that
the discipline grouping, and the term itself, are
not used uniformly in international educational
policy or practice. For example, in Australia,
health professions, agriculture, environment and
related fields, and computing, are all typically
included within the official ambit of STEM, and
appear in some of the tables in this report. The
inclusion of agriculture is common but not
uniform throughout the world. Practical health
fields, such as medicine, are included in some
countries, including Argentina, China, Israel,
New Zealand, and the United States. In East Asia
and in Russia, however, STEM normally excludes
health professions. Finland includes geography.
Some countries include psychology. Tertiary level
analysis in New Zealand includes architecture,
veterinary and environmental studies.
In much discussion of STEM both in Australia
and in other jurisdictions, it appears that
science, engineering and related technologies,
and mathematics, are seen as a de facto core.
Medicine and health sciences, as noted, are
marginal to this core or are not always included.
This core notion of STEM poses problems for policy in Australia because compared to some comparator countries (e.g. Finland, Korea), Australia has a large workforce in health services and a small workforce in manufacturing and the engineering professions. Nevertheless, it can be argued that mathematics and the basic sciences are foundational to all science-based work, including health and other applied life sciences. At school the foundational preparatory practice of STEM – in the form of the science and mathematics disciplines – remain relevant whether STEM is conceived broadly or narrowly. Most of this report is focused on schooling. Discussion of tertiary education and workforce issues is largely focused on science, mathematics and engineering.
At the same time, science, technology, engineering and mathematics – not to mention the many specific disciplines within these broad fields, especially in natural sciences, and more so if the health and agricultural professions are added to the mix – constitutes a heterogeneous cluster. The dynamics, issues and problems of participation, performance and usage are not identical for each discipline, especially in the workforce. There is an artificiality in combining all these fields in a single noun. We recognise that where statements are made that cover the whole cluster, it is essential the generalisation applies to each part.
At the outset we note also that learning in the STEM disciplines is not entirely sui generis within educational curricula. Educationally, the development of and performance in the STEM disciplines is not independent of success in other disciplines, as is discussed further in Section 5. Nor should other disciplines be seen as ‘less worthy’ or ‘less important’, or ‘less valuable’ educationally or vocationally, than are the STEM disciplines. The key findings presented in this report imply the need both a broader take-up of science and mathematics, and a larger cohort engaged in intensive or ‘deep’ STEM-related learning. In upper secondary and in tertiary education, students make subject choices and more study of STEM means less study of non-STEM disciplines. There are inevitable opportunity costs. Nevertheless, over a whole education and career the best outcomes are likely to be derived from a balanced and plural approach to disciplinary learning. We

31
do not advocate – and nor does the international
experience favour – students studying narrowly
specialised programs that wholly exclude non-
STEM disciplines such as the humanities.
For example, rather than STEM-focused final year
secondary school students limiting their program
to science, mathematics and compulsory
English, given the point about the value of
breadth and balance, it might be better if those
STEM-intensive students did one less STEM-
related subject and an additional subject in the
humanities and social sciences such as a foreign
language or history. In other words, one way to
go might be for most students to do somewhat
more STEM than before, and a minority of
students to do a little less STEM than before (for
more discussion of the different curriculum and
tracking options see Section 5).
Methodology
Country, regional and special interest reports
Country and regional reports
The project commissioned consultants to provide
STEM: Country / Regional Reports including, but
not limited to the following:
• Attitudes towards STEM, and the priority
given to STEM, in families, the community/
media, government, educational institutions,
employers and professional bodies.
• The perceived relevance of STEM to
economic growth and well-being.
• Current patterns of STEM provision in
schooling, including STEM in primary
education, and its influence on later
participation in STEM; enrolments in
STEM disciplines in secondary education;
STEM provision, and participation, in
tertiary (university and non university)
education; and trends since 2005 in those
secondary and tertiary enrolments.
• The role of STEM disciplines in both general
education and vocational and occupationally-
specific programs in education and training.
• Student uptake of STEM programs
and factors affecting student
performance and motivation.
• Access of STEM graduates to the labour
markets, and labour market take-
up of STEM knowledge and skills.
• Strategies, policies and programs
used to enhance STEM at all levels of
education, and judgment concerning
the success of those programs.
Special interest reports
The project also commissioned special interest
reports in relation to key issues including
indigenous students and STEM in Canada and
the United States, the policies and data of
international agencies in relation to STEM and
STEM-related performance in education, STEM
and student identity, and STEM-related graduates
in the Australian labour market.
The full list of country, regional and special
interest reports is set out in Table 1.
National Workshop, 21 February 2013
The STEM: Country Comparisons National
Workshop was held on 21 February 2013, at the
Australian National University in Canberra. The
National Workshop focused on international
STEM provision and take-up, strategies for
enhancing STEM, and the implications for
Australia. Attendees included Expert Working
Group members and 45 people from a diverse
range of organisations, including ACOLA and the
Office of the Chief Scientist, CSIRO, Questacon,
the ACER, the Australian Research Council
(ARC), the Australian Bureau of Statistics (ABS),
the Australian National Centre for the Public
Awareness of Science, the Australian Government
(DEEWR, DIICCSRTE, Australian Workforce and
Productivity Agency) and State and Territory
government (Tasmania, ACT, South Australia
departments and Skills Tasmania). The National
Workshop was also attended by people from
the university sector (including a number
of individual universities and the Regional
Universities Network) and associations (Australian
Secondary Principals Association, Science and
Technology Australia, Australian Association

32
Table 1: Country, regional and special interest reports on STEM commissioned for this project
Report Authors Title
China Yuan Gao, University of Melbourne Report on China’s STEM System
Taiwan Yuan Gao, University of Melbourne Report on Taiwan: STEM (Science, Technology, Engineering and Mathematics)
Japan Mayumi Ishikawa, Shota Fujii, Ashlyn Moehle, Osaka University STEM Country Comparisons: Japan
Singapore
Noraini Idris, Mohd Fadhil Daud, Chew Cheng Meng, Leong Kwan Eu, Ahmad Dzohir Ariffin @ Maarof, University of Malaya
Country Report Singapore STEM
Korea Jae-Eun Jon, Korea University and Hae-In Chung, University of Minnesota STEM Report – Republic of Korea
United States Adam Maltese, Indiana University; Florin Lung and Geoff Potvin, Clemson University; Craig Hochbein, University of Louisville
STEM Education in the United States
Canada Julian Weinrib and Glen Jones, University of Toronto
Canada’s Approach to Science, Technology, Engineering and Mathematics (STEM): Context, Policy, Strategy and Programs
Western Europe Regional Report (including Belgium, Denmark, Germany, the Netherlands, Norway, Sweden, Switzerland)
Ian Dobson, University of Ballarat … a critical examination of existing solutions to the STEM skills shortage in comparable [European] countries
Finland Ian Dobson, University of Ballarat
… a critical examination of existing solutions to the STEM skills shortage in comparable [European] countries: Finland Country Report
France Elodie de Oliveira, OECD and Kelly Roberts, University of Melbourne
Literature Review: STEM Education in France
United Kingdom Anthony Tomei, Emily Dawson and Justin Dillon, King’s College London
A study of Science, Technology, Engineering and Mathematics education in the United Kingdom
New Zealand Cathy Buntting and Alister Jones, University of Waikato; Liz McKinley and Mark Gan, University of Auckland
STEM initiatives and issues in New Zealand
RussiaAnna Smolentseva, National Research University – Higher School of Economics, Moscow
Science, Technology, Engineering and Mathematics: Issues of Educational Policy in Russia
Brazil Hugo Horta, Technical University of Lisbon Education in Brazil: Access, quality and STEM
Portugal Hugo Horta, Technical University of Lisbon STEM education in Portugal: Education, policies and labor market
Argentina Cynthia Fernandez Roich, University of Melbourne
Study of Science, Technology, Engineering and Mathematics (STEM) and STEM-related issues in Argentina
Israel Gili Drori and Avida Netivi, The Hebrew University of Jerusalem
STEM in Israel: The Educational Foundation of ‘Start-Up Nation’
United States Indigenous
Sharon S. Nelson-BarberPacific Resources for Education and Learning (PREL)
US Indigenous STEM Report

33
Report Authors Title
Canada Indigenous Glen Aikenhead, University of Saskatchewan
Science, Technology, Engineering and Mathematics Education and Related Employment for Indigenous Students and Citizens of Saskatchewan
South Africa Michael Kahn, Stellenbosch University Science, Technology, Engineering and Mathematics (STEM) in South Africa
Australian Labour Market
Josh Healy, Kostas Mavromaras, Rong Zhu, Flinders University The STEM Labour Market in Australia
Literature Review: Student Identity Marilyn Cole, Deakin University
Literature review update: Student identity in relation to Science, Technology, Engineering and Mathematics subject choices and career aspirations
International Agencies Kelly Roberts, University of MelbourneLiterature Review – A selection of the work of international organizations on STEM education and STEM-related issues
Australia Brigid Freeman, University of MelbourneScience, Technology, Engineering and Mathematics (STEM) in Australia: Practice, policy and programs
of Mathematics Teachers, Australian Science
Teachers Association, Australasian Science
Education Research Association).
Key themes emerging from the National
Workshop included international comparisons
and Australia’s performance in that context,
the large proportion of mathematics teachers
teaching out-of-field (one class in every three),
the ‘long tail’ of STEM underperformance,
the need to support ‘STEM for all’ as generic
preparation whilst also supporting the ‘STEM
elite’, the question of compulsory mathematics
or science participation, the foundational
role of mathematics to everyday life, career
structures/ladders and professional development
requirements and opportunities for Australia’s
mathematics and science teachers, indigenous
participation in STEM, and the need for more
information about STEM labour market needs.
This ReportThis report provides an outline of STEM provision
and participation in Australia (Section 2) that
serves as the base of comparison with other
country systems. Section 2 also draws attention
to existing issues and problems in Australia’s
STEM effort. Section 3 provides a general
introduction to the international comparisons
used in this report, reflecting on the broad
differences between the systems discussed in
the report, which are grouped into four main
regional sets: the English-speaking countries,
Western Europe, East Asia and Singapore, and
emerging and developing countries. Section 3
also reflects on the relevance of international
comparisons to Australia, and on the potential
for and limits of policy borrowing and policy
transfer across borders. Section 4 then looks at
STEM policy issues from the point of view of
international agencies such as the OECD and
the World Bank, and uses data from the PISA and
TIMSS to compare Australian participation in, and
performance in relation to, the STEM disciplines,
with those of other countries. Australian students
display a strong performance overall but we are
not improving rapidly as are some other nations
and there is some faltering in mathematics.
The report then moves into substantive
discussion of relevant issues in Australia
through the lens of international comparison.
Each succeeding section of the report focuses
on a particular aspect of STEM provision and
participation, reflecting on the contents of the
reports from the consultants, and then discusses
possible changes in Australian policies, strategies
and professional practices. Section 5 looks at
the overall structuring of the STEM disciplines
within education and the economy. It considers
difficult and ambiguous issues such as the extent
to which STEM functions as general education
34
and as vocationally-targeted education; the
relationship between broadening the take-up
of STEM and strengthening the nation’s high-
end STEM performance; whether STEM-specific
tracks should be developed in academic and/or
vocational secondary education; the desirability
or otherwise of compulsory STEM subjects in
senior secondary education; the use of STEM
prerequisites at the gateway to university; and
the potential for engineering to function as a
generic vocational degree. Section 6 looks at
public, government, family and student attitudes
to STEM and strategies for building awareness
of STEM learning and STEM careers. Many
governments around the world are pursuing
such strategies at present. Section 7 looks at
the approach taken by governments in framing
overall policy on STEM. Australia does not have a
STEM policy framework and the report considers
possible forms of such a policy framework, and
the potential benefits, limits and obstacles.
Section 8 (Curriculum and pedagogy) and
Section 9 (Teachers and teaching) look at
possible changes in teaching and learning in
Australia, designed to enhance participation and
performance in relation to STEM, in the light of
the many recent initiatives taken around the
world. These sections discuss the use in school
programs of greater emphases on creativity,
problem solving, inquiry-focused methods and
critical thinking; possible career pathways and
special salary arrangements for teachers of
science and mathematics; the enhancement of
discipline-specific professional development;
and what to do about the very high incidence
of teachers in STEM classrooms in Australia who
are teaching outside the field in which they were
trained. Few other countries have this problem.
Section 10 discusses the strategies used in
other countries to build high-end research
performance and doctoral student numbers in
the STEM disciplines. It notes that the policies
on building ‘World-Class Universities’ that are
now widespread in East Asia and in Western
Europe have no counterpart in Australia. Section
11 looks at the findings of the consultants’
reports, and the commissioned report on
Australia, in relation to STEM disciplines in the
graduate labour markets. It notes that with
a small number of exceptions, the country
reports suggest that there is insufficient
research on the labour market take-up of STEM

35
qualifications, knowledge and skills; and in many
policy jurisdictions there is ambiguity about
the economic role of STEM. While it is widely
assumed that the STEM disciplines directly create
economic value through the labour process,
and the value equation is most effective when
the mix of specific vocational skills in STEM is
matched closely with employer requirements,
in fact many STEM graduates use their STEM
education and training as general rather than
specific preparation for work. There is evidence
of recurring shortages of STEM-qualified labour
in engineering but on the whole labour market
data do not strongly support a demand-driven
argument for growing participation in specific
STEM disciplines. However, this does not obviate
the potential benefits, at work and in society, of
more widely distributed STEM knowledge and
skills, and of better high-end preparation in STEM.
Section 12 considers the under-representation
of girls and women in certain STEM-related fields
of study and work, especially engineering and
computing, and what might be done to better
utilise the potential of girls and women. Female
under-representation is a world-wide problem
but there is significant statistical variation
between country systems, and some have been
more successful than others in improving gender
balance. The section discusses possible policies
and strategies, in the light of international
experience. Section 13 considers STEM and
indigenous students in Australia, in the light of
both the disappointing national performance,
and the experiences of indigenous students in
Canada (more advanced in its approach than
Australia), the United States and New Zealand.
Section 14 provides an account of various
approaches around the world to partnerships
between educational institutions, business and
industry designed to enhance STEM provision
and participation, and to other forms of
community outreach in relation to STEM.
The final Section 15 considers the potential in
Australia for upgraded national coordination in
relation to STEM, and the kinds of activities that
a national body or structure might pursue. Most
of the countries considered in this study have
more extensive coordination arrangements than
currently apply in Australia.

36
STEM in Australia
Australian Government focus on school education, and science and innovation School education, and science and innovation are national priorities
for the Australian Government. The National Plan for School
Improvement (Australian Government, 2012) pledges access to a
high-quality, high-equity education for every Australian school
student, regardless of where they live, where they attend school
or their personal circumstances. Transforming Australia’s Higher
Education System (Australian Government, 2009), the government’s
response to the Bradley review of Australia’s higher education
system (Review of Australian Higher Education: Final Report, Bradley
et al, 2008), commits to higher education expansion as a driver
for Australia’s knowledge-based economy. Powering Ideas An
Innovation Agenda for the 21st Century (Australian Government,
2009), the government’s response to the Cutler review of Australia’s
science and innovation sector (Venturous Australia building strength
in innovation, Cutler & Company, 2008), undertakes to enhance
science and innovation, including research and development.

37
Key structural elements of the education, and
science and innovation agendas at the federal
level include the Prime Minister’s Science,
Engineering and Innovation Council (PMSEIC),
the Office of the Chief Scientist, the Department
of Education, Employment and Workplace
Relations (DEEWR) and the Department of
Industry, Innovation, Climate Change, Science,
Research and Tertiary Education (DIICCSRTE). In
releasing the Health of Australian Science (Office
of the Chief Scientist, 2012a), the Chief Scientist,
Professor Ian Chubb placed STEM firmly on
the national agenda. The Office of the Chief
Scientist has recently established the position of
National Mathematics and Science Education and
Industry Adviser (February 2013). The Adviser will
champion the role of mathematics, science and
statistics across education and industry, and work
with these sectors to develop and provide policy
advice to government through the Chief Scientist.
Australia’s school education system In 2010 there were 9,468 schools in Australia,
including 6,357 primary schools, 1,409 secondary
schools, 1,286 combined primary and secondary
schools and 416 special schools for students with
disability. Most government and Catholic schools
were primary schools (72 per cent), whereas most
independent schools were combined primary and
secondary schools (63 per cent) (Gonski et al, 2011).
Australia’s schools enrolled 3.5 million full-
time equivalent students. The majority of
school students (66 per cent) were enrolled in
government schools, with the remainder enrolled
in Catholic systemic and non-systemic schools (20
per cent), and independent schools (14 per cent).
The number of school students has grown over
the last decade, with greater growth recorded in
independent schools (14 per cent) than Catholic
schools (6 per cent) or government schools (2 per
cent) (ABS, 2011, cited in Gonski et al, 2011).
Table 2: Schooling in Australia, 2010
Schools
Total number of schools 9,468
Primary schools 6,357
Secondary schools 1,409
Combined schools 1,286
Special schools (for students with disability) 416
Schools by sector
Total number of schools Government
6,743Catholic
1,708Independent
1,017
Primary schools 4,879 72% 1,230 72% 248 24%
Secondary schools 1,034 15% 303 18% 72 7%
Combined schools 498 7% 148 9% 640 63%
Special schools 332 5% 27 2% 57 6%
Students
Total number of full-time equivalent students 3.5 million
Number and percentage attending government schools 2.3 million 66%
Number and percentage attending Catholic schools 713,289 20%
Number and percentage attending independent schools 491,233 14%
Source: Reproduced from ABS 2011, Schools, Australia 2010, cat. No. 4221.0, cited in Gonski et al., 2012, Review of Funding for Schooling – Final Report, p. 4.

38
Under the Australian Constitution, States and
Territories have responsibility for education,
although all levels of government fund school
and tertiary education. The OECD estimates
that Australia’s 2009 government expenditure
on school and non-tertiary post-school level
education (3.8 per cent of GDP) was the same
as the OECD country average. Total spending on
school and non-tertiary post-school education
was 4.2 per cent of GDP compared to the OECD
country average of 4.0 per cent, reflecting what
is by international standards a relatively high
private investment in Australia’s relatively large
private school sectors.
Australian CurriculumThe Australian Curriculum, led by the Australian
Curriculum, Assessment and Reporting Authority
(ACARA) is progressively being developed and
introduced from foundation (kindergarten) to
senior secondary level in all States and Territories,
across all school systems. The Australian
Curriculum defines learning areas, specifies
general capabilities and establishes cross-
curriculum priorities. The Foundation to Year 10
(F-10) Australian Curriculum includes the learning
areas of Mathematics and Science, general
capabilities in Numeracy and Information and
Communication Technology, and cross-cultural
priorities (Indigenous histories and cultures,
Asia and Australia’s engagement with Asia, and
Sustainability). Sustainability will encompass
the organising ideas of Systems, World View and
Futures, and be embedded in the various learning
areas. F-10 Australian Curriculum has been
published, and States and Territories have agreed
to the phased introduction of this curriculum
over the next few years.
The Senior Secondary Australian Curriculum
includes the learning areas of Mathematics
(Essential Mathematics, General Mathematics,
Mathematical Methods, Specialist Mathematics)
and Science (Biology, Chemistry, Physics, and
Earth and Environmental science). The Senior
Secondary Australian Curriculum for Mathematics
and Science has been published, and negotiations
with the States and Territories are progressing to
determine the extent to which the curriculum
will be implemented. States and Territories are
responsible for determining senior secondary
certification requirements, which mandate which
curriculum elements are required for certification
purposes. The Australian Curriculum: Technologies
is under development. The Australian Curriculum
Implementation Survey (ACARA 2012) reports on
the state and territory implementation plans to
introduce the F-10 Australian Curriculum, noting
the phase-in period 2011-2014.
Overall educational achievement The upper secondary graduation rate for
Australians under the age of 25 is higher than
the OECD average in general programs (70 per
cent versus 49 per cent) and lower than the
OECD average in pre-vocational and vocational
programs (23 per cent versus 35 per cent). These
graduation rates should be interpreted carefully
as they represent the estimated percentage of
people from a certain age cohort that is expected
to graduate at some point during their lifetimes,
and the estimate is sensitive to changes in the
duration of the programs; and they include
international students, which artificially boosts
the apparent graduation rate.
The Standing Council on Tertiary Education Skills &
Employment reported in the National Foundation
Skills Strategy for Adults (SCOTESE, 2012) that ‘44 per
cent of Australia’s working age population (around
6 million people) have literacy levels below … the
level needed to meet the complex demands of
work and life in modern economies. This equates to
40 per cent of employed Australians, 60 per cent of
unemployed Australians and 70 per cent of those
outside the labour force. … (which) lend(s) weight
to concerns about our ability to meet projected
skills demands in coming years’ (ibid., p.2). These
findings raise questions about the scientific literacy
of a large part of the Australian population.
The educational attainment of 25-64 year old
Australians in 2010 is presented in Table 3. Up to
73 per cent of the Australian population aged 25-
64 years had completed at least upper secondary
level education or more. This figure is up to 85

39
per cent among those aged 25-34 years, above
the OECD average of 82 per cent for this group.
As many as 27 per cent of Australians aged 25-64
years have attained tertiary type A (bachelor or
other undergraduate level program) and advanced
research programs, clearly above the OECD
average of 22 per cent. Among Australians aged
25-34 years, 34 per cent had attained the levels of
bachelor or advanced research programs in 2010.
School student performance
Literacy and numeracy
The Review of Funding for Schooling found with
respect to educational attainment generally that:
… on average, students from low
socioeconomic backgrounds, Indigenous
students, students with disability, students from
remote and very remote areas, and to variable
degrees LBOTE students: are more likely to
be considered developmentally vulnerable
at school entry, have lower performance on
assessments throughout schooling, with
the gap getting larger in the later years of
schooling, have lower Year 12 and equivalent
attainment rates (Gonski et al, 2011, p.28).
In terms of literacy and numeracy specifically,
the 2012 National Assessment Program – Literacy
and Numeracy (NAPLAN) results (ACARA, 2012)
reveal persistent differences in students’ literacy
and numeracy achievement between States and
Territories and significant underperformance
in some jurisdictions relative to the national
average, particularly in the Northern Territory.
The results also reveal lower mean literacy and
numeracy scale scores for indigenous students
(particularly remote and very remote indigenous
students) and students based in remote and very
remote locations.
These findings are confirmed in other research.
The Australian National Audit Office reported in
the review of the National Partnership Agreement
on Literacy and Numeracy (Gonski et al, 2011, p.28)
that a large percentage of indigenous students
are at or below the national minimum standards
for reading and numeracy achievement. In 2011,
the percentage increased as students progressed
through years 3-9, with 60.9 per cent of year 9
Indigenous students in 2011 at or below the
national minimum standard for reading and
numeracy achievement, compared to 22.2 per
cent of non-Indigenous year 9 students.
Mathematics and science
Results emerging from international assessment
programs, including the TIMSS and PISA suggest
that Australia’s school student science and
mathematics performance is declining in some
instances, and remaining static in others. For
more discussion of Australia’s performance in
comparative context see Section 4. (These results
will be discussed only briefly here).
In science, Australia’s performance appears to
have held steady. However, the 2009 PISA results
reveal a decline over time in mathematical
literacy and are of particular concern. Thomson
et al. suggest that ‘the average mathematical
literacy performance of Australia declined
significantly (by 10 score points) between
PISA 2003 and PISA 2009, while there was no
significant change in the OECD average over this
time’ (2010, p.vii).
In terms of variations in performance in PISA,
there is significant disparity between the States
and Territories. With respect to mathematics
literacy achievement, students in Western
Australia and the Australian Capital Territory
consistently achieve the highest raw mean
scores, and students in Tasmania and the
Northern Territory consistently record the
Table 3: Educational attainment of Australians aged 25-64 years in 2010
At least upper secondary Tertiary type a and advanced research programs
Australia 73% 27%
OECD Average 74% 22%
Source: OECD 2012, Education at a Glance 2012: OECD Indicators, OECD Publishing, Paris.

40
lowest raw mean scores. Males on average
scored significantly higher than females, and
non-indigenous students on average scored
significantly higher than indigenous students,
by 76 points, or equivalent to almost two
years of schooling (ibid, p.viii). Students from
independent schools achieved significantly
higher average raw scores than students from
Catholic and government schools, and students
in Catholic schools significantly outperformed
those in the government schools. However, once
differences in students’ SES backgrounds were
taken into account, there were no statistically
significant differences in the average score
by school sector. Students from metropolitan
schools significantly outperformed students
from provincial and remote schools, and
students from high SES backgrounds on
average significantly outperformed students
from low SES backgrounds. In many instances
these disparities were large: ‘the performance
gap between students of the same age from
different backgrounds can be equivalent to up
to three years of schooling. This gap places an
unacceptable proportion of 15-year-old students
at risk of not achieving significant levels sufficient
for them to effectively participate in the 21st
century workforce and to contribute to Australia
as productive citizens’ (ibid, p.xiv). In reflecting on
these performance gaps, the Review of Funding for
Schooling stated that:
The absolute decline in performance as
measured by PISA in reading and mathematical
literacy is evident at all levels of achievement.
Australia’s weak performance in reading and
mathematics compared to Canada (a similar
country) and Singapore (our nearest Asian
neighbour participating in PISA) illustrates
a serious cause for concern and suggests
significant educational reform is needed to
address the competitive disadvantage our
children face (Gonski et al, 2011, p.211).
School student participation in mathematics and science In 2009, 52 per cent of the total cohort of all year
12 students were enrolled in science subjects
(Goodrum et al, 2012), including biology (49,681
or 24.1 per cent of the total year 12 cohort),
chemistry (35,867 or 17.4 per cent) and physics
(29,532 or 14.3 per cent) (noting that a small
number of students enrol in more than one
science course). Geology and earth science
enrolled the lowest proportion of year 12
students (2,201 or 1.1 per cent; these disciplines
are not offered in many schools). In comparison,
148,097 (72 per cent of the total cohort) of all
year 12 students were enrolled in mathematics
(National School Statistics Collection, ABS cited
in Office of the Chief Scientist, 2012a, p.24). The
majority of these enrolments were in elementary
mathematics, compared with advanced
mathematics (10.1 per cent) and intermediate
mathematics (19.6 per cent) (Barrington, 2011).
Participation in senior secondary science and
mathematics has been declining for decades. For
example, the period 1992 – 2010 saw a decline
in year 12 school science and mathematics
participation rates, including a marginal decline in
mathematics (from 76.6 per cent to 71.6 per cent),
Table 4: Student enrolments in year 12 science subjects, Australia 2009
Subject Students enrolled (Number) Proportion of cohort
Mathematics 148,097 71.7%
Biology 49,681 24.1%
Chemistry 35,867 17.4%
Physics 29,532 14.3%
Geology and Earth science 2,201 1.1%
Other science 16,655 8.1%
Source: Reproduced from Office of the Chief Scientist 2012a, Health of Australian Science, Australian Government, p. 24.

41
a larger proportional decline in both biology
(from 35.3 per cent to 24.0 per cent) and physics
(from 20.8 per cent to 14.2 per cent), and decline
also in chemistry (from 22.9 per cent to 17.2 per
cent) (Office of the Chief Scientist 2012a, p.43).
This decline has been attributed to the increased
range of year 12 course offerings (Lyons & Quinn,
2010) and a decline in the ‘perceived utility value’
of physics and chemistry, in particular (Office of
the Chief Scientist 2012a, p.53).
It is important to note that while the proportions
of the year 12 cohort enrolled in these science
subjects has declined significantly, trends in the
absolute number of enrolled students in the
STEM disciplines are less clear-cut. Between the
mid 1970s and 2010 the absolute number of
students rose, peaking in the early 1990s and
has declined since, in part because of relaxed
university prerequisite requirements. The
absolute number of STEM students at year 12
is currently at a level similar to the mid 1970s.
Regardless of these fluctuations in absolute
numbers, it appears that Australia has been
unsuccessful in developing a momentum for
‘science and maths for all’ in year 12. Though
the proportion of the age cohort finishing year
12 has increased substantially, it is likely that
those students who in former years would not
have completed school have enrolled in year 12
science subjects and advanced mathematics at a
more modest rate than other students.
In relation to mathematics, the National
Committee for the Mathematical Sciences
reported that the spread of achievement in
years leading up to year 12 is wide and growing,
with ‘extensive underachievement and small
numbers reaching advanced levels’ (National
Committee for the Mathematical Sciences
2006, cited in Broadbridge & Henderson, 2008,
p.17). This reduces the number of students
eligible to progress to advanced school-level
mathematics. In terms of year 12 mathematics,
for the period 1995-2010, participation in
elementary mathematics increased (from 37
per cent to 50 per cent), while participation in
both intermediate and advanced mathematics
decreased (from 27.2 to 19.6 per cent, and
14.to 10.1 per cent, respectively) (AMSI, 2012a).
Intermediate and advanced mathematics
(calculus-based subjects) are prerequisites for
many university STEM-discipline courses, so
decreased participation in these subjects in year
12 has significant implications for the pipeline to
university STEM-disciplines.
In NSW, Mack and Walsh (2013) identify a decline
in the proportion of students undertaking at least
one mathematics and one science subject in the
HSC. In 2001 some 19.7 per cent of boys and 16.8
per cent of girls from the corresponding year 8
cohort went on to study a mathematics/science
combination in the HSC. However, in 2011 only 18.6
per cent of boys and 13.8 per cent of girls went
Figure 1: Year 12 science participation as a percentage of the year 12 cohort in Australian schools, 1976 to 2007
76 77 78 79 80 81 82 83 84 85 86 87 88 89 90 91 92 93 94 95 96 97 98 99 00 01 02 03 04 05 06 07
60
50
40
30
20
10
0
Perce
ntag
e
Biology Chemistry Physics Other Sciences
Source: Ainley, J, Kos, J & Nicholas, M 2008, Participation in science, mathematics and technology in Australian education, Research Monograph no. 63, ACER, Melbourne.
GeologyPsychology

42
on to study mathematics/science in the HSC’ (ibid,
p.1). It should be noted the cohort size increased
in this period. Furthermore, the report notes
the high proportions of high achieving (ATAR-
eligible) students who do not participate in any
mathematics programs in year 12, particularly girls.
Broadbridge and Henderson note that in entry
to higher education, within the context of
increasing competition for discerning high
achieving students, there have been ‘many
cases (of ) the lowering of entry prerequisites for
courses’ (2008, p.11). With respect to engineering
programs in particular, Broadbridge and
Henderson found that ‘many respondents …
attributed the decline in mathematical ability
to a lowering of entry standards to engineering
degree programs; the majority of universities
have removed the higher level secondary school
mathematics prerequisite’ (ibid, p.14).
Tertiary participation in the STEM disciplines It is not always recognised that in tertiary
education, students enrol in STEM disciplines in
both Vocational Education and Training (VET ),
and higher education. In 2010, the VET sector
catered for 1,799,000 students (655,800 effective
full time [EFT ] students). Of that group 70.8 per
cent were enrolled in TAFE Institutes, 8.2 per cent
were in dual-sector universities, 0.3 per cent were
in public universities and other training providers
housed 20.7 per cent. The higher education
sector catered for 1,192,700 students (861,500
EFT ), enrolled in public universities (83.2 per
cent), dual-sector universities (10.1 per cent),
TAFE institutes (0.3 per cent), and other training
providers (6.4 per cent).
In 2010, the VET sector enrolled students in
programs spanning Australian Qualification
Framework (AQF) levels 1-8, meaning from
Certificate 1 to Graduate Certificate or Graduate
Diploma, and also some students in non-AQF
Table 5: Tertiary education provider type profile, 2010
Provider typeVET Higher education Total
(’000) per cent (’000) per cent (’000) per cent
Equivalent full-time students
Dual-sector universities 53.8 8.2% 87.0 10.1% 140.8 9.3%
TAFE institutes 464.5 70.8% 2.5 0.3% 467.0 30.8%
Public universities 2.0 0.3% 716.5 83.2% 718.5 47.4%
Other providers 135.5 20.7% 55.5 6.4% 191.0 12.6%
Total 655.8 100.0% 861.5 100.0% 1 517.3 100.0%
Students
Dual-sector universities 104.4 5.8% 118.6 9.9%
Not provided
TAFE institutes 1 182.9 65.8% 3.5 0.3%
Public universities 4.5 0.2% 992.3 83.2%
Other providers 491.2 27.3% 78.3 6.6%
Students attending various providers 16.0 0.9% - -
Total 1 799.0 100.0% 1 192.7 100.0%
A dash (-) represents a true zero figure, with no data reported in this category.
Sources: Data on vocational education and training were derived from the National VET Provider Collection. Data on higher education were derived from the Higher Education Statistics Collection.
Source: NCVER 2012, Tertiary education and training in Australia 2010, Department of Industry, Innovation, Science, Research and Tertiary Education, viewed 19 March 2013, http://www.ncver.edu.au/publications/2489.html.

43
programs. The higher education sector enrolled
students in programs spanning AQF levels 5–10,
that is, from Diploma to Doctoral degree. In
terms of AQF programs, the largest group of VET
students were enrolled in Certificate Level III
programs (34.3 per cent), whereas the majority
of higher education students were enrolled in
Bachelor degree Pass and Honours programs
(73.6 per cent).
Table 6: Equivalent full-time domestic and international students by sector of education and selected course characteristics, 2010
Vet Higher education Total(’000) per cent (’000) per cent (’000) per cent
Qualification levelAQF qualificationsDoctoral degree - - 35.2 4.1% 35.2 2.3%Master’s degree - - 109.6 12.7% 109.6 7.2%Graduate certificate or graduate diploma 0.4 0.1% 34.7 4.0% 35.2 2.3%Bachelor degree (Pass and Honours) 1.2 0.2% 634.2 73.6% 635.4 41.9%Advanced diploma 27.0 4.1% 3.7 0.4% 30.7 2.0%Associate degree 0.1 0.0% 6.6 0.8% 6.7 0.4%Diploma 113.2 17.3% 17.3 2.0% 130.6 8.6%Certificate IV 114.8 17.5% - - 114.8 7.6%Certificate III 225.2 34.3% - - 225.2 14.8%Certificate I or II 116.1 17.7% - - 116.1 7.6%AQF sub-total 598.1 91.2% 841.3 97.7% 1,439.4 94.9%Non-AQF qualificationsOther recognised courses 42.6 6.5% 10.2 1.2% 52.8 3.5%Non-award courses 8.4 1.3% 8.4 1.0% 16.9 1.1%Subject only – no qualification 6.7 1.0% - - 6.7 0.4%Cross-provider programs - - 1.5 0.2% 1.5 0.1%Non-AQF sub-total 57.7 8.8% 20.2 2.3% 77.9 5.1%Field of educationNatural and physical sciences 4.6 0.7% 62.4 7.2% 67.0 4.4%Information technology 17.4 2.7% 33.9 3.9% 51.3 3.4%Engineering and related technologies 110.6 16.9% 65.6 7.6% 176.2 11.6%Architecture and building 47.4 7.2% 21.4 2.5% 68.8 4.5%Agriculture, environmental and related studies 31.2 4.8% 12.5 1.5% 43.8 2.9%Health 31.2 4.8% 126.8 14.7% 158.0 10.4%Education 15.5 2.4% 74.6 8.7% 90.1 5.9%Management and commerce 133.9 20.4% 228.6 26.5% 362.5 23.9%Society and culture 103.0 15.7% 160.3 18.6% 263.3 17.4%Creative arts 32.6 5.0% 61.9 7.2% 94.5 6.2%Food, hospitality and personal services 49.5 7.5% 0.8 0.1% 50.2 3.3%Mixed field programs 72.4 11.0% 4.1 0.5% 76.5 5.0%Not applicable 6.7 1.0% 8.4 1.0% 15.1 1.0%Total 655.8 100.0% 861.5 100.0% 1,517.3 100.0%International statusInternational* 38.3 5.8% 252.6 29.3% 290.9 19.2%Domestic 617.5 94.2% 608.9 70.7% 1,226.4 80.8%
*NCVER 2012 defines ‘International students’ are ‘those with a temporary entry permit or student visa or those who reside outside Australia during the unit of study. The number of international students is derived for the VET sector, based on students with at least one unit with an international full-fee-paying funding source’ (p. 28).
A dash (-) represents a true zero figure, with no data reported in this category.
Sources: Data on vocational education and training were derived from the National VET Provider Collection. Data on higher education were derived from the Higher Education Statistics Collection.
Source: NCVER 2012, Tertiary education and training in Australia 2010, Department of Industry, Innovation, Science, Research and Tertiary Education, viewed 19 March 2013, http://www.ncver.edu.au/publications/2489.html.

44
In terms of the field of education, 195,000
effective full-time VET students were enrolled in
STEM disciplines (natural and physical sciences,
information technology, engineering and related
technologies, agriculture environmental and
related studies), representing 29.9 per cent
of all VET EFT enrolments. Over half of these
enrolments were in the engineering and related
Table 7: Equivalent full-time domestic and international students by sector of education and selected course characteristics for all students, males, females, aged 24 years and under, 2010
All students Males Females Aged 24 years and under
VET Higher education VET Higher
education VET Higher education VET Higher
educationQualification levelAQF qualificationsDoctoral degree - 4.1% - 4.6% - 3.7% - 0.8%Master’s degree - 12.7% - 13.7% - 12.0% - 7.0%Graduate certificate or graduate diploma 0.1% 4.0% 0.1% 3.6% 0.1% 4.4% 0.0% 1.6%
Bachelor degree (Pass and Honours) 0.2% 73.6% 0.1% 71.9% 0.2% 75.0% 0.2% 84.6%
Advanced diploma 4.1% 0.4% 4.5% 0.5% 3.8% 0.4% 4.5% 0.5%Associate degree 0.0% 0.8% 0.0% 1.1% 0.0% 0.5% 0.0% 0.7%Diploma 17.3% 2.0% 13.1% 2.4% 21.6% 1.7% 14.8% 2.5%Certificate IV 17.5% - 15.8% - 19.2% - 12.9% -Certificate III 34.3% - 38.6% - 30.0% - 38.9% -Certificate I or II 17.7% - 18.7% - 16.7% - 21.0% -AQF sub-total 91.2% 97.7% 90.9% 97.7% 91.5% 97.6% 92.4% 97.6%Non-AQF qualificationsOther recognised courses 6.5% 1.2% 6.8% 1.1% 6.2% 1.3% 5.7% 1.1%Non-award courses 1.3% 1.0% 1.4% 1.0% 1.1% 1.0% 1.6% 1.1%Subject only – no qualification 1.0% - 0.8% - 1.2% - 0.3% -
Cross-provider programs - 0.2% - 0.2% - 0.2% - 0.2%Non-AQF sub-total 8.8% 2.3% 9.1% 2.3% 8.5% 2.4% 7.6% 2.4%Field of educationNatural and physical sciences 0.7% 7.2% 0.5% 7.7% 0.9% 6.9% 0.7% 7.8%
Information technology 2.7% 3.9% 4.3% 7.2% 1.0% 1.3% 3.3% 3.9%Engineering and related technologies 16.9% 7.6% 30.5% 14.3% 2.8% 2.3% 19.0% 8.4%
Architecture and building 7.2% 2.5% 13.1% 3.3% 1.2% 1.8% 10.1% 2.7%Agriculture, environmental and related studies 4.8% 1.5% 6.8% 1.6% 2.6% 1.4% 4.0% 1.3%
Health 4.8% 14.7% 2.2% 9.3% 7.4% 19.1% 3.6% 13.5%Education 2.4% 8.7% 1.8% 4.8% 2.9% 11.8% 0.6% 7.3%Management and commerce 20.4% 26.5% 13.8% 29.3% 27.2% 24.3% 19.9% 28.3%
Society and culture 15.7% 18.6% 7.8% 15.0% 23.8% 21.5% 12.0% 17.2%Creative arts 5.0% 7.2% 4.0% 6.2% 6.0% 8.0% 6.5% 8.1%Food, hospitality and personal services 7.5% 0.1% 5.0% 0.1% 10.1% 0.1% 10.1% 0.1%
Mixed field programs 11.0% 0.5% 9.2% 0.4% 13.0% 0.5% 9.9% 0.4%Not applicable 1.0% 1.0% 0.8% 1.0% 1.2% 1.0% 0.3% 1.1%Total (per cent) 100.0% 100.0% 100.0% 100.0% 100.0% 100.0% 100.0% 100.0%Total (’000) 655.8 861.5 331.8 383.9 322.7 477.6 321.8 623.8
A dash (-) represents a true zero figure, with no data reported in this category.
Sources: Data on vocational education and training were derived from the National VET Provider Collection. Data on higher education were derived from the Higher Education Statistics Collection.
Source: NCVER 2012, Tertiary education and training in Australia 2010, Department of Industry, Innovation, Science, Research and Tertiary Education, viewed 19 March 2013, http://www.ncver.edu.au/publications/2489.html.

45
technologies field of education. 349,000 EFT
higher education students were enrolled in
STEM disciplines, representing 32.7 per cent of
all higher education enrolments. Over a third
of these enrolments were in the health field of
education. In total, 496,300 EFT VET and higher
education students were enrolled in STEM
disciplines in 2010, representing a total of 32.7
per cent of all enrolments.
In terms of international higher education
students, the Office of the Chief Scientist
reported (2012a) that: ‘The proportion of
international students varies widely across
narrower fields of education: Information
Technology and Engineering had the largest
international student components, at 68 and
43 per cent respectively; Natural and Physical
Sciences and Agriculture and Environmental
Sciences had the smallest at 22 and 20 per cent
respectively’ (p. 27).
In terms of gender representation, while more
females enrolled in VET (322,700) than males
(331,800) in 2010, many more males than females
enrolled in STEM disciplines (44,300 males versus
14,700 females). Similarly in the higher education
sector, more females were enrolled overall than
males (477,600 versus 383,900), but females
were under-represented in STEM disciplines in the
higher education sector (40,100 males versus 31,000
females). For more discussion see Section 12.
Note that the inclusion of the health field
of education, which enrols 19,100 females,
considerably decreases the gender disparity in
STEM disciplines. The greatest disparities in higher
education discipline enrolments are in information
technology (7,200 males, 1,300 females) and
engineering (14,300 males, 2,300 females).
University STEM participation over timeFor the period 2002-2010, commencing domestic
undergraduate enrolments increased overall by
23.6 per cent. However, there was much variation
by field of education. In terms of undergraduate
participation in STEM, commencing enrolments
in health increased significantly (by 73.0 per cent)
to represent 17.9 per cent of all commencing
undergraduate enrolments1. Commencing
enrolments in natural and physical sciences
remained flat for the period 2002-2007 then grew
by 29 per cent in 2008-2010, to represent 10.5 per
cent of all commencing undergraduate enrolments
in 2010 (Office of the Chief Scientist, 2012a).
Commencing enrolments in engineering
increased by 21 per cent from a low base,
1 The overall decline in STEM-discipline enrolments would be higher if nursing had not been made a university degree level program.
Figure 2: Commencing domestic bachelor’s (pass and graduate entry) enrolments: science-related fields of education
2002 2003 2004 2005 2006 2007 2008 2009 2010
40,000
30,000
20,000
10,000
0
Enro
lmen
ts (n
o.)
Source: Office of the Chief Scientist 2012a, Health of Australian Science, Australian Government, p. 71.
Health Natural and Physical Sciences
Information Technology
Agriculture, Environmental and Related Studies
Engineering and Related Technologies

46
representing growth in student numbers from
approximately 10,000 to 12,400. Engineering
represented 6.1 per cent of all commencing
undergraduate enrolments. Enrolments
in information technology decreased by
approximately 50 per cent, to represent 3 per
cent of all commencing domestic undergraduate
enrolments in 2010. Enrolments in agriculture
and environment decreased from a low base
of 4 per cent, to represent just 1.7 per cent
of all commencing domestic undergraduate
enrolments (ibid.). Commencing international
undergraduate enrolments increased more than
domestic enrolments.
Higher degrees by researchOver 2002-2010, commencing domestic higher
degree by research enrolments remained fairly
static, with some variation by field of education.
In STEM higher degrees by research, commencing
enrolments in natural and physical sciences fell
from a high of 1,700 in 2004 to recover partly
between 2008-2010, reaching 1,600 students in
2010. Commencing enrolments in health grew
by 21 per cent over 2002-2010 to reach about
1,400. Commencing enrolments in engineering
and related technologies declined for several
years then returned to the 2002 level of about
1,000. In commencing enrolments in agriculture,
environmental and related studies, numbers
Figure 3: Domestic commencing HDR enrolments: science-related
2002 2003 2004 2005 2006 2007 2008 2009 2010
1800
1600
1400
1200
1000
800
600
400
200
0
Enro
lmen
ts (n
o.)
Source: Office of the Chief Scientist 2012a, Health of Australian Science, Australian Government, p. 75.
Health Natural and Physical Sciences
Information Technology
Agriculture, Environmental and Related Studies
Engineering and Related Technologies
Figure 4: Proportion of domestic commencing undergraduate enrolments, by gender: science-related fields
2002 2003 2004 2005 2006 2007 2008 2009 2010
100
90
80
70
60
50
40
30
20
10
0
Com
men
cing
enro
lmen
ts (%
)
Source: Office of the Chief Scientist 2012a, Health of Australian Science, Australian Government, p. 72.
Male Female

47
remained steady at approximately 350; and
enrolments in information technology declined
from 370 to 230 (Dobson, 2012).
Domestic higher degree by research completions
increased for the period 2002-2010. However the
Health of Australian Science report suggests some
caution is taken in interpreting this data.
Gender balance of university enrolments In 2010, women’s share of commencing
domestic students in the science-related
disciplines was almost equal to women’s share
of all commencing enrolments: 54.0 per cent
of starting enrolments in the combined group
of agriculture and environment, engineering,
health, information technology, and natural and
physical sciences, compared to 55.6 per cent of
all commencing enrolments.
However, domestic women students’
representation in undergraduate commencing
enrolments varies considerably by field. Women
are about 80 per cent of commencers in health
and slightly more than half in agriculture and
environment, and the natural and physical
sciences. But in engineering and related
technologies (20 per cent) and information
technology (14 per cent) they are poorly
represented (Office of the Chief Scientist 2012a).
Women’s under-representation in engineering
and in information technology is longstanding
and for the most part worldwide. As noted,
Section 12 explores this issue in more detail.
In 2010, there were approximately 285,000 course
completions in all fields of education and at all
levels (undergraduate and postgraduate), for
domestic and international students together2. Of
these course completions, approximately 90,000
were in science-related fields of education,
representing 32 per cent of all completions.
The largest numbers completing were in
health (approximately 38,000), and the lowest
in agriculture and environmental sciences
(approximately 3,800). The largest number of
higher degree by research student completions
was in the natural and physical sciences (1,589).
Indicative completion rates for undergraduate
students varied, with the highest recorded in
health (73 per cent) and natural and physical
sciences (69 per cent). There were lower
indicative completion rates in engineering (58
per cent), agriculture and environment (56 per
2 Domestic students comprised 69 per cent of all completions in science-related fields of education in 2010 (Office of the Chief Scientist 2012a).
Figure 5: Number of student completions (domestic and international): science-related fields of education, by course level, 2010
Natural and Physical Sciences Information Technology Engineering Agriculture and Environment Health
45,000
40,000
35,000
30,000
25,000
20,000
15,000
10,000
5000
0
Num
ber o
f com
plet
ions
Source: Office of the Chief Scientist 2012a, Health of Australian Science, Australian Government, p. 26.
Postgraduate research 1589 262 986 370 1053
Postgraduate coursework 2535 6059 4637 1215 11,726
Undergraduate 14,344 7147 9967 2188 25,597

48
cent) and information technology (50 per cent).
Completion rates for higher degree by research
students in science-related fields of education
were generally higher than the average for
all fields, with the exception of information
technology (Office of the Chief Scientist, 2012a).
In terms of both patterns of STEM enrolments
and patterns of completions, there are continued
disparities between students from different groups,
in rates of participation and achievement. There
are disparities between States and Territories;
and between students from government,
Catholic and independent schools. Indigenous,
students with disability, students in remote and
very remote locations, and students from low
socio-economic status [SES] background are all
under-represented. Where these disadvantages
compound, particularly for indigenous students
living in remote and very remote locations, young
Australians are at much higher than average
risk of under-achievement in standardised tests
of STEM-related knowledge and skills, and of
under-enrolment in STEM disciplines in post-
compulsory education and training. As noted, girls
and women are under-represented in the STEM
fields of education of engineering and information
technology. All these disparities are longstanding.
Teacher supplyAustralia’s schools are staffed by over 300,000
teachers. The Staff in Australia’s Schools (SiAS)
survey identified a small number of unfilled
specialist area teaching positions including
science (10 positions overall), computing (110)
and technology (70), in almost all cases at a
rate of one position unfilled per school, where a
vacancy was identified. There were no reported
unfilled numeracy positions (McKenzie et al,
2011). However, there were sizable shortages
noted for Generalist Primary teacher positions
(610) (ibid, p.108). DEEWR’s Skills Shortage List
Australia 2011-12 (current as at June, 2012)
identified national skills shortages for the
education professionals classification of Early
Childhood (Pre-primary School) Teacher (DEEWR,
2012a). DEEWR also notes that ‘secondary
school teacher positions in the fields of senior
mathematics and science attract relatively few
suitable applicants’ (ibid, p.23).
There is variation at the State and Territory level:
recruitment difficulties have been recorded in
New South Wales for secondary school teachers
in some locations (DEEWR, 2012b), Queensland
for primary school teachers in regional areas
(DEEWR, 2012c), Tasmania for mathematics
and science teachers (DEEWR, 2012d) and
the Northern Territory for primary school
and secondary school in mathematics and IT,
particularly in remote locations (DEEWR, 2012e).
Schools located in regional and remote areas,
or indigenous communities, and schools with a
low socioeconomic advantage experience more
difficulty filling teaching vacancies.
Secondary school principals identified larger
numbers of unfilled teaching positions including
400 in mathematics (390 positions in mathematics;
10 in statistics), 190 in science (chemistry – 80;
physics – 50; science: general – 50 and biology
– 10) and 310 in technology (computing – 30;
information technology – 130; and wood or
metal technology – 120). In many instances
individual schools reported vacancies of more
than one unfilled teacher in the nominated
specialty, indicating that some secondary schools
in particular experience difficulty recruiting
teaching staff. In total, there were some 900
unfilled mathematics, science and technology
positions identified in 2011 (McKenzie et al, 2011).
Teacher skills shortages, particularly with respect
to secondary qualified science and mathematics
teachers, have been identified as a key element of
the ‘crisis in science education’ (Tytler, 2007).
We note that data on absolute shortages do not
tell the whole story of teaching capacity in the
STEM disciplines, and are misleading if relied on
as the sole source of information. This is because
of the widespread practice in Australia of staffing
classes in mathematics and science (especially
senior secondary physical sciences) with teachers
untrained or under-trained in the disciplines
concerned. McKenzie and colleagues note that
where there are unfilled positions, secondary
school principals report the implementation
of strategies including ‘requiring teachers to
teach outside their field of expertise’ (42.2 per

49
cent), ‘recruit(ing) retired teachers on short-
term contracts’ (25.1 per cent), and ‘recruit(ing)
teachers not fully qualified in subject areas with
acute shortages’ (23.0 per cent).
The incidence of teaching out of field for
mathematics and science in Australia, especially
in regional and rural areas, is of grave concern. We
note that there are socially regressive variations
between school systems, with more secondary
school principals from government (72.9 per
cent) than Catholic (67 per cent) or independent
schools (49.3 per cent) resorting to a range
of strategies to deal with staffing shortages
(McKenzie et al. 2011). In other words, where
there are labour market shortages in specialist
science, mathematics and technology secondary
school teaching positions, government and
Catholic schools in particular are resorting to the
use of under-qualified or unqualified replacement
staff, in terms of disciplinary qualifications.
Teaching outside field is a serious weakness
in Australian schooling. It is discussed in more
detail, in relation to mathematics, in Section 9.
The Australian Mathematical Sciences Institute
suggest with respect to issues of teacher supply,
that ‘the ageing secondary teacher population
and falling graduation rates indicate an endemic
problem’ (AMSI 2012a, p.2).
In addition, there are serious concerns with
respect to primary school teachers’ level of science
and mathematics training, and some teachers’
confidence and capacity to deliver lessons in
these areas. The Australian Mathematical Sciences
Institute has called on the government to ensure
teachers are ‘mathematically prepared’, and has
indicated that ‘a concerted and immediate effort
by governments, the teaching profession and the
universities is required to guarantee the supply
of suitably qualified mathematics teachers’ (AMSI
2012b, n.p.).
STEM and the labour markets There is discussion of labour market-related
issues in Section 11 of the report. This part of
Section 2 merely establishes basic facts about the
situation in Australia.
The Australian Workforce and Productivity Agency
Discussion Paper Future focus: Australia’s skills and
workforce development needs (AWPA, 2012) having
examined the skills and workforce development
needs arising from four proposed scenarios (long
boom, smart recovery, terms of trade shock, ring
of fire) reported that ‘skills shortages in some
areas and industries threaten wage inflation and
risk growth-constraining monetary tightening’
(ibid., p.1). Further, the report states that ‘the
demand for higher levels of skill is a reality …
(and) this can be expected to continue into
the future in response to technology-induced
change, structural adjustment, a progressive
shift to service-based industries, and Australia’s
changing demographics’ (ibid, p.1).
The primary data used in this Section are derived
from the ABS Census data, which are divided
into three ASCED codes: natural and physical
sciences (NPS), information technology (IT ) and
engineering and related technologies (ERT ). It
should be noted that the category of natural
and physical sciences is very broad, covering
the gamut of mathematics, physics, chemistry,
biochemistry and geology to laboratory
technology. The category of information
technology is relatively focused.
The Census data on employment are gathered
on the basis of the respondent’s highest
qualification. This leads to under-reporting of
STEM qualifications, in particular by school
teachers. For example, a respondent who
completed a first degree in a STEM field and
then completes a postgraduate qualification
in education will not be captured in this
employment category.
According to the Census there are 651,000 STEM-
qualified people in Australia (in 2011), including
those holding Bachelor Degree level or higher
qualifications in natural and physical sciences
(232,000; 40 per cent), information technology
(161,000; 36 per cent) and engineering related
technologies (257,000; 25 per cent). The STEM
group – here excluding health sciences – represents
approximately 20 per cent of the Australian
population with a Bachelor Degree or higher
qualification. The under-reporting mentioned above
is more likely to influence the reported figures for

50
natural and physical sciences graduates because
information technology and engineering graduates
are less likely to become school teachers.
The STEM-qualified population is more male-
dominated (72 per cent male) than the tertiary-
qualified Australian population as a whole (45 per
cent). However, secondary teaching in Australia
is female-dominated, especially in the biological
sciences. If the STEM educated but under-reported
female secondary teachers were included in the
NPS category of STEM graduates, the percentage
of male graduates would decrease. The under-
reporting of NPS graduates probably exaggerates
the extent of male domination of the STEM-
qualified population in Australia.
Employment rates are high among all STEM-
qualified people (81 per cent), and the
unemployment rate is low (less than 4 per cent).
From 2007 to 2011, the total growth across all
occupations nationally was 8.1 per cent; the top
eight STEM occupations exceeded the national
rate, growing by 11.1 per cent on average.
There are marked differences in labour market
participation patterns between males and
females, with female STEM graduates more likely
to be employed part time: 23 per cent, compared
to 10 per cent for males. Rates of return are
broadly similar to those of other graduates, and
among the STEM-qualified group are highest for
computing/information technology graduates.
There is great diversity in the occupational
destinations of STEM graduates. A significant
occupational ‘bunching’ occurs at a broad
level, with eight occupations taking 75 per
cent of employed STEM graduates (design,
engineering, science and transport professionals;
ICT professionals; specialist managers; business,
human resource and marketing professionals;
engineering, ICT and science technicians;
education professionals; office managers and
program administrators; hospitality, retail and
service managers). Between 2007 and 2011 the
strongest growth in employment among the STEM
occupations was for design, engineering, science
and transport professionals (24.7 per cent) and
for ICT professionals (13.8 per cent). In this period,
both headcount and total hours of employment
of STEM graduates grew more quickly than
the national average. Full-time average weekly
earnings remained above the national average,
but generally grew at a slower rate.
It appears that there are skills shortages for at least
some classifications of engineers. In the period
under discussion, civil, mining, mechanical and
electrical engineering generally had low vacancy
fill rates and there were few suitable applicants per
vacancy (see Section 11 for more detail).
There are concerns regarding the Australian
university academic staffing profile as the
academic workforce ages, the proportion of
tenured staff positions decrease, casualisation
increases, employment conditions exacerbate
recruitment difficulties, and global competition
and mobility increases. These concerns affect
the capacity of the university sector to enhance
scientific literacy, educate STEM undergraduate
and higher degree by research students, and
undertake STEM-related research.
Policies, strategies and programsCommonwealth government reports and policy
statements have specifically focused on elements
of the education, and science and innovation
agendas relevant to science, technology,
engineering and mathematics. With respect to
schooling and teaching quality, the Melbourne
Declaration on Educational Goals for Young
Australians commits all Australian governments
to quality schooling, including knowledge in
mathematics and science (physics, chemistry
and biology). The Measurement Framework for
Schooling in Australia, NAPLAN, NAP-SL and
NAP-ICT package represents a framework for the
collection of data regarding mathematical and
science performance, scientific literacy and ICT
literacy. These Australian assessment regimes are
additional to the PISA and TIMSS initiatives.
There have been a number of inquiries into
teaching and teacher education. The Council
of Australian Government (COAG) National
Partnership Agreement on Improving Teacher Quality
supported the development of the Australian
Professional Standards for Teachers by the Australian

51
Institute for Teaching and School Leadership
(AITSL), national accreditation of pre-service
teacher training courses, national consistency in
graduate teacher registration (AITSL Proficient
Standards), performance management systems
and professional development.
In response to the Review of Funding for
Schooling: Final Report (Gonski report) the
Australian government has announced the
National Plan for School Improvement. A key
theme of the plan is Quality Teaching, which
involves reforms aimed at ensuring Australia
has the best possible teachers and that they
are adequately supported. Announced reforms
include: increasing entry requirements for school
leavers and mature-aged teaching degree
applicants; increasing the length of pre-service
practicum requirements; improvements to
teacher performance management; higher
quality professional development and greater
school autonomy including in staff selection
and employment. Government reviews have
recognised the issues facing declining student
engagement with, and participation in, school
science and mathematics, and recommended
a range of policy interventions to address
declining performance and general science
literacy. This includes improving primary school
science through a focus on literacy education,
establishing partnerships between industry
and education, installing contemporary science
equipment, and providing careers education and
transition support.
In terms of participation in higher education,
reviews have recommended strategies to
address disparities faced by particular cohorts,
for example the Bradley review’s targets for
increasing participation of students from low
SES backgrounds. The Cutler review made
recommendations relevant to STEM research
and development and industry innovation. With
respect to both school and university education,
addressing the inequities for indigenous
Australians is a key government priority. The
COAG National Foundation Skills Strategy for Adults
highlights skill development needs for adults,
including the skills of English language, literacy
and numeracy which are seen as precursors
for scientific literacy. The Australian Workforce
and Productivity Agency is exploring a range of
strategies to increase the skill level of Australia’s
workforce, including scientific literacy and
capacity to transition to higher education.
Commonwealth, State and Territory governments
have produced a number of policies, strategies
and review reports related, directly and indirectly,
to STEM. This includes documentation focused
on early childhood, vocational education and
training, existing workforce skills development,
research and development, and innovation. Policy
interventions to support STEM and scientific
literacy address teaching quality, curriculum,
curriculum resources, school and university
education and research infrastructure, work
integrated learning (e.g. internships and work
placements), career and subject selection advice,
post-school transitions, cross-sectoral partnerships
(education, industry, government) including the
School Business Community Partnership Brokers
Program, existing workforce development,
targeted immigration, research capabilities,
business development, commercialisation,
community engagement and accountability.
Despite the plethora of government policies and
reviews focused on education, and science and
innovation and the relatively recent emergence
of the STEM agenda in Australia, the ‘pipeline’
is decreasing and there are serious questions
about performance in the foundation skills of
literacy and numeracy, and the enabling sciences,
mathematics and scientific literacy. Participation
in university undergraduate and higher degree
by research programs in STEM-disciplines is only
marginally increasing, largely due to increases
in the health disciplines. There are challenges
facing Australia’s research and development
and innovation sector, and there are some
labour market shortages in STEM-occupations,
principally engineering. If workforce levels of
numeracy and scientific literacy were higher
it is likely that productivity would advance. A
coherent STEM policy framework spanning all
Commonwealth, State and Territory governments,
education systems and industry, including
strategies in early childhood, school, VET, higher
education and research and development, could
go some way to addressing these challenges.
That matter is discussed further in Section 7.

What country comparisons can tell us
In this project, when seeking to identify useful lessons and ideas
for Australia, in the approaches taken by other countries, we did
not commission reports from every possible national system. We
focused on those domains where useful ideas were most likely
to be identified: countries most similar to our own, in relation to
the nation overall or particular populations such as indigenous
students, and countries that are high performers in relation to
STEM. Broadly, the reports commissioned for this project that were
nation-specific fall into five main groups:
• English-speaking countries with whom we share many common
features in government, society, the economy and education: the
United Kingdom, the United States, Canada and New Zealand.
• Europe, including the Western Europe regional report plus
specific country reports on France, Portugal, Finland and Russia.
We focused mostly on the STEM-strong countries rather than
covering every jurisdiction in Europe.
• The emerging and emerged players in East and Southeast Asia
which share a Post-Confucian heritage and are exceptionally
dynamic in STEM: China, South Korea, Japan, Taiwan and Singapore.
52

• Emerging economies and education systems:
South Africa, Brazil and Argentina.
• Countries with a particular interest in
indigenous policy issues: Specific reports on
indigenous students and STEM in Canada and
the United States, plus content in the country
reports from New Zealand and Brazil, and
related issues in the report from South Africa.
The country and regional reports reveal an
almost universal governmental preoccupation
with the level of STEM participation in senior
secondary school, and the level of achievement
in the STEM-related disciplines in both secondary
and higher education. In most nations with
active official policy there is also active public
discussion. There is a widespread interest in
building high-end STEM skills, linked to research
and development, and industry innovation. It
is assumed in most national jurisdictions that
the quantity and quality of STEM competences
affects economic performance – though in
most nations there is less programmatic focus
on the links between education in STEM, and
the take-up of STEM skills in the labour markets,
than the assumption suggests. Most efforts of
government, and most of the focus of media
and public attention, are in relation to schools.
Most of the reports discuss issues of curriculum,
pedagogy, student motivation, and teaching.
Consequently this summary report is rich in those
areas. In the consultants’ work there is less focus
on universities than on schools, and almost no
discussion of the parallel set of higher education
issues in relation to curriculum, pedagogy,
student motivation, and teaching. Thus these
issues in higher education are scarcely touched
on in this report, though they are important.
There is little discussion of the labour market and
industry settings, which remain something of a
‘black box’ everywhere. There is also surprisingly
53

54
little policy and public focus – in most countries,
including Australia – on technical education,
where the STEM factor is strong. The exceptions
are the minority of countries which maintain
high quality vocational or technical secondary
institutions and/or tertiary level institutions.
In large part the dominance of emphasis on
schooling is because schooling is subject to direct
government regulation and responsibility, while
universities are more autonomous, technical
institutes in most systems lack adequate status,
and the economic utilisation of STEM, on which
the rationale for STEM policy (ostensibly) pivots,
are largely beyond governmental reach and
public scrutiny. Command economies such as
that of the former Soviet Union used to directly
run the production side of the economy,
including the allocation of graduates to work.
The government of China still exercises greater
interest in the education-to-labour relation
than do most governments. Nevertheless, the
overall trend is for governments to withdraw
from directing the take-up of graduate labour
except in their own organisations. It is ironic that
much of the official rhetoric about STEM turns
on its assumed contribution to productivity and
innovation in the workplace, yet little genuine
effort is made to establish whether, and to what
extent, these expected benefits of STEM are
manifest in the economy. Policy focuses largely on
the supply side, on tuning the education system,
and (it seems) expects demand to spontaneously
appear and to make effective use of graduate
skills, despite the obvious limitations of a strategy
of relying on a supply-side approach alone.
The preoccupation with the quantity and quality
of STEM is often, though not always, linked to
national results in comparative international
tests of school student achievement in STEM
domains. In some countries there are widespread
concerns about declining proportion – or
numbers – of students in the STEM disciplines.
In some countries there are also concerns
about shortages of STEM skills in the labour
markets, especially engineering-related skills.
Sometimes the STEM policy agenda is driven
by an argument about shortages that inhibit
economic capacity; sometimes more by
arguments about lifting performance to meet
the challenges of modernisation and/or
international competitiveness.
The fact that there is an almost universal
preoccupation with STEM-related issues in
education and the economy, and the fact that
examination of government strategies and
programs reveals many points of not just overlap
and similarity, but commonality, does not mean
the issues are ‘the same’ everywhere. Still less
does it mean that programs and practices in one
jurisdiction can be transplanted into another with
the same or similar effects. Programs, policies
and professional practices in relation to STEM are
nested in ‘thick’ and complex social, economic
and policy contexts. Common trends around
the world are articulated everywhere through
national political cultures and local histories
and conventions, and STEM policies must be
consonant with the national and local contexts in
order to gain purchase. Each individual program
initiative plays out in specific ways. Policy
borrowing not only requires much translation
and adaptation, it is a case-by-case matter.
Nonetheless, governments everywhere watch
other government initiatives closely. There is
much parallelism and convergence in STEM,
as in other education policy.
All else being equal, policies and practices that
have developed in settings relatively similar
to Australia are more likely to provide useful
pointers for Australia, than policies and programs
from elsewhere. Where political, educational
and business organisations are broadly similar
to our own, there tends to be greater ease of
policy transfer and adaptation. Where families,
students and educational professionals share
similar assumptions and behaviours to those of
their Australian counterparts, programs that work
elsewhere are more likely to work here. Thus in
this project we looked especially closely at nations
where we have obvious commonalities: the
English-speaking countries, and to a lesser extent,
the affluent countries of Northwestern Europe
closest to the United Kingdom. But this does not
mean that only these closer comparator countries
can have something to teach us in Australia.
Some of the strongest recent performers – in
education in general, and in STEM educational
achievement and STEM-led dynamism in the

55
economy in particular – are countries with quite
different languages, histories and cultures to our
own, such as Finland in Europe, and East Asian
nations such as Korea, Taiwan and China. Other
standouts include education systems where
Eastern and Western heritage are combined,
such as Singapore and Hong Kong SAR in China.
It is in these nations that programs to lift STEM
performance appear to be bearing the most fruit
at present, in both schooling and in research
science. We need to better understand what
drives and sustains their improvement.
In the consultants’ reports it is noticeable that
the presentation of STEM-related issues differs in
terms of the five groupings outlined above. STEM
issues are nested in rather different narratives in
each case. These narratives colour the kinds of
strategies and programs employed, at least to
some extent.
In the English-speaking countries, with the
exception of Canada, there is widespread talk of
a STEM ‘crisis’. This is underpinned by quantitative
indicators that show a declining relative (or
even absolute) performance in international
comparisons of achievement and a lower rank
than the nation believes it should occupy; and/
or declines in participation in STEM subjects
at school. There are some inventive programs
related to STEM, especially in the United
Kingdom and United States. However, for the
most part the talk of crisis does not appear to
secure a consensus about programs able to lift
performance in a sustained way. Certainly the
outcomes of comparative tests over time suggest
that a clear dynamic of improvement is missing,
in contrast with, say, Korea. Nevertheless, it is
interesting to note that when there are measured
improvements, as in the United States PISA
performance in science, little attention is given
to this. The narrative about decline seems to be
deeply entrenched. In the United States, Australia
and New Zealand, there is more debate about
the quality of teachers than in the STEM-strong
countries, and with some exceptions the status
of teachers is not as high. There is also a faltering
of universal achievement – the ‘tail’ of STEM
low achievers is longer in the English-speaking
countries than in much of Western Europe and
East Asia, though again Canada is an exception,
and the United States and United Kingdom have
longer ‘tails’ than Australia. In research the English
speaking countries still enjoy a global advantage
but are concerned that some other countries
exhibit faster improvement. Australia and New
Zealand do not perform as strongly in science as
the United States, United Kingdom and Canada.
In the reports of the consultants from English-
speaking countries there is some critique of
the orthodox STEM policy drivers. The United
Kingdom report refers to ‘somewhat hysterical’
reactions to PISA results. The United States report
raises the question of the extent of STEM worker
shortages. It also mounts an argument that STEM
graduates are very useful in workplaces generally,
and that raising universal STEM competencies
has a positive economic effect outside of specific
occupations. In the English speaking countries,
though, the arguments about specific STEM skills
(whether in terms of shortage, or in terms of high
performers) mostly seem in a tradeoff with the
argument for general STEM literacy across the
population. The former arguments seem to have
more purchase than the latter.
Western Europe includes many countries where
an emphasis on STEM has long been part of the
framing of national policy on education and
industry, though some countries refer to crisis or
under-performance. Several countries perform
exceptionally well in research science given their
size, including Switzerland, Sweden, Finland
and the Netherlands. The European Commission
has been centrally focused on STEM policy
since the 1990s. STEM is especially significant
in advanced manufacturing nations such as
Germany, where engineering is a large presence.
Finland has exceptional STEM indicators in all
domains including school performance, the
proportion of doctoral enrolments, the level
of the STEM qualifications required at work,
including teaching, and the weight of the
research and development workforce within the
economy. Not everyone is on the STEM reform
bandwagon: Russia inherited from the Soviet era
what was then an advanced culture of science
and technology, including special science schools
and competitions, and there is strong content
knowledge in schooling as measured by TIMSS,
but the education system is less effective in

56
PISA, which compared to TIMSS places greater
emphasis on applications of knowledge rather
than content. However, Russia is not at this stage
so enthusiastic about reforms to emphasise
inquiry based and problem-solving processes,
and enhance creativity, preoccupations in many
other systems. There is little momentum in the
STEM discussion or interest in other countries’
performance. In contrast, in France, there
are concerns about declining participation
in secondary school and tertiary STEM,
notwithstanding the fact that France looks
relatively strong in terms of STEM at university
level, and science careers are more prestigious
in French society than in the English-speaking
world. As in other nations, it seems there is
always room for a ‘there should be more STEM’
argument regardless of the actual level of STEM
competences. This indicates the power of the
core economic narrative about the contribution
of STEM to economic innovation, growth and
competitiveness. In that respect STEM draws
on near universal perceptions of the centrality
of science and technology. These themes are
especially obvious in policy and public cultures in
Western Europe.
In East Asia and Singapore the language about
STEM is more confident. There is an almost
universal recognition in the home about the
importance of education (Marginson, 2011) and
STEM has been placed in a superior position.
The position of STEM in secondary schooling
and higher education is unquestionable. China
has compulsory mathematics until the end
of school. Long-term planning approaches
are dominant and there is a broad and deep
social and governmental consensus about the
importance of science, technology, research
and STEM. There are strong programs to lift the
top science universities on the global scale, in
every one of these systems. Policy focuses on
quantitative benchmarks, achieves them and
moves the standard to a higher level. There are
comprehensive programs of reform in every
schooling system with a common movement
towards more student-centred, inquiry based
and problem-solving learning and an emphasis
on creativity. In the last Korea stands out, with
its inclusion of the Arts in its STEAM program.
There are concerns in both Korea and Japan
about the need to encourage more bright
students to stay with science and mathematics:
here the concern intersects with that of many
other countries. In the Post-Confucian societies
teachers are respected, and STEM classes are
taught by discipline-qualified teachers teaching
in the fields in which they were trained. While
there is less debate about the quality of teachers

57
than in English-speaking countries (except
perhaps in Japan), there is much emphasis on
lifting teacher quality, which is built into the
promotion-oriented professional development
system in China. There is a largely seamless
movement between STEM for all and programs
focused on higher achievers and research,
though particular techniques designed to isolate
high STEM achievers, such as special schools or
scholarship allocations, play into fraught debates
about competitive systems and outcomes and
can be controversial. STEM is generally (as it is
everywhere) associated with high achieving
academic tracking. Perhaps the association is
strongest in East Asia. There are relatively strong
systems of technical schools in some systems,
including Singapore and Taiwan. Taiwan also has
technical universities. There is much talk about
the need to lift national effort and performance,
coupled with a focus on trends in performance;
but the Anglo-American preoccupations with
‘crisis’, decline, and seemingly intractable capacity
weaknesses, are absent in these countries, except
that Japan is focused on declining participation
and relative performance in STEM.
For countries in the process of developing
an industrial base, and/or with low levels of
education participation and teacher supply such
as Brazil and South Africa, STEM participation is
framed in terms of improving participation in
basic education, and putting in place a qualified
teaching workforce. Issues of socio-economic
equity and building human capital in previously
excluded populations have greatest resonance in
these nations, where participation in good quality
upper secondary and tertiary education (indeed,
participation in the modern economy) is by no
means universal; there are social groups whose
members are largely excluded; and science and
research systems are down the development
curves. This is not a description of Australian
economy and society. However, it does describe
the position of many indigenous Australians.
There, solving the problem of STEM capacity and
performance is a sub-set of the larger problem of
designing more effective educational programs
and resources. This is not to say STEM-related
indigenous education should ‘wait’ until the larger
problems of indigenous participation in education
and society have been effectively addressed.
The consultants’ reports on STEM in indigenous
education contexts indicate common themes
across the group. Indigenous STEM issues in part
are understood in terms of the disadvantages of
low SES and remote locality, and in part in terms
of cross-cultural encounter. Inventive curricula
and pedagogies are needed, as the reports from
Canada and the United States suggest.

An international view of STEM in Australia
International organisations have a unique comparative
perspective that highlights global recognition of the
importance of the STEM disciplines, and can usefully inform
Australia’s national STEM agenda. The international organisations
that give significant attention to STEM issues include the
Organization for Economic Cooperation and Development
(OECD), the World Bank, United Nations Science, Education and
Cultural Organization (UNESCO), the European Union (EU), and
the International Association of the Evaluation of Educational
Achievement (IEA). A full discussion of data, findings and policy
recommendations of international organisations in relation to
STEM education is provided in the consultants’ report on the
work of international organisations.
Interest in STEM education: An economic imperativeThe interest of international organisations in both education
and the labour market in STEM fields is closely tied to an overall
58

economic agenda. This is based on research
that connects cognitive ability levels in the
population, as measured by tests of scientific,
mathematical and reading literacy, to long-term
economic growth and competitive advantage.
In this argument, economic growth signifies
the overall wellbeing of the population and not
simply the wealth of the economy.
Economic modelling has consistently identified
a ‘relationship between direct measures of
cognitive skills and long-term economic
development’ (OECD, 2010a; Barro, 2001;
Sianesi & Reenen, 2003; and Krueger & Lindahl,
2001). Educational attainment falls short as a
proxy for human capital, as it measures only
quantity, not quality. The OECD argues that
this relationship is ‘particularly incomplete and
potentially misleading … for comparing the
impacts of human capital on the economies of
different countries’ (OECD 2010a, p.13), because
it implies that there is similarity in the outcomes
of a year of schooling between countries and
that formal schooling is the only source of
learning. Instead, the international evidence
reveals that educational quality, as measured by
tests of cognitive skills primarily in science and
mathematics, is both a more accurate predictor
of, and a more potent influence on, economic
outcomes (Hanushek & Woessmann, 2009;
Hanushek & Woessmann, 2008; OECD 2010a;
Sianesi & Reenen, 2003; Hanushek & Kimko,
2000). A recent study (Hanushek & Woessmann,
2012) again confirms this overall conclusion.
Their model has now grown to encompass a
particularly large base of evidence. It includes the results of international tests conducted over many decades by both the IEA and the OECD. Modelling undertaken by the OECD on results generated in its own standardised global testing program has similarly demonstrated that
59

60
‘differences in cognitive skills’ explain ‘a majority of the historic differences in economic growth rates across OECD countries’ (OECD 2010a, p.10).
International organisations emphasise the economic imperative as a justification for their interest in STEM education. The OECD explains its interest in declining numbers of students studying STEM fields, and in correcting gender imbalances in STEM participation, in these terms. A report from the OECD Global Science Forum notes that ‘the economy is increasingly driven by complex knowledge and advanced cognitive skills’ and claims this to be the driver of OECD and ministerial interest in the area (OECD 2006, p.3). The report described women not currently involved in STEM fields as a ‘resource’ (ibid.). UNESCO (2007, p.45) similarly uses this terminology, referring to women and minorities under-represented in STEM fields as a ‘resource’ or ‘pool of talent’ that is necessary for achieving development goals. The EU has a similar view, expressing concern about declines in participation in STEM fields due to the ‘strategic importance’ of ‘innovation and knowledge in science and technology’ for the maintenance of ‘economic growth’ (European Communities 2008, p.16). The same research described the under-representation of women, attrition in particular, as essentially the under-utilization of available and qualified human capital. Furthermore, the European Commission (EC) (ibid.) advocates urgent action in order to boost quality and international competitiveness in innovation. Again these are primarily economic concerns.
The OECD’s flagship international testing program expresses its goal as the measurement of ‘cumulative yield’ from the quantitative examination of educational outcomes (OECD, 2010b, p.11 & OECD 2006, p.9). UNESCO notes the importance of engineering education for the economy by describing it as a ‘foundation for the development of society’ (2010, p.337). Without a thriving engineering profession, it claims, development, production and economic growth would suffer. The reasoning is that engineering drives innovation, and in turn, innovation drives the economy through the exploitation of new markets.
Focus on the link between economic development and high-end skills may seem an obvious concern for international organisations like OECD whose work is anchored to the wealthier, more developed countries. However, organisations whose main concern is developing countries, such as the World Bank, are similarly preoccupied with the economic benefits of STEM-related performance. For example, UNESCO claims that excellence in STEM ‘plays an important role in promoting long-term economic growth, and in building a base for a science-based knowledge society’ (ibid, p.27), as well as in establishing a sustainable development trajectory within developing economies. In relation to women in science, the report explains that any discrimination reducing the engagement of women limits growth and the reduction of poverty in developing countries (UNESCO, 2007). In 2010, UNESCO also refers to the role of science and technology capacity as being ‘critical drivers for achieving sustainable development and gaining access to the knowledge economy and society’ (p.7). The outcomes of this are both societal improvement and economic growth.
Policy research and recommendations
International organisations have undertaken research and policy work in a variety of areas related to education in STEM fields in countries around the world. Much of this work refers to declining interest and participation in STEM study, and the need to make changes that attract more students to the related disciplines, particularly women and other under-represented groups. Research in international organisations has also focused on the training of engineers to meet labour market demands. In addition, the international organisations have discussed the use of STEM education to promote sustainable development and to improve levels of financial literacy.
The most significant role of international organisations in relation to STEM education is the comparative measurement of participation and performance.

61
Participation in STEM fields of educationThe participation rates of Australian students in
the STEM disciplines are relatively good on the
international scale and provide something of a
competitive advantage. However, Australia may
need to undertake significant improvement in
order to keep pace with comparable countries
that are lifting their performance.
A lack of comparable data at upper secondary level
School level engagement in the study of STEM
fields is key to ongoing pathways through higher
education and into the STEM labour market.
However, there is a distinct lack of standardised
international data collated to illustrate upper
secondary level participation in STEM fields of study.
As noted in Section 4, in Australia 52 per cent of
year 12 students in 2009 were enrolled in science
subjects (Goodrum et al, 2012), and 72 per cent
took some level of mathematics study, including
14 per cent in intermediate level mathematics, and
7 per cent in advanced mathematics (Office of the
Chief Scientist, 2012a; and Barrington, 2011).
Consultant reports commissioned for this project provide specific national data from a selection of comparable countries. In Canada national statistics are not collated but the education system of each province provides enrolment data in STEM disciplines. In 2010-11 between 42 per cent and 50 per cent of year 12 students were enrolled in mathematics, varying by province. Physics and chemistry attracted between 14 and 40 per cent of enrolled students, depending on the province. The United States is another useful comparator. Unlike Australia or Canada, the United States nationally counts the proportion of high school graduates who have completed mathematics and science courses at some point throughout their secondary studies. On this measure, more than 75 per cent of graduates in 2009 had undertaken at least basic level mathematics, 90 per cent biology, 75 per cent chemistry, and less than 40 per cent physics. Basic secondary school mathematics topics, such
as algebra and geometry, had been covered by more than two thirds of all students. More tertiary directed topics, such as probability and calculus, had been undertaken by less than 10 per cent of United States secondary school graduates in 2009.
In some countries students are required to study mathematics until the end of school, including Brazil, China, Israel, Finland and Taiwan. However, each has a unique curriculum structure and mandates mathematics study quite differently. While participation in mathematics to year 12 is at or above 90 per cent, national performance levels significantly diverge between these countries. Finland, along with selected educational regions of China, top international tests of students’ mathematical and scientific abilities, while students from Brazil and Israel reach comparatively low proficiency levels.
Finland is an important comparator given its successful education system. In 2011, 14 per cent of Finnish matriculation candidates undertook advanced mathematics, 19 per cent basic level mathematics, 7 per cent each of biology and physics, and 6 per cent chemistry. These figures provide a good example of the difficulty with direct comparison. The curriculum is arranged differently in Australia and Finland, there are more Finnish than Australian students engaged in academically oriented programs at this level, and more students overall complete secondary school in Finland (93 per cent, compared with 70 per cent of Australian students).
First degree tertiary participation in STEM fields
In Australia the proportion of first degree
students enrolled in STEM disciplines is
comparatively low. Fewer Australian students
are enrolled in STEM fields overall than in other
comparable countries, below key comparators
such as Finland, Korea and Germany.
The overall STEM shortfall is attributable
primarily to low participation in engineering and
mathematics study, rather than in the sciences.
If enrolments in these two discipline areas are
not included, the Australian figures climb well
above the OECD and European averages. Of the
countries presented above, only New Zealand

62
and the United Kingdom reach a higher level
of participation in science and computing than
does Australia. Participation in engineering at
tertiary level is particularly strong in Finland,
Israel and Korea, such that when this discipline
is removed, these countries fall below OECD and
European average participation to less than 9 per
cent of tertiary new entrants. The comparable
figure in Australia is more than 11 per cent. Even
Denmark, with STEM participation at first degree
level only just above that of Australia, attracts a
proportionately greater number of students to
engineering study.
Australia is a key global destination for education,
hosting a considerable number of international
students. It is not a key STEM destination. Given
the significant numbers of international students
who remain in the country on completion and
apply for residence or citizenship, the disciplinary
choices of these students are pertinent to the
enhancement of STEM fields. The majority of
international students (55 per cent) in Australia
choose study programs in the fields of social
science, business and law, while less than a
quarter (23 per cent) undertake STEM studies.
In contrast, Sweden, Finland, Germany and the
United States are key STEM destinations, with
Canada, Denmark, the United Kingdom and the
New Zealand also attracting a greater proportion
of their international students to these fields than
does Australia. Engineering again experiences a
particular shortfall in Australia compared to other
countries, with only 11 per cent of international
students participating studying in this field. As
Table 9: The distribution of international tertiary new entrants by field of education in 2010 for Australia, and a selection of comparable countries
CountryEngineering,
manufacturing and construction
Sciences Mathematics and statistics Computing Other
Sweden 34.51% 8.60% 1.90% 6.73% 48.26%Finland 31.72% 3.67% 0.46% 7.03% 57.13%Germany 21.58% 7.05% 1.93% 7.30% 62.14%United States 18.42% 8.77% 2.08% 6.64% 64.09%Canada 15.75% 7.75% 2.74% 4.94% 68.82%Denmark 19.27% 1.71% 2.06% 6.54% 70.42%United Kingdom 14.88% 5.73% 1.78% 6.14% 71.46%New Zealand 6.99% 6.91% 2.45% 9.79% 73.87%Australia 11.08% 3.48% 0.47% 7.65% 77.33%Japan 14.98% 1.21% 0.00% 0.00% 83.81%
Source: OECD 2012a, Education at a Glance 2012: OECD Indicators, OECD Publishing, Paris.
Table 8: The distribution of tertiary new entrants by field of education in 2010 for Australia, a selection of comparable countries, and the OECD and E21 averages
CountryEngineering,
manufacturing and construction
Sciences Mathematics and statistics Computing Other
Finland 25.4% 3.4% 1.2% 4.3% 65.7%Israel 25.3% 4.7% 0.9% 2.8% 66.3%Korea 23.8% 4.0% 0.7% 2.9% 68.6%Germany 15.7% 5.6% 2.5% 3.8% 72.4%OECD Average 15.0% 4.4% 1.0% 4.3% 75.3%EU21 Average 14.9% 4.3% 1.0% 4.3% 77.7%United Kingdom 8.2% 8.3% 1.7% 4.1% 78.0%New Zealand 6.4% 6.9% 2.5% 6.3% 78.8%Denmark 11.9% 2.1% 1.2% 5.9% 80.0%Australia 8.7% 6.6% 0.4% 4.3% 82.2%Argentina 8.0% 3.3% 1.7% 4.8% 83.2%Japan 14.6% 2.2% - - -
Source: OECD 2012a, Education at a Glance 2012: OECD Indicators, OECD Publishing, Paris.

63
many as 35 per cent of all international tertiary
students in Sweden, and 32 per cent in Finland
are enrolled in engineering, manufacturing and
construction related programs.
There is no consistent pattern of participation
in STEM study at tertiary level through time. The
consultants’ reports indicate variation by country
and by specific discipline or sub-discipline.
Some countries, such as Finland, have had
difficulty producing longitudinal data as a result
of structural and governance changes in higher
education in recent years.
STEM higher degree participation
In comparative terms Australia has stronger
participation of students in STEM doctoral
degrees. A higher proportion of doctoral degrees
than first degrees are in science and engineering
fields: 40 per cent of all doctorate degrees
awarded in 2008 in Australia were in these two
fields, just above the OECD average and on par
with Denmark and Finland. Other countries with
higher doctoral participation include France,
Canada, New Zealand and the United Kingdom.
Australia attracts students to science fields
at doctoral level in higher numbers than in
engineering. Twenty-six percent of doctorates
are awarded in science, with only 14 per cent
in engineering. In contrast, key Asian countries
China, Japan and Korea focus doctoral training
on engineering. Australia, however, is not alone.
New Zealand, Germany and the United States
also have higher proportions of doctoral degrees
awarded in science than in engineering.
In Australia 37 per cent of doctorate degrees in
science and engineering fields were awarded to
women in 2008. Australia is significantly behind
only Portugal and Israel on this measure. In both
these countries, close to half of their doctoral
completions in science and engineering are
women. Women are most under-represented in
Japan and Korea, amongst the countries shown.
Performance in STEM fields of educationTwo international organisations use large
scale standardised testing programs
to measure school level educational
achievement on a comparative basis.
The OECD has developed PISA. This has grown since
2000 to encompass more than 74 member and
non-member countries and economies in its fifth
cycle in 2012. The participant countries account for
more than 90 per cent of the world’s economy. The
most recent data available are from the fourth cycle
of PISA testing conducted in 2009. Questions used
in the test are designed to capture the learning
of 15 year-olds by measuring the application of
curriculum knowledge to real world problems.
Figure 6: Percentage of all awarded doctoral degrees from science and engineering fields in 2009
France China Canada (2008)
Israel New Zealand
United Kingdom
Denmark Australia (2008)
Finland OECD Average
Japan Germany India (2008)
United States
Korea South Africa
Brazil (2008)
Portugal
70
60
50
40
30
20
10
0
Source: OECD 2011, Science, Technology and Industry Scoreboard 2011, OECD Publishing, Paris.
Science
36.895
44.527
33.882
18.786
38.22734.118
36.865 36.965
30.76933.637
15.311
33.26933.868
49.194
Percentage of S&E doctorate degrees awarded to women
Engineering

64
The second international test is TIMSS, which has
been conducted every four years since 1995 by
the International Association for the Evaluation
of Educational Achievement (IEA). In the 2011
cycle of testing, the science and mathematics
curriculum knowledge of year 4 and year 8
students were examined in 69 countries. The
intention of the TIMSS differs from PISA in that it is
focused on student understanding of curriculum
knowledge in mathematics and science.
The data collected through both of these tests
are rich and complex. Consideration of the full
detail is beyond the scope of this report. We
focus on a small number of points of interest
that illuminate Australia’s comparative
international performance.
Country ranking by average score
When PISA and TIMSS results are released most
of the focus of media and governments falls
on the overall ranking of countries on the basis
of average scores. In that regard the overall
performance of Australia is comparatively good.
In the latest cycle of PISA Australia is ranked
equal 7th in scientific and reading literacy, and
equal 13th in mathematical literacy (OECD, 2010c;
and Thomson et al. 2010). Performance in TIMSS
is not as good. In the average performance
of year 4 students Australia was equal 18th in
mathematics and equal 19th in science (Mullis et
al, 2012a; Mullis et al, 2012b; and Thomson et al,
2012a). By year 8, Australian students had raised
the nation’s position to equal 7th in mathematics
and equal 10th in science (ibid.).
Figure 7: Mathematical literacy performance of students from countries above the OECD average in the 2009 PISA testing cycle
Shanghai, China
Finland
Korea
Hong Kong, China
Liechtenstein
Singapore
Macao, China
Canada
Japan
Estonia
Chinese Taipei
Netherlands
Switzerland
New Zealand
Australia
Iceland
Denmark
Norway
Germany
Belguim
United Kingdom
Slovenia
Poland
Ireland
Slovak Republic
Sweden
OECD average
273
2
2421159
62
62
63
3 7
3 7
3 8
3 8
94
3 10
94
3 11
94
105
115
116
125
6 13
126
118
146
147
146
147
147
148
118
517282716
828262416
1120252213
513312615
1620231913
413252820
414252719
615242617
210233023
1117222116
415242419
816232316
514222419
412222620
310212721
29212723
28202824
513222319
615212217
28182725
410192422
28192624
6192924
49182523
29192523
310192422
In cases in which the proportion of students in a proficiency level is one per cent or less, the level still appears in the figure but the numeral label ‘1’, does not.
Source: Thomson, S, De Bortoli, L, Nicholas, M, Hillman, K & Buckley, S 2010, Challenges for Australian education: results from PISA 2009, Australian Council for Educational Research, Melbourne, viewed 11 January 2013, http://research.acer.edu.au/ozpisa/9.
100 80 60 40 20 0 20 40 60 80 100
Below Level 1 Level 1 Level 2Percentage of students Level 3 Level 4 Level 5 Level 6

65
In the last cycles of testing in TIMSS and PISA,
countries/systems that consistently performed
equal to or above the level of Australia included
Korea, Finland, Taiwan, the Hong Kong and
Shanghai regions of China, Japan, Canada,
Singapore, New Zealand, the Netherlands
and Germany.
The tail of underperformers
More important than the ranking of average
scores is the distribution of student performance.
When examining this distribution, there are two
key groups to watch: the ‘tail’ of low achieving
students, and the top performing students. The
tail is pertinent to the broad distribution of basic
scientific and mathematical literacy. The smaller
the low achiever group – or alternately, the
average scores achieved by the bottom quintile
or quartile – tell us how close we are to achieving
universal competence in STEM. The size of the
top performer group – or alternately, the average
scores achieved by the top quintile or quartile –
help us to understand how strong Australia will be
in future in terms of advanced STEM capability.
Participants in both PISA and TIMSS are divided
into groups according to their demonstrated
proficiency. A benchmark performance level is set,
below which students are thought to be at risk of
having difficulty in participating work and life as
productive citizens in the twenty-first century.
In PISA, 16 per cent of Australian students fall
below this point in terms of mathematical
literacy, and 12 per cent in scientific literacy. A
further 20 per cent fall into the level immediately
5
Figure 8: Scientific literacy performance of students from countries above the OECD average in the 2009 PISA testing cycle
Shanghai, China
Finland
Korea
Hong Kong, China
Estonia
Canada
Macao, China
Japan
Chinese Taipei
Liechtenstein
Singapore
Australia
Poland
Netherlands
New Zealand
Switzerland
Hungary
Latvia
Slovenia
Germany
United Kingdom
Ireland
Norway
Portugal
Denmark
Lithuania
Czech Republic
Iceland
OECD average
In cases in which the proportion of students in a proficiency level is one per cent or less, the level still appears in the figure but the numeral label ‘1’, does not.
Source: Thomson, S, De Bortoli, L, Nicholas, M, Hillman, K & Buckley, S 2010, Challenges for Australian education: results from PISA 2009, Australian Council for Educational Research, Melbourne, viewed 11 January 2013, http://research.acer.edu.au/ozpisa/9.
4203626113
5
7
8
7
9
9
3
11
100 80 60 40 20 0 20 40 60 80 100
55
55
2
82
3
2
10
3
93
112
11
4 9
3 11
4 10
2 12
3 12
4
114
114
124
133
124
143
135
125
135
315312915
11303319
214332915
9263421
211263121
5233825
314302716
8263321
9253024
515262517
311252820
7213226
11252722
414252618
29243021
5223326
3183629
232924 9
11252720 2
9222923 2
233023 8
203127 6
4183229
4183229
203126 6
212924 7
202926
193026 6
7
Below Level 1 Level 1 Level 2Percentage of students Level 3 Level 4 Level 5 Level 6

66
above (level 3 of 6) where the skill level is
considered to be insufficient for people to
thrive (Thomson et al. 2010). In TIMSS testing of
mathematics at year 4, 30 per cent of students fall
below the specified benchmark. This proportion
rises to 37 per cent by year 8. In science, 29 per
cent of year 4 participants in TIMSS fail to reach
the international benchmark. At year 8 the size
of the group is much the same, at 30 per cent
(Thomson et al, 2012a).
In international testing the distribution
of achievement tends to correlate with
demographic factors. Low socio-economic status
is associated with poorer performance in both
scientific and mathematical literacy in PISA. Thus
while only 3 per cent of Australian students in the
highest SES quartile fall below the international
benchmark in mathematical literacy, 22 per
cent of students in the lowest SES quartile fail
to reach this level. Difference is more marked
in mathematical literacy, at 4 per cent and 28
per cent respectively. Less variation is observed
according to immigrant status, however. Young
people born in Australia to immigrant parents are
the highest achieving group in Australia.
The international comparison reveals that Taiwan,
the Shanghai region of China, Korea, Singapore,
Finland, Hong Kong and Canada are among the
countries with significantly smaller groups of
under-performers. There are no countries where
all students reach the minimum benchmark. But
should any level of underperformance be an
acceptable part of Australian education?
High achievers
The top performers in science and mathematics at secondary school constitute the primary pool of talent with the potential to contribute to the future STEM workforce at the high-end, including research and development functions and technology management. In mathematics in PISA, the nations/systems with the largest number of top performers are the Shanghai region of
China, Singapore, Hong Kong SAR and Taiwan. Those nations/systems with the largest group of students at the top three proficiency levels are Shanghai, Singapore, Hong Kong SAR, Taiwan, Korea, Finland and Switzerland. Interestingly, these are also the systems with the smallest proportion of underperformers. It would seem that there is no need to choose between boosting high achievement and eliminating disadvantage.
In PISA science fewer nations/systems are above
Australia in terms of the size of the group of
students reaching the top three proficiency
levels. Those that are ahead include the Shanghai
region, Singapore, Finland, Hong Kong SAR and
New Zealand.
Performance through time
The PISA and TIMSS data also allow Australia’s
performance to be tracked over time. Are we
improving, declining or standing still?
In PISA performance in science can be tracked
only between the 2006 and 2009 testing cycles.
There was no significant change. We have longer
comparisons for reading and mathematics,
however. In both domains there has been a
statistically significant decline in performance.
In reading literacy, Australia achieved an average
score of 528 in the year 2000 but only 515 in
2009. In mathematical literacy, the average
score fell from 524 in 2003 to 514 in 2009 (OECD,
2010d; and Thomson et al, 2010).
In several other countries there were significant
improvements in the PISA results. However, in
reading and mathematics, only Korea improved
so as to reach an overall mathematical literacy
score above that of Australia.
Although the average scores of year 4
and year 8 students in TIMSS tests have
fluctuated since the first test in 1995, the
only statistically significant change since
then has been an overall improvement
in year 4 mathematical performance.

67
The impact of performance ranking and the country perspectivesSince it began in 2000, PISA has made a large
splash in the international media every time a
new set of performance data has been released.
The results often kindle public discussions on
school reform in countries around the world.
Through an examination of European responses
to the outcomes of the first two rounds of PISA
testing in 2000 and 2003, Grek (2009) identified
three types of reaction.
First, some countries experienced ‘PISA-surprise’.
For example, the Finnish were pleasantly
surprised by their success in the assessment
and by the international interest they garnered
through this result (Grek, 2009, p.34; and
Breakspear, 2012).
Second, in some countries the results created
national consternation, described by Grek (2009,
p.34) as ‘PISA-shock’. For example this occurred
in Germany in 2000 and Japan in 2003, when
students from these countries performed at a
level below general expectations (Grek, 2009;
and Breakspear, 2012). This triggered national
debates about education and contributed to
subsequent reforms that were then monitored
using ongoing PISA performance and nationally
observed benchmarks. Kingdom (1995) argues
that an external shock like this generates a
policy window during which time it is politically
possible to enact large scale reforms.
The third type of reaction was termed ‘PISA-
promotion’ by Grek (2009, p.34). It is typified by
countries such as the United Kingdom, where
the media was uninterested in the early cycles
of PISA. The national results were relatively good
and the national government touted the student
achievement scores as evidence of the success
of British education. No reforms were generated
in this process (Grek, 2009; and Breakspear,
2012). These last two types of reaction, shock
and promotion, underline the importance of
the media’s interpretation of the comparative
test results (Grek, 2009). Breakspear (2012) notes
that the three reactions vary on the basis of
differences between expected and actual test
outcomes (higher than expected, lower than
expected, consistent with expectations). He notes
that in New Zealand, students’ high performance
level in the test reinforced existing positive
feelings about recent reforms, while in the United
States, the below average results achieved by
students were also consistent with expectations.
In both cases, no new reforms were proposed.
The consultants’ reports demonstrate that
individual countries have their own perspectives
on PISA. The report on Canada describes
stable performance levels but notes the lack of
national improvement when compared with the
improving performances in some other countries,
which has reduced Canada’s ranking over time.
Japan experienced shock about its performance
in science and mathematics in the year 2000,
with some further decline in 2003. Educational
reforms since then have been associated with
some improvement in student results, though
more so in relation to reading than STEM. There
are continuing equity gaps. The consultants’
report on Korea notes the improvements in
students’ international test scores in recent years.
This increase is attributed to a concerted and
directed effort using several strategies in concert.
However, policy makers know they face an
ongoing challenge to generate interest in STEM
among bright students.

68
STEM in society
Generic role of STEMThe STEM disciplines create direct economic benefits in that they
help to form skilled labour. Nevertheless the case for expanding
and improving STEM provision and participation on the basis of
labour market demand or rates of return is less than clear-cut
(see Section 11 for more discussion). At the same time, the total
economic and social argument in favour of STEM provision is
larger than this. The STEM disciplines generate a broad range of
benefits, individual and collective.
The argument for the STEM disciplines is in large part about
their generic role in the workplace and beyond. The widespread
emphasis on universal STEM acquisition, throughout the world’s
schooling systems, reflects the ubiquitous role of science and
technology in work and living. Preparing students in STEM helps
to prepare them to be good citizens and persons able to shape
the course of their own lives. There are many human activities
and problems where understanding requires at least a basic
scientific and technological knowledge and confidence, such as
global warming, ecological transformation and changing energy

69
patterns; issues related to health and medical
care; and the use of communications and other
digital technologies, especially their use as modes
of production and creativity. It is often stated
that design skills, which are now underpinned
by digital and quantitative capacities, are
increasingly required in many domains.
More specifically, in terms of the economy,
we need an ever-growing proportion of the
workforce to have quantitative and symbolic skills
and basic scientific knowledge. In manufacturing
and advanced services and agriculture not just
technical specialists but most workers require
some scientific and technological literacy and
this is increasingly true also in education and
health. This means that both academic and
vocational programs need to be STEM strong.
As the consultants who prepared the report on
the United States argue:
The steadily rising technological baseline of
day-to-day activities, including school work
and typical work-related tasks, requires a
higher level of STEM skills from everyone over
time. The transition to a more technology-
intensive economy in the 21st century has
raised the bar of entry in most professions,
and now jobs which used to be available
for high school graduates require skills at
the level of a professional certificate or an
associate’s degree in STEM. This applies to
the entire workforce, in a sense the entire
workforce is increasingly made of technicians.
In this respect the line between the increasingly
ubiquitous role of STEM in employment, and
the larger formative role of STEM learning for
individual and social capabilities, is blurred. As
the same consultants put it:
Beyond the job demands, STEM-related skills
are increasingly adaptive in the modern world.
As Professor Richard Larson from M.I.T. says: ‘A
person has STEM literacy if she can understand
the world around her in a logical way guided by
the principals of scientific thought. A STEM-
literate person can think for herself. She asks
critical questions. She can form hypotheses
and seek data to confirm or deny them. She
sees the beauty and complexity in nature and
seeks to understand. She sees the modern
world that mankind has created and hopes
to use her STEM-related skills and knowledge
to improve it’. These skills, often developed
from STEM courses, are sought by employers
in most sectors, making STEM students highly
marketable, while at the same time giving those
with advanced technical training a number of
career options outside of STEM fields.
Here we want to emphasise the importance
of disciplinary contents in STEM, in terms
of knowledge, techniques and ways of
understanding. There are no short-cuts here.
Students need to acquire these contents in solid
programs of study taught by teachers qualified
in the specific discipline. This is a key issue and
problem in Australian schooling, particularly in
relation to mathematics (see also Sections 2 and
9). Further, contents acquired at secondary school
are an essential foundation for later learning,
especially in mathematics and the physical
sciences. We note that here the loosening
of prerequisite requirements at Australian
universities has partly decoupled foundational
learning from later learning.
Broadening and deepening STEM engagement
In sum, it is desirable to persuade (1) more
students to aspire to STEM learning and STEM-
based careers; and (2) more high achieving
students to shift from higher education programs
in business and law, to science, mathematics and
engineering. We need to persuade more young
Australians to aspire to science and mathematics
because learning in those fields is economically
and socially useful, and intrinsically worthwhile,
and a powerful intellectual formation that can
be foundational to many different kinds of
individual achievement. We might also persuade
more young people to aspire to engineering,
on the grounds that an engineering degree is
a valid and valuable preparation, not only for
work as a professional engineer but also in other
occupations and professions.
The goals of lifting participation and performance
in STEM should not be seen in conflict with other
educational goals, such as improving reading,
literacy, language acquisition, knowledge of

history, society and culture. STEM learning and
non-STEM learning are complementary. Reading
skills underlie all scientific work. The PISA data
show that countries strong in reading tend to
be strong in mathematics and science, and vice
versa. We see STEM as part of a larger educational
program in which, all else being equal, we would
hope all students achieve across the board to
the highest possible level. Choices do need to be
made and it is impossible for senior secondary
and tertiary students to maintain a fully inclusive
curriculum without sacrificing depth. Here our
concern is less to ensure that every student
does more STEM, and more to spread STEM
participation to those who currently opt out
in the senior secondary years, and increase the
number engaged in deep STEM work. In this
scenario there are modest opportunity costs.
To the extent that part of the student body
increases the time commitment to STEM learning,
those students will have less time for non-STEM
disciplines and other pursuits.
The consultants’ country reports confirm that there
is now an emphasis, in many countries, on the role
of STEM-related education in fostering broad-based
scientific literacy. STEM disciplines lift the general
level of understanding of science and technology,
and disseminate quantitative, reasoning and
problem solving skills of a high order across the
economy. Below the senior secondary school levels
STEM-oriented curricula are positioned as a form
of general education and cultural acquisition. As
noted, a key objective of strategies and programs
is ‘science for all’ and this aspiration is expressed
in changes to the junior and middle secondary
curriculum in many countries, and an increasing
focus on science-specific education in primary
schools in some countries.
The discussion rarely takes the form of
‘mathematics for all’, though arguably
mathematics is the key generic element in
developing competence and confidence in
science and technology. Perhaps it is assumed
that the period of compulsory mathematics, to
the end of year 10 or year 11 in most countries,
is sufficient to ensure a common numeracy
across the population. However, it can be argued
that the stage of mathematics for all should be
shifted further up the educational scale. Higher
order mathematics such as statistical modelling
is increasingly useful in a broad range of areas.
One of the factors working against mathematics
for all in senior secondary education is the role
of mathematics education as a selector and elite
streamer of school populations, so that many
students opt out of, or are ejected from, the
mathematics track. Until mathematics becomes
universal at a higher level, the goal of ‘science for
all’ is also inhibited.
The notion of science for all is positioned
alongside the emphasis, in nearly all countries, on
fostering high-end STEM achievement: increasing
the size of the high performing cohort, retaining
more bright students in STEM, lifting the level
of performance of top STEM students, and also
fostering research and world-class universities
in higher education (see also Section 10). A
typical policy formulation of the focus on STEM
high achievement is that of the United Kingdom
Treasury Ten-Year review:
… the Government’s overall ambitions are
to achieve a step change in: the quality of
science teachers and lecturers in every school,
college and university; the results for students
studying science at GCSE level; the numbers
choosing SET subjects in post-16 education
and in higher education; and the proportion
of better qualified students pursuing R&D
careers. (DfES 2004, p.12)
Structural responses include specialist science
and mathematics schools providing elite
education, frequently in high performing Asian
countries (e.g. Super Science High Schools in
Japan; Science and Arts Schools for the Gifted
in Korea; National University of Singapore High
School of Mathematics and Science, and School
of Science and Technology). In some instances
such schools reflect historical specialisations
(e.g. Russian residency-based schools associated
with universities where students specialise in
advanced mathematics and science studies, and
may progress from school to the military sector),
or well-established systemic responses such as
the United Kingdom where some 1,300 schools
have a specialisation in science, technology,
engineering or mathematics and computing.
These schools frequently provide advanced
70

mathematics and science curriculum, involve
participation in high-end enrichment activities
such as the International Olympiads, and provide
rigorous preparation for students aspiring to
university study – either in STEM- or indeed non-
STEM disciplines.
In contrast, the South African Focus Schools
(‘Dinaledi Schools’) project provides resources
to selected schools in previously disadvantaged
African communities with successful science
and mathematics teaching. The initiative
supports advanced science and mathematics
education required for students to gain entry
into science-based higher education programs.
The project has grown to encompass over 500
schools, representing 18% of all students taking
mathematics and science in the South African
school-leaving examination. In Argentina, school
structural reform has witnessed the restoration
of an integrated model of secondary technical
education to support increased participation in
science and technology.
The focuses on science for all, and high-end
STEM cohorts, are not inherently contradictory.
For example, science for all maximises the talent
pool for high-end achievement. The consultants’
reports often describe this dual focus as a tandem.
For example, most interventions described
at the primary and lower secondary level are
focused on engaging all students with science
and mathematics to increase numbers, including
under-represented groups, participating in
STEM in upper secondary and higher education.
Evidence can be found in the literature, for
instance, that ‘science for all’ types of programs
provide a superior preparation for advanced STEM
training (see Smith & Gunstone, 2009).
The need to provide STEM for all and enhance
high achievement in STEM is repeatedly
emphasised in country strategies, especially
in the high achieving East Asian polities such
as Korea, China and Singapore. It is part of the
Russian tradition, where all students study
mathematics to the end of school and there
are special science schools and numerous
mathematics and science ‘battles’ (competitions).
It has been a strong theme in the policy rhetoric
of Japan, though undercut by an enhanced
71
role for choice and reductions in content-based
learning in the two decades before 2008. Japan
maintains high achievement streams such as
super science high schools but science and
mathematics are no longer compulsory to
the end of senior secondary school. In Taiwan
students continue with an integrated science
for all curriculum until the end of year 11 before
tracking between STEM and non-STEM programs.
Taiwan is one of many school systems where the
dual objectives are managed sequentially rather
than simultaneously. In principle it is possible to
maintain both objectives until the end of senior
secondary school or even the end of the first
degree, at the price of restrictions on student
choice, and the study of other disciplines.
The reports thus demonstrate the need to tackle
the problem at ‘both ends’ – increasing the pool
of students coming through the STEM pathway,
and paying special attention to STEM-enthusiastic
Key Finding 5.1: Broadening STEM engagement and achievement
In all strong STEM comparator countries,
broadening STEM engagement
and achievement entails improving
participation in the STEM disciplines
through ‘T’ policies (i.e. learning in both
breadth and depth) and covering the full
spectrum of prior student achievement
levels. In particular:
• Provision of at least some discipline-
based STEM learning for all school
students, up to and including students
in senior secondary education.
• Improving the engagement and
performance of students from groups
currently under-represented in STEM,
that on average perform relatively
poorly in mathematics and science.
• Lifting the size and average
achievements of the group of
students engaged in intensive
STEM learning in depth, in both
schooling and higher education.

72
students through a more concentrated STEM
experience. Within this however, there are quite
different cultural presumptions operating in Asia
compared to the west, concerning the nature
of STEM-talented individuals. The China report
emphasises the profound belief in Chinese
societies that excellence comes through effort
rather than innate talent, so that the process of
selection of talented STEM students presumes a)
that this achievement occurs through effort and
that b) all students are capable of high quality
work, compared to more individualistic western
cultures where the selection mechanism is
thought of as identifying innate talent.
This belief in effort as the pathway to academic
success, and that most if not all students are
capable of high level work, is consistent with
research in Australia and elsewhere on strategies
to build resilience and optimism concerning
student engagement with mathematics. Students
often lock in early lack of success in solving
mathematics problems as an essentialised
lack of capability, whereby failure is reinforced
through repeated instances. Strategies are
being successfully explored to build optimism
and resilience in problem solving in students
who may otherwise identify as untalented and
unsuccessful in mathematics.
If Australia is to produce a strong STEM educated
populace, and lift our PISA and TIMSS rankings,
serious attention needs to be paid to currently
low scoring populations of students (low SES,
indigenous). The drift towards fragmentation of
the education system with the concentration
of STEM students in high SES public and
private schools to the detriment of these
under-represented groups, is at odds with the
overwhelming thrust of these country reports
that emphasis wide community participation
with STEM and science and mathematics for
all students. The Asian countries offer a model
for attending to the involvement of students
from all SES levels. There are notable examples
of attention to indigenous education in the
Canadian, the United States indigenous reports,
in the New Zealand report, and in other reports
such as the Brazil and South African reports.
Irrespective of the logic of country comparisons
in the PISA and TIMSS tests, the fact that 30 per
cent of science and mathematics students in
a developed country like Australia are scoring
below levels of minimal competency (level
3) in science and mathematics is cause for
considerable concern. Much of the lower scoring
cohort is associated with disadvantaged, low SES
school populations, and there is a need to focus
attention on these students for reasons of equity,
and for the practical reason that they represent a
potential source of STEM expertise.
In metaphorical terms, we need to lift the level
of the peaks of the STEM mountain range, and
broaden and elevate the whole of the range at
the same time. Framing Australian STEM policy
around the need for (a) a highly educated and
innovative STEM workforce, and STEM talent
capable of high end creative achievement and
innovation and (b) the need for all students to
have STEM knowledge and skills, suggests a
comprehensive set of initiatives, with several
concurrent objectives:
• The need to strengthen high-end STEM
cohort size and capability, and as part of that,
to pay special attention to STEM-enthusiastic
students by providing a more concentrated
and more exciting STEM experience;
• Related to that, the need to secure more
retention of high achieving year 11 and 12
STEM students at the higher education stage;
• The need to increase the size of the pool of
students coming through the STEM pathway;
and specifically, the need to increase the
proportion of senior secondary students
doing mathematics and one science subject.
One possibility is mandatory mathematics till
the end of year 11 or year 12 of secondary
school. Compulsory science is also possible;
• The need to elevate and universalize
educational performance in disadvantaged
schools and communities and through that
to lift the STEM potentials and performance
in such schools. If the aim is STEM for all, then
this means ‘every school a good school’, and ‘a
good STEM school’;

73
• The need for effective remedial programs,
especially in relation to mathematics;
• The need for appropriate adult education
programs to popularise science and
technology and enhance literacy in those
domains. Here science lends itself more easily
to lifelong learning than does mathematics.
This suggests that it is essential to both
universalise maths achievement at school
stage, as far as possible, while creating viable
‘second chance’ STEM pathways.
Different societies bring different assumptions
to bear on this dual focus: lifting the peaks and
elevating the broad mountain range at the
same time. East Asian notions of STEM-talented
individuals differ in some respects from those
in English-speaking nations. The China report
emphasises the profound belief of Sinic societies
that excellence comes through effort rather than
innate talent, so that the process of selection
of talented STEM students presumes that this
achievement occurs through effort, and that all
students are capable of high quality work. This
contrasts with the more individualistic notion
that the selection mechanism identifies innate
talent. Yet the Sinic belief that effort is the
pathway to academic success, and that most if
not all students are capable of high level work,
is consistent with research in Australia and
elsewhere on strategies to build resilience and
optimism concerning student engagement with
mathematics. Students often lock-in early lack
of success in solving mathematics problems
as essentialised lack of capability. Failure is
reinforced through repeated instances.
The front line solution is to build optimism
and resilience in problem solving, in students
who may otherwise identify as untalented and
unsuccessful in mathematics. A secondary
strategy is to enhance remedial programs in STEM
disciplines, especially mathematics; possibly
making these available in community education
for adults as well as in schools and tertiary
education. France and Singapore appear to have
developed effective remedial approaches to STEM.
Arguably, the positioning of STEM disciplines as
the premier device for identifying innate talent,
and assigning privileged pathways to the bearers
of talent, corrupts the potential for STEM for all.
STEM imagined and practiced solely as the high
ability/high performance/high ambition track
is the death of universal science literacy. This
approach forces a tradeoff between the two parts
of the dual strategy. If Australia is to produce
a strong STEM educated populace, and lift our
PISA and TIMSS rankings, serious attention needs
to be paid to currently low scoring populations
of students (especially low SES students, and
indigenous). But the present fragmentation
of the Australian education system, with the
concentration of STEM students in high SES
public and private schools, to the detriment
of under-represented social groups, is at odds
with the overwhelming thrust of the reports
commissioned for this project. They are clear in
coupling broad-based STEM achievement with
a stronger high performance track.
The structuring of the curriculumThe relationship between high achievement-
focused programs, and STEM for all, has
implications for the structuring of the curriculum.
The relationship is handled in different ways
around the world. In many systems that
emphasise wide community participation
and science and mathematics for all students,
educational professionals work very hard to break
down the barriers to universal STEM achievement.
The East Asian countries offer models for
involving students from all SES levels. There are
notable examples of attention to indigenous
education in the Canadian and the United States
indigenous reports, in the New Zealand report,
and in the Brazil and South African reports.
Finland assigns its best teachers to the low
achieving students and schools, enabling it to
pursue excellence and inclusion at the same time.
This approach depends on good resourcing. In
countries that invest in education as a proportion
of GDP at the level of the OECD average or below,
or where GDP per head is modest, policy makers
are more likely to face trade-offs between STEM
inclusion and STEM excellence.

74
Most European and Asian countries have
a defined ‘sciences’ strand as one of a few
options, rather than a smorgasbord of subject
options, attracting between 30 per cent and 50
per cent of students. The advantage of this is
the creation of a sizeable population of STEM
focused students. The disadvantage is the lack of
flexibility in choice, and the creation of a sizeable
proportion of the school population with no
senior science or mathematics. It is difficult to
discern a clear pattern that links these broader
subject grouping choices with participation
levels in the sciences, but in the United Kingdom
policy on creating opportunities for greater
science specialisation at Graduate Certificate
of Secondary Education (GCSE) level has led to
greater participation at the tertiary stage.
The patterns of choice in a country reflect a
history of subscription to particular views of
disciplinary education and the appropriate
degree of specialisation at the senior school
level. The Australian system has grown up
around maximising choice of subject offerings,
and a relaxing of pre-requisites to delay choice.
The disadvantage of this is that students can
choose away from challenging subjects. There
are no ready models in the consultants’ reports
that could be adopted unchanged, but the
strong commitment in most other countries to
disciplinary depth and coherence signals a need
to look carefully at trends in subject choice and
the quality of content-based learning in Australia.
Five possible kinds of structural change have
been identified flowing from these findings,
which could develop further the reach and
educational effects of the STEM disciplines and
extend and intensify their social and economic
contributions to Australia. These structural
changes can be considered independently
of each other, and they could not all be
implemented at the same time: indeed, the first
and third are contradictory. These structural
changes have varied implications for on one
hand lifting high achievement STEM, on the other
hand STEM for all. These options are suggested
by consideration of the experience of comparator
countries, as described in the consultants’ reports.
i. STEM tracking: A firm and possibly early
bifurcation between STEM and non-STEM
tracks, as distinct from a comprehensive
curriculum in secondary education. This may
strengthen high achievement STEM and
broaden the size of the STEM cohort, at the
cost of the universal ‘science for all’ approach;
ii. Academic and technical-vocational institutions:
The development of a strong group of STEM-
heavy technical and vocational schools
and tertiary institutes, alongside academic
secondary schools and universities (the latter
also including some STEM);
iii. An integrated secondary curriculum: A less
specialised and more integrated upper
secondary curriculum, more comprehensive
of the disciplines, in which all students
would pursue mathematics, science and
humanities. This would strengthen ‘science
for all’, and it may broaden the intellectual
formation of high achievers;
iv. Mandatory STEM in years 11 and 12: Related
to strategy 3, or separately from it, the
possibility of mandatory mathematics and/
or science to the end of senior secondary
school or to year 11 inclusive;
v. A broader role for degree programs in
engineering: A broadening of the role of
engineering degrees in the professional
labour markets, together with an expansion
of the number of higher education students
studying engineering and technologies.
These five possible structural changes will now
be considered in turn.
i. STEM tracking
In some countries the upper secondary
curriculum, or middle and upper secondary
curriculum, is divided into firm STEM and non-
STEM tracks. In those circumstances the STEM
track normally enjoys higher prestige and is
populated by a disproportionate share of the
high achieving students.
In China, students track between a predominantly
science and predominantly non-science
curriculum in the last three years of secondary
school. In total 55 per cent of applicants to the

75
higher education entrance examination, the
National College Entrance Examination (NECC),
choose the science and engineering division of
the test. As a result more than half of students
enrolled in bachelor degrees are likewise
in STEM related fields. In 2010 first-degree
enrolment shares were engineering (31.6 per
cent), science (9.8 per cent), medicine (6.3 per
cent) and agriculture (1.8 per cent). Likewise in
Japan students choose between a science track
that emphasises science and mathematics, and
a humanities track that emphasises Japanese
and social studies. Unlike the situation in
China, more students choose the humanities
path. In Korea students attending general
high schools choose between a humanities/
social sciences track, and a natural sciences/
engineering track. However, other students are
enrolled in specialist high schools that focus
on either science, foreign languages, art, or
vocational training. In Taiwan students track
between STEM and non-STEM curricula at year
12, a year later than their counterparts in China.
Most Western European countries have bifurcated
senior secondary education with large numbers
of students – typically about half of the age
cohort – enrolled in secondary vocational
institutions or streams. Vocational tracks tend
to be STEM-heavy and practical in orientation,
though not all fall into the former category,
and feed into vocational tertiary institutions.
Switzerland has a plethora of vocational options.
In France the main academically-oriented
upper secondary level pathways are divided by
discipline grouping. Students may choose one
of three tracks: science, economic and social
sciences, or literature. Beyond this, the options
are very limited, though recent reforms expanded
student choice somewhat. Another European
country with this model is Russia, where senior
secondary students undertaking general
academically oriented programs are channelled
through discipline based tracks/streams/profiles:
a physics and mathematics profile, and socio-
economics profile. This ‘profile’ based curriculum
is not implemented in all senior secondary
institutions. There are other kinds of schools that
have specific streams. In addition to general high
schools, there are gymnasiums that focus on
humanities, and lyceums that focus on technical
and scientific subjects.
General education in the United Kingdom also in
effect provides a discipline-streamed curriculum.
General high schools offer a range of year 12
subjects from which students have significant
choice. However, they end up specialising in either
science or the arts/humanities. While it is not
compulsory, specialisation is both recommended
and encouraged through timetabling.
In Australia a strong STEM track could strengthen
the number of students enrolled in rigorous
learning in mathematics and sciences, and
broaden the pool of students with knowledge
foundational to STEM-based programs in higher
education, potentially boosting STEM numbers in
both senior secondary and higher education.
At present separated institutional and curriculum
tracks play a modest role in Australia. There are
school-based apprenticeships and VET in schools
programs within academic schooling, many
of which have some STEM components. Some
students spend the years 15-18 in VET rather
than schools and higher education, not all in
STEM programs. Arguably, however, the principal
specialist STEM strand is created by the pre-
requisites for entry into science-based programs
in higher education (though as noted, the role
of science and mathematics pre-requisites has
diminished in recent years), and by the scaling
systems used to collate results in the final
secondary school examinations. These scaling
systems boost the scores of students undertaking
STEM disciplines, such as the harder mathematics
subjects, physics and chemistry, to compensate
for the increased competition for marks in
these subjects because of the selective cohorts.
Students with medium to high performance
in the STEM disciplines are protected in the
competition for university entrance. As noted,
this produces a concentration effect, with
clusters of high performance STEM students in
the leading private schools and selective public
schools. The best STEM teachers also tend to
concentrate in those schools, whose students
mostly come from affluent families.
Thus Australia constitutes a high performance
STEM cohort. However, as noted, the STEM

76
disciplines function also as a privileged route to
the most sought after university courses (and a
means of reproducing the educational and social
advantages of upper middle class families). STEM’s
role in social selection tends to overshadow
disciplinary learning. Many students use STEM to
secure entry into sought after places in medicine,
law and business education, not engineering or
science. Most of those enrolling in law or business
then move away from STEM at university. The
tension between STEM as high performance
disciplinary formation and STEM as elite track for
university entry and social advantage shows itself
also in other systems, like China, where STEM is the
best route to the top universities.
The other downside of STEM tracking is that it
tends to narrow intellectual formation. It could be
argued that a balanced and inclusive curriculum
which includes all of science, mathematics,
language and humanities is a better preparation
in many ways. It might be better to ensure that all
secondary students do at least some high quality
STEM work, while none enroll in a curriculum
which is almost entirely STEM-based. Then all
would be at least moderately well prepared for
the full range of possible higher education and
vocational programs (and probably would be more
rounded and more creative and socially skilled
people). However, if STEM-destined secondary
students took one mathematics subject instead
of two, and one science subject instead of two,
university programs in the STEM-based areas
would have more work to do on foundations.
These issues need thought and wide discussion.
ii. Academic and technical- vocational institutions
As well as tracking between STEM and non-
STEM, most countries track between academic
and technical-vocational sectors in secondary
and/or tertiary education. This is especially true
in countries with strong manufacturing sectors
and/or technologically-based services. While this
sectoral divide is not identical to the STEM/non-
STEM distinction within a single school sector,
the secondary-technical sector is usually a STEM-
heavy sector with a focus on applied engineering
and related knowledge and skill. The key is to
resource the secondary-technical sector properly,
with advanced teaching and equipment. Given
that there is a STEM track within the academic
stream, the overall outcome is a stronger overall
level of participation in STEM, with a diversity of
skills and approaches matching different STEM
and STEM to work pathways.
Secondary vocational education
Countries with strong secondary-technical
sectors include Germany and Singapore. Korea
has vocational high schools, which have played
an important role in training people for growing
Korean industry, and strengthening these schools
is an important priority in government; though
as the consultants’ report indicates, these schools
suffer somewhat from lower status in Korean
society. Japan has struggled to give technological
education enough status, though its technical
institutions have a reputation for being flexible
and inventive. In Taiwan the senior secondary
vocational schools are important, enrolling
almost as many students as the academic high
schools. The consultants’ report notes that: ‘Since
these vocational schools mainly offer subjects
related to technology, the vocational students
are also a potential source of STEM manpower’. In
2010 just under 80 per cent of all graduates from
vocational schools went on to higher education.
The corresponding proportion from academic
high schools was about 95 per cent. A feature of
Korea, Singapore and Taiwan is the status given to
STEM work in technical-vocational institutions and
the possibility of articulation between these and
academic study pathways. The technical-vocational
institutions are an important source of STEM
professionals, often at a high level of expertise.
The OECD provides comparative data on
participation in STEM in upper secondary
vocationally oriented study. Just over 64 per cent
of all male upper secondary level vocational
graduates in Australia in 2010 were in STEM fields,
including sciences, engineering, mathematics,
statistics and computing. This is essentially the
same as the OECD average at just under 64 per
cent. A further 5 per cent of Australian males at
this level choose studies in health and welfare
fields. A greater proportion of young males chose
STEM fields at this level of education in countries

77
like Korea, Norway, Argentina and Finland.
International comparison of the proportion of
Australian young women in upper secondary
level vocational education choosing studies in
STEM fields shows poor levels of participation.
As few as 6.5 per cent of female upper secondary
vocational students graduate from STEM fields,
while the OECD average is twice this number
at 12.2 per cent. In contrast, 51 per cent is the
comparable figure for Korea. A further 35 per cent
of young Australian women graduate from health
and welfare studies at this level of education,
compared to figures for the OECD average and
Korea of 21 per cent and 6 per cent respectively.
It is important to note that the international
differences in participation here may be as much
a product of the kind of courses that can be
studied at this level within the system as the
choices of the participants.
Figure 9: The distribution of male upper secondary and vocational graduates by field of education
Esto
nia
Turk
ey
Kore
a
Pola
nd
Norw
ay
Hung
ary
Arge
ntin
a
Slov
enia
Czec
h Re
publ
ic
Finla
nd
Spai
n
Aust
ralia
Swed
en
OECD
Ave
rage
Switz
erla
nd
Aust
ria
Fran
ce
Icela
nd
EU21
Ave
rage
Slov
ak R
epub
lic
Denm
ark
Germ
any
Japa
n
Neth
erla
nds
Belg
uim
Irela
nd
100
90
80
70
60
50
40
30
20
10
0
Source: OECD 2012a, Education at a Glance 2012: OECD Indicators, OECD Publishing, Paris.
Health and WelfareOtherSTEM (Including Sciences, Engineering, Mathematics, Statistics and Computing)
Figure 10: The distribution of female upper secondary and vocational graduates by field of education
Kore
a
Arge
ntin
a
Turk
ey
Esto
nia
Hung
ary
Pola
nd
OECD
Ave
rage
Finla
nd
Norw
ay
Czec
h Re
publ
ic
Swed
en
Switz
erla
nd
Slov
ak R
epub
lic
EU21
Ave
rage
Japa
n
Aust
ria
Germ
any
Slov
enia
Spai
n
Icela
nd
Aust
ralia
Denm
ark
Fran
ce
Belg
uim
Neth
erla
nds
Irela
nd
100
90
80
70
60
50
40
30
20
10
0
Source: OECD 2012a, Education at a Glance 2012: OECD Indicators, OECD Publishing, Paris.
Health and WelfareOtherSTEM (Including Sciences, Engineering, Mathematics, Statistics and Computing)

78
Arguably vocational education and training in
Australia is poorly resourced and overshadowed
in status terms by the academic stream, aside
from the trades course which continue to attract
some strong students. This does not stop VET
from playing a significant role in many industries
and communities. Progression from VET to higher
education is not as strong as many would like,
though the principal function of VET is less to feed
into higher education than to offer distinctive
pathways through education and into the labour
markets. The growth of degree programs within
VET may help to close the status gap between
VET and higher education though it might also
enhance status differentiation within VET.
Tertiary vocational education
Most European countries provide vocational
tertiary sectors. Germany has universities
of applied sciences, the world-famous
fachhocschulen. The Netherlands provides
HBOs, Finland polytechnics and Sweden higher
vocational colleges. One limitation, however, is
that the vocational track has a limited association
with research work in STEM. In Taiwan there
are two kinds of university, comprehensive
and technical, and in that system technical
universities are involved in applied research. The
consultants’ report states:
Technical universities were upgraded from
technical colleges in 1990s. Universities of
technology recruit students mainly from
vocational high schools, and they are also
allowed to enrol graduates from traditional
academic high schools. As a result of the
upgrade, technical universities have a similar
structure to general universities and offer
degree programs from Bachelor to PhD.
They are responsible for basic and advanced
science-technology education. For basic
science-technology education, the aim is
to train qualified technologist for various
industries. The curricula are designed to
teach the student science-related knowledge
and mathematics theories, and students
are required to manipulate sophisticated
machines, equipment and apparatus or to
manage complex production processes. They
can obtain a Bachelor degree after completing
the course. For advanced science-technology
education, the aim is to cultivate engineers.
In the curricula, in addition to the advanced
science and mathematics theories, students
are also required to acquire advanced
knowledge of a special technical field and
management. This kind of program will last
two years and grant a Masters degree when
the student graduates.
Technical universities in Taiwan have
developed explicit goals to complement the
general university. ... In order to cultivate
application-oriented talents, teaching and
learning in technical universities focus on
practice rather then theory. In general,
students studying at technical universities
in Taiwan receive vocational training …
which emphasises practical knowledge
and skills. The curricula are designed to be
student-oriented and enterprise-oriented.
The teaching plans are jointly developed by
teachers, enterprise staffs and graduates.
The majors and curricula are adjusted
according to the analysis of market demands.
Adaption to the society, and sustainable
development of the capacity of students are
highly valued [outcomes] … Many technical
universities have adopted sandwich programs
containing practical training to help their
students acquire professional know-how…
The implementation of sandwich programs
at a university may consist of a half-year or
a full year in a company. Basically, learning
alternates between school and factory… Like
the general university, technical universities
in Taiwan also place considerable attention
in the cooperation with industry. As a result
of the close relationship with enterprises,
students are trained in necessary skills for
employment and when they graduate, they
are easily employed. Experienced technical
staff in different enterprises comprise a large
proportion of teaching staff in technical
universities. They … not only possess high
qualifications but also have extensive practice
experiences, and they clearly know the
exact demands of enterprises. Moreover,
cooperation with industries enhances the
research ability of technical universities.

79
The major funding of technical universities
comes from enterprises and universities
encourage their teachers to obtain funds from
enterprises by actively involving themselves in
market-oriented research.
iii. An integrated secondary curriculum
While tracking and institutional specialisation
offers one set of routes to possible strengthening
of STEM, a more comprehensive curriculum,
including mandatory STEM subjects provides
another. However, this would work against the
long-term trend to increased individualised
choice in secondary education.
In the last fifty years the upper secondary school
curriculum in Australia has moved towards an
increased scope for student selection of subjects.
English is the one compulsory subject in the
final two years of school. University prerequisites
have been reduced in number, further freeing
student choice. Students freely opt for subjects
they like doing, or subjects in which they excel,
or subjects which maximise their Australian
Key finding 5.2: STEM-specific tracking in secondary education
Many of Australia’s comparator countries
achieve strong participation in STEM
through bifurcation at secondary school
level between STEM and non-STEM tracks,
and vocational tracks leading to significant
STEM training. There may be benefits
in significant discussion in Australia
concerning the potential for, and the pros
and cons of:
• Firm bifurcation between a
comprehensive STEM track, and
a non-STEM track, in the final two
years of secondary education.
• Development of STEM-heavy technical
and vocational schools and tertiary
institutes, alongside academic
secondary schools and universities
(the latter also including some STEM).
Tertiary Admission Rank (ATAR) at the point of
university entrance. It is likely that overall, this
has led to some evacuation of the most difficult
mathematics and science subjects, despite
the fact that the scaling systems used in some
states enables students who do well in those
subjects to achieve high ATARs. There are other
concerns. The number of students doing foreign
languages is low and has reduced as a proportion
of the senior secondary cohort. More generally,
it can be argued that it would be intrinsically
desirable for all senior secondary students to
have knowledge of both STEM and the non-STEM
strands of learning, and for these students to
share a common educational culture, as they do
at year 10 and below.
A common comprehensive approach to years
11 and 12 might involve all students doing
English, mathematics to at least intermediate
level, at least one science subject, and a foreign
language. There might be two additional
subjects at year 11 and one at year 12, that
would be determined by student choice. This
approach would strengthen the goal of ‘STEM
for all’, though it may marginally weaken high
value STEM learning. STEM-focused students
would be limited to three possible science
and mathematics subjects rather than four as
at present. There would also be opportunity
costs for some other students who might prefer
a mix of subjects more strongly loaded in
favour of the humanities and social sciences.
Another possible approach – and one that
reconciles several of the options presented in this
section – would be:
• Year 11: An integrated program, whereby all
students complete compulsory mathematics,
science, English and a foreign language, plus
two more subjects of their choice;
• Year 12: A two track program, similar to that
prevailing in China, whereby all students
would complete compulsory English and
mathematics but would otherwise divide into
STEM-specific and non-STEM tracks.
However, issues of a common curriculum and
compulsory languages are beyond the ultimate
scope of this report. Our focus is on the STEM
disciplines. We will discuss only the possible

80
introduction of mandatory mathematics and/
or science in year 11, or years 11 and 12. Sub-
section iv. looks at this possibility in detail.
iv. Mandatory STEM in years 11 and 12?
The international picture
Up to the 1970s in Japan, high school students
who aspired to higher education were required
to take four science subjects: physics, chemistry,
biology and earth sciences. In 1982 the
Curriculum Guidelines were revised so that only
two science subjects were required, leading to
declines in the proportion of students doing each
science subject. The national universities require
just one science subject for students entering
humanities faculties. Many private universities
do not require any science for students entering
humanities, though they require Japanese and
English. Physics dropped from almost 90 per cent
in the 1970s to 20 per cent in the last decade. In
addition, revisions to the Curriculum Guidelines
reduced the mandated hours of learning in
science and mathematics subjects.
The Curriculum Guidelines of 1998 significantly
decreased the number of school hours of STEM
subjects in Japanese compulsory education.
Promoting the idea of ‘yutori education’ (‘relaxed
education’), designed to reduce the pressure of
intensive study and examination anxiety, while
enhancing students’ motivation to learn, the 1998
Curriculum Guidelines reduced the school hours of
mathematics and science curricula to approximately
150 hours for mathematics in primary education
and 50-70 hours for junior secondary mathematics
as well as primary and junior secondary science. The
contents of the curriculum were reduced by 30 per
cent and simplified.
These changes did not trigger any observable
increase in student motivation. The Japan
consultants’ report stated that: ‘Many families and
schools failed to take advantage of the flexibility
afforded through relaxed education policy to
promote creative and independent learning of
children. Instead, children and young students
filled spare hours playing computer games and
exchanging text messages’. Examination anxiety
did not disappear because schooling was still
used for social selection. But the level of learning
deteriorated. There was a decline in Japan’s
comparative performance in international tests
of student achievement, triggering the public
backlash known as ‘PISA-fright’, and a decline in
the proportion of students enrolled in the STEM
disciplines at university. Nevertheless, the study
hours dictated by the Curriculum Guidelines
for senior secondary education continued to
decrease up to the revision of the Curriculum
Guideline in 2008.
This revision saw a reversal of the ‘yutori
education’ approach. Mandatory content and
hours were increased, cutting off the choice to
Figure 11: Total study hours of mathematics and sciences in Japanese junior secondary education, 1958 to 2008
1958 1968 1977 1989 1998 2008
450
400
350
300
250
200
150
100
50
0
Source: MEXT, http://www.mext.go.jp/a_menu/shotou/new-cs/youryou/index.htm, and NIER (2005), http://www.nier.go.jp/kiso/sisitu/siryou1/2-02.pdf, cited in the Japan consultants’ report.
MathematicsSciences
385 385
290315
350
385
350
385
420 420420
385

81
opt out. The 2008 changes increased the study
hours of mathematics and science up to the
standard of 1988. The study hours of science
in junior secondary education were increased
by nearly one-third (95 hours). The content of
programs was also substantially increased.
In many countries students are required to
study mathematics to the end of year 11.
This happens in Australia’s closest and least
foreign country, New Zealand. After year 11
subject specialisation often tends to inhibit
compulsory curricula. There are very few
instances of compulsory mathematics to year
12 in European countries (though we note this
finding cannot be considered definitive without
further research). Russia has mandatory studies
of both mathematics and Russian till the end of
school. In Finland mathematics study is required
throughout upper secondary level schooling,
though students are given the choice between
studying basic or advanced level mathematics
curriculum within either a general/academic
program or a vocationally driven pathway in the
form of upper secondary level VET.
Mandatory mathematics is part of the curriculum
in some non-European countries. In Brazil,
although recent curriculum reforms created
more student choice, the study of mathematics
is compulsory through to the end of upper
secondary school. The curriculum includes
advanced level mathematical sub-disciplines/
knowledge areas. The report notes consensus
among policy makers that this practice should
continue. In China mathematics is a compulsory
subject all through school, as a part of the
general primary and lower secondary curriculum,
and then as a compulsory component of all
discipline grouping options offered to senior
secondary students. The position in Taiwan is
similar to but not quite the same as in China.
Mathematics is compulsory to year 11, then
students choose to spend their year 12 year
preparing for one of the two university entrance
exams on offer. Both of these include some form
of mathematics. The track with greater focus
on social science and language requires only
one general mathematics topic. In Japan and
Korea senior secondary students divide between
STEM and non-STEM tracks. In neither country
are students beyond year 10 required to study
mathematics at an advanced level.
In Israel high school matriculation from mainstream
high schools in Israel requires minimal mathematics
through to the end of year 12, but advanced
mathematics courses are optional. However,
a large proportion of Israeli students in PISA
do not meet minimum proficiency levels in
mathematical literacy. Reasons for this in
the consultant report include both that the
requirement is for only basic level study in
mathematics, not advanced. And also, Ultra-
Orthodox Jewish schools offer little or no
mathematics, diluting national proficiency averages.
Australia might have something to learn from
some other countries’ more stringent approaches
to STEM education, and also from the case of
Japan, which reversed its ‘dumbing down’ of the
STEM curriculum. We suspect that the increased
range of choices in Australian schooling, the
reduced role of science and mathematics
prerequisites in university entrance (and the
corresponding greater emphasis on score level
rather than content preparation), and thus the
ease of opting out of harder STEM subjects, are
associated with both the deterioration in the
proportion of the student cohort taking STEM
subjects and the deterioration in the proportion
of students doing the most challenging subjects.
If so too much choice has undermined both
STEM for all and high performance STEM. One
way to increase the proportion of students
doing STEM, while not compromising the rigour
of the STEM subjects taken by those who use
STEM to differentiate themselves from the pack,
is to introduce mandatory mathematics and or
science either to year 11 or 12. If this were to be
done there should be a companion commitment
to targeting mathematics curriculum and
pedagogy in the middle years to provide
enjoyable and rewarding learning experiences,
such that the groundwork was laid for extension
of mathematics into the senior years.
Current Australian requirements
As part of the senior secondary level national
curriculum recently developed by ACARA,
mathematics study to year 10 is a focal/
foundational area of study. The year 11 and 12

82
position is less clear at this stage. The mathematics
curriculum at this stage will be divided into four
alternative subjects that meet the differing abilities
and vocational needs of students. These are (from
least to most complex): Essential mathematics;
General mathematics; Mathematical methods;
and, Specialist mathematics. The Australian
Curriculum in mathematics, science and English
has been published for levels from Foundation
(reception) level to year 12. The Commonwealth
has negotiated implementation plans for F-10
Australian Curriculum with all States and Territories,
and the F-10 Australian Curriculum is progressively
being implemented around the country. The
process is not complete for years 11 and 12.
It should be noted that under the Australian
Constitution, the States and Territories have
authority for education, and so for senior
secondary certification. Negotiation with the
States and Territories regarding exactly what
parts of the new Australian Curriculum will
be incorporated in to their senior secondary
curriculum offerings is ongoing. And, even if the
states adopt the Senior Secondary Australian
Curriculum, they are responsible for determining
senior secondary certification requirements
which mandate which curriculum elements are
required for certification purposes.
In terms of current mandatory requirements for
senior secondary certificate requirements (in
addition to other requirements):
• New South Wales students must complete a
Board Developed Course in English to qualify
for the Higher School Certificate (HSC)
• Victorian students taking the Victorian
Certificate of Education (VCE) must include
English units; Victorian students taking the
Victorian Certificate of Applied Learning
(VCAL) undertake core studies in literacy,
numeracy and personal development (along
with a VET program and work placement)
• Queensland students undertaking the
Queensland Certificate of Education (QCE)
must fulfil literacy and numeracy requirements
• Western Australian students undertaking
the Western Australian Certificate
of Education (WACE) must meet
English language requirements
• South Australian students undertaking the
South Australian Certificate of Education
(SACE) must complete compulsory
requirements in literacy, numeracy and a
Research Project (SACE Board of SA n.d.)
• Tasmanian students undertaking the
Tasmanian Certificate of Education (TCE)
must meet five standards regarding literacy,
numeracy, ICT, participation and achievement
• Australian Capital Territory students
undertaking the ACT Year 12 Certificate
have no specific mathematics
or science requirements
• Northern Territory students undertake
an award based on the South Australian
Certificate of Education (SACE), and must
complete literacy, numeracy and planning
requirements (Keating et al, 2011).
As such, at least minimum numeracy
requirements for senior secondary certificate
purposes are in place for Victorian students
doing the VCAL (about 12 per cent of the cohort),
Queensland students doing the QCE, South
Australian students doing the SACE, Tasmanian
students doing the TCE, and Northern Territory
students doing the SACE. However, these
numeracy requirements do not imply mandatory
mathematics course participation, nor suggest
that participation in at least one Australian
Curriculum – Mathematics course will necessarily
be a compulsory requirement of the respective
senior secondary certificates (assuming at least
some States and Territories adopt some elements
of the senior secondary Australian Curriculum
– Mathematics). For example the Tasmanian
‘everyday adult mathematics’ standard currently
involves ‘using common maths knowledge and
skills to measure, solve basic problems, develop
budgets, collect survey information and interpret
it, and carry out calculations involving fractions
and metric quantities’ (Tasmanian Qualifications
Authority, n.d.).

Table 10: State and Territory populations and year 12 enrolments for 2004. Data from Barrington (2006), Tables 2A, 2B, 3A, 3B, 4
Column A: Number of
students in year 12
Column B: Number of students in Advanced
Mathematics (In NSW: Mathematics
Extension 1 and possibly Extension 2)
(note 1)
Column C: Students in
Intermediate Mathematics but not in Advanced
Mathematics (In NSW: Mathematics)
(note 2)
Column D: Students in Elementary
Mathematics Subjects
(In NSW: General Mathematics and Mathematics Life
Skills) (note 3)
Column E: Students not in
Mathematics (note 4)
NSW66279 9959 13306 30382 12632
100% 15.0% 20.1% 45.8% 19.1%
Vic49975 6293 12090 22759 8833
100% 12.6% 24.2% 45.5% 17.7%Qld 40592 3430 12887 21246 3029
100% 8.4% 31.7% 52.3% 7.5%WA 19792 1628 2655 12785 2724
100% 8.2% 13.4% 64.6% 13.8%SA 13324 1211 2134 3937 6042
100% 9.1% 16.0% 29.5% 45.3%Tas 4161 228 595 1340 1998
100% 5.5% 14.3% 32.2% 48.0%ACT 4098 488 1148 2156 306
100% 11.9% 28.0% 52.6% 7.5%NT 1390 45 198 543 604
100% 3.2% 14.2% 39.1% 43.5%
Totals199611 23282 45013 95148 36168
100% 11.7% 22.6% 47.7% 18.1%
Source: Coupland, M 2006, A critical analysis of selected Australian and international mathematics syllabuses for the post-compulsory years of secondary schooling, Report prepared for the NSW Board of Studies, Sydney, viewed 19 March 2013, http://www.boardofstudies.nsw.edu.au/manuals/pdf_doc/maths_st6_lit_curr_rev_pt1.pdf.
83
In fact, as illustrated by Coupland (2006), despite
the numeracy requirements established in several
senior secondary school certificates no states
have compulsory mathematics requirements
that involve 100 per cent of year 12 students.
Year 12 participation ranges from highest in
the Australian Capital Territory, where there
are no minimum numeracy standards, and
Queensland, and lowest in Tasmania (where there
are minimum numeracy standards). Arguably,
students who complete secondary school
without at least intermediate mathematics,
including calculus, probability and the
foundations of statistics, are effectively excluded
from a broad spectrum of occupations, and will
be increasingly disadvantaged over time because
of the growing use of creative digital applications
in many fields.
If STEM-specific prerequisites were to be
strengthened, this would shift the emphases
away from maximising student choice and
flexibility, and away from fostering competition
for the highest possible scoring student
regardless of discipline. It would enable greater
focus on optimising preparation in the disciplines
so as to lift the level of study in both senior
secondary and higher education.
We note also that if all students are to learn
mathematics to at least level 3 in year 11 or
year 12 in classes in which they are taught by
teachers trained in mathematics at university
level, this will require a substantial increase in
qualified teachers. This might require several
years to achieve, even if coordinated action is
implemented immediately.
In addition, any decision to increase the spread
and/or depth of mathematics or science learning
at years 11 and 12 stage has implications for
primary education and for junior and middle
secondary education. It is widely perceived that
in Australia there are deficiencies in primary

Key finding 5.3: Compulsion vs choice in senior secondary mathematics and science education
There is a concerning trend in the senior
secondary and undergraduate tertiary years
in Australia away from the sciences and
particularly away from advanced mathematics.
There is a range of structural elements in
the curriculum offerings of many of our
comparators strong in STEM that offer possible
models for consideration by Australia. Many
of these countries have a more stringent
approach to curriculum offerings, for instance
requiring the study of mathematics to Year 11.
An extension of mandatory STEM curricula in
senior secondary schools has opportunity costs,
by restricting student choice and engagement
in non-STEM subjects of educational value.
Nonetheless, there may be benefits in
discussion among the states, territories, subject
teacher associations, universities and relevant
science and mathematics organisations about
the pros and cons of possible reforms to senior
secondary education certificate requirements,
to enable one or more of the following:
• Including the study of mathematics (at
any level from Essential Mathematics to
Specialist Mathematics) up to the end of
year 11 – making mathematics compulsory
for everyone to the end of year 11.
• Including the study of mathematics (at
any level from Essential Mathematics to
Specialist Mathematics) up to the end of
year 12 – making mathematics compulsory
for everyone to the end of year 12.
• Including the study of mathematics for
all to the end of year 12, with standards
differentiated according to pathways.
For all students, including those taking
vocational pathways, the minimum
curriculum level required would be
equivalent to the Essential Mathematics
course from the Australian Curriculum.
For students to receive an Australian
Tertiary Admission Rank (ATAR) and go
to university, the minimum curriculum
level required would be equivalent to the
General Mathematics course from the
Australian Curriculum.
• Including the study of at least one
science subject up to the end of year
11 – making science compulsory for
everyone to the end of year 11.
• Including the study of at least one
science subject up to the end of year
12 – making science compulsory for
everyone to the end of year 12.
Key Finding 5.4: STEM-specific prerequisites for higher education
In a number of high performing countries
STEM subjects at upper secondary school level
are strongly linked to university entrance. One
way of lifting the level of study of STEM in both
senior secondary and higher education would
be the reintroduction of more comprehensive
prerequisite requirements for university
programs requiring advanced STEM knowledge,
optimising preparation in the disciplines.
mathematics learning and in primary teacher
training in relation to mathematics knowledge
(see chapters 10 and 11). If so, these would need
to be addressed in secondary school where many
mathematics (and science) classes are taken by
teachers with no tertiary mathematics (or where
relevant, science) qualifications. Senior secondary
and tertiary education can not be expected to
play a routine remedial role occasioned by gaps
in the provision of primary education.
v. A broader role for degree programs in engineering?
Section 4 noted that when comparing Australian practice with other countries, a relatively low proportion of first-degree higher education students are enrolled in engineering. Students commencing programs in engineering, manufacturing and construction constitute an average 15.0 per cent in tertiary education in the OECD, and 25.4 per cent in Finland, 23.8 per cent in Korea, and 15.7 per cent in Germany. The
84

proportion in Russia is 23 per cent. In Australia it is 8.7 per cent. The proportion commencing engineering and related disciplines in the United Kingdom (8.2 per cent) and New Zealand is even lower than in Australia. In contrast, Australian participation in health sciences and natural sciences is above the OECD average though the proportion of tertiary students entering mathematics programs is low (OECD 2012, p.358).
There are a number of possible reasons that may explain the relative position of Australia and of the other English speaking nations. In Australia aspirations of students at age 15 to enter careers in engineering or computing are below the OECD average, being 10.5 per cent for boys and just 1.2 per cent for girls compared to OECD averages of 12.4 per cent and 1.6 per cent respectively. However it is a feature of all nations, including the engineering-strong nations, that at age 15 years aspirations to enter work in science – typically shared by about a third of the cohort – are much stronger than for entering work in engineering (ibid, p.82). The deeper question is why in Australia more students do not transfer their aspirations from science to engineering, as the youthful glamour of science wears off a little, and students become more aware of the nature and potential of more prosaic engineering degrees.
Australia’s manufacturing sector is modest in size when compared with Germany or Korea. This constitutes one limit on the potential for professional work in engineering. However, the larger question is the role of engineering and related qualifications – whether these are seen as solely focused on professional engineering, or can function also as generic preparation for other occupations in the public and private sectors. It is likely that most prospective students would see the study of engineering as linked to professional practice, and this impression is reinforced by the close relationship between university engineering programs and professional engineers’ associations. In that context, while the profession remains male-dominated and there is a close nexus between university training and professional work, the male domination of the profession reproduces the male domination of enrolments in higher education, limiting the capacity of actions by the educational institutions to correct the historic gender imbalance.
Arguably, engineering provides a valuable
training in problem solving, design, practical
construction and project organisation, as well
as strong foundations in quantitative and spatial
techniques. Many graduates in engineering
in the engineering-strong countries, such as
Korea, Finland, Russia and Germany, enter jobs
in business and government. In the last three
decades in the English speaking countries there
has been a major expansion in the proportion
of tertiary students doing business studies.
The study of law has also expanded sharply
in Australia and now functions as generic
preparation for careers in government and
business, as well as the legal professions. It
may be that the nation would be well served if
engineering came to play a larger generic role
in professional labour markets. Such a change
may hasten growth in female participation. But
this would require a shift in the assumptions
dominant in tertiary engineering programs.
Key finding 5.5: Generic role of engineering degrees
Relative to our strong comparator countries
Australia has low participation in tertiary
engineering degrees. The participation of
women in these degrees is also low.
5.5.1 Tertiary institutions and the
professions in engineering and
the technologies might consider
ways and means of strengthening
the generic role of engineering
degrees in professional labour
markets, broadening the pathways
between the study of engineering
and employment in fields beyond
professional engineering, including
business and government. Such an
approach would have implications
for program design, marketing and
student counselling.
5.5.2 There is potential for strategies
designed to make engineering
more attractive as a generic degree,
especially for young women.
85

86
Attitudes to stem
The public and parentsThe consultants’ report on STEM in the United States notes that
according to studies conducted by the National Science Foundation,
the United States public expresses strong support for the value of
science and technology, though it has some ambivalence about
the quality of STEM education in schools. The consultants’ report
states that ‘Overall, an overwhelming 91 per cent of adults agree or
strongly agree with the claim that science and technology will result
in more opportunities for the next generation. There are gender
differences, however. Only 29 per cent of women “strongly agree”
with this premise’ compared to 41 per cent of men. Support for
science and technology is stronger among young people than other
age groups and not surprisingly, rises with the level of educational
achievement. At the same time ‘consistently 60-70 per cent of
respondents indicating some agreement with the idea that science
and math education is inadequate’. The consultants also report on
the American public’s handling of the respective claims of science
and religious faith. Essentially, both views of the world are strongly
valorised. In both respects the United States public contrasts with
some other nations, as Table 11 shows.

87
The United States consultants report sums up the
comparative position as follows:
On the one hand, the US seems most similar
to South Korea and China in that a large
percentage of their citizens believe in the
promise of science for improving our lives
and expanding opportunities for the next
generation. This sets it apart from Japan,
India and the European Union in the level of
agreement with those ideas. Conversely, there
is evidence that a majority of Americans believe
that we depend too much on science and not
enough on faith, which puts us ahead of all
others, spare South Korea, in this regard. Yet, we
also lead the group in our lack of agreement
with the notions that it is not important to
understand science for everyday life and in the
belief that science makes our lives change too
fast. In sum, Americans are at or near the top of
a number of countries in terms of their belief
in the importance of STEM and what it can do
today and will do in the future. The belief that
we do not depend enough on faith is deep-
rooted in the fabric of this country and is likely
not to change any time soon. However, this
does not mean that Americans reject science,
and they’re unique in this respect among the
sample of countries investigated.
Table 11: Percentage of respondents who Agree with statements about science, by country
StatementUnited States
(2004 or 2010)a
Japan (2001)
South Korea (2008)
China (2001 or 2007)b,c
India (2004)
Malaysia (2008)d
European Union (2010)
Promise of scienceScience and technology are making our lives healthier, easier and more comfortable
90 73 93 86 77 84 66
With the application of science and new technology, work will become more interesting
76 54 85 70 61 71 61
Because of sceince and technology, there will be more opportunities for the next generation
91 66 84 82 54 NA 75
Reservations about scienceWe depend too much on science and not enough on faith 55 NA 54 16 NA 39 38
It is not important for me to know about science in my daily life 14 25 30 17 NA NA 33
Science makes our way of life change too fast 51 62 73 73 75 66 58
NA = not available, question not asked or different response categories offered; S&T = science and technology.
a US responses to 2004 survey include “Science and technology are making our lives healthier...”, “With the application of science and new technology...”, “We depend too much on science...”, and “It is not important for me to know about science...” Responses to other items are from 2010 survey.
b China’s responses to 2001 survey include “Promise of science” questions and “We depend too much on science...” China’s responses to 2001 survey include “It is not important for me to know about science...” and “Science makes our way of life change...”
c Chinese respondents to 2001 survey were given different categories (Agree, Basically agree, Don’t agree, Don’t know), with neutral category.
d Malaysian question corresponding to “Science and technology are making our lives healthier, easier, and more comfortable” stated as “Science and technology improves the quality of our lives.” Question corresponding to “With the application of science and new technology, work will become more interesting” stated as “Our daily work will be more effecient with the use of science and technology.” Question corresponding to “It is important for me to know about science in my daily life” stated in a positive form as “We need to have knowledge about science in order to manage our daily lives”, Malaysian responses of agree and disagree reversed to make them correspond to negative form of statement asked by other countries.
Sources: United States: University of Michigan, Survey of Consumer Attitudes (2004) and University of Chicago, National Opinion Research Centre, General Social Survey (2010); Japan: Ministry of Education, Culture, Sports, Science and Technology in Japan (2002); Korea: Korea Foundation for the Advancement of Science and Creativity (formerly Korea Science Foundation), Report: Survey of Public Attitudes Toward, and Understanding of Science and Technology (2006), Korea Gallup; National Understanding of Science and Technology: Survey Report Results (2009); Russia: Gokhberg L and Shuvalova O, Russian Public Opinion of the Knowledge Economy: Science, Innovation, Information Technology and Education as Drivers of Economic Growth and Quality of Life, British Council, Russia (2004); China: Chinese Ministry of Science and Technology, China Science and Technology Indicators 2002 (2002); India: Shukla R, India Science Report: Science Education, Human Resources and Public Attitudes towards Science and Technology, National Council of Applied Economic Research (2005); Malaysia: Malaysian Science and Technology Information Centre, Public Awareness of Science and Technology: Malaysia 2008 (2010); and EU: European Commission, Special Eurobarometer 340/Wave 73.1: Science and Technology Report (2010).
Science and Engineering Indicators 2012.
Source: United States consultants’ report.

88
The Korea consultants’ report notes Korea poll data which suggest that ‘over the past decade, Korean people have increased their interest in science and technology. Their interest in new scientific discoveries and the use of new inventions and technology has gradually grown. The reasons for their interest include the relevance of science and technology to their daily lives, the acquisition of new knowledge, and media influence … [Comparative data suggest that] the level of Koreans’ interest in science and technology is higher than that of the Chinese, but still lower than those of Americans and the Japanese’.
However, the Korean consultants’ report notes that while ‘overall, Koreans have become more interested in STEM and consider it important for Korean society … they do not necessarily prefer to pursue STEM-related professions for themselves’. Doctors, government officials and teachers enjoy higher prestige than STEM workers. There are widespread perceptions that STEM careers are relatively insecure and do not pay well. The consultants link these perceptions to a partial retreat of high quality students from STEM studies. This underlines the point that positive public attitudes to science do not necessarily translate into high national participation and performance in the STEM disciplines in education.
Most consultants explicitly report that science and technology are valued by the public, in both the sense of public as media and public as community ‘grass-roots’, and by parents of school students. Overall social respect for STEM is high in China, Singapore, the United States and Israel; and in all these cases parents exhibit a high valuation of STEM. New Zealand reports ambiguous attitudes by parents, with support for science diminishing over the 2005-2010 period. The Israel consultants’ report raises the issue of an ultra-orthodox population in particular who do not participate in STEM education. On the other hand, in mainstream Israel there is strong support for science and innovation from families and a strong desire for students to move into science, engineering and medicine, linked to a history of research and development innovation.
The extent and distribution of these positive valuations of science and technology, the extent
to which they become expressed as explicit understanding of and valuation of the STEM disciplines, and the extent to which parents want STEM studies and STEM careers for their children, are more variable. These opinions matter. There are many points in the reports that indicate a strong influence of families, and public attitudes, on STEM participation.
Positive family attitudes to STEM affect student participation in a number of ways. The Chinese and Singapore reports emphasise parental involvement in children’s education through out of school tutorial provision. Out of school learning is a major factor also in Korea (especially), Japan and Taiwan. The Singapore consultants’ report focuses on parent committees supporting schools including involvement in arrangements for low SES, low mathematics achievers, and high levels of involvement in enrichment activities such as clubs or science and mathematics competitions.
The United Kingdom focus on informal education links with more broadly based initiatives on public engagement with science, acknowledging the role of families in influencing children through participation in informal science (mainly) and mathematics activities. A number of STEM initiatives in Europe (e.g. Pencil, reported in the Western Europe consultants’ report) involve schools linking with local communities, again acknowledging the importance of families. Family perspectives on STEM, and on education generally, influences students through role modelling of respect for such studies, and advice on potential careers. We note in passing that the research literature on STEM achievement also provides data on the impact of parental attitudes and involvement. Families’ ‘cultural capital’ correlates with students’ self-efficacy in relation to learning science and mathematics through the twin effects of high expectations, and modelling of STEM interest and career paths.
Parents, and educational institutions themselves, are also affected by what is happening in media, public opinion and the operations of social institutions outside formal education. The United Kingdom has developed a suite of initiatives around the education of the public, including media policy, and informal education.

89
In Australia interventions focused on families
have proven productive in two ways. First, the
family as a site for developing positive attitudes
to STEM. Students can be encouraged to orient
to STEM careers by providing families with
information about productive futures in STEM
professions. This may involve the provision
of resources to careers teachers, who then
disseminate those materials to families via
students, or it may involve direct contact with
parents through school events. Second, the
family as a pedagogical medium. There have
been a number of primary school programs
focused on families, including ‘family maths’
and ‘family science’ initiatives, whereby schools
organise activity nights in which parents and
children explore mathematics or science activities
together. Part of this is the design of science
and mathematics activities to do at home. Such
activities are especially important for families
without a history of professional participation in
STEM. There is scope to further develop the role
of families in mathematics and science education.
Parental attitudes help to shape student
participation in, and expectations in regard to,
STEM. But not all students have family support.
Not all have families. In those cases the role of
institutional education, including that of teachers,
becomes not just important but all-important.
Student attitudes
Patterns of student response
There is a negative correlation between student
attitudes to STEM learning and a countries’
index of development. This relationship shows
up in a number of comparative studies in the
research literature, and is discussed in a number
of these reports. The graph at Figure 12, from
the Relevance of Science Education (ROSE) study
(Sjøberg & Schreiner 2010) illustrates the negative
correlation. This underlines the challenge in
advanced post-industrial societies such as
Australia, of engaging students with science–
related subjects and STEM futures. One reason
is the wider set of options generally available to
contemporary youth in these societies. Another is
Figure 12: Data from the ROSE study showing students’ responses to the question ‘I like school science better than most other school subjects’. Percentage answering Agree or Strongly Agree, by gender
UgandaGhana (Centr)
LesothoSwazilandZimbabweBotswana
PhilippinesBangladesh
India (Guj)India (Mumb)
MalaysiaTrinidad & T.
TurkeyGreece
PortugalSpain (Bal)
Russia (Kar)Poland
Czech RepublicLatvia
EstoniaSlovenia
AustriaGermany
IrelandScotland
N. IrelandEngland
JapanFinlandIceland
SwedenDenmark
Norway
Source: Sjøberg, S & Schreiner, C 2010, The ROSE Project: An overview and key findings, Naturfagsenteret, Oslo.
0 20 40 60 80 100
Female Male
student perceptions of mismatch between what
they see as STEM professional futures, and their
own developing identities. It seems that we need
to do more to engender interest in STEM-related
careers than once was the case, particularly in
relation to girls.
The trend of declining attitudes to mathematics
and science with age, from primary through the
secondary school years, is described in many of
the consultants’ reports and is well documented
in the literature. This means that policy attention
should be focused across the entire education
spectrum. There are many examples in the
reports of initiatives at primary school stage, as
well as initiatives directed at enhancing STEM
participation in higher education, and STEM

90
research and development interventions. In
Western Europe and the United Kingdom, the
United States and Japan, considerable attention is
paid to primary school mathematics and science.
In Australia there has been growing realisation
of the importance of the primary and lower
secondary years in determining students’
intentions to continue or not with STEM-related
subjects and careers. There is considerable
evidence that student experience and developing
intentions through these years are strongly
indicative of their eventual choices (Tytler et al,
2008). The implication of this is clear – that if we
are to help students to keep open the possibility
of STEM subjects and eventual career choice, or
even to encourage them to engage productively
with science and mathematics as citizens, then a)
the mathematics and science experiences prior
to the early middle years of schooling need to
be positive and engaging, and b) students need
to be made aware of the range of people and
activities comprising STEM work in society.
Comparative Australian data on attitudes
Data from the TIMSS international testing on
student attitudes to mathematics and science
show two things. Firstly, student attitudes are
linked to performance. In any single country, and
in all countries taken together, more positive
attitudes are predictive of higher achievement
scores (see Table 12a). The data show that in both
Tables 12A and 12B: Data indicative of Australian students’ attitudes and consequent achievement scores in TIMSS international assessment of student achievement
Table 12A Like science Somewhat like science Do not like sciencePercentage of students
Average achievement
Percentage of students
Average achievement
Percentage of students
Average achievement
Year 4 TIMSS 2011International Average 53 504 35 469 12 461
Australia 55 529 31 506 14 496Year 8 TIMSS 2011: ScienceInternational Average 35 515 44 472 21 450
Australia 25 559 42 521 33 490
Table 12B Like science Like Mathematics
Percentage of students
Average achievement
Percentage of students
Average achievement
Year 4 TIMSS 2011International Average 53 504 48 509Australia 55 529 45 535US 56 555 45 552Ontario 48 537 35 533England 44 535 44 548Hong Kong 52 551 47 619Chinese Taipei 58 564 34 613Korea 39 604 23 627Year 8 TIMSS 2011International Average 35 515 26 504Australia 25 559 16 553US 29 555 19 536Ontario 29 543 26 546England 32 562 14 548Hong Kong 28 561 19 635Chinese Taipei 17 618 14 681Korea 11 623 8 677
Source: Mullis, IVS, Martin, MO, Foy, P & Arora, A 2012a, TIMSS 2011 International Results in Mathematics, International Association for the Evaluation of Educational Achievement, Boston; and Mullis, IVS, Martin, MO, Foy, P & Arora, A 2012b, TIMSS 2011 International Results in Science, International Association for the Evaluation of Educational Achievement, Boston.

91
mathematics and science Australian students’
attitudes at 4th grade are comparable to the
international average, but that by 8th grade the
proportions of Australian students who ‘like’
mathematics and science have fallen well below
that international average. However, this must be
seen in the context of the generally less positive
attitudes to science in developed countries,
described above in Figure 12. A comparison with
attitudes of our closest comparator countries,
and high performing Asian countries, in Table
12b, shows Australian students’ attitudes higher
than those in Chinese Taipei and Korea, broadly
comparable with those of the United States,
Ontario and England, but lower than particularly
England in science, and Ontario in mathematics.
Data from a PISA survey of 15 year-old student
expectations of science and engineering careers
provides a proxy for student choices. According
to the survey results, 33.5 per cent of 15 year-old
Australian students expect to undertake science
Figure 13: The percentage of participating 15 year-old students expecting a career in a science, engineering or computing field
Brazil United States
Canada Argentina France Australia OECD Average
New Zealand
Denmark United Kingdom
Germany Japan Finland Korea
50
40
30
20
10
0
Source: OECD 2012a, Education at a Glance 2012: OECD Indicators, OECD Publishing, Paris.
Percentage of 15-year-olds planning a science-related career
Percentage of 15-year-olds planning a career in engineering and computing (not including architects)
Denm
ark
OECD
Ave
rage
Aust
ralia
Cana
da
Unite
d Ki
ngdo
m
Kore
a
New
Zeal
and
Unite
d St
ates
Germ
any
100
80
60
40
20
0
Source: OECD 2010e, Expectations for science-related careers by gender, OECD Factbook 2010: Economic, Environmental and Social Statistics, OECD Publishing, Paris.
Figure 14: The percentage of participating 15 year-old students expecting a career in a science, engineering or computing field by gender
Computer sciences and Engineering: Males
Computer sciences and Engineering: Females
Denm
ark
OECD
Ave
rage
Aust
ralia
Cana
da
Unite
d Ki
ngdo
m
Kore
a
New
Zeal
and
Unite
d St
ates
Germ
any
100
80
60
40
20
0
Health science and Nursing: Males
Health science and Nursing: Females

92
related careers before the age of 30, near the
OECD average of 33.2 per cent, but below the
proportion expecting this future in countries
including Brazil, the United States, Canada and
France. Only 5.8 per cent of 15 year-old students
in Australian schools expect to be in engineering
or computer sciences related careers, compared
to the OECD average of 6.9 per cent, and 9.4 per
cent in Brazil and 9.0 per cent in Japan. This lack
of awareness of or commitment to engineering
as a course option was discussed in section 4.
There are clear gender differences in expectations
about STEM careers. Only 26 per cent of 15 year-
old Australian males expect careers in health
science or nursing, compared to 71 per cent of
females. In total 46 per cent of males are planning
careers in engineering or computer science fields,
compared to only 8 per cent of females.
The detailed patterns of student attitudes to
science and mathematics are complex and
highly contextual. As noted in the United States
consultants’ report, the wording of attitude
surveys can be crucially important in framing
student response. There are differences in
attitudes of students towards science, and
towards school science. There are differences
between ‘liking’ science or mathematics and
intending to continue in these subjects. There are
variations in attitudes to the different sciences
and to different science-related futures. The
Korean consultants’ report describes negative
social attitudes towards engineering as a
profession. Medicine is accorded higher status.
The Chinese consultants’ report describes the
high status of theoretical knowledge and respect
for teachers as fundamental values in countries
with a Confucian heritage. While the broad
patterns of attitude shifts are apparent, and
tend to be shared across borders, the contextual
details must be noted.
Making sense of student attitudes to science
The literature review: Student identity related
to STEM subject choices and career aspirations
makes the point that the literature on attitudes
to science is gradually being supplanted
by the identity construct, which is a more
powerful way of looking at the factors affecting
student commitment or otherwise to STEM.
An individual’s identity is both fluid and multi-
faceted, constructed in interaction with many
social and cultural factors such family and friends,
feelings of competence, and interest. “Am I the
sort of person who is curious about the natural
world?” “Who do I want to become?” These are
questions central to identity. It has been argued
that taking on board the scientific world-view,
including values, involves for most students
an identity shift that must be negotiated.
The identity construct can be powerful in
investigating the issues associated with
indigenous people learning science, and also
the experiences of other minority groups, low
SES students, and girls. Identity helps us to make
sense of the different and particular strategies
needed to support the variety of students in our
classes to engage with and value science and
mathematics. The identity perspective on STEM
participation supports:
• An emphasis on role models, whereby
students are introduced to people
working in and enthusiastic about
STEM, with whom they can relate;
• Curriculum diversity to cater for many
students, so that STEM ideas and
practices are seen as sufficiently varied
to allow for individual commitments;
• The explicit inclusion of values in
the curriculum, so that technological
objectivity and determinism is not seen
as defining of STEM, but social good,
and personal values, can be associated
with STEM ideas and practices;
• Inclusion of career information and images as
part of the school curriculum, so that students
have identity models to work with, offering
a range of possible identity futures; and
• Explicit scaffolding of students to
take on and value science ideas,
as critical in learning science.
The research literature identifies the cultural
capital invested in families with STEM
connections that act to set high standards
towards achievement in science or mathematics,

93
provide role models for interest and work in
STEM, and increase students’ self-efficacy in
relation to STEM subjects (Blenkinsop et al, 2006;
and Lyons, 2006). As noted, schooling plays a
particularly important role for students from low
SES areas who may not have family connections
with STEM professional work. Under optimum
conditions schooling can provide students with
academic capital sufficient to largely substitute
for cultural capital in the home.
For most countries, initiatives targeted
at student attitudes and identity were a
significant part of the strategic mix. This
included initiatives to increase awareness of
the nature of STEM professions. Based on the
consultants’ reports, strategies and programs
could be further developed and extended so
as to encourage in students positive attitudes
to study of mathematics and science, and
to STEM-related work and careers. Such
strategies would need to take into account
the diversity of students’ contexts, including
their gender, ethnicity/cultural background,
SES status and indigeneity. Such strategies
could include:
• Awareness campaigns to enrich public
understanding of career options in STEM
and the nature of STEM work, and to alert
young people to the range of possible
future STEM lives and identities.
• Strategies at school level designed to
involve families in mathematics and
science learning and in building positive
attitudes to STEM-related careers.
• Role models, in the form of student
interaction with practicing STEM
professionals, or web-based presentations
of narratives of STEM professionals (such
as those on the Academy of Technological
Sciences and Engineering [ATSE] Science
and Technology Education Leveraging
Relevance [STELR] website).
• Career advice that includes images
of people working in STEM-related
careers, delivered through information
workshops for careers teachers, and
mathematics and science teachers.
• The inclusion, in curriculum
resources, of images of people
working in STEM-related careers.
• The inclusion, in curriculum resources,
of materials that speak to the identity
needs of the diverse range of students.
This includes girls (e.g. science material
related to health, or the environment.),
indigenous students (e.g. materials
that embody respect for indigenous
knowledge), and contextual science
that relates to youth interests.
• The expansion of opportunities
for families and the general public
to engage positively with science
and mathematics through events,
exhibitions and other approaches.
• Enrichment programs whereby
students are engaged in science or
mathematics projects that entail linking
to members of local communities.
Key finding 6.1: Building awareness of STEM disciplines and STEM-related occupations among young people

94
Framing national STEM policy and strategy
National STEM Legislation and Policy Several countries articulate a national government commitment
to STEM or a broader science and technology agenda in national
policy. National policy establishes a framework for STEM-specific
objectives and can facilitate the implementation of coherent STEM-
specific strategies and programs. Government commitment to
STEM, or elements of STEM, may be reflected in legislation, policy or
strategy statements focused explicitly on STEM, or more broadly on
science and technology, school and tertiary education, and research
and development. National STEM policy tends to span more than
one government ministry, and in many instances is supported by
structures co-ordinating STEM or science and technology activity
across jurisdictions and agencies.
Policy objectives
National STEM or science and technology policy is generally
conceived in human capital terms. Emphasis on the ‘pipeline’ of
school and tertiary STEM education is frequently motivated by issues
concerning the STEM labour force; considered instrumental

95
to economic growth and wellbeing. Many
countries have also adopted an explicit policy focus
on increasing scientific literacy. The objectives
of national STEM or science and technology
legislation or policy vary in focus and breadth,
and typically include some of the following:
• promote a positive image of science
and mathematics, and STEM
• increase public knowledge and awareness of
science (scientific literacy, scientific method)
• support increased student engagement
• support increased student participation in
school-based mathematics and science, tertiary-
level STEM-disciplines, and the STEM workforce
• support increased achievement in
school-based mathematics and science,
and tertiary STEM-disciplines
• address disparities based on gender
• address under-representation of
minority groups and those located in
various geographical locations
• establish mechanisms for co-ordination
across STEM-related ministries, agencies,
organisations (including scientific agencies,
and research and development funding
agencies) and STEM stakeholders
• establish annual and long-term objectives
• establish common metrics
to monitor progress
• establish an evaluation strategy
• identify key participating STEM-related
ministries, agencies and organisations
• identify key strategies or programs.

96
Different approaches (English speaking and Western European countries; Asian countries; developing countries)
English-speaking (Canada, New Zealand and
the United States) and Western European
countries with high performing education
systems and unmet demand for STEM-qualified
positions frequently have national policy
specifically focused on, or embracing, STEM.
In such countries, variations exist in terms of
policy coverage depending on the scope of
government responsibility (for example, between
federal and unitary systems).
Asian countries with very high performing
education systems and growing economies
(Korea, Japan, China, Taiwan) have established
national policies around science and technology
more broadly, and university and industry driven
research and development.
Reflecting the imperatives of poverty reduction
and equitable education, developing economies
(Brazil, Argentina, South Africa) have national
policies focused on quality education systems
and emerging industry development, rather than
STEM-specific policy.
Case study: United States STEM policy and programs United States governments on both sides of
politics have fully embraced the STEM agenda.
The consultants’ report on STEM in the United
States notes that support for STEM is universal
in Washington:
At the federal level, support for STEM is
one of the issues that generally remains
above partisan politicking. For example,
in the most recent election for President,
the leading candidates from both major
political parties made it clear that they
want to strengthen many aspects related
to STEM and innovation in the US. Where
differences do surface, they generally revolve
around how improvements should be made
and how such initiatives will be funded.
Government concern with STEM in the United
States can be traced back to the report of
Vannevar Bush, commissioned by President
Roosevelt at the end of 1944, in which proposals
as to how science could be turned from warfare
to curing disease, development of scientific
talent in American youth, fuller and more fruitful
employment, and a more fulfilling life, are called
for. In his report – Science, the Endless Frontier
– Bush writes that ‘scientific progress is one
essential key to our security as a nation, to our
better health, to more jobs, to a higher standard
of living, and to our cultural progress’ (Bush
1945, n.p.). This optimism is mirrored in the 2010
Report to the President, Prepare and inspire: K-12
education in science, technology, engineering and
maths (STEM) for America’s future which sets out
the rationale for the United States government’s
STEM agenda:
The success of the United States in the 21st
century – its wealth and welfare – will depend
on the ideas and skills of its population.
These have always been the Nation’s most
important assets. As the world becomes
increasingly technological, the value of these
national assets will be determined in no small
measure by the effectiveness of science,
technology, engineering, and mathematics
(STEM) education in the United States. STEM
education will determine whether the United
States will remain a leader among nations and
whether we will be able to solve immense
challenges in such areas as energy, health,
environmental protection, and national
security … It will generate the scientists,
technologists, engineers, and mathematicians
who will create the new ideas, new products,
and entirely new industries of the 21st
century. It will provide the technical skills and
quantitative literacy needed for individuals
to earn livable wages and make better
decisions for themselves, their families, and
their communities. And it will strengthen
our democracy by preparing all citizens to
make informed choices in an increasingly
technological world (President’s Council of
Advisors on Science and Technology, 2010, p.vii).

97
This very broad rationale stands in contrast
to the 1993 remarks of the chairman of the
United States Congress Committee on Science,
Space and Technology, George E. Brown Jr. who
reported that: ‘Global leadership in science and
technology has not translated into leadership
in infant health, life expectancy, rates of literacy,
equality of opportunity, productivity of workers,
or efficiency of resource consumption. Neither
has it overcome failing education systems,
decaying cities, environmental degradation,
unaffordable health care, and the largest national
debt in history’ (cited in Science, 1993, p.735).
The tone of Prepare and Inspire is based on a
widespread but usually implicit assumption that
the progress of science is now an alternative to
the distribution of already existing wealth to deal
with hunger and poverty. On this alternative,
governments must look to science as a means of
creating more wealth: intensive agriculture and
genetically modified crops will feed the hungry,
and economic growth will reduce and eventually
remove poverty. This is of course not an
exclusively American view – it is widely assumed
by many governments – but it is one that can be
questioned. We raise it here to draw attention to
the fact that there may be deep-seated political
and ideological agendas behind the formulation
of particular STEM programs. One can advocate a
commitment to STEM programs while remaining
neutral to such agendas, as we have tried to do in
the body of the report.
The United States government’s commitment
to STEM is reflected in federal legislation.
Initially introduced in 2007 by President Bush,
and reauthorised by President Obama in 2010,
the America COMPETES Act (Congress of the
United States of America, 2010) represents a
comprehensive, legislative commitment to
STEM education, research and development,
and innovation. With respect to education,
the America COMPETES Act: provided the
foundation for programs increasing the number
of STEM teachers in high-needs areas by
700,000; requested the co-ordination of STEM-
related effort across scientific agencies (i.e.
NASA, National Science Foundation, National
Oceanic and Atmospheric Administration); and
suggested that schools observe a National Day
of STEM. The Act also called for an inventory of
strategies aimed at increasing performance and
participation of minorities in STEM, and identified
federally-significant STEM-related programs
including Teachers for Competitive Tomorrow.
The America COMPETES Act required the Director
of the Office of Science and Technology Policy
(OSTP) to establish a committee responsible for
co-ordinating federal efforts related to STEM.
The committee is charged with responsibility to
develop, implement through the participating
agencies, and update once every five years a
5-year STEM education strategic plan, which shall
a. specify and prioritise annual
and long-term objectives;
b. specify the common metrics that
will be used to assess progress
toward achieving the objectives;
c. describe the approaches that will be
taken by each participating agency
to assess the effectiveness of its STEM
education programs and activities; and
d. … describe the role of each agency in
supporting programs and activities designed
to achieve the objectives. (ibid, n.p.)
The Director of the OSTP is required to present
a progress report annually to Congress. The
Reauthorization specifically: directed NASA
and NOAA to increase their efforts to improve
student interest in STEM; required all agencies
to promote increased participation of minority
groups; focused on cyber-learning tools to train
and retrain the STEM workforce; continued the
Teachers for Competitive Tomorrow program and
promoted greater alignment between school
graduation requirements and national needs in
STEM. The Reauthorization also established the
National Centre for Science and Engineering
Statistics, as part of the National Science
Foundation, to collect and disseminate data on
STEM research, development and education.
There are numerous STEM reports developed to
inform government STEM policy. The majority of
these have recommended a systemic approach
including: the establishment of a structure
connecting interested stakeholders; a decision
chain coupled with a funding scheme; and a

98
feedback and evaluation mechanism to record
and interpret implementation progress. Rising
Above the Gathering Storm (National Academies’
Committee on Science, Education and Public Policy
2007) included STEM-specific recommendations
concerning the multiplicative effect of well-
prepared science and mathematics teachers on
their students, and the importance of attracting
the brightest people into STEM occupations from
the national pool (via undergraduate scholarships,
graduate fellowships and business tax credits),
and international pool (via access to education,
employment, visa processing and skill-based
immigration). The report also recommended
increased funding for research and innovation
generally, with emphasis on basic research and
strategies to incentivise innovation.
The National Science Board STEM education
recommendations to the President-Elect Obama
administration in 2009 (National Science Board,
2009) included advancing STEM education
for all American students, supporting quality
education and ensuring long-term prosperity.
Elements of an effective STEM education system
were conceived as including: a motivated public,
students and parents (via public awareness
campaigns); clear educational goals and
assessments, regardless of a students’ state or
school district; high-quality teachers; world-
class resources and assistance for teachers; an
early start in science (via the inclusion of STEM
core concepts in early education programs
and elementary school STEM education);
communication, co-ordination and collaboration
involving coalitions between K-12 school systems,
colleges and universities, science education
organisations, business and industry; and
streamlined federal government co-ordination
of STEM education research.
Building a Science, Technology, Engineering and
Maths Education Agenda (National Governors’
Association, 2011) recommended strategies to
increase the number of students undertaking
post-secondary STEM education and pursuing
STEM careers, and improve scientific literacy.
The report recommended: adopting rigorous
mathematics and science standards and improved
assessments; recruiting and retaining effective
teachers; incorporating hands-on mathematics
and science activities and educational
opportunities beyond the classroom; enhancing
the quality and supply of STEM teachers; and
establishing goals for post-secondary institutions
to meet STEM labour market needs. Similarly,
Prepare and Inspire (2010) by the President’s
Council of Advisors on Science and Technology
(PCAST) recommended that: attention be paid
to STEM common standards; STEM teachers
be recruited via the creation of a STEM Master
Teachers Corps; educational technology use be
expanded; specialised STEM-focused schools be
established; and strong national leadership be
demonstrated in terms of the STEM agenda.
Engage to Excel (2013) prepared by the
President’s Council of Advisors on Science and
Technology (PCAST), established a target of
one million additional college graduates with
STEM degrees over the next decade to address
projected STEM labour market shortages. The
report envisaged the adoption of teaching
strategies that emphasise student engagement,
providing all students with tools to excel, and
diversifying pathways to STEM degrees. Key
recommendations included: the adoption of
empirically-validated teaching practices; the
replacement of standard laboratory courses with
discovery-based research courses; a national
experiment in post-secondary mathematics
education to address mathematics-preparation
gaps; the establishment of partnerships among
stakeholders to diversify pathways to STEM
careers; and the creation of a Presidential Council
on STEM education.
Finally, the Co-ordinating Federal Science,
Technology, Engineering and Mathematics
(CoSTEM) Education Investments: Progress Report
(2012) established a five-year federal STEM
education strategic plan, including a vision,
goals and objectives. The plan’s primary goal is
to develop a shared pathway between the 13
federal agencies with responsibility for STEM
education, scientific literacy and STEM workforce
development. The plan aims to ‘provide STEM
education and training opportunities to prepare a
diverse, well-qualified workforce, able to address
the mission needs of the Federal agencies and
lead in innovation across the broad spectrum
of industries and occupations related to the

99
missions of Federal agencies’ (ibid, p.11). The
plan established objectives regarding: increasing
STEM interest and engagement among the public
of all ages; increasing opportunities to develop
deeper STEM knowledge, skills, and abilities;
improving STEM educator and leader preparation;
improving the institutional capacity to support
effective STEM education and learning programs;
and increasing the STEM learning base and use of
evidence based STEM education practices.
There are common themes throughout these
policy reports, key to which is coordination of
STEM effort, and collaboration between STEM
stakeholders. The reports also highlight the need
for a concerted effort around recruiting and
retaining STEM teachers, promoting consistency
in curriculum standards despite the challenges
posed by the federal structure, and increasing
participation of girls, women and minorities in
STEM education and the STEM labour market. The
United States approach to STEM conceives a dual
focus on STEM for high achievers and scientific
literacy for all, and involves a diverse range of
strategies spanning schools, colleges, universities,
research and development organisations,
industry and the broader community.
There are a plethora of initiatives, implemented
by a variety of national, state and local
organisations that translate these policy
recommendations into practice. The consultants’
report identified some notable ones. Skills
for America’s Future established a national
network of partnerships between employers,
community colleges, industry associations,
and other stakeholders to bridge the skills
gap between the 3 million unfilled technical
jobs and unemployment. The Master Teachers
Corps rewards STEM teachers; the STEM Talent
Expansion Program (STEP) aims to increase the
number of engineering and computer science
bachelor-level graduates by 10,000 annually.
Educate to Innovate involves public-private
partnerships to foster interest and engagement
in STEM through out-of-school activities (e.g.
greater focus on STEM in Sesame Street). The
Common Core State Standards (CCSS) initiative
involved the development of common standards
for K-12 English language, arts, mathematics and
science, with 45 of 50 states having adopted the
standards and in various stages of classroom
implementation. A number of immigration-
based initiatives have also been implemented
to strengthen the STEM labour market. For
example, student visa arrangements have been
extended for holders of PhD’s in STEM fields (from
12 months to 29 months); employment-based
visas under the American Competitiveness in the
Twenty-First Century Act 2000 provide foreign
nationals working in universities and non-profit
or government research facilities with dual-intent
visas (where the employer supports applications
for employment and permanent residency). (See
Section 10 for further discussion).
The establishment of a national framework
for STEM policy and programs has not been
without challenges. The CoSTEM Report (2012,
p.12) identified several factors that constrain the
achievement of strategic goals:
• The Federal government’s lack of authority
to create a national STEM education
curriculum or set of standards;
• Budget fluctuations and changes in
views of agencies’ roles are affecting
the long-term planning;
• Certain agencies cannot by law
target underrepresented groups;
• Coordination between agencies is
difficult with limited funding;
• Data confidentiality rules limit
evaluation strategies.
Evaluations suggest that while many of the
functional elements of a national STEM policy and
strategy are in place, others are in the process of
being implemented, or are yet to be implemented.
Case study: United Kingdom STEM policy and programs The United Kingdom’s commitment to STEM is
conceptualised in terms of human capital: ‘The
best way for the UK to compete, in an era of
globalisation, is to move into high-value goods,
services and industries. An effective science
and innovation system is vital to achieve this
objective’ (Sainsbury 2007, p.3). The United

100
Kingdom’s long-term policy agenda for STEM
is represented by their Science & Innovation
Investment Framework 2004-2014, which states:
The nations that can thrive in a highly
competitive global economy will be those
that can compete on high technology and
intellectual strength – attracting the highest-
skilled people and the companies which
have the potential to innovate and to turn
innovation into commercial opportunity.
These are the sources of the new prosperity.
This is the opportunity. This framework sets
out how Britain will grasp it. It sets out how
we will continue to make good past under-
investment in our science base – the bedrock
of our economic future. More than that, it sets
out not only how we intend to invest in this
great British asset – the world-class quality of
our scientists, engineers and technologists –
but how we will turn this to greater economic
advantage by building on the culture change
under way in our universities, by promoting
far deeper and more widespread engagement
and collaboration between businesses and the
science base, and by promoting innovation in
companies directly. (DfES 2004, p.1)
Despite being commissioned by the former
Labour Government and published in 2004, the
framework captures the essence of the current
official policy position on STEM, and there has
been no subsequent government STEM-specific
policy announced.
The Science & Innovation Investment Framework
2004-2014 established objectives in terms of
‘world class research at the UK’s strongest centres
of excellence; … greater responsiveness of the
publicly-funded research base to the needs of
the economy and public services; … increased
business investment in R&D, and increased
business engagement in drawing on the UK
science base for ideas and talent; … a strong
supply of scientists, engineers and technologists
…; sustainable financially robust universities
and public laboratories across the UK; (and) …
confidence and increased awareness across UK
society in scientific research and its innovative
applications’ (Tomei 2013, pp.4-5). In terms of
increasing the supply of scientists, engineers
and technologies, the framework articulated
ambitions regarding:
• the quality of science teachers and lecturers
in every school, college and university
• ensuring national targets for
teacher training are met
• the results for students studying
science at GCSE level
• the numbers choosing SET subjects in post-
16 education and in higher education
• the proportion of better qualified
students pursuing R&D careers
• the proportion of minority ethic and women
participants in higher education. (ibid., p.5)
The Science & Innovation Investment Framework
2004-2014 has provided the basis for ongoing
government investment through the science
research budget despite the economic downturn,
and the backdrop for a series of STEM-related
strategies and programs.
In the school sector, national curriculum,
including standardised mathematics, science
and ICT curriculum, is mandated in public
schools in England, Wales and Northern Ireland.
Independent schools, new academies and free
schools are not required to follow the curriculum,
however the majority do. The national curriculum
has been the subject of ongoing reform, as has
the General Certificate of Secondary Education
(GCSE) (e.g. 21st Century Science). Mathematics,
science and ICT are compulsory in years 10-
11, and most students take the national GCSE
examinations. One offering is the new ‘Triple
Science’ option in which pupils take three
separate GCSEs, in physics, chemistry and
biology. Normally only offered to higher attaining
pupils, Triple Science has had increasing take-up
in recent years, with strong government backing.
Various initiatives involve teacher ‘continuing
professional development’ (CPD) and ‘in-service
education and training’ (INSET) to support
curriculum reforms and the focus on inquiry
based science education.
Mathematics has provided a particular policy
focus with the implementation of a National
Numeracy Strategy in the late 1990s and the

101
placement of mathematics specialists in each
primary school. Specialist schools in science,
technology and engineering, and mathematics
and computing have been established (there
are now 1300 schools in England), and there is
a National Network of Science Learning Centres
that provides discipline-specific continuous
professional development for teachers.
There are a large number of enrichment
activities which promote science to the
general community, including science centres,
museums, science festivals, science talks and
activities outside school or university classes,
zoos, planetaria, aquaria and botanical gardens,
and science centres following the model of the
Exploratorium in San Francisco (see Section 14).
STEM-specific initiatives include the Science,
Technology, Engineering and Mathematics Network
(STEMNET), an educational charity established in
1996 with national and regional hubs implementing
the STEM Ambassadors program, co-ordinating the
STEM Clubs Network and supporting the Schools
STEM Advisory Network.
Whilst the United Kingdom framework provides a
backdrop for STEM strategy spanning education,
research and industry sectors, it is now somewhat
dated in terms of providing a cohesive STEM policy
to guide ongoing and future activity in this area.
Case study: Korea STEM policy and programs The Korean consultants’ report articulates the
Korean government’s rationale for national
science and technology policy:
the Korean government has attributed the
recent advancement of the Korean economy
and its role in the global community to the
development of science and technology. In
a public message from the Lee government
(2008-2013) on its accomplishments of science
and technology policies, it acknowledged the
enhanced competitiveness of science and
technology over its regime (MEST, 2012a).
For example, in this message, the Korean
government emphasised that in the IMD
Scientific Infrastructure Subindex, Korea moved
up from 7th in 2007 to 5th in 2012, and Korean
higher education institutions in the top 200 QS
World University Rankings increased from two
in 2007 to six in 2012.
The Korean government has established detailed
plans for technology development every five
years from the 1960s through the 1980s (Hong
et al, 2010). In the 1st economic development
5-year plan (in the 1960s), the government
focused on educating technicians to promote
light industry. In the 2nd economic development
5-year plan the focus shifted to college and
university education in science and technology
fields (including fisheries). After the 1970s the
focus shifted to education for different industries,
principally including engineering, as part of a
strategy to promote the heavy chemical industry
(ibid.). In the 1980s, demand for highly qualified
and specialised staff in science and technology
intensified, and the government established
the Korea Advanced Institute of Science
and Technology (KAIST ), a graduate school
specialising in science and engineering. The
government also established the Korea Institute
of Technology and specialised science high
schools and strengthened undergraduate science
and technology education, reflecting a shift in
government policy focus from undergraduate to
postgraduate higher education.
In the 1990s government investment in research
and development and research-intensive
universities intensified. The Korean consultants’
report notes that at this point:
the issues of imbalance between demand and
supply, as well as quantity and quality of human
resources in science and technology, difficulty of
finding employment in science and engineering
fields, and the phenomenon of avoiding science
and engineering emerged. In the 2000s, a
need for highly advanced human resources
increased with the advent of the knowledge-
based economy, but issues from the 1990s
still persisted in addition to a decrease in the
number of high school graduates in Korea and a
mismatch between university education and the
demand from industry.

102
The First Master Plan for Educating and Supporting
Human Resources in Science and Technology was
introduced in this climate to encourage people
to participate in science and engineering,
and enhance the competitiveness of science
and technology. Subsequently, the Second
Master Plan for Educating and Supporting
Human Resources in Science and Technology
(2011-2015) under the Special Support Act for
Science and Engineering for Improving National
Competitiveness focused on science and
technology education and workforce preparation.
There are a range of strategies and programs that
support the Second Master Plan. For example,
Korea launched Science, Technology, Engineering,
Arts and Mathematics (STEAM) as a mechanism
to engender inter-disciplinary education,
creativity, artistic literacy, student engagement
and motivation in STEM education (see section
8). The Korea Institute for the Advancement of
Science and Creativity (KOFAC) was established
to promote science and technology-related
cultural activities, and co-ordinate enrichment
activities and STEAM talks. Some strategies focus
on elite education, such as the Comprehensive
Plan for Discovering and Educating Talented and
Gifted Youth in Science that provides specialist
science, technology, engineering, arts and
mathematics schools for talented and gifted
students. Korea has also adopted a ‘life cycle
approach’ with respect to human resources for
science and technology covering education,
employment, research and retirement (e.g.
Global PhD Scholarship are available for high
caliber undergraduate and doctoral students and
postdoctoral researchers).
Korea has launched several initiatives aimed at
increasing the number of world-class universities,
including Brain Korea 21, the World Class
University (WCU) Project, and the Global EXCEL
program which aims to increase the number
of Korean institutions in the top 100 world
universities (see section 12). Given the significant
gender disparities, particularly in engineering, the
Korea Advanced Institute of Supporting Women
in Science, Engineering and Technology (WISET)
has been established and various women in
engineering programs, and women in science
and technology programs introduced. In addition,
the Women’s Academy for Technology Change
in the 21st Century (WATCH21) promotes natural
sciences and engineering to high school students.
From a policy perspective, the Korean case
study provides a unique example of national
government long term planning for science
and technology and economic development,
which has clearly translated to a high performing
education system, and extremely high levels
of participation in STEM-disciplines in higher
education undergraduate and doctoral programs
(principally including engineering).
Case study: Japan STEM policy and programs The Japanese consultants’ report indicates that the
Japanese government and scientific community
have identified the emergence of the ‘research
and development mega competition’ in the 21st
century as a key driver of science and technology
reform. As the consultants’ report notes:
there is a measure of national consensus:
competitiveness of the national economy
depends on the strength and capacity of
research and development, and subsequently
on human capital development. Education
and educational institutions, from primary to
tertiary and beyond, which nurture and train
human resources to sustain the progress of
technological innovation, therefore constitute
a renewed political priority for contemporary
Japan. Hence, STEM is placed within a
framework of long-term national economic
development and forms an integral part of
such policy deliberations.
The Japanese Science and Technology Basic Law
(Kagaku Gijutsu Kihon Hō, or S&T Law of 1995)
provided a legislative commitment to progressing
science and technology and established mid-
to long-term commitments across several
government ministries. The S&T Law (Chapter 1,
Article 1, Law No. 130 of 1995) aimed to foster
a superior standard of science and technology
to contribute not only to Japanese economic
and societal development but also the progress
of global science and technology as the world

103
builds toward a sustainable human society. The
legislation introduced a range of reforms with
significant, wide-reaching effects, including
provisions for re-examination and revision of mid-
to long-term science and technology policy.
The legislation established the Council for
Science and Technology Policy, headed by
the Japanese Prime Minister. The Council is
the principal mechanism to determine mid-
term science and technology strategies. While
each ministry oversees the implementation
of individual STEM programs, the Council has
authority over the general direction of the
promotion of science and technology on the
basis of five-year basic plans, thereby ensuring
mid- to long-term planning and commitments
(Kitazawa 2010, pp.31-32).
The Ministry of Education, Culture, Sports and
Science and Technology (MEXT), representing
a merger of the previous Ministry of Education,
Science and Culture, and Science and Technology
Agency, has responsibility for science and
technology through education, and co-
ordination of multiple STEM-related agendas.
The restructure was part of a larger effort to
downsize government and decrease government
expenditure on education. The consultants’ report
notes that ‘the government’s STEM strategies
and programs thus inhabit a climate of austerity
against a backdrop of mounting criticism and
concern over deteriorating STEM performance of
Japanese students as well as lack of enthusiasm
for STEM subjects’.
The Japanese government has introduced a range
of national strategies to enhance STEM. Firstly,
as discussed in Section 5, national Curriculum
Guidelines for compulsory primary and secondary
school-level science and mathematics have been
developed that increase hours and content.
These guidelines are complemented by other
initiatives that seek to improve science teaching,
including disciplinary training of primary school
science teachers. These strategies aim to improve
the quality of basic STEM education nationwide
(‘science for all’), generating and stimulating
interest in science and creating support for
STEM in Japanese society. A second strategy
involves ‘elite’ education (e.g. Super Science High
School program, and the ‘science elite track’
from secondary to tertiary education). Thirdly,
strategies have been implemented which focus on
transitions between university and career paths
(e.g. job placement of graduate students and
post-doctoral researchers in STEM fields). Fourthly,
strategies have been developed which specifically
address the gender disparities in STEM education
and STEM occupations, including initiatives
involving public and corporate sector funding.
Finally, the 300,000 International Students Plan aims
to send 300,000 Japanese students abroad, and
accept 300,000 international students to Japanese
universities by 2020, with STEM-disciplines
representing a strategic target discipline.
The Japanese Science and Technology Agency
(JST ) is responsible for implementing many of
the Japanese government strategies, including
those broadly concerned with enhancing general
scientific literacy (‘science for all’).
Whilst the S&T Law represents a legislative
commitment to science and technology, there
is no national STEM policy, and no co-ordinated
approach to monitoring and evaluation of
the various science and technology, and
STEM strategies and programs. The Japanese
consultants’ report suggests that ‘the practice of
incorporating STEM into policies and programs
without giving it primary focus results in
fragmentation of information, making it difficult
to synthesize a cohesive picture of national
STEM strategies and programs, their impact
and shortfalls. Doing so requires not only an
understanding of current status and statistics, but
also of shifting policy priorities and adjustments,
as well as changing needs and demands towards
STEM spanning wide sectors of society’. As such,
while the legislative framework for science
and technology, and STEM initiatives reflects
government commitment to STEM, more could
be done with respect to national STEM policy
coherence and financial support.

104
Other STEM or science policiesWestern Europe, Germany, France, Ireland, the Netherlands, Norway, Spain, and the United Kingdom all have national STEM (or science) policies or strategies (Eurydice, 2011) that provide a coherent STEM framework, frequently linked to broader educational goals. Typically, these policies or strategies involve: promotion of a positive image of science; increasing public knowledge of science; improving school-based mathematics and science (teaching and learning); and increasing interest and participation in school-based mathematics and science, tertiary STEM disciplines and the STEM workforce. In addition, Western European national STEM policies seek to address disparities (gender and minority groups) in education and employment-based STEM, and match graduates with employer skills needs. For example, the German government’s High-Tech
Strategy is supported by MINT (STEM) Future, a registered non-profit association supported by the German President as patron. The association promotes the interests of students in STEM, and supports increased participation in school-based science and mathematics and STEM-disciplines. The national strategy is supported by the National Pact for Women
in MINT Careers that seeks to address gender disparities in STEM education and employment.
The Norwegian Science for the Future Strategy
for Strengthening Mathematics, Science and
Technology (MST ) 2010-2014 conceives of STEM holistically from kindergarten to employment, and promotes co-operation between education and industry to facilitate transition of graduates into STEM professions. France, Switzerland and Italy have national strategies focused on school education, from encouraging interest in school-based science and mathematics (France), promoting ‘synergies’ between diverse STEM strategies and programs (Switzerland) and establishing an inter-departmental structure to foster STEM culture (Italy). In Austria, Finland, Slovenia and the Slovak Republic, national STEM-specific strategies are no longer prioritised as STEM has effectively been mainstreamed (Kearney 2011).
Other countries have non-STEM-specific policies
and plans that establish national agendas for
science and technology, and related issues. The
Russian government’s science and technology
policy establishes a global goal for Russian high
technology products and intellectual services (5-
10 per cent of global markets) but does not focus
specifically on STEM nor provide a coherent,
consistent STEM policy. Similarly, China’s Science
and Technology Development Goal (2006-2020)
and National Mid and Long-term Education
Reform and Development Framework (2010-2020)
articulate broader objectives regarding industry
development and education reform. Taiwan
demonstrates national commitment and long
term planning, with science and technology
plans dating back to 1959 (Long-Term National
Science and Technology Plan).
The Israeli government has not articulated
a comprehensive national STEM policy or
strategy. Rather the government’s agenda
is dispersed between policy commitments
to science, technology, education, research
and development and innovation (spanning
many ministries), supported by legislation
(e.g. Encouragement of Industrial Research and
Development Law; Law for the Encouragement of
Capital Investment) and regulation through the
National Council for Research and Development.
Neither Brazil, Argentina or Portugal have
national STEM-specific policies; rather they
focus on enhancing the quality of education,
industry, and science and technology generally.
For example, the Brazil Education Development
Plan 2011-2020 focuses on improving school
education through enhanced teaching quality
and teacher career pathways. Argentina’s national
policies focus on research and development,
and industry-specific development (such as
Biotechnology and Engineering), such that the
Bicentennial Strategic Plan (2006-2010) seeks
to foster research and innovation, and general
scientific capacity, and Biotechnology Multi-Year
Plan for Science and Technology and Strategic
Plan for Science, Technology and Innovation
‘Bicentennial’ promote biotechnology and
engineering industry-sector development.
Portuguese national policy is clearly focused

105
Key finding 7.1: National STEM policy
A number of countries articulate
through national policy a government
commitment to STEM or a broader science
and technology agenda. In these cases
national policy establishes a framework
for STEM-specific objectives and facilitates
the implementation of coherent STEM-
specific strategies and programs. National
STEM policy tends to span more than
one government ministry, and in many
instances is supported by structures
coordinating STEM or science and
technology activity across jurisdictions and
agencies. National STEM or science and
technology policy is generally conceived
in human capital terms.
A national STEM policy could provide a
coherent framework for identifying and
articulating STEM-specific strategies and
programs spanning the school, VET, higher
education and research and development
sectors, and also relevant programs in
relation to innovation, employment and
industry development.
on quality education, with the Technological
Plan supporting school ICT infrastructure and
equipment; and the Mathematics Plan nurturing
mathematics participation and achievement, as
does the National Action Plan for Science.
National STEM centres or agencies There are numerous examples of national STEM
centres or agencies established with a specific
STEM, or science focus. This includes national
centres or agencies established to: provide policy
advice to government; communicate science to
the public; stimulate public interest in science;
support STEM school and technical education
and STEM teaching; conduct enrichment
activities; undertake STEM-discipline research,
frequently involving industry and education
research-focused partnerships; undertake
research regarding STEM education; or progress a
single STEM-related agenda, such as Indigenous
STEM science and education. In many instances,
such structures perform a number of these
functions and involve partnerships between
participant and/or networked organisations.
Additional information regarding such co-
ordination structures is provided elsewhere in
this report. (National STEM centres and agencies,
and the potential for such approaches in
Australia, are discussed in Section 14).

106
School curriculum and pedagogy
Strategies and programsThe consultants’ reports provide a wealth of information
regarding school curriculum-based initiatives aimed at
enhancing both the spread and quality of science and
mathematics school education, and building scientific literacy.
Most interventions described at the primary and lower
secondary level are focused on engaging all students with
science and mathematics, partly in order to increase numbers,
including under-represented groups, participating in STEM
in upper secondary and higher education. We note here
that many countries have nationally consistent curriculum
(or curriculum frameworks), or standards which inform
curriculum development (e.g. Common Core State Standards for
mathematics, science and English language curriculum in the
United States; compulsory National Curriculum for government
schools in England, Wales and Northern Ireland; National
Education 9-year Curriculum Outline and Senior Secondary School
Curriculum Outline in Taiwan and the Common Framework
for Science Learning Outcomes: Pan-Canadian Protocol for
Collaborations on School Curriculum in Canada).

107
In many instances science and mathematics
or whole-school curriculum reform has
concentrated both on content revision and
pedagogy reform. In some instances, such
as France, curriculum reform has involved
‘thinning’ curriculum content to afford greater
concentration on student development of
problem-based and procedural skills. Curriculum
guidelines and resources have been introduced
in a number of countries to complement
curriculum and pedagogy reform. For example,
in Japan guidelines have been introduced for
compulsory primary and secondary school
science and mathematics that focus on content
and enhancement of mathematical and scientific
literacy and problem solving. In Israel, the Matar
science and technology online portal has been
developed by the Israeli Ministry of Education
and implemented by Tel Aviv University to
support school-based science and technology
with podcasts, classroom aids and information
for school-based research. In other examples,
examination or secondary/senior secondary
certification-requirements inform curriculum
content; for example the United Kingdom
Graduate Certificate of Secondary Education
(GCSE, year 10 equivalent) requires completion
of three science courses, and the National Senior
Certificate in South Africa requires completion of
mathematical literacy requirements as one of the
four compulsory subjects.
The consultants’ reports also provide numerous
examples of initiatives generally aimed at
increasing participation in school-based
mathematics and science, or higher education-
based STEM disciplines. For example, the
United States Engage to Excel program aims to
increase the number of higher education STEM
graduates to 1 million by increasing student
engagement and addressing inequitable
participation in pre-requisites to STEM study
(due to SES, gender, race-ethnicity, income)
via diversified pathways to STEM degrees. In
South Africa, strategies include addressing
the performance of historically disadvantaged
learners by providing high-quality science,
mathematics and technology education. General
and racial transformation-based strategies also
focus on increasing the pass rate for year 12
physical science and mathematics to support
increased transition of disadvantaged learners
from school to university. In Western Europe,
strategies that increase student engagement
and promote positive attitudes to science
and mathematics are employed to support
increased student participation. Strategies
identified in various international agency reports
include: allowing students to re-enter the
STEM pathway; understanding student choices;
predicting STEM labour market requirements;
information for students; student contact
with STEM professionals; and collaboration
between stakeholders (including international
collaboration between organisations, policy
makers, professional bodies, educational
institutions and interested parties).
Curriculum – strategic focus, aims, structure In framing curriculum in mathematics and
science, the different countries strike a balance
between competing choices:
i. Curriculum focus: Between focusing
on core science and mathematics
disciplinary concepts, or on generic
competencies such as problem solving,
creativity and flexibility in thinking.
ii. Focus on all students or a STEM elite?:
Between focusing on science and
mathematics for all students, or catering
for an elite through streaming or
specialist schools (see also Section 5).
iii. Content breadth and depth: Between
a comprehensive curriculum focused
on a wide set of concepts, or a
pared back curriculum focused on
disciplinary depth and competencies.
iv. School and teacher autonomy, and
accountability regimes: Between effecting
improvement in mathematics and science
provision through tight accountability
regimes, or through supporting local
autonomy and innovation in curriculum,
pedagogy, and enrichment processes.

108
v. Curriculum structure: Between the relative
effectiveness of invigorated curriculum
content, or restructured curriculum.
vi. Pedagogy: Between traditional teacher-
centred pedagogies focusing on broad
conceptual knowledge transmission, or
student-centred pedagogies focusing on
critical and creative thinking.
These choices will be discussed in turn.
i. Curriculum focus
A choice that becomes apparent in analysing
the curriculum initiatives described in the
consultants’ reports is that between focusing
on core science and mathematics disciplinary
concepts, or on generic competencies such
as problem solving, creativity and flexibility in
thinking. In the first case, there is a concern to
support high level curriculum content knowledge
as part of the agenda to improve a country’s
standing on the PISA or TIMSS assessments. In
this case, teacher disciplinary qualifications are
a key focus. In the second case, the argument is
grounded in the desire to have STEM education
serve the economic imperative to innovate,
consistent with a focus on research and
development and industry start-up strategies.
The second approach might also facilitate the
mobility of STEM graduates across a wide range
of occupations, enhancing the generic role of
STEM programs.
The Asian countries in the present study, all
very successful in PISA and where disciplinary
knowledge is held in high esteem, report a
shift in focus towards nurturing generic skills of
creativity, problem solving, collaboration and
higher order thinking. Part of this shift relates
to a perception that teaching and learning in
classrooms is too teacher-focused and does not
allow students to develop the creativity and
problem solving skills that will drive innovation.
Part of it is a feeling that the more individualistic
education commitments of the West have been
successful in driving innovation.
In North America and Europe, as in Australia,
this focus on higher order skills is expressed in a
commitment to inquiry in science, and problem
solving in mathematics. Inquiry, it is argued, is an
approach that should lead to enhanced student
engagement with ideas in science. Here again
there is a tension between content coverage,
and a skills focus. In the United States alongside
a commitment to inquiry in science there is a
parallel commitment to the development of
rigorous science and mathematics standards
and assessment. The two foci are not inherently
contradictory – the issue concerns emphasis,
and whether ‘rigour’ is conceived of primarily in
terms of mastery of a standard set of content
prescriptions, or in terms of capacity to use
science and mathematical ideas and processes
flexibly in novel situations. One cannot imagine
the development of strong problem solving skills
in mathematics, separate from deep knowledge
of conceptual ideas.
The key issues relating to balancing these
foci are pedagogy (discussed in sub-
section vi. Pedagogy) and assessment. In
the 2015 PISA round, collaborative problem
solving will be a significant dimension.
Korea has developed a decisive curriculum
response to a perception that students were not
finding the STEM curriculum engaging, and that
the curriculum was not addressing the objective
of creativity. Korea is especially concerned
about teaching strategies and approaches,
and determined to improve the creativity,
artistic and innovative flair of students in STEM
employment. Towards this end the country has
developed a ‘STEAM’ curriculum with the creative
‘Arts’ embedded in STEM to enhance student
engagement and encourage creativity. This is
intended to emulate the philosophy of past
Apple CEO Steve Jobs, that infinite imagination
and divergent thinking, more than technological
advances or industrial structures, define success
in technology, including engineering and
engineering design, and innovation in science. The
STEAM ‘movement’ also exists in the United States.
A further curriculum innovation mooted in a
number of the reports is the introduction into
students’ school experience of information
or activities that open up knowledge about
STEM professional work (see the United States
consultants’ report, and many reports on

109
strategies of linking students with scientists or
scientific practices). This is consistent with a
substantial literature pointing out that students
make choices regarding STEM subjects largely in
ignorance of the varied nature of work and career
trajectories undertaken by STEM professionals. It
is consistent also with the perspective on identity
as a key frame for student choice.
This concern with lack of awareness of STEM
professions has been strongly expressed in
relation to engineering, and mathematics, which
tend to be invisible to students compared to their
knowledge of doctors, or even research scientists.
Responses to this have included putting students
in touch with STEM workers, better representing
authentic STEM experiences in classroom
activities, or including stories about STEM work
as part of the curriculum. These strategies are
already being pursued in Australia through the
‘science as a human endeavour’ dimension of
the curriculum, or the many schemes linking
scientists with schools.
The Korean example of including creative
arts in STEM proffers a potential advantage in
introducing more explicit creative design work
into the science curriculum to develop students’
problem solving capabilities. The creation
for instance of models and representations
to interpret phenomena and solve problems
is central to scientific knowledge building
practices, and has precedents in innovative
science education practices (Ainsworth, 2011).
Such design work could be used to raise the
profile of engineering design in the science
and mathematics curriculum. Ways should
be investigated of including creative work
in science and mathematics teaching and
learning, similar to explorations common in art
and design curricula. This approach would be
particularly productive during the primary and
lower secondary years when students’ identity
commitments are being formed.
While in the consultants’ reports there are no
descriptions of an explicit design/engineering
focus in the science curriculum, engineering
is included in some vocational courses, for
instance in Germany and in Singapore. Given
the importance of design in STEM work, and
the relative invisibility of the work of engineers
at school level, there exists an argument for
incorporating technology design work as part
of students’ science experience. This would
imply, in time, a modification to the science
curriculum, but with imagination it could be
productively incorporated into the current
curriculum as part of scientific and mathematics
problem solving and investigative practice.
The recent framework for science education in
the United States developed by the National
Academies of Sciences, and Engineering, the
Institute of Medicine, and the National Research
Council, listed as major dimensions ‘Scientific
and Engineering Practices’ and in the disciplinary
core ideas listed ‘Engineering design’ and ‘Links
among engineering, technology, science, and
society’. The inclusion of design tasks in science
and mathematics curricula is consistent with
the Korean focus on creativity and innovation,
described above.
ii. Focus on all students or a STEM elite?
A second choice evident in the consultants’
reports is between focusing on ‘science (and
mathematics) for all’, and catering for a STEM elite
engaged in high performance learning, through
streaming or specialist schools. This balance
was discussed extensively in Section 5. We will
not reiterate the arguments, except to again
make the point that these foci are not inherently
contradictory, and the consultants’ report systems
where the two elements are held in balance. It
seems likely that a well-developed STEM policy
will place greater emphasis on one or other of
these approaches at different levels of education.
iii. Content breadth and depth
A third choice is between a comprehensive
curriculum focused on a wide set of concepts,
and a pared back curriculum focusing on
disciplinary depth and competencies. As noted
in Section 5, Japan went through a period of
cutting back content prescription to emphasize
what they called a more ‘relaxed’ curriculum
with room for students to develop autonomy
and wider skills. However, falling PISA results

110
led to a reinstatement of curriculum specificity.
The Asian consultants’ reports all raise this
issue of abstracted content coverage and the
associated lecture style classroom practice, and
a greater focus on skills supporting innovation,
implying more student-centred pedagogies. In
Western countries there is a different formulation
of essentially the same issue, with a universal
commitment to inquiry but a teaching force
and assessment regimes focused on traditional
content coverage. In both Asia and Europe there
is a strong focus on teacher professional learning
to support changes in curriculum focus. What is
perhaps missing is a sharp conception of what
‘rigor’ might mean in an environment where
disciplinary literacies in support of reasoning and
problem solving are balanced against a need for
comprehensive conceptual fluency.
If performance on PISA is valued then strong
disciplinary commitments are essential. The task
is to pursue higher order reasoning and other
generic competencies through a strong focus on
problem solving competencies of the discipline.
Investigative skills and problem solving,
creative approaches to investigation and design
must be conceptualised as core disciplinary
competencies. In analyses of the characteristics
of Australian mathematics lessons in the 1999
TIMSS video study, Stacey (2003) coined the
term ‘shallow teaching syndrome’ to describe
the combination of low procedural complexity
of problems, high proportion of repetition, and
absence of mathematical reasoning in classroom
discourse that constituted the practices in
Australian lessons. Teaching strategies that
emphasise problem solving and reasoning
must be underpinned by commitment to deep
disciplinary knowledge. This implies a program
of mutually supportive initiatives that focus on
curriculum framing, assessment, and teacher
professional learning in both disciplinary and
pedagogical knowledge.
Key finding 8.1: Inquiry, reasoning, and creativity and design in STEM curricula
Many comparator countries with strong
STEM agendas and results have a well-
developed curriculum focus on innovation,
creativity and reasoning, accompanied
by a strong commitment to disciplinary
knowledge. In relation to school curricula,
teaching, learning and educational policy
and organisation could usefully address
elements such as:
• Strong disciplinary frameworks,
noting that disciplinary thinking
and disciplinary literacies are central
to creative problem solving in
STEM-related learning and work.
• At the core of learning, methods
of problem solving, inquiry,
critical thinking and creativity,
all of which can enhance both
students’ attitudes to, and practical
competencies, in STEM fields.
• Design tasks into school science
and mathematics curricula, in order
to support the development in
students of problem solving skills,
flexibility in thinking, and awareness
of engineering design activities.
• Consideration of the inclusion of
the visual and performing arts
alongside strategies and programs
designed to enhance the orthodox
STEM-related disciplines, as in the
successful STEAM policy in Korea.
• Development of assessment
regimes that support the
commitment to problem solving,
inquiry-based approaches, critical
thinking and creativity.

iv. School and teacher autonomy, and accountability regimes
A fourth choice concerns whether to effect
improvement in mathematics and science
provision through the development of tightly
prescribed standards supported by high stakes
accountability regimes, or through supporting
local autonomy and innovation in curriculum,
pedagogy, and enrichment processes. These
different approaches are evident in the reports,
often within one country. In the United Kingdom,
for instance, there has been a high stakes
accountability regime for some years, driven
through the national curriculum and associated
testing, as well as many projects supporting local
enrichment activity.
There was discussion in the United Kingdom
consultants’ report about the longer term effects
of such accountability regimes and approved
teacher professional development involving
prescriptive teaching approaches. Evidence is
presented in the consultants’ report that over
time this has reduced the professionalism of
teachers, the richness of teaching approaches,
and the quality of student experiences.
This argument is supported by the Finland
consultants’ report, which emphasises teacher
quality and autonomy, the ‘trusting’ of teachers,
and local collaborative curriculum design and
teaching approaches. Finland outperforms almost
all other countries in PISA paradoxically whilst
not paying attention to testing regimes.
This is consistent with experience in the United
States. Au’s (2007) extensive meta-analysis of all
relevant assessment related studies concluded
that high stakes testing leads to a more
fragmented curriculum and a transmission-
dominated pedagogy. Au further argued that this
approach tends to lead to performance learning
by students, motivated by extrinsic rewards
rather than inherent interest in the subject itself.
It is clear from the consultants’ reports that the
predominant approach to increasing student
engagement with STEM involves enriching
students’ mathematics and science learning
experiences through local initiatives, and
increasing teaching quality through coherent
training and professional development rather
than accountability regimes. The many projects
spawned by concerns about STEM participation,
while often centrally planned, are diverse and
supportive in nature rather than constrained and
standards driven.
In Australia, partly because of the state-based
nature of education, there have been a wide
variety of approaches to curriculum and teaching
and learning developed within relatively discrete
systems. The Australian Curriculum offers an
opportunity for greater dialogue between States
and Territories, and cooperation concerning
innovation in assessment and support of
teachers. The lesson from the consultants’ reports
seems to be that accountability regimes that are
put in place to encourage consistency should
strike an appropriate balance between the need
to support teacher and school professionalism
and the opportunities offered by local context.
The consultants’ reports raise serious questions
about the narrowing and de-skilling effects of
too prominent an emphasis on the accountability
side of this equation.
In framing approaches to increasing student
engagement with STEM pathways the emphasis
should be on developing initiatives that
support and enrich students’ and teachers’
experience and knowledge, allowing for local
character and teacher/school autonomy. The
Australian Curriculum provides a framework to
clarify purposes and outcomes, and would be
inappropriately used as prescribing a tightly
constrained set of experiences. Instruments
should be developed to explicitly clarify and
support approaches to school science and
mathematics that are known to engage students
in quality learning.
While assessment and accountability measures
are important to track progress, they should
not invite comparisons between schools or
teachers, since this has been shown to have the
effect of de-skilling teachers and narrowing the
experience and motivation of students.
111

Key finding 8.2: Standardised tests of student achievement
A number of high performing STEM
countries monitor achievement through
standardised testing regimes. There
was some evidence presented of
negative effects of high accountability
regimes in narrowing the curriculum
and de-skilling teachers. At the other
end of the standardisation-autonomy
scale, most countries had instituted
initiatives that supported local
autonomy and contextual variation.
Standardised testing of student
achievement in STEM is a useful way of
mapping progress at systemic level and
among sub-populations, and can be used
to diagnose gaps and problems at macro
and micro levels.
112
v. Curriculum structure
A fifth choice apparent in these reports is the
relative effectiveness of increasing participation
in science and mathematics through invigorated
curriculum content, compared with restructured
curriculum. While there is a lot of focus on
curriculum content as the key to improving STEM
engagement, the United Kingdom consultants’
report argues that the greater influence over
time on participation in science and mathematics
is the changing structures of choice in school
subjects. In the United Kingdom there has been a
marked increase in science participation at General
Certificate of Secondary Education (GCSE) with
the introduction of double and triple unit science.
However, recent analysis (Banner et al, 2010) failed
to find evidence of the hoped-for increased social
mobility aimed at by the reforms, finding instead
that the increased diversity of provision of science
offerings may be leading to increasingly stratified
student take up, particularly with regard to gender,
and SES. Structures vary widely between the
different countries. There are very different patterns
of subject choice and compulsion, and in the
structure of curriculum and the place of vocational
studies and academic studies, and articulation
between these and into higher education.
vi. Pedagogy
All of the advanced industrial countries
comparable to Australia (United States and
Canada, United Kingdom, Europe, Asia) favour
similar kinds of curriculum reform, shifting from a
heavy content focus in science or an instrumental
approach to mathematics, towards inquiry,
problem solving, creativity and critical skills.
Correspondingly, all these countries are focused
on establishing pedagogies that are student-
centred and inquiry based, with support for a
variety of student competencies.
Most of the consultants’ reports discuss
widespread reform of pedagogies in school-
based science and mathematics curricula. In
high-performing Asian countries such as China,
New Curriculum Reform involves the incorporation
of inquiry based, creativity-focused, student
centred learning with reforms supported
by textbook revision, teaching resource
material preparation and teacher professional
development. Similarly in Singapore, the Teach
Less, Learn More and Thinking Schools Learning
Nations initiatives involve moving away from
the traditional dependence on rote learning
and repetitive tests to discovery-based, student-
centred learning that engages students and
promotes lifelong learning. Many countries in
Western Europe have embraced inquiry based
education, particularly with respect to science
education, and learning which involves real-world
contexts. Others actively encourage evidence
based or empirically-validated teaching strategies
including France and the United States.
Several consultants’ reports explicitly referred
to the role of information technology in school
education, either generally, or with respect
to science and mathematics specifically. For
example, in New Zealand ICT-based initiatives
include the Laptops for Teachers scheme, School
Network Upgrade Project, rollout of ultra-fast
broadband, e-learning teacher fellowships and
the Virtual Learning Network. In Portugal, the
Technological Plan supported the introduction of
high-speed internet access in schools, purchase
of IT equipment including laptops, development
of portals for sharing digital resources, and
projects such as the Virtual School and Mobile

113
School. ICT use is encouraged throughout the
curriculum. While ICT use is referred to frequently
in descriptions of initiatives, there was not
sufficient depth to these descriptions to allow
a close analysis of the impact and success of
these, that would significantly inform Australian
practice. These reports could be usefully mined
to provide the basis for a more in depth study of
comparative ICT innovation to potentially inform
Australian ICT strategies for STEM.
The ‘problem’ is mostly cast as a traditional
curriculum and teaching approach that fail
to excite students. The solution is a focus on
developing teachers’ capacities to enact new
pedagogies in the face of considerable inertia
in practice. In China the issue of traditional
lecture style teaching is explicitly described, and
policy is framed in terms of the need to support
teachers through developing resources and
supporting teachers to be more responsive to
students’ ideas. In Japan there is an established
system of discussion of lesson designs based
on eliciting and working with students’ ideas.
The issue, therefore, of establishing engaging
student-centred teaching and learning
approaches looks different depending on the
prevailing culture in the country. In traditional
Chinese culture the status of the teacher, the
tradition of transmission of highly valued
abstracted knowledge, and the preference
for theory over practice, places particular
challenges for pedagogical transformation.
These sought after pedagogies emphasise
competencies in problem solving and scientific
investigative process, and higher order thinking.
The argument is centred on the curriculum
objective of developing a workforce that will
support innovation in research and development,
and be flexible in the application of skills. This
flexibility is particularly important in late modern
societies where the notion of a committed
career within a single workplace has given way
to requirements for youth to develop a portfolio
of skills and experience to confer advantage in a
variety of positions.
A key argument in favour of this policy approach
is the fact that STEM graduates often find
themselves in work only tangentially related
to their qualifications. These arguments are
consistent with findings in the research literature
that scientific workers utilise their knowledge of
scientific processes and their analytical skills built
around scientific methods, more so than explicit
conceptual knowledge that they often learn on
the job (Duggan & Gott 2002).
Australia has a long standing commitment to
inquiry based and problem solving pedagogies
and scientific and mathematical literacy aims.
Australian educators have been at the forefront
in promoting these ideas internationally. The
problem, however, lies in the inertia of schools
and teachers in adhering to traditional teaching
approaches. This situation is reinforced by strong
traditions of assessment that fail to support
curriculum and pedagogy intentions, maintaining
a focus instead on testing comprehensive
coverage of concepts at a relatively low level of
reasoning and problem solving. The situation is
often exacerbated, particularly in mathematics,
by the number of out of field teachers in
mathematics classrooms. Such teachers often do
not choose to attend professional development
events in their out of field subject.
Based on the experience of other countries with
comparable reform agendas, the solution must lie
in dedicated teacher professional development
in conditions that support significant changes
in orientation and belief in relation to teaching
in mathematics and science. The professional
development of teachers in science and
mathematics is discussed further in Section 9.

114
Teachers and teaching
The consultants’ reports identify a large number of strategies
and programs focused on STEM teaching excellence. These
include teacher education focused initiatives, teaching career
and school structure considerations such as leadership, teacher
input into school decision making, classroom autonomy,
teaching standards, and rewarding the best STEM teachers.
Reports also focused on teaching resources, including science
and mathematics projects, teaching and instructional materials
and best practices, teaching tools, innovative teaching
methods/pedagogy, curriculum materials, and assessment
resource banks. In addition the consultants’ reports identified
professional development opportunities, including general
learning and discipline-specific continuous professional
development, workshops, higher education such as Masters
programs, peer group projects, in-school lesson evaluation
and co-teaching, culturally responsive instruction, funded
professional development days, teacher visits to industry; and
highlighted the importance of teacher networks, and the value
of teachers undertaking and showcasing education research.

115
Teacher status, training, continuous professional development and career trajectoryMost consultants’ reports provide information
describing processes and issues around the
teaching profession itself, including recruitment
and training, continuous professional
development, career structures, and the nature
and quality of teaching. Teacher credentialing
emerges as a significant issue in countries with a
low education participation base, such as South
Africa or Brazil. In advanced countries the United
States stands out as the country significantly
concerned with teaching quality, with the
issue tending to be characterised in terms of
teaching workforce quality. In Australia there has
also been a robust discussion at government
level and in the media concerning the quality
of Australia’s teaching workforce, with some
emphasis given to ‘failing teachers’. This seems
ironic given the scores of Australian students on
the PISA and TIMSS science and mathematics
tests ahead of a number of countries in
which teachers are held in high regard.
In Asia a primary concern in relation to STEM is
retraining teachers to support the introduction
of new pedagogies, with no implications for an
essentialised notion of teacher ‘quality’. Teachers
are highly respected in East Asia and Singapore, a
phenomenon that is customarily associated with
Confucian traditions. The Finland consultants’
report also emphasises high respect for teachers
and trust in their professionalism. There are many
references to the high entry conditions and
status of teachers in European countries and also
the United Kingdom. Thus, in most of the reports,
the focus on teachers relates not to any lack of
professionalism or competence, but to a need for
re-training implied by the significant changes in
pedagogical approach being promoted – towards
inquiry, reasoning and problem solving, and a
wider skill set generally – away from traditional
conceptions of school science and mathematics.
There is general acknowledgement of the
significant nature of this shift, and of the time
and resources needed.
A number of the consultants’ reports emphasised,
through descriptions of teacher focused programs,
the need to involve teachers in these changes.
One difference that is apparent in comparing the
consultants’ reports is the level of commitment
to a specific disciplinary program supported by
teachers trained in that discipline. In much of
Europe and in China the sciences are taught as
distinct disciplines at secondary level, compared
to Australia’s integrated curriculum. Australian
teachers are thus required to be more flexible
in dealing with knowledge outside their major
discipline area. Further, science teachers in
China almost always teach in their science major
discipline area. The difference also shows up in the
teaching of science and mathematics in primary
schools by specialist teachers. The structural
elements of the curriculum, and the manner in
which teaching labour is trained and deployed,
impact disciplinary commitment and depth.
In the consultants’ reports a number of inter-
related differences relating to teachers stand out:
• The entry level for teachers is high in many
countries, and entry into teacher education
is very competitive compared to Australia. In
Finland a discipline-specific Masters degree
is required. In China and other countries
teachers increasingly have higher degrees.
• In most European and in Asian countries
teachers enjoy high status. This was explicitly
emphasised in the Finland, French, Chinese,
Korean, Japanese, and Singapore consultants’
reports. Status is in each cased framed within
a number of facets of the culture, including
public respect for theoretical knowledge,
perceptions of the importance of education
for social betterment, and professional
conditions. Another facet is balance of
commitment to community values as distinct
from individualistic approaches. In China
there is a strong belief in knowledge as a
communal good, and teaching is seen as
having the important function of transmitting
communal knowledge. This is in contrast to
the lower status of transmission of knowledge
as compared to its production in the United
States and other English-speaking countries.

116
• There are major differences in the
organisation of continuous teacher
professional development and the degree of
autonomy in planning teaching and learning.
Continuous professional development is
built into teacher career trajectories in many
countries, and school based autonomy and
teacher collaboration is a strong aspect of
Asian systems and many European countries,
including Finland.
• Related to continuous professional
development is teacher career structure.
The link is more obvious in some countries
than others. In China, teaching standards
and career structures are linked explicitly to
professional development. To be promoted to
a higher salary level teachers must participate
in mandated subject-based professional
development – not generic professional
development as often predominates in
Australia – and achieve a higher standard of
performance in teaching their discipline. In
Singapore there are emphases on mentoring
and continuous professional development
and a career structure based on professional
growth, including a strong focus on potential
leaders. The Singapore consultants’ report was
the only report that specifically mentioned
performance bonuses as part of the suite of
measures. The consultants’ reports indicated
that other countries framed teacher rewards
as part of an orderly career structure.
• There were few instances mentioned in the
consultants’ reports of teaching in discipline
areas for which teachers were not trained.
The United States consultants’ report and the
Brazil consultants’ report were exceptions. The
phenomenon of teaching out of field is much
discussed in the United States consultants’
report and research literature (Hobbs, 2012).
In Australia teaching out of field is a major
problem. An ACER study found that in years
7-10 mathematics, only 61.5 per cent of
teachers had two or more years’ tertiary
mathematics (the minimum required to teach
mathematics subjects in most countries).
Thus more than one third, 38.5 per cent, were
teaching out of field, and 23.3 per cent had
no tertiary mathematics at all (McKenzie et al,
2011). The Mathematics, Engineering & Science
in the National Interest report of the Office
of the Chief Scientist (2012b) found that of
teachers teaching years 7-10 mathematics,
24 per cent of those working in metropolitan
schools and 31 per cent in provincial towns
have no mathematics training at university
level. Of those teaching mathematics at years
11-12, 12 per cent in metropolitan schools
and 16 per cent in provincial towns had no
mathematics training at university level. These
problems are less likely to occur in schools
serving high SES families. Faced with staffing
shortages 46.7 per cent of government school
principals require teachers to teach out of
field and 57.3 per cent of Catholic school
principals, compared with only 14.3 per cent
of independent school principals. There are
similar, if not quite so pressing, concerns
with science teachers, especially in the
physical sciences. While senior school physics
and chemistry teachers are predominantly
qualified and experienced, the majority of
teachers of science across the 7-10 years
are biology trained (Goodrum et al, 2012).
Mathematics teaching out of field is a very
serious deficiency in Australian education
(ibid, Tables 2.3.6 and 2.3.1).
• The United States consultants’ report
described at least one initiative involving
differential pay for mathematics and science
teachers consistent with their earning power
outside of schools. There were no other
references to differential pay scales in the
consultants’ reports.
• The United Kingdom consultants’ report
described how devolution of professional
development provision to schools
had decreased access to professional
development in science and mathematics
in favor of professional development on
a whole school basis. This corresponds
with findings in the Australian research
literature (Tytler et al, 2011). In an era
focused on literacy, numeracy and general
education, science professional development
provision in particular has suffered.

117
Key finding 9.1: Career pathways for STEM teachers
STEM-strong comparator countries have in
common the high status of teachers, and
high entry level into the profession.
9.1.1 Strong STEM performing
countries particularly in Asia have
meritocratic career structures that
recognise teaching excellence.
Australia could develop a specific
and integrated career pathway
for mathematics and science
teachers, one that would be
common to all schools and
based on teaching effectiveness,
innovation and leadership closely
tied to recognised continuous,
discipline-based professional
learning. The Australian Professional
Standards for Teachers, developed
by the Australian Institute for
Teaching and School Leadership
(AITSL), provide one possible
basis for such an approach.
9.1.2 Higher degrees for teachers are a
feature of some high performing
countries such as Finland. Australia
could consider the scheme put
forward by the Academy of
Science to attract PhD graduates
in mathematics and science into
a teaching career. The Academy
has recommended that:
… enhanced career pathways
be established to promote the
recruitment of science PhD
graduates into teaching. This would
provide an alternative path for
PhD scientists who wish to move
out of research careers. It would
also ensure that schools have
science teachers who are not only
passionate about science but are
able to draw on their research skills
and expertise to engage students in
‘learning by doing’ – an approach
which has already been shown to
increase student performance.
Key finding 9.2: STEM-specific salaries
There are a few examples of differential
salaries or incentives for teachers in the
STEM area to attract and retain science and
mathematics teachers particularly in hard-
to-staff schools.
9.2.1 One possible incentive strategy
is to provide higher rates of pay
for teachers of mathematics and
science with honours or higher
degrees.
9.2.2 Another possible incentive strategy
is to provide bonus starting pay for
mathematics and science teachers
at schools in low SES schools and
regional and remote schools,
similar to the United Kingdom’s
‘golden welcome’ scheme.
These comparisons represent key findings, and
have important implications for how best to
support teachers to develop and implement
new practices. The structure of the reports did
not allow for in depth analysis in each country’s
conditions regarding, for instance, teacher career
pathways and support structures for professional
learning. The literature contains, however,
comparative analysis on some of these issues
(see for instance the Jensen et al., 2012 Grattan
Institute report “Catching up” comparing Australian
practices with high achieving Asian countries).
Career pathways and salary scales
It is often argued that the status of teachers
in Australia needs to be lifted, and that entry
into the teaching profession should be more
competitive. The consultants’ reports strongly
confirm Australia’s disadvantage in this regard.
However, there is nothing in the consultants’
reports, or particularly the international
comparisons, to indicate that Australian teachers
are less professional than teachers in these
countries. Nevertheless, teachers in some
high performing countries have a number of
advantages over Australian teachers in their levels

118
A strong feature of some international
jurisdictions is the development of an
evidence based national approach to
professional development of mathematics
and science teachers. In high performing
Asian countries in particular there is a strong
tradition of school-based professional learning
through collaborative planning.
9.3.1 One way to strengthen depth of
content in STEM at school level is to
engage secondary school-level science
and mathematics teachers in sustained
discipline-specific professional
development programs, focused on
pedagogical content knowledge and
content knowledge that are not part
of generic professional development
programs common to all teachers.
9.3.2. Professional development for
teachers of mathematics and
science could support teachers
in the implementation of the
Australian Curriculum in Science,
Mathematics and Technologies, and
include, as key characteristics:
• an evidence-based approach
• use of international experience,
and experience at state level
• a framework linking professional
development with the acquisition
of higher degrees in mathematics
and science education, supported
by financial incentives.
9.3.3 Consistent with the findings
summarised in Sections 5 and 8,
discipline-specific professional
development could address methods
of problem solving, inquiry-based
approaches, critical thinking and
creativity, and other methods
designed to increase student
learning and engagement with
science and mathematics; and also
take into account the diversity of
the student population and the
need to enhance inclusion and
performance among students from
social groups presently under-
represented in STEM (see Section 5).
Key finding 9.3: Discipline-specific professional development in secondary education
of training (e.g. the Masters as a threshold degree
in Finland, and less instances of teachers teaching
out of field compared to Australia), in achieving
high professional levels, and in accessing support
for improving practice on a continuous basis.
Professional development of teachers of mathematics and science
A strong feature of some international
jurisdictions is the development of an evidence
based national approach to professional
development of mathematics and science
teachers. The starting point here is recognition
that it is crucial that professional development
is centrally concerned with discipline-based
programs, rather than being predominantly
programs generic to all teachers (Tytler et al,
2011). The approach to professional development
should be tailored to supporting teachers in the
implementation of the Australian Curriculum
– Science, Mathematics and Technologies. In
addition, professional development could be
linked to the development of higher degrees in
mathematics and science education supported
by financial incentives for teachers.
Australia has a low incidence of primary school
teachers with major studies in science or
mathematics, compared to our major comparator
countries. The United Kingdom has established
a national program of training for specialist
teachers of primary school mathematics who take
leadership responsibility for the teaching of these
subjects in their schools. Experience in Australia
supports the notion that an enthusiastic and
knowledgeable science or mathematics teacher
within a primary school can play an important

119
role in increasing the quality of curriculum and
pedagogy. Victoria is currently trialling this
approach for both mathematics and science, and
the evaluations to date have been very positive.
Teaching ‘out of field’
The incidence of teaching out of field for
mathematics and science in Australia, especially
in regional and rural areas, indicates an urgent
need to attract more qualified teachers into the
profession. It is unacceptable to have teachers
in front of classes who do not have the requisite
knowledge and skills to inject enthusiasm and
knowledge. The possibility of coherent planning
is limited, given that the government does
not collect figures on the number of teacher
education graduates in the specific science and
mathematics areas they are qualified to teach.
Key finding 9.4: ‘Out of field’ teaching
The incidence of ‘out of field’ teaching
in science and mathematics is especially
high in Australia by comparison with
other countries. Arguably, this is a crucial
weakness of Australian education,
impairing both the breadth and depth of
STEM learning, especially in government
and Catholic schools. One possible
strategy would be a national timetable
for elimination of out of field teaching in
STEM in Australia, coupled with monitoring
of graduates from teacher training and
rigorous discipline-specific professional
development training programs, linked
to monetary incentives and leading to
a qualification, for teachers currently
teaching ‘out of field’ in science and maths.
Key finding 9.5: Science and mathematics teaching in primary schools
There is a serious focus in all countries
on the quality of mathematics and
science education at the primary
school level. Many countries mirror
concern in Australia with the adequacy
of current provision at this level.
The foundations of STEM competence
are laid in early childhood and primary
education. This suggests the need to
lift the confidence and competence
of primary teachers in the teaching of
science and mathematics. One model
would be a scheme akin to that of
the United Kingdom, whereby trained
specialist mathematics leaders have
responsibility within their schools for
overseeing mathematics teaching skills
and approaches, and for developing the
relevant learning resources.

120
Government research strategies and funding arrangements are
often STEM, or science and technology, specific. For example, the
Canadian Mobilizing Science and Technology to Canada’s Advantage,
(2007) report established a strategy for science and technology
research involving: the development of national advantages
(entrepreneurship, knowledge, and people); increasing private-
sector investment in science and technology; sustaining the
public standing of science and technology; and providing
funding for science and technology students and researchers.
The Canadian strategy is implemented via science and
technology research funding agencies including the Tri-Council
Granting Agencies. The Canadian Industrial R&D Internship
Program involves tripartite arrangements between universities,
industry and government to support world-class research and
graduate research students and post-doctoral fellows, and foster
technology-transfer between universities and industry.
In Israel, students excelling in science and mathematics
are encouraged and supported for example, through the
Atuda (academic reserve) program and Talpiot program,
several of which integrate academic studies in science and
The R&D workforce

121
defense-related research and development.
The consultants’ reports identified a series of
initiatives to increase participation of indigenous
university students, including scholarships,
mentoring, internships, supplemental instruction,
bridging programs, and preparation for pre-
requisite science and mathematics courses.
In Japan, internships are offered for doctoral
students, and programs are run which target
science and technology honours students. More
generic in nature, the South African R&D Strategy
(2002) identifies government initiatives aimed at
enhancing science and technology research and
development through tax incentives, competitive
grant funding, the Research Chairs Initiative,
Centres for Excellence, and Competence and
support for ‘big science’ (such as the successful
bid with Australia for the Square Kilometer Array
radio telescope).
Perhaps the principal aspect of these policy
approaches is strategies and programs for
forming, attracting and retaining high-skill
human capital in the STEM disciplines.
Doctoral training in STEMThe majority of the consultants’ reports for
specific countries focus on the supply of
STEM doctoral graduates. For the most part
nations with developed or emerging research
capacity are increasing doctoral graduates in
STEM more rapidly than STEM graduates at
first-degree level. Further, in many countries
doctoral graduates in the STEM disciplines are
increasing faster than doctoral graduates in
other fields. For example, between 2002-2003
and 2009-2010 in the United Kingdom, Higher
Education Statistics Agency data show that
total non-STEM PhD qualifiers increased by 4
per cent while STEM PhD increased by 8 per
cent. Numbers in mathematics increased by
21 per cent, in physical sciences by 9 per cent,
computing by 6 per cent, and engineering
and technology by 6 per cent. There were falls
in biological sciences and medicine. Between
2005 and 2010 the number of PhD graduates
in Canada increased by 31 per cent overall but
39 per cent in mathematics and statistics, 48
per cent in the physical sciences, 65 per cent in
engineering, manufacturing and construction,
and 134 per cent in the life sciences.
Between 2005 and 2009 Australian doctoral
graduates increased more rapidly than in the
United Kingdom, slightly faster than in Korea but
less rapidly than in the United States and Canada.
The supply of doctorally-trained STEM
personnel is essential to both national research
effort and the reproduction of the research
university systems that provide most of the
education in the STEM disciplines at degree
level. However, national research capacity
and the Australian research and development
and innovation system are discussed only
briefly in this report. These elements are not
specifically included in the terms of reference
for this project, and arise elsewhere in the SAF
program and in government consideration.
Table 13: Doctoral graduation rates, select countries, 2005-2009
Country 2005 2009 Growth 2005-2009
Canada 4,116 5,440 32.2%
United States 52,631 67,716 28.7%
France 9,578 11,941 24.7%
Australia 4,886 5,808 18.9%
South Korea 8,449 9,912 17.3%
United Kingdom 15,778 17,651 11.9%
Japan 15,286 16,476 7.8%
Germany 25,952 25,527 -1.6%
Source: OECD 2012a, Education at a Glance 2012: OECD Indicators, OECD Publishing, Paris.

122
Among the matters discussed by the consultants:
• Universities in the United States implement
a range of strategies to attract ‘world-class’
domestic and international students, early
career researchers and researchers.
• In China engineering, which is
overwhelmingly dominant in national
research funding, is much the largest field of
STEM doctoral training. Between 2005 and
2010 the number of entrants to doctoral
programs increased by 14.3 per cent in
engineering, 19.6 per cent in natural science
and 25.7 per cent in agriculture, though it
declined by 4 per cent in medicine.
• In Taiwan in 2011, 13,248 of the 33,686
doctoral students (39.3 per cent) were
enrolled in engineering. There were just 4,745
in science and 3,563 in medicine.
• In Korea between 2008 and 2012 the
number of doctoral graduates in engineering
increased from 2,078 to 3,050 (46.8 per cent)
while those in natural science increased from
1,592 to 2,242. Engineering graduates were
25.2 per cent of all doctoral graduates in 2011.
• In Japan 43.5 per cent of doctoral graduates
in technologies enter private companies,
in contrast to 22.0 per cent in science and
7.9 per cent in health. Concerns about the
supply of doctoral researchers, especially in
science, have led to government action. The
consultant for Japan reports that:
One of the policies to support career
development of young science and
technology researchers is a five-year
grant for universities and research
institutions titled ‘Improvement of Research
Environment for Young Scholars’, started by
JST in 2006. The program allocates up to 200
million yen per year to 9-12 universities and
institutions. In 2012, total budgets for this
program increased to 7.5 billion JPY per year.
Selected institutions install a ‘tenure track
system’ in which up-and-coming researchers
are given fixed-term employment while they
gain experience conducting independent
research. Upon passing a strict evaluation
at the end of the contract period, these
young researchers are given tenure
positions. Although the program is not
restricted to STEM fields, it is designated at
host institutions as ‘research organisations
currently striving to become world-class
research bases’, effectively singling out most
universities and institutions with strength in
science and technology fields.
… the ‘Young Researchers Training
Program for Promoting Innovation’
promotes internships for doctoral course
students and postdoctoral fellows in
private sectors in order to establish a
variety of career-path opportunities.
The program nurtures highly skilled
professionals who are capable of
undertaking innovative projects
and who can work competitively for
Japanese industry in a globalised
context. A chief goal of the program is
to achieve full uptake of STEM doctoral
graduates into the labor market.
• Gender imbalance (see Section 12) is a serious
weakness in STEM doctoral training in most
countries. For example, in Canada women
comprised 44 per cent of all doctoral graduates
in 2008, but 42 per cent of those in the physical
and life sciences, 26 per cent in mathematics,
computing and information sciences, and
23 per cent in engineering, architecture and
related technologies. In Taiwan more than two
thirds of all doctoral students are men.
In a number of countries there are specific
immigration policies designed to augment the
supply of doctorally trained labour. Doctoral
graduates in STEM often enjoy advantages at
the point of immigration. This intention is often
in some tension with the restrictive aspect of
immigration policies. The United States has
several schemes. The consultants’ report on STEM
in the United States notes that:
PhD graduates can remain legally and work
in the US for up to 12 months beyond
graduation on the non-immigrant F1 status.
As recently as 2007, for certain STEM fields this
period has been extended to 29 months. As
of 2011, the list of disciplines eligible for this
extension has been expanded.

123
Under the provisions of American
Competitiveness in the Twenty-First Century
Act of 2000 annually up to 65,000 H-1B visas
are issued to foreign nationals sponsored
by US companies. Additionally, each year up
to 20,000 foreign nationals with graduate
degrees from US universities can be issued
H-1B visas. Foreign nationals working in
universities and non-profit or governmental
research facilities are issued H-1B visas in
addition to the first two categories. The H-1B
is a dual-intent visa; the employer can file on
employees’ behalf for permanent residence,
the first step toward naturalisation.
In the past two years, several legislative
initiatives were discussed. While the two of
them introduced in 2011 in the House of
Representatives did not get the committees’
approval, the SMART Jobs Act initiative, later
renamed STEM Jobs Act, co-sponsored by
senators Lamar Smith and Chris Coons was
approved in December 2012 by the House
of Representatives by a margin of 245 to 139
only to be blocked a few days later by the
Senate Democrats. The final form of STEM Jobs
Act proposed the reallocation of immigrant
visas from the Diversity program (popularly
known as the Visa Lottery) to highly qualified
foreign graduates of American graduates with
advanced degrees in STEM fields. Earlier in
2012, another legislative initiative, called the
STAR Act, sponsored by Senator John Cornyn,
stipulated that STEM graduates working in
institutions receiving at least $5 million a year
in federal research grants could be granted
permanent residence. The legislative project
was referred to the House committees, but
was not enacted.
The United States consultants recommend
Australia should ‘Take advantage of the qualified
immigrant STEM workforce by providing them
with legal pathways to gaining legal residence,
while keeping a judicious balance between the
STEM workforce trained in Australia (Australian-
born and assimilates of them) and immigrants’.
The Canadian Mitacs-Globalink Internship
Program supports international undergraduate
students studying with Canadian universities
and industry research partners. In Japan, the
300,000 International Students Plan aims to attract
international students to Japanese research
programs, including those in STEM-disciplines, and
in Western Europe, mobility is one mechanism to
address STEM labour market shortages.
Building World-Class UniversitiesSeveral consultants’ reports outline government
programs and policies designed to enhance
the scientific outputs of research universities by
building ‘World-Class Universities’ more highly
placed in world rankings of research outputs (see
also Salmi 2009). This is an explicit objective of
all higher education and research systems in East
and Southeast Asia, where World-Class University
programs are linked to programs designed
to enhance the supply of doctorally-trained
research labour and to benchmark local research
activity against international leaders. Typically,
World-Class University programs involve the
designation of a group of institutions for special
development, the application of performance
targets, and the allocation of specific monies to
achieve those targets on an accelerated basis.
In Russia, a presidential target has been
established to increase the number of universities
ranking in the top 100 universities globally to five
by 2020. This target is supported by increased
government expenditure on higher education
research, stratification of the higher education
landscape to concentrate resources and promote
excellence, and strategies to attract leading
researchers and develop world class laboratories.
China’s Project 211 and Program 985 have been
much discussed in the world literatures on
higher education, and science policy. Project 211
now involves 112 universities. It consists of two
major components: the improvement of overall
institutional capacity and the development of key
disciplinary areas, including the capacity to train
high quality research and development labour in
fields of research seen as strategically significant.
Program 985 initially designated nine universities
for development as globally competitive
institutions. The number of universities has now

124
been expanded to 39. Government funding
targeted at bringing diasporic researchers
back to China makes a significant contribution
to university improvement. It enhances the
internationalisation of research and pushes
research standards closer to those of North
America, the United Kingdom and Western Europe.
In Taiwan, the Ministry of Education encourages
research universities ‘to establish interscholastic
(international) research teams or cooperate
with research institutions in specialised areas in
order to focus human resources and equipment
investments, develop key national research
areas, [and] assist with the creation of new
opportunities for integration of research and
development and innovation’. Five of the seven
designated research priority areas are in STEM.
The consultant for Taiwan notes further that:
The Ministry of Education is using competitive
funding to assist with the creation of
research universities with development
potential, boost the efficiency of overall
university instruction and research, integrate
human resources, improve university
management strategies, and establish a sound
organisational operation system. This project
has invested NT$50 billion over five years in
twelve universities (the ‘T12’ universities) to
boost their international competitiveness.
The T12 universities include both large
comprehensive universities (e.g. National
Taiwan University) and small, specialised
universities – both public and private (e.g.
National Yang Ming University, a small
university specialising in biomedical research).
The consultant for Taiwan notes that ‘the forging
of world-class universities and enlistment
of outstanding talents’ requires a long-term
investment approach’. In order to develop
internationally competitive higher education
institutions and to provide strong incentives for
universities to participate, ‘the government has
promised ten years of funding support. NT$500
million has already been earmarked for the first
five-year period’.
South Korea has had a long-standing
commitment to building the Korea Advanced
Institute of Science and Technology (KAIST ) as a
strong research and graduate training university.
The Brain Korea 21 program was launched in 1999
with a focus on supporting graduate students
in science and engineering fields. The World
Class University project of 2008-2012 set out to
recruit outstanding faculty from abroad, create
strong departments and enhance collaboration
between Korean and foreign scholars. The
emphasis on established foreign faculty was in
some tension with Brain Korea 21’s focus on local
graduate students. However in 2011, the Korean
government initiated the Global Ph.D. Fellowship
(GPS), which funds doctoral students so that
they can focus on their academic studies without
concerns about tuition and living expenses.
The program aims to educate them at a global
level to advance the level of Korean science and
technology. The program is ambitious, setting out
to prepare highest quality researchers including
Nobel laureates.
The next program, Global EXCEL (2013-2019),
is closer to Brain Korea 21. It consists of three
strands, global leader teams (30 per cent),
interdisciplinary teams (10 per cent), and
innovative teams for graduate education (50 per
cent in the natural sciences and engineering and
10 per cent in the humanities and social sciences).
According to the consultants’ report: ‘The Global
EXCEL focuses on supporting graduate students
by increasing funding for doctoral students, but
eliminating the program for international faculty
from the previous WCU project’.
East Asia and Singapore already contain a
significant number of universities comparable
to the leading Australian research universities in
their output of scientific papers and their rate of
citation. On both quantity and quality measures
the National University of Singapore is ahead of
all Australian institutions.
The 2012 Henry review of Australia in the Asian
Century recommended that the nation seek to
achieve ten universities ranked in the world’s
top 100 by 2025 (Henry et al, 2012, p.171). This
objective was endorsed by government when
the report was released. However, Australia
has allocated no special investment monies to
achieve such an objective, which appears to be
seen as an institutional responsibility rather than

125
a national one. The Australian government has
not been willing to create a special category
of high achievement research universities for
the purposes of funding and administration. It
generally applies a ‘one-size-fits all’ approach to
policies on, and funding of, all universities on
the public schedule. Accordingly the ‘World-
Class University’ policies of Australia’s East and
Southeast Asian neighbours, while constituting
a powerful shaping force in the enhancement
of regional research capacity, have no specific
implications for Australian policy at this time.
Table 14: Universities in East Asia, Singapore and Western Pacific by volume of scientific papers, 2005-2009, universities with more than 6000 papers only
Institution Volume of science papers 2005-2009
World rank on paper Volume
Proportion of papers in top 10% most cited in field
U Tokyo JAPAN 18,382 4 10.2%Kyoto U JAPAN 14,941 11 9.5%Seoul National U SOUTH KOREA 13,052 19 8.9%Zhejiang U CHINA 13,037 20 9.1%Osaka U JAPAN 12,266 25 8.1%National U Singapore SINGAPORE 11,838 29 13.8%Tohoku U JAPAN 11,736 30 7.9%Tsinghua U CHINA 11,478 34 10.8%National Taiwan U TAIWAN 11,302 35 8.9%Shanghai Jiao Tong U CHINA 10,683 40 8.2%U Sydney AUSTRALIA 10,155 45 10.1%U Melbourne AUSTRALIA 9,724 50 11.9%Peking U CHINA 9,153 53 10.4%U Queensland AUSTRALIA 9,088 54 11.8%Kyushu U JAPAN 8,462 62 6.8%Hokkaido U JAPAN 8,043 71 6.1%Yonsei U SOUTH KOREA 7,399 79 7.8%U New South Wales AUSTRALIA 7,263 82 10.6%Nagoya U JAPAN 7,203 87 8.1%Nanyang Technological U SINGAPORE 7,136 90 11.9%National Cheng Kung U TAIWAN 7,126 92 8.5%Fudan, U CHINA 7,061 94 11.1%Tokyo Institute Technology JAPAN 6,932 99 8.3%U Hong Kong HONG KONG SAR 6,820 103 11.5%Monash U AUSTRALIA 6,797 106 10.4%U Science & Technology China CHINA 6,789 107 13.0%Nanjing U CHINA 6,584 114 10.7%Shandong U CHINA 6,087 130 7.6%Chinese U Hong Kong HONG KONG SAR 6,029 131 10.1%
Source: Leiden University 2012, Leiden Ranking 2011/2012, viewed 19 March 2013, http://www.leidenranking.com/ranking.aspx.

126
Labour markets and STEM
All consultants preparing national and regional reports
were asked to furnish data on the take-up of STEM-qualified
graduates in the labour markets, and reflect on issues of
shortage/oversupply and the matching of graduate skills and
knowledge with the needs of employers. Most consultants
were unable to respond to this request at the expected level
of detail. In many countries there is a lack of relevant data.
In most countries government does not directly regulate
the education-employment relation, though it regulates
education. Therefore data are much stronger in relation to the
output of graduates than the use of graduate labour. Further,
while some countries such as Australia collect information
on the broad sectors where graduates by discipline are
employed, the practical relationship between education
and work, especially the deployment of skilled labour in the
workplace – the manner in which, and the extent to which,
graduates’ human capital is utilised at work, industry by
industry, in the short- and long-term – remain largely a ‘black
box’ for research. There is much scope for work in this area.

127
Nevertheless, some consultants did provide
suggestive data. The reports on the United States,
United Kingdom and Korea stood out. Some
consultants’ reports identified the transition from
further education to employment as a potential
source of ‘leakages’ in the STEM ‘pipeline’. For
example, in the United States, the National
Science Board recommended that the National
Science Foundation create a ‘roadmap’ to
improve STEM education from pre-kindergarten
to college. In Singapore, career service centres
provide guidance for students through career
counselling, careers fairs, industry visits, online
recruitment services and information resources.
In Japan transition support is provided for
university STEM-discipline graduates and
post-doctoral researchers seeking permanent
employment in STEM research positions.
We also commissioned a report by the National
Institute of Labour Studies (NILS) at Flinders
University, on ‘The STEM labour markets in Australia’.
International findingsThe research literature on STEM and national
(and global) labour markets is driven by varying
assumptions, and has varying and often
contradictory findings. Much of the discussion
focuses on shortages of STEM-related skills.
One characteristic of the shortages literature is
that potential and predicted shortages tend to
exceed actual and measured shortages. Other
evidence suggests that the main employment
growth is likely to be occupations that do not
specifically require STEM-related skills (though
we note that some such jobs are likely to be
filled by STEM-educated workers). A recent
EU Skills Panorama (European Union, 2012)
forecasts demand for STEM-related occupations
in the period 2010-2020. These estimates are
taken from a 2012 report on skills demand
and supply by CEDEFOP for the 27 European
nations. This suggests modest growth and
some declines in STEM-specific engineering
and manufacturing occupations. There is larger
growth in communications, computing and
also professional services. The report concludes
that: ‘Most job opportunities will be in the
“other professionals” (which covers jobs such as
business and legal professionals), “other associate
professionals” (which includes finance and
sales associate professionals, business services
agents, police inspectors and detectives), as well
as “sales and service elementary occupations”
(which include street vendors, domestic help)
occupational groups’ (European Centre for the
Development of Vocational Training [CEDEFOP]
2012, p.29).
This perspective is generally consistent with
the consultants’ reports commissioned for the
current project. The report on the United States
highlights data provided by the National Science
Foundation, probably the most useful single data
set anywhere. There were 15.8 million people
Table 15: Anticipated future employment demand in key STEM-related sectors, EU-27 countries, 2010-2020
Sector 2010 (‘000s)
2020 (‘000s)
Change 2010-2020
Pharmaceuticals 494 493 0.0%Chemicals not specified elsewhere 1,168 1,169 0.1%Non-Metallic Mineral Products 1,618 1,549 - 4.3%Mechanical Engineering 3,453 3,644 5.5%Electronics 967 980 1.3%Electrical Engineering & Instruments 2,750 2,780 1.1%Motor Vehicles 2,208 2,164 - 2.0%Manufacturing not specified elsewhere 2,204 2,206 0.1%Communications 3,011 3,156 4.8%Computing Services 3,040 3,270 7.6%Professional Services 7,530 8,578 13.9%All industries 223,219 230,847 3.4%
Source: European Union 2012, EU Skills Panorama Analytical Highlight, viewed 21 March 2013, http://euskillspanorama.ec.europa.eu/docs/AnalyticalHighlights/EngineeringProfessionals_en.pdf.

128
working as US-born scientists and engineers
in 2006, which was 10 per cent of the total
workforce. Two thirds worked in business and
industry where they represented 12.8 per cent of
the total workforce. They were also 40 per cent
of those employed in the education sector. The
consultants note a widespread belief that there
is a national shortage of STEM labour, especially
for research and development purposes, and this
belief has driven policy attention to the area.
However, some experts argue that the United
States has a surplus of STEM graduates. The
consultants also note tensions within the country
around the role of immigrant labour, some see
immigrant STEM workers as essential to national
capacity, while others argue that they drive down
wages. Similar debates play out in Australia and
in many other countries.
When considering issues of supply and demand,
the consultants find that in contrast with the
common rhetoric about a shift to knowledge-
intensive production at higher levels, generating
demand for graduates, most STEM vacancies
require a lower level of skills and knowledge than
that generally embodied in a bachelor degree:
‘Thus technician openings are experiencing a
large shortage of applicants, while positions
requiring high level skills, at the Bachelor’s and
graduate levels, are much more competitive’.
Second, in part STEM qualifications are generic
rather than pointing to specific occupations
end-on to the field of training. Some STEM
graduates go to non-STEM employment. When
doing so they tend to earn higher than average
wages. In that respect – the generic function
of STEM in the labour markets – it is possible to
identify shortage. These findings about generic
employability, and relatively strong wages, may
have implications for Australia:
STEM skills are not only needed in STEM
occupations, but in other economic sectors
as well. Given both the competitiveness
of obtaining employment in some of the
highly specialised STEM occupations, and the
transferability of STEM competencies to other
categories of occupations, it seems that part
of the STEM workforce diverts into non-STEM
– fulfilling demand in those fields, especially
when wages offered are higher than in STEM
occupations. Even in non-STEM fields, STEM
degree holders earn more on average than
non-STEM degree holders … Given this
process of diversion and the economy as a
whole demanding workers with STEM skills, a
picture emerges of a shortage in the available
workforce having STEM-related competencies.
The American Bureau of Labor Statistics
predicts that in the next decade there will be
robust growth of employment in healthcare
(29 per cent), computing and IT (22 per cent)
and mathematics (17 per cent). In professions
requiring doctoral degrees employment is
expected to grow by 20 per cent. However, of
the 20 detailed occupations that are forecast
to have the fastest growth between 2010 and
2020, only three of these occupations require
STEM training (biomedical engineers, veterinary
technologists and technicians and diagnostic
medical sonographers).
The United States consultants’ report also
focuses on immigration-related schemes that
are intended to enhance high skill STEM labour.
These issues are discussed briefly in Section 10.
Like the report on the United States, the
consultants’ report on the United Kingdom notes
a widespread belief that the United Kingdom
does not have enough science and engineering
graduates, and professional scientists. There are
also concerns that the quality of STEM graduates
may be inadequate. Here the question of demand
and need for STEM qualifications turns in part on
the economic role envisioned for STEM. Some
analyses position STEM qualifications as end-on
with STEM-specific occupations. Others, including
the Council for Industry and Higher Education
(CIHE), see STEM graduates as economically
valuable regardless of whether they go into
a STEM-specific career or not. In this context
boosting STEM is seen as a means of broadly
boosting workforce quality. Almost half United
Kingdom employers are willing to pay STEM
graduates more than other graduates. As a 2012
House of Lords report put it in broad terms, citing
the CIHE, what is needed is STEM capabilities:
… the workforce of the future will increasingly
require higher-level skills as structural
adjustments in the economy force businesses

129
to move up the value chain. These jobs of
the future will increasingly require people
with the capabilities that a STEM qualification
provides. (House of Lords, 2012)
Nevertheless, the same report also found that
STEM graduates were insufficiently informed
about potential career openings, undercutting
the generic role of STEM. The United Kingdom
consultants’ report, in referring to STEM graduates
in non STEM jobs 2011 (Department of Business,
Innovation and Skills, 2011), reports that:
… the majority of STEM graduates did not use
their STEM specific degree knowledge at work,
whether they were or were not in a STEM
related job. For example, only 16 per cent of
STEM graduates interviewed for the BIS study
believed they used their STEM skills a lot at
work. Furthermore, STEM graduates appeared
to be working in a range of occupations
across STEM and non-STEM related
employment. In contrast, however, 90 per cent
of STEM graduates interviewed felt they used
general skills learned through their degree
in their work. For employees, the broad
skills of STEM graduates, such as numeracy
and analytic skills were perceived as more
appealing than specialist subject knowledge.
The United Kingdom’s consultants’ report
also noted that the leading STEM graduates
often earned higher salaries in business and
law than in STEM occupations: ‘Overall, the
BIS report concluded that the linear and
simple view of supply and demand for STEM
graduates was not reflected in the complexity
of the employment decisions made by
STEM graduates and employers, with many
factors involved in career decisions. Thus
the linear trajectory from STEM student to
STEM professional is far from self-evident’.
The Canadian consultants’ report noted that
between 2008 and 2017, specific demand for
STEM-related occupations, including science
and engineering, is expected to grow faster
than labour demand as a whole: ‘It is anticipated
that this growth will be driven by increases in
professional business services, especially those
related to engineering, computer science,
and research and development, specifically in
the civil, mechanical, electrical and chemical
engineering fields, and other technical inspectors
and regulatory officers’. However, there is no
discussion of the potential for STEM qualifications
to function as generic preparation for work.
The Russian consultants’ report provides
relevant data related to the latter point, by
comparing field of training, broadly defined, to
actual graduate occupations in the workforce.
It finds that computing specialists (66.6 per
cent) are most likely to be working in the field
of their degree, followed by mathematicians
and statisticians (61.0 per cent), scientists and
science-based technicians (42.1 per cent),
engineers and architects (35.9 per cent) and
specialists in biological and agricultural sciences
(21.6 per cent). The report also notes that almost
30 per cent of scientists and engineers are
working in fields not requiring higher education
at all. Graduates in computing and mathematics
are less likely to be ‘downwardly mobile’:
The analysis also does not confirm the
thesis, frequently repeated by some, of an
over-production of economists and lack
of engineers in the Russian economy. The
engineering workforce trained in Soviet or
Post-Soviet time is less successful in the
labor market and engineering graduates
more likely than many other graduates to
work in a position not requiring higher
education at all. Those with technical
vocational education are even less likely
to get a job in the area of training, than
are those with university degrees.
On the other hand engineers and scientists are
more likely to be upwardly mobile. This again
points to the heterogeneity of science and
engineering graduate destinations in Russia. This
suggests that it is possible for engineering to
function as a gateway to multiple destinations,
as does science, in contrast with the more
profession-bound role on engineering degrees in
Australia. The position of engineering graduates
in Russia contrasts with that of France, where,
according to the consultants, engineers enjoy
both relatively high starting salaries and relatively
stable first jobs: ‘The 2010 national study of the
2007 cohort of graduates shows that unlike the

130
61 per cent of engineering school students who
maintained their first job, more than half of the
2007 graduates from other courses changed
jobs at least once during this first three years
in the labour market’. The position of Russian
engineering graduates also contrasts with the
position in China. The consultant notes that as in
many countries, a STEM qualification constitutes
an advantage in the labour markets and this is
particularly the case with engineering.
Notwithstanding the overwhelming dominance
of engineering students in STEM enrolments
in China, the average employment rate of
engineering graduates, 95.2 per cent, was
4.4 per cent higher than the overall graduate
employment rate. This can be partly attributed
to the high rate of investment in buildings and
urban infrastructure in China. Infrastructure and
construction are engineering-heavy activities.
STEM graduates in general, and engineering
graduates in particular, also enjoy labour market
advantages in Taiwan: ‘Among the top ten high
monthly earning industries in 2011, STEM-related
fields took eight places’.
In East Asia and Singapore, with the partial
exception of Japan, engineering graduates
are both more numerous as a proportion of all
graduates and all STEM graduates, and on the
whole more advantaged, than elsewhere. The
most extensive data in the consultancy reports
is provided in relation to Korea. In Korea ‘the
academic major and knowledge are key factors
for hiring STEM graduates when compared to
… non-STEM graduates. Similar results have
been found in the assignment of job duties
… employers consider it important to utilise
STEM graduates’ knowledge and skills related
to their academic majors’. Data for 2008 show
that engineering and science graduates had
the highest rate of graduate participation in
‘economic activities’ (91.5 per cent), comparable
to medicine and pharmacy (91.1 per cent),
though unemployment (3.5 per cent) was slightly
higher than in medicine and pharmacy (1.8 per
cent). The rate of employment of natural science
(life sciences) graduates was lower at 84.5 per
cent. As in France, and in contrast with Russia,
engineers and applied scientists were less likely
to change jobs than other graduates. Natural
science graduates were more likely to change
jobs. This suggests that in Korea a natural science
degree is likely to be more generic in function
than an engineering degree:
The main reason for changing jobs appeared
to be due to pay raises, both in the natural
sciences and engineering fields, but
those from the natural sciences tended
to get new jobs unrelated to their majors,
compared to those from engineering. In
other words, those who studied the natural
sciences experienced more difficulty in
findings jobs related to their majors.
Those who had their first jobs in the STEM
fields continued to stay in STEM two years
later in 2008, but those with jobs outside of
the STEM fields had difficulty moving into
STEM, and continued to stay in non-STEM
jobs. Those from engineering majors tended
to work for jobs within the natural sciences
and engineering field more often than those
with natural science majors.
Natural science graduates were more likely to be
in part-time work. In part this was because there
was a higher proportion of women graduates in
the natural sciences, than in engineering. Some
women prefer part-time work for family-related
reasons. On the whole science and engineering
graduates enjoyed advantages: ‘Those who
pursue expert careers in the STEM fields in Korea
tend to be males, unmarried, graduates of higher
education institutions located in Seoul or other
regions related to industries, majoring in science
and engineering rather than the natural sciences,
and high academic achievers’. Interestingly, the
consultants found that the proportion of top 100
company CEO positions held by STEM graduates
increased from 35.9 per cent in 2003 to 46.4 per
cent in 2007. The proportion of CEO positions
held by business graduates declined.
Only STEM doctoral graduates overwhelmingly
matched training and job. The majority of first-
degree graduates were working out of field:
The level of match between academic
major and job is generally better with STEM
graduates than those from the humanities and
social sciences, but not those from medicine
and pharmacy. The match is also better

131
with college graduates from engineering
majors than those from the natural sciences.
However, according to a recent study, only
42.4 per cent of STEM college graduates were
working for jobs in the natural sciences and
engineering. This result gets better only with
those with advanced education: 64.7 per cent
for master’s degree holders and 90.0 per cent
for doctoral degree holders in the natural
sciences and engineering.
There are some concerns in Korea that the
STEM curriculum has become ‘old-fashioned’,
in that it is too focused on the manufacturing
sector, though industry is ‘switching to a
service industry based on a manufacturing
or tertiary industry. It has been reported that
more than the half of employers consider STEM
graduates not to have adequate competence
to match what companies require for jobs’. On
the question of future shortage or oversupply
of STEM graduates in Korea, different studies
have produced conflicting findings.
Australian reportThe NILS study notes that according to the
2011 Australian census, STEM graduates have
high employment rates (81 per cent) and low
unemployment rates (4 per cent) compared
to graduates from most other disciplines. This
is consistent with patterns in other countries.
Compared to engineering (10 per cent) and
computing (12 per cent) graduates, graduates
from the natural and physical sciences (18
per cent) were more likely to be employed
part-time. In part this is a consequence of
the male domination of engineering and
computing: whereas most men want full-time
work, some women opt for part-time work for
family reasons. There is much variation within
these three broad categories of graduates. For
example, whereas just 53 per cent of graduates
in the natural and physical sciences were
employed full-time in 2011, in mathematics
and statistics the rate of full-time employment
was 67 per cent, similar to engineering at 69
per cent. This reflects variations in the gender
composition of the three broad groups.
Again using the 2011 census data, NILS notes
that the three largest occupational groups
for employing STEM graduates are Design,
Engineering, Science and Transport Professionals,
ICT Professionals, and Specialist Managers.
Between 2007 and 2011, employment in the
top eight STEM occupations grew by an average
of 11.1 per cent compared to overall growth
of 8.1 per cent in all occupations. The total
number of employed Design, Engineering,
Science and Transport Professionals grew
by 23.1 per cent. We note that these data
understate the number of STEM-trained
persons working in education. The census
asks respondents to report on their ‘highest
qualification’. School teachers with bachelor-level
science degrees who have also completed an
education qualification at graduate diploma or
masters level report their discipline of highest
qualification as ‘education’ rather than ‘science’.
NILS also provides recent (2011) data on private
financial rates of return to the costs of study by
STEM qualification. These are compared with the
average returns of 15 per cent for men and 12
per cent for women for all graduates. The rate
of return was highest for IT graduates – 17 per
cent and 15 per cent respectively – followed by
engineering (15/14 per cent), mathematics and
statistics (13/12 per cent) and science (10/11
per cent). Since these data were prepared the
labour market for computing graduates has
weakened, however. The rates of return to the
study of science and mathematics are lower
than the average for all graduates. The returns
to engineering are above average for women
and about average for men. They note that
these estimates for the most part exclude STEM
graduates who are teachers, for the reason given
above. Since teachers get about average pay,
it is unlikely that their inclusion would increase
the estimated rates of return to science and
mathematics graduates.
Data on job vacancies six weeks after advertising
show engineers and geologists are in shorter
supply than medical laboratory scientists and
secondary teachers (Table 16).

Likewise data from the Graduate Careers Australia
(GCA) indicate that employers experience relative
difficulty in hiring graduate engineers and more
so, computing graduates.
NILS cites further 2007-2011 GCA data to
show that less than two thirds of recent STEM
graduates work in jobs that are directly matched
to their education. Engineering graduates are
the most likely to be working in their field of
training (79 per cent in 2011) compared to
computing graduates (60 per cent) and graduates
in the natural and physical sciences (only 44
per cent). This underlines the relatively generic
use of science degrees in Australia, compared
to the relatively professionally-focused use of
engineering degrees in Australia. The professional
focus of engineering degrees is also associated
with relatively high annual earnings compared to
science degrees (Table 17)
When discussing STEM graduate employment
both government and popular opinion tend to
assume that all STEM training is directed towards
specific occupations. However, like graduates in
arts and the humanities, and business studies,
Table 16: Recruitment experiences of employers that use STEM skills intensively: 2007-11 (Proportion of vacancies unfilled six weeks after advertising)
ANZSCO code Occupation name 2007 2008 2009 2010 2011
2332 Civil Engineer 67% 69% 45% 62% 60%
233512 Mechanical Engineer 66% 70% 32% 49% 68%
233513 Production or Plant Engineer 58% 39% 67% 13% n/a
234611 Medical Laboratory Scientist 26% 38% 36% 14% 18%
133211 Engineering Manager 62% 54% 31% 47% 50%
233311 Electrical Engineer 55% 86% 44% 49% 62%
234411 Geologist 49% 75% 41% 71% 67%
241411 Secondary School Teacher 14% 16% 5% 15% 13%
233611 Mining Engineer (excluding Petroleum) 69% 85% 46% 66% 58%
233612 Petroleum Engineer n/a 100% 45% 66% 100%
Source: DEEWR n.d., Survey of Employers who have Recently Advertised (SERA), cited in the NILS report.
Table 17: Changes in selected labour market outcomes for recent university STEM graduates, four months after completion: 2007 to 2011
FIELD OF EDUCATION 2007 2008 2009 2010 2011
Mean Full-time Annual Salary ($ 000s)
Natural and Physical Sciences 47.1 49.5 51.8 53.4 55.3
Information Technology 50.2 53.3 56.8 55.0 58.7
Engineering and Related Technologies 55.0 58.9 62.1 61.6 64.8
Total STEM 51.5 54.7 57.8 58.0 60.9
Education Well-Matched to Job (%)
Natural and Physical Sciences n/a 49% 44% 43% 44%
Information Technology n/a 60% 59% 59% 60%
Engineering and Related Technologies n/a 80% 79% 76% 79%
Total STEM n/a 61% 58% 57% 60%
Source: Graduate Careers Australia, Graduate Destination Survey (GDS) unit record files, cited in the NILS report.
132

graduates in science in Australia find themselves
working in many different fields. Many graduate
jobs do not require a science-specific degree.
The generic role of science degrees in Australia
has parallels in most countries included in this
project. The position of engineering is more
variable. Whereas in Australia there is a strong
nexus between engineering study and graduate
professional work, engineering plays a broader
role in China, Korea and Russia.
As was noted above, this larger generic potential
of STEM learning and qualifications is discussed
in the consultants’ reports on the United States
and United Kingdom. As the United States
consultants’ report puts it: ‘STEM skills are not
only needed in STEM occupations, but in other
economic sectors as well’. If we take the view that
STEM disciplines can provide useful foundations
for many occupations – whether with or without
additional study – the question of shortage/
oversupply changes. For example, if engineers are
in oversupply relative to professional engineering
jobs, the surplus engineering graduates
nevertheless are potential employees in business
and government. And there may be a need for
more such generic engineering graduates. We
note that an expansion of the generic functions
of engineering would not necessarily increase
average salaries. Some generic qualifications (e.g.
law) are associated with above average private
rates of return. Other generic qualifications (e.g.
science, humanities) are not.
We need to know more about the uses of STEM
knowledge and qualifications in Australian labour
markets. We also need a more precise description
of the STEM-trained workforce in teaching than
the census data provide.
Key finding 11.1: Specific and generic roles of STEM education and training in relation to the workplace
There is a lack of clear data in Australia
concerning destinations of STEM graduates
and the role of STEM training in a variety
of professions. There is also lack of data on
qualifications of teachers of STEM.
11.1.1 A key need is data concerning the
destinations of STEM graduates
(whether at the level of first
degree, postgraduate coursework
or postgraduate research) in the
first 5-10 years after graduation,
identifying the respective roles of
STEM education and training in
relation to:
• work specific to the STEM
qualification
• work that is outside field but
within STEM
• work in occupations with no
specific STEM requirements that
may nonetheless draw on STEM
graduates’ skills and knowledge
in a more generic manner.
Such data gathering could also
include:
• review and audit of occupations
requiring STEM qualifications
• comparison of the labour
market outcomes of STEM
graduates by field, with those of
non-STEM graduates
• factors that facilitate and limit
the labour market mobility and
flexibility of graduates with STEM
qualifications, and employer
take-up of STEM qualifications.
11.1.2 A comprehensive survey of
secondary teachers in order to
identify the number and full
qualifications profiles of teachers of
all STEM subjects at all year levels.
133

134
Girls and women
The proportion of women employed in STEM fields in Australia
is undesirably low. A comparison with other developed
countries reveals significant scope for improvement in Australia.
The evidence presented here highlights the persistence of the
problem. A broad range of initiatives, based on international
reports, are suggested to solve this imbalance.
What is the problem?Women and girls are under-represented in STEM fields
throughout their education and career. In education, gender
based disparity in STEM has been masked by growing
numbers of female students enrolling in, and graduating
from, universities, and increasing absolute numbers
of enrolments in the fields of science and technology.
Comparative international data show that women have
been participating equitably in tertiary education for some
time (for example, Argentina, Canada, Western Europe,
Finland, and Russia). In fact, the percentage of tertiary type
A qualifications (mainly undergraduate bachelor degrees)

135
and advanced research degrees awarded to
women in Australia has remained steady at
around 56 per cent since 2000 (OECD, 2012a).
The OECD average increased slightly over the
same period from nearly 54 per cent in 2000
to 58 per cent of awarded qualifications in
2010 (ibid.). From these figures, it would seem
that inequality for women in education no
longer exists. However, an examination of the
disciplinary distribution of tertiary students
reveals a gendered pattern of participation.
Gendered patterns of participation by discipline
The gender-based stratification of participation
in STEM has roots in the expectations of students
prior to the curricular choices they make in
upper secondary school. The 2006 OECD PISA
test surveyed the career expectations of 15 year
old girls and boys internationally. In Australia
32.8 per cent of female and 34.2 per cent of
male participants expected to be in a science-
related career by 30 years of age. This was close
to the OECD average figures, although slightly
higher than the average for males. However, it
is considerably lower than the corresponding
percentages expressed by boys and girls in
Canada (girls: 44.9 per cent, boys: 39.8 per cent)
and the United States (girls: 49.4 per cent,
boys: 39.9 per cent).
There are much larger differences in other STEM
disciplines. In total 46 per cent of the boys
tested in PISA 2006 indicated an expectation of
a career in computer sciences or engineering,
compared with only 8 per cent of girls. This
reveals a slightly greater divergence between
genders than shown in the OECD average. Of
the countries shown in Figure 15, Australia has
the lowest number of 15 year old girls expecting
careers in health sciences and nursing at 64
per cent, while close to the average number
of boys (22 per cent) report this expectation.
A study of secondary participation in sciences in
Australian education found that student attitudes
and career ambitions are critical in determining
engagement in tertiary level science courses.
This research specifically found that almost
three quarters (74 per cent) of students who
studied two science subjects in their final year of
secondary school continued on to study science
related areas at university (Ainley et al. 2008). The
research on student attitudes shows not only that
young women are less positive about STEM study,
but also that there appears to be a connection
between early attitudes and the propensity to
pursue study and careers in these fields.
Denm
ark
OECD
Ave
rage
Aust
ralia
Cana
da
Unite
d Ki
ngdo
m
Kore
a
New
Zeal
and
Unite
d St
ates
Germ
any
100
80
60
40
20
0
Source: OECD 2010e, Expectations for science-related careers by gender, OECD Factbook 2010: Economic, Environmental and Social Statistics, OECD Publishing, Paris.
Figure 15: The percentage of participating 15 year-old students expecting a science related career by 30 years of age, by field and gender, in PISA 2006
Computer sciences and Engineering: Males
Computer sciences and Engineering: Females
Denm
ark
OECD
Ave
rage
Aust
ralia
Cana
da
Unite
d Ki
ngdo
m
Kore
a
New
Zeal
and
Unite
d St
ates
Germ
any
100
80
60
40
20
0
Health science and Nursing: Males
Health science and Nursing: Females

136
A recent report on secondary mathematics
and science participation in the New South
Wales school certificate notes that at secondary
level, the participation of girls in at least one
mathematics and one science subject after year
10 has been dwindling since 2001 (Mack & Walsh,
2013). The proportion of girls who elect to study
no mathematics whatsoever after year 10 has
tripled from 7.5 per cent in 2001 to 21.5 per cent
in 2011. The corresponding proportion of boys
also tripled but from a much lower base level,
from 3.1 per cent to 9.8 per cent.
At tertiary level in Australia, men outnumber
women in mathematics, statistics, sciences
(particularly physics), engineering,
manufacturing, construction and computing,
while women outnumber men in the study
of health, welfare, education, humanities,
arts, agriculture, life sciences, services, social
sciences, business and law. Similar patterns can
be observed internationally. Figure 16 illustrates
the percentage of tertiary qualifications awarded
to women by field of education in Australia
compared to OECD averages in 2010, highlighting
the gender based disciplinary divergence. While
the numbers of women studying in STEM fields
has increased in recent years, the figures still
stand below half. Female students comprise the
majority of the cohort in life sciences, while those
in engineering, manufacturing and construction
contain the smallest proportion of women.
Table 18 shows disciplinary tertiary qualifications
of women by country. Denmark and Finland
achieve the highest female representation in
fields in which women are under-represented
in the OECD averages. Australia is well below
the OECD and EU21 averages in engineering,
manufacturing and construction, sciences, life
sciences and mathematics.
In Canada, women account for more than half
of the tertiary students in all fields except for
engineering, mathematics and computing, as
well as architecture. While 44 per cent of all
doctoral graduates in Canada were women
in 2008, these women were primarily located
in education, social science, law and health.
The average was brought down in part by the
fields of agriculture, natural resources, physics,
life sciences, technology and humanities, and
most dramatically by mathematics, computer
science, architecture, engineering and related
technologies. Only 10 per cent of enrolments
in computer engineering in Canada between
1991 and 2007 were women. Female students
comprised only 23 per cent of civil engineering
students and nearly 40 per cent of those enrolled
in undergraduate programs in biosystems,
chemical or environmental engineering.
Figure 16: The percentage of qualifications awarded to women in tertiary type A and advanced research programs, by field of education, in 2010
Heal
th an
d we
lfare
Educ
atio
n
Hum
aniti
es an
d ar
ts
All f
ield
s
Agric
ultu
re
Life s
cienc
es
Serv
ices
Socia
l scie
nces
, bu
sines
s and
law
Phys
ical s
cienc
es
Mat
hem
atics
and
stat
istics
Scie
nces
Engi
neer
ing,
m
anuf
actu
ring
and
cons
truct
ion
Com
putin
g
80
60
40
20
0
Source: OECD 2012a, Education at a Glance 2012: OECD Indicators, OECD Publishing, Paris.
Australia OECD Average

137
The employment of tertiary graduates from
science related fields illustrates a similar pattern
of gender differences. Australian figures for
employment of female science-related tertiary
graduates are a little above the OECD average
and display a similar difference between men and
women. The best performing countries (with least
gender disparity) shown here are Estonia, Iceland,
Mexico, Poland and Turkey. It is interesting to
note that greater gender disparity occurs in some
of the economies with the more developed or
established science research traditions.
In a report on women in science in Australia,
Bell (2010) highlights the extent of inequality in
STEM employment. In 2008, the participation of
women in science, technology and engineering
jobs was 45.1 per cent, representing a small 2.8
per cent increase from 42.3 per cent in 1992.
For comparison, during the same period, the
percentage of women employed in government
Table 18: The percentage of qualifications awarded to women in tertiary type A and advanced research programs, by STEM field in 2010 for selected countries
Engineering, Manufacturing
and ConstructionSciences Life Sciences Physical
SciencesMathematics and Statistics Computing
Finland 21.48 46.30 76.18 50.35 47.51 28.40Germany 21.96 44.30 67.44 42.72 61.36 15.33New Zealand 30.20 44.31 58.92 45.80 47.80 23.55EU21 Average 28.39 42.29 66.80 44.85 48.88 18.75OECD Average 27.19 41.61 64.23 43.81 45.89 19.73Canada 23.50 49.01 62.64 44.80 42.45 17.91Korea 23.32 39.22 48.37 46.89 54.80 20.86Denmark 32.00 37.29 67.36 38.40 36.17 20.89Norway 26.68 36.17 74.66 38.49 31.05 19.72United States 21.67 43.50 57.94 39.38 41.61 21.08Australia 24.31 37.31 55.15 48.05 39.89 19.57France 30.05 37.62 62.71 38.70 36.15 15.81United Kingdom 22.56 37.52 50.81 42.58 40.32 18.71Switzerland 19.53 34.40 52.89 32.29 31.83 8.20Netherlands 19.51 22.66 62.35 24.22 31.97 10.94
Source: OECD 2012a, Education at a Glance 2012: OECD Indicators, OECD Publishing, Paris.
Figure 17: Number of science related tertiary graduates among 25-34 years old in employment per 100 000 of this cohort by gender, in OECD 30 countries
New
Zeal
and
Kore
a
Slov
ak R
epub
lic
Turk
ey
Finla
nd
Pola
nd
Icela
nd
Fran
ce
Unite
d Ki
ngdo
m
Aust
ralia
Denm
ark
Czec
h Re
publ
ic
Esto
nia
Irela
nd
Cana
da
OECD
Ave
rage
EU21
Ave
rage
Germ
any
Swed
en
Portu
gal
Spai
n
Unite
d St
ates
Slov
enia
Aust
ria
Mex
ico
Switz
erla
nd
Norw
ay
Belg
uim
Hung
ary
Chile
Japa
n
Neth
erla
nds
5000
4000
3000
2000
1000
0
Source: OECD 2012a, Education at a Glance 2012: OECD Indicators, OECD Publishing, Paris.
WomenMen

138
administration and defence grew 18.8 per cent,
from 37.1 per cent in 1992 to 55.9 per cent in
2008. Even more significant, the percentage of
women employed in several other traditionally
male dominated fields, while lower overall,
also increased more than in STEM fields.
For example, a 5.7 per cent rise in women
employed in mining was recorded, from 9.5
per cent in 1992 to 15.2 per cent in 2008. The
gendered patterns of disciplinary distribution
that occur during upper secondary and tertiary
education are mirrored in the workforce, with
female researchers more concentrated in
biology, agriculture and health, rather than
engineering, physics or computing (ibid.).
Japan displays the greatest gender divergence in
STEM employment, and education. Only 10 per
cent of Japanese students in 2012 enrolled in
undergraduate and masters programs in the field
of technology were female. Furthermore, females
account for only 13.8 per cent of researchers in
universities, corporations and public research
institutions. Women filled only 7.6 per cent of
STEM research positions in private corporations,
and 24 per cent of these positions in universities.
As in other countries, engineering is making the
slowest progress. Comprising just 1.4 per cent
of all engineers in 1970, women still account for
only 8.6 per cent today. In Korea, the situation
is better but far less than ideal. Female students
represented 28.5 per cent of students in STEM
tertiary programs in 2010, and only 24 per cent of
STEM students at doctoral level.
Not only is female participation in STEM
education and employment low, the attrition rate
is particularly high, with women leaving science
and other related disciplines in disproportionate
numbers at each stage of the career cycle. This
happens in highest volume at the post doctoral
level, despite the large amount of time invested
in education prior to employment. Only a quarter
of female science and technology graduates in
the United Kingdom actually gain employment
in science, engineering or technology
sectors. Others work in related jobs, including
administrative or other adjunct positions in sales
and marketing within the science or research
sector, or they pursue totally unrelated careers.
What causes are identified?There are a myriad of factors that contribute
to the under-representation of women in
STEM education and employment. These
include the perceived nature, organization
and career pathways of STEM fields of study
and employment, the availability and scope
of parental leave, small numbers of women
influencing and participating in senior roles on
funding and other decision making bodies, the
difficulty of breaking through existing disciplinary
networks, as well as a lack of effective counter
measures and policies within national systems.
As the Argentinean consultants’ report notes,
motherhood creates problems for young female
scientists in terms of the balance between work
and family demands.
Stereotypes, fuelled by ignorance of what
exactly STEM careers entail and who scientists,
engineers and other STEM professionals
actually are, create significant disincentives for
girls and women to become interested in and
pursue study and careers in STEM fields. This is
particularly the case in engineering, computer
sciences and statistics, explaining the strong
gender differences in the participation data. The
Canada consultants’ report in particular notes
young people’s persistent lack of understanding
of what engineering and technology careers
entail. This report also notes that when parents
or relatives encourage the young person
to become interested in engineering and
technology, this interest does not necessarily
translate into study or career ambition.
Research based on surveys of seventh grade
primary students in Europe revealed a striking
ignorance of STEM careers and professionals,
one that could be easily reversed. The Draw a
scientist test (DAST) is often used to investigate
students’ understandings and images of science,
identifying a number of key stereotypical
characteristics that students have learnt to
associate with scientists. Students see the
typical scientist as white, male, eccentric, and
surrounded by laboratory equipment. Research
has established a connection between these
views and students’ own ambition to engage
in future science studies. This phenomenon

139
is particularly associated with girls. Figure 18
illustrates the stereotyped image of scientists
held by young school students prior to visiting
a scientific research laboratory, and then their
altered view afterwards. The age and gender
of the person depicted in these illustrations
changed dramatically.
The report on Argentina notes traditional
perceptions that associate STEM fields as
masculine, while education and health are
seen as feminine. This translates directly into
participation levels in Argentina, with women
accounting for 25 per cent of tertiary enrolments
in physics in 2012, and 64 per cent of those
enrolled in biology in the same year. Gender
divergence in STEM employment also persists in
Argentina. Despite finishing their degrees faster
and with higher average grades than their male
peers, most female Argentinean STEM graduates
are only able to secure lower status positions.
The consultants’ report on France similarly makes
note of strong national perceptions of masculine
and feminine disciplines. Women accounted for
30 per cent less of the International Standard
Classification of Education (ISCED) levels 5 and
6 graduates from mathematics, science and
technology fields in France in 2009.
The Canadian consultants’ report notes that the
majority of women express negative feelings
about engineering and technology occupations,
citing undesirable scenarios such as construction
or outdoor work, and the probability that such
occupations focus more on computers rather
than people. There is also a lack of role models for
women in STEM careers, particularly engineering
and technology, including high school teachers
and industry professionals.
Why is it an issue?The under-representation of women in science
and other STEM fields is a problem for a number
of reasons. Five arguments are made in the
literature and by the consultants to this project.
The last is the most emphasised argument.
First, when the gender balance in STEM is
aligned with the gender balance in the real
world, it is more likely that the STEM research
will, accordingly, be better aligned, and so more
Figure 18: Seventh grade student drawings of a “scientist” before (left) and after (right) their visit to a scientific research laboratory
European Communities 2008, Mapping the maze: Getting more women to the top in research, Scientific Culture and Gender Issues, Directorate of Science, Economy and Society, European Commission, Brussels. Document Number: EUR 23311 EN, p. 13.

140
productive and relevant. Second, the inclusion of
women can boost the quality of STEM research.
Diversity of participation enables greater
aggregate creativity and reduces potential bias.
Both factors tend to improve research quality.
Third, gender equality can be supported on
the basis of social justice, fairness and human
rights. If all people are equal, then all should be
able to experience equal opportunity, including
the circumstances that enable them to engage
successfully in STEM education and careers.
Fourth, STEM research attempts primarily to
address the common needs and issues facing
the population and is financed by common
funds, such as tax revenues. It makes sense
to adequately involve all subgroups of the
population in the research process.
The final argument connects the gender agenda
to the economic imperative that drives much of
the international debate on STEM enhancement.
Improvements in participation and performance
in STEM are seen to enhance human capital and
innovation, thereby lifting national economic
growth and international competitiveness. In this
policy context, women are seen as an under-utilised
resource with the potential to boost the labour
force in this sector and provide a larger talent pool
from which to source the best and brightest. The
human capital of women who have undertaken
training in STEM and left their careers prematurely
is considered to be a wasted economic resource.
Searching for options: What can be / has been done about it?The evidence presented here highlights the
persistence of the discipline-based problem and
provides a basis for re-invigorating the agenda
on women in STEM. This report will now suggest
strategic options for Australia on the basis of the
international evidence collated in this project.
Numerous initiatives have been proposed and
implemented around the world, and are outlined
in the consultants’ reports. An important message
through these is that initiatives or changes that
are solely confined to educational goals will not
be able to entirely redress the imbalance.
Overall approach to women’s participation in STEM
A consistent and broader policy setting is
needed. Nationally consistent policy on this issue
is known as gender mainstreaming, essentially a
systemic commitment is made to gender equality
in STEM education and careers. This plays out
through a combination of elements including
political will, legislation, greater understanding
of gender issues, mandated involvement of
women on decision making bodies and to senior
appointments, more appropriate human resource
processes and funding systems.
Legislation can play a significant role. In France,
the National Ministry of Education made it a
priority to steer the career ambitions of more
young women towards the STEM fields. Equality
legislation was therefore enacted to encourage
the diversification of girls’ professional choices.
An important strategy extended legislation to
top level appointments in academia or positions
on decision making bodies, such as research
councils. Important elements of this include
procedural transparency, standardised selection
procedures, widespread publishing of position
advertisements, headhunting highly qualified
women, and monitoring gender dis-aggregated
data on selection and hiring outcomes. Norway is
a good example of the success of this approach.
At one Norwegian University, equality-oriented
searching was conducted through committees
established for the identification and recruitment
of qualified women. This can be contrasted
with the case of Canada, where the under-
representation of women in STEM has not been
a significant part of federal policy thinking or
reports on STEM fields in recent years. Women
in Canada are particularly under-represented in
STEM fields and the country has experienced
little improvement in recent years.
Active and deliberate engagement of women
in policy processes, funding and human
resource decisions has been shown to improve
participation. For example, the EU imposed
a target on expert group and committee
membership. Since the mid 2000s, all decision-
making boards were required to be composed of
at least 40 per cent of each sex. The strategy has

141
apparently successfully ‘led to a strong increase in
the participation of women on evaluator panels
for research proposals submitted’ (European
Communities, 2008, p.10).
Other policy levers include targets, quotas
and financial incentives. These can be applied
throughout secondary or tertiary education, as
well as in the workplace for STEM professionals.
In Sweden, political pressure from policy makers
to achieve targets is strong and has effectively
increased the participation of women, whilst
maintaining institutional autonomy in decision-
making and appointments. In Switzerland,
a successful program of financial incentives
has been in operation since 2000 whereby
universities are provided with greater national
governments funds for the appointment
of female professors. A range of financial
opportunities is available to women in France,
to enhance their involvement in STEM education
and employment, including from industry
sources, such as L’Oreal Paris.
Labour market conditions often drive student
choices throughout school and university
education. STEM professions, particularly in
the private sector, are noted internationally for
conditions that do not attract women, and often
create obstacles for those who enter these fields.
For example, funding is sourced externally and
grants are usually offered preferentially to those
working full-time. Also, experiments often need
to be conducted outside normal working hours
and networking is critically important to success,
making it particularly difficult for women to
balance work and family life.
Mentoring strategies
The provision of mentoring and other direct support strategies are important for improving the representation of women in STEM fields. Direct methods can address the confidence and attitudinal factors that contribute to females avoiding STEM education and careers. There are numerous examples of this throughout Europe, including the European Network of Mentoring Programs, professorial-PhD linkages in Norway, Les Femmes En Maths in France, which depicts successful professional women who graduated from mathematics and science study.
Key finding 12.1: Gender-based participation in STEM
Countries generally are grappling with the
issue of under-representation of women
and girls in STEM fields, and pursue a
variety of gender equity policies and
strategies to address this. In Australia,
women’s participation in STEM has not
altered substantially over two decades,
and there is a case to be made for re-
invigorating the agenda on women in
STEM. Comparator countries’ initiatives
could provide indications of ways
forward. Measures designed to lift female
participation in STEM, from first degrees
to research functions, could include:
• System-wide targets designed to
achieve an equitable percentage
of women in STEM disciplines.
• Scholarships and fellowships
specifically reserved for female
students and researchers, in areas
such as engineering where women
are grossly under-represented.
Such scholarships and fellowships
would be largely provided by
higher education institutions.
• Strategic reservation of funds
for women to assist their study
and establish themselves as
researchers, and/or the allocation
of greater points in funding
selection processes to projects
that include women researchers.
The absence of role models, and lack of familiarity
with STEM careers, have been identified as key
factors to address if women and girls are to be
attracted to STEM fields in greater numbers.
In France, there is a program to encourage
girls to take up scientific careers called Pour le
science. In Israel Mind the Gap! has successfully
brought young women into contact with
women working in the world’s largest internet
company, introducing them to the world of
computer science, research and development,
and internet commerce. In Korea, there is a

142
high school program, known as the Women’s
Academy for Technology Change in the 21st
Century (WATCH 21), which is intended to
attract and promote the study of the natural
sciences and engineering, through creative
problem solving and research activities.
Key finding 12.2: Mentoring programs to encourage female participation in STEM
Mentoring programs in a number
of countries have been positively
evaluated as improving women’s
participation in STEM. Examples of
mentoring programs include:
• Bringing together young women and
successful female STEM professionals
(including scientists, engineers,
mathematicians and computing
specialists) to provide authentic
understanding of STEM careers, and
access to female role models. Such
contact with STEM professionals could
start as early as primary level schooling
and continue consistently through
education and early career training.
• Peer to peer support between
high school and primary students,
or between tertiary and upper
secondary students, through
activities and science shows.
• Systematic linkages between
professors in STEM fields, and
doctoral students or post-doctoral
level women in STEM fields.
Key finding 12.3: Gender-related elements in school curricula and pedagogies in STEM disciplines
Gender-related elements in school
curricula and pedagogies in STEM
disciplines are a feature of some countries’
initiatives that are well supported in the
literature. Strategies could include:
• Curriculum design and professional
development that could generate
greater teacher awareness
about encouraging girls to
consider STEM pathways.
• Content, pedagogy and resources
suited to the learning styles and
preferences of girls as well as boys.
• An increased focus on inquiry
based science teaching,
integrated; mathematics
throughout the curriculum.
• Engaging science experiences
from an early age.
Curricula and professional development
Fostering greater gender awareness among
people working within STEM-related fields –
including the educational and work culture
through attitudes of teachers and colleagues
– is another strategy well supported in the
literature and with demonstrated success
internationally. In schools, this includes teachers
understanding the issue and its persistence,
as well as learning to create teaching and
learning activities to better assist girls.

143
Work and careers
In the workplace awareness and cultural change
includes more flexible working hours, child care
provision, support for family mobility, greater
periods and payments during maternity and
paternity leave, and incentives to return to work
after periods of time away spent with family.
There has been some expansion of career
pathways for women in engineering and other
STEM fields. In Korea, the Women in Engineering
program, along with the Women in Science
and Technology program, have supported the
career development of young women, as well as
contributing to relevant policy research.
Career and course counselling services for STEM
pathways need to be revised to provide materials
better adapted to attract young women, and
include advisors who are familiar with STEM
professions and career pathways. In specific
fields in Australia this has been successful in the
past. Comprehensive and gender-disaggregated
data is important to not only better understand
discipline based gender divergence, but it is also
key to monitoring the progress of implemented
strategies. International organisations, among
others around the world, call for improvements
and expansion of the collated data.
Key findings 12.4 and 12.5
Further strategies for increasing women’s
participation in STEM, successfully pursued
by a number of comparator countries,
include career counselling and flexible
workplace arrangements. These suggest
the following options for Australia:
Key finding 12.4: Course and career counselling designed to encourage female participation in STEM
Counselling services and
promotional materials in relation
to STEM pathways designed to
effectively encourage young
women to follow STEM pathways.
Key finding 12.5: Women in the STEM-related workplace
Facilitating female participation
in STEM-related fields of work,
including issues such as maternity
pay and provision for paternity
pay and leave, flexible working
hours, child care provision, and
support for family mobility.

144
Stem and indigenous students
STEM indigenous issues and approachesThere are significant issues concerning indigenous participation
in post compulsory STEM subjects, including university studies,
and in the STEM workforce, across all countries with significant
indigenous populations. The issue is canvassed at length in the
Canadian and United States indigenous reports and in the New
Zealand report. It is also raised in the Brazil report, and in the
South African report for which the issue has quite a different
political history. All these reports echo the substantial concerns
of the participation and achievement levels of Australian
indigenous people in education, and in STEM.
The consultants’ reports describe in some detail the disadvantage
suffered by indigenous people in pursuing successful STEM
pathways. The issue is not only one of social justice and equity
– there are significant implications flowing from this loss of a
substantive group within the population to STEM pathways
and the personal futures these entail. Key points outlining the
situation in each of the major indigenous reports are:

145
• In Canada the indigenous population
(First Nations, Métis, and Inuit peoples)
numbers 1.26 million, a sizable minority of
whom live on reserves. In some provinces
and particularly in remote areas that are
rich in mineral resources, the indigenous
peoples make up a substantial fraction of
the population, with indigenous children
in Saskatchewan comprising 29 per cent
of school age children. Indigenous people
have increasingly economic importance,
and in northern areas are a significant STEM
workforce resource. The participation of
Saskatchewan indigenous people in post
compulsory school STEM increased at
twice the rate of their population increase
between 2003 and 2012, but is still half the
participation rate of students overall.
• The United States consultants’ report focuses
particularly on American Indian (AI) and Alaska
Native (AN) people’s under-participation and
disadvantage in the United States STEM system
– participation and graduation rates are
significantly worse for these groups than other
minority groups in the United States. Only 17
per cent of AI/AN have bachelor degrees and
only 3 per cent were in STEM careers in 2009.
There are particular pockets of disadvantage
within this, for instance extremely low
persistence rates of AI women in engineering.
There is significant growth in Native American
populations, and increasing access to higher
education, but under-representation in
STEM pathways is ascribed to approaches
to school science and mathematics that
are inappropriate to their needs.
• In New Zealand Māori and Pasifika
students under perform in all subjects
but the effect is particularly marked
in mathematics and science.
In these countries, the momentum for policy
and practice action is accelerated as indigenous
peoples grow in numbers and in economic
importance. There is growing confidence
amongst indigenous people in the call for better
outcomes and increasing acknowledgement of
indigenous views and needs and identity. This
is enshrined in New Zealand in statutory rights
under the Treaty of Waitangi, and in Canada
First Nations reserves have access to increasing
potential financial power.
We can identify through the consultants’ reports
two culture-related disjunctions that act against
indigenous participation in STEM:
• A mismatch between cultural beliefs about
the world, and science and mathematics
curriculum beliefs and teaching approaches
(an identity issue);
• Problems for indigenous students in dealing
with institutional cultures, particularly at
university level.
Cutting across these is the issue of language,
which is a particular feature of the New Zealand
response to Māori identity and participation in
education. Similar issues can be found in Brazil
with Amazonian natives, and in a somewhat
different form in South Africa with the majority
black population.
One could expect that these cultural ‘border
crossing’ issues involve disparities between
indigenous parental expectations and
presumptions, and the identity/self-efficacy
demands of STEM subjects. The Canadian
report describes in some detail the ambiguous
attitude of First Nations elders and parents
towards education – as both the pathway
to a fulfilling life (the ‘new buffalo’), and an
instrument of historical oppression.
The three consultants’ reports identify
interventions which have proven effective or
promising, in three distinct areas 1) developing
culturally responsive curriculum and teaching
approaches, 2) developing support structures
for students entering higher education, and 3)
developing a range of community outreach and
enrichment strategies to encourage and support
indigenous STEM participation.
Culturally responsive teaching
The Canadian report describes the development,
over a period of time, of a Saskatchewan science
curriculum that incorporates indigenous
perspectives, and teacher professional learning
to support this. The underpinning insight
driving this work is that successful uptake of

146
scientific ways of thinking involves significant
identity work particularly for indigenous people,
involving a ‘border crossing’ into the world
of science that teachers need to guide. The
curriculum development involved a significant
consultative process with indigenous elders,
who were also involved in intensive professional
development workshops for teachers who
were led to an understanding of indigenous
perspectives. Teachers described this experience
as very powerful. Increased uptake of post-
compulsory science indicate these have been
very successful interventions. There is evidence
that the approach also leads to improved results
for non-indigenous students. The consultants
make a strong point that a critical aspect of
successful intervention is that indigenous people
need to be involved as equal partners in framing
the approach, and further, that any perceived
‘gap’ in knowledge between indigenous and
western perspectives be seen as needing to be
equally spanned from both sides. Indigenous
perspectives can add value, for instance,
to sustainability perspectives on managing
environmental resources.
The report describes six areas that constitute
culturally responsive teaching:
• Specific attention to the learning
needs of indigenous students
• Integrating indigenous knowledge
into science classes
• Culturally appropriate teaching strategies
• Assessment involving culturally valid ways of
students communicating what they know
• Culture-based patterns of classroom
inter-personal communication
• A learning environment experienced by
students that is framed around these five areas.
The United States consultants’ report mainly
focuses on strategies to support indigenous
students entering higher education, but refers to
United States experience that is consistent with
the perspectives described above.
In New Zealand there has been a significant effort
put into incorporating Māori ideas and language
into the science and mathematics curricula. New
Zealand has a system of immersive Māori schools
that are very successful in terms of identity
outcomes for Māori students. However, fewer
choices because of size, and lack of Māori speaking
teachers with science or mathematics expertise
mean STEM outcomes are lower than otherwise.
In all of this work on improving indigenous
students’ engagement with and successful
learning of science, the construct of identity
is very powerful in enabling a framing of the
issue, and the interventions, around the multiple
relationships and values that drive students’
responses to and possible alignment with
scientific ways of thinking. To some entrenched
concern about incorporating indigenous ways
of knowing into the science or mathematics
curricula, the response has been that without
these measures students are not inclined
to take up scientific perspectives, and that
through discussion of alternative perspectives,
understanding of the nature of scientific thinking
is enriched for all students.
Support structures for students at university
The United States consultants’ report describes
a range of interventions to support indigenous
students entering higher education institutions,
some of which have been comprehensively
researched. Two significant programs that provide
evidence based insight into effective support
strategies are the Meyerhoff Scholars program at
the University of Maryland, and the public-private
partnership ‘Building Engineering and Science
Talent’ (BEST ), which identified STEM programs
that are effective for under-represented groups in
pre-K – 12, higher education, and the workplace.
The design principles for effective programs
arising from the BEST review are:
• defined outcomes drive the intervention
(goals, desired outcomes, data collection,
research and continuous improvement).
• sustained commitment (proactive
leadership; sufficient resources;
steadfastness in the face of setbacks).
• personalisation (the goal of the intervention
is the development of students as

147
individuals) (student-centred teaching
and learning; mentoring; tutoring;
peer interaction; recognise individual
differences, uniqueness and diversity);
• challenging content (curriculum clearly
defined; real-world applications; goes
beyond minimum competencies;
reflects local/state/national standards;
academic remediation available).
• engaged adults (educators play roles as
teachers, coaches, mentors, tutors and
counsellors; teachers develop quality
interactions; active family support sought).
The United States consultants’ report indicates
that the Meyerhoff Scholars program:
promotes active learning and analytical
thinking, provides learner-centered
environments mindful of students’ cultural
orientations, exposes students to mentors in
the various STEM fields, provides counselling
and peer-group supports, assesses student
learning to expose their ways of thinking, and
develops classrooms into communities by
promoting intellectual and social cohesion.
External evaluations showed that:
Meyerhoff students are nearly twice as likely
to persist and graduate in mathematics,
engineering, and the sciences than their
peers who declined offers of admission to the
program and enrolled at other universities.
The Canadian consultants’ report attributes the
low entry numbers and high drop out rate of
indigenous students in STEM university programs
to the culture of university STEM departments
that are not sensitive to the needs of indigenous
students. The report describes transition
programs that address the problem of indigenous
students transferring from school to university,
offering skills and support. There are a variety
of forms of undergraduate indigenous student
support, always outside the courses as such
because of prevailing resistance to discussing
indigenous issues by university faculty. These
include centres, mentorship programs and others.
Saskatchewan’s STEM institutes have a variety of
programs for supporting indigenous students;
some are run by indigenous organisations. The
support programs include transition support,
emergency bursaries, an aboriginal activity
centre, access to elders and cultural advisors,
special indigenous teacher education programs,
and appropriate, locally contextualised course
content. Similarly, the New Zealand consultants’
report describes a range of STEM outreach
programs run by universities a number of which
target Māori and Pasifika students. The University
of Auckland’s ‘Vision 20:20’ initiative for instance
has three components:
• An indigenous admission scheme (MAPAS)
involving admission support, academic
support (includes additional group tutorials,
specific study space and computer labs, study
retreats, homework and pre-exam study
support, and guidance on forming study
groups), and pastoral support (mentoring,
peer support, regular lunches … )
• A one year foundation certificate program
transitioning indigenous students into
university health and medical programs
• A recruitment program offering school
presentations, career advice and visits to
health science facilities, and financial support.
Outreach, enrichment, and workplace initiatives
The University of Auckland initiative described
above has outreach components. A number
of school outreach programs are described in
the Canadian consultants’ report including an
‘ambassadors program’ with 3rd and 4th year
undergraduate students, outreach science
programs that teach science in a ‘fun’ way, camps
and ‘discover engineering’ events.
The Canadian consultants’ report includes case
studies of successful industry led workplace
recruitment models involving large companies,
with a number of integrated aspects. These
include workplace visits, work placement, and
scholarships with guaranteed employment. The
cases have led to considerable success in terms
of indigenous tertiary education qualifications
and achievement of senior positions in
companies by indigenous STEM professionals.
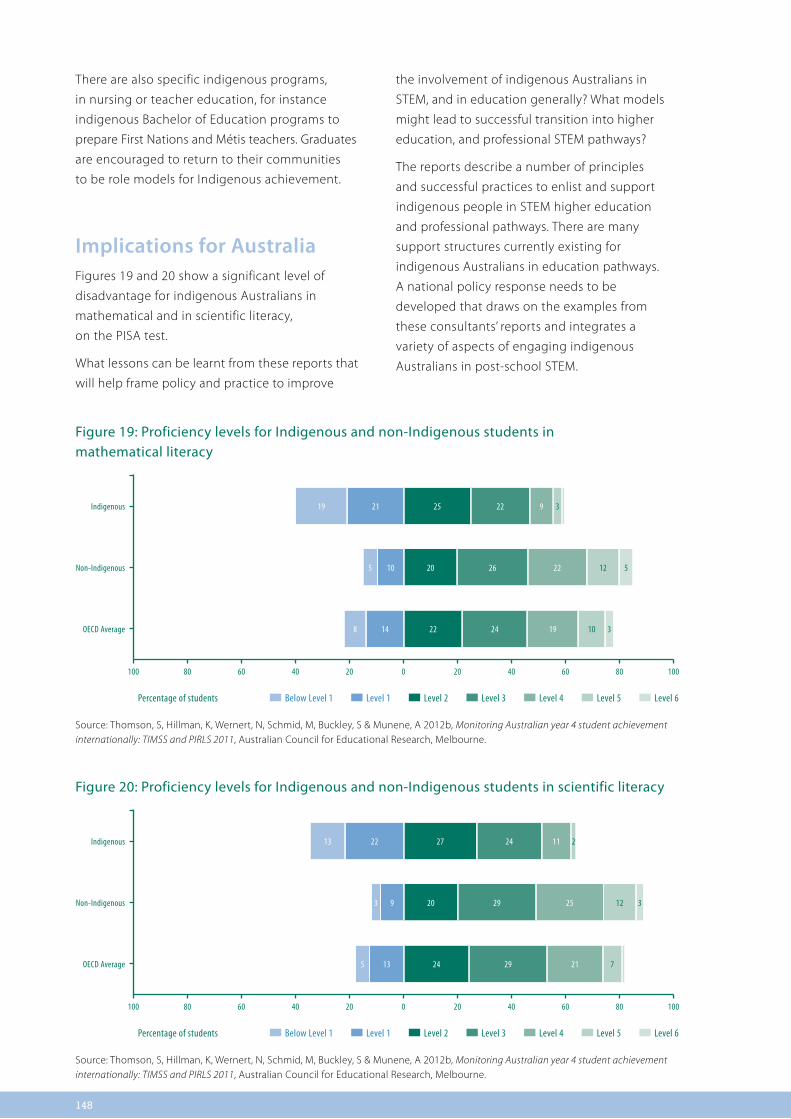
148
There are also specific indigenous programs,
in nursing or teacher education, for instance
indigenous Bachelor of Education programs to
prepare First Nations and Métis teachers. Graduates
are encouraged to return to their communities
to be role models for Indigenous achievement.
Implications for Australia Figures 19 and 20 show a significant level of
disadvantage for indigenous Australians in
mathematical and in scientific literacy,
on the PISA test.
What lessons can be learnt from these reports that
will help frame policy and practice to improve
the involvement of indigenous Australians in
STEM, and in education generally? What models
might lead to successful transition into higher
education, and professional STEM pathways?
The reports describe a number of principles
and successful practices to enlist and support
indigenous people in STEM higher education
and professional pathways. There are many
support structures currently existing for
indigenous Australians in education pathways.
A national policy response needs to be
developed that draws on the examples from
these consultants’ reports and integrates a
variety of aspects of engaging indigenous
Australians in post-school STEM.
Figure 19: Proficiency levels for Indigenous and non-Indigenous students in mathematical literacy
Indigenous
Non-Indigenous
OECD Average
Source: Thomson, S, Hillman, K, Wernert, N, Schmid, M, Buckley, S & Munene, A 2012b, Monitoring Australian year 4 student achievement internationally: TIMSS and PIRLS 2011, Australian Council for Educational Research, Melbourne.
100 80 60 40 20 0 20 40 60 80 100
2119 2225 3
Below Level 1 Level 1 Level 2Percentage of students Level 3 Level 4 Level 5 Level 6
105 222620 512
148 192422 310
9
Figure 20: Proficiency levels for Indigenous and non-Indigenous students in scientific literacy
Indigenous
Non-Indigenous
OECD Average
Source: Thomson, S, Hillman, K, Wernert, N, Schmid, M, Buckley, S & Munene, A 2012b, Monitoring Australian year 4 student achievement internationally: TIMSS and PIRLS 2011, Australian Council for Educational Research, Melbourne.
100 80 60 40 20 0 20 40 60 80 100
2213 2427 2
Below Level 1 Level 1 Level 2Percentage of students Level 3 Level 4 Level 5 Level 6
93 252920 312
135 212924
11
7

149
Key finding 13.1: National approach to STEM teaching and learning for indigenous students
The Canadian indigenous STEM education
experience presents a strong case for
pursuing ‘culturally responsive teaching’
involving the recognition of indigenous
knowledge as part of the study of science,
and the active involvement of indigenous
elders in framing the curriculum and teacher
professional development. On the basis of
this report, advancing STEM teaching and
learning for Australian indigenous students
needs wide discussion, including approaches
to curriculum and pedagogy in STEM that
would more strongly engage indigenous
students with STEM subjects at school, in
higher education, and into professional STEM
pathways. Such approaches could entail,
among other elements:
• Recognition of indigenous Australian
knowledge in science and mathematics
curricula, providing that this draws on
systematic research into indigenous
Australian perspectives, as well as
appropriate international examples
such as those from Canada, the
United States and New Zealand;
• Involvement of indigenous elders
in this research, and in the ensuing
development of curriculum and teacher
professional learning support;
• Compilation of recent and existing
educational programs and practices
and support structures, which have
proved effective in Australia.
Key finding 13.2: Programs and activities designed to facilitate indigenous students’ learning and work in STEM-related disciplines
The experience of Canada, the United
States and New Zealand point to common
findings concerning the characteristics
of programs successful in attracting
and retaining indigenous students in
tertiary STEM pathways. Programs and
activities designed to facilitate indigenous
students’ learning and work in STEM-
related disciplines could include:
• Courses facilitating the transitions
between schooling and tertiary education,
and between education and work;
• Outreach activities between
tertiary education and schools;
• Working with industry to establish
processes for engaging indigenous
students and graduates into the workforce,
including local work placements that
draw on STEM education and training;
• Scholarships leading to university
and/or employment;
• Higher education institutional structures
and activities including specialist societies,
mentors, and career counselling;
• Curriculum initiatives and
professional learning for higher
education teaching staff.
Key finding 13.3: Professional development regarding STEM and indigenous students
The Canadian report in particular makes clear
the critical role of professional development
in successfully engaging indigenous
students in school science and mathematics.
Professional development regarding STEM
and indigenous students could include:
• Recognition and respect for
indigenous ways of knowing; and
• Culturally responsive teaching, whereby
students from indigenous backgrounds
are supported in engaging effectively with
scientific thinking and practices; and also
Programs and activities designed to
facilitate indigenous students’ learning
and work in STEM-related disciplines.

150
Partnerships and enrichment activities
In addition to strategies and programs within formal
education, some governments foster science learning and
popularisation outside educational institutions (see also Section
15), and encourage partnerships between civil and business
organisations, and education institutions. Much such activity
also occurs without the involvement of government, though the
incidence of independent initiatives varies between countries.
In the United Kingdom, according to the consultants’ report:
In addition to STEM education through school and university,
a third landscape of science education and engagement
takes place out of school. Referred to as ‘informal’ or ‘life-
long’ science education, amongst other names, for the
purposes of this report, we note that in the UK there has
been considerable investment in science engagement and
education activities in science centres, museums, science
festivals, and other environments, that we will refer to here as
informal contexts. Alongside activities designed to educate
are a host of activities that fall under the broad banner of
public engagement with science. These activities are less
explicitly education, with a focus instead on science as part

151
of culture or the political aspects of science in
society. With the House of Lords (2000) report
which foregrounded the political need for
dialogue, debate and discussion on scientific
issues in British society, new funding streams
for science engagement activities meant that
public engagement with science came to
refer to educational, as well as cultural and
political science engagement activities. As
a result, the last 20 years has seen a blurring
of informal science education activities with
political and cultural science engagement,
which has also meant a significant amount of
science education and engagement has taken
place outside schools and universities.
In many countries there are initiatives that involve
partnerships between education institutions
(schools, technical education providers and
universities), research institutions, industry
(companies and professional associations),
government and the community. There are also
numerous examples of ‘enrichment activities’
that essentially complement institutionalised
education. Such activities frequently involve
young people, families, and the broader public.
Enrichment activities provide opportunities for
authentic learning, elite and remedial education,
student engagement by exploration of the
identity construct, and sharing good practice.
These partnerships provide students with
access to STEM professionals, and contemporary
practices in STEM, including interdisciplinary
teams, and interactions with societal needs.
Partnerships • In Taiwan, partnerships involving industrial-
academic collaboration are a mechanism to support enhanced fundamental research and development activity, the development of incubators in new knowledge-based firms and entrepreneurial technology transfer (commercialisation and patenting activities). Such collaborations span up-, mid- and downstream scientific technological development, and are supported by Regulations Governing University Industrial-Academic Collaboration. The collaborations encourage funding from industry to
universities, including industry-sponsored research, and include opportunities for investigation of ‘real-world’ applied research problems. For example, the Ford Company has established a partnership with a number of technical universities which involves Ford technical staff teaching in university and university students visiting the Ford Company.
• In Western Europe, Xperimania is a partnership between the Association of Petrochemical Producers in Europe and education institutions to promote chemistry and physics to students.
• In the United States, Skills for America’s Future was established as a national network of partnerships among industry, community colleges, professional associations to bridge the skills gap. Similarly, Education to Innovate has been established in the United States as a public-private partnership to foster interest and engagement in STEM through out of school activities.
• In China, partnerships between universities, research institutes, university-affiliated technology-based enterprises, and industry more broadly have been established to drive the innovation system, support knowledge transfer and increase commercialisation. For example, the Bainbridge Program run by Royal Phillips Electronics with Shanghai Jiaotong University involves joint laboratories and projects; and the Microsoft China Company’s collaboration with Chinese universities involves students undertaking internships at Microsoft alongside the Microsoft certification exam.
• In Western Europe, there are a number of community-based partnerships involving schools and local councils (for example the ‘Pencil’ project). In the United Kingdom, STEMNET, an educational charity, co-ordinates STEM ambassadors, STEM clubs and an advisory schools network. In France, there are national non-government organisations dedicated to enhancing student interest teacher support, resource production or outreach such as ‘La main a la Pate’ and Universciences in France.
• In New Zealand, there are biotechnology and science learning hubs which produce online engagement material.

152
Enrichment activities• Learning experiences outside the classroom
(LEOTC) include National Science Week,
camps, science centres, museums, zoos,
planetaria, aquaria, botanical gardens, science
parks, science fairs, historic parks, performing
arts and science centres. These activities
provide opportunities for authentic, hands-on,
interactive learning, and are frequently made
available to people of all ages.
• Competitions include Olympiads (physics,
mathematics, chemistry, geo-science,
engineering), Amazing Science-X Challenge,
National Junior Robotics Competition and
the Science Award. These activities frequently
involve elite education, and are targeted at
high achieving school and university students.
• Real-world science activities include ‘Meet
the Scientist’, excursions, hands-on projects,
internships, work experience, simulation,
activities that students connect with
personally, and make science relevant and
meaningful. These activities concern the
identity construct.
• Support such as mentoring, coaching,
science talks, interest groups, ‘after-school
activities’, ‘second classrooms’, subject-
related clubs, student-interest clubs,
over-age students, school-university-
industry mentoring, confidence-based
contracts, I Like Science Project, scientific
and technical workshops, laboratories,
individual learning plans, financial literacy,
and the Israel Technology Transfer Network.
These activities provide either remedial
support and/or elite education.
• Networking and sharing resources such as
the national French framework of activities/
programs which is overseen by regional
inspectors in each regional education
authority, and the ‘Ambition and Success
Network’ for sharing of good practice.
Evaluation outcomesWhile the consultant’s reports provide a wealth
of examples, evaluation results were only
provided with respect to a limited number
of activities identified. For example, the New
Zealand Biotechnology materials, La main
de la Pate and STEMNET were all evaluated
positively, and the United Kingdom audit office
found that enrichment activities could be
linked to improved senior secondary school
students’ science and mathematics grades. The
United Kingdom consultants’ report makes the
point that while enrichment activities have
very strong anecdotal support, a clear case
has not been forthcoming concerning their
impact on students. Very often these projects
have not been subject to critical scrutiny.
In Australia there are many examples of the type described in these consultants’ reports of partnerships between universities and industry, and with overseas higher education institutions. There are examples for instance of four way collaboration between Australian and Chinese universities and enterprises which do business in both Australia and China. There are many examples of students embedded in companies as part of their undergraduate studies, or spending time at overseas institutions. Links with industry need, however to be improved. Whilst Australia has above the OECD average number of researchers, it is well below average for the number of business researchers (DIISRTE 2012). Australia was ranked low in the OECD for collaboration between business and higher education and government research institutions. The importance of collaboration and partnerships (and Australia’s relative low standing) is also highlighted in the Report of the 2011 ATN-G08 Symposium Excellence in Innovation: Measuring the Dividend (ATN-G08 Symposium 2011).
Cooperative Research Centres (CRCs) are examples
of collaborative arrangements with industry, for
instance embedding researchers and PhD students
in industry based laboratories. The vocational
education system has a very strong network of
153
industry based part time lecturers at TAFE Institutes
and other Registered Training Organisations (RTOs)
to ensure the currency and industry relevance of
the AQF certificates and diplomas.
There have been some notable engagements
with school science by peak scientific bodies that
have yielded considerable benefit to the teaching
and learning of science in schools. Examples
of these are the Academy of Science’s ‘Primary
Connections’ project which has developed
an innovative approach to teaching science
in primary schools that has achieved national
scope, and their ‘Science by doing’ project which
is currently developing materials in teacher
professional learning, and in student resource
materials. ATSE have developed the STELR
program which has reached hundreds of schools
and is being enhanced with an innovative digital
planning platform. The CSIRO’s Scientists and
Mathematicians in Schools programs have been
very positively evaluated.
Separate from these programs with a national
focus there are many such partnership and
outreach activities in Australia that anecdotally
can be very effective. However, they are not
coordinated, often not evaluated, nor are their
outcomes clearly defined. Schools can often be
resistant to such out-of-curriculum activity given
the busy lives of teachers, and the sustainability
of the initiatives is variable, depending on a
number of contextual factors (Tytler et al. 2011b).
Given the successful outcomes of such
partnership activities reported in a number of
countries, there is a need to better understand
how they can be devised and implemented to
ensure significant outcomes. There is a need
to develop better understandings of how
these partnerships and outreach practices can
Key finding 14.1: STEM Partnerships
Successful partnership initiatives in
a number of STEM-strong countries
demonstrate the important role of
partnerships in supporting innovation
in school mathematics and science.
While partnership activities are common
in Australia, clear understandings
of their nature and their effects is
often lacking. An approach to STEM
partnerships could include:
• Developing an understanding of the
scale, scope and variety of STEM-related
partnership and enrichment initiatives
in Australia – many of which are
localised in nature – and of their nature,
aims, and effectiveness.
• Coordinating the sharing of details
about the relevant initiatives,
and develop advice for science
organisations, business and industry,
and school authorities, concerning how
best to manage these to good effect.
be effectively embedded into schools’ STEM
curriculum offerings, and how to encourage
schools to be open to such initiatives.
Scientists and mathematicians need to be
supported to better understand the needs of
teachers and schools in this sort of partnership
activity. Schools need to be made aware of the
advantages of these activities for student learning
and engagement, and ways of arranging the
school curriculum to incorporate such activities.

National STEM coordination
Many of these reports describe a comprehensive STEM policy
framework that integrates activity across the many dimensions
including industry, research and development, universities,
schools, and the public. Many also describe high level, national
agencies or centres through which the whole or parts of the
policy are enacted.
This country comparison project has examined initiatives
focused on STEM participation. The issue addressed in this
section is therefore the need for coordination of approaches to
STEM policy in relation to perceptions of STEM, and education.
These country comparisons suggest possibilities for productive
approaches to improving participation and performance in
STEM at many levels, relating to teaching and teacher education,
curriculum and pedagogy at primary through tertiary levels,
public perceptions, and participation in STEM by particular
groups including girls and women, low SES communities, and
indigenous communities. For each of these, the case exists for
coordination of response at national level, in order to gather
expertise and maximise the possibility of effective intervention.
154

The need for a coordinated national response to STEM participation issuesCurrently in Australia, STEM policy in schools
is vested in the states. In Australia, a Science &
Maths Education & Industry Advisor has recently
been appointed within the Office of the Chief
Scientist to oversee coordination across the
country. Compared to the situation in similar
countries, however, where significant structures
including centres are common, the level of input
of advice, and the capacity to commission studies
and generate resources seems limited. There have
been notable instances of national guidance and
innovation relating to curriculum, and teacher
education, which provide an effective proof
of concept for a more encompassing national
approach in this area.
National direction regarding school mathematics
and science education has been provided
through the Australian Curriculum, and in this
and a previous version (in 1987), the effect has
been dramatic in unifying the language through
which curriculum is conceived of in Australia.
The 1987 curriculum established the language
of ‘outcomes’ as the guiding principle, as well as
providing leadership in conceptualising purposes.
Even though the curriculum was not directly
adopted across all states, it significantly affected
what happened in state curricula in the ensuing
years and provided a platform for the current
curriculum initiative. For the current Australian
Curriculum, the move towards a competency
focus and the inclusion of the ‘Science as a
Human Endeavour’ dimension has changed
the language used in all states, concerning the
purposes of science.
155

156
There has not been, however, a significant
accompanying project to develop the necessary
professional learning for teachers to support
the changed practices implied in the curriculum
document, nor assessment to support the
widened set of curriculum purposes. The
importance of teachers and teaching highlighted
by this report suggests a need for national
leadership to address this issue.
The most significant non-governmental
developments of curriculum and pedagogy
with national reach have been carried out
by the Academy of Science, with its Primary
Investigations, then Primary Connections, and
Science by Doing initiatives. Primary Connections
has had varied take up across the states but
is a significant resource in each state, and has
established the principle of disciplinary literacy
competence as a major driver in thinking about
primary school science, across Australia. Primary
Connections included a significant professional
development component but this was of
short term duration over the life of project
development. Science by Doing has produce
professional learning materials for teachers that
are based on widely agreed principles. The STELR
program which is in some schools in all states
is currently offering significant digital planning
innovation for teachers.
Thus, there are significant projects in science that
demonstrate clearly the strength of a national
approach to development of curriculum and
resources. However there are significant areas of
science and mathematics education and STEM
participation more generally, described in this
report and listed above, which are not addressed
by these projects and approaches.
There is a case to be made for coordination
at national level for each of these aspects of
STEM participation. Given the interrelationship
between these aspects, particularly relating
to school curriculum, pedagogy, teachers
and teaching, and resources, there is a further
argument to be made that these aspects of
policy development should be the remit of one
coordinating process or agency. This is the case
with almost all countries reported.
The benefits of such coordination at national
level are: the coherence it could bring, the
enhanced status of STEM deriving from a
coordinated national approach, the advantages
of drawing on significant Australian expertise,
and the possibility of developing approaches
providing continuity beyond election cycles. The
coordination process envisaged would gather
together expertise to develop policy options and
advice on these various aspects.
The further question to be addressed in this
section concerns the process by which this
coordination occurs. The consultants’ reports
offer many examples of the operation of Centres
focused on STEM policy and its implementation,
from which we might draw.
What other countries doIn the consultants’ reports, in almost all
instances, structures such as centres, agencies
and institutes have been established as part of
the STEM infrastructure. This ranges from high
level, advisory bodies comprising government
ministers and professional association
stakeholders, through national STEM or science
centres with varying responsibilities, networks
to support advances in STEM education and
teaching quality, and STEM-discipline research-
focused organisations. Many such structures are
physical; some appear to be virtual.
There are a variety of objectives, ranging
from the provision of advice to government;
communication of science to the community
and stimulation of young people’s interest in
STEM education and professions. In addition,
such structures provide a mechanism to
support STEM education and STEM teaching
quality; conduct enrichment activities; support
STEM-discipline research and research-
focused partnerships; undertake research
regarding STEM education; and progress
Indigenous STEM science and education.
Several seek to do many of these things.
Key differentiating features include the
relationship with government (advisory regarding

157
STEM policy; implementation of government
STEM policy or strategy; not-related), level and
breadth (regional, national, provincial, local),
objectives (broad, focused), and role (advice,
promotion, resources, activity-based, and
research-focused). What is clear is that most
countries have a series of structures or centres to
provide a focal point for STEM.
Centres providing advice to government
The Canadian Science, Technology and
Innovation Council is a strategic authority
established by the Canadian government to
centralise science and technology advice.
Similarly, the Taiwanese Science and Technology
Advisory Group is a science- and technology-
focused advisory authority.
Centres communicating science and stimulating interest
InGenius is the European Union co-ordinating
body for STEM education, established by
European Schoolnet and the European
Roundtable of Industrialists (ERT ). InGenious
comprises European Union ministries of
education and industry, and focuses on science
communication. InGenius provides a best
practice STEM education resource repository and
aims to stimulate interest in STEM education and
professions. European Schoolnet (EUN) comprises
European Union ministries of Education, and
provides information to STEM teachers on
innovative pedagogy, creative STEM curriculum
and strategies to engage industry.
STEM networks established in the United
Kingdom include the Science, Technology,
Engineering and Mathematics Network
(STEMNET), established as an educational charity
with national and regional hubs to engage
students and support STEM programs (STEM
Ambassadors, STEM Clubs Network and Schools
STEM Advisory Network). Similarly, the South
African Association for Science and Technology
Education Centres (SAASTEC) performs a science
communication function, and seeks to advance
science and technology. The Korea Institute
for the Advancement of Science and Creativity
(KOFAC) promotes science and technology-
related cultural activities, focuses on science and
creativity communication, supports STEAM, and
implements enrichment activities.
Centres supporting STEM education and STEM teaching quality
In the United Kingdom, a national network
of Science, and Mathematics Learning
Centres has been established in response to
a lack of structured science teacher training,
accreditation, recognition and professional
development. The centres support subject-
related continuous professional development
through financial support for participating
teachers. These were well reviewed in a report
of the Audit office as one of the initiatives
that had been evaluated positively.
In 2004 Professor Celia Hoyles was appointed
to the position of the United Kingdom
government’s Chief Adviser for Mathematics.
In 2007 she was appointed as Director of the
National Centre for Excellence in the Teaching of
Mathematics. These initiatives for mathematics
education arose from a well-respected report
by Prof Adrian Clark concerning the need
to take action concerning participation and
learning in mathematics. These initiatives
could form models for structures to enhance
mathematics and science in Australian schools.
In Western Europe there are numerous national
STEM centres supporting STEM education For
example, Finland’s National Science Education
Centre (LUMA) promotes science education,
facilitates partnerships between schools,
universities, industry, teachers and others,
conducts enrichment activities such as the
Science Fair and Millennium Youth Camp and is
supported by a network of science education
centres located at Finnish universities. Other
Western European centres include the Norwegian
Centre for Mathematics Education and Centre
for Science Education; Belgium RVO-Society;
Dutch Freudenthal Institute for Science and
Mathematics Education; Switzerland MINT; and
Danish Centre for Science, Technology and

Health. These centres implement a range of
programs and strategies to support STEM. French
national non-government organisations also
include Universciences, which seeks to stimulate
students’ interest in sciences and make scientific
and technical culture accessible. The La main
a la Pate represents a co-operative scientific
organisation with international links that seeks
to improve science and technology teaching for
primary and secondary school levels.
The New Zealand Mathematics and Science
Taskforce, established by the Ministry of
Education has developed STEM resources
including ‘Connected’ to stimulate primary
school students interest in science, technology
and mathematics; Building Science Concepts
booklets; and the Numeracy Development
Project. The Israeli Science and Technology
Administration, located within the Ministry
of Education establishes STEM education
goals, develops STEM curriculum and related
pedagogies, monitors achievement and co-
ordinates implementation of the Adapting the
Education System to the 21st Century.
Centres conducting enrichment activities
In the United Kingdom, Science Centres following
the model of the Exploratorium in San Francisco
have been established to provide co-ordinated
enrichment science education activities. In
Portugal, the National Agency for Scientific and
Technological Culture (Ciencia Viva) co-ordinates
a range of enrichment activities including Science
and Technology Week, science in the summer,
the Robotics Open Festival, MIT professors
go to school, the ORION amateur scientific
association, debates with scientists, Census Viva,
the LONGEVA project, ethnomathematics, the
FORUM ciencia viva and Champimovel Project.
The national agency is supported by Ciencia Viva
interactive science centres.
Singapore’s education system is supported
by numerous ‘out-of-school’ or extra-curricula
science and mathematics activities. Science
Centre Singapore supports science activities
for pre-schoolers and organises enrichment
activities. The Singapore Academy of Young
Engineers and Scientists (SAYES) is a youth
science movement that conducts enrichment
activities including field trips, co-ordinates
lectures by Nobel Laureates and scientists,
provides training programs and conducts peer
group activities.
Centres involving STEM-discipline research and research-focused partnerships
In Taiwan, Regional Industrial-Academic
Collaboration Centres provide opportunities for
industrial-academic interchange, exploration
of potential R&D partners, and subsidised
college technology R&D. These relationships are
supported by the Implementation Guidelines for
the Promotion of Industrial-Academic Collaboration
between Technical Colleges and Universities and
Industry Parks. The French National Association for
Research and Technology (ANRT) and INRIA are
dedicated to the study of technology and digital
sciences, and are actively engaged in research,
innovation and development of European
partnerships to improve research. The French
Institute for Engineering Sciences and Systems
(INSIS) of the National Center for Scientific
Research (CNRS) focus on engineering research.
The Singapore Agency for Science, Technology and
Research (A*STAR) provides funding for science,
technology and engineering research, co-ordinates
R&D in science and technology, attracts scientists
and industry to Singapore. A*STAR has several
councils, including the Biomedical Research
Council, Science & Engineering Research Council
and Exploit Technologies. Singapore’s Biopolis
and Fusionopolis shared research facilities and
equipment also support science and technology
research. In China, National Technology Transfer
Centres, based at universities, support the transfer
of technology to industry; and various independent
agencies support science and technology from a
central and devolved perspective.
158

Centres involving research regarding STEM education
The French Institute for Education (ENS-INRP) and
University of Burgundy’s institutes and laboratories
examine policies and produce research pieces to
collaborate with government on STEM education.
The centre supports STEM programs such as
National Mathematics Conference. The French
Evaluation Agency for Research and Higher
Education (AERES) evaluates tertiary institution’s
performance and managerial efficacy.
Most of the federal government support for
research and scholarship at Canadian academic
institutions is distributed through competitive
processes operated by three specialised Councils
with jurisdiction over their respective areas
There are many examples of potent policy
and coordination regimes in our comparator
countries, that express the urgency with
which national STEM agendas are being
pursued, and the benefits of coherence across
STEM related areas. National coordination
could make a significant contribution to
the enhancement of STEM provision and
participation in Australia, as it already does
in many other countries. Areas of activity in
which national coordination might add value
to STEM provision and participation include:
• The compilation of data concerning
participation and performance
in STEM education.
• The generation and dissemination of
knowledge concerning effective, evidence
based approaches to engagement with
quality learning in STEM fields, drawing on
international and Australian experience,
and on the relevant research literature.
• Coordination and networking of policies,
strategies and programs designed to
enhance approaches to STEM-related
teaching and learning in schools,
consistent with the Australian Curriculum,
including the coordination of resource
development and dissemination across the
States and Territories.
• Coordination and networking of policies,
strategies and programs designed to
enhance approaches to STEM-related
teaching and learning in tertiary
education, including outreach and
placement activities in partnership with
schools and with industry.
• Coordination of principles and approaches
to professional development in relation
to STEM teaching, and support structures
for teachers of mathematics and science,
designed to build the capacity and
status of the profession and to support
improvements in student learning.
• Coordination of approaches to
the enhancement of knowledge
and advice regarding STEM
pathways, courses and careers.
• Coordination of approaches to
partnership and mentoring designed
to support STEM education in
schools and tertiary institutions.
• Coordination of policy and program
development in relation to the
participation in STEM of students
from under-represented groups,
including girls and women (particularly
in relation to engineering), low SES
students and disadvantaged school
communities, including regional,
rural and remote communities,
and indigenous communities.
• Coordination of approaches to enhancing
public, student and employer perceptions
of the potential contributions of STEM,
and better understanding of STEM in
education, work and careers.
Key finding 15.1: Possible forms and activities in relation to national STEM coordination
159

of focus; the Canadian Institutes of Health
Research (CIHR), the Natural Sciences and
Engineering Research Council (NSERC), and
the Social Sciences and Humanities Research
Council (SSHRC). These Councils jointly share the
responsibility for administering, adjudicating, and
monitoring the distribution of federal research
grants in pursuit of high-quality research and in
service to the social and economic well-being of
Canada and its citizens.
Centres to progress Indigenous STEM science and education
The United States National Consortium for
Graduate Degrees for Minorities in Science
and Education (GEM) supports Indigenous
student participation in tertiary education
science. Various United States based coalitions
are established between K-12 school systems,
colleges and universities, informal science
education organisations, business and industry to
address STEM issues, streamline the co-ordination
of STEM education research and disseminate
successful STEM education activities.
Options for AustraliaThere is a compelling argument to be made,
based on the experience of other countries and
on current developments in Australia, for national
coordination of approaches to improving
participation in STEM.
Australia being a federal system, many of the
structures from other countries cannot translate
immediately. Nevertheless, the weight of the
examples points strongly to the need for some
sort of coordinating body or agency to provide
advice and leadership on key aspects of STEM
participating policy, and in most cases also
responsibility for policy administration.
A separate issue concerns the implementation
of the policy advice. Most countries have set
up one or more centres with responsibility for
implementation of some or all aspects of such
policy, including commissioning special projects.
These sometimes, as in the United States,
involving public-private partnerships.
A possible way forward is offered by one well-
regarded and positively evaluated model used
in the United Kingdom, that of a national
mathematics advisor, supported by a high level
advisory body.
160

In the key comparator countries there
are a variety of structural approaches to
national coordination of STEM initiatives.
Australia could productively learn from these.
Approaches could take a number of possible
forms, not all mutually exclusive, including
for example:
• a specially constituted national
STEM body (i.e. an agency or centre)
reporting to an appropriate
government office or department
• an advisory body with State and Territory
government representation
• an advisory body with broad
representation of peak stakeholder groups
including industry, STEM educator and
research bodies, and education systems.
The key aspects of such a body or bodies
needing considered discussion are the
national overview that would be required,
the capacity to establish working groups to
deal with distinct issues, and the capacity to
commission research and to focus resources.
Key finding 15.2: Possible coordination structures
161

162
Acronyms
A*STAR Singapore Agency for Science, Technology and Research
AAMT Australian Association of Mathematics Teachers
ABS Australian Bureau of Statistics
ACARA Australian Curriculum, Assessment and Reporting Authority
ACER Australian Council for Educational Research
ACOLA Australian Council of Learned Academies
ACT Australian Capital Territory
AERES Evaluation Agency for Research and Higher Education
AI American Indian
AITSL Australian Institute for Teaching and School Leadership
AMSI Australian Mathematical Sciences Institute
AN Alaska Native
ANAO Australian National Audit Office
ANRT National Association for Research and Technology
AQF Australian Qualification Framework
ARC Australian Research Council
ASERA Australasian Science Education Research Association
ASPA Australian Secondary Principals Association
ASTA Australian Science Teachers Association
ATAR Australian Tertiary Admission Rank
ATSE Academy of Technological Sciences and Engineering
AWPA Australian Workforce and Productivity Agency
BEST Building Engineering and Science Talent
BIS Department of Business, Innovation and Skills
CCSS Common Core State Standards

163
CEDEFOP European Centre for the Development of Vocational Training
CIHE Council for Industry and Higher Education
CIHR Canadian Institutes of Health Research
CNSR National Center for Scientific Research
COAG Council of Australian Government
CoSTEM Co-ordinating Federal Science, Technology, Engineering and Mathematics
CPAS Centre for the Public Awareness of Science
CPD Continuing Professional Development
CRC Cooperative Research Centre
CSIRO Commonwealth Scientific and Industrial Research Organisation
DEEWR Department of Education, Employment and Workplace Relations
DfES Department for Education and Skills
DIISRTE Department of Industry, Innovation, Science, Research and Tertiary Education
EC European Communities
EFT Effective Full Time
ERT European Roundtable of Industrialists
EU European Union
EUN European Schoolnet
EWG Expert Working Group
F-10 Foundation to Year 10
GCA Graduate Careers Australia
GCSE Graduate Certificate of Secondary Education
GDP Gross Domestic Product
GDS Graduate Destination Survey
GEM National Consortium for Graduate Degrees for Minorities in Science and Education

164
GPS Global Ph.D. Fellowship
HSC Higher School Certificate
ICT Information Communication Technology
IEA International Association of the Evaluation of Educational Achievement
INSET In-Service Education and Training
INSIS Institute for Engineering Sciences and Systems
ISCED International Standard Classification of Education
JST Japanese Science and Technology Agency
K-12 Kindergarten to Year 12
KAIST Korea Advanced Institute of Science and Technology
KOFAC Korea Institute for the Advancement of Science and Creativity
LEOTC Learning Experiences Outside The Classroom
LUMA National Science Education Centre
MEXT Ministry of Education, Culture, Sports and Science and Technology
MST Mathematics, Science and Technology
NAP-ICT National Assessment Program – Information & Communication Technology
NAP-SL National Assessment Plan – Scientific Literacy
NAPLAN National Assessment Program – Literacy and Numeracy
NASA National Aeronautics and Space Administration
NCVER National Centre for Vocational Education Research
NECC National College Entrance Examination
NILS National Institute of Labour Studies
NOAA National Oceanic and Atmospheric Administration
NSERC Natural Sciences and Engineering Research Council
NSF National Science Foundation
OECD Organisation for Economic Co-operation and Development
OSTP Office of Science and Technology Policy
PCAST President’s Council of Advisors on Science and Technology
PhD Doctor of Philosophy
PISA Program for International Student Assessment
PMSEIC Prime Minister’s Science, Engineering and Innovation Council

165
QCE Queensland Certificate of Education
R&D Research and Development
ROSE Relevance of Science Education
RTO Registered Training Organisation
S&T Law Science and Technology Basic Law (Kagaku Gijutsu Kihon Hō)
SAASTEC South African Association for Science and Technology Education Centres
SACE South Australian Certificate of Education
SAF Securing Australia’s Future
SAYES Singapore Academy of Young Engineers and Scientists
SCOTESE Standing Council on Tertiary Education Skills & Employment
SES Socio-Economic Status
SET Science, Engineering and Technology
SiAS Staff in Australia’s Schools
SSHRC Social Sciences and Humanities Research Council
STEAM Science, Technology, Engineering, Arts and Mathematics
STELR Science and Technology Education Leveraging Relevance
STEM Science, Technology, Engineering and Mathematics
STEMNET Science, Technology, Engineering and Mathematics Network
STEP STEM Talent Expansion Program
TAFE Technical and Further Education
TCE Tasmanian Certificate of Education
TIMSS Trends in International Maths and Science Study
UNESCO United Nations Science, Education and Cultural Organization
VCAL Victorian Certificate of Applied Learning
VCE Victorian Certificate of Education
VET Vocational Education and Training
WACE Western Australian Certificate of Education
WATCH21 Women’s Academy for Technology Change in the 21st Century
WCU World Class University
WISET Korea Advanced Institute of Supporting Women in Science, Engineering and Technology

166
Bibliography
ACARA 2012, Australian Curriculum Implementation Survey, Australian Curriculum, Assessment and Reporting Authority, Sydney, viewed 11 January 2013, http://www.acara.edu.au/curriculum_1/learning_areas/mathematics.html
ACARA 2012, NAPLAN Achievement in Reading, Persuasive Writing, Language Conventions and Numeracy: National Report for 2012, Australian Curriculum, Assessment and Reporting Authority, Sydney, viewed 6 January 2013, http://www.nap.edu.au/verve/_resources/NAPLAN_2012_National_Report.pdf
Ainley, J, Kos, J & Nicholas, M 2008, Participation in science, mathematics and technology in Australian education, Research Monograph no. 63, ACER, Melbourne.
Ainsworth S, Prain V & Tytler R 2011, ‘Drawing to Learn in Science’, Science, vol. 333, pp. 1096 – 1097.
AMSI 2012a, Discipline Profile of the Mathematical Sciences, Australian Mathematical Sciences Institute, Melbourne.
AMSI 2012b, Forum Communique (press release), Australian Mathematical Sciences Institute, Melbourne.
ANAO 2012, Audit Report No.41 2011–12 Performance Audit National Partnerships Agreement on Literacy and Numeracy, Australian National Audit Office, Canberra, viewed 5 January 2013, http://www.anao.gov.au/~/media/Uploads/Audit per cent20Reports/2011 per cent2012/201112 per cent20Audit per cent20Report per cent20No41.pdf
ATN-G08 Symposium 2011, Excellence in Innovation: Measuring the Dividend, viewed 22 March 2013, http://www.go8.edu.au/__documents/go8-policy-analysis/2012/atn-go8-report-web-pdf.pdf
Au, W 2007, ‘High Stakes Testing and Curricular Control: A Qualitative Metasynthesis’, Educational Researcher, vol. 36, no. 5, pp. 258-267.
Australian Government 2009, Powering Ideas: An Innovation Agenda for the 21st Century, viewed 6 January 2013 http://www.innovation.gov.au/Innovation/Policy/Documents/PoweringIdeas.pdf
Australian Government 2009, Transforming Australia’s Higher Education System, Australian Government, Canberra, viewed 11 January 2013, http://www.innovation.gov.au/HigherEducation/Documents/TransformingAusHigherED.pdf
Australian Government 2012, National Plan for School Improvement – FAQs, Australian Government, Canberra, viewed 31 December 2012, http://www.schoolfunding.gov.au/node/148#how-long-will-it-take-to-implement
AWPA 2012, Future focus: Australia’s skills and workforce development needs Discussion paper, Australian Workforce and Productivity Agency, Canberra, viewed 1 March 2013 http://www.awpa.gov.au/publications/documents/Future-Focus-Australias-skills-and-workforce-development-needs-Discussion-Paper.pdf
Banner, I, Donnelly, J, Homer, M & Ryder, J 2010, ‘The impact of recent reforms in the KS4 science curriculum’, School Science Review, vol. 92, no. 339, pp. 101-109.
Barrington, F 2011, AMSI Interim Update on Year 12 Mathematics Student Numbers, 2011, Australian Mathematical Sciences Institute, Melbourne.
Barro, R 2001, ‘Human capital and growth’, American Economic Review, vol. 91, no. 2, pp. 12-17.
Bell, S 2010, ‘Women in science: The persistence of gender in Australia’, Higher Education Management and Policy, OECD Publishing, vol. 22, no. 1, pp. 1-19.
Blenkinsop, S, McCrone, T, Wade, P, & Morris, M 2006, How do young people make choices at 14 and 16?, Department for Education and Skills, viewed 19 March 2013, http://dera.ioe.ac.uk/6449/1/RR773.pdf
Breakspear, S 2012, The policy impact of PISA: An exploration of the normative effects of international benchmarking in school system performance, OECD Education Working Papers, vol. 71 pp. 1-30.
Broadbridge, P & Henderson, S 2008, Mathematics Education for 21st Century Engineering Students, Australian Mathematical Sciences Institute, Melbourne, viewed 26 February 2013, http://scholar.google.com.au/scholar?cluster=18143973785765796401&hl=en&as_sdt=0,5&as_vis=1
Bush, V 1945, Science, the Endless Frontier, United States Government Printing Office, Washington, viewed 20 March 2013, http://www.nsf.gov/od/lpa/nsf50/vbush1945.htm
Congress of the United States of America 2010, America COMPETES Act, viewed 20 March 2013, http://thomas.loc.gov/cgi-bin/query/z?c111:H.R.5116:
Coupland, M 2006, A critical analysis of selected Australian and international mathematics syllabuses for the post-compulsory years of secondary schooling, Report prepared for the NSW Board of Studies, Sydney, viewed 19 March 2013, http://www.boardofstudies.nsw.edu.au/manuals/pdf_doc/maths_st6_lit_curr_rev_pt1.pdf
Cutler and Company 2008, Venturous Australia – building strength in innovation, viewed 6 January 2013, http://www.innovation.gov.au/Innovation/Policy/Documents/NISReport.pdf

167
DEEWR 2012a, Skills Shortage List Australia, Department of Education, Employment and Workplace Relations, Canberra, viewed 7 January 2013, http://deewr.gov.au/skill-shortages
DEEWR 2012b, Skills Shortages New South Wales, Department of Education, Employment and Workplace Relations, Canberra, viewed 7 January 2013, http://deewr.gov.au/skill-shortages
DEEWR 2012c, Skills Shortages Queensland, Department of Education, Employment and Workplace Relations, Canberra, viewed 7 January 2013, http://deewr.gov.au/skill-shortages
DEEWR 2012d, Skills Shortages Tasmania, Department of Education, Employment and Workplace Relations, Canberra, viewed 7 January 2013, http://deewr.gov.au/skill-shortages
DEEWR 2012e, Skills Shortages Northern Territory, Department of Education, Employment and Workplace Relations, Canberra, viewed 7 January 2013, http://deewr.gov.au/skill-shortages
Department for Business Innovation and Skills 2011, STEM graduates in non STEM jobs, Department for Business, Innovation and Skills, London.
DfES 2004, Science & innovation investment framework 2004-2014, Department for Education and Skills and Treasury, London, viewed 19 March, 2013, http://news.bbc.co.uk/nol/shared/bsp/hi/pdfs/science_innovation_120704.pdf
DIISRTE 2012, Australian Innovation System Report 2011, Australian Government, viewed 21 March 2013, http://www.innovation.gov.au/Innovation/Policy/Pages/AustralianInnovationSystemReport.aspx
Dobson, IR 2012, Unhealthy Science? University Natural and Physical Sciences 2002 to 2009/10, Report prepared for the Office of the Chief Scientist, viewed 11 January 2013, http://www.chiefscientist.gov.au/wp-content/uploads/Unhealthy-Science-Report-Ian-R-Dobson.pdf
Duggan, S, & Gott, R 2002, ‘What sort of science education do we really need?’ International Journal of Science Education, vol. 24, no. 7, pp. 661–679.
European Centre for the Development of Vocational Training (CEDEFOP) 2012, RESEARCH PAPER No 26: Future skills supply and demand in Europe: Forecast 2012, Research Paper no. 26, Publications Office of the European Union, Luxembourg.
European Communities 2008, Mapping the maze: Getting more women to the top in research, Scientific Culture and Gender Issues, Directorate of Science, Economy and Society, European Commission, Brussels. Document Number: EUR 23311 EN.
European Union 2012, EU Skills Panorama Analytical Highlight, viewed 21 March 2013, http://euskillspanorama.ec.europa.eu/docs/AnalyticalHighlights/EngineeringProfessionals_en.pdf
Eurydice 2011, Science Education in Europe: National Policies, Practices and Research, European Commission, Brussels.
Federal Coordination in STEM Education Task Force Committee on STEM Education National Science and Technology Council 2012, Co-ordinating Federal Science, Technology, Engineering and Mathematics 2012, Education Investments: Progress Report, viewed 19 March 2013, http://www.whitehouse.gov/sites/default/files/microsites/ostp/nstc_federal_stem_education_coordination_report.pdf
Goodrum, D, Druhan, A & Abbs, J 2012, The Status and Quality of Year 11 and 12 Science in Australian Schools, Australian Academy of Science, viewed 24 April 2012, http://www.science.org.au/publications/documents/Year11and12Report.pdf
Gonski, D, Boston, K, Greiner, K, Lawrence, C, Scales, B & Tannock, P 2011, Review of Funding for Schooling – Final Report, Australian Government, Canberra, viewed 28 December 2012 http://foi.deewr.gov.au/node/30439/
Grek, S 2009, ‘Governing by numbers: The PISA ‘effect’ in Europe’, Journal of Education Policy, vol. 24, no. 1, pp. 23-37.
Hanushek, E, & Kimko, DD 2000, ‘Schooling, labour-force quality and the growth of nations’, American Economic Review, vol. 90, no. 5, pp. 1184-1208.
Hanushek, EA & Woessmann, L 2008, ‘The role of cognitive skills in economic development’, Journal of Economic Literature, vol. 46, no. 3, pp. 607-668.
Hanushek, EA & Woessmann, L 2009, Do better schools lead to more growth? Cognitive skills, economic outcomes, and causation, Institute for the Study of Labour Discussion Paper, no. 4575.
Hanushek, EA & Woessmann, L 2012, ‘Do better schools lead to more growth? Cognitive skills, economic outcomes, and causation’, Journal of Economic Growth, vol. 17, no. 4, pp. 267-321.
Henry et al. 2012, White Paper on Australia in the Asian Century, report prepared for the Department of the Prime Minister and Cabinet, viewed 19 March 2013, http://asiancentury.dpmc.gov.au/white-paper
Hobbs, L 2012, Teaching ‘out-of-field’ as a boundary-crossing event, International Journal of Science and Mathematics Education, 1-31.
Hong, S, Hwang, Y, Bae, Y, Hong, S-B, Jung, S, Lee, S, … Huh, H 2010, Role of science and technology in leading the economic development of Korea and its implications for developing countries, Science and Technology Policy Institute, Seoul.
House of Lords 2012, Higher Education in Science, Technology, Engineering and Mathematics, Select Committee on Science and Technology 2nd Report of Session 2012–13, House of Lords, London.
Jensen, B, Hunter, A, Sonnemann, J, & Burns, T 2012, Catching up: learning from the best school systems in East Asia, Grattan Institute, viewed 21 April 2013, http://grattan.edu.au/publications/reports/post/catching-up-learning-from-the-best-school-systems-in-east-asia/

168
Kearney, C 2011, Efforts to increase students’ interest in pursuing science, technology, engineering and mathematics studies and careers, European Schoolnet.
Keating, J, Annett, P, Burke, G & Hanlon, C 2011, Mapping funding and regulatory arrangements across the Commonwealth and state and territories, report prepared by the University of Melbourne, commissioned by the Victorian Department of Education and Early Childhood Development on behalf of the Ministerial Council for Education, Early Childhood Development and Youth Affairs, viewed 19 March 2013, http://www.mceecdya.edu.au/verve/_resources/Mapping_Funding_and_Regulatory_Arrangements_-July_2011.pdf
Kingdon, J 1995, Agendas, Alternatives, and Public Policy, (2nd ed.) Harper Collins, New York.
Kitazawa, Koichi 2010, Kagaku Gijutsu wa Nihon o Sukuu noka: ‘Dai Yon no Kachi’ o Mezashite [Can Science and Technology Save Japan?: Toward the creation of the ‘forth value’], Tokyo: Discover Twenty-One (in Japanese).
Krueger, AB & Lindahl, M 2001, ‘Education for growth: Why and for whom?’, Journal of Economic Literature, vol. 39, no. 4, pp. 1101-1136.
Leiden University 2012, Leiden Ranking 2011/2012, viewed 19 March 2013, http://www.leidenranking.com/ranking.aspx
Lyons, T 2006, ‘The puzzle of falling enrolments in physics and chemistry courses: Putting some pieces together’, Research in Science Education, vol. 36, no. 3, pp. 285-311.
Lyons, T & Quinn, F 2010, Choosing Science: understanding the declines in senior high school science enrolments, National Centre of Science, ICT and Mathematics Education for Rural and Regional Australia, University of New England, Armidale.
Mack, J & Walsh, B 2013, Mathematics and science combinations NSW HSW 2001-2011 by gender.
Marginson, S 2011, ‘Higher education in East Asia and Singapore: Rise of the Confucian model’, Higher Education, vol. 61, no. 5, pp. 587-611.
McKenzie, P, Rowley, G, Weldon, P & Murphy, M 2011, Staff in Australia’s Schools 2010: Main Report of the Survey, Report prepared for the Department of Education, Employment and Workplace Relations by Australian Council for Educational Research, DEEWR, Canberra.
MEXT 2002, Annual Report on the Promotion of Science and Technology 2002, Ministry of Education, Culture, Sports, Science and Technology, Japan.
Mullis, IVS, Martin, MO, Foy, P & Arora, A 2012a, TIMSS 2011 International Results in Mathematics, International Association for the Evaluation of Educational Achievement, Boston.
Mullis, IVS, Martin, MO, Foy, P & Arora, A 2012b, TIMSS 2011 International Results in Science, International Association for the Evaluation of Educational Achievement, Boston.
National Academies’ Committee on Science, Education and Public Policy 2007, Rising Above the Gathering Storm: Energizing and Employing America for a Brighter Economic Future, Committee on Science, Engineering and Public Policy, viewed 19 March 2013, http://www.nap.edu/openbook.php?isbn=0309100399
NCVER 2012,Tertiary education and training in Australia 2010, Department of Industry, Innovation, Science, Research and Tertiary Education, viewed 19 March 2013, http://www.ncver.edu.au/publications/2489.html
National Governors’ Association 2011, Building a Science, Technology, Engineering and Maths Education Agenda: An Update of State Actions, viewed 19 March 2013, http://www.nga.org/files/live/sites/NGA/files/pdf/1112STEMGUIDE.PDF
National Science Board 2009, STEM Education Recommendations for the President-Elect Obama Administration, viewed 19 March 2013, www.nsf.gov/nsb/publications/2009/01_10_stem_rec_obama.pdf
OECD 2006, Evolution of student interest in science and technology studies: Policy report, OECD and Development Global Science Forum, Paris.
OECD 2010a, The high cost of low educational performance: The long-run economic impact of improving PISA outcomes, OECD Publishing, Paris.
OECD 2010b, PISA 2009 Assessment framework: Key competencies in reading, mathematics and science, OECD Publishing, Paris.
OECD 2010c, PISA 2009 Results – What students know and can do: Student performance in reading, mathematics and science, OECD Publishing, Paris. Volume 1.
OECD 2010d, PISA 2009 Results – Learning Trends: Changes in student performance since 2000, OECD Publishing, Paris. Volume 5.
OECD 2010e, Expectations for science-related careers by gender, OECD Factbook 2010: Economic, Environmental and Social Statistics, OECD Publishing, Paris.
OECD 2011, Science, Technology and Industry Scoreboard 2011, OECD Publishing, Paris.
OECD 2012, Education at a Glance 2012: OECD Indicators, OECD Publishing, Paris.
Office of the Australian Qualifications Framework Council 2012, AQF Qualifications, viewed 18 February 2013, http://www.aqf.edu.au/AbouttheAQF/AQFQualifications/tabid/98/Default.aspx
Office of the Chief Scientist 2012a, Health of Australian Science, Australian Government, viewed 19 March 2013, http://www.chiefscientist.gov.au/2012/05/health-of-australian-science-report-2/

169
Office of the Chief Scientist 2012b, Mathematics, Engineering and Science in the National Interest, Australian Government, viewed 21 March 2013, http://www.chiefscientist.gov.au/wp-content/uploads/Office-of-the-Chief-Scientist-MES-Report-8-May-2012.pdf
President’s Council of Advisors on Science and Technology 2010, Report to the President Prepare and inspire: K-12 education in science, technology, engineering and math (STEM) for America’s future, viewed 19 March 2013, http://www.whitehouse.gov/sites/default/files/microsites/ostp/pcast-stem-ed-final.pdf
President’s Council of Advisors on Science and Technology 2012, Engage to Excel, viewed 19 March 2013, http://www.whitehouse.gov/sites/default/files/microsites/ostp/pcast-engage-to-excel-final_2-25-12.pdf
SACE Board of SA n.d., About the SACE, viewed 18 February 2013, http://www.sace.sa.edu.au/the-sace/students-families/about-the-sace
Sainsbury, LoT 2007, The Race to the Top: A Review of Government’s Science and Innovation Policies, HM Treasury, London.
Salmi J 2009, The Challenge of Establishing World-class Universities, World Bank, Washington, viewed 19 March 2013, http://siteresources.worldbank.org/EDUCATION/Resources/278200-1099079877269/547664-1099079956815/547670-1237305262556/WCU.pdf
SCOTESE 2012, National Foundation Skills Strategy for Adults, Standing Council on Tertiary Education Skills & Employment, Canberra.
Sianesi, B & Reenen, JV 2003, ‘The returns to education: Macroeconomics’, Journal of Economic Surveys, vol. 17, no. 2, pp. 157-200.
Smith, DV & Gunstone, RF 2009, Science curriculum and the market liberal society of the 21st century: ‘Re-visioning’ the idea of Science for All, Research in Science Education, vol. 39, pp. 1-16.
Sjøberg, S & Schreiner, C 2010, The ROSE Project: An overview and key findings, Naturfagsenteret, Oslo.
Stacey, K 2003, The need to increase attention to mathematical reasoning. In Hollingsworth, H, Lokan, J & McCrae, B, Teaching mathematics in Australia: Results from the TIMSS 1999 video study (pp. 119-122), Australian Council for Educational Research, Melbourne.
Tasmanian Qualifications Authority n.d. Tasmanian Certificate of Education, viewed 18 February 2013, http://www.tqa.tas.gov.au/1906#stand
The Science and Technology Basic Law (Chapter 1, Article 1), Law No. 130 of 1995.
Thomson, S, De Bortoli, L, Nicholas, M, Hillman, K & Buckley, S 2010, Challenges for Australian education: results from PISA 2009, Australian Council for Educational Research, Melbourne, viewed 11 January 2013, http://research.acer.edu.au/ozpisa/9
Thomson, S, Hillman, K & Wernert, N 2012a, Monitoring Australian year 8 student achievement internationally: TIMSS and PIRLS 2011, Australian Council for Educational Research, Melbourne.
Thomson, S, Hillman, K, Wernert, N, Schmid, M, Buckley, S & Munene, A 2012b, Monitoring Australian year 4 student achievement internationally: TIMSS and PIRLS 2011, Australian Council for Educational Research, Melbourne.
Tomei, A, Dawson, E & Dillon, J 2013, A study of Science, Technology, Engineering and Mathematics education in the United Kingdom, unpublished.
Tytler, R 2007, Re-imaging Science Education Engaging students in science for Australia’s future, Australian Education Review, Australian Council for Educational Research, Melbourne.
Tytler, R, Osborne, J, Williams, G, Tytler, K & Cripps Clark, J 2008, Opening up pathways: Engagement in STEM across the Primary-Secondary school transition, Department of Education, Employment and Workplace Relations, Canberra, viewed 19 March 2013, http://pandora.nla.gov.au/tep/88047
Tytler, R, Symington, D, Darby, L, Malcolm, C & Kirkwood, V 2011a, ‘Discourse Communities: A model for considering professional development for teachers of science and mathematics’, Teaching and Teacher Education, vol. 27, no. 5, pp. 871-879.
Tytler, R, Symington, D, & Smith, C 2011b, ‘A curriculum innovation framework for science, technology and mathematics education’, Research in Science Education, vol. 41, pp. 19-38.
UNESCO 2007, Science, technology and gender: An international report, Science and Technology for Development Series, UNESCO, Division for Science Policy and Sustainable Development.
UNESCO 2010, Engineering: Issues, challenges and opportunities for development, UNESCO, the World Federation of Engineering Organisations, the International Council of Academies of Engineering and Technological Sciences, and the International Federation of Consulting Engineers.
Wiseman, AW 2010, Introduction: The advantages and disadvantages of national education policy making informed by international achievement studies. In A.W. Wiseman The impact of international achievement studies on national
education policy making. Emerald Group Publishing Limited, Bingley.

170
Professor Simon Marginson FASSA (Chair)
Professor Marginson is Professor of Higher Education in the Centre for the Study of Higher Education
(CSHE) at the University of Melbourne. He is Joint Editor-in-Chief of Higher Education, the principal world
scholarly journal in higher education studies. Professor Marginson works in sociology and policy studies
in relation to higher education, and comparative and international education. He has held continuous
Australian Research Council support for basic research since 1995, including an ARC Australian Professorial
Fellowship awarded in 2002. He directed the 2002 ASSA Project on ‘The contribution of postgraduate
training in the Social Sciences to Australia’ and has prepared three OECD policy reports on aspects of
higher education and globalisation.
Professor Russell Tytler (Deputy)
Professor Tytler is the Chair in Science Education at Deakin University, deputy director of the Centre
for Research in Educational Futures and Innovation (CREFI) and heads the very productive Science,
Technology, Environmental and Mathematics Education group. He is also ‘hub cap’ of the Victorian SiMERR
rural and regional network. He has had considerable involvement with science curriculum development
in Victoria and nationally, and science education initiatives of the AAS and ATSE. He has been CI on a
range of ARC and government funded research and development projects focusing on student learning in
science and teacher pedagogy and professional learning. Professor Tytler has been a visiting professor in
Universities in Hong Kong and in Sweden.
Professor Stephen Gaukroger FAHA
Professor Gaukroger is currently Professor of History of Philosophy and History of Science at the University
of Sydney. He has served as President of the Australasian Association for the History, Philosophy, and
Social Studies of Science; President of the Australasian Society for the History of Philosophy; Chair of the
Australian Academy of Science National Committee for the History and Philosophy of Science and he is
currently President of the International Society for Intellectual History. He is editor of the series Studies
in History and Philosophy of Science published by Kluwer, and on the editorial boards of the Australasian
Journal of Philosophy, and the British Journal for the History of Philosophy.
Mr David Hind FTSE
David Hind is Chair of Skills Tasmania, an angel investor and Chair of Barefoot Power Pty Ltd, a board
member of the childhood cancer charity Redkite and is Director of External Relations at the University of
Sydney’s School of Chemical and Biomolecular Engineering. He is a past President of the Business Higher
Education Round Table (B-HERT) and was a vice Chair of the Education Forum of ATSE. In 2005, David
retired as Managing Director of BOC South Pacific following CEO/Chair positions in the UK, Thailand and
Japan. He was a member of the Business Council of Australia from 1998 to 2005.
Expert Working Group

171
Professor Nalini Joshi FAA
Professor Nalini Joshi is Professor of Applied Mathematics at the University of Sydney. Nalini has taught
mathematics at ANU, UNSW, the University of Adelaide and the University of Sydney. She has been a
Visiting Professor at Kyoto University in Japan and the University of Leeds, UK. She was Head of the School
of Mathematics and Statistics (2007-09), President of the Australian Mathematical Society (2008-10),
and is now Chair of the National Committee for Mathematical Sciences and a member of the Council of
the Australian Academy of Science. In 2012, she was awarded the Georgina Sweet Australian Laureate
Fellowship, to focus on creating new mathematical methods to describe critical solutions of nonlinear
mathematical systems, and provide activities to promote and support women and early career researchers
in science.
Professor Geoff Prince
Since 2009 Professor Prince has been Director of the Australian Mathematical Sciences Institute (AMSI).
Geoff has taught at RMIT, the University of New England and La Trobe. He worked at AMSI in 2004 through
to 2006 in part as executive director to Garth Gaudry and he oversaw the introduction of the AMSI/
ICE-EM Access Grid Room project. AMSI aims to support research at all levels including mathematics in
cross-disciplinary areas, business and industry; enhance the undergraduate and postgraduate experience
of students in the mathematical sciences and cognate disciplines; and to improve the supply of
mathematically well-prepared students entering tertiary education.
Professor Sue Richardson FASSA
Professor Richardson is Principal Research Fellow and deputy Director of the National Institute of Labour
Studies, Flinders University. Her principal research interests are in the fields of the labour market, the
ageing workforce, immigration, income distribution and the economic resources devoted to children. She
has a part-time appointment as a Member of Fair Work Australia (Minimum Wage Panel). In recent years
she has been a member of a number of Boards including the Council for the Humanities, Arts and Social
Sciences, the National Academies Forum, the South Australian Certificate of Education, the SA Population
Advisory Committee and she led a foresighting group to advise the Prime Minister’s Science, Innovation
and Engineering Council.
All EWG members have declared any relevant interests.

172
We would like to thank the project participants David Atkins (DEEWR), Will Howard (Office of the Chief
Scientist), and Karen Welsh (DIICCSRTE). We would also like to thank Ann Harding, who was a Project
Consultant. We would like to thank Jane Aitken (DEEWR) and Esther Robinson (DEEWR). The project was
supported and managed by ACOLA Secretariat. We are grateful to Jacques de Vos Malan, General Manager,
and Rebecca Skinner, Communications and Project Manager.
Acknowledgements

173

174
Country, regional and special interest reports
The evidence included country, regional and special interest reports:
Anthony Tomei, Emily Dawson and Justin Dillon King’s College London A study of Science, Technology, Engineering and Mathematics education in the United Kingdom
Adam Maltese, Indiana University Florin Lung and Geoff Potvin, Clemson University Craig Hochbein, University of Louisville STEM Education in the United States
Anna Smolentseva National Research University – Higher School of Economics, Moscow Science, Technology, Engineering and Mathematics: Issues of Educational Policy in Russia
Brigid Freeman University of Melbourne Science, Technology, Engineering and Mathematics (STEM) in Australia: Practice, policy and programs
Brigid Freeman University of Melbourne Snapshots of 23 Science, Technology, Engineering and Mathematics (STEM) consultants’ reports: Characteristics, lessons, policies and programs
Cathy Buntting and Alister Jones, University of Waikato Liz McKinley and Mark Gan, University of Auckland STEM initiatives and issues in New Zealand
Cynthia Fernandez Roich University of Melbourne Study of Science, Technology, Engineering and Mathematics (STEM) and STEM-related issues in Argentina
Elodie de Oliveira, OECD Kelly Roberts, University of Melbourne Literature Review: STEM Education in France
Gili Drori and Avida Netivi
The Hebrew University of Jerusalem
STEM in Israel: The Educational Foundation of
‘Start-Up Nation’
Glen Aikenhead
University of Saskatchewan
Science, Technology, Engineering and Mathematics
Education and Related Employment for Indigenous
Students and Citizens of Saskatchewan
Hugo Horta
Technical University of Lisbon
Education in Brazil: Access, quality and STEM
Hugo Horta
Technical University of Lisbon
STEM education in Portugal: Education,
policies and labor market
Ian Dobson
University of Ballarat
… a critical examination of existing
solutions to the STEM skills shortage in
comparable [European] countries
Ian Dobson
University of Ballarat
… a critical examination of existing solutions
to the STEM skills shortage in comparable
[European] countries: Finland Country Report
Jae-Eun Jon, Korea University and
Hae-In Chung, University of Minnesota
STEM Report – Republic of Korea
Josh Healy, Kostas Mavromaras and Rong Zhu
Flinders University
The STEM Labour Market in Australia
Julian Weinrib and Glen Jones
University of Toronto
Canada’s Approach to Science, Technology,
Engineering and Mathematics (STEM):
Context, Policy, Strategy and Programs
Evidence gathering

175
Kelly Roberts
University of Melbourne
Literature Review – A selection of the work
of international organizations on STEM
education and STEM-related issues
Noraini Idris, Mohd Fadhil Daud, Chew Cheng
Meng, Leong Kwan Eu and Ahmad Dzohir Ariffin
@ Maarof
University of Malaya
Country Report Singapore STEM
Marilyn Cole
Deakin University
Literature review update: Student identity in
relation to Science, Technology, Engineering and
Mathematics subject choices and career aspirations
Mayumi Ishikawa, Shota Fujii and Ashlyn Moehle
Osaka University
STEM Country Comparisons: Japan
Michael Kahn
Stellenbosch University
Science, Technology, Engineering and
Mathematics (STEM) in South Africa
Sharon S. Nelson-Barber
Pacific Resources for Education and Learning
(PREL)
US Indigenous STEM Report
Yuan Gao
University of Melbourne
Report on China’s STEM System
Yuan Gao
University of Melbourne
Report on Taiwan: STEM (Science, Technology,
Engineering and Mathematics)
National Workshop – Transforming STEM Capacity (21 February 2013), Canberra
Participants in the National Workshop
included the following:
Alan Green
General Manager Early Years and Schools
Department of Education – Tasmania
Anita Trenwith
Salisbury High School
Anna-Maria Arabia
General Manager Strategy and Partnerships
Questacon National Science
and Technology Centre
Associate Professor Deborah Corrigan
Co-Director, Centre for Science, Mathematics and
Technology Education, Monash University
Australasian Science Education Research
Association (ASERA)
Associate Professor Kim Beswick
Australian Association of
Mathematics Teachers (AAMT)
Brigid Freeman
STEM Country Comparisons Project Co-ordinator
Centre for the Study of Higher Education
University of Melbourne
Catriona Jackson
Chief Executive Officer
Science & Technology Australia
David Hind
Skills Tasmania
Member, Expert Working Group
Dr Angela Ferguson
Principal Research Officer
Department of Education, Training
and Employment – Queensland

176
Dr Caroline Perkins
Executive Director
Regional Universities Network (RUN)
Dr Deborah Keighley-James
Principal Policy Adviser, Tertiary Education
Department of Further Education, Employment,
Science and Technology – South Australia
Dr Ian Dobson
Honorary Senior Research Fellow
School of Education and Arts
University of Ballarat
Project Consultant
Dr Joanna Sikora
Graduate Convenor
Lecturer
School of Sociology
Australian National University
Dr Kylie Brass
Policy & Projects Manager
Australian Academy of the Humanities
Dr Paula Newitt
(Acting) Director, Science Education
Associate Dean, Science@ANU
Australian National University
Dr Rob Dobson
Senior Policy Adviser
Skills Tasmania
Dr Roslyn Prinsley
National Adviser
Science and Mathematics Education and Industry
Office of the Chief Scientist
Dr Siu-Ming Tam
Chief Methodologist / First Assistant Statistician
Australian Bureau of Statistics
Dr Sue Thomson
Director, Educational Monitoring and Research
Division
Research Director, National Surveys
Australian Council for Educational
Research (ACER)
Dr Will Howard
Office of the Chief Scientist
Esther Robinson
Assistant Director
Department of Education, Employment
and Workplace Relations (DEEWR)
Heather Dyne
Regional Universities Network (RUN)
Helen Law
PhD candidate
School of Sociology
Australian National University
Jan Brooks
Manager STEM Strategy R-12
Department for Education and Child
Development – South Australia
Jane Aitken
Director, Learning Areas Support
Australian Curriculum Branch
Curriculum, Assessment and Teaching Group
Department of Education, Employment
and Workplace Relations (DEEWR)
Jim Davies
Chief Executive Officer
Principals Australia Institute
Karen Welsh
Director, Policy Unit
Higher Education Division
DIISRTE

177
Kelly Roberts
Centre for the Study of Higher Education
University of Melbourne
Project Consultant
Kirsten Woyzbun
Assistant Director
Australian Workforce and Productivity Agency
Nicole Mackey
Acting CarbonKids Manager
CSIRO
Paul Floyd
Curriculum Officer
ACT Education and Training
Peter Crawford
Secretary Treasurer
Australian Secretary Principals Association
Professor Ann Harding
University of Canberra
Project Consultant
Professor Brian Yates
Executive Director (Physical, Mathematics and
Information Sciences, and Engineering)
Australian Research Council
Professor Geoff Prince
Director, Australian Mathematical Sciences
Institute
Member, Expert Working Group
Professor Mahananda Dasgupta
Australian Laureate Fellow
Australian National University
Professor Nalini Joshi
University of Sydney
Member, Expert Working Group
Professor Pat Drake
College of Education, Dean
Victoria University
Professor Peter Adams
Associate Dean (Academic)
Faculty of Science
University of Queensland
Science and Technology Australia
Professor Russell Tytler
Professor of Science Education
Deakin University
Deputy Chair, Expert Working Group
Professor Simon Marginson
Centre for the Study of Higher Education
University of Melbourne
Chair, Expert Working Group
Professor Stephen Gaukroger
University of Sydney
Member, Expert Working Group
Professor Sue Richardson
Flinders University
Member, Expert Working Group
Professor Sue Stocklmayer
Director
Australian National Centre for the Public
Awareness of Science
Australian National University
Rebecca Skinner
Communications and Project Manager,
Secretariat
Australian Council of Learned Academies
Robyn Aitken
Australian Science Teachers Association (ASTA)

178
This report has been reviewed by an independent panel of experts. Members of the Review Panel were
not asked to endorse the Report’s conclusions and recommendations. The Review Panel members acted
in a personal, not organisational, capacity and were asked to declare any conflicts of interest. ACOLA
gratefully acknowledges their contribution.
Professor Lyn EnglishProfessor English is a professor in the field of mathematics education at the Queensland University of
Technology. Her areas of research expertise include mathematical modelling, problem solving, statistical
reasoning, the psychology of mathematics education, and engineering education. She is currently the
chief investigator on ARC projects addressing students’ development of statistical literacy, mathematical
modelling, mathematical learning of junior secondary school students, and primary and middle school
students’ knowledge and awareness of engineering. She is the founding editor of the international journal
“Mathematical Thinking and Learning” (Taylor & Francis).
Professor Denis GoodrumProfessor Goodrum is an Emeritus Professor and Executive Director of Science by Doing at the Australian
Academy of Science. He is former Dean of Education of the University of Canberra and has been involved
in many national and international activities in science education. In 1998 he was a visiting scholar
at the National Research Council in Washington DC working on a project examining inquiry and the
National Science Education Standards. He is presently Chair of the ACT Teacher Quality Institute. Professor
Goodrum has been involved in many national projects including Australian Science Curriculum, Primary
Investigations and the Australian School Science Education: National Action Plan 2008–12.
Professor Richard GunstoneEmeritus Professor Gunstone was previously Professor of Science and Technology Education, and Director
(and founder) of the Monash-King’s College (London) International Centre for the Study of Science and
Mathematics Curriculum. He has extensive research, development and consultancy experience in learning,
teaching, curriculum, assessment, and teacher development, in school and undergraduate science, physics,
engineering (and to a lesser extent medicine) contexts. Professor Gunstone is a Life Member of the Science
Teachers’ Association of Victoria and is widely published, including 14 books, 45 book chapters and over
140 refereed research papers. He is frequently invited to address international research conferences.
Dr Doreen Clark AM FTSE Dr Doreen Clark is a scientist with extensive experience in business. From 1969 to 1998 she was Managing
Director of Analchem Bioassay Pty Ltd, she is also a founding director (1991) of Organic Crop Protectants
Pty Ltd a firm which develops and markets environmentally friendly agricultural chemicals. This is her
major business interest following her retirement from Analchem Bioassay. Doreen trained as an organic
chemist, completing a BSc(Hons) degree at Sydney University and a PhD at the University of New South
Wales. Dr Clark was a member of a Commonwealth Committee appointed to review Higher Education
Financing and Policy which released its report “Learning for Life” in 1998. She was a member of the TAFE
Commission of NSW from 1999 to 2007.
Review Panel

179
In June 2012 the Australian Government
announced Securing Australia’s Future,
a $10 million investment funded by the
Australia Research Council in a series
of strategic research projects for the
Prime Ministers Science, Engineering and
Innovation Council (PMSEIC), delivered
through the Australian Council of Learned
Academies (ACOLA) via the Office of the
Chief Scientist and the Chief Scientist.
Securing Australia’s Future is a response
to global and national changes and
the opportunities and challenges of
an economy in transition. Productivity
and economic growth will result
from: an increased understanding in
how to best stimulate and support
creativity, innovation and adaptability;
an education system that values
the pursuit of knowledge across all
domains, including science, technology,
engineering and mathematics; and an
increased willingness to support change
through effective risk management.
PMSEIC identified six initial
research topics:
i. Australia’s comparative advantage
ii. STEM: Country comparisons
iii. Asia literacy – language and beyond
iv. The role of science, research
and technology in lifting
Australian productivity
v. New technologies and their role in
our security, cultural, democratic,
social and economic systems
vi. Engineering energy:
unconventional gas production
About Securing Australia’s Future
The Program Steering Committee
responsible for the overall quality of the
program, including selection of the Expert
Working Groups and the peer review
process, is comprised of three Fellows
from each of the four Learned Academies:
Professor Michael Barber FAA FTSE
(Chair)
Mr Dennis Trewin AO FASSA
(Deputy Chair – Research)
Professor Ruth Fincher FASSA
Professor Mark Finnane FAHA
Professor Paul Greenfield AO FTSE
Professor Iain McCalman AO
FAHA FASSA FRHS
Professor Peter McPhee AM FAHA FASSA
Dr Graham Mitchell AO FAA FTSE
Dr Jim Peacock AC FAA FTSE FRS
Dr Susan Pond AM FTSE
Professor John Quiggin FASSA
Dr Leanna Read FAICD FTSE
www.acola.org.au

PROJECT