Elections and accountability in South Africa
28
Collette Schulz-Herzenberg • ISS Paper 188 • June 2009 Elections and accountability in South Africa e principal mechanisms of political accountability in a democratic state attempt to control the risks associated with the rule of politicians over citizens. Regular elec- tions provide an important accountability mechanism by allowing citizens to decide whether or not to extend a government’s tenure. e threat of loss of office induces governments to become more responsive to the wishes and needs of the electorate. 1 Assuming that a government wishes to be returned to office, it will work towards an- ticipating the prospective expectations and retrospective judgements of the electorate in order to win once again. Citizens therefore use their vote to choose better govern- ments and to structure incentives for the incumbents that should induce them to behave while in office. In this view, elections are regarded as a sanctioning device that induces elected officials to do what the voters want. e anticipation of not being re-elected in the future leads elected officials not to shirk their obligations to the voters in the present. 2 Voters thereby employ their vote to sanc- tion the incumbents. Accountability is obtained by the efforts of government to win re-election. Hence, govern- ments are said to be ‘accountable’ if citizens can discern representative from unrepresentative governments and can sanction them appropriately, retaining in office those incumbents who perform well and ousting who do not. 3 e accountability view of elections therefore suggests that: Elections serve to hold governments responsible for the results of their past actions. Because they anticipate the judgment of voters, governments are induced to choose policies that in their judgment will be positively evaluated by citizens at the time of the next election. 4 For elections to act as an effective accountability mecha- nism, voters must be willing to sanction incumbents by looking at their past performance and punishing poor governance by withdrawing their support. When voters have little incentive or motivation to move their electoral support elsewhere, elections lose their sanctioning function. In other words, there should also be sufficient ‘electoral market’ to make selection among numerous political parties viable. Voters should also be sufficiently interested in and informed about politics to be able to move their support based on evaluations of the incum- bents’ performance. ese voters are typically ‘free’ from strong partisan loyalties and are interested in politics, or ‘cognitively mobilised’. is paper explores these different aspects of voter behaviour to assess whether elections can act as an effec- tive accountability mechanism in South Africa. 5 It finds that, while voters are willing to withdraw support from the incumbent party if they disapprove of its performance, they are unlikely to move their support to another party. Sanctioning government performance in the traditional sense is weak, making political accountability through elections more elusive. Paradoxically, the way in which political accountability currently manifests itself in the South African political system may actually lead to the entrenchment of one- party dominance, further reducing incentives for respon- sive and accountable governance by the incumbent party. e paper concludes that in the South African context electoral accountability relies less on the notion of sanc- tions as a means to punish government. Instead, greater attention should be given to the method of ‘selection’ as a means to control politicians. If this line of reasoning is adopted, elections can still act as an accountability mechanism and even as a sanctioning device. An ac- countability relationship can therefore be established when voters regard elections as an opportunity to choose among parties to select the best possible party on offer. 6 THE SOUTH AFRICAN ELECTORATE Every five years the South African electorate has the op- portunity to hold government to account for its past per- formance in office. South Africa has held four successful national and provincial democratic elections since 1994, which has seen the electoral dominance of the governing
-
Upload
khangminh22 -
Category
Documents
-
view
0 -
download
0
Transcript of Elections and accountability in South Africa

Collette Schulz-Herzenberg • ISS Paper 188 • June 2009
Elections and accountabilityin South Africa
The principal mechanisms of political accountability in a democratic state attempt to control the risks associated with the rule of politicians over citizens. Regular elec-tions provide an important accountability mechanism by allowing citizens to decide whether or not to extend a government’s tenure. The threat of loss of office induces governments to become more responsive to the wishes and needs of the electorate.1 Assuming that a government wishes to be returned to office, it will work towards an-ticipating the prospective expectations and retrospective judgements of the electorate in order to win once again. Citizens therefore use their vote to choose better govern-ments and to structure incentives for the incumbents that should induce them to behave while in office. In this view, elections are regarded as a sanctioning device that induces elected officials to do what the voters want. The anticipation of not being re-elected in the future leads elected officials not to shirk their obligations to the voters in the present.2 Voters thereby employ their vote to sanc-tion the incumbents. Accountability is obtained by the efforts of government to win re-election. Hence, govern-ments are said to be ‘accountable’ if citizens can discern representative from unrepresentative governments and can sanction them appropriately, retaining in office those incumbents who perform well and ousting who do not.3
The accountability view of elections therefore suggests that:
Elections serve to hold governments responsible for the results of their past actions. Because they anticipate the judgment of voters, governments are induced to choose policies that in their judgment will be positively evaluated by citizens at the time of the next election.4
For elections to act as an effective accountability mecha-nism, voters must be willing to sanction incumbents by looking at their past performance and punishing poor governance by withdrawing their support. When voters have little incentive or motivation to move their electoral support elsewhere, elections lose their sanctioning
function. In other words, there should also be sufficient ‘electoral market’ to make selection among numerous political parties viable. Voters should also be sufficiently interested in and informed about politics to be able to move their support based on evaluations of the incum-bents’ performance. These voters are typically ‘free’ from strong partisan loyalties and are interested in politics, or ‘cognitively mobilised’.
This paper explores these different aspects of voter behaviour to assess whether elections can act as an effec-tive accountability mechanism in South Africa.5
It finds that, while voters are willing to withdraw support from the incumbent party if they disapprove of its performance, they are unlikely to move their support to another party. Sanctioning government performance in the traditional sense is weak, making political accountability through elections more elusive. Paradoxically, the way in which political accountability currently manifests itself in the South African political system may actually lead to the entrenchment of one-party dominance, further reducing incentives for respon-sive and accountable governance by the incumbent party. The paper concludes that in the South African context electoral accountability relies less on the notion of sanc-tions as a means to punish government. Instead, greater attention should be given to the method of ‘selection’ as a means to control politicians. If this line of reasoning is adopted, elections can still act as an accountability mechanism and even as a sanctioning device. An ac-countability relationship can therefore be established when voters regard elections as an opportunity to choose among parties to select the best possible party on offer.6
The SouTh AfricAn elecTorATe
Every five years the South African electorate has the op-portunity to hold government to account for its past per-formance in office. South Africa has held four successful national and provincial democratic elections since 1994, which has seen the electoral dominance of the governing

� Elections and Accountability in South Africa • ISS Paper 188 • June 2009
African National Congress (ANC) party increase from 63 per cent to 70 per cent in 2004, and thereafter to drop to 65,9 per cent in the 2009 elections. In contrast, the opposition’s share of the vote steadily decreased from 37 per cent in 1994 to 30 per cent by 2004, and then rose to 34 per cent in 2009.
The electoral imbalances in the party system and the static and predictable nature of voting outcomes have raised concerns that elections fail to act as an account-ability mechanism. This has raised deeper concerns for the quality of democracy. An extended period in power can engender complacency, arrogance and even corrup-tion in a dominant party.7 When parties cease to ‘fear the ballot box’ they are likely to become unresponsive and ideologically entrenched.8 A dominant party, such as the ANC, is able to take the citizenry’s vote for granted because it is not seriously threatened at the polls. If there is no threat to prospects for re-election the value of elections as a means to discipline elite behaviour is eroded.9 Political uncertainty is good for democracy because it keeps politicians alert and makes them responsive to the citizenry.10 Furthermore, predominant party systems may lead to increased levels of political apathy as predetermined electoral outcomes de-energise the political system and cause stagnation among voters.11 Overall, these circumstances diminish competition for political leadership and opportunities for elite rotation or government turnover.12 Political certainty about electoral outcomes and the prospects of re-election invites predict-able politics, which, in turn, signals the deterioration of responsive and accountable government to citizens.13
The reason for the predictability of electoral results is said to lie with voters themselves. Seeing South Africa through the prism of a highly divided society, scholars warn that the legacies of colonialism and apartheid encourage enduring and inflexible racial and ethnic cleavages that inform electoral behaviour.14 The 1994 elections were widely described as a ‘racial or ethnic census’, since the electoral outcome seemed to reflect a link between the voter and his/her race or ethnicity. Fifteen years later partisan support still appears racially aligned or, at least, motivated by notions of group politics. The electoral dominance of the ANC has also led scholars to suggest that ANC voters, in particular, are an unquestionably loyal and enthusiastic group. As such, the ANC government’s economic and political performance, however fair or poor, is likely to have little impact on these voters. The implication of an impervious majority of voters is dire for government accountability. If ANC supporters continually disregard or pay little heed to government performance, accountability is diminished.
The threat of electoral sanction for the incumbent party is therefore seriously undermined when voters are bound by ascriptive identities. Electoral politics based
on any form of ascriptive identities (with the associated static voting outcomes) can hinder the quality of a democracy because it undermines essential components such as competitiveness, accountability, responsiveness and equality. When voters are constrained by strong cleavage identities they are unavailable to respond to the ‘political market’ created by the existence of multiple political parties. Further, parties have little reason to try and persuade new voters while government has little reason to consider voter reactions to public policy in terms of its impact on electoral prospects. Democracy requires more than formal endowments. It demands a degree of uncertainty about the outcomes of political competition to ensure accountable and responsive government. If voting behaviour is motivated by fixed so-ciological and cultural factors such as race and ethnicity, there are no incentives for political uncertainty. Indeed, due to the demographic composition of the electorate, racially motivated voting would most likely generate permanent majorities in South Africa.
SAncTioning governmenT
There are several indications that voters, including government supporters, are not impervious to bad performance but instead show their willingness to withdraw their support at elections. The first indications are to be found in an aggregate analysis of voter trends, which show that there is an overall decline of electoral participation, including within the ANC support base. The second indication is found in data showing that voter evaluations of government’s economic performance influence the direction of party support. Voters withdraw their support when they have negative evaluations of the ANC’s economic performance and support the party when they perceive it has performed well on the economy. Together, these results show that voters are not unquestionably bound to their parties by strong partisan loyalties and that voters do evaluate the incumbent’s performance. This undermines the conventional wisdom that ANC core support continues to be extensive and is unquestionably loyal.
Trends in voter participation
Despite the initial appearance of stability in election results, a longitudinal study of trends in voter registra-tion and voter turnout between 1994 and 2009 suggests that several major changes have occurred, particularly in terms of the size of the active ANC electorate. When one looks beneath the aggregate election results it appears that South Africa has witnessed a general decline in electoral participation in terms of both voter registration and turnout. These patterns suggest that,
Collette Schulz-Herzenberg • ISS Paper 188 • June 2009 �
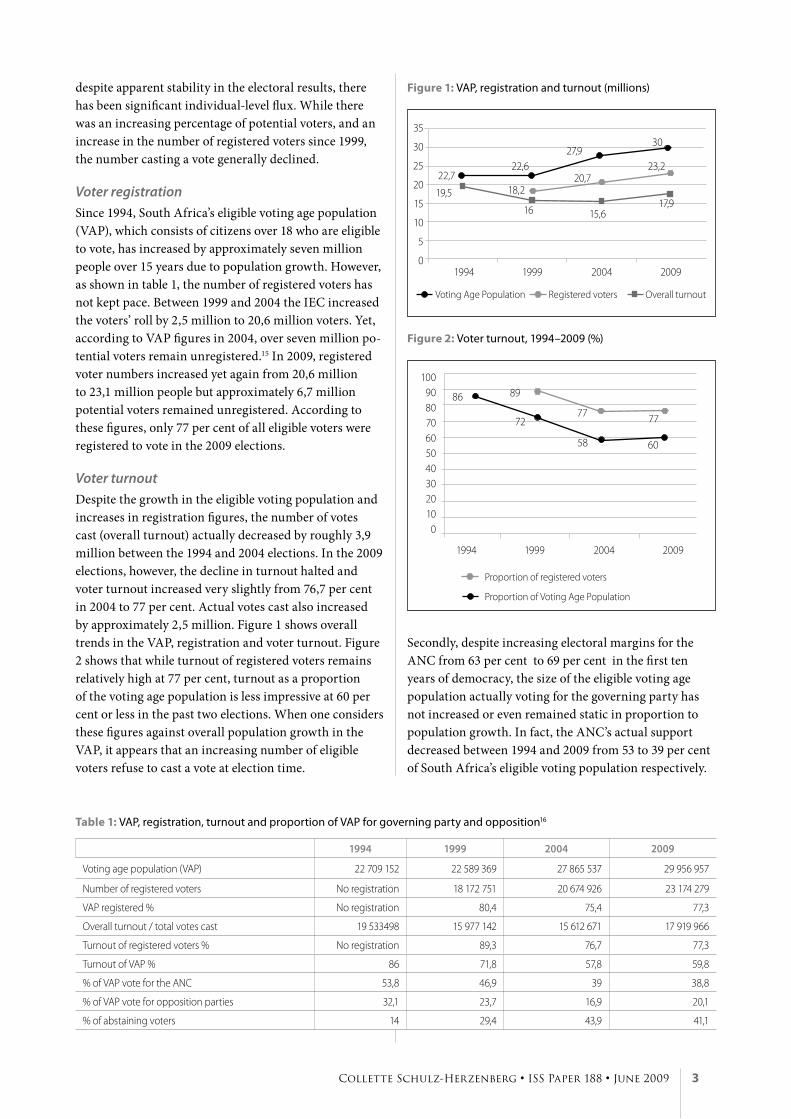
despite apparent stability in the electoral results, there has been significant individual-level flux. While there was an increasing percentage of potential voters, and an increase in the number of registered voters since 1999, the number casting a vote generally declined.
Voter registration Since 1994, South Africa’s eligible voting age population (VAP), which consists of citizens over 18 who are eligible to vote, has increased by approximately seven million people over 15 years due to population growth. However, as shown in table 1, the number of registered voters has not kept pace. Between 1999 and 2004 the IEC increased the voters’ roll by 2,5 million to 20,6 million voters. Yet, according to VAP figures in 2004, over seven million po-tential voters remain unregistered.15 In 2009, registered voter numbers increased yet again from 20,6 million to 23,1 million people but approximately 6,7 million potential voters remained unregistered. According to these figures, only 77 per cent of all eligible voters were registered to vote in the 2009 elections.
Voter turnoutDespite the growth in the eligible voting population and increases in registration figures, the number of votes cast (overall turnout) actually decreased by roughly 3,9 million between the 1994 and 2004 elections. In the 2009 elections, however, the decline in turnout halted and voter turnout increased very slightly from 76,7 per cent in 2004 to 77 per cent. Actual votes cast also increased by approximately 2,5 million. Figure 1 shows overall trends in the VAP, registration and voter turnout. Figure 2 shows that while turnout of registered voters remains relatively high at 77 per cent, turnout as a proportion of the voting age population is less impressive at 60 per cent or less in the past two elections. When one considers these figures against overall population growth in the VAP, it appears that an increasing number of eligible voters refuse to cast a vote at election time.
figure 1: VAP, registration and turnout (millions)
figure �: Voter turnout, 1994–2009 (%)
Secondly, despite increasing electoral margins for the ANC from 63 per cent to 69 per cent in the first ten years of democracy, the size of the eligible voting age population actually voting for the governing party has not increased or even remained static in proportion to population growth. In fact, the ANC’s actual support decreased between 1994 and 2009 from 53 to 39 per cent of South Africa’s eligible voting population respectively.
35
30
25
20
15
10
5
01994 1999 2004 2009
22,7
19,5
22,6
18,2
16
27,9
20,7
15,617,9
23,2
30
Voting Age Population Registered voters Overall turnout
Table 1: VAP, registration, turnout and proportion of VAP for governing party and opposition16
1994 1999 2004 2009
Voting age population (VAP) 22 709 152 22 589 369 27 865 537 29 956 957
Number of registered voters No registration 18 172 751 20 674 926 23 174 279
VAP registered % No registration 80,4 75,4 77,3
Overall turnout / total votes cast 19 533498 15 977 142 15 612 671 17 919 966
Turnout of registered voters % No registration 89,3 76,7 77,3
Turnout of VAP % 86 71,8 57,8 59,8
% of VAP vote for the ANC 53,8 46,9 39 38,8
% of VAP vote for opposition parties 32,1 23,7 16,9 20,1
% of abstaining voters 14 29,4 43,9 41,1
Proportion of registered voters
Proportion of Voting Age Population
86 89
77 7772
58 60
1009080706050403020100
1994 1999 2004 2009

� Elections and Accountability in South Africa • ISS Paper 188 • June 2009
By calculating the proportion of the VAP who voted for the ANC in 2004 we can see that the ANC has retained 72 per cent of its original 1994 vote share but lost approximately 28 per cent.17 Significant decreases in turnout and a reduced share of the vote qualifies the nature of the ANC’s victory in the past two national elections. The magnitude of the ANC’s election victories thus shrinks under scrutiny.
figure �: African National Congress electoral support, 1994–2009
In a corresponding fashion, the opposition has lost half of its active vote share among the eligible voter popula-tion. The size of the opposition bloc vote contracted from 32 per cent of the electorate in 1994 to 17 per cent in 2004, rising again thereafter to 20 per cent in 2009. The only major shifts are within the opposition bloc as votes are redistributed among these parties.18
figure �: The South African electorate, 1994–2009
The magnitude of aggregate partisan change between 1994 and 2009, demonstrated by the declines in regis-tered and actual voters and the proportion of VAP voting for the governing party, has been largely concealed by the apparent stability in aggregate electoral results.
Although the reasons for the withdrawal of participation are unclear, it is an early indication of voter volatility, whether it be a function of increasing political aliena-tion, disaffection or complacency. This withdrawal also offers a cursory suggestion that the electorate is not unquestionably loyal to its political parties. Something is happening under the surface, which casts doubt on conventional wisdom that voters fail to hold government to account by virtue of strong party loyalties.
Party identificationThe subtle shifts in aggregate party support shown above can be explored further by observing trends in party identification. Party identification provides a popular measure of party support. It is best described as an enduring psychological attachment to a political party that guides electoral behaviour.19 It is also is a changeable orientation. People move to and from their respective political parties in response to their evaluations of politi-cal and economic conditions and in response to their evolving evaluations of the performance of the parties and their candidates.20 It also acts as a ‘standing choice’ or default value for voters and is a substitute for more complete information about parties and candidates.21 Voters with a party identification are much more likely to vote and are very likely to vote for their preferred party. However, voters without a party identification are far harder to mobilise to vote and are more open to persua-sion and shifting their election day vote. Thus while party identification provides a good predictor of vote choice, it remains analytically distinct from the vote.22
Using survey questions that measure the concept of party identification, this section looks at overall trends and patterns in South African partisanship over time. In particular, it explores the level and direction of party identification among the entire electorate as well as party support for the ANC.23
Findings reveal that the level of partisanship in South Africa between 1994 and 2008 has fluctuated considerably and far more than is often acknowledged. Partisanship decreased for all political parties until 2002, after which it shows a rise. Figure 5 displays the level of partisanship over time, distinguishing between adults who declare themselves partisans and those who are non-partisans (or independents). After initially high levels of partisanship after the historic 1994 ‘liberation’ election, the proportion of partisans in the electorate declined significantly and then fluctuated between 70 and 45 per cent over the following 12 years. After 1994 no more than 64 per cent of the population has ever stated that they feel close to a political party. By 2008, 14 years into democracy, 40 per cent of the electorate were not overly loyal to any particular political party, and were
1994 1999 2004 2009
ANC % of VAPANC vote proportion
80706050403020
6266
47
69
39
66
39
60
50
40
30
20
10
0
1994 1999 2004 2009
VAP % ANC VAP % opposition VAP % no vote
54
4744 41
32
14
29
24
17
39 39
20

Collette Schulz-Herzenberg • ISS Paper 188 • June 2009 �
thus unguided at election time by long-standing partisan ties when deciding which party to support, suggesting that short-term forces influence party support.
figure �: Levels of party identification across entire electorate
Self-declared partisans can be further divided into those who support the ANC and those who support opposition parties. Figure 6 show the ratios of ANC and opposi-tion supporters (includes all opposition parties) across the electorate over time. Although the vast majority of declared partisans are ANC governing party supporters, there are several developments to be noted. Both the ANC and opposition parties have ‘leaked’ partisans to the independent category, which increased dramatically over time.
figure 6: Direction of party identification (ANC, opposition, independents)
Yet, new independents appear to disproportionately come from the opposition parties, which experienced a much higher rate of decline than the ANC. This develop-ment can be best described as ‘asymmetrical partisan dealignment’, as voters moved away from feeling close
to a particular party but more so from the opposition. Unable to maintain their proportional share of partisans, opposition parties have been the biggest losers. That op-position parties have proliferated and fragmented since 1994, together with the fact that they share a decreasing aggregate share of partisans, suggests that they have to work harder to convince voters to support them at each subsequent election. The only time in which the increase in ANC partisanship is shared by the opposition is between 2000 and 2002. So, where voters do return to their partisanship, it is almost always to the ANC and not to the opposition parties.
The computation of macropartisanship for South African data, shown in table 2, confirms that the pace of aggregate partisan change was quite rapid during the first decade of democracy.24 The consistent incremental change over time reflects the ANC’s increasingly larger share of the partisan ‘market’, due partly to the shedding of partisans from opposition parties among the South African electorate. In other words, as the measure rises, it reflects the rising proportion of ANC partisanship.
Table �: Macropartisanship: a measure for partisan balance over time
Years ‘94 ‘95 ‘97 ‘99 ‘00 ‘02 ‘04 ‘0668 67 72 78 77 72 88 87
The most notable feature from the analysis of partisan-ship is that the dealignment trend has created large numbers of potential ‘floating voters’ who are not overtly loyal to one particular political party, nor guided by long-standing partisan ties when deciding which party to support at elections. Between 1995 and 2008, non-partisans made up a substantial proportion of the eligible electorate (defined here as surveyed citizens who are eligible to vote), fluctuating between 36 per cent and 55 per cent. This ‘floating vote’ accounts for roughly a third to half of the electorate. Moreover, data suggest that it is not an ‘ossified floating vote’, as Schlemmer argues, ‘made up largely of minorities’.25 Instead, much of the non-partisan category is made up of black African voters. This raises questions about predictions that the ANC’s support base is driven by ascriptive identity politics and that the potential swing effects of the floating vote in South Africa are undermined by the ‘solidarity vote’ for the ANC.26 The high number of floating voters whose support is in doubt at the beginning of an election suggests that there is an increased potential for electoral competition or movement in support across political parties, which could potentially reshape future electoral outcomes. This partisan change has been obscured by a focus on election results and ill-considered analyses of turnout data.
70
60
50
40
30
20
10
01994 1995 1997 1999 2000 2002 2004 2006 2008
% ANC partisans % Opposition partisansLinear (% Opposition partisans)
60
38
42
35 34
4652
60
48
28
19
1610 10
18
7 9
12
100
90
80
70
60
50
40
30
20
10
0
86
58 58
45
5546
57 5664
60
1994 1995 1997 1998 1999 2000 2002 2004 2006 2008

6 Elections and Accountability in South Africa • ISS Paper 188 • June 2009
The ANC’s partisan coalitionThere is a pressing concern among South African ana-lysts that the dominant ANC coalition, whose vote share has fluctuated between 62 and 69 per cent since 1994, is a permanent majority because of racial demographics. Group-based politics, particularly as an expression of race, has been presented as an explanation for the overwhelming support given to the ANC.27 If indeed race drives voter behaviour, South Africa is likely to produce a cycle of permanent majorities following each election. Yet, these hypotheses are partly falsified when looking more closely at the ANC’s partisan coalition.
Firstly, on average, less than half the overall electorate are ANC partisans. In 1994, 60 per cent of the electorate were ANC partisans, but this figure has since fluctuated between 34 per cent and 60 per cent of the total elector-ate. By the end of 2008, only 48 per cent of respondents declared themselves to be ANC party identifiers.
Secondly, in terms of race, there is a reduction in levels of partisanship among all racial groups. The ANC therefore attracts less support from the black African population over time. Unsurprisingly, levels of partisan-ship are higher among black South Africans than any other racial group at. However, on average 44 per cent of black South Africans are independents. It would appear that, contrary to conventional wisdom, black voters are not an enthusiastic, unquestionably loyal electorate. The significant increase in independents among this racial group suggests that core ANC support is smaller than initially supposed and that many black voters support this party at election time, not because they are loyal par-tisans but because they do not regard opposition parties as feasible alternatives. Moreover, given the demographic composition of South Africa, continuing increases in non-partisans among the black electorate holds the key to future electoral realignments.
So far, aggregate electoral data suggests that a signifi-cant proportion of people have withdrawn their support from all political parties, including the ANC. There is also evidence of significant proportions of floating voters across the years within the overall electorate, who are not overtly loyal to political parties, nor guided at elections by strong partisan ties. These voters come from across all racial groups. This should free up more voters to move their support at elections and take short-term issues and events into account when they choose among political parties. This decline in party identification signals to political parties that they need to work harder to convince and mobilise these voters to support them. It also suggests that, after a decade of democracy, there is a large and potentially astute group of unpredictable voters who are likely to hold the incumbents to account. Both observations introduce a greater degree of electoral
uncertainty, which, in turn, should encourage account-able and responsive government.
Although there is evidence of people withdrawing their support from political parties it is less clear whether people are willing to withdraw their support from the governing party if they feel it’s not doing a great job. In other words, is dissatisfaction with incumbent perform-ance driving partisan dealignment and the decline in electoral participation? The question that should now be addressed is: are voters willing to withdraw their support from the incumbent party if they are dissatisfied with its performance?
Government performance evaluations
The main hypothesis of rational choice theory is that voters care about and respond to the economic and political performance of the incumbent party. If elections are to act as a genuine accountability mechanism citizens should take into account the past performance of govern-ment and their future expectations and then punish or reward political parties accordingly at the polls.28 People should move to and from their respective political parties in response to their evolving evaluations of political and economic conditions and the performance of the parties and their candidates.29 Party support should therefore respond to party performance in government.
Before we turn to the relationship between govern-ment performance evaluations and partisanship we review how South African voters have evaluated the economy over time.
The evidence shows that changes in economic evalu-ations often correspond with and reflect fluctuations in partisanship.
Economic evaluations: evaluating the economyStrong support for the economic model can be found in the similarities in trends and patterns of partisanship and evaluations that tap satisfaction with the national economy. Figure 7 shows positive judgements of overall conditions in the country, national economic evalua-tions and trends in ANC partisanship.30 Trends in ANC partisanship closely match fluctuations in evaluations of national economic conditions and satisfaction with overall conditions. The fluctuations show that as national economic evaluations decline and stabilise between 1995 and 2000, so does ANC partisanship. As economic evalu-ations rise after 2000, again so do trends in partisanship. As perceptions of economic conditions improve or worsen, the intention to respectively support or distance oneself from incumbents increases. This data shows a pattern over time that offers strong support for the economic model.

Collette Schulz-Herzenberg • ISS Paper 188 • June 2009 �
figure �: Economic evaluations and ANC partisanship Bivariate relationships: Economic evaluations There are a number of different dimensions to voters’ economic performance evaluations. This section exam-ines the different types of economic evaluations.
The bivariate analyses show that approval of eco-nomic performance is almost always associated with support for the incumbent party. Performance evalua-tions predict the direction of partisanship among both the entire electorate and black South African voters.
Table 3 shows the bivariate associations for the entire electorate, while Table 4 shows the same analysis among black South Africans.
First, the relationships between partisanship and various types of economic evaluations are almost always statistically significant at the p=< 0.05. Second, the con-sistently positive direction of the coefficients confirms that approval is almost always associated with increased support for the ANC. Opposition identifiers and inde-
1994 1995 1997 1999 2000 2002 2004 2006
60
38 42
35 34
4652 60
X
X
X
XX
XXX24
32
221515
31
4953
3030 31
4135 44
73
65
80
70
60
50
40
30
20
10
0
Declared ANC partisans %
Satisfaction with national economic conditions %
X Satisfaction with overall conditions %
Item by type 1994 1995 1997 1999 2000 2002 2004 2006
Sociotropic vs. egocentric – current conditions
Current sociotropic .275*** – .254*** .306*** .299*** .231*** .186*** .251***
No. of cases 2 151 3 365 2 106 2 110 2 070 2 152 2 018
Current egocentric .037 – .131*** .025** .175*** -.016 -.073* .112***
No. of cases 2 263 3 418 2 189 2 125 2 100 2 184 2 082
Retrospective vs. prospective – personal/egocentric
Retrospective egocentric – .218*** .343*** .271*** – .143*** .147*** .219***
No. of cases 2 265 3 424 2 178 2 085 2 181 2 076
Prospective egocentric – – .398*** .397*** – .273*** .316*** .246***
No. of cases 3 258 1 983 1902 2 097 1 956
Retrospective vs. prospective – collective/sociotropic
Retrospective sociotropic – .361*** .386*** .346*** .318*** .269*** .213*** .276***
No. of cases 2 260 3 335 2 105 2 114 2 051 2 146 2 002
Prospective sociotropic – .502*** .405*** .519*** .344*** .320*** .302*** .324***
No. of cases 3 221 1 937 2 029 1 930 2 083 1 906
Mediated evaluations of governments economic policy
Personal mediated retrospective – – – – – .171*** .237*** .280***
No. of cases 1 905 2 050 1 928
General evaluation of domestic affairs/overall conditions in SA/direction of country
Overall direction of the country .290*** .399*** .336*** .670*** .422*** .385*** .548*** .455***
No. of cases 2 140 2 252 3 419 1 955 2 128 2 121 2 192 2 090
Total cases 2 401 2 430 3 500 2 200 2 200 2 400 2 400 2 400
* Indicates the correlation is significant at the 0.05 level. (p=< 0.05) ** Indicates the correlation is significant at the 0.01 level. (p=< 0.01) *** Indicates the correlation is significant at the 0.001 level. (p=< 0.001) DV = Non-ANC (0) vs. ANC (1). Summary statistic: Gamma. – = Not asked
Table �: Economic items with direction of partisanship among entire electorate (ANC/non-ANC)

� Elections and Accountability in South Africa • ISS Paper 188 • June 2009
pendents therefore consistently disapprove of the current ANC government’s economic performance. The pattern is largely the same among black African voters.
Egocentric vs. sociotropic economic evaluations Among economic evaluations, the first distinction is between egocentric and sociotropic evaluations. Political scientists speculate whether voters distinguish between their personal economic conditions versus larger economic trends. While some economic studies of voting argue that voters connect their personal economic conditions or personal finances with their votes in the form of ‘pocketbook voting’, others suggest that voters do not project directly from their own pocketbooks or even their personal problems. Instead, they discriminate between government and personal problems and bring to bear only those personal problems they believe are part of the political agenda and those problems with which government should be helping.31 The bivariate correla-tions suggest that people find changes in the national economy to be better indicators of government perform-ance than personal economic conditions. When compar-ing coefficients across the years the strongest correlations
are consistently found in the sociotropic category. This suggests that South African voters base their partisan de-cisions not on their own personal pocketbook situation, but on their larger perceptions of the performance of the broader economy as a whole. This data fits with general findings which assert that personal evaluations have little direct influence on the vote (particularly in Western nations). Voters do not appear to hold the ANC govern-ment responsible for their personal economic plight. This might partly explain why the ANC continues to garner overwhelming popular support in the face of enduring poverty and deepening socio-economic hardships.
Yet it also seems plausible that poorer citizens, especially those who often go without basic necessities such as food, are more likely to connect government’s management of the economy to their personal economic plight and judge government accordingly. Using a poverty variable that taps how often a respondent has gone without food, the survey sample is divided into two sub-groups: hungry citizens (or those who always or very often go without food) and non-hungry citizens (those who have gone without food never, rarely or only several times). The survey sample is filtered to exclude the
Item by type 1994 1995 1997 1999 2000 2002 2004 2006
Sociotropic vs. egocentric – current conditions
Current sociotropic .072 – .086** .191*** .214*** .156*** .131*** .244***
No. of cases 1383 2479 1090 1597 1439 1684 1585
Current egocentric -.039 – .088** .166*** .158*** .069 .027 .241***
No. of cases 1 462 2 517 1 161 1 608 1 463 1 705 1 648
Retrospective vs. prospective – personal/egocentric
Retrospective egocentric – .056 .170*** .217*** – .085* .137*** .240***
No. of cases 1569 2522 1152 1457 1702 1643
Prospective egocentric – – .189*** .323*** – .137*** .259*** .213***
No. of cases 2 414 1 015 1 330 1 635 1 543
Retrospective vs. prospective – collective/sociotropic
Retrospective sociotropic – .168*** .165*** .174*** .211*** .125** .152*** .252***
No. of cases 1 546 2 462 1 086 1 595 1 426 1 677 1 580
Prospective sociotropic – .272*** .171*** .345*** .241*** .138*** .181*** .256***
No. of cases 1 624 2 382 965 1 522 1 338 1 625 1 497
Mediated evaluations of governments economic policy
Personal mediated retrospective – – – – – .151*** .099* .264***
No. of cases 1 342 1 607 1 544
General evaluation of domestic affairs/overall conditions in SA/direction of country
Overall direction of the country -.046 .147*** .150*** .473*** .297*** .252*** .383*** .407***
No. of cases 1 370 1 530 2 521 1 011 1 608 1 483 1 712 1 654
Total cases 1 734 2 430 2 581 1 170 1 665 1 625 1 875 1 876
DV = Non-ANC (0) vs. ANC (1). Summary statistic: Gamma. – = Not asked
Table �: Economic items with direction of partisanship among black voters (ANC/non-ANC)

Collette Schulz-Herzenberg • ISS Paper 188 • June 2009 �
non-hungry and then test for the bivariate associations between direction of partisanship and sociotropic and egocentric economic evaluations among hungry citizens, and then repeated for the non-hungry respondents by ex-cluding the hungry. Table 5 shows comparisons between the hungry, non-hungry and the entire sample.
Table �: Egocentric evaluations and partisanship among hungry and non-hungry citizens
Hunger Item by type 2000 2002 2004 2006
Egocentric evaluations
Poor/hungry .257*** .075 .198* .324**
Non-hungry .150*** -.013 -.113*** .094**
Entire sample .175*** -.016 -.073* .112***
* p=< 0.05; ** p=< 0.01; *** p=< 0.001 DV=ANC/non-ANC (opposition identifiers and independents)Summary statistic: Gamma
The results suggest that people who reported having gone without food on a regular basis show a consistently stronger propensity towards egocentric evaluations over the four years compared with people who reported having sufficient food to eat. This bivariate analysis suggests that the poor appear to be more likely than their better-off counterparts to evaluate government perform-ance based on their (empty) pocketbooks.
To test whether hunger, in particular, may have a different impact than poverty in general, Table 6 shows a more comprehensive poverty index that measures the availability of several basic commodities among the poor, non-poor and the entire sample. The sample is again divided into two sub-samples – those who report frequently going without basic necessities such as food, water, medical care, cash income and cooking fuel, and those who don’t. Again the survey sample is filtered to exclude the non-poor and then test for the bivariate associations between direction of partisanship and egocentric economic evaluations, and then repeated for the non-poor by excluding the poor.
Table 6: Egocentric evaluations and partisanship among poor and non-poor citizens
Poverty index Item by type 2000 2002 2004 2006
Egocentric evaluations
Poor .287*** .077 .033 .261***
Non poor .138** .000 -.065 .054
Entire sample .175*** -.016 -.073* .112***
* p=< 0.05; ** p=< 0.01; *** p=< 0.001 DV=ANC/non-ANC (opposition identifiers and independents)Summary statistic: Gamma.
When the entire poverty index is considered the patterns remain largely unchanged. People who report going without a range of basic commodities are more likely
to rely on egocentric evaluations when informing their partisan choices. This suggests the poor are better able to connect their plight to government policy than the non-poor. In addition, black African voters are more likely to do so than other voters. Unfavorable personal economic situations are more likely to solicit a reaction than favorable economic experiences. In other words, voters are more likely to attribute negative economic experiences to government responsibility, or to hold government responsible for their economic woes than they are to hold it responsible for their good fortunes. Indeed, research finds that unemployed and poor people tend to favour societal explanations of economic disad-vantage more, and individualistic explanations less, than more advantaged individuals do.32
Retrospective vs. prospective economic evaluations The second distinction relates to whether voters act retrospectively by evaluating past economic perform-ance, or prospectively in terms of expectations for the economy’s future.33 If evaluations are retrospective the voter looks back at how the economy has fared, and then decides whether to reward or punish the incumbent government. If evaluations are prospective, voters vote on the basis of their expectations of how the economy will do. Electoral accountability is inherently retrospec-tive in that it involves the passage of time. Citizens look back on a government’s tenure and decide whether or not its performance was satisfactory. As such, account-ability relies to a large extent on retrospective voting.34 The bivariate relationships in tables 3 and 4 suggest that South African voters do look back and act retrospectively when evaluating government’s economic performance, particularly in terms of collective/ sociotropic evalu-ations as evident in moderate to strong relationships shown by the relevant coefficients. Yet overall prospective evaluations show much stronger relationships with partisanship than do retrospective evaluations. The same pattern holds for black African voters. The overall strength of the coefficients in table 4 are not vastly differ-ent from those in table 3, suggesting that even once the impact of race is removed, evaluations continue to matter to black voters. Moreover, in the later years, particularly in 2004 and 2006, the coefficients are virtually the same, which indicates that these set of economic criteria have become increasingly important to black African voters as the influence of other variables diminish.
In addition, when comparing the two types of prospective evaluations (egocentric versus sociotropic) it is clear that prospective sociotropic evaluations have a stronger relationship with partisanship than prospective egocentric evaluations. Overall, the data suggest that South African voters are more likely to think prospec-

10 Elections and Accountability in South Africa • ISS Paper 188 • June 2009
tively than retrospectively when evaluating economic performance in terms of expectations for the entire country’s economic future, and these evaluations affect the direction of partisan identity. However, retrospective evaluations are far from irrelevant to voting behaviour. Their continued presence indicates that voters do enforce some level of electoral accountability. In line with international literature, it appears that South African voters are attuned to both retrospective and prospective evaluations of government performance.35
Simple versus mediated retrospective economic evaluationsA third dimension of economic voting distinguishes between simple and mediated evaluations. The first con-cerns only one object – that of unemployment or income. The mediated evaluation considers government’s han-dling of employment or the economy and the impact that it has on one’s own situation. Voters connect their own personal economic situations to government only when they can connect changes in their personal financial situation to broader economic trends and government policies.36 ‘Mediated’ retrospective evaluations (MREs) were tested using an indicator that solicits evaluations of government’s economic policy in relation to people’s personal economic circumstances.37 Among the entire electorate, coefficients for mediated evaluations show an increase in strength from low to moderate between the years 2002 and 2006. Simple retrospective evaluations, which are based on personal direct experience, explain less of partisanship than MREs where voters are asked to consider both their personal economic circumstances and government’s handling of the economy together in their evaluations. Lewis-Beck found that mediated evalu-ations go much further in explaining American partisan-ship than simple current egocentric evaluations, which find inconsistent support in South Africa and sometimes insignificant results.38 Fiorina also finds that MREs show greater statistical strength and significance than simple retrospective evaluations and at least partially subsume them.39 This is certainly the case with the South African data. In addition, mediated evaluations are also stronger in South Africa than current sociotropic coefficients and retrospective economic evaluations (which are consistently stronger than current economic evalua-tions). Among black African voters, the pattern remains similar. Mediated economic evaluations generally show stronger and statistically significant relationships with partisanship compared with egocentric, sociotropic and retrospective evaluations between 2002 and 2006.
Economic voting is more detectable when respondent evaluations are mediated by taking the role of govern-ment into account. In other words, pocketbook voting is most likely to be observed when personal economic
circumstance is assessed in conjunction with govern-ment’s impact on it.
Table �: Simple versus mediated economic evaluations
2002 2004 2006
Entire electorate
Mediated retrospective .171* .237* .280*
Current egocentric (simple) -.016 -.073* .112*
Current sociotropic (simple) .231* .186* .251*
Retrospective egocentric (simple) .143* .147* .219*
Retrospective sociotropic (simple) .269* .213* .276*
Black African electorate
Mediated retrospective .151*** .099* .264***
Current egocentric (simple) .069 .027 .241***
Current sociotropic (simple) .156*** .131*** .244***
Retrospective egocentric (simple) .085* .137*** .240***
Retrospective sociotropic (simple) .125** .152*** .252***
* p=< 0.05; ** p=< 0.01; *** p=< 0.001 DV=ANC/non-ANC. Summary statistic: Gamma
General evaluations of direction of country and overall conditionsSome of the strongest coefficients are found in the relationship between partisan support for the ANC and evaluations of overall conditions in South Africa. In the period under review the strength of the relationship is substantial and also seems to increase, especially among black voters. This suggests that while voters perform economic evaluations, they also look to the broader national picture for information when deciding which party to identify with or support. Perceptions of the direction and overall condition of the country also act as information sources for future expectations about the economy and are therefore closely linked to the strong correlation coefficients found for prospective sociotropic economic evaluations.
Summary
The findings bode well for electoral accountability. Contrary to assumptions among some scholars that government performance does not affect partisan dispo-sitions in South Africa, the surveys find that economic performance evaluations do influence the direction of partisan support.40 Voters are not impervious to govern-ment’s performance, nor do they fail to hold government to account for poor performance. As perceptions of economic conditions improve or worsen the intention to support or distance oneself from incumbents increases. Fluctuations in party support therefore appear to be affected by changes in voter evaluations of government’s economic performance. It also appears that the most economically disenfranchised or poorest voters will

Collette Schulz-Herzenberg • ISS Paper 188 • June 2009 11
increasingly base their evaluations on their own personal situations. It seems reasonable to expect that, as time passes, voters will increasingly link their personal plights to government policy and hold government responsible. Moreover, the use of mediated evaluations suggests that if voters perceive government policy as having some responsibility for their economic circumstance, they do act to punish or reward the incumbent party. In other words, they discriminate between government and personal problems and bring to bear only those personal problems they believe government should be address-ing.41 For now, however, South African voters base their partisan decisions not simply on their own personal pocketbook situation, but on their larger perceptions of the performance of the broader economy as a whole. Overall, the results show that South Africans are not exclusively ‘pocketbook’ or sociotropic in their outlook. Instead, both types of evaluations act to reinforce each other as sociotropic voting and self-interested voting operate side by side.42
There is also evidence of retrospective voting, on which electoral accountability is said to rely. However, prospective evaluations show stronger relationships with party support. It seems nonsensical, especially in the early years of democracy, to expect retrospective evaluations to dominate. The ANC had not held power for long, giving voters little to evaluate. In other words, voters had limited information about the ANC’s track record in governance and were therefore more likely to think and act prospectively. Many voters might also have tempered some of the ANC’s more modest achievements (slow rates of job creation, in particular) with the party’s huge success in dismantling the apartheid state. Thus, voters act retrospectively by evaluating past economic
performance but also think prospectively in terms of expectations of the economy’s future. And both these evaluations affect the direction of partisan identity.43
With the passage of time, however, as the ANC party develops a longer track record in terms of service delivery and job creation, retrospective evaluations should become more relevant as South Africans become better equipped to evaluate the ANC’s time in office
in terms of the delivery of economic and social goods. Mondi Makhanya, well-known journalist and political commentator, sums up the dual role for retrospective and prospective evaluations thus:
Most South Africans are generally positive about the country they live in. They come from a place where they were sub-human and there was no hope. The past decade has given them a resemblance of hope that things can get better.44
Makanya’s insight also reminds us why the ANC continues to garner support for its perceivably pro-poor policies from poorer segments of society, despite increased unemployment and poverty, the delivery crisis over electricity and allegations of grand corruption over the arms deal.
Yet the presence of retrospective evaluations indicates that voters do enforce some level of electoral accountabil-ity. As short-term issues and performance evaluations motivate voters, the South African electorate should become increasingly unpredictable. Different outcomes from government performance are therefore potentially capable of producing partisan change. A loss of partisan support, or a mere hint of fluidity, should help to improve accountability as incumbents are forced to consider popular opinion by becoming more responsive and more representative of interests.
Having established that voters appear willing to withdraw their support from the incumbent party if they are dissatisfied with its performance, there is little evidence of this dissatisfaction translating into a movement of support to other parties. Instead, it seems that these voters retreat into the independents category. Certain forces have created obstacles to inter-party movement, thus suppressing significant realignment in South African politics. An important set of inter-related questions therefore remain. What explains the lack of inter-party movement? Why do independent or floating voters, in particular, fail to realign themselves? It is to these issues that we now turn.
PoliTicAl inTereST And AwAreneSS Among voTerS
To become self-sufficient in politics and able to judge the performance of the incumbent party (or any politi-cal party), voters should possess the necessary level of political skills and resources and be sufficiently informed about politics. So, as socio-economic development and modernisation proceed, improvements in the politi-cal skills and resources of contemporary electorates contributes to growth in the public’s overall level of political sophistication, or what is described as a process
Fluctuations in party support
appear to be affected by voter
evaluations of government’s
economic performance

1� Elections and Accountability in South Africa • ISS Paper 188 • June 2009
of ‘cognitive mobilisation’.45 Cognitive mobilisation involves two separate developments. First, the public’s ability to process political information has increased, through the higher levels of education and political sophistication among the electorate. Second, the cost of acquiring political information has decreased, through the expansion of the mass media.46
Thus, voters with higher levels of education and political interest are more likely to connect information about government performance with existing economic and social conditions. They should also be able to engage politically without relying on external partisan cues or structural factors like class and race.47
Variations in cognitive skills among South African voters
It is expected that there are significant variations in cog-nitive abilities in South Africa’s divided society, where access to education and news information remain highly unequal. Only educated sections of the population, whose access to political news information is higher, are expected to show signs of cognitive mobilisation. Since preconditions for increases in cognitive mobilisation include modernisation and inclusive educational policies, both of which are underway in South Africa, one would also expect to see increases over time in the proportion of the electorate who are cognitively mobilised.
Dalton states that ‘cognitively mobilized voters are those who possess both the skills and motivation to grapple with the complexities of politics on their own’ (author’s italics).48 Since both items – skills and psycho-logical involvement/motivation – make an independent contribution to the underlying ‘cognitive mobilisation’ concept and are therefore necessary,49 both criteria are used here but the constraint on education is relaxed by also including those with a matriculation qualification plus those with higher tertiary education, while continu-ing to apply the stringent criterion of ‘high political interest’. Compared with their fellow South Africans, a completed matriculation still ensures a relatively high level of formal education.
Table 8 shows that the proportion of cognitively mobilised voters rests at an average of ten per cent over the years, while those who are less cognitively mobilized average around 90 per cent of the sample. Cognitive mobilisation among the vast majority of the populace remains low during the first 12 years of
democracy. It is therefore likely that most voters continue to rely on partisan and other cues to guide their political decisions, or simply do not engage in the political process altogether. The proportion of voters who are politically interested and well-educated and who probably orient themselves to politics using evaluative factors remains limited to roughly one-tenth of the population.
Dalton’s typology: Cognitive mobilisation and partisanship
Several studies have developed typologies of citizens that capture multi-dimensional effects of cognitive mobilisation and partisanship. One such typology has been developed by Dalton.51 While some voters remain oriented to politics based on their partisan attachment, cognitive mobilisation produces another group of politically interested and well-educated voters who orient themselves to politics on their own. This combination of both traits produces a framework that categorises voters by whether they are partisan or non-partisan, on one hand, and whether they are ‘cognitively mobilised’, on the other, as illustrated in Table 9.
Table �: Cognitive skills vs. level of partisanship
Strength of partisanship
Independent Partisanship
Cognitive mobilisation
High Apartisan Cognitive partisan
Low Apolitical Ritual partisan
The cross-classification of the two dimensions in the framework yield the following four categories that represent distinct mobilisation patterns. The important feature of this typology is that it distinguishes between different types of citizens who are normally combined when either mobilisation dimension is considered separately.52
Cognitive partisans score highly on both mobilisation dimensions. They have strong party attachments but they are psychologically involved in politics even when party cues are absent. Both the partisan and cognitive dimensions influence their perceptions and behaviors.Apartisans are not attached to any political party but are cognitively mobilised with high levels of politi-cal involvement and sophistication and possess the skills and resources necessary to orient themselves to politics without depending on party labels. They are
n
n
Table �: Variations in cognitive mobilisation among voters (relaxed version) – percentages 50
1��� 1��� 1��� �000 �00� �00� �00� �006 Average
Cognitively mobilised 10 9 7 6 14 10 6 15 10
Not cognitively mobilised 90 91 93 94 86 90 94 85 90

Collette Schulz-Herzenberg • ISS Paper 188 • June 2009 1�
the new ‘independents' but they are independents of a much different sort than the apoliticals (discussed below). Apartisans comprise politically sophisticated citizens while apoliticals are on the periphery of poli-tics. Apartisans tend to vote on the basis of current issues and demand more responsiveness to public opinion. They are better educated, knowledgeable about politics, and politically engaged, even if they remain someone distant from political parties.Ritual partisans are mobilised by their strong party attachments, but are not cognitively mobilised. They support their preferred party and participate in party-related activities such as voting or campaigns. However, their party support is almost a habitual activity and politically their involvement or under-standing is less likely to extend to areas where party cues are lacking.Apoliticals are neither attached to a political party, nor are they cognitively mobilised in politics. They are located at the periphery of politics, are less in-volved in political issues and candidates and generally less politically sophisticated.
By knowing more about the different types of voters in South Africa we can identify potential consequences for mobilisation patterns and hence electoral accountability. Having previously observed decreasing turnout figures and declines in levels of partisanship after 1994, a central question is whether these new independents were located primarily among the apartisan or the apolitical catego-ries. In other words, are South Africa’s floating electorate made up of voters who are potentially open to persua-sion? As such, do they hold the key to future electoral realignments? Or are they increasingly difficult to mobilise at elections, with a greater potential to abstain from voting? Without the active and politically engaged participation of these voters at the polls, elections may well remain the predictable game that they have become.
One might presume that rapid social change over the past decade may have given growth to new, cognitively mobilised independents. Yet, when the South African electorate is divided according to Dalton’s typology, on average only three per cent of South Africa’s entire electorate qualify as apartisans, shown in table 10. With
n
n
high levels of cognitive mobilisation they have the politi-cal resources to follow the complexities of politics and are free of affective party ties. They are less consistent in their voting patterns because their voting behaviour is not dependent on long-standing party predisposi-tions. They also inject more issue voting into elections and demand that candidates are more responsive to public opinion.53 Yet very few South African voters can be described in this way, nor has this group increased since the advent of democracy, remaining quite static over time. Instead, most of the ‘floating’ or independent non-partisan electorate are made up of apoliticals rather than apartisans. And of the entire electorate, 40 per cent are apolitical.
American research suggests that apoliticals are the least likely to become involved in the electoral process and are the most unsophisticated about politics. This remains a hypothesis in the South African case. It is still unclear whether there is a relationship between know-ledge about politics and turnout in elections. Testing for a relationship between Dalton’s four-fold typology (using an adapted version of cognitive mobilisation) and turnout in South African elections reveals a clear and definite association. Apoliticals, followed by apartisans, are the least likely to turn out in elections, while cogni-tive and ritual partisans are the most likely across all the surveys. In 1995, when asked about their intention to vote in the local elections, only 72 per cent of apoliticals and 83 per cent of apartisans stated they would vote, compared with 95 per cent of cognitive partisans and 89 per cent of ritual partisans.54 Again, in 1997, only 34 per cent of apoliticals said that they had voted in the local election while 53 percent, 65 per cent and 55 per cent of apartisans, cognitive and ritual partisans respectively said that they had done so.55 In 1999, when asked how likely they were to register to vote for the 1999 national elections, only 35 per cent of apoliticals stated they were very likely to do so. However, 74 per cent of apartisans, 83 per cent of cognitive partisans and 62 per cent of ritual partisans said it was very likely that they would register.56
A similar pattern holds across the Afrobarometer survey series. In 2004, when asked whether they had voted in the last election, only 63 per cent of apoliticals and apartisans had done so, whereas 82 per cent of
Table 10: Cognitive skills and partisanship in South Africa over time – percentages
1995 1997 1999 2000 2002 2004 2004Cnep 2006 Average
Apoliticals 38 40 52 52 32 37 46 27 40
Apartisans 4 2 4 2 4 3 1 3 3
Cognitive partisans 6 6 3 4 10 7 4 12 7
Ritual partisans 52 52 41 42 54 53 49 58 50
Total 100 100 100 100 100 100 100 100 100

1� Elections and Accountability in South Africa • ISS Paper 188 • June 2009
cognitive partisans and 76 per cent of ritual partisans had voted.57 And again, in 2006, only 64 per cent of apoliticals and 70 per cent of apartisan stated that they had voted in the last election, whereas 88 per cent of cognitive partisans and ritual partisans did so.58
The data suggests that despite an increase in non-partisans or ‘floating voters’, South Africa’s independents are typically inactive, uninvolved and detached from politics. They are not cognitively mobilised and will probably remain on the periphery of electoral politics. Although these independents are supposedly potentially more open to persuasion, they are also increasingly difficult to mobilise at elections, with a greater potential to abstain from voting. The decreasing turnout figures certainly suggest that this may be the case. Partisanship has weakened in South Africa, not because of a rise in cognitive mobilisation but because of a rise in non-mobilised voters, or ‘apoliticals’. Without the active and politically engaged participation of these voters at the polls, elections may well remain predictable.
Studies pointing to a rising proportion of sophisti-cated non-partisans in the established democracies of the global North are countered by a rival interpretation that suggests that the growth of independents is dispro-portionately concentrated among the less sophisticated sectors of the public.59 This interpretation seems to accord with the South African data. Robert Putnam points to findings that show how poverty and economic deprivation in American society negatively affect the flow of political information and political participa-tion.60 Popkin and Dimock argue that American voters with scant political knowledge have greater difficulty in perceiving differences between parties and candidates and are less likely to participate actively. They state:
The less a person knows about government, the more likely it is that the voter will judge representatives by their personal character and the less a voter knows, the less likely it is that he or she will vote.61
They find that people in the top third of the cognitive engagement scale are more than 20 per cent more likely to vote than those in the bottom third.62 They conclude that people who do not understand the basic features of political institutions are less likely to grasp the connec-tions between issues, candidates, parties and offices.
For comparative purposes, it is instructive to note that the proportion of ‘apartisans’ in South Africa (three per cent) is five times as small as that measured in the United States in 1952 (16 per cent); six times as small as that measured in 1980 (18 per cent), and eight times as small as the 1992 figure (24 per cent).63 This is despite the use of a relaxed operationalisation of Dalton’s cognitive mobilisation concept in the South African data. Indeed,
if one was to compare South African data with United States data using his strict application, the proportion of apartisans would be lower.
Dalton notes that the expansion of new independents in the US means that this group now comprises a fifth of the public.64 The shifting balance between ritual parti-sans and apartisans encapsulates a fundamental change in the characteristics of the American electorate during the later half of the 20th century. The basis of political mobilisation is shifting from long-term, habitual party cues that were used as a heuristic by an unsophisticated public, to a more evaluative and sophisticated electorate that makes their electoral choices on the issues and candidates of the campaign, only partially based on their partisan affiliations.
Table 11: South African and United States data compared – percentages
1964–66USA
2000USA
1995–2006SA Average
Apoliticals 16 20 40
Apartisans 10 20 3
Cognitive partisans 27 33 7
Ritual partisans 47 27 50
Total 100 100 100Source US data: American National Election Studies, 1964–2000.65
An additional concern for electoral accountability is whether party identifiers, or partisans, are willing to move their support, albeit temporarily, as a way of punishing a party or holding incumbents to account. One would reasonably expect inter-party movement to take place among cognitive partisans, rather than ritual partisans. According to Dalton’s typology in table 10, however, cognitive partisans average approximately seven per cent of the entire electorate over the years and only in later years do they show small signs of growth. Of all partisans they make up only 12 per cent. The propor-tion of the electorate with strong party attachments and psychological involvement in politics remains small. Yet the voting intention/turnout data provided earlier suggests that this group is consistently the most likely to participate in elections. On the other hand, ritual parti-sans, or voters who are mobilised by their strong party attachments but are not cognitively mobilised, make up half the population and appear to be increasing. The vast majority of partisans are not cognitively mobilised and are likely to continue being guided by partisan cues rather than their interest in political affairs.
Thus, unlike advanced in industrial democracies, where the process of cognitive mobilisation is decreasing the proportion of the public who need to rely on parti-sanship to guide their political behaviour, there is little evidence of this occurring in South Africa.

Collette Schulz-Herzenberg • ISS Paper 188 • June 2009 1�
Overall, the majority of floating voters are less cognitively mobilised and are most likely to abstain from participating in electoral politics. Further, among those voters who are partisans, the vast majority probably does not have the cognitive skills or political information that would enable them to shift their party support on the basis of ongoing party performance or policy positions.
These findings have implications for holding incum-bent governments to account. The growth of apolitical independents merely expanded the number of citizens who are likely to withdraw from electoral politics. Additionally, a high number of ritual partisans who are typically mobilised by habitual cues, while giving less weight to evaluations of performance and policy criteria, also bodes negatively for responsive and accountable governance. These partisans are less likely to punish incumbents and hold government to account at elections. It also gives rise to a perverse situation for governmental responsiveness in that incumbents may have little incen-tive to be concerned with the economic well-being of the politically unsophisticated, who are also generally the poorer and more socially disadvantaged.66
chooSing Among PoliTicAl PArTieS
The final question is whether sufficient ‘electoral market’ exists to make selection among political parties viable. Withdrawal of support is a necessary condition for holding government accountable. But some degree of inter-party movement is also required. Without politi-cal alternatives to the incumbent party, any degree of dissatisfaction and withdrawal will not necessarily threaten the incumbents and motivate them to be more responsive. If asymmetrical dealignment continues,
weakening party bonds will simply continue to provide the governing party with larger majorities from increas-ingly smaller electorates.
So what are the chances of dissatisfied voters moving their support to another party? And why have we not seen dissatisfaction translate into movement across to other parties? Instead, we see a movement into the
independents category over the years. In other words, why have the opposition failed to benefit from the problems of the incumbent party? Findings shows that if voters become dissatisfied with the performance of the ANC, they will not necessarily vote for any other party. Before they look at the policies, promises and candidates of another party, voters look to a party’s overall image and must be convinced of some basic traits of the party, particularly whether a party is perceived as inclusive of their interests.
The incluSiveneSS of PoliTicAl PArTieS
In South Africa, qualities such as a party’s perceived inclusiveness may constitute important information about how a party will perform in office and whether it represents a voter’s interests, or is congruent with his or her identity. Party images can be understood as the mental pictures or psychological images that voters have of parties.67 The elements of party images refer to the intrinsic values or attributes associated with a party. Especially when information is limited and outcomes are uncertain, party attributes can act as important information short-cuts or heuristic political cues for voters.68 These images take on either positive or negative connotations for voters as people use them to judge, among other things, whether parties are exclusive or inclusive. Since inclusivity shapes the credibility and trustworthiness of a party these images are important information cues for voters. The electorate can, in a fairly short time-span, come to associate certain qualities with specific parties, which then has a substantial influence on voting choices.69 These sociological cues can be expected to take on particular significance in divided or polarised societies, where party images are often a response to, and reflect conflict and cleavages within, the political system.
The first notable development is that South Africa’s biggest political parties are viewed by their own sup-porters as inclusive of the interests of all South Africans rather than as racial custodians or representatives. Across the three surveys, party identifiers overwhelm-ingly view their preferred political party as inclusive of the interests of all South Africans. The only exceptions are those who support the Freedom Front (FF) and Pan Africanist Congress (PAC). Almost all voters think that while their preferred party is inclusive of all South Africans, ‘other’ parties are not. And importantly, for most people, these notions of inclusion and exclusion are primarily race-based. Thus, ‘other’ parties are regarded as racial enclaves, representing rather narrow interests. These racial stereotypes about parties persist and are powerful and pervasive influences on partisanship.
Withdrawal of support is a
necessary condition for holding
government accountable, but
some degree of inter-party
movement is also required.

16 Elections and Accountability in South Africa • ISS Paper 188 • June 2009
Survey items ask respondents to assess the extent to which the major political parties represent the interests of all South Africans or only one specific group. Figure 8 shows perceptions of inclusiveness and exclusiveness by political party for 1994. Graphs 9 and 10 show the same data for 1999 and 2004 respectively.70
figure �: Perceptions of inclusivity and exclusivity – 1994
figure �: Perceptions of inclusivity and exclusivity – 1999
figure 10: Perceptions of inclusivity and exclusivity – 2004
In 1994, the data show that the ANC enjoyed the most inclusive image of all the parties with 77 per cent of the entire sample believing that the party represents all citizens. Opposition parties had much lower levels of inclusiveness and higher levels of uncertainty and ambiguity about their images. Around half the sample
regarded the Inkatha Freedom Party (IFP) and the FF as exclusive, or representative of only one group. The Democratic Party (DP, thereafter the Democratic Alliance – DA) was seen by only 14 per cent as exclusive, while around a third view the National Party (the former apartheid governing party) and PAC as exclusive.
By 2004, there were intriguing changes in the way people view parties. The ANC experienced a small decline in the numbers who saw it as inclusive (from 77 per cent to 70 percent), a slight decline in levels of perceived exclusiveness (17 per cent to 14 per cent) and an increase in those who don’t know (six per cent to 16 percent). Most opposition parties, however, witnessed a massive increase in levels of uncertainty about their images.
Some parties experienced an increase in levels of inclusiveness between 1994 and 2004, such as the IFP (from 16 to 20 to 25 per cent). Other opposition parties witnessed a decline in levels of inclusiveness. The DA shrunk from 39 per cent in 1994, to 24 per cent in 1999, perhaps due to the party’s ‘Fight Back’ campaign slogan in the 1999 national and provincial elections which was interpreted by some as an inherently conservative and anti-change slogan, aimed against blacks.71 This was remedied by a more conciliatory campaign slogan in 2004, ‘South Africa Deserves Better’, with inclusiveness rising again to 33 per cent.72
The data for the NNP shows a steady decline in perceived inclusiveness, from 39 to 27 per cent between 1994 and 2004, which reflects the party’s deteriorating reputation among voters, mainly in response to the breakup with the DA, the realignment of the NNP with the ANC, and the ensuing floor-crossing controversy.73 Continuous shifts in NNP tactics portrayed an inconsist-ent and often contradictory image to its supporters and made it difficult for the party to forge and present a coherent political identity.
The overall trend therefore suggests that voter percep-tions of political parties have changed over time as voters have become increasingly ambiguous or uncertain about party images. Some even judge them to be more inclu-sive. Some of this change in perceptions about parties may also be a result of new voters entering the electorate.
Party images and partisanship
If party images affect party support, we can expect to see a link between support for a political party and perceptions of party inclusiveness and exclusiveness. To explore the effects of party attributes on the direction of partisanship, bivariate relationships are looked at using the Idasa 1994, Opinion 99 and 2004 CNEP surveys.
80706050403020100
77
176
3938
2316
54 49
8
3043
2436 40 39
14
47
ANC NP IFP FF PAC DP
All One group Don’t know
80706050403020100
71
25
4
3244
24 20
4634
ANC NP IFP
All One group Don’t know
36
6
58
FF
2623
51
PAC
24 20
56
DP
22
5
73
UDM
80706050403020100
70
141627
10
63
2518
57
ANC NNP IFP
All One group Don’t know
1133
56
DA
28
6
66
UDM
25
4
71
ID
26
4
70
ACDP

Collette Schulz-Herzenberg • ISS Paper 188 • June 2009 1�
Table 1�: Party attributes x direction of partisanship
ANC -.547*** -.617*** -.313***
Opposition parties .175*** .227*** .212***
Trustworthiness
ANC – -.430*** -.317***
Opposition parties – .150*** .092***
Coding DV: ANC (1) x Independents (2) x Opposition parties (3)Coding: (-1) exclusiveness (0) don’t know (+1) inclusivenessCoding: (-1) untrustworthy (0) don’t know (+1) trustworthy*** Indicates the correlation is significant at the 0.001 level. (p=< 0.001) Summary statistic: Kendall’s Tau C – No trust item available in the 1994 survey
Table 12 demonstrates that evaluations of party attributes do correlate with partisan choice in South Africa. Voter perceptions of inclusiveness and trustworthiness have a highly significant and moderate to strong relationship with the direction of support for the ANC party or oppo-sition parties. Positive images of the ANC, whether it is inclusiveness or trustworthiness, correlate more strongly with the direction of partisanship than positive images of opposition parties. Party images remain powerful cues for partisanship. However, when we compare 1999 and 2004 figures it appears that the strength of coefficients declines over time, suggesting that, overall, party attributes may be declining in importance.
Inclusiveness: A sufficient or necessary condition for partisanship? Although we see reasonably strong relationships between party attributes and partisanship, we are still unable to tell the exact nature of the relationship between inclu-siveness and partisanship. Are perceptions of inclusive-ness a necessary or sufficient condition for partisanship? In other words, is it necessary or sufficient to see a party as inclusive before one can identify with it or support it, or does it merely increase the probability of doing so?
A necessary condition is one where the truth of a proposition or state of affairs must hold if the proposi-tion is true, but that does not guarantee its truth. To say that X is a necessary condition for Y is to say that it is impossible to have Y without X. In other words, the presence of Y (ANC partisanship) is not possible without the presence of X (ANC inclusiveness). A sufficient condition is a condition whose truth guarantees the truth of a proposition or state of affairs. To say that X is a sufficient condition for Y is to say that the presence of X (ANC inclusiveness) guarantees the presence of Y (ANC partisanship). In other words, it is impossible to see the ANC as inclusive and not be an ANC partisan. This proposition is tested looking at the entire electorate for 1994, 1999 and 2004 using a series of cross tabulation tables.
Regarding the ANC as inclusive is a virtually neces-sary, but not sufficient, condition to be an ANC partisan. In 1994 and 1999 virtually all ANC partisans (apart
from one per cent who see it as exclusive or uncertain) view the party as inclusive before they will support it (see table 13). In other words, it is necessary to view the ANC as inclusive before you can be an ANC partisan. It is not sufficient, however, because some respondents who see the ANC as inclusive are also independents and opposition supporters. In 2004 it is neither necessary nor sufficient, but merely probable, since ten per cent who see the party as exclusive are ANC partisans.
Table 1�: ANC exclusive or inclusive? The entire electorate
ANC exclusive (-1)
Don’t know (0)
ANC inclusive (+1)
1994 Kendall’s Tau C: -.421***
ANC (1) 1 14 76
Independent (2) 11 34 11
Opposition (3) 88 52 13
1999 Kendall’s Tau C: -.372***
ANC (1) 1 2 46
Independent (2) 78 80 49
Opposition (3) 21 18 5
2004 Kendall’s Tau C: -.295***
ANC (1) 10 19 54
Independent (2) 57 75 40
Opposition (3) 33 6 6
100% 100% 100%
By observing cell frequencies in table 14 it is clear that perceptions of opposition party inclusiveness are neither necessary nor sufficient conditions for being an opposition supporter. Less than half of the respondents who view opposition parties as inclusive are opposition supporters.
Table 1�: Opposition exclusive or inclusive? The entire electorate
Opposition exclusive (-1)
Don’t know (0)
Opposition inclusive (+1)
1994 Kendall’s Tau C: .150***
ANC (1) 68 61 45
Independent (2) 9 18 15
Opposition (3) 23 21 40
1999 Kendall’s Tau C: .175***
ANC (1) 37 23 15
Independent (2) 53 67 68
Opposition (3) 10 10 17
2004 Kendall’s Tau C: .175***
ANC (1) 55 48 31
Independent (2) 31 50 52
Opposition (3) 14 2 17
100% 100% 100%

1� Elections and Accountability in South Africa • ISS Paper 188 • June 2009
Using the Opinion 99 data, Karen Ferree also found that positive perceptions of opposition inclusiveness are necessary but not sufficient conditions for Africans to support white parties and vice versa.74 As she states:
Inclusive opposition credentials loosen African voters from the ruling party yet on their own probably do not push them all the way into the arms of the opposition. They should therefore be viewed as necessary conditions to cross-over voting, but not sufficient ones.75
Thus, winning votes requires a party to have the right set of racial credentials, but racial credentials alone are not enough. As Ferree states:
Racial credentials are necessary but not sufficient for support: a party must be viewed as inclusive for a voter to vote for it, but this alone is not enough to put a voter in a party’s camp. All the same, racial credentials appear to be playing an important (though not solitary) role in driving patterns of polarized voting. Whites must view the ANC as inclusive to support it, but few whites do; and Africans must view the NP as inclusive to support it, but many Africans do not.76
The effects of exclusivity on partisanshipTo assess whether perceptions of exclusivity affect how one identifies with parties, cell frequencies are observed to see if exclusive images attract or repel voters. Racial census theorists would expect partisan identity to match closely with party exclusivity – in other words, exclusive images should attract voters, not repel them. Yet there is little evidence to suggest that voters are attracted to party exclusiveness. Instead, the data in tables 13 and 14 strongly suggest that the opposite is true. Voters are overwhelmingly repelled by party exclusiveness. Of those that view the ANC as exclusive, only one per cent are ANC partisans in 1994 and 1999, rising to ten per cent in 2004. The vast majority are either opposition supporters or independents. Similarly, a minority of respondents who regard opposition parties as exclusive are op-position partisans. The majority are ANC partisans or independents.
However, most South African voters who do identify with a party view other parties that they do not support as exclusive. Opposition partisans view the ANC as exclusive, while ANC partisans view the majority of op-position parties as exclusive. Moreover, these evaluations almost always stress race as the basis for exclusion – both whites and Africans tend to see the parties of the other side as exclusive.
So far, data shows that a strong theory of racial voting does not hold: African voters do not vote for an African party because they see it as exclusive to Africans. This
is evidence that South Africans generally buy the ideal of the rainbow nation: inclusive politics is worthy, while exclusive politics is detrimental. However, what about a weaker version of racial voting where voters do not vote for some parties because they perceive them as exclusive of their interests or identity? This brings us to the concept of ‘negative’ and ‘closed’ partisanship. Negative partisans can name a party they would never vote for, but have no positive partisanship. Closed partisans, on the other hand, positively identify with one party and also identify a party they would never vote for.77 The evidence so far seems to suggest that partisanship in South Africa is driven by the impressions voters’ hold of other parties. Voters might clearly and emphatically reject some parties, and this might be as important as whether or not they embrace others. In other words, voters are motivated by ‘negative out-group (aka exclu-sivity) feelings’ attached to party images. The reason for negative or closed partisan sentiment lies in perceptions of racial exclusivity as a voter senses he is unrepresented as a result of cues emanating from a party’s image.
The effects of ambiguity on partisanshipDoes uncertainty or ambiguity about a party’s image attract or repel voters? Data suggests that uncertainty is not favourable for opposition parties.78 Very few voters who evaluated the ANC government performance negatively and viewed an opposition party as inclusive showed greater probability of being an opposition sup-porter. One might expect increasing levels of ambiguity about the profiles of political parties to encourage greater cross-voting, thus offsetting the polarisation pattern seen in South Africa’s voting outcomes. Yet there is little evidence to suggest that voter uncertainty over party inclusiveness promotes partisanship or party support. Instead, most of the respondents who express uncertain-ty about the ANC’s image are self-declared independents or opposition supporters. Very few respondents who hold ambiguous views about the ANC’s party image are ANC supporters. The same pattern holds true for opposition parties. It therefore seems that ambiguity and uncertain-ty about a party’s image repels partisan support in much the same way as negative party images do. If a voter is unsure about a party’s inclusiveness, she/he tends not to support it. In other words, it seems that the absence of a party image is equally as detrimental for party support as a negative image.
So, while fewer people over time believe opposition parties are exclusive to one group only, nor are the same people convinced that the parties are more inclusive of their interests.
When we consider independents, who are the most likely voters to consider an alternative party, levels of uncertainty among these ‘floating voters’ about inclusive-
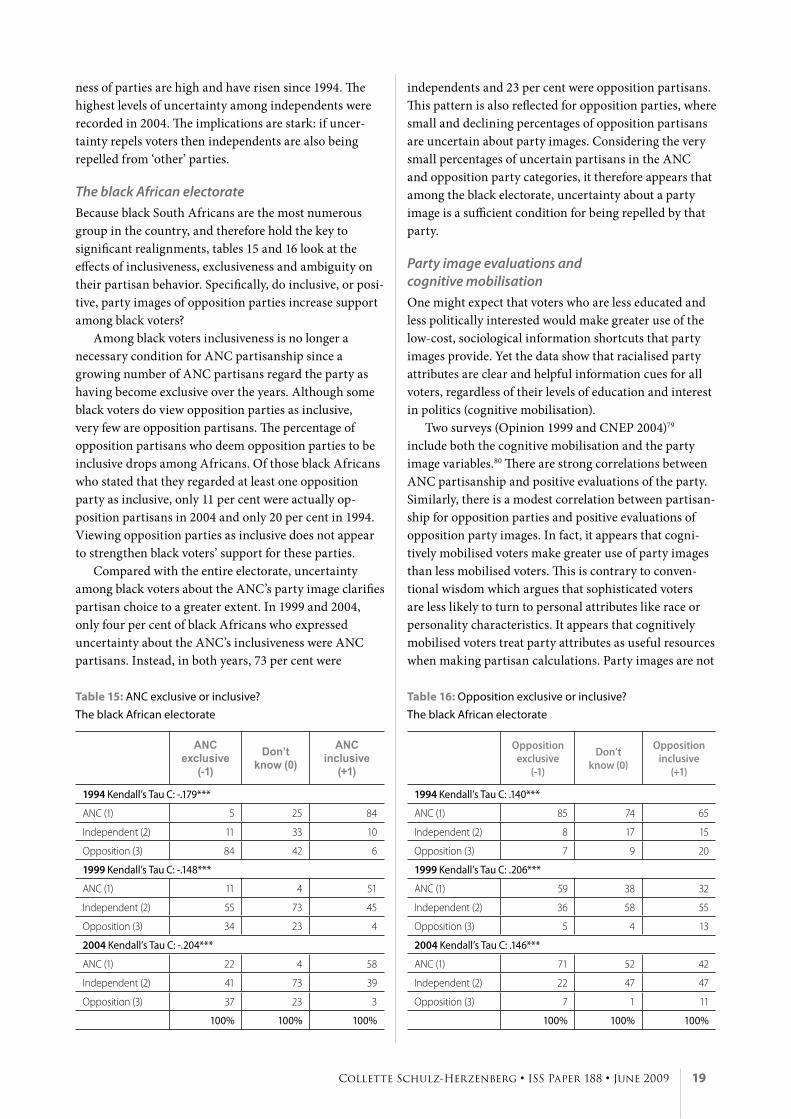
Collette Schulz-Herzenberg • ISS Paper 188 • June 2009 1�
ness of parties are high and have risen since 1994. The highest levels of uncertainty among independents were recorded in 2004. The implications are stark: if uncer-tainty repels voters then independents are also being repelled from ‘other’ parties.
The black African electorateBecause black South Africans are the most numerous group in the country, and therefore hold the key to significant realignments, tables 15 and 16 look at the effects of inclusiveness, exclusiveness and ambiguity on their partisan behavior. Specifically, do inclusive, or posi-tive, party images of opposition parties increase support among black voters?
Among black voters inclusiveness is no longer a necessary condition for ANC partisanship since a growing number of ANC partisans regard the party as having become exclusive over the years. Although some black voters do view opposition parties as inclusive, very few are opposition partisans. The percentage of opposition partisans who deem opposition parties to be inclusive drops among Africans. Of those black Africans who stated that they regarded at least one opposition party as inclusive, only 11 per cent were actually op-position partisans in 2004 and only 20 per cent in 1994. Viewing opposition parties as inclusive does not appear to strengthen black voters’ support for these parties.
Compared with the entire electorate, uncertainty among black voters about the ANC’s party image clarifies partisan choice to a greater extent. In 1999 and 2004, only four per cent of black Africans who expressed uncertainty about the ANC’s inclusiveness were ANC partisans. Instead, in both years, 73 per cent were
independents and 23 per cent were opposition partisans. This pattern is also reflected for opposition parties, where small and declining percentages of opposition partisans are uncertain about party images. Considering the very small percentages of uncertain partisans in the ANC and opposition party categories, it therefore appears that among the black electorate, uncertainty about a party image is a sufficient condition for being repelled by that party.
Party image evaluations and cognitive mobilisationOne might expect that voters who are less educated and less politically interested would make greater use of the low-cost, sociological information shortcuts that party images provide. Yet the data show that racialised party attributes are clear and helpful information cues for all voters, regardless of their levels of education and interest in politics (cognitive mobilisation).
Two surveys (Opinion 1999 and CNEP 2004)79 include both the cognitive mobilisation and the party image variables.80 There are strong correlations between ANC partisanship and positive evaluations of the party. Similarly, there is a modest correlation between partisan-ship for opposition parties and positive evaluations of opposition party images. In fact, it appears that cogni-tively mobilised voters make greater use of party images than less mobilised voters. This is contrary to conven-tional wisdom which argues that sophisticated voters are less likely to turn to personal attributes like race or personality characteristics. It appears that cognitively mobilised voters treat party attributes as useful resources when making partisan calculations. Party images are not
Table 1�: ANC exclusive or inclusive? The black African electorate
ANC exclusive
(-1)
Don’t know (0)
ANC inclusive
(+1)
1994 Kendall’s Tau C: -.179***
ANC (1) 5 25 84
Independent (2) 11 33 10
Opposition (3) 84 42 6
1999 Kendall’s Tau C: -.148***
ANC (1) 11 4 51
Independent (2) 55 73 45
Opposition (3) 34 23 4
2004 Kendall’s Tau C: -.204***
ANC (1) 22 4 58
Independent (2) 41 73 39
Opposition (3) 37 23 3
100% 100% 100%
Table 16: Opposition exclusive or inclusive? The black African electorate
Opposition exclusive
(-1)
Don’t know (0)
Opposition inclusive
(+1)
1994 Kendall’s Tau C: .140***
ANC (1) 85 74 65
Independent (2) 8 17 15
Opposition (3) 7 9 20
1999 Kendall’s Tau C: .206***
ANC (1) 59 38 32
Independent (2) 36 58 55
Opposition (3) 5 4 13
2004 Kendall’s Tau C: .146***
ANC (1) 71 52 42
Independent (2) 22 47 47
Opposition (3) 7 1 11
100% 100% 100%

�0 Elections and Accountability in South Africa • ISS Paper 188 • June 2009
necessarily ‘superficial, emotional, or purely short-term’, as previously assumed.81
Another pattern in the data warrants further discus-sion. Less cognised opposition identifiers make greater use of these information shortcuts than less cognised ANC identifiers. There appears to be greater need for opposition supporters to use party images as information shortcuts than for ANC supporters to do so. This may be because ANC partisans have more deeply-rooted partisan ties than opposition supporters and because they can turn to incumbent performance to inform their partisan decisions. In contrast, opposition partisans cannot rely on performance evaluations to assess their party’s credibility and only have party images to turn to.
Table 1�: Correlations between direction of partisanship x party images,82 for the total sample and sub-samples by cognitive mobilisation
Opinion 1999 Variables Phi
ANC inclusivity
Zero-order All voters -.488***
Conditional correlations
Cognitively mobilised voters -.646***
Non-cognitively mobilised voters -.466***
Opposition inclusivity
Zero-order All voters .240***
Conditional correlations
Cognitively mobilised voters .290*
Non-cognitively mobilised voters .249***
2004 CNEP Variables Phi
ANC inclusivity
Zero-order All voters -.335***
Conditional correlations
Cognitively mobilised voters -.563***
Non-cognitively mobilised voters -.325***
Opposition inclusivity
Zero-order All voters .234***
Conditional correlations
Cognitively mobilised voters .521
Non-cognitively mobilised voters .246***
Summary statistic: Phi (2x2 nominal)
Summary
Party images act as helpful cues for voters about whom and what parties stand for, irrespective of levels of educa-tion and interest in politics. Voters appear to be using these race-based cues as useful information shortcuts about parties. They are simply matching group interests that the parties appear to portray to their individual interests. By thinking about who political parties stand for, South African voters learn much about politics from racial or demographic cues. And most importantly, these
perceptions about party images play a restrictive role, limiting the choice of parties for both partisans and independents. If voters become dissatisfied with their parties they feel that they cannot move their support elsewhere.
Voters with positive evaluations of a party are far more likely to identify with that party, while those with negative evaluations will not. Moreover, positive images of the ANC seem to exert a more powerful influence over ANC partisanship than the positive images of opposition parties do over opposition partisans. Furthermore, party images affect partisanship in different ways. A positive, or inclusive, image of the ANC is almost a necessary condition for being an ANC partisan. However, positive images of opposition parties are not always prerequisites for being an opposition partisan – a few opposition supporters do regard their party as exclusive to one group. Negative, or exclusive, party images overwhelm-ingly repel voters. Very few voters support parties they believe to be exclusive to only one group. Thus the data shows little evidence of conscious or explicit ‘identity’ or ‘racial census’ voting. Uncertainty or ambiguity about a party’s image deters partisan support in much the same way as negative party images do. If a voter is unsure about a party’s inclusiveness he tends not to support it. Uncertainty about whether a party is inclusive or not is thus a sufficient condition for being repelled by a party. Instead of encouraging greater partisan volatility or cross-voting, ambiguity over party images drives voters away. Black South African voters also rely on positive attribute evaluations before they can identify with a party, but positive images of opposition parties do not appear to increase support among black voters. Viewing an opposition party as inclusive is insufficient to push black voters into the arms of the opposition.
Perceptions of inclusiveness also deeply affect how independents view parties. This suggests that perceptions of inclusiveness or exclusiveness are not necessarily a result of partisan predispositions. Independents also have clear view of party images and they may affect whether independents are able to vote for a particular party in an election. People who do not feel close to any party may well take the evaluations of party attributes into account before they decide to support a party at the polls.
Finally, the influence of racial party images on partisanship has endured over time. Racial stereotypes persist and are thus powerful and pervasive influences on partisanship. This is because voters’ images of political parties have changed very little in the first years of democracy. Despite several noteworthy attempts, most political parties have been slow to successfully transform their party images.83 South African political parties still borrow from historically politicised racial conflicts to

Collette Schulz-Herzenberg • ISS Paper 188 • June 2009 �1
maintain electoral support, employed mainly in political discourse and campaigning strategies.84
concluSion – Achieving AccounTAbiliTy Through elecTionS?
What do these findings tell us about the role of elections as a means to secure the accountability and responsive-ness of politicians in South Africa? If elections are to act as a meaningful vehicle for popular control of govern-ment, people must be willing to look retrospectively at past performance and base their vote on whether they are satisfied with what government is delivering between elections. They must also be prepared to punish poor governance accordingly by withdrawing their support. Finally, voters must also be prepared to move their support elsewhere. This implies that they must perceiv-ably have some degree of electoral choice.
Findings show that voters do think retrospectively about government performance. Data also shows that voters are willing to withdraw their support from the incumbents. However, data also shows that voters are unlikely to move their support elsewhere. Many of these voters retreat into the independents category.
The reasons for the lack of interparty movement pivot around party images. These negative perceptions of op-position parties dominate and overwhelm the effects of negative evaluations of government’s economic perform-ance.85 They obstruct inter-party movement, which arguably needs to occur if incumbents are to perceive elections as a punishing mechanism. Thus the potential for inter-party movement resulting from dissatisfaction with incumbents is nullified by perceptions that there are no alternative political homes for many voters.
Moreover, many voters appear unwilling or have few
incentives to change their partisan allegiances. Of all the voters who are party identifiers and who are most likely to vote, most are ritual partisans. These voters are typically mobilised by habitual cues and lack the cogni-tive skills or political information that would enable
them to shift their party support on the basis of party performance or policy positions. They are thus less likely to punish incumbents and hold government to account at elections. Most of the independents in the electorate are uninformed and disengaged from politics. Again, these voters are unlikely to participate at elections and use their political independence to choose between parties. Without the active engagement of this large group of voters, the unpredictability they can potentially bring to South African electoral politics diminishes.
Thus, although citizens do sanction the behaviour of incumbents in a rational manner by withdrawing support, it rarely translates into support for the competi-tion. In other words, while retrospective voting might be a necessary condition for accountability it falls short of being a sufficient condition in South Africa. The result, ironically, has been the further entrenching of the incumbents due mainly to the dealignment trend, which has seen greater losses of support for opposition parties. The lack of electoral uncertainty therefore persists. And where the outcome of an election is not in doubt, incumbents have less incentive to be responsive and accountable to the citizenry.
However, there is reason for optimism if we consider a different way of thinking about electoral accountability. Rather than viewing elections only as a ‘sanctioning device’ that induces elected officials to do what the voters want, elections can also be considered as a means to control politicians through ‘selection accountability’.86
‘Selection’ accountability occurs when voters use elections to choose among the available options on offer.87 In other words, voters try to distinguish the ‘good types’ from the ‘bad types’, selecting what they perceive to be the best choice on offer. Voters therefore think of elections more as an opportunity to make the best possible choice rather than as an opportunity to sanction or punish the incumbents for poor performance.
The interesting implication, of course, is that even when you think a government has performed poorly, voting for it is not irrational if the alternatives are perceived to be worse. This approach has resonance in a political context like South Africa, where the perceptions of party inclusivity matter a great deal to voters’ assess-ments of whether a party will govern in their interests. If political parties and politicians did not vary much in type, then there would be less reason to turn to selection criteria since they would appear to be most similar. However, the introduction of any variation in politicians’ attributes or propensities relevant to their performance in office means that it makes sense for the electorate to focus completely on choosing the best type when it comes time to vote.88 In South Africa the variation in attributes between political parties as perceived by the electorate is significant. Thus, while many voters may
Negative perceptions of
opposition parties overwhelm
the effects of negative
evaluations of government’s
economic performance
�� Elections and Accountability in South Africa • ISS Paper 188 • June 2009
recognise that the incumbent party has performed poorly on a number of fronts, voting them out of office is not rational if opposition parties are deemed to be worse choices.
Another important implication is that by selecting a ‘good type’, voters are effectively sanctioning the ‘bad types’.89 Political parties that garner little support are incentivised to broaden their appeal and moderate policy choices in the direction of what the electorate really wants. And there is some evidence that the opposition parties in South Africa are doing precisely this. For example, the main opposition party, the DA, has at-tempted to reposition itself in terms of policy and party image in order to become more attractive to a greater number of voters. So, it appears that an interesting interaction effect is occurring between two interrelated mechanisms of electoral accountability – that of ‘select-ing the good guys’ and ‘sanctioning the bad guys’.
While the traditional sanctioning device of elections may be weak, elections can and do act as an account-ability mechanism. Voters use elections to choose good governments, rather than to sanction the incumbents. Accountability therefore involves both a selection of prospective governments and a sanction for the parties that fail to win. The paradox is that because party images transform slowly over time, it is unlikely that opposition parties will be regarded as ‘good types’ in the foreseeable future. The implication is that South Africa will remain characterised by a dominant party system in the medium term.
Where elections fail as an optimum mechanism of popular control over politicians, other avenues of political accountability become critical. Modern democ-racies have several other mechanisms that establish the accountability of rulers to citizens, such as the judicial system and criminal law. Freedom of information presents yet another approach to political accountability in modern democratic politics.90 Other important South African institutions that assist citizens in holding government accountable include the Independent Electoral Commission, the Auditor-General’s office, and other independent agencies listed in the South African Constitution.
Securing political accountability cannot rely on retrospective voting and elections alone. It must be supplemented by critical citizen engagement between elections and by strong, independent institutions that can exercise political oversight.91 However, most of the weight in seeking to secure political accountability has to be borne by politicians themselves. The ANC is aware that it faces little electoral threat in the medium term. And therein lies the danger. As Norris explains:
At regular intervals, as long as representatives and parties in office are not insulated from defeat, dissatisfied citizens can use elections as the safety-value in the system to ‘throw the rascals out’.92
However, where elections fail to serve as a safety-valve in party systems with predominant parties without an outlet, public dissatisfaction may strengthen and accumulate.93 As a particular party stays in government for prolonged periods of time, citizens may become dissatisfied with the political system, and democracy itself, if they feel there is little chance of exercising accountability over elected leaders. The consequences for the political system may be even more serious if, indeed, citizens do reject democratisation as the only game in town, or the ‘best form of government’. Until a viable op-position party emerges, elections are unlikely to produce significant changes in the percentages of support for the governing party. And, if one-party dominance continues into the second decade of democracy, the greatest chal-lenge for incumbents will be maintaining high levels of responsiveness and accountability towards citizens.
noTeS1 Adam Przeworski, Susan C. Stokes and Bernard Manin (eds),
Democracy, accountability and representation, Cambridge University Press, 1999, 9.
2 James D. Fearon, Control of politicians, in Adam Przeworski, Susan C. Stokes and Bernard Manin (eds), Democracy, accountability and representation, Cambridge University Press, 1999, 56.
3 Przeworski, Stokes and Manin, Democracy, accountability and representation, 10.
4 Ibid, 29.
5 This paper is based on findings of a doctoral study completed at the University of Cape Town entitled ‘Towards a silent revolution? South African voters during the first years of democracy 1994–2006’. The thesis consists of a longitudinal analysis of change in, first, the level and direction of partisan-ship among the entire electorate; second, the social groups within the ANC’s partisan coalition; and third, the motiva-tions of individual voters by comparing different electorates over 12 years using a series of cross-sectional surveys. It explores the relative influence of competing theoretical models on partisanship, such as demographic and sociological factors, evaluations of government performance, party images, social networks and the voters’ cognitive skills, as well as the relative mix and intersection of these models on partisanship. Findings are based on a range of statistical analyses such as cross-tabulations of structural and demographic variables, bivariate analyses and multivariate data analyses (logistic regression).
The study draws evidence from the following national public opinion surveys listed below:
1. Idasa National Post Election Survey (1994)

Collette Schulz-Herzenberg • ISS Paper 188 • June 2009 ��
2. Idasa Local Government Elections Study (1995)
3. Idasa Political Culture Study (1997)
4. Opinion ’99 (1999)
5. Afrobarometer Round 1 (2000)
6. Afrobarometer Round 2 (2002)
7. Afrobarometer Round 2.5 (2004)
8. Afrobarometer Round 3 (2006)
9. Comparative National Elections Project (CNEP) (2004)
6 Fearon, Control of politicians, 81.
7 James Hamill, The elephant and the mice: Election 2004 and the future of opposition politics in South Africa. The Round Table, 93(377) (2004), 691–708, 702.
8 Andrew Heywood, Politics. 3rd ed, London: Palgrave Macmillan, 2007, 287.
9 William Riker, Liberalism against populism: A confrontation between the theory of democracy and the theory of social choice, San Francisco: W.H Freeman and Company, 1982.
10 Adam Habib and Collette Herzenberg, Popular control over decision-makers, in Richard Calland and Paul Graham (eds), Democracy in the time of Mbeki, Cape Town: Idasa Publishing, 2005, 168.
11 Hamill, The elephant and the mice, 702.
12 Joseph Schumpeter, Capitalism, socialism and democracy, New York: Harper, 1962, 269–271. Schumpeter highlighted the dangers that power monopolies can wreak on democratic competition. He believed competition for leadership to be of such importance that he framed it as the true test of the democratic system. The primary function of the electorate is to produce or evict a government, hence his emphasis on competition thereby reducing powers vested in the electorate to make direct decisions in a democracy.
13 Andreas Schedler, Taking uncertainty seriously: The blurred boundaries of democratic transition and consolidation, Democratization 8(4) (2001), 1–22, 19.
14 Arend Lijphart, Electoral systems and party systems, New York: Oxford University Press, 1994; Donald Horowitz, A democratic South Africa? Constitutional engineering in a divided society, Cape Town: Oxford University Press, 1991.
15 Claude Kabemba, Electoral administration: Achievements and continuing challenges, in Jessica Piombo and Lia Nijzink (eds), Electoral politics in South Africa: Assessing the first democratic decade, , New York: Palgrave Macmillan, 2005, 87–105, 95.
16 Sources for VAP figures: Andrew Reynolds, Elections ’99 South Africa: From Mandela to Mbeki, Cape Town: David Phillip, 1999; Jessica Piombo and Lia Nijzink, Electoral politics in South Africa: Assessing the first democratic decade, New York: Palgrave Macmillan, 2005. The 2004 VAP figures are based on Statistics South Africa Census 2001 data. The 2009 VAP figures are based on the Labour Force Survey, 3rd Quarter 2008. The proportion of VAP for the ANC (and opposition) is calculated using total votes for ANC/total VAP. In 1994 there was no formal registration and hence no voters’ roll. To vote in the 1994 elections citizens simply had to present their Identity Documents.
17 These figures are calculated using total votes for ANC divided by total VAP.
18 Hamill, The elephant and the mice, 701.
19 Angus Campbell, Phillip E. Converse, Warren E. Miller and Donald E. Stokes, The American voter, New York: John Wiley & Sons, 1960, 24–37.
20 Morris Fiorina, Retrospective voting in American presidential elections, New Haven: Yale University Press, 1981, 84–130; Samuel Popkin, The reasoning voter, Chicago: University of Chicago Press, 1991, 54–5.
21 V.O. Key, The responsible electorate, Cambridge, Mass: Belknap Press, 1967.
22 Donald Green, Bradley Palmquist and Eric Schickler, Partisan hearts and minds: Political parties and the social identities of voters, New Haven: Yale University Press, 2002, 4, 19, 164–202.
23 Question items: ‘Do you think of yourself as close to any particular political party? Yes, No, Don’t know’; ‘If yes, which party is that?’
24 It is used by scholars to measure aggregate partisan balance and changes to distribution of partisanship over time. Its operationalisation has two noteworthy features: it omits inde-pendents, and is calculated using the ratio of two percentages and consequently tends to amplify small changes in survey results. The formula used in the US is as follows: Percentage of Democrats divided by (Percentages of Democrats + Republicans), and is used as a summary statistic to show the distribution of partisanship over time in the US. Green, Palmquist and Schickler, Partisan hearts and minds, 87–8. I have reformulated for the South African data as follows: SA = % of ANC / (% of ANC + Opposition).
25 Lawrence Schlemmer, State of parties and health of democ-racy, Focus 26 (2002), 2–5. http://www.hsf.org.za/publications/focus-issues/issues-21-30/issue-26/survey-state-of-parties-and-health-of-democracy/.
26 R.W. Johnson, The 1994 election: Outcome and analysis, in R.W. Johnson and Lawrence Schlemmer (eds), Launching democracy in South Africa: The first open election, New Haven: Yale University Press, 1996, 319; Horowitz, Democratic South Africa, 45; Lawrence Schlemmer, Democracy or democratic hegemony? The future of political pluralism in South Africa, in Hermann Giliomee and Charles Simkins (eds), The awkward embrace: One-party domination and democracy, Cape Town: Tafelberg Publishers, 1999, 281–300; Hermann Giliomee and Charles Simkins, The awkward embrace: One-party domina-tion and democracy, Cape Town: Tafelberg Publishers, 1999, 341.
27 Giliomee and Simkins, The awkward embrace, 341; Horowitz, Democratic South Africa; Schlemmer, Democracy or demo-cratic hegemony?, 282.
28 Anthony Downs, An economic theory of democracy, New York: Harper Collins, 1957, 40–9; Fiorina, Retrospective voting in American presidential elections, 25.
29 Fiorina, Retrospective voting in American presidential elections, 84–130; Popkin, The reasoning voter, 54–5.
30 Figure 1: ‘Overall conditions’. What about the overall condi-tions of the country? Would you say that the country is: Going in the right direction, Going in the wrong direction, Don’t know; In general, how would you describe: A. The present economic

�� Elections and Accountability in South Africa • ISS Paper 188 • June 2009
conditions of this country? (this is what I call ‘national eco-nomic conditions’). The percentages include respondents who answered positively to each evaluation.
31 Popkin, The reasoning voter, 31.
32 Lee Sigelman, Carol Sigelman and David Bullock, Reconsidering pocket book voting: An experimental approach, Political Behaviour 13(2) (1991), 129–149, 142.
33 Fiorina, Retrospective voting in American presidential elections, 15; Popkin, The reasoning voter, 33.
34 Fearon, Control of politicians.
35 Sigelman, Sigelman and Bullock, Reconsidering pocket book voting, 141; Fiorina, Retrospective voting in American presidential elections.
36 Popkin, The reasoning voter, 32; Sigelman, Sigelman and Bullock, Reconsidering pocket book voting, 140.
37 The item is The government’s economic policies have helped most people, only a few have suffered.
38 Michael Lewis-Beck, Comparative economic voting: Britain, France, Germany and Italy, in Pippa Norris (ed), Elections and voting behaviour: New challenges, new perspectives, Aldershot: Dartmouth Publishing, 1998, 175.
39 Fiorina, Retrospective voting in American presidential elections, 120, 128–9. Fiorina’s results found a weak or non-existent relationship between individuals’ perceptions of their chang-ing financial situation and the vote.
40 Schlemmer, State of parties and health of democracy. He argues that the political ‘solidarity vote’ by Africans for the ANC undermines individual and policy-related interests. Voters will vote for the ANC regardless of whether they are unhappy with them or not.
41 Popkin, The reasoning voter, 31.
42 Sigelman, Sigelman and Bullock, Reconsidering pocket book voting, 140.
43 Sigelman, Sigelman and Bullock, Reconsidering pocket book voting, 141; Fiorina, Retrospective voting in American presidential elections.
44 Mondli Makhanya, Opposition’s only chance is to show some vision and stop whining, The Sunday Times, 18 April 2004.
45 Ronald Inglehart, The silent revolution: Changing values and political styles among Western publics, Princeton N.J: Princeton University Press, 1977; Russell Dalton, Citizen politics in Western democracies: Public opinion and political parties in the United States, Great Britain, Germany and France, New Jersey: Chatham House Publishers, 1988; Russell Dalton, Citizen politics: Public opinion and political parties in advanced democracies, 2nd ed. New Jersey: Chatham House Publishers, 1998; Russell Dalton, Partisan mobilisation, cognitive mobilisation and the changing American electorate, Center for the Study of Democracy, University of California, 2004, http://repositories.cdlib.org/csd/04-11; Popkin, The reasoning voter.
46 Dalton, Partisan mobilisation, 3.
47 Dalton, Citizen politics in Western democracies, 18.
48 Dalton, Partisan mobilisation, 5; Russell Dalton, Cognitive mobilisation and partisan dealignment in advanced industrial democracies, The Journal of Politics 46(1) (1984): 264–284, 267.
49 Dalton, Partisan mobilisation, 5.
50 The revised ‘cognitive mobilisation’ variable was created using those who responded positively to having matriculated plus those with higher tertiary education and those who were ‘very interested in politics’.
51 Dalton, Citizen politics, 2nd ed, 215.
52 Dalton, Partisan mobilisation, 5.
53 Dalton, Citizen politics, 2nd ed, 215.
54 Cramer’s V: .223***
55 Cramer’s V: .141***
56 Cramer’s V: .191***
57 Cramer’s V: .100***
58 Cramer’s V: .144***
59 Dalton, Partisan mobilisation, 3.
60 Robert Putnam, Bowling alone, New York: Simon and Schuster, 2000, 343.
61 Samuel L. Popkin and Michael A. Dimock, Cognitive engagement and citizen world views, paper prepared for presentation at the PEGS Conference on Citizen Competence and the Design of Democratic Institutions, February 1995, 2. http://www.bsos.umd.edu/pegs/popkin.txt
62 Ibid., 12.
63 Robert Mattes, Voter information, government evaluations and party images in the first democratic decade, in Jessica Piombo and Lia Nijzink (ed), Electoral politics in South Africa: Assessing the first democratic decade, , 40–63, New York: Palgrave Macmillan, 2005, 60.
64 Dalton, Partisan mobilisation, 15.
65 Ibid., 6.
66 Brad T Gomez, Cognitive heterogeneity and economic voting: A comparative analysis of four democratic electorates, American Journal of Political Science 50(1) (2006), 23.
67 Richard Trilling, Party image and electoral behaviour, New York: John Wiley, 1976, 2.
68 Dalton, Citizen politics in Western democracies, 28; Downs, An economic theory of democracy; Popkin, The reasoning voter.
69 David Butler and Donald Stokes, Political change in Britain (London: Macmillan, 1969), 359.
70 The confidence interval for 1994, 1999 and 2004 CNEP is 1%. At the 95% confidence level, expected range of response rates within the population will be between one percentage point above or below the reported frequencies.
71 David Welsch, The Democratic Party, in Andrew Reynolds (ed), Election ’99 South Africa, , 65–87, Cape Town: David Phillip, 1999, 97.
72 Susan Booysen, The Democratic Alliance: Progress and [itfalls, in Jessica Piombo and Lia Nijzink, Electoral politics in South Africa 129–147, New York: Palgrave Macmillan, 2005, 130.
73 Collette Schulz-Herzenberg, The New National Party: The end of the road, in Jessica Piombo and Lia Nijzink, Electoral politics in South Africa, 166–186, New York: Palgrave Macmillan, 2005, 171.

Collette Schulz-Herzenberg • ISS Paper 188 • June 2009 ��
74 Karen E. Ferree, The microfoundations of ethnic voting, Afrobarometer Working paper No. 40, 2004, 20–23; Karen E. Ferree, Explaining South Africa’s racial census, The Journal of Politics 68(4)(2006) 812.
75 Ferree, Explaining South Africa’s racial census, 812.
76 Ferree, Microfoundations of ethnic voting, 22.
77 Richard Rose and William Mishler, Negative and positive par-tisanship in post-communist countries, Studies in ublic Policy No. 286, Centre for the Study of Public Policy, University of Strathclyde, Glasgow, 1997.
78 Ferree, Explaining South Africa’s racial census, 812.
79 1994 survey does not include all variables used to construct the cognitive mobilisation variable.
80 Does X political party look after interests of all in South Africa or after the interests of one group only? Which group?
81 Dalton, Citizen politics, 2nd ed, 208.
82 Coding: ANC inclusivity: (1) inclusive, (2) exclusive; Opposition inclusivity scale (-1) exclusive (+1) inclusive.
83 Some opposition parties have attempted to transform their images, most obviously the National Party which tried to reinvent itself as the New National Party and the Democratic
Alliance which attempted to garner the black African vote in the 2004 election. The ANC also presents itself as a national, non-racial party in some areas.
84 Gavin Davis, Proportional representation and racial cam-paigning in South Africa, Nationalism and Ethnic Politics, 10 (2004), 319.
85 In an integrated analysis, which attempts to establish the rela-tive effects of party images vis-à-vis government evaluations, it was found that party images dominate the model. See chapter ten in the doctoral thesis.
86 Fearon, Control of politicians, 56.
87 Ibid.
88 Ibid., 77.
89 Ibid., 81.
90 Przeworski, Stokes and Manin, Democracy, accountability and representation, 339.
91 Ibid., 336.
92 Pippa Norris, Critical citizens: Global support for democratic governance, Oxford: Oxford University Press, 1999, 25.
93 Ibid.

�6 Elections and Accountability in South Africa • ISS Paper 188 • June 2009
SUBSCRIPTIONS TO ISS PUBLICATIONS
PERSONAL DETAILS
Knowledge empowers Africa
La savoir émancipe l’Afrique
SUBSCRIPTIONS Indicate Cost
African Security Review only
ISS Monographs only
ISS Papers only
SA Crime Quarterly only
Comprehensive subscription
TOTAL
PUBLICATIONS South Africa African Countries* International
African Security Review(4 issues per year)
R 200,00 US$ 40,00 US$ 55,00
ISS Monographs(Approx. 15 per year)
R 370,00 US$ 75,00 US$ 95,00
ISS Papers(Approx. 12 per year)
R 150,00 US$ 30,00 US$ 40,00
SA Crime Quarterly(4 issues per year)
R 115,00 US$ 25,00 US$ 35,00
Comprehensive subscription(African Security Review, Monographs, Papers and SA Crime Quarterly)
R 800,00 US$ 160,00 US$ 210,00

SUBSCRIPTIONS TO ISS PUBLICATIONS
If you would like to subscribe to ISS publications, please complete the form below and return it to the ISS with a cheque, or a postal/money order for the correct amount, made payable to the Institute for Security Studies (marked not transferable). Please note that credit card payments are also welcome. You can also deposit your payment into the following bank account, quoting the reference: PUBSPAY.
ISS bank details: ABSA, Brooklyn Court, Branch Code: 632005, Account number: 405 749 8921
Please mail, fax or email this form to:ISS Publication Subscriptions, PO Box 1787, Brooklyn Square, 0075, Pretoria, South Africa.ISS contact details: (Tel) +27 12 346 9500, (Fax) +27 12 460 0998, Email: [email protected]: www.issafrica.org
Title: ................................... Surname: ......................................................................... Initials: ...................
Organisation: .............................................................................. Position: .....................................................Postal Address: ........................................................................................................................................................................................................................................................... Postal Code: ..............................................Country: ..............................................................................................................................................................
Tel: .......................................... Fax: ......................................... Email: .........................................................Method of Payment: Visa ■ Master Card ■ Other ■ Specify:
Card Number: ............................................................................ Expiry Date: ................./ ............................Cardholder Name: ..............................................................................................................................................Signature: .............................................................................................................................................................
PERSONAL DETAILS
* Angola; Botswana; Burundi; Congo-Brazzaville; Democratic Republic of Congo; Gabon, Kenya, Lesotho, Madagascar; Malawi, Mauritius; Mozambique; Namibia; Reunion; Rwanda; Seychelles; Swaziland; Tanzania; Uganda; Zambia; Zimbabwe (formerly African Postal Union countries).
Knowledge empowers Africa
La savoir émancipe l’Afrique
SUBSCRIPTIONS Indicate Cost
African Security Review only
ISS Monographs only
ISS Papers only
SA Crime Quarterly only
Comprehensive subscription
TOTAL
PUBLICATIONS South Africa African Countries* International
African Security Review(4 issues per year)
R 200,00 US$ 40,00 US$ 55,00
ISS Monographs(Approx. 15 per year)
R 370,00 US$ 75,00 US$ 95,00
ISS Papers(Approx. 12 per year)
R 150,00 US$ 30,00 US$ 40,00
SA Crime Quarterly(4 issues per year)
R 115,00 US$ 25,00 US$ 35,00
Comprehensive subscription(African Security Review, Monographs, Papers and SA Crime Quarterly)
R 800,00 US$ 160,00 US$ 210,00

As a leading African human security research institution, the Institute for Security Studies (ISS) works towards a stable and peaceful Africa characterised by sustainable development, human rights, the rule of law, democracy and collaborative security. The ISS realises this vision by:
n Undertaking applied research, training and capacity building
n Working collaboratively with others
n Facilitating and supporting policy formulation
n Monitoring trends and policy implementation
n Collecting, interpreting and disseminating information
n Networking on national, regional and international levels
© 2009, Institute for Security Studies
Copyright in the volume as a whole is vested in the Institute for Security Studies, and no part may be reproduced in whole or in part without the express permission, in writing, of both the authors and the publishers.
The opinions expressed do not necessarily reflect those of the Institute, its trustees, members of the Council or donors. Authors contribute to ISS publications in their personal capacity.
Published by the Institute for Security Studies, P O Box 1787, Brooklyn Square 0075 Tshwane (Pretoria), South Africa Tel: (27-12) 346 9500 Fax: (27-12) 460 0998 [email protected]
www.issafrica.org
design Marketing Support Services +27 12 346-2168layout Page Arts cc +27 21 686-0171Printing Tandym Press, Cape Town
AbouT ThiS PAPer
This paper explores different aspects of voter behaviour in South Africa to assess whether elections act as an effective accountability mechanism. It particularly examines voters’ willingness sanction the incumbent African National Congress government by looking at its past performance and punishing the party by withdrawing electoral support if perform-ance is perceived to be poor. The paper also examines voter perceptions of political parties to establish whether sufficient ‘electoral market’ exists in order to make selection among numerous political parties a viable option for voters. Finally, it examines cognitive mobilisation among the electorate to establish whether voters are sufficiently politically engaged and interested in politics to move their support elsewhere if they are to sanction government at election time. It shows that, while voters are willing to withdraw support from the incumbent party if they disapprove of its performance, they are unlikely to move their support to another party. Moreover, most voters typically lack the cognitive skills or political information that would enable them to shift their party support on the basis of ongoing party performance or policy positions. The paper concludes that elections as a mechanism to sanction and hold government to account in the traditional sense is weak, making political accountability through elections more elusive. Instead, greater attention should be given to the method of ‘selection’ as a means to control politicians.
AbouT The AuThor
Collette Schulz-Herzenberg is a senior researcher in the Institute for Security Studies (ISS) Corruption & Governance Programme in Cape Town. She is currently leading a project on conflicts of interest in public life. She holds a Doctorate specialising in South African voting behaviour and an MSc in Democratic Governance from the University of Cape Town. She also holds a BA Honours in the Politics of Africa and Asia from the University of London. She has worked as an elections analyst for the South African Broadcasting Corporation during elections and as a researcher on governance issues with the Institute for Democracy in South Africa. She has also worked in Parliament and lectured on South African politics.
funder
The original doctoral research on which this paper is based was funded by the National Research Foundation, the Andrew W. Mellon Foundation and the University of Cape Town Faculty of Humanities. In addition general Institute funding is provided by the Governments of Denmark, the Netherlands, Norway and Sweden as well as the Open Society Foundation (South Africa).
ISS Paper No 188Price R15,00
Elections and Accountability in South Africa • ISS Paper 188 • June 2009