Statistics on Race and the Criminal Justice System - 2006
140
Statistics on Race and the Criminal Justice System – 2006 A Ministry of Justice Publication under Section 95 of the Criminal Justice Act 1991 October 2007
-
Upload
khangminh22 -
Category
Documents
-
view
3 -
download
0
Transcript of Statistics on Race and the Criminal Justice System - 2006
Statistics on Race and the Criminal Justice System – 2006
A Ministry of Justice Publication under Section 95
of the Criminal Justice Act 1991
October 2007
Section 95
ii
Criminal Justice Act 1991 Section 95
(1) The Secretary of State shall in each year publish such information, as he considers expedient for the purpose of:
(a) enabling persons engaged in the administration of justice to become aware of the financial implications of their decisions; or
(b) facilitating the performance of such persons of their duty to avoid discriminating against any persons on the ground of race or sex or any other improper ground.
(2) Publication under subsection (1) above shall be effected in such a manner, as the Secretary of State considers appropriate for the purpose of bringing the information to the attention of the persons concerned.
© Crown copyright 2007
ISBN
ISSN
This publication is available on the Ministry of Justice website: http://www.justice.gov.uk/publications/statistics.htm
Section 95
iii
The AuthorsAlex Jones Lawrence Singer
With thanks to:
Davnet CassidyChris LewisChristine Magill

Section 95
iv
Section 95
v
Contents
Page
List of tables vi
Executive summary ix
Chapter 1 Introduction 1
Chapter 2 Developments in ethnic monitoring 3
Chapter 3 Victims and homicide 9
Chapter 4 Stop and searches – including under the Police and Criminal Evidence Act and Terrorism Act 23
Chapter 5 Arrests and cautions 37
Chapter 6 Prosecutions and sentencing 55
Chapter 7 Youth offending 69
Chapter 8 Probation 83
Chapter 9 Prisons 87
Chapter 10 Complaints against the police, prison and probation services 93
Chapter 11 Deaths in custody 97
Chapter 12 Practitioners in the Criminal Justice System 101
Appendices 117
Bibliography 122
Useful references 125
Contact points 128
Official publications on race and gender 128
Section 95
vi
List of tables
Page
Table A Proportion (%) of ethnic groups at different stages of the criminal justice process, England and Wales, 2005/6 ix
Table 3.1 Racist incidents for all police force areas 1998/9 to 2005/6 14
Table 3.2 Racially or religiously aggravated offences recorded by police forces by offence type, 2004/5 and 2005/6, with clear-up rates for England and Wales 15
Table 3.3 Number of persons cautioned or prosecuted at magistrates' courts and the Crown Court for racially aggravated offences, by age group and result, 2005 16
Table 3.4 Homicides currently recorded1 by ethnic appearance of victim and police force area: England and Wales, combined data for 2003/04 to 2005/06 20
Table 3.5 Ethnic appearance of currently recorded homicide victims by ethnicity of principal suspect, England and Wales, combined data for 2003/4, 2004/5 and 2005/6 21
Table 3.6 Relationship of currently recorded homicide victims to principal suspect, by ethnic appearance of victim, England and Wales, combined data for 2003/4, 2004/5 and 2005/6 21
Table 3.7 Apparent method of killing of currently recorded homicide victims, by ethnic appearance of victim, England and Wales, combined data for 2003/4, 2004/5 and 2005/6 21
Table 4.1 Stop and searches of persons under s1 of the Police and Criminal Evidence Act 1984, and other legislation, by ethnic appearance, 2005/6 27
Table 4.2 ‘Stop and searches’ of persons under s1 of the Police and Criminal Evidence Act 1984, and other legislation, per 1,000 population, by police force area and ethnic appearance, 2004/5 and 2005/6 28
Table 4.3 Percentage of stop and searches under s1 of the Police and Criminal Evidence Act 1984, and other legislation by reason for search and ethnic appearance, for selected police force areas, 2004/5 and 2005/6 29
Table 4.4 Percentage of ‘stop and searches’ under s1 of the Police and Criminal Evidence Act 1984 and other legislation resulting in an arrest, by police force area and ethnicity, 2004/5 and 2005/6 32
Table 4.5 ‘Stop and searches’ of persons under s60 of the Criminal Justice and Public Order Act 1994, by police force area and ethnic appearance, 2005/6 33
Table 4.6 Total stop and searches under s44 (1) and (2) of the Terrorism Act 2000 by police force area and ethnicity, 2004/5 and 2005/6 34
Table 4.7 Stop and searches of vehicle occupants under s44(1) of the Terrorism Act 2000 and resultant arrests by ethnicity, selected areas, 2005/6 35
Section 95
vii
Table 4.8 Stop and searches of pedestrians under s44(2) of the Terrorism Act 2000 and resultant arrests by ethnicity, selected areas, 2005/6 36
Table 5.1 Total arrests for notifiable offences, by police force and ethnic appearance, 2005/6 40
Table 5.2 Total arrests for notifiable offences per 1,000 population aged ten and over, by police force area and ethnicity, 2004/5 and 2005/6 41
Table 5.3 Arrests resulting from a stop and search under s1 of the Police and Criminal Evidence Act 1984, as a percentage of total arrests for notifiable offences, by police force area and ethnic appearance, 2005/6 42
Table 5.4 Percentage breakdown by ethnic appearance of those arrested for notifiable offences by offence group, selected areas, 2005/6 43
Table 5.5 Percentage breakdown by ethnic appearance for age groups of those arrested for notifiable offences, selected areas, 2005/6 46
Table 5.6 Number of persons cautioned for notifiable offences, by police force area and ethnic appearance, 2005 48
Table 5.7 Percentage of arrests which resulted in a caution for notifiable offences, by police force area and ethnic appearance, 2005/6 49
Table 5.8 Percentage breakdown by ethnic appearance for age groups of persons cautioned for notifiable offences, selected areas, 2005 50
Table 5.9 Percentage breakdown by ethnic appearance of persons cautioned for notifiable offences, by offence group, selected areas, 2005 52
Table 6.1 Prosecutions for indictable offences at magistrates' courts by outcome and ethnic appearance of defendant, selected areas, 2005 58
Table 6.2 Persons sentenced for indictable offences at magistrates' courts by outcome and ethnic appearance of defendant, selected areas, 2005 59
Table 6.3 Persons tried for indictable offences at the Crown Court by outcome and ethnic appearance, selected areas and England and Wales, 2005 60
Table 6.4 Persons sentenced for indictable offences at the Crown Court by outcome and ethnic appearance of defendant, selected areas, 2005 63
Table 6.5 Persons sentenced for indictable offences at the Crown Court by outcome, offence type and ethnic appearance, 2005 66
Table 7.1 Percentage of offences dealt with by Youth Offending Teams by offence group and self-defined ethnicity, selected areas, 2005/6 71
Table 7.2 Pre-court decisions for offences where defendants are aged 10-17 by decision and self-defined ethnicity, selected areas, 2005/6 74
Table 7.3 Sentencing for offences committed by 10-17-year-olds by self-defined ethnicity, selected areas, 2005/6 77
Table 8.1 Percentage of persons starting court order supervision by the Probation Service, by ethnic group and area, 2005 85
Table 8.2 Percentage of persons starting pre- or post-release supervision by the Probation Service, by ethnic group and area, 2005 86

Section 95
viii
Table 9.1 Population in prison establishments by self-identified ethnic group, gender, British Nationals and all Nationalities, 30 June 2006. 89
Table 9.2 Prison population by ethnic group, type of prisoner, age group, offence group and sentence length, 30 June 2006 90
Table 9.3 Sentenced prisoners by court sentencing area, received into prison establishments, by ethnicity, year ending March 2006 91
Table 9.4 Sentenced prison receptions by offence type and ethnicity, year ending March 2006 92
Table 10.1 Police recorded ethnicity of complainant, year ending March 2006 95
Table 10.2 Outcome of completed complaints of discriminatory behaviour, by police force area, 2005/6 96
Table 11.1 Deaths in or following contact with the police by ethnicity, gender, age and cause of death, England and Wales, 2005/6 98
Table 11.2 Self-inflicted deaths in prison by self-identified ethnicity, gender, age and cause of death, 2005/6 99
Table 11.3 Deaths in prison resulting from natural and other causes by self-identified ethnicity, gender, age and cause of death, 2005/6 100
Table 12.1 Police Service staff by ethnicity, 2005/6 (as at 31 March 2006) 103
Table 12.2 Prison Service staff by ethnicity, 2005/6 (as at 31 March 2006) 106
Table 12.3 Probation Service staff in post by ethnicity 2005/6 107
Table 12.4 Crown Prosecution Service staff by ethnicity, 2005/6 108
Table 12.5 Employment in the Criminal Justice System, 2005/6 109
Appendix A1 Estimated population aged ten and over by ethnic origin and police force area, mid-2005 118
Appendix A2 Estimated population aged ten and over, percentage by ethnic origin and police force area, mid-2005 119
Appendix B Correspondence of ethnic classifications 120
Section 95
ix
Executive summary
General Findings1
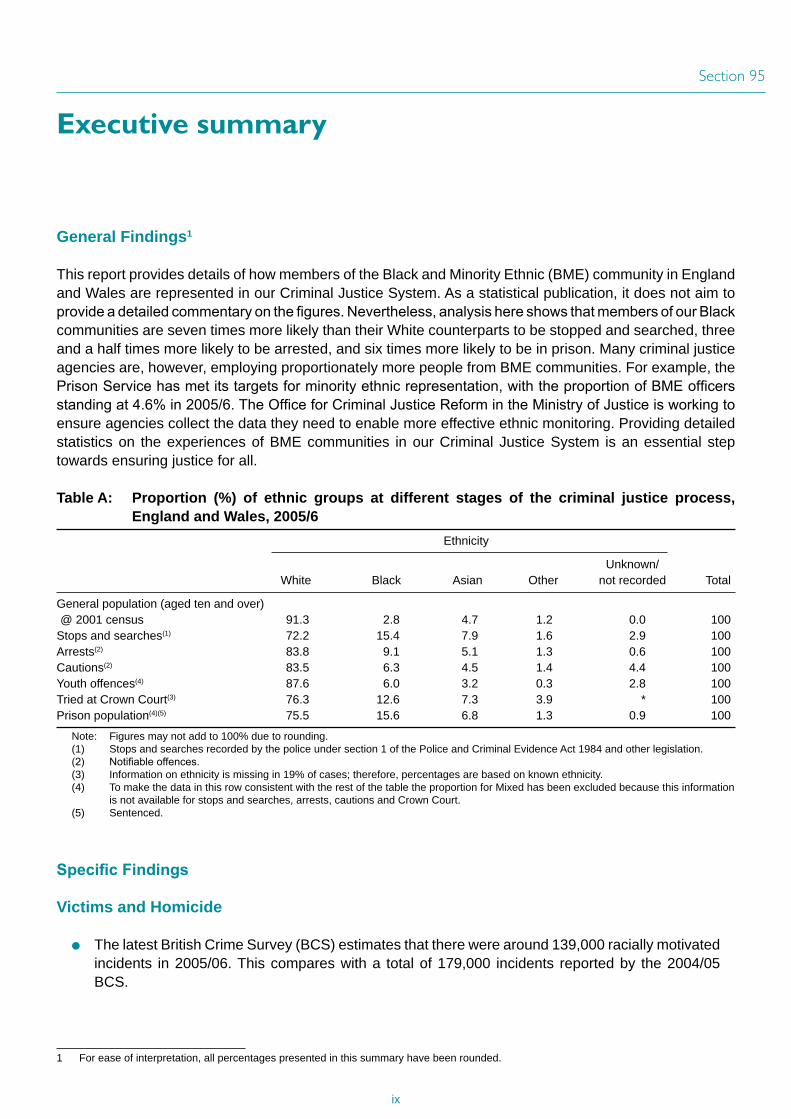
This report provides details of how members of the Black and Minority Ethnic (BME) community in England and Wales are represented in our Criminal Justice System. As a statistical publication, it does not aim to provide a detailed commentary on the figures. Nevertheless, analysis here shows that members of our Black communities are seven times more likely than their White counterparts to be stopped and searched, three and a half times more likely to be arrested, and six times more likely to be in prison. Many criminal justice agencies are, however, employing proportionately more people from BME communities. For example, the Prison Service has met its targets for minority ethnic representation, with the proportion of BME officers standing at 4.6% in 2005/6. The Office for Criminal Justice Reform in the Ministry of Justice is working to ensure agencies collect the data they need to enable more effective ethnic monitoring. Providing detailed statistics on the experiences of BME communities in our Criminal Justice System is an essential step towards ensuring justice for all.
Table A: Proportion (%) of ethnic groups at different stages of the criminal justice process, England and Wales, 2005/6
Ethnicity
Unknown/ White Black Asian Other not recorded Total
General population (aged ten and over) @ 2001 census 91.3 2.8 4.7 1.2 0.0 100
Stops and searches(1) 72.2 15.4 7.9 1.6 2.9 100Arrests(2) 83.8 9.1 5.1 1.3 0.6 100Cautions(2) 83.5 6.3 4.5 1.4 4.4 100Youth offences(4) 87.6 6.0 3.2 0.3 2.8 100Tried at Crown Court(3) 76.3 12.6 7.3 3.9 * 100Prison population(4)(5) 75.5 15.6 6.8 1.3 0.9 100
Note: Figures may not add to 100% due to rounding.(1) Stops and searches recorded by the police under section 1 of the Police and Criminal Evidence Act 1984 and other legislation.(2) Notifiable offences.(3) Information on ethnicity is missing in 19% of cases; therefore, percentages are based on known ethnicity.(4) To make the data in this row consistent with the rest of the table the proportion for Mixed has been excluded because this information
is not available for stops and searches, arrests, cautions and Crown Court.(5) Sentenced.
Specific Findings
Victims and Homicide
l The latest British Crime Survey (BCS) estimates that there were around 139,000 racially motivated incidents in 2005/06. This compares with a total of 179,000 incidents reported by the 2004/05 BCS.
1 For ease of interpretation, all percentages presented in this summary have been rounded.
Section 95
x
l However, as with most crime, the majority of racial incidents are not reported to the police. During 2005/06 60,407 racist incidents were recorded by the police, a rise of 4% over 2004/05. There were 41,382 racially or religiously aggravated offences in 2005/06, a 12% increase from the previous year (37,028 in 2004/05). Well over half (62%) of these were offences of harassment. The clear-up rate for racially or religiously aggravated offences has improved over the last three years (34% in 2003/04, 37% in 2004/05, and 38% in 2005/06).
l The police recorded 2,327 homicides in the three-year period ending 2005/06. Ten per cent of homicides in 2005/06 were of Black people, 7% of Asian people and 4% of ‘Other’ minority ethnic groups. Black victims (28%) were more likely to be shot compared with Asian (10%) and White (5%) victims. Twenty-three homicides were recorded as being racially motivated over the three-year period.
Section 1 PACE: Stop and Search
l The police recorded 878,153 stop and searches under section 1 of the Police and Criminal Evidence Act 1984 and other legislation in 2005/6. This is an increase of over 3% on 2004/5, and is the highest figure since 1998/9. Of the searches carried out in 2005/6, 15% were of Black people, 8% of Asian people and 2% of people of ‘Other’ ethnic origin.
l Relative to the general population, Black people were seven times more likely to be stopped and searched under these powers than White people, a higher rate than 2004/5, when Black people were six times more likely to be stopped and searched than White people. Asian people were twice as likely to be stopped and searched than White people, a similar rate to the previous year. The main reason for conducting a stop and search under these powers across all ethnic groups was for drugs, as was the case in 2004/5.
l Changes in the relative proportions of Black and White people stopped and searched from 2004/5 to 2005/6 appear to be due, at least in part, to changes amongst some police forces in relation to the use of stop and search powers. Because London has the largest number of Black residents, the Metropolitan Police conduct over 75% of all stop and searches of Black people in England and Wales. Between 2004/5 and 2005/6, despite an 18% increase in the numbers of people stopped and searched in the Metropolitan Police area, disproportionality remained relatively stable; Black people were around 4.5 times more likely to be stopped and searched than White people. However, some police forces outside London significantly reduced the total number of stop and searches they conducted between 2004/5 and 2005/6. Among some of these forces, although the number of White persons stopped and searched has reduced, the numbers of Black people stopped and searched has not changed by a similar proportion. This relative difference is partly responsible for the overall increase in disproportionality.
Arrests and Cautions
l In 2005/06 1,429,785 arrests for notifiable offences took place, an increase of just under 6% on the previous year. Of these arrests, 9% were recorded as being of Black people, 5% Asian and 1% ‘Other’ ethnic origin. Compared with 2004/05, the number of arrests of Asian people increased by 11% and for Black people by 10%.
l Relative to the general population, Black people were 3.5 times more likely to be arrested than White people (compared with 3.4 times more likely the previous year). There were variations across forces in the proportions of individuals from different ethnic groups being arrested for specific types of offence.
Section 95
xi
l The police cautioned 285,116 persons for notifiable offences in 2005. Of these, 6% were recorded as Black people, 4% Asian and 1% of ‘Other’ ethnic origin.
l There was a lower use of cautioning for Black offenders relative to arrests (14%) compared with White offenders (20%).
Prosecutions and Sentencing
l The Crown Prosection Service (CPS) has undertaken an Equality and Diversity Impact Assessment of statutory charging covering nearly 560,000 cases in the 12 months April 2005 to March 2006, during which statutory charging was extended to all areas of England and Wales. Its main purposes are to assess the impact of statutory charging and discover if charging decisions vary with the gender, ethnicity and age of the suspect, and, when charged, the type of offence with which suspects are charged. The impact assessment revealed no variation of charging decision by the main ethnic group of the suspect except White suspects (25%) are slightly more likely to receive a decision to make no prosecution on evidential grounds compared to non-White suspects (for example, Black, Mixed or Other suspects, all lower at around 18-20%).
l Ethnicity was recorded in only 20% of the magistrates’ court data supplied to the Home Office for cases in England and Wales for 2005 – compared with 19% in the previous year. Combining information collected from five police force areas on magistrates’ court decisions in 2005 shows that, excluding those defendants committed to the Crown Court for trial, 60% of White, 50% of Black and 42% of Asian defendants were convicted.
l In 2005 ethnicity was recorded in 81% of the Crown Court cases, up from 78% in the previous year. Combining data from the 16 police force areas with the most complete data, a greater proportion of White defendants (75%) were found guilty than Black (70%) or Asian (67%) defendants. However, custodial sentences were given to a greater proportion of Black offenders (68%) and those in the ‘Other’ category (73%) than White (58%) or Asian offenders (60%).
Youth Offending
l In 2005/6 there were 301,860 offences involving young offenders. Of these 85% of offenders identified themselves as White, 6% as Black, 3% as Asian, 3% as Mixed and 0.3% as Chinese or other. Of the 94,535 pre-court decisions 88% involved White people, 4% Black people, 3% Asian people, 2% Mixed and 0.3% Chinese or Other while the overall number of pre-court decisions increased by 11% from 2004/5. For pre-court disposals, people of Mixed ethnicity were more likely to attract a final warning and intervention than people of other ethnic groups. Offences committed by Black young offenders were more likely to attract a custodial sentence when compared to offences committed by other ethnic groups.
Probation
l Black offenders accounted for 6% of those commencing court orders, followed by Asian (5%), Mixed (2%), and Chinese or ‘Other’ offenders (1%). There is however great variation across probation areas and this reflects the ethnic composition of the resident population.
l For England and Wales in 2005 a higher proportion of members of Black and Minority Ethnic (BME) groups started pre- or post-release supervision by the National Probation Service (20%) compared with court order supervision (14%). Black and Asian offenders accounted for 9% and 6% of the total respectively.
Section 95
xii
Prisons
l In June 2006, members of BME groups accounted for 26% of the male prison population and 28% of the female population (including foreign nationals). For British Nationals, the proportion of Black prisoners relative to the population was 7.3 per 1,000 population compared to 1.3 per 1,000 for White persons. In contrast, people from ‘Chinese or other’ ethnic backgrounds were least likely to be in prison with a rate of 0.4 per 1,000 population. The rate for people from Asian groups was higher than for White persons but lower than that for the Mixed or Black groups i.e. 1.7 per 1,000 population.
l For adult prisoners, 59% of the Black offenders, 55% of the Chinese/Other groups, and 51% of the Asian prisoners were serving a sentence of four years or more compared with 47% for both White and Mixed group prisoners.
Complaints
l The police recorded 26,880 complaints in 2005/6; 7% of complaints made against the police were from Black people, 5% from Asian people and 1% from ‘Other’ minority ethnic groups.
Deaths in Police Custody
l In 2005/6, five of the 28 deaths of people who had been arrested or otherwise detained by the Police involved people from BME groups.
Practitioners in the Criminal Justice System
l In most criminal justice agencies there have been increases in the employment of people from BME groups in recent years. The Prison Service has met it’s representation targets for 2005 of 4.4%.
l There was large variation amongst CJS agencies in the proportion of BME staff employed. The Serious Fraud Office and Youth Offending Teams had the highest BME representation at 22% and 17% respectively. In contrast, the lowest proportion of BME members was noted amongst members of the Judiciary which had only 3% representation from the BME community. Moreover, the majority of this group were employed at the levels of District Judge and Recorder. There are no Lord Justices of Black or other minority ethnic membership.
Section 95
1
Chapter 1: Introduction
Section 95 of the Criminal Justice Act 1991 requires the Secretary of State to publish such information as he considers expedient in order to enable those involved in the Criminal Justice System to become aware of the financial implications of their decisions, or to avoid discrimination on grounds of race, sex or any other improper grounds. The Home Office has published a series of documents since 1992 on the issue of race within the Criminal Justice System under these requirements. This report, now under the auspices of the Office for Criminal Justice Reform in the Ministry of Justice continues the series. It brings together statistical information on the representation of Black and Minority Ethnic groups as suspects, offenders and victims within the Criminal Justice System and on employees within the Criminal Justice agencies.
Every effort is made to ensure that the figures presented are accurate and complete. However, it is important to note that these data have been extracted from large administrative data systems generated by the courts, police forces and other agencies. As a consequence, care should be taken to ensure data collection processes and their inevitable limitations are taken into account when those data are used.
The basic statistical information in this document should be considered in conjunction with research reports that are now available on related issues. Most of these reports are now published on websites such as the Home Office website, http://www.homeoffice.gov.uk/rds/index.htm, the Crown Prosecution Service website, http://www.cps.gov.uk, the Ministry of Justice Website, http://www.justice.gov.uk/ and the Youth Justice Board Website, www.yjb.gov.uk. In addition, the Department for Constitutional Affairs website contains archived information prior to 9th May 2007, http://www.dca.gov.uk.
Information in this publication is presented in a variety of ways:
a) Tables covering all police force areas or equivalents for courts and prisons.
b) Detailed tables for the ten police force areas with the highest Black and Minority Ethnic population (Bedfordshire, Greater Manchester, Hertfordshire, Lancashire, Leicestershire, Metropolitan, Nottinghamshire, Thames Valley, West Midlands and West Yorkshire). Just over three-quarters of the Black and Minority Ethnic population of England and Wales live in these police force areas.
c) Where data collection is still being developed, the tables cover those areas able to supply information. For example, for magistrates’ courts information is shown for the five police force areas with most complete ethnicity data (Dorset, Lancashire, Leicestershire, Northamptonshire and Northumbria).
d) Some summary tables for England & Wales as a whole, for example, practitioners.
Publication of this report will be followed by publication of a companion document, which will present an overview of the information presented here, as well as how it relates to other social indicators. Both the companion document and this report are available on the following website:
http://www.justice.gov.uk/publications/publications.htm
Section 95
2
The Race Relations Act 1976 as amended by the Race Relations (Amendment) Act 2000 gives public authorities a statutory general duty to eliminate unlawful discrimination and promote race equality and good race relations. The Act requires authorities to take account of and monitor the impact of services and policies on ethnic minorities. Further information and guidance for criminal justice agencies is available at: http://www.cre.gov.uk/duty/grr/cj.html.
The population figures used in this report were derived from the 2001 Census which showed that nationally 2.8% of the general population were Black, 4.7% Asian and 1.2% of ‘Other’ minority ethnic group. The Census also provided statistics on the ethnic populations for each police force area. These population estimates replaced those used in earlier reports, which were based upon the 1991 Census and the annual Labour Force Survey. Absolute populations for each ethnic group were calculated using these proportions and the annual mid-year estimates for each police force area produced by the Office for National Statistics (ONS). In September 2007 the ONS revised mid-year population estimates for 2002 to 2006. At the time of compiling this report, revised mid-year 2004 and 2005 population estimates were not available. Further information on population estimates is available at: http://www.statistics.gov.uk. Guidance on the collection and classification of ethnic group statistics is available at: http://www.statistics.gov.uk/about/ethnic_group_statistics/.
The use of resident population figures in some tables in this report need to be treated with caution. This is because police records show the area in which persons are, for example, stopped or arrested, rather than where they reside. The two do not necessarily correspond and this is particularly the case for the City of London Police. For this reason, in many tables in this report the figures for City of London police have been amalgamated with the Metropolitan police force area and treated as one.
Data are presented in terms of calendar and financial years and other periods, reflecting the reporting cycles and data collection of the agencies contributing information for this publication.
Revisions
Statistics are by their nature subject to error and uncertainty. Initial estimates are often systematically amended to reflect more accurate and complete information provided by data suppliers. Where any revisions have been made to previously published data, it is noted at the foot of the relevant tables in this report.
Section 95
3
Chapter 2: Developments in ethnic monitoring
This chapter outlines developments in ethnic monitoring within the Criminal Justice System (CJS). Some further detail is contained in subsequent chapters.
For thirty years, those concerned with improving race relations have stressed the need to collect accurate information about the ethnicity of people in contact with the CJS as well as the need to supplement such data with more detailed research. The principle of ethnic monitoring is accepted by all parts of the CJS in England and Wales. However progress can be affected by the lack of national IT systems in some agencies, and the success or otherwise in disseminating information regarding changes in requirements for ethnic monitoring to the relevant people in their organisations.
The final section of this Chapter describes the programme of work currently being undertaken by the Office for Criminal Justice Reform (OCJR) to improve the statistics currently published on race and the CJS under section 95 of the Criminal Justice Act 1991.
Race Relations (Amendment) Act 2000
All criminal justice agencies have a statutory duty to eliminate unlawful discrimination, and to promote race equality and good race relations under the Race Relations (Amendment) Act 2000. The act requires agencies to establish Race Equality Schemes and also to monitor progress in relation to these schemes. Further information is contained in the sections below.
Prisons
The first comprehensive BME monitoring system introduced into the CJS was for the prison population, with the first data published in 1986; it showed a level of representation well above the general population levels. The data collected were determined by a combination of self-assessment by the prisoner and observation by a prison officer. The categories used were similar to those used in official surveys such as the European Union Labour Force Survey.
From 1992 to February 2003 the nine-point 1991 Census classification system was used to collect information on the ethnicity of prisoners. Information based on this ethnic breakdown of the prison population has been published annually since 1993. Since 1993 the nationality of prisoners has also been collected. Since March 2003 all prisoners received into a penal establishment for the first time, and existing prisoners transferred to another establishment, have been asked to self-classify their ethnicity using the 2001 Census 16 +1 categories (16 ethnicity categories plus the ‘Not stated’ category). Prisons now record the ethnicity of virtually all prisoners using this classification system.
The Agenda for Change document released jointly by HM Prison Service and the Commission for Racial Equality, includes an aim to “ensure functional capability is built into new IT systems for prisoner management and personnel management, to enable effective data collation and analysis to support monitoring of impact of policies on Black and Minority Ethnic prisoners and staff” (HMPS and CRE, 2003). The Service has identified which current legacy systems are in place to establish what information is being collected and in which format. Monitoring arrangements are being extended to meet the requirements of the joint CRE/Prison Service Action Plan and the Race Relations (Amendment) Act 2000.
Section 95
4
Probation
The Probation Service was the second criminal justice agency to introduce systematic monitoring, in October 1992. All staff and those supervised by the service were included. Offenders were required to tick a box (Black, White, ‘Other’ (please specify) or Refused) and answer the question, “Where would you say your ethnic group comes from?’’ selecting from the list of countries provided. The results were mapped to the 1991 Census ethnic groupings or the 4-point Home Office system of ethnic classification.
After an initially good start, the proportion of ethnic data missing rose substantially from the mid-1990s. Figures were consequently omitted from the 1999 and subsequent statistical publications on race and the CJS. The transition to the use of the 2001 Census categories led to more technical problems, with many probation areas unable to supply ethnic data because of changes required to IT systems. These problems have been resolved, for court order commencements, where national and area level information is published, and is improving for commencements of pre and post release licence supervision, where information has been published for those areas with sufficiently complete data. Probation Circular 60/2004, issued on 30 December 2004, asks all Probation Boards to examine their ethnicity monitoring data and have an action plan in place to improve their performance in this respect.
Police
Section 95 of the Criminal Justice Act 1991 led to new measures to establish consistent ethnic monitoring within the police service.
Following discussions with the Association of Chief Police Officers (ACPO) and Her Majesty’s Inspector of Constabulary (HMIC) the Home Office wrote to all Chief Constables in England & Wales confirming April 1996 as the start date for mandatory ethnic monitoring in all police force areas. During 1995/96 thirty-nine forces were able to fully or partially begin data collection. The areas of police activity monitored initially were: stop and searches, arrests, cautions and homicides.
The classification was based upon the police officer’s visual perception of the ethnic appearance of the suspect/victim, using four categories (White, Black, Asian and ‘Other’). This was compatible with the fuller classification used in the 1991 Census and elsewhere. Asian in this context covers those of Indian, Pakistani or Bangladeshi origin. Home Office consultations revealed it would not be practicable at that time to use a wider classification system or for the police officers to ask suspects or victims to classify themselves. It was also agreed that police forces should undertake ethnic monitoring of all deaths in police custody from 1 April 1996 (Cotton and Povey, 1997).
From 1 April 1999 all police forces were asked to provide information on notifiable arrests by ethnic appearance, gender, age and offence group. From 1 April 2003, in addition to the visual assessment using the 4-point classification, it has been mandatory for all police forces to record ethnicity by self-assessment by the suspect using the 16-point classification used in the 2001 Census.
Crown Prosecution Service (CPS)
Following implementation of new IT systems, the CPS now has the capacity to record the ethnicity of all defendants in all proceedings and to identify the outcomes for each of the ethnic groups recorded. However, the CPS are reliant on ethnicity data collected by the police.
Section 95
5
The CPS has undertaken an Equality and Diversity Impact Assessment of statutory charging covering nearly 560,000 cases in the 12 months April 2005 to March 2006, during which statutory charging was extended to all areas of England and Wales. Its main purposes are to assess the impact of statutory charging and discover if charging decisions vary with the gender, ethnicity and age of the suspect, and, when charged, the type of offence with which suspects are charged. This assessment has been prepared so that the CPS can fulfil an obligation under the statutory gender and race equality duties and as part of its commitment to monitoring its key services for potential adverse impact. The results of this assessment are included in Chapter 6 of this report.
Courts
It is not always practical for court staff to collect ethnic data whilst a case is in progress. If a case is discontinued or withdrawn, court staff may not have contact with the suspect to assist in finding out their ethnicity. An alternative approach was adopted based upon the transfer of data on the ethnic classification of suspects from the police to the magistrates’ court and in turn for this information to be passed by magistrates’ court staff to the Crown Court.
For magistrates’ courts, data on all court appearances are sent to the Ministry of Justice2 either through direct data transfer from the court's computer or through returns completed by police forces. Because of the variety of IT systems used in courts the Home Office initially only received data with an ethnic marker from courts using the ICL system (and Equis in Northamptonshire). Data were first published for 1999 for 4 police force areas; 5 areas are included for 2005. Ethnicity was recorded in 20% of the magistrates’ court data for England and Wales supplied to the Home Office for 2005, 1% up on 2004. Further expansion will depend upon the introduction of the LIBRA system, a single magistrates’ court IT system which will include the ability to record both the visual and self-assessment ethnicity of the defendant.
At the Crown Court the presence of a national IT system (CREST) has made monitoring easier. All Crown Court centres were asked to include information on ethnic origin on all new cases received from October 2001 based upon information supplied by the police included in case papers. The CREST system has been amended to accept both 4-point and 16-point classifications. Data were received on the ethnicity of 81% of all persons tried at the Crown Court in 2005, up from 78% the previous year. Information from 16 Crown Court centres was sufficiently complete to allow publication; the same number of areas as last year.
Ongoing work to improve the completeness of the data on court proceedings is outlined in the final section of this chapter.
Youth Justice Board (YJB)
Youth Offending Teams use the 16-point ethnic classifications from the 2001 census to monitor the ethnicity of young offenders dealt with. These are amalgamated into five categories for reporting to the YJB, and for presentation in this report, i.e. White, Mixed, Black, Asian, and Chinese and other (see Appendix B). Outcomes measured include offences committed by young people, remand decisions made and sentences given.
In 2004/05, the YJB introduced a performance indicator on race equality, that is ‘All Youth Offending Teams should have an action plan in place to ensure that any difference between the ethnic composition of offenders in all pre-court and post court disposals and the ethnic composition of the local community is reduced year on year’. As part of this development, the YJB began collecting data on numbers of offenders
2 Prior to May 2007, data were sent to the Home Office.
Section 95
6
(having previously collected only numbers of offences) broken down by ethnicity, and has reported back to YOTs on the 2006/07 data compared with 2005/06.
Further information on data from Youth Offending Teams is contained in the Youth Justice Annual Statistics 2005/06 (available at http://www.yjb.gov.uk/en-gb/practitioners/MonitoringPerformance/AnnualStatistics/). Regional statistics are also available at this web link. For research on how minority ethnic young people are dealt with at all stages of the youth justice process, compared with White young people, please see Feilzer, M & Hood, R., 2004.
Racist incidents/crimes
Information on racist incidents is collected annually by HMIC from all police forces on the basis of a common and accepted definition: “A racist incident is any incident which is perceived to be racist by the victim or any other person” (as recommended by The Stephen Lawrence Inquiry in 1999).
On 30 September 1998, the Crime and Disorder Act 1998 introduced new racially aggravated offences covering assault/wounding, criminal damage and harassment. These offences are monitored as part of the standard criminal statistics returns. Religiously aggravated offences have been included with racially aggravated offences in recorded crime figures since 2001.
CPS staff gather information on cases that the police have identified as racist incidents as defined by the Stephen Lawrence Inquiry criteria and also on those cases that their staff consider meet the criteria but have not been so identified by the police. From 1 April 1999, the CPS has additionally monitored racially aggravated offences and since December 2001 has collected statistics on religiously aggravated offences.
Since 1988 the British Crime Survey (BCS) has included a question on the ethnicity of respondents and provides the main measure of racist crime. Ethnic boosts have been used to increase the accuracy of findings for Black and Minority Ethnic groups. The 16-point classification was first used for the 2001/02 sweep of the Survey.
Human resources
Monitoring of staff resources has been introduced by all criminal justice agencies. The data presented in this report are a mixture of both visual and, increasingly, self-assessment. There are some issues regarding the correct interpretation of the 16-point classification and its implementation. Although there has been an improvement this year, some agencies still have further progress to make in reducing the amount of information recorded as unknown.
Census 2001 classification
The Stephen Lawrence Inquiry, the Race Relations (Amendment) Act 2000 and the 2001 Census have all been stimuli for wider and improved monitoring of Black and Minority Ethnic groups. Ministers agreed that this should be based throughout the CJS upon self-assessment and the 16-point census categories. The date for implementation was set as 1 April 2003. The aim of this was to provide a single common system for collecting ethnic data in all agencies, consistent with the demographic information available from the Census.
Progress towards implementing the collection of ethnicity statistics using the 16+1 classification has occurred at different rates and with differing degrees of accuracy across CJS agencies. Work continues to
Section 95
7
improve the position (see below for example). This report mainly uses the 4+1 classification system, as this is more robust for the time period covered. Where quality allows condensed 16+1 data has been used.
Developing Statistics on Race and the Criminal Justice System
The statistics published under section 95 of the Criminal Justice Act 1991 are one of the main sources of information available on race and the CJS. However they have developed incrementally. Following an independent review of the data currently collected, OCJR is leading a programme of work to improve the statistics published on race and the CJS. To ensure that the programme of work addresses the diverse needs of the data users OCJR held a twelve week consultation exercise during autumn 2006 with a range of stakeholders including community groups, practitioners, policy makers and academics.
To address both national and local needs, there was a consensus that OCJR should take forward a national programme to equip local areas with the tools to collect better ethnicity data and support Local Criminal Justice Boards (LCJBs) to take a strategic lead in using and promoting information about their local areas. A key part of this work is the development of a Minimum Dataset (MDS) which will map out clearly for the first time the management data that needs to be collected to performance manage the CJS in relation to race.
The primary aim of the MDS is to enable practitioners and policy makers to;
l Identify disproportionality3 in the CJS;
l Begin to understand the causes of disproportionality;
l Performance manage the CJS in relation to race issues;
l Demonstrate accountability to BME communities
The Minimum Dataset will operate as a specification of the ‘minimum’ data that different CJS agencies need to collect on race and the CJS and will be accompanied by guidance on data collection and quality assurance. The development of the draft MDS and data collection guidance is already underway, and the piloting of the draft dataset is scheduled to begin later this year, with the final dataset and data collection guidance expected to be completed at the beginning of the financial year 2008/09.
Further background to this work can be found using the following links:
The ‘Root and Branch Review of Race and the CJS Statistics: Final Report’ (April 2005)http://www.cjsonline.gov.uk/downloads/application/pdf/Section%2095%20statistics:%20root%20and%20branch%20review.pdf
The Government’s response to the Root and Branch Review: http://www.cjsonline.gov.uk/downloads/application/pdf/Section%2095%20statistics:%20developing%20statistics%20that%20drive%20change.pdf
The table of the review’s recommendation and the Government’s response:http://www.cjsonline.gov.uk/downloads/application/pdf/Section%2095%20statistics:%20response%20to%20recommendations.pdf
3 The term disproportionality, is meant here to mean the imbalance between the proportion of members of BME communities in the general population compared with their level of representation in different parts of the CJS.

Section 95
8
Additionally, OCJR, with colleagues in Her Majesty’s Courts Service (HMCS) have recently initiated work to improve the completeness of ethnicity data on court proceedings. Work has commenced to understand and, where appropriate, develop the business processes involved. Dependent on the findings of this work, the current aim is to have processes in place before the start of data collection for the 2008/09 financial year.

Section 95
9
Chapter 3: Victims and Homicide
Introduction
People seek the services of criminal justice agencies for various reasons. The most obvious is to notify the police of a crime. This chapter looks at the experience of victimisation with particular reference to racist incidents, racially and religiously aggravated offences – including the number of persons cautioned or prosecuted - and homicide. Wherever possible the latest findings from the British Crime Survey (BCS) and other sources have been reported.
Victimisation
The BCS is a large-scale face-to-face household survey asking about people’s experience and perceptions of crime in the last 12 months in England and Wales. It also records, amongst other issues, whether a victim of crime perceived it to be racially motivated.
Since peaking in 1995, BCS crime has fallen by 42 per cent and the risk of becoming a victim of crime has fallen from 40 per cent to 24 per cent based on the 2006/07 BCS (Nicholas et al., 2007). However, risk of victimisation varies by ethnic group. The 2005/06 BCS showed that people from Mixed and Asian ethnic backgrounds (31% and 26% respectively) had a higher risk of becoming a victim of crime (any BCS crime) than people from White (23%), Black (22%) or Chinese and Other (21%) ethnic backgrounds. There were no statistically significant changes in the risk of victimisation for any of the ethnic groups since 2004/05 (Home Office, 2007).
It should be noted that differences in the risk of victimisation between ethnic groups may be at least partly attributable to factors other than ethnicity. Based on the latest figures, the Mixed ethnic group appear to be the group most at risk of crime. This is consistent with previous research (Jansson, K. 2006; Salisbury and Upson, 2004). Analysis of the 2004/05 BCS indicated that ethnicity was not independently associated with risk of victimisation for either personal or all violent incidents. Instead other factors; age and sex, frequency of visiting pubs or bars, living in an area with high levels of perceived anti-social behaviour and marital status were the strongest predictors of risk of victimisation (Jansson K., 2006). The analyses indicated that the differences between the Mixed and other ethnic groups reflect differences in the socio-demographic profiles of the groups rather than ethnicity. In particular the proportion of young people in the mixed ethnic group is large in comparison to other ethnic groups and young people are at a higher risk of victimisation (Nicholas et al., 2007; Walker et al., 2006).
The 2005/06 BCS showed that people in BME groups were significantly more likely than White people to be worried about burglary, car crime and violent crime. Levels of worry about all crime types were lower among people from Mixed ethnic backgrounds compared to other BME groups. Worry about violent crime decreased among people from Mixed and Chinese and Other backgrounds while it increased among people from White ethnic backgrounds between 2004/05 and 2005/06 (Home Office 2007).

Section 95
10
Definitions of Racist Incidents and Crimes
All police forces have collected information on racist incidents from 1986 on the basis of a common definition that covered:
Any incident in which it appears to the reporting or investigating officer that the complaint involves an element of racial motivation; or any incident which includes an allegation of racial motivation made by any person.
(ACPO 1985)
This definition was changed in 1999 when the police adopted the proposed definition from the report of the Stephen Lawrence Inquiry:
A racist incident is any incident which is perceived to be racist by the victim or any other person.(Macpherson 1999)
It should be noted that incidents included here are wider than the normal definition of a crime in the published crime statistics and include general threatening behaviour.
Sections 28 to 32 of the Crime and Disorder Act 1998 introduced into law the concept of specific racially aggravated offences. The provisions came into effect on 30 September 1998. They were further extended to include religiously aggravated offences by section 39 of the Anti-terrorism, Crime and Security Act 2001, with effect from 14 December 2001.
An offence may be defined as racially or religiously aggravated if:
l at the time of committing the offence, or immediately before or after doing so, the offender demonstrates towards the victim of the offence hostility based on the victim's membership (or presumed membership) of a racial or religious group; or
l the offence is motivated (wholly or partly) by hostility towards members of a racial or religious group based on their membership of that group.
‘Membership’, in relation to a racial or religious group, includes association with members of that group. ‘Presumed’ means presumed by the offender.
Main Findings
Racist Incidents: Tables 3.1 - 3.4
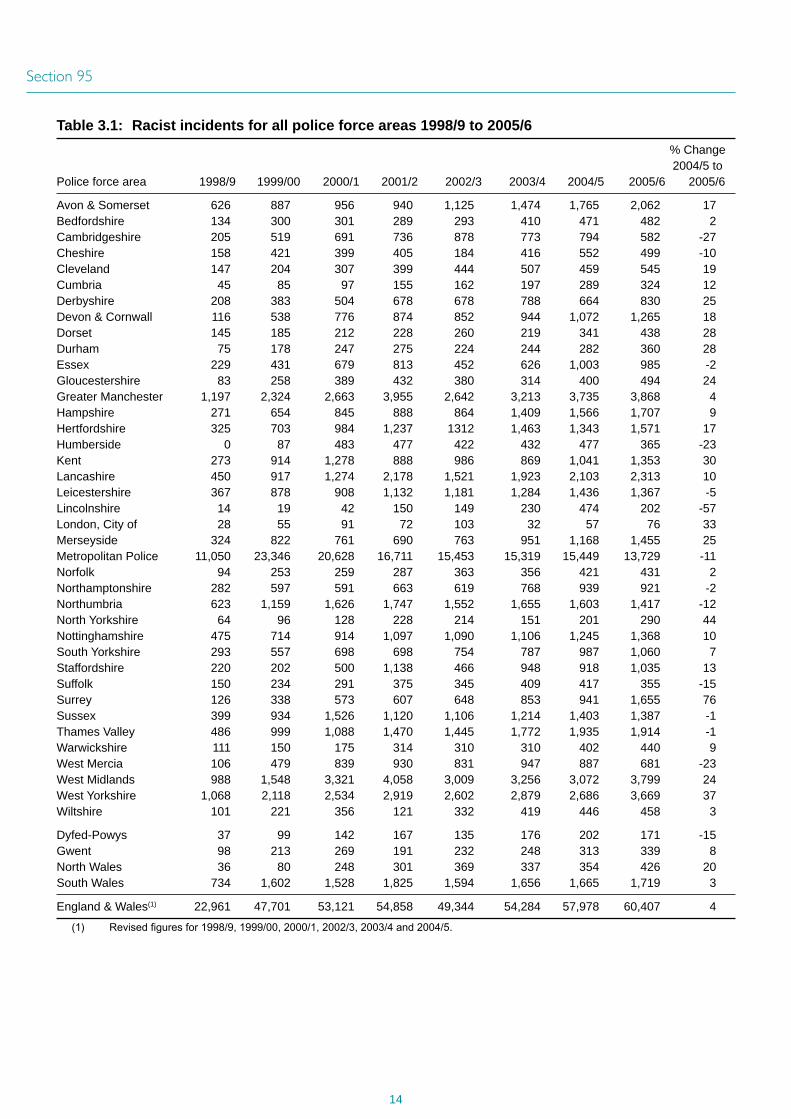
The overall number of racist incidents recorded by the police in England and Wales rose by 4% from 57,978 in 2004/5 to 60,407 in 2005/6 (Table 3.1). Two-thirds of forces registered an increase in the number of incidents. Changes recorded of more than 50% for either an increase or decrease were for relatively smaller forces.
Research from across the UK indicates that the majority of racist incidents recorded are either damage to property or verbal harassment (Maynard and Read, 1997; Clark and Moody, 2002; Jarman, 2002).
The British Crime Survey records people's experiences and perceptions of crime including whether victims of crime perceived the incident to be racially motivated. The number of racially motivated incidents was
Section 95
11
estimated at around 139,000 incidents based on 2005/06 BCS. This compares with 179,000 incidents based on the 2004/05 BCS and 206,000 incidents based on the 2002/03 and 2003/04 BCS combined (Jansson K., 2006).
The 2005/06 BCS found that the risk of becoming a victim of a racially motivated crime was low across all ethnic groups. Less than one per cent of the White population had been victims of racially motivated crimes compared with two per cent of people from Asian, Black and Chinese and Other ethnic backgrounds, and one per cent among people from Mixed ethnic backgrounds. The risk of becoming a victim of a racially motivated crime showed no change for any ethnic groups between 2004/05 and 2005/06 (Home Office, 2007).
On how victims perceived these crimes, there were clear differences between the White and BME populations in terms of the proportion of crimes that were thought to have been racially motivated, with a larger proportion of people from BME groups perceiving incidents as having been racially motivated compared with people from White backgrounds. One per cent of total BCS crimes where the victim was White were thought to be racially motivated, whereas the comparable figure was eight per cent for BCS crimes where the victim was from a BME group. op. cit.
There were also differences in the ethnicity of the offender for crimes experienced by white and BME victims. Where the victim was White, the offender (or one of the offenders if there was more than one), was White in 89% of crimes, Black in 10% of crimes, Asian in 6% and Chinese/Other in 3% of crimes. Where the victim was from a BME group, the offender or one of the offenders was White in 63% of crimes, Black in 37% of crimes, Asian in 18% and Chinese/Other in 5% of crimes. op. cit.
Racially and Religiously Aggravated Offences: Table 3.2
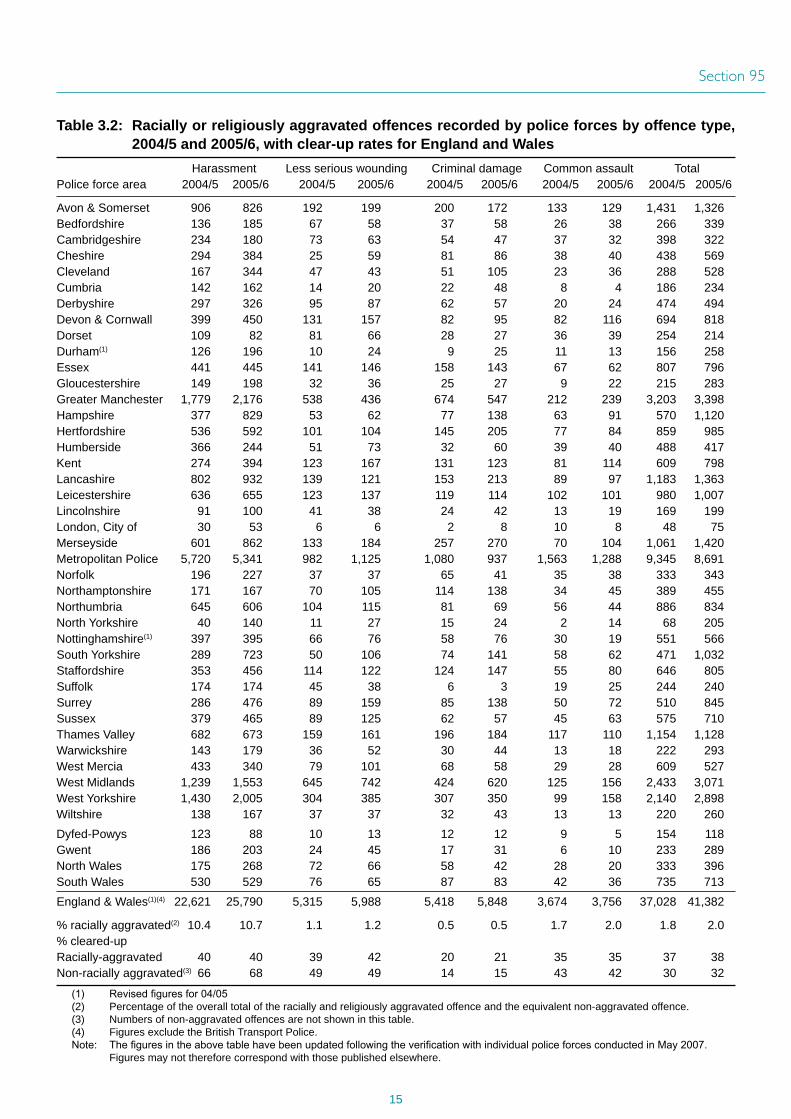
For England and Wales, the police recorded 41,382 racially or religiously aggravated offences in 2005/6. This represents a 12% increase from the previous year (37,028 in 2004/5). Of this total, 62% were for harassment, 14% less serious wounding, 14% criminal damage, and 9% common assault. This is a similar pattern to that recorded for the previous year (Table 3.2).
Police forces varied widely in the number and type of offences recorded. Overall, three-quarters of forces registered an increase in the number of racially or religiously aggravated offences. When compared with the total number of similar non-racially or religiously aggravated offences, 10.7% of harassment offences were recorded as racially aggravated, 2% of common assaults, 1.2% less serious wounding, and 0.5% criminal damage. These proportions were very similar to those recorded for the previous year.
In 2005/6 38% of racially or religiously aggravated offences were cleared up, compared to 32% of equivalent non-racially aggravated offences. For the violent crimes in Table 3.2, the clear-up rate for racially or religiously aggravated offences was lower than for the non-racially aggravated equivalents. The clear-up rate for racially or religiously aggravated harassment was 40%, compared to a 68% clear-up rate for the non-racially or religiously aggravated offence. Similarly, the figures for less serious wounding and common assault were 42% and 35% compared with 49% and 42% respectively for the non-racially or religiously aggravated equivalents. As with the previous year, it was only for criminal damage offences that the clear-up rate for racially or religiously aggravated offences (21%) was greater than that for non-racially or religiously aggravated equivalent (15%).
Section 95
12
The overall clear-up rate for racially or religiously aggravated offences increased by one per cent between 2004/5 and 2005/6.
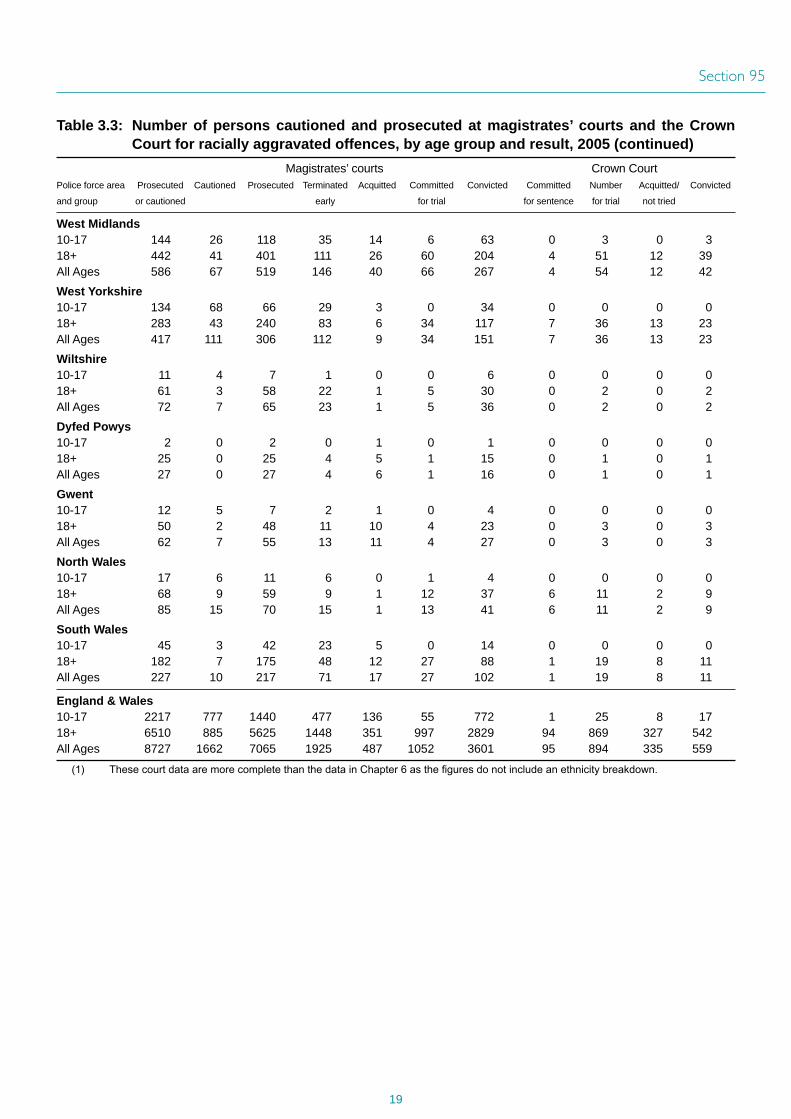
Court Data: Table 3.3
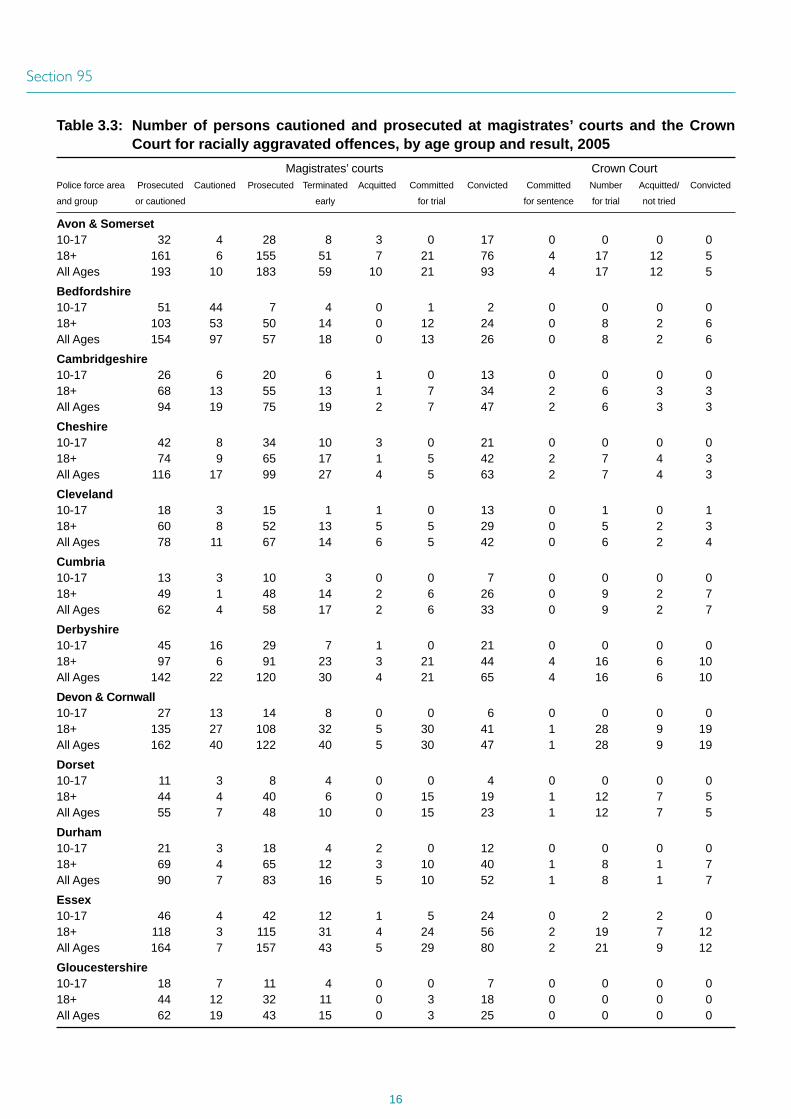
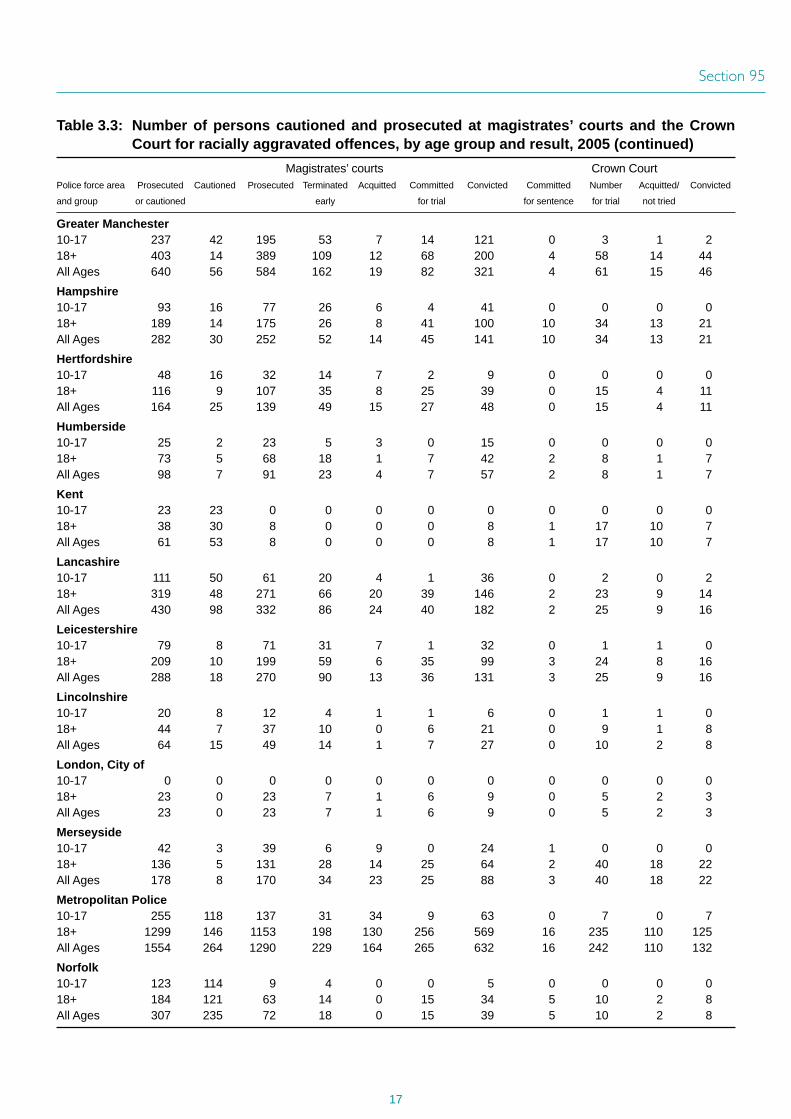
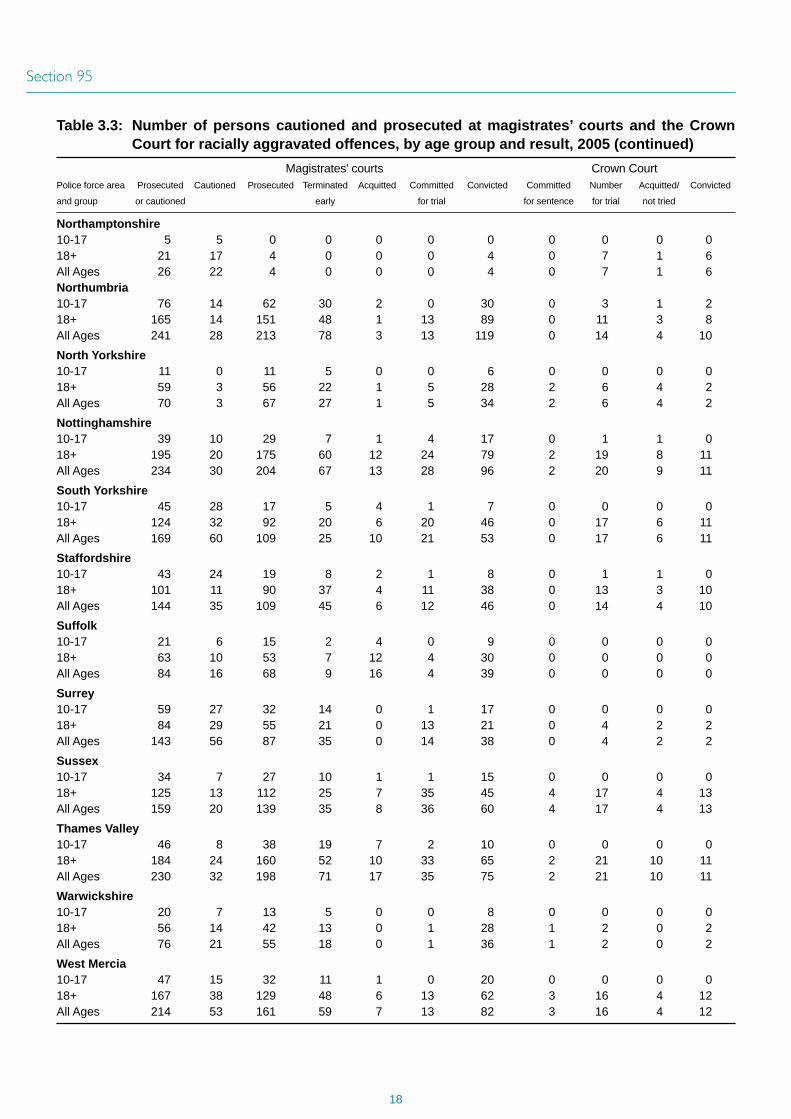
Table 3.3 shows the number of persons cautioned or prosecuted at courts for racially aggravated offences. These court data are more complete than figures presented later in Chapter 6 because the figures are not broken down by the ethnicity of persons.
A total of 8,727 persons were cautioned or prosecuted at magistrates’ courts for racially aggravated offences in 2005, a rise of 20% over the previous year. Of these cases, a quarter were aged less than 18 years (Table 3.3). Of the 7,065 persons proceeded against at magistrates’ courts in 2005, 3,601 were convicted. This conviction rate reflects a steadily rising proportion from 43% in 2003, 47% in 2004, to 51% for 2005. Similarly, the proportion of cases terminated early or acquitted has fallen from 38% in 2004 to 34% in 2005. A total of 1,052 persons were committed to Crown Court for trial.
Crown Court centres in England and Wales dealt with 894 defendants charged with racially aggravated offences in 2005. Of these, 559 were convicted (63% - up from 62% the previous year) and 335 (38%) were either not tried or acquitted.
The Crown Prosecution Service monitors prosecution decisions and outcomes in all cases identified by the police or CPS as arising from a racial incident. The CPS scheme, which adopts the Macpherson definition of a racist incident used in the Stephen Lawrence Inquiry, includes information about the specific racially aggravated offences charged under the Crime and Disorder Act 1998 as well as offences that could fall within Section 153 of the Powers of Criminal Courts (Sentencing) Act 2000, or Section 145 of the CJA 2003.
In 2005/6, there were 7,430 defendant cases identified as being racist incidents, an overall rise of 28% on 2004/5 (CPS 2006). Of these cases in 2005/6 the police had already identified 93% as being racist incidents, with the CPS identifying the remaining 7% (the respective proportions for the previous year were 91% and 9%). The CPS actually prosecuted 82% of these cases (CPS 2006).
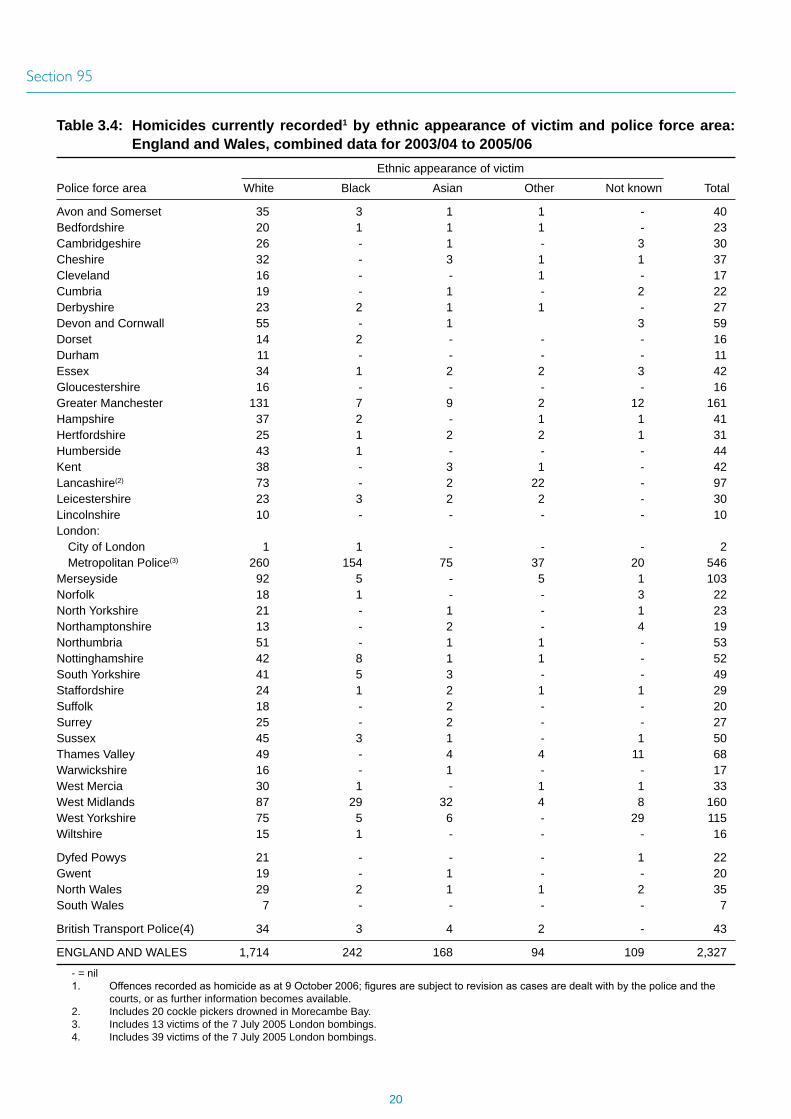
Homicide: Tables 3.4 – 3.7
The information presented in this section on homicide in England and Wales comes from two main sources: The Home Office Homicide Index (which contains records of the details of all offences reported as homicides) and summary information provided by the police in aggregate form as part of the routine quarterly returns on all offences recorded by the police.
Due to the small number of homicides recorded each year, the tables included in the report combine data for 2003/4 to 2005/6. Caution should nevertheless be exercised in drawing conclusions from these figures because the numbers remain small. Figures shown cover those cases currently recorded as homicide i.e. murder, manslaughter and infanticide, and exclude those cases where the offence has been re-classified following subsequent investigation or court decision.
In total, 2,327 homicides (including victims drowned in Morecambe Bay and the London bombings) were recorded by the police in the three years 2003/4 to 2005/6. Just under three-quarters of victims were White (74%), 10% were Black, 7% were Asian and 4% ‘Other’ (Table 3.4). In 5% of homicides the ethnicity of the victim was ‘Not Known’. The largest number of victims was recorded in the Metropolitan Police District
Section 95
13
with 546, followed by Greater Manchester with 161 and the West Midlands with 160. In the West Midlands, Greater Manchester and West Yorkshire, the number of Asian victims exceeded the number of Black victims. In contrast, the number of Black victims in Greater London was more than double the number of Asian victims (154 and 75 respectively).
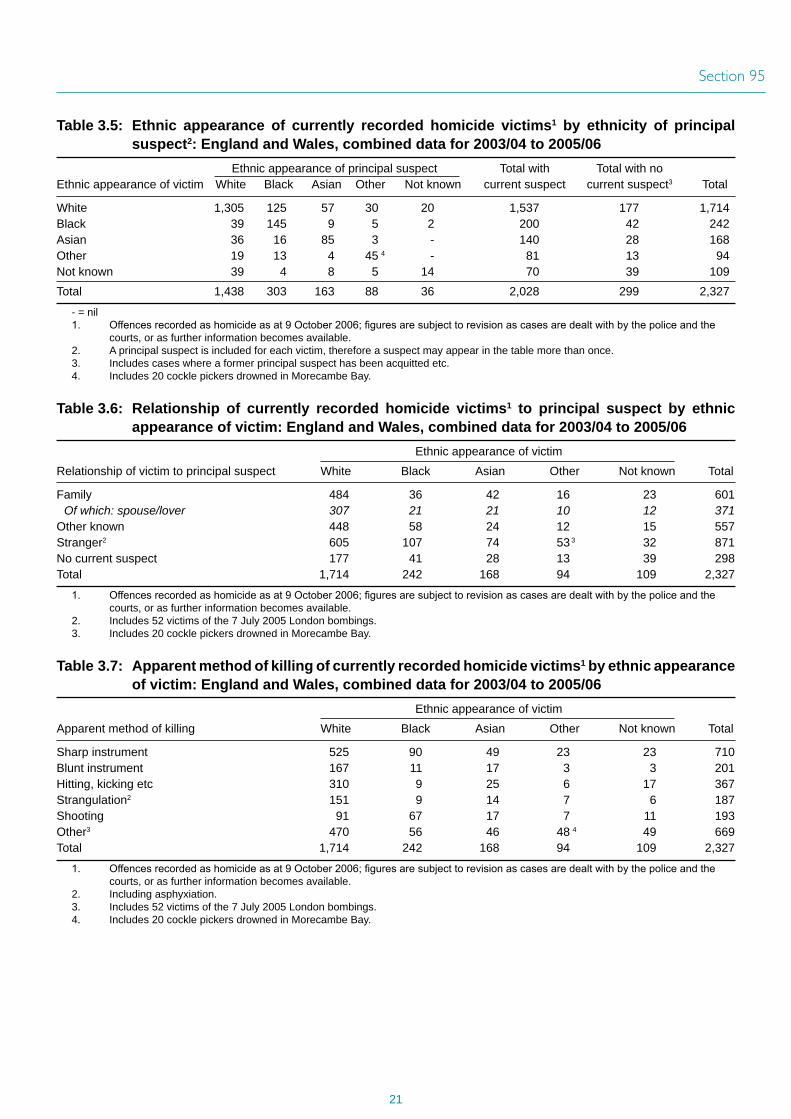
Table 3.5 shows the ethnic appearance of victims and the principal suspect (where it was known) for England and Wales. Of those cases with a current principal suspect, 85% of White victims were killed by suspects from the same ethnic group. The corresponding proportions of suspects from the same ethnic groups were lower for Black people (73%) and Asian people (61%). However it should be borne in mind that in 17% of cases involving Black victims, and 17% of cases involving Asian victims, there is no current suspect (see Table 3.6). For the period under review, 87% of all victims had an identified principal suspect. Some variation by ethnicity can be noted. Thus for White victims 90% of cases had an identified principal suspect, Black (83%), Asian (83%), and Other (86%).
In 50% of cases, the victims had been acquainted with the suspects (Table 3.6). Family members were the principal suspects in 28% of the cases for White victims, 25% for Asian victims and 15% for Black victims. Strangers as suspects accounted for 35% of White victims but 44% for both Black and Asian victims.
Overall as shown in Table 3.7, victimisation through the use of a sharp instrument was the most frequently reported method of killing recorded and accounted for 710 homicides. However, 28% of Black victims died from shooting, compared to just 5% of White victims. In contrast, both White and Asian victims were more likely to fall victim to Hitting/kicking (18% and 15% respectively) than Black victims (4%).
Over this three-year period, the police reported to the Home Office 23 homicides where there was a known racial motivation. Fourteen victims were White, six Asian and three Black. There were no current suspects identified for two of the White victims. It is possible that other homicides recorded in this three-year period and dealt with by the courts have been considered as being racially motivated.
Section 95
14
Table 3.1: Racist incidents for all police force areas 1998/9 to 2005/6
% Change 2004/5 toPolice force area 1998/9 1999/00 2000/1 2001/2 2002/3 2003/4 2004/5 2005/6 2005/6
Avon & Somerset 626 887 956 940 1,125 1,474 1,765 2,062 17Bedfordshire 134 300 301 289 293 410 471 482 2Cambridgeshire 205 519 691 736 878 773 794 582 -27Cheshire 158 421 399 405 184 416 552 499 -10Cleveland 147 204 307 399 444 507 459 545 19Cumbria 45 85 97 155 162 197 289 324 12Derbyshire 208 383 504 678 678 788 664 830 25Devon & Cornwall 116 538 776 874 852 944 1,072 1,265 18Dorset 145 185 212 228 260 219 341 438 28Durham 75 178 247 275 224 244 282 360 28Essex 229 431 679 813 452 626 1,003 985 -2Gloucestershire 83 258 389 432 380 314 400 494 24Greater Manchester 1,197 2,324 2,663 3,955 2,642 3,213 3,735 3,868 4Hampshire 271 654 845 888 864 1,409 1,566 1,707 9Hertfordshire 325 703 984 1,237 1312 1,463 1,343 1,571 17Humberside 0 87 483 477 422 432 477 365 -23Kent 273 914 1,278 888 986 869 1,041 1,353 30Lancashire 450 917 1,274 2,178 1,521 1,923 2,103 2,313 10Leicestershire 367 878 908 1,132 1,181 1,284 1,436 1,367 -5Lincolnshire 14 19 42 150 149 230 474 202 -57London, City of 28 55 91 72 103 32 57 76 33Merseyside 324 822 761 690 763 951 1,168 1,455 25Metropolitan Police 11,050 23,346 20,628 16,711 15,453 15,319 15,449 13,729 -11Norfolk 94 253 259 287 363 356 421 431 2Northamptonshire 282 597 591 663 619 768 939 921 -2Northumbria 623 1,159 1,626 1,747 1,552 1,655 1,603 1,417 -12North Yorkshire 64 96 128 228 214 151 201 290 44Nottinghamshire 475 714 914 1,097 1,090 1,106 1,245 1,368 10South Yorkshire 293 557 698 698 754 787 987 1,060 7Staffordshire 220 202 500 1,138 466 948 918 1,035 13Suffolk 150 234 291 375 345 409 417 355 -15Surrey 126 338 573 607 648 853 941 1,655 76Sussex 399 934 1,526 1,120 1,106 1,214 1,403 1,387 -1Thames Valley 486 999 1,088 1,470 1,445 1,772 1,935 1,914 -1Warwickshire 111 150 175 314 310 310 402 440 9West Mercia 106 479 839 930 831 947 887 681 -23West Midlands 988 1,548 3,321 4,058 3,009 3,256 3,072 3,799 24West Yorkshire 1,068 2,118 2,534 2,919 2,602 2,879 2,686 3,669 37Wiltshire 101 221 356 121 332 419 446 458 3
Dyfed-Powys 37 99 142 167 135 176 202 171 -15Gwent 98 213 269 191 232 248 313 339 8North Wales 36 80 248 301 369 337 354 426 20South Wales 734 1,602 1,528 1,825 1,594 1,656 1,665 1,719 3
England & Wales(1) 22,961 47,701 53,121 54,858 49,344 54,284 57,978 60,407 4
(1) Revised figures for 1998/9, 1999/00, 2000/1, 2002/3, 2003/4 and 2004/5.
Section 95
15
Table 3.2: Racially or religiously aggravated offences recorded by police forces by offence type, 2004/5 and 2005/6, with clear-up rates for England and Wales
Harassment Less serious wounding Criminal damage Common assault TotalPolice force area 2004/5 2005/6 2004/5 2005/6 2004/5 2005/6 2004/5 2005/6 2004/5 2005/6
Avon & Somerset 906 826 192 199 200 172 133 129 1,431 1,326Bedfordshire 136 185 67 58 37 58 26 38 266 339Cambridgeshire 234 180 73 63 54 47 37 32 398 322Cheshire 294 384 25 59 81 86 38 40 438 569Cleveland 167 344 47 43 51 105 23 36 288 528Cumbria 142 162 14 20 22 48 8 4 186 234Derbyshire 297 326 95 87 62 57 20 24 474 494Devon & Cornwall 399 450 131 157 82 95 82 116 694 818Dorset 109 82 81 66 28 27 36 39 254 214Durham(1) 126 196 10 24 9 25 11 13 156 258Essex 441 445 141 146 158 143 67 62 807 796Gloucestershire 149 198 32 36 25 27 9 22 215 283Greater Manchester 1,779 2,176 538 436 674 547 212 239 3,203 3,398Hampshire 377 829 53 62 77 138 63 91 570 1,120Hertfordshire 536 592 101 104 145 205 77 84 859 985Humberside 366 244 51 73 32 60 39 40 488 417Kent 274 394 123 167 131 123 81 114 609 798Lancashire 802 932 139 121 153 213 89 97 1,183 1,363Leicestershire 636 655 123 137 119 114 102 101 980 1,007Lincolnshire 91 100 41 38 24 42 13 19 169 199London, City of 30 53 6 6 2 8 10 8 48 75Merseyside 601 862 133 184 257 270 70 104 1,061 1,420Metropolitan Police 5,720 5,341 982 1,125 1,080 937 1,563 1,288 9,345 8,691Norfolk 196 227 37 37 65 41 35 38 333 343Northamptonshire 171 167 70 105 114 138 34 45 389 455Northumbria 645 606 104 115 81 69 56 44 886 834North Yorkshire 40 140 11 27 15 24 2 14 68 205Nottinghamshire(1) 397 395 66 76 58 76 30 19 551 566South Yorkshire 289 723 50 106 74 141 58 62 471 1,032Staffordshire 353 456 114 122 124 147 55 80 646 805Suffolk 174 174 45 38 6 3 19 25 244 240Surrey 286 476 89 159 85 138 50 72 510 845Sussex 379 465 89 125 62 57 45 63 575 710Thames Valley 682 673 159 161 196 184 117 110 1,154 1,128Warwickshire 143 179 36 52 30 44 13 18 222 293West Mercia 433 340 79 101 68 58 29 28 609 527West Midlands 1,239 1,553 645 742 424 620 125 156 2,433 3,071West Yorkshire 1,430 2,005 304 385 307 350 99 158 2,140 2,898Wiltshire 138 167 37 37 32 43 13 13 220 260
Dyfed-Powys 123 88 10 13 12 12 9 5 154 118Gwent 186 203 24 45 17 31 6 10 233 289North Wales 175 268 72 66 58 42 28 20 333 396South Wales 530 529 76 65 87 83 42 36 735 713
England & Wales(1)(4) 22,621 25,790 5,315 5,988 5,418 5,848 3,674 3,756 37,028 41,382
% racially aggravated(2) 10.4 10.7 1.1 1.2 0.5 0.5 1.7 2.0 1.8 2.0% cleared-up Racially-aggravated 40 40 39 42 20 21 35 35 37 38Non-racially aggravated(3) 66 68 49 49 14 15 43 42 30 32
(1) Revised figures for 04/05(2) Percentage of the overall total of the racially and religiously aggravated offence and the equivalent non-aggravated offence.(3) Numbers of non-aggravated offences are not shown in this table.(4) Figures exclude the British Transport Police. Note: The figures in the above table have been updated following the verification with individual police forces conducted in May 2007.
Figures may not therefore correspond with those published elsewhere.
Section 95
16
Table 3.3: Number of persons cautioned and prosecuted at magistrates’ courts and the Crown Court for racially aggravated offences, by age group and result, 2005
Magistrates’ courts Crown CourtPolice force area Prosecuted Cautioned Prosecuted Terminated Acquitted Committed Convicted Committed Number Acquitted/ Convicted
and group or cautioned early for trial for sentence for trial not tried
Avon & Somerset10-17 32 4 28 8 3 0 17 0 0 0 018+ 161 6 155 51 7 21 76 4 17 12 5All Ages 193 10 183 59 10 21 93 4 17 12 5
Bedfordshire 10-17 51 44 7 4 0 1 2 0 0 0 018+ 103 53 50 14 0 12 24 0 8 2 6All Ages 154 97 57 18 0 13 26 0 8 2 6
Cambridgeshire 10-17 26 6 20 6 1 0 13 0 0 0 018+ 68 13 55 13 1 7 34 2 6 3 3All Ages 94 19 75 19 2 7 47 2 6 3 3
Cheshire 10-17 42 8 34 10 3 0 21 0 0 0 018+ 74 9 65 17 1 5 42 2 7 4 3All Ages 116 17 99 27 4 5 63 2 7 4 3
Cleveland10-17 18 3 15 1 1 0 13 0 1 0 118+ 60 8 52 13 5 5 29 0 5 2 3All Ages 78 11 67 14 6 5 42 0 6 2 4
Cumbria 10-17 13 3 10 3 0 0 7 0 0 0 018+ 49 1 48 14 2 6 26 0 9 2 7All Ages 62 4 58 17 2 6 33 0 9 2 7
Derbyshire10-17 45 16 29 7 1 0 21 0 0 0 018+ 97 6 91 23 3 21 44 4 16 6 10All Ages 142 22 120 30 4 21 65 4 16 6 10
Devon & Cornwall10-17 27 13 14 8 0 0 6 0 0 0 018+ 135 27 108 32 5 30 41 1 28 9 19All Ages 162 40 122 40 5 30 47 1 28 9 19
Dorset 10-17 11 3 8 4 0 0 4 0 0 0 018+ 44 4 40 6 0 15 19 1 12 7 5All Ages 55 7 48 10 0 15 23 1 12 7 5
Durham 10-17 21 3 18 4 2 0 12 0 0 0 018+ 69 4 65 12 3 10 40 1 8 1 7All Ages 90 7 83 16 5 10 52 1 8 1 7
Essex 10-17 46 4 42 12 1 5 24 0 2 2 018+ 118 3 115 31 4 24 56 2 19 7 12All Ages 164 7 157 43 5 29 80 2 21 9 12
Gloucestershire10-17 18 7 11 4 0 0 7 0 0 0 018+ 44 12 32 11 0 3 18 0 0 0 0All Ages 62 19 43 15 0 3 25 0 0 0 0
Section 95
17
Table 3.3: Number of persons cautioned and prosecuted at magistrates’ courts and the Crown Court for racially aggravated offences, by age group and result, 2005 (continued)
Magistrates’ courts Crown CourtPolice force area Prosecuted Cautioned Prosecuted Terminated Acquitted Committed Convicted Committed Number Acquitted/ Convicted
and group or cautioned early for trial for sentence for trial not tried
Greater Manchester10-17 237 42 195 53 7 14 121 0 3 1 218+ 403 14 389 109 12 68 200 4 58 14 44All Ages 640 56 584 162 19 82 321 4 61 15 46
Hampshire 10-17 93 16 77 26 6 4 41 0 0 0 018+ 189 14 175 26 8 41 100 10 34 13 21All Ages 282 30 252 52 14 45 141 10 34 13 21
Hertfordshire10-17 48 16 32 14 7 2 9 0 0 0 018+ 116 9 107 35 8 25 39 0 15 4 11All Ages 164 25 139 49 15 27 48 0 15 4 11
Humberside 10-17 25 2 23 5 3 0 15 0 0 0 018+ 73 5 68 18 1 7 42 2 8 1 7All Ages 98 7 91 23 4 7 57 2 8 1 7
Kent 10-17 23 23 0 0 0 0 0 0 0 0 018+ 38 30 8 0 0 0 8 1 17 10 7All Ages 61 53 8 0 0 0 8 1 17 10 7
Lancashire 10-17 111 50 61 20 4 1 36 0 2 0 218+ 319 48 271 66 20 39 146 2 23 9 14All Ages 430 98 332 86 24 40 182 2 25 9 16
Leicestershire 10-17 79 8 71 31 7 1 32 0 1 1 018+ 209 10 199 59 6 35 99 3 24 8 16All Ages 288 18 270 90 13 36 131 3 25 9 16
Lincolnshire10-17 20 8 12 4 1 1 6 0 1 1 018+ 44 7 37 10 0 6 21 0 9 1 8All Ages 64 15 49 14 1 7 27 0 10 2 8
London, City of 10-17 0 0 0 0 0 0 0 0 0 0 018+ 23 0 23 7 1 6 9 0 5 2 3All Ages 23 0 23 7 1 6 9 0 5 2 3
Merseyside10-17 42 3 39 6 9 0 24 1 0 0 018+ 136 5 131 28 14 25 64 2 40 18 22All Ages 178 8 170 34 23 25 88 3 40 18 22
Metropolitan Police10-17 255 118 137 31 34 9 63 0 7 0 718+ 1299 146 1153 198 130 256 569 16 235 110 125All Ages 1554 264 1290 229 164 265 632 16 242 110 132
Norfolk 10-17 123 114 9 4 0 0 5 0 0 0 018+ 184 121 63 14 0 15 34 5 10 2 8All Ages 307 235 72 18 0 15 39 5 10 2 8
Section 95
18
Table 3.3: Number of persons cautioned and prosecuted at magistrates’ courts and the Crown Court for racially aggravated offences, by age group and result, 2005 (continued)
Magistrates’ courts Crown CourtPolice force area Prosecuted Cautioned Prosecuted Terminated Acquitted Committed Convicted Committed Number Acquitted/ Convicted
and group or cautioned early for trial for sentence for trial not tried
Northamptonshire 10-17 5 5 0 0 0 0 0 0 0 0 018+ 21 17 4 0 0 0 4 0 7 1 6All Ages 26 22 4 0 0 0 4 0 7 1 6Northumbria 10-17 76 14 62 30 2 0 30 0 3 1 218+ 165 14 151 48 1 13 89 0 11 3 8All Ages 241 28 213 78 3 13 119 0 14 4 10
North Yorkshire10-17 11 0 11 5 0 0 6 0 0 0 018+ 59 3 56 22 1 5 28 2 6 4 2All Ages 70 3 67 27 1 5 34 2 6 4 2
Nottinghamshire10-17 39 10 29 7 1 4 17 0 1 1 018+ 195 20 175 60 12 24 79 2 19 8 11All Ages 234 30 204 67 13 28 96 2 20 9 11
South Yorkshire 10-17 45 28 17 5 4 1 7 0 0 0 018+ 124 32 92 20 6 20 46 0 17 6 11All Ages 169 60 109 25 10 21 53 0 17 6 11
Staffordshire 10-17 43 24 19 8 2 1 8 0 1 1 018+ 101 11 90 37 4 11 38 0 13 3 10All Ages 144 35 109 45 6 12 46 0 14 4 10
Suffolk 10-17 21 6 15 2 4 0 9 0 0 0 018+ 63 10 53 7 12 4 30 0 0 0 0All Ages 84 16 68 9 16 4 39 0 0 0 0
Surrey10-17 59 27 32 14 0 1 17 0 0 0 018+ 84 29 55 21 0 13 21 0 4 2 2All Ages 143 56 87 35 0 14 38 0 4 2 2
Sussex10-17 34 7 27 10 1 1 15 0 0 0 018+ 125 13 112 25 7 35 45 4 17 4 13All Ages 159 20 139 35 8 36 60 4 17 4 13
Thames Valley10-17 46 8 38 19 7 2 10 0 0 0 018+ 184 24 160 52 10 33 65 2 21 10 11All Ages 230 32 198 71 17 35 75 2 21 10 11
Warwickshire 10-17 20 7 13 5 0 0 8 0 0 0 018+ 56 14 42 13 0 1 28 1 2 0 2All Ages 76 21 55 18 0 1 36 1 2 0 2
West Mercia10-17 47 15 32 11 1 0 20 0 0 0 018+ 167 38 129 48 6 13 62 3 16 4 12All Ages 214 53 161 59 7 13 82 3 16 4 12
Section 95
19
Table 3.3: Number of persons cautioned and prosecuted at magistrates’ courts and the Crown Court for racially aggravated offences, by age group and result, 2005 (continued)
Magistrates’ courts Crown CourtPolice force area Prosecuted Cautioned Prosecuted Terminated Acquitted Committed Convicted Committed Number Acquitted/ Convicted
and group or cautioned early for trial for sentence for trial not tried
West Midlands 10-17 144 26 118 35 14 6 63 0 3 0 318+ 442 41 401 111 26 60 204 4 51 12 39All Ages 586 67 519 146 40 66 267 4 54 12 42
West Yorkshire 10-17 134 68 66 29 3 0 34 0 0 0 018+ 283 43 240 83 6 34 117 7 36 13 23All Ages 417 111 306 112 9 34 151 7 36 13 23
Wiltshire 10-17 11 4 7 1 0 0 6 0 0 0 018+ 61 3 58 22 1 5 30 0 2 0 2All Ages 72 7 65 23 1 5 36 0 2 0 2
Dyfed Powys 10-17 2 0 2 0 1 0 1 0 0 0 018+ 25 0 25 4 5 1 15 0 1 0 1All Ages 27 0 27 4 6 1 16 0 1 0 1
Gwent 10-17 12 5 7 2 1 0 4 0 0 0 018+ 50 2 48 11 10 4 23 0 3 0 3All Ages 62 7 55 13 11 4 27 0 3 0 3
North Wales 10-17 17 6 11 6 0 1 4 0 0 0 018+ 68 9 59 9 1 12 37 6 11 2 9All Ages 85 15 70 15 1 13 41 6 11 2 9
South Wales 10-17 45 3 42 23 5 0 14 0 0 0 018+ 182 7 175 48 12 27 88 1 19 8 11All Ages 227 10 217 71 17 27 102 1 19 8 11
England & Wales 10-17 2217 777 1440 477 136 55 772 1 25 8 1718+ 6510 885 5625 1448 351 997 2829 94 869 327 542All Ages 8727 1662 7065 1925 487 1052 3601 95 894 335 559
(1) These court data are more complete than the data in Chapter 6 as the figures do not include an ethnicity breakdown.
Section 95
20
Table 3.4: Homicides currently recorded1 by ethnic appearance of victim and police force area: England and Wales, combined data for 2003/04 to 2005/06
Ethnic appearance of victim
Police force area White Black Asian Other Not known Total
Avon and Somerset 35 3 1 1 - 40Bedfordshire 20 1 1 1 - 23Cambridgeshire 26 - 1 - 3 30Cheshire 32 - 3 1 1 37Cleveland 16 - - 1 - 17Cumbria 19 - 1 - 2 22Derbyshire 23 2 1 1 - 27Devon and Cornwall 55 - 1 3 59Dorset 14 2 - - - 16Durham 11 - - - - 11Essex 34 1 2 2 3 42Gloucestershire 16 - - - - 16Greater Manchester 131 7 9 2 12 161Hampshire 37 2 - 1 1 41Hertfordshire 25 1 2 2 1 31Humberside 43 1 - - - 44Kent 38 - 3 1 - 42Lancashire(2) 73 - 2 22 - 97Leicestershire 23 3 2 2 - 30Lincolnshire 10 - - - - 10 London:
City of London 1 1 - - - 2Metropolitan Police(3) 260 154 75 37 20 546
Merseyside 92 5 - 5 1 103Norfolk 18 1 - - 3 22North Yorkshire 21 - 1 - 1 23Northamptonshire 13 - 2 - 4 19Northumbria 51 - 1 1 - 53Nottinghamshire 42 8 1 1 - 52South Yorkshire 41 5 3 - - 49Staffordshire 24 1 2 1 1 29Suffolk 18 - 2 - - 20Surrey 25 - 2 - - 27Sussex 45 3 1 - 1 50Thames Valley 49 - 4 4 11 68Warwickshire 16 - 1 - - 17West Mercia 30 1 - 1 1 33West Midlands 87 29 32 4 8 160West Yorkshire 75 5 6 - 29 115Wiltshire 15 1 - - - 16
Dyfed Powys 21 - - - 1 22Gwent 19 - 1 - - 20North Wales 29 2 1 1 2 35South Wales 7 - - - - 7
British Transport Police(4) 34 3 4 2 - 43
ENGLAND AND WALES 1,714 242 168 94 109 2,327
- = nil1. Offences recorded as homicide as at 9 October 2006; figures are subject to revision as cases are dealt with by the police and the
courts, or as further information becomes available. 2. Includes 20 cockle pickers drowned in Morecambe Bay. 3. Includes 13 victims of the 7 July 2005 London bombings. 4. Includes 39 victims of the 7 July 2005 London bombings.
Section 95
21
Table 3.5: Ethnic appearance of currently recorded homicide victims1 by ethnicity of principal suspect2: England and Wales, combined data for 2003/04 to 2005/06
Ethnic appearance of principal suspect Total with Total with no Ethnic appearance of victim White Black Asian Other Not known current suspect current suspect3 Total
White 1,305 125 57 30 20 1,537 177 1,714Black 39 145 9 5 2 200 42 242Asian 36 16 85 3 - 140 28 168Other 19 13 4 45 4 - 81 13 94Not known 39 4 8 5 14 70 39 109
Total 1,438 303 163 88 36 2,028 299 2,327
- = nil1. Offences recorded as homicide as at 9 October 2006; figures are subject to revision as cases are dealt with by the police and the
courts, or as further information becomes available.2. A principal suspect is included for each victim, therefore a suspect may appear in the table more than once.3. Includes cases where a former principal suspect has been acquitted etc.4. Includes 20 cockle pickers drowned in Morecambe Bay.
Table 3.6: Relationship of currently recorded homicide victims1 to principal suspect by ethnic appearance of victim: England and Wales, combined data for 2003/04 to 2005/06
Ethnic appearance of victim
Relationship of victim to principal suspect White Black Asian Other Not known Total
Family 484 36 42 16 23 601Of which: spouse/lover 307 21 21 10 12 371
Other known 448 58 24 12 15 557Stranger2 605 107 74 53 3 32 871No current suspect 177 41 28 13 39 298Total 1,714 242 168 94 109 2,327
1. Offences recorded as homicide as at 9 October 2006; figures are subject to revision as cases are dealt with by the police and the courts, or as further information becomes available.
2. Includes 52 victims of the 7 July 2005 London bombings.3. Includes 20 cockle pickers drowned in Morecambe Bay.
Table 3.7: Apparent method of killing of currently recorded homicide victims1 by ethnic appearance of victim: England and Wales, combined data for 2003/04 to 2005/06
Ethnic appearance of victim
Apparent method of killing White Black Asian Other Not known Total
Sharp instrument 525 90 49 23 23 710Blunt instrument 167 11 17 3 3 201Hitting, kicking etc 310 9 25 6 17 367Strangulation2 151 9 14 7 6 187Shooting 91 67 17 7 11 193Other3 470 56 46 48 4 49 669Total 1,714 242 168 94 109 2,327
1. Offences recorded as homicide as at 9 October 2006; figures are subject to revision as cases are dealt with by the police and the courts, or as further information becomes available.
2. Including asphyxiation.3. Includes 52 victims of the 7 July 2005 London bombings.4. Includes 20 cockle pickers drowned in Morecambe Bay.

Section 95
22
Section 95
23
Chapter 4: Stop and searches – including under the Police and Criminal Evidence Act and Terrorism Act
Introduction
Police officers have the power to stop and search individuals under a range of legislation, including section 1 of the Police and Criminal Evidence Act 1984 (PACE) as well as section 60 of the Criminal Justice and Public Order Act 1994 and section 44 of the Terrorism Act 2000.
Section 1 of PACE allows an officer who has reasonable grounds for suspicion to stop and search a person or vehicle to look for stolen or prohibited items. Section 60 of the Criminal Justice and Public Order Act allows a senior officer to authorise the stop and search of persons and vehicles where there is good reason to believe that to do so would help to prevent incidents involving serious violence or that persons are carrying dangerous instruments or offensive weapons. Section 44 of the Terrorism Act allows an officer to stop and search persons and vehicles – at a time and place where an appropriate authorisation exists – to look for articles that could be used in connection with terrorism whether or not there are reasonable grounds to suspect the presence of such articles.
Disproportionality in stop and search refers to the extent to which police powers are exercised on a group out of proportion to the number of that group in the general population. This report focuses on ethnicity, but disproportionality may be relevant to other social categories, such as gender, age and class (Waddington et al. 2004; Young 1994). The comparisons presented in this chapter are based on the ethnic profile of searches recorded by the police and the residential population.
Research has questioned the accuracy of police recording practices and the extent to which the resident population reflects the profile of those people who use public spaces where searches are carried out (Waddington et al. 2004; Bland et al. 2000; Hallsworth and McGuire 2004; MVA and Miller 2000; Bonniface 2000; FitzGerald and Sibbitt 1997). However, earlier Home Office research concluded that comparisons based on the residential population remain important because they illustrate the experience of different ethnic groups irrespective of the reasons that may explain any disparities4. Disproportionality is a critical issue for the police service because evidence shows that negative police practices can damage public confidence (Stone and Pettigrew 2000; Macpherson Report, 1999) and because being stopped and searched has been linked with lower satisfaction levels with the police (Miller et al. 2000; Clancy et al. 2001; FitzGerald et al. 2002).
The data collected and analysed in this section refer to persons who were searched by the police following an initial stop and therefore exclude persons stopped by the police without a search. These data exclude, for example, occasions where persons are stopped with a view to a search but where the officer has their suspicions allayed after a conversation, or stops of a vehicle under the Road Traffic Act 1988.
4 Further information available in the Stop and Search Action Team’s Manual available at http://police.homeoffice.gov.uk/news-and-publications/publication/operational-policing/stopandsearch-intermanual1.pdf
Section 95
24
Following the Home Secretary’s acceptance of recommendation 61 of the Stephen Lawrence Inquiry Report, PACE Code A has been amended to include the requirement for officers in all force areas to record all stops including non-statutory or voluntary stops by 1 April 2005. The Ministry of Justice intends to publish statistics on all stops, for the first time, next year.
For further details of stop and searches, please see the Home Office website, at http://police.homeoffice.gov.uk/operational-policing/powers-pace-codes/stop-search1.html/?version=2
Main Findings5
Section 1 PACE: Tables 4.1 - 4.4
In 2005/6 there were 878,153 stop and searches of persons recorded by the police under section 1 of PACE and other legislation (Table 4.1). Of these, 135,262 (15%) were of Black people, 69,274 (8%) of Asian people and 14,101 (2%) of people of ‘Other’ ethnic origin. For England and Wales as a whole, the number of stop and searches rose by 3.4% from 849,0276 in 2004/5 to 878,153 in 2005/6. This is the highest figure since 1998/99, when 1,037,271 stop and searches were recorded.
Numerically, most of this rise was accounted for by an increase of 14,169 (11.8%) for Black people. There were also increases for Asian people (14%), and people in the ‘Other’ minority ethnic group (16%), while stop and searches of White people rose by 0.4%. This increase could be explained, in part, by the London bombings of 7th July 2005. Resultant increased street activities of the police led to an increase in the use of stop and search powers, not only under Section 44 of the Terrorism Act 2000 (see below), but also under S1 PACE.
For the vast majority of police forces, it was apparent that the number of recorded stop and searches relative to the general population was higher for Black people than for White people in 2005/6 (Table 4.2). Overall, Black people were nearly 7 times more likely to be searched than White people (this ratio is higher than the 2004/5 ratio of 6 times). If the figures for London are excluded this ratio falls to 4.8. The ratio of Black to White recorded stop and searches varied substantially between police force areas, from 0.7 in Durham, to 11.8 in Dorset, while the ratio for London was 4.4. This variability reflects, in part, the small numbers involved from some ethnic minority groups in some force areas. There were two force areas (Durham and Northumbria) in which the rate of recorded stop and searches for Black people was below that for White people.
Changes in the relative proportions of Black and White people stopped and searched from 2004/5 to 2005/6 appear to be due, at least in part, to changes amongst some police forces in relation to the use of stop and search powers. Because London has the largest number of Black residents, the Metropolitan Police conduct over 75% of all stop and searches of Black people in England and Wales. Between 2004/5 and 2005/6, despite an 18% increase in the numbers of people stopped and searched in the Metropolitan Police area, disproportionality remained relatively stable; Black people were around 4.5 times more likely to be stopped and searched than White people. However, some police forces outside London significantly reduced the total number of stop and searches they conducted between 2004/5 and 2005/6. Among some of these forces, although the number of White persons stopped and searched has reduced, the numbers of Black people stopped and searched has not changed by a similar proportion. This relative difference is partly responsible for the overall increase in disproportionality.
5 Data reported here have been confirmed by individual police forces. Because of the dynamic nature of these data, the figures reported here may differ from those published elsewhere.
6 2004/5 figures have been revised since the previous publications.
Section 95
25
Asian people were 2.1 times as likely as White people to be stopped and searched, compared to 1.8 times in the previous year. People in the ‘Other’ ethnic group were 1.7 times more likely to be stopped than White people in 2005/6, compared with 1.6 times in 2004/52.
For England and Wales in 2005/6, the most common reason for conducting a stop and search across all ethnic groups was for drugs (Table 4.3), as was the case for the previous year. In 2005/6, as for 2004/5, at least half of all occasions of stop and search for people of Asian and Black ethnic appearance were made for drugs (58% and 50% respectively). The proportion for people of White ethnic appearance was lower, at just under two-fifths (39%). In 2005/6, 23% of PACE stop and searches were for stolen goods, slightly lower than 2004/5 (28%). The percentages varied between 30% for the ‘Other’ group, 24% for the White group and the Black group and 15% for the Asian group.
In 2004/5, 12% of stop and searches resulted in an arrest, compared to 11% in 2004/5 (Table 4.4). This proportion varied between police force areas, from 5% in Northumbria to 19% in Cheshire. This slight increase, overall, is most noticeable in the Black ethnic group where the proportion of stop and searches resulting in arrest increased from 11% in 2004/5 to 13% in 2005/6.
Section 60: Table 4.5
The Criminal Justice and Public Order Act 1994 introduced new powers to stop and search vehicles and persons. Section 60 of the Act, which came into force on 10 April 1995, enables a senior police officer to authorise, for a period not exceeding 24 hours, stop and searches in anticipation of violence.
In 2005/6, the police recorded 36,248 such stop and searches of individuals in England and Wales as a whole (Table 4.5), a decrease of 13% on 2004/5 (41,575 individuals in 2004/57). The overall change in the total number of these stop and searches includes a fall of 2% for White people, 27% for Black people, 29% for Asian people and 27% for those of ‘Other’ ethnicity.
The large increase in the use of this power by Merseyside (who recorded 1,791 such stop and searches in 2004/5 and 8,864 in 2005/6) may be explained by the increase in the number of special operations run by the force. 42 of the 43 forces used these stop and searches in anticipation of violence in 2005/6, compared to 30 in 2004/5.
The proportion of stop and searches resulting in an arrest under Section 60 powers varied across forces. Overall, 5% led to an arrest in 2005/6, compared to 3% in 2004/5 and 4% in 2003/4 (Ministry of Justice, 2007).
Terrorism Act 2000: Tables 4.6-4.8
The Terrorism Act 2000 provides further powers to carry out stop and searches. Section 44 (1) and (2) of the Act allows officers, when given authorisation:
to stop and search vehicles, people in vehicles and pedestrians for articles that could be used for terrorism whether or not there are grounds for suspecting that such articles are present.
(sections 45[1] and [2])
7 2004/5 figures have been revised since previous publications.
Section 95
26
A total of 44,543 searches were made under section 44 (1) and 44 (2) of the Terrorism Act 2000 in 2005/6 compared with 33,177 in 2004/58, an overall increase of 34% (Table 4.6). Searches of Asian people increased from 3,697 to 6,805 (up 84%), searches of Black people increased from 2,744 to 4,155 (up 51%). Searches of people in the “Other” ethnic group also increased, from 1,428 in 2004/5 to 1,937 in 2005/6 (up 36%), as did searches of White people, increasing from 24,782 in 2004/5 to 30,837 in 2005/6 (up 24%). Over half of searches took place in the Metropolitan Police area and 15% in the City of London, compared to 40% and 20% respectively in 2004/5. The large increases in comparison to the 2004/5 figures may be explained, in part, by the London bombings of 7th July 2005. As with stop and searches under S1 PACE, resultant increased street activities of the police led to an increase in the use of stop and search powers under Section 44 of the Terrorism Act 2000.
In 2005/6, 25,479 searches of vehicle occupants were made under section 44(1) (Table 4.7). Seventy five per cent of those searched in 2005/6 were White, 11% Asian and 8% Black. There was a slight increase in the proportion of White people searched and a slight fall in the proportion of Black people searched under this provision compared to 2004/5. Forty six arrests of vehicle occupants in connection with terrorism resulted from section 44(1) searches, compared to 38 in the previous year. Arrests under non-terrorism legislation following the use of this provision remained constant between 2004/5 and 2005/6 at 246. Most arrests following a section 44(1) search were in London. This most likely reflects the use of the powers in London.
The number of stop and searches of pedestrians under section 44(2) nearly doubled between 2004/5 and 2005/6 with 19,064 stop and searches recorded in 2005/6. This increase was accounted for by the increase in use of the power in London. Use of the power in areas outside of London decreased by 19% between 2004/5 and 2005/6. In 2005/6, 61% of people stopped under section 44(2) were White compared to 74% in 2004/5 and 72% in 2003/4. The proportions for Black and Asian people fell to 11% and 21% respectively in 2005/6. In 2005/6, 59 arrests in connection with terrorism resulted from section 44(2) searches compared to 24 in the previous year and 5 in 2003/4. Arrests under non-terrorist legislation rose from 153 in 2004/5 to 212 in 2005/6.
8 2004/5 figures have been revised since previous publications.
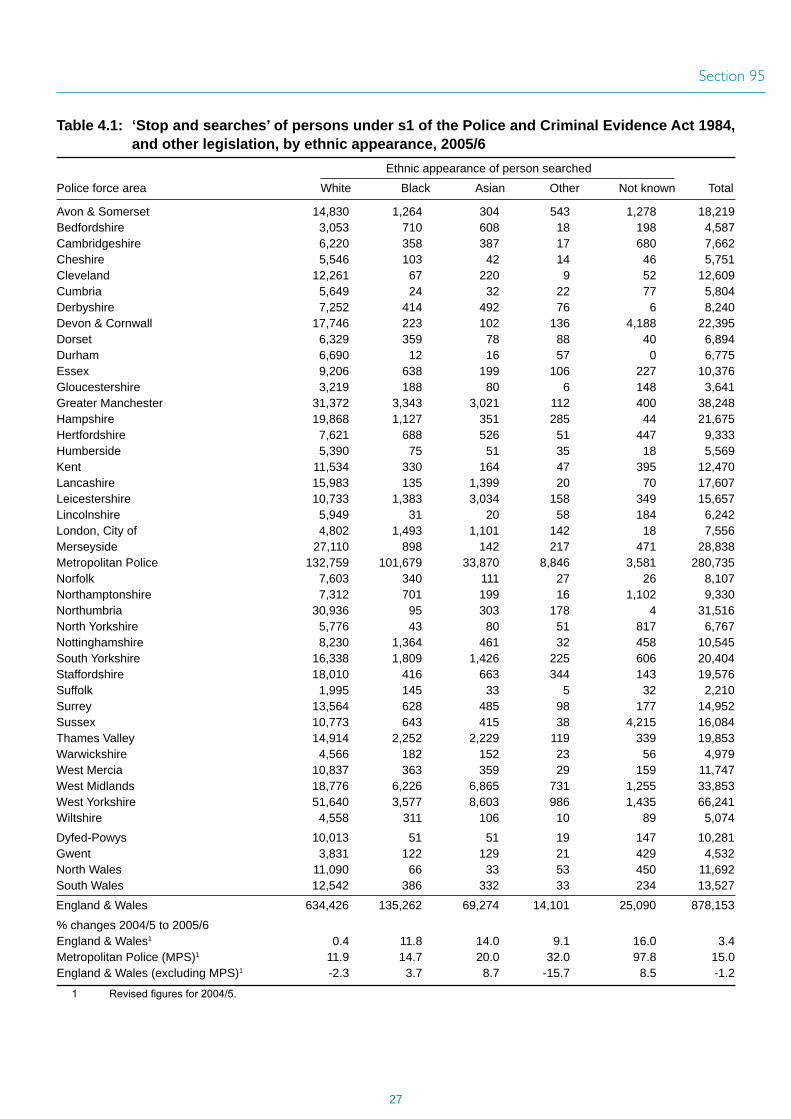
Section 95
27
Table 4.1: ‘Stop and searches’ of persons under s1 of the Police and Criminal Evidence Act 1984, and other legislation, by ethnic appearance, 2005/6
Ethnic appearance of person searched
Police force area White Black Asian Other Not known Total
Avon & Somerset 14,830 1,264 304 543 1,278 18,219Bedfordshire 3,053 710 608 18 198 4,587Cambridgeshire 6,220 358 387 17 680 7,662Cheshire 5,546 103 42 14 46 5,751Cleveland 12,261 67 220 9 52 12,609Cumbria 5,649 24 32 22 77 5,804Derbyshire 7,252 414 492 76 6 8,240Devon & Cornwall 17,746 223 102 136 4,188 22,395Dorset 6,329 359 78 88 40 6,894Durham 6,690 12 16 57 0 6,775Essex 9,206 638 199 106 227 10,376Gloucestershire 3,219 188 80 6 148 3,641Greater Manchester 31,372 3,343 3,021 112 400 38,248Hampshire 19,868 1,127 351 285 44 21,675Hertfordshire 7,621 688 526 51 447 9,333Humberside 5,390 75 51 35 18 5,569Kent 11,534 330 164 47 395 12,470Lancashire 15,983 135 1,399 20 70 17,607Leicestershire 10,733 1,383 3,034 158 349 15,657Lincolnshire 5,949 31 20 58 184 6,242London, City of 4,802 1,493 1,101 142 18 7,556Merseyside 27,110 898 142 217 471 28,838Metropolitan Police 132,759 101,679 33,870 8,846 3,581 280,735Norfolk 7,603 340 111 27 26 8,107Northamptonshire 7,312 701 199 16 1,102 9,330Northumbria 30,936 95 303 178 4 31,516North Yorkshire 5,776 43 80 51 817 6,767Nottinghamshire 8,230 1,364 461 32 458 10,545South Yorkshire 16,338 1,809 1,426 225 606 20,404Staffordshire 18,010 416 663 344 143 19,576Suffolk 1,995 145 33 5 32 2,210Surrey 13,564 628 485 98 177 14,952Sussex 10,773 643 415 38 4,215 16,084Thames Valley 14,914 2,252 2,229 119 339 19,853Warwickshire 4,566 182 152 23 56 4,979West Mercia 10,837 363 359 29 159 11,747West Midlands 18,776 6,226 6,865 731 1,255 33,853West Yorkshire 51,640 3,577 8,603 986 1,435 66,241Wiltshire 4,558 311 106 10 89 5,074
Dyfed-Powys 10,013 51 51 19 147 10,281Gwent 3,831 122 129 21 429 4,532North Wales 11,090 66 33 53 450 11,692South Wales 12,542 386 332 33 234 13,527
England & Wales 634,426 135,262 69,274 14,101 25,090 878,153
% changes 2004/5 to 2005/6England & Wales1 0.4 11.8 14.0 9.1 16.0 3.4Metropolitan Police (MPS)1 11.9 14.7 20.0 32.0 97.8 15.0England & Wales (excluding MPS)1 -2.3 3.7 8.7 -15.7 8.5 -1.2
1 Revised figures for 2004/5.
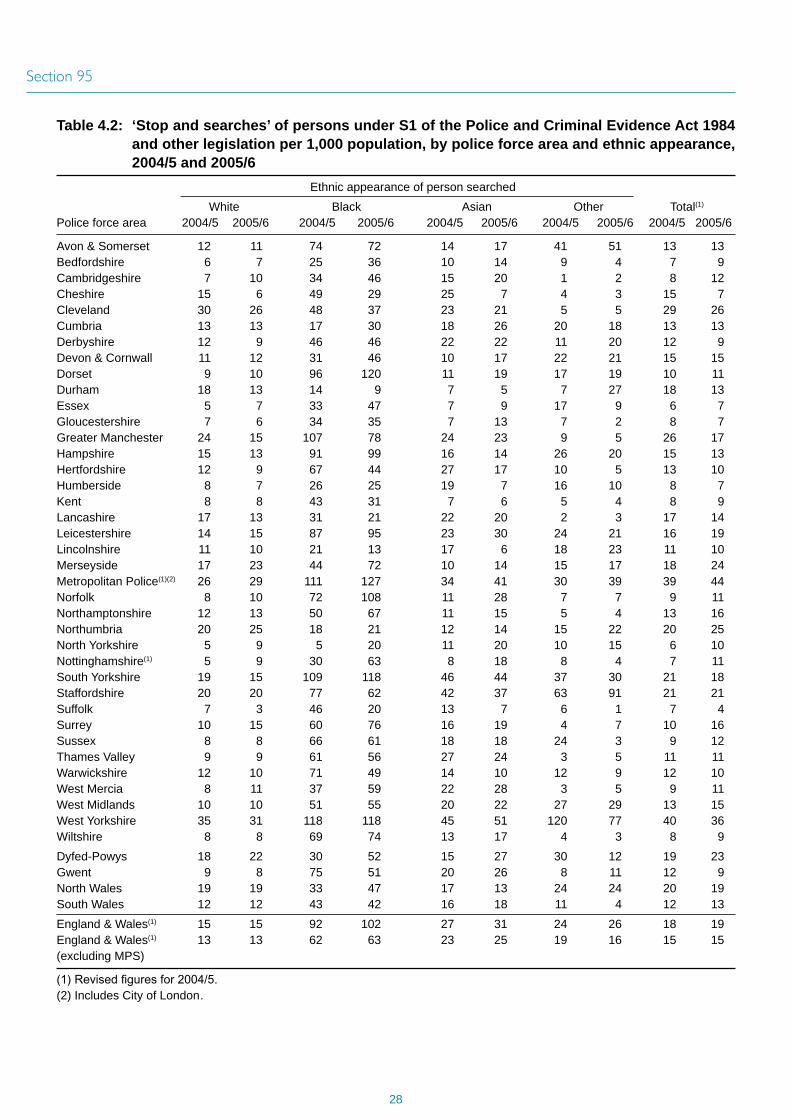
Section 95
28
Table 4.2: ‘Stop and searches’ of persons under S1 of the Police and Criminal Evidence Act 1984 and other legislation per 1,000 population, by police force area and ethnic appearance, 2004/5 and 2005/6
Ethnic appearance of person searched
White Black Asian Other Total(1)
Police force area 2004/5 2005/6 2004/5 2005/6 2004/5 2005/6 2004/5 2005/6 2004/5 2005/6
Avon & Somerset 12 11 74 72 14 17 41 51 13 13Bedfordshire 6 7 25 36 10 14 9 4 7 9Cambridgeshire 7 10 34 46 15 20 1 2 8 12Cheshire 15 6 49 29 25 7 4 3 15 7Cleveland 30 26 48 37 23 21 5 5 29 26Cumbria 13 13 17 30 18 26 20 18 13 13Derbyshire 12 9 46 46 22 22 11 20 12 9Devon & Cornwall 11 12 31 46 10 17 22 21 15 15Dorset 9 10 96 120 11 19 17 19 10 11Durham 18 13 14 9 7 5 7 27 18 13Essex 5 7 33 47 7 9 17 9 6 7Gloucestershire 7 6 34 35 7 13 7 2 8 7Greater Manchester 24 15 107 78 24 23 9 5 26 17Hampshire 15 13 91 99 16 14 26 20 15 13Hertfordshire 12 9 67 44 27 17 10 5 13 10Humberside 8 7 26 25 19 7 16 10 8 7Kent 8 8 43 31 7 6 5 4 8 9Lancashire 17 13 31 21 22 20 2 3 17 14Leicestershire 14 15 87 95 23 30 24 21 16 19Lincolnshire 11 10 21 13 17 6 18 23 11 10Merseyside 17 23 44 72 10 14 15 17 18 24Metropolitan Police(1)(2) 26 29 111 127 34 41 30 39 39 44Norfolk 8 10 72 108 11 28 7 7 9 11Northamptonshire 12 13 50 67 11 15 5 4 13 16Northumbria 20 25 18 21 12 14 15 22 20 25North Yorkshire 5 9 5 20 11 20 10 15 6 10Nottinghamshire(1) 5 9 30 63 8 18 8 4 7 11South Yorkshire 19 15 109 118 46 44 37 30 21 18Staffordshire 20 20 77 62 42 37 63 91 21 21Suffolk 7 3 46 20 13 7 6 1 7 4Surrey 10 15 60 76 16 19 4 7 10 16Sussex 8 8 66 61 18 18 24 3 9 12Thames Valley 9 9 61 56 27 24 3 5 11 11Warwickshire 12 10 71 49 14 10 12 9 12 10West Mercia 8 11 37 59 22 28 3 5 9 11West Midlands 10 10 51 55 20 22 27 29 13 15West Yorkshire 35 31 118 118 45 51 120 77 40 36Wiltshire 8 8 69 74 13 17 4 3 8 9
Dyfed-Powys 18 22 30 52 15 27 30 12 19 23Gwent 9 8 75 51 20 26 8 11 12 9North Wales 19 19 33 47 17 13 24 24 20 19South Wales 12 12 43 42 16 18 11 4 12 13
England & Wales(1) 15 15 92 102 27 31 24 26 18 19England & Wales(1) 13 13 62 63 23 25 19 16 15 15(excluding MPS)
(1) Revised figures for 2004/5. (2) Includes City of London .
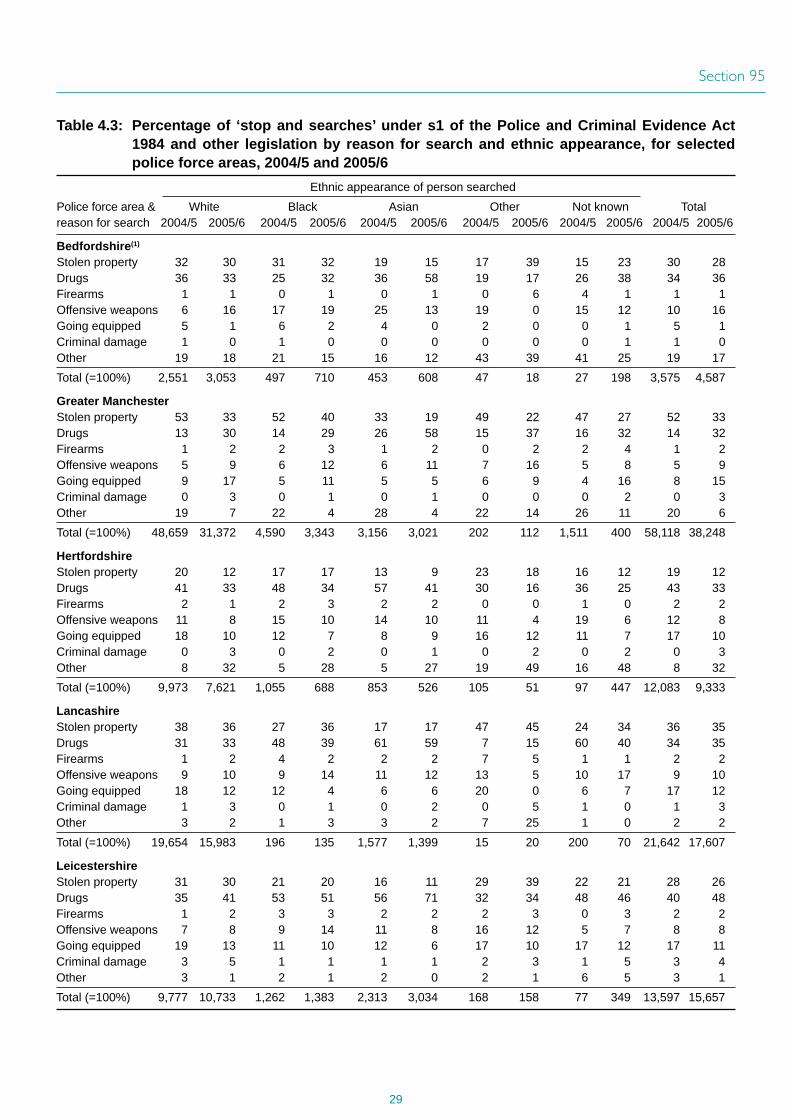
Section 95
29
Table 4.3: Percentage of ‘stop and searches’ under s1 of the Police and Criminal Evidence Act 1984 and other legislation by reason for search and ethnic appearance, for selected police force areas, 2004/5 and 2005/6
Ethnic appearance of person searched
Police force area & White Black Asian Other Not known Totalreason for search 2004/5 2005/6 2004/5 2005/6 2004/5 2005/6 2004/5 2005/6 2004/5 2005/6 2004/5 2005/6
Bedfordshire(1)
Stolen property 32 30 31 32 19 15 17 39 15 23 30 28Drugs 36 33 25 32 36 58 19 17 26 38 34 36Firearms 1 1 0 1 0 1 0 6 4 1 1 1Offensive weapons 6 16 17 19 25 13 19 0 15 12 10 16Going equipped 5 1 6 2 4 0 2 0 0 1 5 1Criminal damage 1 0 1 0 0 0 0 0 0 1 1 0Other 19 18 21 15 16 12 43 39 41 25 19 17
Total (=100%) 2,551 3,053 497 710 453 608 47 18 27 198 3,575 4,587
Greater Manchester Stolen property 53 33 52 40 33 19 49 22 47 27 52 33Drugs 13 30 14 29 26 58 15 37 16 32 14 32Firearms 1 2 2 3 1 2 0 2 2 4 1 2Offensive weapons 5 9 6 12 6 11 7 16 5 8 5 9Going equipped 9 17 5 11 5 5 6 9 4 16 8 15Criminal damage 0 3 0 1 0 1 0 0 0 2 0 3Other 19 7 22 4 28 4 22 14 26 11 20 6
Total (=100%) 48,659 31,372 4,590 3,343 3,156 3,021 202 112 1,511 400 58,118 38,248
Hertfordshire Stolen property 20 12 17 17 13 9 23 18 16 12 19 12Drugs 41 33 48 34 57 41 30 16 36 25 43 33Firearms 2 1 2 3 2 2 0 0 1 0 2 2Offensive weapons 11 8 15 10 14 10 11 4 19 6 12 8Going equipped 18 10 12 7 8 9 16 12 11 7 17 10Criminal damage 0 3 0 2 0 1 0 2 0 2 0 3Other 8 32 5 28 5 27 19 49 16 48 8 32
Total (=100%) 9,973 7,621 1,055 688 853 526 105 51 97 447 12,083 9,333
Lancashire Stolen property 38 36 27 36 17 17 47 45 24 34 36 35Drugs 31 33 48 39 61 59 7 15 60 40 34 35Firearms 1 2 4 2 2 2 7 5 1 1 2 2Offensive weapons 9 10 9 14 11 12 13 5 10 17 9 10Going equipped 18 12 12 4 6 6 20 0 6 7 17 12Criminal damage 1 3 0 1 0 2 0 5 1 0 1 3Other 3 2 1 3 3 2 7 25 1 0 2 2
Total (=100%) 19,654 15,983 196 135 1,577 1,399 15 20 200 70 21,642 17,607
Leicestershire Stolen property 31 30 21 20 16 11 29 39 22 21 28 26Drugs 35 41 53 51 56 71 32 34 48 46 40 48Firearms 1 2 3 3 2 2 2 3 0 3 2 2Offensive weapons 7 8 9 14 11 8 16 12 5 7 8 8Going equipped 19 13 11 10 12 6 17 10 17 12 17 11Criminal damage 3 5 1 1 1 1 2 3 1 5 3 4Other 3 1 2 1 2 0 2 1 6 5 3 1
Total (=100%) 9,777 10,733 1,262 1,383 2,313 3,034 168 158 77 349 13,597 15,657
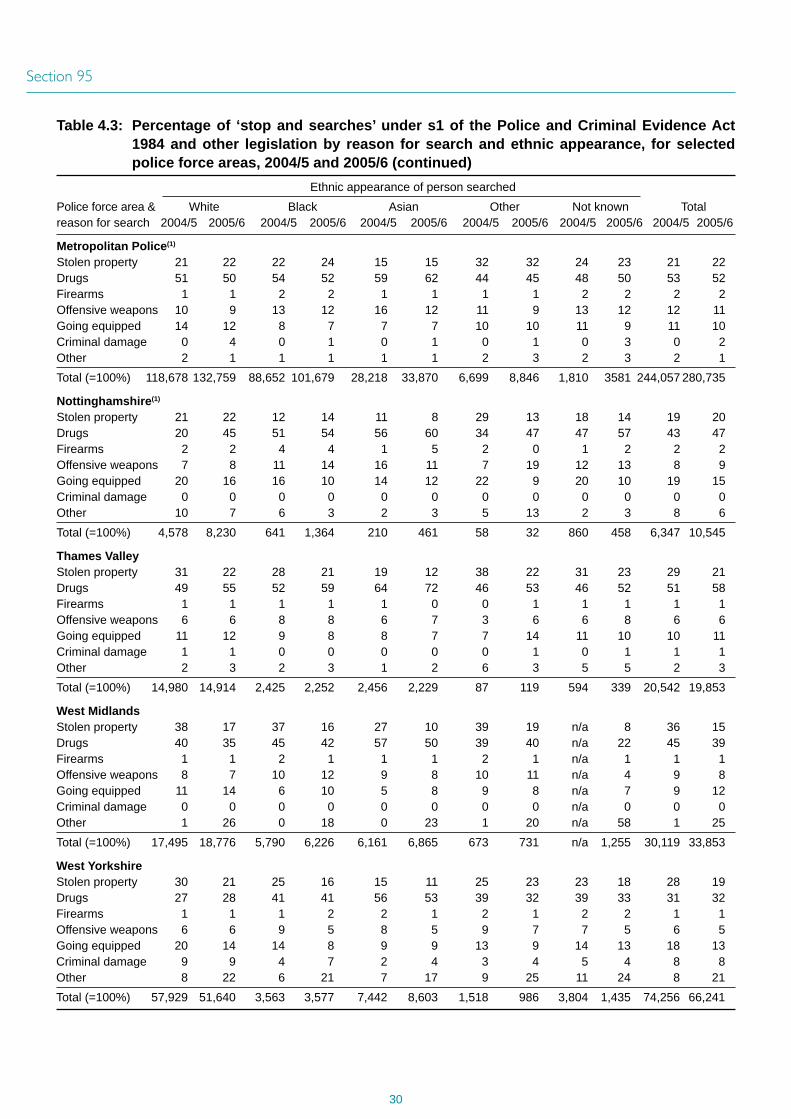
Section 95
30
Table 4.3: Percentage of ‘stop and searches’ under s1 of the Police and Criminal Evidence Act 1984 and other legislation by reason for search and ethnic appearance, for selected police force areas, 2004/5 and 2005/6 (continued)
Ethnic appearance of person searched
Police force area & White Black Asian Other Not known Totalreason for search 2004/5 2005/6 2004/5 2005/6 2004/5 2005/6 2004/5 2005/6 2004/5 2005/6 2004/5 2005/6
Metropolitan Police(1) Stolen property 21 22 22 24 15 15 32 32 24 23 21 22Drugs 51 50 54 52 59 62 44 45 48 50 53 52Firearms 1 1 2 2 1 1 1 1 2 2 2 2Offensive weapons 10 9 13 12 16 12 11 9 13 12 12 11Going equipped 14 12 8 7 7 7 10 10 11 9 11 10Criminal damage 0 4 0 1 0 1 0 1 0 3 0 2Other 2 1 1 1 1 1 2 3 2 3 2 1
Total (=100%) 118,678 132,759 88,652 101,679 28,218 33,870 6,699 8,846 1,810 3581 244,057 280,735
Nottinghamshire(1) Stolen property 21 22 12 14 11 8 29 13 18 14 19 20Drugs 20 45 51 54 56 60 34 47 47 57 43 47Firearms 2 2 4 4 1 5 2 0 1 2 2 2Offensive weapons 7 8 11 14 16 11 7 19 12 13 8 9Going equipped 20 16 16 10 14 12 22 9 20 10 19 15Criminal damage 0 0 0 0 0 0 0 0 0 0 0 0Other 10 7 6 3 2 3 5 13 2 3 8 6
Total (=100%) 4,578 8,230 641 1,364 210 461 58 32 860 458 6,347 10,545
Thames Valley Stolen property 31 22 28 21 19 12 38 22 31 23 29 21Drugs 49 55 52 59 64 72 46 53 46 52 51 58Firearms 1 1 1 1 1 0 0 1 1 1 1 1Offensive weapons 6 6 8 8 6 7 3 6 6 8 6 6Going equipped 11 12 9 8 8 7 7 14 11 10 10 11Criminal damage 1 1 0 0 0 0 0 1 0 1 1 1Other 2 3 2 3 1 2 6 3 5 5 2 3
Total (=100%) 14,980 14,914 2,425 2,252 2,456 2,229 87 119 594 339 20,542 19,853
West Midlands Stolen property 38 17 37 16 27 10 39 19 n/a 8 36 15Drugs 40 35 45 42 57 50 39 40 n/a 22 45 39Firearms 1 1 2 1 1 1 2 1 n/a 1 1 1Offensive weapons 8 7 10 12 9 8 10 11 n/a 4 9 8Going equipped 11 14 6 10 5 8 9 8 n/a 7 9 12Criminal damage 0 0 0 0 0 0 0 0 n/a 0 0 0Other 1 26 0 18 0 23 1 20 n/a 58 1 25
Total (=100%) 17,495 18,776 5,790 6,226 6,161 6,865 673 731 n/a 1,255 30,119 33,853
West Yorkshire Stolen property 30 21 25 16 15 11 25 23 23 18 28 19Drugs 27 28 41 41 56 53 39 32 39 33 31 32Firearms 1 1 1 2 2 1 2 1 2 2 1 1Offensive weapons 6 6 9 5 8 5 9 7 7 5 6 5Going equipped 20 14 14 8 9 9 13 9 14 13 18 13Criminal damage 9 9 4 7 2 4 3 4 5 4 8 8Other 8 22 6 21 7 17 9 25 11 24 8 21
Total (=100%) 57,929 51,640 3,563 3,577 7,442 8,603 1,518 986 3,804 1,435 74,256 66,241
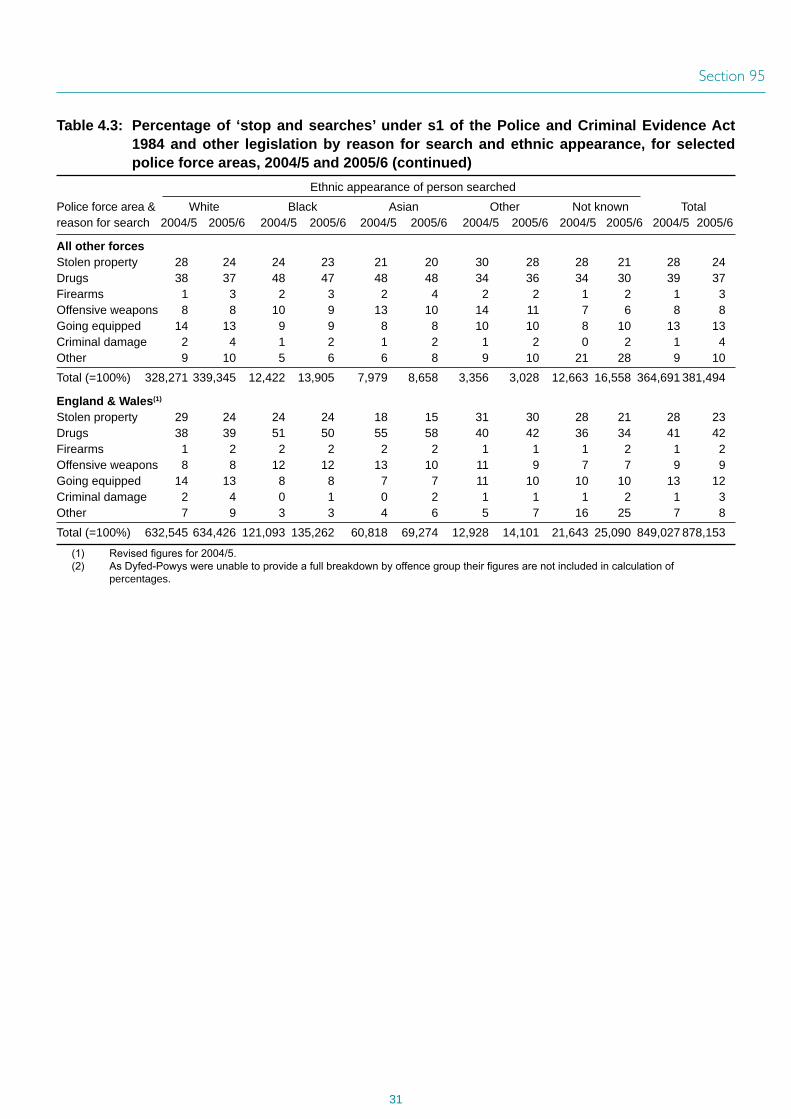
Section 95
31
Table 4.3: Percentage of ‘stop and searches’ under s1 of the Police and Criminal Evidence Act 1984 and other legislation by reason for search and ethnic appearance, for selected police force areas, 2004/5 and 2005/6 (continued)
Ethnic appearance of person searched
Police force area & White Black Asian Other Not known Totalreason for search 2004/5 2005/6 2004/5 2005/6 2004/5 2005/6 2004/5 2005/6 2004/5 2005/6 2004/5 2005/6
All other forces Stolen property 28 24 24 23 21 20 30 28 28 21 28 24Drugs 38 37 48 47 48 48 34 36 34 30 39 37Firearms 1 3 2 3 2 4 2 2 1 2 1 3Offensive weapons 8 8 10 9 13 10 14 11 7 6 8 8Going equipped 14 13 9 9 8 8 10 10 8 10 13 13Criminal damage 2 4 1 2 1 2 1 2 0 2 1 4Other 9 10 5 6 6 8 9 10 21 28 9 10
Total (=100%) 328,271 339,345 12,422 13,905 7,979 8,658 3,356 3,028 12,663 16,558 364,691 381,494
England & Wales(1) Stolen property 29 24 24 24 18 15 31 30 28 21 28 23Drugs 38 39 51 50 55 58 40 42 36 34 41 42Firearms 1 2 2 2 2 2 1 1 1 2 1 2Offensive weapons 8 8 12 12 13 10 11 9 7 7 9 9Going equipped 14 13 8 8 7 7 11 10 10 10 13 12Criminal damage 2 4 0 1 0 2 1 1 1 2 1 3Other 7 9 3 3 4 6 5 7 16 25 7 8
Total (=100%) 632,545 634,426 121,093 135,262 60,818 69,274 12,928 14,101 21,643 25,090 849,027 878,153
(1) Revised figures for 2004/5. (2) As Dyfed-Powys were unable to provide a full breakdown by offence group their figures are not included in calculation of
percentages.
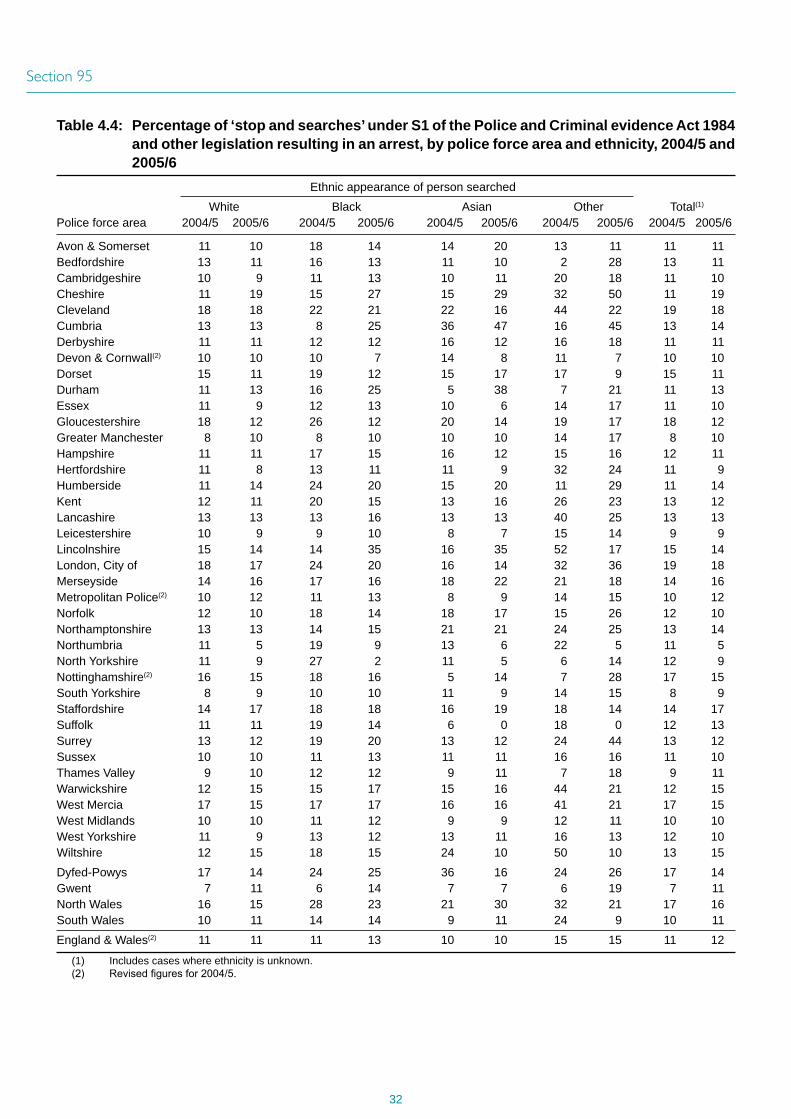
Section 95
32
Table 4.4: Percentage of ‘stop and searches’ under S1 of the Police and Criminal evidence Act 1984 and other legislation resulting in an arrest, by police force area and ethnicity, 2004/5 and 2005/6
Ethnic appearance of person searched
White Black Asian Other Total(1)
Police force area 2004/5 2005/6 2004/5 2005/6 2004/5 2005/6 2004/5 2005/6 2004/5 2005/6
Avon & Somerset 11 10 18 14 14 20 13 11 11 11Bedfordshire 13 11 16 13 11 10 2 28 13 11Cambridgeshire 10 9 11 13 10 11 20 18 11 10Cheshire 11 19 15 27 15 29 32 50 11 19Cleveland 18 18 22 21 22 16 44 22 19 18Cumbria 13 13 8 25 36 47 16 45 13 14Derbyshire 11 11 12 12 16 12 16 18 11 11Devon & Cornwall(2) 10 10 10 7 14 8 11 7 10 10Dorset 15 11 19 12 15 17 17 9 15 11Durham 11 13 16 25 5 38 7 21 11 13Essex 11 9 12 13 10 6 14 17 11 10Gloucestershire 18 12 26 12 20 14 19 17 18 12Greater Manchester 8 10 8 10 10 10 14 17 8 10Hampshire 11 11 17 15 16 12 15 16 12 11Hertfordshire 11 8 13 11 11 9 32 24 11 9Humberside 11 14 24 20 15 20 11 29 11 14Kent 12 11 20 15 13 16 26 23 13 12Lancashire 13 13 13 16 13 13 40 25 13 13Leicestershire 10 9 9 10 8 7 15 14 9 9Lincolnshire 15 14 14 35 16 35 52 17 15 14London, City of 18 17 24 20 16 14 32 36 19 18Merseyside 14 16 17 16 18 22 21 18 14 16Metropolitan Police(2) 10 12 11 13 8 9 14 15 10 12Norfolk 12 10 18 14 18 17 15 26 12 10Northamptonshire 13 13 14 15 21 21 24 25 13 14Northumbria 11 5 19 9 13 6 22 5 11 5North Yorkshire 11 9 27 2 11 5 6 14 12 9Nottinghamshire(2) 16 15 18 16 5 14 7 28 17 15South Yorkshire 8 9 10 10 11 9 14 15 8 9Staffordshire 14 17 18 18 16 19 18 14 14 17Suffolk 11 11 19 14 6 0 18 0 12 13Surrey 13 12 19 20 13 12 24 44 13 12Sussex 10 10 11 13 11 11 16 16 11 10Thames Valley 9 10 12 12 9 11 7 18 9 11Warwickshire 12 15 15 17 15 16 44 21 12 15West Mercia 17 15 17 17 16 16 41 21 17 15West Midlands 10 10 11 12 9 9 12 11 10 10West Yorkshire 11 9 13 12 13 11 16 13 12 10Wiltshire 12 15 18 15 24 10 50 10 13 15
Dyfed-Powys 17 14 24 25 36 16 24 26 17 14Gwent 7 11 6 14 7 7 6 19 7 11North Wales 16 15 28 23 21 30 32 21 17 16South Wales 10 11 14 14 9 11 24 9 10 11
England & Wales(2) 11 11 11 13 10 10 15 15 11 12
(1) Includes cases where ethnicity is unknown.(2) Revised figures for 2004/5.
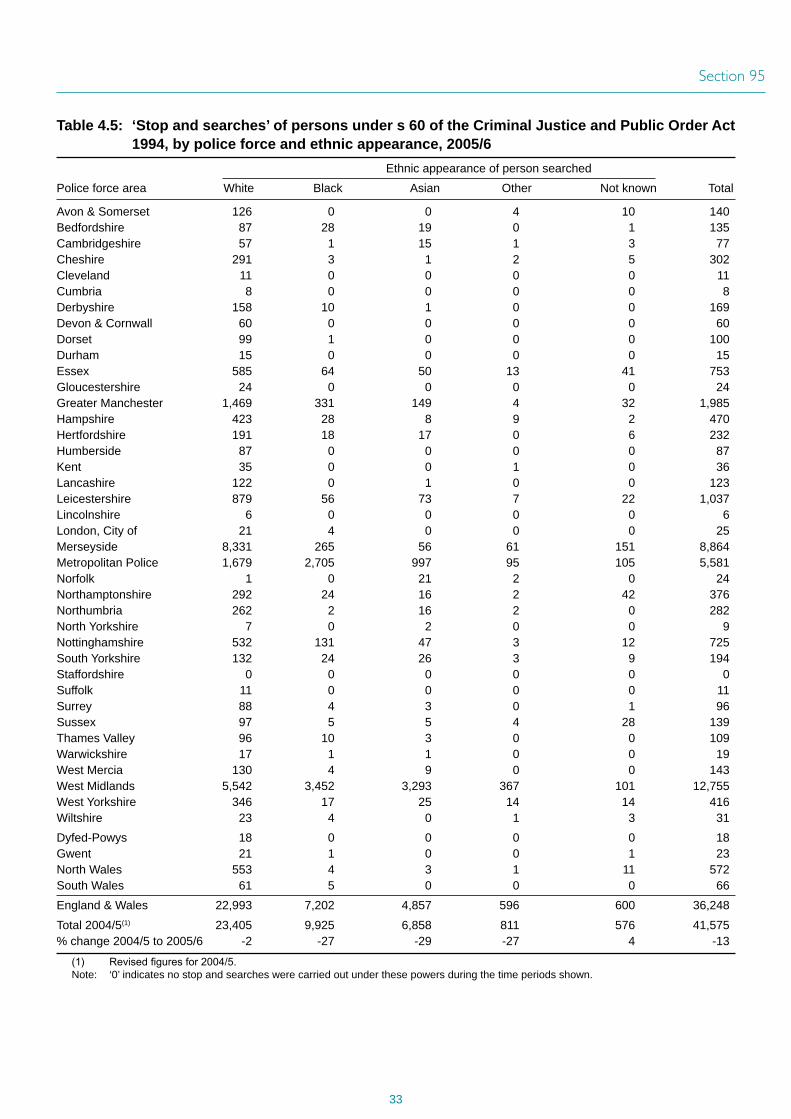
Section 95
33
Table 4.5: ‘Stop and searches’ of persons under s 60 of the Criminal Justice and Public Order Act 1994, by police force and ethnic appearance, 2005/6
Ethnic appearance of person searched
Police force area White Black Asian Other Not known Total
Avon & Somerset 126 0 0 4 10 140Bedfordshire 87 28 19 0 1 135Cambridgeshire 57 1 15 1 3 77Cheshire 291 3 1 2 5 302Cleveland 11 0 0 0 0 11Cumbria 8 0 0 0 0 8Derbyshire 158 10 1 0 0 169Devon & Cornwall 60 0 0 0 0 60Dorset 99 1 0 0 0 100Durham 15 0 0 0 0 15Essex 585 64 50 13 41 753Gloucestershire 24 0 0 0 0 24Greater Manchester 1,469 331 149 4 32 1,985Hampshire 423 28 8 9 2 470Hertfordshire 191 18 17 0 6 232Humberside 87 0 0 0 0 87Kent 35 0 0 1 0 36Lancashire 122 0 1 0 0 123Leicestershire 879 56 73 7 22 1,037Lincolnshire 6 0 0 0 0 6London, City of 21 4 0 0 0 25Merseyside 8,331 265 56 61 151 8,864Metropolitan Police 1,679 2,705 997 95 105 5,581Norfolk 1 0 21 2 0 24Northamptonshire 292 24 16 2 42 376Northumbria 262 2 16 2 0 282North Yorkshire 7 0 2 0 0 9Nottinghamshire 532 131 47 3 12 725South Yorkshire 132 24 26 3 9 194Staffordshire 0 0 0 0 0 0Suffolk 11 0 0 0 0 11Surrey 88 4 3 0 1 96Sussex 97 5 5 4 28 139Thames Valley 96 10 3 0 0 109Warwickshire 17 1 1 0 0 19West Mercia 130 4 9 0 0 143West Midlands 5,542 3,452 3,293 367 101 12,755West Yorkshire 346 17 25 14 14 416Wiltshire 23 4 0 1 3 31
Dyfed-Powys 18 0 0 0 0 18Gwent 21 1 0 0 1 23North Wales 553 4 3 1 11 572South Wales 61 5 0 0 0 66
England & Wales 22,993 7,202 4,857 596 600 36,248
Total 2004/5(1) 23,405 9,925 6,858 811 576 41,575% change 2004/5 to 2005/6 -2 -27 -29 -27 4 -13
(1) Revised figures for 2004/5. Note: ‘0’ indicates no stop and searches were carried out under these powers during the time periods shown.
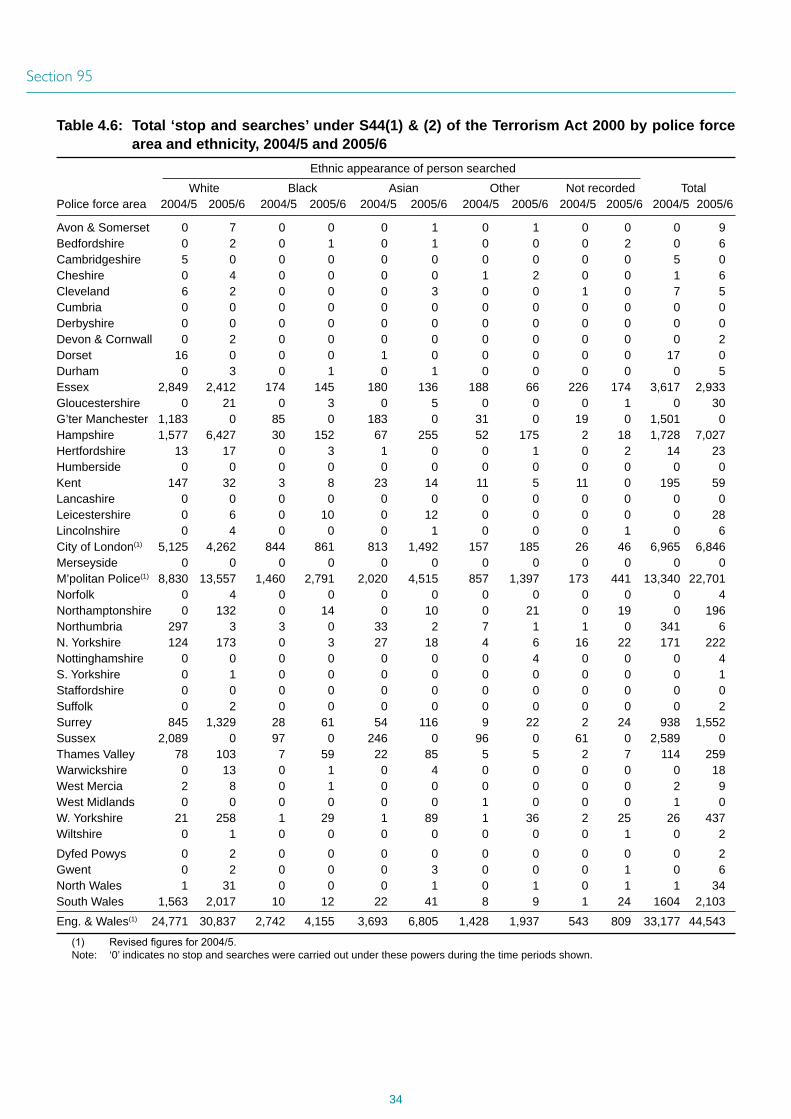
Section 95
34
Table 4.6: Total ‘stop and searches’ under S44(1) & (2) of the Terrorism Act 2000 by police force area and ethnicity, 2004/5 and 2005/6
Ethnic appearance of person searched
White Black Asian Other Not recorded TotalPolice force area 2004/5 2005/6 2004/5 2005/6 2004/5 2005/6 2004/5 2005/6 2004/5 2005/6 2004/5 2005/6
Avon & Somerset 0 7 0 0 0 1 0 1 0 0 0 9Bedfordshire 0 2 0 1 0 1 0 0 0 2 0 6Cambridgeshire 5 0 0 0 0 0 0 0 0 0 5 0Cheshire 0 4 0 0 0 0 1 2 0 0 1 6Cleveland 6 2 0 0 0 3 0 0 1 0 7 5Cumbria 0 0 0 0 0 0 0 0 0 0 0 0Derbyshire 0 0 0 0 0 0 0 0 0 0 0 0Devon & Cornwall 0 2 0 0 0 0 0 0 0 0 0 2Dorset 16 0 0 0 1 0 0 0 0 0 17 0Durham 0 3 0 1 0 1 0 0 0 0 0 5Essex 2,849 2,412 174 145 180 136 188 66 226 174 3,617 2,933Gloucestershire 0 21 0 3 0 5 0 0 0 1 0 30G’ter Manchester 1,183 0 85 0 183 0 31 0 19 0 1,501 0Hampshire 1,577 6,427 30 152 67 255 52 175 2 18 1,728 7,027Hertfordshire 13 17 0 3 1 0 0 1 0 2 14 23Humberside 0 0 0 0 0 0 0 0 0 0 0 0Kent 147 32 3 8 23 14 11 5 11 0 195 59Lancashire 0 0 0 0 0 0 0 0 0 0 0 0Leicestershire 0 6 0 10 0 12 0 0 0 0 0 28Lincolnshire 0 4 0 0 0 1 0 0 0 1 0 6City of London(1) 5,125 4,262 844 861 813 1,492 157 185 26 46 6,965 6,846Merseyside 0 0 0 0 0 0 0 0 0 0 0 0M’politan Police(1) 8,830 13,557 1,460 2,791 2,020 4,515 857 1,397 173 441 13,340 22,701Norfolk 0 4 0 0 0 0 0 0 0 0 0 4Northamptonshire 0 132 0 14 0 10 0 21 0 19 0 196Northumbria 297 3 3 0 33 2 7 1 1 0 341 6N. Yorkshire 124 173 0 3 27 18 4 6 16 22 171 222Nottinghamshire 0 0 0 0 0 0 0 4 0 0 0 4S. Yorkshire 0 1 0 0 0 0 0 0 0 0 0 1Staffordshire 0 0 0 0 0 0 0 0 0 0 0 0Suffolk 0 2 0 0 0 0 0 0 0 0 0 2Surrey 845 1,329 28 61 54 116 9 22 2 24 938 1,552Sussex 2,089 0 97 0 246 0 96 0 61 0 2,589 0Thames Valley 78 103 7 59 22 85 5 5 2 7 114 259Warwickshire 0 13 0 1 0 4 0 0 0 0 0 18West Mercia 2 8 0 1 0 0 0 0 0 0 2 9West Midlands 0 0 0 0 0 0 1 0 0 0 1 0W. Yorkshire 21 258 1 29 1 89 1 36 2 25 26 437Wiltshire 0 1 0 0 0 0 0 0 0 1 0 2
Dyfed Powys 0 2 0 0 0 0 0 0 0 0 0 2Gwent 0 2 0 0 0 3 0 0 0 1 0 6North Wales 1 31 0 0 0 1 0 1 0 1 1 34South Wales 1,563 2,017 10 12 22 41 8 9 1 24 1604 2,103
Eng. & Wales(1) 24,771 30,837 2,742 4,155 3,693 6,805 1,428 1,937 543 809 33,177 44,543
(1) Revised figures for 2004/5.Note: ‘0’ indicates no stop and searches were carried out under these powers during the time periods shown.
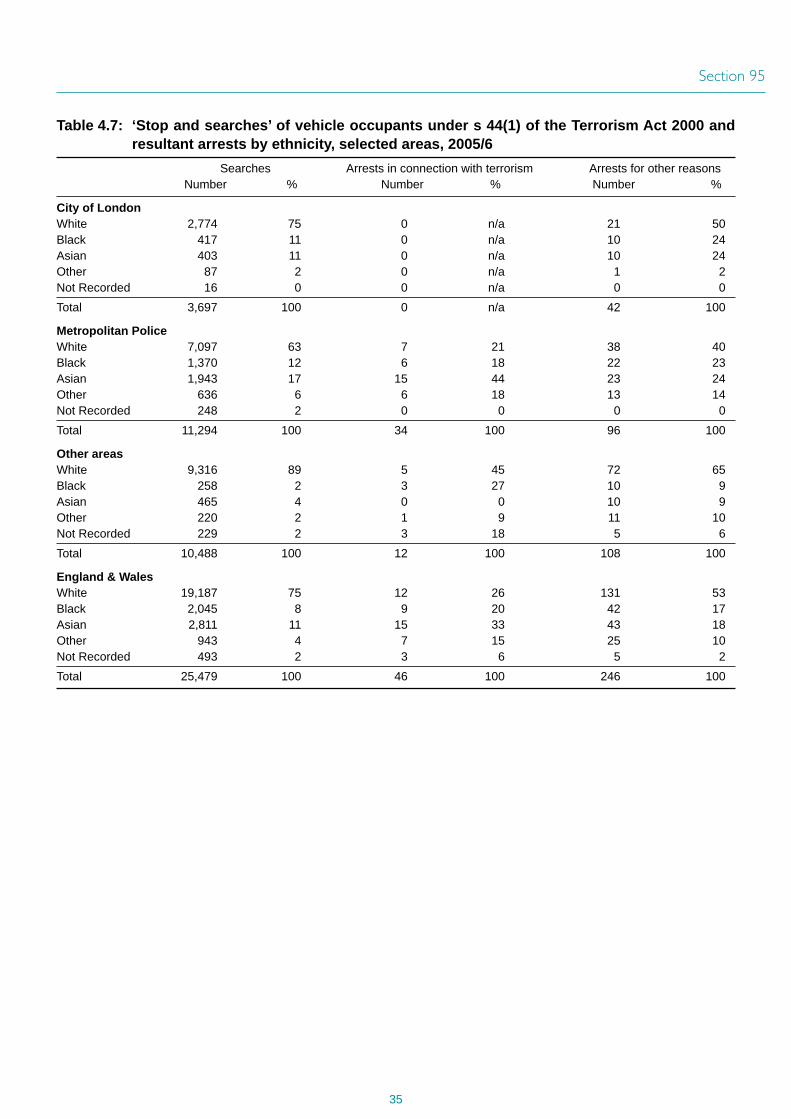
Section 95
35
Table 4.7: ‘Stop and searches’ of vehicle occupants under s 44(1) of the Terrorism Act 2000 and resultant arrests by ethnicity, selected areas, 2005/6
Searches Arrests in connection with terrorism Arrests for other reasons Number % Number % Number %
City of London White 2,774 75 0 n/a 21 50Black 417 11 0 n/a 10 24Asian 403 11 0 n/a 10 24Other 87 2 0 n/a 1 2Not Recorded 16 0 0 n/a 0 0
Total 3,697 100 0 n/a 42 100
Metropolitan Police White 7,097 63 7 21 38 40Black 1,370 12 6 18 22 23Asian 1,943 17 15 44 23 24Other 636 6 6 18 13 14Not Recorded 248 2 0 0 0 0
Total 11,294 100 34 100 96 100
Other areas White 9,316 89 5 45 72 65Black 258 2 3 27 10 9Asian 465 4 0 0 10 9Other 220 2 1 9 11 10Not Recorded 229 2 3 18 5 6
Total 10,488 100 12 100 108 100
England & Wales White 19,187 75 12 26 131 53Black 2,045 8 9 20 42 17Asian 2,811 11 15 33 43 18Other 943 4 7 15 25 10Not Recorded 493 2 3 6 5 2
Total 25,479 100 46 100 246 100
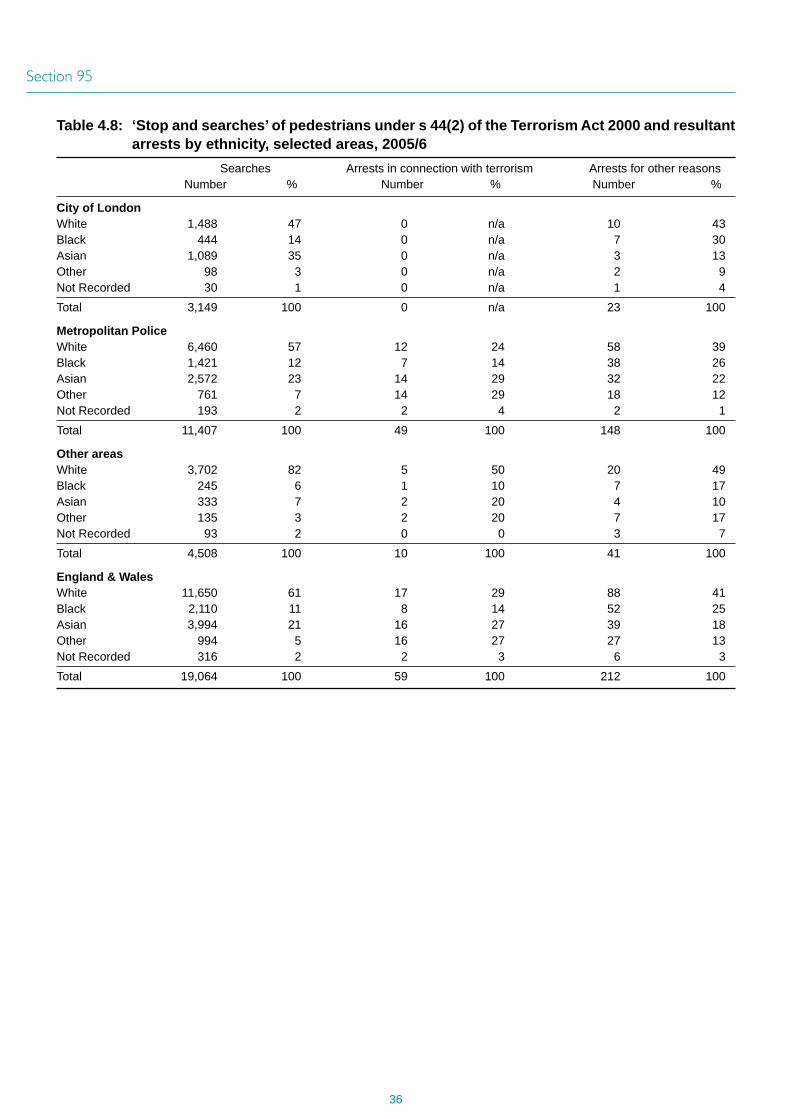
Section 95
36
Table 4.8: ‘Stop and searches’ of pedestrians under s 44(2) of the Terrorism Act 2000 and resultant arrests by ethnicity, selected areas, 2005/6
Searches Arrests in connection with terrorism Arrests for other reasons Number % Number % Number %
City of London White 1,488 47 0 n/a 10 43Black 444 14 0 n/a 7 30Asian 1,089 35 0 n/a 3 13Other 98 3 0 n/a 2 9Not Recorded 30 1 0 n/a 1 4
Total 3,149 100 0 n/a 23 100
Metropolitan Police White 6,460 57 12 24 58 39Black 1,421 12 7 14 38 26Asian 2,572 23 14 29 32 22Other 761 7 14 29 18 12Not Recorded 193 2 2 4 2 1
Total 11,407 100 49 100 148 100
Other areas White 3,702 82 5 50 20 49Black 245 6 1 10 7 17Asian 333 7 2 20 4 10Other 135 3 2 20 7 17Not Recorded 93 2 0 0 3 7
Total 4,508 100 10 100 41 100
England & Wales White 11,650 61 17 29 88 41Black 2,110 11 8 14 52 25Asian 3,994 21 16 27 39 18Other 994 5 16 27 27 13Not Recorded 316 2 2 3 6 3
Total 19,064 100 59 100 212 100
Section 95
37
Chapter 5: Arrests and cautions
Introduction
In recent years approximately 1.3 million persons suspected of committing a notifiable offence have been arrested each year, which increased to over 1.4 million people in 2005/6. An arrested suspect may be subsequently charged, cautioned or dealt with by other means, e.g. informal action or released without further action.
The figures on arrests for notifiable (recorded) offences in this publication are not strictly comparable with published Caution and Court Proceedings data. This is mainly because the aggregated offence categories for notifiable offences do not correspond directly with indictable (including triable either way) offence groups. In addition, Court Proceedings figures relate to the year of the final court decision rather than the year of the arrest, which may be different.
For cautioning, it is important to note the following points:
l In cases where cautioning is an option, the offender’s eligibility to be cautioned depends on a number of factors, including whether they admit committing the offence.
l The use of the caution varies also by offence group, so variations between ethnic groups may partly reflect ethnic differences in patterns of offending.
l For comparative purposes, cautions data have been restricted in this publication to cover only notifiable offences and excludes those cautioned for the majority of summary offences. This is, therefore, on a different basis to data published for indictable offences in other publications that exclude all summary offences.
l The Crime and Disorder Act 1998 introduced the use of reprimands and final warnings by the police in England and Wales for children and young offenders aged between 10 and 17 in place of cautions. The use of these sanctions started on 30 September 1998 in a number of pilot areas, and was rolled out to the rest of England and Wales on 1 June 2000. The figures presented here for cautions also include these two sanctions.
Main Findings9
Arrests: Tables 5.1–5.5
Table 5.1 shows total arrests for notifiable offences by police force and ethnic appearance. There were 1,429,785 arrests for notifiable offences in 2005/06, an increase of just under 6% on the previous year (1,353,379 in 2004/05). Of these, 130,781 (9%) were recorded as being of Black people, 73,298 (5%) of Asian people, 19,300 (1.3%) of those in ‘Other’ groups. Compared with 2004/05, the number of arrests for Asian people increased by just over 11%, by 10% for Black people, by just under 5% for White people and declined by just under 1% for those in the ‘Other’ category.
9 Data reported here have been confirmed by individual police forces. Because of the dynamic nature of these data, the figures reported here may differ from those published elsewhere.
Section 95
38
Table 5.2 shows arrests for notifiable offences per 1,000 population by police force area and ethnicity. The figures for England and Wales show that in 2005/06 the arrest rate for a notifiable offence for Black people was 3.5 times the arrest rate for White people. The rates for people in the Asian and ‘Other’ category were closer to that for White people but still higher. These disproportionality ratios are similar to those reported since 2002/3.
In Table 5.3 just over seven per cent of arrests for notifiable offences are shown to have resulted from a stop and search under the Police and Criminal Evidence Act 1984 (PACE). Higher proportions were noted for both Black people (14%) and Asian people (10%) compared with White people (6%). These proportions for Black and Asian people have also risen compared with the previous year.
The proportion of these arrests resulting from stop and searches under PACE varied widely between police forces. The proportion of arrests for White people varied from 2% in Suffolk to 33% in the City of London10, and for Black people from 1% in Northumbria to 28% in the City of London. Outside the City of London, the highest proportion for White people was 14% in Staffordshire and for Black people it was 23% in Dyfed Powys. These variations are likely to reflect the way different forces police their population, particularly London.
In the next two tables, breakdowns for arrests for notifiable offences in the ten police force areas with the largest Black and Minority Ethnic populations are given for offence group (Table 5.4) and age group (Table 5.5). The main differences between ethnic groups were in the offence groups, with a greater tendency for White people to be arrested for criminal damage and burglary, Black people for Robbery and Fraud and Forgery, and Asian people for Fraud and Forgery. There were variations across forces in the proportions of individuals from different ethnic groups being arrested for specific types of offences.
Although for England and Wales Black members of the 10-17 age group represented less than 10% of that age group arrested for notifiable offences, there was considerable variation between police force areas. For example, in the Metropolitan police force area, the proportion was 39% and in the West Midlands they accounted for just under 16%. This contrasts with Lancashire where the proportion was only 2.3%.
Cautions: Tables 5.6–5.9
The use of police cautioning is normally described in terms of the relationship between the number of persons cautioned by the police and the number of persons convicted at courts. Since there is still no comprehensive analysis currently available for court results, a comparison has been made here (Table 5.7) between the total number of persons arrested by the police and the number of persons cautioned.
In 2005, 285,116 persons were cautioned for notifiable offences, an increase of 20% on the previous year (Table 5.6). Of these, 238,088 (84%) were recorded as White people), 17,979 (6%) were Black people, 12,705 (4%) were Asian, and 3,855 (1%) were in the ‘Other’ group. These proportions were very similar to that recorded for the previous year.
The use of the caution for different ethnic groups varied across police force areas. For example, in England and Wales, the proportion of White persons receiving a caution ranged from 99% of the total for that area in Cheshire and Durham to 53% in Nottinghamshire. For Black people the range was 27% of the total in the Met to none in Cheshire. The range for Asian people was smaller with the highest proportion being recorded in the West Midlands (11%) and the lowest again in Cheshire (0%).
10 See Introduction for discussion on City of London population estimates.
Section 95
39
A comparison by ethnic group has been made between the total number of persons arrested by the police for notifiable offences and the number of persons cautioned for these offences (Table 5.7). For England and Wales, although 20% of arrests were recorded as resulting in a caution, this proportion was somewhat higher than that recorded for members of Black (14%) and Asian (17%) groups. On a force by force examination considerable variation in arrests resulting in a caution can be noted. However, in the vast majority of forces (95%) there was a lower use of cautioning for Black offenders compared to White offenders. There was also a lower use of cautioning for Asian offenders compared with White offenders in 81% of forces. However, the type and seriousness of the offence, the preparedness of the individual to admit guilt, whether the police regard the offender as showing remorse as well as local cautioning policy and practice may all contribute to variations in the use of Cautions.
For those aged up to 21 years, the proportion cautioned in England and Wales who were White slightly decreased with age (Table 5.8). In contrast, the proportion of those cautioned who came from minority ethnic groups tended to increase with age.
The percentage breakdown by ethnic appearance of persons cautioned for notifiable offences by offence group in selected police force areas is provided in Table 5.9. Nationally there is little change from the previous year. The pattern continues to vary between different ethnic groups in respect of the offence group for which they were cautioned. For White offenders their highest proportion relative to other ethnic groups was for Burglary (90%), for Black offenders Robbery (34%) and for Asian offenders Fraud and Forgery (9%).
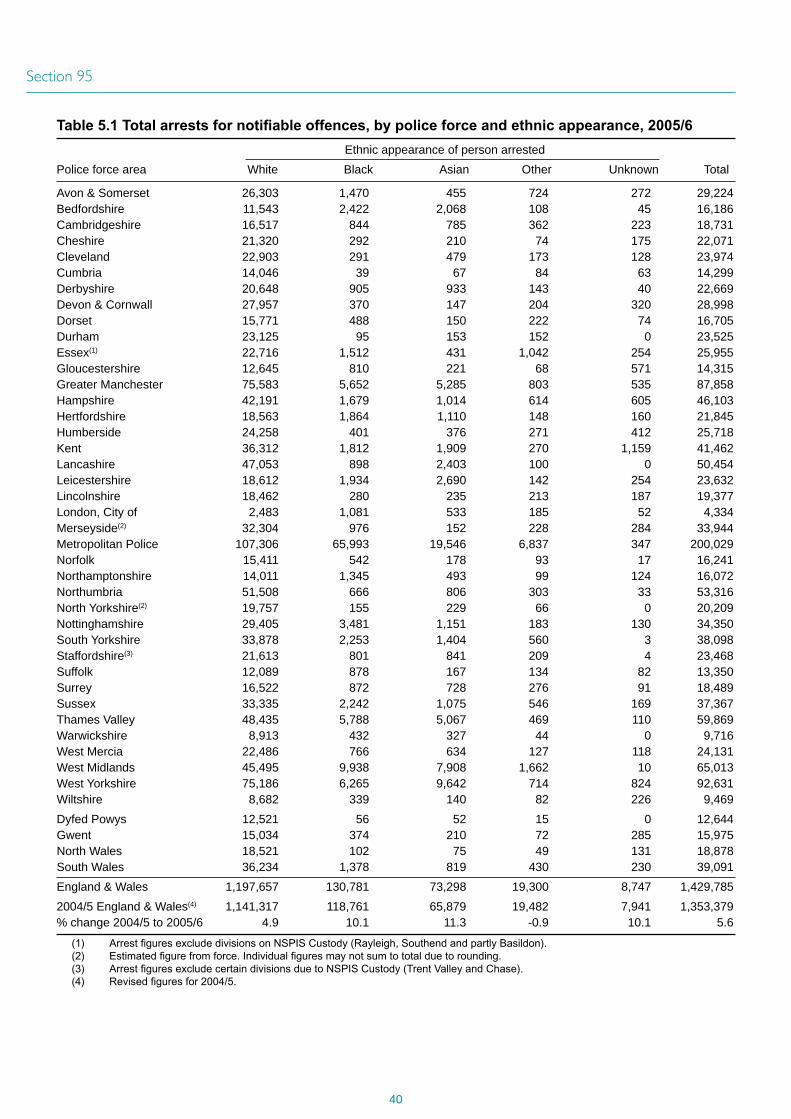
Section 95
40
Table 5.1 Total arrests for notifiable offences, by police force and ethnic appearance, 2005/6
Ethnic appearance of person arrested
Police force area White Black Asian Other Unknown Total
Avon & Somerset 26,303 1,470 455 724 272 29,224Bedfordshire 11,543 2,422 2,068 108 45 16,186Cambridgeshire 16,517 844 785 362 223 18,731Cheshire 21,320 292 210 74 175 22,071Cleveland 22,903 291 479 173 128 23,974Cumbria 14,046 39 67 84 63 14,299Derbyshire 20,648 905 933 143 40 22,669Devon & Cornwall 27,957 370 147 204 320 28,998Dorset 15,771 488 150 222 74 16,705Durham 23,125 95 153 152 0 23,525Essex(1) 22,716 1,512 431 1,042 254 25,955Gloucestershire 12,645 810 221 68 571 14,315Greater Manchester 75,583 5,652 5,285 803 535 87,858Hampshire 42,191 1,679 1,014 614 605 46,103Hertfordshire 18,563 1,864 1,110 148 160 21,845Humberside 24,258 401 376 271 412 25,718Kent 36,312 1,812 1,909 270 1,159 41,462Lancashire 47,053 898 2,403 100 0 50,454Leicestershire 18,612 1,934 2,690 142 254 23,632Lincolnshire 18,462 280 235 213 187 19,377London, City of 2,483 1,081 533 185 52 4,334Merseyside(2) 32,304 976 152 228 284 33,944Metropolitan Police 107,306 65,993 19,546 6,837 347 200,029Norfolk 15,411 542 178 93 17 16,241Northamptonshire 14,011 1,345 493 99 124 16,072Northumbria 51,508 666 806 303 33 53,316North Yorkshire(2) 19,757 155 229 66 0 20,209Nottinghamshire 29,405 3,481 1,151 183 130 34,350South Yorkshire 33,878 2,253 1,404 560 3 38,098Staffordshire(3) 21,613 801 841 209 4 23,468Suffolk 12,089 878 167 134 82 13,350Surrey 16,522 872 728 276 91 18,489Sussex 33,335 2,242 1,075 546 169 37,367Thames Valley 48,435 5,788 5,067 469 110 59,869Warwickshire 8,913 432 327 44 0 9,716West Mercia 22,486 766 634 127 118 24,131West Midlands 45,495 9,938 7,908 1,662 10 65,013West Yorkshire 75,186 6,265 9,642 714 824 92,631Wiltshire 8,682 339 140 82 226 9,469
Dyfed Powys 12,521 56 52 15 0 12,644Gwent 15,034 374 210 72 285 15,975North Wales 18,521 102 75 49 131 18,878South Wales 36,234 1,378 819 430 230 39,091
England & Wales 1,197,657 130,781 73,298 19,300 8,747 1,429,785
2004/5 England & Wales(4) 1,141,317 118,761 65,879 19,482 7,941 1,353,379% change 2004/5 to 2005/6 4.9 10.1 11.3 -0.9 10.1 5.6
(1) Arrest figures exclude divisions on NSPIS Custody (Rayleigh, Southend and partly Basildon). (2) Estimated figure from force. Individual figures may not sum to total due to rounding. (3) Arrest figures exclude certain divisions due to NSPIS Custody (Trent Valley and Chase). (4) Revised figures for 2004/5.
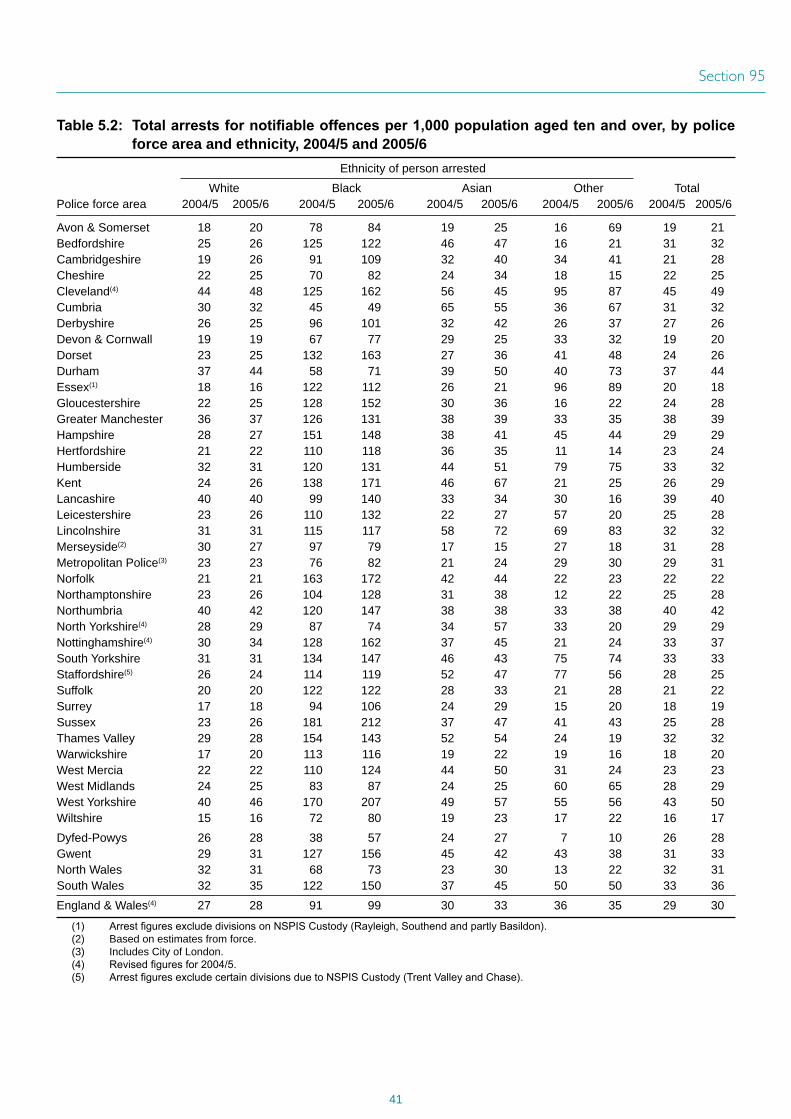
Section 95
41
Table 5.2: Total arrests for notifiable offences per 1,000 population aged ten and over, by police force area and ethnicity, 2004/5 and 2005/6
Ethnicity of person arrested
White Black Asian Other Total Police force area 2004/5 2005/6 2004/5 2005/6 2004/5 2005/6 2004/5 2005/6 2004/5 2005/6
Avon & Somerset 18 20 78 84 19 25 16 69 19 21Bedfordshire 25 26 125 122 46 47 16 21 31 32Cambridgeshire 19 26 91 109 32 40 34 41 21 28Cheshire 22 25 70 82 24 34 18 15 22 25Cleveland(4) 44 48 125 162 56 45 95 87 45 49Cumbria 30 32 45 49 65 55 36 67 31 32Derbyshire 26 25 96 101 32 42 26 37 27 26Devon & Cornwall 19 19 67 77 29 25 33 32 19 20Dorset 23 25 132 163 27 36 41 48 24 26Durham 37 44 58 71 39 50 40 73 37 44Essex(1) 18 16 122 112 26 21 96 89 20 18Gloucestershire 22 25 128 152 30 36 16 22 24 28Greater Manchester 36 37 126 131 38 39 33 35 38 39Hampshire 28 27 151 148 38 41 45 44 29 29Hertfordshire 21 22 110 118 36 35 11 14 23 24Humberside 32 31 120 131 44 51 79 75 33 32Kent 24 26 138 171 46 67 21 25 26 29Lancashire 40 40 99 140 33 34 30 16 39 40Leicestershire 23 26 110 132 22 27 57 20 25 28Lincolnshire 31 31 115 117 58 72 69 83 32 32Merseyside(2) 30 27 97 79 17 15 27 18 31 28Metropolitan Police(3) 23 23 76 82 21 24 29 30 29 31Norfolk 21 21 163 172 42 44 22 23 22 22Northamptonshire 23 26 104 128 31 38 12 22 25 28Northumbria 40 42 120 147 38 38 33 38 40 42North Yorkshire(4) 28 29 87 74 34 57 33 20 29 29Nottinghamshire(4) 30 34 128 162 37 45 21 24 33 37South Yorkshire 31 31 134 147 46 43 75 74 33 33Staffordshire(5) 26 24 114 119 52 47 77 56 28 25Suffolk 20 20 122 122 28 33 21 28 21 22Surrey 17 18 94 106 24 29 15 20 18 19Sussex 23 26 181 212 37 47 41 43 25 28Thames Valley 29 28 154 143 52 54 24 19 32 32Warwickshire 17 20 113 116 19 22 19 16 18 20West Mercia 22 22 110 124 44 50 31 24 23 23West Midlands 24 25 83 87 24 25 60 65 28 29West Yorkshire 40 46 170 207 49 57 55 56 43 50Wiltshire 15 16 72 80 19 23 17 22 16 17
Dyfed-Powys 26 28 38 57 24 27 7 10 26 28Gwent 29 31 127 156 45 42 43 38 31 33North Wales 32 31 68 73 23 30 13 22 32 31South Wales 32 35 122 150 37 45 50 50 33 36
England & Wales(4) 27 28 91 99 30 33 36 35 29 30
(1) Arrest figures exclude divisions on NSPIS Custody (Rayleigh, Southend and partly Basildon). (2) Based on estimates from force. (3) Includes City of London. (4) Revised figures for 2004/5. (5) Arrest figures exclude certain divisions due to NSPIS Custody (Trent Valley and Chase).
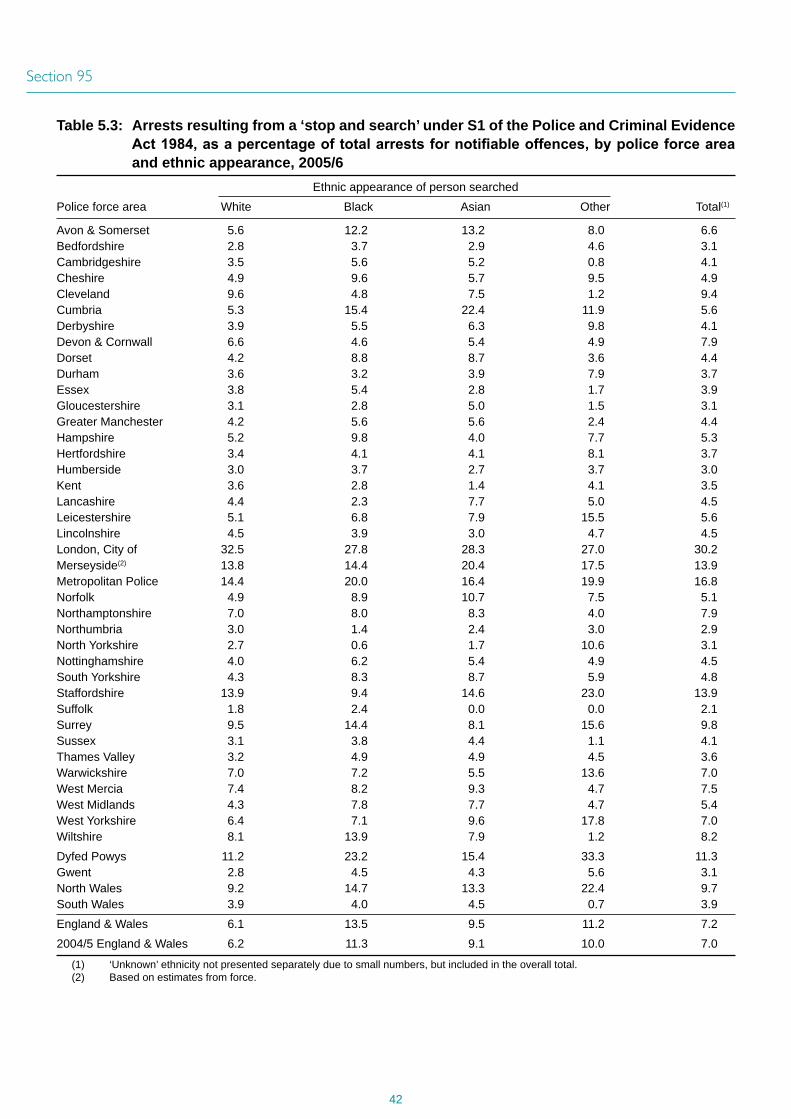
Section 95
42
Table 5.3: Arrests resulting from a ‘stop and search’ under S1 of the Police and Criminal Evidence Act 1984, as a percentage of total arrests for notifiable offences, by police force area and ethnic appearance, 2005/6
Ethnic appearance of person searched
Police force area White Black Asian Other Total(1)
Avon & Somerset 5.6 12.2 13.2 8.0 6.6Bedfordshire 2.8 3.7 2.9 4.6 3.1Cambridgeshire 3.5 5.6 5.2 0.8 4.1Cheshire 4.9 9.6 5.7 9.5 4.9Cleveland 9.6 4.8 7.5 1.2 9.4Cumbria 5.3 15.4 22.4 11.9 5.6Derbyshire 3.9 5.5 6.3 9.8 4.1Devon & Cornwall 6.6 4.6 5.4 4.9 7.9Dorset 4.2 8.8 8.7 3.6 4.4Durham 3.6 3.2 3.9 7.9 3.7Essex 3.8 5.4 2.8 1.7 3.9Gloucestershire 3.1 2.8 5.0 1.5 3.1Greater Manchester 4.2 5.6 5.6 2.4 4.4Hampshire 5.2 9.8 4.0 7.7 5.3Hertfordshire 3.4 4.1 4.1 8.1 3.7Humberside 3.0 3.7 2.7 3.7 3.0Kent 3.6 2.8 1.4 4.1 3.5Lancashire 4.4 2.3 7.7 5.0 4.5Leicestershire 5.1 6.8 7.9 15.5 5.6Lincolnshire 4.5 3.9 3.0 4.7 4.5London, City of 32.5 27.8 28.3 27.0 30.2Merseyside(2) 13.8 14.4 20.4 17.5 13.9Metropolitan Police 14.4 20.0 16.4 19.9 16.8Norfolk 4.9 8.9 10.7 7.5 5.1Northamptonshire 7.0 8.0 8.3 4.0 7.9Northumbria 3.0 1.4 2.4 3.0 2.9North Yorkshire 2.7 0.6 1.7 10.6 3.1Nottinghamshire 4.0 6.2 5.4 4.9 4.5South Yorkshire 4.3 8.3 8.7 5.9 4.8Staffordshire 13.9 9.4 14.6 23.0 13.9Suffolk 1.8 2.4 0.0 0.0 2.1Surrey 9.5 14.4 8.1 15.6 9.8Sussex 3.1 3.8 4.4 1.1 4.1Thames Valley 3.2 4.9 4.9 4.5 3.6Warwickshire 7.0 7.2 5.5 13.6 7.0West Mercia 7.4 8.2 9.3 4.7 7.5West Midlands 4.3 7.8 7.7 4.7 5.4West Yorkshire 6.4 7.1 9.6 17.8 7.0Wiltshire 8.1 13.9 7.9 1.2 8.2
Dyfed Powys 11.2 23.2 15.4 33.3 11.3Gwent 2.8 4.5 4.3 5.6 3.1North Wales 9.2 14.7 13.3 22.4 9.7South Wales 3.9 4.0 4.5 0.7 3.9
England & Wales 6.1 13.5 9.5 11.2 7.2
2004/5 England & Wales 6.2 11.3 9.1 10.0 7.0
(1) ‘Unknown’ ethnicity not presented separately due to small numbers, but included in the overall total.(2) Based on estimates from force.
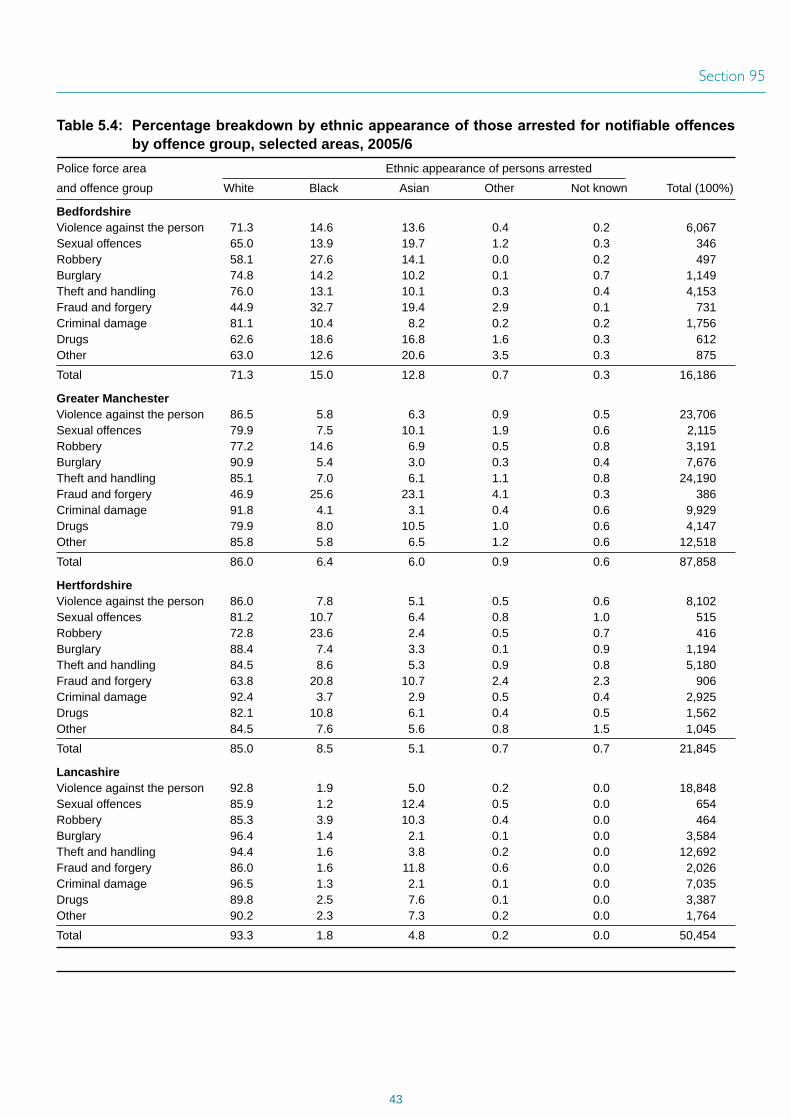
Section 95
43
Table 5.4: Percentage breakdown by ethnic appearance of those arrested for notifiable offences by offence group, selected areas, 2005/6
Police force area Ethnic appearance of persons arrested
and offence group White Black Asian Other Not known Total (100%)
Bedfordshire Violence against the person 71.3 14.6 13.6 0.4 0.2 6,067Sexual offences 65.0 13.9 19.7 1.2 0.3 346Robbery 58.1 27.6 14.1 0.0 0.2 497Burglary 74.8 14.2 10.2 0.1 0.7 1,149Theft and handling 76.0 13.1 10.1 0.3 0.4 4,153Fraud and forgery 44.9 32.7 19.4 2.9 0.1 731Criminal damage 81.1 10.4 8.2 0.2 0.2 1,756Drugs 62.6 18.6 16.8 1.6 0.3 612Other 63.0 12.6 20.6 3.5 0.3 875
Total 71.3 15.0 12.8 0.7 0.3 16,186
Greater Manchester Violence against the person 86.5 5.8 6.3 0.9 0.5 23,706Sexual offences 79.9 7.5 10.1 1.9 0.6 2,115Robbery 77.2 14.6 6.9 0.5 0.8 3,191Burglary 90.9 5.4 3.0 0.3 0.4 7,676Theft and handling 85.1 7.0 6.1 1.1 0.8 24,190Fraud and forgery 46.9 25.6 23.1 4.1 0.3 386Criminal damage 91.8 4.1 3.1 0.4 0.6 9,929Drugs 79.9 8.0 10.5 1.0 0.6 4,147Other 85.8 5.8 6.5 1.2 0.6 12,518
Total 86.0 6.4 6.0 0.9 0.6 87,858
Hertfordshire Violence against the person 86.0 7.8 5.1 0.5 0.6 8,102Sexual offences 81.2 10.7 6.4 0.8 1.0 515Robbery 72.8 23.6 2.4 0.5 0.7 416Burglary 88.4 7.4 3.3 0.1 0.9 1,194Theft and handling 84.5 8.6 5.3 0.9 0.8 5,180Fraud and forgery 63.8 20.8 10.7 2.4 2.3 906Criminal damage 92.4 3.7 2.9 0.5 0.4 2,925Drugs 82.1 10.8 6.1 0.4 0.5 1,562Other 84.5 7.6 5.6 0.8 1.5 1,045
Total 85.0 8.5 5.1 0.7 0.7 21,845
Lancashire Violence against the person 92.8 1.9 5.0 0.2 0.0 18,848Sexual offences 85.9 1.2 12.4 0.5 0.0 654Robbery 85.3 3.9 10.3 0.4 0.0 464Burglary 96.4 1.4 2.1 0.1 0.0 3,584Theft and handling 94.4 1.6 3.8 0.2 0.0 12,692Fraud and forgery 86.0 1.6 11.8 0.6 0.0 2,026Criminal damage 96.5 1.3 2.1 0.1 0.0 7,035Drugs 89.8 2.5 7.6 0.1 0.0 3,387Other 90.2 2.3 7.3 0.2 0.0 1,764
Total 93.3 1.8 4.8 0.2 0.0 50,454
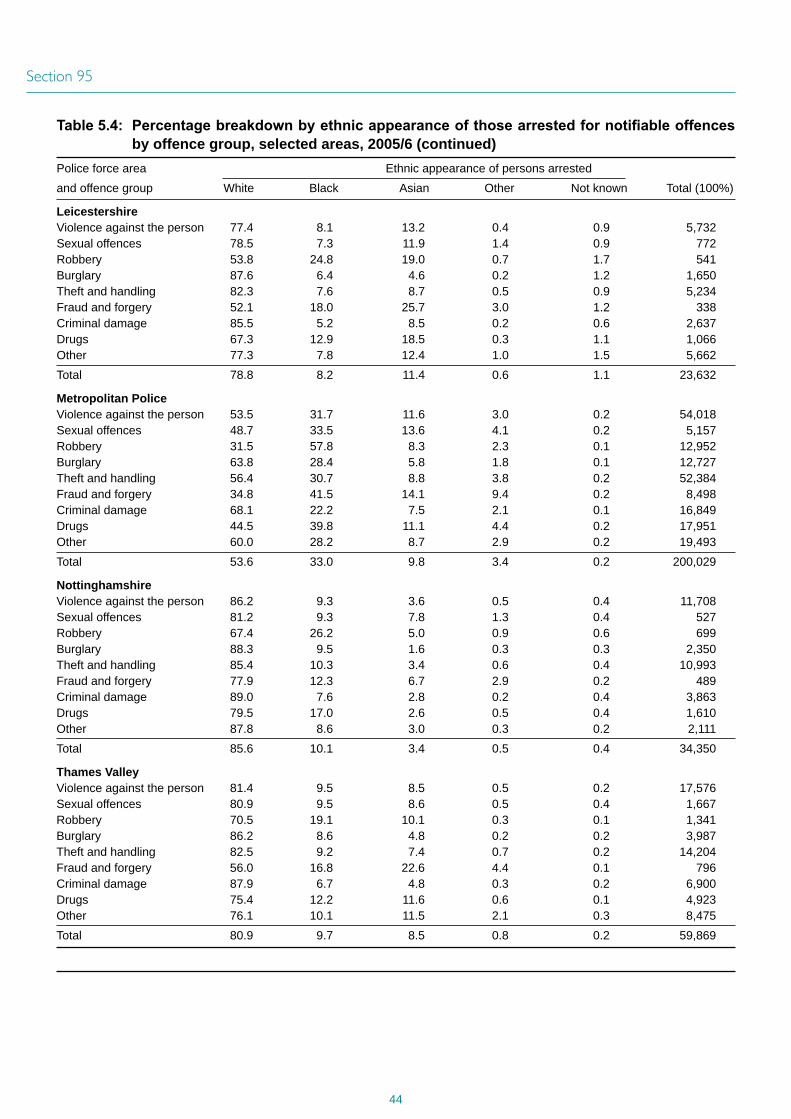
Section 95
44
Table 5.4: Percentage breakdown by ethnic appearance of those arrested for notifiable offences by offence group, selected areas, 2005/6 (continued)
Police force area Ethnic appearance of persons arrested
and offence group White Black Asian Other Not known Total (100%)
Leicestershire Violence against the person 77.4 8.1 13.2 0.4 0.9 5,732Sexual offences 78.5 7.3 11.9 1.4 0.9 772Robbery 53.8 24.8 19.0 0.7 1.7 541Burglary 87.6 6.4 4.6 0.2 1.2 1,650Theft and handling 82.3 7.6 8.7 0.5 0.9 5,234Fraud and forgery 52.1 18.0 25.7 3.0 1.2 338Criminal damage 85.5 5.2 8.5 0.2 0.6 2,637Drugs 67.3 12.9 18.5 0.3 1.1 1,066Other 77.3 7.8 12.4 1.0 1.5 5,662
Total 78.8 8.2 11.4 0.6 1.1 23,632
Metropolitan Police Violence against the person 53.5 31.7 11.6 3.0 0.2 54,018Sexual offences 48.7 33.5 13.6 4.1 0.2 5,157Robbery 31.5 57.8 8.3 2.3 0.1 12,952Burglary 63.8 28.4 5.8 1.8 0.1 12,727Theft and handling 56.4 30.7 8.8 3.8 0.2 52,384Fraud and forgery 34.8 41.5 14.1 9.4 0.2 8,498Criminal damage 68.1 22.2 7.5 2.1 0.1 16,849Drugs 44.5 39.8 11.1 4.4 0.2 17,951Other 60.0 28.2 8.7 2.9 0.2 19,493
Total 53.6 33.0 9.8 3.4 0.2 200,029
Nottinghamshire Violence against the person 86.2 9.3 3.6 0.5 0.4 11,708Sexual offences 81.2 9.3 7.8 1.3 0.4 527Robbery 67.4 26.2 5.0 0.9 0.6 699Burglary 88.3 9.5 1.6 0.3 0.3 2,350Theft and handling 85.4 10.3 3.4 0.6 0.4 10,993Fraud and forgery 77.9 12.3 6.7 2.9 0.2 489Criminal damage 89.0 7.6 2.8 0.2 0.4 3,863Drugs 79.5 17.0 2.6 0.5 0.4 1,610Other 87.8 8.6 3.0 0.3 0.2 2,111
Total 85.6 10.1 3.4 0.5 0.4 34,350
Thames Valley Violence against the person 81.4 9.5 8.5 0.5 0.2 17,576Sexual offences 80.9 9.5 8.6 0.5 0.4 1,667Robbery 70.5 19.1 10.1 0.3 0.1 1,341Burglary 86.2 8.6 4.8 0.2 0.2 3,987Theft and handling 82.5 9.2 7.4 0.7 0.2 14,204Fraud and forgery 56.0 16.8 22.6 4.4 0.1 796Criminal damage 87.9 6.7 4.8 0.3 0.2 6,900Drugs 75.4 12.2 11.6 0.6 0.1 4,923Other 76.1 10.1 11.5 2.1 0.3 8,475
Total 80.9 9.7 8.5 0.8 0.2 59,869
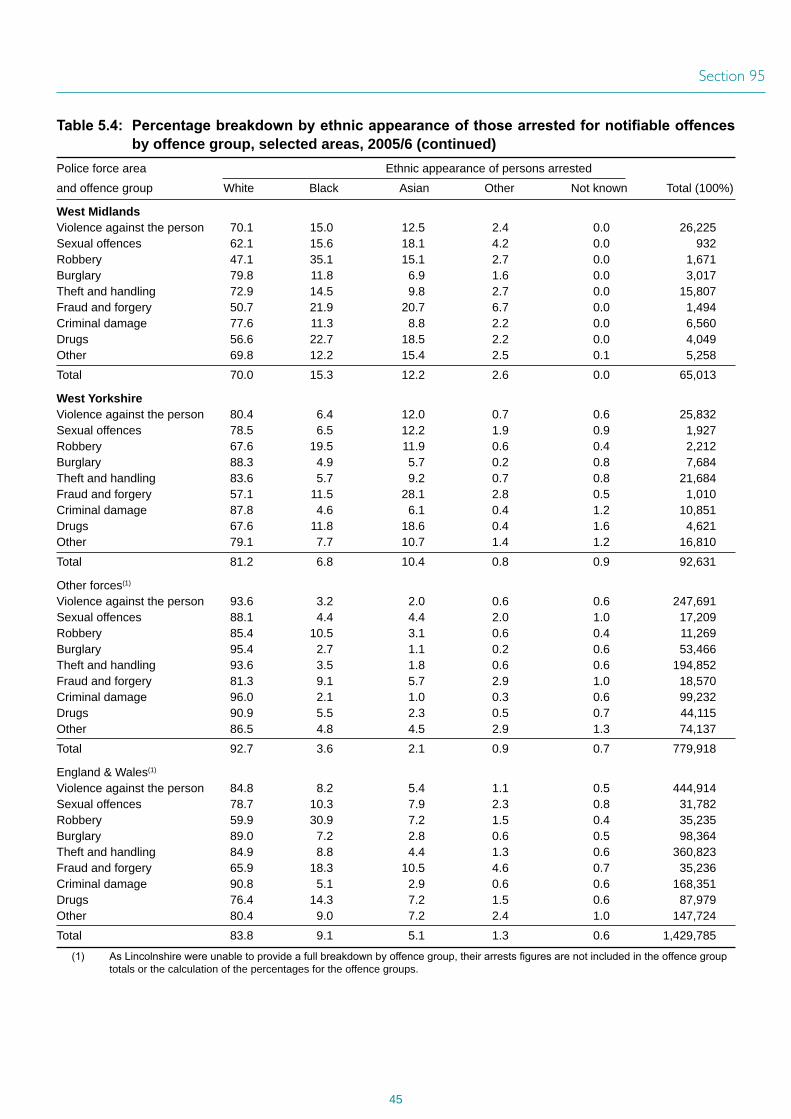
Section 95
45
Table 5.4: Percentage breakdown by ethnic appearance of those arrested for notifiable offences by offence group, selected areas, 2005/6 (continued)
Police force area Ethnic appearance of persons arrested
and offence group White Black Asian Other Not known Total (100%)
West Midlands Violence against the person 70.1 15.0 12.5 2.4 0.0 26,225Sexual offences 62.1 15.6 18.1 4.2 0.0 932Robbery 47.1 35.1 15.1 2.7 0.0 1,671Burglary 79.8 11.8 6.9 1.6 0.0 3,017Theft and handling 72.9 14.5 9.8 2.7 0.0 15,807Fraud and forgery 50.7 21.9 20.7 6.7 0.0 1,494Criminal damage 77.6 11.3 8.8 2.2 0.0 6,560Drugs 56.6 22.7 18.5 2.2 0.0 4,049Other 69.8 12.2 15.4 2.5 0.1 5,258
Total 70.0 15.3 12.2 2.6 0.0 65,013
West Yorkshire Violence against the person 80.4 6.4 12.0 0.7 0.6 25,832Sexual offences 78.5 6.5 12.2 1.9 0.9 1,927Robbery 67.6 19.5 11.9 0.6 0.4 2,212Burglary 88.3 4.9 5.7 0.2 0.8 7,684Theft and handling 83.6 5.7 9.2 0.7 0.8 21,684Fraud and forgery 57.1 11.5 28.1 2.8 0.5 1,010Criminal damage 87.8 4.6 6.1 0.4 1.2 10,851Drugs 67.6 11.8 18.6 0.4 1.6 4,621Other 79.1 7.7 10.7 1.4 1.2 16,810
Total 81.2 6.8 10.4 0.8 0.9 92,631
Other forces(1) Violence against the person 93.6 3.2 2.0 0.6 0.6 247,691Sexual offences 88.1 4.4 4.4 2.0 1.0 17,209Robbery 85.4 10.5 3.1 0.6 0.4 11,269Burglary 95.4 2.7 1.1 0.2 0.6 53,466Theft and handling 93.6 3.5 1.8 0.6 0.6 194,852Fraud and forgery 81.3 9.1 5.7 2.9 1.0 18,570Criminal damage 96.0 2.1 1.0 0.3 0.6 99,232Drugs 90.9 5.5 2.3 0.5 0.7 44,115Other 86.5 4.8 4.5 2.9 1.3 74,137
Total 92.7 3.6 2.1 0.9 0.7 779,918
England & Wales(1) Violence against the person 84.8 8.2 5.4 1.1 0.5 444,914Sexual offences 78.7 10.3 7.9 2.3 0.8 31,782Robbery 59.9 30.9 7.2 1.5 0.4 35,235Burglary 89.0 7.2 2.8 0.6 0.5 98,364Theft and handling 84.9 8.8 4.4 1.3 0.6 360,823Fraud and forgery 65.9 18.3 10.5 4.6 0.7 35,236Criminal damage 90.8 5.1 2.9 0.6 0.6 168,351Drugs 76.4 14.3 7.2 1.5 0.6 87,979Other 80.4 9.0 7.2 2.4 1.0 147,724
Total 83.8 9.1 5.1 1.3 0.6 1,429,785
(1) As Lincolnshire were unable to provide a full breakdown by offence group, their arrests figures are not included in the offence group totals or the calculation of the percentages for the offence groups.
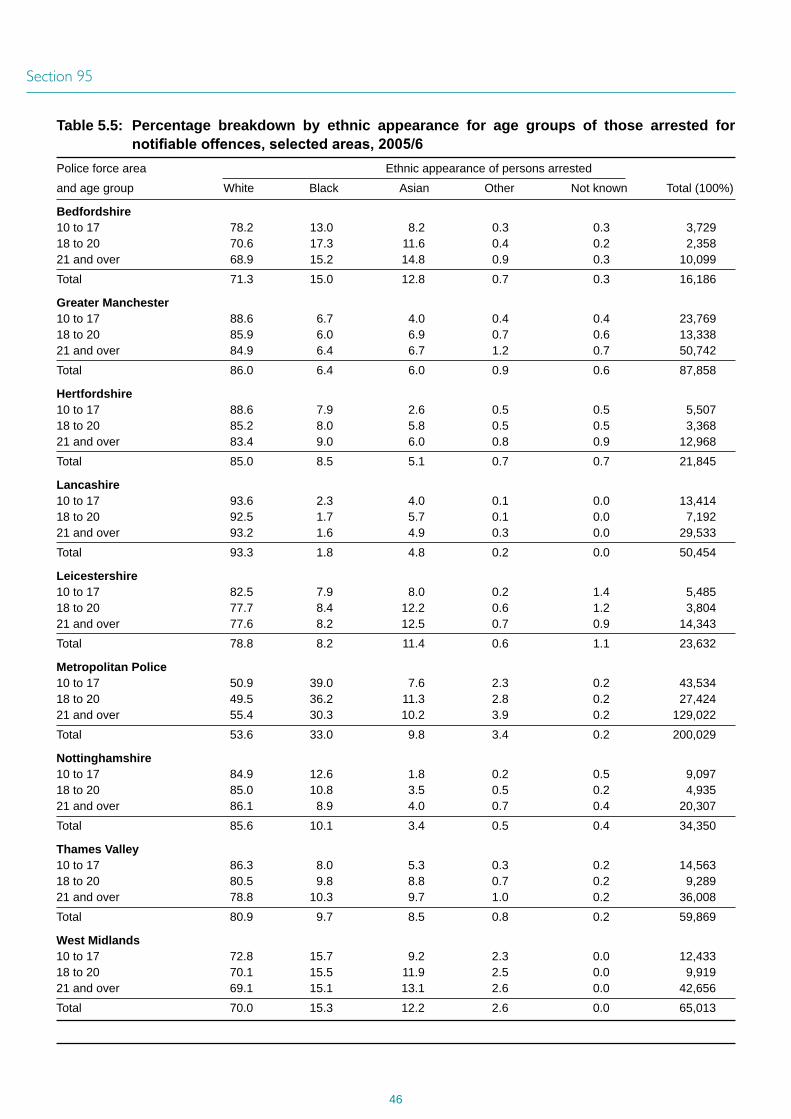
Section 95
46
Table 5.5: Percentage breakdown by ethnic appearance for age groups of those arrested for notifiable offences, selected areas, 2005/6
Police force area Ethnic appearance of persons arrested
and age group White Black Asian Other Not known Total (100%)
Bedfordshire 10 to 17 78.2 13.0 8.2 0.3 0.3 3,72918 to 20 70.6 17.3 11.6 0.4 0.2 2,35821 and over 68.9 15.2 14.8 0.9 0.3 10,099
Total 71.3 15.0 12.8 0.7 0.3 16,186
Greater Manchester 10 to 17 88.6 6.7 4.0 0.4 0.4 23,76918 to 20 85.9 6.0 6.9 0.7 0.6 13,33821 and over 84.9 6.4 6.7 1.2 0.7 50,742
Total 86.0 6.4 6.0 0.9 0.6 87,858
Hertfordshire 10 to 17 88.6 7.9 2.6 0.5 0.5 5,50718 to 20 85.2 8.0 5.8 0.5 0.5 3,36821 and over 83.4 9.0 6.0 0.8 0.9 12,968
Total 85.0 8.5 5.1 0.7 0.7 21,845
Lancashire 10 to 17 93.6 2.3 4.0 0.1 0.0 13,41418 to 20 92.5 1.7 5.7 0.1 0.0 7,19221 and over 93.2 1.6 4.9 0.3 0.0 29,533
Total 93.3 1.8 4.8 0.2 0.0 50,454
Leicestershire 10 to 17 82.5 7.9 8.0 0.2 1.4 5,48518 to 20 77.7 8.4 12.2 0.6 1.2 3,80421 and over 77.6 8.2 12.5 0.7 0.9 14,343
Total 78.8 8.2 11.4 0.6 1.1 23,632
Metropolitan Police 10 to 17 50.9 39.0 7.6 2.3 0.2 43,53418 to 20 49.5 36.2 11.3 2.8 0.2 27,42421 and over 55.4 30.3 10.2 3.9 0.2 129,022
Total 53.6 33.0 9.8 3.4 0.2 200,029
Nottinghamshire 10 to 17 84.9 12.6 1.8 0.2 0.5 9,09718 to 20 85.0 10.8 3.5 0.5 0.2 4,93521 and over 86.1 8.9 4.0 0.7 0.4 20,307
Total 85.6 10.1 3.4 0.5 0.4 34,350
Thames Valley 10 to 17 86.3 8.0 5.3 0.3 0.2 14,56318 to 20 80.5 9.8 8.8 0.7 0.2 9,28921 and over 78.8 10.3 9.7 1.0 0.2 36,008
Total 80.9 9.7 8.5 0.8 0.2 59,869
West Midlands 10 to 17 72.8 15.7 9.2 2.3 0.0 12,43318 to 20 70.1 15.5 11.9 2.5 0.0 9,91921 and over 69.1 15.1 13.1 2.6 0.0 42,656
Total 70.0 15.3 12.2 2.6 0.0 65,013
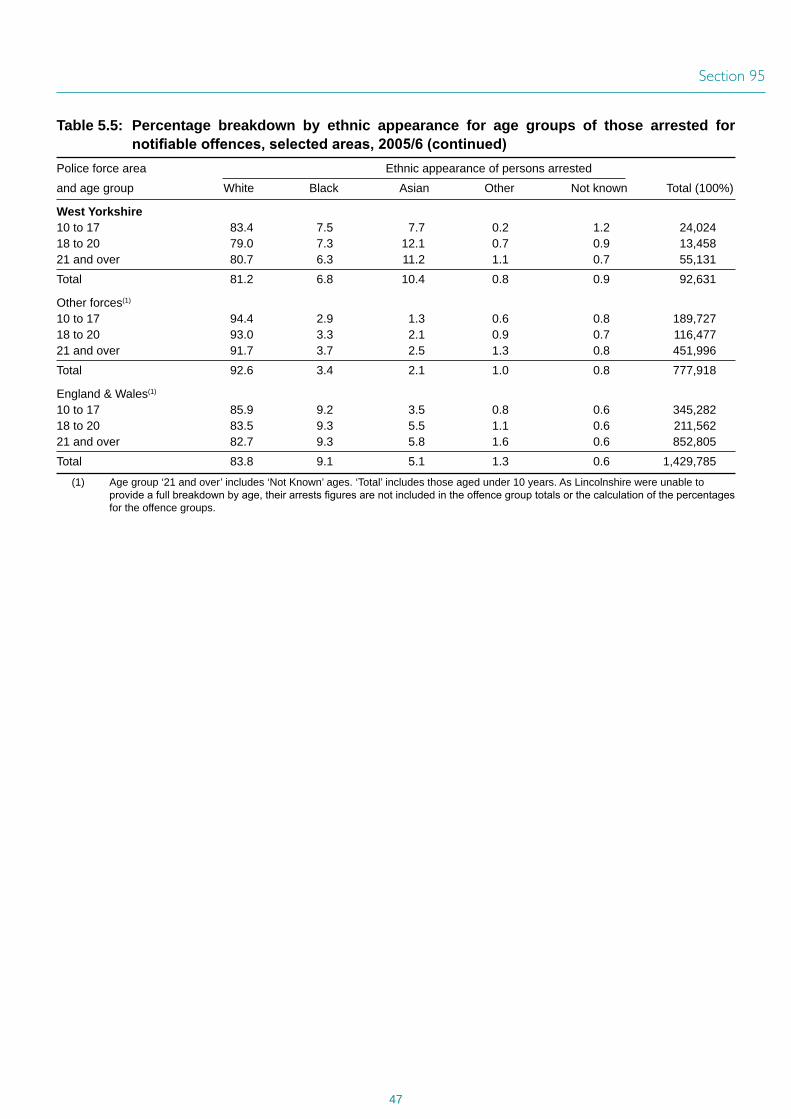
Section 95
47
Table 5.5: Percentage breakdown by ethnic appearance for age groups of those arrested for notifiable offences, selected areas, 2005/6 (continued)
Police force area Ethnic appearance of persons arrested
and age group White Black Asian Other Not known Total (100%)
West Yorkshire 10 to 17 83.4 7.5 7.7 0.2 1.2 24,02418 to 20 79.0 7.3 12.1 0.7 0.9 13,45821 and over 80.7 6.3 11.2 1.1 0.7 55,131
Total 81.2 6.8 10.4 0.8 0.9 92,631
Other forces(1) 10 to 17 94.4 2.9 1.3 0.6 0.8 189,72718 to 20 93.0 3.3 2.1 0.9 0.7 116,47721 and over 91.7 3.7 2.5 1.3 0.8 451,996
Total 92.6 3.4 2.1 1.0 0.8 777,918
England & Wales(1) 10 to 17 85.9 9.2 3.5 0.8 0.6 345,28218 to 20 83.5 9.3 5.5 1.1 0.6 211,56221 and over 82.7 9.3 5.8 1.6 0.6 852,805
Total 83.8 9.1 5.1 1.3 0.6 1,429,785
(1) Age group ‘21 and over’ includes ‘Not Known’ ages. ‘Total’ includes those aged under 10 years. As Lincolnshire were unable to provide a full breakdown by age, their arrests figures are not included in the offence group totals or the calculation of the percentages for the offence groups.
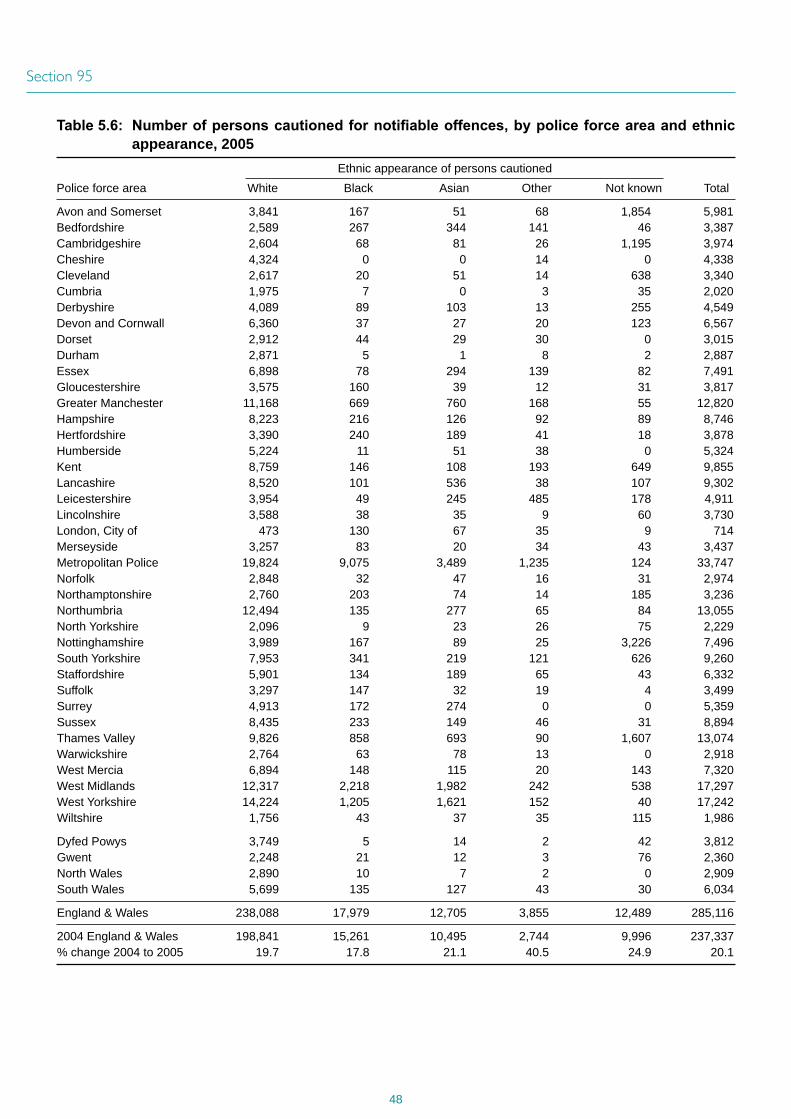
Section 95
48
Table 5.6: Number of persons cautioned for notifiable offences, by police force area and ethnic appearance, 2005
Ethnic appearance of persons cautioned
Police force area White Black Asian Other Not known Total
Avon and Somerset 3,841 167 51 68 1,854 5,981Bedfordshire 2,589 267 344 141 46 3,387Cambridgeshire 2,604 68 81 26 1,195 3,974Cheshire 4,324 0 0 14 0 4,338Cleveland 2,617 20 51 14 638 3,340Cumbria 1,975 7 0 3 35 2,020Derbyshire 4,089 89 103 13 255 4,549Devon and Cornwall 6,360 37 27 20 123 6,567Dorset 2,912 44 29 30 0 3,015Durham 2,871 5 1 8 2 2,887Essex 6,898 78 294 139 82 7,491Gloucestershire 3,575 160 39 12 31 3,817Greater Manchester 11,168 669 760 168 55 12,820Hampshire 8,223 216 126 92 89 8,746Hertfordshire 3,390 240 189 41 18 3,878Humberside 5,224 11 51 38 0 5,324Kent 8,759 146 108 193 649 9,855Lancashire 8,520 101 536 38 107 9,302Leicestershire 3,954 49 245 485 178 4,911Lincolnshire 3,588 38 35 9 60 3,730London, City of 473 130 67 35 9 714Merseyside 3,257 83 20 34 43 3,437Metropolitan Police 19,824 9,075 3,489 1,235 124 33,747Norfolk 2,848 32 47 16 31 2,974Northamptonshire 2,760 203 74 14 185 3,236Northumbria 12,494 135 277 65 84 13,055North Yorkshire 2,096 9 23 26 75 2,229Nottinghamshire 3,989 167 89 25 3,226 7,496South Yorkshire 7,953 341 219 121 626 9,260Staffordshire 5,901 134 189 65 43 6,332Suffolk 3,297 147 32 19 4 3,499Surrey 4,913 172 274 0 0 5,359Sussex 8,435 233 149 46 31 8,894Thames Valley 9,826 858 693 90 1,607 13,074Warwickshire 2,764 63 78 13 0 2,918West Mercia 6,894 148 115 20 143 7,320West Midlands 12,317 2,218 1,982 242 538 17,297West Yorkshire 14,224 1,205 1,621 152 40 17,242Wiltshire 1,756 43 37 35 115 1,986
Dyfed Powys 3,749 5 14 2 42 3,812Gwent 2,248 21 12 3 76 2,360North Wales 2,890 10 7 2 0 2,909South Wales 5,699 135 127 43 30 6,034
England & Wales 238,088 17,979 12,705 3,855 12,489 285,116
2004 England & Wales 198,841 15,261 10,495 2,744 9,996 237,337% change 2004 to 2005 19.7 17.8 21.1 40.5 24.9 20.1
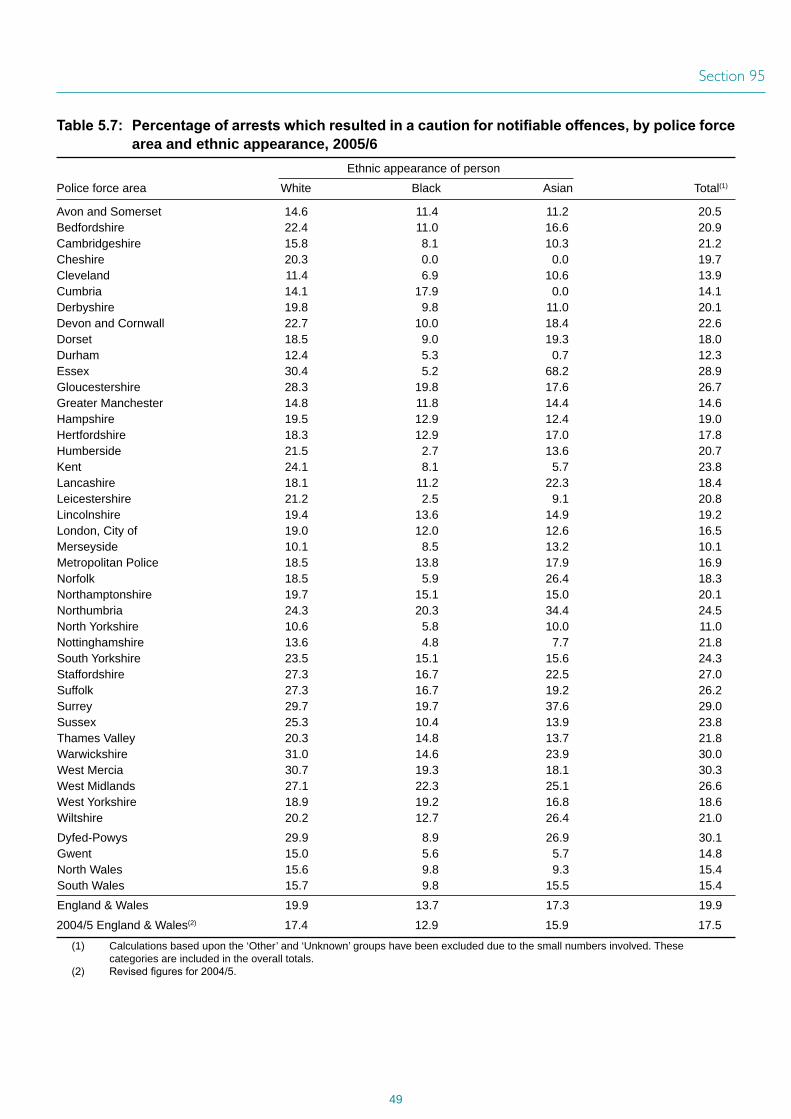
Section 95
49
Table 5.7: Percentage of arrests which resulted in a caution for notifiable offences, by police force area and ethnic appearance, 2005/6
Ethnic appearance of person
Police force area White Black Asian Total(1)
Avon and Somerset 14.6 11.4 11.2 20.5Bedfordshire 22.4 11.0 16.6 20.9Cambridgeshire 15.8 8.1 10.3 21.2Cheshire 20.3 0.0 0.0 19.7Cleveland 11.4 6.9 10.6 13.9Cumbria 14.1 17.9 0.0 14.1Derbyshire 19.8 9.8 11.0 20.1Devon and Cornwall 22.7 10.0 18.4 22.6Dorset 18.5 9.0 19.3 18.0Durham 12.4 5.3 0.7 12.3Essex 30.4 5.2 68.2 28.9Gloucestershire 28.3 19.8 17.6 26.7Greater Manchester 14.8 11.8 14.4 14.6Hampshire 19.5 12.9 12.4 19.0Hertfordshire 18.3 12.9 17.0 17.8Humberside 21.5 2.7 13.6 20.7Kent 24.1 8.1 5.7 23.8Lancashire 18.1 11.2 22.3 18.4Leicestershire 21.2 2.5 9.1 20.8Lincolnshire 19.4 13.6 14.9 19.2London, City of 19.0 12.0 12.6 16.5Merseyside 10.1 8.5 13.2 10.1Metropolitan Police 18.5 13.8 17.9 16.9Norfolk 18.5 5.9 26.4 18.3Northamptonshire 19.7 15.1 15.0 20.1Northumbria 24.3 20.3 34.4 24.5North Yorkshire 10.6 5.8 10.0 11.0Nottinghamshire 13.6 4.8 7.7 21.8South Yorkshire 23.5 15.1 15.6 24.3Staffordshire 27.3 16.7 22.5 27.0Suffolk 27.3 16.7 19.2 26.2Surrey 29.7 19.7 37.6 29.0Sussex 25.3 10.4 13.9 23.8Thames Valley 20.3 14.8 13.7 21.8Warwickshire 31.0 14.6 23.9 30.0West Mercia 30.7 19.3 18.1 30.3West Midlands 27.1 22.3 25.1 26.6West Yorkshire 18.9 19.2 16.8 18.6Wiltshire 20.2 12.7 26.4 21.0
Dyfed-Powys 29.9 8.9 26.9 30.1Gwent 15.0 5.6 5.7 14.8North Wales 15.6 9.8 9.3 15.4South Wales 15.7 9.8 15.5 15.4
England & Wales 19.9 13.7 17.3 19.9
2004/5 England & Wales(2) 17.4 12.9 15.9 17.5
(1) Calculations based upon the ‘Other’ and ‘Unknown’ groups have been excluded due to the small numbers involved. These categories are included in the overall totals.
(2) Revised figures for 2004/5.
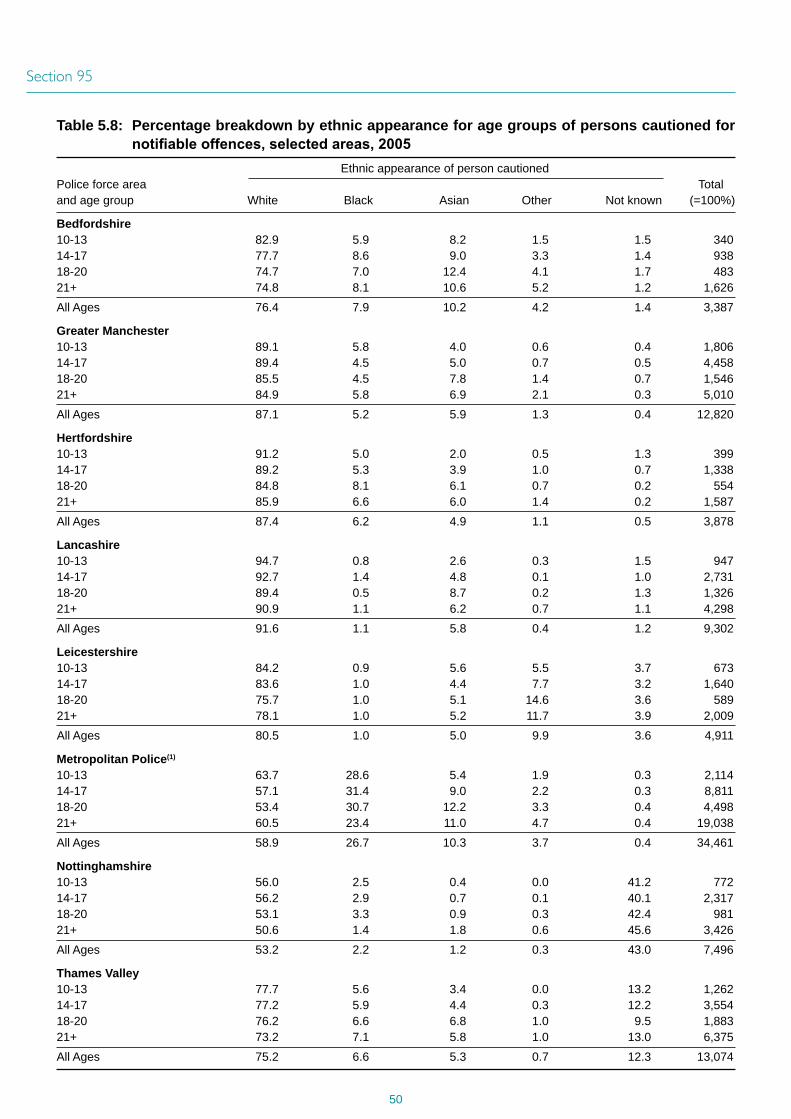
Section 95
50
Table 5.8: Percentage breakdown by ethnic appearance for age groups of persons cautioned for notifiable offences, selected areas, 2005
Ethnic appearance of person cautionedPolice force area Total and age group White Black Asian Other Not known (=100%)
Bedfordshire10-13 82.9 5.9 8.2 1.5 1.5 34014-17 77.7 8.6 9.0 3.3 1.4 93818-20 74.7 7.0 12.4 4.1 1.7 48321+ 74.8 8.1 10.6 5.2 1.2 1,626
All Ages 76.4 7.9 10.2 4.2 1.4 3,387
Greater Manchester10-13 89.1 5.8 4.0 0.6 0.4 1,80614-17 89.4 4.5 5.0 0.7 0.5 4,45818-20 85.5 4.5 7.8 1.4 0.7 1,54621+ 84.9 5.8 6.9 2.1 0.3 5,010
All Ages 87.1 5.2 5.9 1.3 0.4 12,820
Hertfordshire 10-13 91.2 5.0 2.0 0.5 1.3 39914-17 89.2 5.3 3.9 1.0 0.7 1,33818-20 84.8 8.1 6.1 0.7 0.2 55421+ 85.9 6.6 6.0 1.4 0.2 1,587
All Ages 87.4 6.2 4.9 1.1 0.5 3,878
Lancashire 10-13 94.7 0.8 2.6 0.3 1.5 94714-17 92.7 1.4 4.8 0.1 1.0 2,73118-20 89.4 0.5 8.7 0.2 1.3 1,32621+ 90.9 1.1 6.2 0.7 1.1 4,298
All Ages 91.6 1.1 5.8 0.4 1.2 9,302
Leicestershire 10-13 84.2 0.9 5.6 5.5 3.7 67314-17 83.6 1.0 4.4 7.7 3.2 1,64018-20 75.7 1.0 5.1 14.6 3.6 58921+ 78.1 1.0 5.2 11.7 3.9 2,009
All Ages 80.5 1.0 5.0 9.9 3.6 4,911
Metropolitan Police(1) 10-13 63.7 28.6 5.4 1.9 0.3 2,11414-17 57.1 31.4 9.0 2.2 0.3 8,81118-20 53.4 30.7 12.2 3.3 0.4 4,49821+ 60.5 23.4 11.0 4.7 0.4 19,038
All Ages 58.9 26.7 10.3 3.7 0.4 34,461
Nottinghamshire 10-13 56.0 2.5 0.4 0.0 41.2 77214-17 56.2 2.9 0.7 0.1 40.1 2,31718-20 53.1 3.3 0.9 0.3 42.4 98121+ 50.6 1.4 1.8 0.6 45.6 3,426
All Ages 53.2 2.2 1.2 0.3 43.0 7,496
Thames Valley 10-13 77.7 5.6 3.4 0.0 13.2 1,26214-17 77.2 5.9 4.4 0.3 12.2 3,55418-20 76.2 6.6 6.8 1.0 9.5 1,88321+ 73.2 7.1 5.8 1.0 13.0 6,375
All Ages 75.2 6.6 5.3 0.7 12.3 13,074
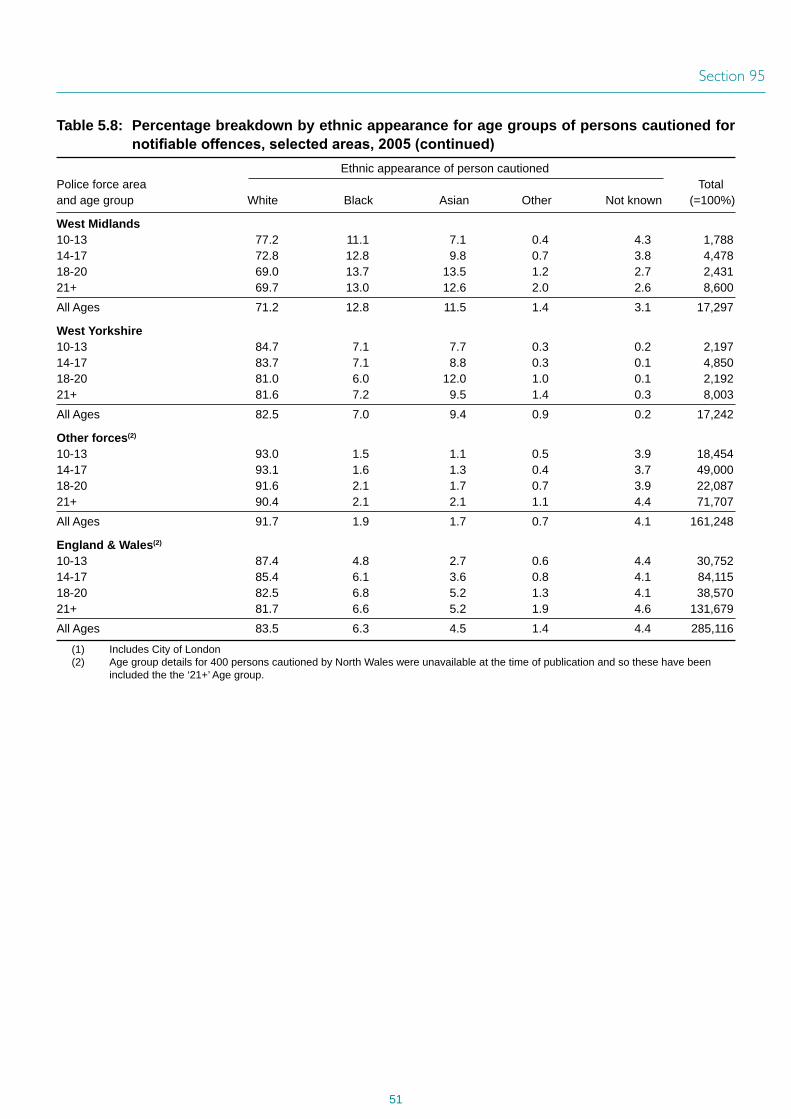
Section 95
51
Table 5.8: Percentage breakdown by ethnic appearance for age groups of persons cautioned for notifiable offences, selected areas, 2005 (continued)
Ethnic appearance of person cautionedPolice force area Total and age group White Black Asian Other Not known (=100%)
West Midlands 10-13 77.2 11.1 7.1 0.4 4.3 1,78814-17 72.8 12.8 9.8 0.7 3.8 4,47818-20 69.0 13.7 13.5 1.2 2.7 2,43121+ 69.7 13.0 12.6 2.0 2.6 8,600
All Ages 71.2 12.8 11.5 1.4 3.1 17,297
West Yorkshire 10-13 84.7 7.1 7.7 0.3 0.2 2,19714-17 83.7 7.1 8.8 0.3 0.1 4,85018-20 81.0 6.0 12.0 1.0 0.1 2,19221+ 81.6 7.2 9.5 1.4 0.3 8,003
All Ages 82.5 7.0 9.4 0.9 0.2 17,242
Other forces(2)
10-13 93.0 1.5 1.1 0.5 3.9 18,45414-17 93.1 1.6 1.3 0.4 3.7 49,00018-20 91.6 2.1 1.7 0.7 3.9 22,08721+ 90.4 2.1 2.1 1.1 4.4 71,707
All Ages 91.7 1.9 1.7 0.7 4.1 161,248
England & Wales(2)
10-13 87.4 4.8 2.7 0.6 4.4 30,75214-17 85.4 6.1 3.6 0.8 4.1 84,11518-20 82.5 6.8 5.2 1.3 4.1 38,57021+ 81.7 6.6 5.2 1.9 4.6 131,679
All Ages 83.5 6.3 4.5 1.4 4.4 285,116
(1) Includes City of London (2) Age group details for 400 persons cautioned by North Wales were unavailable at the time of publication and so these have been
included the the ‘21+’ Age group.
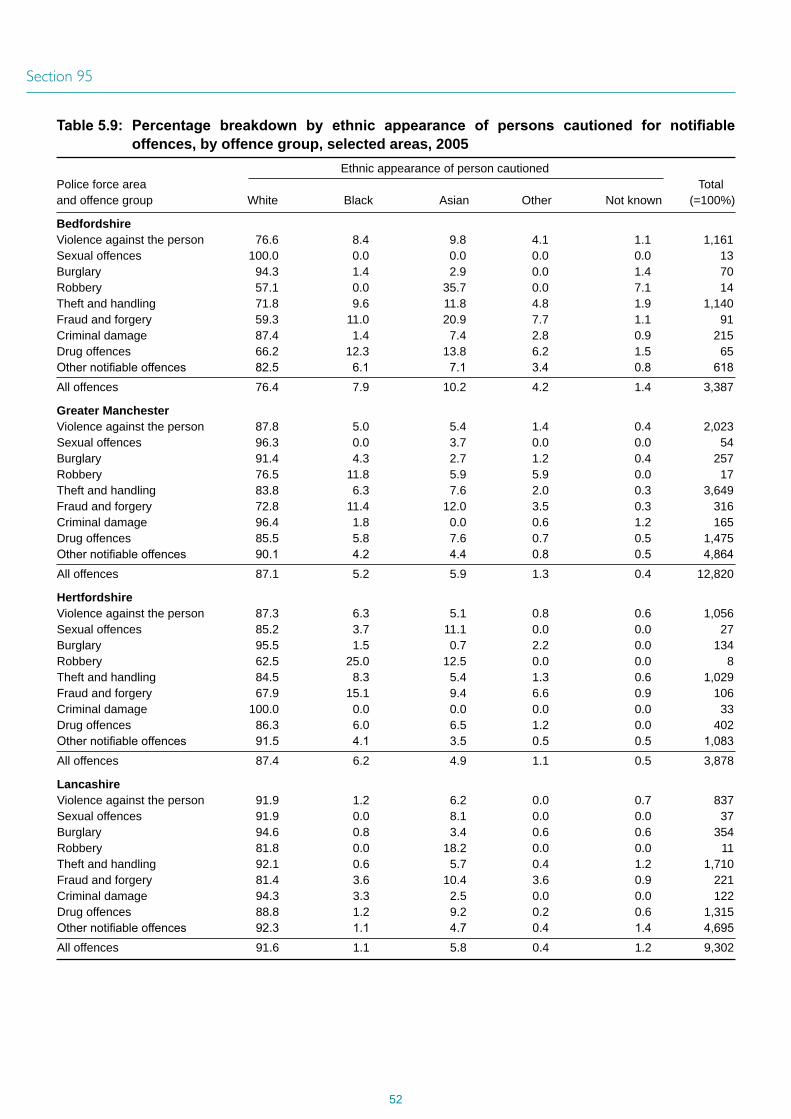
Section 95
52
Table 5.9: Percentage breakdown by ethnic appearance of persons cautioned for notifiable offences, by offence group, selected areas, 2005
Ethnic appearance of person cautionedPolice force area Total and offence group White Black Asian Other Not known (=100%)
Bedfordshire Violence against the person 76.6 8.4 9.8 4.1 1.1 1,161Sexual offences 100.0 0.0 0.0 0.0 0.0 13Burglary 94.3 1.4 2.9 0.0 1.4 70Robbery 57.1 0.0 35.7 0.0 7.1 14Theft and handling 71.8 9.6 11.8 4.8 1.9 1,140Fraud and forgery 59.3 11.0 20.9 7.7 1.1 91Criminal damage 87.4 1.4 7.4 2.8 0.9 215Drug offences 66.2 12.3 13.8 6.2 1.5 65Other notifiable offences 82.5 6.1 7.1 3.4 0.8 618
All offences 76.4 7.9 10.2 4.2 1.4 3,387
Greater Manchester Violence against the person 87.8 5.0 5.4 1.4 0.4 2,023Sexual offences 96.3 0.0 3.7 0.0 0.0 54Burglary 91.4 4.3 2.7 1.2 0.4 257Robbery 76.5 11.8 5.9 5.9 0.0 17Theft and handling 83.8 6.3 7.6 2.0 0.3 3,649Fraud and forgery 72.8 11.4 12.0 3.5 0.3 316Criminal damage 96.4 1.8 0.0 0.6 1.2 165Drug offences 85.5 5.8 7.6 0.7 0.5 1,475Other notifiable offences 90.1 4.2 4.4 0.8 0.5 4,864
All offences 87.1 5.2 5.9 1.3 0.4 12,820
Hertfordshire Violence against the person 87.3 6.3 5.1 0.8 0.6 1,056Sexual offences 85.2 3.7 11.1 0.0 0.0 27Burglary 95.5 1.5 0.7 2.2 0.0 134Robbery 62.5 25.0 12.5 0.0 0.0 8Theft and handling 84.5 8.3 5.4 1.3 0.6 1,029Fraud and forgery 67.9 15.1 9.4 6.6 0.9 106Criminal damage 100.0 0.0 0.0 0.0 0.0 33Drug offences 86.3 6.0 6.5 1.2 0.0 402Other notifiable offences 91.5 4.1 3.5 0.5 0.5 1,083
All offences 87.4 6.2 4.9 1.1 0.5 3,878
Lancashire Violence against the person 91.9 1.2 6.2 0.0 0.7 837Sexual offences 91.9 0.0 8.1 0.0 0.0 37Burglary 94.6 0.8 3.4 0.6 0.6 354Robbery 81.8 0.0 18.2 0.0 0.0 11Theft and handling 92.1 0.6 5.7 0.4 1.2 1,710Fraud and forgery 81.4 3.6 10.4 3.6 0.9 221Criminal damage 94.3 3.3 2.5 0.0 0.0 122Drug offences 88.8 1.2 9.2 0.2 0.6 1,315Other notifiable offences 92.3 1.1 4.7 0.4 1.4 4,695
All offences 91.6 1.1 5.8 0.4 1.2 9,302
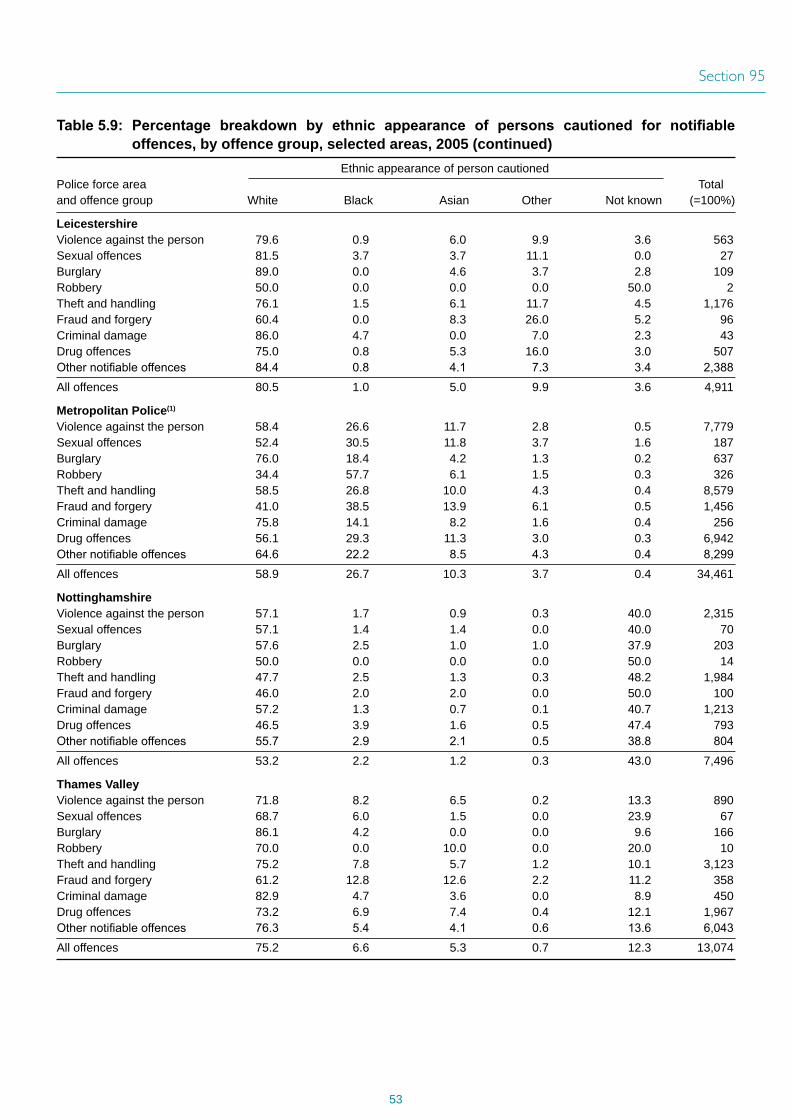
Section 95
53
Table 5.9: Percentage breakdown by ethnic appearance of persons cautioned for notifiable offences, by offence group, selected areas, 2005 (continued)
Ethnic appearance of person cautionedPolice force area Total and offence group White Black Asian Other Not known (=100%)
Leicestershire Violence against the person 79.6 0.9 6.0 9.9 3.6 563Sexual offences 81.5 3.7 3.7 11.1 0.0 27Burglary 89.0 0.0 4.6 3.7 2.8 109Robbery 50.0 0.0 0.0 0.0 50.0 2Theft and handling 76.1 1.5 6.1 11.7 4.5 1,176Fraud and forgery 60.4 0.0 8.3 26.0 5.2 96Criminal damage 86.0 4.7 0.0 7.0 2.3 43Drug offences 75.0 0.8 5.3 16.0 3.0 507Other notifiable offences 84.4 0.8 4.1 7.3 3.4 2,388
All offences 80.5 1.0 5.0 9.9 3.6 4,911
Metropolitan Police(1) Violence against the person 58.4 26.6 11.7 2.8 0.5 7,779Sexual offences 52.4 30.5 11.8 3.7 1.6 187Burglary 76.0 18.4 4.2 1.3 0.2 637Robbery 34.4 57.7 6.1 1.5 0.3 326Theft and handling 58.5 26.8 10.0 4.3 0.4 8,579Fraud and forgery 41.0 38.5 13.9 6.1 0.5 1,456Criminal damage 75.8 14.1 8.2 1.6 0.4 256Drug offences 56.1 29.3 11.3 3.0 0.3 6,942Other notifiable offences 64.6 22.2 8.5 4.3 0.4 8,299
All offences 58.9 26.7 10.3 3.7 0.4 34,461
Nottinghamshire Violence against the person 57.1 1.7 0.9 0.3 40.0 2,315Sexual offences 57.1 1.4 1.4 0.0 40.0 70Burglary 57.6 2.5 1.0 1.0 37.9 203Robbery 50.0 0.0 0.0 0.0 50.0 14Theft and handling 47.7 2.5 1.3 0.3 48.2 1,984Fraud and forgery 46.0 2.0 2.0 0.0 50.0 100Criminal damage 57.2 1.3 0.7 0.1 40.7 1,213Drug offences 46.5 3.9 1.6 0.5 47.4 793Other notifiable offences 55.7 2.9 2.1 0.5 38.8 804
All offences 53.2 2.2 1.2 0.3 43.0 7,496
Thames Valley Violence against the person 71.8 8.2 6.5 0.2 13.3 890Sexual offences 68.7 6.0 1.5 0.0 23.9 67Burglary 86.1 4.2 0.0 0.0 9.6 166Robbery 70.0 0.0 10.0 0.0 20.0 10Theft and handling 75.2 7.8 5.7 1.2 10.1 3,123Fraud and forgery 61.2 12.8 12.6 2.2 11.2 358Criminal damage 82.9 4.7 3.6 0.0 8.9 450Drug offences 73.2 6.9 7.4 0.4 12.1 1,967Other notifiable offences 76.3 5.4 4.1 0.6 13.6 6,043
All offences 75.2 6.6 5.3 0.7 12.3 13,074
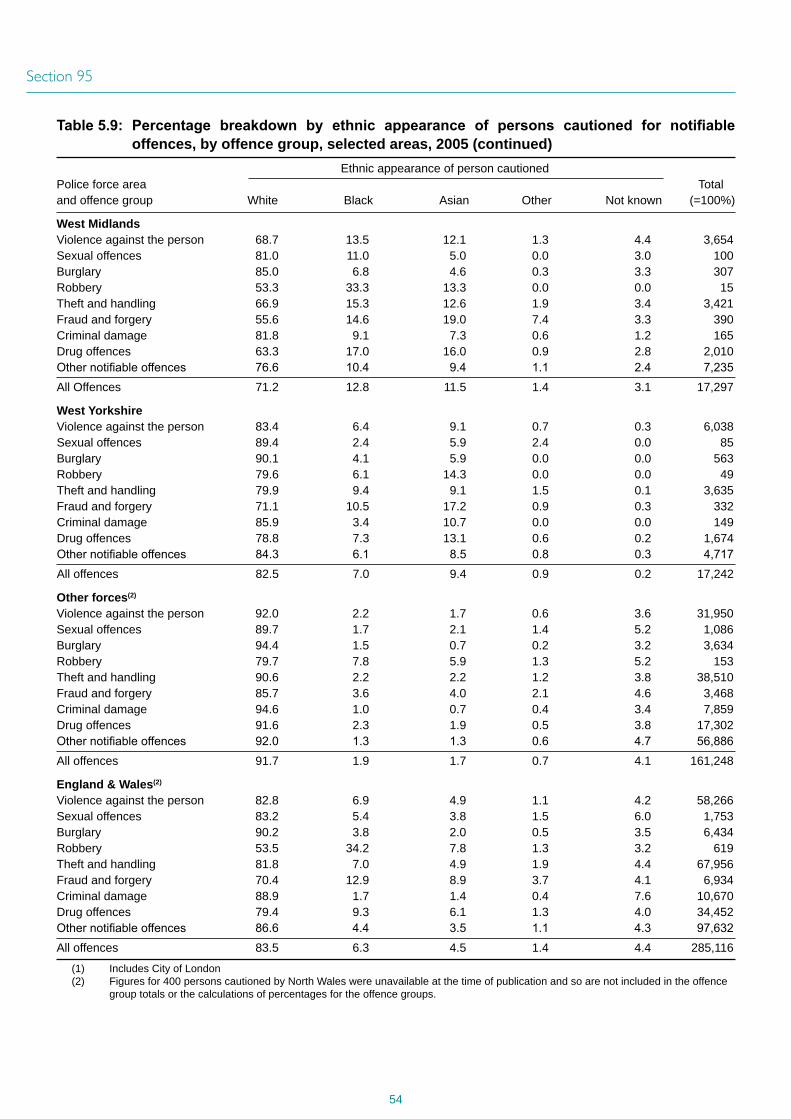
Section 95
54
Table 5.9: Percentage breakdown by ethnic appearance of persons cautioned for notifiable offences, by offence group, selected areas, 2005 (continued)
Ethnic appearance of person cautionedPolice force area Total and offence group White Black Asian Other Not known (=100%)
West Midlands Violence against the person 68.7 13.5 12.1 1.3 4.4 3,654Sexual offences 81.0 11.0 5.0 0.0 3.0 100Burglary 85.0 6.8 4.6 0.3 3.3 307Robbery 53.3 33.3 13.3 0.0 0.0 15Theft and handling 66.9 15.3 12.6 1.9 3.4 3,421Fraud and forgery 55.6 14.6 19.0 7.4 3.3 390Criminal damage 81.8 9.1 7.3 0.6 1.2 165Drug offences 63.3 17.0 16.0 0.9 2.8 2,010Other notifiable offences 76.6 10.4 9.4 1.1 2.4 7,235
All Offences 71.2 12.8 11.5 1.4 3.1 17,297
West Yorkshire Violence against the person 83.4 6.4 9.1 0.7 0.3 6,038Sexual offences 89.4 2.4 5.9 2.4 0.0 85Burglary 90.1 4.1 5.9 0.0 0.0 563Robbery 79.6 6.1 14.3 0.0 0.0 49Theft and handling 79.9 9.4 9.1 1.5 0.1 3,635Fraud and forgery 71.1 10.5 17.2 0.9 0.3 332Criminal damage 85.9 3.4 10.7 0.0 0.0 149Drug offences 78.8 7.3 13.1 0.6 0.2 1,674Other notifiable offences 84.3 6.1 8.5 0.8 0.3 4,717
All offences 82.5 7.0 9.4 0.9 0.2 17,242
Other forces(2)
Violence against the person 92.0 2.2 1.7 0.6 3.6 31,950Sexual offences 89.7 1.7 2.1 1.4 5.2 1,086Burglary 94.4 1.5 0.7 0.2 3.2 3,634Robbery 79.7 7.8 5.9 1.3 5.2 153Theft and handling 90.6 2.2 2.2 1.2 3.8 38,510Fraud and forgery 85.7 3.6 4.0 2.1 4.6 3,468Criminal damage 94.6 1.0 0.7 0.4 3.4 7,859Drug offences 91.6 2.3 1.9 0.5 3.8 17,302Other notifiable offences 92.0 1.3 1.3 0.6 4.7 56,886
All offences 91.7 1.9 1.7 0.7 4.1 161,248
England & Wales(2) Violence against the person 82.8 6.9 4.9 1.1 4.2 58,266Sexual offences 83.2 5.4 3.8 1.5 6.0 1,753Burglary 90.2 3.8 2.0 0.5 3.5 6,434Robbery 53.5 34.2 7.8 1.3 3.2 619Theft and handling 81.8 7.0 4.9 1.9 4.4 67,956Fraud and forgery 70.4 12.9 8.9 3.7 4.1 6,934Criminal damage 88.9 1.7 1.4 0.4 7.6 10,670Drug offences 79.4 9.3 6.1 1.3 4.0 34,452Other notifiable offences 86.6 4.4 3.5 1.1 4.3 97,632
All offences 83.5 6.3 4.5 1.4 4.4 285,116
(1) Includes City of London (2) Figures for 400 persons cautioned by North Wales were unavailable at the time of publication and so are not included in the offence
group totals or the calculations of percentages for the offence groups.
Section 95
55
Chapter 6: Prosecution and Sentencing
Introduction
This chapter examines data from magistrates’ courts and the Crown Court for those police force areas with the most complete recording of ethnicity. A major gap in the information on the way that Black and Minority Ethnic groups are dealt with by the criminal justice system has been a lack of data concerning the prosecution and sentencing processes. However, with the development and increased usage of Compass Case Management System, the Crown Prosecution Service (CPS) will have more comprehensive data available in future years.
The CPS has undertaken an Equality and Diversity Impact Assessment (EDIA) of statutory charging covering nearly 560,000 cases in the 12 months April 2005 to March 2006, during which statutory charging was extended to all areas of England and Wales. Its main purposes are to assess the impact of statutory charging and discover if charging decisions vary with the gender, ethnicity and age of the suspect, and, when charged, the type of offence with which suspects are charged. This assessment has been prepared so that the CPS can fulfil an obligation under the statutory gender and race equality duties and as part of its commitment to monitoring its key services for potential adverse impact.
The impact assessment indicates that there is little variation of charging decision by gender except that female suspects (32%) are slightly more likely than male suspects (28.6%) to receive a decision to make no prosecution on evidential grounds rather than a decision to charge.
The impact assessment revealed no significant variation of charging decision by the main ethnic group of the suspect except White suspects (25.1%) are slightly more likely to receive a decision to make no prosecution on evidential grounds compared to non-White suspects (for example, Black, Mixed or Other suspects, all lower at around 18-20%).
The report provided an analysis by four age-related factors: young offenders; prolific young offenders; persistent offenders; other adult offenders. The analysis showed considerable variation in charging decisions across this classification and this will be explored in future impact assessments.
This second EDIA updates and extends the first EDIA published in May 2006 referred to in the previous year’s report. Copies of both EDIA reports are available from the CPS website http://www.cps.gov.uk.
It is important to remember that decisions made by the CPS and the courts also reflect decisions made at earlier stages of the criminal justice process including charging and cautioning, as well as the circumstances of the offence. It is therefore not possible to say whether, and if so to what extent, differences found in this analysis were the consequence of these earlier decisions/factors.
Magistrates’ Courts: Tables 6.1–6.2
Ethnicity was recorded in only 20% of the magistrates’ court data suppliled to the Home Office for cases in England and Wales for 2005 – compared with 19% in the previous year. These magistrates’ court data represent the number of prosecutions resulting from apprehensions. Tables 6.1 and 6.2 show figures for the five police force areas with the most complete ethnicity data (where the proportions unknown ranged
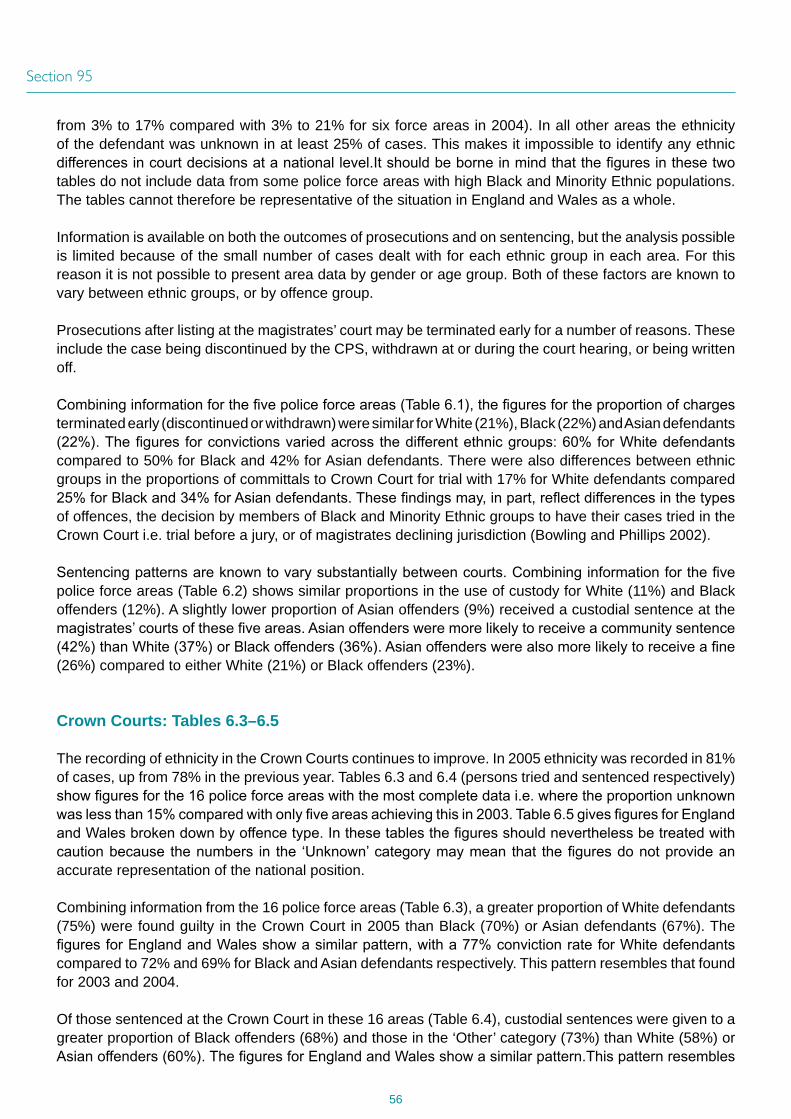
Section 95
56
from 3% to 17% compared with 3% to 21% for six force areas in 2004). In all other areas the ethnicity of the defendant was unknown in at least 25% of cases. This makes it impossible to identify any ethnic differences in court decisions at a national level.It should be borne in mind that the figures in these two tables do not include data from some police force areas with high Black and Minority Ethnic populations. The tables cannot therefore be representative of the situation in England and Wales as a whole.
Information is available on both the outcomes of prosecutions and on sentencing, but the analysis possible is limited because of the small number of cases dealt with for each ethnic group in each area. For this reason it is not possible to present area data by gender or age group. Both of these factors are known to vary between ethnic groups, or by offence group.
Prosecutions after listing at the magistrates’ court may be terminated early for a number of reasons. These include the case being discontinued by the CPS, withdrawn at or during the court hearing, or being written off.
Combining information for the five police force areas (Table 6.1), the figures for the proportion of charges terminated early (discontinued or withdrawn) were similar for White (21%), Black (22%) and Asian defendants (22%). The figures for convictions varied across the different ethnic groups: 60% for White defendants compared to 50% for Black and 42% for Asian defendants. There were also differences between ethnic groups in the proportions of committals to Crown Court for trial with 17% for White defendants compared 25% for Black and 34% for Asian defendants. These findings may, in part, reflect differences in the types of offences, the decision by members of Black and Minority Ethnic groups to have their cases tried in the Crown Court i.e. trial before a jury, or of magistrates declining jurisdiction (Bowling and Phillips 2002).
Sentencing patterns are known to vary substantially between courts. Combining information for the five police force areas (Table 6.2) shows similar proportions in the use of custody for White (11%) and Black offenders (12%). A slightly lower proportion of Asian offenders (9%) received a custodial sentence at the magistrates’ courts of these five areas. Asian offenders were more likely to receive a community sentence (42%) than White (37%) or Black offenders (36%). Asian offenders were also more likely to receive a fine (26%) compared to either White (21%) or Black offenders (23%).
Crown Courts: Tables 6.3–6.5
The recording of ethnicity in the Crown Courts continues to improve. In 2005 ethnicity was recorded in 81% of cases, up from 78% in the previous year. Tables 6.3 and 6.4 (persons tried and sentenced respectively) show figures for the 16 police force areas with the most complete data i.e. where the proportion unknown was less than 15% compared with only five areas achieving this in 2003. Table 6.5 gives figures for England and Wales broken down by offence type. In these tables the figures should nevertheless be treated with caution because the numbers in the ‘Unknown’ category may mean that the figures do not provide an accurate representation of the national position.
Combining information from the 16 police force areas (Table 6.3), a greater proportion of White defendants (75%) were found guilty in the Crown Court in 2005 than Black (70%) or Asian defendants (67%). The figures for England and Wales show a similar pattern, with a 77% conviction rate for White defendants compared to 72% and 69% for Black and Asian defendants respectively. This pattern resembles that found for 2003 and 2004.
Of those sentenced at the Crown Court in these 16 areas (Table 6.4), custodial sentences were given to a greater proportion of Black offenders (68%) and those in the ‘Other’ category (73%) than White (58%) or Asian offenders (60%). The figures for England and Wales show a similar pattern.This pattern resembles
Section 95
57
that found for the previous year. In selected areas, community sentences were given more frequently to White (31%) and Asian (28%) than to the Black (23%) and ‘Other’ (18%) ethnic groups. Again, the figures for England and Wales are similar and also resemble the pattern found for the previous year.
Table 6.5 shows national level data on sentencing in the Crown Court by main offence group. The main offence group attracting the highest number of custodial sentences was violence against the person. For both White and Asian offenders, 54% received custody compared with the higher proportion of 59% for Black offenders. For drug offences, 78% of Black offenders sentenced received a custodial sentence compared with 71% of Asian offenders and 60% of White offenders. A different picture emerges in relation to Burglary where 67% of White offenders received immediate custody compared with 63% for Black offenders and 56% for Asian offenders.In contrast, 42% of Asian offenders received custody for Criminal Damage whilst the proportion for White offenders (40%) and Black offenders (33%) were lower. These proportions may reflect the seriousness of the offences committed. In all of the offence categories there were a substantial proportion of offenders for whom ethnicity had not been recorded.
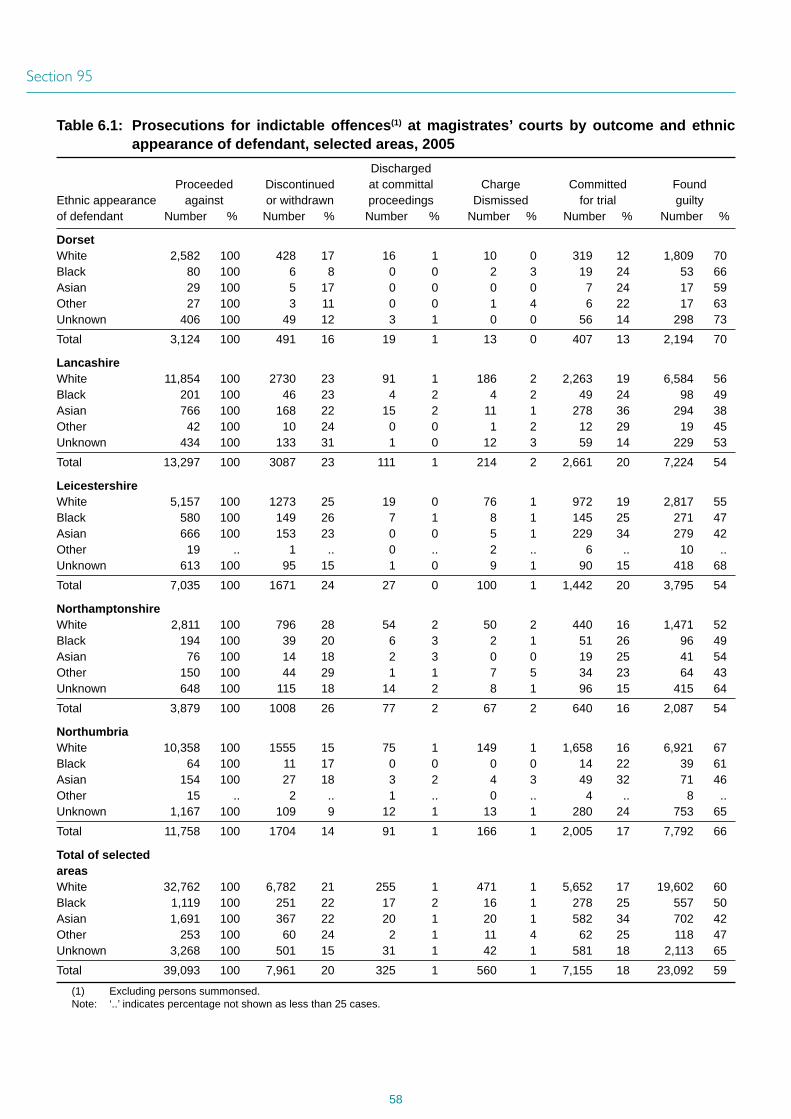
Section 95
58
Table 6.1: Prosecutions for indictable offences(1) at magistrates’ courts by outcome and ethnic appearance of defendant, selected areas, 2005
Discharged Proceeded Discontinued at committal Charge Committed FoundEthnic appearance against or withdrawn proceedings Dismissed for trial guiltyof defendant Number % Number % Number % Number % Number % Number %
DorsetWhite 2,582 100 428 17 16 1 10 0 319 12 1,809 70Black 80 100 6 8 0 0 2 3 19 24 53 66Asian 29 100 5 17 0 0 0 0 7 24 17 59Other 27 100 3 11 0 0 1 4 6 22 17 63Unknown 406 100 49 12 3 1 0 0 56 14 298 73
Total 3,124 100 491 16 19 1 13 0 407 13 2,194 70
Lancashire White 11,854 100 2730 23 91 1 186 2 2,263 19 6,584 56Black 201 100 46 23 4 2 4 2 49 24 98 49Asian 766 100 168 22 15 2 11 1 278 36 294 38Other 42 100 10 24 0 0 1 2 12 29 19 45Unknown 434 100 133 31 1 0 12 3 59 14 229 53
Total 13,297 100 3087 23 111 1 214 2 2,661 20 7,224 54
Leicestershire White 5,157 100 1273 25 19 0 76 1 972 19 2,817 55Black 580 100 149 26 7 1 8 1 145 25 271 47Asian 666 100 153 23 0 0 5 1 229 34 279 42Other 19 .. 1 .. 0 .. 2 .. 6 .. 10 ..Unknown 613 100 95 15 1 0 9 1 90 15 418 68
Total 7,035 100 1671 24 27 0 100 1 1,442 20 3,795 54
Northamptonshire White 2,811 100 796 28 54 2 50 2 440 16 1,471 52Black 194 100 39 20 6 3 2 1 51 26 96 49Asian 76 100 14 18 2 3 0 0 19 25 41 54Other 150 100 44 29 1 1 7 5 34 23 64 43Unknown 648 100 115 18 14 2 8 1 96 15 415 64
Total 3,879 100 1008 26 77 2 67 2 640 16 2,087 54
Northumbria White 10,358 100 1555 15 75 1 149 1 1,658 16 6,921 67Black 64 100 11 17 0 0 0 0 14 22 39 61Asian 154 100 27 18 3 2 4 3 49 32 71 46Other 15 .. 2 .. 1 .. 0 .. 4 .. 8 ..Unknown 1,167 100 109 9 12 1 13 1 280 24 753 65
Total 11,758 100 1704 14 91 1 166 1 2,005 17 7,792 66
Total of selected areasWhite 32,762 100 6,782 21 255 1 471 1 5,652 17 19,602 60Black 1,119 100 251 22 17 2 16 1 278 25 557 50Asian 1,691 100 367 22 20 1 20 1 582 34 702 42Other 253 100 60 24 2 1 11 4 62 25 118 47Unknown 3,268 100 501 15 31 1 42 1 581 18 2,113 65
Total 39,093 100 7,961 20 325 1 560 1 7,155 18 23,092 59
(1) Excluding persons summonsed. Note: ‘..’ indicates percentage not shown as less than 25 cases.
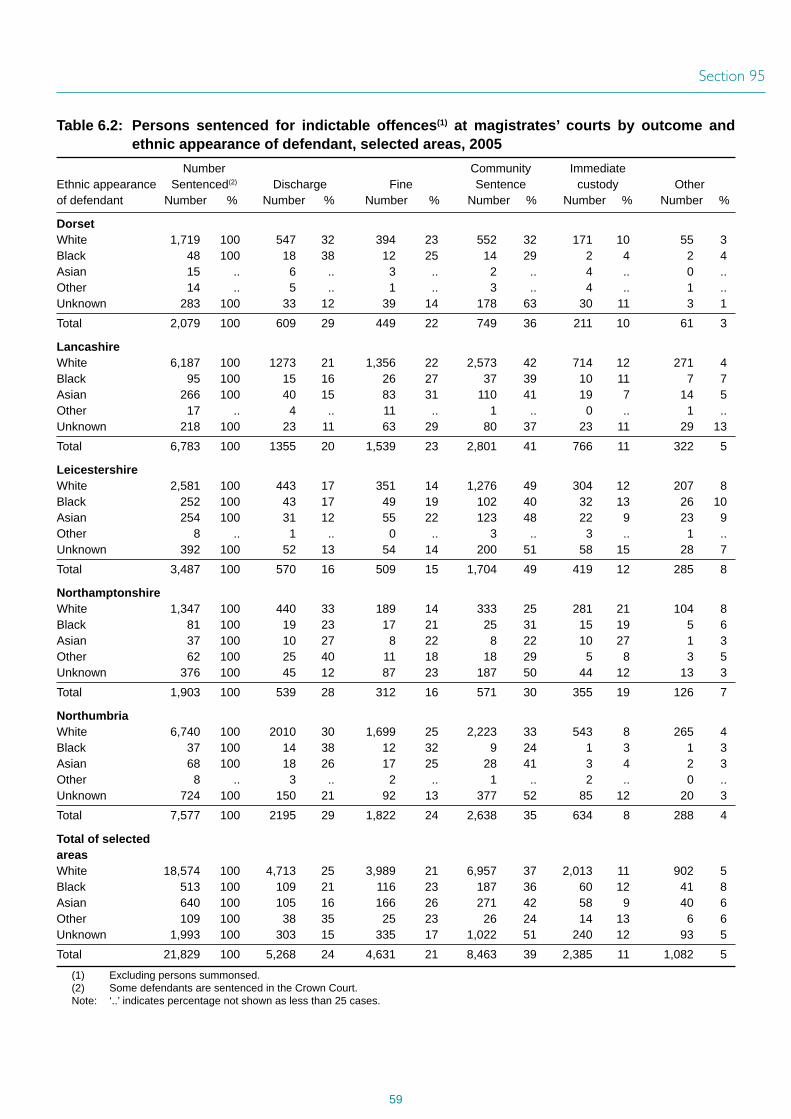
Section 95
59
Table 6.2: Persons sentenced for indictable offences(1) at magistrates’ courts by outcome and ethnic appearance of defendant, selected areas, 2005
Number Community Immediate Ethnic appearance Sentenced(2) Discharge Fine Sentence custody Otherof defendant Number % Number % Number % Number % Number % Number %
Dorset White 1,719 100 547 32 394 23 552 32 171 10 55 3Black 48 100 18 38 12 25 14 29 2 4 2 4Asian 15 .. 6 .. 3 .. 2 .. 4 .. 0 ..Other 14 .. 5 .. 1 .. 3 .. 4 .. 1 ..Unknown 283 100 33 12 39 14 178 63 30 11 3 1
Total 2,079 100 609 29 449 22 749 36 211 10 61 3
Lancashire White 6,187 100 1273 21 1,356 22 2,573 42 714 12 271 4Black 95 100 15 16 26 27 37 39 10 11 7 7Asian 266 100 40 15 83 31 110 41 19 7 14 5Other 17 .. 4 .. 11 .. 1 .. 0 .. 1 ..Unknown 218 100 23 11 63 29 80 37 23 11 29 13
Total 6,783 100 1355 20 1,539 23 2,801 41 766 11 322 5
Leicestershire White 2,581 100 443 17 351 14 1,276 49 304 12 207 8Black 252 100 43 17 49 19 102 40 32 13 26 10Asian 254 100 31 12 55 22 123 48 22 9 23 9Other 8 .. 1 .. 0 .. 3 .. 3 .. 1 ..Unknown 392 100 52 13 54 14 200 51 58 15 28 7
Total 3,487 100 570 16 509 15 1,704 49 419 12 285 8
Northamptonshire White 1,347 100 440 33 189 14 333 25 281 21 104 8Black 81 100 19 23 17 21 25 31 15 19 5 6Asian 37 100 10 27 8 22 8 22 10 27 1 3Other 62 100 25 40 11 18 18 29 5 8 3 5Unknown 376 100 45 12 87 23 187 50 44 12 13 3
Total 1,903 100 539 28 312 16 571 30 355 19 126 7
Northumbria White 6,740 100 2010 30 1,699 25 2,223 33 543 8 265 4Black 37 100 14 38 12 32 9 24 1 3 1 3Asian 68 100 18 26 17 25 28 41 3 4 2 3Other 8 .. 3 .. 2 .. 1 .. 2 .. 0 ..Unknown 724 100 150 21 92 13 377 52 85 12 20 3
Total 7,577 100 2195 29 1,822 24 2,638 35 634 8 288 4
Total of selected areas White 18,574 100 4,713 25 3,989 21 6,957 37 2,013 11 902 5Black 513 100 109 21 116 23 187 36 60 12 41 8Asian 640 100 105 16 166 26 271 42 58 9 40 6Other 109 100 38 35 25 23 26 24 14 13 6 6Unknown 1,993 100 303 15 335 17 1,022 51 240 12 93 5
Total 21,829 100 5,268 24 4,631 21 8,463 39 2,385 11 1,082 5
(1) Excluding persons summonsed. (2) Some defendants are sentenced in the Crown Court. Note: ‘..’ indicates percentage not shown as less than 25 cases.
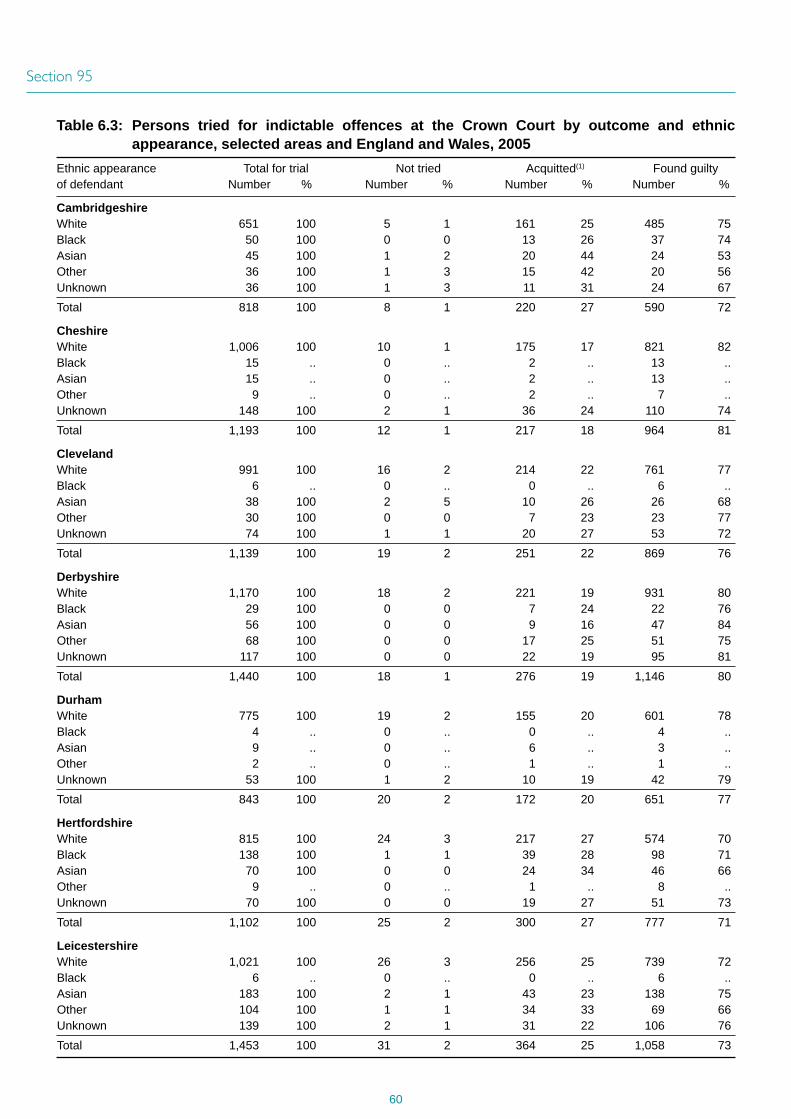
Section 95
60
Table 6.3: Persons tried for indictable offences at the Crown Court by outcome and ethnic appearance, selected areas and England and Wales, 2005
Ethnic appearance Total for trial Not tried Acquitted(1) Found guiltyof defendant Number % Number % Number % Number %
Cambridgeshire White 651 100 5 1 161 25 485 75Black 50 100 0 0 13 26 37 74Asian 45 100 1 2 20 44 24 53Other 36 100 1 3 15 42 20 56Unknown 36 100 1 3 11 31 24 67
Total 818 100 8 1 220 27 590 72
Cheshire White 1,006 100 10 1 175 17 821 82Black 15 .. 0 .. 2 .. 13 ..Asian 15 .. 0 .. 2 .. 13 ..Other 9 .. 0 .. 2 .. 7 ..Unknown 148 100 2 1 36 24 110 74
Total 1,193 100 12 1 217 18 964 81
Cleveland White 991 100 16 2 214 22 761 77Black 6 .. 0 .. 0 .. 6 ..Asian 38 100 2 5 10 26 26 68Other 30 100 0 0 7 23 23 77Unknown 74 100 1 1 20 27 53 72
Total 1,139 100 19 2 251 22 869 76
Derbyshire White 1,170 100 18 2 221 19 931 80Black 29 100 0 0 7 24 22 76Asian 56 100 0 0 9 16 47 84Other 68 100 0 0 17 25 51 75Unknown 117 100 0 0 22 19 95 81
Total 1,440 100 18 1 276 19 1,146 80
Durham White 775 100 19 2 155 20 601 78Black 4 .. 0 .. 0 .. 4 ..Asian 9 .. 0 .. 6 .. 3 ..Other 2 .. 0 .. 1 .. 1 ..Unknown 53 100 1 2 10 19 42 79
Total 843 100 20 2 172 20 651 77
Hertfordshire White 815 100 24 3 217 27 574 70Black 138 100 1 1 39 28 98 71Asian 70 100 0 0 24 34 46 66Other 9 .. 0 .. 1 .. 8 ..Unknown 70 100 0 0 19 27 51 73
Total 1,102 100 25 2 300 27 777 71
Leicestershire White 1,021 100 26 3 256 25 739 72Black 6 .. 0 .. 0 .. 6 ..Asian 183 100 2 1 43 23 138 75Other 104 100 1 1 34 33 69 66Unknown 139 100 2 1 31 22 106 76
Total 1,453 100 31 2 364 25 1,058 73
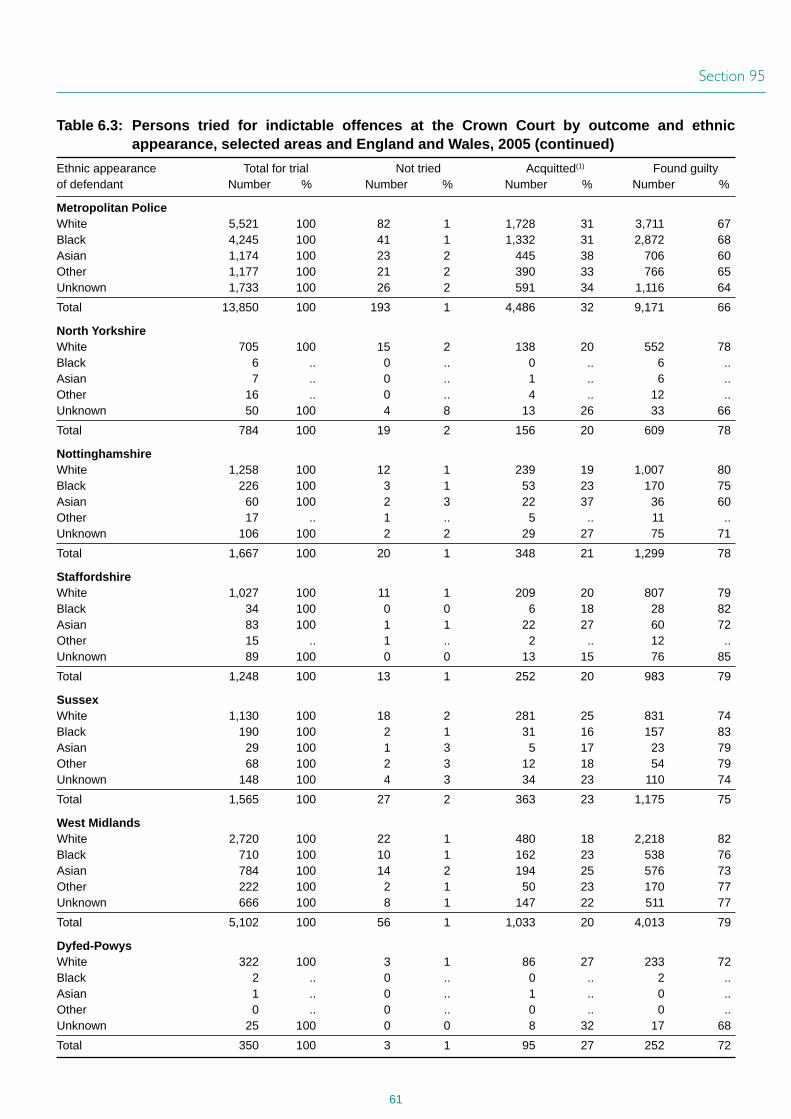
Section 95
61
Table 6.3: Persons tried for indictable offences at the Crown Court by outcome and ethnic appearance, selected areas and England and Wales, 2005 (continued)
Ethnic appearance Total for trial Not tried Acquitted(1) Found guiltyof defendant Number % Number % Number % Number %
Metropolitan Police White 5,521 100 82 1 1,728 31 3,711 67Black 4,245 100 41 1 1,332 31 2,872 68Asian 1,174 100 23 2 445 38 706 60Other 1,177 100 21 2 390 33 766 65Unknown 1,733 100 26 2 591 34 1,116 64
Total 13,850 100 193 1 4,486 32 9,171 66
North Yorkshire White 705 100 15 2 138 20 552 78Black 6 .. 0 .. 0 .. 6 ..Asian 7 .. 0 .. 1 .. 6 ..Other 16 .. 0 .. 4 .. 12 ..Unknown 50 100 4 8 13 26 33 66
Total 784 100 19 2 156 20 609 78
Nottinghamshire White 1,258 100 12 1 239 19 1,007 80Black 226 100 3 1 53 23 170 75Asian 60 100 2 3 22 37 36 60Other 17 .. 1 .. 5 .. 11 ..Unknown 106 100 2 2 29 27 75 71
Total 1,667 100 20 1 348 21 1,299 78
Staffordshire White 1,027 100 11 1 209 20 807 79Black 34 100 0 0 6 18 28 82Asian 83 100 1 1 22 27 60 72Other 15 .. 1 .. 2 .. 12 ..Unknown 89 100 0 0 13 15 76 85
Total 1,248 100 13 1 252 20 983 79
Sussex White 1,130 100 18 2 281 25 831 74Black 190 100 2 1 31 16 157 83Asian 29 100 1 3 5 17 23 79Other 68 100 2 3 12 18 54 79Unknown 148 100 4 3 34 23 110 74
Total 1,565 100 27 2 363 23 1,175 75
West Midlands White 2,720 100 22 1 480 18 2,218 82Black 710 100 10 1 162 23 538 76Asian 784 100 14 2 194 25 576 73Other 222 100 2 1 50 23 170 77Unknown 666 100 8 1 147 22 511 77
Total 5,102 100 56 1 1,033 20 4,013 79
Dyfed-Powys White 322 100 3 1 86 27 233 72Black 2 .. 0 .. 0 .. 2 ..Asian 1 .. 0 .. 1 .. 0 ..Other 0 .. 0 .. 0 .. 0 ..Unknown 25 100 0 0 8 32 17 68
Total 350 100 3 1 95 27 252 72
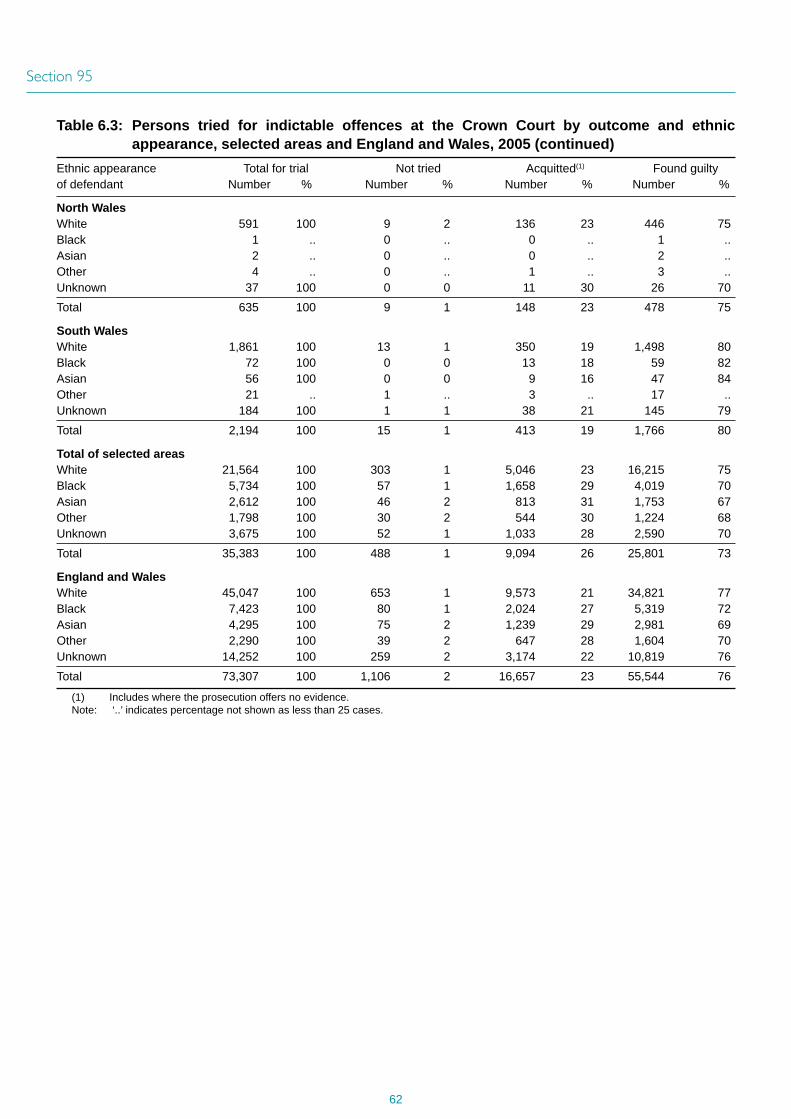
Section 95
62
Table 6.3: Persons tried for indictable offences at the Crown Court by outcome and ethnic appearance, selected areas and England and Wales, 2005 (continued)
Ethnic appearance Total for trial Not tried Acquitted(1) Found guiltyof defendant Number % Number % Number % Number %
North Wales White 591 100 9 2 136 23 446 75Black 1 .. 0 .. 0 .. 1 ..Asian 2 .. 0 .. 0 .. 2 ..Other 4 .. 0 .. 1 .. 3 ..Unknown 37 100 0 0 11 30 26 70
Total 635 100 9 1 148 23 478 75
South Wales White 1,861 100 13 1 350 19 1,498 80Black 72 100 0 0 13 18 59 82Asian 56 100 0 0 9 16 47 84Other 21 .. 1 .. 3 .. 17 ..Unknown 184 100 1 1 38 21 145 79
Total 2,194 100 15 1 413 19 1,766 80
Total of selected areas White 21,564 100 303 1 5,046 23 16,215 75Black 5,734 100 57 1 1,658 29 4,019 70Asian 2,612 100 46 2 813 31 1,753 67Other 1,798 100 30 2 544 30 1,224 68Unknown 3,675 100 52 1 1,033 28 2,590 70
Total 35,383 100 488 1 9,094 26 25,801 73
England and Wales White 45,047 100 653 1 9,573 21 34,821 77Black 7,423 100 80 1 2,024 27 5,319 72Asian 4,295 100 75 2 1,239 29 2,981 69Other 2,290 100 39 2 647 28 1,604 70Unknown 14,252 100 259 2 3,174 22 10,819 76
Total 73,307 100 1,106 2 16,657 23 55,544 76
(1) Includes where the prosecution offers no evidence. Note: ‘..’ indicates percentage not shown as less than 25 cases.
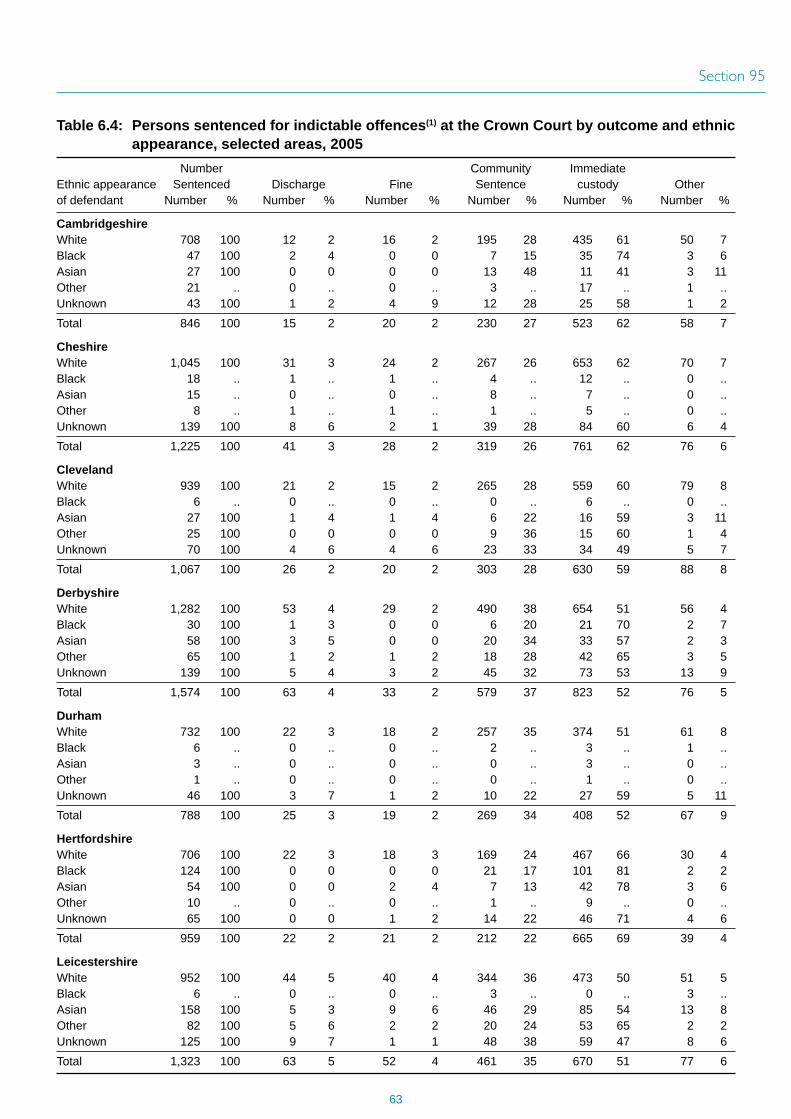
Section 95
63
Table 6.4: Persons sentenced for indictable offences(1) at the Crown Court by outcome and ethnic appearance, selected areas, 2005
Number Community Immediate Ethnic appearance Sentenced Discharge Fine Sentence custody Otherof defendant Number % Number % Number % Number % Number % Number %
Cambridgeshire White 708 100 12 2 16 2 195 28 435 61 50 7Black 47 100 2 4 0 0 7 15 35 74 3 6Asian 27 100 0 0 0 0 13 48 11 41 3 11Other 21 .. 0 .. 0 .. 3 .. 17 .. 1 ..Unknown 43 100 1 2 4 9 12 28 25 58 1 2
Total 846 100 15 2 20 2 230 27 523 62 58 7
Cheshire White 1,045 100 31 3 24 2 267 26 653 62 70 7Black 18 .. 1 .. 1 .. 4 .. 12 .. 0 ..Asian 15 .. 0 .. 0 .. 8 .. 7 .. 0 ..Other 8 .. 1 .. 1 .. 1 .. 5 .. 0 ..Unknown 139 100 8 6 2 1 39 28 84 60 6 4
Total 1,225 100 41 3 28 2 319 26 761 62 76 6
Cleveland White 939 100 21 2 15 2 265 28 559 60 79 8Black 6 .. 0 .. 0 .. 0 .. 6 .. 0 ..Asian 27 100 1 4 1 4 6 22 16 59 3 11Other 25 100 0 0 0 0 9 36 15 60 1 4Unknown 70 100 4 6 4 6 23 33 34 49 5 7
Total 1,067 100 26 2 20 2 303 28 630 59 88 8
Derbyshire White 1,282 100 53 4 29 2 490 38 654 51 56 4Black 30 100 1 3 0 0 6 20 21 70 2 7Asian 58 100 3 5 0 0 20 34 33 57 2 3Other 65 100 1 2 1 2 18 28 42 65 3 5Unknown 139 100 5 4 3 2 45 32 73 53 13 9
Total 1,574 100 63 4 33 2 579 37 823 52 76 5
Durham White 732 100 22 3 18 2 257 35 374 51 61 8Black 6 .. 0 .. 0 .. 2 .. 3 .. 1 ..Asian 3 .. 0 .. 0 .. 0 .. 3 .. 0 ..Other 1 .. 0 .. 0 .. 0 .. 1 .. 0 ..Unknown 46 100 3 7 1 2 10 22 27 59 5 11
Total 788 100 25 3 19 2 269 34 408 52 67 9
Hertfordshire White 706 100 22 3 18 3 169 24 467 66 30 4Black 124 100 0 0 0 0 21 17 101 81 2 2Asian 54 100 0 0 2 4 7 13 42 78 3 6Other 10 .. 0 .. 0 .. 1 .. 9 .. 0 ..Unknown 65 100 0 0 1 2 14 22 46 71 4 6
Total 959 100 22 2 21 2 212 22 665 69 39 4
Leicestershire White 952 100 44 5 40 4 344 36 473 50 51 5Black 6 .. 0 .. 0 .. 3 .. 0 .. 3 ..Asian 158 100 5 3 9 6 46 29 85 54 13 8Other 82 100 5 6 2 2 20 24 53 65 2 2Unknown 125 100 9 7 1 1 48 38 59 47 8 6
Total 1,323 100 63 5 52 4 461 35 670 51 77 6
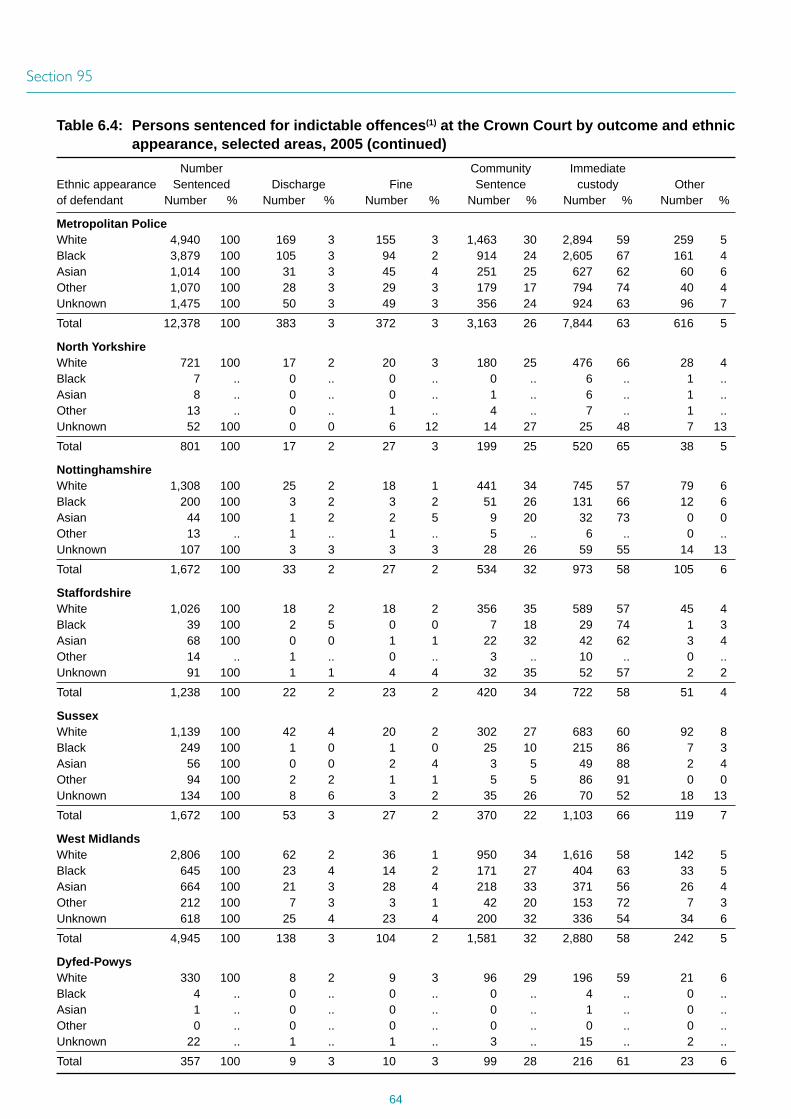
Section 95
64
Table 6.4: Persons sentenced for indictable offences(1) at the Crown Court by outcome and ethnic appearance, selected areas, 2005 (continued)
Number Community Immediate Ethnic appearance Sentenced Discharge Fine Sentence custody Otherof defendant Number % Number % Number % Number % Number % Number %
Metropolitan Police White 4,940 100 169 3 155 3 1,463 30 2,894 59 259 5Black 3,879 100 105 3 94 2 914 24 2,605 67 161 4Asian 1,014 100 31 3 45 4 251 25 627 62 60 6Other 1,070 100 28 3 29 3 179 17 794 74 40 4Unknown 1,475 100 50 3 49 3 356 24 924 63 96 7
Total 12,378 100 383 3 372 3 3,163 26 7,844 63 616 5
North Yorkshire White 721 100 17 2 20 3 180 25 476 66 28 4Black 7 .. 0 .. 0 .. 0 .. 6 .. 1 ..Asian 8 .. 0 .. 0 .. 1 .. 6 .. 1 ..Other 13 .. 0 .. 1 .. 4 .. 7 .. 1 ..Unknown 52 100 0 0 6 12 14 27 25 48 7 13
Total 801 100 17 2 27 3 199 25 520 65 38 5
Nottinghamshire White 1,308 100 25 2 18 1 441 34 745 57 79 6Black 200 100 3 2 3 2 51 26 131 66 12 6Asian 44 100 1 2 2 5 9 20 32 73 0 0Other 13 .. 1 .. 1 .. 5 .. 6 .. 0 ..Unknown 107 100 3 3 3 3 28 26 59 55 14 13
Total 1,672 100 33 2 27 2 534 32 973 58 105 6
Staffordshire White 1,026 100 18 2 18 2 356 35 589 57 45 4Black 39 100 2 5 0 0 7 18 29 74 1 3Asian 68 100 0 0 1 1 22 32 42 62 3 4Other 14 .. 1 .. 0 .. 3 .. 10 .. 0 ..Unknown 91 100 1 1 4 4 32 35 52 57 2 2
Total 1,238 100 22 2 23 2 420 34 722 58 51 4
Sussex White 1,139 100 42 4 20 2 302 27 683 60 92 8Black 249 100 1 0 1 0 25 10 215 86 7 3Asian 56 100 0 0 2 4 3 5 49 88 2 4Other 94 100 2 2 1 1 5 5 86 91 0 0Unknown 134 100 8 6 3 2 35 26 70 52 18 13
Total 1,672 100 53 3 27 2 370 22 1,103 66 119 7
West Midlands White 2,806 100 62 2 36 1 950 34 1,616 58 142 5Black 645 100 23 4 14 2 171 27 404 63 33 5Asian 664 100 21 3 28 4 218 33 371 56 26 4Other 212 100 7 3 3 1 42 20 153 72 7 3Unknown 618 100 25 4 23 4 200 32 336 54 34 6
Total 4,945 100 138 3 104 2 1,581 32 2,880 58 242 5
Dyfed-Powys White 330 100 8 2 9 3 96 29 196 59 21 6Black 4 .. 0 .. 0 .. 0 .. 4 .. 0 ..Asian 1 .. 0 .. 0 .. 0 .. 1 .. 0 ..Other 0 .. 0 .. 0 .. 0 .. 0 .. 0 ..Unknown 22 .. 1 .. 1 .. 3 .. 15 .. 2 ..
Total 357 100 9 3 10 3 99 28 216 61 23 6
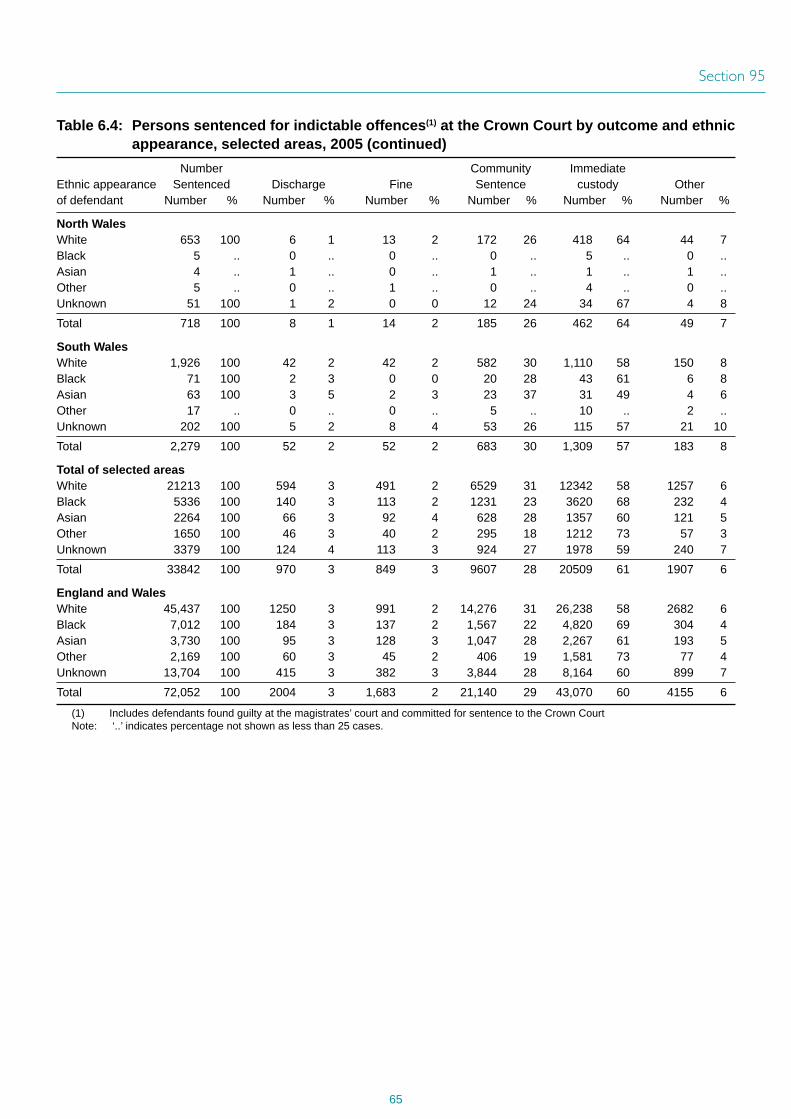
Section 95
65
Table 6.4: Persons sentenced for indictable offences(1) at the Crown Court by outcome and ethnic appearance, selected areas, 2005 (continued)
Number Community Immediate Ethnic appearance Sentenced Discharge Fine Sentence custody Otherof defendant Number % Number % Number % Number % Number % Number %
North Wales White 653 100 6 1 13 2 172 26 418 64 44 7Black 5 .. 0 .. 0 .. 0 .. 5 .. 0 ..Asian 4 .. 1 .. 0 .. 1 .. 1 .. 1 ..Other 5 .. 0 .. 1 .. 0 .. 4 .. 0 ..Unknown 51 100 1 2 0 0 12 24 34 67 4 8
Total 718 100 8 1 14 2 185 26 462 64 49 7
South Wales White 1,926 100 42 2 42 2 582 30 1,110 58 150 8Black 71 100 2 3 0 0 20 28 43 61 6 8Asian 63 100 3 5 2 3 23 37 31 49 4 6Other 17 .. 0 .. 0 .. 5 .. 10 .. 2 ..Unknown 202 100 5 2 8 4 53 26 115 57 21 10
Total 2,279 100 52 2 52 2 683 30 1,309 57 183 8
Total of selected areas White 21213 100 594 3 491 2 6529 31 12342 58 1257 6Black 5336 100 140 3 113 2 1231 23 3620 68 232 4Asian 2264 100 66 3 92 4 628 28 1357 60 121 5Other 1650 100 46 3 40 2 295 18 1212 73 57 3Unknown 3379 100 124 4 113 3 924 27 1978 59 240 7
Total 33842 100 970 3 849 3 9607 28 20509 61 1907 6
England and Wales White 45,437 100 1250 3 991 2 14,276 31 26,238 58 2682 6Black 7,012 100 184 3 137 2 1,567 22 4,820 69 304 4Asian 3,730 100 95 3 128 3 1,047 28 2,267 61 193 5Other 2,169 100 60 3 45 2 406 19 1,581 73 77 4Unknown 13,704 100 415 3 382 3 3,844 28 8,164 60 899 7
Total 72,052 100 2004 3 1,683 2 21,140 29 43,070 60 4155 6
(1) Includes defendants found guilty at the magistrates’ court and committed for sentence to the Crown Court Note: ‘..’ indicates percentage not shown as less than 25 cases.
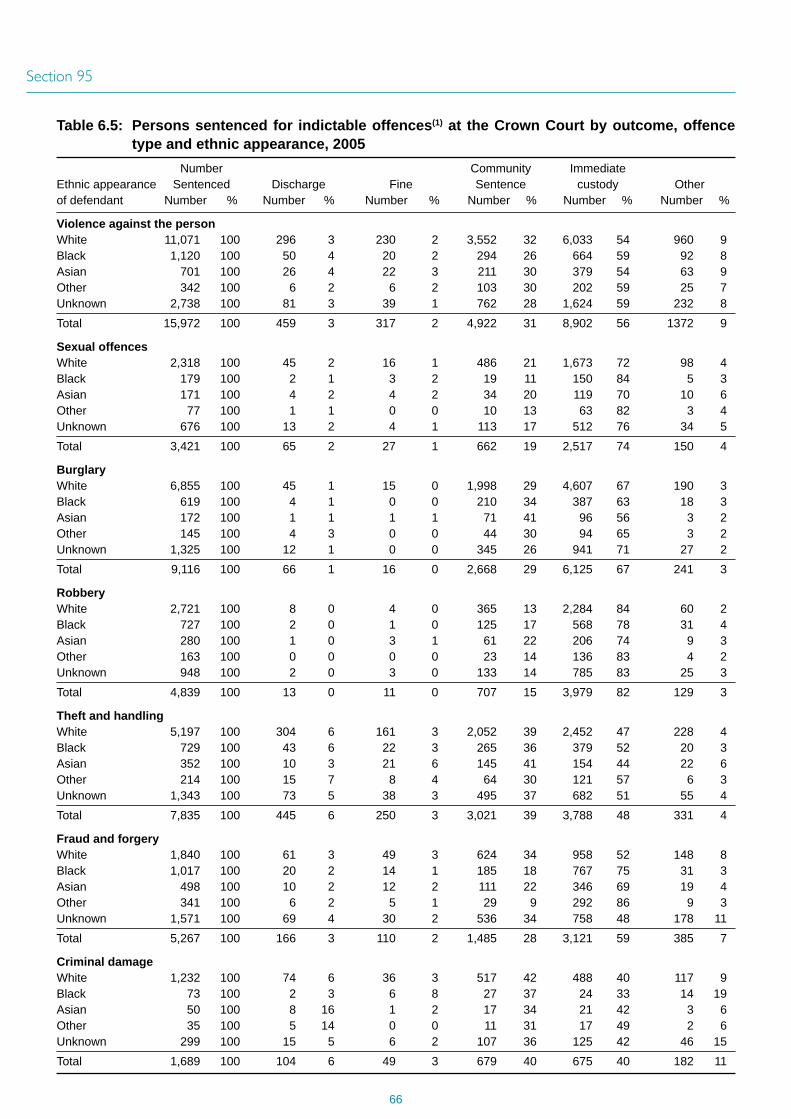
Section 95
66
Table 6.5: Persons sentenced for indictable offences(1) at the Crown Court by outcome, offence type and ethnic appearance, 2005
Number Community Immediate Ethnic appearance Sentenced Discharge Fine Sentence custody Otherof defendant Number % Number % Number % Number % Number % Number %
Violence against the person White 11,071 100 296 3 230 2 3,552 32 6,033 54 960 9Black 1,120 100 50 4 20 2 294 26 664 59 92 8Asian 701 100 26 4 22 3 211 30 379 54 63 9Other 342 100 6 2 6 2 103 30 202 59 25 7Unknown 2,738 100 81 3 39 1 762 28 1,624 59 232 8
Total 15,972 100 459 3 317 2 4,922 31 8,902 56 1372 9
Sexual offences White 2,318 100 45 2 16 1 486 21 1,673 72 98 4Black 179 100 2 1 3 2 19 11 150 84 5 3Asian 171 100 4 2 4 2 34 20 119 70 10 6Other 77 100 1 1 0 0 10 13 63 82 3 4Unknown 676 100 13 2 4 1 113 17 512 76 34 5
Total 3,421 100 65 2 27 1 662 19 2,517 74 150 4
Burglary White 6,855 100 45 1 15 0 1,998 29 4,607 67 190 3Black 619 100 4 1 0 0 210 34 387 63 18 3Asian 172 100 1 1 1 1 71 41 96 56 3 2Other 145 100 4 3 0 0 44 30 94 65 3 2Unknown 1,325 100 12 1 0 0 345 26 941 71 27 2
Total 9,116 100 66 1 16 0 2,668 29 6,125 67 241 3
Robbery White 2,721 100 8 0 4 0 365 13 2,284 84 60 2Black 727 100 2 0 1 0 125 17 568 78 31 4Asian 280 100 1 0 3 1 61 22 206 74 9 3Other 163 100 0 0 0 0 23 14 136 83 4 2Unknown 948 100 2 0 3 0 133 14 785 83 25 3
Total 4,839 100 13 0 11 0 707 15 3,979 82 129 3
Theft and handling White 5,197 100 304 6 161 3 2,052 39 2,452 47 228 4Black 729 100 43 6 22 3 265 36 379 52 20 3Asian 352 100 10 3 21 6 145 41 154 44 22 6Other 214 100 15 7 8 4 64 30 121 57 6 3Unknown 1,343 100 73 5 38 3 495 37 682 51 55 4
Total 7,835 100 445 6 250 3 3,021 39 3,788 48 331 4
Fraud and forgery White 1,840 100 61 3 49 3 624 34 958 52 148 8Black 1,017 100 20 2 14 1 185 18 767 75 31 3Asian 498 100 10 2 12 2 111 22 346 69 19 4Other 341 100 6 2 5 1 29 9 292 86 9 3Unknown 1,571 100 69 4 30 2 536 34 758 48 178 11
Total 5,267 100 166 3 110 2 1,485 28 3,121 59 385 7
Criminal damage White 1,232 100 74 6 36 3 517 42 488 40 117 9Black 73 100 2 3 6 8 27 37 24 33 14 19Asian 50 100 8 16 1 2 17 34 21 42 3 6Other 35 100 5 14 0 0 11 31 17 49 2 6Unknown 299 100 15 5 6 2 107 36 125 42 46 15
Total 1,689 100 104 6 49 3 679 40 675 40 182 11
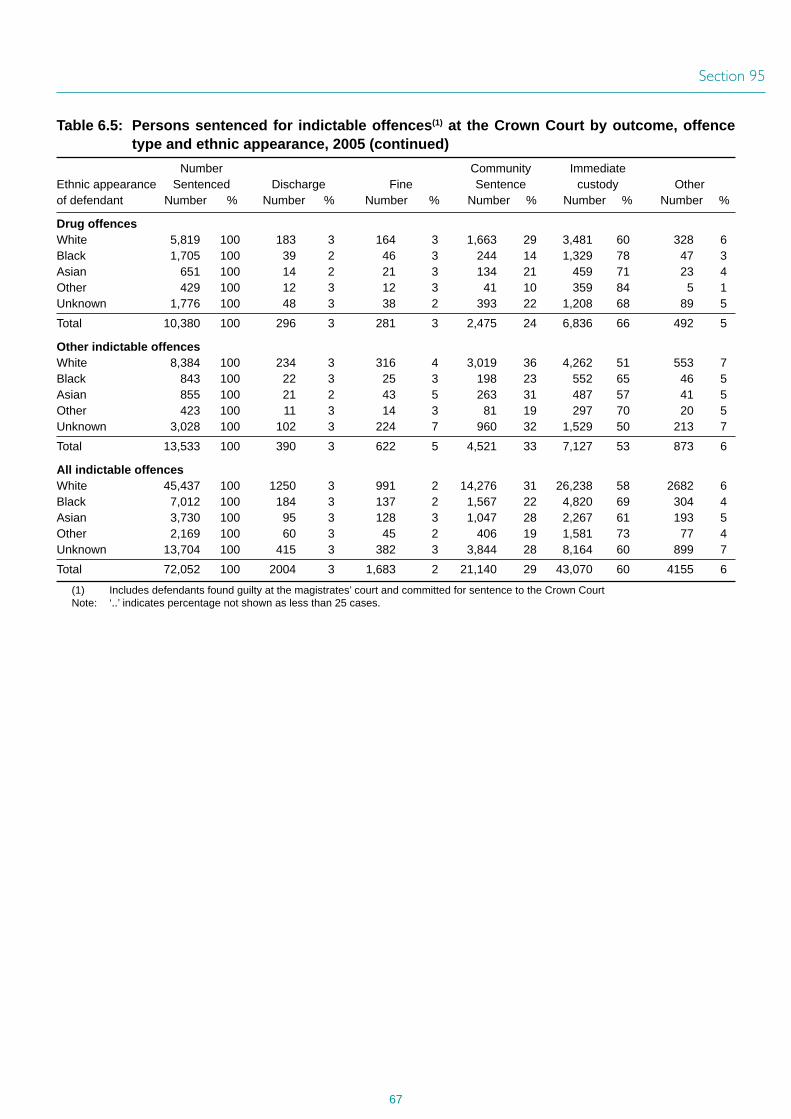
Section 95
67
Table 6.5: Persons sentenced for indictable offences(1) at the Crown Court by outcome, offence type and ethnic appearance, 2005 (continued)
Number Community Immediate Ethnic appearance Sentenced Discharge Fine Sentence custody Otherof defendant Number % Number % Number % Number % Number % Number %
Drug offences White 5,819 100 183 3 164 3 1,663 29 3,481 60 328 6Black 1,705 100 39 2 46 3 244 14 1,329 78 47 3Asian 651 100 14 2 21 3 134 21 459 71 23 4Other 429 100 12 3 12 3 41 10 359 84 5 1Unknown 1,776 100 48 3 38 2 393 22 1,208 68 89 5
Total 10,380 100 296 3 281 3 2,475 24 6,836 66 492 5
Other indictable offences White 8,384 100 234 3 316 4 3,019 36 4,262 51 553 7Black 843 100 22 3 25 3 198 23 552 65 46 5Asian 855 100 21 2 43 5 263 31 487 57 41 5Other 423 100 11 3 14 3 81 19 297 70 20 5Unknown 3,028 100 102 3 224 7 960 32 1,529 50 213 7
Total 13,533 100 390 3 622 5 4,521 33 7,127 53 873 6
All indictable offences White 45,437 100 1250 3 991 2 14,276 31 26,238 58 2682 6Black 7,012 100 184 3 137 2 1,567 22 4,820 69 304 4Asian 3,730 100 95 3 128 3 1,047 28 2,267 61 193 5Other 2,169 100 60 3 45 2 406 19 1,581 73 77 4Unknown 13,704 100 415 3 382 3 3,844 28 8,164 60 899 7
Total 72,052 100 2004 3 1,683 2 21,140 29 43,070 60 4155 6
(1) Includes defendants found guilty at the magistrates’ court and committed for sentence to the Crown Court Note: ‘..’ indicates percentage not shown as less than 25 cases.

Section 95
68
Section 95
69
Chapter 7: Youth Offending
Introduction
The Youth Justice Board (YJB) for England and Wales was set up under the Crime and Disorder Act 1998. Part of its function is to monitor the operation of the Youth Offending Teams and the provision of youth justice services. Monitoring systems introduced when the Youth Justice Board was established included the collection of the ethnicity of young offenders based upon self-classification and the 2001 Census classification system, i.e. ‘16+1’, see Appendix B for details.
The figures in this chapter are presented with reference to the main categories derived from the 16+1 system, that is, White, Mixed, Black, Asian and ‘Chinese and ‘other’. Information is provided for England and Wales as a whole and for the ten police force areas with the largest minority ethnic populations. Statistics are presented on offences, pre-court decisions and sentences, and cover the financial year ending March 2006. It should be noted that these figures are derived from notifications made to Youth Offending Teams by the police and it is known that, for various reasons, not all occurrences are notified.
Further information on data from Youth Offending Teams is contained in the Youth Justice Annual Statistics 2004/05 (available at http://www.yjb.gov.uk/en-gb/practitioners/MonitoringPerformance/AnnualStatistics/ ). Regional statistics are also available at this web link. The YJB has also published findings from a research study it commissioned on how minority ethnic young people are dealt with at all stages of the youth justice process, compared with White young people (see Feilzer, M & Hood, R. 2004).
Main Findings
Offences: Table 7.1
In 2005/6, 301,860 offences (both indictable and summary) involving offenders aged between 10 and 17 were notified to and dealt with by Youth Offending Teams in England and Wales (Table 7.1). This compares to 287,013 in 2004/5 and represents an increase of 5.2%. In 85.2% of the offences in 2005/6, the young people involved classified their ethnicity as White, 5.8% as Black, 3.1% as Asian, 2.8% as Mixed and 0.3% as Chinese and other. Ethnicity was unknown for 2.7% of offences. Young Black people were substantially overrepresented compared with White people for robbery offences. Young people from Asian and Mixed ethnic backgrounds also showed considerable over-representation for the same offence. These patterns are similar to those evident since 2001. The figures also suggest over-representation of Black people for drugs offences. The same finding has been reported since 2003.
Pre-court Decisions: Table 7.2
Of those cases notified to Youth Offending Teams, pre-court decisions were made on 94,535 offences in 2005/6 (Table 7.2). This compares with 85,370 in 2004/5 an increase of 10.7%. Of these, 87.9% involved White people, 4.2% involved Black people, 3.3% Asian, 1.5% Mixed and 0.3% Chinese and other, with 2.8% unknown. These proportions are similar to those observed annually since 2003. These proportions are true for all three types of decisions reported here – Police reprimand, final warning without intervention, and final warning with intervention - with differences of only a very few percentage points. On average,
Section 95
70
approximately two-thirds (66.1%) of pre-court decisions on offences involving young offenders in 2005/6 attracted a police reprimand, 5% a final warning without intervention, and 28.9% a final warning and intervention. The proportion of final warnings without intervention has nearly halved since 2002.
The proportions of these pre-court decisions administered across each of the ethnic groups varied. As in 2004/5, offences involving young offenders of Mixed ethnicity were less likely to get a police reprimand (57.5%) than offences committed by those in other ethnic groups (range 65.7% to 72.2%); conversely offences involving those of Mixed ethnicity were more likely (36.2%) than offences involving other ethnic groups (range 24.6% to 29.3%) to attract a final warning and intervention. The Chinese and Other ethnic group had the highest proportion of reprimands and the lowest proportions of final warnings without intervention.
Sentencing: Table 7.3
Youth Offending Teams recorded information on 117,707 offences involving young offenders sentenced in 2005/6, of which 83.8% were committed by White people, 6.9% Black people, 2.9% Asian, 3.5% Mixed and 0.4% Chinese and other, with 2.5% unknown (Table 7.3). This distribution is similar to the figures reported in 2004/5, although the proportion in the Mixed group has increased and the proportion in the Chinese and other group has decreased slightly.
Overall, in 2005/6, 26.5% of disposals for offences involving young offenders handed down by the courts were community sentences, 24.1% were Referral Orders, 13.2% were compensation orders (up from 11.8% in 2004/5), 11.4% were fines, and 9.5% were accounted for by an absolute or conditional discharge. Offences committed by young offenders who self-classified as Chinese or Other were most likely to attract a Referral Order. The percentage of offences attracting a custodial sentence was 6.0%, down from 6.2% in 2004/5. Offences committed by Black young offenders were more likely to attract a custodial sentence when compared to offences committed by other ethnic groups. However, it is important to bear in mind that the decision to impose a custodial sentence can be influenced by a variety of factors including the nature and seriousness of the offence.
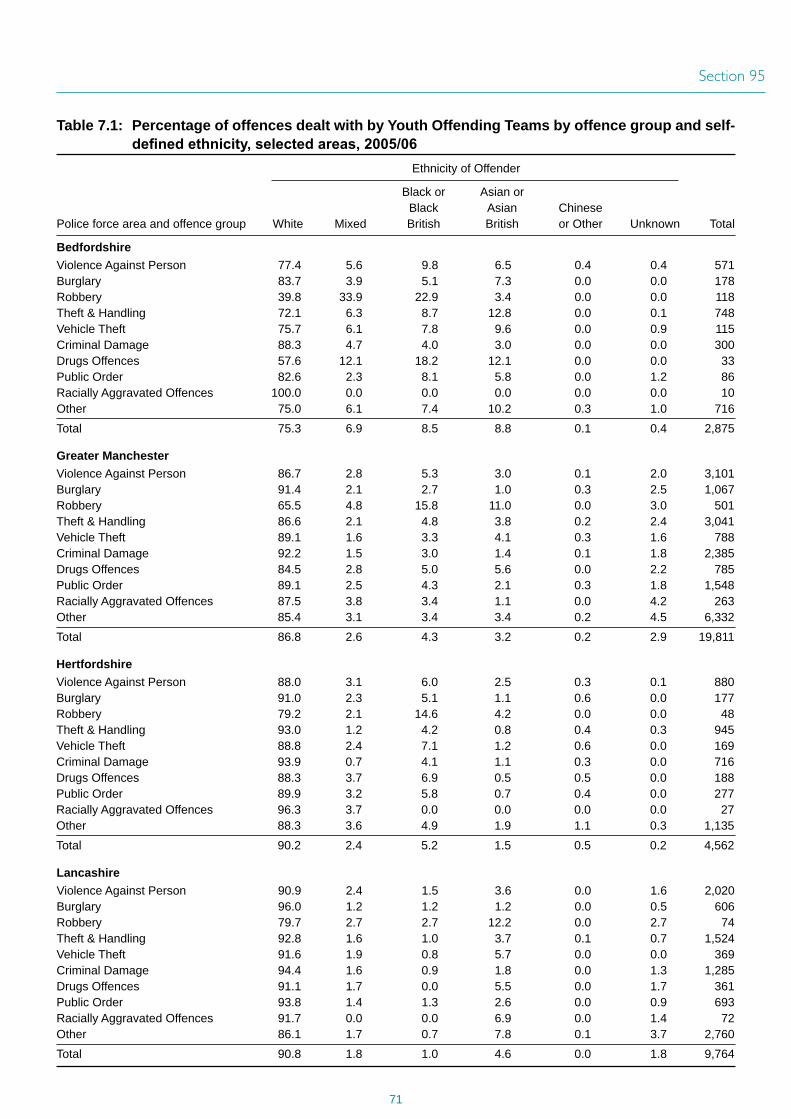
Section 95
71
Table 7.1: Percentage of offences dealt with by Youth Offending Teams by offence group and self-defined ethnicity, selected areas, 2005/06
Ethnicity of Offender
Black or Asian or Black Asian Chinese Police force area and offence group White Mixed British British or Other Unknown Total
Bedfordshire
Violence Against Person 77.4 5.6 9.8 6.5 0.4 0.4 571Burglary 83.7 3.9 5.1 7.3 0.0 0.0 178Robbery 39.8 33.9 22.9 3.4 0.0 0.0 118Theft & Handling 72.1 6.3 8.7 12.8 0.0 0.1 748Vehicle Theft 75.7 6.1 7.8 9.6 0.0 0.9 115Criminal Damage 88.3 4.7 4.0 3.0 0.0 0.0 300Drugs Offences 57.6 12.1 18.2 12.1 0.0 0.0 33Public Order 82.6 2.3 8.1 5.8 0.0 1.2 86Racially Aggravated Offences 100.0 0.0 0.0 0.0 0.0 0.0 10Other 75.0 6.1 7.4 10.2 0.3 1.0 716
Total 75.3 6.9 8.5 8.8 0.1 0.4 2,875
Greater Manchester
Violence Against Person 86.7 2.8 5.3 3.0 0.1 2.0 3,101Burglary 91.4 2.1 2.7 1.0 0.3 2.5 1,067Robbery 65.5 4.8 15.8 11.0 0.0 3.0 501Theft & Handling 86.6 2.1 4.8 3.8 0.2 2.4 3,041Vehicle Theft 89.1 1.6 3.3 4.1 0.3 1.6 788Criminal Damage 92.2 1.5 3.0 1.4 0.1 1.8 2,385Drugs Offences 84.5 2.8 5.0 5.6 0.0 2.2 785Public Order 89.1 2.5 4.3 2.1 0.3 1.8 1,548Racially Aggravated Offences 87.5 3.8 3.4 1.1 0.0 4.2 263Other 85.4 3.1 3.4 3.4 0.2 4.5 6,332
Total 86.8 2.6 4.3 3.2 0.2 2.9 19,811
Hertfordshire
Violence Against Person 88.0 3.1 6.0 2.5 0.3 0.1 880Burglary 91.0 2.3 5.1 1.1 0.6 0.0 177Robbery 79.2 2.1 14.6 4.2 0.0 0.0 48Theft & Handling 93.0 1.2 4.2 0.8 0.4 0.3 945Vehicle Theft 88.8 2.4 7.1 1.2 0.6 0.0 169Criminal Damage 93.9 0.7 4.1 1.1 0.3 0.0 716Drugs Offences 88.3 3.7 6.9 0.5 0.5 0.0 188Public Order 89.9 3.2 5.8 0.7 0.4 0.0 277Racially Aggravated Offences 96.3 3.7 0.0 0.0 0.0 0.0 27Other 88.3 3.6 4.9 1.9 1.1 0.3 1,135
Total 90.2 2.4 5.2 1.5 0.5 0.2 4,562
Lancashire
Violence Against Person 90.9 2.4 1.5 3.6 0.0 1.6 2,020Burglary 96.0 1.2 1.2 1.2 0.0 0.5 606Robbery 79.7 2.7 2.7 12.2 0.0 2.7 74Theft & Handling 92.8 1.6 1.0 3.7 0.1 0.7 1,524Vehicle Theft 91.6 1.9 0.8 5.7 0.0 0.0 369Criminal Damage 94.4 1.6 0.9 1.8 0.0 1.3 1,285Drugs Offences 91.1 1.7 0.0 5.5 0.0 1.7 361Public Order 93.8 1.4 1.3 2.6 0.0 0.9 693Racially Aggravated Offences 91.7 0.0 0.0 6.9 0.0 1.4 72Other 86.1 1.7 0.7 7.8 0.1 3.7 2,760
Total 90.8 1.8 1.0 4.6 0.0 1.8 9,764
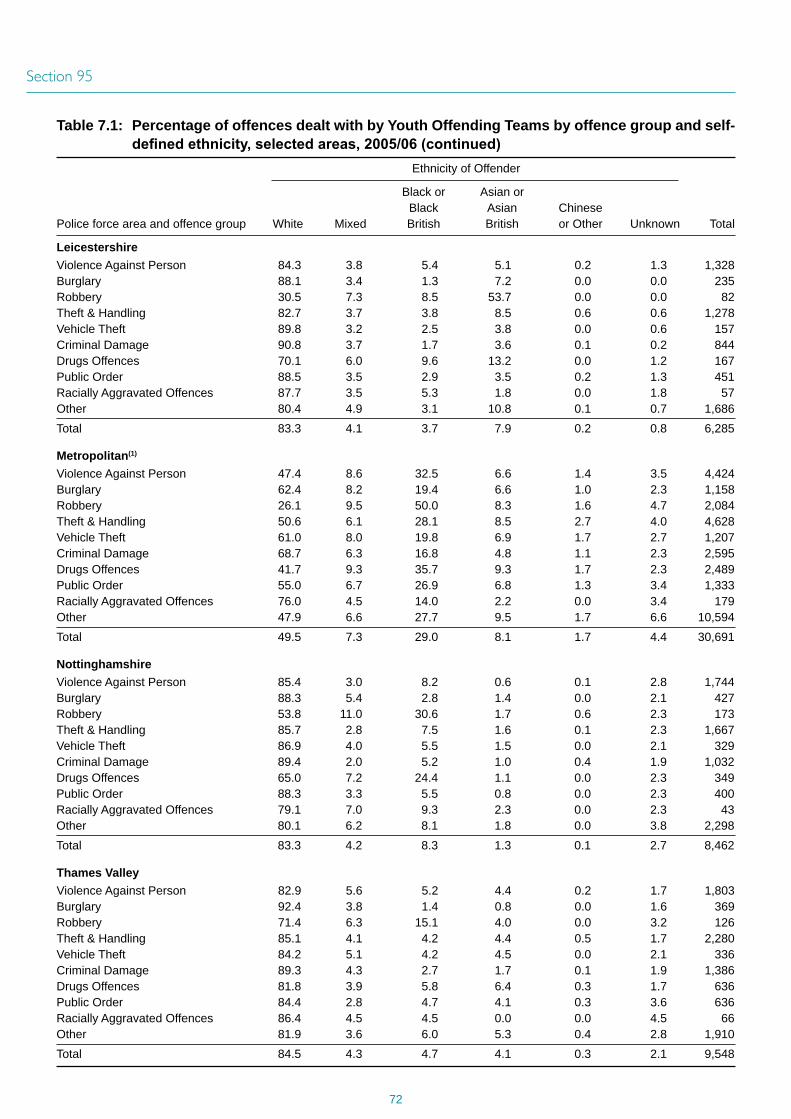
Section 95
72
Table 7.1: Percentage of offences dealt with by Youth Offending Teams by offence group and self-defined ethnicity, selected areas, 2005/06 (continued)
Ethnicity of Offender
Black or Asian or Black Asian Chinese Police force area and offence group White Mixed British British or Other Unknown Total
Leicestershire
Violence Against Person 84.3 3.8 5.4 5.1 0.2 1.3 1,328Burglary 88.1 3.4 1.3 7.2 0.0 0.0 235Robbery 30.5 7.3 8.5 53.7 0.0 0.0 82Theft & Handling 82.7 3.7 3.8 8.5 0.6 0.6 1,278Vehicle Theft 89.8 3.2 2.5 3.8 0.0 0.6 157Criminal Damage 90.8 3.7 1.7 3.6 0.1 0.2 844Drugs Offences 70.1 6.0 9.6 13.2 0.0 1.2 167Public Order 88.5 3.5 2.9 3.5 0.2 1.3 451Racially Aggravated Offences 87.7 3.5 5.3 1.8 0.0 1.8 57Other 80.4 4.9 3.1 10.8 0.1 0.7 1,686
Total 83.3 4.1 3.7 7.9 0.2 0.8 6,285
Metropolitan(1)
Violence Against Person 47.4 8.6 32.5 6.6 1.4 3.5 4,424Burglary 62.4 8.2 19.4 6.6 1.0 2.3 1,158Robbery 26.1 9.5 50.0 8.3 1.6 4.7 2,084Theft & Handling 50.6 6.1 28.1 8.5 2.7 4.0 4,628Vehicle Theft 61.0 8.0 19.8 6.9 1.7 2.7 1,207Criminal Damage 68.7 6.3 16.8 4.8 1.1 2.3 2,595Drugs Offences 41.7 9.3 35.7 9.3 1.7 2.3 2,489Public Order 55.0 6.7 26.9 6.8 1.3 3.4 1,333Racially Aggravated Offences 76.0 4.5 14.0 2.2 0.0 3.4 179Other 47.9 6.6 27.7 9.5 1.7 6.6 10,594
Total 49.5 7.3 29.0 8.1 1.7 4.4 30,691
Nottinghamshire
Violence Against Person 85.4 3.0 8.2 0.6 0.1 2.8 1,744Burglary 88.3 5.4 2.8 1.4 0.0 2.1 427Robbery 53.8 11.0 30.6 1.7 0.6 2.3 173Theft & Handling 85.7 2.8 7.5 1.6 0.1 2.3 1,667Vehicle Theft 86.9 4.0 5.5 1.5 0.0 2.1 329Criminal Damage 89.4 2.0 5.2 1.0 0.4 1.9 1,032Drugs Offences 65.0 7.2 24.4 1.1 0.0 2.3 349Public Order 88.3 3.3 5.5 0.8 0.0 2.3 400Racially Aggravated Offences 79.1 7.0 9.3 2.3 0.0 2.3 43Other 80.1 6.2 8.1 1.8 0.0 3.8 2,298
Total 83.3 4.2 8.3 1.3 0.1 2.7 8,462
Thames Valley
Violence Against Person 82.9 5.6 5.2 4.4 0.2 1.7 1,803Burglary 92.4 3.8 1.4 0.8 0.0 1.6 369Robbery 71.4 6.3 15.1 4.0 0.0 3.2 126Theft & Handling 85.1 4.1 4.2 4.4 0.5 1.7 2,280Vehicle Theft 84.2 5.1 4.2 4.5 0.0 2.1 336Criminal Damage 89.3 4.3 2.7 1.7 0.1 1.9 1,386Drugs Offences 81.8 3.9 5.8 6.4 0.3 1.7 636Public Order 84.4 2.8 4.7 4.1 0.3 3.6 636Racially Aggravated Offences 86.4 4.5 4.5 0.0 0.0 4.5 66Other 81.9 3.6 6.0 5.3 0.4 2.8 1,910
Total 84.5 4.3 4.7 4.1 0.3 2.1 9,548
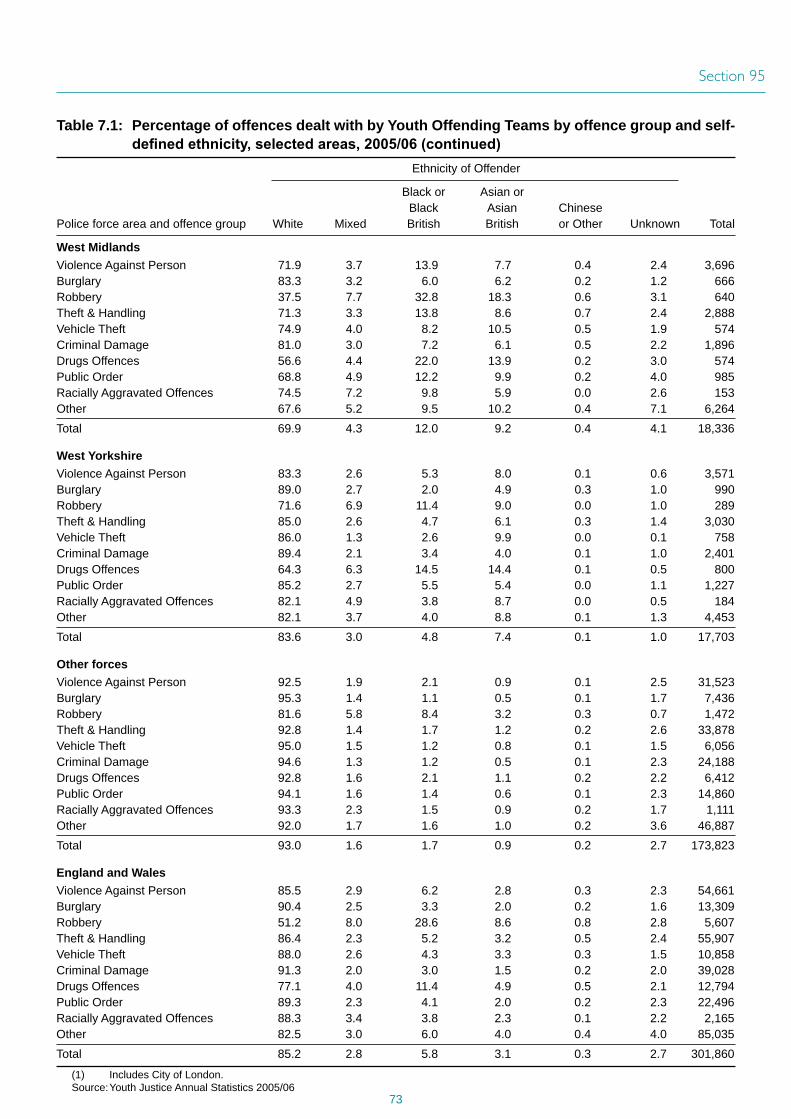
Section 95
73
Table 7.1: Percentage of offences dealt with by Youth Offending Teams by offence group and self-defined ethnicity, selected areas, 2005/06 (continued)
Ethnicity of Offender
Black or Asian or Black Asian Chinese Police force area and offence group White Mixed British British or Other Unknown Total
West Midlands
Violence Against Person 71.9 3.7 13.9 7.7 0.4 2.4 3,696Burglary 83.3 3.2 6.0 6.2 0.2 1.2 666Robbery 37.5 7.7 32.8 18.3 0.6 3.1 640Theft & Handling 71.3 3.3 13.8 8.6 0.7 2.4 2,888Vehicle Theft 74.9 4.0 8.2 10.5 0.5 1.9 574Criminal Damage 81.0 3.0 7.2 6.1 0.5 2.2 1,896Drugs Offences 56.6 4.4 22.0 13.9 0.2 3.0 574Public Order 68.8 4.9 12.2 9.9 0.2 4.0 985Racially Aggravated Offences 74.5 7.2 9.8 5.9 0.0 2.6 153Other 67.6 5.2 9.5 10.2 0.4 7.1 6,264
Total 69.9 4.3 12.0 9.2 0.4 4.1 18,336
West Yorkshire
Violence Against Person 83.3 2.6 5.3 8.0 0.1 0.6 3,571Burglary 89.0 2.7 2.0 4.9 0.3 1.0 990Robbery 71.6 6.9 11.4 9.0 0.0 1.0 289Theft & Handling 85.0 2.6 4.7 6.1 0.3 1.4 3,030Vehicle Theft 86.0 1.3 2.6 9.9 0.0 0.1 758Criminal Damage 89.4 2.1 3.4 4.0 0.1 1.0 2,401Drugs Offences 64.3 6.3 14.5 14.4 0.1 0.5 800Public Order 85.2 2.7 5.5 5.4 0.0 1.1 1,227Racially Aggravated Offences 82.1 4.9 3.8 8.7 0.0 0.5 184Other 82.1 3.7 4.0 8.8 0.1 1.3 4,453
Total 83.6 3.0 4.8 7.4 0.1 1.0 17,703
Other forces
Violence Against Person 92.5 1.9 2.1 0.9 0.1 2.5 31,523Burglary 95.3 1.4 1.1 0.5 0.1 1.7 7,436Robbery 81.6 5.8 8.4 3.2 0.3 0.7 1,472Theft & Handling 92.8 1.4 1.7 1.2 0.2 2.6 33,878Vehicle Theft 95.0 1.5 1.2 0.8 0.1 1.5 6,056Criminal Damage 94.6 1.3 1.2 0.5 0.1 2.3 24,188Drugs Offences 92.8 1.6 2.1 1.1 0.2 2.2 6,412Public Order 94.1 1.6 1.4 0.6 0.1 2.3 14,860Racially Aggravated Offences 93.3 2.3 1.5 0.9 0.2 1.7 1,111Other 92.0 1.7 1.6 1.0 0.2 3.6 46,887
Total 93.0 1.6 1.7 0.9 0.2 2.7 173,823
England and Wales
Violence Against Person 85.5 2.9 6.2 2.8 0.3 2.3 54,661Burglary 90.4 2.5 3.3 2.0 0.2 1.6 13,309Robbery 51.2 8.0 28.6 8.6 0.8 2.8 5,607Theft & Handling 86.4 2.3 5.2 3.2 0.5 2.4 55,907Vehicle Theft 88.0 2.6 4.3 3.3 0.3 1.5 10,858Criminal Damage 91.3 2.0 3.0 1.5 0.2 2.0 39,028Drugs Offences 77.1 4.0 11.4 4.9 0.5 2.1 12,794Public Order 89.3 2.3 4.1 2.0 0.2 2.3 22,496Racially Aggravated Offences 88.3 3.4 3.8 2.3 0.1 2.2 2,165Other 82.5 3.0 6.0 4.0 0.4 4.0 85,035
Total 85.2 2.8 5.8 3.1 0.3 2.7 301,860
(1) Includes City of London.Source: Youth Justice Annual Statistics 2005/06
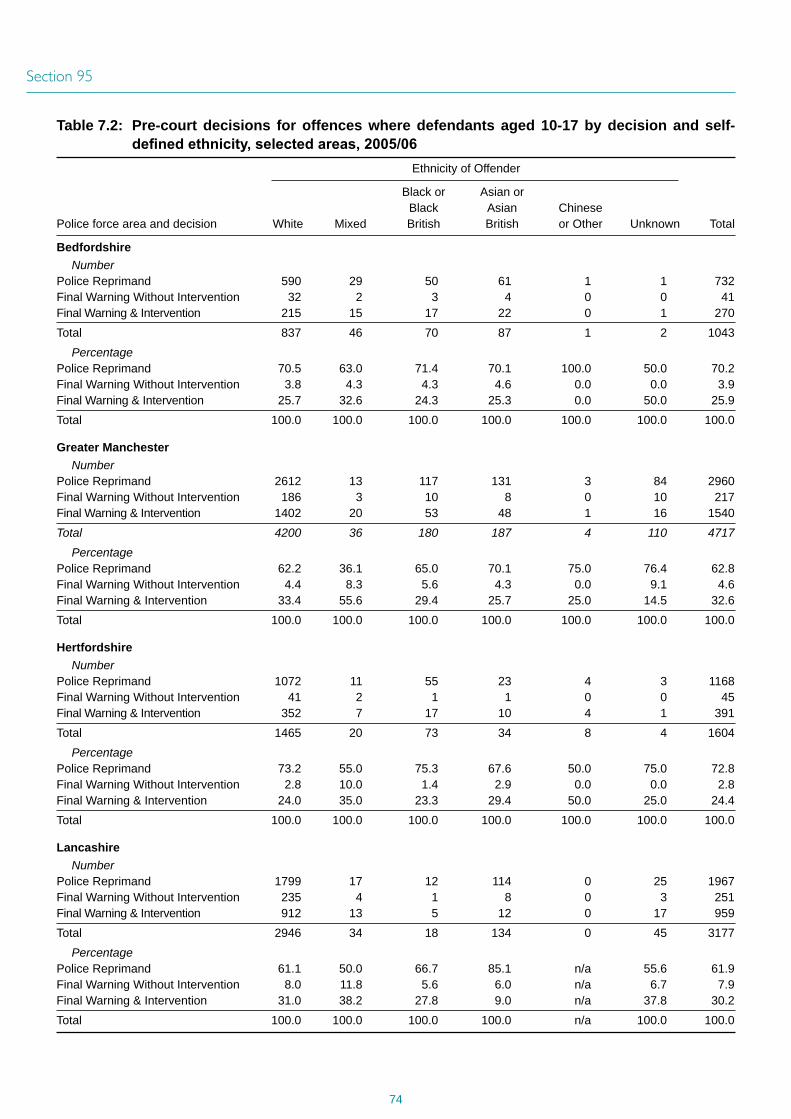
Section 95
74
Table 7.2: Pre-court decisions for offences where defendants aged 10-17 by decision and self-defined ethnicity, selected areas, 2005/06
Ethnicity of Offender
Black or Asian or Black Asian Chinese Police force area and decision White Mixed British British or Other Unknown Total
Bedfordshire
NumberPolice Reprimand 590 29 50 61 1 1 732Final Warning Without Intervention 32 2 3 4 0 0 41Final Warning & Intervention 215 15 17 22 0 1 270
Total 837 46 70 87 1 2 1043
PercentagePolice Reprimand 70.5 63.0 71.4 70.1 100.0 50.0 70.2Final Warning Without Intervention 3.8 4.3 4.3 4.6 0.0 0.0 3.9Final Warning & Intervention 25.7 32.6 24.3 25.3 0.0 50.0 25.9
Total 100.0 100.0 100.0 100.0 100.0 100.0 100.0
Greater Manchester
Number Police Reprimand 2612 13 117 131 3 84 2960Final Warning Without Intervention 186 3 10 8 0 10 217Final Warning & Intervention 1402 20 53 48 1 16 1540
Total 4200 36 180 187 4 110 4717
PercentagePolice Reprimand 62.2 36.1 65.0 70.1 75.0 76.4 62.8Final Warning Without Intervention 4.4 8.3 5.6 4.3 0.0 9.1 4.6Final Warning & Intervention 33.4 55.6 29.4 25.7 25.0 14.5 32.6
Total 100.0 100.0 100.0 100.0 100.0 100.0 100.0
Hertfordshire
Number Police Reprimand 1072 11 55 23 4 3 1168Final Warning Without Intervention 41 2 1 1 0 0 45Final Warning & Intervention 352 7 17 10 4 1 391
Total 1465 20 73 34 8 4 1604
Percentage Police Reprimand 73.2 55.0 75.3 67.6 50.0 75.0 72.8Final Warning Without Intervention 2.8 10.0 1.4 2.9 0.0 0.0 2.8Final Warning & Intervention 24.0 35.0 23.3 29.4 50.0 25.0 24.4
Total 100.0 100.0 100.0 100.0 100.0 100.0 100.0
Lancashire
NumberPolice Reprimand 1799 17 12 114 0 25 1967Final Warning Without Intervention 235 4 1 8 0 3 251Final Warning & Intervention 912 13 5 12 0 17 959
Total 2946 34 18 134 0 45 3177
Percentage Police Reprimand 61.1 50.0 66.7 85.1 n/a 55.6 61.9Final Warning Without Intervention 8.0 11.8 5.6 6.0 n/a 6.7 7.9Final Warning & Intervention 31.0 38.2 27.8 9.0 n/a 37.8 30.2
Total 100.0 100.0 100.0 100.0 n/a 100.0 100.0
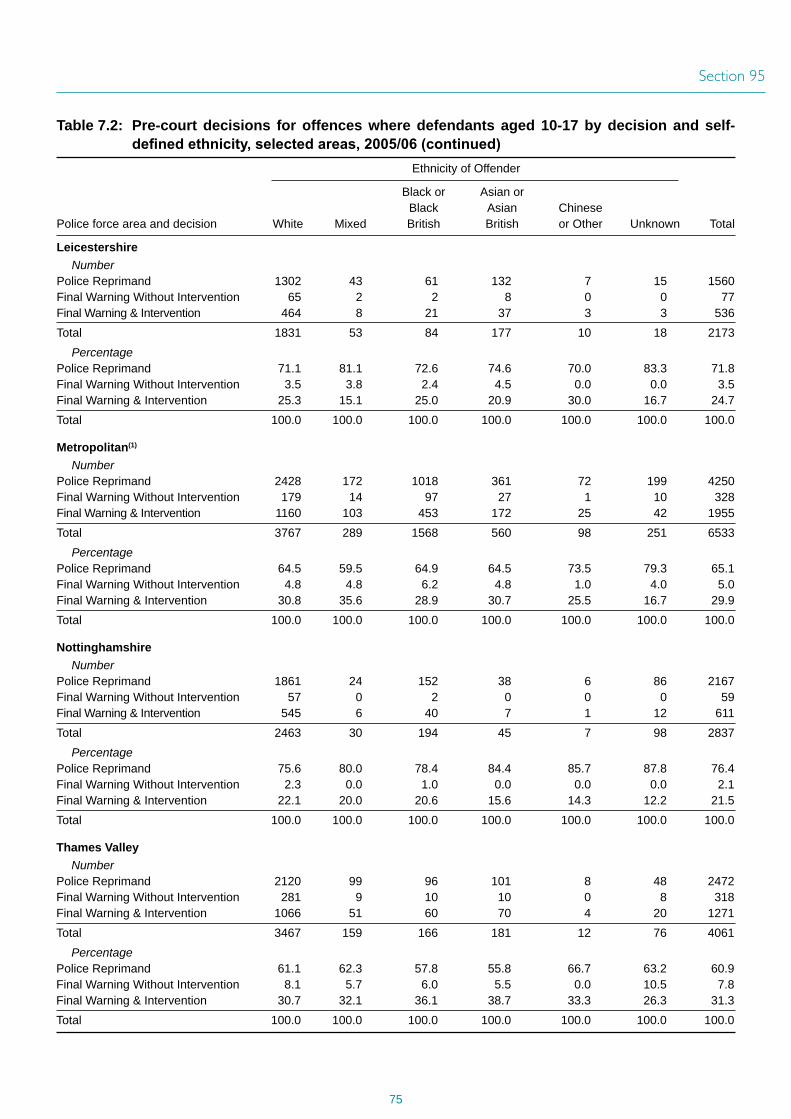
Section 95
75
Table 7.2: Pre-court decisions for offences where defendants aged 10-17 by decision and self-defined ethnicity, selected areas, 2005/06 (continued)
Ethnicity of Offender
Black or Asian or Black Asian Chinese Police force area and decision White Mixed British British or Other Unknown Total
Leicestershire
Number Police Reprimand 1302 43 61 132 7 15 1560Final Warning Without Intervention 65 2 2 8 0 0 77Final Warning & Intervention 464 8 21 37 3 3 536
Total 1831 53 84 177 10 18 2173
Percentage Police Reprimand 71.1 81.1 72.6 74.6 70.0 83.3 71.8Final Warning Without Intervention 3.5 3.8 2.4 4.5 0.0 0.0 3.5Final Warning & Intervention 25.3 15.1 25.0 20.9 30.0 16.7 24.7
Total 100.0 100.0 100.0 100.0 100.0 100.0 100.0
Metropolitan(1)
Number Police Reprimand 2428 172 1018 361 72 199 4250Final Warning Without Intervention 179 14 97 27 1 10 328Final Warning & Intervention 1160 103 453 172 25 42 1955
Total 3767 289 1568 560 98 251 6533
Percentage Police Reprimand 64.5 59.5 64.9 64.5 73.5 79.3 65.1Final Warning Without Intervention 4.8 4.8 6.2 4.8 1.0 4.0 5.0Final Warning & Intervention 30.8 35.6 28.9 30.7 25.5 16.7 29.9
Total 100.0 100.0 100.0 100.0 100.0 100.0 100.0
Nottinghamshire
Number Police Reprimand 1861 24 152 38 6 86 2167Final Warning Without Intervention 57 0 2 0 0 0 59Final Warning & Intervention 545 6 40 7 1 12 611
Total 2463 30 194 45 7 98 2837
Percentage Police Reprimand 75.6 80.0 78.4 84.4 85.7 87.8 76.4Final Warning Without Intervention 2.3 0.0 1.0 0.0 0.0 0.0 2.1Final Warning & Intervention 22.1 20.0 20.6 15.6 14.3 12.2 21.5
Total 100.0 100.0 100.0 100.0 100.0 100.0 100.0
Thames Valley
Number Police Reprimand 2120 99 96 101 8 48 2472Final Warning Without Intervention 281 9 10 10 0 8 318Final Warning & Intervention 1066 51 60 70 4 20 1271
Total 3467 159 166 181 12 76 4061
Percentage Police Reprimand 61.1 62.3 57.8 55.8 66.7 63.2 60.9Final Warning Without Intervention 8.1 5.7 6.0 5.5 0.0 10.5 7.8Final Warning & Intervention 30.7 32.1 36.1 38.7 33.3 26.3 31.3
Total 100.0 100.0 100.0 100.0 100.0 100.0 100.0
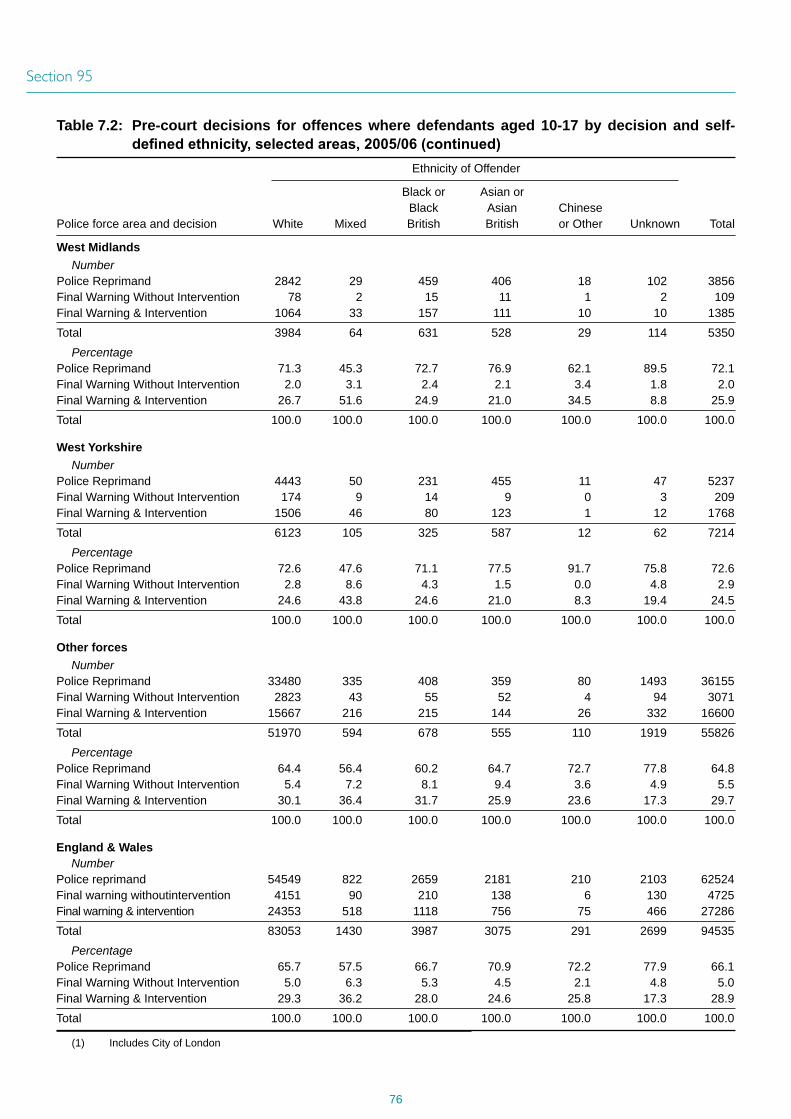
Section 95
76
Table 7.2: Pre-court decisions for offences where defendants aged 10-17 by decision and self-defined ethnicity, selected areas, 2005/06 (continued)
Ethnicity of Offender
Black or Asian or Black Asian Chinese Police force area and decision White Mixed British British or Other Unknown Total
West Midlands
Number Police Reprimand 2842 29 459 406 18 102 3856Final Warning Without Intervention 78 2 15 11 1 2 109Final Warning & Intervention 1064 33 157 111 10 10 1385
Total 3984 64 631 528 29 114 5350
Percentage Police Reprimand 71.3 45.3 72.7 76.9 62.1 89.5 72.1Final Warning Without Intervention 2.0 3.1 2.4 2.1 3.4 1.8 2.0Final Warning & Intervention 26.7 51.6 24.9 21.0 34.5 8.8 25.9
Total 100.0 100.0 100.0 100.0 100.0 100.0 100.0
West Yorkshire
Number Police Reprimand 4443 50 231 455 11 47 5237Final Warning Without Intervention 174 9 14 9 0 3 209Final Warning & Intervention 1506 46 80 123 1 12 1768
Total 6123 105 325 587 12 62 7214
Percentage Police Reprimand 72.6 47.6 71.1 77.5 91.7 75.8 72.6Final Warning Without Intervention 2.8 8.6 4.3 1.5 0.0 4.8 2.9Final Warning & Intervention 24.6 43.8 24.6 21.0 8.3 19.4 24.5
Total 100.0 100.0 100.0 100.0 100.0 100.0 100.0
Other forces
Number Police Reprimand 33480 335 408 359 80 1493 36155Final Warning Without Intervention 2823 43 55 52 4 94 3071Final Warning & Intervention 15667 216 215 144 26 332 16600
Total 51970 594 678 555 110 1919 55826
Percentage Police Reprimand 64.4 56.4 60.2 64.7 72.7 77.8 64.8Final Warning Without Intervention 5.4 7.2 8.1 9.4 3.6 4.9 5.5Final Warning & Intervention 30.1 36.4 31.7 25.9 23.6 17.3 29.7
Total 100.0 100.0 100.0 100.0 100.0 100.0 100.0
England & Wales Number
Police reprimand 54549 822 2659 2181 210 2103 62524Final warning withoutintervention 4151 90 210 138 6 130 4725Final warning & intervention 24353 518 1118 756 75 466 27286
Total 83053 1430 3987 3075 291 2699 94535
Percentage Police Reprimand 65.7 57.5 66.7 70.9 72.2 77.9 66.1Final Warning Without Intervention 5.0 6.3 5.3 4.5 2.1 4.8 5.0Final Warning & Intervention 29.3 36.2 28.0 24.6 25.8 17.3 28.9
Total 100.0 100.0 100.0 100.0 100.0 100.0 100.0
(1) Includes City of London
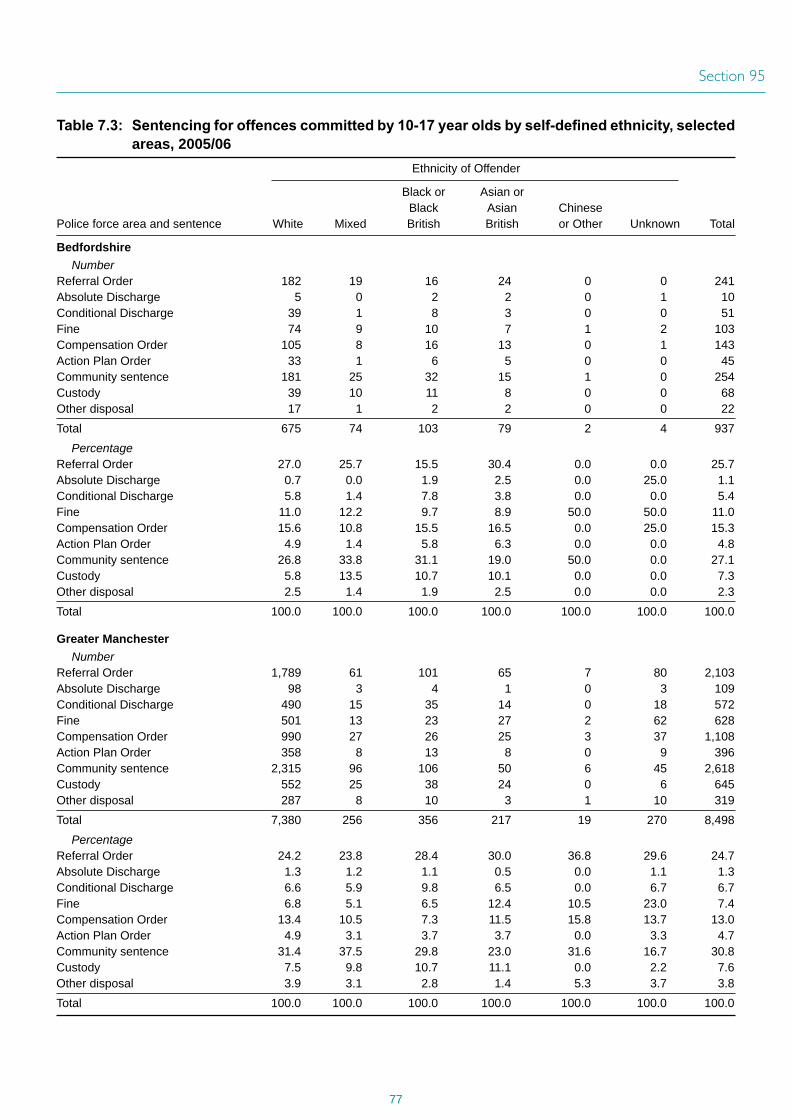
Section 95
77
Table 7.3: Sentencing for offences committed by 10-17 year olds by self-defined ethnicity, selected areas, 2005/06
Ethnicity of Offender
Black or Asian or Black Asian Chinese Police force area and sentence White Mixed British British or Other Unknown Total
Bedfordshire
Number Referral Order 182 19 16 24 0 0 241Absolute Discharge 5 0 2 2 0 1 10Conditional Discharge 39 1 8 3 0 0 51Fine 74 9 10 7 1 2 103Compensation Order 105 8 16 13 0 1 143Action Plan Order 33 1 6 5 0 0 45Community sentence 181 25 32 15 1 0 254Custody 39 10 11 8 0 0 68Other disposal 17 1 2 2 0 0 22
Total 675 74 103 79 2 4 937
Percentage Referral Order 27.0 25.7 15.5 30.4 0.0 0.0 25.7Absolute Discharge 0.7 0.0 1.9 2.5 0.0 25.0 1.1Conditional Discharge 5.8 1.4 7.8 3.8 0.0 0.0 5.4Fine 11.0 12.2 9.7 8.9 50.0 50.0 11.0Compensation Order 15.6 10.8 15.5 16.5 0.0 25.0 15.3Action Plan Order 4.9 1.4 5.8 6.3 0.0 0.0 4.8Community sentence 26.8 33.8 31.1 19.0 50.0 0.0 27.1Custody 5.8 13.5 10.7 10.1 0.0 0.0 7.3Other disposal 2.5 1.4 1.9 2.5 0.0 0.0 2.3
Total 100.0 100.0 100.0 100.0 100.0 100.0 100.0
Greater Manchester
NumberReferral Order 1,789 61 101 65 7 80 2,103Absolute Discharge 98 3 4 1 0 3 109Conditional Discharge 490 15 35 14 0 18 572Fine 501 13 23 27 2 62 628Compensation Order 990 27 26 25 3 37 1,108Action Plan Order 358 8 13 8 0 9 396Community sentence 2,315 96 106 50 6 45 2,618Custody 552 25 38 24 0 6 645Other disposal 287 8 10 3 1 10 319
Total 7,380 256 356 217 19 270 8,498
Percentage Referral Order 24.2 23.8 28.4 30.0 36.8 29.6 24.7Absolute Discharge 1.3 1.2 1.1 0.5 0.0 1.1 1.3Conditional Discharge 6.6 5.9 9.8 6.5 0.0 6.7 6.7Fine 6.8 5.1 6.5 12.4 10.5 23.0 7.4Compensation Order 13.4 10.5 7.3 11.5 15.8 13.7 13.0Action Plan Order 4.9 3.1 3.7 3.7 0.0 3.3 4.7Community sentence 31.4 37.5 29.8 23.0 31.6 16.7 30.8Custody 7.5 9.8 10.7 11.1 0.0 2.2 7.6Other disposal 3.9 3.1 2.8 1.4 5.3 3.7 3.8
Total 100.0 100.0 100.0 100.0 100.0 100.0 100.0
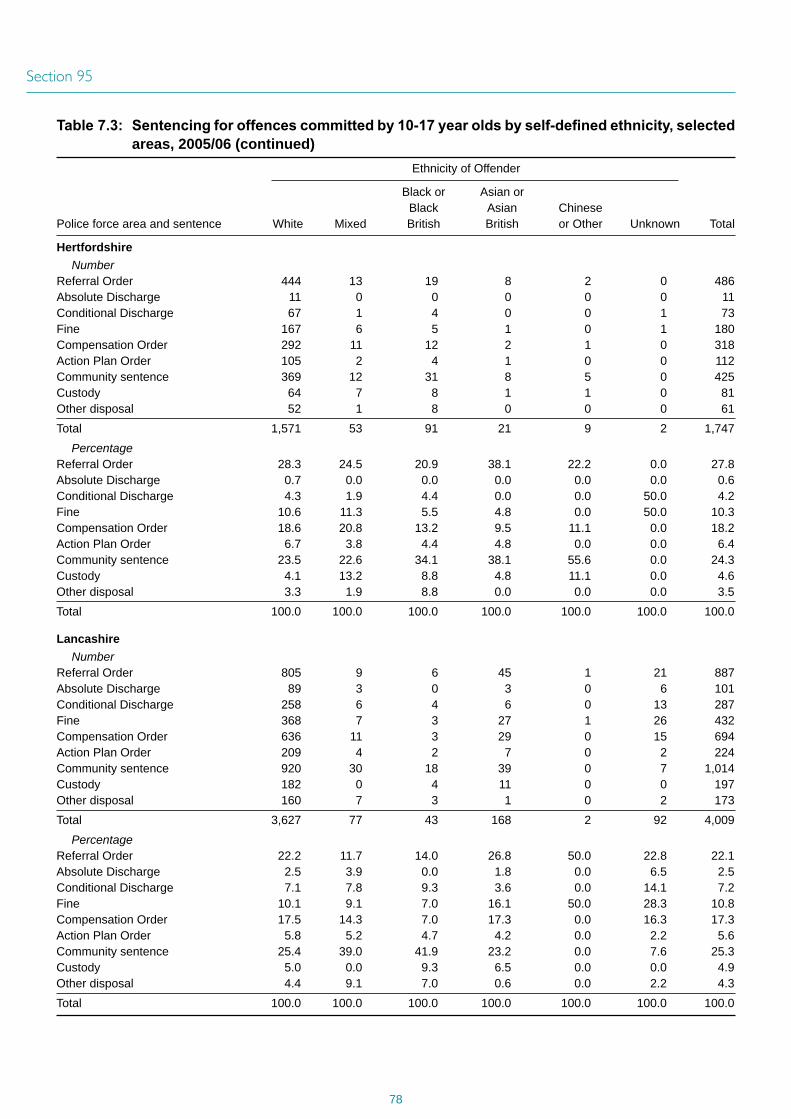
Section 95
78
Table 7.3: Sentencing for offences committed by 10-17 year olds by self-defined ethnicity, selected areas, 2005/06 (continued)
Ethnicity of Offender
Black or Asian or Black Asian Chinese Police force area and sentence White Mixed British British or Other Unknown Total
Hertfordshire
Number Referral Order 444 13 19 8 2 0 486Absolute Discharge 11 0 0 0 0 0 11Conditional Discharge 67 1 4 0 0 1 73Fine 167 6 5 1 0 1 180Compensation Order 292 11 12 2 1 0 318Action Plan Order 105 2 4 1 0 0 112Community sentence 369 12 31 8 5 0 425Custody 64 7 8 1 1 0 81Other disposal 52 1 8 0 0 0 61
Total 1,571 53 91 21 9 2 1,747
Percentage Referral Order 28.3 24.5 20.9 38.1 22.2 0.0 27.8Absolute Discharge 0.7 0.0 0.0 0.0 0.0 0.0 0.6Conditional Discharge 4.3 1.9 4.4 0.0 0.0 50.0 4.2Fine 10.6 11.3 5.5 4.8 0.0 50.0 10.3Compensation Order 18.6 20.8 13.2 9.5 11.1 0.0 18.2Action Plan Order 6.7 3.8 4.4 4.8 0.0 0.0 6.4Community sentence 23.5 22.6 34.1 38.1 55.6 0.0 24.3Custody 4.1 13.2 8.8 4.8 11.1 0.0 4.6Other disposal 3.3 1.9 8.8 0.0 0.0 0.0 3.5
Total 100.0 100.0 100.0 100.0 100.0 100.0 100.0
Lancashire
Number Referral Order 805 9 6 45 1 21 887Absolute Discharge 89 3 0 3 0 6 101Conditional Discharge 258 6 4 6 0 13 287Fine 368 7 3 27 1 26 432Compensation Order 636 11 3 29 0 15 694Action Plan Order 209 4 2 7 0 2 224Community sentence 920 30 18 39 0 7 1,014Custody 182 0 4 11 0 0 197Other disposal 160 7 3 1 0 2 173
Total 3,627 77 43 168 2 92 4,009
Percentage Referral Order 22.2 11.7 14.0 26.8 50.0 22.8 22.1Absolute Discharge 2.5 3.9 0.0 1.8 0.0 6.5 2.5Conditional Discharge 7.1 7.8 9.3 3.6 0.0 14.1 7.2Fine 10.1 9.1 7.0 16.1 50.0 28.3 10.8Compensation Order 17.5 14.3 7.0 17.3 0.0 16.3 17.3Action Plan Order 5.8 5.2 4.7 4.2 0.0 2.2 5.6Community sentence 25.4 39.0 41.9 23.2 0.0 7.6 25.3Custody 5.0 0.0 9.3 6.5 0.0 0.0 4.9Other disposal 4.4 9.1 7.0 0.6 0.0 2.2 4.3
Total 100.0 100.0 100.0 100.0 100.0 100.0 100.0
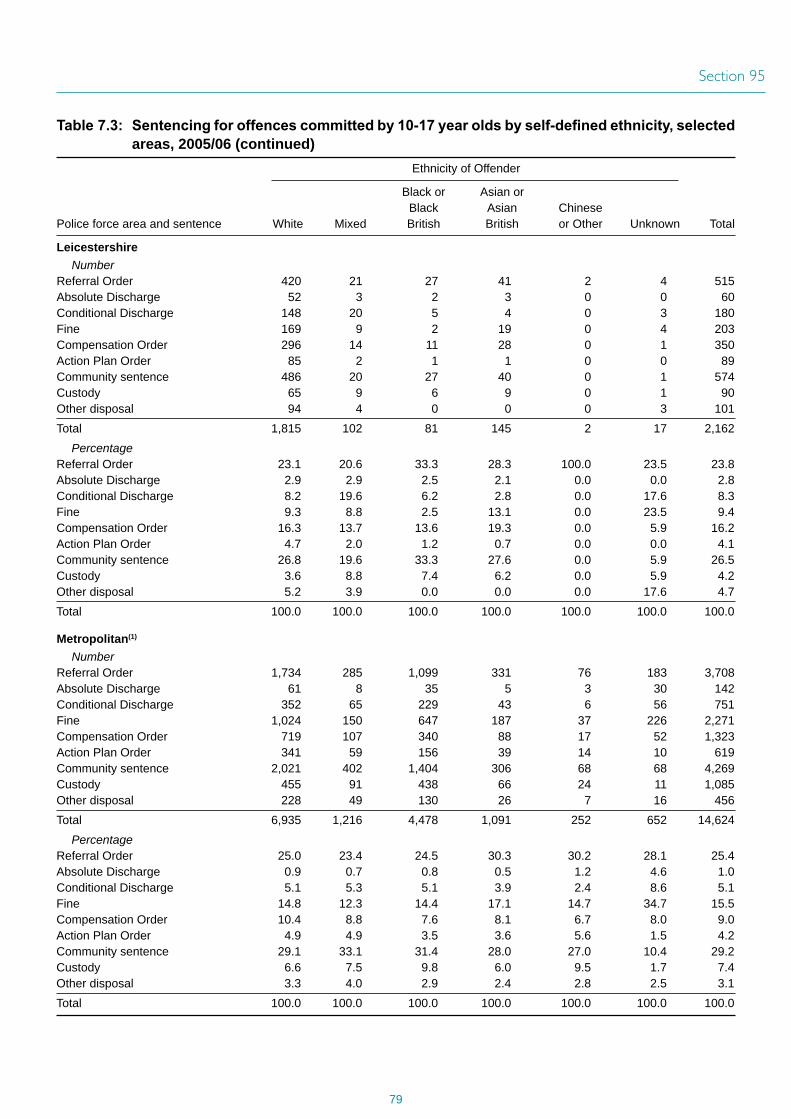
Section 95
79
Table 7.3: Sentencing for offences committed by 10-17 year olds by self-defined ethnicity, selected areas, 2005/06 (continued)
Ethnicity of Offender
Black or Asian or Black Asian Chinese Police force area and sentence White Mixed British British or Other Unknown Total
Leicestershire
Number Referral Order 420 21 27 41 2 4 515Absolute Discharge 52 3 2 3 0 0 60Conditional Discharge 148 20 5 4 0 3 180Fine 169 9 2 19 0 4 203Compensation Order 296 14 11 28 0 1 350Action Plan Order 85 2 1 1 0 0 89Community sentence 486 20 27 40 0 1 574Custody 65 9 6 9 0 1 90Other disposal 94 4 0 0 0 3 101
Total 1,815 102 81 145 2 17 2,162
Percentage Referral Order 23.1 20.6 33.3 28.3 100.0 23.5 23.8Absolute Discharge 2.9 2.9 2.5 2.1 0.0 0.0 2.8Conditional Discharge 8.2 19.6 6.2 2.8 0.0 17.6 8.3Fine 9.3 8.8 2.5 13.1 0.0 23.5 9.4Compensation Order 16.3 13.7 13.6 19.3 0.0 5.9 16.2Action Plan Order 4.7 2.0 1.2 0.7 0.0 0.0 4.1Community sentence 26.8 19.6 33.3 27.6 0.0 5.9 26.5Custody 3.6 8.8 7.4 6.2 0.0 5.9 4.2Other disposal 5.2 3.9 0.0 0.0 0.0 17.6 4.7
Total 100.0 100.0 100.0 100.0 100.0 100.0 100.0
Metropolitan(1)
Number Referral Order 1,734 285 1,099 331 76 183 3,708Absolute Discharge 61 8 35 5 3 30 142Conditional Discharge 352 65 229 43 6 56 751Fine 1,024 150 647 187 37 226 2,271Compensation Order 719 107 340 88 17 52 1,323Action Plan Order 341 59 156 39 14 10 619Community sentence 2,021 402 1,404 306 68 68 4,269Custody 455 91 438 66 24 11 1,085Other disposal 228 49 130 26 7 16 456
Total 6,935 1,216 4,478 1,091 252 652 14,624
Percentage Referral Order 25.0 23.4 24.5 30.3 30.2 28.1 25.4Absolute Discharge 0.9 0.7 0.8 0.5 1.2 4.6 1.0Conditional Discharge 5.1 5.3 5.1 3.9 2.4 8.6 5.1Fine 14.8 12.3 14.4 17.1 14.7 34.7 15.5Compensation Order 10.4 8.8 7.6 8.1 6.7 8.0 9.0Action Plan Order 4.9 4.9 3.5 3.6 5.6 1.5 4.2Community sentence 29.1 33.1 31.4 28.0 27.0 10.4 29.2Custody 6.6 7.5 9.8 6.0 9.5 1.7 7.4Other disposal 3.3 4.0 2.9 2.4 2.8 2.5 3.1
Total 100.0 100.0 100.0 100.0 100.0 100.0 100.0
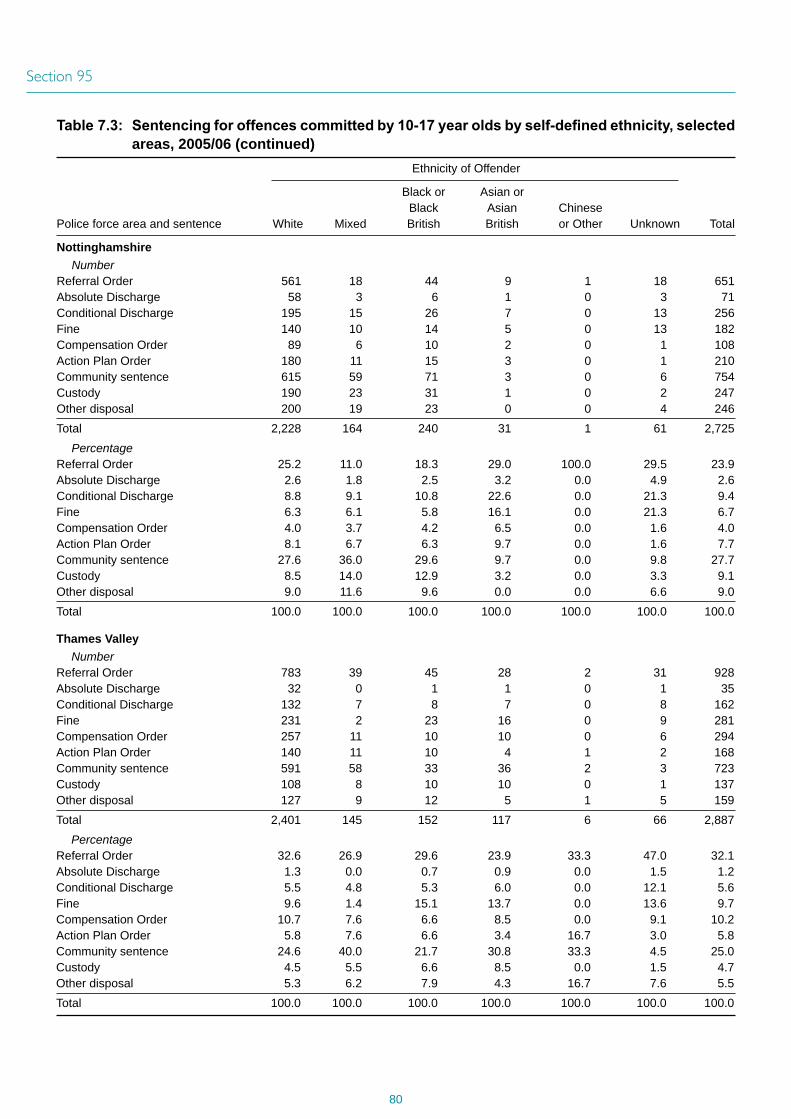
Section 95
80
Table 7.3: Sentencing for offences committed by 10-17 year olds by self-defined ethnicity, selected areas, 2005/06 (continued)
Ethnicity of Offender
Black or Asian or Black Asian Chinese Police force area and sentence White Mixed British British or Other Unknown Total
Nottinghamshire
Number Referral Order 561 18 44 9 1 18 651Absolute Discharge 58 3 6 1 0 3 71Conditional Discharge 195 15 26 7 0 13 256Fine 140 10 14 5 0 13 182Compensation Order 89 6 10 2 0 1 108Action Plan Order 180 11 15 3 0 1 210Community sentence 615 59 71 3 0 6 754Custody 190 23 31 1 0 2 247Other disposal 200 19 23 0 0 4 246
Total 2,228 164 240 31 1 61 2,725
Percentage Referral Order 25.2 11.0 18.3 29.0 100.0 29.5 23.9Absolute Discharge 2.6 1.8 2.5 3.2 0.0 4.9 2.6Conditional Discharge 8.8 9.1 10.8 22.6 0.0 21.3 9.4Fine 6.3 6.1 5.8 16.1 0.0 21.3 6.7Compensation Order 4.0 3.7 4.2 6.5 0.0 1.6 4.0Action Plan Order 8.1 6.7 6.3 9.7 0.0 1.6 7.7Community sentence 27.6 36.0 29.6 9.7 0.0 9.8 27.7Custody 8.5 14.0 12.9 3.2 0.0 3.3 9.1Other disposal 9.0 11.6 9.6 0.0 0.0 6.6 9.0
Total 100.0 100.0 100.0 100.0 100.0 100.0 100.0
Thames Valley
Number Referral Order 783 39 45 28 2 31 928Absolute Discharge 32 0 1 1 0 1 35Conditional Discharge 132 7 8 7 0 8 162Fine 231 2 23 16 0 9 281Compensation Order 257 11 10 10 0 6 294Action Plan Order 140 11 10 4 1 2 168Community sentence 591 58 33 36 2 3 723Custody 108 8 10 10 0 1 137Other disposal 127 9 12 5 1 5 159
Total 2,401 145 152 117 6 66 2,887
Percentage Referral Order 32.6 26.9 29.6 23.9 33.3 47.0 32.1Absolute Discharge 1.3 0.0 0.7 0.9 0.0 1.5 1.2Conditional Discharge 5.5 4.8 5.3 6.0 0.0 12.1 5.6Fine 9.6 1.4 15.1 13.7 0.0 13.6 9.7Compensation Order 10.7 7.6 6.6 8.5 0.0 9.1 10.2Action Plan Order 5.8 7.6 6.6 3.4 16.7 3.0 5.8Community sentence 24.6 40.0 21.7 30.8 33.3 4.5 25.0Custody 4.5 5.5 6.6 8.5 0.0 1.5 4.7Other disposal 5.3 6.2 7.9 4.3 16.7 7.6 5.5
Total 100.0 100.0 100.0 100.0 100.0 100.0 100.0
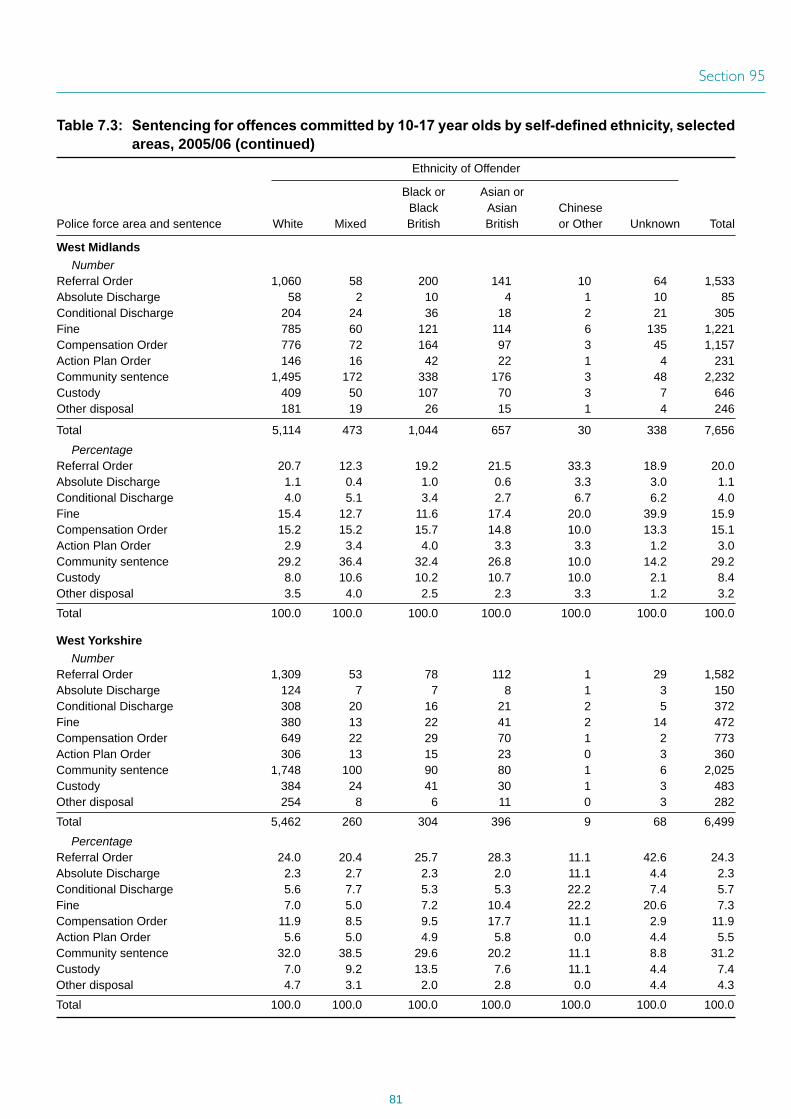
Section 95
81
Table 7.3: Sentencing for offences committed by 10-17 year olds by self-defined ethnicity, selected areas, 2005/06 (continued)
Ethnicity of Offender
Black or Asian or Black Asian Chinese Police force area and sentence White Mixed British British or Other Unknown Total
West Midlands
Number Referral Order 1,060 58 200 141 10 64 1,533Absolute Discharge 58 2 10 4 1 10 85Conditional Discharge 204 24 36 18 2 21 305Fine 785 60 121 114 6 135 1,221Compensation Order 776 72 164 97 3 45 1,157Action Plan Order 146 16 42 22 1 4 231Community sentence 1,495 172 338 176 3 48 2,232Custody 409 50 107 70 3 7 646Other disposal 181 19 26 15 1 4 246
Total 5,114 473 1,044 657 30 338 7,656
Percentage Referral Order 20.7 12.3 19.2 21.5 33.3 18.9 20.0Absolute Discharge 1.1 0.4 1.0 0.6 3.3 3.0 1.1Conditional Discharge 4.0 5.1 3.4 2.7 6.7 6.2 4.0Fine 15.4 12.7 11.6 17.4 20.0 39.9 15.9Compensation Order 15.2 15.2 15.7 14.8 10.0 13.3 15.1Action Plan Order 2.9 3.4 4.0 3.3 3.3 1.2 3.0Community sentence 29.2 36.4 32.4 26.8 10.0 14.2 29.2Custody 8.0 10.6 10.2 10.7 10.0 2.1 8.4Other disposal 3.5 4.0 2.5 2.3 3.3 1.2 3.2
Total 100.0 100.0 100.0 100.0 100.0 100.0 100.0
West Yorkshire
Number Referral Order 1,309 53 78 112 1 29 1,582Absolute Discharge 124 7 7 8 1 3 150Conditional Discharge 308 20 16 21 2 5 372Fine 380 13 22 41 2 14 472Compensation Order 649 22 29 70 1 2 773Action Plan Order 306 13 15 23 0 3 360Community sentence 1,748 100 90 80 1 6 2,025Custody 384 24 41 30 1 3 483Other disposal 254 8 6 11 0 3 282
Total 5,462 260 304 396 9 68 6,499
Percentage Referral Order 24.0 20.4 25.7 28.3 11.1 42.6 24.3Absolute Discharge 2.3 2.7 2.3 2.0 11.1 4.4 2.3Conditional Discharge 5.6 7.7 5.3 5.3 22.2 7.4 5.7Fine 7.0 5.0 7.2 10.4 22.2 20.6 7.3Compensation Order 11.9 8.5 9.5 17.7 11.1 2.9 11.9Action Plan Order 5.6 5.0 4.9 5.8 0.0 4.4 5.5Community sentence 32.0 38.5 29.6 20.2 11.1 8.8 31.2Custody 7.0 9.2 13.5 7.6 11.1 4.4 7.4Other disposal 4.7 3.1 2.0 2.8 0.0 4.4 4.3
Total 100.0 100.0 100.0 100.0 100.0 100.0 100.0
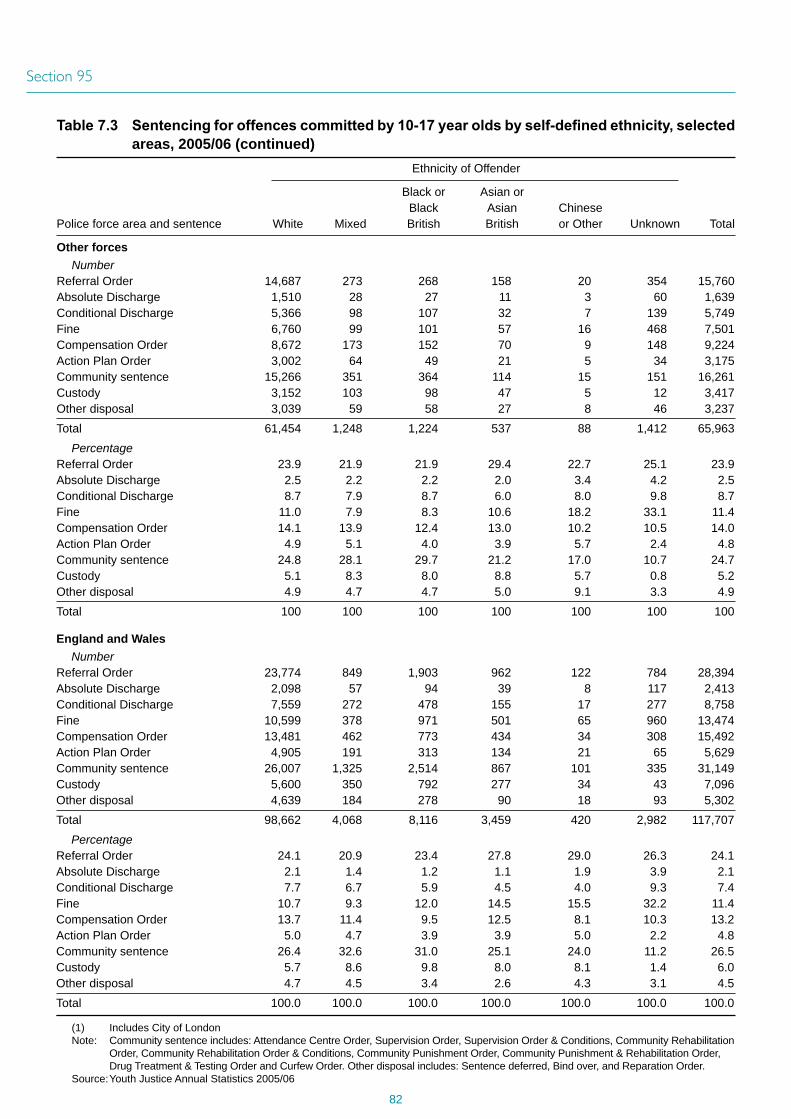
Section 95
82
Table 7.3 Sentencing for offences committed by 10-17 year olds by self-defined ethnicity, selected areas, 2005/06 (continued)
Ethnicity of Offender
Black or Asian or Black Asian Chinese Police force area and sentence White Mixed British British or Other Unknown Total
Other forces
Number Referral Order 14,687 273 268 158 20 354 15,760Absolute Discharge 1,510 28 27 11 3 60 1,639Conditional Discharge 5,366 98 107 32 7 139 5,749Fine 6,760 99 101 57 16 468 7,501Compensation Order 8,672 173 152 70 9 148 9,224Action Plan Order 3,002 64 49 21 5 34 3,175Community sentence 15,266 351 364 114 15 151 16,261Custody 3,152 103 98 47 5 12 3,417Other disposal 3,039 59 58 27 8 46 3,237
Total 61,454 1,248 1,224 537 88 1,412 65,963
Percentage Referral Order 23.9 21.9 21.9 29.4 22.7 25.1 23.9Absolute Discharge 2.5 2.2 2.2 2.0 3.4 4.2 2.5Conditional Discharge 8.7 7.9 8.7 6.0 8.0 9.8 8.7Fine 11.0 7.9 8.3 10.6 18.2 33.1 11.4Compensation Order 14.1 13.9 12.4 13.0 10.2 10.5 14.0Action Plan Order 4.9 5.1 4.0 3.9 5.7 2.4 4.8Community sentence 24.8 28.1 29.7 21.2 17.0 10.7 24.7Custody 5.1 8.3 8.0 8.8 5.7 0.8 5.2Other disposal 4.9 4.7 4.7 5.0 9.1 3.3 4.9
Total 100 100 100 100 100 100 100
England and Wales
Number Referral Order 23,774 849 1,903 962 122 784 28,394Absolute Discharge 2,098 57 94 39 8 117 2,413Conditional Discharge 7,559 272 478 155 17 277 8,758Fine 10,599 378 971 501 65 960 13,474Compensation Order 13,481 462 773 434 34 308 15,492Action Plan Order 4,905 191 313 134 21 65 5,629Community sentence 26,007 1,325 2,514 867 101 335 31,149Custody 5,600 350 792 277 34 43 7,096Other disposal 4,639 184 278 90 18 93 5,302
Total 98,662 4,068 8,116 3,459 420 2,982 117,707
Percentage Referral Order 24.1 20.9 23.4 27.8 29.0 26.3 24.1Absolute Discharge 2.1 1.4 1.2 1.1 1.9 3.9 2.1Conditional Discharge 7.7 6.7 5.9 4.5 4.0 9.3 7.4Fine 10.7 9.3 12.0 14.5 15.5 32.2 11.4Compensation Order 13.7 11.4 9.5 12.5 8.1 10.3 13.2Action Plan Order 5.0 4.7 3.9 3.9 5.0 2.2 4.8Community sentence 26.4 32.6 31.0 25.1 24.0 11.2 26.5Custody 5.7 8.6 9.8 8.0 8.1 1.4 6.0Other disposal 4.7 4.5 3.4 2.6 4.3 3.1 4.5
Total 100.0 100.0 100.0 100.0 100.0 100.0 100.0
(1) Includes City of London Note: Community sentence includes: Attendance Centre Order, Supervision Order, Supervision Order & Conditions, Community Rehabilitation
Order, Community Rehabilitation Order & Conditions, Community Punishment Order, Community Punishment & Rehabilitation Order, Drug Treatment & Testing Order and Curfew Order. Other disposal includes: Sentence deferred, Bind over, and Reparation Order.
Source: Youth Justice Annual Statistics 2005/06
Section 95
83
Chapter 8: Probation
Introduction
Chapter 2 described how ethnic monitoring with the National Probation Service (NPS) commenced in 1992 but that from the mid-1990s the proportion of ethnic data missing rose substantially. In 1998/9 ethnic data for over 1 in 10 of probation orders and approaching 1 in 5 of Community Service Orders were unavailable.
These problems were identified as an issue in the Probation Inspectorate’s thematic report on race equality (Smith 2000). It found that “for many staff, the completion of race and ethnic monitoring forms was a mechanistic exercise with little meaning”. In almost all of the case files examined, the only section of the form to be completed was that required by the Home Office on self-identified ethnicity.
A follow-up inspection report published by the Probation Inspectorate (Morgan 2004) found that, amongst other things, there were significant delays in the analysis of data; the NPS had not sought to differentiate their database on enforcement by race or gender variables; and there had been delays in the adaptation of the case management system (CRAMS) to enable the input of the new 16+ 1 monitoring categories. The review concluded that none of the recommendations on ethnic monitoring made by the 2000 review had been met. However, the problems with the IT systems have now been resolved, and national figures for those starting court order supervision by the Probation Service have been included in national statistical publications. In spite of this progress the proportion of ethnic data missing in a small number of areas for those commencing pre- or post-release supervision is still too high for the publication of the national figures. This information has been published for only those areas with sufficiently complete data.
Court Supervision: Table 8.1
Information on the ethnicity of persons starting court order supervision under the NPS is given in Table 8.1. In the previous year all probation areas supplied returns with less than 10% missing data. Missing data is where no valid ethnic code has been recorded in the returns submitted by the probation area. For 2005 all but one probation area achieved the missing data standard. The ‘Not Stated’ category included in the table indicates a refusal on the part of the offender to declare their ethnicity to the probation service.
These returns show that, overall, Black offenders accounted for 6% of those commencing court orders, followed by Asian (5%), Mixed (2%) and Chinese/Other (1%) offenders. There is however great variation across probation areas and this reflects the ethnic minority composition of the resident population. For example, the proportion of BME offenders commencing court order supervision ranged in probation areas from 45% in London, 32% in Bedfordshire and 30% in the West Midlands probation areas to less than 1% in Cumbria, Durham and Dyfed-Powys probation areas. The relative proportion of BME groups also varies between probation areas. For example in London, court order supervision commencements were composed of 26% Black and 10% Asian offenders. By contrast, in the West Midlands, court order supervision commencements were composed of 10% Black and 14% Asian offenders.
Section 95
84
Pre- and Post-Release Supervision: Table 8.2
For England and Wales in 2005 a higher proportion of members of BME groups started pre- or post-release supervision by NPS (20%) compared with court order supervision (14%). Black and Asian offenders accounted for 9% and 6% of the total respectively. The greatest proportions for Black offenders starting pre- or post-release supervision were in London (28%) and the West Midlands (14%) probation areas. For Asian offenders the largest concentrations were in Leicestershire (16%), West Midlands (14%) and West Yorkshire (12%). It is not possible to explain these areas’ differences with the rest of England and Wales simply on the basis of the ethnic composition of the resident populations. This is because all but one of these probation area proportions are higher than the proportions for BME groups based on the mid-year (2005) population estimates (see Appendix A2). The exception to this apparent disproportionality was the West Midlands where the percentages for Asian offenders starting pre- or post release supervision were the same as the mid-year population estimates i.e. 14%.
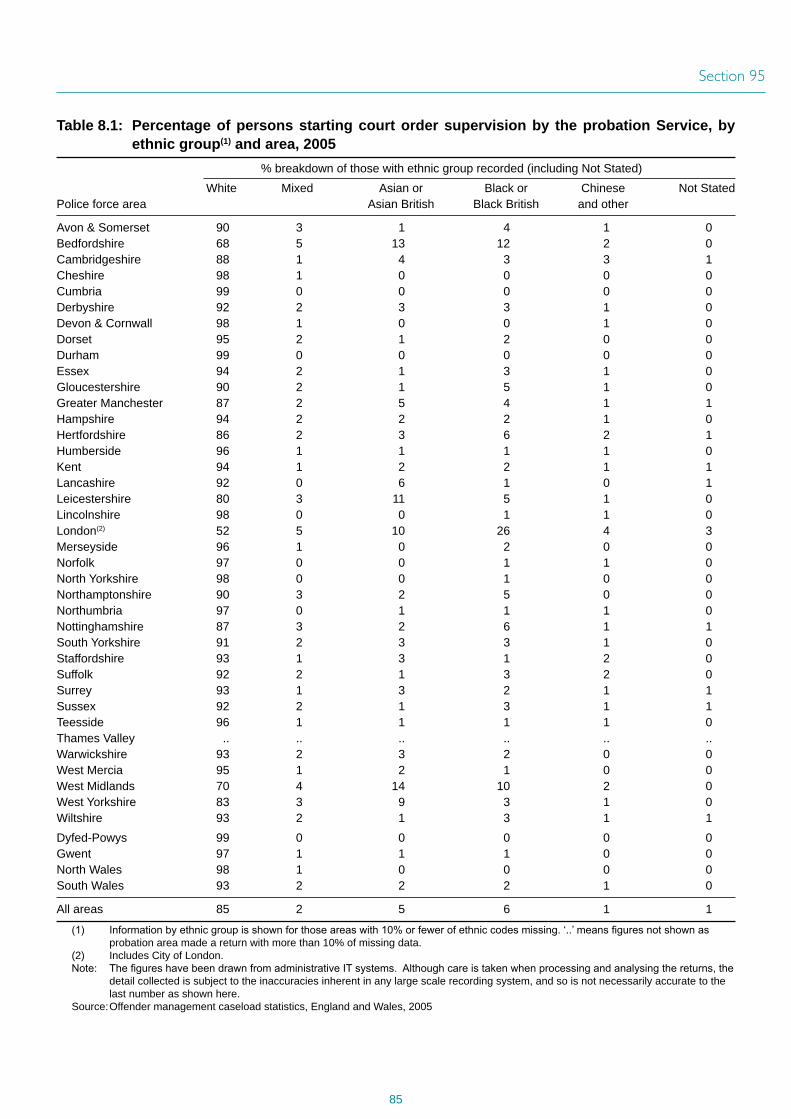
Section 95
85
Table 8.1: Percentage of persons starting court order supervision by the probation Service, by ethnic group(1) and area, 2005
% breakdown of those with ethnic group recorded (including Not Stated)
White Mixed Asian or Black or Chinese Not Stated Police force area Asian British Black British and other
Avon & Somerset 90 3 1 4 1 0Bedfordshire 68 5 13 12 2 0Cambridgeshire 88 1 4 3 3 1Cheshire 98 1 0 0 0 0Cumbria 99 0 0 0 0 0Derbyshire 92 2 3 3 1 0Devon & Cornwall 98 1 0 0 1 0Dorset 95 2 1 2 0 0Durham 99 0 0 0 0 0Essex 94 2 1 3 1 0Gloucestershire 90 2 1 5 1 0Greater Manchester 87 2 5 4 1 1Hampshire 94 2 2 2 1 0Hertfordshire 86 2 3 6 2 1Humberside 96 1 1 1 1 0Kent 94 1 2 2 1 1Lancashire 92 0 6 1 0 1Leicestershire 80 3 11 5 1 0Lincolnshire 98 0 0 1 1 0London(2) 52 5 10 26 4 3Merseyside 96 1 0 2 0 0Norfolk 97 0 0 1 1 0North Yorkshire 98 0 0 1 0 0Northamptonshire 90 3 2 5 0 0Northumbria 97 0 1 1 1 0Nottinghamshire 87 3 2 6 1 1South Yorkshire 91 2 3 3 1 0Staffordshire 93 1 3 1 2 0Suffolk 92 2 1 3 2 0Surrey 93 1 3 2 1 1Sussex 92 2 1 3 1 1Teesside 96 1 1 1 1 0Thames Valley .. .. .. .. .. ..Warwickshire 93 2 3 2 0 0West Mercia 95 1 2 1 0 0West Midlands 70 4 14 10 2 0West Yorkshire 83 3 9 3 1 0Wiltshire 93 2 1 3 1 1
Dyfed-Powys 99 0 0 0 0 0Gwent 97 1 1 1 0 0North Wales 98 1 0 0 0 0South Wales 93 2 2 2 1 0
All areas 85 2 5 6 1 1
(1) Information by ethnic group is shown for those areas with 10% or fewer of ethnic codes missing. ‘..’ means figures not shown as probation area made a return with more than 10% of missing data.
(2) Includes City of London. Note: The figures have been drawn from administrative IT systems. Although care is taken when processing and analysing the returns, the
detail collected is subject to the inaccuracies inherent in any large scale recording system, and so is not necessarily accurate to the last number as shown here.
Source: Offender management caseload statistics, England and Wales, 2005
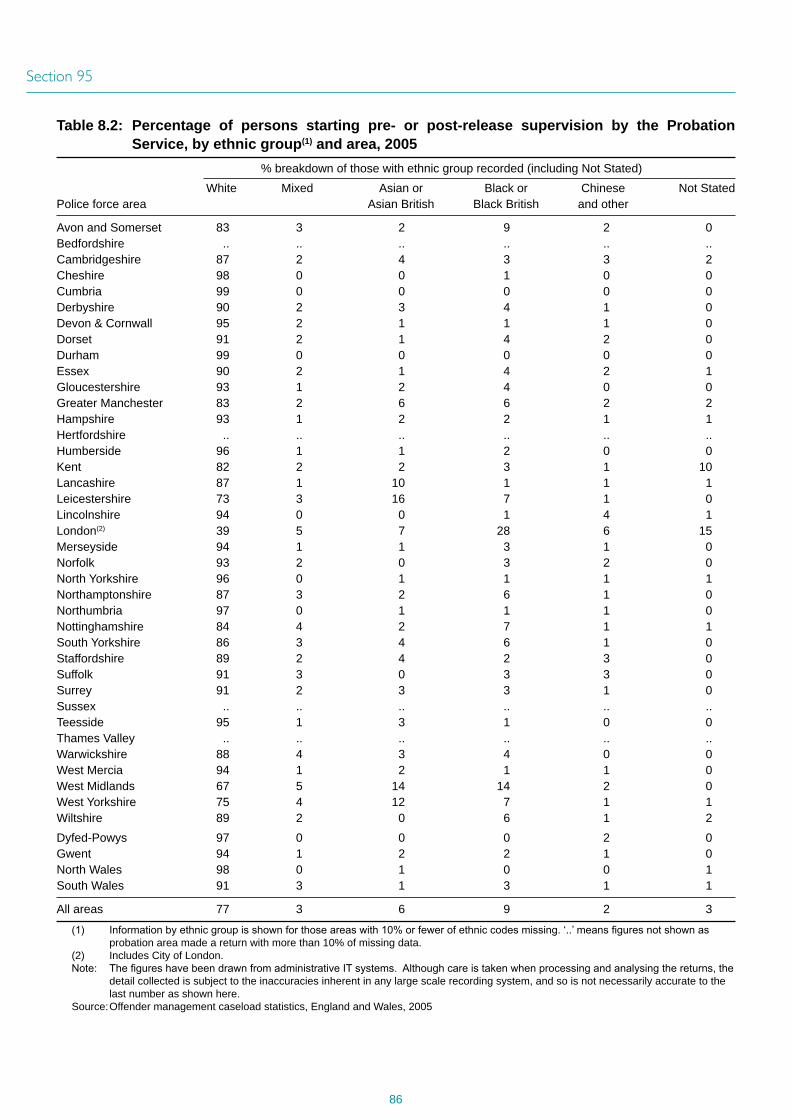
Section 95
86
Table 8.2: Percentage of persons starting pre- or post-release supervision by the Probation Service, by ethnic group(1) and area, 2005
% breakdown of those with ethnic group recorded (including Not Stated)
White Mixed Asian or Black or Chinese Not Stated Police force area Asian British Black British and other
Avon and Somerset 83 3 2 9 2 0Bedfordshire .. .. .. .. .. ..Cambridgeshire 87 2 4 3 3 2Cheshire 98 0 0 1 0 0Cumbria 99 0 0 0 0 0Derbyshire 90 2 3 4 1 0Devon & Cornwall 95 2 1 1 1 0Dorset 91 2 1 4 2 0Durham 99 0 0 0 0 0Essex 90 2 1 4 2 1Gloucestershire 93 1 2 4 0 0Greater Manchester 83 2 6 6 2 2Hampshire 93 1 2 2 1 1Hertfordshire .. .. .. .. .. ..Humberside 96 1 1 2 0 0Kent 82 2 2 3 1 10Lancashire 87 1 10 1 1 1Leicestershire 73 3 16 7 1 0Lincolnshire 94 0 0 1 4 1London(2) 39 5 7 28 6 15Merseyside 94 1 1 3 1 0Norfolk 93 2 0 3 2 0North Yorkshire 96 0 1 1 1 1Northamptonshire 87 3 2 6 1 0Northumbria 97 0 1 1 1 0Nottinghamshire 84 4 2 7 1 1South Yorkshire 86 3 4 6 1 0Staffordshire 89 2 4 2 3 0Suffolk 91 3 0 3 3 0Surrey 91 2 3 3 1 0Sussex .. .. .. .. .. ..Teesside 95 1 3 1 0 0Thames Valley .. .. .. .. .. ..Warwickshire 88 4 3 4 0 0West Mercia 94 1 2 1 1 0West Midlands 67 5 14 14 2 0West Yorkshire 75 4 12 7 1 1Wiltshire 89 2 0 6 1 2
Dyfed-Powys 97 0 0 0 2 0Gwent 94 1 2 2 1 0North Wales 98 0 1 0 0 1South Wales 91 3 1 3 1 1
All areas 77 3 6 9 2 3
(1) Information by ethnic group is shown for those areas with 10% or fewer of ethnic codes missing. ‘..’ means figures not shown as probation area made a return with more than 10% of missing data.
(2) Includes City of London. Note: The figures have been drawn from administrative IT systems. Although care is taken when processing and analysing the returns, the
detail collected is subject to the inaccuracies inherent in any large scale recording system, and so is not necessarily accurate to the last number as shown here.
Source: Offender management caseload statistics, England and Wales, 2005
Section 95
87
Chapter 9: Prisons
Introduction
Information on the ethnic composition of the prison population has been regularly published by the Home Office for many years. Information on nationality, religion and gender are also available as well as prisoner status (remand or sentenced), age, offence group, and length of sentence.
In 2003 new ethnic categories were introduced into the prison IT system. These categories, based upon self-classification and the 2001 Census, replaced the 1991 Census categories with 16+1 classifications (see Appendix B for details). The figures in this chapter are presented using the main categories derived from the new 16+1 system; specifically, White, Mixed, Black, Asian, and ‘Chinese and other’.
It should be noted that due to the changes in the classification systems, and the introduction of the Mixed category, it is not possible to compare figures shown in this chapter with those from earlier publications. The chapter does not, therefore, include any trend analysis but rather focuses on the differences between ethnic groups apparent in the prison statistics for 2006.
Please note that the figures in this chapter refer to self-identification of ethnicity.
Main Findings
Prison Population by Ethnic Group: Table 9.1
The prison population as at the 30th June 2006 was 77,982 with 26% (20,177) of prisoners identifying themselves as being from Black and Minority Ethnic (BME) groups (excluding prisoners whose ethnicity was not recorded). Just over a quarter of the male prison population (15% Black, 7% Asian, 3% Mixed, and 1% Chinese or Other) and 28% of the female prison population (20% Black, 2% Asian, 4% Mixed, and 2% Chinese or Other) were from BME groups.
Fifteen per cent of the male prison population and 23% of the female prison population were foreign nationals. Foreign nationals accounted for 40% of the BME prison population.
For British Nationals, the proportion of black prisoners on 30 June 2006 relative to the population was 7.3 per 1,000 compared to 1.3 per 1,000 for White persons. Similarly, people from Mixed ethnic backgrounds were more likely to be in prison than their White counterparts with a rate per 1,000 population of 3.4. In contrast, people from Chinese or other ethnic backgrounds were least likely to be in prison with a rate of 0.4 per 1,000 population. The rate for people from Asian groups was higher than for White persons but lower than that for the Mixed or Black groups i.e. 1.7 per 1,000 population.
Section 95
88
Prisoner Characteristics: Table 9.2
Comparisons of the characteristics of prisoners in June 2006 by ethnic group show the following facts:
l Of the total prison population all minority ethnic groups had a higher than average proportion of prisoners on remand (White 15%, Mixed 20%, Black 20%, Asian 21%, and Chinese or other 22%). Similarly, all minority ethnic groups had a higher proportion of prisoners on remand that were untried compared with White prisoners (White 9%, Mixed 13%, Black 13%, Asian 14%, Chinese or other 14%). These differences may reflect in part the variation between ethnic groups in the type of offences for which the offender was remanded.
l For the Mixed group, there was a higher proportion of sentenced prisoners in the 15 to 17 and 18 to 20 age ranges than for other ethnic groups. In the 15 to 17 age range, the proportion was at least twice that for other ethnic groups.
l Just under one-third (32%) of Black prisoners, over a quarter (28%) of the Chinese or other group, and just under a quarter (24%) of the Asian group of prisoners were serving a sentence for drug offences. This compares with 13% for White prisoners. A higher proportion of Mixed (20%) and Black (17%) prisoners were serving a sentence for robbery compared to White (12%), Asian (12%), and Chinese/Other (7%) prisoners. Fourteen per cent of White prisoners were serving a sentence for burglary compared to 10% of Mixed, 6% of Black, 4% of Asian, and 4% of Chinese/Other prisoners. The frequency of violence against the person was similar across all ethnic groups.
l Variations in the length of imprisonment for different ethnic groups will, in part, reflect differences in the types and seriousness of offences resulting in a custodial sentence. For young offenders there was nearly twice as many of the Mixed group (19%) serving a sentence of a year or more compared to the other ethnic groups. For the adults, 59% of the Black offenders, 55% of the Chinese/Other groups, and 51% of the Asian prisoners were serving a sentence of four years or more compared with 47% for both White and Mixed prisoners. There were proportionately fewer Mixed and Black prisoners (7%) serving sentences of less than a year compared with members of the White and Asian (11%) groups.
Prisoners and Sentencing: Tables 9.3 and 9.4
In the twelve months to March 2006, 80% of sentenced offenders received into prison establishments were known to be White, 11% were Black, 6% were Asian, 2% Mixed and 1% were from Chinese or Other ethnic backgrounds (Table 9.3).
If the miscellaneous group of ‘Other Offences’ is excluded, the main offences committed by the sentenced prisoners received differed by ethnic group (Table 9.4). Thus for White prisoners it was Theft and Handling (21%), for Mixed and Asian prisoners Violence Against the Person (19% and 16% respectively), for Black prisoners Drug Offences (17%), and for Chinese/Others Fraud and Forgery (27%).
Ethnicity and Religion of Prisoners
Data for June 2006 indicate that Christianity was the most commonly stated religion for White prisoners (57%). Some 52% of Black prisoners and 43% of those in the ‘Mixed’ category considered themselves Christians.
Seventy-one per cent of Asian prisoners were Muslim, the most commonly stated religion for Asian prisoners.
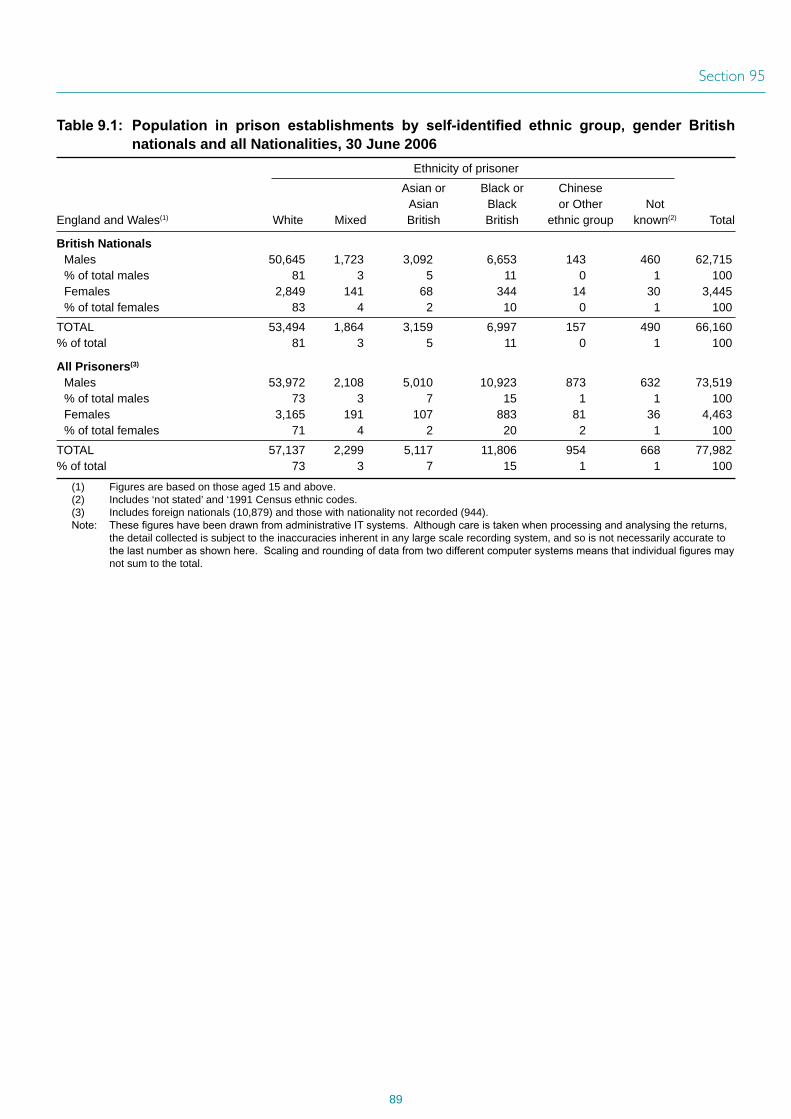
Section 95
89
Table 9.1: Population in prison establishments by self-identified ethnic group, gender British nationals and all Nationalities, 30 June 2006
Ethnicity of prisoner
Asian or Black or Chinese Asian Black or Other Not England and Wales(1) White Mixed British British ethnic group known(2) Total
British Nationals Males 50,645 1,723 3,092 6,653 143 460 62,715% of total males 81 3 5 11 0 1 100Females 2,849 141 68 344 14 30 3,445% of total females 83 4 2 10 0 1 100
TOTAL 53,494 1,864 3,159 6,997 157 490 66,160% of total 81 3 5 11 0 1 100
All Prisoners(3) Males 53,972 2,108 5,010 10,923 873 632 73,519% of total males 73 3 7 15 1 1 100Females 3,165 191 107 883 81 36 4,463% of total females 71 4 2 20 2 1 100
TOTAL 57,137 2,299 5,117 11,806 954 668 77,982% of total 73 3 7 15 1 1 100
(1) Figures are based on those aged 15 and above. (2) Includes ‘not stated’ and ‘1991 Census ethnic codes.(3) Includes foreign nationals (10,879) and those with nationality not recorded (944).Note: These figures have been drawn from administrative IT systems. Although care is taken when processing and analysing the returns,
the detail collected is subject to the inaccuracies inherent in any large scale recording system, and so is not necessarily accurate to the last number as shown here. Scaling and rounding of data from two different computer systems means that individual figures may not sum to the total.
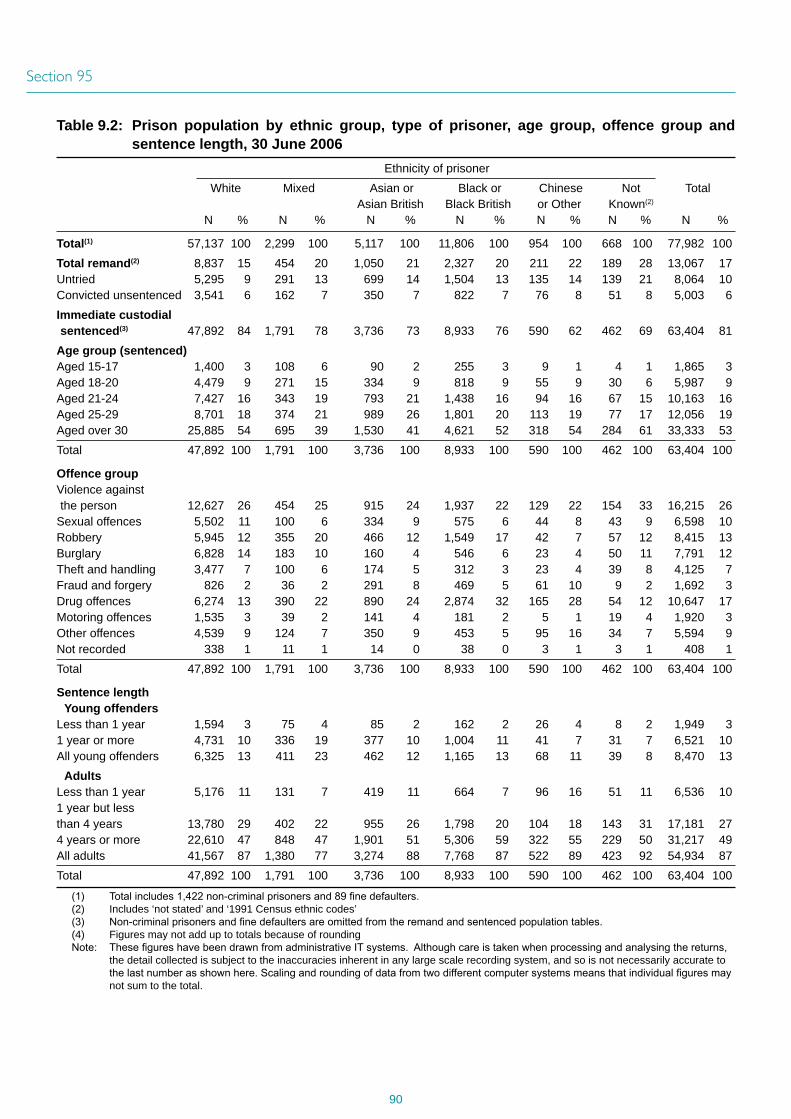
Section 95
90
Table 9.2: Prison population by ethnic group, type of prisoner, age group, offence group and sentence length, 30 June 2006
Ethnicity of prisoner
White Mixed Asian or Black or Chinese Not Total Asian British Black British or Other Known(2)
N % N % N % N % N % N % N %
Total(1) 57,137 100 2,299 100 5,117 100 11,806 100 954 100 668 100 77,982 100
Total remand(2) 8,837 15 454 20 1,050 21 2,327 20 211 22 189 28 13,067 17Untried 5,295 9 291 13 699 14 1,504 13 135 14 139 21 8,064 10Convicted unsentenced 3,541 6 162 7 350 7 822 7 76 8 51 8 5,003 6
Immediate custodial sentenced(3) 47,892 84 1,791 78 3,736 73 8,933 76 590 62 462 69 63,404 81
Age group (sentenced) Aged 15-17 1,400 3 108 6 90 2 255 3 9 1 4 1 1,865 3Aged 18-20 4,479 9 271 15 334 9 818 9 55 9 30 6 5,987 9Aged 21-24 7,427 16 343 19 793 21 1,438 16 94 16 67 15 10,163 16Aged 25-29 8,701 18 374 21 989 26 1,801 20 113 19 77 17 12,056 19Aged over 30 25,885 54 695 39 1,530 41 4,621 52 318 54 284 61 33,333 53
Total 47,892 100 1,791 100 3,736 100 8,933 100 590 100 462 100 63,404 100
Offence group Violence against the person 12,627 26 454 25 915 24 1,937 22 129 22 154 33 16,215 26
Sexual offences 5,502 11 100 6 334 9 575 6 44 8 43 9 6,598 10Robbery 5,945 12 355 20 466 12 1,549 17 42 7 57 12 8,415 13Burglary 6,828 14 183 10 160 4 546 6 23 4 50 11 7,791 12Theft and handling 3,477 7 100 6 174 5 312 3 23 4 39 8 4,125 7Fraud and forgery 826 2 36 2 291 8 469 5 61 10 9 2 1,692 3Drug offences 6,274 13 390 22 890 24 2,874 32 165 28 54 12 10,647 17Motoring offences 1,535 3 39 2 141 4 181 2 5 1 19 4 1,920 3Other offences 4,539 9 124 7 350 9 453 5 95 16 34 7 5,594 9Not recorded 338 1 11 1 14 0 38 0 3 1 3 1 408 1
Total 47,892 100 1,791 100 3,736 100 8,933 100 590 100 462 100 63,404 100
Sentence length Young offenders
Less than 1 year 1,594 3 75 4 85 2 162 2 26 4 8 2 1,949 31 year or more 4,731 10 336 19 377 10 1,004 11 41 7 31 7 6,521 10All young offenders 6,325 13 411 23 462 12 1,165 13 68 11 39 8 8,470 13
Adults Less than 1 year 5,176 11 131 7 419 11 664 7 96 16 51 11 6,536 101 year but less than 4 years 13,780 29 402 22 955 26 1,798 20 104 18 143 31 17,181 274 years or more 22,610 47 848 47 1,901 51 5,306 59 322 55 229 50 31,217 49All adults 41,567 87 1,380 77 3,274 88 7,768 87 522 89 423 92 54,934 87
Total 47,892 100 1,791 100 3,736 100 8,933 100 590 100 462 100 63,404 100
(1) Total includes 1,422 non-criminal prisoners and 89 fine defaulters. (2) Includes ‘not stated’ and ‘1991 Census ethnic codes’ (3) Non-criminal prisoners and fine defaulters are omitted from the remand and sentenced population tables. (4) Figures may not add up to totals because of rounding Note: These figures have been drawn from administrative IT systems. Although care is taken when processing and analysing the returns,
the detail collected is subject to the inaccuracies inherent in any large scale recording system, and so is not necessarily accurate to the last number as shown here. Scaling and rounding of data from two different computer systems means that individual figures may not sum to the total.
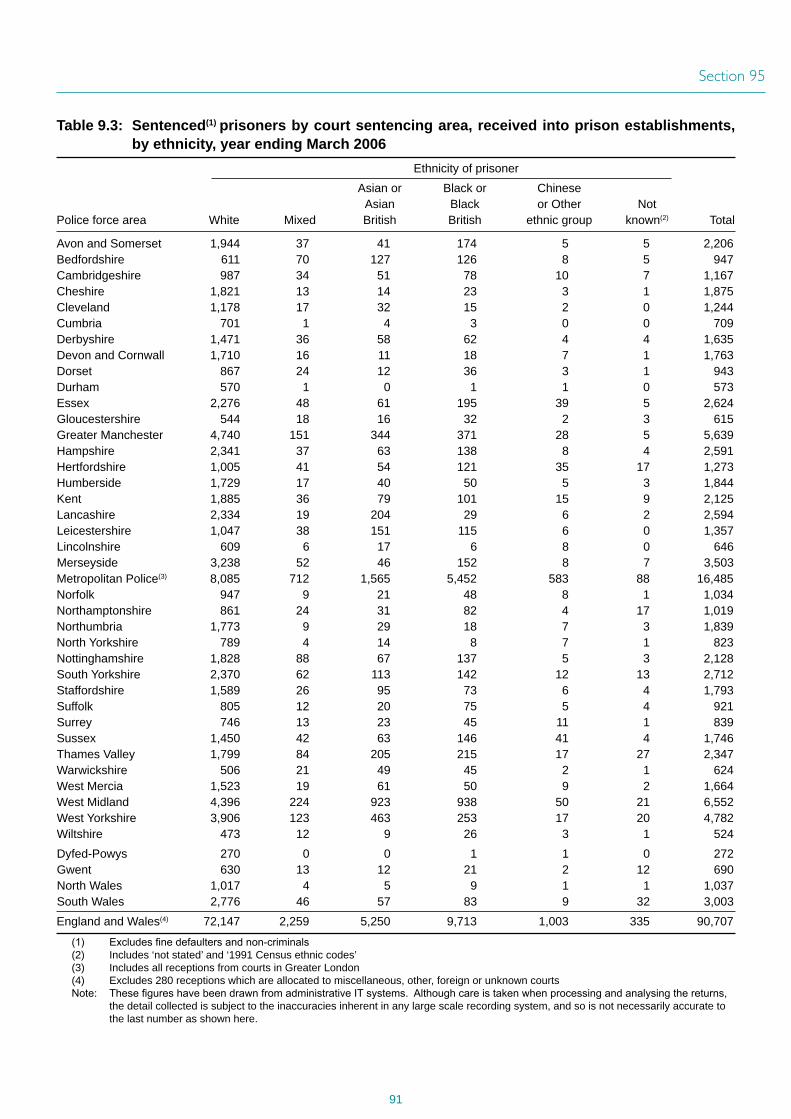
Section 95
91
Table 9.3: Sentenced(1) prisoners by court sentencing area, received into prison establishments, by ethnicity, year ending March 2006
Ethnicity of prisoner
Asian or Black or Chinese Asian Black or Other Not Police force area White Mixed British British ethnic group known(2) Total
Avon and Somerset 1,944 37 41 174 5 5 2,206Bedfordshire 611 70 127 126 8 5 947Cambridgeshire 987 34 51 78 10 7 1,167Cheshire 1,821 13 14 23 3 1 1,875Cleveland 1,178 17 32 15 2 0 1,244Cumbria 701 1 4 3 0 0 709Derbyshire 1,471 36 58 62 4 4 1,635Devon and Cornwall 1,710 16 11 18 7 1 1,763Dorset 867 24 12 36 3 1 943Durham 570 1 0 1 1 0 573Essex 2,276 48 61 195 39 5 2,624Gloucestershire 544 18 16 32 2 3 615Greater Manchester 4,740 151 344 371 28 5 5,639Hampshire 2,341 37 63 138 8 4 2,591Hertfordshire 1,005 41 54 121 35 17 1,273Humberside 1,729 17 40 50 5 3 1,844Kent 1,885 36 79 101 15 9 2,125Lancashire 2,334 19 204 29 6 2 2,594Leicestershire 1,047 38 151 115 6 0 1,357Lincolnshire 609 6 17 6 8 0 646Merseyside 3,238 52 46 152 8 7 3,503Metropolitan Police(3) 8,085 712 1,565 5,452 583 88 16,485Norfolk 947 9 21 48 8 1 1,034Northamptonshire 861 24 31 82 4 17 1,019Northumbria 1,773 9 29 18 7 3 1,839North Yorkshire 789 4 14 8 7 1 823Nottinghamshire 1,828 88 67 137 5 3 2,128South Yorkshire 2,370 62 113 142 12 13 2,712Staffordshire 1,589 26 95 73 6 4 1,793Suffolk 805 12 20 75 5 4 921Surrey 746 13 23 45 11 1 839Sussex 1,450 42 63 146 41 4 1,746Thames Valley 1,799 84 205 215 17 27 2,347Warwickshire 506 21 49 45 2 1 624West Mercia 1,523 19 61 50 9 2 1,664West Midland 4,396 224 923 938 50 21 6,552West Yorkshire 3,906 123 463 253 17 20 4,782Wiltshire 473 12 9 26 3 1 524
Dyfed-Powys 270 0 0 1 1 0 272Gwent 630 13 12 21 2 12 690North Wales 1,017 4 5 9 1 1 1,037South Wales 2,776 46 57 83 9 32 3,003
England and Wales(4) 72,147 2,259 5,250 9,713 1,003 335 90,707
(1) Excludes fine defaulters and non-criminals (2) Includes ‘not stated’ and ‘1991 Census ethnic codes’ (3) Includes all receptions from courts in Greater London (4) Excludes 280 receptions which are allocated to miscellaneous, other, foreign or unknown courts Note: These figures have been drawn from administrative IT systems. Although care is taken when processing and analysing the returns,
the detail collected is subject to the inaccuracies inherent in any large scale recording system, and so is not necessarily accurate to the last number as shown here.
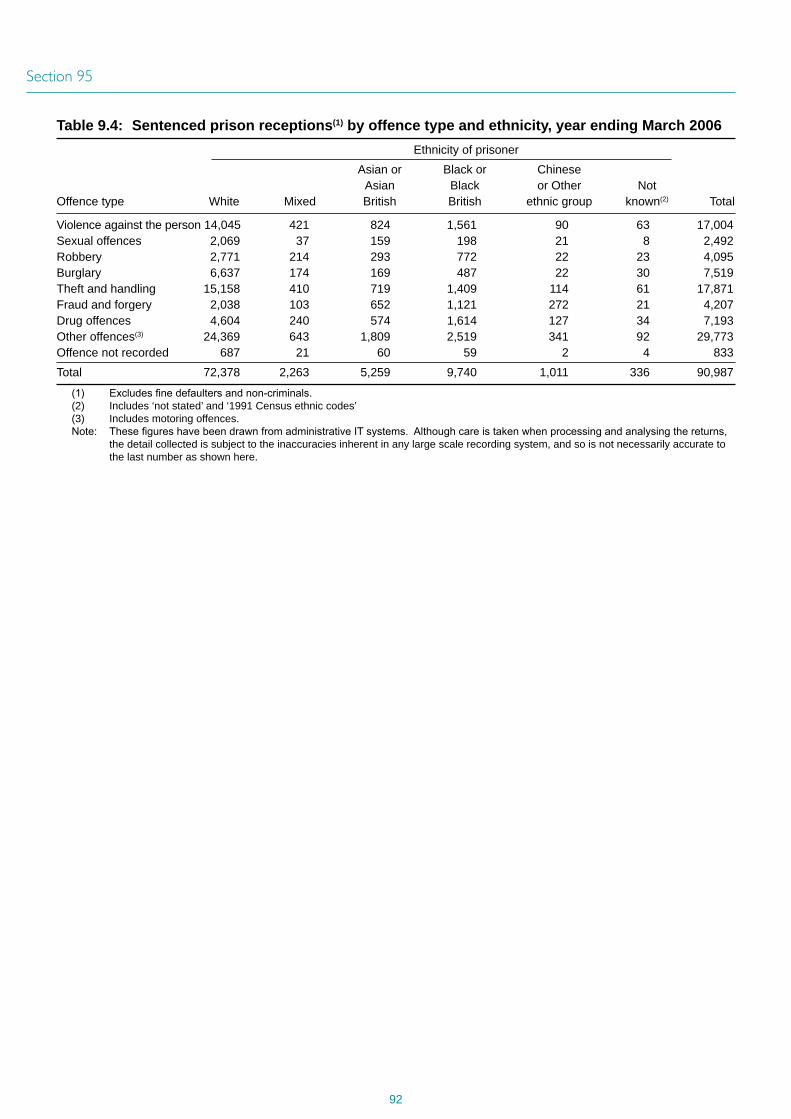
Section 95
92
Table 9.4: Sentenced prison receptions(1) by offence type and ethnicity, year ending March 2006
Ethnicity of prisoner
Asian or Black or Chinese Asian Black or Other Not Offence type White Mixed British British ethnic group known(2) Total
Violence against the person 14,045 421 824 1,561 90 63 17,004Sexual offences 2,069 37 159 198 21 8 2,492Robbery 2,771 214 293 772 22 23 4,095Burglary 6,637 174 169 487 22 30 7,519Theft and handling 15,158 410 719 1,409 114 61 17,871Fraud and forgery 2,038 103 652 1,121 272 21 4,207Drug offences 4,604 240 574 1,614 127 34 7,193Other offences(3) 24,369 643 1,809 2,519 341 92 29,773Offence not recorded 687 21 60 59 2 4 833
Total 72,378 2,263 5,259 9,740 1,011 336 90,987
(1) Excludes fine defaulters and non-criminals. (2) Includes ‘not stated’ and ‘1991 Census ethnic codes’ (3) Includes motoring offences. Note: These figures have been drawn from administrative IT systems. Although care is taken when processing and analysing the returns,
the detail collected is subject to the inaccuracies inherent in any large scale recording system, and so is not necessarily accurate to the last number as shown here.
Section 95
93
Chapter 10: Complaints against the police, prison & probation services
Introduction
In this chapter information is presented on those who made complaints about the conduct of individuals serving with the police and the outcome of complaints concerning discriminatory behaviour. Information on complaints from prisoners and complaints from those subject to probation supervision, or those upon whom reports have been written, is also presented.
Complaints against the Police
Under the provisions of the Police Reform Act 2002 (PRA 2002), the Government established a new body, the Independent Police Complaints Commission (IPCC), on 1 April 2004. The IPCC replaced the Police Complaints Authority. It has a general duty under the PRA 2002 to increase confidence in the police complaints system in England and Wales, and so increase confidence in policing as a whole.
Under the PRA 2002, a complaint can be made about the ‘conduct’ of a person serving with the police. It may be about, for example, behaviour, inappropriate language, actions or omissions. In some cases it may be about an allegation of criminal behaviour. A complaint can be made by the following types of people:
l any member of the public who alleges that police misconduct was directed at them;
l any member of the public who alleges that they have been ‘adversely affected’ by police misconduct even if it was not directed at them;
l any member of the public who claims that they witnessed misconduct by the police;
l a person acting on behalf of someone who falls within any of the three categories above; for example, a member of an organisation who has been given written permission.
There are several methods by which people can make complaints:
l In person at any police station or by contacting any police force by phone, email, post or fax.
l By phoning, emailing, writing to or faxing the Independent Police Complaints Commission, who will pass on the complaint, with the complainant’s consent, to the relevant force for action. The force which is subject to the complaint is responsible for recording the complaint.
l By a third party, provided the complainant has given written permission for the third party to make the complaint on their behalf.11
11 Information from; IPCC (2005) Making the New Complaints System Work Better: Statutory Guidance, London: IPCC.
Section 95
94
The PRA (2002), alongside the creation of the IPCC, has led to changes to how complaints about the police are now handled as well as developments in the collection, analysis and publication of complaints data12.
Ethnicity of Complainants: Table 10.1
In 2005/06, 26,880 people made complaints about the conduct of individuals serving with the police. The data in Table 10.1 are recorded by means of a visual assessment of the complainant being carried out by the person recording the complaint. The figures show that over half (58%) of these complainants were White, 7% Black, 5% Asian and 1% ‘Other’ minority ethnic groups. These proportions closely resemble the data recorded in 2004/05.
Due to the number of complainants whose ethnicity is not known, caution should be exercised in drawing any firm conclusions on the ethnicity of people complaining about the police. As Table 10.1 shows, ethnicity is not known for 30% of complainants. In 24 of the 43 police forces the proportion equalled or exceeded 25%. However, for no force did the proportion of unknowns exceed 50%, unlike 2004/5 when five forces exceeded 50% unknown ethnicity, with North Yorkshire and Surrey exceeding 60%. Practical difficulties in the recording and collection of ethnicity data is one possible explanation for the level of missing information on ethnicity (Gleeson, E. & Dady, H. 2006). The duty of recording the ethnicity of the complainant rests with the police force. The IPCC intends to continue to work with police forces to improve the quality of this information.
Discriminatory Behaviour: Table 10.2
The figures presented in Table 10.2 show the outcome of completed allegations for discriminatory behaviour. This is defined as acts towards an individual that a person serving with the police may have come into contact with, whilst on or off duty, which amount to an abuse of authority or maltreatment. This includes acts committed on grounds of another person’s nationality or ethnicity, sexual orientation, disability, age or religion.
A total of 1116 allegations of discriminatory behaviour were finalised in 2005/6, of which 13 were substantiated (Table 10.2). Nearly 28% of all allegations of discriminatory behaviour were completed by the Metropolitan Police Service in 2005/06 compared with 32% for the previous year, with three of these 2005/6 allegations being substantiated.
Prison and Probation Services Complaints
The Prisons and Probation Ombudsman is appointed by the Secretary of State for Justice and investigates complaints from prisoners and those subject to probation supervision, or those upon whom reports have been written. The Ombudsman is completely independent of both the Prison Service and the National Probation Service (NPS).
In 2005/6 the Ombudsman received 78 complaints on race issues in the Prison Service, 19 more than the revised figure of 59 for the previous year and an additional 16 on religious matters (the same as the previous year). Thirty (38%) of the 78 cases met the eligibility criteria for consideration, compared to a revised figure of 16 (27%) in 2004/05. The number of complaints on race issues in 2005/6 represented 2% of the overall total of complaints. In 2004/5 the figure was 1%.
There were no complaints on race regarding the NPS which met the eligibility criteria.
12 Further information is presented in the IPCC report; Gleeson, E. & Dady, H. (2006) Police Complaints: Statistics for England and Wales 2005/06. London: IPCC. This report is available at: http://www.ipcc.gov.uk/index/resources/research/stats.htm
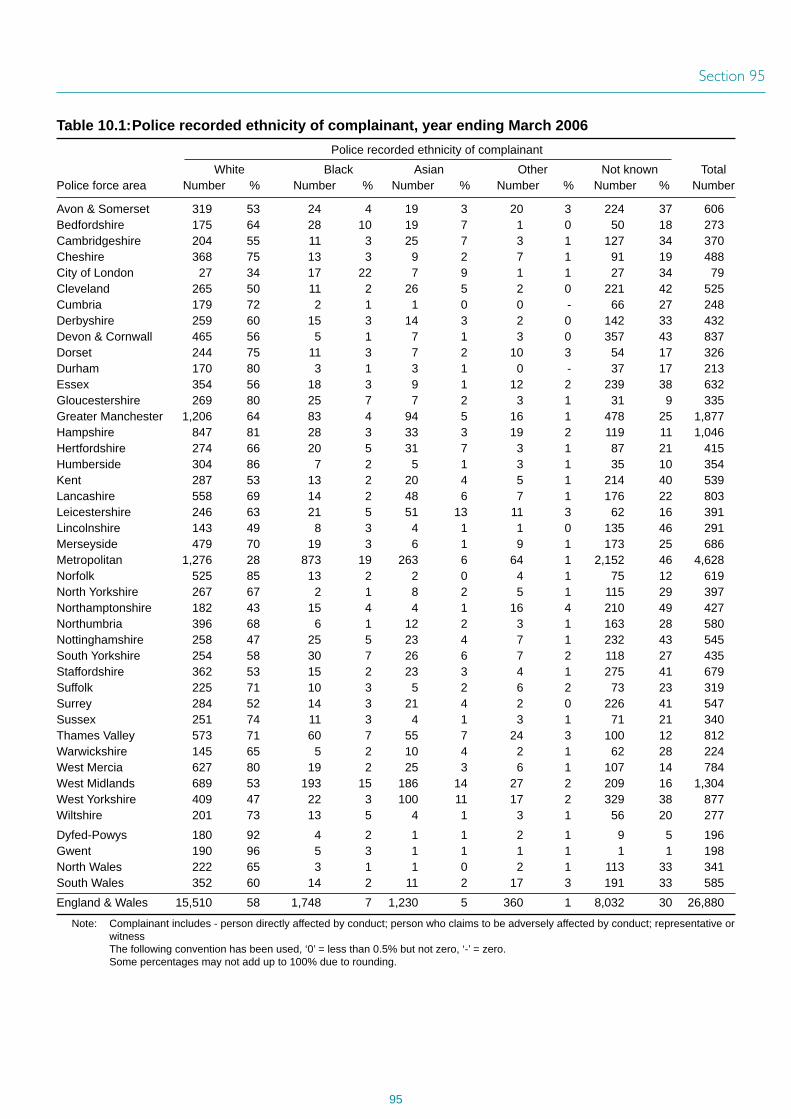
Section 95
95
Table 10.1: Police recorded ethnicity of complainant, year ending March 2006
Police recorded ethnicity of complainant
White Black Asian Other Not known TotalPolice force area Number % Number % Number % Number % Number % Number
Avon & Somerset 319 53 24 4 19 3 20 3 224 37 606Bedfordshire 175 64 28 10 19 7 1 0 50 18 273Cambridgeshire 204 55 11 3 25 7 3 1 127 34 370Cheshire 368 75 13 3 9 2 7 1 91 19 488City of London 27 34 17 22 7 9 1 1 27 34 79Cleveland 265 50 11 2 26 5 2 0 221 42 525Cumbria 179 72 2 1 1 0 0 - 66 27 248Derbyshire 259 60 15 3 14 3 2 0 142 33 432Devon & Cornwall 465 56 5 1 7 1 3 0 357 43 837Dorset 244 75 11 3 7 2 10 3 54 17 326Durham 170 80 3 1 3 1 0 - 37 17 213Essex 354 56 18 3 9 1 12 2 239 38 632Gloucestershire 269 80 25 7 7 2 3 1 31 9 335Greater Manchester 1,206 64 83 4 94 5 16 1 478 25 1,877Hampshire 847 81 28 3 33 3 19 2 119 11 1,046Hertfordshire 274 66 20 5 31 7 3 1 87 21 415Humberside 304 86 7 2 5 1 3 1 35 10 354Kent 287 53 13 2 20 4 5 1 214 40 539Lancashire 558 69 14 2 48 6 7 1 176 22 803Leicestershire 246 63 21 5 51 13 11 3 62 16 391Lincolnshire 143 49 8 3 4 1 1 0 135 46 291Merseyside 479 70 19 3 6 1 9 1 173 25 686Metropolitan 1,276 28 873 19 263 6 64 1 2,152 46 4,628Norfolk 525 85 13 2 2 0 4 1 75 12 619North Yorkshire 267 67 2 1 8 2 5 1 115 29 397Northamptonshire 182 43 15 4 4 1 16 4 210 49 427Northumbria 396 68 6 1 12 2 3 1 163 28 580Nottinghamshire 258 47 25 5 23 4 7 1 232 43 545South Yorkshire 254 58 30 7 26 6 7 2 118 27 435Staffordshire 362 53 15 2 23 3 4 1 275 41 679Suffolk 225 71 10 3 5 2 6 2 73 23 319Surrey 284 52 14 3 21 4 2 0 226 41 547Sussex 251 74 11 3 4 1 3 1 71 21 340Thames Valley 573 71 60 7 55 7 24 3 100 12 812Warwickshire 145 65 5 2 10 4 2 1 62 28 224West Mercia 627 80 19 2 25 3 6 1 107 14 784West Midlands 689 53 193 15 186 14 27 2 209 16 1,304West Yorkshire 409 47 22 3 100 11 17 2 329 38 877Wiltshire 201 73 13 5 4 1 3 1 56 20 277
Dyfed-Powys 180 92 4 2 1 1 2 1 9 5 196Gwent 190 96 5 3 1 1 1 1 1 1 198North Wales 222 65 3 1 1 0 2 1 113 33 341South Wales 352 60 14 2 11 2 17 3 191 33 585
England & Wales 15,510 58 1,748 7 1,230 5 360 1 8,032 30 26,880
Note: Complainant includes - person directly affected by conduct; person who claims to be adversely affected by conduct; representative or witness
The following convention has been used, ‘0’ = less than 0.5% but not zero, ‘-’ = zero. Some percentages may not add up to 100% due to rounding.
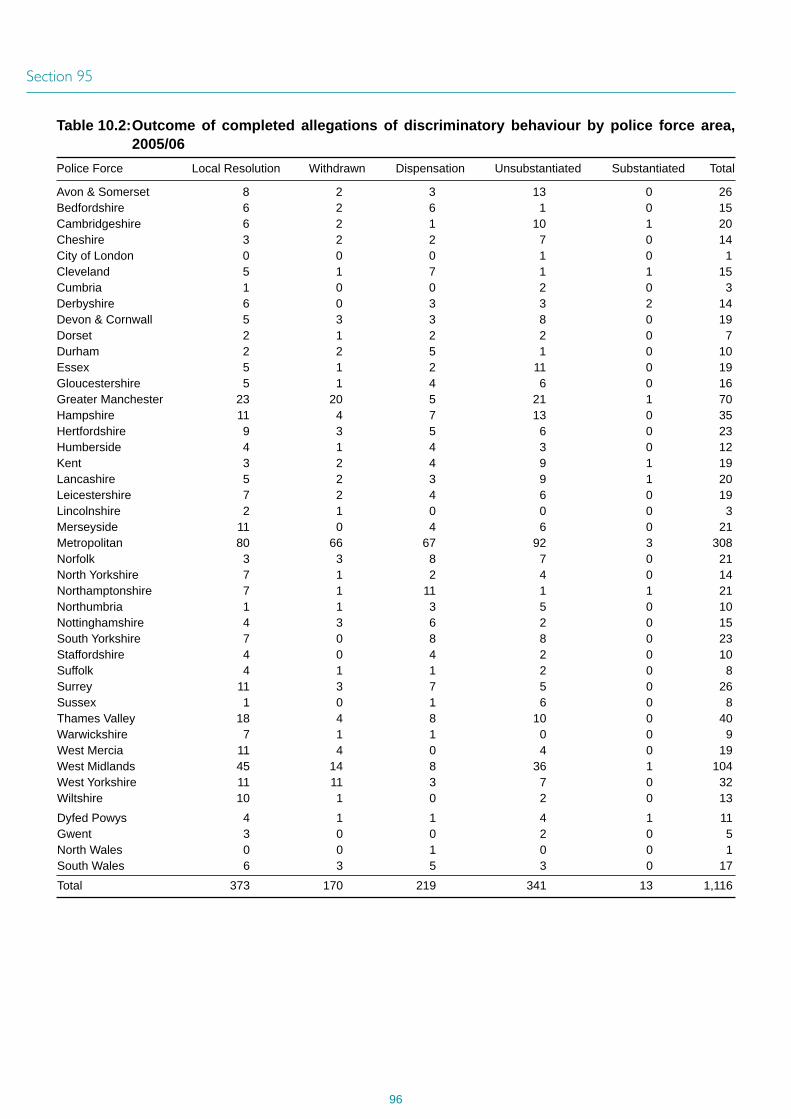
Section 95
96
Table 10.2: Outcome of completed allegations of discriminatory behaviour by police force area, 2005/06
Police Force Local Resolution Withdrawn Dispensation Unsubstantiated Substantiated Total
Avon & Somerset 8 2 3 13 0 26Bedfordshire 6 2 6 1 0 15Cambridgeshire 6 2 1 10 1 20Cheshire 3 2 2 7 0 14City of London 0 0 0 1 0 1Cleveland 5 1 7 1 1 15Cumbria 1 0 0 2 0 3Derbyshire 6 0 3 3 2 14Devon & Cornwall 5 3 3 8 0 19Dorset 2 1 2 2 0 7Durham 2 2 5 1 0 10Essex 5 1 2 11 0 19Gloucestershire 5 1 4 6 0 16Greater Manchester 23 20 5 21 1 70Hampshire 11 4 7 13 0 35Hertfordshire 9 3 5 6 0 23Humberside 4 1 4 3 0 12Kent 3 2 4 9 1 19Lancashire 5 2 3 9 1 20Leicestershire 7 2 4 6 0 19Lincolnshire 2 1 0 0 0 3Merseyside 11 0 4 6 0 21Metropolitan 80 66 67 92 3 308Norfolk 3 3 8 7 0 21North Yorkshire 7 1 2 4 0 14Northamptonshire 7 1 11 1 1 21Northumbria 1 1 3 5 0 10Nottinghamshire 4 3 6 2 0 15South Yorkshire 7 0 8 8 0 23Staffordshire 4 0 4 2 0 10Suffolk 4 1 1 2 0 8Surrey 11 3 7 5 0 26Sussex 1 0 1 6 0 8Thames Valley 18 4 8 10 0 40Warwickshire 7 1 1 0 0 9West Mercia 11 4 0 4 0 19West Midlands 45 14 8 36 1 104West Yorkshire 11 11 3 7 0 32Wiltshire 10 1 0 2 0 13
Dyfed Powys 4 1 1 4 1 11Gwent 3 0 0 2 0 5North Wales 0 0 1 0 0 1South Wales 6 3 5 3 0 17
Total 373 170 219 341 13 1,116
Section 95
97
Chapter 11: Deaths in custody
Police: Table 11.1
The figures presented in Table 11.1 concern deaths of persons who have been arrested or otherwise detained by the police. These deaths may have taken place on police, private or medical premises, in a public place or in a police or other vehicle. This differs from previous reports which have reported deaths during or following contact with the police. Statistics on deaths during or following police contact, which includes fatal road traffic incidents and shootings, for 2005/06, are presented in a separate report (Teers and Menin 2006).
In addition, Table 11.1 reports “Cause of Death” categories in line with IPCC classifications. This marks a change from previous reports, and has been initiated to achieve consistency with the IPCC.
In 2005/06 there were 28 recorded deaths of persons who had been arrested or otherwise detained by the police, a decrease from the 36 deaths recorded in 2004/05. Of the deaths in 2005/06, 23 involved White people and five involved deaths of minority ethnic people (one Black person, two Asian and two people of ‘Other’ ethnic group). In comparison, in 2004/05 there were 34 deaths in or following police custody which involved White people, and two deaths which involved Black people.
The average age for White people who died in or following police custody in 2005/06 was 43 years old and the average age of minority ethnic people was 33 years old. The cause of death for people from minority ethnic groups included asphyxiation/airway obstruction; drug or alcohol overdose/poisoning, long term drug or alcohol misuse; and natural causes.
Prison: Tables 11.2 and 11.3
There were a total of 74 self-inflicted deaths in prison in 2005/06. Of these, nine involved Black people, five involved Asian people, and there were two deaths of people of Mixed ethnicity (see Table 11.2). For all groups, the main cause of death was hanging, which accounted for 86% of deaths overall. For White prisoners, the average age of self-inflicted death was 36 years, compared with an average age of 30 for those from a minority ethnic group. Females accounted for three of the self-inflicted deaths in prison in 2005/06.
There were 90 other deaths in prisons in 2005/06, of which 85 (94%) were a result of natural causes. Six of the deaths involved Black people, two Asian people, and one person of Mixed ethnicity. Natural Causes was the only cause of death of people from minority ethnic groups. There were two homicides in 2005/06, both of which involved a White victim. Only 5% of these non-self-inflicted deaths in prison were of female prisoners. The average age of death for white prisoners was 53 years, whereas for minority ethnic prisoners it was 41 years.
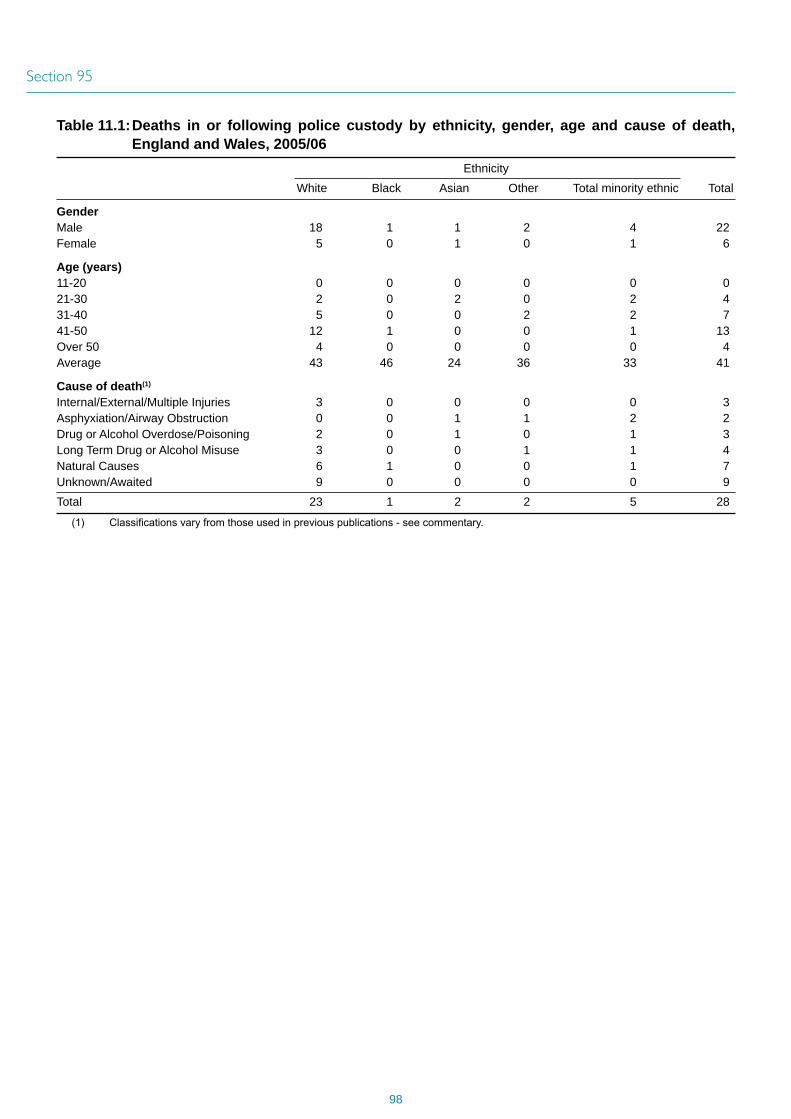
Section 95
98
Table 11.1: Deaths in or following police custody by ethnicity, gender, age and cause of death, England and Wales, 2005/06
Ethnicity
White Black Asian Other Total minority ethnic Total
Gender Male 18 1 1 2 4 22Female 5 0 1 0 1 6
Age (years) 11-20 0 0 0 0 0 021-30 2 0 2 0 2 431-40 5 0 0 2 2 741-50 12 1 0 0 1 13Over 50 4 0 0 0 0 4Average 43 46 24 36 33 41
Cause of death(1) Internal/External/Multiple Injuries 3 0 0 0 0 3Asphyxiation/Airway Obstruction 0 0 1 1 2 2Drug or Alcohol Overdose/Poisoning 2 0 1 0 1 3Long Term Drug or Alcohol Misuse 3 0 0 1 1 4Natural Causes 6 1 0 0 1 7Unknown/Awaited 9 0 0 0 0 9
Total 23 1 2 2 5 28
(1) Classifications vary from those used in previous publications - see commentary.
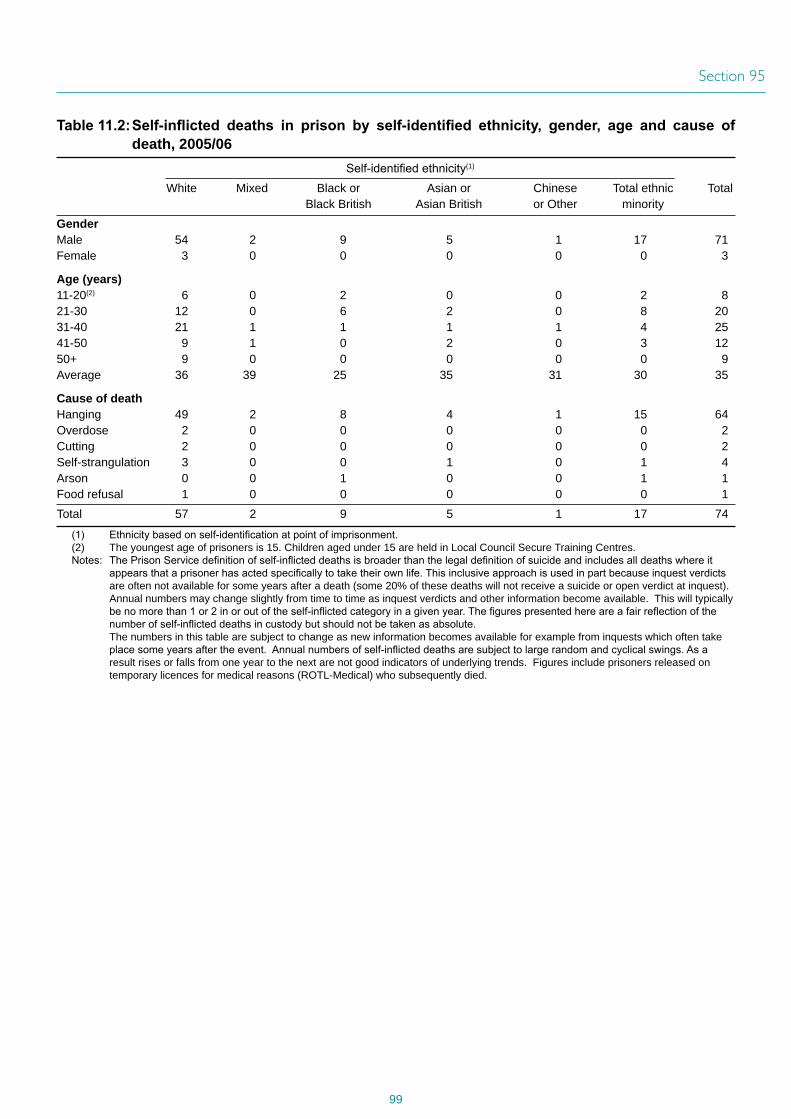
Section 95
99
Table 11.2: Self-inflicted deaths in prison by self-identified ethnicity, gender, age and cause of death, 2005/06
Self-identified ethnicity(1)
White Mixed Black or Asian or Chinese Total ethnic Total Black British Asian British or Other minority
Gender Male 54 2 9 5 1 17 71Female 3 0 0 0 0 0 3
Age (years) 11-20(2) 6 0 2 0 0 2 821-30 12 0 6 2 0 8 2031-40 21 1 1 1 1 4 2541-50 9 1 0 2 0 3 1250+ 9 0 0 0 0 0 9Average 36 39 25 35 31 30 35
Cause of death Hanging 49 2 8 4 1 15 64Overdose 2 0 0 0 0 0 2Cutting 2 0 0 0 0 0 2Self-strangulation 3 0 0 1 0 1 4Arson 0 0 1 0 0 1 1Food refusal 1 0 0 0 0 0 1
Total 57 2 9 5 1 17 74
(1) Ethnicity based on self-identification at point of imprisonment. (2) The youngest age of prisoners is 15. Children aged under 15 are held in Local Council Secure Training Centres. Notes: The Prison Service definition of self-inflicted deaths is broader than the legal definition of suicide and includes all deaths where it
appears that a prisoner has acted specifically to take their own life. This inclusive approach is used in part because inquest verdicts are often not available for some years after a death (some 20% of these deaths will not receive a suicide or open verdict at inquest). Annual numbers may change slightly from time to time as inquest verdicts and other information become available. This will typically be no more than 1 or 2 in or out of the self-inflicted category in a given year. The figures presented here are a fair reflection of the number of self-inflicted deaths in custody but should not be taken as absolute.
The numbers in this table are subject to change as new information becomes available for example from inquests which often take place some years after the event. Annual numbers of self-inflicted deaths are subject to large random and cyclical swings. As a result rises or falls from one year to the next are not good indicators of underlying trends. Figures include prisoners released on temporary licences for medical reasons (ROTL-Medical) who subsequently died.
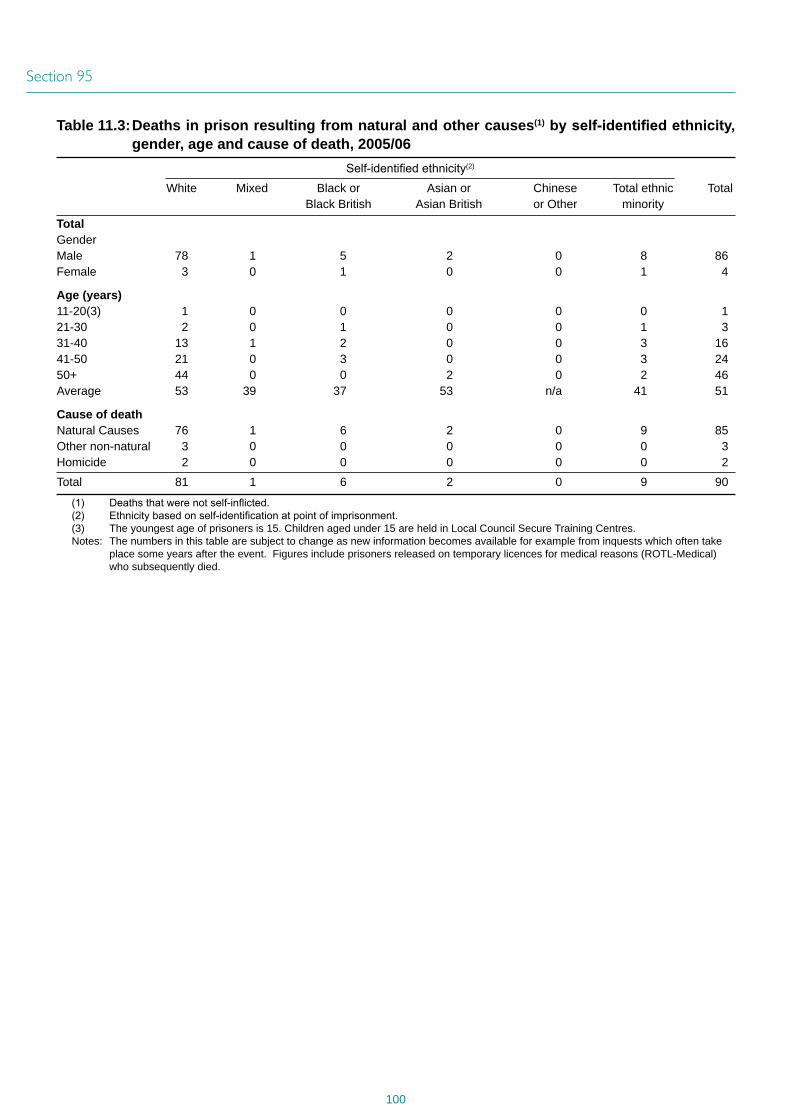
Section 95
100
Table 11.3: Deaths in prison resulting from natural and other causes(1) by self-identified ethnicity, gender, age and cause of death, 2005/06
Self-identified ethnicity(2)
White Mixed Black or Asian or Chinese Total ethnic Total Black British Asian British or Other minority
TotalGender Male 78 1 5 2 0 8 86Female 3 0 1 0 0 1 4
Age (years) 11-20(3) 1 0 0 0 0 0 121-30 2 0 1 0 0 1 331-40 13 1 2 0 0 3 1641-50 21 0 3 0 0 3 2450+ 44 0 0 2 0 2 46Average 53 39 37 53 n/a 41 51
Cause of death Natural Causes 76 1 6 2 0 9 85Other non-natural 3 0 0 0 0 0 3Homicide 2 0 0 0 0 0 2
Total 81 1 6 2 0 9 90
(1) Deaths that were not self-inflicted. (2) Ethnicity based on self-identification at point of imprisonment.(3) The youngest age of prisoners is 15. Children aged under 15 are held in Local Council Secure Training Centres. Notes: The numbers in this table are subject to change as new information becomes available for example from inquests which often take
place some years after the event. Figures include prisoners released on temporary licences for medical reasons (ROTL-Medical) who subsequently died.
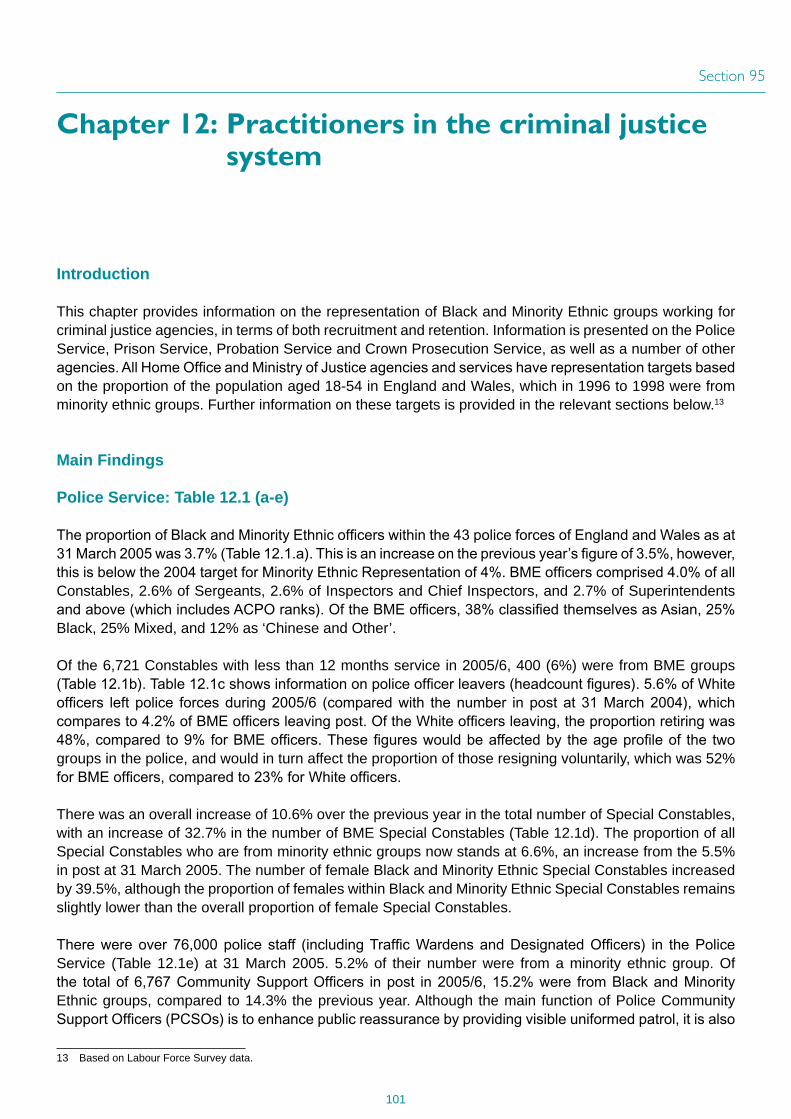
Section 95
101
Chapter 12: Practitioners in the criminal justice system
Introduction
This chapter provides information on the representation of Black and Minority Ethnic groups working for criminal justice agencies, in terms of both recruitment and retention. Information is presented on the Police Service, Prison Service, Probation Service and Crown Prosecution Service, as well as a number of other agencies. All Home Office and Ministry of Justice agencies and services have representation targets based on the proportion of the population aged 18-54 in England and Wales, which in 1996 to 1998 were from minority ethnic groups. Further information on these targets is provided in the relevant sections below.13
Main Findings
Police Service: Table 12.1 (a-e)
The proportion of Black and Minority Ethnic officers within the 43 police forces of England and Wales as at 31 March 2005 was 3.7% (Table 12.1.a). This is an increase on the previous year’s figure of 3.5%, however, this is below the 2004 target for Minority Ethnic Representation of 4%. BME officers comprised 4.0% of all Constables, 2.6% of Sergeants, 2.6% of Inspectors and Chief Inspectors, and 2.7% of Superintendents and above (which includes ACPO ranks). Of the BME officers, 38% classified themselves as Asian, 25% Black, 25% Mixed, and 12% as ‘Chinese and Other’.
Of the 6,721 Constables with less than 12 months service in 2005/6, 400 (6%) were from BME groups (Table 12.1b). Table 12.1c shows information on police officer leavers (headcount figures). 5.6% of White officers left police forces during 2005/6 (compared with the number in post at 31 March 2004), which compares to 4.2% of BME officers leaving post. Of the White officers leaving, the proportion retiring was 48%, compared to 9% for BME officers. These figures would be affected by the age profile of the two groups in the police, and would in turn affect the proportion of those resigning voluntarily, which was 52% for BME officers, compared to 23% for White officers.
There was an overall increase of 10.6% over the previous year in the total number of Special Constables, with an increase of 32.7% in the number of BME Special Constables (Table 12.1d). The proportion of all Special Constables who are from minority ethnic groups now stands at 6.6%, an increase from the 5.5% in post at 31 March 2005. The number of female Black and Minority Ethnic Special Constables increased by 39.5%, although the proportion of females within Black and Minority Ethnic Special Constables remains slightly lower than the overall proportion of female Special Constables.
There were over 76,000 police staff (including Traffic Wardens and Designated Officers) in the Police Service (Table 12.1e) at 31 March 2005. 5.2% of their number were from a minority ethnic group. Of the total of 6,767 Community Support Officers in post in 2005/6, 15.2% were from Black and Minority Ethnic groups, compared to 14.3% the previous year. Although the main function of Police Community Support Officers (PCSOs) is to enhance public reassurance by providing visible uniformed patrol, it is also
13 Based on Labour Force Survey data.
Section 95
102
anticipated that PCSO recruitment – more demographically diverse than regular recruitment – will make the police more genuinely representative of the diverse communities they police. (see Johnston L., 2005; Johnston, L., 2006).
Prison Service: Table 12.2 (a & b)
The proportion of BME officers in 2005/6 was 4.6% (Table 12.2a). This is an increase, up from 4.4%, in 2004/5, and equals the Prison Service target for Minority Ethnic Representation for 2005. Overall, prison officer numbers rose by 1.2% with White officers increasing in number by 2.0% and BME officers by 5.3%. However, these figures may have been affected by the 15.3% decrease in the number of officers where the ethnicity was unknown. The ethnicity of 4.8% of officers in 2005/6 remained unknown.
Black and Minority Ethnic groups accounted for 7.6% of the 5,660 people recruited into the Prison Service in 2005/6 (Table 12.2.b). Of the 4,856 individuals who left Prison Service employment during this period, 7.1% were from Black and Minority Ethnic groups.
Probation Service: Table 12.3
The overall proportion of BME staff was 11.8% in 2005/6, up from 10.9% in 2004/5 (Table 12.3), and exceeding the representation target for 2005 (8.3%). The total number of staff increased by 6.3%, with staff identifying themselves as White increasing in number by 6.5% and BME staff by 14.9%. There was, however, a decrease of 38.6% in the number of staff where ethnicity was not available. The ethnicity of 4.7% of officers in 2005/6 remained unknown.
Crown Prosecution Service: Table 12.4
Overall there was a 4.8% increase in CPS staff from 2004/5 to 2005/6. The proportion of BME staff in the CPS was 15.2% up from 14.8% in 2004/5 (excluding numbers Not Known). The largest percentage increase in the number of staff was found in the Black and Other groups (6.6% and 4.7% respectively). The Chinese group was the only group to experience a decrease (the groups small sample size means that a fall in the number of Chinese staff from 28 in 2004/5 to 27 in 2005/6 resulted in a decrease of 3.6%)
Other Criminal Justice Agencies: Table 12.5
Of all the other Criminal Justice Agencies reported here, the Serious Fraud Office employed the highest proportion of BME staff at 22% for 2005/6, while Youth Offending Team Members also had a high representation of BME members at 17%. This lies in contrast to many of the other agencies. The lowest proportion was noted amongst members of the Judiciary which had only 3% representation from the BME community. Moreover, the majority of this group were employed at the levels of District Judge and Recorder. Circuit Judges and High Court Judges were composed of only 1% minority ethnic members, while there were no Lord Justices of Black or other minority ethnic origin.
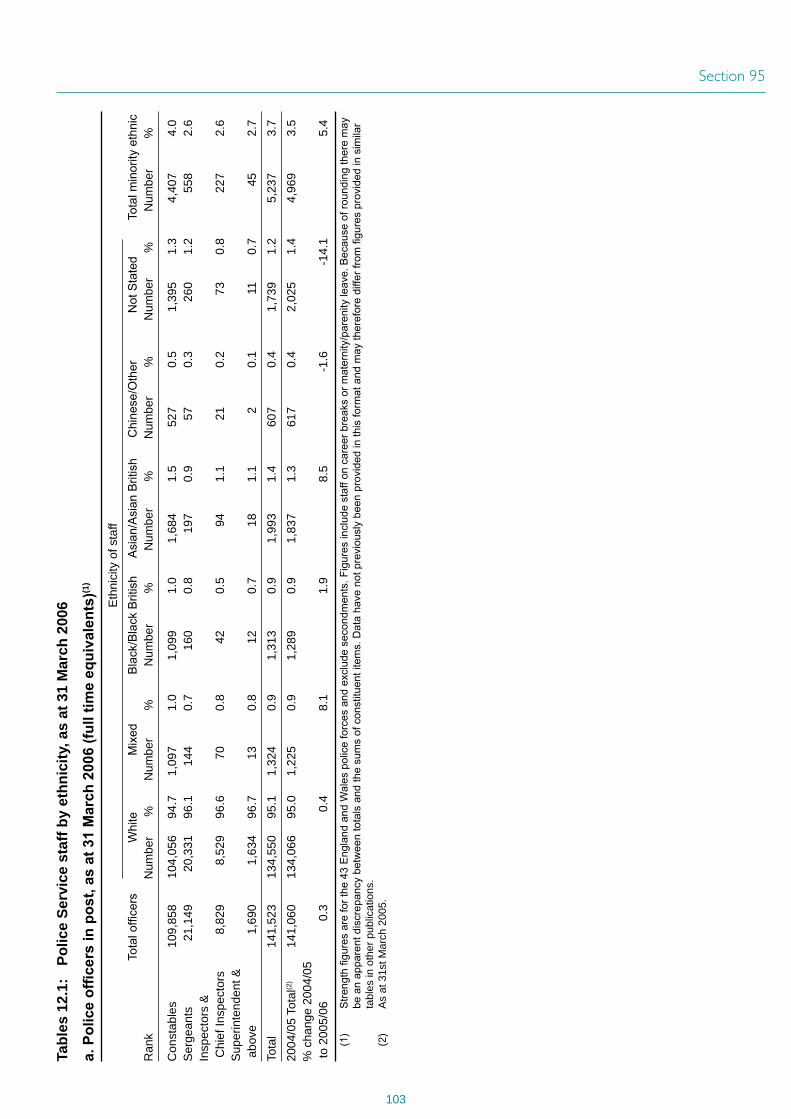
Section 95
103
Tab
les
12.1
: P
olic
e S
ervi
ce s
taff
by
eth
nic
ity,
as
at 3
1 M
arch
200
6
a. P
olic
e o
ffice
rs in
po
st, a
s at
31
Mar
ch 2
006
(fu
ll ti
me
equ
ival
ents
)(1)
E
thni
city
of s
taff
To
tal o
ffice
rs
Whi
te
Mix
ed
Bla
ck/B
lack
Brit
ish
Asi
an/A
sian
Brit
ish
Chi
nese
/Oth
er
Not
Sta
ted
Tota
l min
ority
eth
nic
Ran
k N
umbe
r %
N
umbe
r %
N
umbe
r %
N
umbe
r %
N
umbe
r %
N
umbe
r %
N
umbe
r %
Con
stab
les
109,
858
104,
056
94.7
1,
097
1.0
1,09
9 1.
0 1,
684
1.5
527
0.5
1,39
5 1.
3 4,
407
4.0
Ser
gean
ts
21,1
49
20,3
31
96.1
14
4 0.
7 16
0 0.
8 19
7 0.
9 57
0.
3 26
0 1.
2 55
8 2.
6In
spec
tors
&
Chi
ef In
spec
tors
8,
829
8,52
9 96
.6
70
0.8
42
0.5
94
1.1
21
0.2
73
0.8
227
2.6
Sup
erin
tend
ent &
ab
ove
1,69
0 1,
634
96.7
13
0.
8 12
0.
7 18
1.
1 2
0.1
11
0.7
45
2.7
Tota
l 14
1,52
3 13
4,55
0 95
.1
1,32
4 0.
9 1,
313
0.9
1,99
3 1.
4 60
7 0.
4 1,
739
1.2
5,23
7 3.
7
2004
/05
Tota
l(2)
141,
060
134,
066
95.0
1,
225
0.9
1,28
9 0.
9 1,
837
1.3
617
0.4
2,02
5 1.
4 4,
969
3.5
% c
hang
e 20
04/0
5 to
200
5/06
0.
3
0.4
8.
1
1.9
8.
5
-1.6
-14.
1
5.4
(1)
Str
engt
h fig
ures
are
for
the
43 E
ngla
nd a
nd W
ales
pol
ice
forc
es a
nd e
xclu
de s
econ
dmen
ts. F
igur
es in
clud
e st
aff o
n ca
reer
bre
aks
or m
ater
nity
/par
enity
leav
e. B
ecau
se o
f rou
ndin
g th
ere
may
be
an
appa
rent
dis
crep
ancy
bet
wee
n to
tals
and
the
sum
s of
con
stitu
ent i
tem
s. D
ata
have
not
pre
viou
sly
been
pro
vide
d in
this
form
at a
nd m
ay th
eref
ore
diffe
r fr
om fi
gure
s pr
ovid
ed in
sim
ilar
tabl
es in
oth
er p
ublic
atio
ns.
(2)
As
at 3
1st M
arch
200
5.
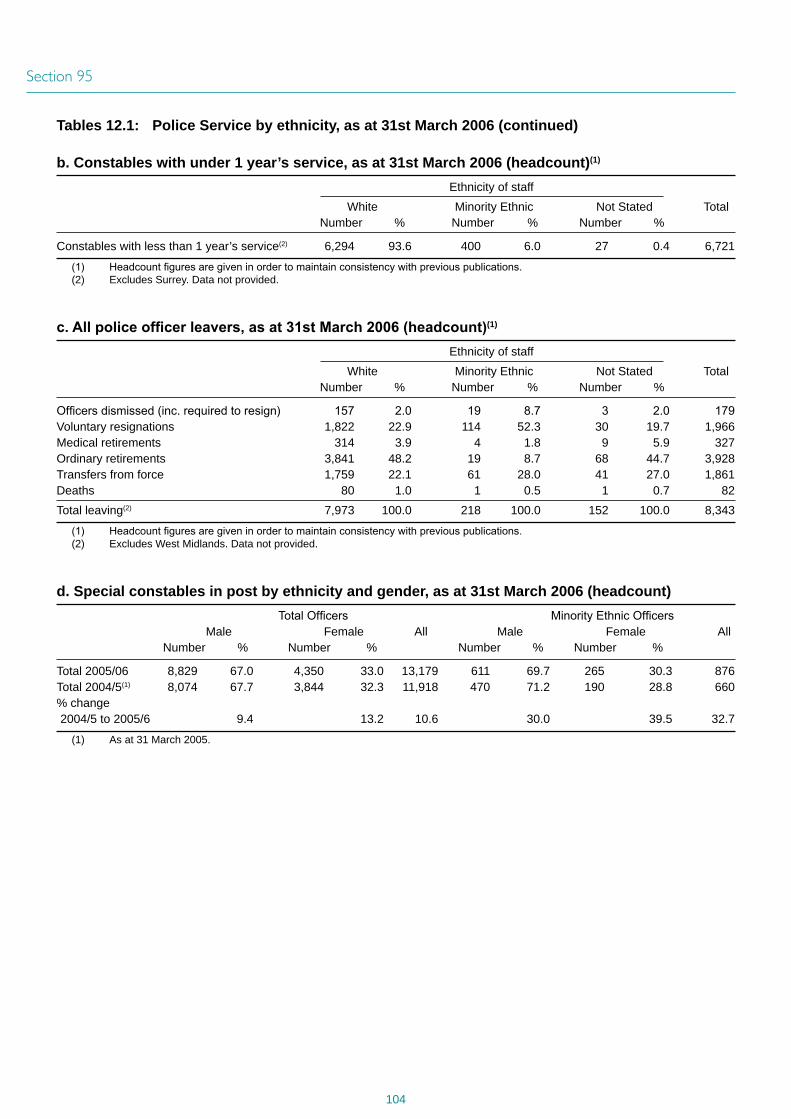
Section 95
104
Tables 12.1: Police Service by ethnicity, as at 31st March 2006 (continued)
b. Constables with under 1 year’s service, as at 31st March 2006 (headcount)(1)
Ethnicity of staff
White Minority Ethnic Not Stated Total Number % Number % Number %
Constables with less than 1 year’s service(2) 6,294 93.6 400 6.0 27 0.4 6,721
(1) Headcount figures are given in order to maintain consistency with previous publications. (2) Excludes Surrey. Data not provided.
c. All police officer leavers, as at 31st March 2006 (headcount)(1)
Ethnicity of staff
White Minority Ethnic Not Stated Total Number % Number % Number %
Officers dismissed (inc. required to resign) 157 2.0 19 8.7 3 2.0 179Voluntary resignations 1,822 22.9 114 52.3 30 19.7 1,966Medical retirements 314 3.9 4 1.8 9 5.9 327Ordinary retirements 3,841 48.2 19 8.7 68 44.7 3,928Transfers from force 1,759 22.1 61 28.0 41 27.0 1,861Deaths 80 1.0 1 0.5 1 0.7 82
Total leaving(2) 7,973 100.0 218 100.0 152 100.0 8,343
(1) Headcount figures are given in order to maintain consistency with previous publications. (2) Excludes West Midlands. Data not provided.
d. Special constables in post by ethnicity and gender, as at 31st March 2006 (headcount)
Total Officers Minority Ethnic Officers Male Female All Male Female All Number % Number % Number % Number %
Total 2005/06 8,829 67.0 4,350 33.0 13,179 611 69.7 265 30.3 876Total 2004/5(1) 8,074 67.7 3,844 32.3 11,918 470 71.2 190 28.8 660% change 2004/5 to 2005/6 9.4 13.2 10.6 30.0 39.5 32.7
(1) As at 31 March 2005.
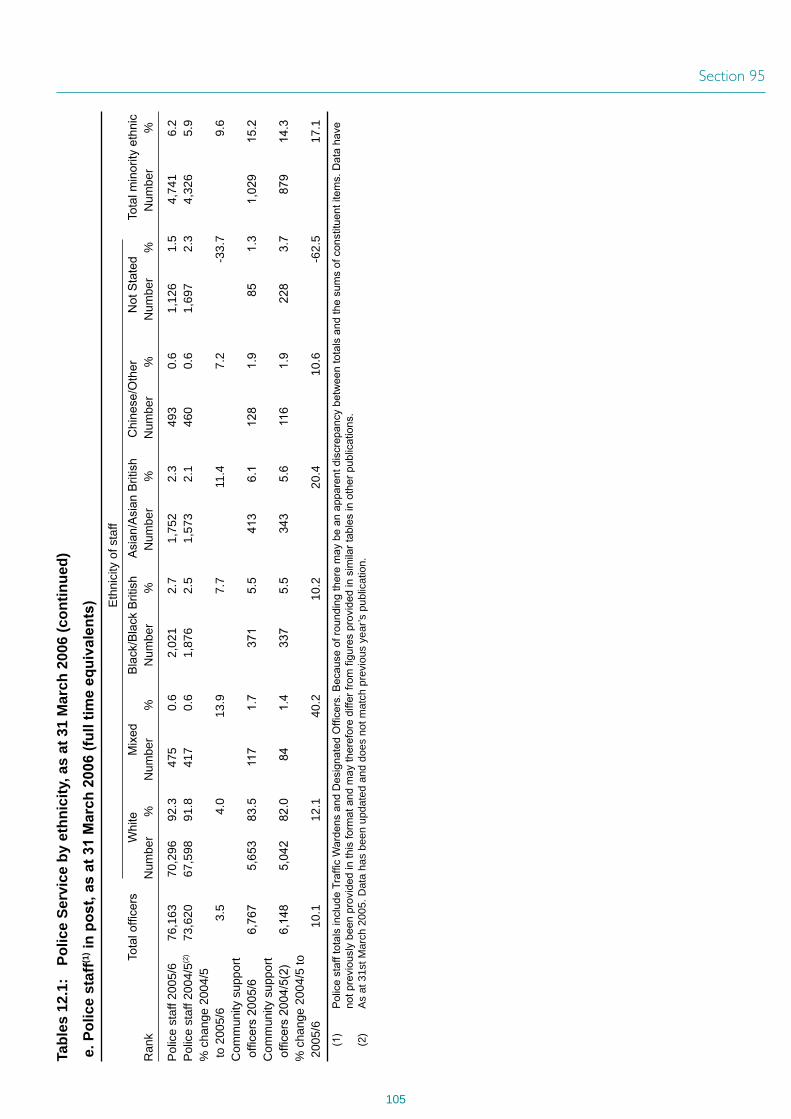
Section 95
105
Tab
les
12.1
: P
olic
e S
ervi
ce b
y et
hn
icit
y, a
s at
31
Mar
ch 2
006
(co
nti
nu
ed)
e. P
olic
e st
aff(1
) in
po
st, a
s at
31
Mar
ch 2
006
(fu
ll ti
me
equ
ival
ents
)
E
thni
city
of s
taff
To
tal o
ffice
rs
Whi
te
Mix
ed
Bla
ck/B
lack
Brit
ish
Asi
an/A
sian
Brit
ish
Chi
nese
/Oth
er
Not
Sta
ted
Tota
l min
ority
eth
nic
Ran
k N
umbe
r %
N
umbe
r %
N
umbe
r %
N
umbe
r %
N
umbe
r %
N
umbe
r %
N
umbe
r %
Pol
ice
staf
f 200
5/6
76,1
63
70,2
96
92.3
47
5 0.
6 2,
021
2.7
1,75
2 2.
3 49
3 0.
6 1,
126
1.5
4,74
1 6.
2P
olic
e st
aff 2
004/
5(2)
73,6
20
67,5
98
91.8
41
7 0.
6 1,
876
2.5
1,57
3 2.
1 46
0 0.
6 1,
697
2.3
4,32
6 5.
9%
cha
nge
2004
/5
to 2
005/
6 3.
5
4.0
13
.9
7.
7
11.4
7.2
-3
3.7
9.
6C
omm
unity
sup
port
of
ficer
s 20
05/6
6,
767
5,65
3 83
.5
117
1.7
371
5.5
413
6.1
128
1.9
85
1.3
1,02
9 15
.2C
omm
unity
sup
port
of
ficer
s 20
04/5
(2)
6,14
8 5,
042
82.0
84
1.
4 33
7 5.
5 34
3 5.
6 11
6 1.
9 22
8 3.
7 87
9 14
.3%
cha
nge
2004
/5 to
20
05/6
10
.1
12
.1
40
.2
10
.2
20
.4
10
.6
-6
2.5
17
.1
(1)
Pol
ice
staf
f tot
als
incl
ude
Tra
ffic
War
dens
and
Des
igna
ted
Offi
cers
. Bec
ause
of r
ound
ing
ther
e m
ay b
e an
app
aren
t dis
crep
ancy
bet
wee
n to
tals
and
the
sum
s of
con
stitu
ent i
tem
s. D
ata
have
no
t pre
viou
sly
been
pro
vide
d in
this
form
at a
nd m
ay th
eref
ore
diffe
r fr
om fi
gure
s pr
ovid
ed in
sim
ilar
tabl
es in
oth
er p
ublic
atio
ns.
(2)
As
at 3
1st M
arch
200
5. D
ata
has
been
upd
ated
and
doe
s no
t mat
ch p
revi
ous
year
’s p
ublic
atio
n.
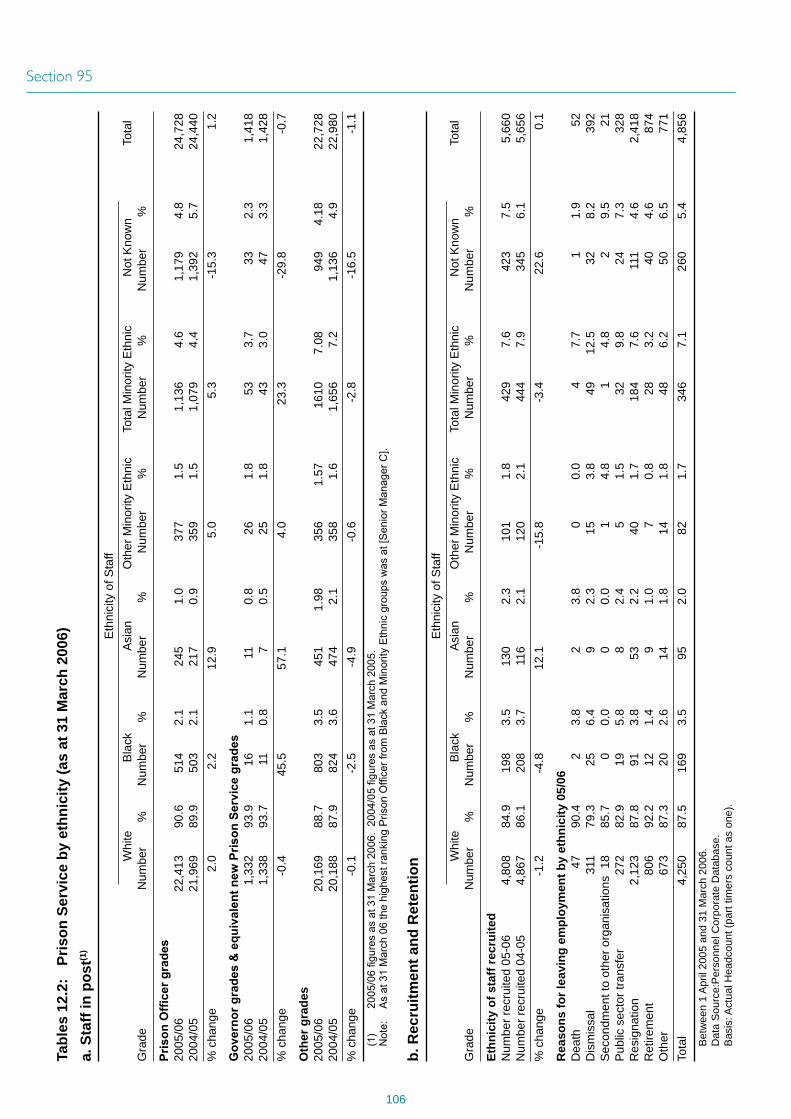
Section 95
106
Tab
les
12.2
: P
riso
n S
ervi
ce b
y et
hn
icit
y (a
s at
31
Mar
ch 2
006)
a. S
taff
in p
ost
(1)
E
thni
city
of S
taff
W
hite
B
lack
A
sian
O
ther
Min
ority
Eth
nic
Tota
l Min
ority
Eth
nic
Not
Kno
wn
Tota
lG
rade
N
umbe
r %
N
umbe
r %
N
umbe
r %
N
umbe
r %
N
umbe
r %
N
umbe
r %
Pri
son
Offi
cer
gra
des
2005
/06
22,4
13
90.6
51
4 2.
1 24
5 1.
0 37
7 1.
5 1,
136
4.6
1,17
9 4.
8 24
,728
2004
/05
21,9
69
89.9
50
3 2.
1 21
7 0.
9 35
9 1.
5 1,
079
4.4
1,39
2 5.
7 24
,440
% c
hang
e 2.
0
2.2
12
.9
5.
0
5.3
-1
5.3
1.
2
Go
vern
or
gra
des
& e
qu
ival
ent
new
Pri
son
Ser
vice
gra
des
2005
/06
1,33
2 93
.9
16
1.1
11
0.8
26
1.8
53
3.7
33
2.3
1,41
820
04/0
5 1,
338
93.7
11
0.
8 7
0.5
25
1.8
43
3.0
47
3.3
1,42
8
% c
hang
e -0
.4
45
.5
57
.1
4.
0
23.3
-29.
8
-0.7
Oth
er g
rad
es
2005
/06
20,1
69
88.7
80
3 3.
5 45
1 1.
98
356
1.57
16
10
7.08
94
9 4.
18
22,7
2820
04/0
5 20
,188
87
.9
824
3.6
474
2.1
358
1.6
1,65
6 7.
2 1,
136
4.9
22,9
80
% c
hang
e -0
.1
-2
.5
-4
.9
-0
.6
-2
.8
-1
6.5
-1
.1
(1)
2005
/06
figur
es a
s at
31
Mar
ch 2
006.
200
4/05
figu
res
as a
t 31
Mar
ch 2
005.
Not
e:
As
at 3
1 M
arch
06
the
high
est r
anki
ng P
rison
Offi
cer
from
Bla
ck a
nd M
inor
ity E
thni
c gr
oups
was
at [
Sen
ior
Man
ager
C].
b. R
ecru
itm
ent
and
Ret
enti
on
E
thni
city
of S
taff
W
hite
B
lack
A
sian
O
ther
Min
ority
Eth
nic
Tota
l Min
ority
Eth
nic
Not
Kno
wn
Tota
lG
rade
N
umbe
r %
N
umbe
r %
N
umbe
r %
N
umbe
r %
N
umbe
r %
N
umbe
r %
Eth
nic
ity
of
staf
f re
cru
ited
N
umbe
r re
crui
ted
05-0
6 4,
808
84.9
19
8 3.
5 13
0 2.
3 10
1 1.
8 42
9 7.
6 42
3 7.
5 5,
660
Num
ber
recr
uite
d 04
-05
4,
867
86.1
20
8 3.
7 11
6 2.
1 12
0 2.
1 44
4 7.
9 34
5 6.
1 5,
656
% c
hang
e -1
.2
-4
.8
12
.1
-1
5.8
-3
.4
22
.6
0.
1
Rea
son
s fo
r le
avin
g e
mp
loym
ent
by
eth
nic
ity
05/0
6
D
eath
47
90
.4
2 3.
8 2
3.8
0 0.
0 4
7.7
1 1.
9 52
Dis
mis
sal
311
79.3
25
6.
4 9
2.3
15
3.8
49
12.5
32
8.
2 39
2S
econ
dmen
t to
othe
r or
gani
satio
ns
18
85.7
0
0.0
0 0.
0 1
4.8
1 4.
8 2
9.5
21P
ublic
sec
tor
tran
sfer
27
2 82
.9
19
5.8
8 2.
4 5
1.5
32
9.8
24
7.3
328
Res
igna
tion
2,12
3 87
.8
91
3.8
53
2.2
40
1.7
184
7.6
111
4.6
2,41
8R
etire
men
t 80
6 92
.2
12
1.4
9 1.
0 7
0.8
28
3.2
40
4.6
874
Oth
er
673
87.3
20
2.
6 14
1.
8 14
1.
8 48
6.
2 50
6.
5 77
1
Tota
l 4,
250
87.5
16
9 3.
5 95
2.
0 82
1.
7 34
6 7.
1 26
0 5.
4 4,
856
Bet
wee
n 1
Apr
il 20
05 a
nd 3
1 M
arch
200
6.D
ata
Sou
rce:
Per
sonn
el C
orpo
rate
Dat
abas
e.
Bas
is: A
ctua
l Hea
dcou
nt (
part
tim
ers
coun
t as
one)
.
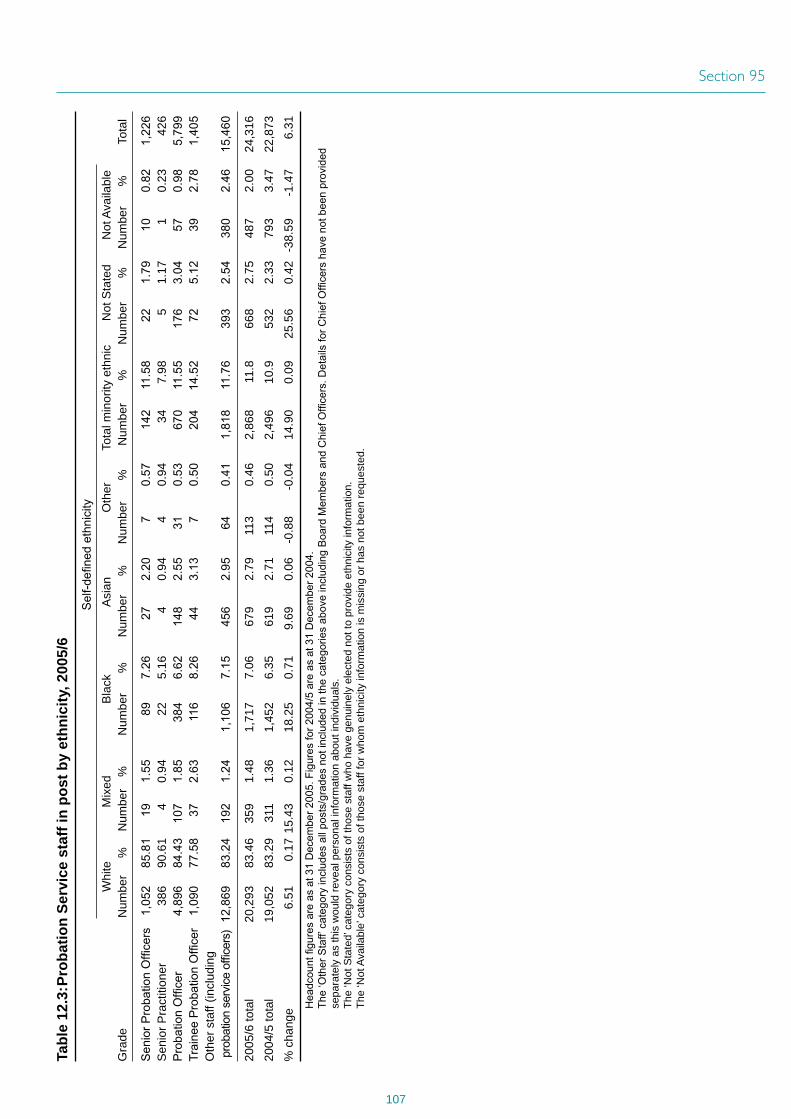
Section 95
107
Tab
le 1
2.3:
Pro
bat
ion
Ser
vice
sta
ff in
po
st b
y et
hn
icit
y, 2
005/
6
S
elf-
defin
ed e
thni
city
W
hite
M
ixed
B
lack
A
sian
O
ther
To
tal m
inor
ity e
thni
c N
ot S
tate
d N
ot A
vaila
ble
Gra
de
Num
ber
%
Num
ber
%
Num
ber
%
Num
ber
%
Num
ber
%
Num
ber
%
Num
ber
%
Num
ber
%
Tota
l
Sen
ior
Pro
batio
n O
ffice
rs
1,0
52
85.8
1 19
1.
55
89
7.
26
27
2.20
7
0.57
1
42
11.5
8 2
2
1.79
1
0
0.82
1
,226
S
enio
r P
ract
ition
er
386
90
.61
4 0.
94
22
5.
16
4 0.
94
4 0.
94
34
7.
98
5
1.17
1
0.
23
426
P
roba
tion
Offi
cer
4,8
96
84.4
3 10
7 1.
85
384
6.
62
148
2.55
31
0.
53
670
11
.55
176
3.
04
57
0.
98
5,7
99
Tra
inee
Pro
batio
n O
ffice
r 1
,090
77
.58
37
2.63
1
16
8.26
44
3.
13
7 0.
50
204
14
.52
72
5.
12
39
2.
78
1,4
05
Oth
er s
taff
(incl
udin
g
prob
atio
n se
rvic
e of
ficer
s)
12,8
69
83.2
4 19
2 1.
24
1,1
06
7.15
45
6 2.
95
64
0.41
1
,818
11
.76
393
2.
54
380
2.
46
15,
460
2005
/6 to
tal
20,
293
83
.46
359
1.48
1
,717
7.
06
679
2.79
11
3 0.
46
2,8
68
11.8
6
68
2.75
4
87
2.00
2
4,31
6
2004
/5 to
tal
19,
052
83
.29
311
1.36
1
,452
6.
35
619
2.71
11
4 0.
50
2,4
96
10.9
5
32
2.33
7
93
3.47
2
2,87
3
% c
hang
e 6.
51
0.17
15.
43
0.12
18
.25
0.71
9.
69
0.06
-0
.88
-0.0
4 14
.90
0.09
25
.56
0.42
-3
8.59
-1
.47
6.31
H
eadc
ount
figu
res
are
as a
t 31
Dec
embe
r 20
05. F
igur
es fo
r 20
04/5
are
as
at 3
1 D
ecem
ber
2004
.
The
‘Oth
er S
taff’
cat
egor
y in
clud
es a
ll po
sts/
grad
es n
ot in
clud
ed in
the
cate
gorie
s ab
ove
incl
udin
g B
oard
Mem
bers
and
Chi
ef O
ffice
rs. D
etai
ls fo
r C
hief
Offi
cers
hav
e no
t bee
n pr
ovid
ed
sepa
rate
ly a
s th
is w
ould
rev
eal p
erso
nal i
nfor
mat
ion
abou
t ind
ivid
uals
.
The
‘Not
Sta
ted’
cat
egor
y co
nsis
ts o
f tho
se s
taff
who
hav
e ge
nuin
ely
elec
ted
not t
o pr
ovid
e et
hnic
ity in
form
atio
n.
The
‘Not
Ava
ilabl
e’ c
ateg
ory
cons
ists
of t
hose
sta
ff fo
r w
hom
eth
nici
ty in
form
atio
n is
mis
sing
or
has
not b
een
requ
este
d.
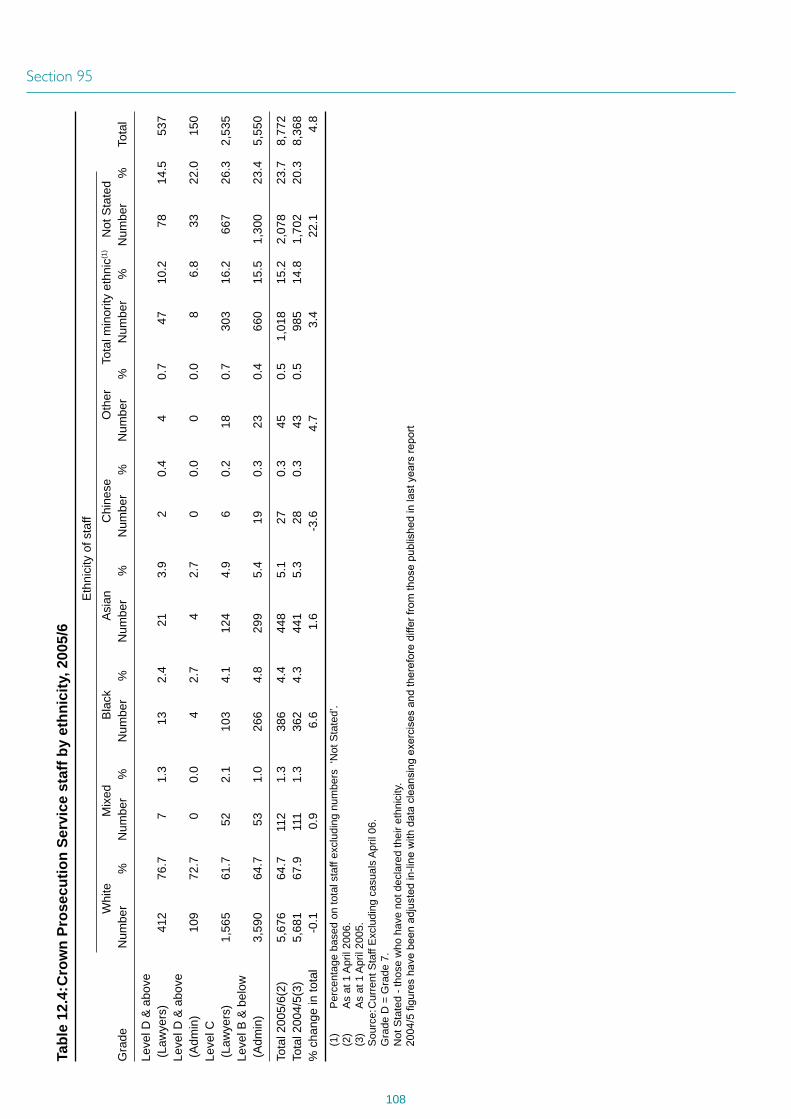
Section 95
108
Tab
le 1
2.4:
Cro
wn
Pro
secu
tio
n S
ervi
ce s
taff
by
eth
nic
ity,
200
5/6
E
thni
city
of s
taff
W
hite
M
ixed
B
lack
A
sian
C
hine
se
Oth
er
Tota
l min
ority
eth
nic(1
) N
ot S
tate
dG
rade
N
umbe
r %
N
umbe
r %
N
umbe
r %
N
umbe
r %
N
umbe
r %
N
umbe
r %
N
umbe
r %
N
umbe
r %
To
tal
Leve
l D &
abo
ve
(Law
yers
) 41
2 76
.7
7 1.
3 13
2.
4 21
3.
9 2
0.4
4 0.
7 47
10
.2
78
14.5
53
7Le
vel D
& a
bove
(A
dmin
) 10
9 72
.7
0 0.
0 4
2.7
4 2.
7 0
0.0
0 0.
0 8
6.8
33
22.0
15
0Le
vel C
(L
awye
rs)
1,56
5 61
.7
52
2.1
103
4.1
124
4.9
6 0.
2 18
0.
7 30
3 16
.2
667
26.3
2,
535
Leve
l B &
bel
ow
(Adm
in)
3,59
0 64
.7
53
1.0
266
4.8
299
5.4
19
0.3
23
0.4
660
15.5
1,
300
23.4
5,
550
Tota
l 200
5/6(
2)
5,67
6 64
.7
112
1.3
386
4.4
448
5.1
27
0.3
45
0.5
1,01
8 15
.2
2,07
8 23
.7
8,77
2To
tal 2
004/
5(3)
5,
681
67.9
11
1 1.
3 36
2 4.
3 44
1 5.
3 28
0.
3 43
0.
5 98
5 14
.8
1,70
2 20
.3
8,36
8%
cha
nge
in to
tal
-0.1
0.9
6.
6
1.6
-3
.6
4.
7
3.4
22
.1
4.
8
(1)
Per
cent
age
base
d on
tota
l sta
ff ex
clud
ing
num
bers
‘N
ot S
tate
d’.
(2)
As
at 1
Apr
il 20
06.
(3)
As
at 1
Apr
il 20
05.
Sou
rce:
Cur
rent
Sta
ff E
xclu
ding
cas
uals
Apr
il 06
.G
rade
D =
Gra
de 7
.N
ot S
tate
d -
thos
e w
ho h
ave
not d
ecla
red
thei
r et
hnic
ity.
2004
/5 fi
gure
s ha
ve b
een
adju
sted
in-li
ne w
ith d
ata
clea
nsin
g ex
erci
ses
and
ther
efor
e di
ffer
from
thos
e pu
blis
hed
in la
st y
ears
rep
ort
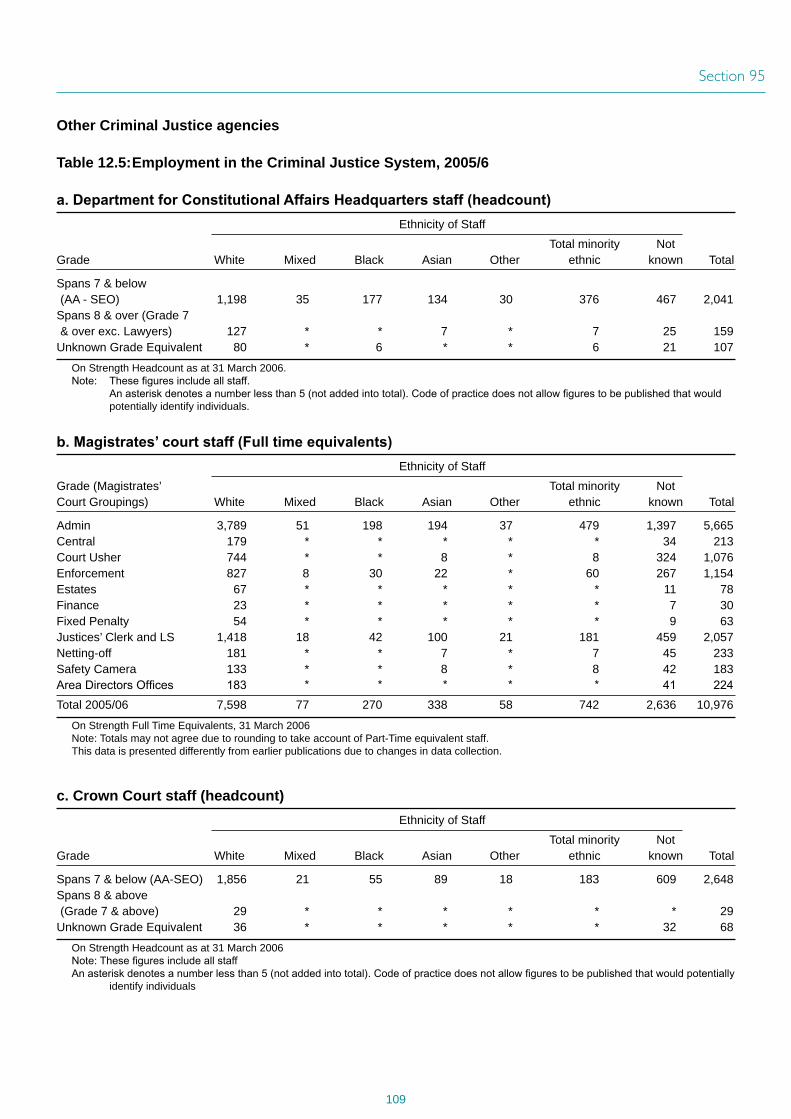
Section 95
109
Other Criminal Justice agencies
Table 12.5: Employment in the Criminal Justice System, 2005/6
a. Department for Constitutional Affairs Headquarters staff (headcount)
Ethnicity of Staff
Total minority Not Grade White Mixed Black Asian Other ethnic known Total
Spans 7 & below (AA - SEO) 1,198 35 177 134 30 376 467 2,041
Spans 8 & over (Grade 7 & over exc. Lawyers) 127 * * 7 * 7 25 159
Unknown Grade Equivalent 80 * 6 * * 6 21 107
On Strength Headcount as at 31 March 2006.Note: These figures include all staff. An asterisk denotes a number less than 5 (not added into total). Code of practice does not allow figures to be published that would
potentially identify individuals.
b. Magistrates’ court staff (Full time equivalents)
Ethnicity of Staff
Grade (Magistrates’ Total minority Not Court Groupings) White Mixed Black Asian Other ethnic known Total
Admin 3,789 51 198 194 37 479 1,397 5,665Central 179 * * * * * 34 213Court Usher 744 * * 8 * 8 324 1,076Enforcement 827 8 30 22 * 60 267 1,154Estates 67 * * * * * 11 78Finance 23 * * * * * 7 30Fixed Penalty 54 * * * * * 9 63Justices’ Clerk and LS 1,418 18 42 100 21 181 459 2,057Netting-off 181 * * 7 * 7 45 233Safety Camera 133 * * 8 * 8 42 183Area Directors Offices 183 * * * * * 41 224
Total 2005/06 7,598 77 270 338 58 742 2,636 10,976
On Strength Full Time Equivalents, 31 March 2006Note: Totals may not agree due to rounding to take account of Part-Time equivalent staff.This data is presented differently from earlier publications due to changes in data collection.
c. Crown Court staff (headcount)
Ethnicity of Staff
Total minority Not Grade White Mixed Black Asian Other ethnic known Total
Spans 7 & below (AA-SEO) 1,856 21 55 89 18 183 609 2,648Spans 8 & above (Grade 7 & above) 29 * * * * * * 29
Unknown Grade Equivalent 36 * * * * * 32 68
On Strength Headcount as at 31 March 2006 Note: These figures include all staffAn asterisk denotes a number less than 5 (not added into total). Code of practice does not allow figures to be published that would potentially
identify individuals
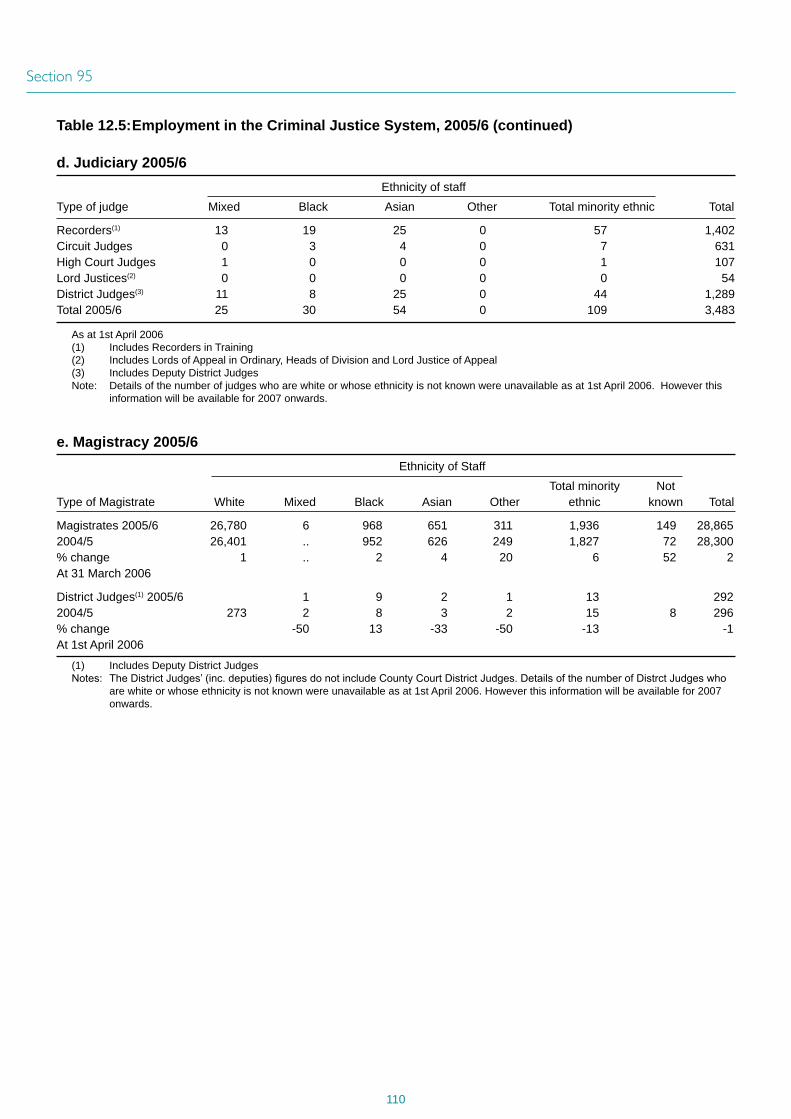
Section 95
110
Table 12.5: Employment in the Criminal Justice System, 2005/6 (continued)
d. Judiciary 2005/6
Ethnicity of staff
Type of judge Mixed Black Asian Other Total minority ethnic Total
Recorders(1) 13 19 25 0 57 1,402Circuit Judges 0 3 4 0 7 631High Court Judges 1 0 0 0 1 107Lord Justices(2) 0 0 0 0 0 54District Judges(3) 11 8 25 0 44 1,289Total 2005/6 25 30 54 0 109 3,483
As at 1st April 2006(1) Includes Recorders in Training(2) Includes Lords of Appeal in Ordinary, Heads of Division and Lord Justice of Appeal (3) Includes Deputy District Judges Note: Details of the number of judges who are white or whose ethnicity is not known were unavailable as at 1st April 2006. However this
information will be available for 2007 onwards.
e. Magistracy 2005/6
Ethnicity of Staff
Total minority Not Type of Magistrate White Mixed Black Asian Other ethnic known Total
Magistrates 2005/6 26,780 6 968 651 311 1,936 149 28,8652004/5 26,401 .. 952 626 249 1,827 72 28,300% change 1 .. 2 4 20 6 52 2At 31 March 2006
District Judges(1) 2005/6 1 9 2 1 13 2922004/5 273 2 8 3 2 15 8 296% change -50 13 -33 -50 -13 -1At 1st April 2006
(1) Includes Deputy District JudgesNotes: The District Judges’ (inc. deputies) figures do not include County Court District Judges. Details of the number of Distrct Judges who
are white or whose ethnicity is not known were unavailable as at 1st April 2006. However this information will be available for 2007 onwards.
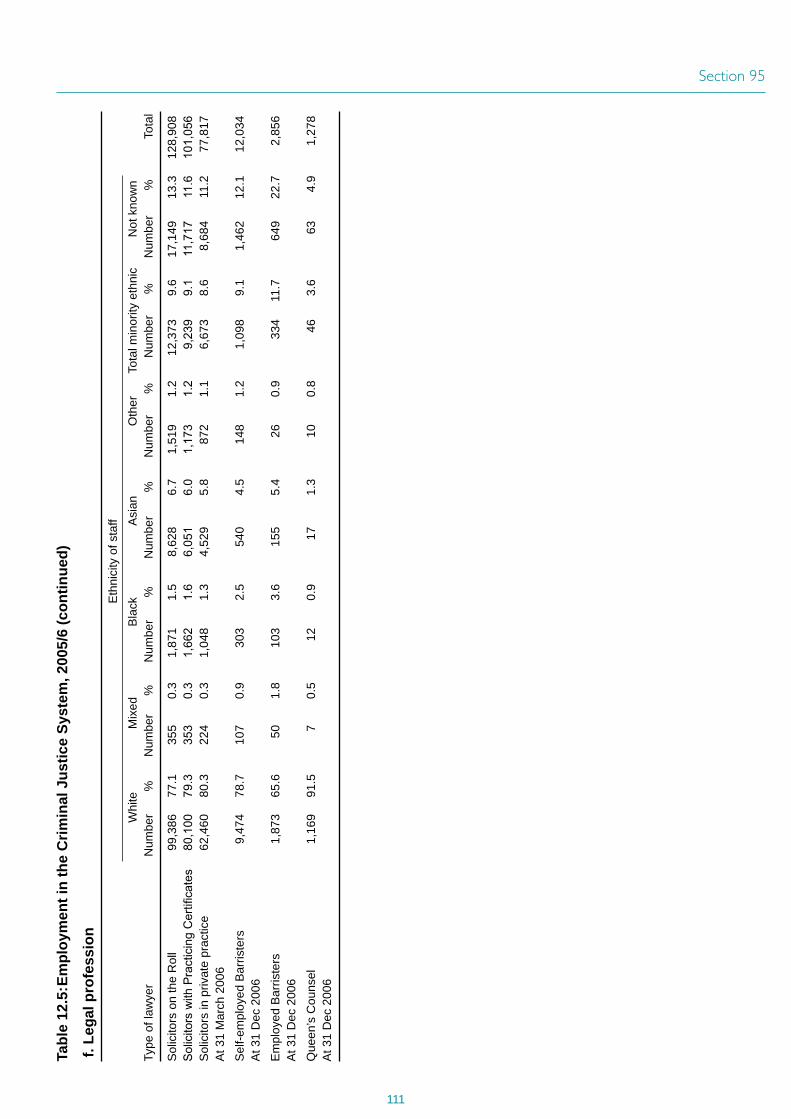
Section 95
111
Tab
le 1
2.5:
Em
plo
ymen
t in
th
e C
rim
inal
Ju
stic
e S
yste
m, 2
005/
6 (c
on
tin
ued
)
f. L
egal
pro
fess
ion
E
thni
city
of s
taff
W
hite
M
ixed
B
lack
A
sian
O
ther
To
tal m
inor
ity e
thni
c N
ot k
now
nTy
pe o
f law
yer
Num
ber
%
Num
ber
%
Num
ber
%
Num
ber
%
Num
ber
%
Num
ber
%
Num
ber
%
Tota
l
Sol
icito
rs o
n th
e R
oll
99,3
86
77.1
35
5 0.
3 1,
871
1.5
8,62
8 6.
7 1,
519
1.2
12,3
73
9.6
17,1
49
13.3
1
28,9
08
Sol
icito
rs w
ith P
ract
icin
g C
ertifi
cate
s 80
,100
79
.3
353
0.3
1,66
2 1.
6 6,
051
6.0
1,17
3 1.
2 9,
239
9.1
11,7
17
11.6
1
01,0
56
Sol
icito
rs in
priv
ate
prac
tice
62,4
60
80.3
22
4 0.
3 1,
048
1.3
4,52
9 5.
8 87
2 1.
1 6,
673
8.6
8,68
4 11
.2
77,
817
At 3
1 M
arch
200
6
Sel
f-em
ploy
ed B
arris
ters
9
,474
78
.7
107
0.
9 30
3 2.
5 54
0 4.
5 14
8 1.
2 1,
098
9.1
1,46
2 12
.1
12,0
34A
t 31
Dec
200
6
Em
ploy
ed B
arris
ters
1,
873
65.6
50
1.
8 10
3 3.
6 15
5 5.
4 26
0.
9 33
4 11
.7
649
22.7
2,
856
At 3
1 D
ec 2
006
Que
en’s
Cou
nsel
1,
169
91.5
7
0.5
12
0.9
17
1.3
10
0.8
46
3.6
63
4.9
1,27
8A
t 31
Dec
200
6
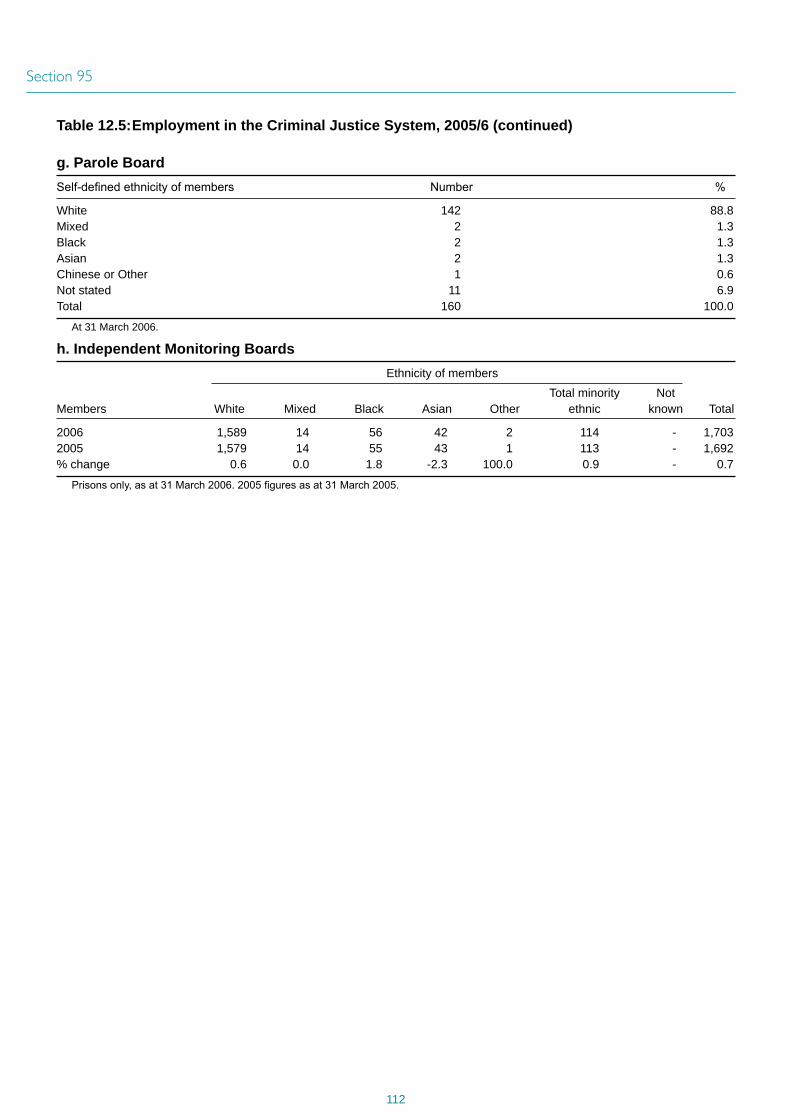
Section 95
112
Table 12.5: Employment in the Criminal Justice System, 2005/6 (continued)
g. Parole Board
Self-defined ethnicity of members Number %
White 142 88.8Mixed 2 1.3Black 2 1.3Asian 2 1.3Chinese or Other 1 0.6Not stated 11 6.9Total 160 100.0
At 31 March 2006.
h. Independent Monitoring Boards
Ethnicity of members
Total minority Not Members White Mixed Black Asian Other ethnic known Total
2006 1,589 14 56 42 2 114 - 1,7032005 1,579 14 55 43 1 113 - 1,692% change 0.6 0.0 1.8 -2.3 100.0 0.9 - 0.7
Prisons only, as at 31 March 2006. 2005 figures as at 31 March 2005.
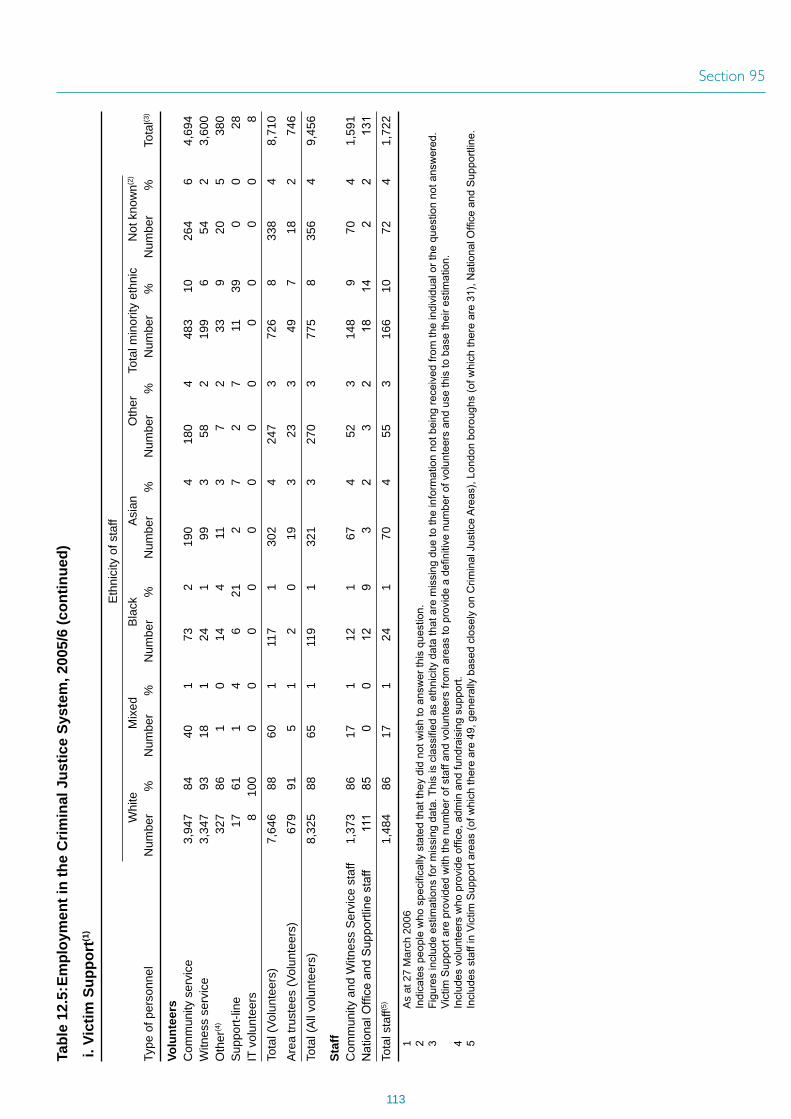
Section 95
113
Tab
le 1
2.5:
Em
plo
ymen
t in
th
e C
rim
inal
Ju
stic
e S
yste
m, 2
005/
6 (c
on
tin
ued
)
i. V
icti
m S
up
po
rt(1
)
E
thni
city
of s
taff
W
hite
M
ixed
B
lack
A
sian
O
ther
To
tal m
inor
ity e
thni
c N
ot k
now
n(2)
Type
of p
erso
nnel
N
umbe
r %
N
umbe
r %
N
umbe
r %
N
umbe
r %
N
umbe
r %
N
umbe
r %
N
umbe
r %
To
tal(3
)
Vo
lun
teer
sC
omm
unity
ser
vice
3,
947
84
40
1 73
2
190
4 18
0 4
483
10
264
6 4,
694
Witn
ess
serv
ice
3,34
7 93
18
1
24
1 99
3
58
2 19
9 6
54
2 3,
600
Oth
er(4
) 32
7 86
1
0 14
4
11
3 7
2 33
9
20
5 38
0S
uppo
rt-li
ne
17
61
1 4
6 21
2
7 2
7 11
39
0
0 28
IT v
olun
teer
s 8
100
0 0
0 0
0 0
0 0
0 0
0 0
8
Tota
l (V
olun
teer
s)
7,64
6 88
60
1
117
1 30
2 4
247
3 72
6 8
338
4 8,
710
Are
a tr
uste
es (
Vol
unte
ers)
67
9 91
5
1 2
0 19
3
23
3 49
7
18
2 74
6
Tota
l (A
ll vo
lunt
eers
) 8,
325
88
65
1 11
9 1
321
3 27
0 3
775
8 35
6 4
9,45
6
Sta
ff
Com
mun
ity a
nd W
itnes
s S
ervi
ce s
taff
1,37
3 86
17
1
12
1 67
4
52
3 14
8 9
70
4 1,
591
Nat
iona
l Offi
ce a
nd S
uppo
rtlin
e st
aff
111
85
0 0
12
9 3
2 3
2 18
14
2
2 13
1
Tota
l sta
ff(5)
1,48
4 86
17
1
24
1 70
4
55
3 16
6 10
72
4
1,72
2
1
As
at 2
7 M
arch
200
62
In
dica
tes
peop
le w
ho s
peci
fical
ly s
tate
d th
at th
ey d
id n
ot w
ish
to a
nsw
er th
is q
uest
ion.
3
Fig
ures
incl
ude
estim
atio
ns fo
r m
issi
ng d
ata.
Thi
s is
cla
ssifi
ed a
s et
hnic
ity d
ata
that
are
mis
sing
due
to th
e in
form
atio
n no
t bei
ng r
ecei
ved
from
the
indi
vidu
al o
r th
e qu
estio
n no
t ans
wer
ed.
Vic
tim S
uppo
rt a
re p
rovi
ded
with
the
num
ber
of s
taff
and
volu
ntee
rs fr
om a
reas
to p
rovi
de a
defi
nitiv
e nu
mbe
r of
vol
unte
ers
and
use
this
to b
ase
thei
r es
timat
ion.
4
In
clud
es v
olun
teer
s w
ho p
rovi
de o
ffice
, adm
in a
nd fu
ndra
isin
g su
ppor
t.5
In
clud
es s
taff
in V
ictim
Sup
port
are
as (
of w
hich
ther
e ar
e 49
, gen
eral
ly b
ased
clo
sely
on
Crim
inal
Jus
tice
Are
as),
Lon
don
boro
ughs
(of
whi
ch th
ere
are
31),
Nat
iona
l Offi
ce a
nd S
uppo
rtlin
e.
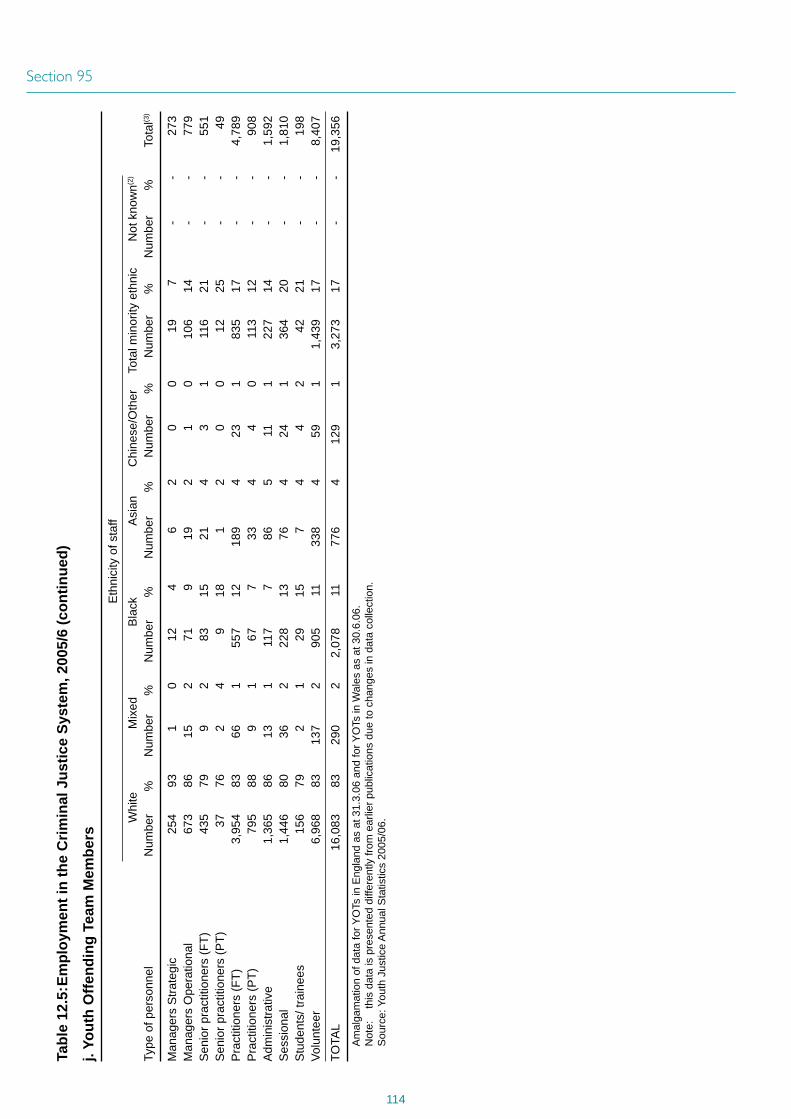
Section 95
114
Tab
le 1
2.5:
Em
plo
ymen
t in
th
e C
rim
inal
Ju
stic
e S
yste
m, 2
005/
6 (c
on
tin
ued
)
j. Y
ou
th O
ffen
din
g T
eam
Mem
ber
s
E
thni
city
of s
taff
W
hite
M
ixed
B
lack
A
sian
C
hine
se/O
ther
To
tal m
inor
ity e
thni
c N
ot k
now
n(2)
Type
of p
erso
nnel
N
umbe
r %
N
umbe
r %
N
umbe
r %
N
umbe
r %
N
umbe
r %
N
umbe
r %
N
umbe
r %
To
tal(3
)
Man
ager
s S
trat
egic
25
4 93
1
0 12
4
6 2
0 0
19
7 -
- 27
3M
anag
ers
Ope
ratio
nal
673
86
15
2 71
9
19
2 1
0 10
6 14
-
- 77
9S
enio
r pr
actit
ione
rs (
FT
) 43
5 79
9
2 83
15
21
4
3 1
116
21
- -
551
Sen
ior
prac
titio
ners
(P
T)
37
76
2 4
9 18
1
2 0
0 12
25
-
- 49
Pra
ctiti
oner
s (F
T)
3,95
4 83
66
1
557
12
189
4 23
1
835
17
- -
4,78
9P
ract
ition
ers
(PT
) 79
5 88
9
1 67
7
33
4 4
0 11
3 12
-
- 90
8A
dmin
istr
ativ
e 1,
365
86
13
1 11
7 7
86
5 11
1
227
14
- -
1,59
2S
essi
onal
1,
446
80
36
2 22
8 13
76
4
24
1 36
4 20
-
- 1,
810
Stu
dent
s/ tr
aine
es
156
79
2 1
29
15
7 4
4 2
42
21
- -
198
Vol
unte
er
6,96
8 83
13
7 2
905
11
338
4 59
1
1,43
9 17
-
- 8,
407
TO
TAL
16,0
83
83
290
2 2,
078
11
776
4 12
9 1
3,27
3 17
-
- 19
,356
Am
alga
mat
ion
of d
ata
for
YO
Ts in
Eng
land
as
at 3
1.3.
06 a
nd fo
r Y
OTs
in W
ales
as
at 3
0.6.
06.
Not
e:
this
dat
a is
pre
sent
ed d
iffer
ently
from
ear
lier
publ
icat
ions
due
to c
hang
es in
dat
a co
llect
ion.
Sou
rce:
You
th J
ustic
e A
nnua
l Sta
tistic
s 20
05/0
6.
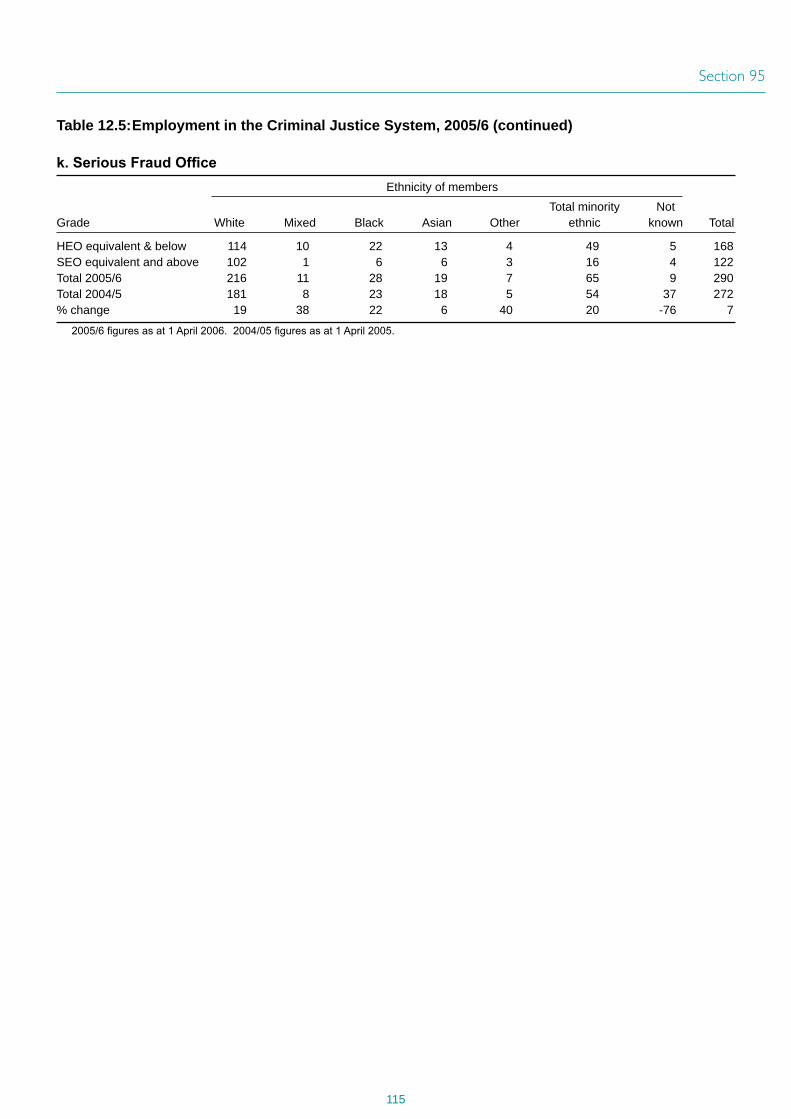
Section 95
115
Table 12.5: Employment in the Criminal Justice System, 2005/6 (continued)
k. Serious Fraud Office
Ethnicity of members
Total minority Not Grade White Mixed Black Asian Other ethnic known Total
HEO equivalent & below 114 10 22 13 4 49 5 168SEO equivalent and above 102 1 6 6 3 16 4 122Total 2005/6 216 11 28 19 7 65 9 290Total 2004/5 181 8 23 18 5 54 37 272% change 19 38 22 6 40 20 -76 7
2005/6 figures as at 1 April 2006. 2004/05 figures as at 1 April 2005.

Section 95
116
Section 95
117
Appendices
Appendix A1 Estimated population aged 10 and over by ethnic origin and police force area, mid-2005
Appendix A2 Estimated population aged 10 and over, percentage by ethnic origin and police force area, mid-2005
Appendix B Correspondence of ethnic classifications
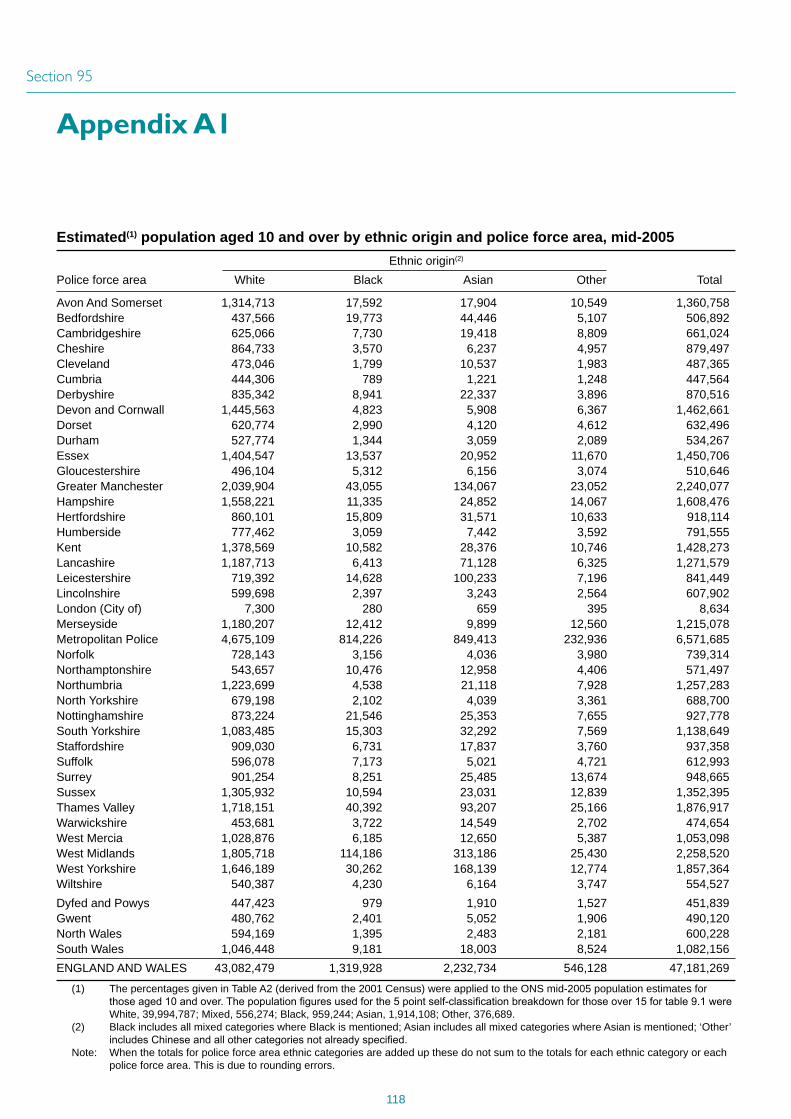
Section 95
118
Appendix A1
Estimated(1) population aged 10 and over by ethnic origin and police force area, mid-2005
Ethnic origin(2)
Police force area White Black Asian Other Total
Avon And Somerset 1,314,713 17,592 17,904 10,549 1,360,758Bedfordshire 437,566 19,773 44,446 5,107 506,892Cambridgeshire 625,066 7,730 19,418 8,809 661,024Cheshire 864,733 3,570 6,237 4,957 879,497Cleveland 473,046 1,799 10,537 1,983 487,365Cumbria 444,306 789 1,221 1,248 447,564Derbyshire 835,342 8,941 22,337 3,896 870,516Devon and Cornwall 1,445,563 4,823 5,908 6,367 1,462,661Dorset 620,774 2,990 4,120 4,612 632,496Durham 527,774 1,344 3,059 2,089 534,267Essex 1,404,547 13,537 20,952 11,670 1,450,706Gloucestershire 496,104 5,312 6,156 3,074 510,646Greater Manchester 2,039,904 43,055 134,067 23,052 2,240,077Hampshire 1,558,221 11,335 24,852 14,067 1,608,476Hertfordshire 860,101 15,809 31,571 10,633 918,114Humberside 777,462 3,059 7,442 3,592 791,555Kent 1,378,569 10,582 28,376 10,746 1,428,273Lancashire 1,187,713 6,413 71,128 6,325 1,271,579Leicestershire 719,392 14,628 100,233 7,196 841,449Lincolnshire 599,698 2,397 3,243 2,564 607,902London (City of) 7,300 280 659 395 8,634Merseyside 1,180,207 12,412 9,899 12,560 1,215,078Metropolitan Police 4,675,109 814,226 849,413 232,936 6,571,685Norfolk 728,143 3,156 4,036 3,980 739,314Northamptonshire 543,657 10,476 12,958 4,406 571,497Northumbria 1,223,699 4,538 21,118 7,928 1,257,283North Yorkshire 679,198 2,102 4,039 3,361 688,700Nottinghamshire 873,224 21,546 25,353 7,655 927,778South Yorkshire 1,083,485 15,303 32,292 7,569 1,138,649Staffordshire 909,030 6,731 17,837 3,760 937,358Suffolk 596,078 7,173 5,021 4,721 612,993Surrey 901,254 8,251 25,485 13,674 948,665Sussex 1,305,932 10,594 23,031 12,839 1,352,395Thames Valley 1,718,151 40,392 93,207 25,166 1,876,917Warwickshire 453,681 3,722 14,549 2,702 474,654West Mercia 1,028,876 6,185 12,650 5,387 1,053,098West Midlands 1,805,718 114,186 313,186 25,430 2,258,520West Yorkshire 1,646,189 30,262 168,139 12,774 1,857,364Wiltshire 540,387 4,230 6,164 3,747 554,527
Dyfed and Powys 447,423 979 1,910 1,527 451,839Gwent 480,762 2,401 5,052 1,906 490,120North Wales 594,169 1,395 2,483 2,181 600,228South Wales 1,046,448 9,181 18,003 8,524 1,082,156
ENGLAND AND WALES 43,082,479 1,319,928 2,232,734 546,128 47,181,269
(1) The percentages given in Table A2 (derived from the 2001 Census) were applied to the ONS mid-2005 population estimates for those aged 10 and over. The population figures used for the 5 point self-classification breakdown for those over 15 for table 9.1 were White, 39,994,787; Mixed, 556,274; Black, 959,244; Asian, 1,914,108; Other, 376,689.
(2) Black includes all mixed categories where Black is mentioned; Asian includes all mixed categories where Asian is mentioned; ‘Other’ includes Chinese and all other categories not already specified.
Note: When the totals for police force area ethnic categories are added up these do not sum to the totals for each ethnic category or each police force area. This is due to rounding errors.
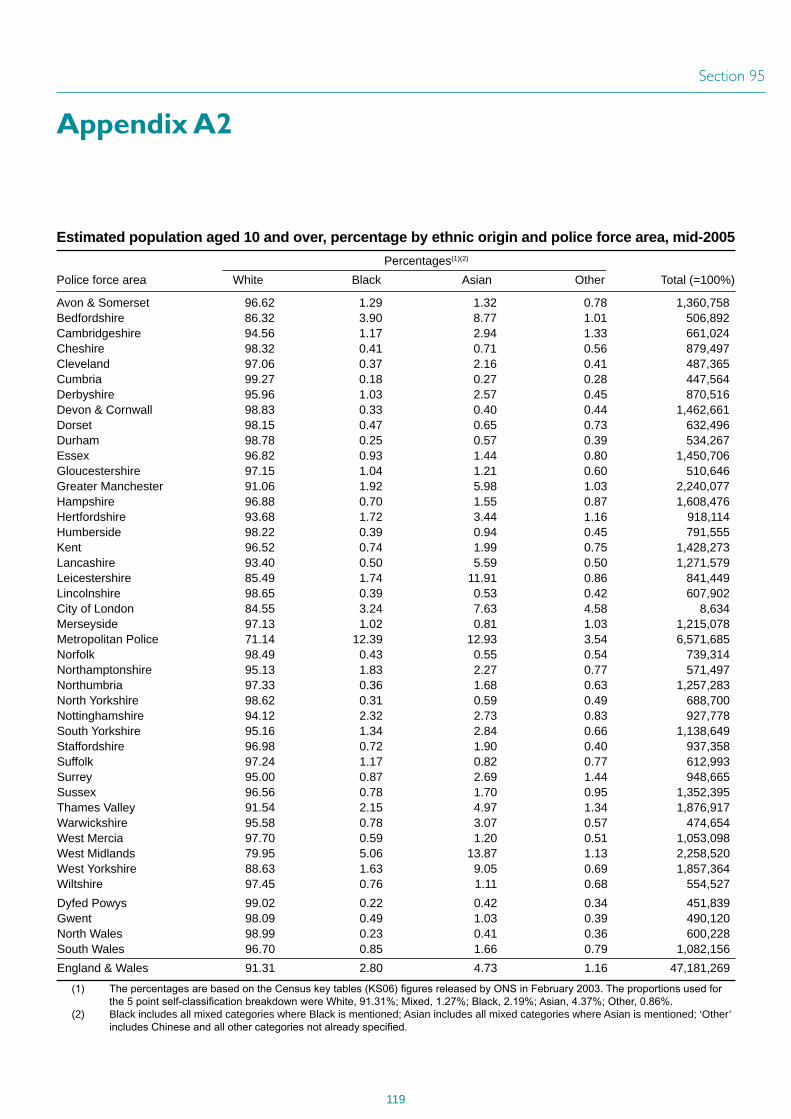
Section 95
119
Appendix A2
Estimated population aged 10 and over, percentage by ethnic origin and police force area, mid-2005
Percentages(1)(2)
Police force area White Black Asian Other Total (=100%)
Avon & Somerset 96.62 1.29 1.32 0.78 1,360,758Bedfordshire 86.32 3.90 8.77 1.01 506,892Cambridgeshire 94.56 1.17 2.94 1.33 661,024Cheshire 98.32 0.41 0.71 0.56 879,497Cleveland 97.06 0.37 2.16 0.41 487,365Cumbria 99.27 0.18 0.27 0.28 447,564Derbyshire 95.96 1.03 2.57 0.45 870,516Devon & Cornwall 98.83 0.33 0.40 0.44 1,462,661Dorset 98.15 0.47 0.65 0.73 632,496Durham 98.78 0.25 0.57 0.39 534,267Essex 96.82 0.93 1.44 0.80 1,450,706Gloucestershire 97.15 1.04 1.21 0.60 510,646Greater Manchester 91.06 1.92 5.98 1.03 2,240,077Hampshire 96.88 0.70 1.55 0.87 1,608,476Hertfordshire 93.68 1.72 3.44 1.16 918,114Humberside 98.22 0.39 0.94 0.45 791,555Kent 96.52 0.74 1.99 0.75 1,428,273Lancashire 93.40 0.50 5.59 0.50 1,271,579Leicestershire 85.49 1.74 11.91 0.86 841,449Lincolnshire 98.65 0.39 0.53 0.42 607,902City of London 84.55 3.24 7.63 4.58 8,634Merseyside 97.13 1.02 0.81 1.03 1,215,078Metropolitan Police 71.14 12.39 12.93 3.54 6,571,685Norfolk 98.49 0.43 0.55 0.54 739,314Northamptonshire 95.13 1.83 2.27 0.77 571,497Northumbria 97.33 0.36 1.68 0.63 1,257,283North Yorkshire 98.62 0.31 0.59 0.49 688,700Nottinghamshire 94.12 2.32 2.73 0.83 927,778South Yorkshire 95.16 1.34 2.84 0.66 1,138,649Staffordshire 96.98 0.72 1.90 0.40 937,358Suffolk 97.24 1.17 0.82 0.77 612,993Surrey 95.00 0.87 2.69 1.44 948,665Sussex 96.56 0.78 1.70 0.95 1,352,395Thames Valley 91.54 2.15 4.97 1.34 1,876,917Warwickshire 95.58 0.78 3.07 0.57 474,654West Mercia 97.70 0.59 1.20 0.51 1,053,098West Midlands 79.95 5.06 13.87 1.13 2,258,520West Yorkshire 88.63 1.63 9.05 0.69 1,857,364Wiltshire 97.45 0.76 1.11 0.68 554,527
Dyfed Powys 99.02 0.22 0.42 0.34 451,839Gwent 98.09 0.49 1.03 0.39 490,120North Wales 98.99 0.23 0.41 0.36 600,228South Wales 96.70 0.85 1.66 0.79 1,082,156
England & Wales 91.31 2.80 4.73 1.16 47,181,269
(1) The percentages are based on the Census key tables (KS06) figures released by ONS in February 2003. The proportions used for the 5 point self-classification breakdown were White, 91.31%; Mixed, 1.27%; Black, 2.19%; Asian, 4.37%; Other, 0.86%.
(2) Black includes all mixed categories where Black is mentioned; Asian includes all mixed categories where Asian is mentioned; ‘Other’ includes Chinese and all other categories not already specified.
Section 95
120
Appendix B
Correspondence of ethnic classifications
The two tables below give details of the different ways in which information on ethnicity is categorised by criminal justice agencies in England and Wales.
The first table presents categories used by the police when they visually identify someone as belonging to an ethnic group, e.g. at the time of a stop and search or an arrest. The second table gives the categories used by the 2001 census when individuals identify themselves as belonging to a particular ethnic group. It should be noted that the two table are not measuring the same dimensions.
The rows show how the categories in the different classifications of ethnicity correspond with each other. There is not necessarily a direct match in all cases.
The characters in brackets after the categories denote the codes used by practitioners within the Criminal Justice System, and are given to facilitate their understanding of how the categories are used. The code IC stands for ‘Identity Code’.
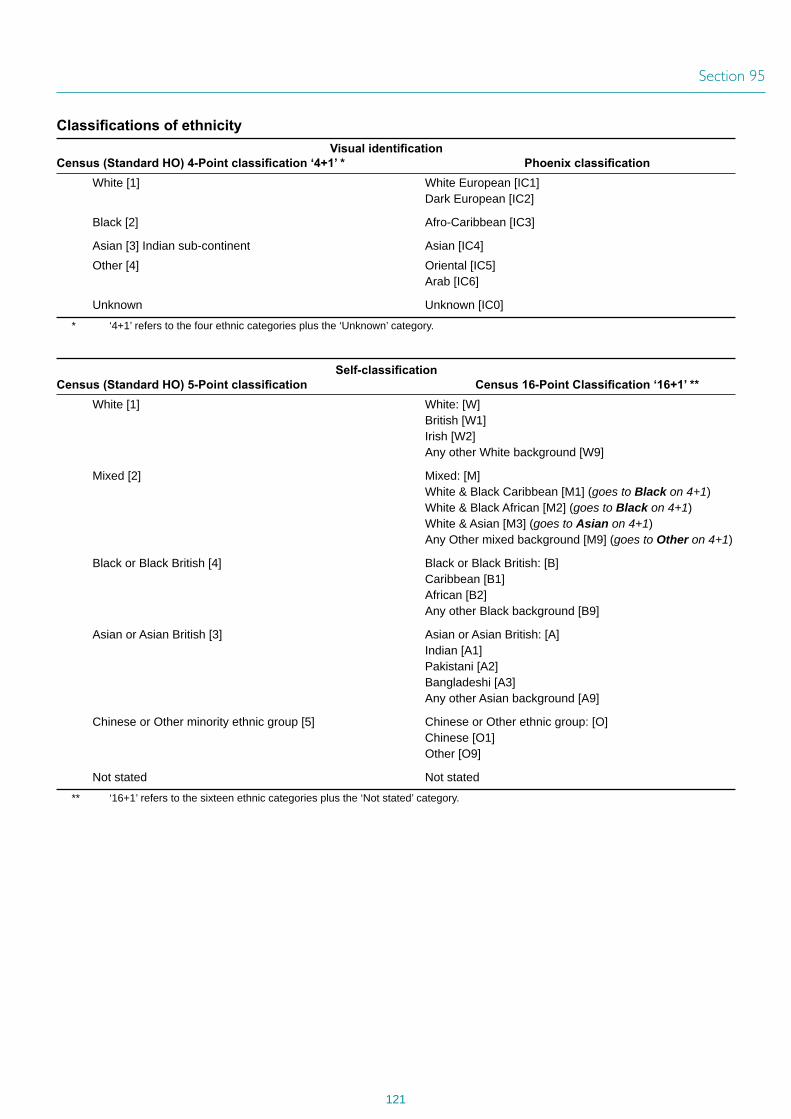
Section 95
121
Classifications of ethnicity
Visual identificationCensus (Standard HO) 4-Point classification ‘4+1’ * Phoenix classification
White [1] White European [IC1] Dark European [IC2]
Black [2] Afro-Caribbean [IC3]
Asian [3] Indian sub-continent Asian [IC4]
Other [4] Oriental [IC5] Arab [IC6]
Unknown Unknown [IC0]
* ‘4+1’ refers to the four ethnic categories plus the ‘Unknown’ category.
Self-classificationCensus (Standard HO) 5-Point classification Census 16-Point Classification ‘16+1’ **
White [1] White: [W] British [W1] Irish [W2] Any other White background [W9]
Mixed [2] Mixed: [M] White & Black Caribbean [M1] (goes to Black on 4+1) White & Black African [M2] (goes to Black on 4+1) White & Asian [M3] (goes to Asian on 4+1) Any Other mixed background [M9] (goes to Other on 4+1)
Black or Black British [4] Black or Black British: [B] Caribbean [B1] African [B2] Any other Black background [B9]
Asian or Asian British [3] Asian or Asian British: [A] Indian [A1] Pakistani [A2] Bangladeshi [A3] Any other Asian background [A9]
Chinese or Other minority ethnic group [5] Chinese or Other ethnic group: [O] Chinese [O1] Other [O9]
Not stated Not stated
** ‘16+1’ refers to the sixteen ethnic categories plus the ‘Not stated’ category.
Section 95
122
Bibliography
Bland, N., Miller, J. and Quinton, P. (2000) Upping the PACE? An evaluation of the recommendations of the Stephen Lawrence Inquiry on stops and searches, Police Research Series Paper 128. London: Home Office Police Research Group. Available at: http://www.homeoffice.gov.uk/rds/prgpdfs/prs128.pdf
Bonniface (2000) Stop and Search (unpublished).
Bowling, B. and Phillips, C. (2002) Racism, crime and justice. London: Longman.
Clancy, A., Hough, M., Aust, R. and Kershaw, C. (2001) Crime, Policing and Justice: the experience of ethnic minorities: Findings from the 2000 British Crime Survey. Home Office Research Study 223. London: Home Office Research Development and Statistics Directorate. Available at: http://www.homeoffice.gov.uk/rds/pdfs/hors223.pdf
Clark, I. and Moody, S. (2002) Racist Crime and Victimisation in Scotland. Crime and Criminal Justice Research Findings No. 58. Edinburgh: Scottish Executive Central Research Unit. Available at:http://www.scotland.gov.uk/cru/resfinds/crf58.pdf
Cotton, J. & Povey, D. (1997) Police Complaints and Discipline: England and Wales April 1996 to march 1997. Home Office Statistical Bulletin, Issue 21/97. London.
CPS (2006) Racist and Religious Incident Monitoring Annual Report 2005/06 Management Information Branch, Crown Prosecution Service.
CPS (2007) Equality and Diversity impact assessment of CPS Statutory Charging: England and Wales: for the period ending March 2006. By Yung Fang Chen and Chris Lewis, Institute of Criminal Justice Studies, University of Portsmouth.
Feilzer, M & Hood, R. (2004) Differences or Discrimination – Minority Ethnic Young People in the Youth Justice System, London: Youth Justice Board.
Fitzgerald, M. et al. (2002) Policing for London. Willand Publishing.
Fitzgerald, M. & Sibbitt, R. (1997) Ethnic Monitoring in Police Forces: A beginning Home Office Research Series, No. 173. Home Office, London.
Hallsworth & Mcguire (2004) Examining Stop and Search Patterns in the City of London (unpublished).
HMPS & CRE (2003) Implementing Race Equality in Prisons: A shared agenda for change. London: Her Majesties Prison Service & Commission for Racial Equality.
Home Office (2007) Crime in England and Wales 2006/7: Supplementary Volume No. 1, Home Office.
Jansson, K. (2006) Ethnicity and victimisation; findings from the 2004/5 British Crime Survey. Home Office.
Section 95
123
Jarman, N. (2002) Overview Analysis of Racist Incidents Recorded in Northern Ireland by the RUC 1996-1999. Belfast: The Office of the First Minister and Deputy First Minister, Research Branch. Available at:http://www.research.ofmdfmni.gov.uk/racistincidents/racistincidents.pdf
Johnston, L. (2005) ‘From “community” to “neighbourhood” policing: Police Community Support Officers and the “Police Extended Family” in London’, Journal of Community and Applied Social Psychology, 15, (2005): 241-254
Johnston, L. (2006) ‘Diversifying police recruitment? The deployment of Police Community Support Officers in London’, The Howard Journal of Criminal Justice 45, (4) pp. 388-402.
Macpherson of Cluny, Sir William. (1999). The Stephen Lawrence Inquiry. Cm 4262-I. Available at:http://www.archive.official-documents.co.uk/document/cm42/4262/4262.htm
Maynard, W. and Read, T. (1997) Policing racially motivated incidents, Crime Detection and Prevention Series Paper 84. London: Home Office, Police Research Group. Available at: http://www.homeoffice.gov.uk/rds/prgpdfs/fcdps84.pdf
Morgan, R. (2004) Towards Race Equality: Follow-up Inspection Report. London: HM Inspectorate of Probation. Available at: http://www.homeoffice.gov.uk/docs2/towardsraceequality04.pdf
Ministry of Justice (2007), Arrests for Notifiable Offences and the Operation of Certain Police Powers under PACE, England and Wales, 2005/6. Ministry of Justice Statistical Bulletin, London: Criminal Justice Evidence and Analysis Unit, Research Development and Statistics, Office for Criminal Justice Reform. Available at: http://www.justice.gov.uk/publications/statistics.html
Miller, J. et al. (2000) The Impact of Stops and Searches on Crime and the Community. Police Research Series paper 127, London: Home Office
MVA and Miller, J (2000) Profiling Populations Available for Stops and Searches. Police Research Series, Paper 131. London: Home Office.
Nicholas, S. et al. (2007) Crime in England and Wales 2006/07 4th Edition. Edited by Nicholas, S., Kershaw, C. and Walker, A. Home Office Statistical Bulletin. Home Office.
Salisbury, H. and Upson, A. (2004) Ethnicity, victimisation and worry about crime: findings from the 2001/02 and 2002/3 British Crime Survey. Home Office Research Findings No 237. London: Home Office Research Development and Statistics Directorate. Available at: http://www.homeoffice.gov.uk/rds/pdfs04/r237.pdf
Smith, G. (2000) Towards Race Equality. Thematic Inspection Report. London: HM Inspectorate of Probation. Available at: http://www.homeoffice.gov.uk/docs/hmiprobthematicracefulldoc.pdf
Stone, V. and Pettigrew, N. (2000) The Views of the Public on Stops and Searches, Police Research Series Paper 129. London: Home Office Police Research Group. Available at: http://www.homeoffice.gov.uk/rds/prgpdfs/prs129.pdf
Teers, R. & Menin, S. (2006) Deaths During or Following Police Contact: Statistics for England and Wales 2005/06. IPCC Research and Statistics Series: Paper 4

Section 95
124
Walker, A. et al. (2006) Crime in England and Wales 2005/2006 Home Office Statistical Bulletin, 12/06
Waddington, P., Stenson, K., & Don, D. (2004) In Proportion: Race and Police Stop and Search. British Journal of Criminology, 44(6): 889-914.
Young (1994) Policing the Street: Stops and Searches in North London
Section 95
125
Useful references
Barclay, G. and Mhlanga, B. (2000) Ethnic differences in decisions on young defendants dealt with by the Crown Prosecution Service, Section 95 Findings No 1. London: Home Office. Available at: http://www.homeoffice.gov.uk/rds/pdfs/sec95findings1.pdf
Burnett, R. and Farrell, G. (1994) Reported and unreported racial incidents in prisons. Occasional Paper No. 14. Oxford: University of Oxford, Centre for Criminological Research.
Bibi, N., Clegg, M. and Pinto, R. Police Service strength, England & Wales, 31 March 2005. Home Office Statistical Bulletin 12/05. London: Home Office Research Development and Statistics Directorate. 29 September 2004. Available at: http://www.homeoffice.gov.uk/rds/pdfs05/hosb1205.pdf
Coleman, K., Hird, C., Povey, D. and Bibi, N. (2006). Violent Crime Overview, Homicide and Gun Crime 2004/2005 (Supplementary Volume to Crime in England and Wales 2004/2005). Home Office Statistical Bulletin 02/06. London: Home Office Research Development and Statistics Directorate. Available at: http://www.homeoffice.gov.uk/rds/pdfs06/hosb0206.pdf
Cotton, J. (2004) Police Complaints and Discipline, England and Wales, 12 months to March 2004. Home Office Statistical Bulletin 17/04. London: Home Office Research Development and Statistics Directorate. 30 November 2004. Available at: http://www.homeoffice.gov.uk/rds/pdfs04/hosb1704.pdf
Councell, R. (2005) Offender Management Caseload Statistics 2004, England and Wales. Home Office Statistical Bulletin 17/05. London: Home Office Research Development and Statistics Directorate. December 2005. Available at: http://www.homeoffice.gov.uk/rds/pdfs05/hosb1705.pdf
CPS. (2005) Racist Incident Monitoring Annual Report 2004-2005. London: The Crown Prosecution Service. Available at: http://www.cps.gov.uk/publications/docs/rims04-05.pdf
Edgar, K. and Martin, C. (2004) Perceptions of race and conflict: perspectives of minority ethnic prisoners and of prison officers. Home Office Online Report 11/04. London: Home Office Research Development and Statistics Directorate. Available at: http://www.homeoffice.gov.uk/rds/pdfs2/rdsolr1104.pdf
Flood-Page, C., Campbell, S., Harrington, V. and Miller, J. (2000) Youth crime: Findings from the 1998/99 Youth Lifestyle Survey, Home Office Research Study 209. London: Home Office. Available at: http://www.homeoffice.gov.uk/rds/pdfs/hors209.pdf
Genders, E. and Player, E. (1989) Race Relations in Prison, Oxford: Clarendon Press.
Gleeson, E. & Bucke, T., (2006) Police Complaints: Statistics for England and Wales 2004/5, IPCC Research and Statistics Series: Paper 3. Available at: http://www.ipcc.gov.uk/index/resources/stats.htm.
Guessous, F., Hooper, N. and Moorthy, U. (2001). Religion in Prisons 1999 and 2000 England & Wales. Home Office Statistical Bulletin 15/01. London: Home Office Research Development and Statistics Directorate. Available at: http://www.homeoffice.gov.uk/rds/pdfs/hosb1501.pdf
Home Office (2000) Race equality in public services. London: Home Office
Section 95
126
Home Office (2000) Race equality: The Home Secretary’s Employment Targets. London: Home Office
Home Office (2004) Probation Statistics, England & Wales, 2002. London: Home Office Research Development and Statistics Directorate. Available at: http://www.homeoffice.gsi.gov.uk/rds/pdfs2/probation2002.pdf
Home Office (2004) Prisons and Probation Ombudsman for England and Wales: annual Report 2003-2004. (Cm 6256). London: Home Office. July 2004. Available at: http://www.ppo.gov.uk/annureps.htm
Home Office (2005) Sentencing statistics 2004. HOSB 15/05. London: Home Office
Hood, R.G. and Cordovil, G. (1992) Race and sentencing – A study in the Crown Court: report for the Commission for Racial Equality. Oxford & New York: Clarendon Press.
Hood, R. and Shute, S. (2000). The Parole System at work – a study of risk-based decision making. Home Office Research Study No 202. London: Home Office Research Development and Statistics Directorate. Available at: http://www.homeoffice.gov.uk/rds/pdfs/hors202.pdf
Independent Police Complaints Committee (2005) Making the New Complaints System Work Better: Statutory Guidance, London: IPCC.
John, G. (2003) Race for Justice: a review of CPS decision making for possible racial bias at each stage of the prosecution process – Executive summary. Rawtenstall, Lancashire: The Gus John Partnership Limited. Available at:http://ww.cps.gov.uk/home/CPSPublications/docs/racejustice.pdf
Leicester Ethnic Monitoring Project Board (2000) Ethnic appearance monitoring of defendants at Leicester Magistrates’ Court 1997-2000.
Mayhew, P. (2001) Review of information on homicide: a discussion document (provisional). London: Home Office Research Development and Statistics Directorate. December 2001. Available at: http://www.homeoffice.gov.uk/rds/pdfs/provhomicideinfo.pdf
Mhlanga, B. (1999) Race and Crown Prosecution Decisions. London: The Stationery Office.
Moorthy, U., Cahalin, H. and Howard, P. (2004) Ethnicity and parole. Findings 222. London: Home Office Research Development and Statistics Directorate. Available at: http://www.homeoffice.gov.uk/rds/pdfs2/r222.pdf
Nicholas, S., Povey, D., Walker, A. and Kershaw, C. (2005) Crime in England and Wales 2004/2005. Home Office Statistical Bulletin 11/05. London: Research Development and Statistics Directorate. Available at: http://www.homeoffice.gov.uk/rds/crimeew0405.html
Phillips, C. and Brown. D. (1998) Entry into the criminal justice system: a survey of police arrests and their outcomes, Home Office Research Study No 185. London: Home Office Research and Statistics Directorate. Available at: http://www.homeoffice.gov.uk/rds/pdfs/hors185.pdf
PLPU. (2004) Deaths during or following police contact: Statistics for England & Wales, April 2003 to March 2004. London: Home Office Police Leadership and Powers Unit. Available at: http://www.homeoffice.gov.uk/docs3/police_contact.pdf
Section 95
127
Probation Circular 83/2001 Race and ethnic classification system for the Criminal Justice System. London: Home Office National Probation Service, 21 May 2001.
Probation Circular 152/2001. Race and ethnic classification system for the Criminal Justice System: Implementation arrangements for the NPS. London: Home Office National Probation Service, 20 December 2001.
Probation Circular 12/2002 Race and ethnic classification system for the Criminal Justice System: Urgent advice London: Home Office National Probation Service, 21 February 2002.
Probation Circular 09/2004 Race and ethnic monitoring – Offender ethnicity data, London: Home Office National Probation Service, 30 January 2004. Available at: http://www.probation.homeoffice.gov.uk/files/pdf/PC09.pdf
Probation Circular 30/2004. Race and ethnic monitoring – Achieving quality data and effective implementation of 2001 16+1 Census categorisation. London: Home Office National Probation Service, 30 December 2004. Available at: http://www.probation.homeoffice.gov.uk/files/pdf/PC60.pdf
Safer Custody Group (2002) Safer Custody Report for 2001: self-inflicted deaths in Prison Service custody. London: HM Prison Service, Sager Custody Group.
Smith, G. (2003) Review of Shootings by Police in England & Wales from 1998 to 2001. House of Commons papers 2002-03. 313. London: The Stationery Office. 30 January 2003.
Statistics on Women (2003) Statistics on Women and the Criminal Justice System 2002. London: Home Office Research Development and Statistics Directorate. Available at: http://www.homeoffice.gov.uk/rds/pdfs2/s95women02.pdf
Statistics on Women (2004) Statistics on Women and the Criminal Justice System 2003. London: Home Office Research Development and Statistics Directorate. Available at: http://www.homeoffice.gov.uk/rds/pdfs2/s95women03.pdf
Woodcock, J., Maisels, J., Hudspith, D. and Irani, D. (2003) Deaths during or following police contact: Statistics for England & Wales, April 2002 to March 2003. London: Home Office Police Leadership and Powers Unit. Available at: http://www.homeoffice.gov.uk/docs2/deathpolcustody2002-2003.pdf
Youth Justice Board (2006) Youth Justice Annual Statistics 2004/5, London: Youth Justice Board. Available at: http://www.youth-justice-board.gov.uk/PractitionersPortal/PracticeAndPerformance/Performance/AnnualStatistics/
Section 95
128
Contact points
Any enquiries about the figures in this publication should be made to:
Alex JonesResearch, Development and StatisticsOffice for Criminal Justice ReformE-mail: [email protected]
Press enquiries should be made to:
Ministry of Justice Press OfficeCriminal Justice DeskTel 020 7210 8643Website: http://www.justice.gov.uk
Official publications on race and gender
England & WalesPublications under section 95 of the Criminal Justice Act 1991Race and the Criminal Justice System 1992, 1994, 1995 and 1997.Statistics on Race and the Criminal Justice System - 1998, 1999, 2000, 2002, 2003, 2004, 2005Race Equality –- The Home Secretary’s Employment Targets, 2005.Statistics on Women and the Criminal Justice System, 1999, 2000, 2001, 2002, 2003, 2004 and 2006
Publications are available from:The Home OfficeWebsite: http://www.homeoffice.gov.uk/rds/index.htm
ScotlandPublications are available from:The Scottish ExecutiveWebsite: http://www.scotland.gov.uk
Northern IrelandPublications are available from: Northern Ireland OfficeWebsite: http://www.nio.gov.uk