Human Rights Report 2014 on Indigenous Peoples in Bangladesh
Upload
khangminh22Category
view
2download
0
STATISTICAL POCKETBOOK
BANGLADESH 2014
BANGLADESH BUREAU OF STATISTICS
STATISTICS AND INFORMATICS DIVISION (SID)
MINISTRY OF PLANNING

Editorial Committee
Chairperson
Ms. Kaniz Fatema ndc
Secretary
Statistics and Informatics Division (SID) Ministry of Planning
Members
Mr. Mohammad Abdul Wazed : Director General
Mr. M Shafiqul Islam : Additional Secretary
Mr. Md. Baitul Amin Bhuiyan : Deputy Director General
Mr. M. A. Mannan Howlader : Additional Secretary (Development)
Ms. Salima Sultana : Director
Mr. Prodip Kumar Saha : Deputy Secretary
Mr. Ghose Subobrata : Director
Mr. Md. Moniruzzaman : Director
Mr. Jafor Ahmed Khan : Director
Mr. Md. Zahidul Hoque Sardar : Director
Mr. Md. Nazrul Islam : Director (In-charge)
Member Secretary
Mr. Abul Kalam Azad : Director

বাাংলাদেশ পরিসাংখ্যান
পদেট বই
2014
STATISTICAL POCKETBOOK BANGLADESH
2014
MAY 2015
BANGLADESH BUREAU OF STATISTICS
STATISTICS AND INFORMATICS DIVISION (SID), MINISTRY OF PLANNING GOVERNMENT OF THE PEOPLE'S REPUBLIC OF BANGLADESH
www.bbs.gov.bd

This book or any portion thereof cannot be copied, microfilmed or reproduced for commercial purposes. Data therein
can, however be used & published with acknowledgement of their sources.
Price: Taka 150.00 (Inland)
US $ 30.00(Overseas inclusive of
air mail postage)
ISBN-978-984-33-9598-6
Printed at
Bangladesh Bureau of Statistics
Statistics and Informatics Division(SID), Ministry of Planning

This book or any portion thereof cannot be copied, microfilmed or reproduced for commercial purposes. Data therein
can, however be used & published with acknowledgement of their sources.
COMPLIMENTARY
ISBN-978-984-33-9598-6
Printed at
Bangladesh Bureau of Statistics
Statistics and Informatics Division(SID), Ministry of Planning

Secretary Statistics and Informatics
Division (SID) Ministry of Planning
Government of Bangladesh
Foreword
Statistics itself provides us with a clear idea of a country or different phenomena through data and images as tables, charts and maps. All most all the aspects such as social, demographic, and economic etc. are covered by the official statistics. It is the only means of getting basic information for decision making, evaluations and assessment of success made in the development process at different levels. The demand for relevant, reliable, and accurate statistics, therefore, is increasing day by day. None can imagine a little advancement at national even at sub-national level unless updated statistical data are available. Moreover, these also facilitate comparisons between countries and regions, considering such importance of official statistics. Bangladesh has already been recognized as an active member of the global statistical community and especially as the pro-active participant of the UN Statistical Commission. Bangladesh Bureau of Statistics (BBS) has already enlarged the dimension of data collection for official statistics to some extents under the administrative support and guidance of the Statistics and Informatics Division (SID) of the Ministry of Planning.
In this context, I myself, thus, feel delighted to know that BBS is going to publish the 35th
issue of the Statistical Pocket Book of Bangladesh. It is worth mentioning that the publication would enrich and harmonize policy making process of the nation and it would, therefore, be a great endeavor on the way to create a prosperous digital Bangladesh. BBS has been experiencing in publishing such an annual publication since 1978. This publication comprises of fifteen chapters in a brief manner and provides most useful summary statistics on area, population, demographics, socio-economic characteristics of population, education, health, agriculture and other aspect of our country. To keep it handy the Pocket Book covers only some selected years and is limited only statistics most frequently sought after or referred to. For complete set of data, users can refer to the volume of Statistical Year Book of Bangladesh, 2014 which contains data in much detailed form. I like to convey thanks, with deep enthusiasm, to Mr. Mohammad Abdul Wazed, Director General of BBS and his colleagues for bringing out this valuable publication. I also appreciate the Joint Secretary and other colleagues in SID as well as the members of the Editors’ Forum for their meticulous and persistent labour in bringing out this publication.
I hope this publication will serve as a valuable source of information on a wide range of socio-economic and demographic issues to our public representatives, policy-makers, officials, planners, researchers, business community, students and all other data users.
Dhaka May 2015
Kaniz Fatema ndc Secretary

- 1 -
Director General Bangladesh Bureau of Statistics
Statistics and Informatics Division (SID) Ministry of Planning
Government of Bangladesh
Preface
The Statistical Pocketbook of Bangladesh is a regular publication of Bangladesh
Bureau of Statistics (BBS). This publication provides an overview of the most recent
and most pertinent annual data compiled on various socio-economic and
environmental situation of the country collected from various sources. In this concise
book information have been organized and updated under relevant chapters. Most of
the tables have data up to 2014. The tables of this pocketbook may also be found on
the BBS website at www.bbs.gov.bd.
I acknowledge with sincere gratitude for the valuable suggestions provided by the
Officials of SID during preparation of this publication. The members of the Editors’
Forum also deserve special thanks.
We welcome valuable comments and constructive suggestions for our users for
improvement of future issues.
Dhaka
May 2015
Mohammad Abdul Wazed
Director General
(Additional Secretary)
Bangladesh Bureau of Statistics

VII
CONTENTS Page
Chapter I
INTRODUCTION
1. An overview .......................................................................... .......... 3-6
2. Some selected basic facts about Bangladesh ................. ............... 7-13
3. Selected general information .........................................................
— Fundamental principles of state policy ....................................... 14
— Fundamental rights as provided by the constitution................. 15
— Fundamental foreign policy of Bangladesh ............................. 15
— Organs of the state ................................................................... 16
— The judicial system ................................................................... 17
4. Public administration ..................................................................... 18
5. The government ............................................................................. 19-20
6. Ministries and divisions of the government.................................. 21-22
7. Organizational setup of Bangladesh Bureau of Statistics (BBS) 23
8. The national statistical system ........................................................ 24-25
9. Investment scenario in Bangladesh................................................ 26-31
10. Board of Investment (BOI) ............................................................. 32-42
11. Privatization Commission of Bangladesh ...................................... 43-44
12. The Securities and Exchange Commission (SEC).................... 45-46
13. National Energy Policy (NEP) ........................................................ 46-47
14. Private sector power generation policy of Bangladesh................ 48-49
Chapter II
ENVIRONMENT
2.01 Storm warning signals in Bangladesh ............................................ 53-55
2.02 Wind-speed estimation over land in Bangladesh ........................... 56-57
2.03 Monthly total rainfall in Bangladesh........................................ ........ 58
2.04 Monthly average minimum temperature in Bangladesh................ 59
2.05 Monthly average maximum temperature in Bangladesh............... 60
2.06 Monthly average normal rainfall in Bangladesh in selected stations 61
2.07 Standard minimum normal temperature in Bangladesh ................. 62
2.08 Standard maximum normal temperature in Bangladesh ................ 63
2.09 Water level of major rivers at selected stations of
Bangladesh.......
64
2.10 Physiography of Bangladesh .......................................................... 65
2.11 Land type of Bangladesh ................................................................ 66 2.12 Agro-ecological zone of Bangladesh .......................................... 67

VIII
Chapter III
AREA, POPULATION, HOUSEHOLD AND HOUSING CHARACTERISTICS
3.01 Administrative units by zila, 2011 ................................................... 71-73
3.02 Zila-wise household and population of Bangladesh, 2011 ............ . 74-76
3.03 Household and population of municipalities, 2011 ........................ . 77-90
3.04 Household and population of statistical metropolitan areas in
Bangladesh...................................................................... .... ..........
91-93
3.05 Upazilla/thana-wise area, household and population of
Bangladesh, 2001 and 2011 ...........................................................
94-113
3.06 Percentage distribution of population by marital status and age
group .. ...........................................................................................
114
3.07 Mean age at marriage by sex, 1982 to 2011 .................................. 115
3.08 Crude death rate (CDR) by residence, 1996 to 2011 ..................... 116
3.09 Crude birth rate (CBR) by residence, 1996 to 2011 ....................... 116
3.10 Infant mortality rate (IMR) per 1000 live birth, 2005 to 2011 .......... 117
3.11 Natural growth rate (CBR-CDR) by residence, 2005 to 2011 ......... 117
3.12 Maternal mortality ratio (MMR) ,1998 to 2011 ................................ 117
3.13 Life expectancy at birth by sex ....................................................... 118
3.14 Abridged life table for Bangladesh population by sex, 2012 119
3.15 Ethnic household and population by zila, 2011.................... .......... 120-121
3.16 Disable person by type of household and disability, 2011… .......... 122
3.17 Intercensal growth rates of population, 1901-2011................ ........ 123
3.18 Disable person by age group and sex, 2011......................... ......... 124
3.19 Household reporting reading newspaper, listening radio,
watching television and using internet................................... ......
125
3.20 Household reporting latrine............. ............................................... 125
3.21 Household reporting source of light ................................................ 125
3.22 Household reporting cooking fuel .................................................. 125
3.23 Projected population by sex and urban and rural residence on
the assumption………………................................................ .........
126-128

IX
Chapter IV
LABOUR AND MANPOWER
4.01 Key findings of Labour Force Survey, 2010..................... ............. 131-135
4.02 Working age population by broad economic category............. ... . 136
4.03 Labour force aged 15 Years and over by administrative division . 137
4.04 Labour force aged 15 years and over by level of education ......... 138
4.05 Labour force participation rate by age group and sex........ .......... 139
4.06 Employed persons aged 15 years and over by major occupation 140
4.07 Growth rate of major occupation between, 2005-06 & 2010.... ... . 141
4.08 Average weekly hours by occupation of employed persons aged
15 years and above .............................................................. .......
141
4.09 Annual average growth rate of employed persons by .................. 142
4.10 Employed persons aged 15 years and over by average weekly
hours worked and industries.........................................................
143
4.11 Average weekly working hours of employed persons aged 15
years and over by status in employment .....................................
144
4.12 Day labourers by weekly income by sex..................................... ... 145-146
4.13 Salaried workers by monthly income by sex ................................ 147-148
4.14 Unemployment rate of population aged 15 years and over
by sex and residence ....................................................................
149
4.15 Youth labour force aged 15-29 years by broad economic category 149
4.16 Youth labour force aged 15-29 years by broad economic category 150
4.17 Youth labour force aged 15-29 years by division ........................... 150
4.18 Employed youths aged 15-29 years by major occupation .............. 151
4.19 Employed youths ages 15-29 years by status in employment 152
4.20 Comparative manpower statements of the ministries/division,
departments /directorates ...............................................................
153
4.21 Class wise number of female officers and staff.............................. 154
4.22 Class wise manpower of civil officers and staff .............................. 154
4.23 Overseas employment in 2014 ................................................. ...... 155-156
4.24 Category wise overseas employment ............................................ 157
4.25 Growth of RMG in Bangladesh................................................ ...... . 158

X
Chapter V
AGRICULTURE
5.01 Key findings of different Agriculture Censuses........................ 161-162
5.02 Land utilization statistics……………………………………........... 163
5.03 Acreage, production and yield rate of major agricultural crops 164
5.04 Acreage and production of minor cereals………………………… 165
5.05 Sowing and harvesting period of important crops ……………… 166
5.06 Production of fruits ................................................................ 167 5.07 Flowering and harvesting period of main fruits ......................... 167
5.08 Production of vegetables ....................................................... 168
5.09 Sowing and harvesting period of important vegetables ............. 169
5.10 Production of spices .............................................................. 169
5.11 Production of oilseeds ........................................................... 170
5.12 Production of pulses .............................................................. 170
5.13 Area irrigated by different methods ......................................... 171
5.14 Area irrigated under different crops ......................................... 171
5.15 Cold storage by location & capacity ......................................... 172
5.16 Forest lands under the control of forest department ................. 173
5.17 Output of forest products (reserve forest) ................................ 174
5.18 Output from farm forest .......................................................... 174
5.19 Forestation/plantation progress .............................................. 175
5.20 Species/group-wise annual fish production in inland and marine
fisheries, 2012-13..............................................
175
5.21 Internal procurement of food grain …………………. ................. 176
5.22 Public food distribution system .............................................. 176
Chapter VI
INDUSTRY
6.01 Indices of industrial production (manufacturing)…...... .................. . 179
6.02 Some productivity indices of industrial labour in selected................... 180
6.03 Production of selected industrial items .......................................... 181-182
6.04 Structure of jute manufacturing industry ......................................... 183
6.05 Production of jute goods in Bangladesh and India ........................ 183
6.06 Structure of cotton textile industry .................................................. 184
6.07 Production of natural gas, fertilizer and chemicals ......................... 184

XI
Chapter VII
ENERGY
7.01 Indicators of Energy Sector ............................................................ 187
7.02 Generation of electricity (Million KWH) by type of fuel ................... 188
7.03 Maximum generation for electricity ................................................ 188
7.04 Consumption of electricity by category ........................................... 189
7.05 Sector-wise number of consumers of rural electricity..................... 189
7.06 Sector-wise consumption (MWH) of rural electricity ..................... 190
7.07 Per capita electricity generation and consumption ......................... 190
7.08 Natural gas reserves and production in Bangladesh ...................... 191
7.09 Main natural gas transmission lines ............................................... 192
7.10 Category wise number of new gas connection................................. 193
7.11 Quantity and value of production of natural gas by gas fields 193
7.12 ERL production during last fure years ............................................ 194
7.13 Receved of petroleum product from deferent gas field ................. 195
7.14 Oil import bill (last five year) ........................................................... 196
7.15 Export performance last five years ................................................. 196
7.16 Sale of petroleum products last four year........................ ............... 197
7.17 Sector wise use of petroleum products last five years ................... 197
7.18 Import of coal and coke from some selected countries .................. 198
7.19 Consumption of commercial energy by major sources in trillion BTU 198
7.20 Consumption of commercial energy by major sources ..... ............ 198
7.21 Sector wise final consumption of commercial energy in trillion BTU 199
7.22 Sector wise final consumption of commercial energy .................... 199
7.23 Energy supplied by traditional fuels in the unorganized sectors ..... 200

XII
Chapter VIII
TRANSPORT AND COMMUNICATION
8.01 Transport, storage and communications............................ ......... 203-205
8.02 Length of RHD road network as per road type ............................ 205
8.03 Roads maintained by local government institutions .................... 206
8.04 Major road links between Dhaka to other districts ....................... 207-208
8.05 Bangladesh railway district wise .................................................. 209
8.06 Number of registered motor vehicles in Bangladesh ................... 210
8.07 Region wise Number of telephone ............................................. 210
8.08 Bangladesh bater stations and frequencies used ....................... 211-212
8.09 Bangladesh television stations and frequencies used ................. 213
8.10 Postal rates for selected countries (air mail) ............................... 213
8.11 Dredging activities by IWTA and BWDB .................................... 214
8.12 Number of hajis to Makkah from Bangladesh ............................. 214
8.13 Monthly arrival of tourists in Bangladesh .................................... 215
8.14 Passports issued ......................................................................... 215 Chapter IX
FOREIGN TRADE
9.01 Indicators of the foreign trade sector ........................................... 219 9.02 Balance of Payments .................................................................. 220 9.03 Foreign Trade ............................................................................. 221 9.04 Direction of Export (f.o.b.) by selected countries ......................... 222 9.05 Direction of Import (c.i.f.) by selected countries .......................... 223 9.06 Exports of principal commodities ................................................. 224 9.07 Imports (c.i.f.) by broad commodity groups ................................ 225-227 9.08 Quantity of export of selected items ............................................ 228 9.09 Quantity of import of selected items ............................................ 228 9.10 Exports by end use and institutional accounts ............................ 229 9.11 Imports by end use and institutional accounts ............................. 230 9.12 Export (f.o.b.) prices per unit of selected commodities.... ........... 231 9.13 Import (c.i.f.) prices per unit of selected commodities...... ........... 231 9.14 Unit price index of exports ........................................................... 232 9.15 Unit price index of import ..................... ....................................... 232 9.16 Export and import tonnage handled at the ports of Chittagong
and Mongla.................... ............................................................. 233
9.17 Quantity and value of jute goods and raw jute exported to foreign countries.................... .....................................................
233
9.18 Exports as a percentage of imports............................ ................ . 234 9.19 Export of primary and manufactured commodities ........ ............. 235 9.20 Export by traditional and non-traditional items ...... ..................... 236 9.21 Bangladesh export to SAARC countries ................. .................... 237

XIII
Chapter X
NATIONAL ACCOUNTS FINANCE AND BANKING
10.01 Indicators of National Accounts .............................................. 241-242
10.02 Gross Domestic Product, sectoral share and growth rate at
current prices by broad industry sector .
243 10.03 Gross Domestic Product, sectoral share and growth rate at
constant prices (2005-06) by broad industry sector ....................
244
10.04 Investment-GDP ratio................................................. ............... 245
10.05 Saving-GDP ratio (at current price) ............................................. 246
10.06 Gross National Products at current prices . .. 247
10.07 Sectoral shares of GDP at current prices..................................... 248 10.08 Gross National Products of Bangladesh at constant (2005-
06) prices .......................................................................
249-250
10.09 Sectoral shares of GDP at constant (2005-06) prices................... 251
10.10 Annual growth of GDP by sectors(2005-06) prices...................... 252
10.11 Expenditure based Gross Domestic Product at current prices.... 253
10.12 Expenditure based Gross Domestic Product at constant prices ... 254
10.13 Indicators of finance and banking ......................................... ... 255-256
10.14 Government resources by sources ............................................ 257
10.15 Consolidated receipts and expenditure ...................................... 258
10.16 Revenue receipts by principal heads.......................................... 259
10.17 Economic classification of revenue budgets............................... 260
10.18 Revenue expenditure by functions ............................................ 261
10.19 Development expenditure by sectors ........................................ 262 10.20 Economic classification of development expenditure by
investment and non investment .................................................
263
10.21 Government Gross Fixed Capital Formation................................ 264
10.22 Money supply and foreign exchange reserves............................ 265
10.23 Growth of bank credit and bank deposits.................................... 265
10.24 Bank advances by main economic purposes............................... 266
10.25 Division-wise distribution of bank deposit and advance.............. 266 10.26 Bank deposits and advances by selected zilawise urban areas
according to volume of transactions ..........................................
267
10.27 Advances classified by sector (all banks)..................................... 268
10.28 Commitment and disbursement of foreign aid .......................... 269
10.29 Commitment and disbursement of foreign aid by principal......... .. 270
10.30 Debt-service payments on foreign loans..................................... 271

XIV
Chapter XI
PRICES AND WAGES
11.01 Wage rate indices by major sector in Bangladesh ....................... 275
11.02 Annual average wholesale prices of selected consumer goods
in Dhaka .......................................................................................
276
11.03 Annual average retail prices of selected consumer goods ........... 277-285
11.04 Annual average price of jute and jute goods ................................ 286
11.05 Annual average price of hides, skins and tanned leather in Dhaka 287
11.06 Harvest time market price of agricultural crops ........................... 288-289
11.07 Prices of selected building materials in Dhaka .............. .............. 290
11.08 Daily average wage rates of selected industries workers in Dhaka 291
11.09 Daily average wages rates of construction labour in Dhaka ......... 292
11.10 Government procurement prices for rice, paddy, wheat and
sugarcane .....................................................................................
293
11.11 Consumer Price Index (CPI), national.............................. ............ 294
11.12 Consumer Price Index (CPI), all rural............................. .............. 295
11.13 Consumer Price Index (CPI), all urban ........................................ 296
11.14 Wage Rate Indices (WRI) of Bangladesh.............................. ....... 297 11.15 Consumer Price Index of industrial workers at Chittagong, Khulna
and Narayanganj ..........................................................................
298
11.16 Construction materials price indices in Bangaldesh.............. ....... 298
11.17 Indices of cost of building construction in Bangladesh, Barisal
Dhaka, Chittagong, Khulna, Rajshahi, Sylhet........... ......................
298-301
11.18 Index of Wholesale Price of agricultgural and industrial products 302 11.19 House rent indices for private residential house for different
centres in Bangladesh ..................................................................
303 Chapter XII
EDUCATION
12.01 Indicators of education system in Bangladesh ............................. 307
12.02 Number of primary level educational institutions, teachers and
students ........................................................................................
308
12.03 Number of secondary schools, teachers and enrolment ............. 309
12.04 Number of attached primary section, student and teacher ........... 310
12.05 Number of colleges type of management and sex ....................... 311
12.06 Results of Madrasha Education Board .......................... .............. 312 12.07 Number of sanskrit and pali tols with teachers and students ....... 312 12.08 Number of madrasha (Dhakil to Kamil) by type and sex .............. 313

XV
12.09 Board-wise number of students appeared and passed in SSC
examinations ..........................................................................
314
12.10 Board-wise number of students appeared and passed in HSC
examinations ..........................................................................
315
12.11 Results of technical education by group ................................. 316
12.12 Comparative statistics of JSC& JDC examination................. 317
12.13 Number of professional educational institution by type of
gender and management.................................................. .....
318
12.14 Number of teachers in teacher educational institution ........... 319
12.15 Number of institutions, teachers and enrolment by type ........ 320
12.16 Education and literacy rate ..................................................... 321
12.17 Literacy rates of population of 7 years and above by zila ....... 322-323
12.18 Number of students of public universities.... .......................... 324
12.19 Number of students of private universities......................... .... 325-327
Chapter XIII
HEALTH, FAMILY PLANNING AND SOCIAL STATISTICS
13.01 Indicators of the health and family planning sector............... 331-332
13.02 Primary healthcare centers run by DGHS at the upazila level 333
13.03 Distribution of secondary and tertiary public hospitals under
the DGHS by division………………………………. ................
334
13.04 Number of beds, admissions, hospital deaths, outdoor visits
and bed occupancy rate ................................................……
335-336 13.05 Distribution of family planning aids through government
programme ..........................................................................
337 13.06 Number of newspapers published.......................... ............ 337
13.07 Number of cinema halls and production of films by type ........ 338
13.08 Number of crime statistics............. ........................................ 339-340
13.09 Distribution of ever uses of contraceptives by age of woman
and method of contraceptive used........................................
341
13.10 Distribution of contraceptives uses of currently married women by age................................................ ...................
341
13.11 Contraceptive prevalence rate by method and residence ..... 342 13.12 Contraceptive prevalence rate by residence ........................ 342
13.13 Contraceptive uses trend by 2006-2012 ............................. 343

XVI
13.14 Contraceptive method mix with respect to modern method.... 343
13.15 Proportion morbidity and prevalence of morbidity per 1000
population......................................................................................
344
13.16 Proportion of persons reported morbidity of different ....... .......... 345
13.17 Proportion of treatments received by source of treatment ..... 345
13.18 Average expenditure per treatment recipient............................... 345
13.19 Distribution method of treatment by sex and residence HIES ..... 346
Chapter XIV
CONSUMPTION AND NUTRITION
14.01 Consumption and nutrition indicator ............................................ 349 14.02 Percentage distribution of income accruing to household in groups
(deciles) and Gini co-efficient HIES...................................
349 14.03 Nutrient contents of selected common food items of
Bangladesh .........................................................................
350-351 14.04 Nutrient contents of selected common food items of
Bangladesh ..........................................................................
352-355 14.05 National food balance of Bangladesh (per capita/day) .. ................. 356 14.06 Percentage distribution of women who have comprehensive
knowledge of HIV and AIDS........................................................
357 14.07 Immunization percentage of children aged 12-23 months
immunized against BCG, DPT 3, polio 3 and measles by sex and residence, 2008................................................ .
357 14.08 Percentage distribution of women aged,15-49 with a birth in the
two years preceding the survey, by type of personnel assisting with the delivery, Bangladesh............................... .......................
358 14.09 Percentage of women aged, 15-49 years with a birth................. . 359 14.10 Proportion of children under the age of five ............................... . 360 14.11 Prevalence of malnutrition by gomez classification by gender
and year .....................................................................................
360 14.12 Per capita day intake of major food item (in grams) by residence
HIES………………………………………………… ...........................
361 14.13 Anthropometry (Underweight, Standing, Wasting and
Obesity)findings among................................................. .................
363
14.14 Low MUAC among children aged 12-59 months by area of
residence and sex, 2005................................................ .................
363
14.15 Arsenic level in household drinking water........ ............................... 363
14.16 Disease control and healthy environment associations of child
nutritional status, 2005.................................... ................................
364
14.17 Mean age, weight, hight MUAC and BMI of non-pregnant mothers
by area of residence......................................... ..............................
365
XVII
14.18 Nutritional status of non-pregnant adolescent mothers by area of
residence, 2005........................................ ......................................
365
14.19 Maternal nutritional status by area of residence, 2005. .................. 366 14.20 Prevalence of moderate and severe malnutrition in children aged
<5 years by sex and area of residence ...........................................
367 14.21 Prevalence of malnutrition in children aged 5-59 months, 1985 to
2005.............................................................. ..................................
368 14.22 Nutritional status of non-pregnant adult mothers by area of
residence......................................................................... ...............
368 14.23 Prevalence of low birth weight by sex and division. ................... ..... 369
Chapter XV
INTERNATIONAL COMPARISONS
15.01 Estimation of mid year population of selected countries ................ 373
15.02 Estimates of world muslim population in 2011 ....................... 374-376
15.03 Basic economic indicators in selected countries ........................... 377
15.04 Basic social indicators in selected countries .................................. 378
15.05 Index number of agricultural production of some selected
countries ......................................................................................
379
15.06 Consumer Price Indices in selected countries/cities ............ 380-381
15.07 Retail Price Indices relating to living expenditures of United
Nations officials in selected countries ................................... .
382
15.08 World land utilization statistics .............................................. . 383
15.09 Selected foreign currency equivalent to Bangladeshi Taka 384

XVIII
Some Units of Measurement
1 maund = 82.29 lb = 37.3241 kg
1 kg = 1.0716916 seer = 2.2046226 lb.
1 acre = 0.404686 Hectare
1 bale of jute = 0.1814369 Metric Ton
1 crore = 10 million
1 lakh = 0.1 million
1 mile = 1.6093 Kilometre
1 kilometre = 0.6213712 mile
1 square mile = 2.589988 sq. kilometre
1 square kilometre = 0.3861022 sq. mile
Abbreviations and Notations
(...) = Nil or Insignificant
Sr. = Seer
Md. = Maund
MT = Metric Ton
Kg = Kilogram
Tk./tk. = Taka
(p) = Provisional
$ = U.S. Dollar
Lbs. = Pound (weight)
Cft. = Cubic feet
Sq. = Square
Yd. = Yard
(e) = Estimated
(r) = Revised
n.r. = Not reported
n.a. = Not available
BBS = Bangladesh Bureau of Statistics
H/H = Household
ERL = Eastern Refinery Ltd
RMG = Readymade Garments
HIES = House Hold Income & Expenditure Survey
BANBEIS = Bangladesh Bureau of Educational
Information and Statistics KWH = Kilowatt hours MWH = Megawatt hours MICS = Multiple Indicator Cluster Survey

1
1
Chapter I
INTRODUCTION

2

3
3
AN OVERVIEW General
Bangladesh emerged as an independent and sovereign country in
1971 following a nine-month‟s war of liberation. It is one of the largest
deltas of the world with a total area of 147,570 sq. km. With a unique
communal harmony, Bangladesh has a population of about 152.25
(million) as on July-2012 based on population Census making it one of
the densely populated countries of the world. The majority (about 88.8%)
of the people are Muslim & over 98% of the people speak Bangla.The
country is covered with a network of rivers and canals forming a maze of
interconnecting channels.
Being an active partner, Bangladesh plays a vital participatory role
in many international and regional forums, particularly in the UN,
Commonwealth and South Asian Association of Regional Cooperation
(SAARC).
History
Bangladesh has a glorious history and rich heritage. Once it was
known as „Sonar Bangla‟ or “The Golden Bengal”. The territory now
constituting Bangladesh was under Muslim rule for over five and a half
centuries from 1201 to 1757 AD. Subsequently, it came under British rule
following the defeat of the sovereign ruler, Nawab Sirajuddaula, at the
battle of Palassey on 23 June, 1757. The British ruled over the Indian
sub-continent including this territory for nearly 190 years from 1757 to
1947. During that period, Bangladesh was a part of the British Indian
provinces of Bengal and Assam. With the termination of British rule in
August 1947, the sub-continent was partitioned into India and Pakistan.

4
Bangladesh became a part of Pakistan and was called „East Pakistan‟. It
remained under Pakistani rule for about 24 years from August 14, 1947
to March 25, 1971.
Bangladesh was liberated on December 16, 1971 following its victory in
the War of Liberation and appeared on the world map as an independent
and sovereign country.
There is an elected single-house Parliament in Bangladesh, known
as the House of the Nation (Bangladesh Jatiya Sangshad), in which the
legislative power of the Republic is vested. The Speaker presides over
the Parliament. The Prime Minister is the leader of the House, who is
also the Head of the Government, while the President is the Head of the
State. Bangladesh has a general election every five years .
Foreign policy marked by the State shall base its international
relations on the principles of respect for national sovereignty and
equality, non-interference in the internal affairs of other countries,
peaceful settlements of international disputes, and respect for
international law and the principles enunciated in the United Nations
Charter.
Culture
Bangladesh is heir to a rich cultural legacy. In two thousand or
more years of its chequered history, many illustrious
dynasties of kings and Sultans (Muslim Kings) ruled the country and
have left their mark in the shape of magnificent cities and monuments.
Apart from this, the century old cultural tradition can be observer in
innumerable tangible and intangible heritages in archaeological sites,
sculptures, stones and terracotta, architectures, museums, archives,
libraries, classical music, songs and dance, paintings, dramas, folk arts,
festivals, games as well as also in ethnic cultural activities.
5
5
The people of Bangladesh are very simple and friendly. Sound
communal harmony among the different religions in this country has
ensured a very congenial atmosphere. More than 75% of the population
live in rural areas. Urbanisation has, however, been rapid in the last few
decades.
Economy
Bangladesh has an agrarian economy, although the share of
agriculture to GDP has been decreasing over the last few years. Yet it
dominates the economy accommodating the major rural labour force.
From a marketing point of view, Bangladesh has been following a mixed
economy that operates on free market principles.
Health system in Bangladesh
Bangladesh has made significant progress in recent times in
many of its social development indicators particularly in the health sector.
The country has made important gains in providing primary health care
since the Alma Ata Declaration in 1978. Health indicators show steady
gains in many respects and the health status of the population has
improved. Infant, maternal and under-five mortality rates have all
decreased over the last decades, with a marked increase in life
expectancy at birth. It has achieved a credible record of sustaining 90%
plus vaccine coverage in routine EPI along with NIDs (National
Immunizations Days) since 1995. But some of this progress is uneven
and there still exists inequalities between different groups and
geographical regions. A major constraint identified towards reaching the
MDGs and other national health goals is shortages in the health
workforce and the uneven skill mix. Like most transitional societies, a
wide range of therapeutic choices are available in Bangladesh, ranging
from self- care to traditional and western medicine. The public sector is

6
largely used for in-patient and preventive care while the private sector is
used mainly for outpatient curative care. Primary Health Care (PHC) has
been chosen by the Government of Bangladesh as a strategy to achieve
the goals of “Health for All” which is now being implemented as
Revitalized Primary Health Care. In Bangladesh, the status of healthcare
is similar to many developing countries: medical practitioners in
Bangladesh often operate in relative isolation, dealing with diverse health
care needs. Tertiary care hospitals are also concentrated within the
capital and few other major cities.
Forest
Of the total area of Bangladesh, agricultural land makes up 65%
of its geographic surface, forest lands account for almost 17%, while
urban areas are 8% of the area. Water and other land use account for
the remaining 10%. The total forestland includes classified and
unclassified state lands and homestead forests and tea/rubber gardens.
The Hill Forest is mainly situated in Khagrachari, Bandarban and Sylhet.
The total area of the Hill Forest is 670,000 hectare which accounts for
44% of the total area managed by the Forest Department and is 4.54% of
total area of Bangladesh. Sundarban, the world‟s largest contiguous
natural mangrove forest in Bangladesh covers an area of 6,017 sq. km
which accounts for 4.07% of total area of Bangladesh and 40% of total
area managed by the Forest Department. The Forestry sector contributes
about 2% of the total GDP (Gross Domestic Product) of Bangladesh.
About 2% (two percent) of the total manpower of the country is engaged
in the forestry sector.

7
7
SOME SELECTED BASIC FACTS ABOUT BANGLADESH
1. Official Name: The People‟s Republic of Bangladesh 2. State Religion: Islam but other main religions namely
Hinduism, Buddhism, Christianity are practised in peace and harmony.
3. State Language: Bangla. 4. National Anthem: The first ten lines of “ Amar Sonar
Bangla”. written by Nobel Laureate Rabindranath Tagore.
5. National Flag: Consists of a circle coloured red throughout its area, resting on a green rectangular background. The length to width ratio of the rectangle is 10:6 and the circle has a radius of one fifth of the length.
6. National Emblem: The national flower "Shapla" (nymphea-nouchali) resting on water,
having on each side an ear of paddy and being surmounted by three connected leaves of jute with two stars on each side of the leaves.
7. Capital: Dhaka
8. Nationality: Bangladeshi
9. Name of Currency: Taka (TK), Denominations: Notes:Taka 1000,500,100,50,20,10,5,2&1 Coins: Taka 5, 2,1 and Paisa 50, 25, 10,
5, 2 &1 10. Geographical Location: Between 20
o 34' and 26
o38' north
latitude and between 88o01' and 92
o41'
east longitude.
11. Boundary: North: India West: India South: Bay of Bengal East: India and Myanmar
12. Area: 56977 sq. miles or 147570 sq. km.
13. Territorial Water: 200 nautical miles.

8
14. (a) Administrative and other units:
Units Number Average Population,2011
In thousand (Enumerated) Division 7 24007.28
Zila 64 2250.68
Thana/Upazila 544 264.79 Union 4543 31.71 Mouza 56348 2.56 Household 32173630 4.44(nos.) Source: BBS
(b) Administrative units as on 31st December, 2014
Units Number
Division 7 Zila 64 City Corporation 11 Municipalities 324 Upazila 487 Thana 624 Union 4500 Source: LGRD & Ministry and police headquarters.
15. (a) Population data as per SVRS Report (in million) 1
st July-10 1
st July 2011 1
st July 2012
Total 148.6 150.6 152.7 Male 76.1 77.1 78.2 Female 72.5 73.5 74.5 Urban 38.5 39.0 41.7 Rural 110.1 110.9 111.6 Annual Growth Rate 1.36 1.37 1.36 Sex ratio (males per 100 females) 105.0 104.9 104.9 Density (per sq. km) 1007 1021 103.5 Life expectancy at birth: Both sex 67.7 69.0 69.4 Male 66.6 67.9 68.2 Female 68.8 70.3 70.7 (b) Projected Population (million) July, 2011 July 2015 July 2019 Total 151.41 158.96 167.37 Male 77.85 81.63 85.86 Female 73.56 77.33 81.51 Sex ratio: (males per 100 females) 106.00 106.00 105.34

9
9
16. Population of City Corporations: 2006
2007
2008 (Estimated)
Dhaka 6475252 6732968 7000940
Chittagong 2438403 2532421 2579107
Khulna 830454 842995 855650
Rajshahi 447031 459682 472775
Barisal 205166 195955 210374
Sylhet 394119 427265 463198
17. Main Seasons : Summer (March-May), Rainy Season (June-September) and Winter (December-February)
18. Climatic Variations (Average):
Season Temperature Rainfall Relative
Humidity maximum minimu
m
Pre Monsoon 32.6oC 22.4
oC 453 mm 74%
Monsoon 31.5oC 25.5
oC 1733 mm 86%
Post Monsoon 30.5oC 21.4
oC 210 mm 80%
Winter 26.5oC 13.9
oC 44 mm 73%
Annual 30.4oC 21.2
oC 203 mm 78%
19. Standard Time : GMT+6 hours
20. Principal Rivers : Padma, Meghna, Jamuna, Brahmaputra,
Teesta, Surma and Karnaphuli
(Total 310 rivers including tributaries)
21. Principal Seasonal
Crops and Fruits : Paddy, jute, wheat, tobacco, pulses, oil
seeds, spices, vegetables, jack-fruit, banana
mango, coconut.

10
22. Principal Industries: Readymade garments, textiles, chemical fertilizers, pharmaceuticals, tea processing, paper & Newsprints, cement, light engineering, sugar, leather goods etc.
23. Principal Minerals: Natural gas, Coal, Lime, White clay, Glass sand.
24. Principal Exports: Readymade garments & knitwear, frozen fish, jute & jute goods, pharmaceutical products, tea, leather products, handicrafts, chemicals.
25. Ports: Sea ports: Chittagong and Mongla. Inland river ports: Dhaka,Chandpur, Barisal, Khulna, Baghabari,Narayanganj, Bhairab Bazar, Ashuganj.
26. Airports: International: Dhaka, Chittagong and Sylhet. Domestic: Dhaka, Chittagong, Jessore, Sylhet, Cox's Bazar, Sayedpur, Rajshahi and Barisal.
27. Landports: Benapole, Teknaf, Banglabandha, Sonamasjid,Nakugaon, Bilonia, Hilli, Darshana, Birol, Burimari, Tamabil, Haluaghat, Akhaura, Bibirbazar, Bhomra, Gobrakora & Karaitoli.
28. Radio Stations: Dhaka, Chittagong, Khulna,Rajshahi, Rangpur, Sylhet, Rangamati, Comilla and Thakurgaon. Broadcasting Programmes (languages): Bangla, English, Urdu, Hindi, Arabic and Nepali.
29. Television Stations: Dhaka, Chittagong. Relay Stations : Chittagong, Sylhet, Khulna, Natore,
Mymensingh, Rangpur, Noakhali, Satkhira, Cox's Bazar, Rangamati and Thakurgaon.
30. Television Channels:
Terrestrial: BTV. Satellite: BTV-World, Channel-I, NTV, ATN Bangla, RTV, Bangla Vision, Boishakhi TV, Islamic TV, Desh TV, ETV, Diganto TV, Masranga TV, Bijoy TV, Mohona TV, Chanel 9,ATN News, Independent TV, Somoy TV, Sangsad TV, GTV, Chanel 24, Ekattor TV, SATV & Asian TV.

11
11
31.A Educational institutions: 2011 2012 2013
Public Universities 34 34 34
Private Universities 52 60 77
Govt. Medical colleges 21 23 23
Private Medical colleges 42 48 54
General Colleges 3475 3547 3793
Govt. Polytechnic Institutes 46 46 46
Private Polytechnic Institutes 125 172 224
Secondary Schools 15391 15581 15951
Govt. Secondary Schools 306 308 317
Primary Schools 78685 104017 106859 Source: University Grants Commission & BANBEIS.
31. B Educational enrolments: 2011 2012 2013
Public University enrolment 2170472 1890543 2020549
College enrolment 2915851 3044320 3194787
Secondary School enrolment 7510218 7937235 8501442
Primary School enrolment 16955789 19003210 19584972 Source: BANBEIS,
32. Health Facilities : 2011 2012 2013
Hospitals *(Govt & nongovt Reg with
DGHS)
3084 3549 4169
Hospital beds 81876 95103 91106
Persons per hospital bed 1340 1574 1699
Registered physicians 53063 58977 64434
Persons per physicians 2682 2586 3297 Note: *(Including 402 Upazila Health Complex and Rural Health Complex)
Latest data are not available from respective sources. Source: DG HS.

12
33. Gross Domestic Product (GDP ) (Base : 2005-06)
2011-12 2012-13 2013-14(p)
Current price (billion taka ) 10552 11989 13509 Constant price (billion taka) 6885 7299 7745 Per capita GDP (in taka) Current price 69614 78009 86731 Constant price 45421 47491 49726 Per Capita GDP (in US$) Current price 880 976 1115 Constant price 574 594 640 Per Capita Income at Current Price in taka 75505 84283 92510 in US$ 955 1054 1190 Implicit GDP deflator 153.26 164.26 174.42 Real GDP growth (%) 6.52 6.01 6.12 34. Electricity 2011-12 2012-13 2013-14 Per capita Generation (KWH) 211.86 231.65 - Per capita Consumption (KWH) 180.08 197.72 -
35. Energy production index (Base: 1988-89=100)
Electricity 512 - - Natural gas 506 - - 36. Industrial production index
(manufacturing) (Base: 1988-89=100)
621
- -
37. Consumer Price Indices (Base: 2005-06=100)
National 170.19 181.73 195.08 All Urban 164.52 177.71 191.73 All Rural 173.26 183.90 196.90
38. Money and Credit (billion Taka)
2009-10 2010-11 2011-12 2012-13 2013-14
Money supply (Narrow) 879.88 1031.01 1097.21 1236.03 1416.45
Money supply (Broad) 3630.31 4405.20 5171.10 6035.05 7006.23 Scheduled Banks time deposits
2750.43 3374.19 4073.88 4799.02 5589.78
Note: (P)=Provisional.

13
13
39. Govt. finance (billion Taka) 2011-12 2012-13 2013-14
Revenue receipt 1183.85 1281.28 1566.71
Revenue expenditure 1029.03 1232.37 1550.28
Public sector development expenditure 348.50 500.35 520.00
Foreign exchange reserve (million US $) 10364.4 15315.20 21508.00
40. Foreign Direct investment (FDI)inflows
(In million uss)
2011-12 2012-13 2013-14
Equity Capital 454.10 761.03 270.59
Re-invested Earnings 542.35 645.64 795.81
Intra-company Loans 198.43 323.96 429.10
Total 1194.88 1730.63 1495.50
41. Foreign trade (billion Taka) (billion US $) 2005-06 Export (fob) 691.95 10.3
Import (cif) 962.34 14.3
2006-07 Export (fob) 850.31 12.3
Import (cif) 1118.66 16.2
2007-08 Export (fob) 963.79 14.05
Import (cif) 1496.72 21.82
2008-09 Export (fob) 974.98 14.17
Import (cif) 1548.23 22.50
2009-10 Export (fob) 1021.48 14.77
Import (cif) 1642.41 23.74
2010-11 Export (fob) 1444.31 20.29
Import (cif) 2400.28 33.73
2011-12 Export (fob) 1803.13 22.80
Import (cif) 2809.63 35.52
2012-13 Export (fob) 1894.37 24.36
Import (cif) 2707.76 34.82
Source: Economic TrandsBangladesh Bank .

14
FUNDAMENTAL PRINCIPLES OF STATE POLICY
(1) The principles of nationalism, socialism, democracy and
secularism, together with the principles derived from those as set out in this
Part, shall constitute the fundamental principles of state policy.
(2) The principles set out in this Part shall be fundamental to the
governance of Bangladesh, shall be applied by the State in the making of
laws, shall be a guide to the interpretation of the Constitution and of the other
laws of Bangladesh, and shall form the basis of the work of the State and of
its citizens, but shall not be judicially enforceable.
These principles are expressed as follows :
- Promotion of local government institutions.
- Participation of women in national life.
- Democracy and human rights.
- Principles of state, co-operative and private ownership.
- Emancipation of peasants and workers and backward sections of the
people from all forms of exploitation.
- Provision of basic necessities of life.
- Rural development and agricultural revolution.
- Free and compulsory education and removing illiteracy.
- Improvement of public health and morality.
- Ensuring equality of opportunity.
- Work as a right and duty for every able citizen.
- Duties of the citizens to observe the Constitution and the laws
- Public servants to serve the people.
- Separation of the judiciary from the executive.
- Enrichment of the national culture.
- Protection of national monuments, objects or places of special artistic
or historic importance or interest.
- Promotion of international peace, security and solidarity and
consolidation.
- Preservation and strengthening fraternal relations among Muslim
countries.

15
15
FUNDAMENTAL RIGHTS AS PROVIDED
BY THE CONSTITUTION
- Equality of all citizens before law. - No discrimination against any citizen on grounds of religion, race,
sex or place of birth. - Equal rights of women with men. - Equality of opportunity in public employment. - Prohibition of foreign titles etc. - Right to protection of law. - Protection of right to life and personal liberty. - Prohibition of forced labour. - Safeguards as to arrest and detention. - Protection in respect of trial and punishment. - Freedom of movement, assembly, association, thought and con-
science and of speech, profession or occupation, lawful trade or business and religion.
- Rights to property. - Protection of the privacy of home and correspondence. - Enforcement of fundamental rights through courts of law. - Laws and enactments inconsistent with fundamental rights are void.
FUNDAMENTAL FOREIGN POLICY OF BANGLADESH
1) The State shall base its international relations on the principles of respect for national sovereignty and equality, non-interference in the internal affairs of other countries, peaceful settlements of international disputes, and respect for international law and the principles enunciated in the United Nations Charter, and on the basis of those principles shall-
a) Strive for the renunciation of the use of force in international
relations and for general and complete disarmament; b) Uphold the right of every people freely to determine and build up
its own social, economic and political system by ways and means of its own free choice; and
c) Support oppressed peoples throughout the world waging a just struggle against imperialism colonialism or racialism.
2) The State shall endeavor to consolidate, preserve and strengthen fraternal relations among Muslim countries based on Islamic solidarity.

16
ORGANS OF THE STATE
The Republic comprises of three basic organs: (1) The Legislature,
(2) The Judiciary and (3) The Executive.
The President of Bangladesh is elected by the members of
Parliament in accordance with law. The President, as Head of State,
takes precedence over all other persons in the State, and exercises the
powers and performs the duties conferred and imposed on him by the
constitution and by any other law. The President acts in accordance with
the advice of the Prime Minister, save only that of appointing the Prime
Minister and the Chief Justice. The supreme command of the defence
services vests in the President.
The President holds office for a term of five years from the date on
which he enters upon his office. No person can hold office as President
for more than two terms, whether or not the terms are consecutive.
If a vacancy occurs in the office of President or if the President is
unable to discharge the functions of his office on account of absence,
illness or any other cause the Speaker of the Parliament discharges
those functions until a President is elected or until the President resumes
the functions of his office.
There shall be a Cabinet for Bangladesh having the Prime Minister at
its head and comprising also such other Ministers as the Prime Minister
may from time to time designate. The executive power of the Republic is
exercised by or on the authority of the Prime Minister.
The President appoints as Prime Minister the member of Parliament
who appears to him to command the support of the majority of the
members of Parliament. The appointment of Prime Minister and other
Ministers and of the Ministers of State and Deputy Ministers is made by
the President provided that not less than nine-tenths of their number are
appointed from among members of parliament and not more than one-
tenth of their number may be chosen from among persons qualified for
election as members of Parliament.
The legislative powers of the Republic vest in the Parliament, which
consists of three hundred members, designated as members of
parliament, elected by direct election. However, presently there are fifty
reserved seats exclusively for women members to be elected by the
aforesaid members on the basis of procedure of proportional
representation in the Parliament.
No War can be declared and the Republic can not participate in any
war except with the assent of Parliament.

17
17
THE JUDICIAL SYSTEM
The Supreme Court of Bangladesh is the highest judicial organ in the
country which comprises of the Appellate Division and the High Court Divi-
sion. The Supreme Court consists of the Chief Justice and a number of
other judges. The Chief Justice and the judges appointed to the Appellate
Division sit only in that Division and other judges sit in the High Court
Division.
The Chief Justice and other Judges are appointed by the President. A
Judge holds office until he attains the age of sixty seven years. The
Appellate Division hears and determines appeals from judgments,
decrees, orders or sentences of the High Court Division. The High Court
Division has superintendence and control over all subordinate courts and
functions as the Appellate Court. There are some other special Courts,
such as Labour court, Juvenile Court, Administrative Tribunal etc.
At the district level, the district court is headed by the District and
Sessions Judge who is assisted by Additional District Judges, Chief
Judicial Magistrate and Other Judicial Magistrates, Joint District Judges
and Assistant Judges.

18
PUBLIC ADMINISTRATION
Bangladesh has a unitary form of government. The President is the
Head of State and the Prime Minister is the Head of Government. The
Prime Minister is assisted by a Council of Ministers. The permanent officer-
in-charge of the Ministries/Divisions is designated as Secretary who
belongs to the Civil Service. A list of the Ministries/Divisions is given at
page 21.
For administrative purposes, the country is divided into Seven
divisions, each headed by a Divisional Commissioner. There are 64
Districts under the 7 Divisions. The district is administered by a Deputy
Commissioner who is assisted by Additional Deputy Commissioners. The
Districts are divided into Upazilas headed by a Upazila Nirbahi Officer.
Currently, there are 487 Upazilas.
The head of the police administration is the Inspector-General of Police
(IGP). The divisional police administration is headed by the Deputy
Inspector General of Police and the district police-administration by the
Superintendent of Police and there is an Inspector of Police in each Thana.
The Superintendents of Police and the Inspectors of Police work in close
co-operation with the Deputy Commissioners and Upazila Nirbahi Officers
for maintenance of law and order under their respective jurisdictions. The
chief police officers in Dhaka, Chittagong, Khulna, Rajshahi, Barisal, Sylhet
and Rangpur cities are designated as Metropolitan Police Commissioner.
19
19
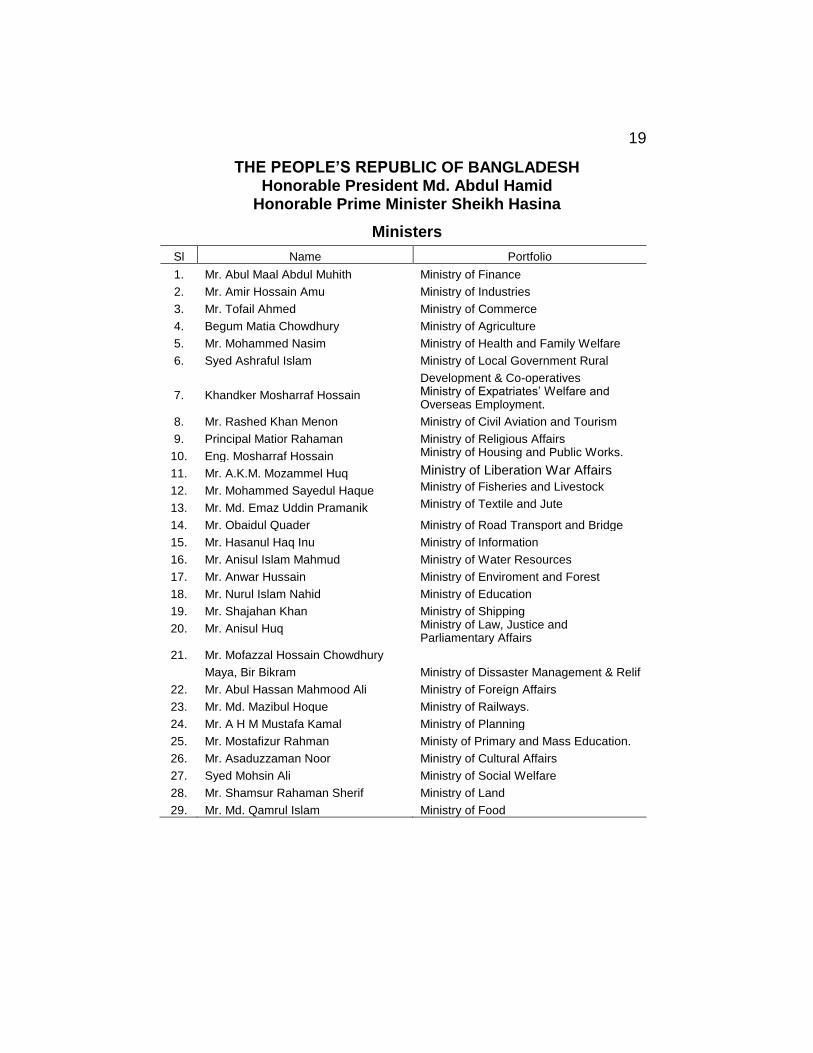
THE PEOPLE’S REPUBLIC OF BANGLADESH Honorable President Md. Abdul Hamid
Honorable Prime Minister Sheikh Hasina
Ministers
Sl Name Portfolio
1. Mr. Abul Maal Abdul Muhith Ministry of Finance
2. Mr. Amir Hossain Amu Ministry of Industries
3. Mr. Tofail Ahmed Ministry of Commerce
4. Begum Matia Chowdhury Ministry of Agriculture
5. Mr. Mohammed Nasim Ministry of Health and Family Welfare
6. Syed Ashraful Islam Ministry of Local Government Rural
Development & Co-operatives
7. Khandker Mosharraf Hossain Ministry of Expatriates‟ Welfare and Overseas Employment.
8. Mr. Rashed Khan Menon Ministry of Civil Aviation and Tourism
9. Principal Matior Rahaman Ministry of Religious Affairs
10. Eng. Mosharraf Hossain Ministry of Housing and Public Works.
11. Mr. A.K.M. Mozammel Huq Ministry of Liberation War Affairs
12. Mr. Mohammed Sayedul Haque Ministry of Fisheries and Livestock
13. Mr. Md. Emaz Uddin Pramanik Ministry of Textile and Jute
14. Mr. Obaidul Quader Ministry of Road Transport and Bridge
15. Mr. Hasanul Haq Inu Ministry of Information
16. Mr. Anisul Islam Mahmud Ministry of Water Resources
17. Mr. Anwar Hussain Ministry of Enviroment and Forest
18. Mr. Nurul Islam Nahid Ministry of Education
19. Mr. Shajahan Khan Ministry of Shipping
20. Mr. Anisul Huq Ministry of Law, Justice and Parliamentary Affairs
21. Mr. Mofazzal Hossain Chowdhury
Maya, Bir Bikram
Ministry of Dissaster Management & Relif
22. Mr. Abul Hassan Mahmood Ali Ministry of Foreign Affairs
23. Mr. Md. Mazibul Hoque Ministry of Railways.
24. Mr. A H M Mustafa Kamal Ministry of Planning
25. Mr. Mostafizur Rahman Ministy of Primary and Mass Education.
26. Mr. Asaduzzaman Noor Ministry of Cultural Affairs
27. Syed Mohsin Ali Ministry of Social Welfare
28. Mr. Shamsur Rahaman Sherif Ministry of Land
29. Mr. Md. Qamrul Islam Ministry of Food

20
SPECIAL ENVOY TO THE HONORABLE PRIME MINISTER (With the Status of Minister)
Sl Name Portfolio 1. Mr. Hussain Muhammad Ershad Special Envoy
ADVISERS
Sl Name Portfolio 1. Mr. H.T. Imam Political Affairs 2. Dr. Mashiur Rahman Economic Affairs 3. Dr. Gowher Rizvi International Affairs 4. Dr. Tawfiq-E- Elahi Chowdhury,BB Power, Energy and Mineral
Resources 5. Maj. Gen.(Rtd) Tarique Ahmed Siddique Security Affairs
STATE MINISTERS
Sl Name Portfolio 1. Mr.Md.Mujibul Haque (Chunnu) Ministry of Labour & Employment 2. Arch. Yeafesh Osman Ministry of Science and Technology 3. Mr. M.A. Mannan (A) Ministry of Finance (B) Ministry of
Planning 4. Mirza Azam Ministry of Textile and Jute
5. Mr. Promode Mankin Ministry of Social Welfare
6. Mr. Bir Bahadur Ushwe Sing Ministry of Chittagong Hill Tracts Affairs
7. Mr. Narayon Chandra Chanda Ministry of Fisheries and Livestock.
8. Mr. Biren Sikder Ministry of Youth and Sports
9. Mr. Asaduzzaman Khan Ministry of Home Affairs 10. Mr. Saifuzzaman Chowdhury Ministry of Land. 11. Begum Ismat Ara Sadique Ministry of Public Administration. 12. Begum Meher Afroze Ministry of Woman and Children Affairs.
13. Mr. Muhammad Nazrul Islam Ministry of Water Resources
14. Mr. Md. Mashiur Rahaman Ranga Rural Development and Co-operatives Division
15. Mr. Md. Shahriar Alam Ministry of Foreign Affairs 16. Mr. Zahid Maleque Ministry of Health and Family Welfare
17. Mr. Nasrul Hamid Ministry of Power Energy and Mineral
Resources. 18. Mr. Zunaid Ahmed Palak Information and Communication
Technology Division DEPUTY MINISTERS
Sl Name Portfolio 1. Mr. Abdullah Al Islam Jakob Ministry of Environment and Forest
2. Mr.Arif Khan Joy Ministry of Youth and Sports
Source: Cabinet Division and Website, April 2015

21
MINISTRIES AND DIVISIONS OF THE GOVERNMENT
Sl. No. Ministry/Division 1. President‟s Office (a) Public Division (b) Personal Division 2. Prime Minister „s Office 3. Cabinet Division 4. Armed forces Division 5. Ministry of Chittagong Hill Tracts Affairs 6. Ministry of Primary and Mass Education 7. Ministry of Agriculture 8. Ministry of Civil Aviation and Tourism 9. Ministry of Commerce 10. Ministry of Road Transport and Bridge (a) Road Transport and Highways Division (b) Bridge Division 11. Ministry of Cultural Affairs 12. Ministry of Defense 13. Ministry of Food 14. Ministry of Education 15. Ministry of Power , Energy and Mineral Resources
(a) Power Division (b) Energy and Mineral Resources Division
16. Ministry of Environment and Forest 17. Ministry of Public Administration
(a) Bangladesh Public Service Commission Secretari 18. Ministry of Fisheries and Livestock 19. Ministry of Finance
(a) Finance Division (b) Economic Relations Division (c) Internal Resources Division (d) Bank and Financial Institutionals Division.
20. Ministry of Foreign Affairs 21. Ministry of Health and Family Welfare 22. Ministry of Home Affairs 23. Ministry of Housing and Public Works 24. Ministry of Industries 25. Ministry of Information 26. Ministry of Textiles and Jute 27. Ministry of Labour and Employment
Contd.

22
Sl.No. Ministry/Division
28. Ministry of Law, Justice and Parliamentary Affairs
(a) Law and Justice Division (b) Lagislaliva and Parliamentary Affair Division (c) Parliament Secretariat
29. Ministry of Land
30. Ministry of Local Government, Rural Development and Co-operatives
(a) Local Government Division
(b) Rural Development and Co-operatives Division
31. Ministry of Planning
(a) Planning Division
(b) Statistics and Informatics Division
(c) Implementation Monitoring & Evaluation Division
32. Ministry of Post and Tele-communications and Information Technology
33. (a) Posts and Telecommunications Division
34. (b) Information and Communication Technology Division
Ministry of Religious Affairs
Ministry of Disaster Management and Relief
35. Ministry of Shipping
36. Ministry of Social Welfare
37. Ministry of Women and Children Affairs
38. Ministry of Water Resources
39. Ministry of Youth and Sports
40. Ministry of Liberation War Affairs
41. Ministry of Expatriates‟ Welfare and Overseas Employment
42. Ministry of Railways
43. Ministry of Science & Technology
Source: Website April 2015

23
ORGANIZATIONAL SETUP OF BANGLADESH BUREAU OF STATISTICS
Director General
Deputy Director General
Director Census Wing
Director Agriculture
Wing
Director Industry
and Labour Wing
Director FA and
MIS
Director National
Accounting Wing
Director ICT & Data Processing
wing
Director Demography and Health
Wing
Director SSTI
H.Q
DIV Statistical Office
DSO Office
USO Office T.S Office
Abbreviations
FA and MIS = Finance, Administration and Management Information
System , H.Q= Head Quarter , DIV=Divisional, DSO=District Statistical Officer,
USO= Upazila Statistical Officer, TS= Thana Statistician. SSTI= Statistical Staff Training Institute, ICT= Information & Communication Technology.

24
THE NATIONAL STATISTICAL SYSTEM
The statistical system of Bangladesh is centralised in Bangladesh
Bureau of Statistics (BBS). It comprises of seven functional wings. For
policy matters, BBS is under administrative control of Statistics and
Informatics Division(SID), Ministry of Planning.
The Director General is the Chief Executive of BBS. He is
responsible for collecting, processing and disseminating official statistics.
In performing his responsibilities he is assisted by a contingent of officers
and staffs.
The broad functions of BBS are to collect, compile, analyse and
publish statistics on all sectors of the economy to meet the needs of
development planning, research, policy and decision making. BBS is in
charge of conducting the Population Census, Agricultural Census and
Economic Census. Apart from this, national level surveys in the fields of
labour force, demographic situation, agriculture, household income and
expenditure are conducted. Except there, foreign trade statistics and
national income accounts, selected social indicators and socio economic
information relating to all sectors of the national economy are also
compiled and published.
BBS publishes on a regular basis advance releases on Industrial
Production, Consumer Price Indices and Monthly Statistical Bulletins. In
addition to these, three major annual publications viz. Statistical
Yearbook, Agricultural Statistics Yearbook and the Statistical Pocket
Book are published regularly. Moreover, to meet specific needs several
adhoc and subject- specific publications are also published.
25
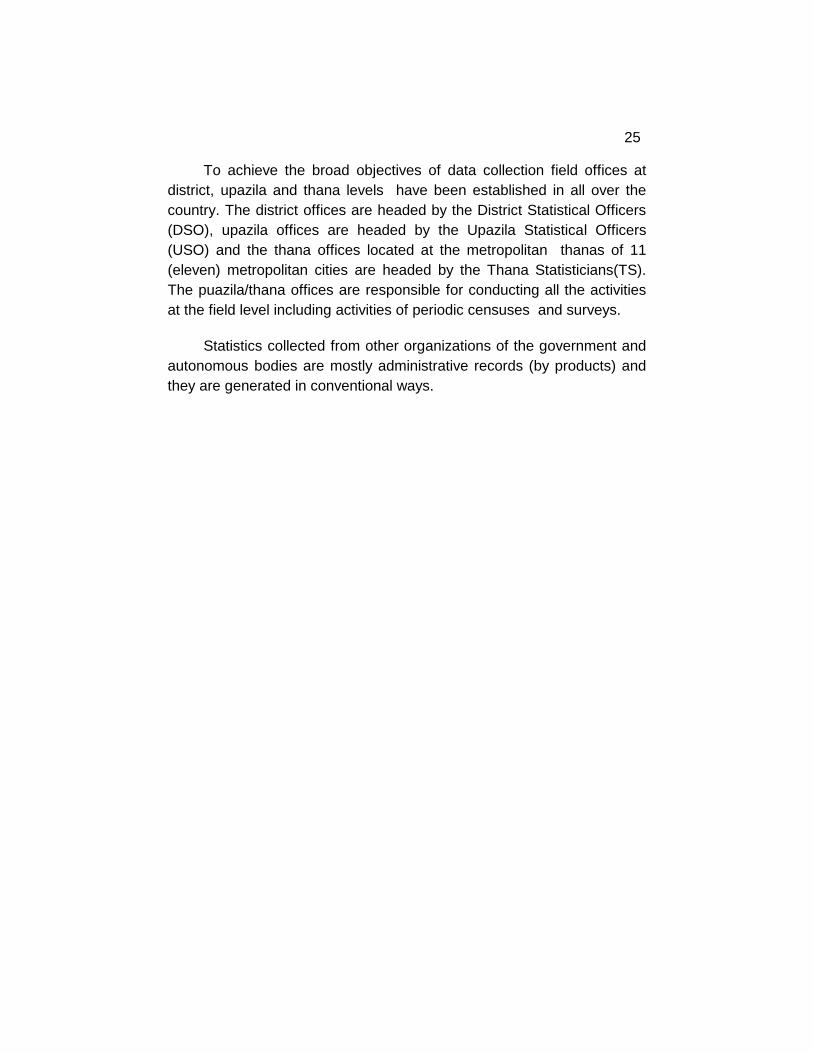
To achieve the broad objectives of data collection field offices at
district, upazila and thana levels have been established in all over the
country. The district offices are headed by the District Statistical Officers
(DSO), upazila offices are headed by the Upazila Statistical Officers
(USO) and the thana offices located at the metropolitan thanas of 11
(eleven) metropolitan cities are headed by the Thana Statisticians(TS).
The puazila/thana offices are responsible for conducting all the activities
at the field level including activities of periodic censuses and surveys.
Statistics collected from other organizations of the government and
autonomous bodies are mostly administrative records (by products) and
they are generated in conventional ways.

26
INVESTMENT SCENARIO IN BANGLADESH The Government of Bangladesh has put in place a comprehensive
array of policies aimed at bringing about significant socio-economic
improvements to the people of Bangladesh and ultimately self-reliance for
the nation. In recognition of the private sectors ability to contribute
towards achievement of these goals, the government has recently
implemented a number of significant policy reforms. These are designed
to create a more open and competitive climate for foreign investment.
In order to achieve the objective of accelerating industrial growth
and to gain a greater share of industry in the Gross Domestic Product
(GDP) as well as to make the industrial policy responsive to the changes
occurring in the global economy, the government announced a new
Industrial Policy-2010.
The industrial policy 2010 of Bangladesh proposed an integrated
strategy of economic growth through rapid industrialization. It has been
prepared taking into consideration the government‟s determination to
achieve millennium development goals by 2015, and halve the number of
the unemployed, and hunger and poverty stricken people by 2017. To
alleviate poverty by creating additional employment opportunities, the
policy aims to create job for one man per family.
The industrial policy envisages rapid industrialization through
short, medium and long term measures for raising the rate of GDP
growth to 8% by 2013, and 10% by 2017. It emphasizes an increase in
the industry sector‟s share in GDP to 40% by 2021.

27
The industrial policy 2010, recommends for establishing economic
zones, Industrial parks, high tech parks and private EPZ‟s for rapid and
balanced industrial development of the country.
The policy recommends that the public sector‟s industries will be
complementary and competitive to private sector‟s industries. Besides,
public-private partnership will be an important element of the industrial
policy.
Reserved sector (public sector) industries: The following areas are reserved for public sector investment:
1. Arms and ammunitions and other military equipments and
machineries
2. Nuclear power
3. Security printing and minting
4. Afforestation and Mechanized Extraction within the boundary of
reserved forest

28
Private sector investment: The role of the Private sector has been recognised as a predominant one. Except reserved sectors, private sector investment has been kept open without any ceiling. Private investment both local and foreign or joint venture between local and foreign or with public sector is allowed.
Massive Establishment of Small, Medium Enterprises (SMEs) and Cottage Industries in Countrywide Industrialization
The development and expansion of SMEs is regarded as a very important medium of achieving industrialization and economic growth in both developed and developing countries. The role of SMEs in industrial revolution in the industrialized world was enormous, and this trend has continued to-date. The role of SMEs in generating investment, savings, profit, employment opportunities, export, regional industrialization and improvement of people‟s living standards as well as national development is very important. To this end, forward linkage, backward linkage, value addition activities and productivity improvement should be accelerated in order to establish and expand SMEs in the manufacturing sector. As such the SME sector has been treated as a priority sector in the Industrial Policy 2005.
Scope of SMEs: 1. The structural arrangements of Bangladesh‟s industries show that
jute, textiles, paper, steel and engineering, cement, chemical, fertilizer and pharmaceutical industries are under the big and medium scale industries. On the other hand, specialized textile industries (including garments), backward linkage industries, hand-operated welding, food processing and food linkage industries, leather, ceramics, light engineering including automobiles, basic metal engineering, small scale chemical engineering, rubber industries, paper printing and publishing industries, small fabrication industries, non-metal mineral products, batteries, electrical, electronics, handicrafts, agro-based industries, multilateral jute goods, silk industries, fruit processing, poultry farming, fisheries, tea-gardening and processing, vegetable seed farming, floriculture and agro-forestry, and printing industries, ginning and baling, construction industries, transportation (including automobiles), cinema and photography, pathological laboratories, cold storage, furniture, computer industries, fast food, frozen food, etc. under service industries and many other sectors are included in the SMEs.

29
2. SMEs will be established on a greater scale across the country in order to bring about poverty alleviation, unemployment reduction and creating more employment opportunity so that national economic growth can be attained. To this end, the government has taken an initiative to draw up a separate SME policy with a view to providing necessary guidelines and strategic assistance in respect of establishing SMEs throughout the country. The guidelines and strategy incorporated in the relevant policies will be pursued in establishing and expanding SMEs of all kinds throughout the country.
Foreign investment : 1. Foreign direct investment will be encouraged in all industries in
Bangladesh except those in the reserved lists, banking, insurance and other financial institutions. This type of investments can be made in local public and private sectors individually or jointly. The capital market will be open for “portfolio” investments.
2. The legal framework for foreign investments has been drawn up on the basis of the Foreign Investment (Development and Preservation) Act 1980. The framework is as follows:
Equal treatment of both local and foreign investments. Safeguarding foreign investments from state expropriation. Assurance of repatriating finance and profit deriving from share
disposal.
3. There will be no restrictions to foreign investment in terms of equity participation, i.e., 100% foreign equity can be invested. While setting up industries with complete foreign investment or in joint venture, there will be no restrictions to the sale of shares through public issue irrespective of paid-up capital. However, foreign investors or institutions can purchase shares through Stock Exchange as per guidelines framed by the concerned authority. Foreign investors or institutions can avail loan from local banks to meet their running costs. Conditions for such type of loan will be determined on the basis of the relations between the bank and the borrower.
4. Foreign investors can avail of the same facilities as local investors in terms of tax holiday, royalty payment, technical fees, etc. Personal income taxes need not be paid by foreign technicians appointed in foreign companies for up to three years, and after that period, they have to pay on the basis of a dual taxation revocation agreement or any other agreement reached with their respective countries.

30
5. In respect of foreign investment, full repatriation facility of invested capital will be given. Profits and dividends are also repatriable. If foreign investors choose to reinvest their repatriable dividend or earned profit, then this will be treated as new investment. Foreign citizens appointed in Bangladesh will be entitled to a remittance of 50% of their wage and full repatriation of their savings and retirement benefits.
6. There will be no restrictions to the issuing of work permit for efficient foreign professionals on the basis of the recommendations of local and foreign investing companies or joint venture companies. Multiple entry visa will be issued to foreign investors for three years and to efficient professionals for the whole period of their appointment.
7. In respect of foreign investments in thrust sectors, preference will be given to small and medium scale investors when allotting plots in BSCIC industrial enclaves.
8. Investments by non-resident Bangladeshis will be treated as foreign direct investment.
9. Steps will be taken to protect intellectual property in respect of new goods and formulae.
10. International norms and systems will be followed in respect of providing investment assurance and conflict resolution.
11. Initiatives will be taken to expand the facilities of EPZ areas to those 100% export-oriented industries that are established in non-EPZ areas.
Facilitative role of the public institutions:
The following is the investment framework for the development of the private sector:
a) All foreign investments shall be registered in the prescribed manner
with the concerned promotional body before setting up an industry. b) Prior clearance will be required for setting up of ready-made
garments (RMG) units, banks, insurance companies and other financial institutions.

31
c) Bangladesh Small and Cottage Industries Corporation (BSCIC) will allot industrial plots to respective industrial units in its own industrial estates and estates developed by it under special orders. Similarly, Bangladesh Export Processing Zones Authority (BEPZA) will allot land in its own estates. Board of Investment (BOI) will recommend and pursue allotment of public land wherever available.
d) Concerned facilitating agencies will, after discussion with the relevant
authorities, determine the time limit for receipt of power, gas, water, drainage and telecommunication connection as well as provide clearance relating to environment pollution. These facilities will be provided by the "One Stop Service" cell of the facilitating agencies.
e) BOI, BEPZA and BSCIC will approve, wherever necessary, the
payment of any royalties, technical assistance fees and approve appointment and payment of remuneration of foreign personnels.
f) Private sector is allowed to set up export processing zones and
develop industrial parks. Government will extend support to these zones and parks. Industries located in the private zones (EPZs) will enjoy the same facilities as those enjoyed by the units located in the public EPZs.

32
BOARD OF INVESTMENT (BOI)
The Government of Bangladesh established the Board of Investment (BOI) in 1989 for accelerating private investment in Bangladesh. The Board, headed by the Prime Minister of the Republic, is vested with necessary powers to take decisions for speedy implementation of new industrial projects and provide operational support services to the existing ones.
The major functions of Board of Investment (BOI) include the following :
* Undertaking investment promotion activities at home and abroad. * Providing all types of facilities for promotion of capital investment and
rapid industrialization. * Registration of industrial projects as well as royalty, technical know-
how and technical assistance agreements wherever required. * Approval of payment of royalty, technical know-how and technical
assistance fees to foreign nationals/ organisations beyond the prescribed limits.
* Issuing work permit to expatriate personnel working in private sector industrial enterprises.
* Providing import facilities to industrial units in the private sector. * Approval of the terms and conditions of foreign private loan and
suppliers credit. * Allotment of land in the industrial areas/estates for industrial purpose * Conciliation of disputes relating to foreign investors and * Providing assistance to avail infrastructure facilities for industries.
Utility service:
The infrastructure and institutional support services that are available with the Utility Service are :
a) pre investment counselling b) electric connection c) gas connection d) water and sewerage connection e) telecommunication facilities f) solution of problems in case of difficulties arising in clearing imported
machinery under concessional rate of import duty and obtaining bonded warehouse license
g) environmental clearance

33
Courtesy service:
The Board of Investment offers courtesy service to the visiting foreign investors. The service includes reception at airport, hotel booking, transport arrangement and drawing up itinerary in accordance with the need of the foreign investors visiting Bangladesh. To avail of the services the investors are advised to intimate BOI in advance.
Welcome service at airport:
"BOI welcome service” counter manned by BOI officials has been set-up to offer round the clock service to all foreign investors arriving at the Hazrat Sha Jalal International Airport, Dhaka. Foreign investors are requested to avail the services on arrival.
PROCEDURE FOR OBTAINING FACILITIES AND SERVICE
To avail of the facilities and services provided by BOI for setting up of industries, the procedure mentioned below are to be followed by the entrepreneurs:
A. Registration of joint venture/100% foreign investment proposals in the private sector:
For registration of the projects entrepreneurs/investors are required to apply in a prescribed form available in the One Stop Service Centre of BOI.
B. Registration of self-financed local investment projects including industries sanctioned/financed by financial institutions or commercial banks:
The entrepreneurs/investors of such projects are also required to apply in prescribed form to BOI for registration.
C. Permission for setting up joint venture industrial units with the public sector corporations:
An entrepreneur, either local or foreign, can set up an industry with public sector corporation. Such joint venture is required to be registered with BOI if the private sector share holding is more than 50%, and in such case it is treated as private sector project. For any public sector which makes contribution out of their own fund needs approval of the concerned ministry. If the share holding of the corporation is 50% or above, it is treated as a public sector project. The public sector project is processed by the concerned ministry for approval of the Planning Commission.

34
Procedure of import of raw and packing materials and spare parts:
No permission is required for import of free list items. For items in the restricted list, BOI, BEPZA and BSCIC will fix up the import entitlement and recommend to Chief Controller of Imports & Exports (CCI&E) for issuance of IRC (Import Registration Certificate). CCI&E issues IRC in favour of the industrial enterprises within 30 days of receiving application. Items included in the banned list cannot be imported unless otherwise specified. In case of import of raw and packing materials of the pharmaceutical industry, the Drugs Administration Directorate under Ministry of Health and Family Welfare prepares Block Lists on half-yearly basis. BOI/BEPZA/BSCIC provides all other assistance relating to import in their respective jurisdictions. In this connection procedure followed by BOI is as under: On receipt of application in the prescribed form along with copies of (I) TIN certificate, (2) Trade Licence, (3) Membership Certificate of relevant trade association/chamber, (4) Certificate from the nominated bank regarding opening of account, (5) Incorporation Certificate, in case of limited companies and (6) Letter of registration with BOI, necessary field inspection is done to determine annual production capacity and half yearly/yearly import entitlement of raw & packing materials. The entrepreneur is then advised to deposit IRC fees (on the basis of annual import entitlement) by Treasury Challan to the Bangladesh Bank/Treasury. On receipt of the copy of treasury challan, recommendation is made to the office of the CCI&E for issuance of IRC. The entrepreneur will then approach the nominated bank for opening Letters of Credit for import.
Guidelines for registration/approval of foreign loan, supplier’s credit, PAYE scheme etc.:
Private investors arranging foreign loan, supplier's credit, deferred payments, PAYE scheme etc. are required to obtain prior approval from BOI. Investors need to approach BOI in the prescribed application form for the purpose.
Remittance, royalty, technical know-how and technical assistance fees:
Royalty: Royalty fee is paid by the local manufacturer to its foreign collaborator in consideration of
* license to use the brand name and trade mark of the foreign manufacturer on the local product (s) and/or;
* assignment of rights under inventions by the foreign company as well as current manufacturing experience.

35
Technical know-how and technical assistance fees : Technical know-how and technical assistance fee is paid by the local unit to its foreign collaborator in consideration of preparation of factory layout, engineering specifications of the project, assistance in selecting machine, supervision of civil construction and installation of machinery and equipment, know-how and assistance in production, testing, safety and quality control, assistance by way of making available patented process and/or know-how and right to avail of the technical information resulting from research and development, training of local personnel, technical assistance in management and marketing in deserving cases and assistance in other technical matters etc. No prior permission of BOI is required for entering into agreements for remitting fees for the purpose of royalty, technical know-how and technical assistance if the total fees and other expenses connected with technology transfer (service fee, marketing commission etc.) are within the following prescribed limits: a) For new and existing projects such fees and other expenses should
not exceed an aggregate limit of 6% of the C&F value of respective imported machinery.
b) Within the agreement period recurrent annual fees for royalties and
other expenses such as fees for technical know-how, technical assistance, operational services, marketing of products etc. should not exceed an aggregate limit of 6% of the previous years sales of the firms as declared in the Tax Return and Audited Balance Sheet of the company.
Once the technology transfer agreements falling within the above limits are signed, these are required to be furnished to BOI for registration and for remittance. Proposals which are not covered under the prescribed limits will require prior approval of BOI for which application have to be submitted along with necessary documents and copy of the draft agreement. Procedure for obtaining work permit for foreign nationals:

36
Work permit for foreign nationals is a pre-requisite for employment in Bangladesh. Private sector industrial enterprises desiring to employ foreign nationals are required to apply in advance in the prescribed form of BOI. For expatriate employment the following guidelines are followed:
a) Nationals of the foreign countries recognized by Bangladesh are considered for employment.
b) Employment of expatriate personnel be considered only in industrial establishments which are sanctioned/registered by the appropriate authority.
c) Decision of the Board of Directors of the concerned company for new employment/ extension and the certified copy of the Memorandum and Articles of Association duly signed by the share holders are to be furnished.
d) Experts/Technicians in the irrespective fields are required to furnish their certificate of educational qualifications and experience through their employers.
e) Service contract/agreement/appointment letter/buyer's nomination along with the copy of passport are to be furnished.
f) The number of foreign employees should not exceed 15% of the total employees including top management personnel.
g) Initially employment of any foreign national is considered for a term of one year which can be extended on the merits of the case.
h) Necessary security clearance by the Ministry of Home Affairs is required. Procedure for obtaining industrial plots :
Entrepreneurs requiring industrial plots for setting up of an industry in any industrial area/estate apart from BEPZA and BSCIC, may approach BOI mentioning the size of plot required by them along with copies of registration/sanction letter and industrial layout plan for justifying actual requirement. After receiving an application the BOI provides assistance to the entrepreneur in getting an industrial plot. Most of the industrial areas/estates are owned/controlled by the city development authorities in three divisional headquarters, RAJUK in Dhaka, CDA in Chittagong and KDA in Khulna. Besides these, there are a few industrial estates owned and controlled by some other government agencies namely, (a) Public Works Department and (b) Housing and Settlement Directorate. BOI recommends for acquisition of land to the concerned authorities if required by the industrial units. In such case the entrepreneurs required to submit relevant papers and information in connection with the land to be acquired by the Deputy Commissioner concerned.

37
Procedure for obtaining electricity, gas, water, sewerage & telephone connection: Entrepreneurs may apply either directly to the concerned authority for obtaining utility services or approach BOI's One Stop Service for assistance along with copy of registration/sanction letter. INCORPORATING A COMPANY IN BANGLADESH
Business in Bangladesh may be carried on by a company formed and incorporated locally and a foreign company incorporated outside but registered in Bangladesh by establishing a place of business here. There are mainly two types of companies
i) Limited companies and ii) Unlimited companies
Limited companies are divided into two categories:
a) Company limited by shares; and b) Company limited by guarantees.
Unlimited companies and companies limited by guarantees may or may not have share capital. Companies limited by shares:
There are two broad categories of companies limited by shares namely :
a) Private limited companies : and b) Public limited companies.
Private limited companies :
A Private Limited company means a company which by its Articles a) restrict the right to transfer the shares; b) limit the number of its members to a minimum of 2 and maximum
of 50 excluding the persons who are in the employment of the company
c) prohibits any invitation to the public to subscribe for the shares or debentures of the company ; and
d) entitles to commence business from the date of its incorporation. Public Limited Companies :

38
a) A public limited company may issue invitation to the members of the public to subscribe the shares and debentures of the company through a prospectus which complies with the requirements of the companies Act. 1994 and the Securities and Exchange Commission Act, 1993 as amended from time to time.
b) The required minimum number of Members are 7 but there is no maximum
limit. c) The minimum number of Directors are 3. d) A company can be formed as a public company or alternatively a company
which is incorporated as a private company can also be converted into a public company.
e) In order to commence business the public company shall have to obtain a
commencement certificate from the Registrar of Joint Stock Companies. Memorandum of Association:
Memorandum of Association of the company shall state the name of the company, whether it is public limited or private limited and the location of the registered office of the company. The memorandum should clearly spell out the main objectives, the authorised capital-division of this capital into shares of fixed amount and liability of its members. Articles of Association:
The Articles of Association are the regulations governing the internal management of the affairs of the company and the conduct of its business. INCENTIVES AND FACILITIES FOR THE INVESTORS A. Tax Holiday: Tax holiday is allowed to companies for the following periods according to the location of industries. * Dhaka and Chittagong Division 5 years (excluding the 3 hill districts of Chittagong Division) * Rajshahi, Khulna, Sylhet, Barisal, Rangpur and the 3 Hill districts of Chittagong Division 7 years

39
The period of tax holiday is calculated from the month of commencement of commercial production or operation of the industrial undertaking. The eligibility of tax holiday is to be determined by the National Board of Revenue (NBR). Tax holiday facility can be availed of by industries set up within June 30, 2000. B. Accelerated Depreciation: Accelerated depreciation in lieu of tax holiday is allowed at the rate of 80% of actual cost of machinery or plant for the year in which the unit starts commercial production and 20% for the following years. The rate of depreciation is 100% for areas specified by the NBR. C. Concessionary Duty On Imported Capital Machinery: Import duty at the rate of 1% advalorem is payable on capital machinery and spares imported for initial installation or BMR/BMRE of the existing industries. The value of spare parts should not however exceed 10% of the total C & F value of the machinery and will also get the benefit of this concessionary rate of duty. For 100% export oriented industries, no import duty is charged in case of capital machinery and spares. D. Rationalisation of Import Duty: Duties and taxes on import of goods which are produced locally will be higher than those applicable to import of raw materials for producing such goods. E. Incentives to Non-resident Bangladeshis: Special incentives are provided to encourage non-resident Bangladeshis for investment in the country. Non-resident Bangladeshi investors will enjoy facilities similar to those of foreign investors. Moreover, they can buy newly issued shares/debentures of Bangladeshi companies. A quota of 10% has been fixed for non-resident Bangladeshis in primary public shares. Furthermore, they can maintain foreign currency deposits in the Non-resident Foreign Currency Deposit (NFCD) accounts.

40
F. Other Incentives:
* Tax exemption on royalties, technical know-how fees received by any foreign collaborator, firm, company and experts.
* Tax exemption on the interest on foreign loans under certain conditions.
* Avoidance of double taxation in case of foreign investors on the basis of bilateral agreements.
* Exemption of income tax up to 3 years for the foreign technicians employed in industries specified in the relevant schedule of income tax ordinance.
* Tax exemption on income of the private sector power generation company for 15 years from the date of commercial production.
* Facilities for full repatriation of invested capital, profit and dividend.
* Six months multiple entry visa for the prospective new investors.
* Re-investment of repatriable dividend treated as new investment.
* Citizenship by investing a minimum of US$ 5,00,000 or by transferring US$ 10,00,000 to any recognized financial institution (non-repatriable).
* Permanent residentship by investing a minimum of US$ 75,000 (non-repatriable).
* Tax exemption on capital gains from the transfer of shares of public limited companies listed with a stock exchange.
Export-Oriented and Export Linkage Industries
1. Export-oriented industrialization is one of the major objectives of the present Industrial Policy. Prioritizing export-oriented industries and providing all-out government assistance in respect of this will be ensured.
2. Those industries that export at least 80 percent of their produce or supply 80 percent raw materials for exportable items or those business enterprises that export at least 80 percent of their services will be considered export-oriented industries (IT-related goods are also included).

41
3. The following incentives and facilities will be provided in order to attract investment in 100 percent export-oriented industries: (a) Duty-free import of capital machinery and up to 10 percent of
the value of the spares of that capital machinery. The rates of customs duty in the import sector reorganized into four tiers: 0%, 2%, 5% , 10% and 25%.
(b) The duty drawback system has been further simplified, and with this in mind, a flat rate will be fixed for all exportable items. Exporters will get duty drawback facility at a flat rate from concerned commercial banks.
(c) The system of providing up to 90 percent credit against non-negotiable and fixed L/Cs / sale agreements.
(d) In order to ensure backward linkage, export-oriented readymade garment industries and other local raw material using export-oriented industries will be provided with various facilities at a prescribed rate. Similar facilities will also be provided to local deemed exporters in export-oriented industries.
(e) Export-oriented industries will be given the facility of handling foreign exchange of certain amount which will be beyond the Bangladesh Bank‟s foreign exchange regime in order to facilitate the opening of their offices abroad, promoting their products and taking part in international trade fairs.
(f) The export income earned from cottage industries will be 100% income tax-free, and the SMEs and other industries will be given income tax rebate at the rate of 50% of their export income.
(g) The facility of importing raw materials necessary for the production of export goods but enlisted as banned/reserved items.
(h) Value-added jute, jute-mixed goods and diversified jute goods produced with new technology will be treated as export-oriented or import-substitute industries.
(i) Consistent with present government policies, facilities will be given for tax-free import of raw materials (at a prescribed amount) necessary for the production of exportable goods.
(j) If local raw materials are provided to local industries or projects through foreign currency L/Cs, then those will be treated as indirect export and will be given facilities, which are applicable for export.

42
(k) The export credit assurance scheme will be further expanded and strengthened.
4. The export-oriented industries identified, as the government‟s thrust sectors will be given special facilities including „venture capital‟ facilities.
5. The current facilities of duty and tax assessment and rebate on imported goods (before arrival) will continue. Clearing process and formalities will be further simplified so that the clearance process takes the least time to be completed.
6. In respect of export-oriented and export linkage industries, all sorts of facilities described in the export policy will be given, apart from the facilities mentioned above.
7. Utility services will be provided to 100 percent export-oriented industries at reduced/rebated rates.
Note: For further details users are requested to contact BOI Bangladesh. Source : Board of Investment.

43
Privatization Commission of Bangladesh
The privatization Commission which came into being in March, 1993 is entrusted with the overall responsibility of privatizing State-owned Enterprises identified for privatization, whether small, large, profitable or non-profitable.
Privatization in Bangladesh has gone through various phases since its Independence. Just after the war of Independence in 16 December 1971, the Government had to step in to fill the vacuum in the economy as the then-owners, abandoned their properties and left the country. In addition, the nationalization policy of March, 1972 of major industries like Jute, Textile, Chemical and other basic industries, DFIs, Banks and Insurance etc. brought into fold nearly 90% of such enterprises under Government control. However these public sector enterprises right from inception could not run profitably and efficiently and many of them ran into severe financial difficulties and serious management problems. As stated earlier, by 1975, the Government began to reverse its policy of nationalization due to the heavy burdens created by the public sector enterprises on the national exchequer. During the period 1976-1992 about 500 SOEs had been sold or returned to their former owners. Since the creation of Privatzation Commission as the special agency in March, 1993 by the Government to implement the programme of divestiture of SOEs. Till to-date 71 (51 as enterprise & 20 by offloading shares) SOEs got the final approval for sale from the GOB. It is worth mentioning that 51 (Fifty one) SOEs have so far been handed over to the new buyers since March, 1993. LOI (Letter of Intent) have been issued for 4 (Four) SOEs to be handed over to the new buyers during the same period. Moreover, decision to off-load the shares of 20 (Twenty) public limited companies have been taken.
Before inviting tender for sale of the identified SOEs, valuations of the assets and liabilities are made by Chartered Accountant (C.A) firms or by the consultants engaged by the Commission. Valuation reports are examined and reviewed by the Privatization Commission and a re-valuation can be made by another C.A firm/valuer firm if considered necessary. Tenders are invited after the finalization of the valuation. Valuation and other relevant documents are made available to the prospective bidders before submission of the bids.
In the case of sale of enterprise, the prospective buyers will submit quotation according to the terms and conditions of the tender. Value of current assets such as sundry debtors, advances etc. will be payable to the Government by the buyer either in cash or within one year along with a simple interest rate of 10% per annum.

44
In the cases mentioned above the buyer will have to provide irrevocable bank guarantee without recourse in case the payment is not made in cash.
Short-term liabilities such as, sundry creditors, claims of employees
and workers over by the Government.
As regards employees of the tendered enterprise (if it is a running one) the Corporation and the buyer will jointly determine the number of redundant employees in the light of technical and operational feasibility. Retained employees, however, will be offered new terms and conditions by the buyer.
Buyers will be liable to pursue all pending court cases. Land under the enterprise will be used normally for establishment and expansion of industries. A substantial amount of unutilized but developed land can, however, be used for other productive activities. In case of sale of Government-owned shares in different companies the prospective buyers will submit quotations for the total number of shares offered for sale. The company whose shares are offered for sale, will repay all quasi-equity loans of the Government and dues of the Corporations witiin a period of 10 years in 6-monthly instalment carrying a simple interest of 10% per annum and will submit an irrevocable bank guarantee without recourse from a scheduled bank. In addition to the above, the buyer will also give a personal irrevocable bank guarantee without recourse for the above quasi-equity loans and dues or will keep the share certificates of all the shares bought by him under the custody of the Government. While implementing the policy of privatization, efforts will be made to make the ownership of the industrial enterprises as broad-based, as possible.

45
The Securities and Exchange Commission (SEC)
The Securities and Exchange Commission (SEC) was established
on 8th June, 1993 under the Securities and Exchange Commission Act, 1993. The Chairman and Members of the Commission are appointed by the Government and have overall responsibility to administer securities legislation. The commission, at present has three full time members, excluding the Chairman. The commission is a statutory body and attached to the Ministry of Finance.
Mission of the SEC Is to:
- Protect the interests of securities investors. - Develop and maintain fair, transparent and efficient securities
markets. - Ensure proper issuance of securities and compliance with securities
laws.
Commission‟s main functions are:
- Regulating the business of the Stock Exchanges or any other securities market.
- Registering and regulating the business of stock-brokers, sub-brokers, share transfer agents, merchant bankers and managers of issues, trustee of trust deeds, registrar of an issue, underwriters, portfolio managers, investment advisers and other intermediaries in the securities market.
- Registering, monitoring and regulating of collective investment scheme including all forms of mutual funds.
- Monitoring and regulating all authorized self regulatory organizations in the securities market.
- Prohibiting fraudulent and unfair trade practices relating to securities trading in any securities market.
- Promoting investors‟ education and providing training for intermediaries of the securities market.
- Prohibiting insider trading in securities. - Regulating the substantial acquisition of shares and take-over of
companies. - Undertaking investigation and inspection, inquiries and audit of any
issuer or dealer of securities, the Stock Exchanges and intermediaries and any self regulatory organization in the securities market.
- Conducting research and publishing information.

46
Stock Exchanges
Bangladesh has two Stock Exchanges, Dhaka Stock Exchange (DSE), established in 1954 where trading is conducted by Computerized Automated Trading System and Chittagong Stock Exchange (CSE), established in 1995 which is also conducted by Computerized Automated Trading System . All exchanges are self-regulated, private sector entities which must have their operating rules approved by the SEC. Each Stock Exchange:
establishes listing requirements approves, suspends or removes listing privileges of companies monitors listed companies in compliance with legal regulatory
provisions permits dual listing
NATIONAL ENERGY POLICY
In recognition of the importance of energy in socio-economic
development, the Government of Bangladesh has given continuing attention to the overall development of energy sector. It involved survey, exploration, exploitation and distribution of indigenous natural gas; establishment of petroleum refining facility and distribution systems; and establishment of power generation plants and networks for transmission and distribution of electricity. During last one decade, about 20 percent of total public sector investment was allocated for the development of energy sector.
Per-capita consumption of commercial energy and generation of
electricity in 2000 were about 200 KGOE/year and 120 kWH/year respectively. Per capita consumption of commercial energy and electricity in Bangladesh in one of the lowest among the developing countries. At present about 65% of total final energy consumption is met by different type of biomass fuels (e.g. agricultural residues, wood fuels, animal dung etc.).

47
In 2000 only 2.2% of total households (mostly in urban areas) had
piped natural gas connections for cooking and 30% of households had
electricity connections and only 3.9% of total households used kerosene
for cooking.
The Government formulated and announced the first National Energy
Policy (NEP) of the country in 1996 to ensure proper exploration,
production, distribution and rational use of energy sources to meet the
growing energy demand of different zones, consuming sectors and
consumers groups on a sustainable basis. With rapid change of global as
well as domestic situation the government has updated this NEP in 2004.
The objectives of the revised National Energy Policy (NEP) are as
follows:
(i) To provide energy for sustainable economic growth so that
the economic development activities of different sectors are
not constrained due to shortage of energy.
(ii) To meet the energy needs of different zones of the country
and socio-economic groups.
(iii) To ensure optimum development of all the indigenous
energy sources.
(iv) To ensure sustainable operation of the energy utilities.
(v) To ensure rational use of total energy sources.
(vi) To ensure environmentally sound sustainable energy
development programmes causing minimum damage to
environment.
(vii) To encourage public and private sector participation in
development and management of the energy sector.
(viii) To bring entire country under electrification by the year
2020.
(ix) To ensure reliable supply of energy to the people at
reasonable and affordable price.
(x) To develop a regional energy market for rational exchange
of commercial energy to ensure energy security. Note: For details, users are advised to refer to ‘national energy policy’ published by the ministry of power, energy and mineral resources, GOB.

48
PRIVATE SECTOR POWER GENERATION POLICY OF BANGLADESH
The “PRIVATE SECTOR POWER GENERATION POLICY OF BANGLADESH” was approved by the Government with a view to boosting up private sector power generation in the country. The government of Bangladesh (GOB) recognizes that the pace of power development has to be accelerated in order to achieve overall economic development targets of the country and avoid looming power shortages. At present only 15% of Bangladesh population has access to electricity. 1. Presently, there state-owned enterprises generate and transmit electricity in
the country. They are:
a) Bangladesh Power Development Board (BPDB), responsible for generation and transmission of power in the urban areas except the area under Greater Dhaka;
b) Dhaka Electricity Supply Authority (DESA), responsible for distribution of
electricity in the greater Dhaka area including the metropolitan city of Dhaka; and
c) Rural Electrification Board (REB), responsible for distribution of electricity
in rural areas. * At present 11666 GWH electricity is generated annually in the country.
Power System Master Plan (PSMP) projects a requirement of 16500 GWH in 2000 and 24160 GWH in 2005. This implies an increase in peak demand from the present 2200 MW to 3150 MW by 2000 and 4600 MW by 2005 for which capacity addition of about 3350 MW will be required by 2005. Hence on average, additional 300 MW of generation capacity has to be added every year. The total investment between now and 2005, required to achieve such capacity enhancement, is Taka 176 billion or US$ 4.4 billion. The corresponding investment requirement for expansion and reinforcement of transmission and distribution system would be about US$ 2.2 billion for the same period, bringing the grand total to US$ 6.6 billion.
* Such a huge investment on the part of the GOB is almost impossible,
Government, therefore, has amended its Industrial Policy following the recommendation of the Inter-Ministerial-Working Group for Power Sector Reform. As per the revised policy the Government is strongly committed to attract private investment for installing new power generation capacity on a Build-own-operate (BOO) basis.

49
2. Gob policy and the power cell:
In order to translate this explicit policy of the Government into actual investment projects, Government of Bangladesh created and set up a Power Cell under the Ministry of Energy and Mineral Resources (MEMR) in 1995. All the responsibilities of private sector power development lie with the cell. The cell will solicit and evaluate proposals, negotiate and process award of contracts and finalize projects. At the same time it will represent interest of Government of Bangladesh in the private sector power project.
- Solicitation of proposals : Independent Power Producers‟ Projects will be implemented on Build-own-operate (BOO) basis. Before submission of the RFP (request for proposal) the bidders will have to pre qualify as per criteria published in the National and International Press. Proposals of the pre qualified bidders will be ranked as per criteria and acceptance will be given accordingly. The first ranked bidder will be given a stipulated period to (a) submit a performance guarantee and (b) reach financial closure. After that the bidders will be required to complete financing arrangements. The bidder will also have to ensure security package through three separate agreements: (a) Model Implementation Agreement (IA), (b) Power Purchase Agreement (PPA) and (c) Fuel Supply Agreement (FSA).
3. Allocation of project/plant site and provision of fuel :
The plant site will be selected by Government of Bangladesh in consultation with the project sponsor. The fuel supply will also be determined by GOB keeping in view the existing fuel situation of the country.
4. Tariff for bulk purchase of power at busbar : The produced power will be purchased (as per PPA) by
BPDB/DESA/REB or any distribution company to be created in future and it will be decided by Government of Bangladesh. Tariff will be divided into two parts: (a) Capacity payment-in local currency in case of local payment and in
foreign currency in case of foreign payment. (b) Energy payment-all in local currency. They will have to meet other tariff
requirements as per RFP.
5. Fiscl incentives :
The private power companies will be given some fiscal incentives such as exemption from corporate Income Tax for a period of 15 years. Customs and VAT free import of plant and equipment, repatriation of equity and dividend, exemption of Income Tax of foreign Investors in Bangladesh, Insurance facilities according to their own choice, instruments and deeds exempted from stamp duties, all industrial facilities as Power Generation declared as Industry, raising local and foreign finance as per BOI Investment Rules and indigenous equipment support.
6. In case of any ambiguity with regard to interpretation of any provision of this policy documents the GOB interpretation shall be final.
Note: For details, users are advised to refer to ‘national energy policy’ published by the ministry of power, energy and mineral resources, GOB.

51
Chapter II
ENVIRONMENT

52

53
2.01 Storm Warning Signals in Bangladesh
Storms in Bangladesh generally occur in the months of April-May and October-November.
The Meteorological Department uses separate codes of signals for storm warnings at maritime and river ports. These codes are given below in abbreviated forms:
Existing Signal System for Maritime Ports
1. Distant Cautionary Signal No. I
Explanation: There is a region of squally weather (wind speed of 61 kms/
hour) in the distant sea where a storm may or may not form.
2. Distant Warning Signal No. II
Explanation: A storm (wind speed of 62-88 kms/hour)has formed in the
distant deep sea. Ships may fall into danger if they leave harbour.
3. Local Cautionary Signal No. III
Explanation: The port is threatened by squally weather (wind speed of
40-50 kms/hour).
4. Local Warning Signal No. IV
Explanation: The port is threatened by a storm (wind speed of 51-61
kms/hour) but it doesn't appear that the danger is as yet sufficiently great
to justify extreme precautionary measures.
5. Danger Signal No. V

54
Explanation: The port will experience severe weather from a storm of light
or moderate intensity (wind speed of 62-88 kms/hour) that is expected to
cross the coast to the south of Chittagong port or Cox's Bazar port and to
the east of Mongla port.
6. Danger Signal No. VI
Explanation: The port will experience severe weather from a storm of
slight or moderate intensity (wind speed of 62-88 kms/hour) that is
expected to cross the coast to the north of the port of Chittagong or Cox's
Bazar and to the west of the port of Mongla.
7. Danger Signal No. VII
Explanation: The port will experience severe weather from a storm of
light or moderate intensity (wind speed of 62-88 kms/hour) that is
expected to cross over or near the port.
8. Great Danger Signal No. VIII
Explanation: The port will experience severe weather from a storm of
great intensity (wind speed of 89-117 kms/hour or more) that is expected
to cross the coast to the south of the port of Chittagong or Cox's Bazar
and to the east of the port of Mongla.

55
9. Great Danger Signal No. IX
Explanation: The port will experience severe weather from a storm of
great intensity (wind speed of 89-117 kms/ hour or more) that is expected
to cross the coast to the north or the port of Chittagong or Cox's Bazar
and to the west of the port of Mongla.
10. Great Danger Signal No. X
Explanation: The port will experience severe weather from a storm
of great intensity (wind speed of 89-117 kms/hour or more) that is
expected to cross over or near the port.
Existing Signal System for Inland River Ports
1. Cautionary Signal No. I
Explanation: The area is threatened by squally winds (wind speed of 45-
60 kms/hour) of transient nature. This signal is also hoisted during nor’
westers.
2. Warning Signal No. II
Explanation: A squall, Kalbaishakhi or a nor’wester (wind speed 61-80
kms/hour or more) is likely to strike the area Vessels of 65 feet and under
in length are to seek shelter immediately.
3. Riverine Danger Signal No. III
Explanation: A storm (wind speed of 62-88 kms/hour or more) is likely to strike the area soon (all vessels will seek shelter immediately). 4. Riverine Great Danger Signal No. IV
Explanation: A violent storm (wind speed of 89 kms/hour or more) will strike the area soon (all Vessels will take shelter immediately).
Source: Meteorological Department.

56
2.02 Wind-Speed Estimation Over Land in Bangladesh (According To Beaufort Scale)
No.
Name
Indication
Wind speed (at 33 feet)
M.P.H.
0. Calm Smoke rises vertically. Less than-1
1. Light air Wind direction shown by smoke drift, but not by wind-vane. 1-3
2. Light breeze Wind felt on face. Leaves rustle, wind-vane moves. 4-7
3. Gentle breeze Leaves and small twigs in constant motion Light flag extended. 8-12
4. Moderate breeze Dust and loose paper raised. 13-18
5. Fresh breeze Small leafy trees sway. Small waves on water. Surfaces form crests. 19-24
6. Strong breeze Large branches sway. Telephone wires whistle. Difficult to use umbrella. 25-31
7. Moderate gale Whole trees sway. Difficult to walk against the wind. 32-38
8. Fresh gale Twigs broken off trees. Wind impedes progress when walking. 39-46
9. Strong gale Branches broken off trees. Slight structural damage to buildings (chimneys, roof slates) 47-54
Contd.

57
2.02 Wind-Speed Estimation Over Land in Bangladesh (According To Beaufort Scale)
No. Name Indication Wind speed
(at 33 feet) M.P.H.
10. Whole gale Trees uprooted. Considerable structural damage to buildings. 55-63
11. Storm Widespread damage to trees and properties. 64-75
12. Hurricane Widespread damage to trees and properties. Above 75
Source: Meteorological Department.

2.03 Monthly Total Rainfall in Bangladesh, 2014 (Millimeter)
Station Month
Jan Feb Mar Apr May June July Aug Sep Oct Nov Dec
Dhaka 0 14 10 80 152 337 213 392 156 49 0 0 Tangail 0 25 23 47 136 588 239 236 316 41 0 0 Mymensingh 0 43 28 78 161 342 301 569 401 15 0 0 Faridpur 0 15 14 29 243 400 254 323 - 83 0 0 Madaripur 0 12 7 25 179 356 209 309 577 81 0 4 Srimangal 0 13 49 96 397 456 351 384 233 73 0 0 Sylhet 0 34 67 119 538 528 316 777 457 33 0 0 Bogra 0 54 0 43 206 580 181 244 722 21 0 1 Dinajpur 0 32 1 14 187 234 289 184 421 64 0 0 Ishurdi 3 35 30 18 209 409 223 255 312 89 0 0 Rajshahi 0 34 5 51 173 191 215 363 174 5 0 1 Rangpur 0 26 1 16 213 266 99 362 148 9 0 0 Sydpur 0 26 7 6 156 448 142 459 595 45 0 0 Chuadanga 1 44 50 0 65 228 150 299 401 99 0 1 Jessore 0 19 10 0 211 240 335 257 432 38 0 1 Khulna 0 24 5 0 170 444 349 277 122 10 0 3 Mongla 0 35 6 5 272 254 291 214 185 136 0 2 Satkhira 0 31 36 0 199 296 240 181 275 42 0 1 Barisal 0 11 13 0 251 342 262 265 235 51 0 1 Bhola 0 16 14 9 129 477 307 465 240 67 0 3 Khepupara 0 31 3 6 193 349 454 436 211 134 0 5 Patuakhali 0 32 5 14 320 385 553 376 239 131 0 2 Chandpur 0 20 24 53 182 627 322 259 245 98 0 2 Teknaf 0 22 0 11 66 422 841 1005 337 55 1 0 Chittagong 0 37 18 46 359 1439 391 692 446 104 10 3 Commilla 0 7 17 16 175 399 165 431 361 64 0 6 Cox’s Bazar 0 22 1 10 140 678 726 604 295 43 0 1 Feni 0 14 21 5 287 651 377 587 257 97 0 1 Hatiya 0 27 14 2 158 918 702 624 463 273 2 1 Kutubdia 0 78 4 55 105 1047 583 550 368 80 1 2 M. Court 0 20 58 42 217 719 548 669 444 108 2 0 Rangamati 0 23 18 1 357 593 168 302 430 151 10 0 Sandwip 0 34 32 33 218 1167 565 965 321 58 3 0 Sitakunda 0 26 21 27 216 974 427 745 414 87 0
Source: Bangladesh metrological department. 58
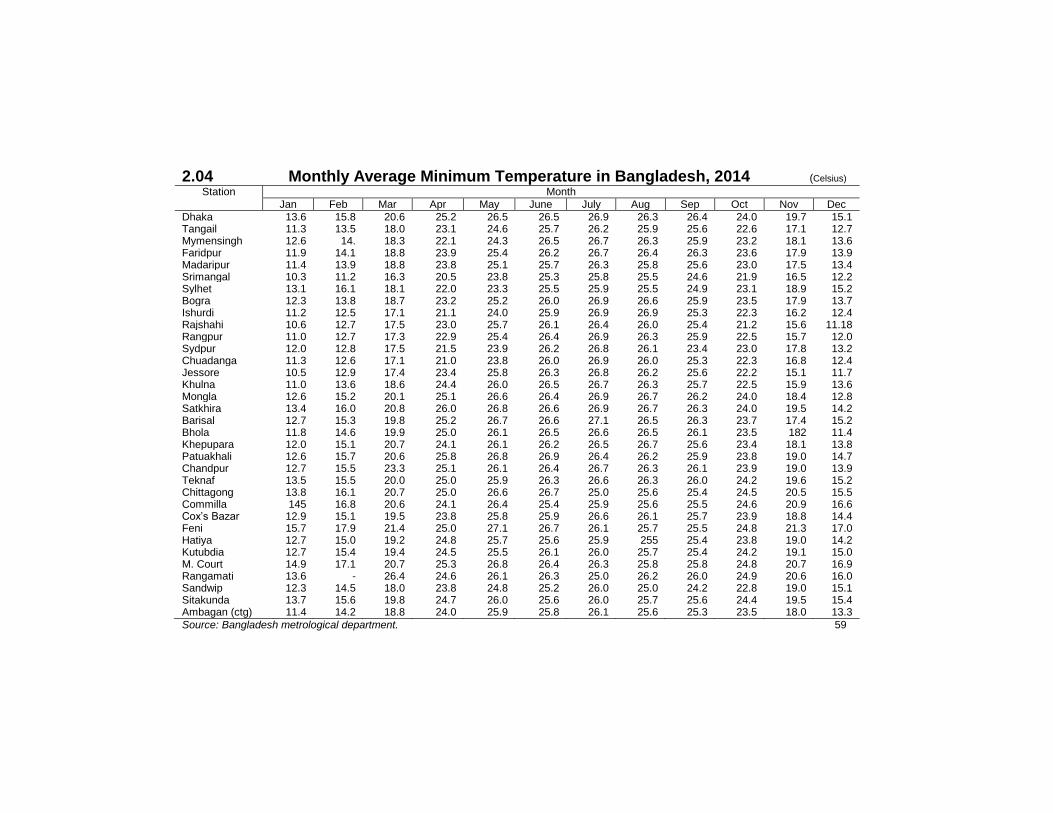
2.04 Monthly Average Minimum Temperature in Bangladesh, 2014 (Celsius) Station Month
Jan Feb Mar Apr May June July Aug Sep Oct Nov Dec
Dhaka 13.6 15.8 20.6 25.2 26.5 26.5 26.9 26.3 26.4 24.0 19.7 15.1 Tangail 11.3 13.5 18.0 23.1 24.6 25.7 26.2 25.9 25.6 22.6 17.1 12.7 Mymensingh 12.6 14. 18.3 22.1 24.3 26.5 26.7 26.3 25.9 23.2 18.1 13.6 Faridpur 11.9 14.1 18.8 23.9 25.4 26.2 26.7 26.4 26.3 23.6 17.9 13.9 Madaripur 11.4 13.9 18.8 23.8 25.1 25.7 26.3 25.8 25.6 23.0 17.5 13.4 Srimangal 10.3 11.2 16.3 20.5 23.8 25.3 25.8 25.5 24.6 21.9 16.5 12.2 Sylhet 13.1 16.1 18.1 22.0 23.3 25.5 25.9 25.5 24.9 23.1 18.9 15.2 Bogra 12.3 13.8 18.7 23.2 25.2 26.0 26.9 26.6 25.9 23.5 17.9 13.7 Ishurdi 11.2 12.5 17.1 21.1 24.0 25.9 26.9 26.9 25.3 22.3 16.2 12.4 Rajshahi 10.6 12.7 17.5 23.0 25.7 26.1 26.4 26.0 25.4 21.2 15.6 11.18 Rangpur 11.0 12.7 17.3 22.9 25.4 26.4 26.9 26.3 25.9 22.5 15.7 12.0 Sydpur 12.0 12.8 17.5 21.5 23.9 26.2 26.8 26.1 23.4 23.0 17.8 13.2 Chuadanga 11.3 12.6 17.1 21.0 23.8 26.0 26.9 26.0 25.3 22.3 16.8 12.4 Jessore 10.5 12.9 17.4 23.4 25.8 26.3 26.8 26.2 25.6 22.2 15.1 11.7 Khulna 11.0 13.6 18.6 24.4 26.0 26.5 26.7 26.3 25.7 22.5 15.9 13.6 Mongla 12.6 15.2 20.1 25.1 26.6 26.4 26.9 26.7 26.2 24.0 18.4 12.8 Satkhira 13.4 16.0 20.8 26.0 26.8 26.6 26.9 26.7 26.3 24.0 19.5 14.2 Barisal 12.7 15.3 19.8 25.2 26.7 26.6 27.1 26.5 26.3 23.7 17.4 15.2 Bhola 11.8 14.6 19.9 25.0 26.1 26.5 26.6 26.5 26.1 23.5 182 11.4 Khepupara 12.0 15.1 20.7 24.1 26.1 26.2 26.5 26.7 25.6 23.4 18.1 13.8 Patuakhali 12.6 15.7 20.6 25.8 26.8 26.9 26.4 26.2 25.9 23.8 19.0 14.7 Chandpur 12.7 15.5 23.3 25.1 26.1 26.4 26.7 26.3 26.1 23.9 19.0 13.9 Teknaf 13.5 15.5 20.0 25.0 25.9 26.3 26.6 26.3 26.0 24.2 19.6 15.2 Chittagong 13.8 16.1 20.7 25.0 26.6 26.7 25.0 25.6 25.4 24.5 20.5 15.5 Commilla 145 16.8 20.6 24.1 26.4 25.4 25.9 25.6 25.5 24.6 20.9 16.6 Cox’s Bazar 12.9 15.1 19.5 23.8 25.8 25.9 26.6 26.1 25.7 23.9 18.8 14.4 Feni 15.7 17.9 21.4 25.0 27.1 26.7 26.1 25.7 25.5 24.8 21.3 17.0 Hatiya 12.7 15.0 19.2 24.8 25.7 25.6 25.9 255 25.4 23.8 19.0 14.2 Kutubdia 12.7 15.4 19.4 24.5 25.5 26.1 26.0 25.7 25.4 24.2 19.1 15.0 M. Court 14.9 17.1 20.7 25.3 26.8 26.4 26.3 25.8 25.8 24.8 20.7 16.9 Rangamati 13.6 - 26.4 24.6 26.1 26.3 25.0 26.2 26.0 24.9 20.6 16.0 Sandwip 12.3 14.5 18.0 23.8 24.8 25.2 26.0 25.0 24.2 22.8 19.0 15.1 Sitakunda 13.7 15.6 19.8 24.7 26.0 25.6 26.0 25.7 25.6 24.4 19.5 15.4 Ambagan (ctg) 11.4 14.2 18.8 24.0 25.9 25.8 26.1 25.6 25.3 23.5 18.0 13.3
Source: Bangladesh metrological department. 59

2.05 Monthly Average Meximum Temperature in Bangladesh, 2014 (Celsius) Station Month
Jan Feb Mar Apr May June July Aug Sep Oct Nov Dec
Dhaka 24.3 27.2 32.4 36.4 35.2 33.2 32.9 32.2 32.8 31.1 30.2 24.6 Tangail 23.5 26.3 32.2 36.5 35.4 33.3 32.5 31.7 33.1 30.9 30.1 24.1 Mymensingh 24.2 25.6 30.6 33.5 33.2 32.3 32.9 32.2 31.9 30.7 29.9 24.7 Faridpur 23.1 27.1 32.8 37.0 35.5 33.3 32.8 32.6 32.9 31.3 30.4 24.8 Madaripur 23.6 27.3 32.5 36.2 35.4 33.5 32.5 32.4 32.6 31.2 30.2 25.2 Srimangal 25.5 27.3 32.3 35.1 33.4 32.9 34.2 32.5 32.8 30.8 30.7 26.4 Sylhet 27.0 27.3 32.4 34.9 32.3 32.1 31.1 30.1 32.2 31.7 31.2 27.8 Bogra 23.3 25.8 31.5 35.5 35.1 33.1 33.2 33.4 32.4 31.4 30.9 25.0 Dinajpur 22.5 24.4 30.5 34.9 34.5 33.0 33.2 32.0 31.9 30.6 29.5 24.2 Ishurdi 22.9 26.0 32.2 37.4 36.6 34.0 34.0 33.8 33.3 30.5 29.6 24.4 Rajshahi 23.0 26.0 32.5 38.0 37.1 34.9 34.0 32.6 34.1 31.1 30.2 24.5 Rangpur 22.2 24.4 30.4 34.3 33.3 32.6 31.1 32.8 31.4 30.. 29.4 24.1 Sydpur 22.6 24.7 31.0 35.3 35.0 33.2 33.3 32.6 32.2 30.8 29.8 24.7 Chuadanga 23.0 26.8 32.8 38.2 37.7 34.6 32.9 33.5 33.7 31.2 29.9 24.3 Jessore 24.0 28.0 33.4 38.0 37.5 34.2 32.8 32.8 33.5 35.5 31.0 26.0 Khulna 24.0 27.7 32.9 37.7 36.8 33.8 33.8 32.9 33.3 31.8 31.0 25.7 Mongla 24.1 27.7 33.2 37.3 35.9 33.0 32.8 33.0 32.6 31.2 30.1 25.7 Satkhira 23.6 27.2 32.3 36.8 36.0 33.7 32.0 31.9 33.1 31.7 30.5 26.0 Barisal 24.6 27.4 32.4 36.2 34.7 33.0 33.6 33.5 32.4 30.9 30.3 26.3 Bhola 25.3 27.7 32.2 35.3 34.5 32.7 31.5 31.6 32.0 31.2 30.5 27.4 Khepupara 26.2 28.7 33.0 36.0 34.6 33.0 32.1 31.7 32.4 31.0 30.4 27.1 Patuakhali 25.9 28.6 33.3 36.6 34.9 33.2 31.9 31.7 32.9 31.4 30.7 25.2 Chandpur 24.0 27.3 32.6 36.0 34.8 33.2 32.8 31.8 32.6 31.7 30.7 28.6 Teknaf 27.4 28.5 31.4 33.0 34.1 32.2 31.6 30.6 31.0 31.3 30.6 27.9 Chittagong 25.4 27.8 30.7 33.3 32.4 31.1 32.7 32.1 31.0 30.1 30.6 25.9 Commilla 25.0 26.9 30.9 34.9 34.6 325 33.2 31.9 32.5 31.2 30.0 28.7 Cox’s Bazar 27.7 29.3 32.4 35.0 34.6 32.6 31.1 30.9 32.0 31.8 31.6 26.7 Feni 25.5 27.5 31.7 35.6 34.5 32.1 32.2 31.4 30.4 30.9 30.7 27.0 Hatiya 26.2 28.1 31.7 34.9 34.4 32.0 32.1 31.0 31.5 30.8 30.5 27.1 Kutubdia 25.5 27.3 30.4 31.6 33.8 32.1 31.7 30.8 31.6 30.8 30.5 25.1 M. Court 24.6 27.4 31.9 35.9 35.4 32.7 32.7 32.1 32.1 31.2 29.5 27.7 Rangamati 26.9 28.9 33.7 37.1 34.5 32.4 32.4 31.3 32.3 30.9 305 27.1 Sandwip 26.3 28.0 31.3 34.5 33.6 31.6 31.2 30.3 31.7 31.1 30.7 27.1 Sitakunda 27.4 29.1 32.3 35.1 33.7 32.1 31.7 30.7 32.3 31.3 31.4 28.3
Source: Bangladesh Metrological Department. 60

2.06 Monthly Average Normal Rainfall in Bangladesh in Selected Station, 1981-2012 (Millimeter)
Station Month Yearly Jan Feb Mar Apr May June July Aug Sep Oct Nov Dec
Dhaka 8 22 64 141 288 347 388 303 340 180 31 13 177 Tangail 6 25 45 111 262 315 335 251 288 172 26 12 154 Mymensingh 7 19 41 141 334 403 470 340 330 215 18 10 194 Faridpur 7 26 51 115 229 318 338 294 265 160 35 13 154 Madaripur 8 23 53 117 236 372 391 329 266 157 34 5 165 Srimangal 6 30 91 209 428 409 341 338 283 174 36 13 196 Sylhet 7 36 141 385 582 7770 794 626 555 195 30 13 344 Bogra 8 13 20 76 211 327 370 288 300 161 10 10 149 Dinajpur 11 11 13 70 226 365 451 360 362 162 8 9 170 Ishurdi 6 21 34 77 173 236 308 225 293 114 16 9 126 Rajshahi 8 14 24 56 141 242 313 248 272 119 13 10 121 Rangpur 10 12 27 118 277 466 476 344 377 187 9 8 192 Sydpur 10 6 27 92 251 462 438 330 386 179 11 6 183 Chuadanga 11 21 27 40 148 229 344 210 315 133 17 9 125 Jessore 14 25 46 72 188 315 336 276 278 139 31 12 144 Khulna 13 33 52 78 183 331 322 305 290 157 38 6 150 Mongla 11 27 45 57 178 346 381 316 331 185 43 3 160 Satkhira 14 31 41 86 159 294 345 300 299 146 32 7 146 Barisal 11 25 54 104 206 399 424 354 284 192 49 6 175 Bhola 8 25 50 116 241 458 458 374 307 191 42 7 189 Khepupara 10 26 46 87 260 484 631 468 398 277 60 8 229 Patuakhali 9 25 44 111 235 538 598 454 378 225 47 4 222 Chandpur 6 22 64 142 277 369 434 361 285 170 38 7 181 Teknaf 4 14 16 60 291 1000 1119 926 446 259 82 16 352 Chittagong 8 24 57 131 319 580 760 531 239 204 60 14 243 Commilla 8 21 67 142 322 366 407 301 254 166 34 10 174 Cox’s Bazar 5 21 32 98 338 851 961 685 402 224 92 15 310 Feni 6 26 64 163 368 527 705 513 358 208 46 9 249 Hatiya 5 19 44 117 279 624 703 537 407 262 49 12 254 Kutubdia 7 23 45 82 277 633 793 518 324 213 71 9 249 M. Court 11 24 73 143 338 567 747 608 400 218 46 7 265 Rangamati 5 22 64 131 342 473 549 434 292 170 55 13 212 Sandwip 11 23 66 134 368 686 884 606 460 277 54 8 298 Sitakunda 5 19 72 156 352 560 733 580 400 274 54 7 267 Ambagan (Ctg) 8 7 26 95 370 646 673 472 294 263 49 16 243
Source: Bangladesh Metrological Department. 61

2.07 Standard Minimum Normal Temperature in Bangladesh, 1981-2012 (Celsius) Station Month Annual
Period Jan Feb Mar Apr May June July Aug Sep Oct Nov Dec Dhaka 13.1 16.2 20.8 23.8 24.8 26.2 26.3 26.4 25.9 23.9 19.4 14.8 21.8 Tangail 11.4 14.4 18.9 22.8 24.0 25.6 26.1 26.3 25.7 23.5 18.5 13.5 20.9 Mymensingh 11.9 14.9 18.9 22.3 23.7 25.6 26.1 26.3 25.6 23.3 18.2 13.5 20.9 Faridpur 12.2 15.1 19.7 23.4 24.5 25.8 25.9 26.2 25.9 24.0 19.3 14.2 21.3 Madaripur 12.2 15.1 19.7 23.4 24.5 25.8 25.9 26.2 25.9 24.0 19.3 14.2 21.3 Srimangal 10.0 12.5 17.5 21.3 22.9 24.8 25.1 25.3 24.7 22.2 16.7 11.9 19.6 Sylhet 12.9 14.8 18.7 21.1 22.9 24.8 25.1 25.3 24.7 22.2 16.7 11.9 19.6 Bogra 11.7 14.4 19.0 22.6 24.1 25.8 26.2 26.4 25.7 23.3 18.3 13.7 20.9 Dinajpur 10.4 13.0 17.3 21.1 23.2 25.1 25.7 26.2 25.3 22.3 16.7 12.2 19.9 Ishurdi 104 13.3 18.2 23.0 24.4 25.8 26.0 26.2 25.6 23.0 17.5 12.4 20.5 Rajshahi 10.6 13.2 17.9 22.8 24.3 25.8 26.1 26.2 25.6 22.9 17.5 12.6 20.5 Rangpur 10.9 13.2 17.3 21.2 23.3 25.3 26.0 26.3 25.3 22.6 17.4 13.0 20.1 Sydpur 10.7 13.5 17.5 21.3 23.4 25.2 26.1 26.3 25.4 22.6 17.4 12.8 20.2 Chuadanga 10.7 14.3 19.0 23..7 25.1 26.1 26.2 26.3 25.6 23.4 18.0 12.6 20.9 Jessore 11.2 14.7 19.6 23.6 25.0 26.0 26.0 260 25.5 23.1 17.8 12.6 20.9 Khulna 12.2 15.6 20.5 24.2 25.3 26.2 26.2 26.3 25.9 24.1 19.4 14.0 21.7 Mongla 13.9 17.5 22.0 25.0 26.0 26.5 26.3 26.4 26.0 24.5 20.5 15.7 22.5 Satkhira 12.1 15.9 20.7 24.4 25.6 26.4 26.2 26.2 25.7 23.5 18.3 13.3 21.5 Barisal 12.0 15.4 20.5 23.8 24.9 25.8 25.7 25.8 25.4 23.7 18.9 13.6 21.3 Bhola 12.6 16.0 21.0 24.1 25.2 26.1 25.9 26.1 25.7 24.0 19.4 14.4 21.7 Khepupara 13.6 16.9 21.8 24.8 25.8 26.3 25.9 26.0 25.7 24.3 20.1 15.3 22.1 Patuakhali 13.6 16.7 21.2 24.2 25.4 26.2 26.0 26.1 25.8 24.2 20.1 15.2 22.1 Chandpur 13.5 16.1 20.7 23.7 24.8 25.9 25.9 26.1 25.8 24.2 20.0 15.3 21.8 Teknaf 15.0 17.0 20.7 24.1 25.4 25.5 25.2 25.2 25.2 24.3 21.1 16.9 22.1 Chittagong 14.1 16.3 20.6 23.6 24.9 25.4 25.2 25.3 25.2 24.1 20.3 15.8 21.7 Commilla 12.1 15.5 19.7 22.7 24.1 25.4 25.5 25.6 25.2 23.5 18.5 13.4 20.9 Cox’s Bazar 15.4 17.6 21.2 24.2 25.3 25.4 25.3 25.3 25.1 24.5 21.1 17.0 22.3 Feni 12.7 15.8 20.4 23.4 24.5 25.4 25.2 25.3 25.1 23.5 19.0 14.4 21.2 Hatiya 14.1 16.8 21.1 24.0 25.1 25.7 25.5 25.6 25.4 24.4 20.3 15.8 22.0 Kutubdia 15.0 17.4 21.2 24.2 25.4 25.7 25.5 25.6 5.5 24.5 220.8 16.7 22.3 M. Court 13.7 16.3 20.4 23.6 24.9 25.8 25.7 25.8 25.7 24.5 20.5 15.8 21.9 Rangamati 13.0 15.1 19.4 22.7 24.0 24.9 24.8 24.8 24.6 23.4 19.7 15.3 21.0 Sandwip 14.2 16.9 21.5 24.4 25.3 25.7 25.4 25.5 25.4 24.4 20.4 15.9 22.1 Sitakunda 12.0 14.9 19.8 23.5 24.7 25.5 25.4 25.4 25.2 23.6 18.8 13.8 21.0 Ambagan (Ctg) 14.3 17.2 21.3 24.5 255.0 25.6 25.5 25.5 25.4 24.3 20.1 16.1 22.1 Source: Bangladesh Metrological Department.
62

2.08 Standard Maximum Normal Temperature in Bangladesh, 1981-2012 (Celsius) Station Month Yearly
Jan Feb Mar Apr May June July Aug Sep Oct Nov Dec Dhaka 25.0 28.3 32.4 33.8 33.3 32.5 31.7 32.0 32.0 31.7 29.7 26.5 30.7 Tangail 23.8 27.4 31.6 33.8 33.3 32.6 31.9 32.2 32.0 31.6 29.4 225.9 30.5 Mymensingh 24.4 27.0 30.6 31.8 31.7 31.5 31.1 31.6 31.3 31.3 29.4 26.1 29.8 Faridpur 24.4 27.9 32.5 34.3 33.7 32.5 31.5 31.7 31.8 31.6 29.2 25.9 30.6 Madaripur 25.2 28.5 32.5 34.1 33.9 32.7 31.8 32.1 32.3 32.1 29.9 26.6 31.0 Srimangal 25.1 28.0 31.6 62.9 32.1 32.1 32.1 32.5 32.1 31.5 29.3 26.6 30.5 Sylhet 25.5 27.7 30.6 31.0 31.1 31.3 31.5 32.1 31.6 31.4 29.5 26.6 30.0 Bogra 24.5 27.4 31.4 33.5 33.2 32.7 32.0 32.4 32.1 31.8 30.1 26.5 30.6 Dinajpur 23.0 26.5 30.9 32.8 32.6 32.5 31.9 32.3 31.7 31.0 28.9 25.3 29.9 Ishurdi 24.1 27.7 32.8 35.4 34.6 33.5 32.3 32.5 32.3 31.7 29.4 25.9 31.0 Rajshahi 24.0 27.9 33.1 36.0 35.0 33.8 32.4 32.7 32.5 31.6 29.3 25.7 31.2 Rangpur 23.1 26.2 30.4 31.6 31.7 31.8 31.7 32.1 31.5 30.7 28.4 25.0 29.5 Sydpur 22.8 26.5 30.8 32.2 32.4 32.2 32.0 32.4 32.0 31.1 28.8 25.3 29.5 Chuadanga 24.4 28.4 33.3 36.1 35.7 34.1 32.8 33.0 32.8 32.2 29.9 26.1 31.6 Jessore 25.4 28.9 33.3 35.8 35.4 33.7 32.5 32.7 32.8 32.5 30.3 26.8 31.7 Khulna 25.3 28.7 32.9 34.7 34.6 33.1 32.0 32.1 32.3 32.0 29.8 26.5 31.2 Mongla 25.3 28.8 32.8 34.7 34.5 32.8 31.7 31.8 31..9 31.6 29.5 26.5 31.0 Satkhira 25.5 28.8 32.9 35.0 35.2 33.5 32.2 32.2 32.3 32.2 30.1 26.8 31.4 Barisal 25.5 28.5 32.3 33.5 33.3 32.0 31.1 31.4 31.6 31.7 29.7 26.7 30.6 Bhola 25.8 28.4 31.8 32.9 32.9 31.6 30.8 31.2 31.3 31.6 29.8 26.8 30.4 Khepupara 25.8 28.6 31.8 32.7 32.8 3.5 30.6 30.8 31.1 31.3 29.5 26.9 30.3 Patuakhali 25.6 28.6 32.2 33.4 33.3 31.8 30.9 31.2 31.6 31.6 29.5 26.7 30.5 Chandpur 24.6 27.9 31.7 33.0 33.1 32.1 31.4 31.7 31.7 31.5 29.4 26.1 30.3 Teknaf 27.3 29.0 31.0 32.1 32.3 30.5 29.9 30.1 30.8 31.5 30.2 28.1 30.2 Chittagong 26.0 28.2 30.8 31.9 32.3 31.6 30.9 31.3 31.7 31.7 29.9 27.1 30.3 Commilla 25.1 277 30.8 32.4 32.6 31.8 31.2 31.8 31.9 31.5 29.6 26.6 30.3 Cox’s Bazar 27.0 29.1 31.5 32.7 32.8 31.2 30.4 30.8 31.4 31.9 30.5 28.1 30.6 Feni 25.7 28.3 31.3 32.2 32.3 31.2 30.5 31.1 31.4 31.4 29.8 26.9 30.2 Hatiya 25.2 27.9 30.9 32.1 32.1 30.8 30.0 30.5 30.8 31.0 29.2 26.4 29.7 Kutubdia 25.5 27.4 30.1 31.7 32.3 31.0 30.2 30.6 31.1 31.4 29.9 27.2 29.9 M. Court 25.1 27.9 31.4 32.9 32.8 31.5 30.7 31.1 31.4 31.4 29.4 26.2 30.2 Rangamati 25.8 28.8 32. 333.3 33..0 31.7 31.1 31.7 31.9 31.6 29.3 26.5 30.6 Sandwip 25.3 27.5 30.2 31.4 31.7 30.8 30.1 30.5 31.0 31.3 29.4 26.5 29.6 Sitakunda 26.6 28.9 31.3 32.2 32.4 31.3 30.6 31.2 31.8 32.1 30.3 27.7 30.5 Ambagan (Ctg) 27.3 30.2 32.3 32.9 32.7 31.5 31.0 31.5 32.0 32.4 31.0 28.5 31.1
Source: Bangladesh Metrological Department. 63

2.09 Water Level of Major Rivers at Selected Stations of Bangladesh (Metre)
2010-11 2011-12 2012-13
River Station Name & Station ID Highest Lowest Highest Lowest Highest Lowest
Ganges-Padma Hardinge Bridge, SW 90 13.69 4.68 13.78 5.25 13.56 5.10
Gumti Comilla, SW110 11.25 6.56 10.95 6.58 10.60 6.64
Matamuhuri Lama, SW 203 11.45 6.39 14.06 6.56 14.65 6.38
Meghna-Surma Bhairab Bazar SW 273 5.94 1.12 6.08 1.17 5.96 1.20
Muhuri Parsuram SW 212 13.90 8.49 12.48 8.37 13.90 8.25
Surma-Meghna Sylhet, SW 267 11.54 2.17 10.90 2.17 11.97 2.30
Teesta Kaunia, SW 294 29.44 25.50 29.20 25.54 29.31 25.40
Gumti Daudkandi 6.67 1.67 5.59 1.04 5.57 1.36
Brahmaputra-
Jamuna
Sirajganj, SW 49 13.83 6.69 13.42 6.74 13.98 6.35
Brahmaputra-
Jamuna
Bahadurabad, SW 46.92 19.80 13.21 19.65 12.61 20.56 12.32
Ganges-Padma Goalundo 9.12 2.40 8.86 2.71 9.17 2.32
Note: Water year (April-March) Source: Bangladesh Water Development Board.
64

65
2.10 Physiograhpy of Bangladesh
Class SQ.K.M % Old Himalyan Floodplain 4008 2.77 Tista Floodplain 10304 7.11 Korotoya Floodplain 2572 1.78 Lower Atrai Basin 851 0.59 Lower Punarbhaba Floodplain 129 0.09 Brahmapuyta Floodplain 16344 11.28 Ganges River Floodplain 24504 16.92 Ganges Tidal Floodplain 17066 11.78 Gopalgonj Khulna beels 2247 1.55 Arial Beel 144 0.10 Meghna River Floodplain 2464 1.70 Meghna Estuarine Floodplain 17011 11.74 Sylhet Basin/Surma-Kusiara Floodplain
9195 6.35
Northern & Eastern Piedmont Plains 4038 2.79 Chittagong Coastal Plain 3720 2.57 St, Martin Coral Island 8 0.01 Barind Tract 7727 5.33 Madhupur Tract 4244 2.93 North a Eastern Hills 18172 12.54 Akhaura Terrace 113 0.08 Source: FAO, 1988, Land Resource Sappraisal of Bangladesh for Agricultural Development, report 2, Agro ecological Regions of Bangladesh.
82

66
2.11 Land Type of Bangladesh
Class Area (Hectore)
High Land (H) or (FO) 4199952
Medium Hig Land (MH) or (F1) 5039724
Medium Low Land (ML) or (F2) 1991102
Low Land (L) or (F3) 1101560
Very Low Land (VL) or (F4) 193243
Other 2178045
Total 14483626
Source: FAO, 1988, Land Resource Sappraisal of Bangladesh for Agricultural Development, Report 2, Agro ecological Regions of Bangladesh.

67
2.12 Agro-Ecological Zone of Bangladesh
No. Class Total Area
(Sq.K.M)
Soils Character
Type*
Sent% Alluvium%
Clay %
1. Old Himalyan Piedmont Plain 4008 1 10 82 8 2. Tista Active 836 2 41 59 0 3. Tista Meander Floodplain 9468 3 6 88 6 4. Korotoya Bangali Floodplain 2572 3 8 65 27 5. Lower Atrai Basin) 851 4 0 16 84 6. Lower Punarbhaba Floodplain 129 5 0 0 100 7. Active Brahmaputra Jamuna Floodplain 3190 2 27 72 1 8. Young Brahmaputr-Jamuna Floodplain 5924 3 6 79 15 9. Old Brahmaputra Floodplain 7230 4 2 51 47 10. Active Ganges Floodplain 3334 6 8 80 12 11. High Ganges Floodplain 13205 4 1 51 48 12. Lower Ganges Floodplain 7968 4 0 48 52 13. Ganges Tidal Floodplain 17066 3 0 17 83 14. Gopalgong Khulna Beels 2247 4 0 15 57 15. Arial Beel 144 4 0 8 92 16. Middle Megna Floodplain 1555 3 14 59 27 17. Lower Meghna Floodplain 909 7 0 50 50 18. Young Meghna Estuarine Floodplain 9269 6 0 98 2 19. Old Meghna Estuarine Floodplain 7740 3 0 90 10 20. Eastern Surma Kusiara Floodplain 4622 3 1 25 74 21. Sylhet Basin 4573 3 1 12 87 22. Northern & Eastern Piedmont Plains 4038 5 4 4 51 23. Chittagong Coastal Plain 3720 3 3 82 15 24. St. Martin Coral Island 8 8 96 2 0 25. Level Barind Tract 5049 9 0 3 97 26. High Baring Tract 1600 10 0 13 87 27. North Eastern Barind Tract 1076 10 0 2 98 28. Madhupur Tract 4244 9 0 13 87 29. North and Eastern Hills 18171 11 9 67 4 30 Akhaura Terrace 113 12 0 31 63
Type of Soile: 1. Non-calcareous brown, 2. Non-calcareous alluvium, 3. Non- calcareous grey, 4. Non-calcareous bark grey, 5. Acid basin dlays, 6. Calcareous alluvium, 7. Calcareous grey, 8. Calcareous alluvim (non salgne), 9. Shallow grey terrace 10. Deep grey terrace, 11. Brow hill, 12. Deep red-brown ferrace Source: FAO, 1988, Land resources Appraisal of Bangladesh for Agricultural Development, Report 2, Agro Ecological Eegions of Bangladesh.

69
Chapter III
AREA POPULATION
HOUSEHOLD AND HOUSING CHARACTERISTICS

70

71
3.01 Administrative Units by Zila, 2011
Division/Zila
Area in Square
Kilometre
Number of Upazila/ Thana*
Union
Village Pauras- hava
Barisal Division 13226 40 349 4097 24
1. Barisal 2785 10 85 1116 5
2. Bhola 3404 7 68 438 5
3. Jhalakati 707 4 32 455 2
4. Pirojpur 1278 7 51 648 3
5. Barguna 1831 5 42 562 4
6. Patuakhali 3221 7 71 878 5
Chittagong Division 33908 112 947 15219 59
7. Bandarban 4479 7 30 1554 2
8. Khagrachhari 2749 8 38 1702 3
9. Rangamati 6116 10 49 1555 2
10. Chittagong 5283 26 194 1267 10
11. Cox's Bazar 2492 8 71 989 4
12. Brahmanbaria 1881 9 100 1323 4
13. Chandpur 1646 8 88 1230 7
14. Comilla 3146 16 185 3532 10
15. Feni 991 6 43 553 5
16. Lakshmipur 1441 5 58 547 4
17. Noakhali 3686 9 91 967 8
Sylhet Division 12635 38 333 10250 19
18. Habiganj 2637 8 77 2142 6
19. Moulvibazar 2799 7 67 2015 5
20. Sunamganj 3747 11 87 2887 4
21. Sylhet 3452 12 102 3206 4
Dhaka Division 31178 163 1256 25213 85
22. Dhaka 1464 46 86 1999 3
23. Gazipur 1807 5 44 1114 5 Contd.
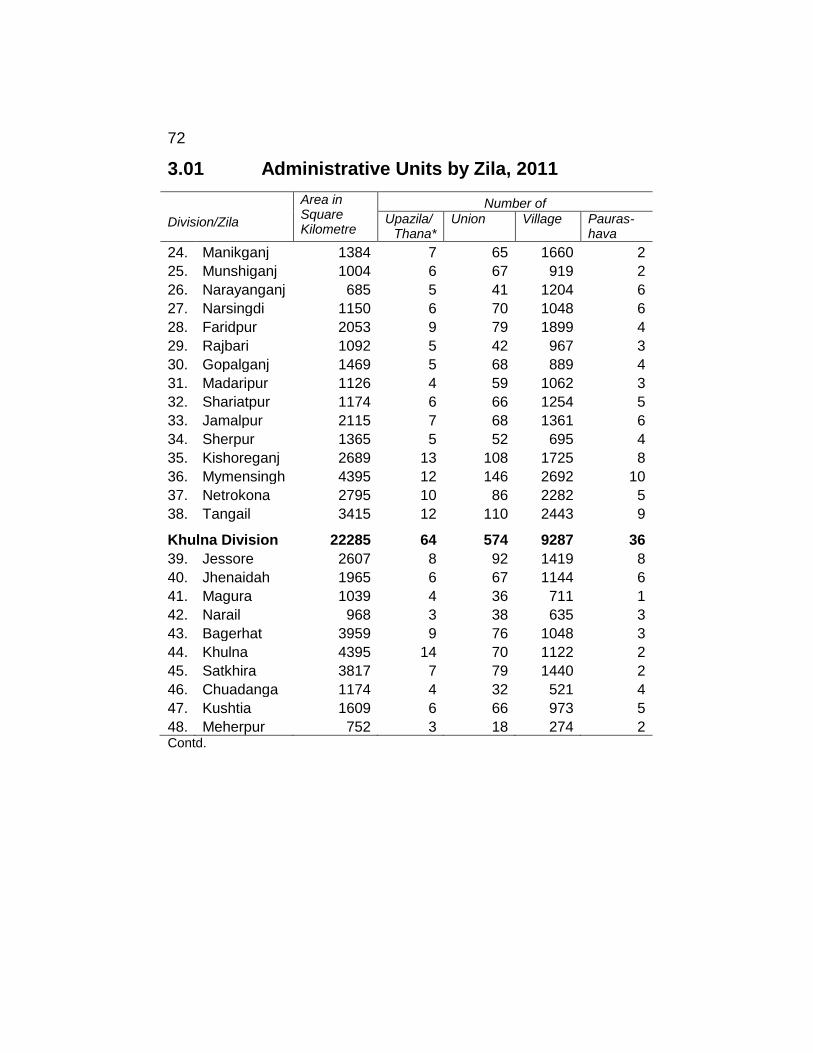
72
3.01 Administrative Units by Zila, 2011
Division/Zila
Area in Square Kilometre
Number of Upazila/
Thana* Union
Village Pauras-
hava
24. Manikganj 1384 7 65 1660 2
25. Munshiganj 1004 6 67 919 2
26. Narayanganj 685 5 41 1204 6
27. Narsingdi 1150 6 70 1048 6
28. Faridpur 2053 9 79 1899 4
29. Rajbari 1092 5 42 967 3
30. Gopalganj 1469 5 68 889 4
31. Madaripur 1126 4 59 1062 3
32. Shariatpur 1174 6 66 1254 5
33. Jamalpur 2115 7 68 1361 6
34. Sherpur 1365 5 52 695 4
35. Kishoreganj 2689 13 108 1725 8
36. Mymensingh 4395 12 146 2692 10
37. Netrokona 2795 10 86 2282 5
38. Tangail 3415 12 110 2443 9
Khulna Division 22285 64 574 9287 36
39. Jessore 2607 8 92 1419 8
40. Jhenaidah 1965 6 67 1144 6
41. Magura 1039 4 36 711 1
42. Narail 968 3 38 635 3
43. Bagerhat 3959 9 76 1048 3
44. Khulna 4395 14 70 1122 2
45. Satkhira 3817 7 79 1440 2
46. Chuadanga 1174 4 32 521 4
47. Kushtia 1609 6 66 973 5
48. Meherpur 752 3 18 274 2 Contd.

73
3.01 Administrative Units by Zila, 2011
Division/Zila
Area in Square
Kilometre
Number of Upazila
Union
Village Pauras- hava
Rajshahi Division 18154 70 564 14075 59
49. Bogra 2899 12 110 2618 11
50. Joypurhat 1018 5 32 887 4
51. Pabna 2376 9 73 1562 9
52. Sirajganj 2402 9 82 2016 6
53. Naogaon 3436 11 99 2799 3
54. Natore 1900 6 52 1351 8
55. Nawabganj 1703 5 45 1135 4
56. Rajshahi 2425 13 71 1727 14
Rangpur Division 16185 58 539 9050 20
57. Dinajpur 3444 13 101 2131 8
58. Panchagarh 1403 5 43 825 2
59. Thakurgaon 1782 5 51 641 3
60. Gaibandha 2115 7 82 1250 3
61. Kurigram 2245 9 72 1872 3
62. Lalmonirhat 1247 5 45 478 2
63. Nilphamari 1547 6 61 361 4
64. Rangpur 2401 8 84 1492 3
Bangladesh 147570 545 4562 87191 310 Source: Bangladesh Population and Housing Census 2011, Community Report.

74
3.02 Zila-wise Household and Population of Bangladesh, 2011 Name of Zila
House- holds ('000')
Population Size of H/H
Sex Ratio M/F
Male ('000')
Female ('000')
Total ('000')
BANGLADESH 32174 72110 71934 144044 4.44 100
Rangpur Division 3818 7882 7906 15788 4.11 100
1. Panchagarh 229 497 491 988 4.31 101
2. Thakurgaon 221 701 689 1390 4.31 102
3. Dinajpur 716 1506 1482 2990 4.14 102
4. Nilphamari 422 923 911 1834 4.34 101
5. Lalmonirhat 290 629 627 1256 4.31 100
6. Rangpur 720 1444 1437 2881 3.96 100
7. Kurigram 508 1010 1059 2069 4.06 95
8. Gaibandha 612 1169 1210 2379 3.88 97
Rajshahi Division 4487 9257 9228 18485 4.09 100
9. Joypurhat 243 459 454 914 3.74 101
10. Bogra 867 1709 1692 3401 3.88 101
11. Naogaon 657 1300 1300 2600 3.95 100
12. Natore 424 854 852 1707 4.01 100
13. Nawabganj 358 810 837 1648 4.59 97
14. Rajshahi 634 1310 1285 2595 4.31 102
15. Sirajganj 715 1551 1546 3097 4.03 100
16. Pabna 591 1263 1260 2523 4.25 100
Khulna Division 3740 7843 7845 15688 4.17 100
17. Kushtia 477 974 973 1947 4.06 100
18. Meherpur 166 325 331 655 3.95 98
19. Chuadanga 277 565 564 1129 4.05 100
20. Jhenaidah 422 886 885 1771 4.17 100 Contd.

75
3.02 Zila-wise Household and Population of Bangladesh, 2011 Name of Zila
House- holds ('000')
Population Size of H/H
Sex Ratio M/F
Male ('000')
Female ('000')
Total ('000')
21. Magura 206 455 464 918 4.44 98
22. Narail 163 354 368 722 4.42 96
23. Jessore 656 1386 1378 2765 4.17 101
24. Satkhira 470 983 1003 1986 4.21 98
25. Khulna 547 1176 1143 2319 4.19 103
26. Bagerhat 354 740 735 1476 4.13 101
Barisal Division 1863 4090 4236 8326 4.45 97
27. Pirojpur 256 548 565 1113 4.32 97
28. Jhalakati 158 329 354 683 4.80 93
29. Barisal 514 1137 1187 2324 4.49 96
30. Bhola 373 884 893 1777 4.76 99
31. Patuakhali 346 753 782 1536 4.41 96
32. Barguna 216 437 455 893 4.12 96
Dhaka Division 10849 24172 23252 47424 4.32 104
33. Netrokona 479 1111 1118 2230 4.64 99
34. Mymensingh 1155 2539 2571 5110 4.39 99
35. Sherpur 341 676 682 1358 3.97 99
36. Jamalpur 563 1129 1164 2293 4.06 97
37. Tangail 870 1757 1847 3605 4.10 95
38. Kishoreganj 627 1432 1480 2912 4.62 97
39. Manikganj 325 676 717 1393 4.26 94
40. Dhaka 2786 6556 5488 12044 4.21 119 Contd.

76
3.02 Zila-wise Household and Population of Bangladesh, 2011
Name of Zila
House- holds ('000')
Population Size of
H/H
Sex Ratio M/F
Male ('000')
Female ('000')
Total ('000')
41. Gazipur 826 1775 1629 3404 4.07 109
42. Narsingdi 3335 1103 1122 2225 4.62 98
43. Narayanganj 676 1521 1427 2948 4.34 107
44. Munshiganj 313 722 724 1446 4.55 100
45. Faridpur 420 942 970 1913 4.51 97
46. Rajbari 238 520 530 1050 4.39 98
47. Gopalganj 250 578 595 1172 4.66 97
48. Madaripur 252 575 591 1166 4.61 97
49. Shariatpur 248 559 597 1156 4.66 94
Sylhet Division 1791 4933 4977 9910 5.52 99
50. Sunamganj 440 1236 1231 2468 5.58 100
51. Sylhet 596 1727 1707 3434 5.74 101
52. Moulvibazar 361 945 974 1919 5.30 97
53. Habiganj 393 1026 1063 2089 5.30 96
Chittagong Division 5626 13933 14490 28423 5.01 96
54. Brahmanbaria 539 1367 1474 2840 525 93
55. Comilla 1054 2575 2812 5387 507 92
56. Chandpur 506 1146 1270 2416 4.76 90
57. Lakshmipur 365 828 901 1729 4.71 92
58. Noakhali 594 1485 1622 3108 5.20 92
59. Feni 278 694 743 1437 5.12 93
60. Chittagong 1532 3839 3777 7616 4.92 102
61. Cox's Bazar 416 1170 1120 2290 5.45 104
62. Khagrachhari 134 314 300 614 4.53 105
63. Rangamati 128 313 283 596 4.56 111
64. Bandarban 80 203 185 388 4.75 110 Note : Total May not tally because of rounding. Source: Bangladesh Population and Housing Census-2011, Community Report.

3.03 Household and Population of Municipalities, 2011
Municipality Area (sq.km)
H/H
Population (000) Sex Ratio
Literacy 7+yrs Both Sex Male Fe-male
Bangladesh Barisal Division 1. Bakerganj 6.22 3395 15418 7644 7774 98 76.7 2. Banaripara 1.81 2373 10366 5365 5001 107 88.5 3. Gaurnadi 16.83 9417 42438 21205 21233 100 68.9 4. Barisal 58.05 72709 328278 169475 158803 107 75.3 5. Mehendiganj 14.97 6329 30067 14535 15532 94 64.3 6. Bhola 22.66 9635 47477 24493 22984 107 76.0 7. Muladi 16.96 4528 20490 10215 10275 99 62.6 8. Burhanuddin 3.22 2649 13110 6753 6357 106 69.0 9. Charfasson 9.49 4088 19595 10122 9473 107 75.4 10. Daulat Khan 2.49 3230 16728 85.35 8193 104 48.1 11. Lalmohon 6.53 4218 20522 10388 10134 103 60.3 12. Jhalakati 16.13 12399 54029 27528 26501 104 77.9 13. Nalchity 23.32 7053 30805 14706 16099 91 66.1 14. Mathbaria 4.01 4330 18375 9124 9251 99 77.9 15. Kuakata 4.14 2065 9177 5043 4134 122 57.6 16. Pirojpur 29..49 13646 60056 30048 30008 100 77.8 17. Sworup kati 4.98 3985 20019 10865 9154 119 79.3 18. Amtoli 7.79 4067 17311 8701 8610 101 68.7 19. Barguna 15.57 7353 32235 16697 15538 107 75.9 20. Betagi 4.10 2526 10204 5111 5093 100 76.4 21. Patharghata 7.21 4457 17177 8637 8540 101 72.5 22. Galachipa 3.39 4967 21200 10888 10312 106 71.5 23. Kalapara 3.75 4347 17332 8887 8445 105 75.1 24. Patuakhali 12.66 13994 65000 33630 31370 107 75.8 25. Bauphal 7.96 2538 11435 5653 5782 98 75.8 77 Contd.

3.03 Household and Population of Municipalities, 2011
Municipality Area (Sq.km)
H/H (000)
Population Sex Literacy 7+yrs Both
Sex Male Fe-
male Ratio
Chittagong Div. 26. Chittagong City Corp 155.40 556451 2582401 1360695 1221706 111 68.7 27. Bandarban 13.05 8699 41434 23191 18243 127 67.1 28. Lama 13.87 3996 19014 9850 9164 107 50.3 29. Baroiarhat 2.12 2399 11602 5983 5619 106 54.8 30. Banshkhali 28.42 7378 36910 18049 18861 96 42.3 31. Chandnaish 26.83 6852 35248 17014 18234 93 61.4 32. Mirersharai 10.49 3507 16218 7695 8523 97 60.1 33. Patia 9.95 10613 55323 29191 26132 112 64.3 34. Rangunia 11.82 6541 32641 16115 16526 98 60.2 35. Raozan 27.15 11460 59148 29546 29602 100 63.3 36. Sandwip 30.03 8278 41365 19195 22170 87 51.3 37. Satkania 12.51 8548 45001 20909 24092 87 61.4 38. Sitakunda 27.97 9017 45147 22759 22388 102 62.1 39. Chakaria 15.76 13163 72669 37328 35341 106 61.3 40. Cox' s Bazar 7.94 31431 167477 94279 73198 129 55.7 41. Teknaf 4.04 4752 25056 13296 11760 113 40.9 42. Mahesh khali 7.70 5061 27321 14069 13252 106 43.7 43. Akhaura 8.22 7453 36262 17855 18407 97 61.8 44. Brahman baria 17.60 33517 172017 85323 86694 98 66.0 45. Kasba 16.86 7757 40416 19749 20667 96 56.0 46. Nabi Nagar 14.14 10539 53157 25343 27814 91 51.2 47. Chandpur 22.91 33322 159021 79799 79222 101 67.4
Contd. 78

3.03 Household and Population of Municipalities, 2011
Municipality Area (Sq.km)
H/H (000)
Population Sex Literacy 7+yrs Both Sex Male Fe-
male Ratio
48. Faridganj 19.69 7552 35090 16626 18464 90 60.1 49. Hajiganj 20.25 12679 63892 31735 32157 99 66.2 50. Kachua 11.23 5125 27024 13371 13653 98 63.3 51. Matlab 30.92 13682 59286 28051 31235 90 63.0 52. SengerChar 27.23 7884 36691 18093 18598 97 59.2 53. Shahrasti 15.65 5815 28287 13695 14592 94 67.0 54. Barura 23.13 9807 49126 24318 24808 98 52.8 55. Chauddagram 16.64 7629 38317 18838 19479 97 63.0 56. Chandina 15.12 9315 46823 22734 24089 94 59.3 57. Daudkandi 13.18 9400 46256 22887 23369 98 57.4 58. Comilla Sader Dakshin 30.87 20209 103710 54196 49514 109 69.3 59. Comilla Addarsha Sader 11.47 46669 235423 123104 112319 110 75.8 60. Debidwar 21.05 11901 61418 29300 32118 91 60.6 61. Homna 11.73 5905 29173 14302 14871 96 46.4 62. Laksham 19.86 14079 70632 35063 35569 99 60.3 63. Khagra chhari 13.05 10247 47278 25583 21695 118 71.0 64. Dagan bhuiyan 12.76 6144 32080 16089 15991 101 65.1 65. Chhagalnaiya 25.25 8902 45177 22337 22840 98 63.4 66. Feni 22.00 31468 156971 82554 74417 111 69.7 67. Parshuram 22.38 5950 29691 14456 15235 95 59.1 68. Sonagazi 5.33 3784 19866 9760 10106 97 62.8 69. Lakshmipur 19.42 17009 83112 42162 40950 103 63.9 70. Raipur 10.02 6593 30756 15065 15691 96 60.8 71 Ramganj 26.16 9055 44775 21505 23270 92 63.1 79 Contd.

3.03 Household and Population of Municipalities, 2011 Municipality Area
(Sq.km) H/H
(000) Population Sex Literacy
7+yrs BothSex Male Female Ratio
72. Begumganj 14.48 14568 80001 42062 37939 111 67.2 73. Chatkhil 13.81 6084 31395 15258 16137 95 70.1 74. Hatia 30.56 9026 44802 21592 23210 93 57.2 75 Kabirhat 9.74 3240 17448 8224 9224 \89 61.7 76. Noakhali 16.67 20222 107654 54948 52706 104 75.3 77. Sonaimuri 13.11 6162 34218 16590 17628 94 62.0 78 Senbagh 8.01 3613 19065 9137 9928 92 63.6 79. Bashurhat 6.85 5512 29877 14800 15077 98 62.5 80. Matiranga 25.50 5023 23913 12255 11658 105 60.4 81. Ramgati 20.87 5161 24854 12865 11989 107 59.6 82. Rangamati 11.81 4735 24016 11955 12061 99 51.9 83. Baghaichari 18.78 2774 13807 7304 6503 112 57.1 84. RangamatiSadar 64.75 18355 84000 44925 39075 115 73.1 85. Nangal kot 13.06 5194 26719 12966 13753 94 52.6
Dhaka Division 86. Sreepur 46.9 31470 126249 67160 59089 114 63.3
87. Dhamrai 6.98 14380 56777 28986 27791 104 66.7
88. Gazipur 47.23 43909 179037 93616 85421 110 67.9
89. Tongi 32.07 120624 406420 255236 151184 169 67.7
90. Dhaka City Cor. 126.34 1576746 6970105 3876586 3093519 126 74.6
91. Savar 13.54 74515 286008 148958 137050 109 74.9
92. Dohar 11.28 5056 36434 17735 18699 95 61.5
93. Manikganj 23.13 16459 71698 36084 35614 101 69.1
94. Singair 16.56 6102 26885 12961 13924 93 55.8
95. Narayanganj 12.69 66045 286330 148214 138116 107 67.7
96. Shiddirganj 22.71 60290 256760 132698 124062 107 66.5
97. Sonargaon 9.06 7289 32796 16812 15984 105 62.6 80 Contd.

3.03 Household and Population of Municipalities, 2011 Municipality Area
(Sq.km)
H/H (000)
Population Sex Ratio
Literacy 7+yrs Both Sex Male Female
98. Tarabo 19.39 38612 150709 81088 69621 116 57.7 99. Mirkadim 2.87 9912 42145 22744 21401 106 58.9 100. Munshiganj 17.74 15133 70674 35868 34806 103 65.2 101. Narsingdi 14.75 32361 146115 75179 70936 105 67.8 102. Raypura 7.61 7282 34904 16779 18125 93 52.6 103. Shipbur 4.85 4278 20272 10080 10192 99 58.8 104. Durgapur 13.31 5687 24306 12298 12008 102 60.1 105. Madhabdi 5.10 11323 49583 28865 20718 139 66.0 106. Monohardi 6.66 4159 17635 8609 9026 95 63.9 107. Ghorasal - 18868 85949 44624 41325 108 66.6 108. Bhanga 12.43 7505 34148 16934 17214 98 61.5 109. Boalmari 13.42 6016 27595 13748 13847 99 54.6 110. Faridpur 19.07 27384 121632 62144 59488 104 77.3 111. Nagarkanda 8.25 2556 11872 5978 5894 101 54.3 112. Gopalganj 14.25 11600 51346 26369 24977 106 78.6 113. Kotalipara 2.05 1240 5808 2953 2855 103 78.0 114. Muksudpur 16.77 4312 19711 9822 9889 99 61.8 115. Tungipara 2.59 1754 8596 4370 4226 103 63.0 116. Kalkini 27.79 8815 41608 20351 21257 96 55.3 117. Pangsha 12.57 6569 29098 14568 14530 100 67.7 118. Rajbari 11.65 12657 55313 28271 28042 101 74.3 119. Bhedarganj 2.14 1791 8169 4021 4148 97 62.7 120. Damudya 5.38 3274 14242 6719 7523 89 64.5 121. Naria 9.64 4957 22773 10819 11954 91 60.5 122. Shariatpur 24.92 10908 49535 25113 24422 103 62.5 123. Zanjira 13.27 4434 21251 10480 10771 97 56.0
81 Contd.

3.03 Household and Population of Municipalities, 2011
Municipality Area (Sq.km)
H/H (000)
Population Sex Literacy 7+yrs Both Sex Male Fe male Ratio
124 Dewanganj 20.25 9418 38027 18570 19457 95 42.6 125 Islampur 16.66 10195 38568 19031 19537 97 47.9 126 Jamalpur 53.28 33845 142764 71418 71346 100 62.1 127 Madarganj 10.78 7957 33169 16188 16981 95 39.1 128 Melendaha 12.95 7615 31320 15880 15440 103 45.7 129 Sharishabari 22.54 12638 52162 25738 26424 97 53.4 130 Nakla 16.41 8067 33086 16134 16952 95 52.6 131 Nalitabari 9.25 6522 27142 13652 13490 101 55.0 132 Sherpur 23.4 22665 97979 49622 48357 103 56.2 133. Sreebardi 10.9 5794 24169 12145 12024 101 38.2 134. Bajitpur 9.57 7821 34898 17561 17337 101 60.4 135. Bhairab 15.71 24057 118992 60284 58708 103 53.6 136. Hossainpur 5.58 5205 23118 11414 11704 98 49.3 137. Karimganj 7.82 5913 26844 13107 13737 95 51.4 138. Katiadi 19.32 9090 40725 19660 21065 93 48.2 139. Pakundia 18.28 6407 28606 13937 14669 95 60.5 140. Kishoreganj 11.30 21879 103798 52534 51264 102 72.5 141. Kuliarchar 11.08 6598 31781 15651 16130 97 43.5 142. Bhaluka 10.4 9787 38774 20239 18535 109 73.8 143. Fhulbaria 15.8 6658 31058 15653 15405 102 54.3 144. Gaffargaon 5.39 6513 29325 14691 14634 100 67.7 145. Gauripur 8.8 5583 25570 12782 12788 100 64.7 146. Ishwarganj 12.41 5917 28631 14593 14038 104 58.0 147 Mymensingh 21.73 54869 258040 132123 125917 105 73.9 148 Muktagachha 12.57 11189 49915 25127 24788 101 60.2 149 Nandail 23.05 7329 33308 16506 16802 98 53.3 82 Contd.

3.03 Household and Population of Municipalities, 2011
Municipality Area (Sq.km)
H/H (000)
Population Sex Literacy 7+yrs Both
Sex Male Fe-
male Ratio
150. Phulpur 10.1 5774 25628 12908 12720 101 53.9 151. Trishal 15.48 7202 34747 17943 16804 107 61.0 152. Bandar 11.28 39302 166291 84262 82029 103 61.8 153. Kanchan 16.97 10912 49468 24309 25159 97 53.4 154. Kendua 10.64 4888 22363 11203 11160 100 53.4 155. Mohanganj 6.97 5786 27193 13636 13557 101 65.8 156. Madan 11.77 3639 17388 8837 8551 103 42.0 157. Netrokona 29.39 19627 91936 46898 45038 104 67.1 158. Gaolanda 4.85 4156 18663 9207 9456 97 58.5 159. Bhuapur 13.69 6854 28708 14565 14143 103 59.0 160. Ghatail 8.88 7668 35245 19590 15655 125 72.1 161. Gopalpur 23.15 12539 50160 24771 25389 98 49.5 162. Kalihati 16.33 8731 37038 18655 18383 101 53.4 163. Dhanbari 25.63 9134 36125 17746 18379 97 52.3 164. Madhupur 25.00 13713 56342 28769 27573 104 56.7 165. Mirzapur 8.5 6129 28602 13147 15455 85 69.7 166. Tangail 33.80 37607 167412 84741 82671 103 71.8 167. Sakhipur 13.77 7473 30028 14896 15132 98 57.6 168. Kaliakair 24.66 42093 157162 83527 73635 113 69.0 169. Kaliganj 5.29 9718 45430 24334 21096 115 60.1 170. Madaripur 14.22 14112 62690 31070 31620 98 73.1 171. Shibchar 8.02 5527 24154 11876 12278 97 65.9
Contd. 83

3.03 Household and Population of Municipalities, 2011
Municipality Area (Sq.km)
H/H (000)
Population Sex Literacy 7+yrs Both
Sex Male Fe-
male Ratio
Khulna Division 172. Jhikargachha 9.43 7890 32774 16045 16729 96 64.4 173. Keshabpur 12.41 6330 26229 13141 13088 100 63.0 174. Jessore 14.71 45930 201796 104753 97043 108 77.8 175. Banapole 11.15 8563 36524 18477 18047 102 56.9 176. Chaugachha 11.63 5144 21422 10783 10639 101 61.6 177. Manirampur 17.65 7017 28138 14215 13923 102 66.1 178. Jhenaidah 40.86 25286 107834 55047 52787 104 68.1 179. Abhay Nagar 25.11 21267 85856 43405 42451 102 63.7 180. Horinakundu 22.78 5385 22011 11024 10987 100 47.3 181. Kaliganj 15.89 10637 45341 22966 22375 103 65.1 182. Kotchandpur 17.04 7943 33094 16467 16627 99 62.3 183. Maheshpur 21.27 6687 27670 13916 13754 101 53.0 184. Sailkupa 20.92 8507 35271 17671 17600 100 54.1 185. Magura 43.92 22105 98355 49065 49290 100 66.0 186. Kalia 17.74 4485 19678 9900 9778 101 52.1 187. Lohagara 17.01 5919 25290 12193 13097 93 76.1 188. Narail 26.90 9945 42299 21338 20961 102 81.7 189. Bagerhat 7.53 11982 49073 24601 24472 101 75.8 190. Mongla 19.40 8927 39837 21607 18230 119 64.1 191. Morrelganj 6.00 5070 21741 10855 10886 100 73.8 192. Khulna City Cor. 50.61 157261 663342 345005 318337 108 73.6 193. Chalna 9.49 3449 14188 7065 7123 99 - 194. Paikgachha 5.53 3788 16017 8204 7813 105 65.9 84 Contd.

3.03 Household and Population of Municipalities, 2011
Municipality Area (Sq.km) H/H (000)
Population Sex Literacy 7+yrs Both
Sex Male Fe-
male Ratio
195. Kalaroa 14.54 6570 27250 13510 13740 98 61.3 196. Satkhira 32.39 26896 113322 57616 55706 103 69.3 197. Alamdanga 9.59 8078 32048 15774 16274 97 63.1 198. Chuadanga 37.37 20472 85786 42940 42846 100 61.7 199. Darshana 24.56 7968 33396 16682 16714 100 59.0 200. Jibannagar 13.03 6699 25518 12770 12748 100 57.4 201. Bheramara 3.99 5274 22124 10940 11184 98 71.4 202. Kumarkhali 10.5 5276 21914 10824 11090 98 63.6 203. Khoksa 6.49 4086 17607 8849 8758 101 58.8 204. Kushtia 13.32 23037 102988 52887 50101 106 74.8 205. Mirpur 9.21 5507 22417 11470 10947 105 56.0 206. Gangai 16.9 6488 25500 12721 12779 100 59.6 207. Meherpur 15.9 10418 43133 21784 21349 102 66.3 208. Bagherpara 3.03 1923 8290 4194 4096 102 62.3 Rajshahi Division 209. Bogra Sadar 68.63 93351 400983 210093 190890 110 72.4 210. Dhunat 4.85 3474 14206 7084 7122 99 52.1 211. Dhupchanchia 10.35 5401 22406 11458 10948 105 61.6 212. Gabtali 10.80 5493 21455 10601 10854 98 60.3 213. Kahalo 6.82 3636 13887 6955 6932 100 61.8 214. Nandigram 19.38 4528 18496 4937 9059 104 56.3 215. Santahar 10.2 7847 31037 15713 15324 103 62.1 216. Shariakandi 3.58 5069 18543 9398 9145 103 50.5
Contd. 85

3.03 Household and Population of Municipalities, 2011
Municipality Area (Sq.km) H/H (000)
Population Sex Literacy 7+yrs BothSex Male Female Ratio
217. Sherpur 7.70 5678 25152 12602 12550 100 74.5 218. Sonatola 12.46 6514 24720 12208 12512 98 49.6 219. Akkelpur 15.99 6281 24227 12129 12098 100 63.2 220. Joypurhat 18.55 16843 69033 35278 33755 105 77.9 221. Kalai 13.11 4411 16464 8173 8291 99 54.0 222. Panchbibi 9.63 5510 22475 11283 11192 101 69.4 223. Dhamoirhat 11.14 3852 15006 7749 7257 107 55.5 224. Bera 16.42 11012 50068 25118 24950 101 52.2 225. Bhangura 5.13 4712 20606 10237 10369 99 56.6 226. Chatmohar 3.28 3377 14443 7238 7205 100 76.3 227. Faridpur 9.63 3203 14010 6889 7121 97 56.0 228. Ishwardi 19.59 15332 66255 33420 32835 102 65.2 229. Pabna 27.27 33217 144442 74039 70403 105 76.2 230. Santhia 26.29 9319 38704 19627 19077 103 47.9 231. Sujanagar 11.08 5833 25461 12808 12653 101 44.6 232. Arani 9.41 4059 16550 8289 8261 100 53.2 233. Belkuchi 19.00 16229 75364 39174 36190 108 49.6 234. Kazipur 8.5 3396 12637 6004 6633 91 46.9 235. Rayganj 7.04 4354 17318 8655 8663 100 61.3 236. Shahjadpur 11.07 14226 64507 32923 31584 104 56.1 237. Sirajganj 28.49 35556 158913 80241 78672 102 63.2 238. Ullahpara 12.7 10526 47693 24169 23524 103 61.9 239. Naogaon 37.08 35923 150549 77326 73223 106 65.1 240. Nozipur 11.82 5315 21670 11238 10432 108 69.6 241. Bagatipara 9.06 2557 9975 4860 5115 95 62.1
Contd. 86

3.03 Household and Population of Municipalities, 2011
Municipality Area (Sq.km)
H/H (000)
Population Sex Literacy 7+yrs Both
Sex Male Fe-
male Ratio
242. Banpara 12.61 4480 17276 8568 8708 98 - 243. Baraigram 10.97 5576 22247 10988 11259 98 59.1 244. Gurudaspur 13.61 8287 32807 16613 16194 103 54.6 245. Gopalpur 14.98 5319 21042 10660 10382 103 60.3 246. Naldanga 5.22 2661 10266 5109 5157 99 - 247. Natore 14.84 18828 81203 41272 39931 103 73.0 248. Singra 29.39 7955 33192 16682 16510 101 56.8 249. Nachale 12.40 3780 17364 8581 8783 98 55.6 250. Chapai Nawabganj 32.9 39422 180731 86012 94719 91 60.8 251. Rahanpur 14.42 7614 34941 17391 17550 99 56.5 252. Shibganj 23.68 9023 42693 21315 21378 100 51.9 253. Atgharia 8.60 3390 13686 6776 6910 98 56.7 254. Rajshahi City Cor. 97.18 99245 449756 232974 216782 107 74.0 255. Bagha 11.69 7044 27623 13887 13736 101 55.4 256. Bhabaniganj 13.34 4546 17955 9107 8848 103 52.6 257. Tahirpur 10.84 4469 17944 9040 8904 101 54.4 258. Charghat 18.72 9105 38409 19860 18549 107 62.1 259. Durgapur 24.83 7109 26671 13337 13334 100 55.0 260. Godagari 14.29 8008 39766 20239 19527 104 53.0 261. Kakonhat 19.25 3997 16569 8066 8503 95 44.9 262. Katakhali 9.13 6953 28613 14915 13698 109 59.8 263. Kesharhat 16.19 5091 19645 9852 9793 101 53.9 264. Mundumala 31.76 4888 21940 10854 11086 98 50.6
Contd. 87

3.03 Household and Population of Municipalities, 2011
Municipality Area (Sq.km)
H/H (000)
Population Sex Literacy 7+yrs Both
Sex Male Fe-
male Ratio
265. Noahata 40.46 14045 57119 28826 28293 102 56.5 266. Puthia 13.50 5188 20610 10390 10220 102 59.2 267. Tanore 27.22 7976 31479 15666 15813 99 49.1 268. Shibganj 13.67 5576 21643 10916 10727 102 44.6 Rangpur Division 269. Birampur 27.53 10802 45334 22979 22355 103 59.7
270. Birganj 6.30 4535 194667 9949 9518 105 65.7
271. Fulbari 16.04 8170 34786 17651 17135 103 62.3
272. Ghoraghat 18.63 5570 22717 11405 11312 101 51.2
273. Hakimpur 16.40 6679 28411 15002 13409 112 63.0
274. Dinajpur 20.67 40929 186727 96139 90588 106 75.4
275. Parbatipur 6.67 7299 29143 14629 14514 101 64.5
276. Setabganj 10.23 7128 27335 13826 13510 102 62.6
277. Pirganj 29.41 6541 27700 14103 13597 104 53.8
278. Thakurgaon 30.03 18015 80589 41211 39378 105 74.3
279. Ranisankail 9.15 3876 17762 9112 8650 105 59.8
280. Gaibandha 11.29 15430 67833 33987 33846 100 74.5
281. Gobindaganj 14.47 9718 38415 19362 19053 102 54.8
282. Kurigram 27.04 17159 77252 39353 37899 104 63.2
Contd. 88

3.03 Household and Population of Municipalities, 2011
Municipality Area (Sq.km)
H/H (000)
Population Sex Literacy 7+yrs Both
Sex Male Fe-
male Ratio
283. Sundarganj 6.51 4252 17168 8559 8609 99 51.6
284. Nagesharri 42.0 15298 62289 31021 31268 99 49.7
285. Ulipur 26.14 11526 45933 22403 23530 95 50.3
286. Lalmonirhat 17.62 13897 60322 30496 29826 102 66.0
287. Patgram 12.49 6379 30565 15491 15074 103 49.7
288. Domar 9.42 4011 17027 8535 8492 101 64.2
289. Jaldhaka 28.20 10207 46211 23493 22718 103 41.5
290. Nilphamari 19.28 9448 45386 23286 22100 105 64.1
291. Saidpur 24.88 26311 127104 65060 62044 105 63.9
292. Boda 11.11 3951 14787 7428 7359 101 66.7
293. Badarganj 3.88 6289 25286 12926 12360 105 57.9
294. Panchagarh 20.72 10105 45589 23241 22348 104 70.3
295. Haragachha 16.13 14714 61425 30140 31285 96 41.4
296. Rangpur 50.69 64885 300659 156110 144549 108 72.1 Contd.
89
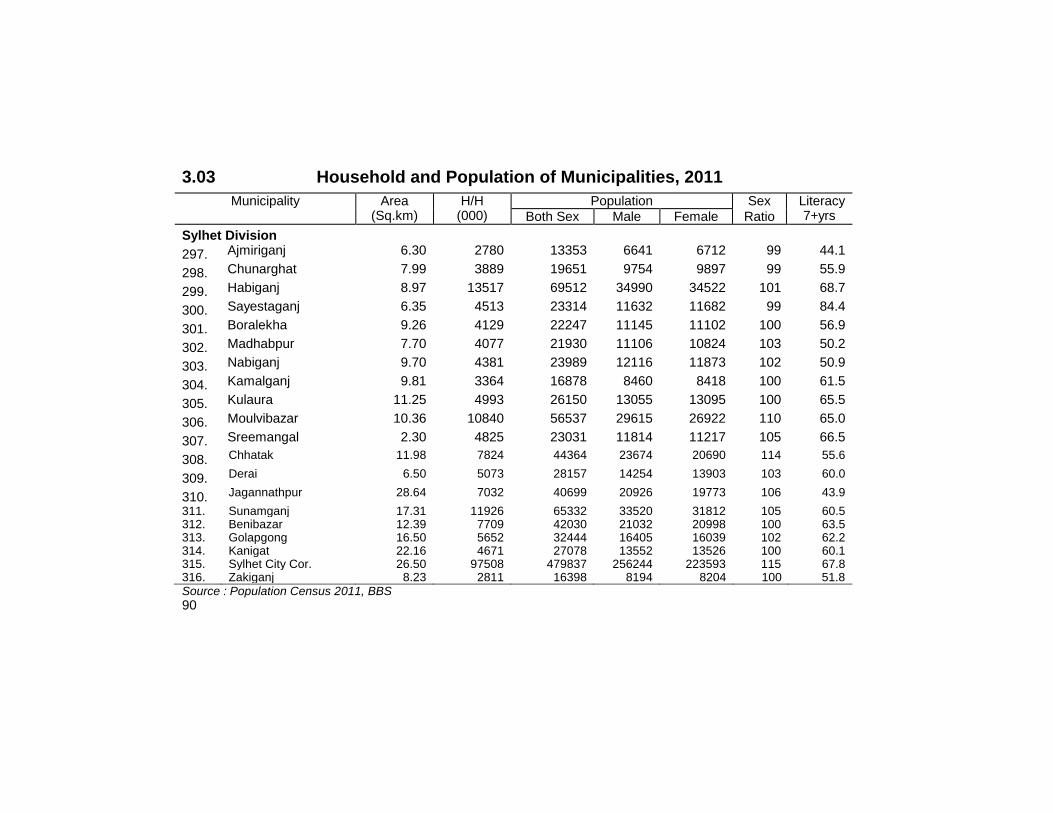
3.03 Household and Population of Municipalities, 2011
Municipality Area (Sq.km)
H/H (000)
Population Sex Literacy 7+yrs Both Sex Male Female Ratio
Sylhet Division
297. Ajmiriganj 6.30 2780 13353 6641 6712 99 44.1
298. Chunarghat 7.99 3889 19651 9754 9897 99 55.9
299. Habiganj 8.97 13517 69512 34990 34522 101 68.7
300. Sayestaganj 6.35 4513 23314 11632 11682 99 84.4
301. Boralekha 9.26 4129 22247 11145 11102 100 56.9
302. Madhabpur 7.70 4077 21930 11106 10824 103 50.2
303. Nabiganj 9.70 4381 23989 12116 11873 102 50.9
304. Kamalganj 9.81 3364 16878 8460 8418 100 61.5
305. Kulaura 11.25 4993 26150 13055 13095 100 65.5
306. Moulvibazar 10.36 10840 56537 29615 26922 110 65.0
307. Sreemangal 2.30 4825 23031 11814 11217 105 66.5
308. Chhatak 11.98 7824 44364 23674 20690 114 55.6
309. Derai 6.50 5073 28157 14254 13903 103 60.0
310. Jagannathpur 28.64 7032 40699 20926 19773 106 43.9
311. Sunamganj 17.31 11926 65332 33520 31812 105 60.5 312. Benibazar 12.39 7709 42030 21032 20998 100 63.5 313. Golapgong 16.50 5652 32444 16405 16039 102 62.2 314. Kanigat 22.16 4671 27078 13552 13526 100 60.1 315. Sylhet City Cor. 26.50 97508 479837 256244 223593 115 67.8 316. Zakiganj 8.23 2811 16398 8194 8204 100 51.8 Source : Population Census 2011, BBS
90

3.04 Household and Population of Statistical Metropolitan
Areas in Bangladesh, 2001 SMA/City
Corporation/ Municipality
Number of Household
Population Sex Ratio
Average H/H Size
Upazila/ Thana
Union Ward
Mauza Mahallah Village
Both Sex Male Female
1 2 3 4 5 6 7 8 9 10 11 12 13
ALL SMA 59 132 257 1311 1418 2229 31101078 14762107 8130426 6631681 123 4.8
Dhaka SMA 33 61 132 773 971 1569 2071946 9672763 5382233 4290530 125 4.7
Dhaka City
Corporation 21 - 90 - 731 - 1109514 5327306 302197 2305336 131 4.8
Narayanganj
Municipality
- - 08 - 78 - 50638 241393 131168 110225 119 4.8
Kadamrasul
Municipality
- - 04 - 39 - 27720 128561 66799 61762 108 4.6
Savar
Municipality
- - 09 - 55 - 30386 127540 68491 59049 116 4.2
Tongi
Municipality
- - 12 - 37 - 67655 283099 156335 126764 123 4.2
Gazipur
Municipality
- - 09 - 31 - 26891 122801 65522 57279 114 4.6
Other Urban
Area
12 61 - 773 - 1569 757068 3442063 1871948 1570115 119 4.5
Savar Upazila 01 12 - 220 - 373 101329 459501 249685 209816 119 4.5
Keraniganj
Upazila
01 12 - 112 - 422 124605 603114 322732 280382 115 4.8
Gazipur
Upazila
01 08 - 183 - 261 100399 460640 249911 210729 119 4.6
Contd.
91
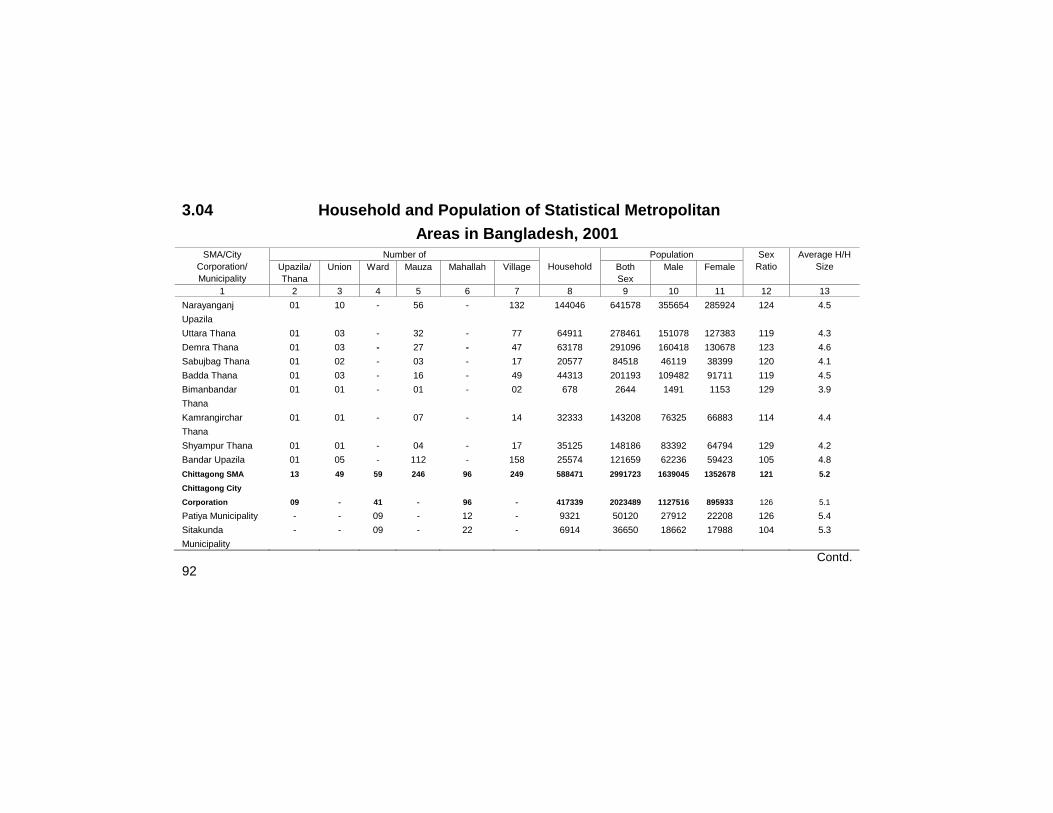
3.04 Household and Population of Statistical Metropolitan
Areas in Bangladesh, 2001 SMA/City
Corporation/
Municipality
Number of
Household
Population Sex
Ratio
Average H/H
Size Upazila/
Thana
Union Ward Mauza Mahallah Village Both
Sex
Male Female
1 2 3 4 5 6 7 8 9 10 11 12 13
Narayanganj
Upazila
01 10 - 56 - 132 144046 641578 355654 285924 124 4.5
Uttara Thana 01 03 - 32 - 77 64911 278461 151078 127383 119 4.3
Demra Thana 01 03 - 27 - 47 63178 291096 160418 130678 123 4.6
Sabujbag Thana 01 02 - 03 - 17 20577 84518 46119 38399 120 4.1
Badda Thana 01 03 - 16 - 49 44313 201193 109482 91711 119 4.5
Bimanbandar
Thana
01 01 - 01 - 02 678 2644 1491 1153 129 3.9
Kamrangirchar
Thana
01 01 - 07 - 14 32333 143208 76325 66883 114 4.4
Shyampur Thana 01 01 - 04 - 17 35125 148186 83392 64794 129 4.2
Bandar Upazila 01 05 - 112 - 158 25574 121659 62236 59423 105 4.8
Chittagong SMA 13 49 59 246 96 249 588471 2991723 1639045 1352678 121 5.2
Chittagong City
Corporation 09 - 41 - 96 - 417339 2023489 1127516 895933 126 5.1
Patiya Municipality - - 09 - 12 - 9321 50120 27912 22208 126 5.4
Sitakunda
Municipality
- - 09 - 22 - 6914 36650 18662 17988 104 5.3
Contd. 92

3.04 Household and Population of Statistical Metropolitan Areas in Bangladesh, 2001 SMA/City Corporation/
Municipality
Number of Household
Population Sex
Ratio
Average
H/H Size Upazila/
Thana
Union War
d
Mauza Mahallah Village Both
Sex
Male Female
1 2 3 4 5 6 7 8 9 10 11 12 13
Other Urban Area 04 49 - 246 - 249 207117 1155192 605061 550131 110 5.6
Hathazari Upazila 01 15 - 48 - 59 67147 403788 206922 196866 105 6.0
Patiya Upazila 01 16 - 102 - 104 52220 273728 140106 133622 105 5.2
Karnafuli Upazila 01 8 - 27 - 27 31913 179148 94472 84676 112 5.6
Sitakunda Upazila 01 10 - 22 - 59 55837 298528 163561 134967 121 5.3
Khulna SMA 08 13 31 106 181 142 253215 1172831 623723 549108 114 4.6
Khulna City Corporation 04 - 31 - 181 - 170335 770498 412661 357837 115 4.5
Other Urban Area 04 13 - 106 - 142 82880 402333 211062 191271 110 4.9
Rupsa Upazila 01 05 - 64 - 78 34369 167604 86176 81428 106 4.9
Dighalia Upazila 01 04 - 30 - 42 24306 120782 63751 57031 112 5.0
Daulatpur Upazila 01 01 - 2 - 2 2234 10807 5536 5271 105 4.8
Khan Jahan Ali Upazila 01 03 - 10 - 20 21971 103140 55599 47541 117 4.7
Rajshahi SMA 05 09 35 186 170 269 135216 651062 345319 305743 112 4.8
Rajshahi City
Corporation 04 - 35 - 170 - 77016 388811 208525 180286 114 4.9
Other Urban Area 01 09 - 186 - 280 58200 262251 136794 125457 109 4.5
Paba Upazila 01 09 - 186 - 280 58200 262251 136794 125457 109 4.5
Note: Part of 6 thanas included in Dhaka city corporation. Source: Population Census , 2001
93

94
3.05 Upazila/Thana-wise Area, Household and Population of Bangladesh, 2001 and 2011
Zila/Upazila/Thana Area in Census 2001 Census 2011 Name Sq.Km
Male '000'
Female '000'
H/Hold '000'
Male '000'
Female '000'
BANGLADESH 147570 64091 60264 32174 74980 74791
A. Barisal Division 13226 4159 4015 1863 4090 4236
1. Barguna 1831 430 418 216 437 455 Amtali 720 132 128 63 132 139 Bamna 101 35 35 20 39 40 Barguna Sadar 454 121 117 62 129 133 Betagi 167 60 59 28 57 60 Patharghata 387 83 79 43 81 83
2. Barisal 2784 1197 1158 515 1137 1187 Agailjhara 155 78 77 33 72 77 Babuganj 164 74 73 32 68 73 Bakerganj 411 174 180 72 149 165 Banaripara 134 77 75 84 73 75 Gaurnadi 150 92 88 42 92 96 Hizla 515 90 85 31 73 73 Barisal Sadar 324 243 220 115 267 260 Mehendiganj 418 154 150 65 147 154 Muladi 260 92 91 38 83 92 Wazirpur 248 123 119 53 114 121
3. Bhola 3403 884 820 373 884 893 Bhola Sadar 413 211 197 88 214 216 Burhanuddin 284 126 118 49 115 119 Char Fasson 1106 214 200 95 229 228 Daulatkhan 316 91 83 35 83 85 Lalmohan 396 142 134 34 139 145 Manpura 373 36 31 17 39 38 Tazumuddin 512 64 57 29 65 62
4. Jhalakati 706 346 348 158 329 354 Jhalakati Sadar 159 101 99 50 105 111 Kathalia 151 65 65 31 61 64 Nalchity 231 106 109 43 92 101 Rajapur 164 74 75 34 71 77
Contd. Note : Area of division is given in sq. km and that for zila/upazila/thana in acres.

95
3.05 Upazila/Thana-wise Area, Household and Population of Bangladesh, 2001 and 2011
Zila/Upazila/Thana Name
Area in Census 2001 Census 2011 Sq.Km.
Male '000'
Female '000'
H/Hold '000'
Male '000'
Female '000'
5. Patuakhali 3221 739 722 346 753 782 Bauphal 487 152 153 68 145 160 Dasmina 351 58 59 28 60 63 Dumki 92 35 35 16 34 37 Galachipa 1268 167 159 80 180 182 Kalapara 491 104 98 58 121 117 Mirzaganj 167 59 59 28 59 62 Patuakhali Sadar 362 164 159 69 155 161 6. Pirojpur 1277 562 550 256 548 565 Bhandaria 163 79 76 34 72 76 Kawkhali 79 38 37 16 35 35 Mathbaria 344 132 132 61 129 134 Nazirpur 228 91 88 41 90 91 Pirojpur Sadar 166 115 112 38 81 83 Nesarabad(Sw.kati) 200 107 105 48 104 107 Zianagar 94 - - 17 38 39
B.Chittagong Div. 33908 12404 11886 5626 13933 14490 7. Bandarban 4479 162 136 80 203 185 Ali Kadam 885 19 16 9 26 24 Bandarban Sadar 501 39 30 19 48 41 Lama 671 42 37 22 57 52 Naikhongchhari 463 26 23 12 31 30 Rowangchhari 442 12 10 6 14 13 Ruma 492 15 12 6 15 14 Thanchi 1020 9 8 5 12 11
8. Brahmanbaria 1881 1206 1193 539 1367 1474 Akhaura 98 66 64 28 70 75 Ashuganj 67 74 72 34 88 92 Bancharampur 187 138 140 60 139 159 Brahmanbaria Sadar 1881 319 307 96 259 263 Kasba 209 136 135 61 152 167 Nabinagar 350 208 212 95 230 263 Nasirnagar 294 128 128 59 151 158 Sarail 215 136 135 59 152 163 Bijoynagar 221 - - 49 126 132 Contd.

96
3.05 Upazila/Thana-wise Area, Household and Population of Bangladesh, 2001 and 2011
Zila/Upazila/Thana Area in Census 2001 Census 2011 Name Sq.Km
Male '000'
Female '000'
H/Hold '000'
Male '000'
Female '000'
9. Chandpur 1645 1125 1146 507 1146 1270 Chandpur Sadar 308 221 216 98 227 239 Faridganj 232 182 193 86 182 214 Haimchar 134 63 62 25 54 56 Haziganj 189 143 149 66 157 174 Kachua 235 164 168 77 181 201 Matlab 129 102 105 46 98 112 Uttar Matlab 260 135 133 64 141 151 Shahrasti 154 99 105 46 107 122 10. Chittagong 5282 3475 3135 1532 3839 3777 Anwara 164 117 112 50 127 132 Bayjid Bostami 17 95 73 47 110 101 Banshkhali 376 205 186 84 212 219 Bakalia 12 110 87 57 139 124 Boalkhali 126 105 97 44 109 114 Chandanaish 101 98 94 44 117 116 Chandgaon 25 97 82 55 132 124 Chittagong port 20 115 99 47 106 102 Double Mooring 8 146 113 78 194 167 Fatikchhari 773 226 216 100 260 266 Halishahar 9 67 58 31 78 74 Hathazari 246 207 197 81 215 217 Karnafuli 136 94 85 - - - Khulshi 13 135 108 61 149 130 Patenga 32 44 37 30 70 63 Kotwali 7 165 118 66 176 144 Lohagara 258 134 133 53 136 144 Mirsharai 482 183 186 80 187 211 Pahartali 13 69 58 42 99 92 Panchlaish 8 84 64 45 115 104 Patiya 211 168 156 102 266 262 Rangunia 361 154 144 68 168 171 Raozan 246 164 161 63 156 167 Sandwip 762 143 149 57 129 150 Satkania 280 168 170 71 186 199 Sitakunda 483 182 153 77 202 186
Contd.
Note : Karnafuli thana has been abolished

97
3.05 Upazila/Thana-wise Area, Household and Population of Bangladesh, 2001 and 2011
Zila/Upazila/Thana Area in Census 2001 Census 2011 Name Sq.Km
Male '000'
Female '000'
H/Hold '000'
Male '000'
Female '000'
11. Comilla 3146 2313 2283 1054 2575 2812 Barura 241 174 177 83 190 215 Brahmanpara 128 92 90 38 97 107 Burichong 163 133 126 58 146 156 Chandina 201 154 152 70 166 184 Chauddagram 270 188 193 87 208 236 Daudkandi 314 226 224 69 169 181 Debidwar 238 191 187 83 204 227 Homna 142 98 93 40 100 106 Comilla Sadar Dhikin 209 319 294 85 208 219 Laksam 156 297 302 57 141 154 Meghna 99 48 49 22 56 56 Muradnagar 340 235 233 102 248 276 Nangalkot 225 157 163 73 171 203 Comilla Sadar 142 - - 106 270 262 Mandrhargonj 159 - - 45 112 133 Titas 109 - - 36 87 98
12. Cox's Bazar 2491 927 847 416 1170 1120 Chakaria 503 260 243 88 239 235 Cox's Bazar Sadar 228 186 162 83 242 217 Kutubdia 215 56 51 23 64 61 Maheshkhali 362 135 121 58 166 156 Ramu 391 104 99 48 135 132 Teknaf 388 105 96 46 133 131 Ukhia 261 81 75 38 105 103 Pekua 139 - - 32 86 85 13. Feni 990 616 624 278 694 743 Chhagalnaiya 139 85 85 37 89 98 Daganbhuiyan 141 110 116 49 119 136 Feni Sadar 226 204 200 98 255 258 Parshuram 95 101 104 20 48 53 Sonagazi 284 116 120 50 124 139 Fulgazi 102 - - 23 59 60
Contd.

98
3.05 Upazila/Thana-wise Area, Household and Population of Bangladesh, 2001 and 2011
Zila/Upazilla/Thana Area in Census 2001 Census 2011 Name Sq.Km
Male '000'
Female '000'
H/Hold '000'
Male '000'
Female '000'
14. Khagrachhari 2749 278 248 134 314 300 Dighinala 694 49 44 22 53 50 Khagrachhari Sadar 297 50 42 24 58 53 Lakshmichhari 220 12 10 6 13 13 Mahalchhari 251 24 20 11 26 24 Manikchhari 168 26 24 13 31 31 Matiranga 495 55 51 27 64 63 Panchhari 334 34 31 14 31 31 Ramgarh 287 28 26 15 37 35 15. Lakshmipur 1440 745 745 365 828 901 Lakshmipur Sadar 480 287 289 144 325 359 Raipur 195 119 118 60 132 143 Ramganj 169 137 147 59 131 155 Ramgati 279 202 191 56 128 133 Kamalnagar 314 46 111 112 16. Noakhali 3685 1281 1296 594 1485 1623 Begumganj 238 379 388 102 261 288 Chatkhil 133 104 111 46 93 109 Companiganj 380 107 107 49 120 130 Hatiya 1507 175 167 91 224 229 Senbagh 159 131 141 54 133 150 Noakhali Sadar 336 386 381 100 252 273 Sobarnachar 575 - - 55 144 146 Sonaimuri 169 - - 61 150 177 Kabirhat 185 - - 36 93 104 17. Rangamati 6116 275 234 128 313 283 Bagaichhari 1931 42 36 20 51 46 Barkal 760 22 18 9 26 22 Kawkhali 339 26 23 13 31 29 Belaichhari 745 13 11 6 15 13 Kaptai 258 37 29 14 32 28 Juraichhari 606 12 10 6 15 13 Langadu 388 36 32 18 42 39 Nannerchar 393 21 19 9 23 21 Rajasthali 145 12 10 6 14 12 Rangamati Sadar 546 54 45 27 66 59
Contd.

99
3.05 Upazila/Thana-wise Area, Household and Population of Bangladesh, 2001 and 2011
Zila/Upazilla/Thana Area in Census 2001 Census 2011 Name Sq.Km
Male '000'
Female '000'
H/Hold '000'
Male '000'
Female '000'
C. Sylhet Division 12635 4065 3875 1791 4933 4977
18. Habiganj 2635 893 865 393 1026 1063 Ajmiriganj 223 51 48 21 57 58 Bahubal 250 85 82 37 98 100 Baniachong 482 138 131 59 164 169 Chunarughat 495 135 132 61 147 155 Habiganj Sadar 253 141 134 62 164 166 Lakhai 196 59 62 28 71 78 Madhabpur 294 138 135 62 156 163 Nabiganj 439 145 142 62 170 175
19. Moulvibazar 2799 821 792 361 945 974 Barlekha 448 117 116 44 124 133 Kamalganj 485 117 113 52 128 131 Kulaura 545 200 196 66 176 184 Moulvibazar Sadar 344 145 136 63 172 171 Rajnagar 338 98 95 43 113 120 Sreemangal 450 143 135 652 159 159
20. Sunamganj 3747 1037 977 440 1236 1232 Bishwamvarpur 248 63 63 29 78 78 Chhatak 440 172 163 67 198 200 Derai 420 105 98 45 123 121 Dharampasha 531 95 88 44 112 111 Dowarabazar 263 92 87 43 112 116 Jagannathpur 368 116 109 43 130 130 Jamalganj 309 72 67 30 85 83 Sullah 256 53 49 20 57 56 Sunamganj Sadar 290 188 179 50 140 139 Tahirpur 315 81 75 38 111 105 Dakshin Sunamganj 303 - - 32 91 93
Contd.

100
3.05 Upazila/Thana-wise Area, Household and Population of Bangladesh, 2001 and 2011
Zila/Upazila/Thana Area in Census 2001 Census 2011 Name Sq.Km Male
'000' Female
'000' H/Hold '000'
Male '000'
Female '000'
21. Sylhet 3452 1314 1241 596 1727 1707 Balaganj 375 131 126 54 158 162 Beanibazar 253 105 106 42 124 130 Bishwanath 213 97 93 38 116 117 Companiganj 296 60 54 29 90 84 Fenchuganj 114 48 47 19 51 54 Golabganj 278 132 132 50 154 162 Gowainghat 481 107 100 48 144 144 Jaintiapur 266 63 58 28 81 81 Kanaighat 391 108 108 46 129 135 Sylhet Sadar 301 364 319 158 437 392 Zakiganj 265 100 99 41 117 120 Dakshin Surma 187 - - 43 126 127 D.Dhaka Division 31178 20362 18682 10849 24172 23252 22. Dhaka 1463 4712 3800 2786 6556 5488 Adabar - - - 50 109 95 Bangshal - - - 35 120 67 Dakshinkhan - - - 64 137 119 Darus Salam - - - 40 87 72 Gendaria - - - 30 76 61 Jatrabari - - - 102 245 198 Kadamtali - - - 88 201 170 Kalabagan - - - 24 68 51 Khilkket - - - 31 73 57 Paltan - - - 11 36 23 Rampura - - - 50 119 105 Shah Ali - - - 28 62 54 Badda - 198 161 130 302 234 Bimanbandar - 3 2 2 6 4 Cantonment - 70 48 26 72 57 Demra - 238 190 53 122 105 Dhamrai 307 178 172 95 207 205 Dhanmondi - 147 106 33 79 68 Dohar 161 94 97 50 107 119 Gulshan - 107 83 60 140 113 Hazaribagh - 71 57 44 101 85 Kafrul - 157 133 96 210 186 Kamrangirchar - 76 67 22 51 43 Contd Note:Due to unavailability of corrected area, The areas of metropolitan thanas have not been incorporated.

101
3.05 Upazila/Thana-wise Area, Household and Population of Bangladesh, 2001 and 2011
Zila/Upazila/Thana Area in Census 2001 Census 2011 Name Sq.Km
Male '000'
Female '000'
H/Hold '000'
Male '000'
Female '000'
Khilgaon - 185 152 78 174 153 Keraniganj 166 323 280 178 422 373 Kotwali - 162 92 12 40 22 Lalbagh - 206 140 84 199 170 Mirpur - 301 250 117 269 231 Mohammadpur - 251 205 82 196 160 Motijheel - 162 108 47 123 87 Nawabganj 244 146 151 71 149 170 Pallabi - 232 200 143 312 284 Shyampur - 211 165 43 102 82 Ramna - 149 109 42 108 93 Sabujbagh - 160 131 89 204 172 Savar 280 318 269 359 739 647 Sutrapur - 206 147 43 121 90 Sher-E-Banglanagar - - - 30 76 62 Turag - - - 39 86 71 Tejgaon Ind. Area - - - 35 91 56 Uttarkhan - - - 18 101 79 Chakbazar - - - 31 101 55 Newmarket - - - 8 33 17 Tejgaon - 174 128 30 85 64 Uttara - 188 157 39 101 79 Shahbagh - - - 9 45 23
23. Faridpur 2052 893 863 420 942 971 Alfadanga 127 50 51 24 52 57 Bhanga 215 117 115 57 125 134 Boalmari 271 118 115 56 126 130 Charbhadrasan 154 38 38 14 30 33 Faridpur Sadar 412 214 200 104 236 234 Madhukhali 230 95 92 46 102 103 Nagarkanda 192 165 158 43 98 100 Sadarpur 261 95 94 40 90 97 Saltha 186 - 36 83 84
24. Gazipur 1806 1068 964 826 1775 1629 Gazipur Sadar 457 472 395 449 977 844 Kaliakair 314 138 129 117 248 235 Kaliganj 214 123 116 58 133 132 Kapasia 356 162 159 80 166 176 Sreepur 462 172 165 122 251 241
Contd
Note:Due to unavailability of corrected area, The areas of metropolitan thanas have not been incorporated.

102
3.05 Upazila/Thana-wise Area, Household and Population of Bangladesh, 2001 and 2011
Zila/Upazila/Thana Area in Census 2001 Census 2011 Name Sq.Km
Male '000'
Female '000'
H/Hold '000'
Male '000'
Female '000'
25. Gopalganj 1468 593 573 250 578 595 Gopalganj Sadar 389 165 157 73 173 171 Kashiani 286 114 114 46 100 108 Kotalipara 355 115 112 48 113 117 Muksudpur 308 146 142 62 141 148 Tungipara 128 52 47 21 51 50
26. Jamalpur 2115 1076 1031 563 1129 1164 Baksiganj 238 91 87 52 108 111 Dewanganj 267 115 114 61 127 132 Islampur 353 148 141 75 148 150 Jamalpur Sadar 508 290 279 152 302 313 Madarganj 225 119 114 64 130 133 Melandaha 258 150 143 79 154 159 Sarishabari 263 162 154 80 160 166
27. Kishoreganj 2688 1320 1275 627 1432 1480 Astagram 355 75 71 31 75 77 Bajitpur 193 106 104 53 122 127 Bhairab 139 126 121 59 147 151 Hossainpur 121 82 80 41 90 94 Itna 401 80 72 35 84 80 Karimganj 200 129 129 63 142 146 Katiadi 219 142 141 76 151 164 Kishoreganj Sadar 193 178 170 90 205 209 Kuliarchar 104 79 77 39 88 94 Mithamain 222 63 59 24 62 60 Nikli 214 61 59 30 67 67 Pakundia 180 120 117 57 121 130 Tarail 141 79 75 5 79 81
28. Madaripur 1125 584 562 252 575 591 Kalkini 280 138 134 59 134 140 Madaripur Sadar 283 171 161 74 171 174 Rajoir 229 110 108 49 113 116 Shibchar 332 165 159 70 157 162
29. Manikganj 1383 648 637 325 676 717 Daulatpur 218 79 77 39 80 87 Ghior 148 69 69 35 71 75 Contd

103
3.05 Upazila/Thana-wise Area, Household and Population of Bangladesh, 2001 and 2011
Zila/Upazila/Thana Area in Census 2001 Census 2011 Name Sq.Km
Male '000'
Female '000'
H/Hold '000'
Male '000'
Female '000'
Harirampur 244 85 86 34 66 74 Manikganj Sadar 215 131 131 71 149 160 Saturia 140 78 77 41 84 88 Shivalaya 199 80 75 41 85 87 Singair 217 126 122 65 141 147
30. Munshiganj 1004 656 638 313 772 724 Gazaria 131 70 68 35 79 79 Lohaganj 131 83 85 37 79 80 Munshiganj Sadar 218 171 156 82 195 189 Sirajdikhan 180 121 120 60 144 145 Sreenagar 203 115 114 57 127 133 Tongibari 140 96 94 42 98 99
31.Mymensingh 4394 2297 2193 1155 2539 2591 Bhaluka 444 158 151 107 217 213 Dhobaura 252 87 85 44 96 100 Fulbari 398 201 195 101 223 226 Gaffargaon 398 311 202 99 211 220 Gauripur 274 145 138 72 160 163 Haluaghat 357 137 133 70 143 147 Ishwarganj 280 173 165 81 187 189 Mymensingh Sadar 380 350 324 167 391 385 Muktagachha 314 186 180 97 207 209 Nandail 326 189 182 88 198 205 Fulpur 626 270 255 136 298 304 Trishal 338 190 182 94 209 211
32. Narayanganj 684 1162 1012 676 1521 1427 Araihazar 181 171 160 77 188 188 Sonargaon 171 160 146 90 204 196 Bandar 54 129 121 73 158 154 Narayanganj Sadar 100 487 396 313 691 622 Rupganj 176 215 189 122 280 255
33. Narsingdi 1150 974 922 478 1103 1122 Belabo 117 83 81 42 93 97 Monohardi 193 121 123 63 131 144 Narsingdi Sadar 213 305 274 150 364 344 Palash 91 99 90 47 108 105 Contd

104
3.05 Upazila/Thana-wise Area, Household and Population of Bangladesh, 2001 and 2011
Zila/Upazila/Thana Area in Census 2001 Census 2011 Name Sq.Km
Male '000'
Female '000'
H/Hold '000'
Male '000'
Female '000'
Raipur 312 232 223 111 259 277 Shibpur 217 134 131 65 148 155
34. Netrokona 2794 1017 971 479 1111 1118 Atpara 192 68 65 31 72 73 Barhatta 220 81 77 38 91 90 Durgapur 279 101 98 51 112 113 Khaliajuri 297 43 39 19 50 48 Kalmakanda 376 120 114 58 135 137 Kendua 303 146 140 66 150 155 Madan 233 73 69 32 78 77 Mohanganj 241 74 70 35 84 83 Netrokona Sadar 341 169 161 81 187 186 Purbadhala 308 143 137 68 153 158
35. Rajbari 1092 489 462 238 520 536 Baliakandi 228 96 90 463 104 103 Goalandaghat 121 61 57 25 55 58 Pangsha 250 182 170 56 122 122 Rajbari Sadar 322 151 145 76 162 169 Kaiukhali 168 - - 35 77 78
36. Shariatpur 1174 544 539 248 559 597 Bhedarganj 261 120 118 53 121 132 Damudya 90 58 59 24 51 58 Gosairhat 166 62 62 33 76 82 Naria 203 111 114 50 110 122 Shariatpur Sadar 175 101 98 46 104 106 Zanjira 246 92 87 42 96 98
37. Sherpur 1364 659 620 341 676 682 Jhenaigati 242 79 76 41 80 81 Nakla 173 92 87 47 93 97 Nalitabari 327 129 124 65 125 127 Sherpur Sadar 372 234 216 122 250 247 Sreebardi 248 125 117 66 129 131
Contd.

105
3.05 Upazila/Thana-wise Area, Household and Population of Bangladesh, 2001 and 2011
Zila/Upazila/Thana Area in Census 2001 Census 2011 Name Sq.Km
Male '000'
Female '000'
H/Hold '000'
Male '000'
Female '000'
38. Tangail 3414 1670 1621 870 1757 1848 Basail 157 81 80 39 75 85 Bhuapur 225 97 94 46 92 98 Delduar 184 95 94 48 101 107 Ghatail 451 190 182 104 205 213 Gopalpur 193 139 135 64 124 129 Kalihati 295 194 182 99 203 208 Madhupur 366 216 207 76 148 149 Mirzapur 373 185 181 94 195 213 Nagarpur 262 127 132 67 137 152 Sakhipur 435 122 120 71 132 146 Tangail Sadar 334 225 214 117 260 261 Dhanbari 133 - - 46 86 90
D. Khulna Division 22285 7586 7119 3740 7843 7845
39. Bagerhat 3959 804 745 354 740 736 Bagerhat Sadar 272 133 124 64 134 133 Chitalmari 191 72 67 30 69 69 Fakirhat 160 69 65 33 69 68 Kachua 131 51 49 23 48 49 Mollahat 187 65 61 118 65 66 Mongla 1461 81 68 32 71 65 Morrelganj 460 179 171 76 143 151 Rampal 335 92 86 38 78 77 Sarankhola 756 62 52 29 62 57
40. Chuadanga 1174 518 489 277 565 564 Alamdanga 364 159 150 86 173 173 Chuadanga Sadar 298 143 136 77 157 157 Damurhuda 311 132 123 70 145 144 Jibannagar 199 84 80 44 90 90
Contd.

106
3.05 Upazila/Thana-wise Area, Household and Population of Bangladesh, 2001 and 2011
Zila/Upazila/Thana Area in Census 2001 Census 2011 Name Sq.Km/
Male '000'
Female '000'
H/Hold '000'
Male '000'
Female '000'
41. Jessore 2606 1278 1194 656 1386 1378 Abhaynagar 247 120 112 62 132 131 Bagherpara 308 100 95 450 108 109 Chaugachha 269 109 102 56 116 115 Jhikargachha 307 139 133 72 147 152 Keshabpur 258 116 110 62 127 127 Jessore Sadar 435 340 304 169 380 363 Manirampur 444 195 187 101 207 211 Sharsha 336 159 151 83 170 171
42. Jhenaidaha 1964 816 764 422 886 885 Harinakunda 227 90 83 48 99 98 Jhenaidah Sadar 470 204 190 109 218 228 Kaliganj 310 131 122 78 141 141 Kotchandpur 165 68 64 34 71 71 Maheshpur 417 152 144 80 166 16 Shailkupa 373 171 161 83 181 181
43. Khulna 4394 1244 1135 547 1176 1142 Batiaghata 248 73 68 41 87 85 Dacope 991 83 74 37 76 76 Daulatpur 7 63 55 27 58 54 Dumuria 454 144 136 72 153 153 Dighalia 77 64 57 27 59 56 Khalishpur 11 128 107 40 88 77 Khan Jahan Ali 33 59 50 19 38 36 Khulna Sadar 9 134 117 54 116 109 Koyra 1775 96 97 46 95 99 Paikgachha 411 128 121 60 124 124 Phultala 56 40 37 20 42 42 Rupsa 120 86 81 42 90 89 Sonadanga 8 90 82 39 85 83 Terokhada 189 57 53 26 58 58
Contd.

107
3.05 Upazila/Thana-wise Area, Household and Population of Bangladesh, 2001 and 2011
Zila/Upazila/Thana Area in Census 2001 Census 2011 Name Sq.Km/
Male '000'
Female '000'
H/Hold '000'
Male '000'
Female '000'
44. Kushtia 1608 894 846 477 974 973 Bheramara 153 90 86 48 98 101 Daulatpur 468 228 216 116 228 229 Khoksa 104 58 56 32 64 65 Kumarkhali 258 152 146 79 163 165 Kushtia Sadar 318 219 205 120 253 249 Mirpur 305 147 138 83 166 165
45. Magura 1039 421 403 206 455 464 Magura Sadar 401 170 161 86 189 191 Mohammadpur 233 96 93 45 102 106 Shalikha 228 76 72 36 82 82 Sreepur 175 79 77 37 82 85
46. Meherpur 751 303 288 166 325 331 Gangni 363 138 131 78 148 151 Meherpur Sadar 276 119 113 64 127 129 Mujibnagar 111 46 44 25 49 50
47. Narail 967 353 345 163 354 368 Kalia 301 105 103 49 109 111 Lohagara 284 111 110 51 109 119 Narail Sadar 381 137 132 63 135 138
48. Satkhira 3817 955 910 470 983 1003 Assasuni 374 126 123 62 134 135 Debhata 173 61 58 30 62 63 Kalaroa 231 112 109 59 117 121 Kaliganj 333 131 126 65 136 139 Satkhira Sadar 398 212 198 109 231 230 Shyamnagar 1968 160 153 72 153 165 Tala 337 152 142 72 149 150
Contd.

108
3.05 Upazila/Thana-wise Area, Household and Population of Bangladesh, 2001 and 2011
Zila/Upazila/Thana Area in Census 2001 Census 2011 Name Sq.Km/
Male '000'
Female '000'
H/Hold '000'
Male '000'
Female '000'
E. Rajshahi Division 18154 15515 14687 4487 9257 9228
49. Bogra 2898 1547 1466 867 1709 1692 Adamdighi 168 95 92 50 93 98 Bogra Sadar 176 365 329 132 288 267 Dhunat 447 137 134 75 143 149 Dupchanchia 162 82 79 45 87 90 Gabtali 239 149 141 83 159 160 Kahaloo 240 100 96 58 111 112 Nandigram 265 86 82 46 90 90 Sariakandi 408 123 117 76 135 135 Sherpur 295 145 141 82 166 167 Shibganj 314 182 171 99 190 188 Sonatala 156 85 82 49 92 94 Shahjanpur 221 - - 73 149 140
50. Dinajpur 3444 1364 1279 716 1509 1481 Birampur 212 78 73 42 86 84 Birganj 413 138 132 74 160 158 Biral 353 119 112 61 130 128 Bochaganj 224 75 71 39 80 80 Chirirbandar 312 137 128 68 147 146 Phulbari 228 79 73 43 89 87 Ghoraghat 148 52 51 30 59 59 Hakimpur 99 43 40 23 47 45 Kaharole 205 71 67 37 77 77 Khansama 179 77 73 39 87 85 Dinajpur Sadar 354 222 203 112 248 237 Nawabganj 314 105 99 58 115 115 Parbatipur 395 168 157 89 184 181
Contd.

109
3.05 Upazila/Thana-wise Area, Household and Population of Bangladesh, 2001 and 2011
Zila/Upazila/Thana Area in Census 2001 Census 2011 Name Sq.Km/
Male '000'
Female '000'
H/Hold '000'
Male '000'
Female '000'
51. Gaibandha 2114 1085 1053 612 1169 1210 Phulchhari 3144 70 68 40 83 83 Gaibandha Sadar 324 199 193 110 214 223 Gobindaganj 460 235 226 133 257 259 Palashbari 185 117 115 63 120 125 Sadullapur 230 135 131 75 140 147 Sughatta 231 127 124 69 131 137 Sundarganj 369 202 196 122 226 236
52. Joypurhat 1012 435 412 243 459 454 Akkelpur 154 65 64 366 56 57 Joypurhat Sadar 236 134 123 76 147 142 Kalai 166 65 64 39 71 72 Khetlal 142 59 57 30 54 54 Panchbibi 311 111 105 61 119 117
53. Kurigram 2245 897 895 508 1010 1059 Bhurungamari 236 98 99 57 114 118 Char Rajibpur 111 31 33 17 35 38 Chilmari 224 56 58 31 59 63 Phulbari 156 71 70 40 79 82 Kurigram Sadar 276 132 127 73 155 158 Nageshwari 417 162 161 94 193 201 Rajarhat 166 85 84 46 89 94 Raomari 197 83 83 47 96 10 Ulipur 458 179 180 103 191 204
54. Lalmonirhat 1247 566 543 290 6288 6273 Aditmari 195 103 100 52 123 123 Hatibandha 288 105 101 53 117 117 Kaliganj 253 111 106 58 122 123 Lalmonirhat Sadar 263 148 141 79 167 166 Patgram 246 99 95 48 111 108
Contd.

110
3.05 Upazila/Thana-wise Area, Household and Population of Bangladesh, 2001 and 2011
Zila/Upazila/Thana Area in Census 2001 Census 2011 Name Sq.Km/
Male '000'
Female '000'
H/Hold '000'
Male '000'
Female '000'
55. Naogaon 3435 1228 1163 656 1300 1300 Atrai 284 92 88 45 96 97 Badalgachhi 213 96 90 54 101 101 Dhamoirhat 300 88 82 49 94 91 Manda 375 179 174 97 180 184 Mahadevpur 397 137 18 76 147 146 Naogaon Sadar 275 183 171 101 205 201 Niamatpur 449 116 111 62 123 126 Patnitala 382 108 101 59 117 116 Porsha 252 62 60 31 66 66 Raninagar 258 93 88 46 92 93 Sapahar 244 74 70 36 81 80
56. Natore 1900 784 737 434 854 852 Bagatipara 139 61 58 33 65 66 Baraigram 299 125 119 70 139 141 Gurudaspur 203 99 95 55 108 107 Lalpur 327 126 117 66 138 136 Natore Sadar 401 207 193 110 222 221 Singra 528 166 155 89 183 182
57. Nawabganj 1702 725 700 358 810 837 Bholahat 123 47 46 24 51 52 Gomastapur 318 122 118 63 136 140 Nachole 283 67 65 33 73 74 Nawabganj Sadar 451 227 225 113 255 276 Shibganj 525 262 246 125 295 296
Contd.

111
3.05 Upazila/Thana-wise Area, Household and Population of Bangladesh, 2001 and 2011
Zila/Upazila/Thana Area in Census 2001 Census 2011 Name Sq.Km/
Male '000'
Female '000'
H/Hold '000'
Male '000'
Female '000'
58. Nilphamari 1546 810 761 422 923 911 Dimla 326 114 110 64 142 141 Domar 216 110 105 58 125 124 Jaldhaka 303 142 133 79 171 170 Kishoreganj 205 131 122 66 131 130 Nilphamari Sadar 373 191 181 97 219 216 Saidpur 121 122 110 58 134 131
59. Pabna 2376 1126 1050 591 1263 1260 Atgharia 186 70 66 38 78 79 Bera 243 121 111 57 128 128 Bangura 138 50 49 29 62 63 Chatmohar 310 121 119 70 145 146 Faridpur 137 64 60 31 65 65 Ishwardi 250 153 140 73 158 156 Pabna Sadar 439 248 229 139 297 294 Santhia 331 168 155 89 191 189 Sujanagar 338 131 120 64 139 140
60. Panchagarh 1404 430 407 229 497 491 Atwari 209 59 56 32 67 67 Boda 349 103 97 56 117 116 Debiganj 309 95 91 52 113 112 Panchagarh Sadar 347 118 111 60 137 135 Tetulia 189 54 51 28 63 62
Contd.

112
3.05 Upazila/Thana-wise Area, Household and Population of Bangladesh, 2001 and 2011
Zila/Upazila/Thana Area in Census 2001 Census 2011 Name Sq.Km/
Male '000'
Female '000'
H/Hold '000'
Male '000'
Female '000'
61. Rajshahi 2425 1184 1102 634 1310 1285 Bagha 185 88 82 47 92 92 Bagmara 366 163 157 94 177 178 Charghat 164 95 89 52 104 103 Durgapur 197 86 81 49 94 92 Godagari 475 143 136 72 166 165 Mohanpur 162 78 75 44 85 85 Paba 340 137 125 77 159 155 Puthia 192 98 91 53 105 102 Tanore 295 88 86 47 94 97 Boalia 45 102 89 50 114 107 Motihar 20 29 23 12 33 29 Rajpara 25 64 57 30 70 67 Shah Makdam 12 13 11 7 15 14
62. Rangpur 2400 1307 1235 720 1444 1437 Badarganj 301 133 125 72 144 143 Gangachhara 269 136 125 73 150 148 Kaunia 147 110 105 56 113 115 Rangpur Sadar 359 313 287 165 367 351 Mithapukur 515 230 219 135 252 256 Pirgachha 266 149 146 83 154 160 Pirganj 411 176 170 102 192 193 Taraganj 128 62 58 34 72 71
63. Sirajganj 2402 1398 1296 715 1551 1546 Belkuchi 158 160 142 74 180 173 Chauhali 210 81 74 40 80 80 Kamarkhanda 90 66 62 32 68 70 Kazipur 328 136 131 70 135 140 Raiganj 259 138 130 77 159 159 Shahjadpur 324 247 225 124 283 278 Sirajganj Sadar 320 253 231 125 279 276 Tarash 300 85 83 49 97 100 Ullahpara 409 232 217 124 269 271
Contd.

113
3.05 Upazila/Thana-wise Area, Household and Population of Bangladesh, 2001 and 2011
Zila/Upazila/Thana Area in Census 2001 Census 2011 Name Sq.Km/
Male '000'
Female '000'
H/Hold '000'
Male '000'
Female '000'
64. Thakurgaon 1781 627 587 321 70 689 Baliadangi 284 88 82 46 99 96 Haripur 201 66 62 33 74 74 Pirganj 353 111 101 58 123 121 Ranisankail 287 101 95 51 112 110 Thakurgaon Sadar 654 261 244 133 294 288 Note: Figures may not add up to the total because of rounding. Source: Bangladesh Population and Housing Census 2011, Community Report
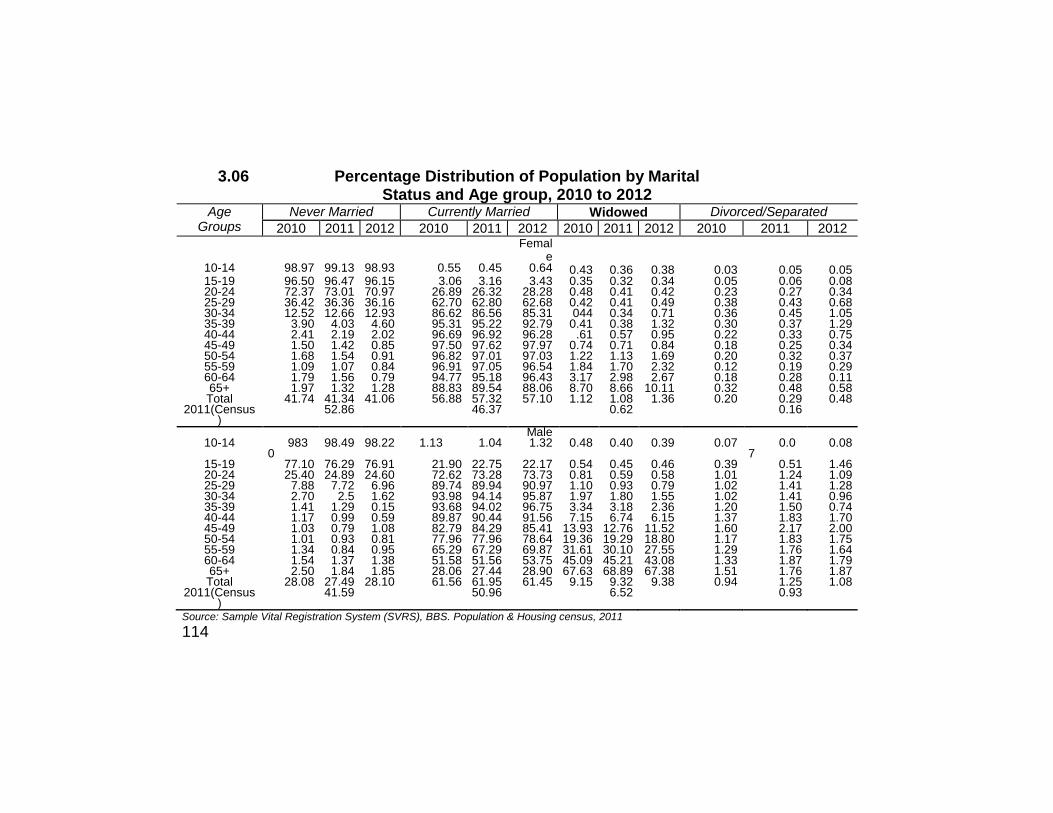
3.06 Percentage Distribution of Population by Marital Status and Age group, 2010 to 2012
Age Groups
Never Married Currently Married Widowed Divorced/Separated
2010 2011 2012 2010 2011 2012 2010 2011 2012 2010 2011 2012 Femal
e
10-14 98.97 99.13 98.93 0.55 0.45 0.64 0.43 0.36 0.38 0.03 0.05 0.05 15-19 96.50 96.47 96.15 3.06 3.16 3.43 0.35 0.32 0.34 0.05 0.06 0.08 20-24 72.37 73.01 70.97 26.89 26.32 28.28 0.48 0.41 0.42 0.23 0.27 0.34 25-29 36.42 36.36 36.16 62.70 62.80 62.68 0.42 0.41 0.49 0.38 0.43 0.68 30-34 12.52 12.66 12.93 86.62 86.56 85.31 044 0.34 0.71 0.36 0.45 1.05 35-39 3.90 4.03 4.60 95.31 95.22 92.79 0.41 0.38 1.32 0.30 0.37 1.29 40-44 2.41 2.19 2.02 96.69 96.92 96.28 .61 0.57 0.95 0.22 0.33 0.75 45-49 1.50 1.42 0.85 97.50 97.62 97.97 0.74 0.71 0.84 0.18 0.25 0.34 50-54 1.68 1.54 0.91 96.82 97.01 97.03 1.22 1.13 1.69 0.20 0.32 0.37 55-59 1.09 1.07 0.84 96.91 97.05 96.54 1.84 1.70 2.32 0.12 0.19 0.29 60-64 1.79 1.56 0.79 94.77 95.18 96.43 3.17 2.98 2.67 0.18 0.28 0.11 65+ 1.97 1.32 1.28 88.83 89.54 88.06 8.70 8.66 10.11 0.32 0.48 0.58 Total 41.74 41.34 41.06 56.88 57.32 57.10 1.12 1.08 1.36 0.20 0.29 0.48
2011(Census)
52.86 46.37 0.62 0.16
Male 10-14 983
0 98.49 98.22 1.13 1.04 1.32 0.48 0.40 0.39 0.07 0.0
7 0.08
15-19 77.10 76.29 76.91 21.90 22.75 22.17 0.54 0.45 0.46 0.39 0.51 1.46 20-24 25.40 24.89 24.60 72.62 73.28 73.73 0.81 0.59 0.58 1.01 1.24 1.09 25-29 7.88 7.72 6.96 89.74 89.94 90.97 1.10 0.93 0.79 1.02 1.41 1.28 30-34 2.70 2.5 1.62 93.98 94.14 95.87 1.97 1.80 1.55 1.02 1.41 0.96 35-39 1.41 1.29 0.15 93.68 94.02 96.75 3.34 3.18 2.36 1.20 1.50 0.74 40-44 1.17 0.99 0.59 89.87 90.44 91.56 7.15 6.74 6.15 1.37 1.83 1.70 45-49 1.03 0.79 1.08 82.79 84.29 85.41 13.93 12.76 11.52 1.60 2.17 2.00 50-54 1.01 0.93 0.81 77.96 77.96 78.64 19.36 19.29 18.80 1.17 1.83 1.75 55-59 1.34 0.84 0.95 65.29 67.29 69.87 31.61 30.10 27.55 1.29 1.76 1.64 60-64 1.54 1.37 1.38 51.58 51.56 53.75 45.09 45.21 43.08 1.33 1.87 1.79 65+ 2.50 1.84 1.85 28.06 27.44 28.90 67.63 68.89 67.38 1.51 1.76 1.87 Total 28.08 27.49 28.10 61.56 61.95 61.45 9.15 9.32 9.38 0.94 1.25 1.08
2011(Census)
41.59 50.96 6.52 0.93
Source: Sample Vital Registration System (SVRS), BBS. Population & Housing census, 2011
114

115
3.07 Mean Age at Marriage by Sex, 1982 to 2012 Year Male Female
1983 VRS 25.2 18.6 1984 VRS 23.9 17.8
1985 VRS 25.3 18.0 1986 VRS 24.5 17.5 1987 VRS 25.0 17.9 1988 VRS 24.8 18.0 1989 VRS 25.0 18.0
1990 VRS 25.1 18.0 1991 PC 24.2 18.1 1991 SVR 25.2 18.1 1992 SVR 25.2 18.2 1993 SVR 26.6 19.6
1994 SVR 27.7 19.8 1995 SVR 27.5 19.9 1996 SVR 27.6 20.0 1997 SVR 27.6 20.0 1998 SVR 27.6 20.2
1999 SVRS 27.7 20.3 2000 SVRS 27.7 20.4 2001 PC 25.2 19.0 2001 SVRS 25.8 20.4 2002 SVRS 25.6 20.6 2003 SVRS 25.2 20.4 2004 SVRS 25.3 19.0 2005 SVRS 23.3 18.0 2006 SVRS 23.4 18.1 2007 SVRS 23.6 18.4 2008 SVRS 23.8 19.1 2009 SVRS 23.8 18.5 2010 SVRS 23.9 18.7 2011 SVRS 24.9 18.6 2012 SVRS 24.7 20.1 Source: (1) Population Census (PC) 1991, 2001 (2) Sample Vital Registration System (SVRS), BBS.

116
3.08 Crude Death Rate (CDR) by Residence, 1996 to 2012 (Per 1000)
Year National Urban Rural
1997 5.5 4.2 6.5 1998 5.1 3.7 5.4 1999 5.1 3.5 5.4 2000 4.9 3.5 5.3 2001 4.8 4.3 5.2 2002 5.1 3.8 5.4 2003 5.9 4.7 6.2 2004 5.8 4.4 6.1 2005 5.8 4.9 6.1 2006 5.6 4.4 6.0 2007 6.2 5.1 6.6 2008 6.0 5.1 6.5 2009 5.8 4.7 6.1 2010 5.6 4.9 5.9 2011 5.5 4.8 5.8 2012 5.3 4.6 5.7 Source: Sample Vital Registration System (SVRS), BBS.
3.09 Crude Birth Rate (CBR) by Residence, 1996 to 2012 (Per 1000)
Year National Urban Rural 1997 21.0 16.2 24.5 1998 19.9 14.0 21.0 1999 19.2 13.8 20.9 2000 19.0 13.7 20.8 2001 18.9 13.6 20.7 2002 20.1 16.6 21.0 2003 20.9 17.9 21.7 2004 20.8 17.8 26.6 2005 20.7 17.8 21.7 2006 20.6 17.5 21.7 2007 20.9 17.4 22.1 2008 20.5 17.2 22.4 2009 19.4 16.8 20.4 2010 19.2 17.1 20.1 2011 19.2 20.2 17.4 2012 18.9 17.1 20.0 Source: Sample Vital Registration System (SVRS), BBS.

117
3.10 Infant Mortality Rate (IMR) Per 1000 Live Birth, 2005 to 2012 Sex & Residence 2006 2007 2008 2009 2010 2011 2012
A. Sex Both Sex 45 43 41 39 36 35 33 Male 47 45 42 42 38 36 34 Female 43 41 40 37 35 33 32
B. Residence National 45 43 41 39 36 35 33 Urban 38 42 40 37 35 32 31 Rural 47 43 42 40 37 36 34
Source: Sample Vital Registration System (SVRS), BBS.
3.11 Natural Growth Rate (CBR-CDR) by Residence 2005 to 2012 Residence 2006 2007 2008 2009 2010 2011 2012
National 1.47 1.40 1.39 1.36 1.36 1.37 1.36 Urban 1.31 1.23 1.22 1.21 1.22 1.26 1.25 Rural 1.57 1.55 1.51 1.43 1.42 1.44 1.43
Source: Sample Vital Registration System (SVRS), BBS.
3.12 Maternal Mortality Ratio (MMR),1998 to 2012
(Per 1000 live births) Year National Rural Urban
1999 3.20 3.33 2.63 2000 3.18 3.29 2.61 2001 3.15 3.26 2.58 2002 3.91 4.17 2.73 2003 3.76 4.02 2.70 2004 3.65 3.87 2.53 2005 3.48 3.58 2.75 2006 3.37 3.75 1.96 2007 3.51 3.86 2.19 2008 3.48 3.93 2.42 2009 2.59 2.85 1.79 2010 2.16 2.30 1.78 2011 2.09 2.15 1.96 2012 2.03 2.10 1.90 Note: As per 10
th revision of international classification of diseases.
Source: Sample Vital Registration System (SVRS), BBS.

118
3.13 Life Expectancy at Birth by Sex, 1999 to 2012
Year sex Bangladesh Urban Rural
2000 Both sex 63.6 65.3 62.1 Male 63.7 65.2 61.7 Female 63.5 65.4 62.7
2002 Both sex 64.9 67.2 64.4 Male 64.5 67.0 63.9 Female 65.4 67.3 65.0
2003 Both sex 64.9 67.6 64.3 Male 64.3 67.3 63.4 Female 65.4 67.9 65.5
2004 Both sex 65.1 67.8 64.3 Male 64.4 67.5 63.4 Female 65.7 68.1 65.5
2005 Both sex 65.2 67.9 64.5 Male 64.4 67.6 63.5 Female 65.8 68.1 65.6
2006 Both sex 65.4 68.0 64.6 Male 64.5 67..8 63.6 Female 66.6 68.3 65.7
2007 Both sex 66.6 68.1 66.0 Male 65.5 67.7 64.7 Female 67.9 68.7 67.6
2008 Both sex 66.8 68.3 66.2 Male 65.6 67.9 64.8 Female 68.0 68.8 67.7
2009 Both sex 67.2 68.7 68.9 Male 66.1 68.2 65.6 Female 68.7 69.2 68.3
2010 Both sex 67.7 68.9 67.4 Male 66.6 68.3 66.4 Female 68.8 69.5 68.6
2011 Both sex 69.0 69.9 68.6 Male 67.9 68.9 67.4 Female 70.3 71.1 69.8 2012 Both sex 69.4 71.5 69.2 Male 68.2 70.8 68.8 Female 70.7 70.3 70.0 Source: Sample Vital Registration System (SVRS), BBS.

3.14 Abridged Life Table for Bangladesh Population by Sex, 2012
Both Sex Male Female Age Probability
of dying Number
of surviving
Expectation of life
Probability of dying
Number of
surviving
Expectation of life
Probability of dying
Number of
surviving
Expectation of life
0 0.04341 100000 69.36 0.04505 100000 68.24 0.04169 100000 70.69
1 00.00350 95659 70.20 0.00365 95495 68.78 0.00336 95831 71.76
2 0.00220 95324 69.42 0.00227 95146 68.01 0.00212 95509 70.98
3 0.00191 95115 68.57 0.00167 94930 67.14 0.00217 954307 70.13
4 0.0010 94933 67.68 0.00170 94772 66.25 0.00149 95100 69.26
05-09 0.00429 94781 66.88 0.00548 94611 65.49 0.00310 94959 68.41
10-14 0.00399 94375 62.14 0.00464 94092 60.80 0.00329 94665 63.62
15-19 0.00394 93998 57.37 0.00389 93655 56.04 0.00399 94353 58.83
20-24 0.00479 93627 52.60 0.00529 93291 51.27 0.00429 93976 54.05
25-29 0.00504 93179 47.83 0.00444 92797 46.50 0.00568 93573 49.30
30-34 0.00673 92710 43.08 0.00638 92385 41.72 0.00707 93041 44.59
35-39 0.00876 92086 38.38 0.00881 91796 37.00 0.00866 92383 39.90
40-44 0.01222 91279 33.73 0.01548 90987 32.40 0.00896 91583 35.21
45-49 0.02362 90163 29.26 0.02854 98579 28.01 0.01853 90762 30.63
50-54 0.03642 88034 25.01 0.04583 87023 23.90 0.2684 89081 26.22
55-59 0.05301 84827 20.94 0.06768 83035 20.03 0.03777 86690 21.93
60-64 0.08969 80331 17.16 0.11049 77415 16.48 0.06829 83416 17.87
65-69 0.12528 73126 13.61 0.15238 68861 13.20 0.09759 77720 14.03
70-74 0.18894 63965 10.18 0.20648 58368 9.97 0.17109 70135 10.41
75-79 0.26919 51879 6.69 0.30724 46316 6.64 0.22993 85135 6.74
80+ 1 37914 1 1 32086 1 1 44768 1 Source: Report on Sampe Vital Registration System, 2012, BBS
119

120
3.15 Ethnic Household and Population by Zila, 2011
Sl. Name of Zila General
Household Population % of Total Tribal
No. General Population
BANGLADESH 353727 1586141 100.00 100.00 1 Barisal Division 745 2757 0.21 0.17 1 Barguna Zila 325 1143 0.09 0.07 2 Barisal Zila 15 76 0.00 0.00 3 Bhola Zila 11 57 0.00 0.00 4 Jhalokati Zila 6 29 0.00 0.00 5 Patuakhali Zila 376 1399 0.11 0.09 6 Pirojpur Zila 12 53 0.00 0.00 2 Chittagong Div. 194138 897871 54.88 0.00 7 Bandarban Zila 36288 172401 10.26 56.61 8 Brahmanbaria Zila 25 118 0.01 10.87 9 Chandpur Zila 282 1292 0.08 0.01 10 Chittagong Zila 6834 32165 1.93 0.08 11 Comilla Zila 604 2974 0.17 2.03 12 Cox's Bazar Zila 2885 14551 0.82 0.19 13 Feni Zila 117 639 0.03 0.92 14 Khagrachhari Zila 70175 316987 19.84 0.04 15 Lakshmipur Zila 56 244 0.02 19.98 16 Noakhali Zila 51 347 0.01 0.02 17 Rangamati Zila 76821 356153 21.72 0.02 3. DhakaDivision 35177 149007 9.94 22.45 18 Dhaka Zila 4615 20123 1.30 9.39 19 Faridpur Zila 651 3233 0.18 1.27 20 Gazipur Zila 3525 15368 1.00 0.20 21 Gopalganj Zila 348 2066 0.10 0.97 22 Jamalpur Zila 376 1569 0.11 0.13 23 Kishorganj Zila 94 433 0.03 0.10 24 Madaripur Zila 17 76 0.00 0.03 25 Manikganj Zila 115 582 0.03 0.00 26 Munshiganj Zila 24 103 0.01 0.04 27 Mymensingh Zila 8632 35907 2.44 0.01 28 Narayangan Zila 165 899 0.05 2.26 29 Narsingdi Zila 40 208 0.01 0.06 30 Netrokona Zila 6021 25247 1.70 0.01 31 Rajbari Zila 293 1285 0.08 1.59 32 Shariatpur Zila 10 93 0.00 0.08 33 Sherpur Zila 4180 16231 1.18 0.02 34 Tangail Zila 6071 25584 1.72 1.61 Contd.

121
3.15 Ethnic Household and Population by Zila, 2011
Sl. Name of Zila General
Household Population % of Total Tribal
No. General Population
4. Khulna Division 8905 40530 2.52 2.56 35 Bagerhat Zila 698 3327 0.20 0.21 36 Chuadanga Zila 329 1268 0.09 0.08 37 Jessore Zila 3790 17432 1.07 1.10 38 Jhenaidaha Zila 698 3108 0.20 0.20 39 Khulna Zila 476 2054 0.13 0.13 40 Kushtia Zila 373 1666 0.11 0.11 41 Magura Zila 1760 8099 0.50 0.51 42 Meherpur Zila 4 18 0.00 0.00 43 Narail Zila 208 943 0.06 0.06 44 Satkhira Zila 569 2615 0.16 0.16
5. RajshahiDivision 58465 245015 16.53 15.45 45 Bogra Zila 2008 7981 0.57 0.50 46 Joypurhat Zila 5705 23139 1.61 1.46 47 Naogaon Zila 28374 116736 8.02 7.36 48 Natore Zila 2853 11912 0.81 0.75
49 Chapai Nawabganj Zila 3216 14190
0.91 0.89
50 Pabna Zila 501 1973 0.14 0.12 51 Rajshahi Zila 11132 49312 3.15 3.11 52 Sirajganj Zila 4676 19772 1.32 1.25
6 Rangpur Division 24618 102001 6.96 6.43 53 Dinajpur Zila 15999 66861 4.52 4.22 54 Gaibandha Zila 1123 4312 0.32 0.27 55 Kurigram Zila 115 486 0.03 0.03 56 Lalmonirhat Zila 23 126 0.01 0.01 57 Nilphamari Zila 109 495 0.03 0.03 58 Panchagarh Zila 383 1528 0.11 0.10 59 Rangpur Zila 4727 18561 1.34 1.17 60 Thakurgaon Zila 2139 9632 0.60 0.61
7. Sylhet Division 31679 148960 8.96 9.39 61 Habiganj Zila 14534 65802 4.11 4.15 62 Maulvibazar Zila 13217 63466 3.74 4.00 63 Sunamganj Zila 1444 6911 0.41 0.44 64 Sylhet Zila 2484 12781 0.70 0.81 Source: Population & Housing Census, 2011, BBS.

3.16 Disable Person by Type of Household and Disablity, 2011
Locality/Household Total Speech Vision Hearing Physical Mental Autism
BANGLADESH
Total 2025842 275594 394020 183012 796219 254439 122558
General 2010428 273647 390940 181728 791226 251591 121296
Institutional 7812 864 1518 590 2468 1797 575
Others 7602 1083 1562 694 2525 1051 687
Rural
Total 1672262 228462 329221 157511 658888 202057 96123
General 1666911 227794 328211 157039 657037 201170 95660
Institutional 2356 242 443 185 849 451 186
Others 2995 426 567 287 1002 436 277
Urban
Total 353580 47132 64799 25501 137331 52382 26435
General 343517 45853 62729 24689 134189 50421 25636
Institutional 5456 622 1075 405 1619 1346 389
Others 4607 657 995 407 1523 615 410
Source: Population & Housing Census, 2011, BBS.
122

122
3.17 Inter censal Growth Rates of Population 1901 to 2011 Census Year Population Variation
Number Percent Growth
Rates Exponential
1901 March 1 28,927,786 — — —
1911 March 10 31,555,056 2,627,270 9.08 0.94
1921 March 18 33,254,096 1,699,040 5.38 0.60
1931 February 26 35,604,170 28,50,071 7.07 0.74
1941 March 1 41,997,297 6,893,127 17.96 1.70
1951 March 1 44,165,740 2,168,443 5.16 0.50 (42,062,610)
1961 Feb. 1 55,222,663 11,056,923 25.04 2.26 (50,840,235)
1974 March 1 76,398,000 21,175,337 38.35 2.48 (71,479,071)
1981 March 5 89,912,000 13,514,000 17.69 2.35 (87,120,119) 1991 March 11 111,455,185 21,543,185 23.96 2.17 (106,314,992) 2001 January 23 130,522,598 19,067,402 17.11 1.59 (124,355,263) 2011 March 15-19 144,043,697
(149,772,364) 13,521,099 10.36 1.47
Note: Figures in the Parenthesis Represent Enumerated Population Source: Bangladesh Population Census, BBS.

3.18 Disable Person by Age group and sex, 2011
Sex/Age Total Disable Population Disable Population %
Group Total Speech Vision Hearing
Physical Mental Autism Total Speech Vision Hearing Physical Mental Autism
BothSex Total 144043697 2029230 276103 394552 183278 797420 255103 122774 100 13.6 19.4 9 39.3 12.6 6.1
0-4 1506197 76365 15813 7974 3511 35430 4741 8896 100 20.7 10.4 4.6 46.4 6.2 11.6 5-14 34819844 345369 80333 38448 23076 123989 46293 33230 100 23.3 11.1 6.7 35.9 13.4 9.6 15-29 39641187 411732 81350 47652 26359 143776 79212 33383 100 19.8 11.6 6.4 34.9 19.2 8.1 30-49 34697928 455462 57569 83492 39986 1177791 73914 22710 100 12.6 18.3 8.8 39 16.2 5 50-64 12987282 336423 23688 88839 36912 144416 31022 11546 100 7 26.4 11 42.9 9.2 3.4 65 + 6835486 403879 17350 128147 53434 172018 19921 13009 100 4.3 31.7 13.2 42.6 4.9 3.2 Male Total 72109796 109564 154771 187856 88322 458963 138934 66798 100 14.1 17.1 8.1 41.9 12.7 6.1 0-4 7638523 42582 8653 4156 1945 20319 2702 4807 100 20.3 9.8 4.6 47.7 6.3 11.3 5-14 17937403 197688 45321 21768 12480 72817 26582 18720 100 22.9 11 6.3 36.8 13.4 9.5 15-29 18512114 225509 43838 24473 13166 81283 44582 18167 100 19.4 10.9 5.8 36 19.8 8.1 30-49 17420651 243526 33106 37251 18149 102847 39712 12461 100 13.6 15.3 7.5 42.2 16.3 5.1 50-64 6957436 180401 13927 40904 16875 86664 15655 6376 100 7.7 22.7 9.4 48 8.7 3.5 65 + 3643669 205938 9926 59304 25707 95033 9701 6267 100 4.8 28.8 12.5 46.1 4.7 3 Female Total 71933901 933586 121332 206696 94956 338457 116169 55976 100 13 22.1 10.2 36.3 12.4 6 0-4 7423447 337773 7160 3818 1566 15111 2039 4089 100 21.2 11..3 4.6 44.7 6. 12.1
5-14 16882441 147681 35012 16680 10596 51172 19711 14510 100 23.7 1.3 7.2 34.7 13.3 9.8 15-29 21129073 186223 37512 23179 13193 62493 34630 15216 100 20.1 12.4 7.1 33.6 18.6 8.2 30-49 17277277 211936 24463 46241 21837 74944 34202 10249 100 11.5 21.8 10.3 35.4 16.1 4.8 50-64 6029846 156022 9761 47935 20037 57752 15367 5170 100 6.3 30.7 12.8 37 9.8 3.3 65 + 3191817 197941 7424 68843 27727 76985 102220 6742 100 3.8 34.8 14 38..9 5.2 3.4
Source: Population & Housing Census, 2011, BBS. 124

3.19 Household Reporting Reading Newspaper, Listening Radio Watching
Television and Using Internet (Percent)
Localit
y
No. of Household No. of Household%
Newspaper Radio Television Internet Newspaper Radio Television Internet
Yes No Yes No Yes No Yes No Yes No Yes No Yes No Yes No
Total 14160106 17545578 2681192 29024491 18676957 13028727 974959 30730725 44.66 55.34 8.46 91.54 58.91 41.09 3.08 96.92 Rural 10426891 15108986 2121970 23413907 13812327 11723550 376771 25159106 40.83 59.17 8.31 91.69 54.09 45.91 1.48 98.52 Urban 3733215 2436592 559222 5610585 4864630 1305177 598187 5571620 60.51 39.49 9.06 90.94 78.85 21.15 9.70 90.30
Source: Population Census Sample Survey, 2011, BBS.
3.20 Household Reporting Latrine (Percent)
Locality Latrine Latrine% Total Sanitary
with Water
Seal
Sanitary
without
Water Seal
Non
Sanitary/
Kutcha
Open
Space
Sanitary
with Water
Seal
Sanitary
without
Water
Seal
Non
Sanitary/
Kutcha
Open
Space
Total
Total 31705684 8816453 10714206 9953308 2221716 27.81 33.79 31.39 7.01 100.00 Rural 25535877 5840787 8645738 8953670 2095681 22.87 33.86 35.06 8.21 100.00 Urban 6169807 2975666 2068468 999638 126035 48.23 33.53 16.20 2.04 100.00
Source: Population Census Sample Survey, 2011, BBS.
3.21 Household Reporting Source of Light (Percent)
Locality Source of Light Source of Light%
Total Electricity Solar
Energ
Kerosene Biogas Other Electricity Solar
Energy
Kerosene Biogas Other Total
Total 31705684 17945031 1051736 12521349 410407 146161 56.60 3.32 39.49 0.13 0.46 100 Rural 25535877 12472701 1023926 11860910 39196 139143 48.84 4.01 46.45 0.15 0.54 100 Urban 6169807 5472330 27809 660440 2210 7018 88.70 0.45 10.70 0.04 0.11 100
Source: Population Census Sample Survey, 2011, BBS.
3.22 Household Reporting Cooking Fuel Locality Cooking Fuel Cooking Fuel %
Total Wood Kero-
sene
Gas/LPG Elec-
tricity
Straw/Dried
Cow Dung
Bio-
gas
Wood Kero-
sene
Gas/
LPG
Elec-
tricity
Straw/Dried
Cow Dung
Bio-
gas
Total
Total 31705684 11017840 317629 4010415 119238 16220943 19619 34.75 1.00 12.65 0.38 51.16 0.06 100 Rural 25535877 8959854 266379 1142677 65264 15085541 16162 35.09 1.04 4.47 0.26 59.08 0.06 100 Urban 6169807 2057986 51250 2867738 53974 1135402 3457 33.36 0.83 46.48 0.87 18.40 0.06 100

Source: Population Census Sample Survey, 2011, BBS. 125
3.23 Projected Population by Sex and Urban and Rural Residence on the assumption that TFR=2.1 by 2011 (in Million)
Year Bangladesh Urban Rural
Male Female Total Male Female Total Male Female Total
2001 67.08 62.94 130.02 16.44 14.02 30.47 50.63 48.92 99.55
2002 68.39 64.21 132.6 16.86 14.39 31.25 51.53 49.82 101.35
2003 69.67 65.45 135.12 17.37 14.83 32.2 52.3 50.62 102.92
2004 70.89 66.65 137.54 17.96 15.36 33.33 52.93 51.28 104.21
2005 72.01 67.75 139.76 18.65 15.97 34.62 53.36 51.78 105.14
2006 73.03 68.77 141.8 19.43 16.67 36.11 53.6 52.1 105.69
2007 74.09 69.81 143.91 20.25 17.4 37.65 53.84 52.41 106.26
2008 75.11 70.82 145.93 21.08 18.14 39.22 54.03 52.68 106.71
2009 76.08 71.78 147.86 21.92 18.89 40.82 54.15 52.89 107.04
2010 76.99 72.69 149.69 22.77 19.66 42.43 54.22 53.04 107.26
2011 77.85 73.56 151.41 23.63 20.43 44.06 54.22 53.13 107.35
2012 78.75 74.46 153.2 24.52 21.23 45.75 54.23 53.22 107.45
2013 79.68 75.38 155.06 25.44 22.07 47.51 54.23 53.32 107.55
2014 80.64 76.34 156.98 26.4 22.93 49.33 54.24 53.41 107.65
2015 81.63 77.33 158.96 27.39 23.83 51.22 54.24 53.5 107.74
2016 82.65 78.34 160.99 28.42 24.76 53.18 54.24 53.58 107.81
2017 83.7 79.38 163.08 29.48 25.73 55.21 54.22 53.65 107.87
2018 84.77 80.43 165.21 30.57 26.72 57.3 54.2 53.71 107.91
Contd. 126

3.23 Projected Population by Sex and Urban and Rural Residence on the assumption that TFR=2.1 by 2011 (in Million)
Year Bangladesh Urban Rural
Male Female Total Male Female Total Male Female Total
2019 85.86 81.51 167.37 31.7 27.75 59.4 54.16 53.76 107.92
2020 86.96 82.58 169.54 32.86 28.8 61.66 54.1 53.78 107.88
2021 88.05 83.66 171.71 34.04 29.88 63.92 54.01 53.78 107.79
2022 89.13 84.73 173.86 35.24 30.99 66.23 53.89 53.74 107.63
2023 90.21 85.79 176 36.47 32.11 68.58 53.75 53.68 107.43
2024 91.28 86.84 178.12 37.71 33.26 70.97 53..56 53.58 107.15
2025 92.33 87.88 180.21 38.98 34.43 73.41 53.35 53.45 106.8
2026 93.35 88.89 182.24 40.26 35.61 75.87 53.1 53.28 106.38
2027 94.35 89.88 184.23 41.55 36.81 78.36 52.81 53.07 105.88
2028 95.33 90.84 186.17 42.85 38.02 80.87 52.48 52.82 105.3
2029 96.27 91.77 188.04 44.16 39.24 83.4 52.11 52.53 104.64
2030 97.18 92.67 189.85 45.48 40.47 85.95 51.71 52.21 103.92
2031 98.06 93.54 191.6 46.8 41.7 88.5 51.27 51.84 103.11
2032 98.91 94.38 193.29 48.12 42.94 91.06 50.79 51.44 102.23
2033 99.73 95.19 194.92 49.45 44.19 93.64 50.29 51 101.29
2034 100.53 95.97 196.5 50.78 45.44 96.22 49.75 50.53 100.28
2035 101.3 96.73 198.03 52.11 46.7 98.81 49.19 50.03 99.22
Contd. 127

3.23 Projected Population by Sex and Urban and Rural Residence on the assumption that TFR=2.1 by 2011 (in Million)
Year Bangladesh Urban Rural
Male Female Total Male Female Total Male Female Total
2036 102.05 97.47 199.52 53.45 47.96 101.41 48.6 49.51 98.11
2037 102.78 98.19 200.97 54.79 49.23 104.02 48 48.96 96.96
2038 103.5 98.89 202.39 56.13 50.5 106.63 47.37 48.38 95.75
2039 104.2 99.56 203.76 57.47 51.78 109.25 46.73 47.79 94.52
2040 104.9 100.23 205.13 58.82 53.06 111.88 46.07 47.17 93.24
2041 105.58 100.88 206.46 60.18 54.34 114.52 45.4 46.54 91.94
2042 106.26 101.52 207.78 61.54 55.63 117.17 44.72 45.89 90.61
2043 106.93 102.15 209.08 62.9 56.91 119.81 44.03 45.23 89.26
2044 107.59 102.76 210.35 64.26 58.2 122.46 43.33 44.56 87.89
2045 108.25 103.36 211.61 65.62 59.49 125.11 42.62 43.87 86.49
2046 108.9 103.95 212.85 66.99 60.78 127.77 41.91 43.17 85.08
2047 109.54 104.52 214.06 68.35 62.06 130.41 41.19 42.46 83.65
2048 110.17 105.08 215.25 69.71 63.34 133.05 40.46 41.74 82.2
2049 110.79 105.62 216.41 71.07 64.61 135.68 39.73 41.01 80.74
2050 111.4 106.14 217.54 72.41 65.87 138.28 38.99 40.27 79.26
2051 112 106.65 218.65 73.75 67.12 140.87 38.25 39.53 77.78
Source: Sectoral Need-Based Projections in Bangladesh, BBS 128

129
Chapter IV
LABOUR AND
MANPOWER

130

131
4.01 Key Findings of Labour Force Survey, 2010 (Million) Labour force survey(15+Population)
Labour force characteristics 2002-03 2005-06 2010 1. Economically active population/Labour Force
(Million) (15+)
Bangladesh Total 46.3 49.5 56.7 Male 36.0 37.3 39.5 Female 10.3 12.1 17.2 Urban Total 11.3 11.7 13.3 Male 8.6 8.9 9.3 Female 2.7 2.8 4.0 Rural Total 35.0 37.8 43.4 Male 27.4 28.5 30.2 Female 7.6 9.3 13.2 2. Employed Population (million) Bangladesh Total 44.3 47.4 54.1 Male 34.5 36.1 37.9 Female 9.8 11.3 16.2 Urban Total 10.7 11.3 12.4 Male 8.2 8.6 8.8 Female 2.5 2.7 3.6 Rural Total 33.6 36.1 41.7 Male 26.3 27.5 29.1 Female 7.3 8.6 12.6 3. Unemployed Population (million) Bangladesh Total 2.0 2.1 2.6 Male 1.5 1.2 1.6 Female 0.5 0.9 1.0 Urban Total 0.6 0.5 0.9 Male 0.4 0.3 0.5 Female 0.2 0.2 0.4 Rural Total 1.4 1.6 1.7 Male 1.1 0.9 1.1 Female 0.3 0.7 0.6 Contd.

132
4.01 Key Findings of Labour Force Survey, 2010 (Million) Labour force survey
(15+Population)
Labour force characteristics 2002-03 2005-06 2010
4. Not in Labour force (Million) Bangladesh Total 34.5 35.1 38.9 Male 5.2 5.7 8.4 Female 29.3 29.4 30.5 Urban Total 8.6 9.3 9.9 Male 1.5 1.8 2.3 Female 7.1 7.5 7.6 Rural Total 25.9 25.8 29.0 Male 3.7 3.9 6.1 Female 22.2 21.9 22.9
5. Unemployment rate(%)
Total 4.3 4.3 4.5 Male 4.2 3.4 4.1 Female 4.9 7.0 5.8
6. Labour force participation rate (%) (refined activity rate)
Bangladesh Total 57.3 58.5 59.3 Male 87.4 86.8 82.5 Female 26.1 29.2 36.0 Urban Total 56.8 55.7 57.3 Male 85.1 83.2 80.2 Female 27.4 27.4 34.5 Rural Total 57.5 59.4 60.0 Male 88.1 88.0 83.3 Female 25.6 29.8 36.4 Contd.
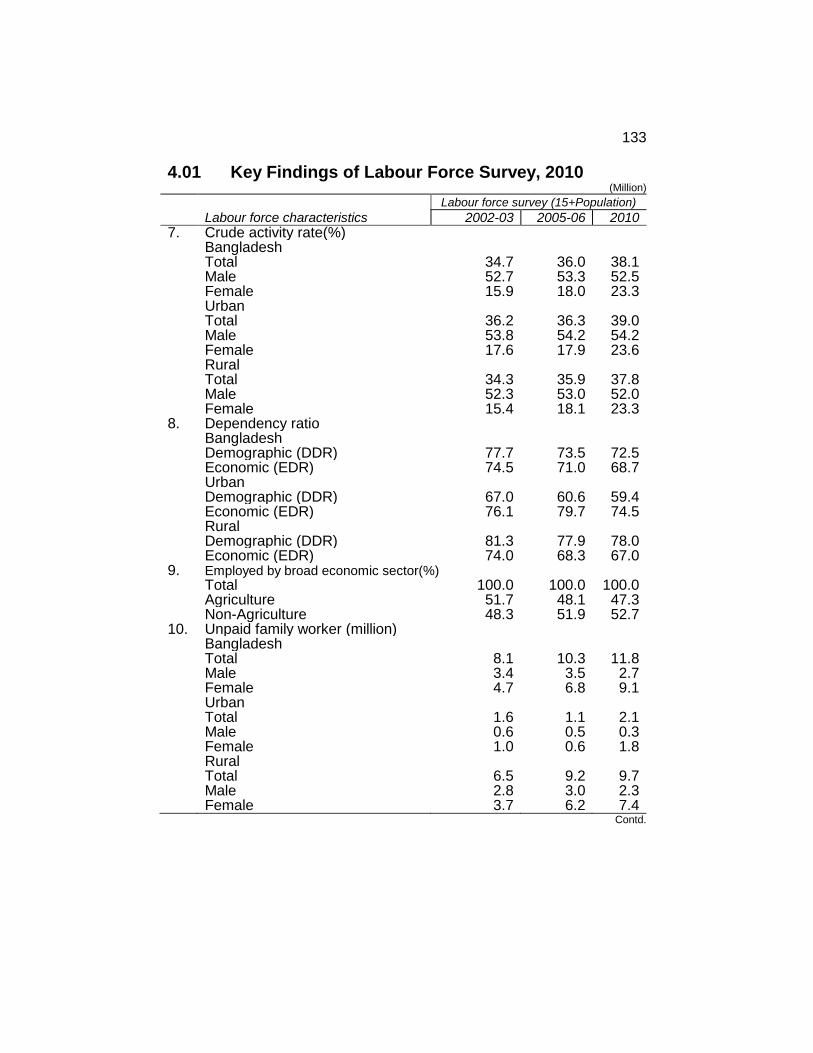
133
4.01 Key Findings of Labour Force Survey, 2010 (Million) Labour force survey (15+Population)
Labour force characteristics 2002-03 2005-06 2010 7. Crude activity rate(%) Bangladesh Total 34.7 36.0 38.1 Male 52.7 53.3 52.5 Female 15.9 18.0 23.3 Urban Total 36.2 36.3 39.0 Male 53.8 54.2 54.2 Female 17.6 17.9 23.6 Rural Total 34.3 35.9 37.8 Male 52.3 53.0 52.0 Female 15.4 18.1 23.3 8. Dependency ratio Bangladesh Demographic (DDR) 77.7 73.5 72.5 Economic (EDR) 74.5 71.0 68.7 Urban Demographic (DDR) 67.0 60.6 59.4 Economic (EDR) 76.1 79.7 74.5 Rural Demographic (DDR) 81.3 77.9 78.0 Economic (EDR) 74.0 68.3 67.0 9. Employed by broad economic sector(%) Total 100.0 100.0 100.0 Agriculture 51.7 48.1 47.3 Non-Agriculture 48.3 51.9 52.7 10. Unpaid family worker (million) Bangladesh Total 8.1 10.3 11.8 Male 3.4 3.5 2.7 Female 4.7 6.8 9.1 Urban Total 1.6 1.1 2.1 Male 0.6 0.5 0.3 Female 1.0 0.6 1.8 Rural Total 6.5 9.2 9.7 Male 2.8 3.0 2.3 Female 3.7 6.2 7.4
Contd.

134
4.01 Key Findings of Labour Force Survey, 2010 (Million)
Labour force survey(15+Population)
Labour force characteristics 2002-03 2005-06 2010
11. Youth Labour Force (aged15-29) (million)
Bangladesh
Total 19.0 17.8 20.9 Male 13.5 13.2 13.1 Female 5.5 4.6 7.8 Urban Total 4.4 4.2 5.1 Male 3.1 3.0 3.1 Female 1.3 1.2 2.0 Rural Total 14.6 13.6 15.8 Male 10.4 10.2 10.0 Female 4.2 3.4 5.8
12. Youth Labour Force (aged 15-24) (million)
Bangladesh
Total 12.4 10.8 13.2 Male 8.6 8.4 8.2 Female 3.8 2.4 5.0 Urban Total 2.8 2.3 3.2 Male 1.9 1.7 1.9 Female 0.9 0.6 1.3 Rural Total 9.6 8.5 9.9 Male 6.7 6.7 6.3 Female 2.9 1.8 3.6
13. Female labour force (million) Bangladesh 10.3 12.1 17.2 Urban 2.7 2.8 4.0 Rural 7.6 9.3 13.2
14. Female labour force participation rate(%) Bangladesh 26.1 29.2 36.0 Urban 27.4 27.4 34.5 Rural 25.6 29.8 36.4
15. Employment by Sector (million)Format Sector Total 9.2 10.2 6.8 Male 7.3 8.6 5.5 Female 2.0 1.6 1.3 Informal sector Total 35.1 37.2 47.3 Male 27.2 27.5 32.4 Female 7.9 9.7 14.9 Contd.

135
4.01 Key Findings of Labour Force Survey, 2010 (Million) Labour force survey
(15+Population)
Labour force characteristics 2002-03 2005-06 2010
16. Employment by major occupation (Million) Total 44.3 47.4 54.1 Professional, technical 1.7 2.2 2.4 Administrative, managerial 0.1 0.2 0.7 Clerical workers 1.5 1.0 1.0 Sales workers 6.5 6.7 8.2 Service workers 2.0 2.8 3.0 Agriculture, forestry & fisheries 22.8 23.0 25.7 Production & transport labourers & Others 9.7 11.5 13.5
17. Employment by major industry (million) Total 44.3 47.4 54.1 Agriculture, forestry & fisheries 22.9 22.8 25.7 Mining and quarrying 0.1 0.1 0.1 Manufacturing 4.3 5.2 6.7 Electricity, Gas and water 0.1 0.1 0.1 Construction 1.5 1.5 2.6 Trade, hotel and restaurant 6.7 7.8 8.4 Transport, storage & communication 3.0 4.0 4.0 Finance & business Services and real
estate 0.3 0.8 1.0
Health, education, Public administration & defense
2.5 2.6 2.3
Community and personal services 2.7 2.6 3.4 18. Status in employment (million) Total 44.3 47.4 54.1 Self-employed/own accountant workers 19.8 19.9 22.0 Employer 0.2 0.1 0.1 Employee 6.1 6.6 9.4 Unpaid family helpers 8.1 10.3 11.8 Day labourers 8.9 8.6 10.6 Note: Components may not add to totals as one employed person may be engaged in More than one occupation or industry. Source: Labour Force Survey (LFS), 2010, BBS.
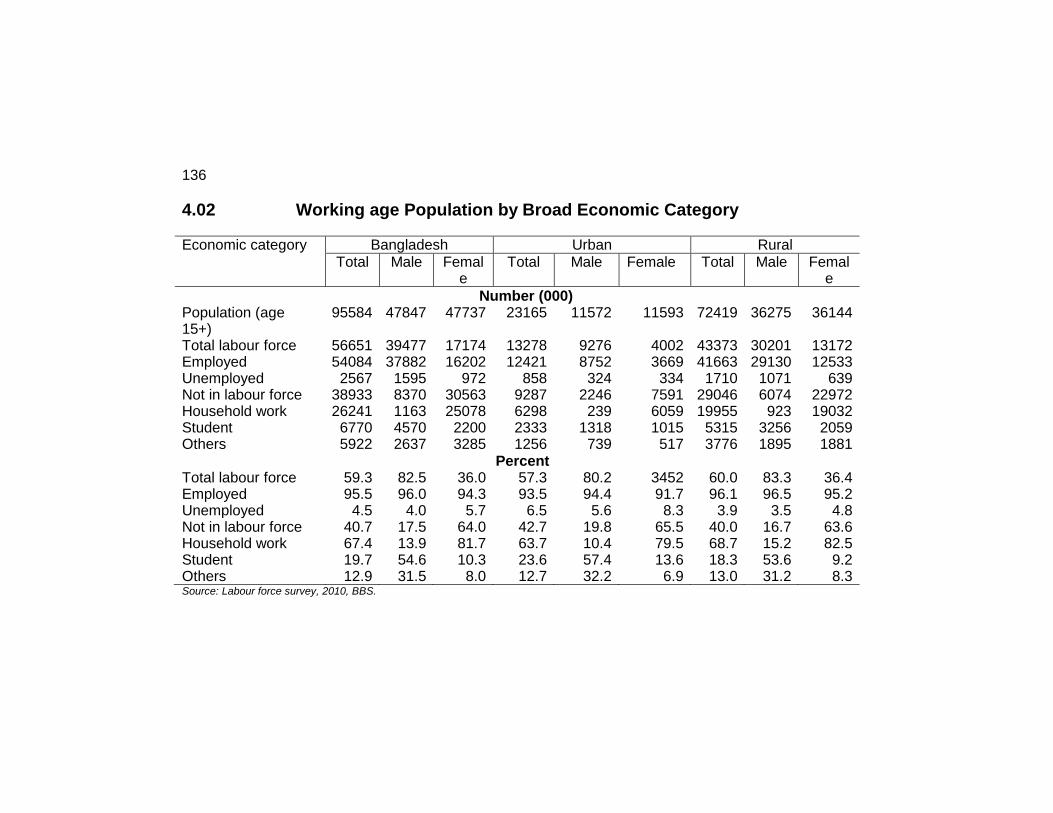
136
4.02 Working age Population by Broad Economic Category Economic category Bangladesh Urban Rural
Total Male Female
Total Male Female Total Male Female
Number (000) Population (age 15+)
95584 47847 47737 23165 11572 11593 72419 36275 36144
Total labour force 56651 39477 17174 13278 9276 4002 43373 30201 13172 Employed 54084 37882 16202 12421 8752 3669 41663 29130 12533 Unemployed 2567 1595 972 858 324 334 1710 1071 639 Not in labour force 38933 8370 30563 9287 2246 7591 29046 6074 22972 Household work 26241 1163 25078 6298 239 6059 19955 923 19032 Student 6770 4570 2200 2333 1318 1015 5315 3256 2059 Others 5922 2637 3285 1256 739 517 3776 1895 1881 Percent Total labour force 59.3 82.5 36.0 57.3 80.2 3452 60.0 83.3 36.4 Employed 95.5 96.0 94.3 93.5 94.4 91.7 96.1 96.5 95.2 Unemployed 4.5 4.0 5.7 6.5 5.6 8.3 3.9 3.5 4.8 Not in labour force 40.7 17.5 64.0 42.7 19.8 65.5 40.0 16.7 63.6 Household work 67.4 13.9 81.7 63.7 10.4 79.5 68.7 15.2 82.5 Student 19.7 54.6 10.3 23.6 57.4 13.6 18.3 53.6 9.2 Others 12.9 31.5 8.0 12.7 32.2 6.9 13.0 31.2 8.3 Source: Labour force survey, 2010, BBS.
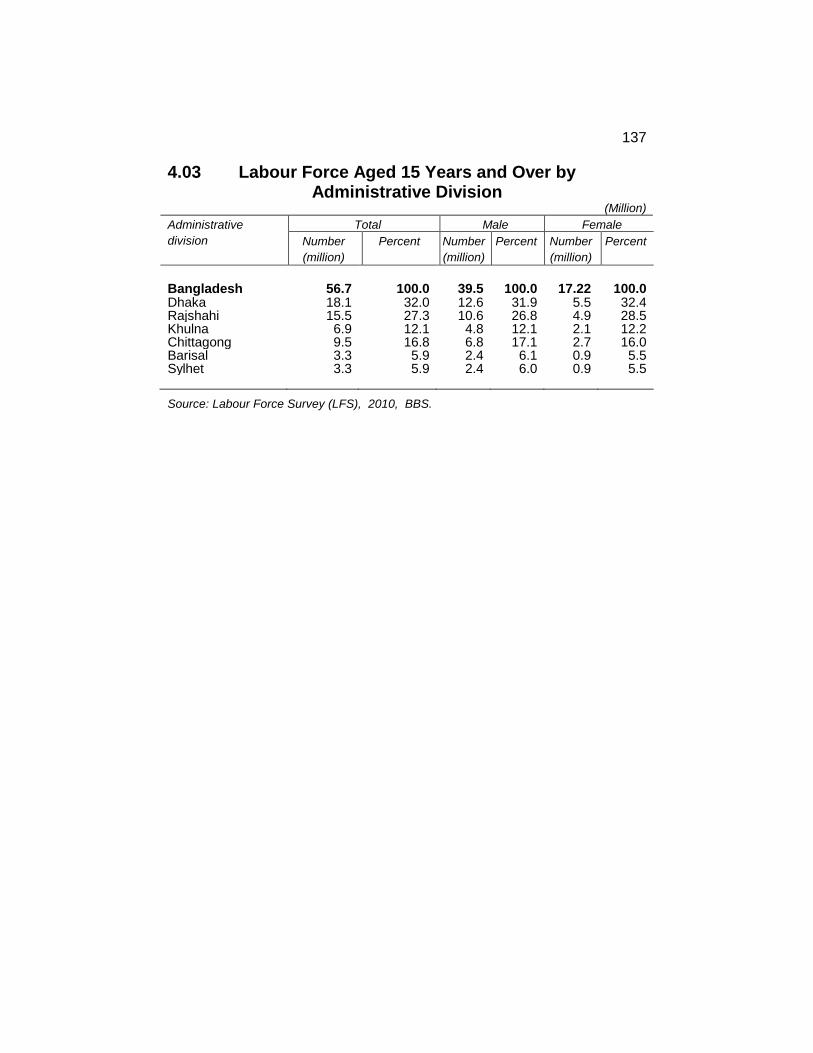
137
4.03 Labour Force Aged 15 Years and Over by Administrative Division
(Million)
Administrative
division
Total Male Female
Number
(million)
Percent Number
(million)
Percent Number
(million)
Percent
Bangladesh 56.7 100.0 39.5 100.0 17.22 100.0 Dhaka 18.1 32.0 12.6 31.9 5.5 32.4 Rajshahi 15.5 27.3 10.6 26.8 4.9 28.5 Khulna 6.9 12.1 4.8 12.1 2.1 12.2 Chittagong 9.5 16.8 6.8 17.1 2.7 16.0 Barisal 3.3 5.9 2.4 6.1 0.9 5.5 Sylhet 3.3 5.9 2.4 6.0 0.9 5.5
Source: Labour Force Survey (LFS), 2010, BBS.

4.04 Labour Force Aged 15 Years and Over by Level of Education (000)
Level of Education Total Rural Urban Total Male Female Total Male Female Total Male Female
Number
Total 56651 39477 17174 43373 30201 13172 13279 9276 4003 No education 22719 15738 6981 19124 13317 5807 3595 2421 1174 Class I-v 12943 9050 3893. 9941 7006 2935 3003 2045 958 Class vi-viii 8074 5442 2632 5896 3915 1981 2178 1527 651 Classix-x 5090 3278 1812 3813 2430 1383 1276 848 428 SSC/equivalent 3522 2569 953 2391 1755 636 1131 813 318 HSC/equivalent 2096 1575 521 1216 936 280 880 639 241 Bachelor degree/equivalent 1177 976 201 565 474 91 612 502 110 Master Degree/equivalent 819 677 142 345 301 44 474 376 98 Medical/engineering degree 106 87 19 20 17 3 86 70 16 Technical/vocational education
82 70 12 44 36 8 37 33 4
Others 23 16 7 17 14 3 6 2 4 Percent
Total 100.0% 100.0% 100.0% 100.0% 100.0% 100.0% 100.0% 100.0% 100.0% No education 40.1 39.9 40.6 44.1 44.1 44.1 27.1 26.1 29.3 Class I-v 22.8 22.9 22.7 22.9 23.2 22.3 22.6 22.0 23.9 Class vi-viii 14.3 13.8 15.3 13.6 13.0 15.0 16.4 16.5 16.3 Classix-x 9.0 8.3 10.5 8.8 8.0 10.5 9.6 9.1 10.7 SSC/equivalent 6.2 6.5 5.6 5.5 5.8 4.8 8.5 8.8 7.9 HSC/equivalent 3.7 4.0 3.0 2.8 3.1 2.1 6.6 6.9 6.0 Bachelor degree/equivalent 2.1 2.5 1.2 1.3 1.6 0.7 4.6 5.4 2.8 Master Degree/equivalent 1.4 1.7 0.8 0.8 1.0 0.3 3.6 4.1 2.4 Medical/engineering degree 0.2 0.2 0.1 0.0 0.1 0.0 0.6 0.8 0.4 Technical/vocational education
0.1 0.2 0.1 0.1 0.1 0.1 0.3 0.4 0.1
Others 0.0 0.0 0.0 0.0 0.0 0.0 0.0 0.0 0.1 Source: Labour force survey, 2010, BBS. 138

4.05 Labour Force Participation Rate by Age Group and Sex Age group Population aged 15+(000) Labour force (000) Participation (%)
Rate Total Male Female Total Male Female Total Male Female
Total 95584 47847 47737 56651 39477 17174 59.27 82.51 35.98
15-19 14463 7575 6888 5694 3669 2025 39.37 48.44 29.40
20-24 13186 5929 7257 7476 4502 2974 56.70 75.93 40.98
25-29 11604 5353 6251 7730 4935 2795 66.61 92.19 44.71
30-34 11218 5352 5866 7942 5207 2735 70.80 97.29 46.62
35-39 9328 4629 4699 6792 4552 2240 72.81 98.34 47.67
40-44 9052 4645 4407 6592 4554 2038 72.82 98.05 46.24
45-49 6869 3683 3186 5102 3586 1516 74.28 97.37 47.58
50-54 6126 3347 2779 3435 3150 285 56.07 94.11 10.25
55-59 4402 2318 2084 2285 2052 233 51.91 88.52 11.18
60-64 3473 1890 1583 1564 1459 105 45.03 77.20 6.63
65+ 5864 3126 2738 2039 1811 228 34.77 57.93 8.32
Source: Labour force survey, 2010, BBS.
139

4.06 Employed Persons Aged 15 Years and Over by Major Occupation Major Occupation Bangladesh Urban Rural
Total Male Female Total Male Female Total Male Female Number (000)
Total 54084 37882 16202 10421 8752 3669 41663 29130 12533 Professional, Technical 2406 1892 515 921 709 212 1486 1183 303 Administrative, Managerial 689 593 96 312 286 26 377 307 70 Clerical Worker 1001 906 104 427 378 49 582 528 54 Services Worker 3001 1688 1313 759 374 385 2242 1315 927 Sales Worker 8158 6869 1290 2139 1978 161 6020 4891 1129 Agri, Forestry, Fisheries 25698 15192 10506 2976 1183 1793 22722 14009 8713 Production, transport Labourer
12388 10116 2272 4491 3518 972 7897 6598 1299
Others 1082 965 117 457 385 72 625 581 44 Percent
Total 100.0 100.0 100.0 100.0 100.0 100.0 100.0 100.0 100.0 Professional, Technical 4.4 4.9 3.2 7.4 8.1 5.8 3.4 4.1 2.4 Administrative, Managerial 1.3 1.6 0.6 2.5 3.3 0.7 0.9 1.1 0.6 Clerical Worker 1.9 2.4 0.6 3.4 4.3 1.3 1.4 1.8 0.4 Services Worker 5.5 4.5 8.1 6.1 4.3 10.5 5.4 4.5 7.4 Sales Worker 15.0 18.1 8.0 17.2 22.6 4.4 14.4 16.8 9.0 Agri, Forestry, Fisheries 47.4 40.1 64.8 24.0 13.5 48.9 54.5 48.1 69.5 Production, transport Labourer
22.8 26.7 14.0 36.2 40.2 26.5 19.0 22.7 10.4
Others 2.0 2.5 0.7 3.7 4.4 2.0 1.5 2.0 0.4 N.B: Component may be higher than total as one employed person may be employed in more than one occupation. This is also true for employment industry and status in employment. Source: Labour force survey, 2010, BBS.
140

4.07 Growth Rate of Major Occupation between, 2005-06 & 2010 Major Occupation LFS 2005-06 LFS 2010 Growth rate
Total Male Female Total Male Female Total Male Female Number (000)
Total 47357 36080 11277 54084 37882 16202 3.32 1.22 9.06 Professional, Technical 2231 1737 494 2406 1892 515 1.88 2.14 1.05 Administrative, Managerial 223 201 22 689 593 96 28.20 27.04 36.83 Clerical Worker 1015 872 144 1001 906 104 -0.34 0.95 -8.13 Services Worker 2757 1892 865 3001 1688 1313 2.12 -2.85 10.43 Sales Worker 6710 6476 235 8158 6869 1290 4.89 1.47 42.57 Agri, Forestry, Fisheries 22926 15221 7705 25698 15192 10506 2.85 -0.05 7.75 Production, transport Labourer & Others
11493 9681 1812 13470 11081 2389 3.97 3.38 6.91
Source: Labour force survey, 2010, BBS.
4.08 Average Weekly Working Works by Occupation of Employed Persons Aged 15 Years and Above (Hours) Occupation Total Urban Rural
Total Male Female Total Male Female Total Male Female Total 46 51 35 49 53 38 45 50 34 Professional, Technical 49 49 47 49 49 47 49 49 47 Administrative, Managerial 49 50 45 51 51 47 47 48 45 Clerical Worker 50 51 45 50 50 44 50 51 45 Services Worker 46 52 37 48 54 42 45 52 36 Sales Worker 51 52 46 55 55 47 50 51 46 Agriculture, Forestry, Fisheries 42 49 31 37 49 29 42 49 32 Production and transport Labourer 51 53 41 54 55 50 49 52 35 Others 52 52 49 53 53 49 51 52 50 Source: Labour force survey, 2010, BBS
141

4.09 Annual Average Growth Rate of Employed Persons by Sex and by Industry between, 2005-06 & 2010
(000) Industry 2005-06 2010 Average growth rate
Total Male Female Total Male Female Total Male Female Total 47357 36080 11277 54084 37882 16202 3.32 1.22 9.06 Agriculture, hunting and forestry 21672 14168 7504 25727 15221 10506 4.29 1.79 8.41 Mining an d Quarrying 51 44 7 109 92 17 18.98 18.44 22.18 Manufacture 5224 3926 1298 6731 4824 1907 6.34 5.15 9.62 Electricity, gas and water supply 76 73 3 123 114 9 12.04 11.14 27.46 Construction 1524 1421 104 2617 2391 227 13.52 13.01 19.51 Wholesale & ratail frade; repair of motor vehicles, motor
7108 6705 403 7557 6530 1027 1.53 -0.66 23.39
Hotels and restaurants 712 661 51 832 776 56 3.89 4.01 2.34 Transport, storage and communications 3976 3910 66 4037 3790 247 3.81 -0.78 32.99 Financial Intermediation 507 392 115 364 313 51 -8.28 -5.63 -20.32 Real estate, renting and business activities
239 227 11 636 569 67 24.47 22.97 45.17
Public administration and defence 882 778 104 539 503 36 -12.31 -10.90 -26.52 Education 1306 964 343 1287 961 326 -0.37 -0.08 -1.27 Health and social work 362 241 122 497 325 172 7.92 7.48 8.58 Other community, social and Personal service activities
2622 1654 968 3374 1812 1562 6.30 2.28 11.96
N.B Components may not add total employed as one employed person may be engaged in more than one industry. Source: Labour force survey, 2010, BBS.
142

4.10 Employed Persons Aged 15 Years and Over by Average Weekly Hours Worked and Industries Industry Total Urban Rural
Total Male Female Total Male Female Total Male Female Total 46 51 35 49 53 38 45 50 34 Agriculture forestry and fishing 42 49 31 37 49 29 42 49 32 Mining an d Quarrying 45 48 31 50 50 38 44 47 31 Manufacture 50 51 48 53 54 53 48 50 44 Electricity, gas, steam and air Conditioning supply 49 49 45 48 49 44 50 50 48 Water supply; sewerage, waste Management and remediation act
50 51 38 52 54 45 47 50 24
Construction 52 52 50 53 53 52 51 51 50 Wholesale and retail trade: repair of motor vehicles and mot
52 53 46 55 56 48 51 52 46
Transportation and storage 54 55 43 56 57 43 53 54 43 Accommodation and food service Activities 55 56 44 58 58 56 54 55 40 Information and communication 50 50 54 53 53 54 49 48 54 Financial and insurance activities 48 48 46 48 48 47 49 49 46 Real estate activities 48 50 16 52 52 - 37 41 16 Professional, scientific and technical activities 53 53 50 51 52 38 55 55 54 Administrative and support service activities 48 49 46 48 48 45 48 49 47 Public administration and defense Compulsory social security
49 49 46 49 49 43 50 50 50
Education 47 48 47 48 48 47 47 47 47 Human Health and social work Activities 51 52 50 50 51 48 52 53 51 Arts, entertainment and recreation 49 49 44 42 47 19 51 50 57 Other service Activities 45 53 26 50 54 38 42 52 22 Activities of households as employers: Undifferentiated good
35 53 32 41 53 38 31 53 28
Activities of extraterritorial Organizations and bodies 50 50 - 50 50 - 48 48 - Source: Labour force survey, 2010, BBS.
143

4.11 Average Weekly Hours Worked of Employed Persons Aged 15 Years and Over by Status in Employment (Hours) Status in Employment Total Urban Rural
Total Male Female Total Male Female Total Male Female Total 46 51 35 49 53 38 45 50 34
Regular Paid Employee 52 52 52 53 53 53 51 52 50
Employer 55 55 54 56 56 51 55 55 55
Self Employed (agri) 50 51 49 48 49 48 50 51 49
Self Employed (non-agri) 52 53 47 55 55 49 51 52 47
Unpaid Family Worker 24 29 23 26 33 24 24 28 23
Irregular Paid Worker 55 56 53 56 57 54 54 55 52
Day Labourer (agri) 54 54 54 54 54 54 54 54 54
Day Labourer (non-agri) 54 54 51 55 56 50 53 53 52
Servant 57 60 56 57 65 56 56 58 56
Source: Labour force survey, 2010, BBS.
144
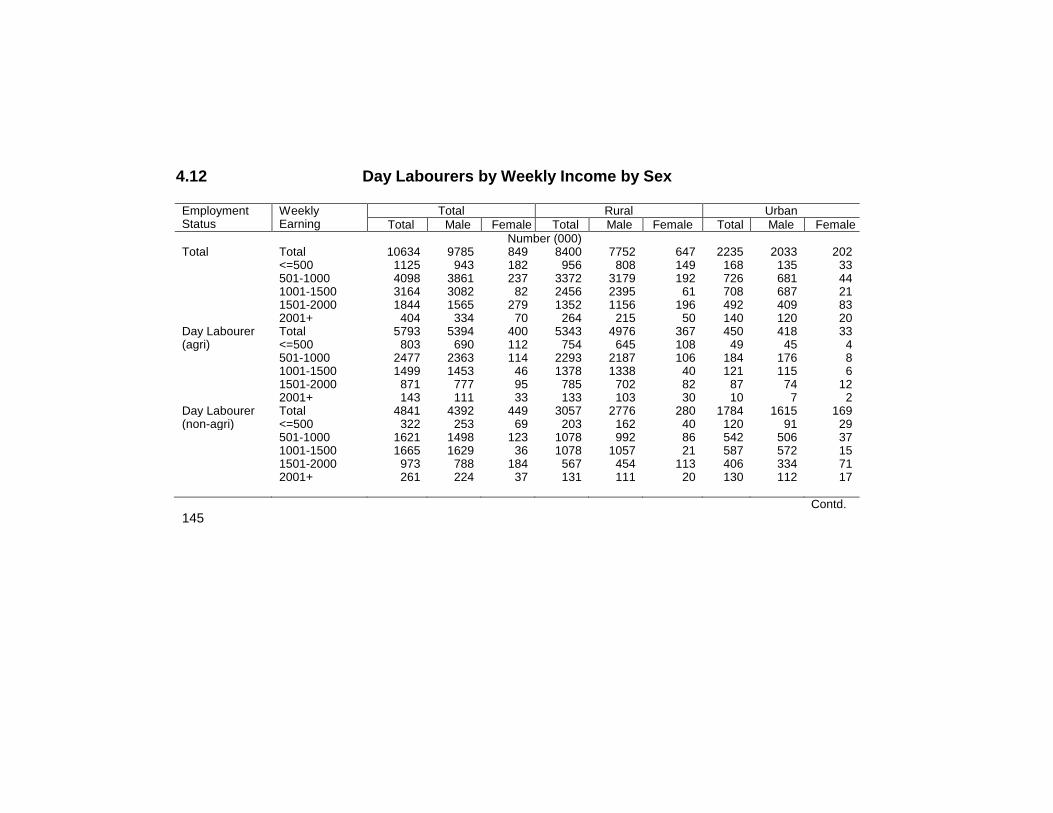
4.12 Day Labourers by Weekly Income by Sex Employment Status
Weekly Earning
Total Rural Urban Total Male Female Total Male Female Total Male Female
Number (000) Total Total 10634 9785 849 8400 7752 647 2235 2033 202 <=500 1125 943 182 956 808 149 168 135 33 501-1000 4098 3861 237 3372 3179 192 726 681 44 1001-1500 3164 3082 82 2456 2395 61 708 687 21 1501-2000 1844 1565 279 1352 1156 196 492 409 83 2001+ 404 334 70 264 215 50 140 120 20 Day Labourer Total 5793 5394 400 5343 4976 367 450 418 33 (agri) <=500 803 690 112 754 645 108 49 45 4 501-1000 2477 2363 114 2293 2187 106 184 176 8 1001-1500 1499 1453 46 1378 1338 40 121 115 6 1501-2000 871 777 95 785 702 82 87 74 12 2001+ 143 111 33 133 103 30 10 7 2 Day Labourer Total 4841 4392 449 3057 2776 280 1784 1615 169 (non-agri) <=500 322 253 69 203 162 40 120 91 29 501-1000 1621 1498 123 1078 992 86 542 506 37 1001-1500 1665 1629 36 1078 1057 21 587 572 15 1501-2000 973 788 184 567 454 113 406 334 71 2001+ 261 224 37 131 111 20 130 112 17 Contd. 145

4.12 Day Labourers by Weekly Income by Sex Employment Status
Weekly Earning
Total Rural Urban Total Male Female Total Male Female Total Male Female
Percent (000) Total Total 100.0 100.0 100.0 100.0 100.0 100.0 100.0 100.0 100.0 <=500 10.6 9.6 21.4 11.4 10.4 23.0 7.5 6.7 16.3 501-1000 38.5 39.5 27.9 40.1 41.0 29.7 32.5 33.5 22.0 1001-1500 29.8 31.5 9.6 29.2 30.9 9.4 31.7 33.8 10.5 1501-2000 17.3 16.0 32.9 16.1 14.9 30.2 22.0 20.1 41.4 2001+ 3.8 3.4 8.2 3.1 2.8 7.7 6.3 5.9 9.8 Day Labourer Total 100.0 100.0 100.0 100.0 100.0 100.0 100.0 100.0 100.0 (agri) <=500 13.9 12.8 28.1 14.1 13.0 29.5 10.8 10.7 11.9 501-1000 42.8 43.8 28.5 42.9 44.0 28.9 40.8 42.1 24.3 1001-1500 25.9 26.9 11.5 25.8 26.9 10.9 27.0 27.6 18.6 1501-2000 15.0 14.4 23.7 14.7 14.1 22.5 19.3 17.8 37.7 2001+ 2.5 2.1 8.1 2.5 2.1 8.2 2.2 1.8 7.4 Day Labourer Total 100.0 100.0 100.0 100.0 100.0 100.0 100.0 100.0 100.0 (non-agri) <=500 6.7 5.8 15.4 6.6 5.8 14.4 6.7 5.6 17.2 501-1000 33.5 34.1 27.4 35.3 35.7 30.9 30.4 31.3 21.6 1001-1500 34.4 37.1 7.9 35.3 38.1 7.3 32.9 35.4 8.9 1501-2000 20.1 18.0 41.0 18.6 16.3 40.4 22.7 20.7 42.1 2001+ 5.4 5.1 8.3 4.3 4.0 7.0 7.3 7.0 10.3 Source: Labour force survey, 2010, BBS.
146

4.13 Salaried Workers by Monthly Income by Sex Monthly Earnings in Group
Total Rural Urban Total Male Female Total Male Female Total Male Female
Number (000) Total 7872 6434 1437 4115 3558 557 3756 2876 880 <1500 46 33 13 35 24 12 11 9 2 1500-1999 123 70 53 68 43 25 55 27 28 2000-2499 330 201 129 131 105 25 199 96 103 2500-2999 300 205 95 155 127 28 145 78 67 3000-3999 563 419 144 261 221 40 302 198 104 4000-4999 910 752 157 467 410 57 443 342 100 5000-5999 409 362 47 252 230 22 157 132 26 6000-6999 776 679 97 405 361 44 371 318 53 7000-7999 362 272 90 190 158 32 172 114 59 8000-8999 931 784 147 464 395 68 467 388 79 9000-9999 555 433 122 380 309 71 175 124 51 10000-12499 1657 1412 245 1002 894 108 655 518 137 12500-14999 214 190 24 101 91 10 113 99 15 15000-17499 197 178 19 73 70 3 124 109 16 17500-19999 69 61 8 20 17 3 49 44 5 20000-24999 207 184 23 59 54 5 148 130 18 25000-29999 47 42 5 13 12 0 35 30 5 30000-34999 63 56 7 15 14 1 48 42 6 35000+ 113 102 11 26 22 3 87 80 8 Contd. 147

4.13 Salaried Workers by Monthly Income (Percent)
Monthly Earnings in Group
Total Rural Urban Total Male Female Total Male Female Total Male Female
Percent (000) Total 100.0 100.0 100.0 100.0 100.0 100.0 100.0 100.0 100.0 <1500 0.6 0.5 0.9 0.9 .7 2.1 0.3 0.3 0.2 1500-1999 1.6 1.1 3.7 1.6 1.2 4.5 1.5 0.9 3.2 2000-2499 4.2 3.1 9.0 3.2 3.0 4.5 5.3 3.3 11.8 2500-2999 3.8 3.2 6.6 3.8 3.6 5.1 3.8 2.7 7.6 3000-3999 7.2 6.5 10.0 6.3 6.2 7.2 8.0 6.9 11.9 4000-4999 11.6 11.7 10.9 11.4 11.5 10.2 11.8 11.9 11.4 5000-5999 5.2 5.6 3.3 6.1 6.5 3.9 4.2 4.6 2.9 6000-6999 9.9 10.5 6.8 9.8 10.1 7.9 9.9 11.1 6.0 7000-7999 4.6 4.2 6.3 4.6 4.4 5.7 4.6 4.0 6.7 8000-8999 11.8 12.2 10.2 11.3 11.1 12.3 12.4 13.5 8.9 9000-9999 7.0 6.7 8.5 9.2 8.7 12.7 4.6 4.3 5.8 10000-12499 21.0 21.9 17.0 24.3 25.1 19.3 17.4 18.0 15.6 12500-14999 2.7 3.0 1.7 2.5 2.6 1.8 3.0 3.4 1.7 15000-17499 2.5 2.8 1.3 1.8 2.0 0.6 3.3 3.8 1.8 17500-19999 0.9 1.0 0.5 0.5 0.5 0.5 1.3 1.5 0.6 20000-24999 2.6 2.9 1.6 1.4 1.5 0.9 3.9 4.5 2.0 25000-29999 0.6 0.7 0.4 0.3 0.3 0.1 0.9 1.0 0.5 30000-34999 0.8 0.9 0.5 0.4 0.4 0.1 1.3 1.5 0.7 35000+ 1.4 1.6 0.8 0.6 0.6 0.6 2.3 2.8 0.9 Source: Labour force survey, 2010, BBS.
148

4.14 Unemployment Rate of Population Aged 15 Years and Over by Sex and Residence Residence Total Male Female
No. of Unemployed
Population(000)
Unemploy- Ment rate (%)
No. of Unemployed Population(000)
Unemploy- Ment rate (%)
No. of Unemployed
Population(000)
Unemploy- Ment rate
(%) 2010 Bangladesh 2568 4.5 1595 4.1 973 5.7 Urban 858 6.5 524 5.7 334 8.3 Rural 1710 4.0 1011 3.6 639 4.9 2005-06 Bangladesh 2104 4.3 1250 3.4 854 7.0 Urban 505 4.3 315 3.6 190 6.7 Rural 1599 4.2 935 3.3 664 7.2 Source: Labour force survey, 2010, BBS.
4.15 Youth Labour Force Aged 15-29 Years by Broad Economic Category Economic Category Bangladesh Urban Rural
Total Male Female Total Male Female Total Male Female Number (000) Total Youth Population 39253 18857 20396 10075 4610 5465 29178 14247 14931 Total Labour Force 20900 13105 7796 5055 3070 1985 15845 10034 5811 Employed 19342 12210 7133 4556 2806 1750 14786 9403 5383 Unemployed 1558 895 663 499 264 235 1059 631 428 Not in Labour Force 18353 5752 12600 5020 1540 3480 13333 4212 9120 Household work 9651 54 9596 2333 33 2300 7318 21 7297 Student 6181 3531 2650 2095 1104 992 4086 2428 1659 Others 735 149 586 290 79 211 445 70 374 Source: Labour force survey, 2010, BBS.
149

4.16 Youth Labour Force Aged 15-29 Years by Broad Economic Category Economic Category Bangladesh Urban Rural
Total Male Female Total Male Female Total Male Female Percent (000) Total Labour Force 53.24 69.50 38.22 50.17 66.59 36.32 54.30 70.43 38.02 Employed 92.54 93.17 91.50 90.12 91.40 88.16 93.32 93.71 92.63 Unemployed 7.46 6.83 8.50 9.88 8.60 11.84 6.68 6.29 7.37 Not in Labour Force 46.76 30.50 61.78 49.83 33.41 63.60 45.70 29.57 61.08 Household work 58.25 1.46 74.78 49.45 2.74 65.66 61.76 0.84 78.21 Student 37.31 94.55 20.65 44.40 90.78 28.31 34.49 96.36 17.78 Others 4.44 3.99 4.56 6.15 6.48 6.04 3.75 2.80 4.01 Source: Labour force survey, 2010, BBS.
4.17 Youth Labour Force Aged 15-29 Years by Division (000)
Division Bangladesh Urban Rural Total Male Female Total Male Female Total Male Female
Number (000) Bangladesh 20900 13105 7796 5055 3070 1985 15845 10034 5811 Chittagong 3854 2523 1331 1092 699 392 2763 1824 939 Dhaka 6741 4112 2628 2525 1486 1039 4215 2626 1589 Khulna 2332 1449 883 422 257 165 1910 1192 718 Rajshahi 5541 3452 2089 734 444 290 4807 3008 1799 Barishal 1144 725 419 137 85 52 1007 639 367 Sylhet 1289 843 446 146 99 47 1143 744 399 Percent Bangladesh 100.00 100.0 100.0 100.0 100.0 100.0 100.0 100.0 100.0 Chittagong 18.44 19.25 17.07 21.60 22.77 19.75 17.44 18.18 16.16 Dhaka 32.25 31.38 33.71 49.95 48.40 52.34 26.61 26.17 27.34 Khulna 11.16 11.06 11.33 8.34 8.37 8.31 12.05 11.88 12.36 Rajshahi 26.51 26.34 26.80 14.52 14.46 14.61 30.33 29.98 30.96 Barishal 5.47 5.53 5.37 2.71 2.77 2.62 6.36 6.37 6.32 Sylhet 6.17 6.43 5.72 2.89 3.22 2.37 7.21 7.41 6.87 Source: Labour force survey, 2010, BBS. 150

4.18 Employed Youths Aged 15-29 Years by Major Occupation Major Occupation Bangladesh Urban Rural
Total Male Female Total Male Female Total Male Female Number (000)
Total 19343 12210 7133 4556 2806 1750 14786 9403 5383 Professional, Technical 539 376 164 214 137 77 325 239 86 Administrative, Managerial 213 201 12 62 58 4 151 143 8 Clerical Worker 224 198 26 88 73 15 136 125 11 Services Worker 669 396 273 225 119 106 444 277 167 Sales Worker 1872 1740 132 623 586 36 1249 1154 95 Agri, Forestry. Fisheries 9984 494 5070 1201 368 833 878 4546 4237 Production, Transport Labourer 5601 4180 1422 2026 1372 654 357 2808 768 Others 289 255 - 126 102 24 163 153 10 Percent (000)
Total 100.0 100.0 100.0 100.0 100.0 100.0 100.0 100.0 100.0 Professional, Technical 2.8 3.1 2.3 4.7 4.9 4.4 2.2 2.5 1.6 Administrative, Managerial 1.1 1.6 0.2 1.3 2.0 0.2 1.1 1.5 0.1 Clerical Worker 1.2 1.6 0.4 1.9 2.6 0.9 0.9 1.3 0.2 Services Worker 3.5 3.2 3.8 4.9 4.2 6.0 3.0 2.9 3.1 Sales Worker 9.7 14.1 1.8 13.6 20.8 2.1 8.4 12.2 1.8 Agri, Forestry. Fisheries 51.5 40.1 71.1 24.3 13.1 46.7 59.2 48.1 78.7 Production, Transport Labourer 28.9 34.1 19.9 44.4 48.7 37.4 24.1 29.7 14.3 Others 1.5 2.1 0.5 2.8 3.6 1.4 1.1 1.6 0.2 Source: Labour force survey, 2010, BBS.
151

4.19 Employed Youths Aged 15-29 Years by Status in Employment (000)
Status in employment Bangladesh Rural Urban Total Male Female Total Male Female Total Male Female
Number (000) Total 19343 12210 7133 14786 9403 5383 4556 2806 1750 Regular Paid Employee 3287 2472 815 1766 1471 295 1522 1001 520 Employer 19 16 3 16 13 3 4 3 1 Self Employed (agri) 978 899 79 905 835 70 73 64 9 Self Employed (non-agri) 2601 2328 272 1956 1803 153 645 525 120 Unpaid Family Worker 7684 2246 5438 6515 1972 4543 1169 274 894 Irregular Paid Worker 664 503 161 359 295 64 305 208 97 Day Labourer(agri) 2473 2327 146 2292 2157 135 181 170 11 Day Labourer(non-agri) 1600 1442 158 974 882 92 626 560 66 Servant 87 27 60 46 18 28 41 9 32 Percent Total 100.0 100.0 100.0 100.0 100.0 100.0 100.0 100.0 100.0 Regular Paid Employee 17.0 20.2 11.4 11.9 15.6 5.5 33.3 35.6 29.7 Employer 0.1 0.1 0.0 0.1 0.1 0.1 0.1 0.1 0.0 Self Employed (agri) 5.0 7.3 1.1 6.1 8.8 1.3 1.6 2.3 .5 Self Employed (non-agri) 13.4 19.0 3.8 13.2 19.1 2.8 14.1 18.7 6.8 Unpaid Family Worker 39.6 18.3 76.2 43.9 20.9 84.4 25.6 9.7 51.1 Irregular Paid Worker 3.4 4.1 2.3 2.4 3.1 1.2 6.7 7.4 5.5 Day Labourer(agri) 12.8 19.0 2.1 15.5 22.8 2.5 4.0 6.0 .6 Day Labourer(non-agri) 8.2 11.8 2.2 6.6 9.3 1.7 13.7 19.9 3.8 Source: Labour force survey-2010
152

4.20 Comparative Manpower Statements of the Ministries/Divisions, Departments/Directorates, Divisional Deputy Commissioner’s Offices and Autonomous Bodies/Corporations, 2008-2013
Year Ministries/Division Departments/Directorates Divisonal/Deputy Commissioner’s Offices
Sanction Exist Vacant Sanction Exist Vacant Sanction Exist Vacant
2008 10515 8600 1915 906599 773352 133247 36549 28061 8488 2009 10655 8711 1944 927148 788819 138329 37838 28586 9252
2010 10921 8568 2353 95439 809050 144389 38758 28648 10110
2011 12580 9438 3142 986186 844735 141451 38842 28413 10429
2012 13038 9452 3586 1004023 851277 152746 45190 33581 11609
2013 13486 10181 3305 106224 901143 161081 44368 33501 10867
Year Autonomous Bodies/Corporations Total
Sanction Exist Vacant Sanction Exist Vacant
2008 297198 232965 64233 1250861 1042978 207883 2009 289123 221889 67234 1264764 1048005 216759
2010 318631 231816 86815 1321749 1078082 243667
2011 322519 233336 99183 1370127 1115922 254205
2012 343273 235250 108023 1405524 1129560 275964
2013 350958 249624 101334 1471036 119449 276587
Source: Ministry of Public Administration.
153

154
4.21 Class wise Number of Female Officers & Staff, 2013
Class Ministry/ Division
(Secretariat)
Departments/ Directorates
Autonomous Bodies
/Corporations
Total
1 2 3 4 5 Class I 553 11549 7904 20006
Class II 333 39390 4262 43985
Class III 361 169948 6578 176887
Class IV 376 43529 4021 47926
Grand Total: 1623 264416 22765 288804
Source: Ministry of Public Administration. 4.22 Class wise Manpower of Civil Officers and Staff, 2013
Year Ministries/Divisions Departments/Directorates Divisonal/Deputy Commissioner’s Offices
Appr oved
Actual Vacant Appr oved
Actual Vacant Appr oved
Actual Vacant
Class I 3477 2897 580 86664 63298 23366 2585 1640 945
Class II 2781 2017 764 91214 67566 23648 802 367 435
Class III 3901 2555 1346 686974
608226
75748 20022 14732 5290
Class IV 3327 2712 615 200372
162053
38319 20959 16762 4197
Total: 13486 10181 3305 1062224
901143
161081
44368 33501 10867
Year Autonomous Bodies/Corporations Total
Approved Actual Vacant Approved Actual Vacant
Class I 80727 61076 19651 173453 128911 44542
Class II 53346 36867 16479 148143 106817 41326
Class III 123144 84090 39054 831041 709603 121438
Class IV 93741 67591 26150 318399 249118 69281
Total: 350958 249624 101334 1471036 1194449 276587
Source: Ministry of Public Administration. (according to information collected in the year, 2013)

4.23 Overseas Employment in 2014
Month
Name of the Country KSA UAE Kuwait Oman Qatar Bahrain Lebanon Jordan Libya Sudan Malaysia Singa
pore January 694 1716 - 10582 5732 1758 1171 1174 245 8 934 4239
February 287 1681 4 8004 6374 1334 985 1850 409 3 699 3441
March 476 1813 154 8551 5825 1596 1367 2012 809 1 267 4912
April 986 2059 294 8661 6629 1797 1341 1995 780 - 385 4691
May 2837 1967 108 8695 6839 1407 1282 171 1351 - 585 4209
Jun 1385 2300 121 9791 7359 2519 1074 1764 596 6 299 4878
July 56 2163 637 8328 8094 1862 1118 2231 243 - 34 4405
August 931 1535 388 8164 7300 2089 1296 1485 - 2 185 4929
September 1123 2175 122 9308 8727 3117 1534 1478 - - 373 4707
October 409 1887 227 7774 6986 1999 1714 1433 - - 300 4449
November 801 2293 439 8597 9246 2059 1676 1425 1 - 616 4653
December 672 2643 600 9293 9464 1839 2092 1720 27 66 457 5237
Total 10657 24232 3094 105748 87575 23378 16640 20338 4451 86 5134 54750
% 2.50 5.69 0.73 24.84 20.57 5.48 3.91 4.78 1.05 0.02 1.21 12.86
Contd.
155
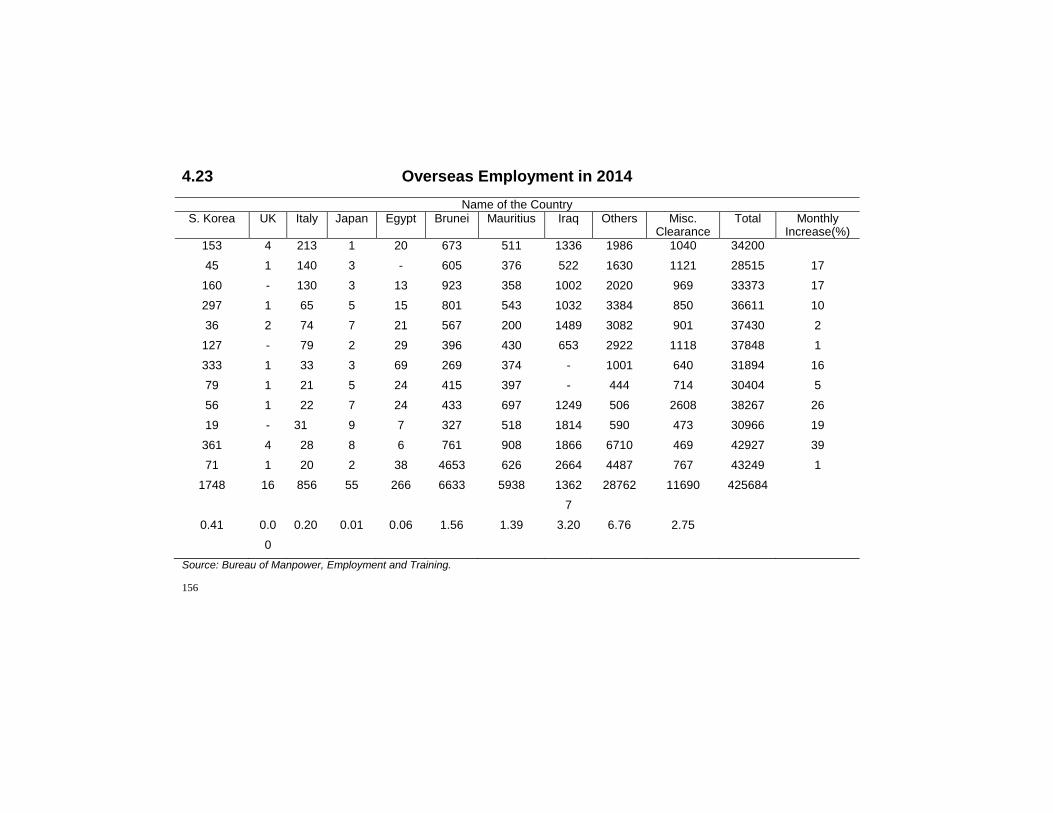
4.23 Overseas Employment in 2014
Name of the Country S. Korea UK Italy Japan Egypt Brunei Mauritius Iraq Others Misc.
Clearance Total Monthly
Increase(%) 153 4 213 1 20 673 511 1336 1986 1040 34200
45 1 140 3 - 605 376 522 1630 1121 28515 17
160 - 130 3 13 923 358 1002 2020 969 33373 17
297 1 65 5 15 801 543 1032 3384 850 36611 10
36 2 74 7 21 567 200 1489 3082 901 37430 2
127 - 79 2 29 396 430 653 2922 1118 37848 1
333 1 33 3 69 269 374 - 1001 640 31894 16
79 1 21 5 24 415 397 - 444 714 30404 5
56 1 22 7 24 433 697 1249 506 2608 38267 26
19 - 31 9 7 327 518 1814 590 473 30966 19
361 4 28 8 6 761 908 1866 6710 469 42927 39
71 1 20 2 38 4653 626 2664 4487 767 43249 1
1748 16 856 55 266 6633 5938 1362
7
28762 11690 425684
0.41 0.0
0
0.20 0.01 0.06 1.56 1.39 3.20 6.76 2.75
Source: Bureau of Manpower, Employment and Training.
156

157
4.24 Category-Wise Overseas Employment 1992 to 2014
Year Professional
Worker’s Category Total Skilled Semi-
Skilled Less-
Skilled Other
1992 11375 50689 30977 95083 - 188124
1993 11112 71662 66168 95566 - 244508
1994 8390 61040 46519 70377 - 186326
1995 6352 59907 32055 89229 - 187543
1996 3188 64301 34689 109536 - 211714
1997 3797 65211 43558 118511 - 231077
1998 9574 74718 51590 131785 - 267667
1999 8045 98449 44947 116741 - 268182
2000 10669 99606 26461 85950 - 222686
2001 5940 42742 30702 109581 - 188965
2002 14450 56265 36025 118516 - 225256
2003 15862 74530 29236 134562 - 254190
2004 12202 10177 28327 122252 8582 272958
2005 1945 13655 24546 112556 12240 252702
2006 925 115468 33965 231158 10722 381516
2007 676 165338 183673 482922 10222 832609
2008 1864 292364 132825 448002 10914 875055
2009 1426 134265 84517 255070 8485 475278
2010 387 90621 20016 279678 7560 390702
2011 1192 229149 28729 308992 7440 568062
2012 812 209368 20498 377120 9509 607798
2013 689 133754 62528 203058 409253 9224
2014 1730 148766 70095 193403 425685 11690 Source: Bureau of Manpower, Employment and Training.

158
4.25 Growth of RMG in Bangladesh 1988-89 to 2013-14
Year Number of Garment Factories
Employment In Million Workers
Export Of RMG In
Million US$
Total Export Of
Bangladesh In MN US$
% OF RMG’s To National Export
1988-89 725 0.317 471.09 1291.56 36.47 1989-90 759 0.335 624.16 1923.70 40.96 1990-91 834 0.402 866.82 1717.55 50.47 1991-92 1163 0.582 1182.57 1993.90 59.31 1992-93 1537 0.804 1445.03 2382.89 60.64 1993-94 1839 0.827 1555.78 2533.90 61.40 1994-95 2182 1.200 2228.35 3472.56 64.17 1995-96 2353 1.290 2547.13 3882.42 65.61 1996-97 2503 1.300 3001.24 4418.28 67.93 1997-98 2726 1.500 3783.63 5161.20 73.31 1998-99 2963 1.500 4020.23 5312.86 75.67 1999-00 3200 1.600 4352.39 5752.20 75.66 2000-01 3480 1.800 4860.12 6467.30 75.15 2001-02 3618 1.800 4583.80 5986.09 76.57 2002-03 3760 2.000 4912.10 6548.44 75.01 2003-04 3957 2.000 5686.09 7602.99 74.79 2004-05 4107 2.100 6417.67 8654.52 74.15 2005-06 4220 2.200 7900.80 10526.16 75.06 2006-07 4490 2.400 9211.23 12177.86 75.64 2007-08 4743 2.800 10699.80 14110.80 75.83 2008-09 4925 3.500 12347.77 15565.19 79.33 2009-10 5063 3.600 12496.72 16204.65 77.12 2010-11 5150 3.600 17914.46 22924.38 78.15 2011-12 5400 4.00 19089.69 24287.66 78.60 2012-13 5600 4.00 21515.73 27027.36 79.61 2013-14 4536 4.00 24491.88 30186.62 81.13 Source: BGMEA, Export Promotion Bureau, Bangladesh Bank, Compile by BGMEA.

159
Chapter V
AGRICULTURE (Crops, Livestock, Forestry and
Fisheries)

160

161
5.01 Key Findings of Different Agriculture Censuses (*rural area only)
Item 1983-84 1996 2008
1. Number of Holdings: Total 13817646 17828187 25351506 Non-farm 3772347 6029945 10480930 Farm 10045299 11798242 14870576
2. Percent of holdings(%) Total farm holdings 72.70 66.18 58.66 Small farm (0.05-2.49 acres) 70.34 79.87 84.27
Medium farm (2.50-7.49) 24.72 17.61 14.19 Large farm (2.50-7.49 acres) 4.94 2.52 1.54 Large farm (7.50 acres & above) 8.67 10.18 9.58 Owning no land - 96.52 95.67 Male headed - 3.48 4.33 Female headed
3. Operated area (acres): All holdings 23019885 20484561 22944236 Per Holding 1.67 1.15 0.91 Farm Holdings 22678464 19957144 21945480 Per farm Holding 2.26 1.69 1.48
4. Homestead area (acres): All holdings 965986 1318415 1995702 Per holding 0.07 0.07 0.08 Per non farm holding 0.04 0.05 0.06 Per farm holding 0.08 0.09 0.09
5. Cultivated area(acres): All farm holding 20157564 17771339 18815381 Per farm holding 2.00 1.50 1.26 Temporary-crops net area 19055299 16450528 17443075 Temporary-crops net area per farm 1.94 1.39 1.17
6. Crop area (‘000’ acres) Temporary-crops gross area 32544 28616 30114 Aus 7684 4149 2515 Percent of gross area 23.6 14.5 8.35 Aman 11964 10548 9261 Percent of gross area 36.8 36.9 30.75 Boro 3138 6137 9980 Percent of gross area 9.6 21.4 33.14 Jute 1799 1304 1079 Percent of gross area 5.4 4.5 3.58
Contd.

162
5.01 Key Findings of Different Agriculture Censuses (*rural area only)
Item 1983-84 1996 2008 Sugarcane 396 329 216
Percent of gross area 1.2 1.1 .72
Wheat 1322 1522 635
Percent of gross area 4.1 5.3 2.11
7. Cropping intensity(%) 170.84 173.95 172.64
8. Irrigation
Holdings reporting irrigation 4426941 7570302 10258189
Irrigated area (acres) 4003719 8586222 11845974
Percent of holdings reporting irrigation
32.0 42.5 40.46
Percent of farm holdings reporting irrigation
43.3 64.2 68.62
Percent of irrigated area to cultivated area
19.9 48.3 62.96
9. Bovine Animal
Total number 22062257 22294904 25853643
number per holding 1.60 1.25 1.02
10. Sheep-goat
Total number 14225768 14609783 17306190
Number per holding 1.03 0.82 0.68
11. Poultry birds
Total number 73713161 126667861 135119224
Number per holding 5.33 7.10 5.33
12. Agriculture labour households
Total number 5495300 6401453 8732259
Percent of all households 39.8 35.9 34.44
Number in non-farm group 2375551 3381101 3855180
Percent in non-farm group 62.97 56.07 36.78
Total number in farm group 3119749 3020356 4877079
Percent in farm group 31.06 25.60 32.80
The rural area definition is given on page 21 in the section concepts and definition( report agriculture censuses, 2008)
Source: Agriculture Census, 2008

5.02 Land Utilization Statistics,1993-94 to 2012-13 (Area in ‘000’ acre)
Year Not available
for cultivation
Forest area
Cultura-ble
waste area
Curre-nt
fallow area
Single cropped area
Double cropped
area
Tripple cropped area
Quar- Druple
cropped area
Net cropped
area
Total cropped
area
1 2 3 4 5 6 7 8 9 10 11
1993-94 10355 4673 1568 984 7229 9497 2364 - 19090 33315 1994-95 10128 4861 1547 1000 7228 9530 2375 - 19133 33413 1995-96 9788 5317 1314 969 7875 8702 2704 - 19281 33391 -
1996-97 9681 5329 1295 963 7196 9722 2483 - 19401 34089 1997-98 9268 5572 1241 898 7083 10094 2513 - 19690 34810 1998-99 9141 5572 1100 1115 7408 9914 2419 - 19741 34493 1999-00 8435 6490 781 862 7395 10246 2460 - 20101 35267
2000-01 8427 6491 794 987 7141 10293 2536 - 19970 35335 2001-02 8676 6365 799 1005 7097 10200 2527 - 19824 35076 2002-03 8685 6418 764 957 7108 10193 2544 - 19845 35126 2003-04 8697 6418 736 957 794 10212 2538 - 19843 35129 2004-05 8724 6420 663 1159 7091 10082 2530 - 19703 34845 2005-06 8802 6420 640 1518 7041 9841 2407 - 19289 33944 2006-07 8835 6420 634 1514 7027 9822 2417 - 19266 33922 2007-08 8872 6420 592 1598 6917 9447 2823 - 19187 34280 2008-09 8885 6420 572 1171 6786 9677 3158 - 19621 35614 2009-10 9572 5754 549 1310 6443 9836 3205 - 19484 35730 2010-11 9238 6368 542 1153 5526 10149 3670 23 19368 36926 2011-12 9238 6359 521 930 6028 9488 4055 23 19594 37261 2012-13 9293 6359 505 969 6031 9441 4047 24 19543 37150 Note: Forest area have been reported from the office of the chief conservator offorest (private forest area not in cluded) The CFC office has
excluded some land from four costal areas which they used to show as forest area vet ore . The same area (666000 acres) is included in the area not available for cultivation.
Source: Agriculture Wing, BBS.
163

5.03 Acreage, Production and Yield Rate of Major Agricultural Crops, 2006-07 to 2013-14 Rice Wheat Jute Sugarcane
Acre Prod. Yield Acre Prod. Yield Acre Prod. Yield Acre Prod. Yield
Year in '000' per acre in '000' per acre in '000' per acre in '000' per acre
'000' (m.ton) (kg) '000' (m.ton) (kg) '000' bales (kg) '000' (m.ton) (kg)
1 2 3 4 5 6 7 8 9 10 11 12 13
2006-07 26142 27318 1044 988 737 746 1034 4884 856 371 5770 15560 2007-08 26129 28931 1107 958 844 881 1089 4622 424 320 4984 15577 2008-09 27872 31317 1124 975 849 871 1039 4678 817 312 5233 16771 2009-10 28236 32257 1140 922 969 970 1029 5090 898 290 4491 15486 2010-11 28489 33542 1177 923 972 1053 1751 8396 869 287 4671 16272 2011-12 28488 33890 1190 885 995 1125 1878 8003 773 266 4603 17316 2012-13 28228 33834 1198 1029 1255 1219 1683 7611 820 270 4469 16560 2013-14 28101 34356 1223 1062 1303 1227 1645 7436 2027 265 4508 17005
Contd.
Tea Pulses (a) Oilseeds (b) Tobacco
Acre Prod. Yield Acre Prod. Yield Acre Prod. Yield Acre Prod. Yield
Year in '000' per acre in '000' per acre in '000' per acre in '000' per acre
'000' (m.ton) (kg) '000' (m.ton) (kg) '000' (m.ton) (kg) '000' (m.ton) (kg)
14 15 16 17 18 19 20 21 22 23 24 25
2006-07 129 58 452 769 259 335 841 683 812 76 39 516 2007-08 133 59 444 558 204 365 875 701 802 72 40 556 2008-09 134 59 443 559 196 350 871 661 759 74 40 546 2009-10 136 68 449 593 220 372 903 786 872 95 55 585 2010-11 140 61 432 627 232 370 924 730 791 121 79 636 2011-12 143 61 422 667 240 359 972 787 805 126 85 679 2012-13 144 64 440 701 265 378 1009 804 801 120 79 663 2013-14 148 68 457 824 352 397 1065 844 792 124 85 2449 Notes : (a) Pulses include masur, mough, gram, mash kalai, arhar, etc (b) oilseeds include rape and mustard, til, linseed, groundnut, coconut, castor, etc (c) for detail please see statistical yearbook of agriculture. (d) In the year 2004-05 data collected in new forms.
(e) Permanent fruit crops acreage covers area under garden. Source: Agriculture Wing, BBS.
164

5.04 Acreage and Production of Minor Cereals,1998-99 to 2013-14
Area in '000' acres Production in '000' tons
Year Barley Jower Bajra Maize Others Barley Jower Bajra
Maize Others
1998-99 21 1 0.14 6 189 5 0.13 0.03 2 55 1999-00 17 2 0.16 8 145 5 1 0.04 4 42 2000-01 14 2 0.14 12 76 4 1 0.05 10 23 2001-02 10 2 0.14 49 46 3 1 0.04 64 15 2002-03 6 2 0.08 72 68 2 1 0.02 117 20 2003-04 5 1 0.07 124 61 1 0.10 0.02 241 17 2004-05 3 2 0.01 165 58 1 0.81 0.005 356 17 2005-06 2 1 0.6 243 44 1 1 0.015 522 12 2006-07 2 0.45 0.06 373 33 1 0.25 0.015 902 9 2007-08 2 0.49 0.06 553 24 1 0.44 0.035 1343 7 2008-09 2 1 0.066 317 10 1 0.44 0.035 730 3 2009-10 2 1 0.058 376 8 1 0.27 0.044 887 3 2010-11 1 1 0.064 409 9 1 0.25 0.015 1018 3 2011-12 1 0.416 0.149 487 3 0.32 0.226 0.32 1298 1 2012-13 1 0.33 0.146 580 4 0.32 0.15 0.83 1548 1 2013-14 1 0.275 0.11 759 4 0.266 0.12 0.058 2124 2 Notes: Others include cheena, other cereals etc. Source: Agriculture Wing, BBS.
165

166
5.05 Sowing and Harvesting Period of Important Crops
Name of crop Sowing period Harvesting period
Cereals : 1. Aus paddy Mid March to Mid April Mid July to Early August 2. Broadcast Aman
paddy Mid March-Mid April Mid Nov-Mid Dec
3. Transplanted Aman paddy End June-Early Sept December to Early January 4. Local Boro paddy Mid Nov-Mid Jan April-May 5. High yielding Boro paddy Dec. to Mid February Mid April-June 6. Wheat Nov-Dec March-Mid April
Fibres : 7. White jute Early March-Mid April July-August 8. Tossa jute Mid April Early May August-Sept. 9. Mesta April-May Oct.-Nov.
Pulses : 10. Masur Mid Oct. to Mid Nov. Begining Feb. to Early March 11. Kheshari Mid Oct. to Mid Dec. Mid Feb. to Mid April
Spices : 12. Bhadoi Chillies Mid April to Mid July Sept.-Dec. 13. Rabi Chillies Mid Nov. to Mid Jan. March-May 14. Onion Begining Oct. to Early Dec Late April to Mid June 15. Turmeric Mid April to Mid June Mid Dec. to Mid March 16. Ginger Mid March-Mid May Mid Dec. to Mid March 17. Corriander Oct. to -December Mid Feb. to Mid March
Others: 18. Potato Mid Sept. toMid Nov. Mid Jan. to March 19. Sugarcane Mid Oct. to Mid Dec. Mid Oct. To Mid April 20. Tobacco Mid Oct. to Mid Dec. Mid Feb. to Mid April Source: Agriculture Wing, BBS.

167
5.06 Production of Fruits, 2008-09 to 2013-14 (Thousand tons) Items 2008-09 2009-10 2010-11 2011-12 2012-13 2013-14
Banana 836 818 801 746 774 770 Mango 828 1048 889 945 957 992 Pineapple 229 234 219 181 187 199 Jackfruit 975 1005 962 929 957 1004 Papaya 130 113 125 120 125 131 Melon 37 43 46 43 40 52 Mandarine - - - - - - Ber 72 76 78 78 78 82 Guava 161 182 271 227 205 203 Citrus Fruits 16 21 20 20 19 18 Others 13 17 14 13 11 16 Source: Agriculture Wing, BBS.
5.07 Flowering and Harvesting Period of Main Fruits
Approximate Approximate Name flowering period harvesting period
Mango February Mid April to Mid June
Pineapple February-March May-July
Lichis February-March Mid April to Mid July
Lemon February-March August-October
Pomelo February-March Mid August to Mid October
Lime February-March June-August
Jackfruit February-March Mid April to Mid July
Guava March-May November-Dec.
July-Sept.(main crop)
Banana Throughout year Peak Periods: Dec. Feb. and
Sept. Oct.
Papaya Throughout year Early July to End August
Melon February-March Mid February to Mid June Source: Agriculture Wing, BBS.

168
5.08 Production of Vegetables, 2009-10 to 2013-14 (Thousand tons)
Vegetable 2009-10 2010-11 2011-12 2012-13 2013-14
Potato 7930 8326 8205 8603 8950
Kharif pumpkin 93 95 79 79 78
Rabi pumpkin 125 122 131 139 167
Kharif brinjal 125 21115 130 132 134
Rabi brinjal 216 124 224 236 311
Patal 78 83 86 85 84
Lady's finger 42 43 45 44 45
Jhinga 44 46 45 46 45
Karala 41 45 46 52 51
Arum 225 239 236 239 229
Puisak 67 67 69 74 73
Chichinga 30 31 32 33 33
Cucumber 55 48 50 49 55
Cabbage 220 207 213 200 217
Cauliflower 160 168 166 166 183
Water gourd 134 137 139 157 179
Tomato 190 232 255 251 360
Radish 260 257 260 252 252
Beans 89 95 94 93 110
Other Rabi vegetable 35 35 34 34 39 Source: Agriculture Wing, BBS.
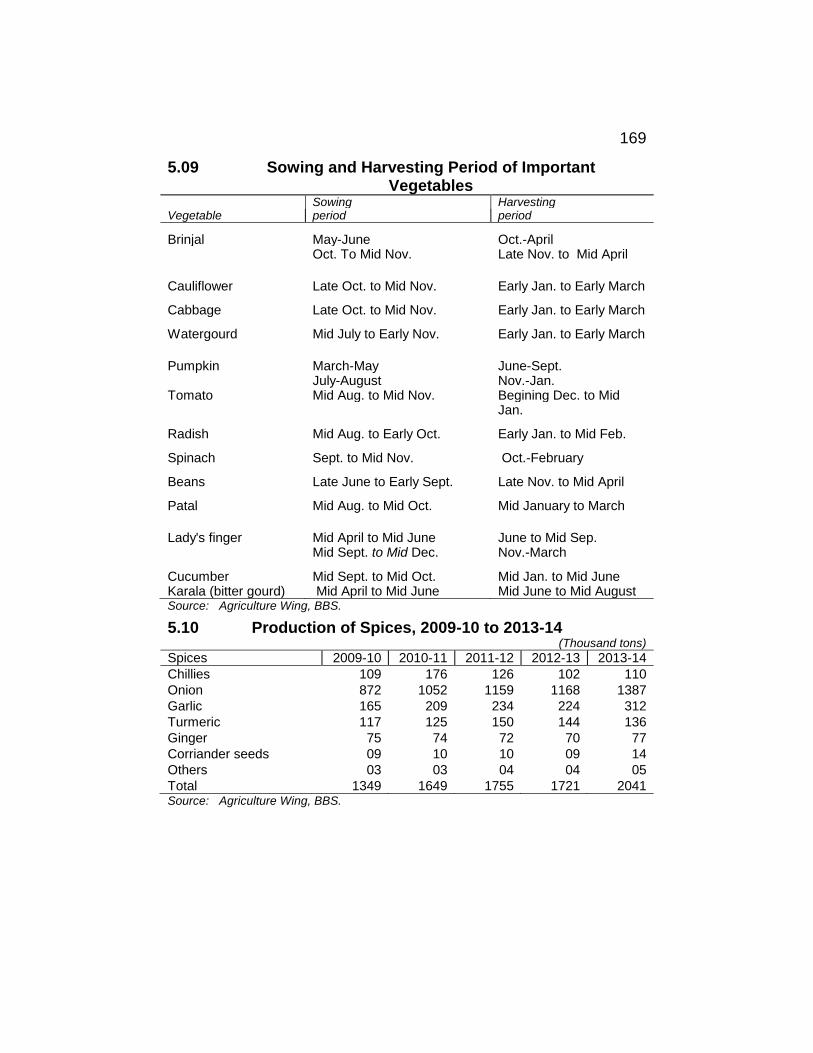
169
5.09 Sowing and Harvesting Period of Important Vegetables Sowing Harvesting Vegetable period period
Brinjal May-June Oct.-April Oct. To Mid Nov. Late Nov. to Mid April
Cauliflower Late Oct. to Mid Nov. Early Jan. to Early March
Cabbage Late Oct. to Mid Nov. Early Jan. to Early March
Watergourd Mid July to Early Nov. Early Jan. to Early March
Pumpkin March-May June-Sept. July-August Nov.-Jan. Tomato Mid Aug. to Mid Nov. Begining Dec. to Mid Jan.
Radish Mid Aug. to Early Oct. Early Jan. to Mid Feb.
Spinach Sept. to Mid Nov. Oct.-February
Beans Late June to Early Sept. Late Nov. to Mid April
Patal Mid Aug. to Mid Oct. Mid January to March
Lady's finger Mid April to Mid June June to Mid Sep. Mid Sept. to Mid Dec. Nov.-March
Cucumber Mid Sept. to Mid Oct. Mid Jan. to Mid June Karala (bitter gourd) Mid April to Mid June Mid June to Mid August Source: Agriculture Wing, BBS.
5.10 Production of Spices, 2009-10 to 2013-14 (Thousand tons)
Spices 2009-10 2010-11 2011-12 2012-13 2013-14
Chillies 109 176 126 102 110
Onion 872 1052 1159 1168 1387
Garlic 165 209 234 224 312
Turmeric 117 125 150 144 136
Ginger 75 74 72 70 77
Corriander seeds 09 10 10 09 14
Others 03 03 04 04 05
Total 1349 1649 1755 1721 2041 Source: Agriculture Wing, BBS.

170
5.11 Production of Oilseeds, 2009-10 to 2013-14 (Thousand tons)
Oilseed 2009-10 2010-11 2011-12 2012-13 2013-14
Linseed 07 07 06 06 06
Summer and Winter Til 32 31 30 31 30
Rape and mustard 222 247 262 294 296
Kharif & Rabi groundnut 53 53 52 50 56
Total 314 338 350 381 388 Source: Agriculture Wing, BBS.26 103
5.12 Production of Pulses, 2009-10 to 2013-14
(Thousand tons)
Pulses 2009-10 2010-11 2011-12 2012-13 2013-14
Gram 06 07 07 07 06
Tur or arhar 01 01 0.445 0.423 01
Mugh 20 19 26 25 32
Masur 71 80 80 93 157
Mashkalai 28 29 24 26 31
Kheshari 82 83 89 103 110
Motor 06 06 06 06 07
Garikalai 0.19 0.15 0.132 0.125 0.032
Other Kharif & Rabi
pulses3
07 0.6 07 06 08
Total 221 231 239 266 352 Source: Agriculture Wing, BBS.

171
5.13 Area Irrigated by Different Methods, 2009-10 to 2013-14 (Thousand acres)
Method 2009-10 2010-11 2011-12 2012-13 2013-14
Modern: 15315 16044 16584 16801 17173
Power pumps 2696 2747 2887 2874 2948
Tubewells 12619 13297 13697 13927 14225
Canals - - - - -
Traditional: 871 860 851 805 943
(Doons*,swing baskets and
others)
Total: 16186 16904 17435 17606 18116
Doons are conical shaped containers usually 10x1' used forlifting water.
Canal has been included in traditional in 2004-05 Source: Agriculture Wing, BBS, BADC, Agricultural Ministry.
5.14 Area Irrigated Under Different Crops, 2009-10 to 2013-14
(Thousand acres)
Crop 2009-10 2010-11 2011-12 2012-13 2013-14
Rice Aus - - - - - Aman 1549 1715 1899 1935 2126 Boro 11025 11313 11473 11409 11416 Total rice 12574 - - - - Wheat 806 856 832 838 951 Other cereals - - - - - Oilseeds - - - - - Potato 911 942 921 939 981 Vegetable 713 737 817 894 925 Sugarcane 138 140 147 155 146 Cotton 32 48 51 40 30 Others 1012 1153 1295 1396 1541 Total 16186 16904 17435 17606 18116 Source: Agriculture Wing, BBS.

172
5.15 Cold Storage by Location and Capacity, 2013 to 2014 (Thousand m.tons)
Former Districts
2013 2014
Number Potato Number Potato
of units Capacity stored of units Capacity stored Dkaka 8 21011 1860 8 21111 15225 Narayangonj 4 17800 1284 5 25400 12320 Munshigonj 72 498600 47820 73 495251 433750 Manikgonj 2 7000 70 2 6000 6000 Gazipur 1 1000 10 1 1000 1000 Kishoregonj 5 23300 141 5 23300 13708 Tangail 3 19900 1043 3 19415 5493 Jamalpur 3 12000 1138 3 12000 10860 Sherpur 2 11200 720 2 11000 6800 Faridpur 3 21000 732 3 17800 8702 Madaripur 1 5120 512 1 6000 3360 Rajshahi 28 299000 27510 28 308000 278510 C. Nawabgonj 1 5000 501 1 5000 4607 Nator 3 11500 1156 4 10500 10500 Naouga 6 26696 1811 6 25768 13889 Dinajpur 10 70600 1081 13 96860 70780 Thakurgaon 14 106440 1072 14 106440 83342 Pabna 2 10452 1002 2 10675 9941 Sirajgonj - - - - - - Bogra 29 223750 22380 29 223780 203823 Joypuhat 19 116956 11695 14 116956 113828 Gaibanda 4 35100 2740 5 41588 22300 Rangpur 39 423451 34960 40 435017 272104 Kurigram 4 43000 38260 4 45860 36202 Nilfamari 9 77888 75381 9 85100 52632 Lalmonirhat 8 74572 59805 8 74572 48040 Khulna 5 10780 3755 5 10780 3488 Shatkhira 5 17320 13331 5 15720 9597 Khustia 3 7290 1851 3 7200 1885 Jessore 10 38960 3634 10 38588 28627 Barishal 1 2000 200 1 2000 1250 Chittagong 5 23452 1083 6 18650 8840 Chandpur 10 50600 3541 10 42000 35719 Feni 1 7560 436 1 6960 5780 Commilla 30 122800 1184 32 128250 130650 Sylhet 3 6860 1386 3 3800 991 Maulavibazar 3 5100 3205 3 4600 3582 Hobigonj 1 1200 72 1 1500 - Meherpur 3 8600 795 3 10000 10269 Coxbazer - - - 1 5000 - Borguna 1 12000 400 1 12000 450 Total 361 2476858 369557 368 2531441 1978844 Notes: The cold storage facilities are largely for storage of potatoes. Source: Department of Agricultural Marketing.

173
5.16 Forest Lands Under the Control of Forest Department During 2013-14
(Sq. kilo meter) Name of District
Reserved Notified under
Forest Act 4&6
Protected
Acquired Vested Transferred From
Uclased State
Forests
Total
Dhaka 0.00 934.74 934.74 934.74
Gazipur 8650.25 55970.17 64620.42 64620.402
Mymensingh 20318.21 18383.06 38701.27 38701.27
Jamalpur 10264.39 10264.39 10264.39
Sherpur 6327.65 13747.23 20074.88 20074.88
Netrokona 531.53 1824.64 32356.17 2656.17
Tangail 55476.38 67400.52 122876.90 122876.90
Sylhet 23900.60 34495.11 58395.74 988.88 59384.62
Habiganj 33886.73 33886.73 2200.00 36086.73
Moulvibazar 59300.32 4892.88 10932.00 75125.20 1079.41 76204.61
Sunamganj 6434.15 11180.30 17614.45 17614.45
Chittagong 190756.07 165000.00 64435.46 16402.82 0 418594.35 418594.35
Cox's Bazar 168900.50 30000.00 33521.42 232421.92 232421.92
Bandarban 242693.40 23535.40 0.00 0.00 38644.75 304873.55 494372.54 799246.09
Rangamati 573270.21 57122.65 1.50 630394.36 763890.54 1394284.90
Khagrachaari 88492.83 7342.67 0.00 0.00 4202.76 100038.26 454077.95 554116.21
Comilla 1720.92 1720.92 1720.92
Feni 2191.43 18000.00 20191.43 20191.43
Bagerhat 6675531.00 0 667531.00 667531.00
Khulna 357400.00 0 357400.00 357400.00
Satkhira 400965.00 0 400965.00 400965.0
Rangpur 1676.14 1749.03 21.54 3446.71 3446.71
Nilphamari 0 648.59 551.49 1200.08 1200.08
Kurigram 128.61 0 128.61 128.61
Lalmonirhat 82.62 0 82.62 82.62
Dinajpur 15210.15 3539.95 18750.10 188750.10
Thakurgaon 117.11 1122.49 0.00 0.00 2239.60 223960
Panchagarh 33.28 4578.03 0.00 0.00 4611.61 4611.31
Naogaon 47395 0 5991.70 681.99 681.99 7147.64 7147.64
Noakhali 49593.11 330406.89 4784.72 384784.72 384784.72
Luxmipur 50000.00 50000.00 50000.00
Patuakhali 32485.87 117514.13 150000.00 150000.00
Barguna 26350.50 48649.50 75000.00 75000.00
Pirojpur 6000.00 6000.00 75000.00
Bhola 73421.78 286578.22 360000.00 6000.00
Acre Total 310759941 1371952.92 91381.89 28591.34 28591.34 4642373.07 1716609.32 360000.00
Hectare Ttal 1258137.411 555446.526 36996.72 11575.44 11575.44 1879503.265 694983.53 6358982.39
SQ Km 2574486.796 Source: Forest Deferment.

174
5.17 Output of Forest Products(Reserve Forests) 2009-10 to 2012-13
Period Unit 2009-10 2010-11 2011-12 2012-13
Timber cft. 759317.31 2201889.01 20115078.50 1900209.13
Firewood cft. 600132.13 933293.94 1833720.55 1558136.82
Golpata Mound 687248.74 521820.00 320016.00 7867352.0
Bamboos nos. 49592822.00 15498488.00 36673894.00 12487752
Sun-grass MT - - -
Honey Ltr 2763.23 25097.00 165731.00 51866.07
Fish Mound 147435.99 134903.00 202042.00 4766913.52
Source: Department of Forests.
5.18 Output from Farm Forest ('000' acres)
Farm forestry Agriculture Census
Items survey 1988 2005(p) 1983-84 1996*
No. of farm holding 10739 14953 9970 11798
Operated area 23144 24193 22674 20485
Forest area 1178 na 1179 na
Area under permanent
Crops/fruit trees 561 na 597 663
Area under bamboos 364 na 295 304
Area under other trees 253 na 287 na
Note: ’p’ Denotes preliminary estimates of agriculture sample survey, 2005 , BBS. ‘*’ denotes the census year which was conducted only in the rural areas. Source : Report of Survey of farm Forestry 1988, BBS.

175
5.19 Forestation/Plantation Progress, 2011-12 to 2013-14 (In Hectare)
Classifications Unit 2010-11 2011-12 2013-14
Coastal forests/Mangrove Heq 17376.60 19939.66 9955.00
Social forestry: (Lac plant Lac 253.85 100.89 11.551
Roads, Rails,Embankments (in KM) K.m 6004 253.85 859.60
Source: Ministry of Environment and Forests, and Bangladesh Economic Review.
5.20 Species/Group-wise Annual Fish Production in Inland
and Marine Fisheries , 2012-13 ( Unit : Metric tons)
Species/Group Inland Fisheries
Marine Fisheries
Total %
1. Major Carp 729362 - 729362 21.39 2. Other Carp 54131 - 54131 1.59 3. Exotic Carp 402858 - 402858 11.81 4. Cat Fish 288887 - 360745 10.58 5. Snake Head 53370 - 53370 1.56 6. Live Fish 102670 - 102670 3.01 7. Other Inland Fish 834208 - 834208 24.46 8. Hilsa/Illish (Tenualosa ilisha) 98648 252575 351223 10.30 9. Shrimp/Prawn 185274 46568 231842 6.80 10. Sardine (Sardinella fimbriata) 29636 29636 0.87 11. Bombay Duck (Harpondon nehereus) - 71745 71745 2.10 12. Indian Salmon (Polydactylus indicus) - 2445 2445 0.07 13. Pomfret (Rup_Hail_Foli Chanda) 29693 29693 0.87 14. Jew Fish (Poa, Lambu, Kaladatina etc.) 30600 30600 0.90 15. Sea Cat Fish (Tachysurus Spp) - 8594 8594 0.25 16. Sharks, Sjates & Ray - 5017 5017 0.15 17. Other Marine Fish - 112115 112115 3.29 Total Metric Ton 2821266 588988 3410254 100.00 % 82.73% 17.27% 100% -
Note : 1. Major Carp-Rui, Catla, Mrigal 2. Other Carp-Ghania,Kalibaus, Bata 3. Exatic Carp- Silver Carp, Common Carp, Mirror Carp, Grass Carp, Big Head Carp
4. Cat Fish-Boal, Air, Pangas, Silon, Rita 5. Snake Head-Shol, Gazar, Taki 6. Live Fish-Koi, Singhi, Magur 7. Other Fish (Inland and Marine)-Includes all other fisher except those mentioned above. 8. Prawn-Galda and Other Inland Chingri 9. Shrimp-Bagda and Other Coastal/Marine Chingri.
Source: Ministry of Fisheries and Livestock, Department of fisheries

176
5.21 Internal Procurement of Food Grain 2005-06 to 2013-14
(000 MT) Year Rice Proc't Total Wheat Total
Aman Boro Aus Tender Rice Food grain
2005-06 88 856 0 944 1 945 2006-07 163 977 0 1140 0 1140 2007-08 0 870 199 1069 4 1073 2008-09 163 1286 0 1449 34 1483 2009-10 15 757 0 0 772 48 820 2010-11 0 463 0 0 463 0 463 2011-12 350 978 0 0 1328 99 1427 2012-13 276 999 0 0 1274 130 1404 2013-14 355 900 0 0 1255 150 1405
Source: Department of Food.
5.22 Public Food Distribution System 2005-06 to 2013-14
(000 MT) Year Rice Wheat Food grain Share of Total
Rice Wheat
2005-06 1008 237 1245 81% 19%
2006-07 1288 192 1480 87% 13% 2007-08 1081 248 1329 81% 19% 2008-09 1757 372 2129 83% 17% 2009-10 1305 653 1958 67% 33% 2010-11 1570 723 2293 68% 32% 2011-12 1412 683 2095 67% 33% 2012-13 1487 600 2087 71% 29% 2013-14 1262 958 2220 57% 43%
Source: Department of Food.

177
Chapter VI
INDUSTRY

178
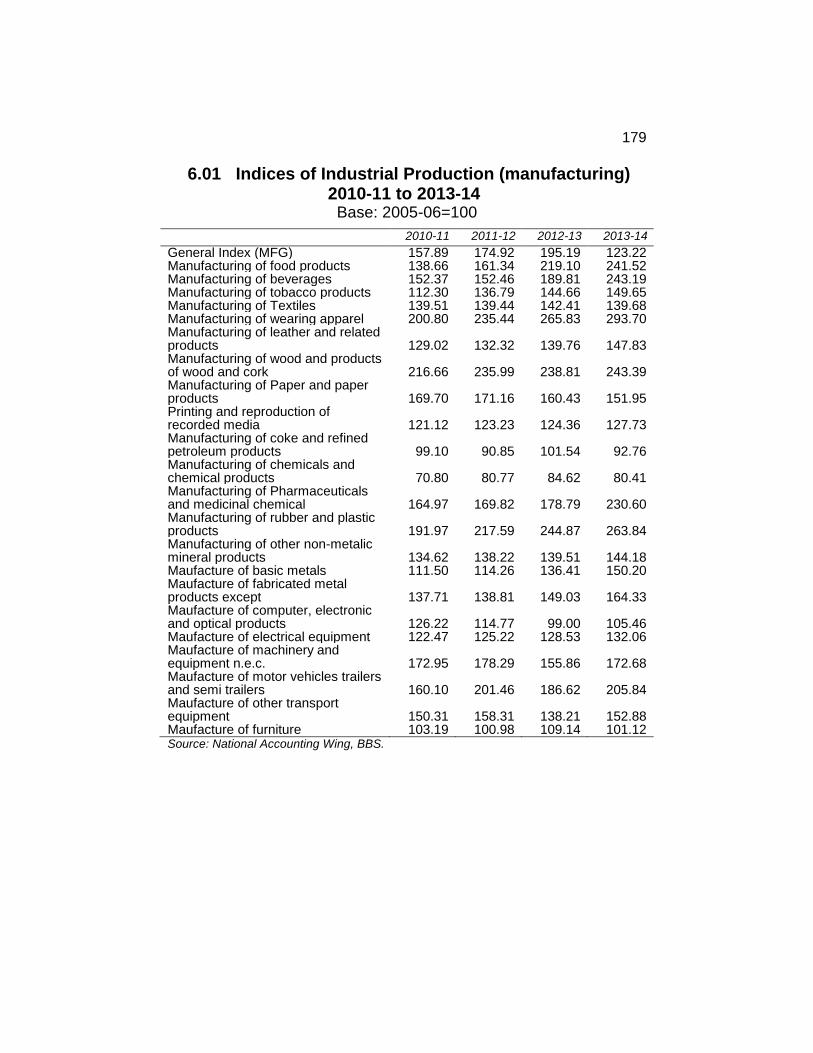
179
6.01 Indices of Industrial Production (manufacturing) 2010-11 to 2013-14
Base: 2005-06=100
2010-11 2011-12 2012-13 2013-14
General Index (MFG) 157.89 174.92 195.19 123.22 Manufacturing of food products 138.66 161.34 219.10 241.52 Manufacturing of beverages 152.37 152.46 189.81 243.19 Manufacturing of tobacco products 112.30 136.79 144.66 149.65 Manufacturing of Textiles 139.51 139.44 142.41 139.68 Manufacturing of wearing apparel 200.80 235.44 265.83 293.70 Manufacturing of leather and related products
129.02
132.32
139.76
147.83
Manufacturing of wood and products of wood and cork
216.66
235.99
238.81
243.39
Manufacturing of Paper and paper products
169.70
171.16
160.43
151.95
Printing and reproduction of recorded media
121.12
123.23
124.36
127.73
Manufacturing of coke and refined petroleum products
99.10
90.85
101.54
92.76
Manufacturing of chemicals and chemical products
70.80
80.77
84.62
80.41
Manufacturing of Pharmaceuticals and medicinal chemical
164.97
169.82
178.79
230.60
Manufacturing of rubber and plastic products
191.97
217.59
244.87
263.84
Manufacturing of other non-metalic mineral products
134.62
138.22
139.51
144.18
Maufacture of basic metals 111.50 114.26 136.41 150.20 Maufacture of fabricated metal products except
137.71
138.81
149.03
164.33
Maufacture of computer, electronic and optical products
126.22
114.77
99.00
105.46
Maufacture of electrical equipment 122.47 125.22 128.53 132.06 Maufacture of machinery and equipment n.e.c.
172.95
178.29
155.86
172.68
Maufacture of motor vehicles trailers and semi trailers
160.10
201.46
186.62
205.84
Maufacture of other transport equipment
150.31
158.31
138.21
152.88
Maufacture of furniture 103.19 100.98 109.14 101.12 Source: National Accounting Wing, BBS.

180
6.02 Some Productivity Indices of Industrial Labour in Selected Industries, 2006-07 to 2012-13 (Base: 1988-89=100) Jute Cotton Paper Steel Year Prod- All Prod- All Prod- All Prod- All uction emplo
- uction emplo
- uction emplo
- uction emplo
- workers yees workers yees workers yees workers yees
1 2 3 4 5 6 7 8 9
2006-07 79 87 366 366 99 87 - -
2007-08 90 100 400 400 113 100 - -
2008-09 85 94 412 413 124 108 - -
2009-10 92 87 412 415 93 69 - -
2010-11 93 103 421 423 103 91 - -
2011-12 100 109 394 397 291 274 - -
2012-13 106 116 398 401 297 273 - - Contd.
6.02 Year
Cement Fertilizer Petroleum products
Paint varnishes
Prod- All Prod- All Prod- All Prod- All uction emplo
- uction emplo
- uction emplo
- uction emplo-
workers yees workers yees workers yees workers yees
10 11 12 13 14 15 16 17
2006-07 454 509 139 131 119 108 664 809
2007-08 470 525 116 110 113 98 672 808
2008-09 535 595 105 97 79 68 623 749
2009-10 503 549 88 83 105 92 684 838
2010-11 514 560 76 72 97 92 706 865
2011-12 480 489 74 81 117 107 1022 1228
2012-13 501 618 73 81 131 104 1041 1267 Source: National Accounting Wing, BBS.

181
6.03 Production of Selected Industrial Items Appendix-33; Production of Major Industrial Goods. Name of Producti Units 2009-10 2010-11 2011-12 2012-13 2013-14
Sugar M.T 62203 100305 69308 107123 128267
Black & Blending Tea M.T
5944 60078 60326 63044 66604
Soft Drinks '000' MT 37592 43857 45906 57614 70768 Cigarettes '000' Doz
Bottol 23677 23446 31905 26270 28314
Preparation & Spinning of Textile fibers
Mill No. 181180 179312 172077 174508 175273
Weaving of Textiles Mill No. 52975 56181 56546 56949 57386
Jute Textile M.T
303815 307385 369029 426820 387612
Wearing Apperal '000' Mit 363994 499113 627892 719311 791402
Knittwear '000' MT 392435 561243 620246 691115 766532 Leather Footwear '000' gross 14009 14130 15098 16135 16655 Pulp, Paper & sprint '000' Pair 148000 156000 159000 149255 146812
Peyrolenes Products M.T
368200 324420 367555 359791 340700 Fertilizer '000' tons 1688936 1013537 1047214 1074791 976691
Soaps & Detergents M.T
62159 63194 64713 67757 68373
Cement M.T
2877203 2982121 3197110 3460495 3569608
Re-roling mills (MS Rod)
M.T 269678 226262 232470 281715 306057
Contd.

182
6.03 Production of Selected Industrial Items 2008-09 to 2012-13 Items Units 2008-09 2009-10 2010-11 2011-12 2012-13
Pumps:
i) Upto 1 cusec Nos. 3472 4645 4607 4573 4575
ii) 1-1/2-- 2 cusec Nos. 1248 1250 - - -
iii) Turbine pump Nos. 218 214 227 233 254
iv) Hand pump Nos. - - - - -
Cable wire MT 24113 24832 26096 20068 22569
Soaps &
detergents'000'
MT 62 62 72 65 68
Drycell battery Mill. Nos. 90 111 119 206 278
Motor cycle Nos. 45554 49355 52087 34766 44677
Bi-cycle Nos. 30058 31380 30150 - -
Bulb: - -
(a) All watt '000'Nos. 43104 46360 47250 48171 51005
(b) Fluorescent
tubes
'000' Nos. - 15892 2638 2689 2847
Electric fan '000'Nos. 100 106 112 168 185
Radio/Transistor '000’Nos. 35 35 34 27 -
Television :
Black & white '000'Nos. 85 85 105 81 121
Television (Colour) Nos. 141726 147740 162352 159516 237375
P =Provisional. Source: i) Sectoral corporation, ii) Bangladesh Forest Industries Corporation. (iii) National Accounting Wing, BBS.

183
6.04 Structure of Jute Manufacturing Industry 2005-06 to 2013-14
Year
No. of mills
No. of looms
installed
Average no. of looms worked
No. of workers (permanent)
(000)
2005-06 74 14570 14340 114 2006-07 76 14369 14002 117 2007-08 95 20061 9598 69 2008-09 93 20043 9051 68 2009-10 105 20101 9946 57 2010-11 104 21306 9757 58 2011-12 110 22318 12204 59 2012-13 113 22379 12577 61 2013-14 124 25104 11983 - Source: BJMC and BJMA.
6.05 Production of Jute Goods in Bangladesh and India
(Thousand MT) Country/year Hessian Sacking Carpet
backing Others Total
Bangladesh 2004-05 45 131 17 293 486 2005-06 53 164 25 302 544 2006-07 40 153 18 360 571 2007-08 48 173 21 48 290 2008-09 20 80 06 2 108 2009-10 25 102 10 7 154 2010-11 46 185 16 42 290 2011-12 54 240 718 56 369 2012-13 51 261 14 101 1427 2013-14 27 120 7 11 167 India 2002-03 350 1010 5 289 1654 2003-04 295 957 4 - 1256 2004-05 313 974 5 300 1592 2005-06 317 1019 6 237 1579 2006-07 266 951 3 245 1465 Source: Bangladesh Jute Mills Corporation.

184
6.06 Structure of Cotton Textile Industry 2003-04 to 2013-14
Year
No. of reporting
mills
Installed capacity Working Total production Spindles
(000) Looms (000)
Spindles (000)
Looms (000)
Yarn (ml.Kg)
Cloth (ml.mtr.)
2003-04 63 1308 5 1170 4 84.9 26.3
2004-05 63 1428 6 1214 5 105.5 32.8
2005-06 63 1224 6 1218 5 120.9 38.0
2006-07 63 1235 6 1225 5 156.6 43.7
2007-08 63 1236 7 1226 5 171.3 46.0
2008-09 63 1237 8 1227 6 176.3 50.5
2009-10 63 1245 9 1235 7 181.2 53.0
2010-11 63 1246 10 1238 9 185.0 56.0
2011-12 18 187080 352 18611 0 9.36 0
2012-13 18 187080 352 33433 0 16.68 0
2013-14 18 186264 352 37164 0 19.80 0
Source : Bangladesh Textile Mills Corporation. 6.07 Production of Natural Gas, Fertilizer and Chemicals, 2007-08 to 2013-14
Year
Natural Gas
(Million CU
metre)
Production of Fertilizers Chemicals Urea (MT)
TSP (MT)
Ammo- nia sul- phate (MT)
Caus- stic
soda (MT)
Sul- phuric Acid (MT)
Hydro- cholo- ric Ac- id (MT)
Chlo- rine (MT)
2007-08 - 1476606 47167 2896 - 62704 - -
2008-09 - 1280294 24144 2072 - 47743 - -
2009-10 - 1058580 76618 314 - 50314 - -
2010-11 - 908837 63457 725 - 48899 - -
2011-12 - 933686 65047 359 - 54348 - -
2012-13 - 1026999 40152 98 - 51816 - -
2013-14 - 838628 86432 28 53177
Source : (i) Petro Bangla. (ii) Bangladesh Chemical Industries Corporation.

185
Chapter VII
ENERGY

186

187
7.01 Indicators of The Energy Sector 2010-11 to 2013-14
Items 2010-11 2011-12 2012-13 2013-14
A. Electricity
Total Generation Cpacity (MW) 6639 8100 8537 9821 Maximum Generation (MW) 4890 6066 6434 7356 Energy Generation (MKWH) 31355 35118 38229 42195 Energy Consumption (MKWH) 26652 29974 32740 36233 Transmission lines in (KM) 8616 8949 9322 9536 Distribution lines in (KM) (33KV&below)
274347 281123 288787 302760
Electrification of BPDB (No.): a. Thana 236 236 236 243 b. Village 4792 4810 5344 5393 c. Deep/shallow & low 30405 30933 36232 43822 lift pumps
B. Gas
Production (BFC) 708.9 743.5 794.38 820.43 Consumption (BFC) Power 273.8 304.3 328.8 337.4 Fertilizer 62.8 58.4 60.0 53.8 Industrial 121.5 128.5 135.7 141.9 Commercial 8.5 8.6 8.8 8.9 Tea garden 0.8 0.8 0.8 0.5 Brick field 0.0 0.0 0.0 0.0 Domestic 87.4 89.2 89.7 101.5 Captive power 121.2 12.6 134.1 143.8 C.N.G 38.5 38.6 40.2 40.1 Total consumption 714.5 751.7 798.2 828.1
C. Petroleum ('000' MT)
Imports :
(i) Crude Oil 1409 1083 1292 1177 (ii) Refined oil 2488 3409 3635 4174 (iii) Lubebase oil 5 5 4 - Total 3902 4497 4931 5351 Note: MKWH=million kilowatt hours. BFC=BillionCubic fit (gas Volume). Source : PDB, BPC, Ministry of Power, Energy and Mineral Resources.
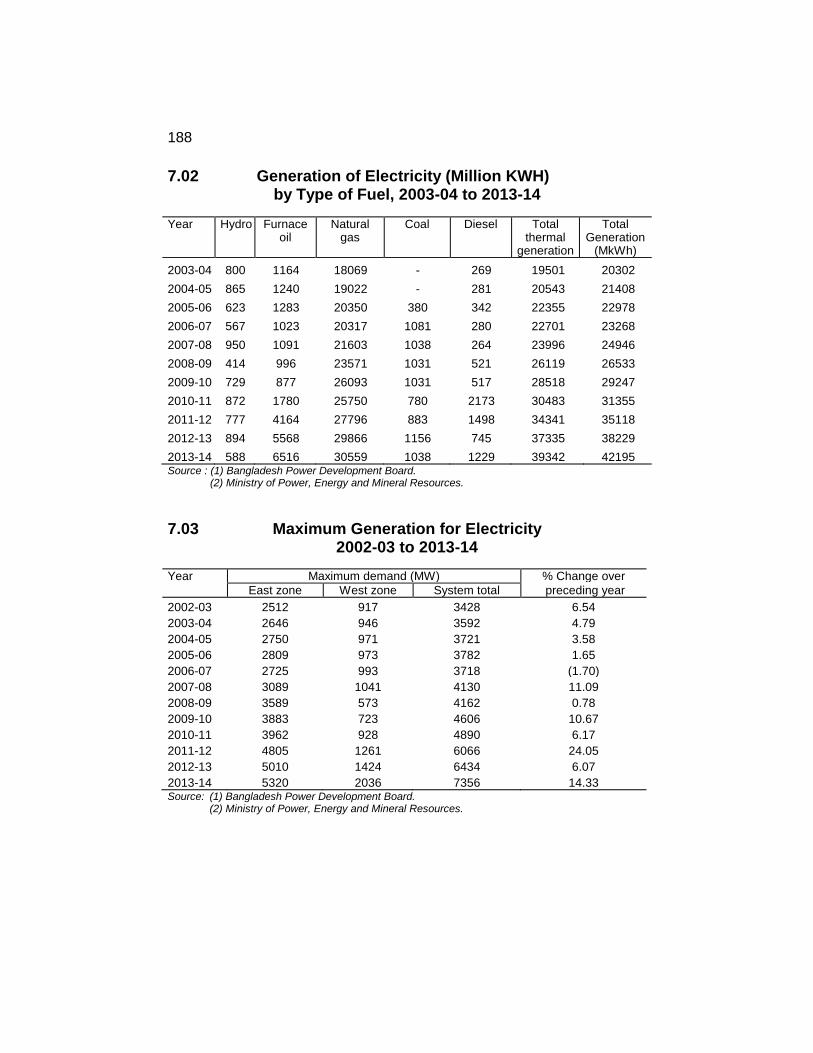
188
7.02 Generation of Electricity (Million KWH) by Type of Fuel, 2003-04 to 2013-14
Year Hydro Furnace oil
Natural gas
Coal Diesel Total thermal
generation
Total Generation
(MkWh)
2003-04 800 1164 18069 - 269 19501 20302
2004-05 865 1240 19022 - 281 20543 21408
2005-06 623 1283 20350 380 342 22355 22978
2006-07 567 1023 20317 1081 280 22701 23268
2007-08 950 1091 21603 1038 264 23996 24946
2008-09 414 996 23571 1031 521 26119 26533
2009-10 729 877 26093 1031 517 28518 29247
2010-11 872 1780 25750 780 2173 30483 31355
2011-12 777 4164 27796 883 1498 34341 35118
2012-13 894 5568 29866 1156 745 37335 38229
2013-14 588 6516 30559 1038 1229 39342 42195 Source : (1) Bangladesh Power Development Board. (2) Ministry of Power, Energy and Mineral Resources.
7.03 Maximum Generation for Electricity 2002-03 to 2013-14
Year Maximum demand (MW) % Change over
East zone West zone System total preceding year
2002-03 2512 917 3428 6.54
2003-04 2646 946 3592 4.79
2004-05 2750 971 3721 3.58
2005-06 2809 973 3782 1.65
2006-07 2725 993 3718 (1.70)
2007-08 3089 1041 4130 11.09
2008-09 3589 573 4162 0.78
2009-10 3883 723 4606 10.67
2010-11 3962 928 4890 6.17
2011-12 4805 1261 6066 24.05
2012-13 5010 1424 6434 6.07
2013-14 5320 2036 7356 14.33 Source: (1) Bangladesh Power Development Board. (2) Ministry of Power, Energy and Mineral Resources.

189
7.04 Consumption of Electricity by Category (County) 2003-04 to 2013-14 (Unit in MKWh)
Year Domestic Service
Agriculture Industrial Service
Commercial Service
Others
Total
2003-04 6599 606 6682 1151 295 15333 2004-05 6947 672 7153 1243 323 16338 2005-06 7748 798 7855 1404 323 18128 2006-07 8167 869 7817 1521 322 18696 2007-08 9274 914 7940 1814 473 20415 2008-09 10053 1172 7626 2054 850 21755 2009-10 11623 1229 9002 2336 406 24596 2010-11 12757 1269 9566 2574 413 26579 2011-12 14678 1492 10579 2751 473 29974 2012-13 16351 1512 11445 2996 436 32740 2013-14 18453 1733 12270 3312 465 36233 Note : MKWh=million kilowatt hours. Source: (1) Bangladesh Power Development Board.
(2) Ministry of Power, Energy and Mineral Resources.
7.05 Consumer Category Wise Consumption (MKWH) of Rural Electricity 2005-06 to 2013-14 (Unit in MKWH) Year Sectors
Domestic Industrial Commercial Irrigation Others Total
2005-06 3186.62 3054.66 442..11 704.78 14.85 7403.02
2006-07 3326.81 2870.68 486.30 745.24 14.08 7443.10
2007-08 3899.04 2572.05 616.02 791.40 14.332 78922.83
2008-09 4193.28 2596.04 702.25 111013.83 13.99 8519.38
2009-10 42055.85 2605.77 704.78 1015.15 14.46 8546.00
2010-11 5505.01 2961.47 922.42 1076.36 14.44 10479.70
2011-12 6436..27 3403.43 1029.60 1237.29 157.12 12263.71
2012-13 7323.64 3887.17 1117.36 244.92 80.83 12653.92
2013-14 8410.69 4270.29 1278.39 1421.02 201.72 15582.11 Source : Rural Electrification Board, Ministry of Power, Energy and Mineral Resources.

190
7.06 Sector Wise Consumption (MWH) of Rural Electricity, 2004-05 to 2012-13 (Unit in MKWH)
Year Sectors
Domestic Industrial Commer- cial
Irrigation Others Total
2004-05 2757540 2730118 361379 594615 13483 6457135
2005-06 3186617 3054663 442106 704782 14849 74030317
2006-07 3326805 2870676 486295 745244 14084 7437104
2007-08 3899044 2572046 616017 791403 14322 7892906
2008-09 4193275 2596038 702249 1013825 13989 8519376
2009-10 4205846 2605773 704776 1015154 14455 8546003
2010-11 5505008 2961472 922422 1076357 14436 10479695
2011-12 6436271 3403427 1029600 1237289 157124 12263711
2012-13 7323636 3887173 1117360 244921 80830 13753920 Note: MWH=Mega watt hours. Source: Rural Electrification Board, Ministry of Power, Energy and Mineral Resources.
7.07 Per Capita Electricity Generation and Consumption 2004-05 to 2012-13
Year Total generation
(GWh)
Total population (in million)
Total sale
(MKWh)
Per capita generation
(KWh)
Per capita consumption
(KWh) 2004-05 22,006.19 137.43 19,195.87 160.13 139..68
2005-06 23,703.01 139.49 20,954.27 169.93 150.22
2006-07 23739.24 141.23 21181.00 168.08 149.97
2007-08 252902.77 143.00 22622.03 176.87 158.20
2008-09 26603.95 144.79 23936.78 183.74 165.32
2009-10 29247.00 146.00 24860.00 200.32 170.27
2010-11 31355.00 148.00 26652.00 211.86 180.08
2011-12 35118.00 152.00 29974.00 231.65 197.72
2012-13 38229.00 153.60 32740.00 248.89 213.15
Note: 1. Per capita generation does not include REB’s IPP. 2. Per capita consumption is based on BPDB’s sales. Source: Bangladesh Power Development Board.

191
7.08 Natural Gas Reserves and Production in Bangladesh (Billion cubic feet) SL. No
Gas Fields Producing Wells
Total Reserve (Proven+ Probable
Reserve (Recoverable)
Production Dec’14
Cumulative Production as
of Dec-14)
Net Recoverable
Reserve A. PRODUCING
1. Bakhrabad 7 1701.0 1231.5 40.1 766.5 465.0 2. Habiganj 7 3684.0 2633.0 7.9 2088.4 544.6 3. Kailashtila 4 3610.0 2760.0 13.5 635.0 2125.0 4. Rashidpur 5 3650..0 2433.0 10.3 5545.7 1887.3 5. Sylhet 2 370.0 318.9 1.5 205.3 113.6 6. Titas 21 8148.9 6367.0 95.0 3894.0 2473.0 7. Narshingdi 2 369.0 276.8 5.1 15999.4 117.4 8. Meghna 1 122.1 69.9 1.9 51.5 18.4 9. Sangu 1 379.9 279.0 2.3 65.3 213.7
10. Saldanadi 4 1491.0 1184.0 46.4 896.1 287.9 11. Jalalabad 1 230.7 203.0 1.7 80.9 122.1 12. Beanibazar 3 553.0 381.0 7.1 116.6 264.4 13. Fenchuganj 6 1053.0 428.0 13.4 266.5 161.5 14. Maulavibazar 18 7427.0 5754.0 153.7 1854.4 3899.6 15. Bibiyana 4 1198.0 522.0 19.5 283.1 238.9 16. Bangura 2 653.8 317.7 1.3 9.7 308.0 17. Shahvbazpur 2 653.8 317.7 1.3 9.7 308.0 18. Semutang 1 62.2 35.1 0.7 7.8 27.3 19. Sundalpur 2 230.0 161.0 7.4 24.5 136.5 20 Srikail 100.0 70.0 - 0.0 70.0
Not in Production
21 Begumganj 100.0 70.0 - 0.0 70.0 22 Kutubdia 65.0 45.5 0.0 45.5 45.5 Production
Suspended
23 Chattak 1039.0 474.0 0 26.5 447.5 24 Kamta 71.8 50.3 0 21.1 29.2 25 Feni 185.2 125.0 0.00 62.4 62.60 Total 93 38019.2 27121.1 430.5 12559.1 14562.0
Source : Petrobangla. Ministry of Power, Energy and Mineral Resources

192
7.09 Main Natural Gas Transmission Lines, 2008-09 to 2013-14 (Unit in Km) Pipe line Year
2008-09 2009-10 2010-11
2011-12
2012-13
2013-14
1.Titas Gas Trans-mission& Distri. ltd a. Transport line - - - - - - b.Distribution line 33.45 - - 22.68 1.5 6.95 c.Feeder main & service line 504.49 31.25 107.33 26.24 33.27 239.67 d.Others 68.3 1.66 8.76 2.77 11.07 5.66 2. Bakhrabad gas system ltd
a.Transport line - - - - - - b.Distribution line - - - - - - c.Feeder main & service line 155.12 11.07 14.27 0.11 - 00 d.Others - - - - - - 3. Karnafully Gas Distribution
Company Ltd
a.Transport line - - - - - b.Distribution line - - - - - c.Feeder main & service line - 34.65 13.81 13.04 59.35 d.Others - - - - - 4. Jalalabad Gas Trans.&Dist.Sys.Ltd.
a.Transport line - - 33.19 0 8.49 0.14 b.Distribution line 40.12 0.37 24.05 5.53 44.3 7.73 c.Feeder main & service line 45.4 2.89 58.32 70.74 73.6 83.80 d.Others 44.02 3.42 45.00 48.83 46.88 45.42 5. GTCL
a.Transport Line - - - - 40.5 - b.Distribution line - - - - - - c.Feeder main & service line - - - - - - d.Others - - - 151 - 0.00 6.PaschimanchalCo.ltd.
a.Transport line - - - - 1.82 - b.Distribution line - - 16.78 270.15 6.28 0.0 c.Feeder main & service line 90.7 04.21 1.55 - 1.33 141.95 d.Others - - 0.77 - 0.11 0.16 7.Sundarban Gas Co. ltd. -
a.Transport line - - 1 - - - b.Distribution line - - - - - - c.Feeder main & service line - - - - - - d.Others - - - - - - Total:
a.Transport line - - 33.19 - 50.81 0.14 b.Distribution line 73.57 0.37 24.05 298.36 52.08 14.68 c.Feeder main & service line 795.71 49.36 216.12 110.9 121.24 524.72 d.Others 112.32 5.08 54.53 202.6 58.06 51.24 Source: Petrobangla. Ministry of Power, Energy and Mineral Resources.

193
7.10 Category-wise Number of New Gas Connection 2008-09 to 2013-14 Category Year 2008-09 2010-11 2011-12 2012-13 2013-14 Power 1 01 01 02 1 Fertilizer 0 0 0 0 0 Industry 132 5 12 20 20 Commercial 58 83 126 102 115 Tea garden 1 0 02 0 0 Brick field 0 0 0 0 0 CNG station 66 11 05 2 1 Domestic 136197 26539 13057 19418 393398 Captive power 120 13 12 13 22
Total: 139105 26652 13074 19577 393557 Source: Petrobangla. Ministry of Power, Energy and Mineral Resources.
7.11 Quantity and Value of Production of Natural Gas by Gas Fields
2012-13 to 2013-14 (Qty in million cubic metre and value in '000' Taka)
Name of 2012-13 2013-14
gas fields Quantity Value Quantity Value
Titas 4686.816 23246607.4 5057.158 - Habiganj` 2351.977 11665805.9 2307.790 - Bakhrabad 318.161 1578078.56 398.829 - Feni 0 0 293.290 - Sylhet 96.903 480638.88 98.885 Kailastila 889.893 4413869.28 90.487 - Narshingdi 309.634 1535784.64 829.421 - Rashidpur 485.538 2408268.48 483.081 -
Meghna 104.02 515939.2 153.578 - Saldanadi 167.164 829133.44 396.673 - Beani Bazar 121.004 600179.84 20.983 - Sangu 165.23 819540.8 74.940 - Jalalabad 2363.746 11724180.2 75.943 - Fenchuganj 396.899 1968619.04 413.732 - Moulovi Bazar 887.384 4401424.64 -
Sahbajpur 8.603 42670.88 - Samutang 12.171 60368.16 2487.097 - Sundalpur 17.576 87176.96 766.650 - Srikail 43.782 217158.72 8107.408 - Bibiyana 8090.897 40130849.1 1062.007 - Bangura 898.69 4457502.4 8.390 - Source: Petrobangla. Ministry of Power, Energy and Mineral Resources.

194
7.12 ERL Production During Last Five Years 2010-11 to 2013-14 (in mt)
Product 2010-11 2011-12 2012-13 2013-14 LPG 13015 12788 14112 11214 Naphtha 131399 111267 137090 131574 SBP 759 841 715 401 MS 18267 32813 54802 54791 HOBC 33728 30402 15283 4301 MTT 9100 7389 10251 7035 JETA-1 2368 3907 - 1336 SKO 266991 226093 286004 231175 HSD 305584 307690 312104 359623 JBO 18585 25224 24571 23263 LDO 2184 2206 2099 2156 LDO(RF) - - - - FO(RF) - - - - FOHS - - - - RCO 353093 314797 373014 - MS/HOBC - - - - DSN - - - - HG - - 511 - BITUMEN 55041 65010 - 56923 FO 131625 90822 70706 301680 Total: Semi-finished - - - - Gas+loss 22746 26650 18870 26335 Grand Total: 1340698 1195032 1320217 1211857 Note: ERL=. Eastern refinery ltd Source: Eastern refinery ltd, Bangladesh Petroleum Corporation, Ministry of Power, Energy and Mineral Resources.

195
7.13 Received of Petroleum Product from Diferent Gas Fiel & Fractonal Plant During (2013-14)
Government Qnty in MT
Name of Gas field MS Octane HSD SKO Conden- sate
Total
Bakhrabad Gas field 4370 - 11042 - - 15412 Bakhrabad gas distribution company limited
- - - - 433 433
Brahmanbaria Gas field 126 - 8753 - - 25379 Titas Gas Field Limited 4474 - 20905 - - 25379 Rashidpur Condensate Fractionation Plant
48809 4782 27201 22315 - 103107
Kailash Tila Plant 4643 - 1324 - - 6267 Haripur Gas field 3812 - 1799 617 - 6228 Kailash Tila Field 4902 - 4872 - - 9778 Rashidpur Gas Field - - - - 1733 1733 Rupantarita Gas Company Limited
18794 - 4877 - - 23671
Pashchimanchal Gas company Limited
- - 5 - - 5
Titas Gas field Limited - - - - - - Gas Transmission Company Ltd.
- - - - 1144 1144
Titas Gas Transmission and Distribution
- - - - 6591 6591
Jalalabad Gas Transmission & Dstribution
- - - - 16 16
Karnaphuli Gas Distribution company Limited
- - - - 26 26
Total 89930 4782 81078 22932 9943 133651 NonGovernment Qnty in MT
Name of Refinery MS Octane HSD SKO Conden- sate
Total
Super Refined Private Limited 10236 - 1510 - - 11960 Chowdhury Refined Limited - - 178 - - 178 Aqua Mineral Turpentine Solvents Plant Ltd.
7275 - 1963 - - 9238
Super Petrochemical (pvt.)Ltd. - 25147 - - - 25147 Petromax Refinery Ltd. 9287 13849 12892 1672 - 37700 PHP Petro Refinery Limited 1705 - - - - 1705 Synthetic Raging Products Privte Limited
455 - - - - 455
Total 28958 38996 16543 1672 214 86383
Qnty in MT
Summary MS Octane HSD SKO Conden- sate
Total
Government 89930 89930 4782 81078 22932 9943 133651 Nongovernment 28958 38996 16543 1672 214 86383 Total 118888 43778 97621 24604 10157 220034 Source:Bangladesh Petroleum Corporation

196
7.14 Oil Import Bill (Last Five Years) Particular 2009-10 2010-
2011 2011-2012
2012-13 2013-2014
Cost of Crude Oil 449141 7039.00 7053.51 8536.70 7957.29
Cost of Refind Oil 1202418 21403.69 30930.31 2631636 28630.24 Cost of Lube Base Oil 52.03 43.75 53.11 38.56 0.00 Total Import Cost 1657.62 28484.44 38036.93 34891.62 36587.53 Source: Bangladesh Petroleum Corporation, Ministry of Power, Energy and Mineral Resources.
7.15 Export Performance Last Five Years USS$ in Million(‘000 MT) Year 2009-10 2010-11 2011-12 2012-13 2013-14 Product Qty $ Qty $ Qty $ Qty $ Qty $ Naptha 135527 92.543 151733 121.23 95024 91.48 133901 121.43 93086 85.62 F.O. (H.S.)
142245 62.474 0 0 0 0 0 0 0 0
Total 277772 155.017 151733 121.23 95024 91.48 133901 121.43 93086 85.62 Source: Bangladesh Petroleum Corporation, Ministry of Power, Energy and Mineral Resources.

197
7.16 Sale of Petroleum Products Last Four Years (Qnty. MT)
Product 2010-11 2011-12 2012-13 2013-14
JET A-1 335732 311890 318423 323327 HOBC 97264 107150 110850 117452 MS 141491 158707 109710 178674 SKO 357209 358436 314876 289871 HSD 3239279 3240349 2964604 3242554 LDO 460 419 1092 1064 JBO 23245 25761 25841 23538 FO 544617 883735 1076423 1202505 LUBE+GRS 17954 17521 15900 17823 SBP 695 719 800 368 MTT 7372 7900 9875 7821 LPG 21294 20729 19671 17529 BITUMEN 41412 80330 58396 62440 TOTAL 4868024 5213646 5086469 5484966 Source: Bangladesh Petroleum Corporation
7.17 Sector Wise Use of Petroleum Products Last Five Years (Qnty. MT)
Product 2010-11 2011-12 2012-13 2013-14
A. Agriculture 1004356 1091989 984936 992736 B. Industry 293948 231071 188992 138750 C. Power 931877 1171718 1261370 1556782 D. Transport (Road, Rail, rive r& air)
2183790 2294160 2288450 2457790
E. Household & others 45653 424708 362721 338908 Total 4868024 5213646 5086469 5484966 Source: Bangladesh Petroleum Corporation

198
7.18 Imports of Coal and Coke from Some Selected Countries (Thousand M T)
Source Year
2000-01 2001-02 2002-03 2003-04 2004-05 2005-06 2006-07
India 106 594 135 212 0.4 0.26 0.10 China 14 16 11 - - - - Indonesia 36 10 64 - - - - Japan - - - - - - - Bhutan - - - - - - - U.K. 1 - - - - - 0.01 Chile - - - - - - - Panama - - - - - - - Other countries - - - 1 - 0.07 0.01
Total 157 620 210 213 0.4 0.33 0.12 Source: Bangladesh Bank , Compiled by BBS.
7.19 Consumption of Commercial Energy by Major Sources in Trillion BTU (Trillion BTU)
Source Year
2000-01 2001-02 2002-03 2003-04 2004-05
Electricity 40 43 47 52 56 Gas 349 365 401 428 456 Petroleum 356 372 408 436 465 Coal (not actual consumption) 3 13 5 5 2
Total: 748 793 861 921 979 Notes: Includes Intermediate Consumption of Energy Source: Ministry of Power, Energy & Mineral Resources.
7.20 Consumption of Commercial Energy by Major Sources (Thousand ton of coal equivalent) Source Year
2000-01 2001-02 2002-03 2003-04 2004-05
Electricity 1441 1557 1699 1899 2024 Gas 12660 13235 14544 15519 16563 Petroleum 12905 13492 14826 15820 16884 Coal (not actual consumption) 120 486 175 199 57
Total: 27126 28770 31244 33437 35527 Notes: Includes intermediate consumption of energy Source: Ministry of Power, Energy & Mineral Resources.

199
7.21 Sector wise Final Consumption of Commercial Energy in Trillion BTU
(Trillion BTU)
Source Year 2000-01 2001-02 2002-03 2003-04 2004-05
Domestic/residential 116.03 128.39 150.69 160.47 163.43
Industrial 91.88 95.16 97.04 90.57 112.87
Commerce/service 6.90 7.24 7.97 8.71 13.29
Transport 181.49 198.66 212.93 218.29 239.84
Agriculture & others 64.70 67.26 95.04 114.65 111.04
Non-energy use 285.03 286.68 305.71 328.31 338.53
Total 746.03 783.39 869.38 921.00 979.00 Notes: i) Commercial energy includes natural gas, petroleum products, coal & electricity ii) Final consumption excludes intermediate consumption iii) Non-energy use indicates use of natural gas as raw materials in fertilizer factories. Source: Ministry of Power, Energy & Mineral Resources. .
7.22 Sector wise Final Consumption of Commercial Energy (Thousand ton of coal equivalent)
Source Year
2000-01 2001-02 2002-03 2003-04
Domestic/residential 4203 4655 5469 5826
Industrial 3338 3459 3523 3286
Commercial/service 249 262 2 89 317
Transport 6579 7205 7738 7921
Agriculture and others 2347 2428 3437 4160
Non-energy 10338 10396 11089 11906
Total final consumption 27054 28405 31545 33416
Notes: i) One metric ton of coal is equivalent of 27.55 x 10 6 BTU Source: Ministry of Power, Energy & Mineral Resources. Compiled by BBS.

7.23 Energy Supplied by Traditional Fuels in the Unorganized Sectors 1994-95 to 2004-05 (Million M.Ton)
Year Cow dung Jute stick
Rice straw
Rice hulls
Biogases Firewood Twigs leaves
Other wastes
Total
1994-95 6.7 1.0 18.14 6.2 2.3 3.5 2.7 2.7 43.24
1995-96 7.8 1.5 18.75 6.2 1.3 3.6 2.7 2.6 44.45
1996-97 8.0 1.8 18.95 6.3 1.4 3.9 2.8 2.6 45.75
1997-98 7.7 2.1 18.18 6.3 1.4 5.0 2.9 2.6 46.18
1998-99 7.9 1.9 18.12 6.3 1.2 5.6 3.0 2.5 46.52
1999-00 8.1 2.1 18.04 6.4 1.2 6.0 3.0 2.7 47.54
2000-01 8.2 2.2 18.75 6.4 1.3 6.2 3.1 2.8 48.95
2001-02 8.2 2.3 18.49 6.5 1.4 6.4 3.1 2.9 49.29
2002-03 8.2 2.2 18.60 6.6 1.4 6.6 3.2 3.0 49.80
2003-04 8.3 2.1 18.60 6.5 1.5 7.2 3.3 3.1 50.50
2004-05 8.4 2.0 18.5 6.5 1.5 7.8 3.3 3.2 51.20 Source : Compiled by BBS.
200

201
Chapter VIII
TRANSPORT AND COMMUNICATION

202
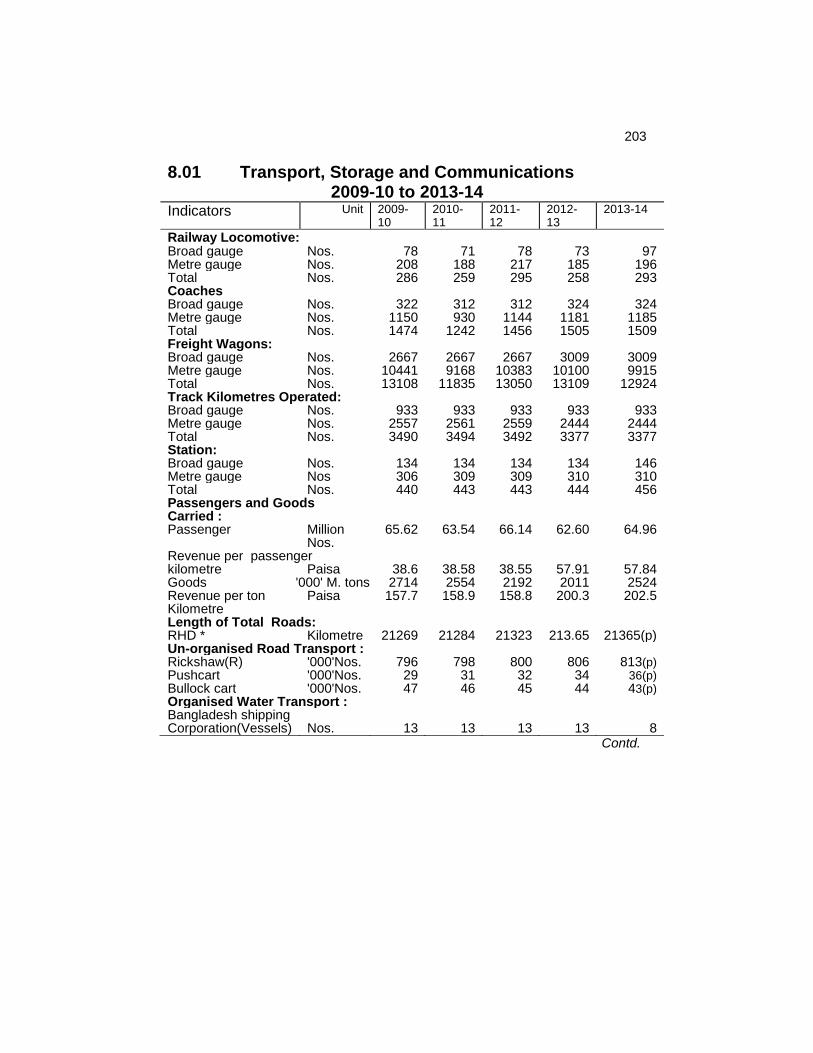
203
8.01 Transport, Storage and Communications
2009-10 to 2013-14 Indicators Unit 2009-
10 2010-11
2011-12
2012-13
2013-14
Railway Locomotive: Broad gauge Nos. 78 71 78 73 97 Metre gauge Nos. 208 188 217 185 196 Total Nos. 286 259 295 258 293 Coaches Broad gauge Nos. 322 312 312 324 324 Metre gauge Nos. 1150 930 1144 1181 1185 Total Nos. 1474 1242 1456 1505 1509 Freight Wagons: Broad gauge Nos. 2667 2667 2667 3009 3009 Metre gauge Nos. 10441 9168 10383 10100 9915 Total Nos. 13108 11835 13050 13109 12924 Track Kilometres Operated: Broad gauge Nos. 933 933 933 933 933 Metre gauge Nos. 2557 2561 2559 2444 2444 Total Nos. 3490 3494 3492 3377 3377 Station: Broad gauge Nos. 134 134 134 134 146 Metre gauge Nos 306 309 309 310 310 Total Nos. 440 443 443 444 456 Passengers and Goods Carried :
Passenger Million Nos.
65.62 63.54 66.14 62.60 64.96
Revenue per passenger kilometre Paisa 38.6 38.58 38.55 57.91 57.84 Goods '000' M. tons 2714 2554 2192 2011 2524 Revenue per ton Kilometre
Paisa 157.7 158.9 158.8 200.3 202.5
Length of Total Roads: RHD * Kilometre 21269 21284 21323 213.65 21365(p) Un-organised Road Transport : Rickshaw(R) '000'Nos. 796 798 800 806 813(p) Pushcart '000'Nos. 29 31 32 34 36(p) Bullock cart '000'Nos. 47 46 45 44 43(p) Organised Water Transport : Bangladesh shipping Corporation(Vessels) Nos. 13 13 13 13 8 Contd.

204
8.01 Transport, Storage and Communications 2009-10 to 2013-14 Indicators Unit 2009
-10 2010-
11 2011-12 2012-13 2013-
14 Bangladesh inland Water transport Corporation(Vessels) Nos. 191 205 196 185 184 Private Vessels: Cargo Nos. 2088 2217 2430 2048 2213 Passenger Nos. 2162 2188 2209 984 1061 Total Nos. 4250 4405 4639 3032 3274 Un-organised Water Transport: Country boat: Motorise '000' Nos 73 74 74 75 76 Cargo '000'Nos. 68 67 66 64 63 Passenger '000'Nos. 127 124 122 120 117 Total '000'Nos. 268 265 262 259 256 Air Transport: (Bangladesh Biman) F-28 Nos. 02 02 02 0 0 Boing Nos. 02 03 05 4 9 Air Bus Nos. 03 03 03 2 2 Dc-10 Nos. 04 04 03 2 2 Total Nos. 11 12 13 8 13 Passengers carried '000'Nos. 1430 1384 1773 1573 1571 Goods carried ‘000’ MT 29 28 24 33 33 Communication: Post offices Nos. 9886 9886 9886 9886 9886 Telephone sets '000'Nos. 972 990 936 903 846 Television licence issued '000'Nos. 03 02 .485 .671 777 Name of operatiors & Subscribers numbers Mobile Operators Grameen Phone Ltd (GP) '000' Nos 33825 39293 43967 49233 Bangla link ltd '000'Nos. 20203 25490 27076 29751 Robi ltd '000'Nos. 14489 19211 22897 24018 Airtle Ltd '000'Nos. 5046 6734 7821 8540 Citycell ltd '000' Nos 1731 1699 1383 1416 Teletalk Ltd '000'Nos. 1142 1358 1902 3595 Total '000'Nos. 76436 93785 105046 116553 PSTN (Land phone '000'Nos. 991 - - 840 BTCL '000' Nos - - - 227 Ranks telecom Ltd '000'Nos. - - - 4 World tel '000'Nos. 5 - - 6 Internet '000'Nos. 996 1142 1324 1077 Mobail Internet '000' Nos 21830 25016 33905 36412 Wimax '000'Nos. 146 401 505 281 Isp+pstn '000'Nos. 206 1211 1222 1230 Total= '000'Nos. 22182 26628 35632 37923
Contd.

205
8.01 Transport, Storage and Communications 2009-10 to 2013-14 Indicators Unit 2009-10 2010-11 2011-12 2012-13 2013-14
StorageCapacity Food '000'MT 1473 1672 1645 1685 1845 BADC(fertilizer & seed) '000'MT 594 689 576 587 590 Jute(BJC) '000'Sft. 515 969 862 903 na Cold storage '000'MT 3500 4000 4000 4600 4600 Chittagong Port Authority: Coverd Space & silo Godowns
'000'MT 246 246 246 246 246
Open Space ‘000’Sft 17 17 17 17 17 Container Yard ‘000’ Teus 31022 31022 31022 31022 31022 Mongla Port Authority: Transit sheds '000' Sft. 211 211 211 211 211 Open Space ‘000’Sft 3229 3229 3229 3229 3229 Container Yard ‘000’ Teus 2180 2180 2180 2180 2180 Tourism: Tourist arrivals '000'Nos. 267 303 155 125 148 Total earnings Million (Taka) 5762 5563 6202 8254 9496 Note: (-) Indicates data not availble. Private vessels, R&HD, Tourism yearly data.(a)earning data ( Jan-14 from Oct-14), TEUS= Twenty foot equivelent Unit Source : Bangladesh Railway. Bangladesh Shipping Corporation. Roads and Highway Deptt. Post office, , BIWTC, BIWTA. Bangladesh Biman. Chittagong and Mongla Port. B.T.C.L, B.A. D.C, Food deptt : Jute and Cold Storage. Parzaton Corporation, S.B (special branch of Bangladesh police), BTRC (Bangladesh Telecommunication Regulatory Commission)
8.02 Length of (RHD) Road Network as per Road Type, 2001 to 2014
(Kilometre) Survey Year National Regional Feeder Type Total
2001 3086 1751 15962 20799 2002 3086 1751 15962 20799 2003 3086 1751 15962 20799 2004 3086 1751 15962 20799 2005 3529 4127 13126 20782 2006 3529 4127 13126 20782 2007 3482 4128 13255 20865 2008 3478 4004 13513 20995 2009 3492 4253 13275 21020 2010 3538 4276 13455 21269 2011 3538 4276 13470 21284 2012 3538 4276 13509 21323 2013 3580 4276 13509 21365 2014 3580 4276 13509 21365(P) Note : Width of different roads by category: national - 7.32 metre. Regional - 5.49 metre, Feeder type A-3.66-metre. Source : Roads & Highways Division.

206
8.03 Roads Maintained by Local Government Institutions, 2010-11 to 2013-14 Type of Number Total Surface type-wise break up of total length (Km) Total length (Km) Road of road length
(Km) Earthen HBB WBM BC Paved Unpaved
2010-11 Upazila road 4495 37822 8073 2480 474 26795 29749 8073 Union road 7974 44751 22705 4298 504 17244 22045 22706 Village road 94545 215774 187053 10438 795 17489 28721 187053 Total 107014 298347 217832 17215 1773 61528 80515 217332
2011-12 Upazila road 4499 37790 7447 1775 652 27917 30343 7447 Union road 7983 44748 21676 3399 989 18685 23073 21676 Village road 96620 218822 187666 9559 1482 20115 31156 187666 Total 109102 301360 216789 14732 3123 66717 84572 216789
2012-13 Upazila road 4502 37812 7432 1755 690 27935 30380 7432 Union road 7994 44840 21680 3367 1024 18768 23160 21680 Village road 97000 219490 188031 3604 1536 20320 31450 188031 Total 109496 302142 217143 14726 3250 67022 84999 217143
2013-14 Upazila road 4510 37266 6572 2279 575 27840 30694 6572 Union road 8014 44017 19858 4418 638 19103 24159 19858 Village road 100457 221997 186051 12276 1340 22330 35946 186051 Total 112981 303280 212481 18973 2553 69273 90799 212481 Note: HBB-Haring bon bond. WBM-water bound macadam. (-) indicated data not available. BC-bituminous carpeting. Paved=pacca road = (HBB+WBM+BC) Source: LGED

207
8.04 Major Road Links between Dhaka to Other Districts, 2013
Sl. No.
Name of District Distance from Dhaka
(in kilometre)
No. of ferry Crossing
First ferry time (Hrs)
Last ferry time (Hrs)
1. Narayangonj 17 - - - 2. Munshigonj 27 - - - 3. Manikgonj 63 - - - 4. Gazipur 37 - - - 5. Norsingdi 51 - - - 6. Mymensingh 122 - - - 7. Kishoregonj 117 - - - 8. Netrokona 158 - - - 9. Tangail 92 - - - 10. Jamalpur 179 - - - 11. Sherpur 188 - - - 12. Faridpur 101 1 0600 2400 13. Madaripur 90 1 0600 2400 14. Gopalgonj 127 1 0600 2400 15. Rajbari 118 1 0600 2400 16. Shariatpur 101 1 0800 1930 17. Chittagong 242 - - - 18. Cox's Bazar 391 - - - 19. Noakhali 158 - - - 20. Laxmipur 137 21. Feni 149 - - - 22. Comilla 96 - - - 23. Chandpur 115 - - - 24. Brahmanbaria 109 - - - 25. Sylhet 241 - - - 26. Sunamgonj 296 - - - 27. Moulvi Bazar 203 - - - 28. Hobigonj 163 - - - 29. Rangamati 293 - - - 30. Khagrachhari 259 - - - 31. Bandarban 316 - - - 32. Rajshahi 256 - - - 33. Naogaon 247 - - - 34. Nawabgonj 302 - - - 35. Natore 210 - - -
Contd.

208
8.04 Major Road Links between Dhaka to Other Districts, 2013
Sl. No.
Name of District Distance from
Dhaka (in kilometer)
No. of ferry crossing
First ferry time (Hrs)
Last ferry time (Hrs)
36. Pabna 216 - - - 37. Sirajgonj 134 - - - 38. Bogra 197 - - - 39. Joypurhat 249 - - - 40. Rangpur 304 - - - 41. Gaibandah 268 - - - 42. Kurigram 348 - - - 43. Lalmonirhat 343 - - - 44. Dinajpur 338 - - - 45. Nilphamari 359 - - - 46. Panchagarh 443 - - - 47. Thakurgaon 407 - - - 48. Khulna 180 1 0600 2400 49. Bagerhat 178 1 0600 2400 50. Satkhira 240 1 0600 2400 51. Jessore 164 1 0600 2400 52. Magura 150 1 0600 2400 53. Narail 130 1 0600 2400 54. Kushtia 183 1 0600 2400 55. Jhenaidah 178 1 0600 2400 56. Chuadanga 215 1 0600 2400 57. Meherpur 240 1 0600 2400 58. Barisal 169 1 0600 1800 59. Jhalakati 182 1 0600 1800 60. Pirojpur 185 1 0600 1800 61. Bhola 205 3 0600 1800 62. Patuakhali 204 3 0600 1800 63. Barguna 247 3 0600 1800 Source: (i) Roads & highways Department. (ii) Bangladesh Inland Water Transport Corporation. Position as on December-2013

209
8.05 Bangladesh Railway District Wise Route Kilometres-2013 Sl. No. Name of District Station No Kilometres
1. Narayangonj 2 9.50 2 Gazipur 11 24.40 3 Norsingdi 12 38.97 4 Mymensingh 23 128.33 5 Kishoregonj 11 73.75 6 Netrokona 13 65.00 7 Dhaka 7 30.00 8 Tangail 7 95.20 9 Jamalpur 18 109.55 10 Faridpur 11 75.34 11 Gopalgonj 3 24.13 12 Rajbari 15 8872 13 Chittagong 45 178.45 14 Noakhali 8 29.40 15 Feni 5 51.73 16 Comilla 16 106.40 17 Chandpur 11 40.66 18 Brahmanbaria 11 74.64 19 Sylhet 8 50.64 20 Sunamgonj 3 13.90 21 Moulvi Bazar 14 125.33 22 Hobigonj 21 72.92 23 Rajshahi 11 63.00 24 Naogaon 5 27.00 25 Nawabgonj 7 64.00 26 Natore 11 37.00 27 Pabna 11 59.00 28 Bogra 12 69.75 29 Joypurhat 7 54.00 30 Rangpur 9 68.33 31 Gaibandah 14 85.65 32 Kurigram 8 42.56 33 Lalmonirhat 15 113.15 34 Dinajpur 12 90.96 35 Nilphamari 9 61.79 36 Panchagarh 3 21.18 37 Thakurgaon 6 43.75 38 Khulna 6 23.24 39 Bagerhat 10 40.53 40 Jessore 10 55.92 41 Kushtia 10 42.00 42 Chuadanga 5 47.40 Total 444 2877.10 Source: (i) Bangladesh Railway, 2013.

210
8.06 Number of Registered Motor Vehicles in Bangladesh (Number)
Types of vehicles 2009 2010 2011 2012 2013 2014
Ambulance 2506 2793 3012 3193 344436 3774 Auto Rickshaw 108436 126763 147186 170731 186428 206325 Auto Tempo 13977 14266 14441 15067 15462 15962 Bus 26016 27778 29539 30978 32085 33573 Cargo Van 2911 3522 4011 4293 4980 5588 Covered Van 3760 5658 8012 9433 11704 14573 Delivery Van 15564 17063 18067 18841 19735 20911 Human Hauler 5846 6520 7672 8387 8772 8997 Jeep 301162 32286 34420 35989 37303 39173 Microbus 59404 66379 70430 73474 76011 80324 Minibus 24749 256444 25920 26169 26317 26573 Motor Cycle 650147 759257 873873 975461 1061269 1151954 Pick Up 23273 32240 42700 503255 56878 66432 Privat Car 1966870 219830 232780 242004 252476 267175 Special Purpose Vehicle
5900 6371 6767 666993 7220 7392
Tanker 2379 277706 3023 3218 3444 3806 Taxicab 44361 44380 44455 44627 44678 45052 Tractor 16855 20600 25800 29294 31179 322701 Truck 73336 82871 90198 94533 99662 107798 Other 934 1317 1324 1325 2405 4000 Total 1307386 1498244 1683630 1844335 1981444 2142083 Source: Bangladesh Road Transport Authority (BRTA) Note: New forma data.
8.07 Region wise Number of Telephones, 2009-10 to 2013-14 Region name 2009-10 2010-11 2011-12 2012-13 2013-14
Dhaka 544027 571465 544798 537000 511000 Chittagong 166399 164093 146679 134000 122000 Khulna 115065 86593 81899 76000 71000 Rajshahi 43521 43803 43176 42000 39000 Rangpur 55805 55917 54857 52000 51000 Sylhet 46929 46909 43264 42000 34000 Barisal - 21714 21087 20000 18000
Totals 971746 990494 935760 903000 846000 Note: (-) Indicates data not available, data in number of telephones are rest pled here by division Source: BTCL.

211
8.08 Bangladesh Betar Stations and Frequencies Used, 2013 Location (Station)
Frequency (in kilohertz)
Power (kw)
Medium Wave
Dhaka 693 1000
Dhaka 630 100
Dhaka 1170 20
Chittagong 873 100
Rajshahi 1080 10
Bogra 846 100
Sylhet 963 20
Nouapara, Jessore 558 100
Rangpur 1053 10
Rangamati 1161 10
Comilla 1413 10
Thakurgaon 999 10
Bandarban 1431 10
Barisal 1287 10
Cox’s Bazar 1314 10
Short Wave
Dhaka 4750 100
Dhaka 7250 250
F.M 89
Dhaka 98 10
Dhaka 100 5
Dhaka 102 5
Dhaka 104 3
Dhaka 103 10
Dhaka 106 10
Contd.

212
8.08 Bangladesh Betar Stations and Frequencies Used, 2013 Location (Station)
Frequency (in kilohertz)
Power (kw)
Chittagong 89 5
Chittagong 90 10
Chittagong 105 10
Rajshahi 89 5
Rajshahi 90 2
Rajshahi 104 10
Rajshahi 105 5
Rajshahi 105 5
Chittagong 105 1
Sylhet 89 10
Sylhet 90 5
Sylhet 105 1
Khulna 89 10
Khulna 90 5
Khulna 102 1
Rangpur 89 10
Rangpur 90 5
Rangpur 105 1
Commilla 101 2
Commilla 104 10
Thakurgaon 92 5
Barisal 105 10
Bandarban 104 5
Rangamati 103 5
Nouapara 101 10
Coxs Bazar 101 10 Note: Frequency changeable , position as on December, 2013 Source : Bangladesh Beta.

213
8.09 Bangladesh Television Stations and Frequencies Used, 2013 Centre Channel Power (in KW) Frequency(in megahertz)
Video Audio
Chittagong 5 10 175 181 Dhaka 9 10 203 209 Natore 8 10 196 202 Rangpur 6 10 182 188 Khulna 11 10 217 223 Mymensingh 12 10 224 230 Sylhet 7 10 189 195 Noakhali 12 10 224 230 Cox's Bazar (Ukhia) 10 10 210 216 Satkhira 7 10 189 195 Brahmanbaria 5 10 175 181 Patuakhali 7 10 189 195 Jhenaidah 5 10 175 181 Thakurgaon 10 10 210 216 Rajshahi 12 10 224 230 Rangamati 8 10 196 202 Note: Position as on December, 2013 Source : Bangladesh Television
8.10 Postal Rates for Selected Countries (Air mail), 2013 (Taka) To country Letter for first 20 grams EMS(Express Mail Service) India 19.00 602 Pakistan 19.00 737 Srilanka 23.00 859 Bhutan 19.00 - Maldives 23.00 921 Nepal 19.00 614 Australia 32.00 1015 Japan 26.00 617 China 26.00 617 Thailand 26.00 614 Burma 26.00 - Singapore 26.00 493 Indonesia 26.00 405 Abudhabi 26.00 861 Saudi Arabia 26.00 740 Kuwait 26.00 862 Egypt 37.00 1047 Libya 37.00 - Nigeria 37.00 - Russia 37.00 1227 Germany 37.00 1233 Turkey 37.00 407 France 37.00 866 U.K. 37.00 989 U.S.A. 46.00 603 Canada 46.00 998 Note: Post card & aerogramme service closed. Position as on december, 2013 Source : Bangladesh Post Office.

214
8.11 Dredging Activities by IWTA and BWDB 2011-12 To 2013-14 2011-12 2012-13 2013-14
Dredging activities IWTA BWDB IWTA BWDB IWTA BWDB
Number of dredgers 10 28 10 28 18 28
Total 240.40 68.53 355.37 79.25 350.48 83.23
(a) Public 117.26 62.04 111.88 74.27 113.30 80.58
(b) Private 123.14 6.49 243.49 4.98 237..18 2.65
Total Cost (Million
Tk.)
922.03 335.65 1415.22 334.88 1271.95 471.08
Per cft Cost (Taka) 3.84 4.90 3.98 4.23 3.63 5.66
Note : The ports of chittagong and mongla having no dredger . Dredgers are hired from IWTA of
BWDB `in time of needs. Source : IWTA & BWDB
8.12 Number of Hajis to Makkah From Bangladesh 2002 to 2014 Year Ballottee Non-Ballottee G.Total*
Male Female Total Male Female Total 2002 2972 543 3515 24239 11118 35357 38872 2003 6378 1567 7945 22336 10739 33075 41020 2004 4762 1027 5789 22987 10866 33853 39642 2005 3187 630 3817 30231 10077 40308 44125 2006 2180 450 2630 34907 14960 49867 52497 2007 4443 1129 5572 27259 12970 40229 45801 2008 6100 1505 7605 27957 13201 41158 48763 2009 6389 1641 8030 35133 15057 50190 58220 2010 5404 1323 6727 59007 25288 84295 91022 2011 2897 909 3806 71674 30583 102257 106063 2012 2384 596 2980 74676 32004 106680 109660 2013 1200 399 1599 61313 26277 87590 89189 2014 565 941 1506 31149 66266 97415 98921
*Bangladeshis living abroad who performed hajj are not included in here. Source : Hajj Office, Ministry of Religious Affairs.
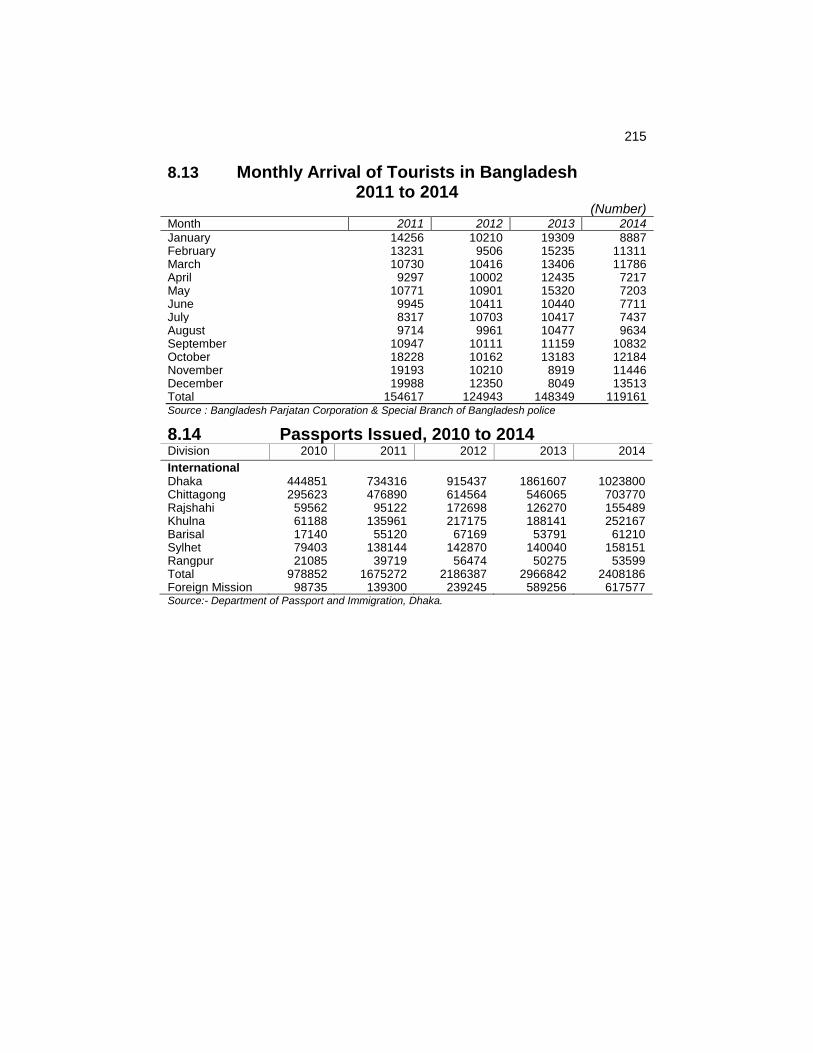
215
8.13 Monthly Arrival of Tourists in Bangladesh 2011 to 2014
(Number) Month 2011 2012 2013 2014
January 14256 10210 19309 8887 February 13231 9506 15235 11311 March 10730 10416 13406 11786 April 9297 10002 12435 7217 May 10771 10901 15320 7203 June 9945 10411 10440 7711 July 8317 10703 10417 7437 August 9714 9961 10477 9634 September 10947 10111 11159 10832 October 18228 10162 13183 12184 November 19193 10210 8919 11446 December 19988 12350 8049 13513 Total 154617 124943 148349 119161 Source : Bangladesh Parjatan Corporation & Special Branch of Bangladesh police
8.14 Passports Issued, 2010 to 2014 Division 2010 2011 2012 2013 2014
International
Dhaka 444851 734316 915437 1861607 1023800 Chittagong 295623 476890 614564 546065 703770 Rajshahi 59562 95122 172698 126270 155489 Khulna 61188 135961 217175 188141 252167 Barisal 17140 55120 67169 53791 61210 Sylhet 79403 138144 142870 140040 158151 Rangpur 21085 39719 56474 50275 53599 Total 978852 1675272 2186387 2966842 2408186 Foreign Mission 98735 139300 239245 589256 617577 Source:- Department of Passport and Immigration, Dhaka.

217
Chapter IX
FOREIGN TRADE

218

219
9.01 Indicators of the Foreign Trade Sector 2009-10 to 2012-13(p)
(Million Taka)
2009-10 2010-11 2011-12 2012-13(p)
Total Imports (CIF) 1794324 2659405 2942810 3144291
Per capita Import (Tk.) 12281 17765 19412 20470
% of GDP 26 33 32 30
Total export (FOB) 1134589 1629733 1762288 2268607
Per capita exports (Tk.) 7766 10887 11625 14769
% of GDP 16 20.46 19.19 21.85
Balance of trade (-)659735 (-)1029672 (-)1180522 -875684
Import price indices 718 (Base 1988-89=100)
174.99 196.45 208.16 873.15
Export price indices
(Base 1988-89=100) 149.99 165.56 171.55 -
Terms of trade 89.00 Govt. Imports as % of total imports .74 .31 .52 -
Private Imports as % of total imports 92 93 90 -
Private Exports as % of total exports 100 99 99 -
Consumer goods as % of total imports 10 10 10 9
Material for consumer goods as % of total import 75 73 76 77
Capital goods as % of total imports 14 16 13 12
Materials for capital goods as % of total imports 2 1 1 1 Source: National Accounting Wing, BBS. Note : ‘p’ denotes provisional

220
9.02 Balance of Payments, 2010-11 to 2013-14(p) (Crore Taka)
Items 2010-11 2011-12 2012-13 2013-14(p)
Current Accounts: a) Goods
Import (FOB) 216341.1 253042.2 272427.1 289825.5 Export (FOB) 164159.2 193375.5 211643.0 230751.4 Trade Balance (1-2) (-) 52181.9 -59666.7 -60784.1 -59074.1
b) Services Receipts 18292.9 19370.4 22601.0 25145.3 Payments 35500.6 41880.3 48387.1 5553902.0 Net (-) 17207.7 -22509.9 -25786.0 -28756.8
c) Income Receipts 871.7 1523.3 965.0 1089.7 Payments 11267.1 131242.2 19198.0 17960.5 Secondary Income Net (-)10395.4 --11718.9 -18233.0 -16870.8
d) Current Transfer (Net) Official 1047.1 829.2 516.6 435.4 Private 84013.1 101982.6 119520.4 115091.8
Total: 85060.3 102811.8 120037.0 115527.2 e) Current Account 5275.3 8916.3 15233.9 1088825.5 Balance (a+b+c+d) f) Capital and Financial Account (Net) 1. Capital Account 4138.1 4138.1 4690.8 2394.3 2. Direct Investment 5585.6 5585.6 -11537.9 -9049.1 3. Portfolio Investment (-)6109.2 -6109.2 742.9 -4690.4 4. Other Investment (-) 9589.8 9589.8 -15951.5 -13185.1 5. Reserve Assets 5351.0 5351.0 41316.0 45537.3 g) Total (1+2+3+4+5) (-) 4762.4 -4762.4 14569.5 18612.7
Errors and Omissions(e+g)
(-) 4651.0 -4651.0 -5355.2 5392.9
Note: 1. Upto June’12 data was complied on the basis of IMF, BDM5 2. From July’12 MPM 6 has been implemented. 3. Net Errors & Omissions=(Currant Account Blanca + Capital Account (Net) Financial Account (Net) 4. P= Provisional 5. MPMS= Blance of payments Manual. 5
th Edition.
Source: Economic Trends, Statistics Department, Bangladesh Bank.January 2015.

221
9.03 Foreign Trade, 1994-95 to 2012-13 (Merchandise) (Crore taka)
Year Exports Imports Balance
1994-95 13130 23455 (-)10325
1995-96 13857 28304 (-)14447
1996-97 16564 30540 (-)13976
1997-98 20393 34183 (-)13790
1998-99 20851 38480 (-)17629
1999-00 24923 42131 (-)17208
2000-01 32419 50371 (-)17952
2001-02 30934 49049 (-)18115
2002-03 33242 55918 (-)22676
2003-04 40581 64257 (-)23676
2004-05 50853 80898 (-)30060
2005-06 62601 99130 (-)36529
2006-07 78931 118478 (-)39560
2007-08 87022 148370 (-)62087
2008-09 97498 154823 (-)57325
2009-10 102148 164241 (-)62093
2010-11 144431 240028 (-)95597
2011-12 180313 280963 (-)100650
2012-13 189437 270776 (-) 81339 Note: Export date are on fob basis; import data are on C&F/CIF bases Source: Economic Trends. Bangladesh Bank. Complete . National Accounting Wing, BBS.

222
9.04 Direction of Exports (Fob) by Selected Countries 2009-10 to 2012-13 (Million Taka)
Countries 2009-10 2010-11 2011-12 2012-13
Australia 7771 18017 24803 39488 Belgium 27117 47452 46357 61559 Burma 654 574 - - Canada 46892 70887 73321 92376 China 12874 23385 29066 39201 Czechoslovakia 1196 2333 - - Egypt 1760 2753 4923 - France 71511 109517 95334 126322 Germany F.R. 152563 24974 268549 332485 Hong Kong 10585 15632 17466 29319 India 19211 32878 32363 42030 Indonesia 3131 2121 801 999 Iran 5358 6914 1720 206 Iraq 1 14 996 86362 Italy 43448 61743 72602 62377 Japan 24116 31050 43367 4368 Malaysia 4425 3387 1720 Maldives 51 3387 4208 8352 Nepal 59 108 82 120 Netherlands 70571 78854 50247 - New Zealand 896 1607 2237 3502 Pakistan 5408 6184 6454 6954 Saudi Arabia 6304 826 848 1137 Singapore 5962 9180 759 1681 Srilanka 1674 2495 3140 - Sudan 2087 4157 377 - Sweden 15480 25787 26315 34094 Thailand 9180 18494 13577 13577 Turkey 33233 51577 39981 53653 U.K. 105439 147114 80316 231962 USA 277212 363815 369647 - Russia Federation 3697 6988 2696 - Yugoslavia 9651 917 951 17356 Other countries 172465 310310 328319 - Total Export 7134589 1692733 1762288 - Source : National Accounting Wing, BBS.

223
9.05 Direction of Import (c.i.f.) by Selected Countries 2009-10 to 2012-13
(Million Taka)
Countries 2009-10 2010-11 2011-12 2012-13
Australia 27816 53780 49299 43348
Belgium 5180 10888 11521 9493
Burma 4128 11872 - 6604
Canada 39330 41502 50940 56889
China 311297 486554 503263 600786
Czechoslovakia 1416 1607 1167 1237
Egypt 56 2601 - -
France 8774 9023 11969 13764
Germany F.R. 32771 48744 46117 54369
Hong Kong 98548 118620 135118 166883
India 203438 315264 341701 363296
Indonesia 97275 132342 186836 145766
Iran 11685 50642 65 14293
Iraq 61 98 205 149
Italy 17630 25197 26674 25308
Japan 93527 108498 139785 131905
Malaysia 85810 115402 142025 149805
Nepal 18 13 5 -
Netherlands 6718 9297 13242 17304
New Zealand 4425 6995 9604 9478
Pakistan 30449 72049 48435 57969
Saudi Arabia 25548 31215 9477 46470
Singapore 107172 122967 188180 201527
Srilanka 2646 4185 5430 7949
Sudan 557 629 171 3747
Sweden 9461 9083 8928 5378
Thailand 50672 97570 5430 70895
Turkey 9938 11027 1372 26355
U.K. 17839 19170 19097 22791
USA 29827 64195 70969 52641
Russia Federation 17035 18309 - -
Yugoslavia 709 253 286 317
Other countries 442568 659814 994606 32182
Total Import 1794324 2659405 2942810 3144291 Source : National Accounting Wing, BBS.

224
9.06 Exports of Principal Commodities 2009-10 to 2012-13
(Million taka)
Commodities 2009-10 2010-11 2011-12 2012-13
Total Exports 1134589 1629733 1762288 2268607
1. Prawns and shrimps 22665 33506 33214 36523
2. Tea 391 228 227 223
3. Spices 18 664 900 1860
4. Raw hides and skins 15665 21257 23228 136
5. Raw Jute 12760 25363 19013 18677
6. Jute yarn 27561 35632 33284 43018
7. Jute mfg. total 14473 55044 32298 69451
Jute fabrics 4013 3330 3361 4698
(a) Hessian - - - -
(b) Sacking - - - -
(c) Carpet backing cloth - - - -
(d) Others 10460 51714 28937 64753
8. Leather and leather Products 17677 19624 30077 33416
9. Ready made garments 790042 1144946 1383468 1806105
10. Handicraft 259 316 353 825
11. Others 218650 293153 206226 258373
Source : National Accounting Wing, BBS.

225
9.07 Imports (c.i.f.) by Broad Commodity Groups 2009-10 to 2012-13
(Value in million Taka) Groups 2009-10 2010-11 2011-12 2012-13
Total Imports: 1794324 2659405 2942810 3144291 1. Live Animals, Animal Products 12437 19579 22859 24914 2. Vegetable Products 114755 202565 140592 145937 Wheat 4949 86458 47571 46111 Rice 54652 63004 17410 1322 Others 55154 53103 75611 98504
3. Animal or Vegetable Fats and Oils and their Cleavage Products; Prepared Edible Fats; Animal or Vegetable Waxes 137879 190515 279524 248804 Animal tallow 18 3 1 - Soyabean oil 42024 61604 86817 71350 Coconut oil 1463 3050 2932 1369 Others 94374 125858 189774 176085
4. Prepared Foodstuffs; beverages,
Spirits and Vinegar; Tobacco and Manufactured Tobacco Substitutes 65850 78014 130094 98865 Unmanufactured
Tobacco(Raw) 1048 787 864 858
Manufactured Tobacco 6 36 149 51 Others 64796 77191 129081 97956
5. Mineral Products 203077 246607 317529 344717 Portland Cement 86 168 45465 53435 White Cement 6 5 72 274 Petroleum oil crude 29844 20703 24438 4983 Kerosene 6965 14545 16839 12521 Others 166176 211186 230715 273504
6. Products of the Chemical or Allied Industries 156268 240790 254868 277092 Pharmaceutical products 13943 14475 14626 16366 Urea 19873 53406 35185 32632 TSP 10579 22366 22676 16281 MP 12217 16124 20681 34625 Insecticides - 6704 8111 9211 Others 99656 127715 153589 167977
Contd.

226
9.07 Imports (c.i.f.) by Broad Commodity Groups 2009-10 to 2012-13
(Value in million Taka) Groups 2009-10 2010-11 2011-12 2012-13
7. Plastics and Articles thereof Rubber and Articles thereof 71742 99160 118020 132477
Crude Rubber 209 427 350 294 Others 71533 98733 117670 132183
8. Raw Hides and Skins, Leather, Furskins and Articles thereof; Saddlery and Harness, Travel Goods, Handbags and Similar Containers; Articles of Animal Gut(other than Silk Worm)
3462
5842
6305
8060
9. Wood and Articles of Wood; Wood Charcoal; Cork and Articles of
Cork; Manufactures of Straw, of Esparto or of other Plaiting Materials Basketware and Wickerwork
5353
7775
8391
8660
10.Pulp of Wood or of other fibrous Cellulosic Materials; Waste and Scrap of Paper or Paper-Board; Paper and Paper-Board and Articles-thereof
36330
48016
50829
57596
11.Textiles and Textile Articles 417001 690070 665565 839300 Raw Cotton 98185 193966 154685 182338 Second hand clothing 183 321 432 324 Others 318633 495783 510448 656638
12. Footwear Headgear Umbrellas, Sun, Umbrellas Walking Stick, Seat Sticks, Whips, Riding Crops and Parts thereof; Prepared Feathers and Articles Made there with; Artificial Flowers; Articles of Human Hair
6370
10734
12596
12051
13. Articles of Stone, Plaster, Cement, Asbestos, Mica or Similar Materials; Ceramic Products; Glass and Glassware
6312
9489
11590
12012
Contd.

227
9.07 Imports (c.i.f.) by Broad Commodity Groups 2009-10 to 2012-13
(Value in million Taka)
Groups 2009-10 2010-11 2011-12 2012-13 14. Natural or Cultured Pearls, Precious or Semi-Precious Stones, Precious Metals, Metals Clad with Precious Metal and Articles thereof; Imitation Jewellery; Coin 996 1132 630 1324 15. Base Metals and Articles of Base Metal 125950 160174 216105 239418
16. Machinery and Mechanical Appliances; Electrical Equip- ment; Parts thereof; Sound Recorders and Reproducers, Television Image and Sound Recorders and Reproducers, and Parts and Accessories of Such Articles Machinery all kinds 273739 465085 438887 432331 Others 273739 465085 438887 17. Vehicles, Aircraft, Vessels and Associated Transport Equip- 127223 147184 215664 ment Transport equipment 127223 147184 215664 200197 18. Optical, Photographic cinemato- graphic, Measuring,Checking Precision, Medical or Surgical Instruments and Apparatus; Clocks and Watches; Musical Instruments; Parts and Accessories thereof 16057 16800 22221 24729 19. Arms and Ammunition; Parts and Accessories thereof 603 2672 9099 9803 20. Miscellaneous Manufactured Articles 12872 17158 21346 25870 21. Work of Art, Collectors Pieces and Antiques 48 44 96 134 Source : National Accounting Wing, BBS.

228
9.08 Quantity of Export of Selected Items 2009-10 to 2012-13
(In '000' ton)
2009-10 2010-11 2011-12 2012-13
Jute Raw 296 507 517 443 Jute Manufacture 603 964 532 889 Tea 02 1 1 1 Leather 52 24 23 31 Frozen Fish 60 91 81 82 Fertilizer 143 121 39 - Source : National Accounting Wing, BBS.
9.09 Quantity of Import of Selected Items 2008-09 to 2011-12 (In '000' ton) Items 2009-10 2010-11 2011-12 2012-13
Rice 162 1807 443 30 Wheat 3202 3544 1772 1597 Edible oil 2533 2603 2994 3062 Milk powder 47 66 74 85 Fertilizer 1936 3374 2255 2314 Petroleum: crude 449 627 582 253 Raw cotton 874 934 730 1082 Pharmaceutical Prod 2 5 3 4 Coal - - - 82 Sugar 1298 1216 1988 1573 Cement 6921 10537 9368 10749 Pig Iron 10 5 5 4 Old garments 7 14 16 13 Dyes 47 66 128 149 Chemical Products 165 350 292 265 Source : National Accounting Wing, BBS.

229
9.10 Exports by End Use and Institutional Accounts (Million taka)
Institution
Year
Consumer goods
Materials for consumer
goods
Capital goods
Materials for capital
goods
Private 2006-07 733528 106334 5541 343 2007-08 846059 119010 5242 15 2008-09 947757 104755 4204 30 2009-10 155636 1198266 245388 26204 2011-12 1553951 174578 7635 229 2012-13 2010282 219682 4111 352
Government 2006-07 1270 2802 - - 2007-08 - 2862 13 - 2008-09 438 347 684 - 2009-10 877 1453 717 322
2011-12 - - 1024 - 2012-13 - - 670
Semi-Government 2006-07 491 - - - 2007-08 - 564 - 12166 2008-09 - 8411 - 8366 2009-10 15222 150237 - 2 2011-12 16502 8369 - - 2012-13 7944 25566 - - Nationalised Industries 2004-05 - - - - 2005-06 - - - - 2007-08 - - - - 2008-09 - - - - 2010-11 - - - -
T.C.B. and others 2004-05 - - - - 2005-06 - - - - 2007-08 - - - - 2008-09 - - - - 2010-11 - - - - Total 2005-06 554384 132507 5023 36 2006-07 735289 109136 5541 343 2007-08 846059 122436 5255 12181 2008-09 948195 113513 4888 8396 2009-10 171735 1349956 246105 26528 2010-11 1442233 181407 5955 138 2011-12 1570453 182958 8648 229 2012-13 2018226 245248 4781 352 Note : TCB = Trading corporation of Bangladesh Source : National Accounting Wing, BBS.

230
9.11 Imports by End Use and Institutional Accounts (Million taka)
Institution
Year
Consumer
goods
Materialsfor consumer
goods
Capital goods
Materials for capital
goods
Private 2006-07 93374 639791 199848 39665 2007-08 173717 983171 198824 16204 2008-09 142573 1044218 207327 21864 2009-10 155636 1198266 245388 26204 2011-12 258109 2015089 74177 25440 2012-13 230912 2179970 387388 91129 Government 2005-06 877 1453 717 322 2006-07 84 970 981 - 2007-08 229 1613 1509 - 2008-09 494 1093 814 424 2011-12 203 8920 1060 5210 2012-13 999 2306 455 11912 Semi-Government 2006-07 9704 135373 674 - 2007-08 9963 111492 - - 2008-09 13012 149078 - - 2009-10 15222 150237 - 2 2011-12 48687 205916 - - 2012-13 56675 183404 - - Nationalised Industries 2004-05 - - - - 2005-06 - - - - 2007-08 - - - - 2008-09 - - - - 2011-12 - - - - T.C.B. and others 2004-05 36 - - - 2007-08 - - - - 2008-09 - - - - 2011-12 - - - - 2012-13 - -- - - Total 2005-06 77154 695891 177432 11868 2006-07 101362 776134 201503 39665 2007-08 183909 1096276 200333 16204 2008-09 156079 1194389 208141 22289 2009-10 171735 1349956 246105 26528 2010-11 263028 1932670 433341 30366 2011-12 306999 2229925 375237 30650 2012-13 288585 2364822 387843 103041 Note: Figures may not add up to the totals because of rounding. Source: National Accounting Wing, BBS.

231
9.12 Export (f.o.b.) Prices Per Unit of Selected Commodities
(Taka) Commodity Units 2009-10 2010-11 2011-12 2012-13
1. Raw Jute Ton 40202 25362 36767 42135
2. Jute manufactures Jute fabrics 55652 57094 71295 76958 a) Hessian Ton - - - - b) Sacking Ton - - - - c) Carpet backing - - - -
cloth Ton - - - -
3. Tea Kg 170 187 173 230
4. Frozen Shrimp Kg 565 648 739 715
5. Leather Ton 156650 887685 165640 Source : National Accounting Wing, BBS.
9.13 Import (c.i.f.) Prices Per Unit of Selected Commodities
(Taka) Commodity Units 2009-10 2010-11 2011-12 2012-13
Rice Ton 30371 34862 39308 43968
Wheat Ton 17063 25107 26847 28872
Raw cotton Ton 113389 207740 211944 168528
Soyabean oil Kg. 61 74 99 99
Cotton yarn
(excluding thread) Kg. 214 208 335 339
Cement Ton 3639 3809 4887 5002
Pig iron Ton 30080 40192 49385 45922
Source : National Accounting Wing, BBS.

232
9.14 Unit Price Index of Exports (Base : 1988-89=100) and 2002-03 Commodity Units 2008-09 2009-10 2010-11 2011-12
General Index 141.50 149.99 165.56 171.55
Shrimp & prawn Kg 100.06 101.00 100.00 10035 Tea kg 142.74 173.09 239.00 236.00 Naptha Litre 148.88 159.00 444.00 585.08 Fertilizer MT 214.33 250.00 331.00 515 Leather, hide & skins Kg 134.62 139.74 203.00 203.48 Raw jute MT 146.93 287.00 357.00 262.62 Jute goods MT 165.59 200.51 218.00 243.96 Source : National Accounting Wing, BBS.
9.15 Unit Price Index of Imports (Base : 1988-89=100) and 2002-03 Commodity Units 2008-09 2009-10 2010-11 2011-12
General Index 165.59 174.99 196.45 208.16 Rice Kg 169.90 217.00 250.00 212
Wheat Kg 269.29 189.80 271.00 243.36 Milk and cream Kg 157.36 123.00 124.00 127 Pulses Kg 120.96 - - - Spices Kg 125.42 172.22 176.00 238
Edible oil Kg 231.83 229.95 187.20 203 Sugar Kg 117.45 182.95 215.81 217 Crude oil MT 361.30 363.79 370.00 - Petroleum products MT 299.51 315.74 311.8 288
Raw cotton MT 122.09 142.52 139.00 143 Cement MT 144.59 161.00 163.00 216 Fertilizer MT 489.08 373.73 374.00 400 Iron and steel MT 194.30 208.29 221.00 270.87 Source : National Accounting Wing, BBS.

233
9.16 Export and Import Tonnage Handled at the Ports of Chittagong and Mongla
(Thousand tons)
Year Chittagong Export Total Chittagong Import Total Export Mongla Import Mongla
1999-00 1753 309 2062 13388 2698 16086 2000-01 1998 305 2303 14909 2462 17371 2001-02 1991 306 2297 16089 1947 18036 2002-03 2261 350 2566 18319 1450 19769
2003-04 2400 316 2716 18986 1178 20164 2004-05 2710 221 2931 21676 1255 22931 2005-06 2926 268 3194 23169 1215 24384 2006-07 3289 253 3542 23836 664 24500 2007-08 3601 205 3806 25346 518 25864 2008-09 2405 209 3973 23449 932 27651 2009-10 4187 148 4322 32814 1501 34232 2010-11 4981 167 4247 39914 2530 42444 2011-12 4717 136 - 36185 2483 - Source : Chittagong and Mongla Port Authority.
9.17 Quantity and Value of Jute Goods and Raw Jute Exported to Foreign Countries 2007-08 2008-09 2009-10 2010-11 2011-12
Jute goods
Jute fabrics 95 165 200 32 4
Hessain '000' tons - - - - -
Sacking '000' tons - - - - -
Others '000' tons 487 530 556 567 528
Total '000' tons 582 625 756 599 532
Total Value (Million
Taka) 28045 23836 29764 55043 37927
Raw Jute
Jute '000' tons 612 586 287 461 35
Value (million Taka) 12350 9681726 10846431 23518 17971
Mesta 'ton' 18468 1347 4300 42 32 Value (Thousand Taka 415452 47544 178456 1844 1042 Source : National Accounting Wing, BBS.

234
9.18 Exports as a Percentage of Imports (Value in million US$)
Year Exports Imports Export as a percentage to Imports
1995-96 3882 6827 56.86
1996-97 4418 7150 61.79
1997-98 5161 7545 68.40
1998-99 5313 8006 66.36
1999-00 5752 8403 68.45
2000-01 6467 9363 69.07
2001-02 5986 8540 70.09
2002-03 6548 9658 67.80
2003-04 7603 10903 69.73
2004-05 8655 13147 65.83
2005-06 10526 14746 71.38
2006-07 12178 17157 70.98
2007-08 14111 21629 65.24
2008-09 15565 22507 69.16
2009-10 16204 23738 68.26
2010-11 22928 33657 68.12
2011-12 24302 35516 68.42
2012-13 27027 33969 69.56
2013-14 30187 37643 8019 Source: Export Promotion Bureau.

235
9.19 Export of Primary and Manufactured Commodities (Value in million dollar) Value in million Taka
Year Total Exports Primary Commodities Manufactured Commodities
Value % Share Value % Share 2001-02 (5986.09) (390.30) 6.52 (5595.79) 93.48
343661.45 26121.10 321254.53 2002-03 (6548.44) (462.59) 7.06 (6085.85) 92.94
379154.49 26784.15 352370.34 2003-04 (7602.99) (553.36) 7.28 (7049.63) 92.72
448272.22 32626.20 415646.02 2004-05 (8654.52) (648.29) 7.49 (8006.23) 92.51
532339.73 39876.30 492463.43 2005-06 (10526.16) (772.70) 7.34 (9753.46) 92.66
707463.61 51933.16 655530.35 2006-07 (12177.86) (832.27) 6.83 (11345.59) 93.17
841003.01 57476.57 783526.45 2007-08 (14110.80) (987.56) 7.00 (13123.24) 93.00
968000.77 67746.71 900254.06 2008-09 (15565.19) (870.11) 5.59 (14695.08) 94.41
1070885.07 59863.57 1011021.50 2009-10 (16204.65) (687.53) 4.24 (15517.12) 95.76
1121037.69 47563.33 1073474.36 2010-11 (2928.22) (958.98) 4.18 (21969.24) 95.82
1631801 68251 1563551 2011-12 (24301.90) (1001.12) 4.12 (23300.78) 95.88
1922280 79189 1843092 2012-13 (27027.36) (1079.58) 3.99 25947.78 96.01
2160296.88 86290.83 - 2074006.06 2013-14 (30186.62) (1253.28) 4.15 (28933.34) 95.85
2346104.11 97404.92 2248699.18 Source: Export Promotion Bureau.

236
9.20 Export by Traditional and Non-Traditional Items (Value in million US$)
Year Total Exports
Traditional Non-Traditional
Value % Share Value % Share 1999-00 (5752.20) (352.01) 6.12 (5400.19) 93.88
288185.16 17635.64 270547.52 2000-01 (6467.30) (320.37) 4.95 (6146.93) 95.05
348587.43 17267.94 331319.49 2001-02 (5986.09) (320.12) 5.35 (5665.97) 94.65
343661.45 18378.23 325283.22 2002-03 (6548.44) (354.47) 5.41 (6193.97) 94.59
37914.49 20524.13 3586.30 2003-04 (7602.99) (341.11) 4.49 (7261.88) 95.51
448272.22 20111.59 428160.63 2004-05 (8654.52) (418.56) 4.84 (8235.96) 95.16
532339.73 25745.71 506594.02 2005-06 (10526.16) (548.77) 4.93 (10007.39) 95.07
707463.51 34866.88 672596.63 2006-07 (12177.86) (471.69) 3.87 (11706.17) 96.13
841003.01 32574.91 808428.10 2007-08 (14110.80) (493.42) 3.50 (13617.38) 96.50
968000.77 33848.35 934152.42 2008-09 (15565.19) (424.91) 2.73 (15140.28) 97.27
1070885.07 29233.81 1041651.26 2009-10 16204.65 (793.64) 4.96 (15411.01) 95.10
1121037.69 54904.02 1066133.67 2010-11 (22928.22) (1118.13) 4.88 (21810.09) 95.12
1631801 79577 1552224 2011-12 (24301.90) (970.76) 3.99 (23331.14) 96.01
1922280 76787 184543 2012-13 (27027.36) (1033.05) 3.82 (25994.31) 96.18
2160296.88 82571.68 2077725.20 2013-14 30186.32 828.20 2.74 (29358.42) 97.26
2346104.11 64367.7 2281736.40
Source: Export Promotion Bureau.

237
279
9.21 Bangladesh Export to SAARC Countries (Value in million US $)
Countries 2009-10 2010-11 2011-12 2012-13 2013-14
Afghanistan 2.74 5.33 3.59 3.57 3.60
Bhutan 2.24 3.12 9.13 1.82 1.91
India 304.63 512.51 498.42 563.96 456.63
Maldives 0.74 0.93 1.78 1.53 1.71
Nepal 8.79 10.84 61.97 24.41 13.69
Pakistan 77.67 86.79 73.21 68.70 56.04
Sri Lanka 23.74 34.73 42.59 23.69 26.81
Total 420.55
(2.60)
652.45
(2.05)
690.69
(2.84)
689.68
(2.55)
560.39
1.86
National Export 16204.65 22928.22 24301.90 27027.36 30186.62 Source: Export Promotion Bureau.

239
Chapter X
NATIONAL ACCOUNTS
FINANCE AND BANKING

241
10.01 Indicators of National Accounts
(Million Taka)
Sl No.
Item 2008-09 2009-10 2010-11 2011-12 2012-13 2013-14(p)
1. GDP growth rate at 1995-96 Prices 5.05 5.57 6.46 6.52 6.01 6.12 2. GDP at current market prices (Million Tk) 7050718 7975.38
7 9158288 1055204
0 11989232 13509204
3. GDP at constant or real prices (Million Tk) 5750562 6070972 6463423 6884932 7298965 7745385 4. Gross National Income (GNI) at current prices
(Million Tk) 7609730 8621422 9883423 1144506
0 12953523 14409370
5. GNI at constant prices (Million Tk) 6206492 6562743 6975184 7467605 7886019 8261487 6. Net National Income (NNI) at current prices
(Million Tk) 6993995 7928762 9094222 1053933
5 11916816 13242572
7. NNI at constant prices (Million Tk) 5707997 6035557 6414090 6869526 7250206 758503 8. Population (Million) 145.8 147.8 149.65 151.58 153.69 155.76 9. Per capita GDP at current prices (Tk.) 48359 53961 61198 69614 78009 86731 10. Per capita GNI at current prices (TK) 52193 58332 66044 75505 84283 92510 11. Per capita real GDP(Tk.) 39441 41076 43190 45421 47491 49726 12. Per capita real GNI (Tk.) 42569 44403 46610 49265 51311 53040 13. Exchange rate (Taka Per US $) 68.80 69.18 71.17 79.10 79.93 77.75 14. Per capita GDP at current prices (US$) 703 780 860 880 976 1115 15. Per capita GNI at current prices (US$) 759 843 928 955 1054 1190 16. Inflation rate (%) 7.60 6.82 10.41 8.69 6.78 7.35 Contd.

242
10.01 Indicators of National Accounts (Million Taka)
Sl No
Item 2008-09 2009-10 2010-11 2011-12 2012-13 2013-14(p)
17. Consumption at current prices (M.Tk.) 5617137 6315707 7269658 8312500 9347273 10344303 a) Private consumption (Million Tk) 5257991 5910930 6802819 7780747 8733888 9642213 b) Public consumption (Million Tk) 359146 404777 466839 531753 613385 702090
18. Investment at current prices (Million Taka) 1847715 2093272 2511292 2982253 3403697 3875139 a) Private investment (Million Tk) 1543343 1720512 2029788 2374233 2607486 2889110 b) Public investment (Million Tk) 304372 372760 481504 608020 796211 986029
19. Domestic saving at current price(MillionTk.) 1433581 1659680 1888630 2239540 2641959 3164902 20. As percentage of GDP
i) Consumption 79.67 79.19 79.38 78.78 77.96 76.57
Private consumption 74.57 7411 74.28 73.74 72.85 71.38 Public consumption 5.09 5.08 5.10 5.04 5.12 5.20
ii) Investment 26.21 26.25 27.42 28.26 28.39 28.69
Private investment 21.89 21.57 22.16 22.50 21.75 21.39 Public Investment 4.32 4.67 5.26 5.76 6.64 7.30
iii) Gross Domestic Savings 20.33 20.81 20.62 21.22 22.04 23.43
iv) Gross National Savings 28.60 29.44 28.88 29.86 30.53 30.54
Source: National Accounting Wing, BBS. Note : ‘P’ denotes provisional.

243
10.02 Gross Domestic Product, Sectoral Share and Growth Rate at Current Prices by Broad Industry Sector (MIllion Taka)
Sl No.
Broad Industry Sector 2008-09 2009-10 2010-11 2011-12 2012-13 2013-14(p)
Gross Domestic Product 1. AGRICULTURE 1205999 1355910 1539506 1707064 1857524 2044066 2. INDUSTRY 1783519 1990376 2293721 2670717 3154016 3584827 3. SERVICES 3759677 4266695 4858085 5608575 6401073 7234626 GDP At current Producer Prices 6749196 7612981 8691312 9986356 11412612 12863519
1. AGRICULTURE 17.87 17.81 17.71 17.09 16.28 15.89 2. INDUSTRY 26.43 26.14 23.69 26.74 27.64 27.87 3. SERVICES 55.71 56.05 55.90 56.16 56.09 56.24 GDP At current Producer prices 100.00 100.00 100.00 100.00 100.00 100.00
1. AGRICULTURE 9.02 12.43 13.54 10.88 8.81 10.04 2. INDUSTRY 14.73 11.60 15.24 16.44 18.10 13.66 3. SERVICES 12.98 13.49 13.86 15.45 14.13 13.02 GDP At current Producer prices 12.70 12.80 14.16 14.90 14.28 12.71
Source: National Accounting Wing, BBS. Note : ‘P’ denotes provisional.

244
10.03 Gross Domestic Product, Sectoral Share and Growth Rate at Constant Prices (2005-06) by Broad Industry Sector (MIllion Taka)
Broad Industry Sector 2008-09 2009-10 2010-11 2011-12 2012-13 2013-14(p)
Gross Domestic Product
1. AGRICULTURE 1003381 1065108 1112574 1146109 1174360 1213652
2. INDUSTRY 1450012 1551980 1691955 1851601 2030084 2200445
3. SERVICES 3010708 3177165 3374677 3596598 3794920 4016329
GDP At constant Producer prices 5464101 5794253 6179206 6594308 6999363 7430426
Share (%)
1 AGRICULTURE 18.36 18.38 18.01 17.38 16.78 16.33
2. INDUSTRY 26.54 26.78 27.38 28.08 29.00 29.61
3. SERVICES 55.10 54.83 54.61 54.54 54.22 54.05
GDP At constant Producer prices 100.00 100.00 100.00 100.00 100.00 100.00
Growth Rate (%)
1 AGRICULTURE 3.47 6.15 4.46 3.01 2.46 3.35
2. INDUSTRY 6.91 7.03 9.02 9.44 9.64 8.39
3. SERVICES 5.08 5.53 6.22 6.58 5.51 5.83
GDP At constant Producer prices 15.46 18.71 19.69 19.03 17.62 17.57
Source: National Accounting Wing, BBS. Note : ‘P’ denotes provisional.

245
10.04 Investment- GDP Ratio
Year Investment as % of GDP
2005-06 Constant prices Current Prices
Total Private Public Total Private Public
2005-06 26.14 20.58 5.56 26.14 20.58 5.56
2006-07 26.17 21.09 5.08 26.17 21.08 5.09
2007-08 27.10 22.45 4.65 26.20 21.70 4.50
2008-09 27.71 23.16 4.55 26.21 21.89 4.32
2009-10 28.49 23.47 5.03 26.24 21.57 4.67
2010-11 29.32 23.80 5.53 27.42 22.16 5.26
2011-12 30.44 24.46 5.98 28.26 22.50 5.76
2012-13 30.25 23.47 6.78 28.39 21.75 6.64
2013-14(p) 30.32 22.95 7.37 28.69 21.39 7.30
Source: National Accounting Wing, BBS. Note: (p) denotes provisional

10.05 Saving-GDP Ratio (at Current Price) Year
Savings as percentage of GDP
National Savings as percentage of
GDP 2005-06 21.44 27.83 2006-07 20.75 27.89 2007-08 19.19 27.79 2008-09 20.33 28.6 2009-10 20.81 29.44 2010-11 20.62 28.88 2011-12 21.22 29.86 2013-13 22.04 20.53 2013-14(p)
23.43 30.54
Source : National Accounting Wing, BBS Note: (p) denotes provisional 246

10.06 Gross National Products at Current Prices (Base : 2005-06) (Million Taka)
Activity/Sector 2008-09 2009-10 2010-11 2011-12 2012-13 2013-14(P)
1. Agriculture and forestry 978072 1109903 1254686 1388791 1487578 1617373 a. Crops and horticulture 711584 814050 919028 1008993 1067941 115660 b. Animal farming 158301 175272 201707 229987 253588 276668 c. Forest & related services 108187 120581 133952 149810 166050 184014
2. Fishing 227927 246007 284820 318273 369946 426693 3. Mining and quarrying 109625 126449 142084 166504 194611 216174 4. Industry 1161971 1285730 1465027 1679275 1971272 2214277 a. Large scale 919962 1016187 1164533 1343974 1584482 1796770 b. Small scale 242010 269543 300494 3335301 386790 417507
5. Electricity, gas and water supply 70119 83457 115893 141894 163812 178998 6. Construction 441805 494739 570716 683044 824321 975378 7. Wholesale and retail trade 960938 1066064 123319 1373962 1545794 1723222 8. Hotel and restaurant 57897 70276 82283 97551 112634 130327 9. Transport, storage and communication 671847 804542 945711 1127023 1242805 1364703
10. Financial intermediation 200027 234478 275454 363164 422365 494987 11. Real estate, renting and business services 494486 544324 601190 6877147 788200 910677 12. Public Administration and defense 224643 254256 302820 334991 376782 435559 13. Education 162499 182575 213920 250477 284293 330641 14. Health and social services 133679 153258 177312 201327 238683 269431 15. Community, social and personal services 853661 956922 1046077 1172932 1389516 1575079 16. GDP Current producer’s price 6749196 7612981 8691312 9986356 11412612 12863519 17. Import duty 301522 362406 466976 565685 576620 645686 18. GDP at current market price 7050718 7975387 9158288 10552040 11989232 13509204 19. Net primary income from abroad 559012 646035 725135 893020 964291 900166 20. GNI at current market price 7609730 8621422 9883423 11445060 12953523 14409370 21. NNI at current market price 6993995 7928762 9094222 10539335 11916816 1242572
Population (million) 1458 1478 14965 15158 15369 15576 Per capita GDP at market price 48359 53961 61198 69614 78009 86731 Per capita GNI at market price 52193 58332 66044 75505 84283 92510 Per capita NNI at market price 47970 53645 60770 69530 77538 85019
Source: National Accounting Wing, BBS. 247 Note: (p) denotes provisional.
248

10.07 Sectoral Shares of GDP at Current Prices (Million Taka)
Activity/Sector 2008-09 2009-10 2010-11 2011-12 2012-13 2013-14
1. Agriculture and forestry 14.49 14.58 14.44 13.91 13.03 12.57 a. Crops and horticulture 10.54 10.69 10.57 10.10 9.36 8.99 b. Animal farming 2.35 2.30 2.32 2.30 2.22 2.15 c. Forest & related services 1.60 1.58 1.54 1.50 1.45 1.43 2. Fishing 3.38 3.23 3.28 3.19 3.24 3.32 3. Mining and quarrying 1.62 1.66 1.63 1.67 1.71 1.68 4. Industry 17.22 16.89 16.86 16.82 17.27 17.21 a. Large scale 13.63 13.35 13.40 13.46 13.88 13.97 b. Small scale 3.59 3.54 3.46 3.36 3.39 3.25 5. Electricity, gas and water supply 1.04 1.10 1.33 1.42 1.44 1.39 6. Construction 6.55 6.50 6.57 6.84 7.22 7.58 7. Wholesale and retail trade 14.24 14.00 13.96 13.76 13.54 13.40 8. Hotel and restaurant 0.86 0.92 0.95 0.98 0.99 1.01 9. Transport, storage and communication 9.95 10.57 10.88 11.29 10.89 10.61 10. Financial intermediation 2.96 3.08 3.17 3.64 3.70 3.85 11. Real estate, renting and business services 7.33 7.15 6.92 6.88 6.91 7.08 12. Public Administration and defense 3.33 3.34 3.48 3.35 3.30 3.39 13. Education 2.41 2.40 2.46 2.51 2.49 2.57 14. Health and social services 1.98 2.01 2.04 2.02 2.09 2.09 15. Community, social and personal services 12.65 12.57 12.04 11.75 12.18 12.24 GDP at current producer's price 100.00 100.00 100.00 100.00 100.00 100.00 Source: National Accounting Wing, BBS. Note: (p) denotes provisional
249

10.08 Gross National Products of Bangladesh at Constant (2005-06) Prices (Million Taka)
Activity/Sector 2008-09 2009-10 2010-11 2011-12 2012-13 2013-14(p)
1. Agriculture and forestry 796815 849042 882059 903322 916565 939115 a. Crops and horticulture 580937 614923 649011 660385 664270 676934 b. Animal farming 116200 119120 122211 125489 128927 132581 c. Forest & related services 99678 104999 110838 117448 123367 129600
2. Fishing 206566 216066 230514 242787 257795 274537 3. Mining and quarrying 88409 95611 99069 105930 115839 121880 4. Industry 934589 996709 1096514 1205674 1329941 1445438 a. Large scale 749336 796314 884753 979983 1084362 1183640 b. Small scale 185253 200395 211760 225691 245579 261798
5. Electricity, gas and water supply 67399 74118 84023 92909 101257 108746 6. Construction 359616 385542 412350 447089 483046 524380 7. Wholesale and retail trade 767284 812193 866497 924574 981731 1046268 8. Hotel and restaurant 40928 43390 46079 49021 52204 55701 9. Transport, storage and communication 595136 640059 694094 757609 805140 857244
10. Financial intermediation 157283 167107 184559 211797 231097 252168 11. Real estate, renting and business services 424419 440778 457896 475864 495089 516092 12. Public Administration and defense 174471 188823 205518 220994 235419 252030 13. Education 122933 129306 136588 147175 156447 169309
Contd.

250
10.08 Gross National Products of Bangladesh at Constant (2005-06) Prices
(Million Taka) Activity/Sector 2008-09 2009-10 2010-11 2011-12 2012-13 2012-14(p)
14 Health and social services 106340 113600 120801 125402 131367 137964 15 Community, social and personal services 621915 641909 662646 684163 706426 729554 16 GDP at constant price 5464101 5794253 6179206 6594308 6999363 7430426 17 Import duty 286461 276719 284217 290624 299602 314959 18 GDP at constant market price 5750562 6070972 6463423 6884932 7298965 7745385 19 Net primary income from abroad 455930 491771 511761 582672 587054 516102 20 GNI at constant market price 6206492 6562743 6975184 7467605 7886019 8261487 21 NNI at constant market price 5707997 6035557 6414090 6869526 7250206 7587503
Population (million) 145.8 147.8 149.65 151.58 153.69 155.76 Per capita GDP at market price (Tk) 39441 41076 43190 45421 47491 49726 Per capita GNI at market price (Tk) 42569 44403 46610 49265 51311 53040 Per capita NNI at market price (Tk) 39149 40836 42861 45319 47174 48713 Annual rise of GDP at constant market price 5.05 5.57 6.46 6.52 6.01 6.12 Annual rise of GNI at constant market price 5.27 5.74 6.28 7.06 5.60 4.76 Annual rise of NNI at constant market price 5.28 5.74 6.27 7.10 5.54 4.65 Annual rise of per capita GDP at market
price 3.60 4.14 5.15 5.17 4.56 4.71
Annual rise of per capita GNI at market price 3.83 4.31 4.97 5.70 4.15 3.37 Annual rise of per capita NNI market price 3.83 4.31 4.96 5.74 4.09 3.26
Source: National Accounting Wing, BBS. Note: (p) denotes provisional.

251 10.09 Sectoral Shares of GDP at Constant (2005-06) Prices
Activity/Sector 2008-09 2009-10 2010-11 2011-12 2012-13 2013-14(p)
1 Agriculture and forestry 14.58 14.65 14.27 13.70 13.09 12.64 a. Crops and horticulture 10.63 10.79 10.50 10.01 9.49 9.11 b. Animal farming 2.13 2.06 1.98 1.90 1.84 1.78 c. Forest& related services 1.82 1.81 1.79 1.78 1.76 1.74
2 Fishing 3.78 3.73 3.73 3.68 3.68 3.69 3 Mining and quarrying 1.62 1.65 1.60 1.61 1.65 1.64 4 Industry 17.60 17.20 17.75 18.28 19.00 19.45 a. Large scale 13.71 13.74 14.32 14.86 15.49 15.93 b. Small scale 3.39 3.46 3.43 3.42 3.51 3.52
5 Electricity, gas and water supply 1.23 1.28 1.36 1.41 1.45 1.46 6 Construction 6.58 6.65 6.67 6.78 6.90 7.06 7 Wholesale and retail trade 14.04 14.02 14.02 14.02 14.03 14.08 8 Hotel and restaurant 0.75 0.75 0.75 0.74 0.75 0.75 9 Transport, storage and communication 10.89 11.05 11.23 11.49 11.50 11.54
10 Financial intermediation 2.88 2.88 2.99 3.21 3.30 3.39 11 Real estate, renting and business services 7.77 7.61 7.41 7.22 7.07 6.95 12 Public Administration and defense 3.19 3.26 3.33 3.35 3.36 3.69 13 Education 2.25 2.23 2.21 2.23 2.24 2.28 14 Health and social services 1.95 1.96 1.95 1.9 1.88 1.86 15 Community, social and personal services 11.38 11.08 10.72 10.38 10.09 9.82
GDP at constant prices 100.00 100.00 100.00 100.00 100.00 100.00 Source: National Accounting Wing, BBS. Note: (p) denotes provisional.
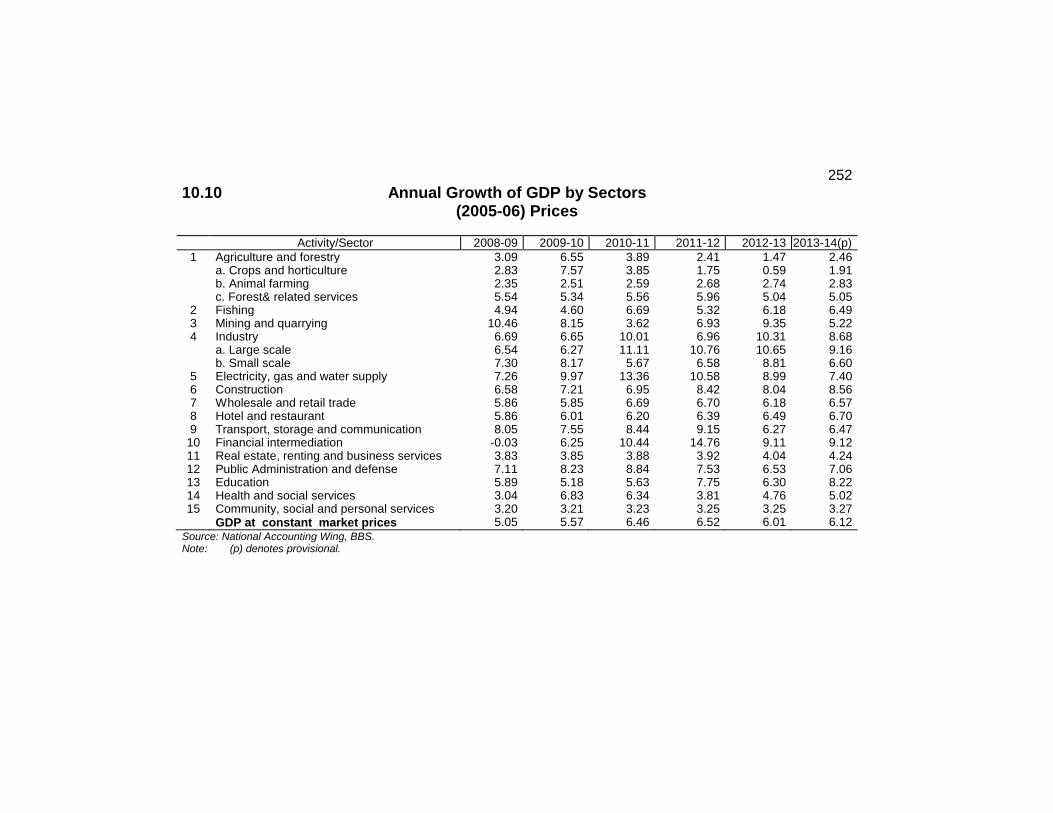
252 10.10 Annual Growth of GDP by Sectors
(2005-06) Prices
Activity/Sector 2008-09 2009-10 2010-11 2011-12 2012-13 2013-14(p)
1 Agriculture and forestry 3.09 6.55 3.89 2.41 1.47 2.46 a. Crops and horticulture 2.83 7.57 3.85 1.75 0.59 1.91 b. Animal farming 2.35 2.51 2.59 2.68 2.74 2.83 c. Forest& related services 5.54 5.34 5.56 5.96 5.04 5.05
2 Fishing 4.94 4.60 6.69 5.32 6.18 6.49 3 Mining and quarrying 10.46 8.15 3.62 6.93 9.35 5.22 4 Industry 6.69 6.65 10.01 6.96 10.31 8.68 a. Large scale 6.54 6.27 11.11 10.76 10.65 9.16 b. Small scale 7.30 8.17 5.67 6.58 8.81 6.60
5 Electricity, gas and water supply 7.26 9.97 13.36 10.58 8.99 7.40 6 Construction 6.58 7.21 6.95 8.42 8.04 8.56 7 Wholesale and retail trade 5.86 5.85 6.69 6.70 6.18 6.57 8 Hotel and restaurant 5.86 6.01 6.20 6.39 6.49 6.70 9 Transport, storage and communication 8.05 7.55 8.44 9.15 6.27 6.47
10 Financial intermediation -0.03 6.25 10.44 14.76 9.11 9.12 11 Real estate, renting and business services 3.83 3.85 3.88 3.92 4.04 4.24 12 Public Administration and defense 7.11 8.23 8.84 7.53 6.53 7.06 13 Education 5.89 5.18 5.63 7.75 6.30 8.22 14 Health and social services 3.04 6.83 6.34 3.81 4.76 5.02 15 Community, social and personal services 3.20 3.21 3.23 3.25 3.25 3.27
GDP at constant market prices 5.05 5.57 6.46 6.52 6.01 6.12
Source: National Accounting Wing, BBS. Note: (p) denotes provisional.
10.11 Espenditure Base Gross domestic Product at Current Prices (Million Taka)
2008-09 2009-10 2010-11 2011-12 2012-13 2013-14(p)
Domestic demand 7464852 8408979 9780950 11294753 12750971 14219442 Consumption 5617137 6315707 7269658 8312500 9347273 10344302 Private 5257991 5910930 6802819 7780747 8733888 9642213 General Goverment 359146 404777 466839 531753 613385 702090 Investment 1847715 2093272 2511292 2982253 3403697 3875139 Private 1543343 1720512 2029788 2374233 2607486 2889110 Public 304372 372760 481504 6080200 796211 986029 Resource balance -438028 -458953 -693896 -821766 -865701 -739119 Exports 1194401 1277985 1824521 2127459 2342441 2669212 Imports 1632429 1736938 2518417 2949225 3208142 3408330 Gross Domestic Expenditure at m.p. 7026824 7950026 9087054 10472987 11885270 13480323 Gross domestic Product at m.p. 7050718 7975387 9158288 10552040 11989232 13509204 Statistical discrepancy 23894 25361 71234 79053 103962 28881 Net factor income at m.p. 559012 646035 725135 893020 964291 900166 Gross National Income at m.p. 7609730 8621422 9883423 11445060 12953523 14409370 Net current transfers from abroad 24069 42479 31015 17909 53749 61064 Gross disposable National Income 7633799 8663901 9914438 11462969 13007272 14470434 Gross domestic saving 1433581 1659680 1888630 2239540 2641959 3164902 Gross National saving 2016662 2348194 2644780 3150469 3659999 4126131 Currenet Account Balance 145053 229561 62254 89163 152339 222111 Memo items : (%of GDP) Consumption 79.67 79.19 79.38 78.78 77.96 76.57 Private 74.57 74.11 74.28 73.74 72.85 71.38 General Government 5.09 5.08 5.1 5.04 5.12 5.2 Investment 26.21 26.25 27.42 28.26 28.39 28.69
Private 21.89 21.57 22.16 22.5 21.75 21.39 Public 4.32 4.67 5.26 5.76 6.64 7.3 Export of goods & services 16.94 16.02 19.92 20.16 19.54 19.76 Imports of goods & services 23.15 21.78 27.5 27.95 26.76 25.23 Gross Domestic saving 20.33 20.81 20.62 21.22 22.04 23.43 Gross National saving 28.6 29.44 28.88 29.86 30.53 30.54 Source : National Accounting Wing, BBS 253 Note: (p) denotes provisional.

254
10.12 Expenditure Based Gross Domestic Product at Constant Prices (Base 2005-06) (Million Taka) 2009-10 2010-11 2011-12 2012-13 2013-14
Domestic demand 6262006 6722383 7117786 7490025 7808394
Consumption 4532147 4827133 5022250 5282071 5459841
Private 4215874 4489555 4674267 4913936 5047907
General Government 316273 337578 347983 368135 411934
Investment 1729859 1895251 2095536 2207954 2348553
Private 1424669 1537984 1684114 1713349 1777506
Public 305191 357267 411422 494605 571048
Resource balance -207566 -266285 -269199 -255176 -149615
Exports 963495 1246176 1402350 1436734 1527770
Imports 1171061 1512460 1671549 1691911 167385
Gross Domestic Expenditure at m.p. 6054440 6456098 6848587 7234849 7658780
Gross Domestic Product at m.p. 6070972 6463423 6884932 7298965 7745385
Statistical Discrepancy 16532 7324 36345 64116 86605
Net factor income from abroad 491434 511262 582672 587054 516102
Gross National Income at m.p. 6562406 6974685 7467605 7886019 8261487
Net current transfers from abroad 32313 21867 11685 32722 35011
Gross Disposable National Income 6594719 6996552 7479290 7918741 8296498
GDP Deflator 131.46 14183 153.26 164.26 174.42
Implicit deflators : base=1995-96
Final consumption expenditure :
Consumer prices index (rebased) 140.21 151.53 166.46 177.74 191.01
CPI (Government employee, rebased) 127.98 138.29 152.81 166.62 170.44
Gross Capital Formation
Construction Materiel Price Index 120.35 129.76 137.15 156.31 171.46
(Building Materiel Price Index) 139.59 154.57 167.70 192.72 211.79
Other construction (Kutcha) 125.07 139.39 155.61 173.24 188.59
Planted Machinery 107.79 112.03 15.71 115.71 116.66
Transport equipments 122.65 141.24 142.53 144.39 146.24
Other capital goods 131.34 135.48 136.87 139.05 139.28
Source :National Accounting Wing
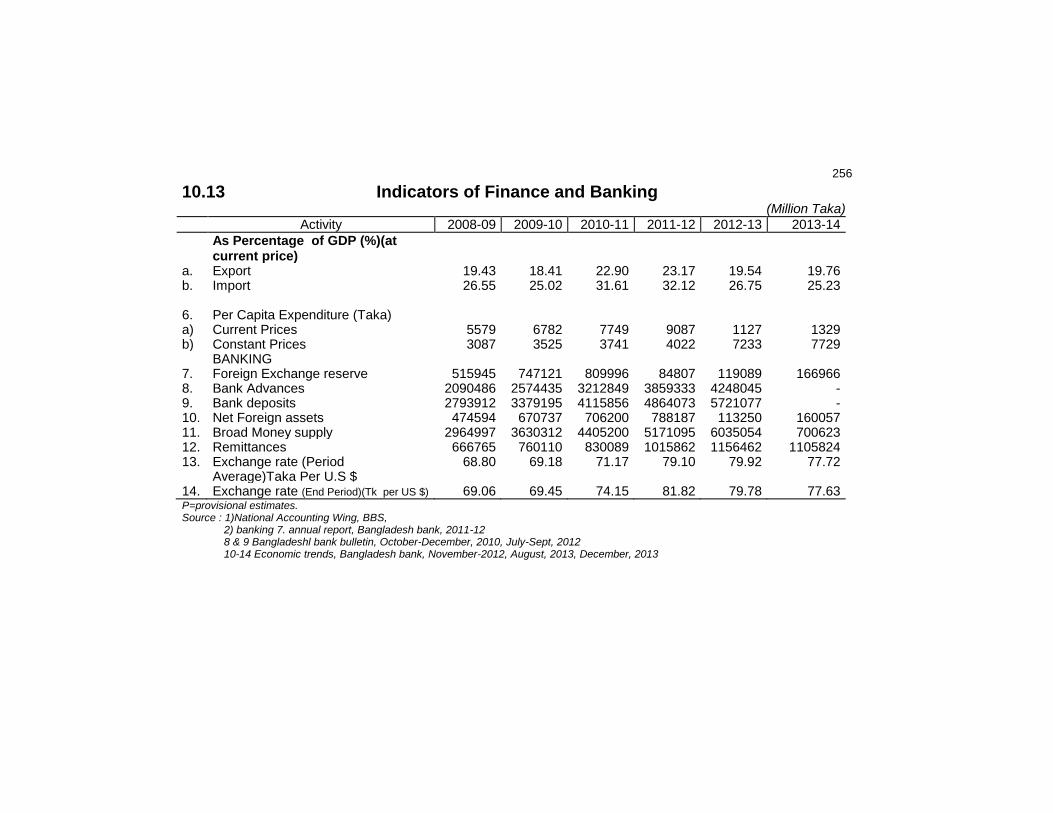
256
10.13 Indicators of Finance and Banking (Million Taka)
Activity 2008-09 2009-10 2010-11 2011-12 2012-13 2013-14
As Percentage of GDP (%)(at current price)
a. Export 19.43 18.41 22.90 23.17 19.54 19.76 b. Import 26.55 25.02 31.61 32.12 26.75 25.23 6. Per Capita Expenditure (Taka) a) Current Prices 5579 6782 7749 9087 1127 1329 b) Constant Prices 3087 3525 3741 4022 7233 7729 BANKING 7. Foreign Exchange reserve 515945 747121 809996 84807 119089 166966 8. Bank Advances 2090486 2574435 3212849 3859333 4248045 - 9. Bank deposits 2793912 3379195 4115856 4864073 5721077 - 10. Net Foreign assets 474594 670737 706200 788187 113250 160057 11. Broad Money supply 2964997 3630312 4405200 5171095 6035054 700623 12. Remittances 666765 760110 830089 1015862 1156462 1105824 13. Exchange rate (Period
Average)Taka Per U.S $ 68.80 69.18 71.17 79.10 79.92 77.72
14. Exchange rate (End Period)(Tk per US $) 69.06 69.45 74.15 81.82 79.78 77.63 P=provisional estimates. Source : 1)National Accounting Wing, BBS, 2) banking 7. annual report, Bangladesh bank, 2011-12 8 & 9 Bangladeshl bank bulletin, October-December, 2010, July-Sept, 2012 10-14 Economic trends, Bangladesh bank, November-2012, August, 2013, December, 2013

257
10.14 Government Resources by Sources (Million Taka)
Heads 2009-10 2010-2011 2011-2012 2012-13 2013-14 1. Total Govt. resources (a+b) 1068780 1351480 1692160 1873130 2372800
(a) Internal Resources 917250 1200040 1455930 1671330 2102660 (i) Revenue Receipts 759050 951870 1183850 1281280 1566710 Tax-Revenue 624850 790520 957850 1074530 1301780 Non-Tax Revenue 134200 161350 226000 206750 264930 (ii) Domestic capital (Net) 158200 248170 272080 370050 535950 (iii) T & T Board 62130 5190 22510 47180 130270 (iv) Self Financing Autonomous Bodies -20920 183790 189570 285580 295680 (v) Borrowing from Banking System 116990 59190 60000 57290 110000
(b)External Resources (Grants & Loans) 151530 151440 236230 201800 270140 (i) Project and non-ADP project aid 5200 134300 207200 188180 242580 (ii) Commodity aids and others 145320 13500 25200 7930 24000 (iii) Food aid 1010 3640 3830 5690 3560
2. Use of resources 1068780 1351480 1692160 1766450 2116010 (i) Revenue 731670 831770 1029030 1232370 1550280 (ii) Annual Development Program 259170 328300 348500 500350 5279500 (iii) Non-ADP Project 16340 24410 33660 18020 30580 (iv) Food for Work Programe 9280 12940 12760 15710 6150 (v) Net outlay for Food Account Operation (-)52320 (-)154060 (-)268210 -106680 -256790
R=Revised. Source: National Accounting Wing, BBS.

258
10.15 Consolidated Receipts and Expenditure (Million Taka)
Heads 2009-10 2010-11 2011-2012 2012-13 2013-14 1. Total Receipts (a+b+c) 1068780 1351480 1692160 1873130 2372800 (a) Revenue Receipts 759050 951870 1183850 1281280 1566710
(i) Tax 624850 790520 957850 1074530 1301780 (ii) Non-Tax 134200 161350 226000 206750 264930
(b) Other Internal Receipts 158200 248170 272080 390050 535950 (c) Foreign grants and loan receipts 151530 151440 236230 201800 270140
(i) Project and non-ADP project aid 5200 134300 207200 188180 242580 (ii) Food, Commodity and others 146330 17140 29030 13620 27560
2. Total Expenditure (a+b) 990840 1160070 1377530 1732720 2079280 (a) Revenue Expenditure 731670 831770 1029030 1232370 1559280
(i) Wages and Salaries 163650 213120 225350 220020 28540 (ii) Commodities and services 78000 110690 122220 119830 206180 (iii) Transfer 457590 297740 346420 367040 408190 (iv) Capital Expenditure 32430 210220 335040 525480 659470
(b) Development Expenditure 259170 328300 348500 500350 520000 (i) Agriculture, Flood control, Water Resources and Rural Institution
63465 80393 75336 110610 114954
(ii) Industry - - - - - (iii) Transport and Communication 4524 5730 4471 17137 17810 (iv) Others 35943 45530 60096 88932 92424
As Percent 0f GDP A 155238 196647 208597 283671 294812 Total Receipts 16.62 16.96 18.43 19.23 - Tax Revenue 9.23 9.92 10.43 11.25 - Development Receipts 4.46 5.02 5.54 5.77 - Total Expenditure 14.27 14.56 15.02 15.35 - Development Expenditure 3.73 4.12 3.81 4.59 - Source : National Accounting Wing, BBS.

259
10.16 Revenue Receipts by Principal Heads (Million Taka) Principal Heads 2009-10 2010-11 2011-12 2012-13 2013-4
Customs 104300 108880 126340 126310 134330
Excise 2610 2750 4500 7510 12030 VAT & Supp.Tax 332800 418280 505240 549660 650340 Income Tax 165600 221050 275610 344030 443700 Private Banks,Industries
& Investment organizations 25452 13819 18454 15614 20238 Stamps 18290 19620 23000 27190 32640 Land Revenue 3921 5254 5697 5170 6870 Registration 8504 12898 16396 106807 138440 Post, Telegraph & Telephone 2195 2370 2810 2410 2940 Others 95833 146949 205803 96579 125180 Total Revenue 759050 951870 1183850 1281280 156710 Total Tax Revenue 624850 79052 957847 1074530 1301780 Total Tax Revenue as % of GDP* 9.23 9.92 10.43 11.25 - Total Revenue % as GDP 11.48 11.95 12.89 13.45 - * GDP at current price, B=budget estimates. Source : Budget Book, Ministry of Finance.

260
10.17 Economic Classification of Revenue Budgets (Million Taka)
Items 2010-11 2011-12 2012-13 2013-14
A. Total revenue receipts 951870 1183850 1281280 1566710
1. Total tax revenue 790520 957847 1074530 1301780
a) Direct tax 226304 281307 344030 443700
b) Indirect tax 530960 637080 675970 784670
c) Other taxes and duties 33256 39460 54530 73410
2. Total non-tax receipt 161350 226004 206750 264930
a) Income from property 65429 75184 53710 60337
b) Fees & Misc. receipts 95921 150820 153040 204593
B. Total revenue
Expenditure (Gross) 831770 1029030 1232370 1559280
1. Consumption expenditure 323810 347570 339850 491620
a) Wages salaries 213120 225350 220020 285440
b) Goods and services 110690 122220 119830 206180
2. Transfer payments 469790 641000 850890 1003200
a) Autonomous bodies 74650 101855 206793 244466
b) Local bodies 880 1200 7667 9064
c) Misc. transfer 103550 208205 314066 260294
d) Subscriptions to UN and other
Foreign Organisation 770 910 630 1110
e) Subsidy to Food 10000 6310 8496 11886
f) Subsidy to Corporation 94110 92860 14418 142780
g) Pension and Gratuity 40050 49700 59760 68180
h) Interest 145780 179960 239150 265420
3. Capital Expenditure(Construction
Machinery etc.) 38170 40460 41630 64460 Source : Budget Book, Ministry of Finance.

261
10.18 Revenue Expenditure by Functions (Million Taka)
Functions 2009-10 2010-11 2011-12 2012-13 2013-14
01 General Public Service 60710 87150 216250 95270 276320
02 Defense Affairs and Service 86630 91310 119510 118120 14948
03 Public Order and safety Affairs 56220 69040 84540 89130 109440
04 Education affairs and Services 117360 136760 141490 148580 186500
05 Health Affairs and Services 3802 48810 53070 52330 61390
06 Social Security and Welfare Affairs and services 55600 79460 85410 74550 97020
07 Housing and Community ameneties Affairs and services 7120 8280 8220 8950 9530
08 Recreational Cultural and religious Affairs and Services 6300 6260 10150 12110 13110
09 Fuel and Energy Affairs and Services 1110 50 440 1450 420
10 Agri. Forestry, Fishing & Hunting Affairs & Services 76160 88270 90540 161670 134070
11 Mining & Mineral, Manufacturing Affairs and
Services
17440 2140 2250 2780 1260
12 Transport and Communication and Services 66230 68760 35360 40250 46200
13 Other Economic Affairs and Services 14390 9280 4180 3310 4740
14 Exp. not classified by Major Group 162598 136200 177620 423870 595332
Total 750192 831770 1029030 1232370 1550280
Source : National Accounting Wing, BBS.

262
10.19 Development Expenditure by Sectors (Million Taka)
2010-11 2011-12 2012-13 2013-14
Agriculture 20618 19800 26962 28020 Rural development 46120 42736 67714 70373 Flood control & water resources
13654 12800 15934 16560
Industry 5732 4471 17137 17810 Power and natural resources 42969 67548 104978 109100 Transport 41072 52642 82081 85304 Communication 3440 7454 6851 7120 Education & Training 56502 52130 66345 68950 Health, Pop. control and Family
Welfare 32820 30270 35088 36466 Physical Planning and Housing 50866 50930 58439 60734 Others* 14507 7719 18821 19563 Total 328300 348500 500350 520000 Note: (i) * Others include social welfare, labour training and cyclone
reconstruction, scientific & technological research, public administration. (ii) figures of BBS may differ with those of ADP (ministry of planning) as these are based on estimates. Source: National Accounting Wing, BBS.

263
10.20 Economic Classification of Development Expenditure by Investment and Non investment. (Million Taka)
2010-11 2011-12 2012-13 2013-14(R)
Investment :
1. Construction 136980 145408 207664 215819
2. Land improvement plantation 7952 8441 12054 12527
3. Breeding stock 228 242 346 360
4. Mechinery and Equipments 52866 56119 80146 83294
Sub-Total 198026 210210 300210 312000
Non-Investment :
1. Wages and salaries 38695 41075 59445 61780
2. Contigencies & other expenditure 41929 44508 64413 66942
3. Interest and Re-payment of loan
2544 2700 3907 4060
4. Subsidy 45977 48806 70635 73409
5. Land purchase 1129 1201 1740 1809
Sub Total 130274 138290 200140 208000
Grand total 328300 348500 500350 520000 Note: i) R= Revised ii) Data on development expenditure has been obtained from government agencies
through detailed questionnaire and also derived through analysis of ADP . iii) Construction consists of all kinds i.e. buildings, roads, canals embankments, line
construction. iv) Machinery & equipment includes transport machinery, agricultural machinery and
equipment and all other machinery & equipments. It also includes office equipments and furniture.
Source: National Accounting Wing, BBS.

264
10.21 Government Gross Fixed Capital Formation (Million Taka)
Subject 2010-11 2011-12 2012-13 2013-14
1.Construction 136980 145408 207664 215819
a) Residential building 2775 2946 4207 4372
b) Non-residential building 37057 39337 56180 58386
c) Other construction 97148 103125 147277 153061
2. Land improvement plantation
and orchard development` 7952 8441 12054 12527
a) Land improvement 4404 4675 6676 6938
b) Plantation and orchard
development 3548 3766 5378 5589
3. Machinery and Equipments 52866 56118 80146 83294
a) Transport equipment 8987 9540 13625 14160
b) Agricultural machinery
equipments 266 2823 4032 4190 c) Other machinery and equipment 43613 43755 62489 64944
4. Breeding stock, draught animal
dairy cattle and the like 228 243 346 360 Grand total 198026 210210 300210 312000 Note: Gross fixed capital formation of the government sector has been derived by
analysis of the ADP and data obtained through detailedquestionnaire from govt. agencies.
Source: National Accounting Wing, BBS.

265
10.22 Money Supply and Foreign Exchange Reserves (Million Taka)
Year Money Supply Foreign
(End of June) Currency outside bank
Demand Deposit
Total money supply
exchange reserve*
2001-02 125314 116204 241518 90858 2002-03 139018 128279 267297 141753 2003-04 158110 146126 304236 163241 2004-05 185181 168499 353680 186769 2005-06 228621 197396 426017 242914 2006-07 266438 234625 501063 349314 2007-08 326899 265176 592075 421377 2008-09 360492 302365 662857 515945 2009-10 461571 416218 877789 747121 2010-11 547951 481062 1029013 809996 2011-12 584171 510604 1094775 848071 2012-13 675529 557365 1232894 1190896 2013-14 769084 643443 1412527 1669666 Excluding inter-bank Items. position as on June 30 each year. * include reserve position in the IMF Source : Economic trends ,Bangladesh Bank August-2013 Annual report, Bangladesh Bank, 2013-14
10.23 Growth of Bank Credit and Bank Deposits (Million Taka) Year Bank Credit Bank Deposit Post
(End of June)
Advance Bills Total Credit
Demand Deposits
Time Deposits
office deposit
2000-01 670909 35236 707145 108691 648268 10392 2001-02 759540 36391 795931 116204 744549 13854 2002-03 845715 42231 887946 128279 872511 22080 2003-04 950040 70332 1020372 146126 992737 33995 2004-05 1114710 82954 1197664 168499 1160423 46602 2005-06 1296481 143079 1439560 197396 1380219 50277 2006-07 1484298 164649 1648947 234625 1613362 56193 2007-08 1831144 135262 1966406 265176 1894805 50313 2008-09 2142186 117151 2259337 302365 2300730 60847 2009-10 2641822 140676 2782498 416218 2750428 69353 2010-11 3266342 210423 3476765 481062 3374189 49760 2011-12 3876839 238522 4115361 510604 4073881 25337 2012-13 4311491 220153 4531644 557365 4799023 - 2013-14 4853997 193492 5047489 643443 5589784 - Note : (1) Bank credit. excluding Inter-bank. bank deposit excluding govt. and inter bank deposits. position as on June 30 each year. (2) Data have been revised according to latest available data. Source: Economic Trend, Bangladesh Bank, August, 2013

266
10.24 Bank Advances by Main Economic Purposes (Million Taka)
Economic purpose 30-06-10 30-06-11 30-06-12 30-06-13
1. Agriculture, forestry & fishing 155693 196552 209302 229771 2. Industry 542651 700543 796260 898338 3. Construction 181923 241901 320344 386274 4. Water works & sanitary services 621 1161 1549 7805 5. Trade 971696 1216810 1491348 1593569 6. Transport, storage & communication 41615 56336 89750 969679 7. Working capital financing 385164 470597 500067 570477 8. Misc. services 295072 328950 450713 471927 Grand total 2574435 3212849 3859333 4248045 Source: Bangladesh Bank Bulletin, Apr-June, 2013
10.25 Division wise Distribution of Bank Deposit and
Advance (all Banks)
(Million Taka)
Division Deposit Advance
30-06-11 30-06-12 30-6-13 30-06-11 30-06-12 30-6-13
Chittagong 795326 953849 1111877 627527 758285 846308
Urban 640864 761297 845672 584292 705406 756614 Rural 154462 192552 265605 43235 52879 89694 Dhaka 2662523 3129992 3688767 2149592 2594093 2850358
Urban 2453400 2864499 31884846 2044306 2468994 2650973 Rural 209123 265493 5002823 105286 125102 199385 Khulna 171192 195885 2373266 150179 168371 181279
Urban 129814 148256 1758155 123871 138386 136483 Rural 41378 47629 615111 26308 30485 44796 Barisal 67980 84253 1004874 34267 41565 45929
Urban 49389 61024 694279 20728 26317 27474 Rural 18591 23229 310595 13539 15248 18455 Rajshahi 155650 184768 2207595 123548 147957 164094
Urban 120698 143205 1663973 98894 119969 130461 Rural 34952 41563 543622 24654 27938 33633 Sylhet 187380 225590 2587096 53535 60635 63322
Urban 130513 157095 1693376 39394 44410 45136 Rural 56867 68495 893720 141401 16225 18186 Total 4115855 486492 5721077 3212849 3859332 4248045
Urban 3579850 4201456 4690168 2958355 3561553 3813784 Rural 536005 662616 1030909 254494 297774 434261 Figures may not add upto totals because of rounding.
Source: Bangladesh Bank Bulletin, Apr-June, 2013.

267
10.26 Bank Deposits and Advances by Selected Zilawise Urban Areas According
to Volume of Transactions (Million Taka)
Cities/Town Deposits Advances
2010 2011 2012 2010 2012 2013
Barisal 19852 24002 29825 10510 13238 17636
Bogra 24045 27612 33454 29816 34995 43249
Chandpur 12448 15291 19302 4655 5532 9647
Chittagong 377813 470949 550824 525569 633858 726829
Comilla 39064 45926 56607 14994 17604 291527
Dhaka 1852200 2237438 2593805 1907977 2311789 2571539
Faridpur 9651 12377 15747 9655 11961 17458
Noakhali 22520 27976 34068 12261 14508 22123
Jessore 19618 23512 28899 26004 28954 37114
Khulna 45993 57444 62758 64130 68160 76648
Kushtia 10422 13216 15366 16002 19625 26949
Mymensingh 17053 22120 27134 10645 13278 27273
Narayanganj 42646 54503 66737 61278 65198 83555
Pabna 12660 16455 19654 10658 13784 20772
Rajshahi 31397 35713 39652 26524 33132 38445
Rangpur 12209 15197 18163 13464 17688 25309
Sylhet 77578 90090 106804 27702 29914 38126 Notes: Position as on June 30 each year. Source: Bangladesh Bank Bulletin, Apr-June, 2013., 2012.

268
10.27 Advances Classified by Sector (all Banks) (Million taka)
Sectors 2010 2011 2012 2013
A. Public Sector 98788 119215 102704 112315 1. Government 2174 3360 3172 2691 2. Financial Instutions 37 - - - (Excluding Deposit money Bank) 3. Non Financial Public
Enterprises 75270 104650 78511 83392 a) Nationalised sector 83038
corporations 74823 104051 78129 354 b) Others 447 598 382 26832 4. Autonomous & Semi Auto 21239 11132 20974 -
nomous bodies
5. Local Authorities and others 100 73 470 -
B. Private Sector 2475647 3093633 3756628 4135730 1. Agriculture & Fishing Professionals
159321 205475 217911 220009
2. Manufacturing Companies 104654 133267 1583721 1765302 3. Constructions companies 61280 73154 98749 108583 4. Commerce and Trade 748288 936560 1089522 1183039 5. Transport & Storage
Companies 26470 37102 49302 58348 6. Private Trust fund and
Non-profit organisations - - - - 7. Professional & self employed persons 22544 28907 39615 38319 8. Financial Institution 62370 69641 81219 80694 9. Foreign official enterprises
& foreign companies/firms engaged in business in Bangladesh and others 348836 410123 596589 681429
Grand total 2574435 3212849 3859332 4248045 Note: Position as on June 30. total may differ due to rounding .
Source: Bangladesh Bank Bulletin, Apr-June, 2013.

269
10.28 Commitment and Disbursement of Foreign Aid (Million US Dollar) Commitment Disbursement
2010-11
2011-12
2012-13
2010-11
2011-12
2012-13
A. Food Aid:
Grants 111 2 - 55 69 50 Loans - - - - - - Total 111 2 - 55 69 50 B. Commodity Aid:
Grants - - - - - - Loans - - - - - - Total - - - - - - C. Project Aid:
Grants 519 1439 555 690 518 676 Loans 5338 3323 5300 1031 1539 2085 Total 5857 4762 5855 1721 2057 2761 D. Grants:
Food Aid 111 2 - 55 69 - Commodity Aid - - - - - - Project Aid 519 1439 555 690 518 676 Total 630 1441 555 745 587 726 E. Loans:
Food Aid - - - - - - Commodity Aid - - - - - - Project Aid 5338 3323 5300 1031 1539 2085 Total 5338 3323 555 1031 1539 2085 Total Grants/Loans 5968 4764 5855 1776 2126 2811
Source : Flow of External Resources Into Bangladesh, 30 June 2013.

270
10.29 Commitment and Disbursement of Foreign Aid by Principal Donors (Million US Dollar)
Commitment Disbursement
Name of Donor 2010-11 2011-12 2012-13 2010-11 2011-12 2012-13
ADB 923 879 1230 487 461 752 Australia - - - - - - Canada - 194 - 31 5 4 China 211 258 360 - 112 77 Denmark 37 - 125 33 45 41 EU 53 136 49 18 16 52 FR Germany 45 98 45 46 43 - IDA 2085 1625 808 553 621 770 IDB 155 18 405 17 17 23 IFAD 80 40 121 22 - 17 India 1000 - - - 13 175 Japan 651 99 -- 121 247 349 Kuwait 63 48 - 10 13 11 Netherlands - 15 80 - - 5 Norway 36 - - - - - Saudi Arabia 45 53 53 2 - 3 Sweden - 106 22 12 34 11 UK 110 333 2 103 137 109 UNICEF - - - 54 59 66 UN System 141 115 37 165 142 171 (Exclu.UNICEF) 15 USA 127 255 25 - - --
OTHERS - - - 1 - 2
Italy - - - - - -
NDE - - - - - - O.P.E.C - 28 30 11 23 6 U.A.E - 31 - - - - Switzerland 6 9 8 - - - Supplier’s Credit 211 325 64 - 34 62 South Korea - 83 22 74 60 38 Spain - - - - - -
Total 5979 4748 6501 1760 2082 2744
Source: Flow of External Resources Into Bangladesh, 30 June 2013.
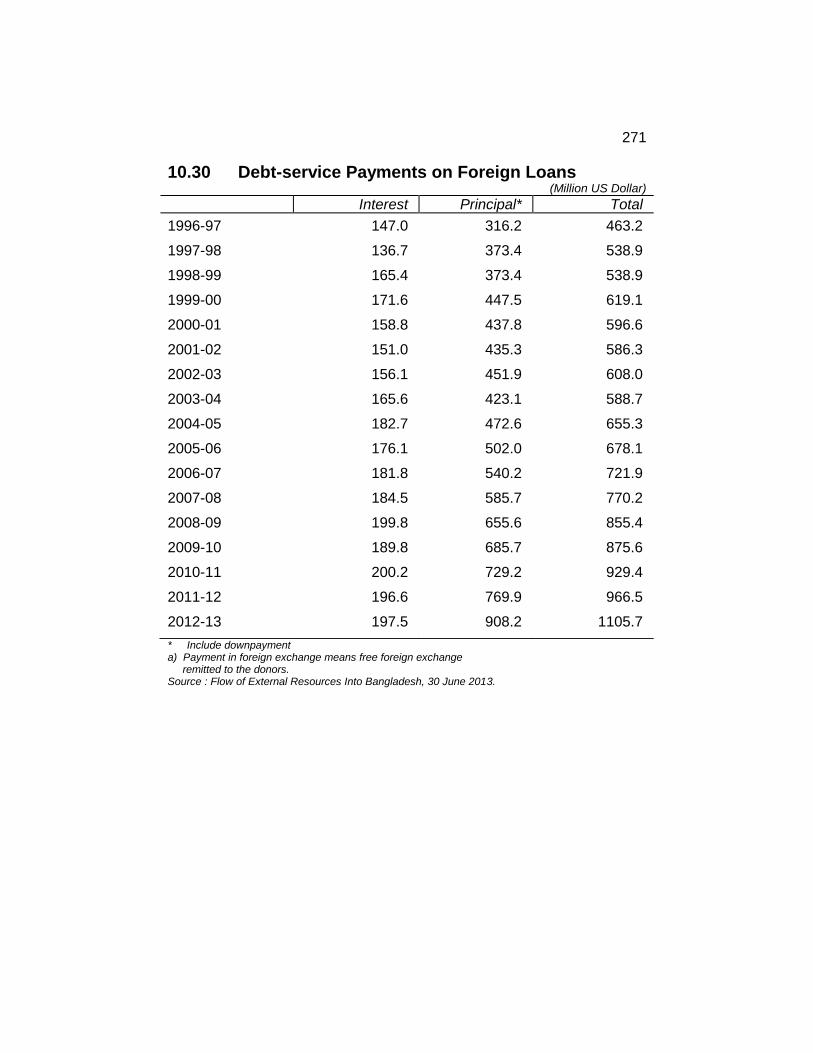
271
10.30 Debt-service Payments on Foreign Loans (Million US Dollar)
Interest Principal* Total
1996-97 147.0 316.2 463.2
1997-98 136.7 373.4 538.9
1998-99 165.4 373.4 538.9
1999-00 171.6 447.5 619.1
2000-01 158.8 437.8 596.6
2001-02 151.0 435.3 586.3
2002-03 156.1 451.9 608.0
2003-04 165.6 423.1 588.7
2004-05 182.7 472.6 655.3
2005-06 176.1 502.0 678.1
2006-07 181.8 540.2 721.9
2007-08 184.5 585.7 770.2
2008-09 199.8 655.6 855.4
2009-10 189.8 685.7 875.6
2010-11 200.2 729.2 929.4
2011-12 196.6 769.9 966.5
2012-13 197.5 908.2 1105.7
* Include downpayment a) Payment in foreign exchange means free foreign exchange
remitted to the donors. Source : Flow of External Resources Into Bangladesh, 30 June 2013.

272

273
Chapter XI
PRICES AND WAGES


275
11.01 Wage rate Indices by Major Sector in Bangladesh
(Base: 1969-70=100)
Period
General Nominal Indices
Agriculture
Fishery Manufacturing Industry
Construction
2001-02 2637.00 2262.00 2411.00 3035.00 2444.00
2002-03 2926.00 2443.00 2563.00 3501.00 2624.00
2003-04 3111.00 2582.00 2775.00 3765.00 2669.00
2004-05 3293.00 2719.00 2757.00 4015.00 2758.00
2005-06 3506.00 2925.00 3133.00 4293.00 2889.00
2006-07 3779.00 3151.00 3332.00 4636.00 3135.00
2007-08 4227.33 3524.00 3669.33 5196.83 3549.08
2008-09 5025.65 4273.71 4236.49 6128.36 4311.31
2009-10 5459.70 4832.49 4741.73 6536.53 4651.20
2010-11 5781.64 5325.63 5043.15 6778.06 4983.29
2011-12 6469.17 6133.58 5186.94 7221.12 6583.09
2012-13 7422.05 7448.50 6021.01 7978.14 7684.48
2013-14 8097.40 8282.91 6566.36 8699.92 8237.89
Source: National Accounting Wing, BBS.

11.02 Annual Average Wholesale Prices of Selected Consumer Goods in Dhaka
(Taka) Items Specification Unit 2009-10 2010-11 2011-12 2012-13
I. Cereals Rice Fine Quintal 3668.00 4496.00 4584.00 4138.00 Rice Medium Quintal 3417.00 3831.00 4042.00 3488.00 Rice Coarse Quintal 2589.00 3663.00 3075.00 2481.00 II. Pulses Moong Katcha, Husked Quintal 8711.00 12036.00 10543.00 10342.00 Masur Whole, Husked Quintal 11133.00 10500.00 9183.00 11384.00 Khesari Sup. quality Quintal 5503.00 4000.00 4017.00 5286.00 III. Spices Chillies Dry Sup. quality Quintal 12744.00 14787.00 15576.00 13027.00 Turmeric Dry Sup. quality Quintal 14033.00 29183.00 20765.00 11345.00 Onion Sup. quality Quintal 3200.00 3163.00 2877.00 3032.00 Garlic Sup. quality Quintal 7445.00 13383.00 7207.00 4236.00 Corriander
seed Sup. quality Quintal 7423.00 7500.00 6315.00 5900.00
IV. Protein items Egg (Hen) Fresh 100 733.00 737.00 813.00 950.00 Fish Ruhi Big size Quintal 21500.00 22483.00 24680.80 24314.00 V. Vegetables Potato Sup. quality Quintal 2141.00 1308.00 1618.00 1838.00 Brinjal Sup. quality Quintal 2479.00 2908.00 2630.00 2823.00 VI.Fuel & Lighting Kerosene White 4 gallon 852.00 1040.00 6130.00 1088.00 Matches 40 sticks Gross 152.44 227.00 217.00 245.00 VII. Miscellaneous Mustard oil Local Sup. quality Qntl. 14222.00 13700.00 15680.00 14977.00 Vegetable oil Pakvan 16 Kg. 1633.00 1922.00 2106.00 - Cocoanut oil Imported Quintal 20570.00 22000.00 33350.00 25500.00 Tobacco leaf Motihari Quintal 16556.00 16000.00 15110.00 22708.00 Betelnut Tanti whole Sup.
qlty. Quintal 13778.00 13000.00 19100.00 23923.00
Betel leaf Medium size (gaddi 6400)
5293.00 6417.00 6715.00 8936.00
Paper Foolscap Ream 337.00 360.00 350.00 354.00 Cigarette Star 250 sticks 1619.00 1818.00 1994.00 2250.00 Source: National Accounting Wing, BBS.
276

277
11.03 Annual Average Retail Prices of Selected Consumer Goods at Divisional Head Quarters (Taka)
Item Specification Unit 2009-10
2010-11
2011-12
2012-13 2013-14
I. Cereals & Cereal Products Rice-Fine Dhaka Kg 62.50 47.29 49.20 44.08 51.58 Chittagong Kg 58.00 44.64 46.50 44.56 52.18 Rajshahi Kg 70.00 45.25 46.97 41.73 50.61 Khulna Kg 56.00 43.25 45.15 42.00 50.56 Barisal Kg 53.50 44.89 44.43 43.24 5133 Sylhet Kg 57.00 46.06 49.44 40.85 51.35 Rice-Medium Dhaka Kg 38.75 42.07 42.45 35.50 47.42 Chittagong Kg 37.00 41.77 42.41 34.89 47.83 Rajshahi Kg 38.00 42.17 42.03 35.85 47.08 Khulna Kg 34.00 40.25 42.74 34.64 45.00 Barisal Kg 40.00 40.75 42.24 34.55 46.40 Sylhet Kg 35.75 40.88 42.01 33.00 46.33 Rice -coarse Dhaka Kg 29.35 35.93 33.20 30.83 38.00 Chittagong Kg 28.00 32.88 32.85 30.04 38.27 Rajshahi Kg 26.00 32.97 31.52 27.39 38.42 Khulna Kg 29.00 32.14 30.51 29.73 3813 Barisal Kg 26.00 34.59 29.88 27.73 37.04 Sylhet Kg 29.75 34.77 35.65 27.81 38.83 Wheat (Atta)- Dhaka Kg 31.41 32.92 34.30 37.33 38.83 Open-market Chittagong Kg 30.00 32.73 33.28 37.67 39.45 Rajshahi Kg 30.00 30.67 33.28 37.04 37..92 Khulna Kg 34.00 31.21 33.49 37.18 38.22 Barisal Kg 22.50 30.33 33.42 36.78 38.64 Sylhet Kg 30.00 34.13 34.30 38.25 39.17 II. Bread & Biscuits Bread (Loaf)- Dhaka Each 26.19 30.61 33.84 39.09 39.80 Local best Chittagong Each 30.00 30.76 31.85 34.38 39.50 (about 400 Rajshahi Each 28.00 25.20 33.77 30.60 34.50 gram) Khulna Each 25.00 25.79 30.77 31.00 34.00 Barisal Kg 21.50 29.95 30.82 37.78 38.80 Sylhet Kg 23.50 28.30 30.37 38.82 89.50 Biscuits Dhaka Kg 127.00 141.75 152.82 169.09 221.00 Local best Chittagong Kg 192.00 144.08 143.97 155.37 189.00 Rajshahi Kg 108.00 124.17 146.75 149.09 183.50 Khulna Kg 149.00 143.00 152.18 156.73 165.63 Barisal Kg 120.00 130.71 137.60 141.86 164.60 Sylhet Kg 87.50 - 130.44 141.50 179.89 III. Pulses Moong-Kutcha, Dhaka Kg 80.50 126.25 117.82 120.66 118.50 split Chittagong Kg 80.00 119.91 122.64 119.94 122.45 Rajshahi Kg 80.00 115.08 116.39 119.12 120.96
6 Khulna Kg 73.00 117.92 118.64 120.27 121.40 Barisal Kg 70.00 117.00 116.44 112.51 118.91 Sylhet Kg 75.00 126.71 117.44 116.92 123.33 Contd.

278
11.03 Annual Average Retail Prices of Selected Consumer Goods at Divisional Head Quarters (Taka)
Item Specification Unit 2009-10
2010-11
2011-12
2012-13
2013-14
Masur-Husked, Dhaka Kg 105.00 107.83 97.45 129.42 115.42 whole Chittagong Kg 105.00 107.73 97.82 126.22 117.36 Rajshahi Kg 100.00 101.17 97.70 126.64 116.25 Khulna Kg 102.00 96.33 96.91 125.45 115.11 Barisal Kg 90.00 100.25 98.55 124.42 118.67 Sylhet Kg 100.00 103.29 101.22 125.08 117.33 Khesari- Sup. Dhaka Kg 56.00 48.68 43.43 63.08 56.83 quality Chittagong Kg 56.00 48.01 42.21 61.89 58.09 Rajshahi Kg 52.00 45.01 42.41 64.51 57.42 Khulna Kg 54.00 42.47 41.57 65.27 58.87 Barisal Kg 53.50 45.80 43.54 65.09 58.83 Sylhet Kg 48.75 47.27 41.81 65.17 58.18 Gram-Sup. Dhaka Kg 67.00 60.17 77.45 97.92 70.83 quality Chittagong Kg 57.00 60.10 75.27 94.38 95.00 Rajshahi Kg 60.00 59.25 79.80 94.82 95.67 Khulna Kg 56.00 58.00 74.82 92.91 96.33 Barisal Kg 48.00 62.17 77.48 94.73 98.18 Sylhet Kg 56.00 59.25 78.62 95.47 98.00 IV. Meat Beef- Sup. Dhaka Kg 210.00 260.08 269.70 283.58 280.00 quality Chittagong Kg 265.00 275.27 291.45 342.22 345.45 Rajshahi Kg 203.00 246.33 259.08 266.36 279.58 Khulna Kg 180.00 226.33 259.54 257.27 267.78 Barisal Kg 210.00 251.50 262.89 277.27 276.44 Sylhet Kg 221.00 265.13 269.89 273.25 279.19 Mutton- Sup. Dhaka Kg 321.00 366.92 420.64 450.25 457.08 quality Chittagong Kg 328.00 374.09 428.27 476.67 464.00 Rajshahi Kg 314.00 346.00 385.69 407.00 462.50 Khulna Kg 299.00 347.00 409.27 410.00 411.11 Barisal Kg 255.00 351.67 382.04 471.32 463.09 Sylhet Kg 337.00 356.00 419.62 412.17 437.33 V. Poultry&Eggs Chicken- Live Dhaka Kg 236.00 237.33 313.50 372.92 377.25 weight Chittagong Kg 193.00 227.09 287.73 360.56 380.91 Rajshahi Kg 182.00 210.50 286.67 358.18 386.67 Khulna Kg 181.00 213.92 279.73 336.82 371.67 Barisal Kg 165.00 215.50 292.11 324.18 359.50 Sylhet Kg 277.50 244.75 275.00 332.12 375.00 Egg (Hen) Dhaka Dozen 78.00 77.81 93.21 111.08 105.50 Chittagong Dozen 81.00 75.90 86.47 109.00 92.78 Rajshahi Dozen 81.00 75.70 86.91 110.50 92.00 Khulna Dozen 75.00 73.56 88.91 107.73 90.10 Barisal Kg 82.50 74.06 88.30 107.27 96.25 Sylhet Kg 93.75 72.80 78.07 107.00 95.97 Contd.

279
11.03 Annual Average Retail Prices of Selected Consumer Goods at Divisional Head Quarters (Taka)
Item Specification Unit 2009-10
2010-11
2011-12
2012-13
2013-14
Egg (Duck) Dhaka Dozen 78.00 80.87 101.65 153.42 121.50 Chittagong Dozen 84.00 80.31 98.31 159.30 105..78 Rajshahi Dozen 84.00 78.87 99.26 156.73 112.20 Khulna Dozen 81.00 80.37 98.46 156.55 112.50 Barisal Kg 85.50 81.63 102.08 157.18 114.40 Sylhet Kg 81.00 83.81 96.58 155.67 115.83 VI. Fish (Fresh) Ruhu cut Dhaka Kg 238.00 277.08 303.25 277.14 343.33 piece Chittagong Kg 190.00 268.73 288.42 288.89 348.18 Rajshahi Kg 245.00 253.50 275.48 284.55 340.91 Khulna Kg 197.00 271.83 280.73 308.82 311.00 Barisal Kg 220.00 283.09 265.78 335.00 325.63 Sylhet Kg 187.50 277.00 291.87 338.22 371.25 Hilsha-Medium
Dhaka Kg 349.00 402.00 621.90 836.67 764.17
size Chittagong Kg 310.00 407.45 589.70 744.44 804.55 Rajshahi Kg 350.00 420.25 583.81 800.00 783.33 Khulna Kg 400.00 427.00 618.45 741.46 800.00 Barisal Kg 300.00 400.75 583.00 756.50 799.67 Sylhet Kg 272.50 405.14 513.00 770.92 812.50 Koi- Medium size
Dhaka Kg 310.00 293.42 242.00 255.42 257.08
Chittagong Kg 330.00 282.73 268.91 293.56 301.82 Rajshahi Kg 320.00 230.58 264.22 257.27 274.17 Khulna Kg 340.00 346.33 286.45 299.09 251.61 Barisal Kg 400.00 297.75 263.67 440.56 503.33 Sylhet Kg 210.00 241.63 253.33 290.17 325.42 VII. Milk & Milk Products Milk-Fresh Dhaka Litre 48.75 48.14 53.36 60.62 64.58 Chittagong Litre 43.00 41.79 46.39 58.00 65.91 Rajshahi Litre 36.00 39.31 46.80 51.36 59.50 Khulna Litre 34.00 34.57 44.49 50.91 54.44 Barisal Kg 37.50 43.21 50.25 51.82 60.33 Sylhet Kg 48.00 46.37 49.83 58.33 60.33 Ghee-Local Dhaka Kg 555.00 625.50 658.64 768.00 815.42 best Chittagong Kg 400.00 528.64 616.73 670.00 808.57 Rajshahi Kg 505.00 553.50 610.69 772.73 768.00 Khulna Kg 550.00 605.33 659.36 709.09 760.00 Barisal Kg 575.00 580.75 631.45 815.50 772.00 Sylhet Kg 500.00 558.13 584.78 772.08 736.67 Butter-Local Dhaka Kg 470.00 421.43 138.25 - 70.00 best Chittagong Kg 400.00 - 131.09 - - Rajshahi Kg - 700.00 127.56 - - Khulna Kg 450.00 671.43 129.82 - 76.67 Barisal Kg 725.00 478.57 125.67 - 65.00 Sylhet Kg 540.00 250.00 127.00 - 68.00 Contd.

280
11.03 Annual Average Retail Prices of Selected Consumer Goods at Divisional Head Quarters (Taka)
Item Specification Unit 2009-10
2010-11
2011-12
2012-13
2013.14
VIII. Fruits 67.58 Banana- Sabri Dhaka Dozen 36.00 46.07 53.55 67.91 67.86 Med. size Chittagong Dozen 30.00 36.07 48.73 69.00 59.70 Rajshahi Dozen 24.00 43.01 47.32 49.91 57.55 Khulna Dozen 30.00 39.56 49.62 60.00 60.80 Barisal Kg 24.00 45.50 56.63 66.09 71.50 Sylhet Kg 45.00 47.97 47.78 73.50 100 Mango- Fazli Dhaka Kg 75.00 70.50 111.50 108.33 120 Med. size Chittagong Kg 75.00 70.00 117.50 100.00 90 Rajshahi Kg 70.00 80.00 99.00 95.00 00 Khulna Kg 65.00 80.00 111.50 117.50 120 Barisal Kg 75.00 90.00 125.00 92.50 120 Sylhet Kg 60.00 - 120.00 11.000 - Pineapple, Dhaka Each 21.00 22.22 19.17 34.83 46.00 Jaldubi Medium
Chittagong Each 8.00 15.23 20.00 30.80 45.38
size Rajshahi Each 25.00 19.00 26.66 31.17 44.50 Khulna Each 15.00 20.00 20.50 45.00 41.50 Barisal Kg 20.00 22.00 21.00 33.20 42.88 Sylhet Kg 18.00 22.35 16.67 28.29 41.33 Coconut, Dhaka Each 26.00 28.10 36.02 36.00 40.64 Dry Med. size
Chittagong Each 20.00 25.78 33.74 35.30 37.17
Rajshahi Each 18.00 26.05 28.99 33.10 36.06 Khulna Each 18.00 20.40 31.37 32.27 36.19 Barisal Kg 26.00 23.80 29.78 32.25 36.79 Sylhet Kg 28.00 26.33 31.17 32.25 17.00 IX. Vegetable Potato Dhaka Kg 18.00 13.93 16.67 91.78 17.00 Superior Chittagong Kg 18.00 12.99 16.00 21.09 17.09 quality Rajshahi Kg 18.00 13.68 16.04 22.89 16.08 Khulna Kg 18.00 14.08 15.79 20.50 16.11 Barisal Kg 19.50 13.35 15.69 21.33 16.03 Sylhet Kg 18.00 14.00 15.45 20.50 14.83 Brinjal Dhaka Kg 30.00 32.30 35.64 41.50 42.50 Chittagong Kg 20.00 26.32 30.95 32.78 44.67 Rajshahi Kg 18.00 25.89 30.62 33.45 38.33 Khulna Kg 23.00 25.94 28.61 28.27 37.56 Barisal Kg 30.00 24.28 28.94 34.60 38.42 Sylhet Kg 25.00 28.45 29.19 31.75 39.83 Patal-Sup. Dhaka Kg 26.00 26.27 37.03 33.78 33.75 quality Chittagong Kg 24.00 19.20 36.77 28.75 33.33 Rajshahi Kg 23.00 21.11 34.79 28.17 20.00 Khulna Kg 19.00 20.47 33.33 35.27 28.88 Barisal Kg - 21.97 34.30 28.38 25.00 Contd.

281
11.03 Annual Average Retail Prices of Selected Consumer Goods at Divisional Head Quarters (Taka)
Item Specification Unit 2009-10 2010-11 2011-12
2012-13
2013-14
Sylhet Kg 23.75 26.05 36.16 30.40 30.10 Cauliflower Sup. Dhaka Kg 26.00 21.67 14.00 30.89 22.80 quality 12 Cha- Chittagong Kg 14.00 22.50 15.06 20.57 25.20 tak to 1 kg size Rajshahi Kg 15.00 19.43 14.18 28.36 32.88 Khulna Kg 09.00 17.07 14.24 27.67 25.40 Barisal Kg 17.00 19.67 14.50 29.67 26.30 Sylhet Kg 26.65 25.37 15.56 28.44 22.56 Cabbage Sup. Dhaka Kg 18.00 16.25 17.75 30.00 22.11 quality 2.50 kg Chittagong Kg 09.00 15.49 10.50 17.38 18.36 size Rajshahi Kg 09.00 16.00 11.00 17.80 17.50 Khulna Kg 08.00 16.00 09.00 17.63 19.44 Barisal Kg 14.00 16.00 08.00 19.67 20.67 Sylhet Kg 17.00 23.25 08.50 21.89 186.67 Mustard Oil Dhaka Kg 148.00 145.92 169.11 194.17 191.82 local best Chittagong Kg 133.00 137.55 164.54 191.72 190.00 Rajshahi Kg 122.00 138.17 164.91 194.09 175.56 Khulna Kg 125.00 139.25 164.91 182.73 175.03 Barisal Kg 152.50 137.75 164.60 170.36 191.92 Sylhet Kg 150.00 144.88 157.33 182.33 120.33 Soyabean oil- Dhaka Kg 96.00 104.58 128.18 132.58 119.22 imported Chittagong Kg 96.00 102.36 129.20 131.00 122.25 best quality Rajshahi Kg 87.00 102.00 128.17 132.73 122.44 Khulna Kg 97.00 103.67 126.27 134.27 120.75 Barisal Kg 100.00 103.83 127.33 131.82 123.50 Sylhet Kg 88.75 108.75 127.33 133.29 28.81 XI. Spices Salt-Fine Dhaka Kg 16.50 19.71 23.23 30.64 28.73 Chittagong Kg 18.00 18.32 23.63 30.11 28.00 Rajshahi Kg 16.00 20.33 23.99 30.18 28.88 Khulna Kg 16.00 18.99 24.00 30.82 28.32 Barisal Kg 18.00 18.99 24.31 31.88 29.98 Sylhet Kg 17.25 19.36 21.19 31.55 185.42 Chillies-(dry) Dhaka Kg 126.00 164.33 188.64 158.33 191.36 Chittagong Kg 145.00 153.68 174.24 194.44 184.08 Rajshahi Kg 120.00 154.25 181.58 172.27 188.33 Khulna Kg 100.00 159.17 184.45 168.18 164.83 Barisal Kg 92.50 156.25 176.00 145.18 176.25 Sylhet Kg 127.50 165.50 179.00 156.58 53.75 Onion Dhaka Kg 31.00 33.26 29.82 35.83 55.18 Chittagong Kg 26.00 29.01 29.60 32.89 51.55 Rajshahi Kg 28.00 30.54 28.21 33.82 47.80 Khulna Kg 28.00 29.60 28.90 36.45 53.03 Barisal Kg 33.00 29.61 30.43 34.48 51.42 Sylhet Kg 27.50 30.54 29.64 34.83
Contd.

282
11.03 Annual Average Retail Prices of Selected Consumer Goods at Divisional Head Quarters (Taka) Item Specification Unit 2009-10 2010-11 2011-12 2012-13 2013-14 Garlic Dhaka Kg 58.00 141.58 58.91 57.08 80.42 Chittagong Kg 58.00 129.64 58.36 65.00 83.18 Rajshahi Kg 55.00 140.58 62.92 55.45 84.27 Khulna Kg 56.00 141.50 58.48 54.55 80.33 Barisal Kg 50.00 136.37 60.70 56.64 74.55 Sylhet Kg 53.50 135.88 59.58 58.83 83..58 Turmaric-local Dhaka Kg 30.00 282.42 181.75 113.75 117.42 Chittagong Kg 30.00 254.91 195.36 100.56 118.22 Rajshahi Kg 28.00 263.64 187.58 95.71 117.88 Khulna Kg 29.00 266.91 193.82 115.45 115.00 Barisal Kg 32.50 279.67 176.10 110.00 105.22 Sylhet Kg 261.29 226.71 131.83 126.25 XII.Sugar&Gur Sugar-white Dhaka Kg 15.00 56.50 62.36 51.42 47.17 Open market Chittagong Kg 15.00 56.55 62.00 51.67 47.55 Rajshahi Kg 14.00 55.17 60.75 51.18 47.00 Khulna Kg 14.00 55.50 60.45 52.30 47.44 Barisal Kg 12.00 53.60 59.50 51.95 47.80 Sylhet Kg 16.25 56.63 61.50 52.06 49.25 Gur Dhaka Kg 54.00 65.17 74.00 78.75 77.08 (Sugarcane) Chittagong Kg 58.00 60.64 71.36 73.90 7709 Rajshahi Kg 50.00 60.25 66.50 72.82 75.55 Khulna Kg 40.00 59.42 63.36 70.10 73.50 Barisal Kg 75.00 61.42 66.17 72.60 68.33 Sylhet Kg 60.00 63.25 75.00 78.08 77.50 XIII.Tobacco, Betelleaf&Tea Tobacco, Dhaka Kg 157.00 153.30 180.96 288.33 296.67 leaf-Motihari Chittagong Kg 150.00 150.00 250.00 276.67 267.73 Rajshahi Kg 130.00 145.00 166.67 285.00 298.64 Khulna Kg 130.00 156.59 170.08 230.73 293.33 Barisal Kg 140.00 149.78 173.08 269.00 280.00 Sylhet Kg 145.00 147.74 167.87 230.64 297.92 Cigarette-Gold Dhaka Packet 58.00 68.25 82.00 98.73 99.50 leaf (King size Chittagong of 20 58.00 67.18 80.36 96.10 98.82 filter tipped) Rajshahi “ 55.00 68.58 79.58 97.60 100.08 Khulna “ 56.00 66.83 81.36 95.73 99.000 Barisal “ 50.00 66.67 81.40 96.91 96.97 Sylhet “ 53.50 67.38 78.78 96.37 97.95 Cigarette- Dhaka Packet 30.00 - - - - Capstan Chittagong of 20 30.00 - - - - (Filter) Rajshahi “ - - - - - Khulna “ 28.00 - - - - Barisal “ 29.00 - - - - Sylhet “ 32.50 - - - -

283
Contd.
11.03 Annual Average Retail Prices of Selected Consumer Goods at Divisional Head Quarters (Taka)
Item Specification Unit 2009-10 2010-11 2011-12 2012-13
2013.14
Cigarette-Star Dhaka Packet 15.00 18.50 50 57.14 - Chittagong of 10 15.00 19.00 48 56.00 - Rajshahi " 14.00 19.50 46 45.20 - Khulna " 14.00 18.50 50 51.00 - Barisal " 12.00 18.50 47.50 48.00 - Sylhet " 16.25 18.00 49.00 45.33 - Betel leaf (pan)
Dhaka Bira of 80
54.00 74.25 88.58 97.58 85.50
Medium size Chittagong " 58.00 67.27 70.79 97.33 93.30 Rajshahi " 50.00 68.83 73.34 86.73 84.17 Khulna " 40.00 66.25 67.50 98.18 89.00 Barisal " 75.00 65.58 73.60 76.18 83.75 Sylhet " 60.00 65.63 67.27 92.08 93.33 Betelnut-tanti Dhaka Kg 157.00 147.00 280.40 278.33 362.50 whole Chittagong Kg 150.00 143.18 273.27 268.89 367.27 Rajshahi Kg 130.00 138.33 271.67 279.64 341.82 Khulna Kg 130.00 130.83 268.82 259.55 320.00 Barisal " 140.00 130.42 261.90 213.00 275.73 Sylhet " 145.00 147.50 284.11 271.17 33167 Tea (loose) Dhaka Kg 174.00 247.50 271 337.14 354.44 Superior Chittagong Kg 180.00 240.55 252.50 320.25 362.22 quality-dust Rajshahi Kg 200.00 252.83 255.22 307.00 352.78 Khulna Kg 170.00 262.25 263.22 278.75 336.67 Barisal " 167.50 231.75 233.78 260.00 322.22 Sylhet " 172.50 248.75 252.67 285.73 342.22 XIV. Fuel and Lighting Fire wood- Dhaka Quintal 850.00 329.00 573.00 550.00 533.33 Local-best Chittagong Quintal 750.00 300.00 471.91 488.38 497.43 Rajshahi Quintal - 300.00 485.50 340.00 575.00 Khulna Quintal 554.00 326.25 507.83 541.25 513.00 Barisal " - 295.22 300.00 459.67 413.33 Sylhet " 280.00 269.88 533.00 2.00 536.36 Match-Boxes Dhaka Each 2.00 2.00 2.00 2.00 2.00 of 40 sticks Chittagong Each 2.00 2.00 2.00 2.00 2.00 Rajshahi Each 2.00 2.00 2.00 2.00 2.00 Khulna Each 2.00 2.00 2.00 2.00 2.00 Barisal " 2.00 2.00 2.00 2.00 2.00 Sylhet " 2.00 2.00 2.00 2.00 2.00 Kerosene- Dhaka Litre 52.58 49.26 58.27 67.67 70.85 white Chittagong Litre 49.00 49.22 56.73 65.78 70.33 Rajshahi Litre 48.00 48.94 57.27 66.86 71.45 Khulna Litre 48.00 48.63 56.91 67.56 70.56 Barisal " 47.00 49.45 56.90 66.10 70.00

284
Sylhet " 54.00 51.66 55.22 66.17 70.18
Contd.
11.03 Annual Average Retail Prices of Selected Consumer Goods at Divisional Head Quarters (Taka)
Item Specification Unit 2009-10 2010-11 2011-12 2012-13 2013-14
Gas Rate- All Per 450.00 Domestic, Bangladesh month 450.00 450.00 450 450 double burner Electricity rates Domestic (for average consumption of 300 units per month) All Per Bangladesh KWT 3.30 3.20 3.69 4.73 4.84 XV. Clothing Dhaka Each 319.00 336.67 375.82 445.42 460.00 40x40 count Chittagong Each 295.00 324.91 345.54 433.56 471.67 5 yeards Rajshahi Each 300.00 335.83 361.10 406.82 452.80 Khulna Each 308.00 332.50 354.91 389.58 445.00 Barisal Each 268.00 337.00 360.10 383.33 475.00 Sylhet Each 223.00 373.13 363.67 - 351.00 Lungi- 80X80 Dhaka Each 276.00 358.92 387.40 369.67 336.00 count Chittagong Each 235.00 345.36 335.37 388.33 334.00 Rajshahi Each 340.00 349.75 341.75 373.94 287.50 Khulna Each 310.00 351.08 332.73 389.82 320.00 Barisal Each 338.00 356.75 369.89 335.91 230.00 Sylhet Each 250.00 348.63 334.67 336.67 66.17 Longcloth- Dhaka Metre 35.58 39.63 55.54 61.08 67.27 Medium Chittagong Metre 30.00 38.15 58.18 60.67 65.92 Rajshahi Metre 33.00 38.14 56.58 61.64 67.44 Khulna Metre 32.00 37.87 56.27 60.91 63.00 Barisal Metre 33.00 40.75 56.30 60.00 64.42 Sylhet Metre 38.00 39.12 54.22 60.13 30.08 XVI. Personal care Toilet soap- Dhaka Each 20.00 21.21 25.82 27.67 31.00 Lux Chittagong Each 17.00 21.13 26.09 26.67 30.00 International Rajshahi Each 18.00 21.21 26.08 27.64 30.00 Khulna Each 22.00 20.48 26.81 27.33 29.67 Barisal Each 20.00 20.62 25.85 27.82 29.67 Sylhet Each 17.00 21.90 26.33 27.50 45.38 Washing Dhaka Kg 49.00 35.25 45.82 - 46.10 soap- Chittagong Kg 48.00 35.12 45.11 - 46.60 Local best Rajshahi Kg 48.00 33.89 47.63 - 48.17 Khulna Kg 48.00 34.67 47.76 - 49.89 Rajshahi Kg 60.00 32.94 47.13 - 47.00 Khulna Kg 38.00 34.34 45.00 -
Contd.

285
11.03 Annual Average Retail Prices of Selected Consumer Goods at Divisional Head Quarters (Taka)
Item Specification Unit 2009-10 2010-11 2011-12 2012-13
2013-14
Washing soap- Dhaka Each 14.00 11.56 15.68 16.50 17.08 Tibet 570 Chittagong Each 14.00 11.25 15.28 16.78 16.92 Rajshahi Each 14.00 11.33 15.64 17.00 16.90 Khulna Each 13.00 11.67 15.20 16.33 16.55 Barisal Each 13.00 11.29 15.50 16.82 17.09 Sylhet Each 15.00 11.60 15.13 16.92 16.27 XVII. Stationery Items Paper- Dhaka Quire 19.83 21.75 21.86 20.33 21.75 foolscap Chittagong Quire 18.00 22.75 23.53 21.56 23.20 Rajshahi Quire 17.00 21.33 21.88 22.50 23.00 Khulna Quire 18.00 21.00 21.41 23.33 22.80 Barisal Quire 18.00 21.40 21.60 22.90 23.42 Sylhet Quire 22.00 21.77 21.20 21.67 22.83 Pencil- Dhaka Each 15.00 13.25 14.45 11.42 Chinese Chittagong Each 16.00 13.09 14.17 13.89 Rajshahi Each 15.00 12.92 13.99 14.40 Khulna Each 18.00 13.17 14.22 13.22 Barisal Each 14.00 13.56 15.46 12.40 Sylhet Each 15.00 13.40 14.60 12.00
Source: National Accounting Wing, BBS.

286
11.04 Annual Average Price of Jute and Jute Goods
(Taka)
Year Growers price
Per quintal
Raw Jute exports
price per bale
(FOB)
Hessian(40"x10 oz)
per 100 yds.
Sacking B. twills per 100
yds
Carpet backing
5-5/36-9x8 oz
per ton
1997-98 573 1788 826 2358 34431
1998-99 757 1840 813 1997 36078
1999-00 893 2111 957 2013 34903
2000-01 901 2243 1053 2188 38773
2001-02 1115 2660 1028 2299 42797
2002-03 820 2055 1066 2711 43505
2003-04 876 2388 1031 2689 43626
2004-05 1366 3305 1280 2727 44208
2005-06 1706 3994 1586 3403 52281
2006-07 1746 3742 - - -
2007-08 1999 3599 1744 4240 62098
2008-09 2556 5264 1983 5470 63670
2009-10 3060 7073 3292 7355 61720
2010-11 4484 9027 3269 8544 110083
2011-12 2998 6744 - - - Source: (i) Bangladesh Jute Mills Corporations. (ii) Department of Jute.

287
11.05 Annual Average Price of Hides, Skins and Tanned Leather in Dhaka
(Taka)
Hides & Skins per hundred
Goat skin (dry
salted)
Chrome
Sq.ft.
Cowkips Lb.
Tanned Leather
New Buck Sq.ft.
Buffalo sole Lb.
(Cow hides) (wet salted)
Light Medium Heavy
1998-99 26071 48111 82143 8667 50 60 39 60
1999-00 31682 25455 75864 7789 52 n.a n.a n.a
2000-01 n.a 35833 n.a 9919 55 n.a n.a n.a
2001-02 n.a 46333 n.a 9750 55 n.a n.a n.a
2002-03 - 57636 - 11682 65 - - -
2003-04 - 67250 - 10167 65 - - -
2004-05 - 85667 - 11000 68 - - -
2005-06 - 92666 - 12000 74 - - -
2006-07 - 127500 - 11778 - - - -
2007-08 136750 24625 - - - - - 12661
7
2008-09 - 113555.55 - 25478 90 - - 11062
5
2009-10 - 118889.00 - 18000.00 90 - - 10750
0.00
2010-11 - 155000.00 - 20000.00 - - - 10000
0.00
2011-12 - 130000.00 - 50000.00 - - - - Note: Average size of cow hide yields about 18 sq. ft. of tanned chrome or new buck leather of 4 lbs. of kips. Source: National Accounting Wing, BBS.

288
11.06 Harvest Time Market Price of Agricultural Crops
(Per Quintal/100 pieces in Taka) Sl.No
.
Name of Crops 2008-09 2009-10 2010-11 2011-12 2012-13 2013-14
1 Aman Local 1426 1579 2082 1650 1510 9
2 Aman HYV 1441 1699 2201 1521 1733 1939
3 Aman Pajam - - - - - 2113
4 Aus Local - - - - - -
5 Aus HYV - - - - - -
6 Aus Pajam - - - - - -
7 Boro Local 1460 1442 1776 1371 1564 1789
8 Boro HYV 1301 1305 2005 1526 1724 1909
9 Boro Pajam - - - - - -
10 Wheat 1446 1739 2056 1975 2203 2248
11 Mustard 3455 3496 3618 4563 4514 4037
12 Masur 6066 6221 4926 5471 6877 7032
13 Mung 3453 6845 6677 5338 7799 7575
14 Gram 3197 4031 4256 5034 6161 4555
15 Motor 4086 5484 3685 3421 4786 4106
16 Kheshari 2822 3021 2145 2356 3961 3162
17 Lin seeds 3431 3174 - 5049 4300 3997
18 Til 2195 2875 2965 3702 4300 5067
19 Groundnut 3283 3249 4716 5260 7545 4165
20 Onion 2395 2281 2751 1573 2819 7073
21 Garlic 2357 6435 8868 2806 3949 13850
22 Chillies (dry) 6968 11353 12377 15895 13038 4648
23 Chillies (green) 3310 2629 2675 5000 3448 11653
24 Zinger 3476 6146 7046 3523 5494 7172
25 Turmeric 6276 13042 19332 10038 5859 6900
26 Corriander seeds 4911 4996 4415 4197 5088 22284
27 Betel nut 6467 6763 9998 10500 16887 5354
28 Betel leaves 2698 3821 3522 4192 4139 3942
29 Jute (White) - 2563 - - 2825 3153
30 Jute (tossa) 2450 2617 4314 2934 2063 -
31 Tobacco (jati) - - - - 1875 1775
32 Tobacco (Matihari) - - - - - 2557
33 Arum 814 1387 1387 1842 2105 1883
34 Karala 1769 1488 1760 2385 1729 1969
35 Jhinga 1207 1263 1404 1801 1717 114
36 Lady`s Finger 1422 1363 1592 1977 1128 1562
37 Cabbage 707 552 754 552 2031 2049
38 Pumkin 960 1013 1011 1252 - 940
39 Bean 1398 1171 1744 1487 1698 1720
Contd.

289
11.06 Harvest Time Market Price of Agricultural Crops
(Per Quintal/100 pieces in Taka) Sl.No
.
Name of Crops 2008-
09
2009-10 2010-11 2011-12 2012-13 2013-14
40 Puisak 683 562 590 921 1542 1816
41 Cucumber 1201 1229 1338 1385 2287 1617
42 Patal 1496 1275 1136 2067 1134 2050
43 Cauliflower 1045 807 1279 941 1395 938
44 Brinjal 1576 1458 1767 1775 1918 1526
45 Radish(china) 709 - 860 739 1163 1559
46 Water gourd 1137 1113 11387 1205 1543 1904
47 Chichinga 1053 976 1091 1675 1193 1221
48 Tomato 1225 944 1912 1592 1259 1449
49 Chalkumra 938 937 938 1295 1008
50 Potato (local) 1461 1180 922 1077 1267
51 Potato (Holand) 1444 592 757 825 185
52 S. Potato 715 699 932 1237 305
53 Banana (Chapa) 124 98 154 149 195 223
54 Banana (Sabri) 189 184 179 232 285 -
55 Banana
(Shaghar)
162 195 137 201 223 1867
56 Pine Apple ( local) - - - - - 2018
57 Pine (jul Doog) 1474 1550 2032 1782 1927 206
58 Pine (Kelenda) - - - - - 6529
59 Lemon 91 155 2090 166 - 7639
60 Jack Fruit 3892 4708 5075 5586 6918 263
61 Water melon 4014 4310 6303 6137 203 988
62 Litchi 125 227 104 251 - 3855
63 Orange - - - 500 - 4987
64 Mango (guti) 2211 1538 5445 2754 3097 6182
65 Fozli 7290 4750 7375 10165 6082 6182
66 Arseni 4500 6400 3627 6300 5406 4468
67 Langra 5178 6000 5820 5574 5167 4987
68 Gofalvog 4158 - 4783 5133 4423 4907
69 Coconut 1381 1373 1355 1438 1822 2625
Sources: Department of Agricultural Marketing.

290
11.07 Prices of Selected Building Materials in Dhaka
(Taka)
Item specification
Unit 2007-08 2008-09 2009-10 2010-11 2011-12
Bricks, Sand & Cement Brick 10" (1st Class)
1000 4300 5700 6200 6792 7116
Sand (Coarse) 200 cft. 958 1112.50 1470 1650 1837 Cement (Local) 50 kg 363 373.75 382 397 430 Hardware M.S. Rod (3/8 or 3 suta)
50 kg. 2502 3083.33 2466 2683 3000
C.I. Sheet (26 gauge) 45 m.m
Bundle 7222 8708.30 9000 6150 6800
G.I. Pipe 1/2'' dia Ft. 35 42.50 41 51 80 Timber & Bamboo Timber (Ctg. Teak) 8'x1"x8' Plank Cft. 2665 2170.83 2000 3214 3255 Timber (Garjan) 3"x3"x8' Beam
Cft. 1177 1535.83 1588 1409 1490
Bamboo (Borak) 30' Long
Each 130 181.25 162 174 194
Paint & varnishes Paint Robbialac (synthetic)
Gallon 648 685.42 652 724 767
Varnish Robbialac 1 Lb. tin 101.74 82.31 87.37 88.39 90.41 Lime (for white wash)
Quintal 962.73 992.73 1425 1571 2016
Source: National Accounting Wing, BBS.

291
11.08 Daily Average Wage Rates of Selected Industries Workers in Dhaka (Taka per day)
Type of labour Category 2009-10 2010-11 2011-12 2012-13 2013-14
1. Industries i) Cotton Skilled 248.17 255.25 265.25 295.00 311.25
Textile Unskilled 176.25 185.42 198.00 213.75 229.75
ii) Jute Skilled 247.50 260.38 265.5 288.08 308.83
Textile Unskilled 165.33 177.62 188.91 212.58 226.67
iii) Matches Skilled 235.08 241.33 249.89 278.17 295.25
Unskilled 164.92 170.67 179.25 213.17 229.17
iv) Engineering Skilled 350.00 350.33 355.75 379.67 398.75
(Fitter) Unskilled 232.00 241.33 252.25 269.83 289.42
v) Edible oil Skilled 250.75 255.00 261.66 288.00 308.83
Unskilled 195.58 200.83 208.80 235.00 247.75
Average of Skilled 266.30 272.45 279.60 305.8 324.58
all Industries Unskilled 186.82 195.17 205.44 228.87 244.55
2. Small Scale Industry (Handloom) Skilled 225.67 235.00 241.33 273.07 305.33 Source: National Accounting Wing, BBS.

292
11.09 Daily Average Wages Rates of Construction Labour in Dhaka
(Taka)
Year Mason Type of workers Helper
Carpenter
2003-04 200 95 197
2004-05 200 95 198
2005-06 211 112 200
2006-07 214 117 208
2007-08 251 150 267
2008-09 286.33 186.25 310.45
2009-10 300.00 200 327.78
2010-11 347.29 245.64 364.54
2011-12 378.41 260.00 380.00
2012-13 417.50 268.50 381.87
2013-14 470.25 359.17 451.11 Source: National Accounting Wing, BBS.
11.10 Government Procurement Prices for Rice, Paddy, Wheat and Sugarcane (Figure in MT) Item 2009-10 2010-11 2011-2012 2012-13 Rice (Medium) 2200 - 2800 2900 Paddy 1400 - 0 1800 Sugarcane* 625 - Wheat 1600 1950 2400 2600 * Note: Mill gate price as on 14th february of every fiscal year. Source: (a) Bangladesh Sugar and Food Industries Corporation. (b) Ministry of Food.

293
11.11 Consumer Price Index (CPI), National
Year General
Food, beverage
& tobacco)
Non-food Clothing and
footwear
Gross rent fuel & lighting
Furniturefurnish-
ing, house-
hold equipm-ent and oper.
Medical care and
health expense
s
Trans-port and communi-cations
Recrea-tion,
entertain-ment, educa-tion and cultural services
Misc. goods and
services
1 2 3 4 5 6 7 8 9 10 11
(Base: 1995-96=100)
2002-03 135.97 137.01 135.13 130.55 131.20 132.32 145.25 159.52 136.94 129.40
2003-04 143.90 146.50 141.03 136.25 136.19 137.95 154.36 170.79 141.31 133.82
2004-05 153.23 158.08 147.14 142.15 141.43 143.18 162.67 179.94 150.24 137.78
2005-06 164.21 170.34 156.56 148.35 152.02 151.21 169.62 191.66 165.42 143.25
2006-07 176.06 184.18 165.79 156.79 162.32 162.61 178.49 201.15 171.47 151.44
2007-08 193.54 206.79 176.26 164.53 174.70 178.56 185.66 211.01 174.86 166.69
2008-09 206.43 221.64 186.67 173.10 184.45 194.75 189.25 222.12 181.44 188.84
(Base: 2005-06=100)
2009-10 141.18 149.40 130.66 130.63 126.25 141.54 133.85 123.34 132.68 140.36
2010-11 156.59 170.48 138.77 140.09 132.33 158.13 144.55 127.44 139.52 148.68
2011-12 170.19 183.65 152.94 160.79 143.36 175.58 152.63 148.58 144.48 164.57
2012-13 287.14 317.62 247.07 252.54 238.91 280.71 228.05 292.45 210.21 266.75
Source: National Accounting Wing, BBS.
294

11.12 Consumer Price Index (CPI), All Rural
Year General Food, beverage
& tobacco)
Non-food Clothing and
footwear
Gross rent fuel &
lighting
Furniturefurnish-ing,
house-hold
equipm-ent and oper.
Medical care and
health exp-enses
Trans-port and
communi-cations
Recreation,
entertain-ment,
education and
cultural services
Misc. goods and services
1 2 3 4 5 6 7 8 9 10 11
(Base: 1995-96=100) Weight 100 62.96 37.04 6.88 14.69 2.70 2.79 2.98 3.20 3.8
2001-02 130.40 130.99 129.41 123.70 128.78 127.55 136.88 144.15 134.26 122.38
2003-04 144.46 145.22 143.18 136.21 141.79 137.67 157.35 170.28 144.28 132.51
2004-05 154.03 156.82 149.29 141.73 147.64 141.90 166.56 178.92 153.78 134.90
2005-06 165.37 168.77 159.59 148.19 160.63 149.45 175.03 191.13 168.85 139.40
2006-07 177.42 182.18 169.33 155.88 172.14 160.38 185.41 201.06 174.74 147.95
2007-08 195.14 203.93 180.19 162.08 185.85 174.31 191.72 211.49 178.03 164.03
2008-09 208.46 218.38 191.59 169.68 199.33 189.12 194.47 219.63 184.66 184.85
(Base: 2005-06=100)
2009-10 142.67 148.47 133.46 132.22 129.25 141.75 137.80 121.29 143.66 142.43
2010-11 159.41 170.81 141.28 143.51 134.08 155.22 147.33 125.37 151.11 150.17
2011-12 173.26 183.62 156.77 164.55 146.37 169.35 156.87 150.60 158.26 168.84
2012-13 289.08 309.90 253.68 249.89 260.93 252.52 229.331 283.00 216.49 259.82
Source: National Accounting Wing, BBS.

295
11.13 Consumer Price Index (CPI), All Urban
Year General
Food, bever-age &
tobacco)
Non-food Clothing and
footwear
Gross rent fuel & lighting
Furniturefurnish-ing,
house-hold equipm-ent and oper.
Medical care and
health expen-
ses
Trans-port and communi-cations
Recrea-tion, entertain-
ment, educa-tion and cultural services
Misc. goods and
services
1 2 3 4 5 6 7 8 9 10 11
(Base: 1995-96=100)
Weight 100 48.80 51.20 6.79 22.17 2.58 2.97 7.07 6.40 3.22
2001-02 129.92 135.93 124.19 126.87 115.60 122.46 134.64 144.85 123.15 126.12
2002-03 134.48 138.77 130.40 130.69 119.50 129.72 141.04 160.53 129.50 131.22
2003-04 142.54 149.60 135.80 136.37 122.56 138.61 147.08 172.02 134.10 137.01
2004-05 151.29 161.14 141.90 143.18 126.31 146.30 152.49 182.41 141.60 144.80
2005-06 161.39 174.18 149.20 148.72 131.07 155.49 156.47 192.53 157.05 152.62
2006-07 172.73 189.06 157.17 159.02 138.41 168.05 161.064 201.38 163.51 159.93
2007-08 189.65 213.73 166.69 170.51 147.54 188.92 170.90 209.84 167.16 173.16
2008-09 201.49 229.60 174.69 181.42 148.24 208.46 176.54 228.18 173.59 198.58
(Base: 2005-06=100)
2009-10 138.43 151.66 126.92 127.60 122.77 141.16 127.10 125.61 120.84 137.80
2010-11 151.36 169.68 135.43 133.58 130.30 163.26 139.80 129.72 127.01 142.83
2011-12 164.52 183.71 147.84 153.65 139.88 186.54 145.37 146.34 129.61 159.31
2012-13 282.42 336.41 230.96 258.99 185.28 349.35 224.99 315.47 194.94 283.63
Source: National Accounting Wing, BBS.

296
11.14 Wage Rate Indices(WRI) of Bangladesh (Base : 1969-70=100)
Year WRI Dhaka Chittagon
g Khulna Rajshahi Banglades
h
2001-02 2689 2491 2659 2709 2637
2002-03 3032 2750 2927 3194 2976
2003-04 3209 2925 3116 3388 3160
2004-05 3387 3089 3308 3388 3293
2005-06 3585 3290 3530 3619 3506
2006-07 3864 3549 3807 3894 3779
2007-08 4296 3956 4296 4361 4227
2008-09 4999.28 4588.13 5268.72 5246.56 5025.67
2009-10 5559.31 4954.58 5659.98 5716.46 5459.70
2010-11 5851.64 5165.83 6007.08 6064.52 5781.64
2011-12 6637.70 549.72 6820.30 7000.01 6469.17
2012-13 7534.61 6918.65 7847.07 7973.58 7422.05
2013-14 8233.51 7589.63 8642.92 871.49 8097.40
Source: National Accounting Wing, BBS.

297
11.15 Consumer Price Indices of Industrial Workers at Chittagong, Khulna & Narayanganj (Base: 1969-70=100) Centre Year General
indices Food Apparel
footwear &textile
Housing & household requisites
Miscella- neous
Chittagong 2000-01 2092 2078 1709 3198 1583
2001-02 2116 2092 1732 3275 1621
2002-03 2160 2126 1755 3403 1680
2003-04 2220 2179 1788 3533 1753
2004-05 2297 2257 1835 3666 1798
2005-06 2427 2399 1902 3872 1845
Khulna 2000-01 1856 1896 1616 2302 1432
2001-02 1881 1911 1634 2374 1488
2002-03 1925 1944 1659 2477 1568
2003-04 1985 1993 1685 2641 1647
2004-05 2065 2067 1723 2754 1769
2005-06 2187 2188 1774 2995 1869
Narayanganj 2000-01 2048 2088 1762 2650 1535
2001-02 2077 2114 1786 2689 1568
2002-03 2119 2159 1807 2758 1593
2003-04 2182 2235 1820 2810 1632
2004-05 2285 2359 1840 2889 1690
2005-06 2438 2542 1879 3069 1736
Source: National Accounting Wing, BBS.
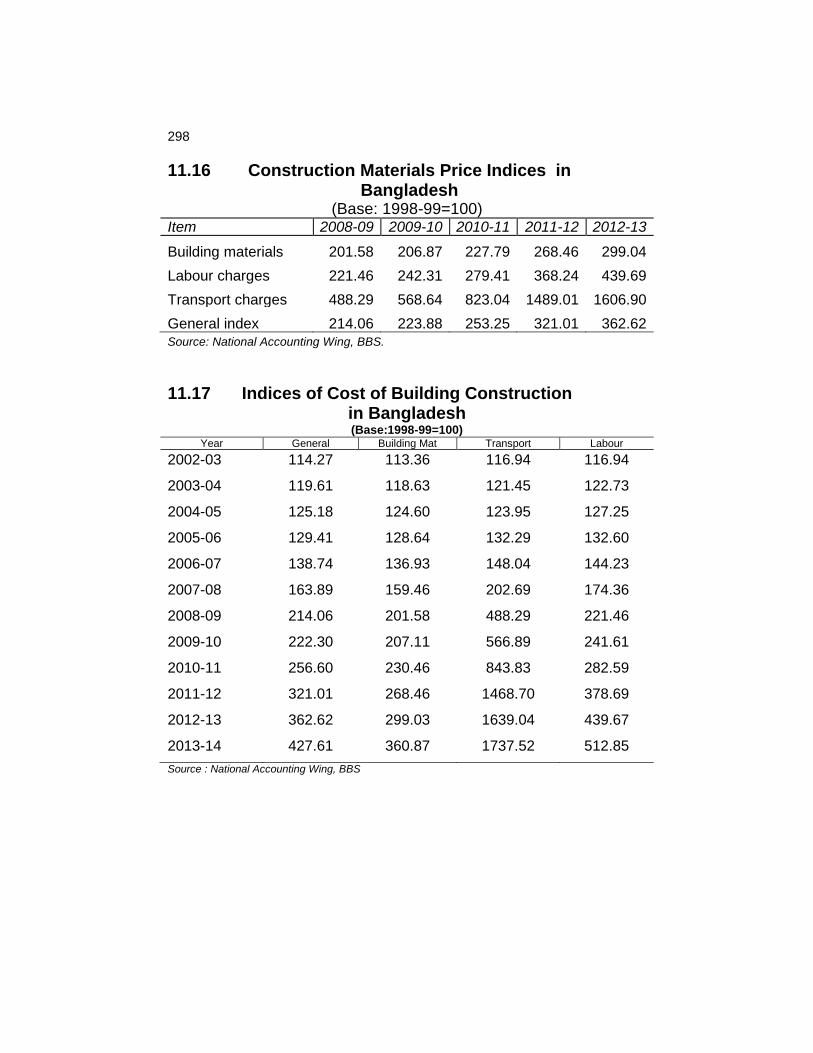
298
11.16 Construction Materials Price Indices in Bangladesh (Base: 1998-99=100) Item 2008-09 2009-10 2010-11 2011-12 2012-13
Building materials 201.58 206.87 227.79 268.46 299.04
Labour charges 221.46 242.31 279.41 368.24 439.69
Transport charges 488.29 568.64 823.04 1489.01 1606.90
General index 214.06 223.88 253.25 321.01 362.62
Source: National Accounting Wing, BBS.
11.17 Indices of Cost of Building Construction in Bangladesh
(Base:1998-99=100) Year General Building Mat Transport Labour
2002-03 114.27 113.36 116.94 116.94
2003-04 119.61 118.63 121.45 122.73
2004-05 125.18 124.60 123.95 127.25
2005-06 129.41 128.64 132.29 132.60
2006-07 138.74 136.93 148.04 144.23
2007-08 163.89 159.46 202.69 174.36
2008-09 214.06 201.58 488.29 221.46
2009-10 222.30 207.11 566.89 241.61
2010-11 256.60 230.46 843.83 282.59
2011-12 321.01 268.46 1468.70 378.69
2012-13 362.62 299.03 1639.04 439.67
2013-14 427.61 360.87 1737.52 512.85
Source : National Accounting Wing, BBS

299
11.17 Construction Materials Price Indices in Barisal (Base: 1998-99=100) Item 2008-
09 2009-
10 2010-11 2011-
12 2012-
13
Building materials 199.28 215.14 229.79 260.26 289.64
Labour charges 319.34 359.24 377.24 474.05 529.64
Transport charges 640.42 638.20 843.24 1420.12 1552.60
General index 238.79 259.39 280.48 341.81 380.05 Source: National Accounting Wing, BBS.
11.17 Construction Materials Price Indices in Dhaka (Base: 1998-99=100) Item 2008-09 2009-10 2010-11 2011-12 2012-13
Building materials 187.24 197.52 221.77 275.86 299.93
Labour charges 191.20 200.05 221.43 296.68 354.31
Transport charges 295.99 423.47 647.09 1316.25 1533.30
General index 191.01 204.26 233.49 308.67 344.66
Source: National Accounting Wing, BBS. Contd.

300
11.17 Construction Materials Price Indices in Chittagong (Base: 1998-99=100) Item 2008-09 2009-10 2010-11 2011-
12 2012-
13
Building materials 207.01 205.51 232.97 283.93 318.69
Labour charges 160.19 174.14 205.75 271.06 322.21
Transport charges 500.62 608.89 1020.02 2083.02 2312.40
General index 206.34 210.64 249.73 331.81 375.19 Source: National Accounting Wing, BBS.
11.17 Construction Materials Price Indices in Khulna (Base: 1998-99=100) Item 2008-09 2009-10 2010-11 2011-12 2012-13
Building materials 205.66 189.88 218.45 260.62 291.41
Labour charges 215.71 224.92 291.52 381.89 456.76
Transport charges 532.77 613.39 846.42 1485.94 1641.00
General index 217.62 209.55 251.99 321.88 365.70 Source: National Accounting Wing, BBS.
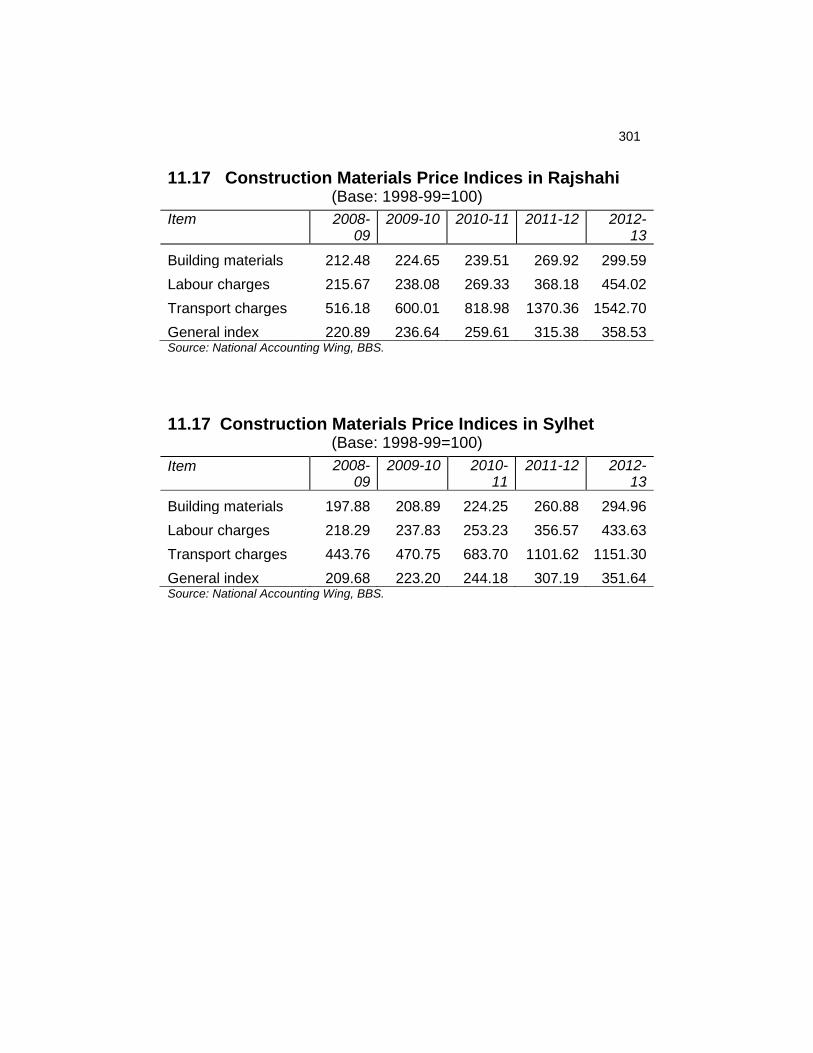
301
11.17 Construction Materials Price Indices in Rajshahi (Base: 1998-99=100)
Item 2008-09
2009-10 2010-11 2011-12 2012-13
Building materials 212.48 224.65 239.51 269.92 299.59
Labour charges 215.67 238.08 269.33 368.18 454.02
Transport charges 516.18 600.01 818.98 1370.36 1542.70
General index 220.89 236.64 259.61 315.38 358.53 Source: National Accounting Wing, BBS.
11.17 Construction Materials Price Indices in Sylhet (Base: 1998-99=100)
Item 2008-09
2009-10 2010-11
2011-12 2012-13
Building materials 197.88 208.89 224.25 260.88 294.96
Labour charges 218.29 237.83 253.23 356.57 433.63
Transport charges 443.76 470.75 683.70 1101.62 1151.30
General index 209.68 223.20 244.18 307.19 351.64 Source: National Accounting Wing, BBS.

11.18 Index of Wholesale Prices of Agricultural and Industrial Products 302 (Base: 1969-70=100) Agricultural products Industrial products
Raw Fuel & Raw Fuel & Manufac- All Region Year Food materials lighting Total Food materials lighting turing Total groups
Dhaka 2001-02 1848 1996 2452 1912 1798 1344 2168 1274 1589 1808 2002-03 1991 1994 2509 1998 1849 1408 2312 1263 1640 1881 2003-04 2023 2021 2562 2029 1961 1442 2452 1296 1716 1924 2004-05 2103 2102 2599 2109 1970 1450 2601 1334 1757 1996 2005-06 2290 2173 2641 2250 2190 1472 3337 1422 1997 2168
Chittagong 2001-02 1736 1970 2367 1833 1872 1289 2271 1202 1590 1755 2002-03 1941 2035 2370 1981 2007 1328 2382 1245 1669 1881 2003-04 2014 2038 2378 2028 2130 1357 2460 1275 1730 1932 2004-05 2042 2060 2386 2053 2193 1358 2527 1345 1784 1967 2005-06 2398 2090 2418 2280 2467 1424 3342 1386 2036 2409
Rajshahi 2001-02 1635 1798 2260 1705 1631 1301 2109 1256 1521 1646 2002-03 1843 1861 2277 1856 1619 1330 2245 1238 1547 1760 2003-04 2006 1961 2330 1993 1718 1357 2357 1237 1595 1865 2004-05 2053 2009 2402 2041 1771 1357 2515 1298 1660 1918 2005-06 2162 2047 2476 2122 1893 1420 3281 1407 1889 2119
Khulna 2001-02 1646 2008 1862 1787 1701 1287 2114 1280 1546 1710 2002-03 1776 1985 1869 1859 1730 1330 2315 1240 1585 1770 2003-04 1879 2002 1886 1926 1856 1357 2376 1259 1640 1834 2004-05 2000 2102 1911 2038 1881 1357 2513 1366 1712 1933 2005-06 2165 2174 1927 2165 2075 1420 3302 1443 1951 2097
Bangladesh 2001-02 1717 1932 2235 1810 1751 1305 2166 1253 1562 1730 2002-03 1888 1966 2256 1922 1802 1349 2318 1247 1610 1822 2003-04 1980 2006 2289 1994 1913 1376 2409 1267 1667 1889 2004-05 2050 2068 2325 2060 1954 1380 2539 1336 1729 1954 2005-06 2256 2121 2366 2204 2156 1435 3308 1415 1968 2128 Source: National Accounting Wing, BBS.

303
11.19 House Rent Indices for Private Residential House for Different Centres in Bangladesh ( Base: 1973-74=100)
Year Dhaka Chittagon
g
Khulna Rajshahi Bangladesh
2000-01 1683 1160 783 1591 1304
2001-02 1724 1175 808 1614 1330
2002-03 1879 1225 827 1692 1406
2003-04 1961 1260 839 1716 1444
2004-05 2031 1307 873 1814 1506
2005-06 2195 1334 902 1903 1584
2006-07 2301 1389 929 1963 1646
2007-08 2403 1558 986 2035 1746
2008-09 2653.19 1643.54 1039.79 2143.25 1869.95
2009-10 2830.23 1687.09 1072.17 2195.50 1946.26
2010-11 3002.65 1801.28 1156.84 2360.20 2080.25
2011-12 3770.99 2225.97 1336.58 2932.93 2566.62
2012-13 4398.80 2600.44 1508.84 3312.33 2955.02
2013-14 4843.69 2738.81 1620.07 3539.21 3185.44 Source: National Accounting Wing, BBS.

305
Chapter XII
EDUCATION

306

307
12.01 Indicators of Education System in Bangladesh
2010 2011 2012 2013 No. of Primary level Institutions (Primary education) 78685 78685 104017 106859 Secondary School (Nos.) 19040 19070 19208 19602 Madrasha (Nos.) 9361 9330 9441 9336 College general (Nos.) 3324 3475 3547 3793 Govt. Medical College (Nos.) 18 21 22 23 Private Medical College (Nos.) 30 42 53 54 Govt. Dental College and Dental Unit 9 9 9 9 Private Dental college (Nos.) 10 12 18 14 Teacher educational (gov) 80 80 81 Teacher educational (Private) 129 129 129 Technical Vocational (gov) 251 245 248 Technical Vocational (Private) 2730 3082 3518 Public University (Nos.) 31 34 34 34 Private University (Nos.) 51 52 60 77 Full-time students in Public universities (Nos.) Total 179128 185910 197278 210602 Male 128605 132168 138411 145591 Female 50523 53742 58867 65011 Student & Teacher Ratio Primary (Public) - 1:47 1:50 1.49 Secondary (Public) - 1:30 1:34 1.32 College (Public) - 1:108 1:100 1.102 University (Public) 1:19 1:19 1.19 1.19 Total government revenue expenditure on education (In million) 94933
(2009-10) 130663 (2010-11)
141490 (2011-12)
148580 (2012-13)
Total government development expenditure on education (In million) 4253
(2009-10) 48930
(2010-11) 52130
(2011-12) 66345
(2012-13) Source: BANBEIS. University Grants Commission & Finance Division.

12.02 Number of Primary Level Educational Institutions, Teacher and Student by Type, 2013
Type of No. of School
Total Teachers Total student
Primary School Total Female % of Female
Total Girls % of Girls
Government Primary School (GPS)
37700 213791 137334 64.2 10564331 5370884 50.8
Regd. NGPS 22632 89483 40572 45.3 4325894 2156108 49.8 Non-regd. NGPS 2799 10767 7573 70.3 443724 215265 48.5 Experimental School 56 227 199 87.7 11499 5630 49 Ebtedae Madrasah 2623 10318 1845 17.9 344120 166443 48.4
Kindergarten 14100 84635 49653 58.7 1798500 817038 45.4
NGO School 2101 4690 3152 67.2 212212 108484 51.1
Community School 1244 4297 3242 75.4 207526 106080 51.1
Attached to High Madrasah 5583 22676 3069 13.5 845438 410528 48.6
Primary sections of High School 1245 8090 4436 54.8 467926 242888 51.9
BRAC Center 9683 9744 9472 97.2 214161 129590 60.5
ROSC School 3830 3854 3124 81.1 93993 47634 50.7
Sishu Kollyan primary School 11 354 254 71.8 11030 5796 52.5
Others School 3151 3582 1851 51.7 44618 21652 48.5
Total 106859 466508 265776 57 19584972 9804020 50.1
Source: BANBEIS. 308

309
12.03 Number of Secondary Schools, Teachers and enrolment by Type, 1996 to 2013
Year No. of Number of Teachers Enrolment
School Total Female % Total Girl %
1996 12978 145188 20198 13.91 558806 2627073 47.03
1997 13778 157077 22334 14.22 6124325 2921560 47.70
1998 14518 165213 24106 14.59 6769078 3464742 51.18
1999 15460 173897 25867 14.87 7236939 3758823 51.94
2000 15720 174146 26290 15.10 7646885 4020237 52.57
2001 16166 183277 30196 16.48 7887010 4196097 53.20
2002 16562 186949 31311 16.75 8162134 4360778 53.43
2003 17386 206557 39580 19.16 8126362 4322568 53.19
2004 18267 214673 47255 22.01 7503247 3925110 52.31
2005 18500 238158 48290 20.28 7398552 3868014 52.28
2006 18700 239431 48615 20.30 7419179 3876914 52.26
2008 18756 209496 46788 22.33 6819748 3661457 53.69
2009 19083 213482 53363 25.00 7356793 3796538 51.61
2010 19040 218011 50334 23.09 7465774 3979676 53.31
2011 19070 223555 52001 23.26 7510218 4026374 53.61
2012 19208 221043 53862 24.37 7937235 4229292 53.28
2013 19608 229575 55846 24.33 8501442 4519091 53.16 Source:BANBEIS.

12.04 Number of Attached Primary Section, Student, and Teacher, 2013
Type of School
Manage
ment
Total
Institutions
No of Insti.
Having Primary Section
% Insti. Having Primary Section
Students Teacher
Total
Girls
% of Girls
Total
Female
%
Female
Junior Secondary Private 2504 441 17.61 99040 46562 47.01 1209 699 57.82
School Total 2504 441 17.61 99040 46562 47.01 1209 699 57.82
Secondary
School
Public 317 107 33.75 55637 28669 51.53 79 32 40.51
Private 15951 1213 7.60 363106 182047 50.14 4786 2687 56.34
Total 16268 1320 8.11 418743 210716 50.32 4865 2719 55.89
School and
College (School
Section)
Public 10 9 90.00 6492 2269 34.95 - - -
Private 820 217 26.46 175326 90944 51.87 1331 889 66.79
Total 830 226 27.23 181818 93213 51.27 1331 889 66.79
All
Public 327 116 35.47 62129 30938 49.80 79 32 40.51
Private 19275 1871 9.71 637472 319553 50.13 7326 4275 58.35
Total 19602 1987 10.14 699601 350491 50.10 7405 4307 58.16
Source: BANBEIS 310

12.05 Number of Colleges Type of Management and Sex, 1999 to 2013
Year Management
School &College /Interm. College
Degree College Honours College Masters College Total College (General)
Total Female Total Female Total Female Total Female Total Female 2006 Public 10 7 140 38 41 6 60 13 251 64
Private 1251 355 1047 176 20 5 28 6 2946 542 Total 1261 362 1187 214 61 11 88 19 3197 606
2008 Public 14 8 116 29 55 16 67 12 252 65 Private 1809 329 1096 181 87 19 33 8 3025 537 Total 1823 337 1212 210 142 35 100 20 3277 602
2009 Public 25 9 110 27 57 17 61 12 253 65 Private 1907 342 1093 181 64 16 30 7 3094 546 Total 1932 351 1203 208 121 33 91 19 3347 611
2010 Public 17 10 117 28 58 17 64 12 256 67 Private 1817 322 1153 188 68 18 30 7 3068 535 Total 1834 332 1270 216 126 35 94 19 3324 602
2011 Public 22 10 113 27 60 17 70 13 265 67 Private 1906 322 1157 196 112 22 35 8 3210 558 Total 1928 342 1270 223 172 39 105 21 3475 625
2012 Public 38 12 93 21 81 24 76 14 288 71 Private 1898 322 1079 191 235 38 47 9 3259 560 Total 1936 334 1172 212 316 62 123 23 3547 631
2013 Public 38 10 82 22 92 25 81 14 293 71 Private 2077 337 1108 198 272 42 43 3 3500 586 Total 2115 347 1190 220 364 67 124 23 3793 657
Source: BANBEIS 311

312
12.06 Results of Madrasa Education Board
Group
Year Dakhil Alim Fazil Kamil
Appeared Pass Appeared Pass Appeared Pass Appeared Pass
2001 150278 146607 65480 22782 24966 9874 9826 7747 2002 148711 78009 65459 17563 24435 8640 9019 6998 2003 163217 68345 60934 24308 20183 9829 6992 5950 2004 176659 105686 55281 22919 17521 9291 6898 5879 2005 156814 97380 47197 30565 19561 13166 7717 7012 2006 161999 122808 56594 42576 18412 14456 7965 7538 2007 167735 110486 51623 38363 18707 14655 10196 9929 2008 180585 148186 61724 50882 16024 14849 7879 7595 2009 185726 159444 58978 49626 17267 16439 9568 9241 2010 210419 182431 73790 63864 22945 21762 12254 12118 2011 237524 197699 76015 68086 - - - - 2012 273065 241572 84246 77316 - - - - 2013 221257 197199 87474 80002 - - - - 2014 236630 211203 107560 99581 - - - -
Source: Madrasa Education Board, Dhaka.
12.07 Number of Sanskrit and Pali Tols With Teachers and Students Year Sanskrit Pali
Tols Teacher Student Tols Teacher Student
1997 145 480 4138 115 445 762 1998 107 378 8426 88 335 457 1999 90 387 13075 90 341 815
2000 115 402 13985 92 347 845 2001 145 477 4138 120 440 6679 2002 148 481 4223 122 452 7012 2003 148 481 4210 122 452 6943
2004 124 424 9635 93 460 620 2005 126 430 7875 93 460 588 2006 126 430 5821 93 460 452 2007 126 430 4691 93 460 494 2008 126 430 4666 93 460 479 2009 126 430 4658 93 460 479 2010 128 316 6630 93 460 545 2011 128 316 9819 93 460 670 2012 128 316 9849 93 460 643 2013 128 436 11127 93 460 448 Source: (i) Bangladesh Sanskrit & Pali Education Board, Dhaka. (ii) Bangladesh Economic Review, Ministry of Finance.

12.08 Number of Madrasha Students (Dakhil to Kamil) by Type and Sex 1997 to 2013
Year Dakhil Alim Fazil Kamil Total Total Female Total Female Total Female Total Female Total Female
1997 4795 459 983 31 955 9 118 1 6851 500
1998 4868 520 998 42 970 13 120 1 6956 576
1999 4890 609 1074 59 1017 21 141 3 7122 692
2000 5015 628 1087 61 1029 23 148 4 7279 784
2001 5391 701 1087 61 1029 21 144 4 7651 784
2002 5536 733 1105 64 1032 23 147 4 7820 821
2003 5995 847 1220 80 1030 20 165 4 841 951
2004 6315 926 1320 86 1012 22 172 6 881 1040
2005 6685 1017 1315 91 1039 24 175 6 9214 1138
2006 6798 1034 1345 98 1040 24 178 7 9361 1163
2008 6779 1046 1401 107 1013 25 191 8 9384 1186
2009 6771 1058 1487 114 1022 24 195 8 9475 1204
2010 6660 1031 1486 114 1021 24 194 8 9361 1177
2011 6669 1028 1401 107 1056 32 204 10 9330 1177
2012 6745 1028 1442 109 1049 27 205 11 9441 1175
2013 6593 1003 1470 112 1054 27 219 12 9336 1154
Source: BANBEIS. 313

12.09 Board wise Number of Students Appeared and Passed in the SSC Examinations.
Year 2009 2010 2011
Name of
Board
Appeared Passed % Pass Appeared Passed % Pass Appeared Passed % Pass
1 2 3 4 5 6 7 8 9 10
Dhaka 239566 165570 69.11 271532 211761 77.99 300571 254368 84.63 Rajshahi 113779 66457 58.41 133895 114629 85.61 129995 104411 80.32 Comilla 88314 64266 72.77 102050 82694 81.03 116198 99757 85.85 Jossore 106264 72271 68.01 123019 97403 70.18 127835 107430 84.04 Chittagong 61964 43132 69.61 68386 49451 72.31 77325 60521 78.27 Barisal 48495 31826 65.63 55342 41309 74.64 61590 48222 78.30 Sylhet 37408 2943 78.71 41233 32336 78.42 48478 39378 81.23 Dinajpur - - - - - - 124658 96579 77.48 Contd.
Year 2012 2013 2014
Name of
Board
Appeared Passed % Pass Appeared Passed % Pass Appeared Passed % Pass
11 12 13 14 15 16 17 18 19
Dhaka 324496 278892 85.95 315784 275726 87.31 343636 322819 93.34 Rajshahi 131965 116559 88.33 114862 108009 94.03 122168 117693 96.34 Comilla 128591 110131 85.64 128642 116307 90.41 144421 129868 8992 Jossore 131763 114847 87.16 118293 109559 92.62 129183 119097 92.19 Chittagong 85767 67722 78.96 86367 76037 88.04 83946 91847 91.40 Barisal 63379 55117 86.96 63576 56348 88.93 70092 63543 90.66 Sylhet 58376 53579 91.78 58506 52045 88.96 68085 60750 89.23 Dinajpur 123807 107969 87.16 487970 440284 90.23 118438 110458 93.26
Source: Education Board Dhaka.
314

315
12.10 Boardwise Number of Students Appeared and Passed in the HSC Examinations.
Year 2010 2011
1 2 3 4 5 6 7
Name of
Board
Appeared Passed % of Pass Appeared Passed % of Pass
Dhaka 194925 140548 72.10 208112 160027 76.89
Rajshahi 82174 61987 75.43 77681 61379 79.01
Comilla 53934 39444 73.13 62375 42837 68.68
Jossore 78801 53376 67.73 86077 54550 63.37
Chittagong 42976 31224 72.65 47767 33931 71.03
Barisal 35141 26125 74.39 35803 25464 71.12
Sylhet 19820 15087 76.12 30894 23381 75.68
dinajpur 72852 49262 67.54 73568 48685 66.18
Total 580623 416987 71.82 622277 450254 72.36
Contd. Year 2012 2013 2014
8 9 10 11 12 13 14 15 16
Name of
Board
App-
eared
Pass % of
Pass
Appeared Pass % of
Pass
App-
eared
Pass % of
Pass
Dhaka 234155 191580 81.82 263426 195045 74.04 297814 251772 84.54
Rajshahi 105135 82467 78.44 105072 18631 77.69 111680 87720 78.55
Comilla 78037 58219 74.60 88694 54359 61.29 103259 72426 70.14
Jossore 105989 71937 67.57 109994 74240 67.49 114815 69550 60.58
Chittagong 53968 39011 72.29 63686 38986 61.22 77526 54312 70.06
Barisal 42019 28144 66.98 52173 37403 71.69 54915 39402 71.75
Sylhet 37372 31903 85.37 42980 34009 79.43 57561 45568 79.16
Dnajpur 85773 64679 75.41 88444 63624 71.94 97033 71940 74.14
Total 742448 567940 76.50 814469 579297 71.13 914603 692690 75.74
Source: Education Board Dhaka.

12.11 Results of Technical Education by Group, 2013 & 2014
Group 2013 2014
Appeared Passed % of pass Appeared Passed % of pass
Diploma in Commerce 384 352 91.67 373 328 87.94
Diploma in Agriculture 6991 6839 97.83 7911 7670 96.95
Diploma in Fisheries 6991 6839 9783
Diploma in Health 25 25 100 266 253 95.11
Diploma in Engineering 25303 12243 48.39 28563 - -
Diploma in Medical technology 3585 1809 50.46 4735 - -
Diploma in Textile 2794 2506 8969 3976 - -
SSC (Vocational) X 86580 72288 83.49 100759 82566 81.94
HSC Business Management 87544 77184 888.17 94842 82695 87.19
HSC Vocational 8040 5147 64.02 9508 6158 64.77
Certificate in Health Technology and
Services 1747 1012 57.93 2084 1288 61.80
Basic Trade (360 hrs) 115515 983392 85.18 64033 54791 85.59
Dhakil (Vocational) 1083 845 78.02 1664 1388 83.58
Source: Bangladesh Technical Education Board.
316

12.12 Comparative Statistics of JSC & JDC Examination, 2013 & 14.
Year 2013 2014
Name of Board Appeared Passed % Pass GPA 5 Appeared Passed % Pass GPA 5
1 2 3 4 5 6 7 8 9
Dhaka 498900 438662 87.93 - 56539 482768 85.36 -
Rajshahi 184480 173166 93.88 - 200513 191130 95.32 -
Comilla 194550 175969 90.45 - 223398 209446 93.00 -
Jossore 177015 157593 89.03 - 188784 173599 91.96 -
Chittagong 138025 118887 86.13 - 150617 126953 84.29 -
Barisal 85375 82762 96.60 - 96468 94466 97.92 -
Sylhet 95227 86801 91.15 - 109485 100255 91.57 -
Dinajpur 730789 657741 90.00 - 195127 175810 90.10 -
Madrasa Board 879151 793446 90.25 - 1729931 1554427 89.85 -
BISE 1548700 1389313 89.71 - 311540 291305 93.50 -
Total 1862380 1675109 89.94 - 2041471 1845732 90.41 -
Source: Education Board. Computer Section.
317

12.13 Number of Professional Educational Institution by Type of Gender and Management, 2013
S.L. No
Type of Institute Public Private Total Total Girls % Total Girls % Total Girls %
1. Medical College 23 0 54 5 77 5 6.49
2. Dental College 9 14 23 0
3. Nursing College 7 12 19 0
4. Homeopathic College 1 47 48 0
5. Unani/Ayurvedic College 2 14 16 0
6. Nursing Institute* 44 44 100 39 39 100.00 83 83 100.00
7. Health technology 8 100 82 90 0
8. Textie Technology College 6 5 11 0
9. Leather Technology 1 0 1 0
10. Law College 71 71 0
11. Art College 8 8 0
Total 101 44 55.56 346 44 12.72 447 88 19.69
Source: BANBEIS. 318

12.14 Number of Teachers in Teacher Educational Institution by Type, Gender and Management, 2013
S.L No.
Type of Institute Public Private Total Total Girls % Total Girls % Total Girls %
1 Primary Training Institute (PTI)
54 54
2 Teachers Training College (TTC)
14 1 104 118 1
3 Technical Teacher Training College (TTTC)
1 1
4 Vocational Teacher Training Institute (VTTI)
1 1
5 Physical Education College 5 25 30 6 Higher SecondaryTeacherTraining
Institute (HSTTI) 5 5
7 Madrasa Teacher Training Institute 1 1 Total 81 1 129 0 210 1 0.48
Source : BANBEIS.
319

12.15 Number of Institutions, Teachers and Enrolment by Type, 2013
Type of Institute No. of
Inst.
Teacher Enrolment Total Female % of
female Total Girl %of girl
Polytechnic Institute 270 3839 479 12.48 151333 18531 12.25
Technical School & College 166 2245 417 18.57 64920 13747 21.18
Commercial College 1 13 3 23.08 868 50 5.76
Glass & Ceramic Institure 1 14 4 28.57 685 48 7.01
Graphic Arts Institute 4 56 7 12.50 1247 67 5.37
Survey Institute 81 1299 215 16.55 26846 8977 33.44
Technical Training Centre 33 520 89 17.12 10127 789 7.79
Textile Institute 50 345 65 18.84 5518 1315 23.83
Textile Vocational 109 960 191 19.90 29493 6462 21.91
Agriculture Training Institute 1 52 5 9.62 916 106 11.57
Marine Technology 169 1976 399 20.19 24426 6782 27.77
S.S.C Vocational (Independent) 1432 5698 1318 23.13 127045 50379 39.65
S.S.C Vocational (Attached) 584 5626 1241 22.06 105370 36608 34.74
HSC Voc/B. Management (Independent) 865 4430 1006 22.71 97191 38801 39.92
HSC Voc/B. Management (Attached) 3766 27073 5439 20.09 645985 182662 28.28
Total (Tech & Voc Edn.) Source : BANBEIS.
320
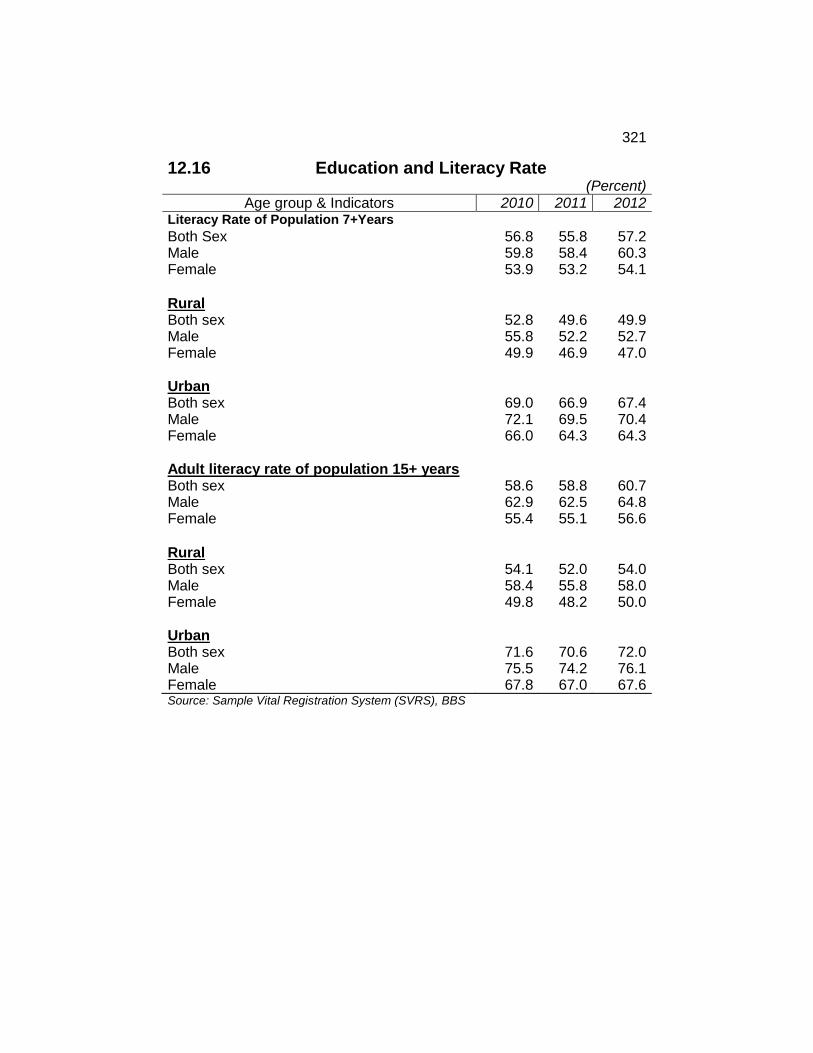
321
12.16 Education and Literacy Rate (Percent)
Age group & Indicators 2010 2011 2012 Literacy Rate of Population 7+Years Both Sex 56.8 55.8 57.2 Male 59.8 58.4 60.3 Female 53.9 53.2 54.1
Rural Both sex 52.8 49.6 49.9 Male 55.8 52.2 52.7 Female 49.9 46.9 47.0 Urban Both sex 69.0 66.9 67.4 Male 72.1 69.5 70.4 Female 66.0 64.3 64.3 Adult literacy rate of population 15+ years Both sex 58.6 58.8 60.7 Male 62.9 62.5 64.8 Female 55.4 55.1 56.6
Rural Both sex 54.1 52.0 54.0 Male 58.4 55.8 58.0 Female 49.8 48.2 50.0 Urban Both sex 71.6 70.6 72.0 Male 75.5 74.2 76.1 Female 67.8 67.0 67.6 Source: Sample Vital Registration System (SVRS), BBS

322
12.17 Literacy Rate of Population 7 Years and Above by Zila, 2011
SL No
Name of Zila Literacy Rate Total Male Female
BANGLADESH 51.77 54.11 49.44 Barisal Division 56.75 57.62 55.93
01 Barguna 57.64 59.23 56.12 02 Barisal 61.24 61.88 60.63 03 Bhola 43.24 43.59 42.91 04 Jhalokathi 66.68 67.59 65.84 05 Patuakhali 54.07 56.24 52.01 06 Pirojpur 52.69 65.04 64.68 Chittagong Division 52.69 53.94 51.52
07 Bandarban 35.86 40.29 30.93 08 Brahmanbaria 45.29 45.74 44.88 09 Chandpur 56.78 56.14 57.34 10 Chittagong 58.91 61.13 56.66 11 Comilla 53.32 54.08 52.65 12 Cox`s Bazar 39.29 40.32 38.22 13 Feni 59.63 61.11 58.28 14 Khagrachhari 46.11 51.88 40.07 15 Lakshmipur 49.40 48.94 49.81 16 Noakhail 51.29 51.44 51.16 17 Rangamati 49.73 56.42 42.26 Dhaka Division 54.19 57.00 51.27
18 Dhaka 70.54 73.56 66.86 19 Faridpur 48.96 50.29 47.69 20 Gazipur 62.60 65.96 58.92 21 Gopal ganj 58.09 60.30 55.98 22 Jamal pur 38.44 41.14 35.86 23 Kishoreganj 40.87 41.51 40.25 24 Madaripur 47.97 50.11 45.93 25 Manikganj 49.20 52.59 46.05 26 Munshiganj 56.09 56.44 55.74 27 Mymenshing 43.49 44.86 42.16 28 Narayanganj 57.10 59.48 54.56 29 Narsingdi 49.60 50.56 48.66 30 Netrokona 39.44 40.88 38.03 31 Rajbari 52.28 53.98 50.63 32 Shuriat pur 47.26 47.96 46.62 33 Sherpur 37.91 40.17 35.70 34 Tangail 46.79 50.01 43.77
Contd.

323
12.17 Literacy Rate of Population of 7 Years and Above by Zila, 2011
SL No
Name of district Literacy Rate Total Male Female
Khulna Division 53.23 55.72 50.75 35 Bagerhat 58.98 59.97 57.99 36 Chuadanga 45.91 46.88 44.93 37 Jessore 56.52 59.38 53.65 38 Jhenaidah 48.40 50.45 46.35 39 Khulna 60.14 64.32 55.85 40 Kushtia 46.33 47.88 44.79 41 Magura 50.64 52.87 48.48 42 Meherpur 46.27 46.87 45.69 43 Narail 61.27 63.34 59.31 44 Satkhira 52.07 56.11 48.15 Rajshahi Division 48.05 50.50 45.60
45 Bogra Zila 49.38 52.86 45.89 46 Joypurhat Zila 57.48 61.39 53.55 47 Naogaon Zila 48.22 51.29 45.17 48 Natore Zila 49.59 51.90 47.29 49 Chapi Nawabganj Zila 42.94 41.55 44.27 50 Pabna Zila 46.72 47.83 45.61 51 Rajshahi Zila 52.98 55.84 50.09 52 Sirajganj Zila 42.05 45.11 39.00 Rangpur Division 47.19 50.60 43.82
53 Dinajpur Zila 52.42 55.68 49.12 54 Gaibandha Zila 42.81 46.29 39.50 55 Kurigram Zila 42.52 46.49 38.80 56 Lalmonirhat Zila 46.09 49.30 42.89 57 Nilphamari Zila 44.37 47.59 41.13 58 Panchagarh Zila 51.77 55.21 48.32 59 Rangpur Zila 48.55 51.25 45.86 60 Thakurgaon Zila 48.71 52.97 44.40 sylhet Division 45.01 46.96 43.10
61 Habiganj 40.53 42.22 38.94 62 Maulvi Bazar 51.10 52.74 49.53 63 Sunamganj 34.98 36.86 33.12 64 Sylhet 51.18 53.48 48.87
Sourch : Population & Housing Census , 2011, BBS.

324
12.18 Number of Students of Public Universities, 2013 Name of University Male Female Total
Students 1 Dhaka University 19842 10992 30834 2 Rajshahi University 22723 11199 33922 3 Chittagong University 14011 6321 20332 4 Jahangirnagar University 99381 5115 14496 5 BUET 7947 1908 9855 6 Bangladesh Agricultural University 3375 2020 5395 7 Islami University 8609 3320 11929 8 Shahjalal University 6120 2377 8497 9 Khulna University 3136 1696 4832 10 Bangladesh Open University 140420 1035088 243928 11 Bangobandhu Sk. Mujibur Rahman - - - 12 Agricultural University 382 326 708 13 National University 14 Bangabandhu Sk. Mujub Medical University 979 609 1588 15 Sher-e-Bangla AgriculturalUniversity 1615 1191 2806 16 Haji Mohammad Danesh Science &Technology
University 1982 1387 3369
17 Patuakhali Science &Technology University 1596 799 2395 18 Moulana Bhasani Science & Technology University 2206 884 3090 19 Chittagong Engineering & Technology University 2517 443 2960 20 Rajshahi Engineering &Technology University 2578 383 2961 21 Khulna Engineering &Technology University 2813 409 3222 22 Dhaka Engineering &Technology University 2315 170 2485 23 Noakhali Science & Technology University 1601 710 2311 24 Jagannath University 13766 4649 18415 25 National Poet Kazi Nazrul Islam University 2122 1342 3464 26 Comilla University 2275 1155 3430 27 Chittagong Veterinary & Animals Science
University 475 226 701
28 Sylhet Agriculture University 1448 560 2008 29 Jessore Science & Technology University 1209 556 1765 30 Bangladesh University of Professional 993 292 1285 31 Begum Rokeya University Rangpur 2498 2240 4738 32 Pabna Science & Technology University 1212 344 1556 33 Bangabandhu Sk. Mojibur Rahman 984 366 1350 34 Bangladesh Textile University 1393 221 1614 35 Barishal University 1488 801 2289
Total 286011 168519 454530 Source: University Grants Commission.

325
12.19 Number of Students of Private Universities, 2013 Name of University Students
Male Female Total
1. Independent University, Dhaka 3564 1423 4989 2. North-South University, Dhaka 15493 6403 21896 3. International University of Business, Agriculture and
Technology (IUBAT), Dhaka
6635
1365
4698 4. University of Science and Technology, Chittagong 2884 1814 2226 5. Darul Ihsan University, Dhaka 1612 614 6328 6. Ahsanullah University of Science & Technology, Dhaka 4314 2014 11056 7. American International University, Bangladesh 8213 2843 10820 8. Asian University of Bangladesh 7680 3140 9355 9. East-West University, Dhaka 5985 3370 9379
10. International Islamic University, Chittagong 6128 3251 4288 11. The University of Asia Pacific, Dhaka 2796 1492 3681 12. Gono University Savar,Dhaka 2158 1323 7784 13. The People's University of Bangladesh 5888 1896 7236 14. BRAC University 3798 3438 10714 15 Stamford University, Bangladesh 7444 3270 8458
16. Northern University 5970 2488 8673 17. South East University 6623 1454 8077 18. Premier University Chittagong 5521 2050 6342 19. Dhaka International University 6342 2556 3560 20. Manarat International University 2033 1527 3560 21. Bangladesh University 5428 1527 3453 22. Leading University 2205 1544 6252 23. BGC Trust University, Bangladesh 4938 1248 4070 24. Sylhet International University 3053 1314 4479 25. University of Dev. Alternatives 2826 1017 11240 26. Daffodil International University 9408 1648 3091 27. State University of Bangladesh 3091 1832 2030 28. IBAIS University 1711 - 7603 29. City University 6653 319 4629
30. Prime University 3676 950 4145 31. Southern University Bangladesh, Chittagong 3363 953 3165 32. Green University of Bangladesh 2762 782 5501 33. World Universtiy of Bangladesh 4417 1084 5501 Contd.

326
12.19 Number of Students of Private Universities, 2014 Name of University Students Male Female Total
34. Santamarium Universtiy of CreativeTechnology 4044 1974 6018 35. The Millennium University 631 210 841 36. Eastern University 2122 1128 3250 37. Bangladesh University of Business & Technology 5285 2237 7522 38. Metropolitan University 2233 1035 3268 39. Uttra University 7400 2703 10103 40. United International University 10404 5891 16295 41. Victoria University of Bangladesh 766 249 1015 42. University of South Asia 2746 601 3347 43. Presidency University 3330 720 4050 44. University of Information Technology & Science 8370 1862 10232 45. Prime Asia University 3421 648 4069 46. Royal University of Dhaka 933 198 1131 47. University of Liberal Arts, 2341 1620 3961 48. Atish Diponkar University of Science & Technology 11342 1513 12855 49. Bangladesh Islamic University 6688 2103 8791 50. ASA University Bangladesh 2863 11557 4020 51. East Dalta Unversity 2863 246 690 52. Central Womens University 444 140 140 53. European University of Bangladesh - 72 543 54. Barendra University 471 174 55336 55. Hamdard University 229 45 274 56. BGMEA University of fashin &techonology 3266 275 3541 57. North east University , Bangladesh 381 135 516 58. First Capital University of Bangladesh 198 80 278 59. Isakha Internationa University Bangladesh 235 58 293 60. Z H Sikder Science & technology University 527 222 749 61 North Western University 625 158 783 62 Khaza Inus Ali University 22 9 3331 63 Sonargaon University 534 47 581 64 Feni University 93 25 118 65 Britinia University 132 37 169 66 Port City University 428 47 475 67 BD University of Health Science 107 74 181 68 Chittagong Independent University 23 21 44 69 Notordame University - - - 70 Time University - - - Contd.

327
12.19 Number of Students of Private Universities, 2014 Name of University Students Male Femal
e Total
71. North Bengal University - - - 72. Far East International University - - - 73. Rajshahi Sceience technology University - - - 74. Sheikh Fazulatunnessa Majib University - - - 75. Cox’s Bazar International University - - - 76. R.P. Shaha University - - - 77. German University Bangladesh - - - Source : University Grants Commission.

329
Chapter XIII
HEALTH, FAMILY PLANNING
AND SOCIAL STATISTICS

330

331
13.01 Indicators of The Health and Family Planning Sector
CL.No
Health Services Provision Number Source
1. Government hospitals under DGHS 592 DGHS 2014 2. Government hospitals of secondary and tertiary
Level Under DGHS
125
DGHS 2014 3. Government hospitals at Upazila and Union
Level
467
DGHS 2014 4. No, of Private registered hospitals and clinics
under DGHS
2983
DGHS 2013 5. No. of private registered diagnostic 5220 DGHS 2013 6. Total beds (in DGHS and registered private
hospitals) :
94318 (DGHS 2014)
7. No. of hospital beds under DGHS (approved) : 48833 (DGHS 2014) 8. No, of hospital beds in private sector
(in private hospitals registered by DGHS
45485
(DGHS 2013) 9. Population per hospital bed (total beds in DGHS
and registered private hospitals against estimated population of July, 2014) :
1655
DGHS 2014 10. No, of postgraduate medical teaching
institutions: 33; Government: 23 Private: 10
DGHS 2013 11. No, of medical colleges: Total 90;
Government: 35; Private: 55
DGHS 2013 12. No, of Dental colleges: Total 27;
Government: 9; Private: 18
DGHS 2013 13. No. of degree/diploma collages for alternative
medicine: Total 64: Government: 3; Private 61
DGHS 2013 14. No. of nursing institutions offering maters degree to
diploma: Total 131; Government:57; Private: 74
DGHS 2013 15. No. of institutions providing midwifery training: 12 DGHS 2013 16. No. of training institutions for community skilled birth
attendants:
47
DGHS 2013 17. No. of medical assistants training schools:
Total 111; Government: 8; Private: 103
DGHS 2013 18. No. of institutes of health technology (IHT)
Total 112; Government: 11; Private: 97; Government-Private: 4
DGHS 2013 19. Bachelor of Homeopathic Medicine College: 50 Health
Bulletin-2014 20. Nursing: Total 7,895;Government 4,640; Private:
3,255 Midwifery: 320 Health
Bulletin-2014 Contd.

332
13.01 Indicators of The Health and Family Planning Sector
CL.No
Health Services Provision Number Source
21. Medical Assistant 6821 Health Bulletin-2014
22. Medical technologist 14255 Health Bulletin-2014
23. No. of sanctioned posts Under DGHS 124216 DGHS 2014 24. No. of registered Physicians 65767 HRM unit,
MOHFW 2013 25. No. of registered dental surgeons 6034 BMDC 2013 26. Distribution of doctors MOHFW 35% MOHFW 2013
Other ministries 3% private 62% HRM unit, MOHFW 2013
27. No. of doctors under DGHS (existing) 23066 DGHS 2014 28. Doctors under DGFP 586 DGFP 2013 29. Total No. of doctors in DGHS and DGFP 23652 DGHS 2013 30. Estimated number of doctors available in the
country
53929
MOHFW 2013 31. No. of registered diploma nurses 33183 BNC 2013 32. Nureses Currently available Under MoHFW 18366 DNS 2014 33. No. of nurse mid-wives in public sector 596 DGHS 2013 34. No. of trained skilled birth attendants 7265 DNC 2013 35. No. of family planning officers 356 DGFP 2014 36. No. of sanitary inspectors 436 DGHS 2014 37. No. of dental technologists 501 DGHS 2014 38. No. of laboratory technologists 1498 DGHS 2014 39. No. of pharmacy technologists 2126 DGHS 2014 40. No. of radiographers 629 DGHS 2014 41. No. of physical therapists 144 DGHS 2014 42. No. of community healthcare providers to work
at community clinics
13240 HRM unit,
MOHFW 2013 43. No. of domiciliary workers under under DGHS 22045 DGHS 2014 44. No. of facility –based workers under DGFP 5358 DGFP 2013 45. Population per physician 2894 Health
Bulletin-2014 46. Population per MOHFW’s nurse 8497 Health
Bulletin-2014 47. Population per MOHFW’s medical technologist 29034 Health
Bulletin-2014 48. No. of MOHFW’s medical technologists per
10000 population 0.3 Health
Bulletin-2014 49. Population per MOHFW’s community health
worker 2603 Health
Bulletin-2014 50. No. of No. of MOHFW’s community health
workers per 10000 population 3.8 Health
Bulletin-2014 Source: DG of Health Service . Health Bulletin, 2014 & BBS.
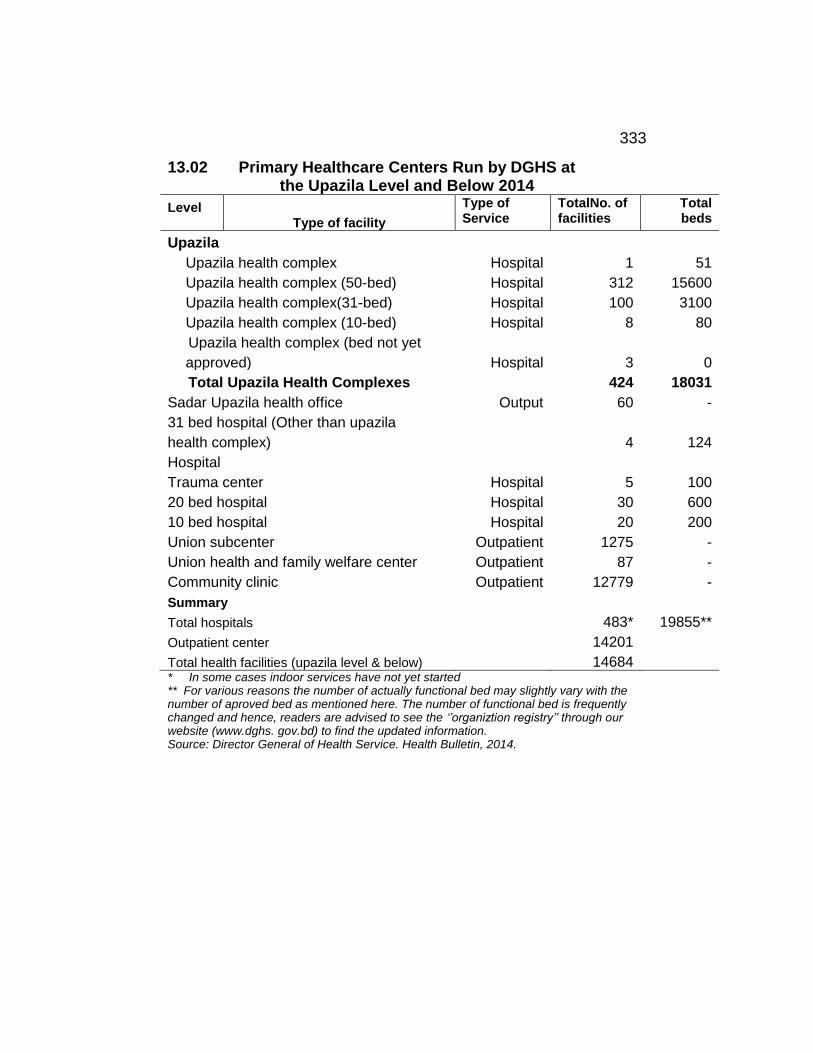
333
13.02 Primary Healthcare Centers Run by DGHS at the Upazila Level and Below 2014
Level Type of facility
Type of Service
TotalNo. of facilities
Total beds
Upazila
Upazila health complex Hospital 1 51
Upazila health complex (50-bed) Hospital 312 15600
Upazila health complex(31-bed) Hospital 100 3100
Upazila health complex (10-bed) Hospital 8 80
Upazila health complex (bed not yet
approved)
Hospital
3
0
Total Upazila Health Complexes 424 18031
Sadar Upazila health office Output 60 -
31 bed hospital (Other than upazila
health complex)
Hospital
4 124
Trauma center Hospital 5 100
20 bed hospital Hospital 30 600
10 bed hospital Hospital 20 200
Union subcenter Outpatient 1275 -
Union health and family welfare center Outpatient 87 -
Community clinic Outpatient 12779 -
Summary
Total hospitals 483* 19855**
Outpatient center 14201
Total health facilities (upazila level & below) 14684 * In some cases indoor services have not yet started ** For various reasons the number of actually functional bed may slightly vary with the number of aproved bed as mentioned here. The number of functional bed is frequently changed and hence, readers are advised to see the ‘’organiztion registry’’ through our website (www.dghs. gov.bd) to find the updated information. Source: Director General of Health Service. Health Bulletin, 2014.

13.03 Distribution of Secondary and Tertiary Public Hospitals Under the DGHS by Division, 2014
Type of Hospitals No and%
Barisal Chittagong Dhaka Khulna Rajshahi Rangpur Sylhet Total
Medical college No 1 2 5 1 2 2 1 14
Hospitals % 7.14 14.29 35.71 7.14 14.29 14.29 7.14 100.00
Other Hosptials at No 7 10 43 15 10 10 7 112
the district level and above
% 6.25 16.07 38.39 13.39 10.71 8.93 6.25 100.00
Source: DG of Health. Health Bulletin, 2014.
334

335
13.04 Number of Beds, Admissions, Hospital Deaths, Outdoor Visits bed-occupancy Rate, Average Length of Stay, and Hospital Death rates in Medical College Hospital 2013
Health facility No. of admissions No. of hospital deaths No. of beds
Male Female Child Total Male Female Child Total
Medical college hospital Sher-e-Bangla M.C.H. 500 34294 34224 13864 82382 1147 1075 1048 3270 Chittagong MC.H 131
3 62173 42550 24508 129231 2715 2340 2453 7508
Comilla M.C.H. 500 16824 17593 14360 48777 598 443 627 1678 Dhaka M.C.H 240
0 49946 26296 19007 95319 5618 2790 458 8866
Shahid Suhrawardy M.C.H 720 16302 17409 10093 43404 312 236 142 690 Sir Salimullah M.C.H. 600 20149 30280 7803 58292 929 691 335 1955 Faridpur M.C.H 500 13853 18077 3983 35913 690 671 422 1783 Mymensingh M.C.H. 100
0 0 0 0 0 0 0 0 0
Shahid Ziaur Rahman M.C.H 500 23315 21008 7115 51438 1187 977 717 2881 Rajshahi M.C.H 530 48356 49871 17559 115786 2413 1547 1225 5185 Dinajpur M.C.H 100
0 13468 12329 6739 32536 644 607 197 1448
Rangpur M.C.H. 500 49597 41225 1924 92746 1850 1442 1024 4316 Sylhet M.A.G. Osmani MC.H 530 52148 49892 13100 115140 1942 1537 839 4318 Khulna M.C.H 500 0 0 0 0 0 0 0 0 Contd.

13.04 Number of Beds, Admissions, Hospital Deaths, Outdoor Visits bed-occupancy Rate, Average Length of Stay, and Hospital Death rates in Medical College Hospital 2013
Health facility No. of outdoor visits Bed occu
pancy
Average length
ofstay(d)
Average daily number Hospital death
rate (%) Male Female Child Total Admission Outdoor
visit
Medical college hospital
Sher-e-Bangla M.C.H. 219282 138405 96385 454072 238.3 5.3 226 1244 4.0
Chittagong MC.H 421431 317191 90965 829587 135.9 5.0 354 2273 5.8
Comilla M.C.H. 87189 107950 56662 251801 134.4 5.0 134 690 3.4
Dhaka M.C.H 607562 432308 184014 1223884 95.9 8.8 261 6653 9.3
Shahid Suhrawardy M.C.H 203559 217347 43670 464576 100.0 6.0 120 1273 1.6
Sir Salimullah M.C.H. 190013 261247 162562 613822 126.6 4.8 160 1682 3.4
Faridpur M.C.H 47294 52099 16290 115683 86.6 4.4 98 317 5.0
Mymensingh M.C.H. 111940 126250 108465 346655 0.0 4.6 0 960 4.9
Shahid Ziaur Rahman M.C.H 163736 162479 24547 350762 152.2 5.4 141 961 5.6
Rajshahi M.C.H 212298 321265 66698 600261 226.2 3.8 317 1645 4.5
Dinajpur M.C.H 47220 53717 22142 123079 105.4 5.9 89 337 4.5
Rangpur M.C.H. 124004 105577 10425 240006 134.7 5.3 254 658 4.7
Sylhet M.A.G. Osmani MC.H 325911 444852 106048 876811 151.8 4.3 315 2402 3.8
Khulna M.C.H 0 0 0 0 0.0 0.0 0 0 0.0
Source: DG of Health, Health Bulletin, 2014. 336

337
13.05 Distribution of Family Planning Aids Through Government Programme Year Permanent Method(cases) IUD Implant Injectable Oralpill Condom M.R
Male Female Total (cases)
(cases) (Doses) (cycles) (pieces)
1998-99 16500 45220 61720 176514 50183 7193788 94593439 191203789 -
1999-00 20724 31042 51766 137570 46376 6926575 85101732 205908308 -
2005-06 51710 62076 113786 248717 66366 12358592 82563949 70072451 124045
2006-07 91291 100409 191700 221694 13804 6513368 97603517 68727958 180106
2007-08 92994 106053 199047 237312 177648 10121299 95172724 5834518 200645
2008-09 100646 115754 216400 330709 86720 12552213 102745106 80809006 201282
2009-10 162430 128768 291198 226415 40348 12358014 108184384 112678645 230220
2010-11 150881 138381 289262 307267 273677 1342309 110737227 126586108 257938
2011-12 167262 140284 307546 261648 215732 13853177 109652518 130668958 265594
2012-13 127828 121922 249750 281137 263277 263277 107320885 139087731 243242
2013-14 101989 114749 216738 244855 13789159 107085168 146926405 310931 19825
Note: M.R is not a family planning method, but it is a maternal health intervention to reduce maternal mortality and morbidity. Source: M.I.S init, Directorate General of Family Planning
13.06 Number of Newspapers Published Year No. of Newspapers and Periodicals
Daily Bi-weekly fortnightly
Monthly Others total
2002 407 603 258 108 1376 2003 436 615 260 108 1419 2004 376 249 67 6 698 2005 407 286 64 7 764 2006 410 267 57 6 740 2008 424 214 69 05 712 2009 405 129 57 02 593 2010 294 126 30 20 470 2011 310 133 30 03 476 2012 322 118 28 02 470 2013 341 79 20 19 459 2014 863 831 161 15 1870 Source: Department of Film and Publications (DFP)

338
13.07 Number of Books Published by Language Year Bengali English Others Total
1999 88 23 - 111
2000 530 87 29 646
2001 780 75 4 859
2002 439 27 - 466
2003 340 34 - 374
2004 339 38 1 368
2005 302 22 1 325
2006 269 30 - 299
2008 267 50 02 319
2009 301 31 - 332
2010 700 100 100 900
2011 318 100 90 508
2012 221 17 02 240
2013 489 23 12 524 Source: Department of Films and Publications.

13.08 Number of Crime Statistics in 2014 Unit Name
Dacoity
Robery
Murder
Speedy
Trail
Riot
Woman & child Repre- ssion
Kidna- pping
Police Assault
Burglary
DMP 47 265 262 332 7 1438 176 104 650 CMP 5 63 120 52 17 300 53 31 97 KMP 2 29 22 17 0 203 11 3 44 RMP 0 28 22 20 6 117 21 14 65 BMP 7 16 15 3 0 93 3 9 35 SMP 21 29 44 32 13 127 8 26 34 Dhaka Range 184 221 1395 6 1 4644 203 127 619 Chittagong Range 138 169 792 193 9 3894 159 228 435 Sylhet Range 4 30 277 54 11 566 27 41 93 Khulna Range 80 5 520 277 15 2312 77 53 310 Barishal Range 36 7 200 51 15 1199 60 8 163 Rajshahi Range 55 73 463 138 0 2190 81 26 137 Rangpur Range 21 62 349 88 0 2525 45 32 126 Railway Range 1 8 83 3 0 5 0 0 1 Total 651 1155 4514 1716 79 19603 920 702 2807
Contd. 339

13.08 Number of Crime Statistics in 2014 Unit Name
Theft
Others Cases
Recovery Cases Total Cases Arms
Act Explosive
Act Narcotics Smuggling Total
DMP 2130 6219 225 104 7063 222 7614 19417 CMP 310 1457 121 16 2485 56 2675 5267 KMP 101 522 34 2 599 10 645 1602 RMP 106 569 18 27 395 126 566 1586 BMP 48 375 16 1 759 5 781 1386 SMP 142 728 12 4 311 18 345 1583 Dhaka Range 1580 21716 331 64 12175 555 13125 44536 Chittagong Range 939 15503 490 53 6817 285 7645 30450 Sylhet Range 354 5468 38 6 2026 202 2272 9426 Khulna Range 585 10247 381 152 2935 1766 5234 19874 Barishal Range 255 6892 36 19 813 31 8999 10049 Rajshahi Range 500 10353 249 64 3969 2070 6352 20537 Rangpur Range 549 10181 62 11 1756 1332 3161 17187 Railway Range 89 170 10 3 395 110 518 829 Total 7660 90400 2023 520 42501 6788 51832 183729 source: Police headquarters. 340
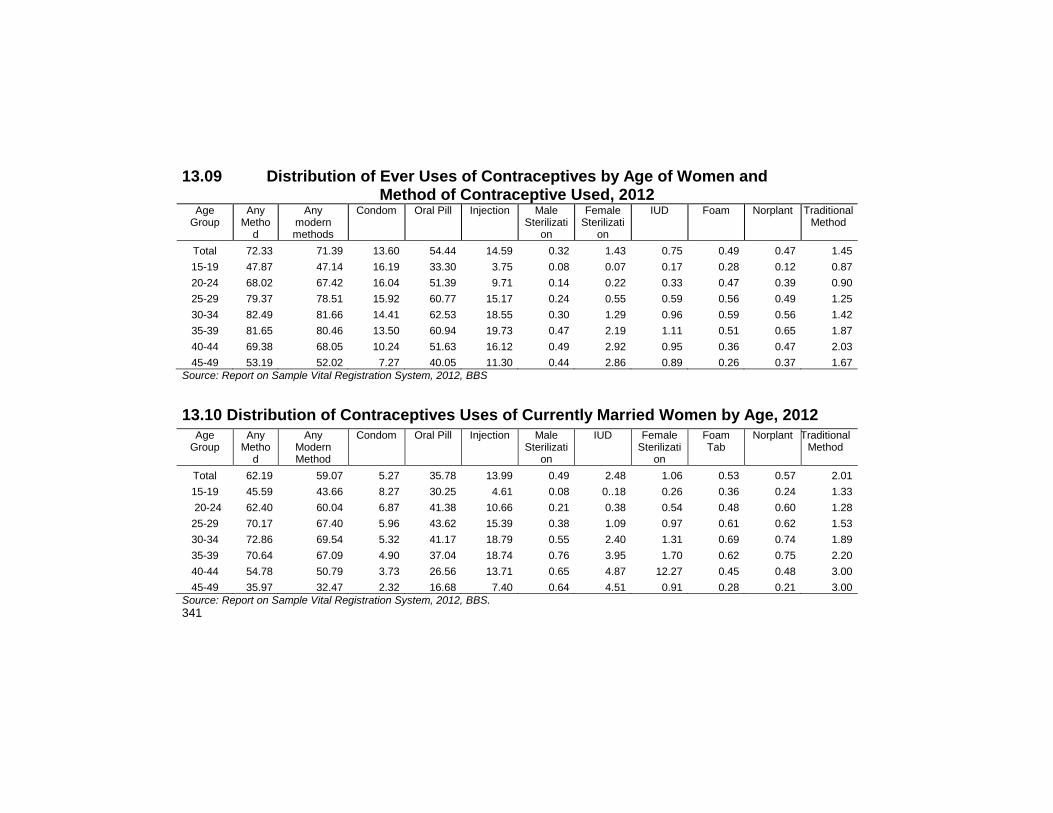
13.09 Distribution of Ever Uses of Contraceptives by Age of Women and Method of Contraceptive Used, 2012
Age Group
Any Metho
d
Any modern methods
Condom Oral Pill Injection Male Sterilizati
on
Female Sterilizati
on
IUD Foam Norplant Traditional Method
Total 72.33 71.39 13.60 54.44 14.59 0.32 1.43 0.75 0.49 0.47 1.45
15-19 47.87 47.14 16.19 33.30 3.75 0.08 0.07 0.17 0.28 0.12 0.87
20-24 68.02 67.42 16.04 51.39 9.71 0.14 0.22 0.33 0.47 0.39 0.90
25-29 79.37 78.51 15.92 60.77 15.17 0.24 0.55 0.59 0.56 0.49 1.25
30-34 82.49 81.66 14.41 62.53 18.55 0.30 1.29 0.96 0.59 0.56 1.42
35-39 81.65 80.46 13.50 60.94 19.73 0.47 2.19 1.11 0.51 0.65 1.87
40-44 69.38 68.05 10.24 51.63 16.12 0.49 2.92 0.95 0.36 0.47 2.03
45-49 53.19 52.02 7.27 40.05 11.30 0.44 2.86 0.89 0.26 0.37 1.67
Source: Report on Sample Vital Registration System, 2012, BBS
13.10 Distribution of Contraceptives Uses of Currently Married Women by Age, 2012
Age Group
Any Metho
d
Any Modern Method
Condom Oral Pill Injection Male Sterilizati
on
IUD Female Sterilizati
on
Foam Tab
Norplant Traditional Method
Total 62.19 59.07 5.27 35.78 13.99 0.49 2.48 1.06 0.53 0.57 2.01
15-19 45.59 43.66 8.27 30.25 4.61 0.08 0..18 0.26 0.36 0.24 1.33
20-24 62.40 60.04 6.87 41.38 10.66 0.21 0.38 0.54 0.48 0.60 1.28
25-29 70.17 67.40 5.96 43.62 15.39 0.38 1.09 0.97 0.61 0.62 1.53
30-34 72.86 69.54 5.32 41.17 18.79 0.55 2.40 1.31 0.69 0.74 1.89
35-39 70.64 67.09 4.90 37.04 18.74 0.76 3.95 1.70 0.62 0.75 2.20
40-44 54.78 50.79 3.73 26.56 13.71 0.65 4.87 12.27 0.45 0.48 3.00
45-49 35.97 32.47 2.32 16.68 7.40 0.64 4.51 0.91 0.28 0.21 3.00
Source: Report on Sample Vital Registration System, 2012, BBS. 341
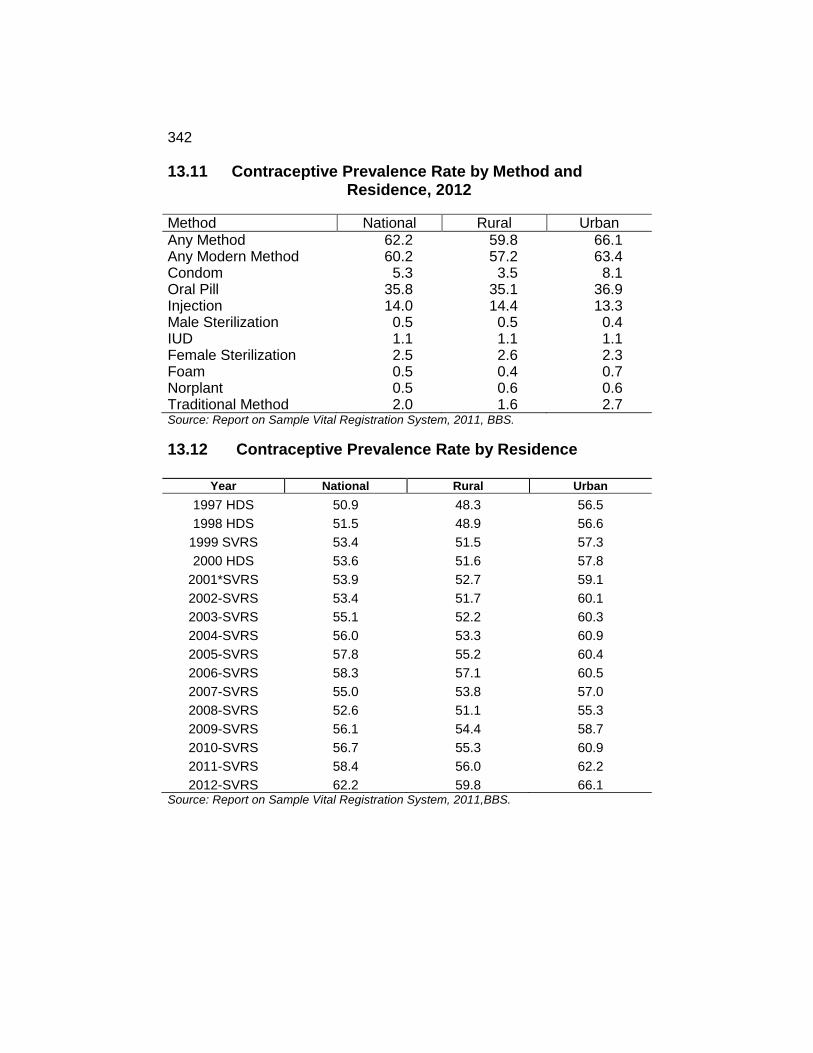
342
13.11 Contraceptive Prevalence Rate by Method and Residence, 2012
Method National Rural Urban Any Method 62.2 59.8 66.1 Any Modern Method 60.2 57.2 63.4 Condom 5.3 3.5 8.1 Oral Pill 35.8 35.1 36.9 Injection 14.0 14.4 13.3 Male Sterilization 0.5 0.5 0.4 IUD 1.1 1.1 1.1 Female Sterilization 2.5 2.6 2.3 Foam 0.5 0.4 0.7 Norplant 0.5 0.6 0.6 Traditional Method 2.0 1.6 2.7 Source: Report on Sample Vital Registration System, 2011, BBS.
13.12 Contraceptive Prevalence Rate by Residence
Year National Rural Urban
1997 HDS 50.9 48.3 56.5
1998 HDS 51.5 48.9 56.6
1999 SVRS 53.4 51.5 57.3
2000 HDS 53.6 51.6 57.8
2001*SVRS 53.9 52.7 59.1
2002-SVRS 53.4 51.7 60.1
2003-SVRS 55.1 52.2 60.3
2004-SVRS 56.0 53.3 60.9
2005-SVRS 57.8 55.2 60.4
2006-SVRS 58.3 57.1 60.5
2007-SVRS 55.0 53.8 57.0
2008-SVRS 52.6 51.1 55.3
2009-SVRS 56.1 54.4 58.7
2010-SVRS 56.7 55.3 60.9
2011-SVRS 58.4 56.0 62.2
2012-SVRS 62.2 59.8 66.1 Source: Report on Sample Vital Registration System, 2011,BBS.

343
13.13 Contraceptive Uses Trend by 2006 to 2012 (among users)
Method 2006 2007 2008 2009 2010 2011 2012
Any method 100 100 100 100 100 100 100
Any modern method 90.1 94.2 96.1 95.8 96.6 96.8 96.8
Oral Pill 62.1 62.7 72.1 66.3 60.6 60.0 59.5
IUD 1.2 1.4 0.7 0.7 1.4 1.6 1.7
Injection 12.0 18.7 15.2 16.3 22.3 21.9 23.2
Condom 11.7 7.9 6.1 9.6 6.7 6.8 8.7
Female sterilization 2.9 3.4 1.8 2.5 3.6 3.7 4.1
Male sterilization 0.5 0.5 0.3 0.4 0.7 0.9 0.8
By Traditional Method 9.9 5.9 3.9 4.2 3.4 3.1 3.2
Others(Poam, Nor plant - - - - 1.4 2.1 1.8 Source : Report on Sample Vital Registration System, 2011, BBS
13.14 Contraceptive Method Mix with Respect to Modern Method
Method 2003
SVRS 2004 SVRS
2006 SVRS
2009 SVRS
2010 SVRS
2011 SVRS
2012 SVRS
Any modern method 100.0 100.0 100.0 100.0 100.0 100.0 100.0
Pill 64.5 64.4 69.0 69.2 62.7 62.0 59.5
IUD 1.2 1.2 1.3 0.8 1.4 1.6 1.8
Injection 19.8 19.6 13.2 16.8 23.2 22.6 23.2
Condom 10.6 10.8 12.9 10.3 6.9 7.0 8.8
Female sterilization 3.7 3.5 3.2 2.5 3.6 3.8 4.1
Male sterilization 0.4 0.4 0.5 0.4 0.7 0.9 0.8
Others(Poam, Nor plant) - - - - 1.6 2.2 1.8 Source : Report on Sample Vital Registration System, 2012, BBS.-

344
13.15 Proportion and Prevalence of morbidity per 1000 Population by selected diseases by sex December 2011-February 2012 Selected Diseases Proportional morbidity(%) Prevalence per 1000
population
Total Male Female Total Male Female
Arthrjitis 7.5 6.3 8.7 14.0 10.9 17.1
Peptic Ulcer 7.3 7.0 7.5 13.4 12.1 14.8
High blood Pressure 6.7 6.0 7.3 12.4 10.5 14.4
Dysentery 4.5 5.2 3.8 8.3 9.1 7.5
Diabetes 4.2 4.4 4.1 7.8 7.7 8.0
Diarrhoea 3.5 3.7 3.4 6.6 6.4 6.7
Acute respiratory Infection 2.6 3.1 2.2 4.9 5.4 4.3
Skin Disease 2.3 2.5 2.1 4.3 4.4 4.2
Conjuctivitis 2.2 1.9 2.6 4.2 3.3 5.0
Asthma 2.1 2.4 1.8 3.9 4.2 3.6
Heart disease 1.8 2.0 1.7 3.3 3.4 3.2
Cataract 1.8 1.7 1.9 3.3 3.0 3.7
hepatitis-b 1.5 1.9 1.2 2.8 3.4 2.3
Measles 1.4 1.4 1.4 2.6 2.4 2.8
Whooping cough 1.4 1.8 1.0 2.5 3.1 2.0
Influenz 1.2 1.3 1.0 2.2 2.3 2.0
Urinary Tract Infecton 1.0 0.9 1.1 1.9 1.5 2.3
Malaria 0.8 0.9 0.7 1.5 1.6 1.3
Chicken pox 0.8 1.0 0.6 1.4 1.7 1.1
Typhoid 0.7 0.7 0.7 1.4 1.3 1.5
Kala-azar 0.6 0.6 0.6 1.2 1.1 1.5
Night blindness 0.6 0.7 0.5 1.1 1.2 1.1
Tuberculosis 0.6 0.7 0.4 1.0 1.3 0.8
Goitre 0.5 0.4 0.5 0.8 0.8 0.9
Cancer/Malignancy 0.4 0.3 0.4 0.6 0.6 0.7
Mumps 0.2 0.2 0.3 0.5 0.4 0.5
Rabies 0.1 0.2 0.1 0.3 0.3 0.2
Tetanus 0..1 0.1 0.1 0.2 0.1 0.2
Diphtheria 0.0 0.1 0.0 0.1 0.1 0.0
Total 100 100 100 186 174 197 Source: Health and Morbidity Status Survey, 2012, BBS.

345
13.16 Proportion of Persons reported morbidity of Different asset Quintile Received treatment from different Health Facility Sl. No
Health Facility Asset Quintile
Lowest Second Middle Forth Highest Total
Government 27 26 29 29 22 27
Private 69 71 68 68 75 70
NGO Clinic 3 3 3 3 3 3
Total 100 100 100 100 100 100
Source: Health and Morbidity Status Survey-2012, BBS
13.17 Proportion of Treatments Received by Source of Treatment an d Sex
Sources of Treatment Total Male Female Doctor 61.8 61.4 62.2 Health Worker (Govt.) 5.4 5.2 5.5 Parmedics/Medical Technologist
3.8 3.8 3.9
Health Worker (NGO) 2.0 1.8 2.2 Homeopathic Doctor 3.6 3.6 3.7 Kabirazi/Unani/Ayurbedic 1.8 2.1 1.5 Religious/Traditional 1.0 1.0 1.1 Pharmacy/Dispensary Worker/Compounder/Family Treatment/Self treatment/Others
20.6 21.2 20.0
Total 100 100 100 Source: Health and Morbidity Status Survey-2012
13.18 Average Expenditure Per Treatment Recipient Due to Accident by Sex and Residence December 2011-Pebruary 2012 Residence Average Expenditure (Tk.)
Total Total Male Female
Rural 4396 4752 3693 Urban 4875 5455 3620 National 4521 4937 3675 Source: Health and Morbidity Status Survey-2012

13.19 Distribution Method of Treatment by Sex and Residence HIES, 2011 & 2005
Type of Treatment National Rural Urban Both Sex
Male Female Both Sex
Male Female Both Sex
Male Female
2010 Total 100.00 100.00 100.00 100.00 100.00 100.00 100.00 100.00 100.00 Govt. health worker 2.41 2.38 2.43 2.57 2.50 2.64 1.70 1.85 1.57 NGO health worker 0.37 0.31 0.43 0.31 0.28 0.33 0.64 0.41 0.84 Homoeopathic doctor 3.44 3.18 3.68 3.49 3.19 3.75 3.26 3.12 3.37 Kabiraj/Hekim/Ayurbed 1.00 1.28 0.75 1.13 1.44 0.86 0.41 0.55 0.29 Peer/Fakir/Tantric/Ojha/boidya 0.36 0.40 0.32 0.31 0.37 0.26 0.56 0.55 0.57 Govt. Doctor (Govt. Institution) 9.28 9.14 9.41 8.52 8.59 8.45 12.53 11.58 13.34 Govt. Doctor (Private Practics) 14.34 13.43 15.16 13.11 12.22 13.92 19.57 18.72 20.31 NGO Doctor 0.20 0.20 0.20 0.22 0.23 0.20 0.13 0.08 0.17 Private Doctor 24.46 24.37 24.54 25.04 24.86 25.21 22.00 22.25 21.79 Pharmacy/dispensary/Compounder 40.21 41.35 39.20 41.20 42.19 40.30 36.05 37.688 34.66 Family Treatment 0.88 0.89 0.87 0.90 0.93 0.89 0.78 0.75 0.80 Self Treatment 0.61 0.56 0.65 0.58 0.56 0.59 0.74 0.57 0.89 Other 2.43 2.50 2.37 2.62 2.64 2.60 1.63 1.89 1.42 2005 Total 100.00 100.00 100.00 100.00 100.00 100.00 100.00 100.00 100.00 Govt. health worker 1.08 1.20 0.97 1.19 1.25 1.12 0.72 1.00 0.47 NGO health worker 0.26 0.16 0.36 0.28 0.15 0.41 0.19 0.18 0.20 Homoeopathic doctor 4.7 04.21 5.22 4.54 4.21 4.88 5.34 4.24 6.31 Kabiraj/Hekim/Ayurbed 1.38 1.60 1.17 1.51 1.78 1.24 0.96 0.94 0.97 Peer/Fakir/Tantric/Ojha/boidya 0.18 0.24 0.12 0.17 0.25 0.10 0.19 0.19 0.19 Govt. Doctor (Govt. Institution) 7.56 7.10 8.01 6.68 6.32 7.04 10.57 9.94 11.12 Govt. Doctor (Private Practics) 15.11 13.82 16.36 11.46 10.71 12.21 27.55 25.22 29.59 NGO Doctor 0.45 0.38 0.52 0.27 0.26 0.27 1.08 0.79 1.33 Private Doctor 24.36 24.49 24.23 26.14 26.35 25.93 18.29 17.69 18.82 Pharmacy/dispensary/Compounder 38.69 40.52 36.91 41.31 42.29 40.33 29.76 34.04 26.02 Family Treatment 0.68 0.63 0.72 0.84 0.80 0.89 0.10 0.00 0.18 Self Treatment 0.52 0.60 0.45 0.27 0.25 0.29 1.38 1.90 0.93 Other 5.00 5.05 4.95 5.33 5.37 5.29 3.86 3.86 3.86
Source: Household Expenditure Survey, 2010, BBS. 346

347
Chapter XIV
CONSUMPTION AND NUTRITION

348

349
14.01 Consumption and Nutrition Indicator Year Bangladesh* Rural Urban
Average per capita per day calorie intake (kcal) 1988-89 2215 2217 2183 1991-92 2265.6 2266.8 2258.1 1995-96 2254.0 2263.1 2208.1 2000 2240.3 2263.2 2150.0 2005 2238.5 2253.2 2193.8 2010 2318.3 2344.6 2244.5 Average per capita daily protein intake (gm) 1988-89 64 63 68 1991-92 62.72 62.29 65.49 1995-96 64.96 64.45 67.50 2000 62.50 61.88 64.96 2005 62.52 61.74 64.88 2010 66.26 65.24 69.11 Source: HIES, 2010, BBS
14.02 Percentage Distribution of Income Accruing to Household in Groups (Deciles) and Gini Co-efficient HIES, 2010&2005
Household Income Deciles
and Gini Co-efficient
2010 2005 National Rural Urban National Rural Urban
1 2 3 4 5 6 7 Total/Deciles 100.00 100.00 100.00 100.00 100.00 100.00 Lower 5% 0.78 0.88 0.76 0.77 0.88 0.67
Decil-1 2.00 2.23 1.98 2.00 2.25 1.80
Decil-2 3.22 3.53 3.09 3.26 3.63 3.02
Decil-3 4.10 4.49 3.95 4.10 4.54 3.87
Decil-4 5.00 5.43 5.01 5.00 5.42 4.61
Decil-5 6.01 6.43 6.31 5.96 6.43 5.66
Decil-6 7.32 7.65 7.64 7.17 7.63 6.78
Decil-7 9.06 9.31 9.30 8.73 9.27 8.53
Decil-8 11.50 11.50 11.87 11.06 11.49 10.18
Decil-9 15.94 15.54 16.08 15.07 15.43 14.48
Decil-10 35.85 33.89 34.77 37.64 33.92 41.08
Top 5% 24.61 22.93 23.39 26.93 23.03 30.37 Gini Co-efficient 0.458 0.431 0.452 0.467 0.428 0.497 Source: HIES, 2010, BBS.
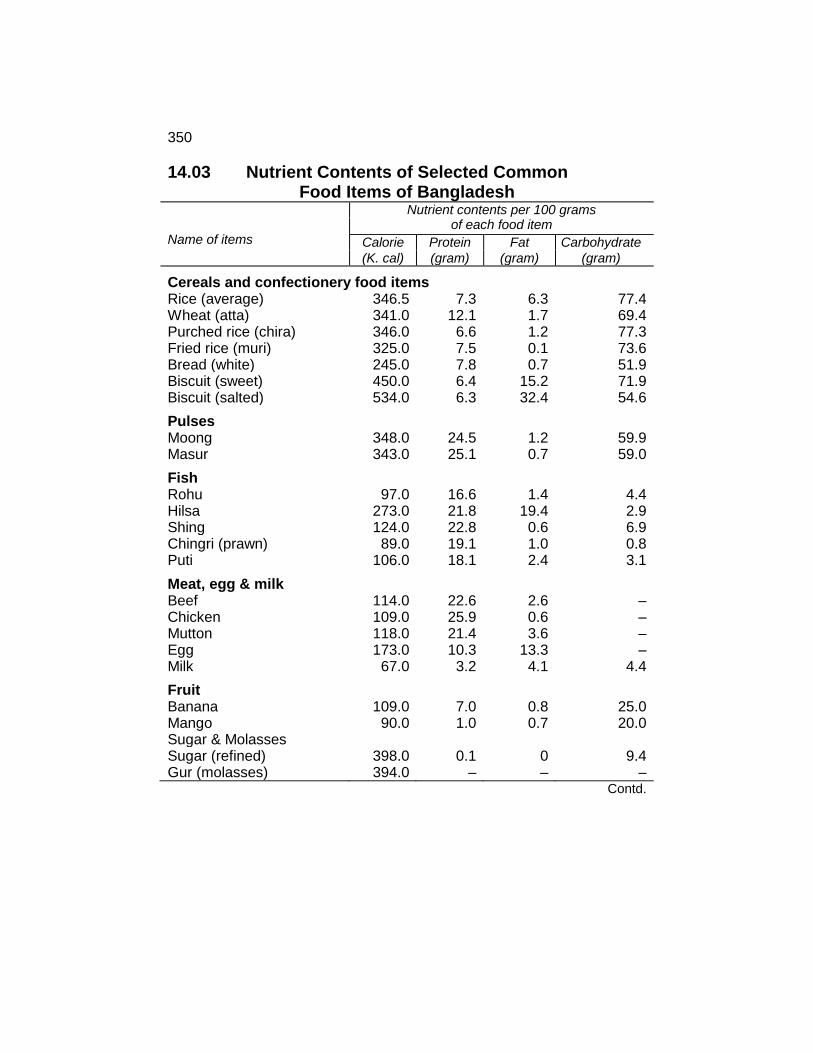
350
14.03 Nutrient Contents of Selected Common Food Items of Bangladesh Name of items
Nutrient contents per 100 grams of each food item
Calorie Protein Fat Carbohydrate
(K. cal) (gram) (gram) (gram)
Cereals and confectionery food items Rice (average) 346.5 7.3 6.3 77.4 Wheat (atta) 341.0 12.1 1.7 69.4 Purched rice (chira) 346.0 6.6 1.2 77.3 Fried rice (muri) 325.0 7.5 0.1 73.6 Bread (white) 245.0 7.8 0.7 51.9 Biscuit (sweet) 450.0 6.4 15.2 71.9 Biscuit (salted) 534.0 6.3 32.4 54.6
Pulses
Moong 348.0 24.5 1.2 59.9 Masur 343.0 25.1 0.7 59.0
Fish
Rohu 97.0 16.6 1.4 4.4 Hilsa 273.0 21.8 19.4 2.9 Shing 124.0 22.8 0.6 6.9 Chingri (prawn) 89.0 19.1 1.0 0.8 Puti 106.0 18.1 2.4 3.1
Meat, egg & milk Beef 114.0 22.6 2.6 – Chicken 109.0 25.9 0.6 – Mutton 118.0 21.4 3.6 – Egg 173.0 10.3 13.3 – Milk 67.0 3.2 4.1 4.4
Fruit
Banana 109.0 7.0 0.8 25.0 Mango 90.0 1.0 0.7 20.0 Sugar & Molasses Sugar (refined) 398.0 0.1 0 9.4 Gur (molasses) 394.0 – – – Contd.

351
14.03 Nutrient Contents of Selected Common Food Items of Bangladesh Name of items
Nutrient contents per 100 grams of each food item
Calorie Protein Fat Carbohydrate
(K. cal) (gram) (gram) (gram)
Vegetable Puishak 27.0 2.2 0.2 4.2 Lalshak 43.0 5.3 0.1 5.0 Arum leaf (kachu shak)
56.0 3.9 1.5 6.8
Ladies finger 43.0 1.8 0.1 8.7 Brinjal 42.0 1.8 2.9 2.2
Spices Dried chillies 246.0 15.9 6.2 31.6 Turmeric 349.0 6.3 5.1 69.4 Ada (ginger) 67.0 2.3 0.9 12.3 Garlic 145.0 6.3 0.1 29.8
Root crops Kachu mukhi 266.0 1.8 0.1 32.4 Potato 89.0 3.0 0.1 19.1 Onion 50.0 1.2 0.1 11.1
Edible oils Mustard oil 900.0 - 100.0 - Til oil 900.0 - 100.0 - Soyabean oil 900.0 - 100.0 - Vegetable ghee (Dalda)
900.0 - 100.0 -
Miscellaneous Betelnut 249.0 4.9 4.5 57.2 Betelleaf 44.0 3.1 0.8 6.1 Source : Institute of Nutrition and Food Science, University of Dhaka.

352
14.04 Nutrient Contents of Selected Common Food Items of Bangladesh
Name of Items
1000 K.cal contents
100 grams of protein contents
100 grams of fat
contents
100 grams of carbohy contents
Rice (average) 5.2 24.6 28.5 2.3 Wheat (atta) 3.4 12.2 87.2 2.1 Purched rice (chira) 5.7 30.0 165.2 2.6 Fried rice (muri) 7.8 34.0 2550.0 3.5 Bread (white) 11.6 36.3 404.3 5.5 Biscuit (sweet) 13.6 95.5 40.2 3.9 Biscuit (salted) 0.0 0.0 0.0 0.0
Pulses
Moong 11.9 16.9 344.9 6.9 Masur 11.5 15.7 564.6 6.7
Fish
Ruhi 138.0 80.6 956.0 304.2 Hilsa 44.2 55.3 62.1 415.8 Shing 153.3 83.4 3168.0 275.5 Chingri (prawn) 274.8 128.0 2445.3 3056.7 Puti 50.2 29.4 221.8 171.7
Meat, egg & milk
Beef 70.0 35.3 307.0 - Chicken 89.9 37.8 1632.4 - Mutton 108.4 59.7 355.2 - Egg 32.0 53.7 41.6 - Milk 33.4 69.9 54.6 50.8
Fruits
Banana 13.8 21.5 188.3 60.3 Mango (ripe) 45.8 412.0 588.6 20.6
Sugar and Molasses
Sugar (refined) 8.0 3194.0 - 34.0 Gur (molasses) 6.4 - - -
Contd.

353
14.04 Nutrient Contents of Selected Common Food Items of Bangladesh
Name of Items
1000 K.cal contents
100 grams of protein contents
100 grams of fat
contents
100 grams of carbohy contents
Vegetables Puishak 23.1 28.4 312.2 14.9 Lalshak 23.0 18.6 987.0 19.7 Arum leaf (kachu shak) 0.0 0.0 0.0 0.0 Ladies finger 29.3 70.0 1260.9 14.5 Brinjal 27.2 63.5 39.4 52.0
Spices Dried chillies 32.5 50.3 128.9 25.3 Turmeric 14.2 78.5 97.0 7.1 Ginger 49.1 142.9 365.3 26.7 Garlic 29.4 67.7 4265.0 14.3
Root food Kachu mukhi 4.5 66.2 1191.0 13.1 Potato 9.0 26.7 200.3 4.2 Onion 26.2 109.0 1308.0 11.8
Edible oils Mustard oil 7.1 - 6.4 - Til oil 5.1 - 4.6 - Miscellaneous Betelnut 42.1 214.1 233.1 18.3 Betelleaf 126.5 179.5 695.6 91.2 Contd.

354
14.04 Nutrient Contents of Selected Common Food Items of Bangladesh
Name of Items
1000 K.cal contents
100 grams of protein
contents
100 grams of
fat contents
100 grams of carbohy contents
Cereals &Confectionery: Rice(Average) Wheat(Atta) Purched Rice(Chira) Fried Rice(Muri) Bread(White) Biscuit(Sweet) Biscuit (Salted) Pulses: Moong Masur Fish: Ruhi Hilsa Shing Chingri (Prawn) Puti Meat,Egg & Milk Beef Chicken Mutton Egg Milk Fruit: Banana Mango (Ripe) Suger & Molasses: Suger (Refined) Gur
6.1 4.1 6.3 8.4
13.2 14.7
0.0
12.6 13.2
146.8
60.0 181.1 301.6
52.7
88.5 99.7
131.2 7.8
37.8
12.4 61.9
8.1 7.6
28.7 14.7 33.1 36.3 41.6
103.5 0.0
17.9 18.0
85.8 75.2 98.5
140.5 30.9
44.6 42.0 72.3 62.1 79.1
19.4
557.2
3234.1 -
33.3 104.4 182.1
2725.7 463.5
43.6 0.0
364.4 645.9
1017.1
84.5 3743.0 2684.4
233.0
387.9 1811.0
430.0 48.1 61.8
169.4 796.0
- -
2.7 2.6 2.8 3.7 6.3 4.5 0.0
7.3 7.7
323.6 565.3 325.5
3355.5 180.4
- - - -
57.5
54.2 27.9
34.4
-
Contd.

355
14.04 Nutrient Contents of Selected Common Food Items of Bangladesh Name Of Items 1000 K.cal
contents 100 grams of protein contents
100 grams of fat
contents
100 grams of carbohy contents
Cereals &
Confectionery:
Vegetables: Puishak Lalshak Aram Leaf (Kachushak) Ladies Finger Brinjal Spices: Dried Chillies Turmaric Ginger Garlic Root Food Items: Kachu Mukhi Potato Onion Edible Oils: Mustard Oil Soyabean Oil Miscellaneous: Betel Nut Betel Leaf
29.3 18.7
0.0
36.3 35.5
34.8 19.7
103.2 25.3
4.6
11.0 33.7
8.4 5.7
43.5 168.4
35.9 15.2
0.0
86.7 82.9
53.8
109.1 300.6
58.2
68.0 32.7
140.4
- -
221.0 239.1
395.1 805.0
0.0
1560.7 51.4
137.9 134.8 768.1
3665.1
1224.0 245.4
1684.4
7.5 5.1
240.6 926.4
18.8 16.1
0.0
17.9 67.8
27.1
9.9 56.2 12.3
13.5
5.1 15.2
- -
18.9 121.5
Source: Institute of Nutrition and Food Science University of Dhaka.
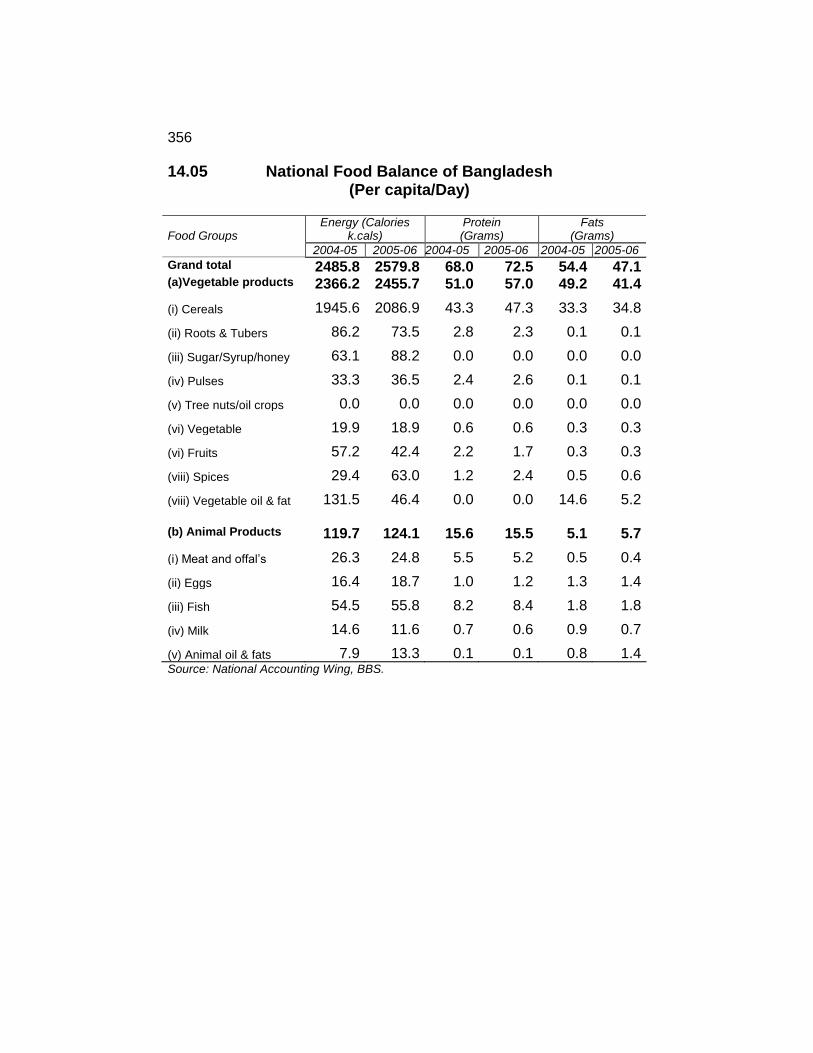
356
14.05 National Food Balance of Bangladesh (Per capita/Day) Food Groups
Energy (Calories k.cals)
Protein (Grams)
Fats (Grams)
2004-05 2005-06 2004-05 2005-06 2004-05 2005-06
Grand total 2485.8 2579.8 68.0 72.5 54.4 47.1 (a)Vegetable products 2366.2 2455.7 51.0 57.0 49.2 41.4
(i) Cereals 1945.6 2086.9 43.3 47.3 33.3 34.8
(ii) Roots & Tubers 86.2 73.5 2.8 2.3 0.1 0.1
(iii) Sugar/Syrup/honey 63.1 88.2 0.0 0.0 0.0 0.0
(iv) Pulses 33.3 36.5 2.4 2.6 0.1 0.1
(v) Tree nuts/oil crops 0.0 0.0 0.0 0.0 0.0 0.0
(vi) Vegetable 19.9 18.9 0.6 0.6 0.3 0.3
(vi) Fruits 57.2 42.4 2.2 1.7 0.3 0.3
(viii) Spices 29.4 63.0 1.2 2.4 0.5 0.6
(viii) Vegetable oil & fat 131.5 46.4 0.0 0.0 14.6 5.2 (b) Animal Products 119.7 124.1 15.6 15.5 5.1 5.7
(i) Meat and offal’s 26.3 24.8 5.5 5.2 0.5 0.4
(ii) Eggs 16.4 18.7 1.0 1.2 1.3 1.4
(iii) Fish 54.5 55.8 8.2 8.4 1.8 1.8
(iv) Milk 14.6 11.6 0.7 0.6 0.9 0.7
(v) Animal oil & fats 7.9 13.3 0.1 0.1 0.8 1.4 Source: National Accounting Wing, BBS.

357
14.06 Percentage Distribution of Women who have Comprehensive Knowledge of HIV and AIDS Transmission, 2006 & 2009 . Area
2006 2009
(15-49) Years Women) (15-24 Years Women)
Knows two ways to
Prevent HIV Transmission
Correctly indentify
misconception
Have Comprehensive
Knowledge (Identify two Prevention
Methods and Three
Misconception
Knows two ways to
prevent HIV Transmission
Correctly indentify There misconception
about HIV Transmission
Have Comprehensive
Knowledge (Identify two Prevention
Methods and Three
Misconception
National 37.3 16.4 12.2 35.3 23.7 14.6 Rural 29.6 12.0 8.2 33.6 21.7 13.5 Urban 54.4 26.0 20.8 40.9 29.8 18.1 Municipality 50.8 23.0 18.2 38.9 27.5 16.2 City Corporation 62.6 32.9 27.0 43.5 32.7 20.4 Slum 37.5 16.4 11.6 29.4 20.0 8.7
Source: MICS, 2006, MICS, 2009, BBS.
14.07 Immunization Percentage of Children Aged 12-23 Months Immunized Against BCG, DPT3, Polio3 and Measles by Sex and Residence, 2008.
Residence BCG(%) DPT3(%) POlio3(%) Measles(%) Boys Girls Boys Girls Boys Girls Boys Girls
National 97.7 96.3 91.0 89.1 95.5 95.6 88.5 86.5 Rural 97.7 95.8 90.4 88.2 95.1 95.6 88.4 85.9 Urban 97.9 98.1 93.0 92.0 97.1 96.0 88.9 88.5 Source: Gender Statistics of Bangladesh,2008.

14.08 Percentage Distribution of Women Aged,15-49 With a Birth in the Two Years Preceding the Survey, by Type of Personnel Assisting With the Delivery, Bangladesh 2006-09 Area 2006
Person Assisting at Delivery Medica
l Doctor
Nurse /Midwife
Traditional Birth
Attendant
Community Health Worker
Relative Friend
Other /Missing
No Attendant
Any Skilled
Personal National 15.5 4.6 66.0 1.0 11.2 1.0 0.8 20.1 Rural 10.6 3.4 71.1 0.9 12.3 0.9 0.9 14.0 Urban 29.8 8.0 51.0 1.3 7.9 1.3 0.6 37.9 Municipality 26.8 8.3 53.3 1.2 8.6 1.1 0.6 35.1 City Corporation
38.1 7.3 44.5 1.4 6.0 1.9 0.8 45.4
Slum 10.8 0.7 70.9 0.5 12.8 3.6 0.7 11.5
2009
Person Assisting at Delivery Medical Doctor
Nurse /Midwife
Auxiliary/ Midwife
Traditional Birth
Attendant
Community Health Worker
Relative Friend
Other/ Missing
No Attendant
Any Skilled
Personal 20.5 3.8 1.2 58.4 0.9 14.5 0.4 0.3 24.4
15.9 3.3 1.2 61.8 1.0 16.1 0.4 0.4 19.2 39.4 5.9 1.3 44.2 0.8 8.0 0.2 0.2 45.3 30.9 7.3 0.8 49.3 0.6 10.7 0.3 0.2 38.2 51.3 4.3 1.9 36.7 1.1 4.4 0.1 0.3 55.6 14.5 0.6 0.5 70.2 1.4 12.3 0.2 0.3 15.1 Source: MICS, 2006, MICS, 2009, BBS. 358

14.09 Percentage of Women Aged, 15-49 Years with a Birth in the Two years Preceding the survey who Breastfed their Baby within one hour of Birth and within one day of Birth, 2006 & 2009
Background Characteristics
2006 2009 Percentage Who
Started Breastfeeding
Within One Hour of Birth
Percentage Who Started
Breastfeeding Within One Day
of Birth
Percentage Who Started
Breastfeeding Within One Hour
of Birth
Percentage Who Started
Breastfeeding Within One Day of Birth
Area National 35.6 81.5 50.2 89.3
Rural 35.5 81.7 50.2 90.0
Urban 36.0 81.0 50.4 86.7
Municipality 37.0 82.3 48.6 87.7
City Corporation 33.1 77.5 53.0 85.8
Slum 34.5 79.1 38.5 79.0
Division Barisal 41.9 82.7 50.8 92.8
Chittagong 32.4 83.1 50.2 92.4
Dhaka 36.5 79.9 51.7 87.5
Khulna 32.7 80.9 49.0 87.7
Rajshahi 34.3 79.0 46.9 88.5
Sylhet 42.3 89.7 59.1 93.5
Months Since Last Birth <6 Month 34.6 79.0 50.6 89.1
6-11 Months 37.1 81.8 49.7 89.0
12-23 Months 35.2 82.3 50.8 90.2
Source: MICS, 2006, MISC, 2009, BBS. 359

360
14.10 Proportion of Children Under the age of five whose Birth has been Registered, 2006 & 2009
Background Characteristics 2006 2009 Sex Birth is Registered Birth is Registered Boys 10.1 53.4 Girls 9.6 53.7 Area National 9.8 53.6 Rural 8.8 53.8 Urban 12.8 52.6 Municipality 12.4 57.2 City Corporation 13.9 47.6 Slum 4.5 28.6 Source: MICS, 2006, MICS, 2009, BBS.
14.11 Prevalence of Malnutrition by Gomez Classification by Gender and Years Both sex Boys Girls
Nutritional Status 1992 1995-96 2000 1992 1995-96 2000 1992 1995-96 2000
Normal 6.2 10.3 11.5 6.2 11.5 11.0 6.2 9.1 12.1 Mild (1st degree) 39.8 47.0 50.7 40.6 46.6 51.6 38.9 47.4 49.8 Moderate (2nd degree) 47.2 38.4 34.7 46.9 38.6 34.3 47.4 38.1 35.1 Severe (3rd degree) 6.8 4.3 2.4 6.3 3.3 2 .4 7.4 5.4 2 .5 Gomez classifications: Normal: >90% of ref. median weight-for-age Mild: 75-89.9% of ref. median W/A Moderate: 60.0-74.9% of ref median W/A Severe: Less than 60% of ref. median W/A Source: Child Nutrition Survey, BBS.

361
14.12 Per Capita Day Intake of Major Food Items (in Grams) by Residence HIES 2010&2005
Food Items 2010 2005
National Rural Urban National Rural Urban
1 2 3 4 5 6 7
Total 1000.0 1000.0 985.5 947.7 946.3 952.1 Cereals 463.9 485.6 402.9 469.2 485.6 419.3 Rice 416.0 441.6 344.2 439.6 459.7 378.5 Wheat 26.0 23.3 33.6 12.1 8.0 24.5 Others 21.9 20.7 25.1 17.5 17.9 16.3 Potato 70.3 71.5 66.7 63.3 61.9 67.5 Vegetables 166.1 170.0 155.0 157.0 156.5 158.7 Leafy vegetables 36.1 36.1 36.3 43.4 43.8 42.2 Others 129.9 133.9 118.6 113.6 112.7 116.5 Pulses 14.3 13.2 17.2 14.2 12..7 18.6 Masoor 6.7 4.8 12.2 8.3 6.2 14.7 Khesari 1.3 1.5 0.7 2.0 2.4 0.9 Others 6.2 6.9 4.3 3.9 4.1 3.0 Milk/Milk prod. 33.7 31.8 39.2 32.4 31.0 36.6 Edible Oils 20.5 18.3 26.6 16.5 14.3 22.9 Mustard 2.1 2.5 0.8 3.8 4.6 1.5 Soyabean 18.3 15.6 25.8 12..6 9.6 21.3 Others 0.1 0.1 0.1 0.1 0.1 0.1 Meat, Poultry,Eggs 26.2 20.5 42.2 20.8 17.6 30.7 Mutton 0.6 0.5 0.9 0.6 0.6 0.7 Beef 6.8 4.7 12.5 7.8 6.4 12.0 Chicken/duck 11.2 9.0 17.4 6.8 5.8 10.1 Eggs 7.2 5.8 10.9 5.2 4.4 7.4 Others 0.4 0.4 0.5 0.4 0.4 0.5 Fish 49.5 45.8 59.9 42.1 39.7 49.6 Condi. & Spices 66.0 64.8 69.3 53.4 50.2 63.1 Onion 22.0 20.2 27.8 18.4 16.1 25.3 Chillie 10.5 10.8 9.8 9.7 9.7 9.9 Others 33.3 33.8 31.7 25.3 24.4 27.9 Fruits 44.7 42.6 50.4 32.5 32.4 32.9 sugar/Gur 8.4 7.4 11.3 8.1 7.5 9.7 Sugar 7.4 6.2 10.7 6.1 5.1 9.0 Gur 1.0 1.2 0.6 2.0 2.4 0.7 Miscellaneous items* 36.5 33.6 44.9 38.2 36.9 42.5 Source: HIES, 2010, BBS * Includes tea, soft drinks, bread, biscuits, betel leaf, etc.

14.13 Anthropometry (Underweight, Standing, Wasting and Obesity) Findings Among Under-5s by Area of Residence and Sex , 2005
Rural (%) Urban (%) National (%)
Girls Boys Total Girls Boys Total Girls Boys Total
Underweight Moderately underweight [WAZWHO=-3.00 - 2.01] 28.3 32.3 30.3 22.6 23.2 22.9 27.1 30.4 28.8
(WHO 2005) Severely underweight [WAZWHO<-3.00] 13.1 10.7 11.9 7.1 6.9 7.0 11.9 9.9 10.9
Underweight [WAZWHO<-2.00] 41.3 43.0 42.2 29.7 30.1 29.9 39.0 40.3 39.7
Stunting Moderately stunted [HAZWHO=-3.00 -2.01] 28.2 28.8 28.5 20.9 23.2 22.1 26.8 27.7 27.2
(WHO 2005) Severely stunted [HAZWHO<-3.00] 20.0 20.6 20.3 12.8 14.7 13.8 18.6 19.4 19.0
Stunted [HAZWHO<-2.00] 48.2 49.4 48.8 33.7 38.0 35.9 45.3 47.1 46.2
Wasting Moderately wasted [WHZWHO=-3.00 -2.01] 12.2 11.8 12.0 11.3 8.5 9.8 12.0 11.1 11.6
(WHO 2005) Severely wasted [WHZWHO<-3.00] 2.6 3.5 3.0 2.0 2.7 2.4 2.5 3.3 2.9
Wasted [WHZWHO<-2.00] 14.8 15.3 15.1 13.3 11.2 12.2 14.5 14.5 14.5
Obesity Overweight [BAZWHO=2.01 - 3.00] 1.3 0.7 1.0 1.1 1.5 1.3 1.2 0.9 1.1
(WHO 2005) Obese [BAZWHO>3.00] 0.4 0.3 0.3 0.2 0.4 0.3 0.3 0.3 0.3
Overweight/obese [BAZWHO>2.00] 1.6 1.0 1.3 1.4 1.9 1.6 1.6 1.2 1.4
Source : Child and Mother Nutrition Survey, 2005, BBS.
362

14.14 Low MUAC (Mid-Upper arm Circumference) Among Children Aged 12-59 Months by Area of Residence and Sex, 2005 Rural (%) Urban (%) National (%)
Girls Boys Total Girls Boys Total Girls Boys Total
Muac category
<125 mm. 6.2 3.4 4.8 2.7 2.2 2.4 5.6 3.2 4.3
Muac category
<110 mm. 0.3 0.2 0.2 0.3 0 0.1 0.3 0.1 0.2
Low MUAC Moderate [MUACZ -3.00 to -2.01] 25.5 27.8 26.7 16.5 17.2 16.9 23.8 25.6 24.7
Severe [MUACZ <-3.00] 2.9 2.3 2.6 1.6 1.3 1.4 2.7 2.1 2.4
Source : Child and Mother Nutrition Survey, 2005, BBS.
14.15 Arsenic Level in Household Drinking Water by Area of Residence and Division
Microgram/ Liter
Arsenic Test Value (Microgram/Liter; jg/1)
<10 (ug/1) 10-49 (ug/1)
50-199 (ug/1)
200+ (ug/1)
<50 (ug/1)
>50 (ug/1)
Number of Household
Water samples
tested Residence National 76.9 10.5 9.5 3.1 87.4 12.6 13423
Rural 74.9 11.1 10.6 3.5 86.0 14 11282
Urban 85.7 8.0 4.8 1.4 93.8 6.2 2141
Division Barisal 94.5 4.1 0.9 0.6 98.5 1.5 1170
Chittagong 68.0 7.3 13.9 10.7 75.4 24.6 2615
Dhaka 76.5 11.4 9.9 2.2 87.9 12.1 3463
Khulna 66.1 17.1 14.1 2.7 83.2 16.8 1709
Rajshahi 88.8 7.9 3.0 0.3 96.7 3.3 3418
Sylhet 53.9 20.6 24.2 1.3 74.5 25.5 1048
Source: MICS, 2009, BBS. 363

14.16 Disease Control and Healthy Environment Associations of Child Nutritional Status, 2005 (Provisional)
Under
weight % Stunted % Wasted % Over-weight %
Type of treatment for child’s illness
MBBS doctor (Private/Health clinic/Hospital) 30.3 36.2 12.6 2.2
Medicine taken from a person sitting in pharmacy 40.6 48.1 14.6 0.7
Village doctor/Homeopath/Herbal 44.2 51.0 15.3 1.1
Spiritual water 46.4 46.4 18.1 0.0
No treatment/family treatment 53.9 75.4 24.6 0.0
Others 26.7 28.0 13.8 0.0
Main sources of drinking water
Tube well 40.4 46.8 14.5 1.3
Tap 21.9 24.1 12.6 2.5
Well 43.7 51.5 24.0 4.6
Pond/river 57.2 61.3 17.3 0.0
Other 32.3 61.6 14.7 3.0
National nutrition indicators 39.7 46.2 14.5 1.4 Source : Child and Mother Nutrition Survey, 2005, BBS.
364

14.17 Mean Age, Weight, Hight, MUAC and BMI of Non-Pregnant Mothers by Area of Residence
Rural Urban Total
Mean SD Mean SD Mean SD
Age (years) 28.2 6.2 27.8 6.0 28.1 6.2
Weight (kg) 44.5 7.0 48.8 9.5 45.4 7.8
Height (cm) 149.5 6.4 149.9 7.8 149.6 6.7
MUAC (cm) 23.8 2.5 25.3 3.3 24.1 2.8
BMI (Kg/M2
) 19.9 2.8 21.7 3.7 20.2 3.1 Source : Child and Mother Nutrition Survey, 2005, BBS.
14.18 Nutritional Status of Non- Pregnant Adolescent Mothers by Area of Residence, 2005 Nutritional status Rural % Urban % Total %
Thinness (<5th
percentile BMI for age) 7.9 6.5 7.6
Normal (5th
– 84th
percentile BMI for age) 92.1 89.7 91.7
Overweight or obese<(85th
percentile BMI for age) 0.0 3.8 0.7
Stunting (HAZ<-2.00) 59.9 61.8 60.2
Source : Child and Mother Nutrition Survey, 2005, BBS.
365

14.19 Maternal Nutritional Status by Area of Residence, 2005
Rural (%) Urban (%) National (%) WHO adult nutritional status
Severe Underweight [Bmi<16] 4.1 2.0 3.7
Moderate Underweight [Bmi 16.0-16.9] 8.1 4.6 7.4
Mild Underweight [Bmi 17.0-18.4] 23.0 14.4 21.2
Normal Range [Bmi 18.5-24.9] 58.9 60.2 59.2
Pre-Obese [Bmi 25-29.9] 5.3 15.8 7.5
Obese Class I [Bmi 30-34.9] 0.6 2.7 1.0
Obese Class Ii [Bmi 35-39.9] 0 0.3 0.1
Obese Class Iii [Bmi ≥ 40] 0.0 0.0 0.0
Overweight or not
Not overweight [BMI<25] 94.1 81.2 91.4
Overweight [BMI>=25] 5.9 18.8 8.6
Obese or not
Not obese [BMI<30] 99.4 97.0 98.9
Obese [BMI>=30] 0.6 3.0 1.1
Source : Child and Mother Nutrition Survey, 2005, BBS.
366

367
14.20 Prevalence of Moderate and Severe Malnutrition in Children Aged<5 Years by Sex and Area of Residence
Indicator Rural(%) Urban(%) National(%) Girl Boy Total Girl Boy Total Girl Boy Total
Underweight Moderate 28.
3 32.
3 30.3 22.
6 23.
2 22.9 27.
1 30.
4 28.8
(WAZ WHO) Severe 13.1
10.7
11.9 7.1 6.9 7.0 11.9
9.9 10.9
Total 41.3
43.0
42.2 29.7
30.1
29.9 39.0
40.3
39.7
Stunting Moderate 28.
2 28.
8 28.5 20.
9 23.
2 22.1 26.
8 27.
7 27.2
(WAZ WHO) Severe 20.0
20.6
20.3 12.8
14.7
13.8 18.6
19.4
19.0
Total 48.2
49.4
48.8 33.7
38.0
35.9 45.3
47.1
46.2
Wasting Moderate 12.
2 11.
8 12.0 11.
3 8.5 9.8 12.
0 11.
1 11.6
(WAZ WHO) Severe 2.6 3.5 3.0 2.0 2.7 2.4 2.5 3.3 2.9 Total 14.
8 15.
3 15.1 13.
3 11.
2 12.2 14.
5 14.
5 14.5
Obesity Moderate 1.3 0.7 1.0 1.1 1.5 1.3 1.2 0.9 1.1 (BAZ WHO) Severe 0.4 0.3 0.3 0.2 0.4 0.3 0.3 0.3 0.3 Total 1.6 1.0 1.3 1.4 1.9 1.6 1.6 1.2 1.4 MUACZ Moderate 25.
5 27.
8 26.7 16.
5 17.
2 16.9 23.
8 25.
6 24.7
Severe 2.9 2.3 2.6 1.6 1.3 1.4 2.7 2.1 2.4 Total 28.
4 30.
1 29.3 18.
1 18.
5 19.3 26.
5 27.
7 27.1
MUAC<125mm 6.2 3.4 4.8 2.7 2.2 2.4 5.6 3.2 4.3 MUAC<110mm 0.3 0.2 0.2 0.3 0.0 0.1 0.3 0.1 0.2
Note: Moderate-3.00 to –2.01; to severe <--3.00; total <--2.00 Source : Child and Mother Nutrition Survey, 2005, BBS.
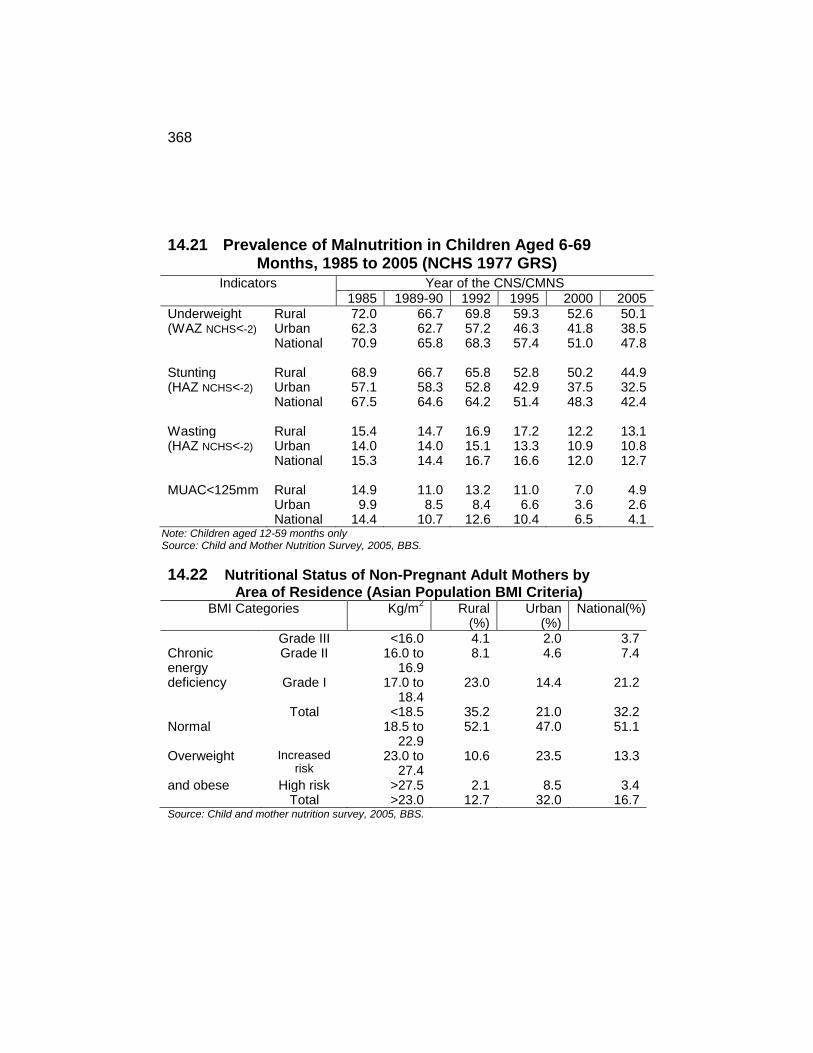
368
14.21 Prevalence of Malnutrition in Children Aged 6-69 Months, 1985 to 2005 (NCHS 1977 GRS)
Indicators Year of the CNS/CMNS 1985 1989-90 1992 1995 2000 2005
Underweight Rural 72.0 66.7 69.8 59.3 52.6 50.1 (WAZ NCHS<-2) Urban 62.3 62.7 57.2 46.3 41.8 38.5 National 70.9 65.8 68.3 57.4 51.0 47.8 Stunting Rural 68.9 66.7 65.8 52.8 50.2 44.9 (HAZ NCHS<-2) Urban 57.1 58.3 52.8 42.9 37.5 32.5 National 67.5 64.6 64.2 51.4 48.3 42.4 Wasting Rural 15.4 14.7 16.9 17.2 12.2 13.1 (HAZ NCHS<-2) Urban 14.0 14.0 15.1 13.3 10.9 10.8 National 15.3 14.4 16.7 16.6 12.0 12.7 MUAC<125mm Rural 14.9 11.0 13.2 11.0 7.0 4.9
Urban 9.9 8.5 8.4 6.6 3.6 2.6 National 14.4 10.7 12.6 10.4 6.5 4.1
Note: Children aged 12-59 months only Source: Child and Mother Nutrition Survey, 2005, BBS.
14.22 Nutritional Status of Non-Pregnant Adult Mothers by
Area of Residence (Asian Population BMI Criteria) BMI Categories Kg/m
2 Rural
(%) Urban
(%) National(%)
Grade III <16.0 4.1 2.0 3.7 Chronic energy
Grade II 16.0 to 16.9
8.1 4.6 7.4
deficiency Grade I 17.0 to 18.4
23.0 14.4 21.2
Total <18.5 35.2 21.0 32.2 Normal 18.5 to
22.9 52.1 47.0 51.1
Overweight Increased risk
23.0 to 27.4
10.6 23.5 13.3
and obese High risk >27.5 2.1 8.5 3.4 Total >23.0 12.7 32.0 16.7
Source: Child and mother nutrition survey, 2005, BBS.

369
14.23 Prevalence of Low Birth Weight by Sex and Division
Indicators Prevalence of LBW (birth weight <2.500g) a.d
Rural (n=2,774
Urban (n=311)
National (n=3,085)
Sex All 36.7 29.0 35.6 Girls 38.8 31.4 37.9 Boys 34.4 26.6 33.3 Division Barisal 38.7 - - Chittagong 28.0 - - Dhaka 43.7 - - Khulna 35.5 - - Rajshahi 37.3 - - Sylhet 37.6 - -
Note: Includes infants whose weights were measured within 72 hr of birth. Divisional data include rural data only. Source : National Low Birth Weight Survey of Bangladesh, 2003-04

371
Chapter XV
INTERNATIONAL COMPARISONS

372

373
15.01 Estimation of Mid year Population of Selected Countries
(Million)
Country 2008 2009 2010 2011 2012 2013
China 1325 1331 1338 1344 1351 1357 India 1150 1166 1182 1198 1213 - USA 304 307 1309 312 314 -
Indonesia 231 234 - 237 245 249 Japan 128 128 128 128 194 201 Brazil 190 191 193 192 - 184 Bangladesh 145 147 149 151 - -
Pakistan 166 170 174 177 - - Mexico 107 108 112 - 128 127 Nigeria - - - - 117 118 Germany F.R. 82 82 82 82 - -
U.K. 61 62 62 63 82 81 Italy 60 60 60 61 75 76 France 60 61 62 63 83 85 Phillippines 90 92 94 - 76 77
Thailand 66 67 67 68 68 - Turkey 71 72 73 74 64 64 Spain 46 46 466 46 63 64 Egypt A.R. 75 77 79 80 60 60
Poland 38 38 39 39 61 - Iran 72 73 74 76 47 47 Myanmar (Burma) 58 59 60 60 39 39 Canada 33 34 34 34 35 35 Source: U.N.Monthly Bulletin of Statistics Online.

374
15.02 Estimates of World Muslim Population in 2011 Total
Population % Muslim Muslim
Population (Million) (Million)
I. Members of the Islamic Conference: Afganistan 32.4 100 32.40 Algeria 36.0 99.7 38.80 Benin 9.1 24.4 2.22 Bahrain 1.3 100 1.30 Brunei 0.4 67 0.27 Bangladesh 164.4 90 147.96 Cameroon 20.1 24 4.82 Chad 11.5 50 5.75 Comoro Islands 0.8 98 0.78 Egypt 82.6 95 78.47 Gabon 1.5 12 0.18 Gambia 1.8 90 1.62 Guinea 10.2 85 8.67 Guinea-Bissau 1.6 50 0.80 Indonesia 238.2 88.2 210.09 Iran 77.9 99 77.12 Iraq 32.7 97 31.71 Jordan 6.6 94 6.20 Kuwait 2.8 100 2.60 Lebanon 4.3 59.7 2.56 Malaysia 28.9 61.4 17.74 Maldives 0.3 100 0.30 Mali 15.4 90 10.86 Mauritania 3.5 100 3.50 Morocco 32.8 98.7 32.43 Libya 6.4 99 6.34 Sierra-leone 5.4 60 3.24 Djibouti 0.9 96 0.86 Nigeria 162.3 70 113.61 Niger 16.1 95 15.30
Contd.

375
15.02 Estimates of World Muslim Population in 2011 Total Population % Muslim Muslim
Population
(Million) (Million)
Oman 3.0 99 2.97 Pakistan 184.8 97 179.26 Qatar 1.7 100 1.7 Saudi Arabia 29.2 100 29.2 Senegal 12.8 94 12.03 Sudan 44.6 70 33.22 Somalia 9.9 100 9.90 Syria 22.5 90 20.25 Tunisia 10.7 99 10.59 Turkey 74.0 99.8 73.85 Uganda 34.5 35 12.06 United Arab Emirates 7.9 99 7.82 Burkina Faso 17.0 60.5 10.29 Yemen A.R. 23.8 100 23.8 Palestine 4.2 98 4.11 Total (ICC) 1538.8 82.82 1289.5 II. Muslim Population in other countries: (A) Africa: Burundi 10.2 10 1.02 Central Africa Republic 5.0 15 0.75 Ethopia 87.1 50 43.55 Ghana 25.0 45 11.25 Cote 'd Ivoire 22.6 38.6 8.72 Kenya 41.6 33 13.73 Lesotho 2.2 5 0.11 Liberia 4.1 35 1.43 Madagascar 21.3 15 3.20 Mauritius 1.3 16.5 0.22 Mozambique 23.1 20 4.02 Tanzania 46.2 55 25.41
Contd.

376
15.02 Estimates of World Muslim Population in 2011 Total Population % Muslim Muslim Population (Million) (Million)
Togo 5.8 50 2.90
B) Asia: Myanmar 54.0 15 8.1 China 1345.9 10 134.59 India 1241.3 20 248.76
Israel 7.9
16 1.26 Philippines
95.7 10 9.57
Srilanka 20.7 10 2.07 Singapore 5.2 16 0.83 Thailand 69.5 10 6.95
(C) Europe: Albania 3.2 79.9 2.56 Bulgaria 7.5 12.2 0.92 Cyprus 0.8 24 0.2
Spain 46.2 2.3
1.06 U.K. 62.7
4.6 2.88
Russian Federation 142.8 19 27.13 Yugoslavia 3.8 44 1.67
(D) USA Caribbeans and other South America: Caribbean Isles: USA 311.7 2.11 6.58
Guayana 0.8 7 0.05 Surinam 0.5 19.6 0.09 World Total 6996.4 28.3 1977.25
ICC= Islamic Conference Countries. Source : SESRIC, 2011.
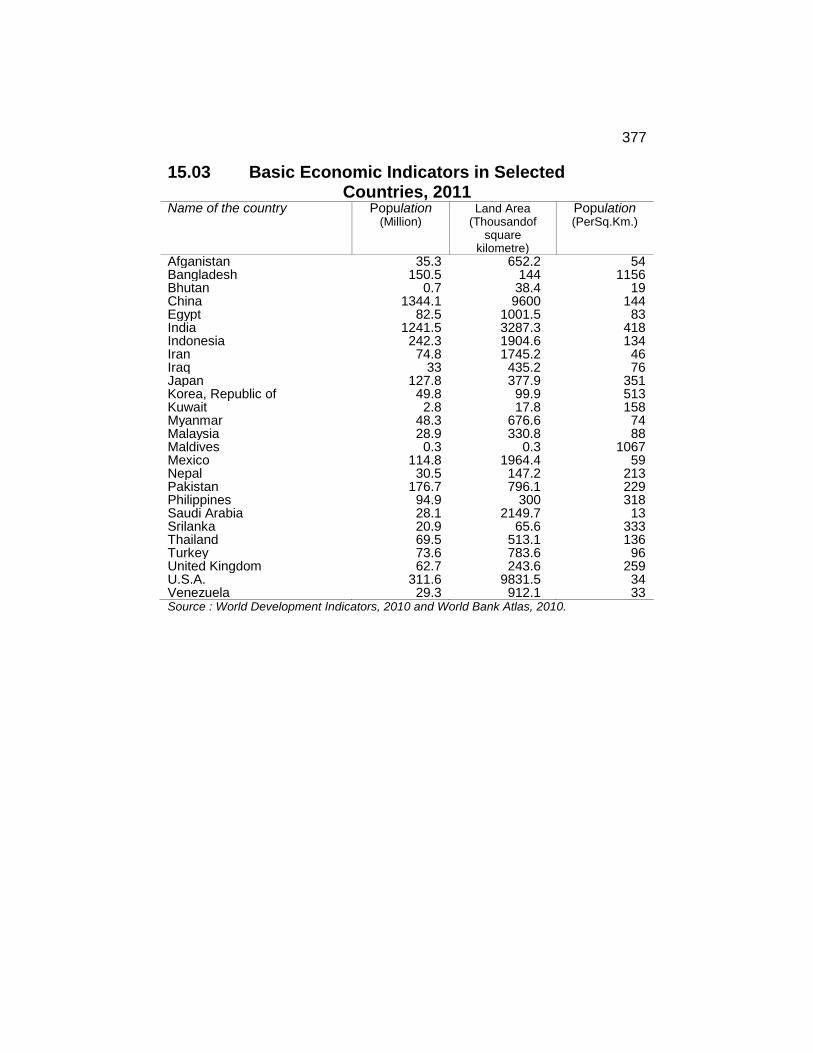
377
15.03 Basic Economic Indicators in Selected Countries, 2011 Name of the country Population
(Million) Land Area
(Thousandof square
kilometre)
Population (PerSq.Km.)
Afganistan 35.3 652.2 54 Bangladesh 150.5 144 1156 Bhutan 0.7 38.4 19 China 1344.1 9600 144 Egypt 82.5 1001.5 83 India 1241.5 3287.3 418 Indonesia 242.3 1904.6 134 Iran 74.8 1745.2 46 Iraq 33 435.2 76 Japan 127.8 377.9 351 Korea, Republic of 49.8 99.9 513 Kuwait 2.8 17.8 158 Myanmar 48.3 676.6 74 Malaysia 28.9 330.8 88 Maldives 0.3 0.3 1067 Mexico 114.8 1964.4 59 Nepal 30.5 147.2 213 Pakistan 176.7 796.1 229 Philippines 94.9 300 318 Saudi Arabia 28.1 2149.7 13 Srilanka 20.9 65.6 333 Thailand 69.5 513.1 136 Turkey 73.6 783.6 96 United Kingdom 62.7 243.6 259 U.S.A. 311.6 9831.5 34 Venezuela 29.3 912.1 33 Source : World Development Indicators, 2010 and World Bank Atlas, 2010.

15.04 Basic Social Indicators in Selected Countries, 2012 Name of the country
Life expentancy
at birth
Crude birth rate (per Thous.)
Crude death rate
(per Thous.)
Total fertility
rate
Population Million (15-64
Yrs)
Physician per thousand people
(1990-99)
Net primary enrolment ratio % of relevant age group
(1998) Afghanistan 61 35 8 5.1 51 0.2 na Bangladesh 70 20 6 2.2 65 0.4 92 Bhutan 68 20 7 2.3 67 0.3 91 China 75 12 7 1.7 73 1.9 na Egypt 71 24 7 2.8 63 2.8 95 India 66 21 8 2.5 66 0.7 93 Indonesia 71 19 6 2.4 66 0.2 92 Iran 74 19 5 1.9 71 0.9 100 Iraq 69 31 5 4.1 57 0.6 na Japan 83 8 10 1.4 62 2.3 100 Korea, Republic of 70 10 5 2.0 73 na na Kuwait 74 21 3 2.6 73 1.8 na Malaysia 75 18 5 2.0 69 1.2 na Mexico 77 19 5 2.2 65 2.1 96 Myanmar 65 17 9 2.0 70 0.6 na Nepal 68 22 7 2.4 60 na 97 Pakistan 66 26 7 3.3 62 0.8 72 Philippines 69 25 6 3.1 62 na na Saudi Arabia 75 20 3 2.7 68 0.9 93 Srilanka 74 18 7 2.3 66 0.7 94 Thailand 74 10 8 1.4 72 0.9 na Turkey 75 17 6 2.1 67 1.7 94 United Kingdom 82 13 9 1.9 65 2.8 100 U.S.A. 79 13 8 2.1 66 2.5 92 Venezuela 74 20 5 2.4 65 na 92 Source: World Development Indicators, 2014.
378

379
15.05 Index Number of Gross Agricultural Production of Some Selected Countries (Base:2004-2006=100)
Country 2006 2007 2008 2009 2010 2011 2012
Afghanista
n
96.60 107.08 99.30 115.30 114.13 109.85 121.70
Australia 93.02 94.90 100.45 100.56 99.31 107.20 117.17 Bangaldesh 106.11 112.09 120.37 121.35 129.27 132.79 106.56
Bhutan 110.78 111.24 92.29 88.93 94.69 108.32 110.47 Brazil 102.90 110.26 117.22 116.59 122.14 128.19 126.56 Camboddia 114.23 119.70 130.51 136.64 147.97 154.53 175.28 Canada 100.22 99.93 105.62 104.97 102.83 103.88 103.30
China 102.88 107.47 113.48 116.07 119.63 124.42 126.83 Egypt 105.86 110.75 115.26 116.54 109.39 113.33 118.64 India 105.60 114.89 116.44 113.82 124.66 132.20 129.94 IIndonesia 106.41 109.19 113.28 119.22 120.39 124.95 132.23 Japan 99.02 100.57 101.02 95.58 92.95 91.89 101.67 Malaysia 105.00 103.92 110.50 109.46 112.07 121.26 120.34
Maldives 98.09 83.96 82.39 77.72 81.43 84.79 88.26 Mexico 108.27 104.57 106.38 104.05 10.758 107.38 113.61 Myanmar 110.99 116.50 125.15 130.34 133.70 133.32 139.90 Nepal 101.53 100.87 107.70 112.92 114.02 122.89 132.32 Pakistan 102.13 106.00 109.98 112.71 110.42 118.92 119.27 Philippines 102.39 109.47 113.20 112.91 112.70 115.09 119.04 Saudi Arabia
101.79 103.40 105.00 101.87 108.85 109.92 108.19
Singapore 93.33 95.96 89.37 91.87 92.30 101.11 105.33 Sri Lanka 103.96 103.21 114.42 111.72 123.62 119.55 121.44 Thailand 101.81 111.21 111.13 113.41 113.86 118.55 124.55 Turkey 103.15 99.03 102.80 105.50 109.97 115.59 121.92 United Kingdom
99.89 98.02 102.01 100.08 101.83 103.86 98.58
USA 98.94 102.97 103.59 105.08 105.63 101.75 101.59 World+ Total
102.00 105.31 109.30 109.99 112.65 116.66 116.94
Nepal
Source: FAOSTAT.

380
15.06 Consumer Price Indices in Selected Countries (Base:2005=100)
Country Item 2010 2011 2012 2013
Australia A 115.80 119.70 121.80 124.7 B 121.60 127.50 125.40 126.4 Bangladesh (Dhaka) A 182.50 202.00 219.70 246.5 B 195.10 220.10 236.50 251.9 Canada A 133.60 145.40 161.30 114.8 B 151.60 166.80 190.00 124.4 Bhutan A 125.70 134.10 141.30 - B 135.50 147.50 159.50 - Brazil A 103.30 109.00 112.20 150.1 B 104.00 110.70 114.20 177.3 Cambodia A 108.90 112.00 113.70 115.5 B 115.70 120.10 122.90 118.7 Canada A 123.50 130.20 133.60 114.8 B 165.20 184.70 193.60 124.4 China A 111.70 117.60 122.40 136.9 B 121.20 129.70 137.20 202.6 China, Hong Kong SAR A 111.10 114.10 116.90 127.7 B 115.80 120.30 125.50 143.2 Denmark A 173.10 247.80 204.10 117.8 B 214.50 110.10 270.60 126.1 Egypt A 107.80 111.50 112.30 223.6 B 109.30 102.10 114.70 304.1 France A 100.00 102.80 104.10 113.2 B 100.00 198.90 106.30 116.0 Germany A 182.70 208.10 217.40 105.7 B 193.80 127.40 227.90 110.4 India A 120.30 148.60 132.90 241.1 B 136.00 99.70 157.30 259.6 Indonesia A 100.00 99.60 99.70 142.2 B 100.00 103.20 99.70 176.1 Contd.

381
15.06 Consumer Price Indices in Selected Countries (Base :2005=100)
Country Item 2010 2011 2012 2013
Japan A 100.00 99.70 99.70 100.0 B 1000.00 99.60 99.70 99.6 Malaysia A 100.00 103.20 104.90 107.1 B 100.00 104.80 107.60 111.5 Maldives A 146.10 162.50 183.90 - B 155.40 186.40 219.40 - Mexico A 124.20 128.50 133.70 138.8 B 134.50 141.40 152.10 160.1 Myanmar A 155.70 163.50 165.90 175..1 B 154.20 159.70 157.30 166.8 Nepal A 192.80 209.80 230.20 151.0 B 211.30 236.10 256.10 283.0 New Zealand A 114.90 119.50 120.80 122.2 B 124.00 130.70 129.90 130.5 Pakistan A 234.00 249.80 273.80 295.1 B 268.00 306.70 333.60 361.8 Philippines A 120.40 126.20 130.10 133.9 B 129.50 136.50 139.90 143.8 Saudi Arabia A 114.70 119.00 122.40 126.7
B 120.80 127.10 132.90 140.5 Singapore A 113.70 119.60 125.10 128.1 B 116.80 120.30 123.20 125.8 Sri Lanka A 109.90 117.30 126.10 134.8 B 110.30 120.00 125.60 135.5 Thailand A 108.00 112.10 115.50 105.3 B 122.80 132.60 139.00 108.4 Turkey A 151.90 161.70 176.10 189.3 B 166.10 176.50 191.30 208.8 United Kingdom A 116.40 122.50 126.40 130.3 B 126.80 134.30 138.70 143.8 United States A 111.70 115.20 117.60 119.3 B 113.70 119.20 122.10 123.2 Viet Nam A 166.90 195.10 212.80 - B 198.60 247.60 266.50 - A =All items B=Food Source: Monthly Bulletin of Statistics, U.N., September 2009.

382
15.07 Retail Price Indices Relating to Living Expenditures of United Nations Officials in Selected Countries
Countr Base New York city=100, September 2014
City Excluding Housing ** Total Afganistan Kabul 93.9 87.8
Argentina Buenos Aires 87.0 80.2
Australia Sedney 97.0 91.8
Bangladesh Dhaka 92.3 85.8
Myanmar (Burma) Yangon 100.8 93.3
Canada Montreal 839 79.4
Egypt Cairo 101.6 96.2
France Paris 92.7 84.3
Germany FR Bonn *** 88.5 83.0
India New Delhi 86.4 81.8
Indonesia Jakarta 98.1 108.4
Japan Tokyo 86.8 88.0
Kuwait Kuwait 87.7 78.7
Malaysia Kualalum pur 82.8 90.1
Nepal Kathmandu 86.5 80.7
Netherland The Huge 95.5 88.7
Pakistan Islamabad 85.7 79.5
Philippines Manila 87.3 84.2
Qatar Doha *** 88.7 103.9
Singapore Singapore 98.0 103.4
Sri Lanka Colombo 92.0 833.5
Switzerland Geneva 112.7 112.0
Thailand Bangkok 90.2 85.0
Turkey Ankara 84.5 79.9
U.A.E. Abu Dabi 92.6 102.1
U.K. London 107.9 115.3
U.S.A. Washington DC 95.7 88.8 Note : *Rates are those relevant to calculation of cost living indices for
international officials.
** Housing consists of rent, utilizations and domestic service.
*** The 'Total' index was calculated on the basis of the cost of
Government or subsidized housing which is normally lower than
prevailing rentals.
Source: Monthly Bulletin of Statistics U.N. October 2014.

383
15.08 World Land Utilization Statistics, 2012 Area(100 Ha)
Country Land Area Agricultural area
Aroble land and
Permanent crops
Arable Land
Forest area
Other Land
Afghanista
n
65286 37910 7910 7790 1350 26026
Bangladesh 13017 9125 8525 7675 1437 2455
Bhutan 3811.7 520 113 1000 3271 21
India 297319 179300 169000 156200 68724 49295
Maldives 30 7 6 3 1 22
Nepal 14335 4121 2326 2118 3636 6578
Pakistan 77088 27040 22040 21185 1601 48447
Sri Lanka 6271 2690 2250 1250 1831 1750
World (Total) 13009102 4922206.
6
1562548 1395895 4021911 4074445
Source: FAOSTAT.

384
15.09 Selected Foreign Currency Equivalent to Bangladeshi Taka (in Average), 2010-11 to 2013-14 Country
Unit
Taka per currency 2010-11
Taka per currency 2011-12
Taka per currency 2012-13
Taka per currency 2013-14
Australia Dollar 70.51 81.65 82.10 71.37
Bahrain Dinar 183.75 209.80 212.00 206.16
Canada Dollar 71.12 78.84 79.61 72.69
China Yuan 10.74 12.47 12.72 12.65
Denmark Krone 13.03 14.22 13.87 14.14
ECU Euro 97.14 105.78 103.39 105.46
Hong Kong Dollar 9.15 10.18 10.31 10.02
India Rupee 1.57 1.58 1.46 1.27
Iran Rial 0.01 0.01 0.01 0.01
Indonesia Rupiah 0.01 0.01 0.01 -
Japan Yen 0.86 1.01 0.92 0.77
Kuwait Dinar 253.51 285.58 282.75 274.81
Malaysia Ringgit 23.09 25.63 25.81 23.95
Myanmar Kyat 11.09 12.32 12.45 12.11
Nepal Rupee 0.98 0.99 0.91 0.79
New Zealand Dollar 53.99 63.62 65.70 64.54
Norway Krone 12.28 13.79 13.88 12.90
Oman Riyal 184.55 205.30 207.57 201.88
Pakistan Rupee 0.83 0.89 0.83 0.76
Philippines Peso 0.86 0.87 0.82 1.79
Qatar Riyal 19.55 21.72 21.95 21.35
Russia Ruble 2.41 2.61 2.56 2.30 Srilanka Rupee 0.64 0.68 0.62 0.59 Singapore Dollar 55.09 62.78 64.52 61.70 Sweden Krona 11.76 11.67 12.12 11.90 Saudi Arabia Riyal 18.98 21.09 21.31 20.72 Switzerland Frank 74.92 88.18 84.92 85.99 South Korea Won 0.06 0.07 0.07 0.07
Thailand Bath 2.33 2.56 2.63 2.46
USA Dollar 71.17 79.10 79.92 77.72
UK Pound 113.26 125.28 125.42 126.40 UAE Dirham 20.19 22.28 22.25 21.16 Note: (a) Figure are yearly average. Source: Bangladesh Bank.

BBS PUBLICATIONS Price effective(Including Postage) from August. 2013
A. Monthly TK. US$ 1. Monthly Statistical Bulletin, Bangladesh 120.00 25.00
B. Quarterly 1. Wage Rate and Earning of non-farm
workers (April-2011,June -2011)
120.00
5.00 C. Annually 1. Statistical Yearbook of Bangladesh, 2009
, 2010 & 2011 (each copy) 550.00 75.00
2. Statistical Pocketbook of Bangladesh, 2009, 2010 , 2011& 2012 (each copy)
150.00 30.00
3. Yearbook of Agricultural Statistics of Bangladesh, 2009, 2010 & 2011 (each copy)
550.00
70.00
4. Foreign Trade Statistics of Bangladesh, 2007-08 Vol. I,II 2008-09 & 2010-11 Volume-I (each year)
650.00
80.00
5. National Accounts Statistics (provisional Estimates of GDP, 2012-13 & Final Estimates of GDP, 2011-12
120.00 6.00
CENSUSES A. Agricultural Census I. The Bangladesh Census of Agriculture
and Livestock
1. Census of Agriculture, 1996, National Series, Vol.2 Agricultural Sample Survey, 1997
500.00
70.00
2. Summary of District/Zila Agricultural Statistics, Census of Agriculture, 1996, Brochure-1
20.00
-
3. Census of Agriculture-2008, National series Vol I, Vol II (each)
550.00 75.00
4. Census of Agriculture-2008, Zila series (64 Zila) each zila
500.00 70.00
5. National volume-1 Agriculture Sample Survey of Bangladesh, 2005
300.00 25.00
6. Agriculture Sample Survey of Bangladesh, 2005, Zila Series (each Zila)
200.00 20.00
7. Preliminary Report Agriculture census, 2008 200.00 30.00
B. Population Census I. Population Census, 1991 1. Population Census, 1991, National Series
Vol. I, Analytical Report . 400.00 40.00
2. Population Census 1991, National Series, Vol-IV, Socio-Economic and Demographic Report...
400.00
65.00
3. Census of Slum Areas and Floating Population 1997, Volume 1
500.00 70.00
II. Population Census, 2001
1. Population Census, National Report (Provisional) July 2003
600.00 75.00
2. Population Census, 2001, Zila Series(each zila).
500.00 50.00
3. Population Census, 2001, Community Series (each zila).
500.00 50.00
4. Population Census 2001, National Series, Vol-II, Union Statistics
600.00 75.00
5. Population Census 2001, National Series, Vol-I, Analytical Report
600.00 75.00
6. Population Census 2001, National Series, Vol-5, Administrative Report
200.00 25.00
7. Population Census, 2001, National Series, Vol-III, Urban Area Report
600.00 75.00
8. Population Census, 2001, National Series, Vol-IV, Socio Economic and Demographic Report
600.00 75.00
SAMPLE SURVEY
I. Sample Registration System:
1. Annual Report of Sample Vital Registration System, 1993 & 1994
250.00 20.00
2. Report of Sample Vital Registration System, 1997-1998 & 1999-2001 (each copy)
250.00 30.00
3. Report of Sample Vital Registration System, 2005-06 , 2007, 2 008 -2009 , 2010
400.00 40.00
I. Household Expenditure Survey:
1. Preliminary Report of Household Income & Expenditure Survey, 2000 .
175.00 20.00
2. Preliminary Report of Household Income & Expenditure Survey, 2010 .
300.00 30.00
3. Report of Household Income and Expenditure Survey, 2005
600.00 75.00
TK. US$
4. Report of the Household Income & Expenditure Survey 2010
700.00 -
III. Labour Force Survey:
1. Report of the Labour Force Survey,
Bangladesh, 1999-2000.
450.00 55.00
2. Report on National Child Labour Survey,
2002-03
350.00 35.00
3. Report on Baseline Survey on Child
Workers in Welding Establishments,
2002-03..
200.00 25.00
4. Report on Baseline Survey on Working
Children in Automobile Establishment,
2002-03
200.00
25.00
5. Report on the Working Children in
Metropolitan Cities of Bangladesh, 2002-
03.
200.00 25.00
6. Report on Baseline Survey on Street
Children in Bangladesh, 2002-03 ..
200.00 25.00
7. Report of the Baseline Survey on Child
Workers in Road Transport Sector, 2002-
03.
200.00 25.00
8. Report of the Baseline Survey on Child
Workers in Battery Recharging/Recycling
Sector, 2002-03..
200.00
25.00
9. Baseline Survey for Determining
Hazardous Child Labour Sectors in
Bangladesh, 2005
400.00 15.00
10
.
Report on Labour Force Survey, 2005-06 598.00 75.00
11
.
Report on Lavour force survey 2010 698.00 85.00
IV. Child Nutrition Survey: 1. Anemia Prevalence Survey of Urban
Bangladesh and Rural Chittagong Hill Tracts, 2003 .
200.00
20.00
2. Child and Mother Nutrition Survey of Bangladesh, 2005
300.00 30.00
3. Progotir Pathey,2006, Vol-1 & Vol-II (each Volume)
300.00 30.00
V. Agriculture Statistics:
1. Farm poultry and livestock Survey in
Bangladesh, 1988-89, 2010.
220.00 10.00
2. Report on Crop Survey (Aman-1994-95,
Wheat-1995-96, Potato-1996-97 and
Sugarcane-1996-97).
200.00
25.00
3. Report of the Household -based
Livestock and Poultry Survey-2009
200.00 5.00
4. Report on thje cost of production of
Aman, 2008-09, Wheat, 2008-09, Aus,
2008-09, Boro, 2008-09, Jute, 2008-09.
150.00 5.00
5, Report on the cost of production on
Onion crop-2009
150.00 5.00
6. Report on the cost of production of
Potato-2009.
150.00 5.00

7. Report on the cost of production of
Pulses -2009,
150.00 5.00
8. Report on the cost of production of Oil
seeds-2009.
150.00 5.00
9. Report on the cost of production of
Maize-2009.
150.00 5.00
VI. Food for Works and Vulnerable group feeding:
1. Report of the Survey on Vulnerable
Group Development (VGD)-1990 .
100.00 15.00
2. Report of the Survey on Test Relief,1991 200.00 15.00
3. Report of the Survey on Vulnerable
Group Development (VGD), 1991.
200.00 15.00
TK. US$
VII. Health, Demographic Survey and Social Statistics:
1 Contraceptive Prevalence, November 1995
75.00 10.00
2. Prevalence of Smoking of Bangladesh, November'95
50.00 10.00
3. Population, Health, Social and Household Environment Statistics, 1996 ..
160.00 20.00
4. Gender Statistics in brief, 1996 . 20.00 5.00 5. Report on Survey on Prevalence of
Disability, 1996 . 100.00 15.00
6. Report of Survey on Marriage, Divorce and Separation in Bangladesh, 1996 .
75.00 10.00
7. Report of Survey on Coverage of Immunization, 1995 .
75.00 10.00
SMALL AREA COMMUNITY LEVEL AND POVERTY RELATED STATISTICS
1. Analysis of Poverty on Basic Needs Dimension Vol. 1.
160.00 20.00
2. Analysis of Basic Needs Dimension of Poverty, Vol. II & III (each)
200.00 20.00
3. Urban Poverty Monitoring Survey, 1998 . 250.00 30.00 4. Rural Poverty Monitoring Survey, 1998. 250.00 30.00 5. Report of the Poverty Monitoring Survey,
May, 1999 -2004 350.00 35.00
SECTORAL STATISTICS Trade and Industry 1. Report on Survey of Private Health
Service Establishment 1997-98 ... 100.00 20.00
2. Report on Survey of Private Education Services in Bangladesh, 1997-98 ....
100.00 20.00
3. Report on Survey of Selected Economic Activities, 1995-96.
100.00 20.00
4. Report on Survey of Private Non-Profit Institution in Bangladesh 1996-97.
100.00 20.00
5. Report on Bangladesh Census of Manufacturing Industries (CMI), 1992-93, 1993-94 , 1995-96, & 1997-98(each copy) .
300.00
35.00
6. Bangladesh Standard Industrial Classification of all Economic Activities-2001 (BSIC-2001)
250.00
30.00
7. Preliminary Report on Handloom Census,2003.
150.00 15.00
8. Report on Bangladesh Census of Manufacturing Industries, 1999-2000 .
350.00 40.00
9. Report on Annual Establishments & Institution Survey 1993-94, 1995-96 & 1996-97 (each copy)
450.00
45.00
10.
Report on Bangladesh Handloom Census-2003 .
600.00 60.00
11.
Economic Census 2001 & 2003, National Report
800.00 80.00
12.
Economic Census 2001 & 2003, Zila Report (each zila)..
570.00 55.00
13.
Report on Annual establishments and Institutions Survey, 2002-03
500.00 50.00
14.
Survey on Private Education Institutions, 2007
270.00 30.00
15.
Survey on Private Health Service Establishments, 2007
250.00 25.00
16.
Survey on Non-Profit Institutions Serving Househld, 2007
250.00 25.00
17.
Report on Bangladesh Survey of 2001-02 CMI Manufacturing Industries, 2005-06 (SMI )
400.00 45.00
NATIONAL ACCOUNTS 1. National Accounts Statistics of
Bangladesh (Revised Estimates 1989-90 to 1998-99) , December 2000
300.00
36.00
2. Estimates of Investment Methods and Data Sources, May 2002
175.00 20.00
3. National Accounts Statistics (Provisional
Estimates of GDP, 2008-09 and Final
Estimates of GDP, 2007-08).
120.00
6.00
TK. US$
4. National Accounts Statistics. Revised
Estimites of GDP 2009-10 and Final
Estimates of GDP-2008-09
120.00
6.00
5. National Accounts Statistics.
Revised estimates of GDP 2010-11, 2012-
13
and Final estimates of GDP 2009-10,2011-
12
120.00
6.00
SPECIAL REPORTS/PROCEEDINGS
1. Fifth Five Year Plan 1997-2002 450.00 60.00
2. Bangladesh Compendium of Environment
Statistics, 1997
300.00 40.00
3. Bangladesh At a Glance May 2001 50.00 05.00
4. Compendium of Environment Statistics of
Bangladesh 2004 & 2005 (each copy) .
500.00
60.00
5. Handbook of Environment Statistics, 2005 125.00 15.00
6. Statistics Bangladesh, 2006 & 2008 (each
copy)
50.00 5.00
7. Survey on Volunteerism in Bangladesh 3010 200.00 20.00
8. Private Commercial Mechanized Transport
Survey 2009
200.00 10.00
9. Report on the Bangladesh Literacy Survey-
2008
180.00 20.00
10 Decent Work Indicators Pilot Survey -2005
(Complementary)
11
.
Pilot Wage Survey- 2007 (Complementary)
12
.
Welfare Monitoring Survey-2009 (Complementary)
13
.
Monitoring of Employment-2009 (Complementary)
14
.
Bangladesh Standard Industrial Classification of
All Economic Activities-2008
(Complementary)
15 Compendium of Environment Statistics
Bangladesh -2009
1000.00 100.00
16
.
Sectoral Need based Projections in Bangladesh, May-2006
(Complementary)
17
.
Wage Rate of Working Poor in
Bangladesh
2009-10
120.00 5.00
18
.
Bangladesh Central Product Classification 300.00 15.00
19
.
Bangladesh Standard Classification of
Occupations-2012
500.00 15.00
20
.
Literacy Assessment Survey -2011 (Complimentary)
* Annual Subscription.
Note

(a) Price in US$ indicates overseas price inclusive of Air mail postage.
(b) Purchase orders enclosing payment in the form of Bank Draft/Cheque/Pay Order favouring Director General, BBS may be
placed at the following address: Director General Bangladesh Bureau of Statistics 'Parishankhan Bhaban' E-27/A, Agargaon, Dhaka-1207 Bangladesh. (c) Publications can also be purchased in cash from :
1. BBS Publication Section, Parishankhan Bhaban (Ground Floor) E-27/A, Agargaon, Dhaka-1207 Phone: 8181442, 8181443, 9120840,
9113788,8129552 Ext. 1010
2. BBS Sales Centre, Ansari Building (1st Floor), 14/2, Topkhana Road, (Opposite of Press club) Dhaka 1000.
3. Book sellers i 4. n Dhaka enlisted with BBS
Copyright © 2022 FDOKUMEN