Statistical analysis of denaturing gel electrophoresis (DGE) fingerprinting patterns: Use of...
10
Environmental Microbiology (2002) 4 (11), 634–643 © 2002 Blackwell Science Ltd Blackwell Science, LtdOxford, UKEMIEnvironmental Microbiology 1462-2912Blackwell Science, 20024 634643 Review Article Use of statistics for the interpretation of DGE patternsN. Fromin et al. Received 10 April, 2002; revised 6 August, 2002; accepted 6 August, 2002. *For correspondence. E-mail [email protected]; Tel. ( + 41) 32 718 22 30; Fax ( + 41) 32 718 22 31. Minireview Statistical analysis of denaturing gel electrophoresis (DGE) fingerprinting patterns N. Fromin, 1 * J. Hamelin, 1 S. Tarnawski, 1 D. Roesti, 1 K. Jourdain-Miserez, 1 N. Forestier, 1 S. Teyssier-Cuvelle, 1 F. Gillet, 2 M. Aragno 1 and P. Rossi 1 1 Microbiology Laboratory, and 2 Plant Ecology Laboratory, University of Neuchâtel, PO Box 2, CH-2007 Neuchâtel, Switzerland. Summary Technical developments in molecular biology have found extensive applications in the field of microbial ecology. Among these techniques, fingerprinting methods such as denaturing gel electrophoresis (DGE, including the three options: DGGE, TGGE and TTGE) has been applied to environmental samples over this last decade. Microbial ecologists took advantage of this technique, originally developed for the detection of single mutations, for the analysis of whole bacterial communities. However, until recently, the results of these high quality fingerprinting patterns were restricted to a visual interpretation, neglecting the analytical potential of the method in terms of statistical significance and ecological inter- pretation. A brief recall is presented here about the principles and limitations of DGE fingerprinting anal- ysis, with an emphasis on the need of standardization of the whole analytical process. The main content focuses on statistical strategies for analysing the gel patterns, from single band examination to the analy- sis of whole fingerprinting profiles. Applying statisti- cal method make the DGE fingerprinting technique a promising tool. Numerous samples can be analysed simultaneously, permitting the monitoring of micro- bial communities or simply bacterial groups for which occurrence and relative frequency are affected by any environmental parameter. As previously applied in the fields of plant and animal ecology, the use of statistics provides a significant advantage for the non- ambiguous interpretation of the spatial and temporal functioning of microbial communities. Fingerprinting techniques applied to microbial communities Molecular approaches in microbial ecology A major challenge in the field of microbial ecology is to assess the diversity of the microbial cells present in a defined habitat. Assessing the diversity of microbial com- munities (in terms of richness and structure) is a way to address how they evolve in their environment. In a more general way, it is a possible means to address the ques- tion of the modulation of microbial communities by environmental factors. Phylogenetically meaningful mac- romolecules, particularly 16S rDNA directly amplified from environmental DNA, are now widely used for such pur- poses (Ranjard et al., 2000a; O’Donnell et al., 2001; Schäfer and Muyzer, 2001). However, information collected by these molecular tools quickly revealed the unsuspected complexity of whole bacterial communities (Ward et al ., 1990). They were shown in turn to be limited in a practical way (O’Donnell et al., 2001). The amount of time and resources needed for the now classical ‘cloning-sequencing’ technique (which potentially supply an exhaustive description of microbial communities), coupled with the impracticability of complete counts of organisms at present (Dunbar et al., 2002), led to the development of alternative solutions. An original way was to separate polymerase chain reaction (PCR)-amplified fragment pools produced from whole microbial communities by electrophoresis techniques (Table 1). These fingerprinting methods are now widely adopted in the field of bacterial ecology and permit the simultaneous analysis of numerous samples (Ferrari and Hollibaugh, 1999). DGE fingerprinting of microbial communities Muyzer et al. (1993) first applied denaturing gel electro- phoresis (DGE) techniques for the analysis of whole bac- terial communities. Denaturing gel electrophoresis allows
-
Upload
univ-montp2 -
Category
Documents
-
view
1 -
download
0
Transcript of Statistical analysis of denaturing gel electrophoresis (DGE) fingerprinting patterns: Use of...

Environmental Microbiology (2002)
4
(11), 634–643
© 2002 Blackwell Science Ltd
Blackwell Science, LtdOxford, UKEMIEnvironmental Microbiology 1462-2912Blackwell Science, 20024
634643
Review Article
Use of
statistics for the interpretation of DGE patternsN. Fromin et al.
Received 10 April, 2002; revised 6 August, 2002; accepted 6 August,2002. *For correspondence. E-mail [email protected]; Tel.(
+
41) 32 718 22 30; Fax (
+
41) 32 718 22 31.
Minireview
Statistical analysis of denaturing gel electrophoresis (DGE) fingerprinting patterns
N. Fromin,
1
* J. Hamelin,
1
S. Tarnawski,
1
D. Roesti,
1
K. Jourdain-Miserez,
1
N. Forestier,
1
S. Teyssier-Cuvelle,
1
F. Gillet,
2
M. Aragno
1
and P. Rossi
1
1
Microbiology Laboratory, and
2
Plant Ecology Laboratory, University of Neuchâtel, PO Box 2, CH-2007 Neuchâtel, Switzerland.
Summary
Technical developments in molecular biology havefound extensive applications in the field of microbialecology. Among these techniques, fingerprintingmethods such as denaturing gel electrophoresis(DGE, including the three options: DGGE, TGGE andTTGE) has been applied to environmental samplesover this last decade. Microbial ecologists tookadvantage of this technique, originally developed forthe detection of single mutations, for the analysis ofwhole bacterial communities. However, until recently,the results of these high quality fingerprintingpatterns were restricted to a visual interpretation,neglecting the analytical potential of the method interms of statistical significance and ecological inter-pretation. A brief recall is presented here about theprinciples and limitations of DGE fingerprinting anal-ysis, with an emphasis on the need of standardizationof the whole analytical process. The main contentfocuses on statistical strategies for analysing the gelpatterns, from single band examination to the analy-sis of whole fingerprinting profiles. Applying statisti-cal method make the DGE fingerprinting technique apromising tool. Numerous samples can be analysedsimultaneously, permitting the monitoring of micro-bial communities or simply bacterial groups for whichoccurrence and relative frequency are affected by anyenvironmental parameter. As previously applied in thefields of plant and animal ecology, the use of statisticsprovides a significant advantage for the non-
ambiguous interpretation of the spatial and temporalfunctioning of microbial communities.
Fingerprinting techniques applied to microbial communities
Molecular approaches in microbial ecology
A major challenge in the field of microbial ecology is toassess the diversity of the microbial cells present in adefined habitat. Assessing the diversity of microbial com-munities (in terms of richness and structure) is a way toaddress how they evolve in their environment. In a moregeneral way, it is a possible means to address the ques-tion of the modulation of microbial communities byenvironmental factors. Phylogenetically meaningful mac-romolecules, particularly 16S rDNA directly amplified fromenvironmental DNA, are now widely used for such pur-poses (Ranjard
et al.,
2000a; O’Donnell
et al.,
2001;Schäfer and Muyzer, 2001).
However, information collected by these molecular toolsquickly revealed the unsuspected complexity of wholebacterial communities (Ward
et al
., 1990). They wereshown in turn to be limited in a practical way (O’Donnell
et al.,
2001). The amount of time and resources neededfor the now classical ‘cloning-sequencing’ technique(which potentially supply an exhaustive description ofmicrobial communities), coupled with the impracticabilityof complete counts of organisms at present (Dunbar
et al.,
2002), led to the development of alternative solutions. Anoriginal way was to separate polymerase chain reaction(PCR)-amplified fragment pools produced from wholemicrobial communities by electrophoresis techniques(Table 1). These fingerprinting methods are now widelyadopted in the field of bacterial ecology and permit thesimultaneous analysis of numerous samples (Ferrari andHollibaugh, 1999).
DGE fingerprinting of microbial communities
Muyzer
et al.
(1993) first applied denaturing gel electro-phoresis (DGE) techniques for the analysis of whole bac-terial communities. Denaturing gel electrophoresis allows

Use of statistics for the interpretation of DGE patterns
635
© 2002 Blackwell Science Ltd,
Environmental Microbiology
,
4
, 634–643
the separation of small polymerase chain reaction prod-ucts, commonly up to 400 bp. The separation of the DNAfragments is achieved as a function of their different G
+
Ccontent and distribution. Consequently, the fingerprintingpattern is built according to the melting behaviour of thesequences along a linear denaturing gradient (Myers
et al
., 1985). Such a gradient is obtained using eitherdenaturing chemicals for denaturing gradient gel electro-phoresis (DGGE) or heat for temperature gradient gelelectrophoresis (TGGE) and temporal temperature gradi-ent electrophoresis (TTGE).
The DGE techniques were applied using 16S rDNAfragments to the analysis of bacterial communities innumerous habitats such as soil and rhizosphere (Bruns
et al
., 1999; Yang and Crowley, 2000; Duineveld
et al.,
2001; Ibekwe
et al.,
2001; McCaig
et al.,
2001; Smalla
et al.,
2001) and aquatic environments (Murray
et al
.,1996; 1998; Ferrari and Hollibaugh, 1999; Moeseneder
et al
., 1999; van der Gucht
et al.,
2001; Schäfer andMuyzer, 2001; Schäfer
et al.,
2001). Interestingly, anincreasing number of studies based on DGE are carriedout on archaeal (Murray
et al
., 1998; Rölling
et al.,
2001)or eukaryal communities (van Hannen
et al
., 1999; vanElsas
et al.,
2000; Diez
et al.,
2001; Mohlenhoff
et al.,
2001).The sensitivity of DGE analysis can be refined with the
targeting of precise (and even non-dominant) taxonomicgroups, by using specific PCR primers (Heuer
et al
., 1997;Nübel
et al
., 1997; Heilig
et al.,
2002) or by identifyingcommunity members by hybridization of blotted DGE gelswith group-specific oligonucleotide probes (Heuer
et al
.,1999). Other developments were based on the use of 16SrRNA as a target (Felske and Akkermans, 1998;Kowalchuk
et al
., 1999; Duineveld
et al.,
2001; Schäfer
et al.,
2001) to highlight metabolically active populationsonly. Functional genes (Watanabe
et al
., 1998; Bruns
et al
., 1999; Lovell
et al.,
2000; Fjellbirkeland
et al.,
2001)or even their transcripts (Wawer
et al
., 1997) were alsoanalysed, which heralds very interesting prospects in clar-ifying the functioning of microbial communities.
Guidelines for the interpretation of DGE fingerprinting patterns
Some features of the fingerprinting techniques have to beconsidered before applying statistics for the analysis ofDGE profiles.
In DGE analysis, the generated banding pattern is con-sidered as an ‘image’ of the whole bacterial community.An individual discrete band refers to an unique ‘sequencetype’ or phylotype (Muyzer
et al
., 1995; van Hannen
et al
.,1999), which is treated in turn as a discrete bacterialpopulation. The term population classically refers to agroup of bacterial cells present in a specified habitat andbelonging to the same species. We are expecting thatPCR fragments generated from a single population todisplay identical electrophoretic mobility in the analysis.This was confirmed by Kowalchuk
et al
. (1997) whoshowed that co-migrating bands generally correspondedto identical sequences. However, it was shown that rDNAfragments of closely related bacteria are not necessarilyresolved (Buchholz-Cleven
et al
., 1997) or may produceseparated bands (Jackson
et al.,
2001). Moreover, non-related sequences might co-migrate at an identical posi-tion (Vallaeys
et al
., 1997), especially when treating com-plex community patterns (Kowalchuk
et al
., 1997; BenOmar and Ampe, 2000). In this case, the question of theresolution of the gel needs to be addressed. Crowding ofthe gel has been discussed already and algorithms toassess it were proposed by Nübel
et al
. (1999a). Degen-erated primers should be avoided also as one single bac-terial strain, or even a single clone, may generate amultiple band pattern (Kowalchuk
et al
., 1997; Piceno
et al
., 1999). Some authors have also detected artificialbands when analysing complex DNA templates, probablyinduced by heteroduplex molecules (Ferris and Ward,1997). Consequently, care should be taken in assigning asingle band to a single bacterial population.
Another assumption for DGE fingerprinting interpreta-tion is that the band intensity is directly related to thedensity of corresponding bacterial phylotypes within thesample. Results obtained by Murray
et al
. (1996) sug-gested a relationship between band intensity and relativeabundance of the corresponding phylotype in the templateDNA mixture. Such an assumption implies that no biaswas obtained during the whole extraction–amplificationprocedure of the bacterial genomes (Muyzer
et al
., 1993;Wang and Wang, 1997; Garcia-Pichel
et al.,
2001). TheDGE analysis should probably be restricted to samplestreated using identical methods, in which DNA extractionand amplification biases are supposed to occur homoge-neously. Moreover, it is commonly accepted that the mainpopulations only (those representing more than 0.1–1%of the target organisms in terms of relative proportion) are
Table 1.
Fingerprinting methods used for the characterization of microbial communities, with recent publications in the related field.
Amplified ribosomal DNA restriction analysis (ARDRA) Smit
et al
. (1997); Tiedje
et al
. (1999)Denaturing gel electrophoresis (DGE) Muyzer and Smalla (1998)Ribosomal intergenic spacer analysis (RISA) Fisher and Triplett (1999); Ranjard
et al.
(2000b)Single strand conformation polymorphism (SSCP) Schwieger and Tebbe (1998); Dabert
et al.
(2001)Terminal restriction fragment length polymorphism (T-RFLP) Moeseneder
et al.,
(1999); Dollhopf
et al.
(2001)

636
N. Fromin
et al.
© 2002 Blackwell Science Ltd,
Environmental Microbiology
,
4
, 634–643
displayed in the profiles (Muyzer
et al
., 1993; Murray
et al
., 1996). As a result, all populations present within ahabitat do not appear on DGE banding patterns. Whenassessing the above considerations, the image of thecommunities which is provided by DGE fingerprinting pat-terns probably relates more to its structure, i.e. to therelative abundance of the main bacterial populations, thanto its total richness (Muyzer and Smalla, 1998). Thesefeatures and restrictions are nevertheless common to allPCR-based approaches (Lee
et al
., 1996; Fisher andTriplett, 1999; Schäfer and Muyzer, 2001).
The last consideration about this analytical technique isabout the reproducibility of the DGE analysis. Reproduc-ibility of sample analysis depends on the upstream ana-lytical steps (from the sampling to the DNA extraction andamplification procedures) as well as the care brought tothe DGE gels themselves. A thorough standardization ateach level of the experiments results in very high repro-ducibility. The use of reference patterns, the loading ofprecise amounts of PCR-amplified fragments and the pre-cision of gel staining are required. As a consequence,identical samples loaded on a single gel display identicalpatterns (Simpson
et al
., 1999; Schäfer
et al.,
2001; Yang
et al.,
2001) and patterns from different gels can be com-pared with a high degree of confidence. The analysis oflarge numbers of samples can be exploited for the char-acterization of the intrinsic variability of the bacterial com-munity structures. This large amount of data can beanalysed in turn with statistical tools, which provide asignificant advantage for the non-ambiguous interpreta-tion of the observed variability (Morris
et al.
, 2002).
Analysis and comparison of DGE community profiles
Denaturing gel electrophoresis techniques have beenextensively used to monitor bacterial communities inspace and time (Ferris and Ward, 1997; Murray
et al
.,1998; Nübel
et al
., 1999b; van der Gucht
et al.,
2001) orto evaluate the impact of environmental disturbances(Ibekwe
et al.,
2001; Müller
et al.,
2001). The variationsbetween DGE profiles were classically described visuallyon a single DGE gel by the disappearance, the appear-ance or the changes in the intensity of selected bands.However, an increasing number of studies propose statis-tical investigations of DGE banding patterns, which
undoubtedly lead to refined results. These advanced anal-yses are based on a computer-assisted characterizationof the banding patterns and the subsequent treatment ofthe data using a statistical approach.
An example of computer-assisted guideline for the anal-ysis of fingerprinting profiles was proposed by Rademaker
et al
. (1999) using the GelCompar software package(Applied Maths, Kortrijk, Belgium). Briefly, banding pat-terns were first standardized with a reference patternincluded in all gels. Each band was described by its posi-tion (
Y,
in pixel on the image file) and its relative intensityin the profile (
P
i
), which could be calculated by the relativesurface of the peak in the profile (
P
i
=
n
I
/
N,
where
n
i
is thesurface of the peak
i
, and
N
is the sum of the surfaces forall the peaks within the profile). Using these data variousstatistical methods can be applied, based either on singleband or on whole DGE profile analysis.
Analysis of DGE profiles based on single bands
One way to analyse DGE fingerprinting patterns is toobserve the possible changes in the presence/absence orin the variation of intensity of a single band (Murray
et al
.,1996). Putative indicator bands highlighted in this way canbe excised from the gels and their sequences analysedusing a cloning–sequencing procedure (Kowalchuk
et al
.,1997; Watanabe
et al
., 1998; Ibekwe
et al.,
2001).The variation in band presence or intensity can be
exploited in two different ways. First of all, the relevanceof indicator bands can be evaluated by testing their occur-rence in relation with various biological and physicochem-ical parameters (Widmer
et al.,
2001) as well as with thepresence or absence of other bands in the patterns. Inthe example shown in Table 2 16S rDNA TTGE bandingpatterns of 30 raw milk samples were analysed in this way.The occurrence of each TTGE band was tested againstqualitative descriptors using a Fisher’s exact test andbands found at the positions
Y
=
230 and
Y
=
300 werepositively correlated to the cleaning frequency of the milk-ing device and to the hygienic status of the cow titsrespectively.
Second, single band analysis can also be used forcomputing a regression between band intensity (depen-dent quantitative variable) and an environmental descrip-tor (independent quantitative variable). In the example
Table 2.
Significant correlation (
P
< 0.05, Fisher’s exact test) between the presence of a selected band within a gel pattern and a qualitativedescriptor. The bands were identified using a cloning-sequencing procedure (P. Rossi, unpublished data).
Descriptors
Position of the band(in pixels on Y axis)
Frequency of cleaningof the milking device
Hygienic status of thecow tits before milking
Identification of 16S rDNAfragment (% identity)
Y
=
230
P
=
0.0001 No correlation Bacillus sp. (>95%)Y = 300 No correlation P = 0.004 Pseudomonas sp. (> 95%)
Use of statistics for the interpretation of DGE patterns 637
© 2002 Blackwell Science Ltd, Environmental Microbiology, 4, 634–643
given above, the TTGE patterns were analysed by plottingthe relative intensities (Pi) of each band versus variousphysical parameters measured from the same samples.A positive correlation (R2 = 0.69) was found between therelative intensity of the band Y = 300 (identified asPseudomonas sp.; Table 2) and the per cent of fat mea-sured in the raw milk (Fig. 1).
Whole profile analysis
The second approach for a comparative analysis of DGEpatterns is based on the whole set of bands present withinthe profiles. The total number of bands (called sometimes‘band richness’) in each sample pattern is related to the
number of dominant phylotypes, and can be used forcomparison purposes (Müller et al., 2001; van der Guchtet al., 2001). Comparison of profiles can be refined bytaking into account the relative intensity of each band (Pi).Thus, diversity indices, such as Shannon-Weaver andEvenness indices (Nübel et al., 1999a; Simpson et al.,1999; Kocherginskaya et al., 2001; McCaig et al., 2001;Ogino et al., 2001), can be calculated to describe possiblechanges in the dominance among phylotypes. An inter-esting feature is to combine these indices with other setsof environmental data. For instance, Nübel et al. (1999a)found a positive linear correlations between Shannon-Weaver indices calculated from both DGE patterns andcarotenoid types in oxygenic-phototrophic microbialcommunities.
Computation of similarity matrix
When considering the presence/absence of the bands,similarities between banding patterns, taken in pairs, canbe expressed as a percentage value of a similarity coef-ficient such as Jaccard (Diez et al., 2001) or Dice (van derGucht et al., 2001) coefficient, or a distance coefficientsuch as Euclidean measure (McSpadden Gardener andLilley, 1997). Other coefficients, such as the Steinhauscoefficient (Fig. 2) or the product moment, also namedPearson correlation coefficient (Rölling et al., 2001;Smalla et al., 2001), allow to take into consideration therelative intensity (Pi) of each band (Legendre and Leg-endre, 1998; Rademaker et al., 1999). As noticed byMurray et al. (1998), the use of these similarity coefficientsfor the calculation of pair-wise levels of similarity betweenpatterns does not require a one-to-one correspondencebetween the number of bands and the number of
Fig. 1. Regression analysis between the relative intensity (ln) of the band at the Y = 300 position and the percentage of fat found in the corresponding raw milk samples (P. Rossi, unpublished data).
Fig. 2. UPGMA clustering of 10 samples taken along a vertical gradient form the small eutrophic Lake Loclat (Neuchâtel, Switzerland). Samples are ranked by depth: 1, corresponds to the surface; 10, to the bottom of the lake (8.7 m).A. Clustering according to DGGE data (using Steinhaus coefficient).B. Clustering according to 23 physical and chemical variables using Euclidean distance (Forestier et al., 2002). Linkage levels were computed using the R package (Casgrain and Legendre, 2001).

638 N. Fromin et al.
© 2002 Blackwell Science Ltd, Environmental Microbiology, 4, 634–643
sequence types. Similarity or distance matrices can bedisplayed graphically as a dendrogram, but also give wayto clustering and ordination methods.
Clustering techniques
Clustering techniques, such as the unweighted pair groupmethod using arithmetic averages (UPGMA), are applied tothe DGE profiling with the aim of identifying the sampleswhich generate similar patterns (Ibekwe et al., 2001; Yanget al., 2001; Boon et al., 2002). One advantage of thispresentation is that the coherence of the fingerprintingpatterns can be assessed rapidly.
In the example given above (Forestier et al., 2002), 10samples were taken from a holomictic eutrophic lakealong a vertical gradient and were analysed for majorions, organic content, physical parameters and DGGEanalysis of 16SrDNA fragment genes. Computation of theDGGE and environmental parameters matrices was car-ried out using the Euclidean distance and Steinhaus coef-ficient, respectively, and UPGMA was selected as aclustering method for the presentation of the results. Theresulting dendrograms (Fig. 2) showed that the sampleswere clustered according to the depth of their sampling,in agreement with measured physical and chemicalparameters.
Ordination methods
Another way of analysing DGE profiles is to bring outmajor tendencies of the variance of the samples for thewhole set of descriptors using multivariate ordinationmethods. Legendre and Legendre (1998) provide a excel-lent review of these methods which are commonly usedin the field of ecology. These methods are used for theintegration of complex sets of data (i.e. bands in the DGEpatterns) into new mathematical variables which can beprojected into a few-dimension perspective (reducedspace). The major advantage of these methods is to dis-play the whole set of samples on a simple scheme, andto highlight the possible descriptors which are governingtheir dispersion (ter Braak et al., 1995). Of course, truecorrelation can only be deduced when sufficient amountsof data are provided: the results of proposed statisticalanalysis should be considered with care, as coincidenceor convergence mechanisms cannot be excluded.
Common ordination methods include non-metric multi-dimensional scaling (NMDS), principal component analy-sis (PCA), correspondence analysis (CA), canonicalvariate analysis (CVA) and canonical correspondenceanalysis (CCA). Several complementary statistical proce-dures can be applied to analyse DGE data (Yang et al.,2001). Details on the specific underlying theory of eachof these methods can be found elsewhere (McSpadden
Gardener and Lilley, 1997; Legendre and Legendre,1998).
Non-metric multidimensional scaling is an ordinationmethod which reduces complex DGE patterns to a pointin a two-dimensional space. By connecting the consecu-tive points, the relative changes in the bacterial commu-nity can be visualized. van Hannen et al. (1999) proposedto calculate Nei-Li distances from the binary data resultingfrom DGE profile analysis and to represent these dis-tances using this ordination method. The authors showedthat bacterial communities that developed on two distinctdetritus substrates differed significantly: the distances cal-culated between communities from different substrateswere greater (P < 0.05) than the distances calculatedbetween the replicates for a given substrate. Non-metricmultidimensional scaling was used elsewhere for the inter-pretation of DGE data (Diez et al., 2001; Schäfer et al.,2001). The advantage of NMDS is to represents theobjects in two or three dimensions, with dissimilar objectsfar apart and similar objects close to one another in theordination space.
Principal component analysis generates new variables,called principal components (linear components of theoriginal variables), which explain the highest dispersion ofthe samples. This method was often used for the interpre-tation of DGE community fingerprinting analysis (van derGucht et al., 2001; Müller et al., 2001; Ogino et al., 2001;Yang et al., 2001). As an example, Müller et al. (2001)used PCA to compare 16S rDNA DGGE profiles for bac-terial communities present in mercury-contaminated soils.Their investigations showed that the DGGE approachgenerated more distinctive results than colony morphotyp-ing and substrate utilization. van der Gucht et al. (2001)showed that the composition of bacterioplanktonic com-munities differed between two lakes and during seasonsusing a PCA applied to presence/absence of bands within16S rDNA DGGE patterns. Using Spearman’s rank corre-lation, the observed seasonal variations were found to bepositively correlated with environmental variables such astemperature, nitrate concentration or microbial biomass.However, PCA is probably not the most suitable statisticalapproach for analysing DGE patterns, as its underlyingmodel assumes that biological populations have a linearresponse curve along the axes of ecological variation.Niche theory tells us that populations have ecologicalpreferences. An unimodal (i.e. bell-shaped) response dis-tribution of the different bacterial populations present in acommunity is probably closer to reality, with more individ-uals near some optimal environmental values.
Correspondence analysis may be applied to any datatable that is dimensionally homogenous. ter Braak (1985)showed that the underlying model was adapted to pres-ence/absence or abundance data tables and conse-quently, that the analysis was well suited for populations
Use of statistics for the interpretation of DGE patterns 639
© 2002 Blackwell Science Ltd, Environmental Microbiology, 4, 634–643
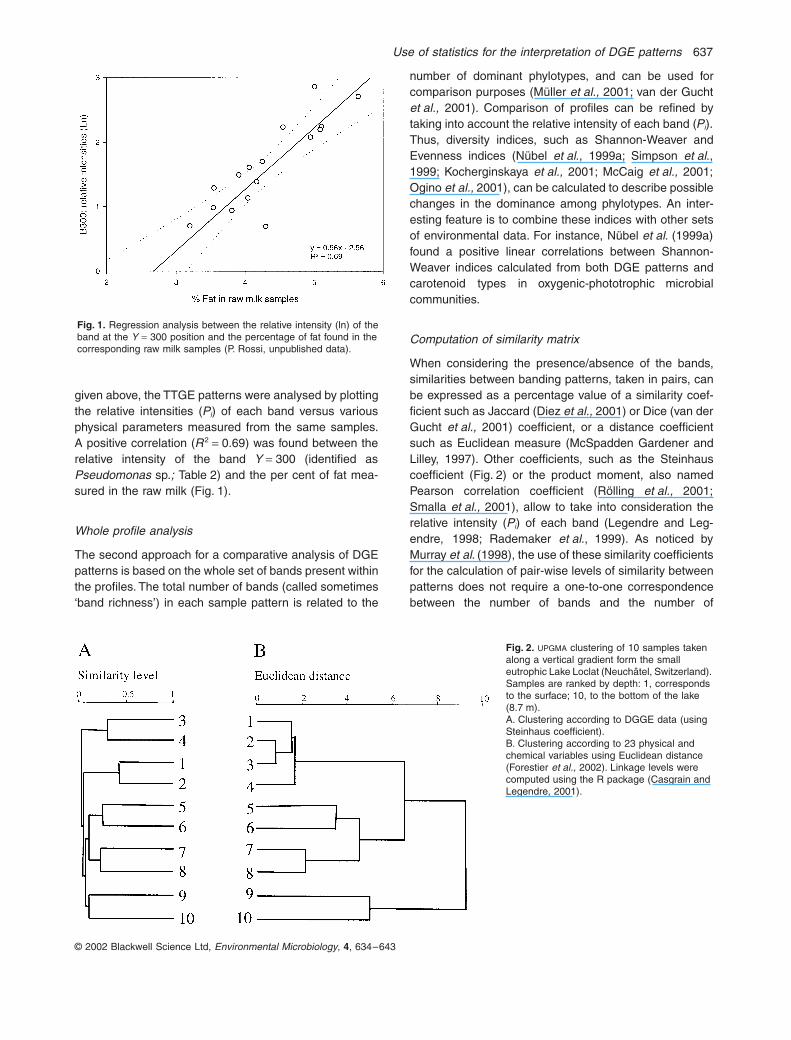
with unimodal distribution along environmental gradients.Using this statistical analysis, Jourdain-Miserez et al.(2001) analysed 16S rDNA gene fragments issued frommilk samples on TTGE gels. The results clearly showeddifferent community structures between organic and con-ventional farming practices (Fig. 3). Correspondenceanalysis was also used elsewhere for similar approaches(Ibekwe et al., 2001; Yang et al., 2001).
Interpretation of DGE patterns with environmental variables
From our point of view, the greatest opportunity of thestatistical analysis of DGE patterns is offered when thecommunity profiles are combined in a joint analysis withenvironmental data sets. The relevant question here is toknow whether the variations observed between differentbanding patterns could be associated with the variationsof measured environmental variables.
McCaig et al. (2001) applied multivariate analysis toreduce the original data for grassland DGGE communitypatterns into six principal components. They showed cleardifferences between improved and non-improved grass-land communities using CVA. This method requires an apriori definition of groups and finds linear combinations ofvariables that maximize the ratio between-group variationto within-group variation.
The ‘community matrix’ obtained from DGE profiles canbe tested also against a second matrix obtained from
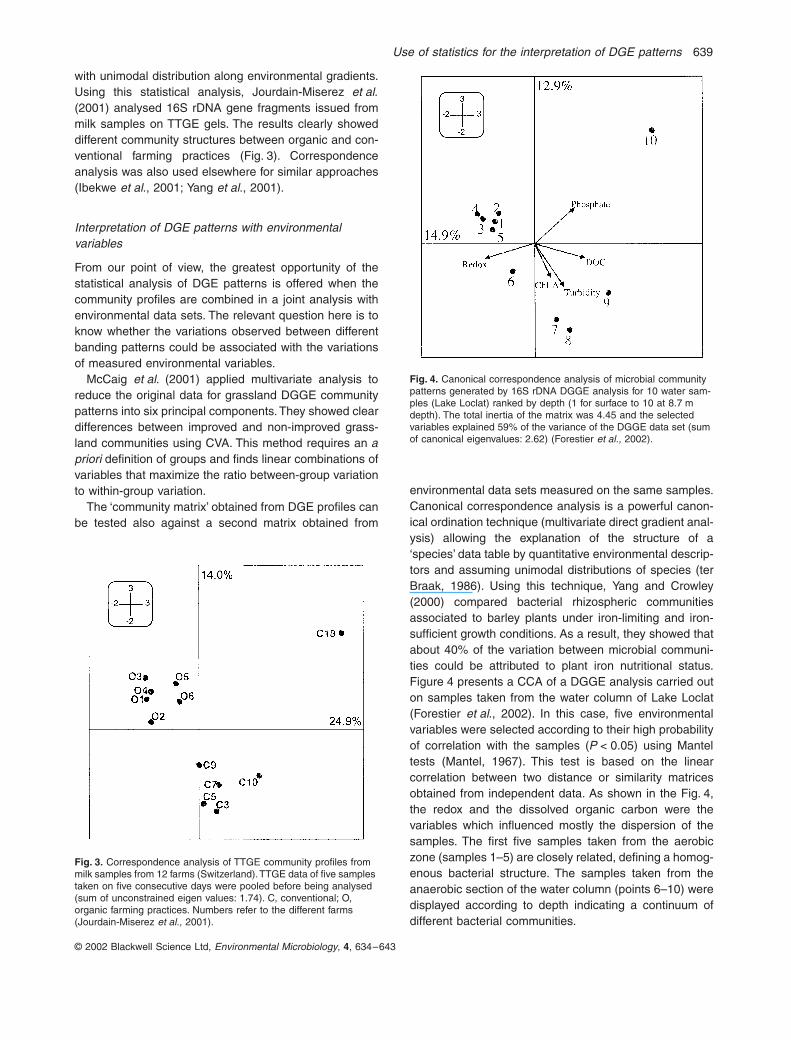
environmental data sets measured on the same samples.Canonical correspondence analysis is a powerful canon-ical ordination technique (multivariate direct gradient anal-ysis) allowing the explanation of the structure of a‘species’ data table by quantitative environmental descrip-tors and assuming unimodal distributions of species (terBraak, 1986). Using this technique, Yang and Crowley(2000) compared bacterial rhizospheric communitiesassociated to barley plants under iron-limiting and iron-sufficient growth conditions. As a result, they showed thatabout 40% of the variation between microbial communi-ties could be attributed to plant iron nutritional status.Figure 4 presents a CCA of a DGGE analysis carried outon samples taken from the water column of Lake Loclat(Forestier et al., 2002). In this case, five environmentalvariables were selected according to their high probabilityof correlation with the samples (P < 0.05) using Manteltests (Mantel, 1967). This test is based on the linearcorrelation between two distance or similarity matricesobtained from independent data. As shown in the Fig. 4,the redox and the dissolved organic carbon were thevariables which influenced mostly the dispersion of thesamples. The first five samples taken from the aerobiczone (samples 1–5) are closely related, defining a homog-enous bacterial structure. The samples taken from theanaerobic section of the water column (points 6–10) weredisplayed according to depth indicating a continuum ofdifferent bacterial communities.
Fig. 3. Correspondence analysis of TTGE community profiles from milk samples from 12 farms (Switzerland). TTGE data of five samples taken on five consecutive days were pooled before being analysed (sum of unconstrained eigen values: 1.74). C, conventional; O, organic farming practices. Numbers refer to the different farms (Jourdain-Miserez et al., 2001).
Fig. 4. Canonical correspondence analysis of microbial community patterns generated by 16S rDNA DGGE analysis for 10 water sam-ples (Lake Loclat) ranked by depth (1 for surface to 10 at 8.7 m depth). The total inertia of the matrix was 4.45 and the selected variables explained 59% of the variance of the DGGE data set (sum of canonical eigenvalues: 2.62) (Forestier et al., 2002).

640 N. Fromin et al.
© 2002 Blackwell Science Ltd, Environmental Microbiology, 4, 634–643
Conclusions
Denaturing gel electrophoresis fingerprinting techniquesare very effective methods for the characterization of bac-terial community structures. These techniques are conve-nient for the simultaneous analysis of numerous samples.They are consequently well suited for the monitoring ofwhole communities, focusing on phylotypes for which theoccurrence and/or the relative frequency are affected byany environmental change. As shown above, emphasisshould be brought to the standardization of the wholeanalytical procedure as a means for increasing the reli-ability of the method and the reproducibility of the pat-terns. For instance computer-assisted analysis of theprofiles should be generalized, escaping the merely qual-itative reading of the fingerprinting patterns.
The exploratory aspect of the statistical techniquesapplied to DGE patterns that we present here is the con-sequence of statistical developments brought to the fieldof plant and animal ecology. It is now possible to approachcausality in microbial ecology with statistical methodsusing experimental designs which were impossible to con-ceive a few years ago, principally because of the time andresources needed for the analysis of high number of sam-ples. Examples provided above showed that it is possibleto apply statistical tools to DGE data sets efficiently. Thefirst result is in the validation of the interpretation of thepatterns, such as shifts in the microbial community struc-ture or the identification of key-populations which may beaffected by changing conditions. Moreover, whole patterndata generated by the DGE analysis can be directly testedfor correlation analysis against any single or combinationof environmental sets of variables.
However, care should be taken in the choice of thestatistical analytical procedure. As shown above, theunderlying theoretical model should be carefully assessedbefore any attempt of application. Some analysis used upto now were probably not well suited to this type of datasets. On the contrary, CA is particularly well suited forabundance data sets, and PCA (normalized using corre-lation) is perfectly adapted for the analysis of environmen-tal data sets (standardized descriptors).
The complementation of DGE analysis with a statisticalapproach leads to the definition of new hypotheses andto new prospects in terms of spatial or temporal function-ing of microbial systems. Statistical methods reveal puta-tive correlations between different sets of variables. Theydo not permit, however, conclusions to be drawn regardingthe causality of these correlations. Therefore, statisticalanalyses should not be considered alone, but in a dialecticrelationship with an ecological hypothesis. Automated pat-tern recognition and mechanistic dynamic modeling (com-bined with field and laboratory experiments) will probablyvery soon be the future steps in this field. In this sense, it
will be conceivable to describe more precisely the rela-tions between the observed diversity of the organisms andtheir ecological niches, leading to the development of thepromising concept of ‘bacterial sociology’.
Acknowledgements
The authors would like to thank Camilla Rusca and SimonaCasati, Noémie Matile and Muriel Meier for their technicalassistance, Jacqueline Moret and Florian Kohler for theiradvises in statistics and Patrick Guerin for the English cor-rection of the manuscript.
References
Ben Omar, N., and Ampe, F. (2000) Microbial communitydynamics during production of the mexican fermentedmaize dough pozol. Appl Environ Microbiol 66: 3664–3673.
Boon, N., De Windt, W., Verstraete, W., and Top, E.M. (2002)Evaluation of nested PCR-DGGE (denaturing gradient gelelectrophoresis) with group-specific 16S rDNA primers forthe analysis of bacterial communities from different waste-water treatment plants. FEMS Microbiol Ecol 39: 101–112.
ter Braak, C.J.F. (1985) Correspondence analysis of inci-dence and abundance data: properties in terms of unimo-dal response model. Biometrics 41: 859–873.
ter Braak, C.J.F. (1986) Canonical correspondence analysis:a new eigenvector technique for multivariate direct gradientanalysis. Ecology 67: 1167–1179.
ter Braak, C.J.F., Van Tongeren, O.F.R., and Jongman,R.H.G. (1995) Data Analysis in Community and LandscapeEcology. Cambridge, UK: Cambridge University Press.
Bruns, M.A., Stephen, J.R., Kowalchuk, G.A., Prosser, J.I.,and Paul, E.A. (1999) Comparative diversity of ammoniaoxidizer 16S rRNA gene sequences in native, tilled andsuccessional soils. Appl Environ Microbiol 65: 2994–3000.
Buchholz-Cleven, B.E.E., Rattunde, B., and Straub, K. (1997)Screening for genetic diversity of isolates of anaerobic Fe(II) -oxidizing bacteria using DGGE and whole-cell hybrid-ization. Syst Appl Microbiol 20: 301–309.
Casgrain, P., and Legendre, P. (2001) The R Package forMultivariate and Spatial Analysis, Version 4.0d6- User’sManual. Département de Sciences Biologiques, Universitéde Montréal. Available, http://www.fas.umontreal.ca/BIOL/legendre/.
Dabert, P., Fleurat-Lessard, A., Mounier, E., Delgenes, J.P.,Moletta, R., and Godon, J.J. (2001) Monitoring of themicrobial community of a sequencing batch reactor bioaug-mented to improve its phosphorus removal capabilities.Water Sci Technol 43: 1–8.
Diez, B., Pedros-Alio, C., Marsh, T.L., and Massana, R.(2001) Application of denaturing gradient gel electrophore-sis (DGGE) to study the diversity of marine picoeukarioticassemblages and comparison of DGGE with other molec-ular techniques. Appl Environ Microbiol 67: 2942–2951.
Dollhopf, S.L., Hashsham, S.A., and Tiedje, J.M. (2001)Interpreting 16S rDNA T-RFLP data: application of self-organizing maps and principal component analysis todescribe community dynamics and convergence. MicrobialEcol 42: 495–505.
Use of statistics for the interpretation of DGE patterns 641
© 2002 Blackwell Science Ltd, Environmental Microbiology, 4, 634–643
Duineveld, B.M., Kowalchuk, G.A., Keijzer, A., van Elsas,J.D., and van Veen, J.A. (2001) Analysis of bacterial com-munities in the rhizosphere of chrysanthenum via denatur-ing gradient gel electrophoresis of PCR-amplified 16SrRNA as well as DNA fragments coding for 16S rRNA. ApplEnviron Microbiol 67: 172–178.
Dunbar, J., Barns, S.M., Ticknor, L.O., and Kuske, C.R.(2002) Empirical and theoretical bacterial diversity in fourArizona soils. Appl Environ Microbiol 68: 3035–3045.
van Elsas, J.D., Duarte, G.F., Keijzer-Wolters, A., and Smit,E. (2000) Analysis of the dynamics of fungal communitiesin soil via fungal-specific PCR of soil DNA followed bydenaturing gradient gel electrophoresis. J Microbiol Meth43: 133–151.
Felske, A., and Akkermans, A.D. (1998) Prominent occur-rence of ribosomes from an uncultured bacterium of theVerrucomicrobiales cluster in grassland soils. Lett ApplMicrobiol 26: 219–223.
Ferrari, V.C., and Hollibaugh, J.T. (1999) Distribution ofmicrobial assemblages in the central Arctic ocean basinstudied by PCR/DGGE: Analysis of a large data set. Hydro-biologia 401: 55–68.
Ferris, M.J., and Ward, D.M. (1997) Seasonal distribution ofdominant 16S rRNA-defined populations in a hot springmicrobial mat examined by denaturing gradient gel electro-phoresis. Appl Environ Microbiol 63: 1375–1381.
Fisher, M.M., and Triplett, E.W. (1999) Automated approachfor ribosomal intergenic spacer analysis of microbial diver-sity and its application to freshwater bacterial communities.Appl Environ Microbiol 65: 4630–4636.
Fjellbirkeland, A., Torsvik, V., and Øvreås, L. (2001) Metha-notrophic diversity in an agricultural soil as evaluated bydenaturing gradient gel electrophoresis profiles of pmoA,mxaF and 16S rDNA sequences. Antonie Van Leeuwen-hoek 79: 209–217.
Forestier, N., Steinmann, P., Lazko, E., Aragno, M., andRossi, P. (2002) Combined statistical analysis of bacterialcommunity structures from an eutrophic lake revealed byDGGE, PLFA and chemical analysis. In Abstracts Book61st Annual Assembly of Swiss Society for Microbiology,Luzern, Switzerland, pp. 43.
Garcia-Pichel, F., López-Córtes, A., and Nübel, U. (2001)Phylogenetic and morphological diversity of cyanobacteriain soil desert crusts from the Colorado Plateau. Appl Envi-ron Microbiol 67: 1902–1910.
van der Gucht, K., Sabbe, K., de Meester, L., Vloemens, N.,Zwart, G., Gillis, M., and Vyverman, W. (2001) Contrastingbacterioplankton community composition and seasonaldynamics in two neighbouring hypertrophic freshwaterlakes. Environ Microbiol 3: 680–690.
van Hannen, E.J., Zwart, G., van Agterveld, M.P., Gons, H.J.,Ebert, J., and Laanbroek, H.J. (1999) Changes in bacterialand eukaryotic community structure after mass lysis offilamentous cyanobacteria associated with viruses. ApplEnviron Microbiol 65: 795–801.
Heilig, H.G., Zoedental, E.G., Vaughan, E.E., Marteau, P.,Akkermans, A.D., and de Vos, W.M. (2002) Moleculardiversity of Lactobacillus spp. & other lactic acid bacteriain the human intestine as determined by specific amplifi-cation of 16S ribosomal DNA. Appl Environ Microbiol 68:114–123.
Heuer, H., Krsek, M., Baker, P., Smalla, K., and Wellington,E.M. (1997) Analysis of actinomycete communities by spe-cific amplification of genes encoding 16S rRNA and gel-electrophoretic separation in denaturing gradients. ApplEnviron Microbiol 63: 3233–3241.
Heuer, H., Hartung, K., Wieland, G., Kramer, I., and Smalla,K. (1999) Polynucleotide probes that target a hypervariableregion of 16S rRNA genes to identify bacterial isolatescorresponding to bands of community fingerprints. ApplEnviron Microbiol 65: 1045–1049.
Ibekwe, A.M., Papiernik, S.K., Gan, J., Yates, S.R., Yang,C.-H., and Crowley, D.E. (2001) Impact of fumigants onsoil microbial communities. Appl Environ Microbiol 67:3245–3257.
Jackson, C.R., Langner, H.W., Donahoe-Christiansen, J.,Inskeep, W.P., and McDermott, T.R. (2001) Molecularanalysis of microbial community structure in an arsenite-oxidizing acidic thermal spring. Environ Microbiol 3: 532–542.
Jourdain-Miserez, K., Aragno, M., and Rossi, P. (2001) Com-parison of bacterial community structure in conventionaland organic raw milk samples using TTGE analysis. InFinal Programm Abstracts, 9th Int Symp Microbial Ecol,Amsterdam, Netherlands, FR 044, pp. 176.
Kocherginskaya, S.A., Aminov, R.I., and White, B.A. (2001)Analysis of the rumen bacterial diversity under two differentdiet conditions using Denaturing Gradient Gel Electro-phoresis, random sequencing and statistical ecologyapproaches. Anaerobe 7: 119–134.
Kowalchuk, G.A., Stephen, J.R., de Boer, W., Prosser, J.I.,Embley, T.M., and Woldendorp, J.W. (1997) Analysis ofammonia-oxidizing bacteria of the beta subdivision of theclass Proteobacteria in coastal sand dunes by denaturinggradient gel electrophoresis and sequencing of PCR-amplified 16S ribosomal DNA fragments. Appl EnvironMicrobiol 63: 1489–1497.
Kowalchuk, G.A., Naoumenko, Z.S., Derikx, P.J., Felske, A.,Stephen, J.R., and Arkhipchenko, I.A. (1999) Molecularanalysis of ammonia-oxidizing bacteria of the beta subdi-vision of the class Proteobacteria in compost and com-posted materials. Appl Environ Microbiol 65: 396–403.
Lee, S.Y., Bollinger, J., Bezdicek, D., and Ogram, A. (1996)Estimation of the abundance of an uncultured soil bacterialstrain by a competitive quantitative PCR method. ApplEnviron Microbiol 62: 3787–3793.
Legendre, P., and Legendre, L. (1998) Numerical ecology.2nd English edn. Amsterdam, The Netherlands: Elsevier,pp. 445.
Lovell, C.R., Piceno, Y.M., Quattro, J.M., and Bagwell, C.E.(2000) Molecular analysis of diazotroph diversity in therhizosphere of the smooth cordgrass, Spartina alterniflora.Appl Environ Microbiol 66: 3814–3822.
Mantel, N. (1967) The detection of disease clustering and ageneralized regression approach. Cancer Res 27: 209–220.
McCaig, A.E., Glover, L.A., and Prosser, J.I. (2001) Numer-ical analysis of grassland bacterial community structureunder different land management regimens by using 16Sribosomal DNA sequence data and denaturing gradient gelelectrophoresis banding patterns. Appl Environ Microbiol67: 4554–4559.
642 N. Fromin et al.
© 2002 Blackwell Science Ltd, Environmental Microbiology, 4, 634–643
McSpadden Gardener, B.B., and Lilley, A.K. (1997) Applica-tion of common statistical tools. In Modern Soil Microbiol-ogy. van Elsas, J.D., Trevors, J.T and Wellington, E.M.H.,(eds). New York: Marcel Dekker, pp. 501–523.
Moeseneder, M.M., Arrieta, J.M., Muyzer, G., Winter, C., andHerndl, G.J. (1999) Optimization of terminal-restrictionfragment length polymorphism analysis for complex marinebacterioplankton communities and comparison with dena-turing gradient gel electrophoresis. Appl Environ Microbiol65: 3518–3525.
Mohlenhoff, P., Muller, L., Gorbushina, A.A., and Petersen,K. (2001) Molecular approach to the characterization offungal communities: methods for DNA extraction, PCRamplification and DGGE analysis of painted art objects.FEMS Microbiol Lett 195: 169–173.
Morris, C.E., Bardin, M., Berge, O., Frey-Klett, P., Fromin, N.,Girardin, H., et al. (2002) Microbial diversity: approachesto experimental design and hypothesis testing in the pri-mary scientific literature from 1975 to 1999. Microbiol MolBiol Rev (in press).
Müller, A.K., Westergaard, K., Christensen, S., andSørensen, S.J. (2001) The effect of long-term mercurypollution on the soil microbial community. FEMS MicrobiolEcol 36: 11–19.
Murray, A.E., Hollibaugh, J.T., and Orrego, C. (1996) Phylo-genetic compositions of bacterioplankton from two Califor-nia estuaries compared by denaturing gradient gelelectrophoresis of 16S rDNA fragments. Appl EnvironMicrobiol 62: 2676–2680.
Murray, A.E., Preston, C.M., Massana, R., Taylor, L.T.,Blakis, A., Wu, K., and DeLong, E.F. (1998) Seasonal andspatial variability of bacterial and archaeal assemblages inthe coastal waters near Anvers Island, Antarctica. ApplEnviron Microbiol 64: 2585–2595.
Muyzer, G., and Smalla, K. (1998) Application of denaturinggradient gel electrophoresis (DGGE) and temperature gra-dient gel electrophoresis (TGGE) in microbial ecology.Antonie Van Leeuwenhoek 73: 127–141.
Muyzer, G., de Waal, E.C., and Uitterlinden, A.G. (1993)Profiling of complex microbial populations by denaturinggradient gel electrophoresis analysis of polymerase chainreaction-amplified genes coding for 16S rRNA. Appl Envi-ron Microbiol 59: 695–700.
Muyzer, G., Teske, A., Wirsen, C.O., and Jannasch, H.W.(1995) Phylogenetic relationships of Thiomicrospira spe-cies and their identification in deep-sea hydrothermal ventsamples by denaturing gradient gel electrophoresis of 16SrDNA fragments. Arch Microbiol 164: 165–172.
Myers, R.M., Fischer, S.G., Lerman, L.S., and Maniatis, T.(1985) Nearly all single base substitutions in DNA frag-ments joined to a GC-clamp can be detected by denaturinggradient gel electrophoresis. Nucleic Acids Res 13: 3131–3145.
Nübel, U., Garcia-Pichel, F., and Muyzer, G. (1997) PCRprimers to amplify 16S rRNA genes from cyanobacteria.Appl Environ Microbiol 63: 3327–3332.
Nübel, U., Garcia-Pichel, F., Kühl, M., and Muyzer, G.(1999a) Quantifying microbial diversity: morphotypes, 16SrRNA genes, and carotenoids of oxygenic phototrophs inmicrobial mats. Appl Environ Microbiol 65: 422–430.
Nübel, U., Garcia-Pichel, F., Kühl, M., and Muyzer, G.
(1999b) Spatial scale and the diversity of benthic cyano-bacteria and diatoms in a salina. Hydrobiologia 401: 381–391.
O’Donnell, A.G., Seasman, M., Macrae, A., Waite, I., andDavies, J.T. (2001) Plants and fertilisers as drivers ofchange in microbial community structure and function insoils. Plant Soil 232: 135–145.
Ogino, A., Koshikawa, H., Nakahara, T., and Uchiyama, H.(2001) Succession of microbial communities during a bio-stimulation process as evaluated by DGGE and clonelibrary analysis. J Appl Microbiol 91: 625–635.
Piceno, Y.M., Noble, P.A., and Lovell, C.R. (1999) Spatialand temporal assessment of diazotroph assemblage com-position in vegetated salt marsh sediments using denatur-ing gradient gel electrophoresis analysis. Microb Ecol 38:157–167.
Rademaker, J.L.W., Louws, F.J., Rossbach, U., Vinuesa, P.,and De Bruijn, F. (1999) Computer-assisted analysis ofmolecular fingerprints and database construction. InMolecular Microbial Ecology Manual. Akkermans, A.D.L.,van Elsas, J.D and De Bruijn, F.J., (eds). Dordrecht: KluwerAcademic Publisher, chapter. 7.1.3.
Ranjard, L., Poly, F., and Nazaret, S. (2000a) Monitoringcomplex bacterial communities using culture-independentmolecular techniques: application to soil environment. ResMicrobiol 151: 167–177.
Ranjard, L., Nazaret, S., Gourbière, F., Thioulouse, J., Linet,P., and Richaume, A. (2000b) A soil microscale study toreveal the heterogeneity of Hg (II) impact on indigenousbacteria by quantification of adapted phenotypes and anal-ysis of community DNA fingerprints. FEMS Microbiol Ecol31: 107–115.
Rölling, W.F.M., van Breukelen, B.M., Braster, M., Lin, B.,and van Verseveld, H.W. (2001) Relationships betweenmicrobial community structure and hydrochemistry in alandfield leachate-polluted aquifer. Appl Environ Microbiol67: 4619–4629.
Schäfer, H., and Muyzer, G. (2001) Denaturing gradient gelelectrophoresis in marine microbial ecology. Meth Micro-biol 30: 425–468.
Schäfer, H., Bernard, L., Courties, C., Lebaron, P., Servais,P., Pukall, R. et al. (2001) Microbial community dynamicsin Mediterranean nutrient-enriched seawater mesocosms:changes in the genetic diversity of bacterial populations.FEMS Microbiol Ecol 34: 243–253.
Schwieger, F., and Tebbe, C.C. (1998) A new approach toutilize PCR-single-strand-conformation polymorphism for16S rRNA gene-based microbial community analysis. ApplEnviron Microbiol 64: 4870–4876.
Simpson, J.M., McCracken, V.J., White, B.A., Gaskins, H.R.,and Mackie, R.I. (1999) Application of denaturant gradientgel electrophoresis for the analysis of the porcine gas-trointestinal microbiota. J Microbiol Meth 36: 167–179.
Smalla, K., Wieland, G., Buchner, A., Zock, A., Parzy, J.,Kaiser, S. et al. (2001) Bulk and rhizosphere soil bacterialcommunities studied by denaturing gradient gel electro-phoresis: plant-dependent enrichment and seasonal shiftsrevealed. Appl Environ Microbiol 67: 4742–4751.
Smit, E., Leeflang, P., and Wernars, K. (1997) Detection ofshifts in microbial community structure and diversity in soilcaused by copper contamination using amplified ribosomal

Use of statistics for the interpretation of DGE patterns 643
© 2002 Blackwell Science Ltd, Environmental Microbiology, 4, 634–643
DNA restriction analysis. FEMS Microbiol Ecol 23: 249–261.
Tiedje, J.M., Asuming-Brempong, S., Nüsslein, K., Marsh,T.L., and Flynn, S.J. (1999) Opening the black box of soilmicrobial diversity. Appl Soil Ecol 13: 109–122.
Vallaeys, T., Topp, E., Muyzer, G., Macheret, V., Laguerre,G., Rigaud, A., and Soulas, G. (1997) Evaluation of dena-turing gradient gel electrophoresis in the detection of 16SrDNA sequence variation in rhizobia and methanotrophs.FEMS Microbiol Ecol 24: 279–285.
Wang, G.C., and Wang, Y. (1997) Frequency of formation ofchimeric molecules as a consequence of PCR coamplifi-cation of 16S rRNA genes from mixed bacterial genomes.Appl Environ Microbiol 63: 4645–4650.
Ward, D.M., Weller, R., and Bateson, M.M. (1990) 16S rRNAsequences reveal numerous uncultured micro-organismsin a natural community. Nature 345: 63–65.
Watanabe, M., Teramoto, M., Futamata, H., and Harayama,S. (1998) Molecular detection, isolation, and physiological
characterisation of functionally dominant phenol-degradingbacteria in activated sludge. Appl Environ Microbiol 64:4396–4402.
Wawer, C., Jetten, M.S., and Muyzer, G. (1997) Geneticdiversity and expression of the [NiFe] hydrogenase large-subunit gene of Desulfovibrio spp. in environmental sam-ples. Appl Environ Microbiol 63: 4360–4369.
Widmer, F., Fliessbach, A., Laczkó, E., Schulze-Aurich, J.,and Zeyer, J. (2001) Assessing soil biological chara-cteristics: a comparison of bulk soil community DNA-,PLFA-, and BiologTM-analysis. Soil Biol Biochem 33: 1029–1036.
Yang, C.H., and Crowley, D.E. (2000) Rhizosphere microbialcommunity structure in relation to root location and plantiron nutritional status. Appl Environ Microbiol 66: 345–351.
Yang, C.H., Crowley, D.E., and Menge, J.A. (2001) 16S rDNAfingerprinting of rhizosphere bacterial communities associ-ated with healthy and Phytophtora infected avocado roots.FEMS Microbiol Ecol 35: 129–136.