Stress-corrosion cracking resistance of duplex stainless steel
Upload
independentCategory
view
3download
0
A
stagmfummdesreictrs©
K
1
t
0d
Electrochimica Acta 53 (2007) 434–446
Statistical analysis of a corrosion inhibitor family on three steel surfaces(duplex, super-13 and carbon) in hydrochloric acid solutions
Ana Luısa de Queiroz Baddini a, Sheila Pressentin Cardoso b,∗,Eduardo Hollauer a, Jose Antonio da Cunha Ponciano Gomes c
a Programa de Pos-Graduacao em Quımica, Instituto de Quımica, Universidade Federal Fluminense,Outeiro de S. Joao Batista s/num, Centro, Niteroi 24210-130, Brazil
b Centro Federal de Educacao Tecnologica de Quımica de Nilopolis-CEFET Quımica, Rua Lucio Tavares 1045, Centro, Nilopolis, Rio de Janeiro, Brazilc Laboratorio de Corrosao, Programa de Engenharia Metalurgica e de Materiais, COPPE, Universidade Federal do Rio de Janeiro,
Ilha do Fundao, Centro de Tecnologia, Rio de Janeiro, Brazil
Received 11 April 2007; received in revised form 6 June 2007; accepted 7 June 2007Available online 24 June 2007
bstract
Previous studies have addressed the experimental and theoretical investigation of the inhibition corrosion efficiencies (ICE) of single metalurfaces. Along this line we carried out calculations concerning to 23 compounds on three different single-steel surfaces, duplex, super-13 andhe carbon steel in hydrochloric acid (15% w/v) solutions. The overall experiment is composed of 69 results of weight loss ICEs at 60 ◦C formines, alcohols, thiourea and its derivatives acting as corrosion inhibitors for three steel surfaces. In these studies ICEs were correlated withroup and quantum AM1 descriptors through the use of three different statistical methodologies based on calibration and validation of regular andodified OLS and PLS (partial least squares) methods. All calculations have shown better results using weight isoesteric Langmuir adsorption
unction (WILA function), ln(θM/(1−θ)) or ln Kads, calculated from the weight loss data as the response function. The function −log(i) has beensed, as well, on all comparisons. Variables describing the metal were added to the previous set of group and quantum IC variables and severalodels have been designed to fit the three-steel problem. Simple products of metal and IC variables with 250 (25 × 10) products were tested asodel I. Selection of the best variable set was carried out for the calibration and validation procedures and these calculations indicated very few
escriptors in common, i.e. each particular selection (calibration or validation) finds its own optimal descriptor set. The overall results showedxcellent correlations with R2 values between 0.80 and 0.96 and a Q2 values from 0.75 to 0.93. We are unaware of any similar QSPR study on theteels here studied, and neither the study of such massive amount of data concerning molecular inhibitors on three different steel surfaces. Our bestesult for the second-order cross-validation descriptor selection employs 29 variables, Y29. The results accurately fitted all 69 corrosion inhibitorsxperiments within 5% accuracy over three different steel types. A second model was designed with all 630 binary products of the metal/ICnterface (((35 + 1) × 35)/2). This model uses the variables of model I plus all simple squares of the primary data. Due to the large number of
omposed variables we carried out calculations based on the classical partial least squares (PLS). Our best result employed nine main componentshat accurately fitted the 69 corrosion inhibitors experiments with obtained calibration coefficients, R2, values of 0.95 and Q2 values of 0.83. Bothesults showed excellent performance compared to previous fits found in the literature. Most of the obtained results are easily transferable to otherimilar many-steel studies through a simple data addition concerning the new metal surface.2007 Elsevier Ltd. All rights reserved.
h
eywords: Corrosion; Inhibitor; Statistical analysis; OLS; PLS
. Introduction
Corrosion inhibitors have been widely used in stimula-ion operations in petroleum wells [1–3]. In these operations,
∗ Corresponding author.E-mail address: [email protected] (S.P. Cardoso).
6mio
us
013-4686/$ – see front matter © 2007 Elsevier Ltd. All rights reserved.oi:10.1016/j.electacta.2007.06.050
ydrochloric acid solutions (15% w/v), at temperatures up to0 ◦C, are often employed to remove iron oxides and carbonatedinerals [4]. In such aggressive medium, the use of corrosion
nhibitors (CI) is mandatory, whether used single or as mixtures
f different CI’s [1–4].A peculiar problem occurring on petroleum operations is these of several steel types in the production line. The 22% Crtainless steel, hereafter called duplex (austenic–ferritic), the

rochim
mamaccwetppcsento
ottstlstscq
wBmplacp[
octcmwo
o[saeFtwn
4Atpm
csettadbl[wbs
yttctotdpdmdse
wnatcPtiiett
ttatA
A.L.d.Q. Baddini et al. / Elect
odified 13% Cr stainless steel (martensitic), hereafter denoteds super-13, and the carbon steel (UNS-G4130) are alloys com-only used in petroleum industry. The corrosion resistance
lloys (CRA’s) containing high chromium and molybdenumoncentrations [4–6] are intensively used due to its superiororrosion resistance for mildly acidic environments, combinedith high strength and good low-temperature toughness. Under
xtreme conditions, this alloy has an excellent corrosion resis-ance for oil/gas co-production fluids due to its extendedassivation pH range. Unfortunately stimulation operations inetroleum production employs solutions with high chlorideoncentrations, a peculiar environment where the CRA oftenhow high corrosion rates! Among the well known CI’s [1–3]mployed in hydrochloric acid medium are amines, amides,itriles, imidazolines, triazoles, pyridine, quinoline derivatives,hiourea derivatives, thiosemicarbazide, thiocyanates amongthers.
Despite the intense search for new commercial inhibitors,nly a few articles address chemiometric analysis of the inhibi-ion corrosion efficiency (ICE). Such procedure, when appliedo the corrosion inhibitors, represents a challenge to the regulartructure-activity thinking as applied in biological fields, sincehe physical adsorption is non-specific, in opposition to the key-ock mechanism present in molecular biology. Although, underuch circumstance we should expect lower statistical correla-ions than those found on biological studies, many corrosiontudies below reported, on the contrary, showed several suc-essful results [7,8] correlating small number of inhibitors anduantum descriptors.
Early attempts to correlate ICE to molecular propertiesere made in the mid-1950s employing Huckel calculations.ergman [7] and Hojtink [9] obtained, for a large number ofolecules, excellent correlations between standard reduction
otentials to the lumo and homo energies in univariate calcu-ations. During the 1960s Donahue and Nobe [10] employedb initio calculations to establish certain correlations. Vosta andollaborators studied the correlation of eight gamma-substitutedyridine N-oxides with several ab initio quantum descriptors11]. These early works operated with univariate correlations.
Growcock et al. [12,13], in an earlier series of papers, elab-rated a general multivariate analysis for chemisorption andorrosion inhibition. They employed physico-chemical descrip-ors as homo and lumo energies, log P, Hammett and Tafelonstants, in the investigation of the inhibition of corrosion ofild steel by derivatives of cinnamaldehyde. This was the firstork to recognize the importance of the Langmuir constant tobtain the best linear relationships.
Abdul-Ahad and Al-Madfai [14], using CNDO/2 method-logy, extended this work to aniline derivatives. Dupin et al.8] carried out an important study of a large set of corro-ion inhibitors containing 42 compounds, including aliphaticmines, imidazolines and related compounds. These corrosionfficiencies were successfully correlated to some Hansch and
ree-Willson parameters. In this study, many non-linear descrip-ors were tested. This is the only work, besides our series, inhich more than 12 molecules were involved. Although theumber of molecules mentioned in Dupin work counts around
c(if
ica Acta 53 (2007) 434–446 435
0, all calculation were applied to sub-sets of this family.lthough the Dupin work is recognized as an extended study
oward a statistical knowledge of related IC families we mustoint out that all calculations were carried with less than 12olecules and restricted to the univariate calculations.Sastri and Perumareddi [15] in a set of univariate experiments,
orrelated the ICEs of several methyl substituted pyridines andubstituted ethane derivatives with MNDO descriptors. Kutejt al. [16] studying dibenzyl sulfoxide adsorption on iron inhe mid-1990s, employed ab initio calculations to recognizehe attachment points of ICs on the iron surface. Ogretir etl. [17] employed several AM1, PM3, MINDO/3 and MNDOescriptors in attempt to correlate the efficiency of pyridineased inhibitors for mild steel. Several descriptors showed excel-ent univariate correlations. However, Sastri and Perumareddi15] did not use multivariate methods. A related article [18]as published recently and was concerned with the iron inhi-ition corrosion when exposed to imidazole derivatives in acidolution.
Lukovits et al. [19] employed a polynomial regression anal-sis for the Langmuir adsorption constant for a set of sevenhiourea derivatives and obtained good correlation values. Ben-iss et al. [20] successfully correlated ICEs, determined throughharge transfer resistance, of six triazole and oxadiazole deriva-ives to AM1 quantum descriptors. A R-values of 0.91–0.96 werebtained. Recently Khalil [21] extended this study and correlatedhe inhibition by 12 thiosemicarbazone and thiosemicarbazideerivatives to five quantum MNDO/PM3 descriptors. All theserevious studies were addressed to carbon steel and the lack ofata concerning other steel types in the literature is clear andust be addressed. Furthermore, the ability to use and transfer
ata between several steel types should be a most useful and aignificant advance in a field where the experiments are ratherxpensive and time consuming.
Recently, the field has experienced a revolutionary changeith several molecular modeling techniques being used to designew ICs. Articles by Wang et al. [22] and Pradip and Rai [23]re few of the contributions to this revolution. Wang calibratedhe ICEs of three imidazole derivatives, and used these values toorrectly predict the ICEs of another three imidazole derivatives.radip and Rai [23] elaborated a procedure for the evaluation of
he interaction energies of surfactants used in industrial clean-ng. The advantage of their proposal is that experimental datas not required. Affrosman et al. [24] predicted, on the basis ofxperimental and computational experience, that the inhibitionime would be maximal around C10 for physical adsorption onitanium surfaces.
Previous studies [25–27] by our group analyzed a set con-aining 23 different corrosion inhibitors and their ICEs towardshree different steel types, the 22% Cr, the modified 13% Crnd the carbon steel. This work aimed the efficient predic-ion of molecular properties based on the QSPR methodology.lthough it is possible to recognize, in the literature, many arti-
les and authors employing simple common-sense descriptorshomo/lumo energies, the difference, the dipole moment, polar-zability and others), it is clear the need for new studies searchingor efficient quantum descriptors and group contribution molec-

4 rochimica Acta 53 (2007) 434–446
uw(cli
sycmowRddtao
mbdotUdstumf
ssci
2
l2eno(fafwoprtpb
Table 1Blank corrosion speeds for the three used steels
Steel type Corrosion speed (mpy)
Duplex 11644.28SC
b
Θ
wc
s1Crsr
siwtianumber 1,2-butyne-1,4-diol in carbon steel case number 23. Forthe other steel cases numbers will vary from 24 to 46 for super-13 and from 47 to 69 for duplex steel consistently with Table 2.Within the text sometimes as the equivalent number from Table 2
Table 2The 23 inhibitors employed and ICE (θ)
Compound θ (duplex) θ (super-13) θ (carbon)
Tributylamine 0.9026 0.9776 0.9758Aniline 0.9686 0.9776 0.9666n-Octylamine 0.8286 0.8862 0.9233Diphenylamine 0.9654 0.9208 0.9204Dodecylamine 0.8592 0.8841 0.9137Di-n-butylamine 0.7547 0.8679 0.9129cyclohexylamine 0.6741 0.7819 0.9032n-Butylamine 0.4335 0.6912 0.8384Triethylamine 0.6085 0.7467 0.8117Hexylamine 0.5428 0.8314 0.7576Sec-butylamine 0.3038 0.6754 0.7554Diethylamine 0.3632 0.6876 0.7451Propylamine 0.3527 0.6818 0.7420Isopropylamine 0.2420 0.6361 0.72421,3-Dibutyl-2-thiourea 0.9874 0.9730 0.95511,3-Diethyl-2-thiourea 0.9864 0.9636 0.88331,3-Dimethyl-2-thiourea 0.9872 0.9596 0.7069Thiourea 0.9699 0.9004 0.3807Propargyl alcohol 0.9735 0.9580 0.9756
36 A.L.d.Q. Baddini et al. / Elect
lar descriptors of general use in the field. Part of this effortas directed toward the search for reliable molecular variables
descriptors) to describe the ICE. Once defined, these variablesould be used to calculate corrosion efficiencies for new molecu-ar structures in a search for chemical structures with a maximumnhibition efficiency value.
Principal component analysis (PCA), simple ordinary leastquares (OLS), second-order cross validation least-squares anal-sis (SOCV-OLS) and partial least-squares analysis (PLS) werearried out for the three single-steel correlations with a com-on inhibition compound set with excellent results. Correlations
btained for OLS were typically in the range 0.99–0.92 for R2,hile a simple PLS with three components produced 0.86–0.882 values. The SOCV-OLS results showed that the usual bestescriptors employed to predict WILA functions were ratherifferent from the best descriptor set selected to describe ICEhrough the OLS models. This is an indication that the best vari-ble set shows a strong dependence on whether the procedure isriented for calibration or validation calculations.
Such diversity of steel types suggests that ordinary statisticalethodologies designed for the single IC/metal interface should
e improved in order to predict ICE of regular inhibitors onifferent metal interfaces. Moreover, such improvement shouldccur at no significant experimental or computational cost, dueo the rather limited experimental data nowadays available.nfortunately, all previous works cited report half-dozen to aozen inhibition corrosion molecules analysis and a single steelurface. Clearly data are missing to the development of suitableransferibility models to predict single and multi-steel ICEs val-es. The aim of the present article is to develop and test two newodels allowing the prediction and fit of inhibition corrosion
amilies on different steel types.This article is the last in a series, with all previous reporting
ingle-steel surfaces, and this one aiming to analyze the multi-teel surface problem concerned to the 23 different inhibitionompounds and three steel surfaces of interest for petroleumndustry.
. Experimental
All inhibition corrosion data were obtained through weightoss experiments based on rectangular steel specimens of.0 cm × 0.5 cm × 0.5 cm dimensions having a central hole. Thexperiments were carried out on cylindrical autoclaves inter-ally coated with teflon. The autoclaves were placed in a rollingven at 60 ◦C for 3 h. All solutions employed 300 mL of HCl15% w/v), 2% w/v of the chemical inhibitor and 0.6% w/v onormaldehyde. The experimental conditions were designed tovoid complete dissolution of the metal plates and to strictlyollow industrial recommendations, for which no more than 2%/v of active components are allowed for matrix acidificationperations. Formaldehyde was employed to minimize hydrogenenetration. These conditions strictly followed those previously
eported [25–27]. The steel specimens were cleaned with ace-one, washed with water, dried and weighed with a 0.0001 grecision. Two results were averaged for each inhibitor. The inhi-ition corrosion efficiencies were calculated through the formula2322
uper-13 7035.57arbon 4800.16
elow:
=(
V0 − V1
V0
)× 100 (1)
here V0 is the blanck corrosion rate and V1 is the inhibitedorrosion rate.
Table 1 lists the uninhibited corrosion rate for all three steeltudied. It is clear from results that the duplex, followed by super-3 are the most affected by corrosion in hydrochloric media.arbon steel, on the contrary, is the one with the least cor-
osion rate. This is well known since these CRA alloys oftenhow greater corrosion rates due to the well-known chloride ioneactions at the molecular interface.
Table 2 lists the corrosion efficiency of the three differentteel types for the 23 inhibitors employed in our study. All exper-ments were carried out with equal inhibitor weights, we used theeight isoesteric Langmuir adsorption function, the WILA func-
ion, defined as ln(θM/(1−θ)) = ln Kads, as the response propertyn QSPR calculations. Hereafter the molecules will be numberedccording Table 2 with Tributylamine in carbon steel being case
-Pentyn-1-ol 0.5628 0.8767 0.9742-Butyn-1-ol 0.9661 0.8963 0.9741-Butyn-1-ol 0.5086 0.7407 0.9592-Butyne-1,4-diol 0.5266 0.6859 0.9441

A.L.d.Q. Baddini et al. / Electrochim
fd
salodepbllitavss
Tme
−
fpblgw
3
M
[bFOulgb(Nbni
mdiCigCtieTwop
iiewpcttpocmdam
mcbCttw
Fig. 1. Corrosion efficiency 3D plots.
ollowed by a letter indicating the steel case (d will denote theuplex steel, s the super-13 and c the carbon steel).
Among the most efficient inhibitors determined for duplexteel we found thiourea derivatives, propargyl alcohol, anilinend diphenylamine. For the super-13 steel we found tributy-amine, aniline and the thiourea derivatives. For the carbon steel,therwise, we found tributylamine, few alcohols and the 1,3-ibutyl-2-thiourea. There is not a single common inhibitor withfficiency larger than 0.96 for all steels and therefore is notossible to protect all steels using a unique set of corrosion inhi-ition. On the other hand, among the less efficient inhibitors theist is more homogeneous and include sec-butylamine, diethy-amine, propylamine, and isopropylamine as the less efficientnhibitors for duplex steel, while 2-butyne-1,4-diol completeshe previous list for super-13. For the carbon steel hexylamine,nd 1,3-dimethyl-2-thiourea and the thiourea completes the pre-ious list. It is clear from the ICEs analysis that the duplex is theteel with the least inhibition, followed by super-13. Among allteel types the carbon is the one with the largest inhibition.
Empirically placing the percentual (%) data presented inable 2 on a 3D graph it is clear that 18 from the original 23olecular inhibitors follows a clear 3D straight line given by the
quation below:
1.000Θduplex − 0.206ΘS13 + 0.403Θcarbon = −75.794 (2)
From the original inhibition set five molecules were excludedrom this fit, thiourea, 1,3-dimethyl-2-thiourea, 2-butyn-1-ol, 2-entyn-1-ol and 2-butyne-1,4-diol clearly showed an outlinerehavior. Among the other inhibitors the accordance was excel-ent with 2.7% of deviation in average. Fig. 1 shows the 3Draphs with an excellent fit. No clear theoretical justificationas established.
. Theoretical calculations
All calculations employed AM1 methodology as coded inopac 6.0 [28] for most of the quantum variables, PCMODEL
meit
ica Acta 53 (2007) 434–446 437
29] for the volume calculations, and the QSPR program, codedy Fedders and co-workers, and obtained at internet [30]. Theedder’s program has been adapted in our laboratory for SOCV-LS analysis. In this work, we employed the same variable setsed in our previous study [25–27], and these include the fol-owing group contribution variable: A1 is the number of RNH2roups; A2 is the number of R1R2NH groups; A3 is the num-er of R1R2R3N groups; NB is the number of phenyl groupsstructurally isolated); NC is the number of cyclic carbon rings;CS is the number of CS bonds; NT is the number of triple CConds; NOH is the number of OH groups; NCR is the averageumber of carbon atoms; NR is the branching number, while Ns the inhibitor number of moles present in the vessel.
For the quantum descriptors, similarly, we employed the sameolecular variables used in a previous study [25–27]: ED is the
imerization energy; M is the molecular IC mass; P is the polar-zability given in atomic units; C is the charge of the polar group;1 is the charge of the S, N and triple CC adsorption site; C2
s the charge of the aromatic ring (or on its absence the polarroup charge); C12 is the charge of two atoms of the polar group;13 is the charge of the three atoms of the polar group; C14 is
he charge of the four adjacent atoms to the polar group; EHs the homo energy; EL is the lumo energy; Dif is the differ-nce EL–EH; DP is the dipole, and V is the calculated volume.he quantum descriptors sum up to 14 descriptors, while thehole set employs 25 molecular descriptors. The values for theverall quantum and group contribution descriptors have beenreviously published [25–27] and will not be reported here.
As required for the modeling of metal/inhibitor process somenformation must be provided about the metallic phase and thenterface, allowing the statistical model to recognize its rel-vance. Although, in principle, a genuine interfacial variableould be preferable, like electrode potentials at 60 ◦C, interfaceroperties calculated through ab initio methods, polarizationurves, isotherm data and Nyquist properties, we must recognizehat most of these variables often requires substantial evalua-ion work. Depending on the data, once obtained, they usuallyrovide an order of magnitude more information than the onebtained with regular statistical methods. Therefore, under thisircumstances it would be of best economy if an alternativeodel could be designed using only molecular and metallic
ata. This procedure would guarantee direct transferibility fromll the measurements employing a common metal or inhibitorolecule.In this study, due to extensive previous work on single-
etallic interface, we decided to add variables of metallic-onlyharacter. Few variables related to steel composition like the car-on content (C%), and many related variables like Si, Mn, P, S,r, Ni, Mo and N will be employed as metallic variables. Besides
he electrode potential of the metallic phase in hydrochloric solu-ion (in absence of the inhibitor) and the blank corrosion rateere added. Table 3 presents its numerical values.Preliminary calculations with the strictly molecular and
etallic variables provides a total of 35 variables for 69 dataxperiments, clearly showed not reliable fits. Of course theres no mathematical correlation between the strictly metallic orhe strictly inhibitor descriptors with a property that is inter-
438 A.L.d.Q. Baddini et al. / Electrochimica Acta 53 (2007) 434–446
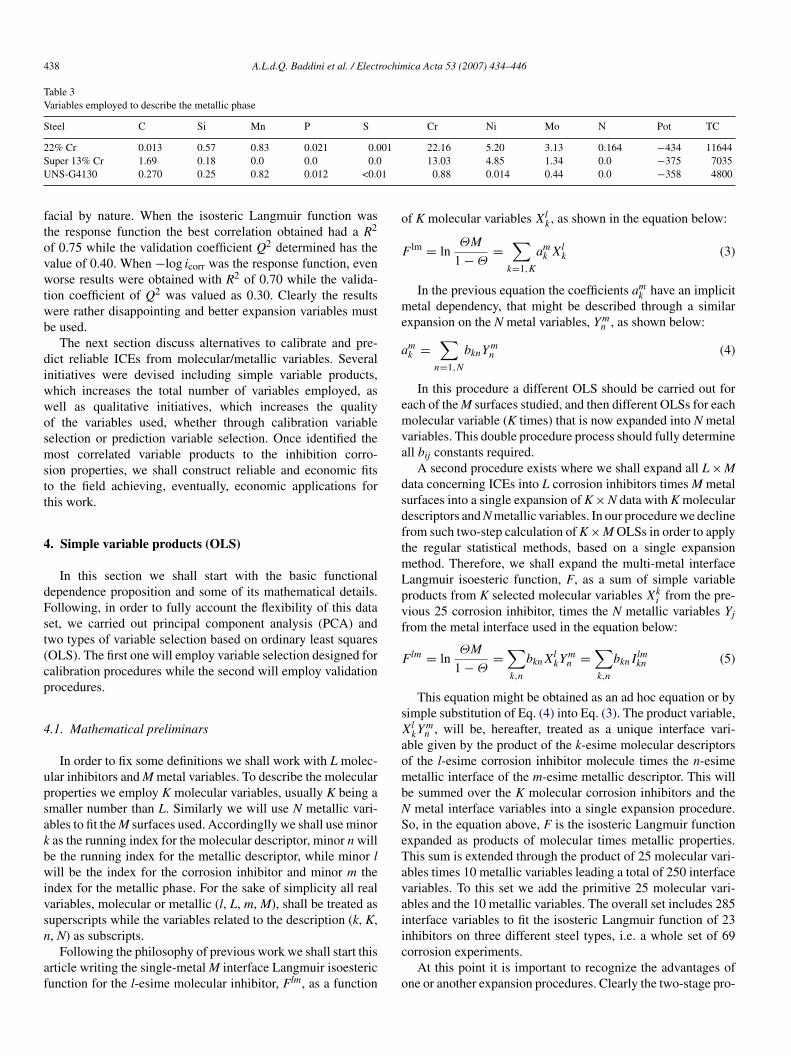
Table 3Variables employed to describe the metallic phase
Steel C Si Mn P S Cr Ni Mo N Pot TC
2 01SU 1
ftovwtwb
diwwosmstt
4
dFst(cp
4
upsakbwivsn
af
o
F
me
a
emva
dsdftmLpvf
F
sX
aombNSeTavai
2% Cr 0.013 0.57 0.83 0.021 0.0uper 13% Cr 1.69 0.18 0.0 0.0 0.0NS-G4130 0.270 0.25 0.82 0.012 <0.0
acial by nature. When the isosteric Langmuir function washe response function the best correlation obtained had a R2
f 0.75 while the validation coefficient Q2 determined has thealue of 0.40. When −log icorr was the response function, evenorse results were obtained with R2 of 0.70 while the valida-
ion coefficient of Q2 was valued as 0.30. Clearly the resultsere rather disappointing and better expansion variables muste used.
The next section discuss alternatives to calibrate and pre-ict reliable ICEs from molecular/metallic variables. Severalnitiatives were devised including simple variable products,hich increases the total number of variables employed, asell as qualitative initiatives, which increases the qualityf the variables used, whether through calibration variableelection or prediction variable selection. Once identified theost correlated variable products to the inhibition corro-
ion properties, we shall construct reliable and economic fitso the field achieving, eventually, economic applications forhis work.
. Simple variable products (OLS)
In this section we shall start with the basic functionalependence proposition and some of its mathematical details.ollowing, in order to fully account the flexibility of this dataet, we carried out principal component analysis (PCA) andwo types of variable selection based on ordinary least squaresOLS). The first one will employ variable selection designed foralibration procedures while the second will employ validationrocedures.
.1. Mathematical preliminars
In order to fix some definitions we shall work with L molec-lar inhibitors and M metal variables. To describe the molecularroperties we employ K molecular variables, usually K being amaller number than L. Similarly we will use N metallic vari-bles to fit the M surfaces used. Accordinglly we shall use minoras the running index for the molecular descriptor, minor n wille the running index for the metallic descriptor, while minor lill be the index for the corrosion inhibitor and minor m the
ndex for the metallic phase. For the sake of simplicity all realariables, molecular or metallic (l, L, m, M), shall be treated asuperscripts while the variables related to the description (k, K,
, N) as subscripts.Following the philosophy of previous work we shall start thisrticle writing the single-metal M interface Langmuir isoestericunction for the l-esime molecular inhibitor, Flm, as a function
ic
o
22.16 5.20 3.13 0.164 −434 1164413.03 4.85 1.34 0.0 −375 7035
0.88 0.014 0.44 0.0 −358 4800
f K molecular variables Xlk, as shown in the equation below:
lm = lnΘM
1 − Θ=
∑k=1,K
amk Xl
k (3)
In the previous equation the coefficients amk have an implicit
etal dependency, that might be described through a similarxpansion on the N metal variables, Ym
n , as shown below:
mk =
∑n=1,N
bknYmn (4)
In this procedure a different OLS should be carried out forach of the M surfaces studied, and then different OLSs for eacholecular variable (K times) that is now expanded into N metal
ariables. This double procedure process should fully determinell bij constants required.
A second procedure exists where we shall expand all L × Mata concerning ICEs into L corrosion inhibitors times M metalurfaces into a single expansion of K × N data with K molecularescriptors and N metallic variables. In our procedure we declinerom such two-step calculation of K × M OLSs in order to applyhe regular statistical methods, based on a single expansion
ethod. Therefore, we shall expand the multi-metal interfaceangmuir isoesteric function, F, as a sum of simple variableroducts from K selected molecular variables Xk
i from the pre-ious 25 corrosion inhibitor, times the N metallic variables Yj
rom the metal interface used in the equation below:
lm = lnΘM
1 − Θ=
∑k,n
bknXlkY
mn =
∑k,n
bknIlmkn (5)
This equation might be obtained as an ad hoc equation or byimple substitution of Eq. (4) into Eq. (3). The product variable,lkY
mn , will be, hereafter, treated as a unique interface vari-
ble given by the product of the k-esime molecular descriptorsf the l-esime corrosion inhibitor molecule times the n-esimeetallic interface of the m-esime metallic descriptor. This will
e summed over the K molecular corrosion inhibitors and themetal interface variables into a single expansion procedure.
o, in the equation above, F is the isosteric Langmuir functionxpanded as products of molecular times metallic properties.his sum is extended through the product of 25 molecular vari-bles times 10 metallic variables leading a total of 250 interfaceariables. To this set we add the primitive 25 molecular vari-bles and the 10 metallic variables. The overall set includes 285nterface variables to fit the isosteric Langmuir function of 23
nhibitors on three different steel types, i.e. a whole set of 69orrosion experiments.At this point it is important to recognize the advantages ofne or another expansion procedures. Clearly the two-stage pro-

rochim
ctpslet
asd
E
e
E
ttcdcmt
t
fi
salastsh
4
cvfitd
aBvcnwt
dt((g2se(CCcfcneot
pduplex steel cluster placed apart in the plot. Among each clusteramines, thiourea derivatives and benzyl compounds have beeneasily clustered and identified.
A.L.d.Q. Baddini et al. / Elect
edure, Eqs. (3) and (4), seems to be the prefered algorithm inhe computer programs since it offers a better cost and a sim-le coding algorithm. The single-step expansion, however, istrongly coupled to standard statistical methods like PCA, regu-ar OLS, PLS and many others, being the prefered route to thoseducated with a general experience and provided by any robustool analysis found in the literature.
In order to show the mathematical equivalence between theselternatives let us define two error functionals. The first one is theingle-metal interface error, defined as regular sum of squaredeviations, as below:
m =∑
l=1,L
⎛⎝Flm −
∑k=1,K
amk Xl
k
⎞⎠
2
=∑
i=1,L
(εlm)2
(6)
and the total error as the sum of all single-metal interfacerrors:
T =∑
m=1,M
Em (7)
In order to prove a mathematical equivalence between thesewo procedures would be a suficient condition to prove thathe derivative of both functionals with respect to its variationaloefficient would cancel simultaneously. Actually expanding theerivative of the multi-metal error with respect to its variationaloefficients (bij) and recognizing the derivative of the single-etal with respect to its variational coefficients (am
i ) are relatedhrough the equation below:
∂ET
∂bkn
= −2∑
m=1,M
∑l=1,L
∑k,n
XlkY
mn εlm = −2
∑k,n
Ymn
∑m
∑l
Xlkε
lm
=∑k,n
Ymn
∑m
(∂Em
∂amk
)= 0 (8)
This result clearly allows the recognition of the derivative ofhe phase error with respect to the am
k variable, shown below:
∂Em
∂amk
= −2∑
l=1,L
Xlkε
lm = 0 (9)
Recognizing this derivative one might re-write Eq. (8) on thenal form bellow:
∂ET
∂bkn
= −2∑k,n
Ymn
∑m
Xlkε
ml =
∑k,n
Ymn
∑m
(∂Em
∂amk
)= 0 (10)
This result clearly indicates that the minima determined foringle-metal interfaces, achieved with respect to Eq. (9), is ancceptable minima for the general expansion. The reverse prob-
em, “is the solution of the general problem a similar solution ofll metal-interfaces?” is a more complicated question. Howeverince its solution is unique we should conclude that they arehe same. So, inasmuch of whether path is chosen, the single-tep or the two-step are mathematically equivalent and therefore,ereafter in this article, we shall employ the single-step analysis.ica Acta 53 (2007) 434–446 439
.2. Principal component analysis (PCA)
In order to fully account the flexibility of this data set wearried out principal component analysis (PCA) and two sets ofariable selections based on ordinary least squares (OLS). Therst one will employ variable selection designed for calibra-
ion procedures while the second will employ selection variableesigned for validation procedures.
All variable interfaces and the primary variables have beennalyzed through the PCA method with the use of UNSCRAM-LER 6.11 [31] program employing self-scaled and centeredariables. For the simple product proposition the three mainomponents sums up to 50.0% of the total data variation. Thisumber shows a small information concentration, especiallyhen compared to the 56.2%, the total variation obtained of
he three main components for the primary variables only.The structure of the components is very illustrative of the data
ispersion. The main component (PC1; 22.4%) has a major con-ribution of the silicon concentration (Si), nitrogen concentrationNitr), the product of homo energy and nitrogen compositionEHNitr) and the product of the homo–lumo gap times the nitro-en composition (DifNitr). For the second component (PC2;1,0%) the major contribution comes from charge of the firstite (C1), the product of the charge of the first site times thelectrode potential at 60 ◦C (C1Pot), product of the CS bondsC1Pot) with the electrode potential (CSPot) and the product ofS bonds with the corrosion rate (CSTC) and the product ofS bonds times the silicon concentration (CSSi). For the thirdomponent (PC3; 12,8%) significant contribution was foundor magnesium and nickel concentration (Mg, Ni), product ofharges and the nickel concentration (C1Ni), product of mag-esium and the homo energy (EHMn) and the product of thenergy gap to the nickel concentration (DifNi). As observed,nce determined a variable with major importance, it was usualo observe its products with large importance variables as well.
The PC1 × PC2 scoring plot is presented in Fig. 2. From thelot it is clear a well-characterized segregation pattern with the
Fig. 2. Score plots for PC2 × PC1 main components.
4 rochim
aifioam
pptiihVtswfc
4c
apnpeafaF
cf
F(a
wocndtatotf
fi6ccinNE
l
40 A.L.d.Q. Baddini et al. / Elect
The well-characterized structure for all clusters shows PCAs an excellent tool for inhibition corrosion analysis. Actuallyt is interesting we have not find a single molecule across itsamily borders. Besides, within the carbon and super-13 clustert was noticeable the segregation of several clear subclustersf amines, propargylic alcohol and derivatives, molecules withromatic rings and a third cluster with thiourea and its derivativesolecules.For the sake of paper size we shall not present other PCA
lots. However we must comment few points observed on otherlots. On PC3 × PC2 we see three clusters of negative, neu-ral and positive values for PC3 for super-13, duplex and carbonnhibitors. Along this clusters all molecules behaved well withints family boundaries, with a clear and unconnected clusterighly valuable as a characterization tool in corrosion studies.ery few exceptions occurred. For this plot we observed clearly
he formation of the sub-clusters above mentioned within eachteel cluster. On the final PC3 × PC1 plot three main clustersere assigned to the steel types based on the PC3 values. There-
ore we should point out PCA as a valuable statistical tool forluster analysis and classification on corrosion studies.
.3. Variable selection based on ordinary least squaresalibration
In order to assess the physical/chemical most relevant vari-bles of the adsorption and corrosion inhibition process, we shallresent results for a simple, although very informative, ordi-ary least-squares analysis coupled to a simple variable selectionrocedure. The principles of this analysis have been describedlsewhere, and we shall not discuss here, but it employs centerednd self-scaled variables with the WILA function as the responseunction. All 23 molecules were employed in the fit. The vari-tions of calibration and validation coefficients are shown in
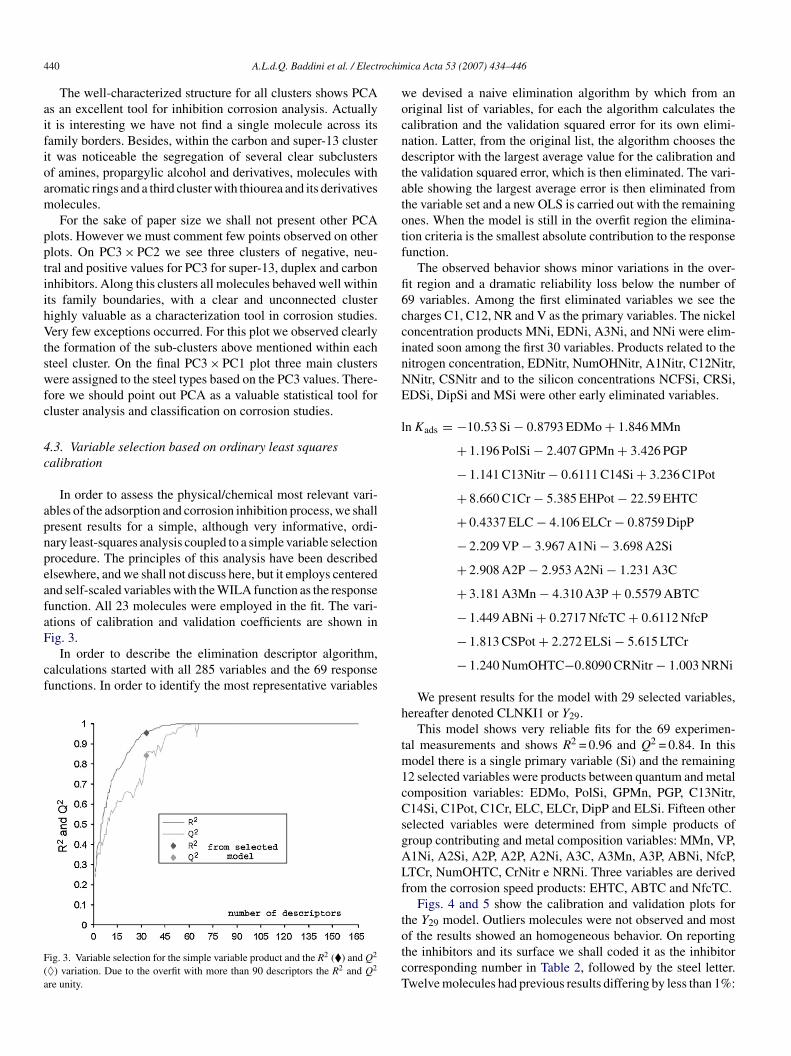
ig. 3.In order to describe the elimination descriptor algorithm,alculations started with all 285 variables and the 69 responseunctions. In order to identify the most representative variables
ig. 3. Variable selection for the simple variable product and the R2 (�) and Q2
♦) variation. Due to the overfit with more than 90 descriptors the R2 and Q2
re unity.
h
tm1cCsgALf
totcT
ica Acta 53 (2007) 434–446
e devised a naive elimination algorithm by which from anriginal list of variables, for each the algorithm calculates thealibration and the validation squared error for its own elimi-ation. Latter, from the original list, the algorithm chooses theescriptor with the largest average value for the calibration andhe validation squared error, which is then eliminated. The vari-ble showing the largest average error is then eliminated fromhe variable set and a new OLS is carried out with the remainingnes. When the model is still in the overfit region the elimina-ion criteria is the smallest absolute contribution to the responseunction.
The observed behavior shows minor variations in the over-t region and a dramatic reliability loss below the number of9 variables. Among the first eliminated variables we see theharges C1, C12, NR and V as the primary variables. The nickeloncentration products MNi, EDNi, A3Ni, and NNi were elim-nated soon among the first 30 variables. Products related to theitrogen concentration, EDNitr, NumOHNitr, A1Nitr, C12Nitr,Nitr, CSNitr and to the silicon concentrations NCFSi, CRSi,DSi, DipSi and MSi were other early eliminated variables.
n Kads = −10.53 Si − 0.8793 EDMo + 1.846 MMn
+ 1.196 PolSi − 2.407 GPMn + 3.426 PGP
− 1.141 C13Nitr − 0.6111 C14Si + 3.236 C1Pot
+ 8.660 C1Cr − 5.385 EHPot − 22.59 EHTC
+ 0.4337 ELC − 4.106 ELCr − 0.8759 DipP
− 2.209 VP − 3.967 A1Ni − 3.698 A2Si
+ 2.908 A2P − 2.953 A2Ni − 1.231 A3C
+ 3.181 A3Mn − 4.310 A3P + 0.5579 ABTC
− 1.449 ABNi + 0.2717 NfcTC + 0.6112 NfcP
− 1.813 CSPot + 2.272 ELSi − 5.615 LTCr
− 1.240 NumOHTC−0.8090 CRNitr − 1.003 NRNi
We present results for the model with 29 selected variables,ereafter denoted CLNKI1 or Y29.
This model shows very reliable fits for the 69 experimen-al measurements and shows R2 = 0.96 and Q2 = 0.84. In this
odel there is a single primary variable (Si) and the remaining2 selected variables were products between quantum and metalomposition variables: EDMo, PolSi, GPMn, PGP, C13Nitr,14Si, C1Pot, C1Cr, ELC, ELCr, DipP and ELSi. Fifteen other
elected variables were determined from simple products ofroup contributing and metal composition variables: MMn, VP,1Ni, A2Si, A2P, A2P, A2Ni, A3C, A3Mn, A3P, ABNi, NfcP,TCr, NumOHTC, CrNitr e NRNi. Three variables are derivedrom the corrosion speed products: EHTC, ABTC and NfcTC.
Figs. 4 and 5 show the calibration and validation plots forhe Y29 model. Outliers molecules were not observed and most
f the results showed an homogeneous behavior. On reportinghe inhibitors and its surface we shall coded it as the inhibitororresponding number in Table 2, followed by the steel letter.welve molecules had previous results differing by less than 1%: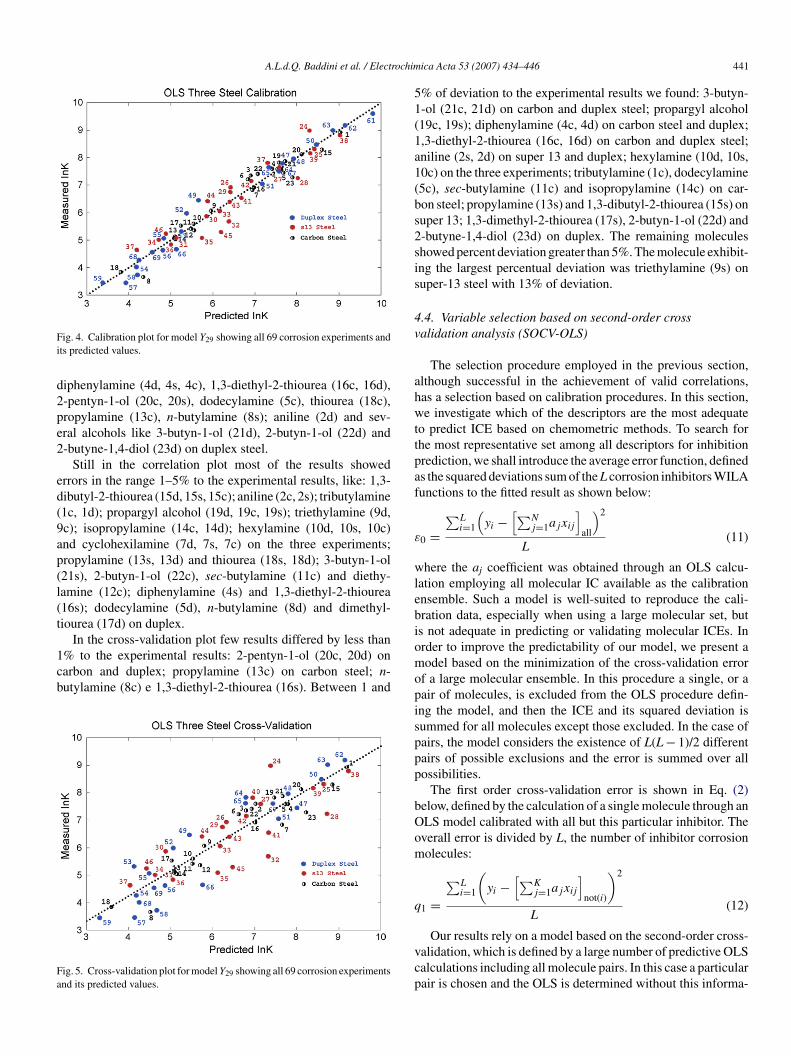
A.L.d.Q. Baddini et al. / Electrochim
Fi
d2pe2
ed(9ap(l(t
1cb
Fa
51(1a1(bs2sis
4v
ahwttpaf
ε
wlebi
ig. 4. Calibration plot for model Y29 showing all 69 corrosion experiments andts predicted values.
iphenylamine (4d, 4s, 4c), 1,3-diethyl-2-thiourea (16c, 16d),-pentyn-1-ol (20c, 20s), dodecylamine (5c), thiourea (18c),ropylamine (13c), n-butylamine (8s); aniline (2d) and sev-ral alcohols like 3-butyn-1-ol (21d), 2-butyn-1-ol (22d) and-butyne-1,4-diol (23d) on duplex steel.
Still in the correlation plot most of the results showedrrors in the range 1–5% to the experimental results, like: 1,3-ibutyl-2-thiourea (15d, 15s, 15c); aniline (2c, 2s); tributylamine1c, 1d); propargyl alcohol (19d, 19c, 19s); triethylamine (9d,c); isopropylamine (14c, 14d); hexylamine (10d, 10s, 10c)nd cyclohexilamine (7d, 7s, 7c) on the three experiments;ropylamine (13s, 13d) and thiourea (18s, 18d); 3-butyn-1-ol21s), 2-butyn-1-ol (22c), sec-butylamine (11c) and diethy-amine (12c); diphenylamine (4s) and 1,3-diethyl-2-thiourea16s); dodecylamine (5d), n-butylamine (8d) and dimethyl-iourea (17d) on duplex.
In the cross-validation plot few results differed by less than
% to the experimental results: 2-pentyn-1-ol (20c, 20d) onarbon and duplex; propylamine (13c) on carbon steel; n-utylamine (8c) e 1,3-diethyl-2-thiourea (16s). Between 1 andig. 5. Cross-validation plot for model Y29 showing all 69 corrosion experimentsnd its predicted values.
omopisppp
bOom
q
vcp
ica Acta 53 (2007) 434–446 441
% of deviation to the experimental results we found: 3-butyn--ol (21c, 21d) on carbon and duplex steel; propargyl alcohol19c, 19s); diphenylamine (4c, 4d) on carbon steel and duplex;,3-diethyl-2-thiourea (16c, 16d) on carbon and duplex steel;niline (2s, 2d) on super 13 and duplex; hexylamine (10d, 10s,0c) on the three experiments; tributylamine (1c), dodecylamine5c), sec-butylamine (11c) and isopropylamine (14c) on car-on steel; propylamine (13s) and 1,3-dibutyl-2-thiourea (15s) onuper 13; 1,3-dimethyl-2-thiourea (17s), 2-butyn-1-ol (22d) and-butyne-1,4-diol (23d) on duplex. The remaining moleculeshowed percent deviation greater than 5%. The molecule exhibit-ng the largest percentual deviation was triethylamine (9s) onuper-13 steel with 13% of deviation.
.4. Variable selection based on second-order crossalidation analysis (SOCV-OLS)
The selection procedure employed in the previous section,lthough successful in the achievement of valid correlations,as a selection based on calibration procedures. In this section,e investigate which of the descriptors are the most adequate
o predict ICE based on chemometric methods. To search forhe most representative set among all descriptors for inhibitionrediction, we shall introduce the average error function, defineds the squared deviations sum of the L corrosion inhibitors WILAunctions to the fitted result as shown below:
0 =∑L
i=1
(yi −
[∑Nj=1ajxij
]all
)2
L(11)
here the aj coefficient was obtained through an OLS calcu-ation employing all molecular IC available as the calibrationnsemble. Such a model is well-suited to reproduce the cali-ration data, especially when using a large molecular set, buts not adequate in predicting or validating molecular ICEs. Inrder to improve the predictability of our model, we present aodel based on the minimization of the cross-validation error
f a large molecular ensemble. In this procedure a single, or aair of molecules, is excluded from the OLS procedure defin-ng the model, and then the ICE and its squared deviation isummed for all molecules except those excluded. In the case ofairs, the model considers the existence of L(L − 1)/2 differentairs of possible exclusions and the error is summed over allossibilities.
The first order cross-validation error is shown in Eq. (2)elow, defined by the calculation of a single molecule through anLS model calibrated with all but this particular inhibitor. Theverall error is divided by L, the number of inhibitor corrosionolecules:
1 =∑L
i=1
(yi −
[∑Kj=1ajxij
]not(i)
)2
L(12)
Our results rely on a model based on the second-order cross-alidation, which is defined by a large number of predictive OLSalculations including all molecule pairs. In this case a particularair is chosen and the OLS is determined without this informa-

4 rochimica Acta 53 (2007) 434–446
tmpndeo
q
steid
tmIteaesvltwwae
mmc
Fvf
Table 4Selected variables with major significance to the OLS model on the three steels
Importance Duplex Super-13 Carbon
1 NCS V EL2 Dip C2 Dif3 EL C NCS4 NOH P EH5 EH NCS M6 C2 EH NB7 C Dip C8 NB NCR P
1
clm(pv
msmt(ts
seics
42 A.L.d.Q. Baddini et al. / Elect
ion. The response function is then evaluated for these pair ofolecules and the errors are summed up to include all possible
airs in the molecular set. In our case, considering the origi-al 69 experimental corrosion measurements, there exist 2415ifferent molecular pairs and the second-order cross-validationrror sums up all these 2415 bootstraps. The average secondrder cross-validation error is shown below:
2 =2∑L
i,j=1
(yi −
[∑Kk=1akxik
]not(i,j)
)2
L(L − 1)(13)
The effect of successive variable additions to the descriptoret on an OLS calculation is well known. Usually the calibra-ion error decreases together with the first order cross-validationrror, while the second order cross-validation error shows anrregular behavior with an initial lowering followed by a clearivergence for a large descriptor number.
In order to determine the most representative set of descrip-ors to describe the inhibition efficiency, we developed a simple
odel based on single descriptor additions to a previous set.n this procedure, we start with the best-correlated descriptoro the response function, and then a single descriptor is added,ach iteration, to the previous descriptor list. On a particular iter-tion, the second order cross-validation error is calculated forach descriptor addition, and the model employs the one whichhows the smallest second-order cross-validation error. For eachariable selection, the model carries out 2415 × 285 OLS calcu-ations, i.e. 688275 bootstrap calculations, choosing the set withhe smallest predictive error. The procedure is then continuedith successive single additions of several descriptors until thehole set with 69 descriptors is obtained. Fig. 6 shows the vari-
tion of calibration, the first and second-order cross-validationrrors plotted against the number of descriptors.
The difference with the calibration descriptor set deter-ined in the previous section is noticeable. Among the fiveost important descriptors associated with the second-order
ross-validation procedure, we find only the mass as a single
ig. 6. Variation of calibration, first-order validation and second-order cross-alidation errors for all 69 corrosion measurements. The curve below is for E0,ollowed by Q1 and Q2.
ibbotv
F
9 M A1 Dip0 C12 A2 A1
ommon descriptor. Among the ten best predictive and corre-ation descriptors, we find only three common descriptors the
ass (M), the charge between two atoms (C12) and the chargeC). Therefore we might conclude that, rule of a thumb, the bestredictive descriptors should be different from those based onariable selection from calibration calculations.
Among the five best predictive descriptors are the molecularass (M), the product between homo energy times the corrosion
peed (HTC), the product of the number of fused cycles and theanganese metal concentration (NFCMn) and the product of
he number of fused cycles with the nitrogen metal concentrationNFCNitr). As noticed previously there are no common variableso those found in Table 4 or to the ones determined in the previousection.
Fig. 7 shows the behavior of the calibration, first andecond-order cross-validation errors. The result shows anxpected behavior. The calibration error ε0 lowers with thencreasing number of descriptors and similarly the first orderross-validation shows a slight decrease. Alternatively theecond-order cross-validation error tends to diminish and thenncrease later with a large descriptor number. This result shoulde credited to the great flexibility that functions with a large num-er of descriptors have to fit the calibration ensemble, known as
verfit process. Usually this pattern presents optimal results forhe calibration with the complete lack of sensibility to averagealues, required on predictive procedure.ig. 7. Calibration plot for model Q29 based on SOCV-OLS variable selection.
A.L.d.Q. Baddini et al. / Electrochim
F
aFvcpS
vb
l
vQsv
rfc1abQ
5m
dtvscpiuv
mlsolaac
5
uintthr(tTTPMNNNv
ttvECDDTt
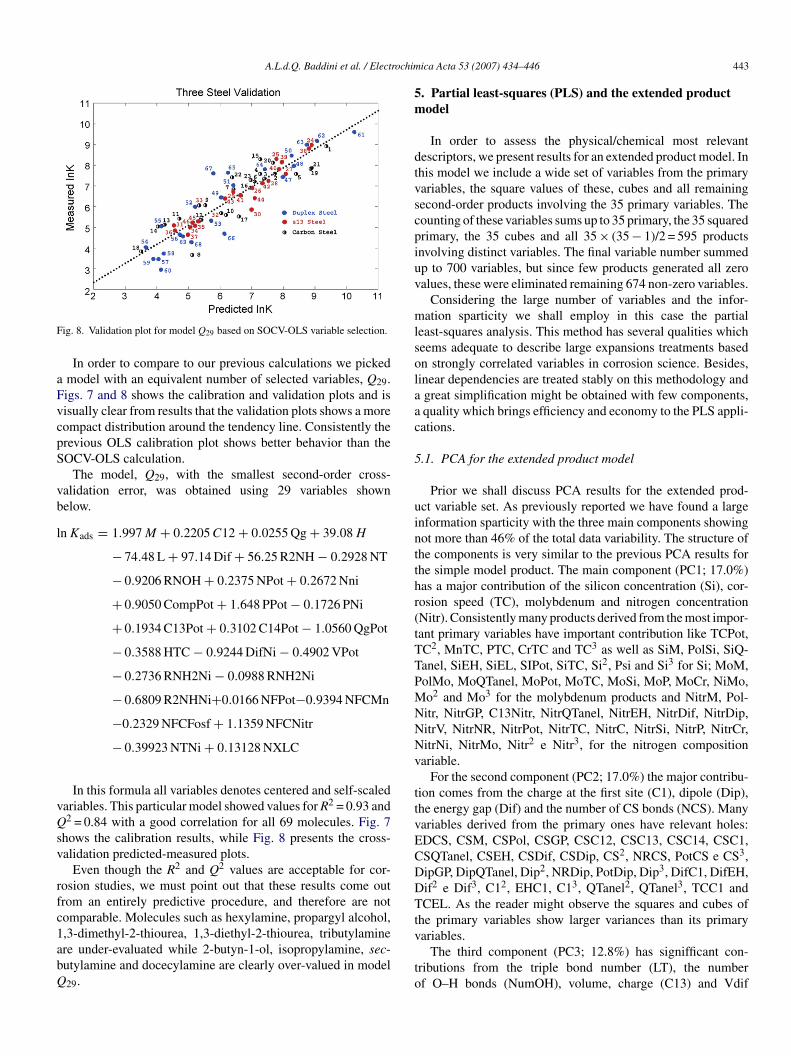
ig. 8. Validation plot for model Q29 based on SOCV-OLS variable selection.
In order to compare to our previous calculations we pickedmodel with an equivalent number of selected variables, Q29.igs. 7 and 8 shows the calibration and validation plots and isisually clear from results that the validation plots shows a moreompact distribution around the tendency line. Consistently therevious OLS calibration plot shows better behavior than theOCV-OLS calculation.
The model, Q29, with the smallest second-order cross-alidation error, was obtained using 29 variables shownelow.
n Kads = 1.997 M + 0.2205 C12 + 0.0255 Qg + 39.08 H
− 74.48 L + 97.14 Dif + 56.25 R2NH − 0.2928 NT
− 0.9206 RNOH + 0.2375 NPot + 0.2672 Nni
+ 0.9050 CompPot + 1.648 PPot − 0.1726 PNi
+ 0.1934 C13Pot + 0.3102 C14Pot − 1.0560 QgPot
− 0.3588 HTC − 0.9244 DifNi − 0.4902 VPot
− 0.2736 RNH2Ni − 0.0988 RNH2Ni
− 0.6809 R2NHNi+0.0166 NFPot−0.9394 NFCMn
−0.2329 NFCFosf + 1.1359 NFCNitr
− 0.39923 NTNi + 0.13128 NXLC
In this formula all variables denotes centered and self-scaledariables. This particular model showed values for R2 = 0.93 and2 = 0.84 with a good correlation for all 69 molecules. Fig. 7
hows the calibration results, while Fig. 8 presents the cross-alidation predicted-measured plots.
Even though the R2 and Q2 values are acceptable for cor-osion studies, we must point out that these results come outrom an entirely predictive procedure, and therefore are notomparable. Molecules such as hexylamine, propargyl alcohol,
,3-dimethyl-2-thiourea, 1,3-diethyl-2-thiourea, tributylaminere under-evaluated while 2-butyn-1-ol, isopropylamine, sec-utylamine and docecylamine are clearly over-valued in model29.v
to
ica Acta 53 (2007) 434–446 443
. Partial least-squares (PLS) and the extended productodel
In order to assess the physical/chemical most relevantescriptors, we present results for an extended product model. Inhis model we include a wide set of variables from the primaryariables, the square values of these, cubes and all remainingecond-order products involving the 35 primary variables. Theounting of these variables sums up to 35 primary, the 35 squaredrimary, the 35 cubes and all 35 × (35 − 1)/2 = 595 productsnvolving distinct variables. The final variable number summedp to 700 variables, but since few products generated all zeroalues, these were eliminated remaining 674 non-zero variables.
Considering the large number of variables and the infor-ation sparticity we shall employ in this case the partial
east-squares analysis. This method has several qualities whicheems adequate to describe large expansions treatments basedn strongly correlated variables in corrosion science. Besides,inear dependencies are treated stably on this methodology andgreat simplification might be obtained with few components,quality which brings efficiency and economy to the PLS appli-ations.
.1. PCA for the extended product model
Prior we shall discuss PCA results for the extended prod-ct variable set. As previously reported we have found a largenformation sparticity with the three main components showingot more than 46% of the total data variability. The structure ofhe components is very similar to the previous PCA results forhe simple model product. The main component (PC1; 17.0%)as a major contribution of the silicon concentration (Si), cor-osion speed (TC), molybdenum and nitrogen concentrationNitr). Consistently many products derived from the most impor-ant primary variables have important contribution like TCPot,C2, MnTC, PTC, CrTC and TC3 as well as SiM, PolSi, SiQ-anel, SiEH, SiEL, SIPot, SiTC, Si2, Psi and Si3 for Si; MoM,olMo, MoQTanel, MoPot, MoTC, MoSi, MoP, MoCr, NiMo,o2 and Mo3 for the molybdenum products and NitrM, Pol-itr, NitrGP, C13Nitr, NitrQTanel, NitrEH, NitrDif, NitrDip,itrV, NitrNR, NitrPot, NitrTC, NitrC, NitrSi, NitrP, NitrCr,itrNi, NitrMo, Nitr2 e Nitr3, for the nitrogen compositionariable.
For the second component (PC2; 17.0%) the major contribu-ion comes from the charge at the first site (C1), dipole (Dip),he energy gap (Dif) and the number of CS bonds (NCS). Manyariables derived from the primary ones have relevant holes:DCS, CSM, CSPol, CSGP, CSC12, CSC13, CSC14, CSC1,SQTanel, CSEH, CSDif, CSDip, CS2, NRCS, PotCS e CS3,ipGP, DipQTanel, Dip2, NRDip, PotDip, Dip3, DifC1, DifEH,if2 e Dif3, C12, EHC1, C13, QTanel2, QTanel3, TCC1 andCEL. As the reader might observe the squares and cubes of
he primary variables show larger variances than its primary
ariables.The third component (PC3; 12.8%) has signifficant con-ributions from the triple bond number (LT), the numberf O–H bonds (NumOH), volume, charge (C13) and Vdif

4 rochimica Acta 53 (2007) 434–446
wwLLHNNN
vAsPdiastro
5
ecavbc
itpdlecC
Fv
F
tva
FpAa((ctaw(2(l
44 A.L.d.Q. Baddini et al. / Elect
ere very important in the data variation. Its productsere also very influent like: NLT, LTM, LTPol, LTGP,TC12, LT14, LTQTanel, LTEH, LTDif, LTEL, LTDip,TV, LT2, NumOHN, NumOHM, NumOHPol, NumO-GP, NumOHC12, NumOHC13, NumOHC1, NumOHQTanel,umOHEH, NumOHEL, NumOHDif, NumOHDip, NumOHV,umOHLT, PotLT, NumOHPot, NumOHTC, LT3, SiLT, andumOHSi.Several score plots were analyzed with most of then showing
ery similar results to the ones obtained in the previous sections.lthough we must present few comments the plots will not be
hown in this article and might be obtained upon request. ForC1 × PC2 it was observed a clear cluster pattern with all duplexata appart from the ones of super-13 and carbon steel. Actuallyn this case most of the data related to super-13 and carbon steelppeared mixed without a clear resolution presented on previouscoring plots. Even though the cluster is more diffuse in this casehan in the previous it is our conclusion that PCA offers a veryeliable source of information on the corrosion process natureccuring at the surface.
.2. PLS for the extended model
In this step we used the UNSCRAMBLER 6.11 [31] programmploying all 674 data variables and allowing the program tohoose the best number of components for the WILA functions the response function. Fig. 9 shows the plot of the residualallidation variance and its variation with the component num-er. This graph indicates the number of seven as the number ofomponents showing the smallest error for the PLS method.
Unfortunately the large number of variables employed (675)mposes limits to the discussion of the component composi-ion. In order to determine the most relevant results we shallresent the regression coefficients plot and its variation with theescriptor number in Fig. 10. The variables with the major abso-
ute contribution are derived from products with dimerizationnergy (ED), number of C–S bonds, nickel and cromium con-entrations like: EDLT, EDNumOH, CrNumOH, NiNumOH,rCS, NiCS, MoCS e NitrCS. In this particular case most ofig. 9. Residual validation variance for the PLS calculation carried out with 675ariables.
(bo
F6o
ig. 10. Regression coefficients for the PLS calculation with 675 variables.
he major variables were products from molecular and inhibitorariables. Although suggestive, it was not possible to establishny correlation to the adsorption mechanism.
The correlation and validation plots are shown inigs. 11 and 12. Most of the molecules present average absoluteercent deviation between 1 and 5%, with an average of 3.10%.mong the molecules with a perfect match between experiment
nd modelling we found cyclohexilamine (7s, 7d); 3-butyn-1,ol21c), tributylamine (1s), di-n-butylamine (6s), diphenylamine4s), propylamine (13s) and 1,3-diethyl-2-thiourea (16s); dode-ylamine (5d) and thiourea (18d). The molecule most apart fromhe straigth line was 2-butyn-1-ol (22d) showing an percent aver-ge deviation of 28%. Other molecules apart for more than 5%,ere: sec-butylamine (11s); n-octylamine (3d); isopropylamine
14d); 1,3-dibutyl-2-thiourea (15d) and propargyl alcohol (19d);-pentyn-1-ol (20d); 2-butyn-1-ol (21d); 1,3-diethyl-2-thiourea16s); n-butylamine (8c); thiourea (18c); aniline (2s) dodecy-amine (5s); hexylamine (10s); triethylamine (9d); diethylamine
12d); propylamine (13d); 1,3-dimethyl-2-thiourea (17d) and 3-utyn-1-ol (21d). The calibration plot showed slope equal tone.ig. 11. PLS calibration plot calculated for the extended product model with75 variables. Numbers refer to the molecules in Table 2 while the letters (c, sr d) declare the steel case.

A.L.d.Q. Baddini et al. / Electrochim
Fvd
auca(i5dt22dd
oocTrIhfdo
6
easTip
to
optm
evacmemamcvildw0
odveMin
patcbtssm
kdALoao
A
c
ig. 12. PLS validation correlation plot for extended product model with 675ariables. Numbers refer to the molecules in Table 2 while the letters (c, s or d)eclare the steel case.
Fig. 11 shows the cross validation plot for this model. Actu-lly the first main observation indicates a line slope less thannity, 0.88, leading to underestimated response functions. Theross validation plot showed just five molecules with aver-ges smaller than 1%: 2-butyne-1,4-diol (23c); n-butylamine8s); propylamine (13s) and 3-butyn-1-ol (21s). Most of thenhibitors showed absolute percentual deviations larger than% with 2-butyn-1-ol (22d) being the molecule with the majoreviation from the experimental one with 52%. The moleculeshat showed absolute deviation within 1–5% were: 1,3-diethyl--thiourea (16s, 16d); tributylamine (1c); 3-butyn-1-ol (21c);-butyn-1-ol (22c); cyclohexylamine (7c); propylamine (13c);i-n-butylamine (6c); sec-butylamine (11s); thiourea (18s);odecylamine (5d); n-butylamine (8d) and hexylamine (10d).
Although all previous results and calculations were carriedut with WILA functions as the response property we must pointut that one of us (ALQBR), on a previous work had carefullyontrasted all calculations with −log i as the response property.his function is well known to the literature and many articles
eporting good statistical correlations to the response function.n our comparations we obtained results with similar quality,owever always pointing to the superior quality of the WILAunction. The extension of the comparations and the large-scaleata here analyzed allow us to be sure about the general qualityf the results here presented.
. Conclusions
Many chemometric studies have been reported in the lit-rature on the problem of single-metal corrosion inhibitionnd quantum descriptors. Most of these studies employed onlyix to eight molecules and a similar number of descriptors.he literature clearly points out to a lack of studies search-
ng for alternative and efficient variables on the corrosion
rocess.A modern challenge is to find reliable ways to predict inhibi-ion corrosion on a single metal surface and to transfer, partiallyr totally, this knowledge to the correlation and predictability
ftar
ica Acta 53 (2007) 434–446 445
f corrosion on different metal surfaces. In this line we shouldoint out the originality of this work that successfully inves-igate many metal-inhibitor variables as products of inhibitor
olecular properties times metallic composition variables.Three alternatives were designed to the description of differ-
nt inhibitor/metal interfaces. On the first one simple primaryariables were used with unreliable results. Clearly it is requiredn extended variable dataset in order to obtain accurate cal-ulation of the inhibition corrosion efficiencies. Two otherodels were designed to provide reliable values. The first model
mploys the simple variable products were products betweenolecular inhibitor properties and metal properties were cre-
ted and used on selective OLS calculations. In this particularodel we had 250 variables. Variable selections have been
arried for the OLS calculations based on calibration and cross-alidation descriptor selections indicating very few descriptorsn common. From these studies we found that each particu-ar selection (calibration or validation) finds its own optimalescriptor set. The overall results showed excellent correlationsith R2 values between of 0.80–0.96 and a Q2 values from.75 to 0.93.
A second alternative employs selection variable based on sec-nd order cross-validation and uses the simple product variableescribed in the previous paragraph. Our best result employs 29ariables, Y29, and accurately fitted all 69 corrosion inhibitorsxperiments within 5% accuracy over three different steel types.ost of the obtained results are easily transferable to other sim-
lar many-steel studies by a simple data addition concerning theew metal surface.
A third alternative employs all squared, cubes and simpleroducts between the primary variables composed of inhibitornd metallic properties. This model uses 674 variables and, dueo the large number of composed variables we carried out cal-ulations based on the classical partial least squares (PLS). Ourest result employed nine main components that accurately fit-ed the 69 corrosion inhibitors experiments. Results for this fithows R2 values of 0.95 and Q2 values of 0.83. Both resultshowed excellent performance compared to the previous twoodels here discussed.Finally we are unaware of any similar QSPR study for this
ind of steel, and neither the study of such massive amount ofata concerning molecular inhibitors and different steel surfaces.ll calculations have shown better results for weight isoestericangmuir adsorption function (WILA function), ln(θM/(1 − θ))r ln Kads, as the response function. Further work is now imper-tive to gain a better understanding, qualitative and quantitative,f structure-property correlations in inhibition corrosion.
cknowledgments
Two of the authors (JACP, EH) acknowledge CNPq for finan-ial support. EH acknowledges FAPERJ for financing computer
acilities. This work is part of the master thesis of one ofhe authors (ALQBR) and doctoral thesis of other (SPC). Wecknowledge the efforts of Dr. J. Wardell on the final englishevision.
4 rochim
R
[[[[[[[
[[[
[
[[
[[
[
[
[
[[[
46 A.L.d.Q. Baddini et al. / Elect
eferences
[1] G. Trabanelli, Werskst. Korros. 39 (1988) 589.[2] G. Schmitt, Br. Corros. J. 19 (1984) 165.[3] G.O. Santana, L. Sathler, J.A.C.P. Gomes, Evaluation of Corrosion
Inhibitors for Acidizing Operations, International Corrosion Council,Granada, 2002.
[4] R.D. Mack, Corrosion 1995, NACE, Paper no. 92, pp. 1–9.[5] M.L. Walker, J.M. Cassidy, K.R. Lancaster, T.H. McCoy, Corrosion 94,
NACE International, Paper 19.[6] J.M. Cassidy, K.R. Lancaster M.L. Walker, Corrosion 93, NACE Interna-
tional, Paper 95.[7] I. Bergman, Trans. Faraday Soc. 50 (1954) 829.[8] P. Dupin, D.A. Vilori-Vera, A. de Savignac, A. Lattes, B. Sutter, Ph.
Haicour, Procedings of the 5th European Symposium on CorrosionInhibitors, vol. 2, 1980, p. 301.
[9] G.J. Hojtink, Recl. Trav. Chim. 77 (1958) 555;G.J. Hojtink, Recl. Trav. Chim. 74 (1955) 1525.
10] F.M. Donahue, K. Nobe, J. Electrochem. Soc. 112 (1966) 886.11] J. Vosta, J. Eliasek, Corros. Sci. 11 (1971) 223.12] F.B. Growcock, Corrosion 45 (1989) 1003.
13] F.B. Growcock, W.W. Frenier, P.A. Andreozzi, Corrosion 45 (1989) 1007.14] P.G. Abdul-Ahad, S.H.F. Al-Madfai, Corrosion 45 (1989) 979.15] V.S. Sastri, J.R. Perumareddi, Corrosion 53 (1997) 617.16] P. Kutej, J. Vosta, J. Pancir, J. Macak, N. Hackerman, J. Electrochem. Soc.142 (1995) 829.
[
ica Acta 53 (2007) 434–446
17] C. Ogretir, B. Mihci, G. Bereket, J. Mol. Struct. 488 (1999) 223.18] G. Bereket, E. Hur, C. Ogretir, J. Mol. Struct. 488 (2002) 79.19] I. Lukovits, I. Bako, A. Shaban, E. Kalman, Electrochim. Acta 43 (1998)
131.20] F. Bentiss, M. Traisnel, H. Vezin, M. Lagrene, Corros. Sci. 45 (2003)
371.21] N. Khalil, Electrochim. Acta 48 (2003) 2635.22] D. Wang, S. Li, Y. Ying, M. Wang, H. Xiao, Z. Chen, Corros. Sci. 41 (1999)
1911.23] Pradip, B. Rai, Colloids Surf. 205 (2002) 139.24] S. Affrosman, J. Daviot, D. Holmes, R.A. Pethrick, M. Wilson, Corros. Sci.
43 (2001) 939.25] S.P. Cardoso, J.A.C.P. Gomes, L.E.P. Borges, E. Hollauer, J. Braz. Chem.
Soc. 17 (2006) 1241.26] S.P. Cardoso, J.A.C.P. Gomes, L.E.P. Borges, E. Hollauer, Braz. J. Chem.
Eng. 24 (2007), in press.27] S.P. Cardoso, J.A.C.P. Gomes, L.E.P. Borges, E. Hollauer, Braz. J. Chem.
Eng., in press.28] MOPAC 6.0, QCPE program, Bloominton, IN, 1989.29] PCMODEL, Serena Software, http://www.serenasoft.com.30] M. Fedders, J.W. Ponder, QSAR Program, 1996. Available at http:
dasher.wustl.edu. Access at 06/04/2005. The program of variable selection,based on second-order cross-validation error, represent minor modifica-tions from this program.
31] UNSCRAMBLER for Windows; Versao 6.11, CAMO ASA, Trondhein,Norway, 1997.
Copyright © 2022 FDOKUMEN