Statisstical Digest - Central Statistics Office of Dominica
202
-
Upload
khangminh22 -
Category
Documents
-
view
1 -
download
0
Transcript of Statisstical Digest - Central Statistics Office of Dominica


EXFlLANA,"ORY NOTE·S
The tables in this Digest relate to the island of thE~ Comm(Jnw(~althof Donlinicawhich is approximately 751 square kiiometrE~S (298 square miles)l, and is situatedbetween latitudes 15 40 North and longitude 61 30 West. The island part of theeasterly chain of the (~aribbean.
Symbols and abbreviations used in this dig(~st are:
o or 0.0$E.C.ECCSOEesCARICOMIMFNo.MFO/WKgMetric. TonGal. orImperial Gal.mml\lllJSCtnsK.W.H.0/0cu.yds9<d.
not availablenil or negligibleless than half the final digit shownEasterl' Caribbean Dollar (U.S. $1 "00 =E.C. $2.70)Eastern Caribbean Central BankOrganisation of Eastern Caribbean StatesCaribbean C·ommon MarketInternational Monetary FundNumbermalefemaleof whichKilogram (1 kg = 2.2 Ibs)1 Metric torl = 2204 Ibs
gallon (1 gal. =4.546 litres)millimetresInilibarscartoonskilo watt hoursper centcubic yardsgallons
The figures in most tables are rounded off to the nearest final digit. Additionof these rounded off figures may not always agree exactly with the roundedoff totals shown in the tables.
i.ii

MESSAGE FROM THE MINISTER FOR FINANCE,INDUSTRY AND PLANNING
This issue of the Annual Statistical Digest coincides with the year of Dominica's 21 st
.Anniversary of Independerlce. The issue therefore includes data wl;rich revealdemographic, social and economic, and growth and development trends, over the last 21years; rcpresellting efforts by the Central Statistical Office to respond. to user demand,and the capability of Goverrmlent Departments in presenting and providing the publicwith a statistical series on historical social and economic infonnation.
These past 21 years ~n the history of Dominica can be described as a period of mixedgrowth perfonnances and overall development; an ahievement attained despite diversechallenges for policy makers and Government planners. Among which were:
• The impact of natural disasters like hurricanes, which have not allowed public sectorinvestments in infra<;tructure to lead to commensurate increases in national capitalfonnation.
• The impact on the dominant banana industry towards the latter decade of this period,of external developments which threatened and eroded some of the protectionpreviously enjoyed by the industry in the major UK market.The impact of recurrent adverse weather conditions also plagued the industry.
Against the background of these challenges, and the constraints ofa small open economy,Dominica not only experienced much social and economic progress, but has attail1ednlaturity as a nation, more resilient, and resolute as a people, prepared for what isanticipated to be the even more ceaseless challenges of the new millennium.
The trends and fluctuations in the statistics clearly reflect 'social and economic impacts ofall of the challenges and constraints faced. The statistical series in this Digest thereforeprovide a good starting point for an)' research on Dominica, and wilU'prove useful topolicy makers and planners.
I comnlend the n1anagement and staff of the Statistics Department, and those \vhoprovided the data and statistics, for the publication of this Statistical Digest whichcommemo~~ the 21 sl anniversary of Dominica's independence.
~.1 ~"---
\ ,~ ----------...... ". .\." ' ;-.-..----_._~JULI& C TIMOTl-IY
Mil'ITSTER FOR FIN'ANCE~ INDUSTRY AND PLANNING

TABLES OF CONTENTS
FOREWORDACKNOWLEDGEMENTSEXPLANATORY NOTES
PAGE
iiiiii
SECTION 1. POPULATION AND VITAL STATISTICS
TABLE
ANALYSIS 1
1. NON-INSTITUTIONAL POPULATION AT CENSUS DATES1881-1991 2
2. NON-INSTITUTIONAL POPULATION OF TOWNS ANDSELECTED COMMUNITIES 1881-1991 3
3. ~rOTAL POPULATION ANALYSED BY BIRTHS, DEATHSAND NET MIGRATION, 1978-1998 4
4. BIRTHS AND DEATHS BY SEX 1978-1998 5
5. MEAN POPULATION AND VITAL RATES 1978-1998 6
5A. POPULATION BY SEX AND FIVE YEAR AGE GROUP1960,1970,1981,1991 7
5B. NON-INSTITUTIONAL POPULATION BY FIVE YEARAGE GROUP 1960,1970,1981,1991 8
se. TOTAL END OF YEAR POPULATION BY SEX AND AGEGROUP 1991-1998 9
6. NUMBER OF MARRIAGES BY AGE OF BRIDE ANDGROOM 1980-1998 10
iv
SECTION II. CLIMATE
ANALYSIS
7. ATMOSPHERIC PRESSURE, TEMPERATURE,RELATIVE HUMIDITY AND RAINFALL 1980-1998
8. RAINFALL AT BOTANIC GARDENS - MONTHLYANALYSIS 1978-1998
11
12
13
SECTION III: TRAVEL AND TOURISM
ANALYSIS 14-15
9. PASSENGER ARRIVALS AND DEPARTURES1978-1998 16
10. VISITOR ARRIVALS BY MODE OF TRANSPORTATION1978-1998 17
11. VISITOR ARRIVALS BY SEA (MONTHLY ANALYSIS)1978-1998 18
12. VISITOR ARRIVALS BY AIR (MONTHLY ANALYSIS)1978-1998 19
13. ALL VISITOR ARRIVALS BY VARIOUS GROUPS1978-1998 20
14. VISITOR ARRIVALS BY COUNTRY OF USUALRESIDENCE 1978-1998 21
15. TOTAL VISITOR ARRIVALS 1978-1998 22
16. ARRIVALS BY CRUISE SHIPS 1979-1998 23
17. ALL CRUISE AND PASSENGER ARRIVALS1978-1998 24
v

SECTION IV. PRICES, LABOUR & ECONOMIC ACTIVITY
ANALYSIS 25-27
18. MONTHLY CONSUMER PRICE INDICES FOR 1998 28
19. CONSUMER PRICE INDEX BY GROUP AND YEAR:1987-1998 29-30
20. MONTHLY INDEX OF FOOD AND NON-FOODGROUPS 1980-1998 31
21. ALL ITEMS INDEX BY YEAR AND MONTH1978 - 1998 32
22. ECONOMIC ACTIVITY DURING THE WEEK BEFORETHE CENSUSES 1970,1981 & 1991 33
23. ECONOMIC ACTIVITY DURING THE YEAR BEFORETHE CENSUS 1970, 1981 &1991 34
24. PERCENTAGE UNEMPLOYED AMONG THEECONOMICALLY ACTIVE 1970,1981 AND 1991 35
25. PERCENTAGE UNEMPLOYED BY AGE GROUP ANDSEX BASED ON MAIN ACTIVITY TWELVE MONTHSBEFORE CENSUSES 1981 AND 1991 36
26A. NON-INSTITUTIONAL WORKING POPULATION,CLASSIFIED BY AGE GROUP, SEX AND INDUSTRIALGROUP: MALE 1991 POPULATION CENSUS 37
268. NON-INSTITUTIONAL WORKING POPULATION,CLASSIFIED BY 'AGE GROUP, SEX AND INDUSTRIALGROUP: FEMALE 1991 POPULATION CENSUS 38
26C. NON-INSTITUTIONAL WORKING POPULATION,CLASSIFIED BY AGE GROUP, SEX AND INDUSTRIALGROUP: BOTH SEXES 1991 POPULATION CENSUS 39
27A. EMPLOYED PERSONS PAST WEEK BY AGE GROUP,SEX AND OCCUPATIONAL GROUP: MALE 1991POPULATION CENSUS 40
vi
SECTION IV (CONT'D)
27B. EMPLOYED PERSONS PAST WEEK BY AGE GROUP,SEX AND OCCUPATIONAL GROUP: FEMALE 1991POPULATION CENSUS 41
27C. EMPLOYED PERSONS PAST WEEK BY AGE GROUP,SEX AND OCCUPATIONAL GROUP: BOTH SEXES1991 POPULATION CENSUS 42
270. REGISTERED NEW EMPLOYERS AND EMPLOYEESBY ECONOMIC ACTIVITY 1986 - 1997 43-44
27E. REGISTERED EMPLOYERS BY MAJOR ECONOMICACTIVITY 1983 - 1997 45
28. NUMBER OF FARM WORKERS RECRUITED ANDRETURNING ANALYSED BY PLACE OF WORK
1978 - 1998 46
SECTION V: SOCIAL CONDITIONS, HEALTH, EDUCATION, HOUSING ANDELECTORATE
SUB-SECTION V-1 : HEALTH
ANALYSIS 47-48
29. NUMBER OF BEDS, ADMISSIONS, DISCHARGES ANDNUMBER OF PERSONS TREATED AT THE PRINCESSMAGARET HOSPITAL 1978 -1998 49
30. DISEASES OF MAJOR PUBLIC HEALTH IMPORTANCECASES REPORTED 1978 - 1998 50
31. NUMBER OF DEATHS ANALYSED ACCORDING TOTHE INTERNATIONAL CLASSIFICATION OFDISEASES 1978 - 1998 51-53
vii
SUB-SECTION V-II: EDUCATION
ANALYSIS 54-56
32. ENROLLMENT IN EDUCATIONAL INSTITUTIONS BY LEVELAND TYPE 1978/79 - 1998/99 57-58
33. NUMBER OF SCHOOLS BY LEVEL AND TYPE-'1980/81 - 1997/98 59-60
34. NUMBER OF TEACHERS & INSTRUCTORS BY LEVELOF INSTRUCTIONS & QUALIFICATION 1980/81-1997/98 61-62
35. REPITITION AND DROP-OUT RATES BY SEX HIGHSCHOOLS 1980/81-1997/98 63
36. NUMBER OF STUDENTS COMPLETING ELEMENTARYHIGH SCHOOLS 1980/81-1997/98 64
37. COMMON ENTRANCE EXAMINATIONS RESULTS1979 - 1998 65
38A. POPULATION 15 YEARS AND OVER BY AGE GROUP,SEX AND OCCUPATION FOR WHICH TRAINED 1991CENSUS: MALES 66
38B. POPULATION 15 YEARS AND OVER BY AGE GROUP,SEX AND OCCUPATION FOR WHICH TRAINED1991 CENSUS: FEMALES 67
38C. POPULATION 15 YEARS AND OVER BY AGE GROUP,SEX AND OCCUPATION FOR WHICH TRAINED1991 CENSUS: BOTH SEXES 68
39A. POPULATION BY AGE GROUP, SEX AND HIGHESTLEVEL OF EDUCATION 1991 CENSUS: MALE 69
39B. POPULATION BY AGE GROUP, SEX AND HIGHESTLEVEL OF EDUCATION 1991 CENSUS: FEMALE 70
39C. POPULATION BY AGE GROUp, SEX AND HIGHESTLEVEL OF EDUCATION 1991 CENSUS: BOTH SEXES 71
viii
SECTION V-II (CONT'D)
40A. POPULATION BY AGE GROUP, SEX AND HIGHESTEXAMINATION PASSED 1991 CENSUS: MALE 72
40B. POPULATION BY AGE GROUP, SEX AND HIGHESTEXAMINATION PASSED 1991 CENSUS: FEMALE 73
40C. POPULATION BY AGE GROUP, SEX AND HIGHESTEXAMINATION PASSED 1991 CENSUS: BOTH SEXES 74
41. POPULATION CURRENTLY AT SCHOOL OR UNIVERSITY,BY SEX AND AGE, 1991 CENSUS 75
42. POPULATION CURRENTLY AT SCHOOL OR UNIVERSITY,BY TYPE OF SCHOOL, 1991 CENSUS 76
SUB-SECTION V-3: HOUSING
ANALYSIS 77
43A. HEADS OF HOUSEHOLDS BY AGE GROUP AND SIZE OFHOUSEHOLD 1991 POPULATION AND HOUSING CENSUS:MALE 78
438. HEADS OF HOUSEHOLDS BY AGE GROUP AND SIZEOF HOUSEHOLD 1991 POPULATION AND HOUSINGCENSUS: FEMALE 79
43C. 1991 POPULATION AND HOUSING CENSUS: BOTH SEXES 80
44. PERCENTAGE DISTRIBUTION OF HOUSEHOLDS BY TYPEOF TENURE, 1970, 1981 AND 1991 CENSUSES 81
45. HOUSEHOLDS BY NUMBER OF ROOMS, 1970, 1981 AND1991 CENSUSES 82
46. DISTRIBUTION OF HOUSEHOLDS BY YEAR OFCONSTRUCTION OF DWELLING, 1981 AND 1991CENSUSES 83
47A. POPULATION 15 YEARS AND OVER BY AGE GROUP, SEXAND MARITAL STATUS, 1991 CENSUS: MALE 84
ix
SUB-SECTION V-3: HOUSING (CONT'D)
47B. POPULATION 15 YEARS AND OVER BY AGE GROUP,SEX AND MARITAL STATUS, 1991 CENSUS: FEMALE 85
47C. POPULATION 15 YEARS AND OVER BY AGE GROUP,SEX AND MARITAL STATUS, 1991 CENSUS: BOTHSEXES 86
SUB-SECTION V-4: ELECTORATE
ANALYSIS 87
48. HOUSE OF ASSEMBLY GENERAL ELECTIONS CANDIDATES,ELIGIBLE VOTERS, BALLOTS CAST, ACCEPTED ANDREJECTED AND PERCENTAGES BY ELECTORALCONSTITUENCY: 1980 88
49. CANDIDATES ELIGIBLE VOTERS, BALLOTS CAST,ACCEPTED AND REJECTED AND PERCENTAGESBY ELECTORAL CONSTITUENCY: 1985 89
50. CANDIDATES ELIGIBLE VOTERS, BALLOTS CAST,ACCEPTED AND REJECTED AND PERCENTAGES BYELECTORAL CONSTITUENCY: 1990 90
51. CANDIDATES ELIGIBLE VOTERS, BALLOTS CAST,ACCEPTED AND REJECTED AND PERCENTAGES BYELECTORAL CONSTITUENCY: 1995 91
SECTION VI: TRANSPORT & COMMUNICATION
ANALYSIS 92
52. ROAD VEHICLES LICENSED AND REGISTERED1987 -1998 93
53. ROAD ACCIDENTS, INJURIES AND FATALITIES1980 -1998 94
54. COMMERCIAL AIRCRAFTS MOVEMENTS ANALYSEDBY AMOUNT OF MAIL AND CARGO SET DOWN ANDPICKED UP 1978 -1998 95
x
SECTION VI (CONT'D)
55. TELEPHONE SERVICES 1978 - 1998
SECTION VII: PRODUCTION
, ANALYSIS
56. PRODUCTION OF MAJOR AGRICULTURAL CROPS1978 - 1997
57. VALUE OF PRODUCTION OF MAJOR AGRICULTURALCROPS 1978 - 1997
58. OUTPUT OF LIVESTOCK PRODUCTS 1978 - 1998
96
97-98
99-100
101-102
103
SECTION VIII: PUBLIC FINANCE
ANALYSIS 104
59. CENTRAL GOVERNMENT REVENUE, EXPENDITURE ANDANNUAL BALANCES 1978n9 -1997/98 105
60. CENTRAL GOVERNMENT REVENUE ANALYSED BYPRINCIPAL ITEMS 1978/79 - 1997/98 106
61. FUNCTIONAL CLASSIFICATION OF RECURRENTEXPENDITURE 1978/79 - 1997/98 107-108
62. CENTRAL GOV~RNMENTREVENUE AND EXPENDITUREANALYSED BY RECURRENT AND CAPITAL ACCOUNTSAND SOURCES OF REVENUE 1978/79 -1997/98 109-111
xi
SECTION IX: BANKING
ANALYSIS 112
63. COMMERCIAL BANKS' LIABILITIES 1981-1998 113
64. COMMERCIAL BANKS' ASSETS 1980-1998 114
65. COMMERCIAL BANKS' TOTAL LOANS &ADVANCESBY BORROWERS 1981-1998 115
66. COMMERCIAL BANKS' OVERDRAFTS &LOANS BYMATURITY 1981-1998 116
67. COMMERCIAL BANKS' SELECTED INTEREST RATES1981-1998 117
68. CREDIT UNIONS NUMBER REGISTERED, MEMBERSHIPAND FINANCES 1978-1998 118-119
SECTION X: NATIONAL ACCOUNTS AND BALANCE OF PAYMENTS
ANALYSIS 120-121
69. GROSS DOMESTIC PRODUCT BY ECONOMIC ACTIVITYAT FACTOR COST 1987-1997(CURRENT PRICE, EC$ MILLION) 122
70. GROSS DOMESTIC PRODUCT BY ECONOMIC ACTIVITYAT FACTOR COST 1987-1997(CONSTANT 1990 PRICES, EC$ MILLION) 123
71. RATE OF GROWTH OF GROSS DOMESTIC PRODUCTBY ECONOMIC ACTIVITY AT FACTOR COST 1987-1997(CURRENT 1990 PRICES) 124
72. RATE OF GROWTH DOMESTIC PRODUCT BY ACTIVITYAT FACTOR COST 1986-1997(CONSTANT 1990 PRICES) 125
73. GROSS DOMESTIC PRODUCT DEFLATORS BY ECONOMICACTIVITY AT FACTOR COST 1987-1997 126
xii
SECTION X (CONT'D)
74. INDEX OF GROSS DOMESTIC PRODUCT BY ECONOMICACTIVITY AT FACTOR COST 1984-1997(IN CURRENT PRICES)
75. INDEX OF GROSS DOMESTIC PRODUCT BY ECONOMICACTIVITY AT FACTOR COST 1987-1997(IN CONSTANT 1990 PRICES)
76. THE BALANCE OF PAYMENTS OF DOMINICA(SUMMARY) 1987 - 1997
127
128
129-130
SECTION XI: TRADE
ANALYSIS 131-132
77. TOTAL TRADE AND BALANCE OF VISIBLE TRADE1978 -1997 133
78. QUANTUM AND UNIT VALUE INDICES OF IMPORTS ANDEXPORTS AND TERMS OF TRADE: 1978-1993 134
79. TRADE BY SECTIONS OF THE S.I.T.C. REV 3 1978-1997 135-137
80. PRINCIPAL DOMESTIC EXPORTS 1978-1997 138-139
81. IMPORTS OF PRINCIPAL ITEMS 1978-1997 140-141
82. TOTAL IMPORTS BY PRINCIPAL TRADING PARTNERS:1978 -1997 142-143
83. TOTAL EXPORTS BY PRINCIPAL TRADING PARTNERS:1978-1997 144-145
84. TOTAL EXPORTS TO CARICOM COUNTRIES:1978-1997 146-147
xiii

SECTION XI (CONT'D)
85. TOTAL IMPORTS FROM CARICOM COUNTRIES:1987-1997
SECTION XII: FACILITIES
ANALYSIS
148-149
150-152
86. POTABLE WATER, AVAILABILITY AND DOMESTICDISTRIBUTION: 1987-1997 153-154
87. ELECTRICITY AND WATER CONSUMPTION 1980-1998 155
88. ELECTRICITY GENERATION, SALES AND CONSUMERS1980-1997 156-157
89. PERCENTAGE DISTRIBUTION OF HOUSEHOLDS BY TYPEOF WATER FACILITIES, 1970, 1981 AND 1991 CENSUSES 158
90. NUMBER OF HOTELS, GUEST HOUSES ANDAPARTMENT/COTTAGES 1988-1997 159
91. CRIME STATISTICS FOR PERIOD 1980 TO 1998 160
92. PRISON POPULATION 1982-1997 161
xiv

POPULATION AND VITAL STATISTICS
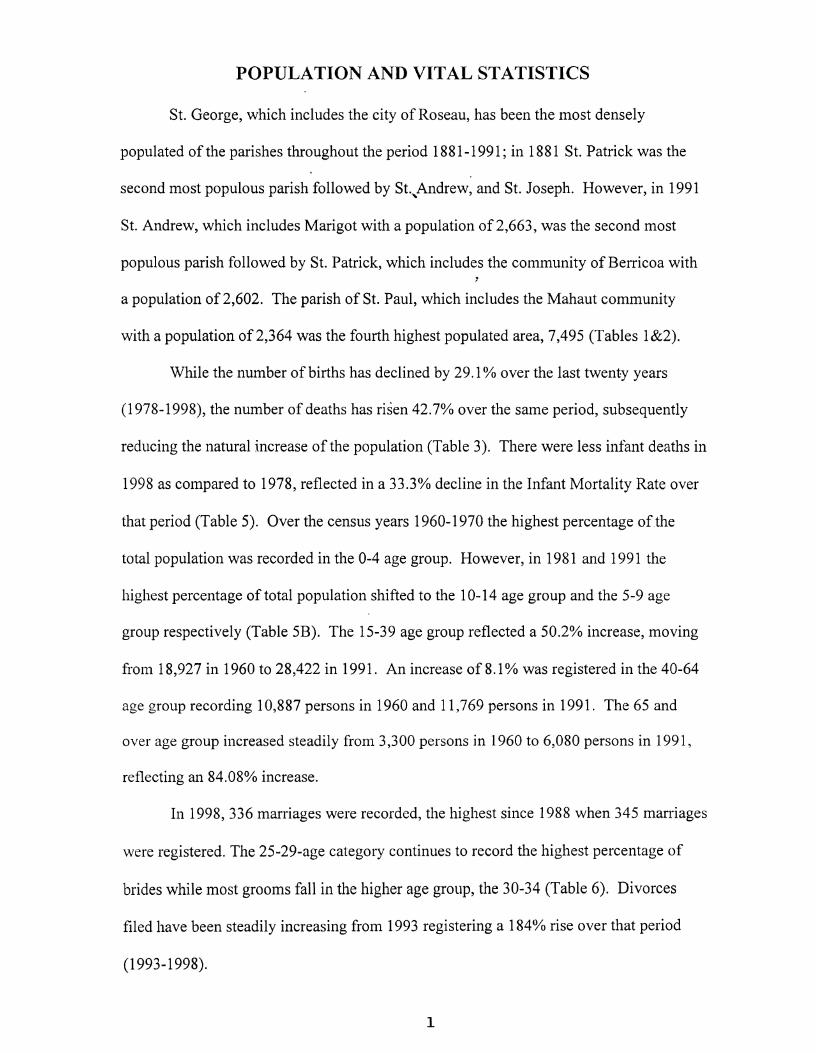
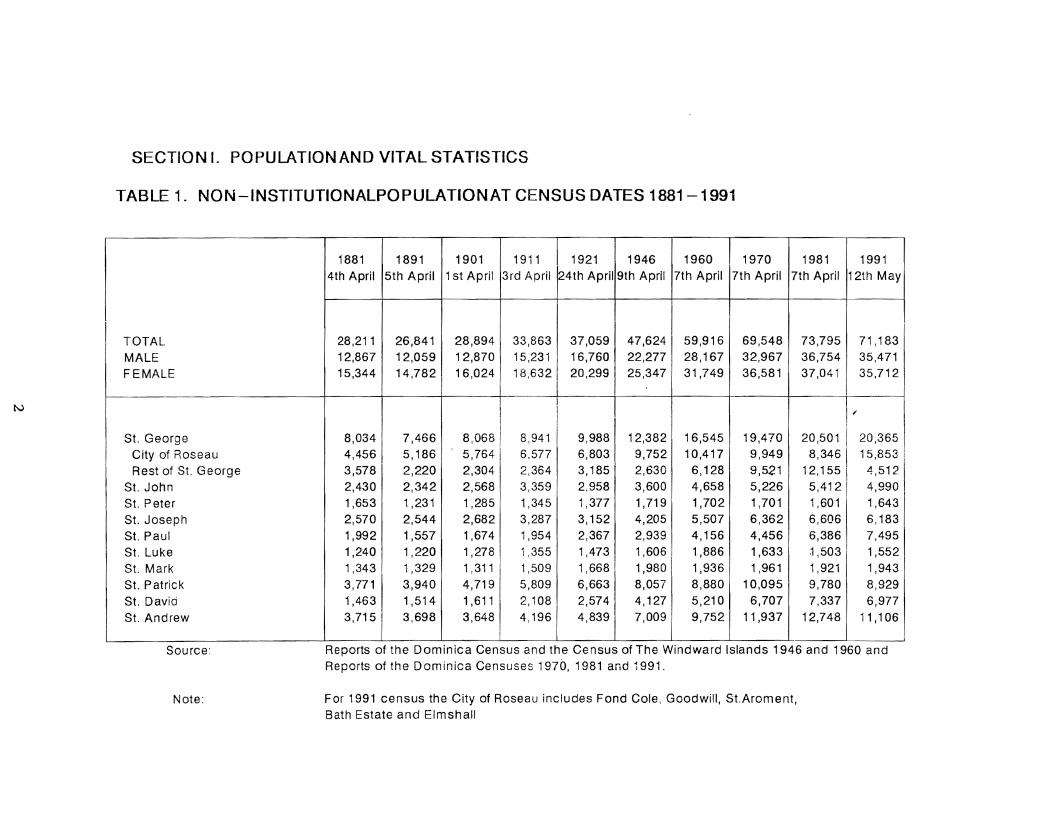
81. George, which includes the city of Roseau, has been the most densely
populated of the parishes throughout the period 1881-1991; in 1881 St. Patrick was the
second most populous parish followed by St..,Andrew, and St. Joseph. However, in 1991
81. Alldrew, which includes Marigot with a population of2,663, was the second most
pOplllous parish followed by St. Patrick, which includes the community of Berricoa with
a population of 2,602. The parish of St. Paul, which includes the Mahaut community
with a population of 2,364 was the fourth highest populated area, 7,495 (Tables 1&2).
While the number of births has declined by 29.1 % over the last twenty years
(1978-1998), the number of deaths has risen 42.70/0 over the same period, subsequently
redllcing the natural increase of the population (Table 3). There were less infant deaths in
1998 as cOlnpared to 1978, reflected in a 33.3% decline in the Infant Mortality Rate over
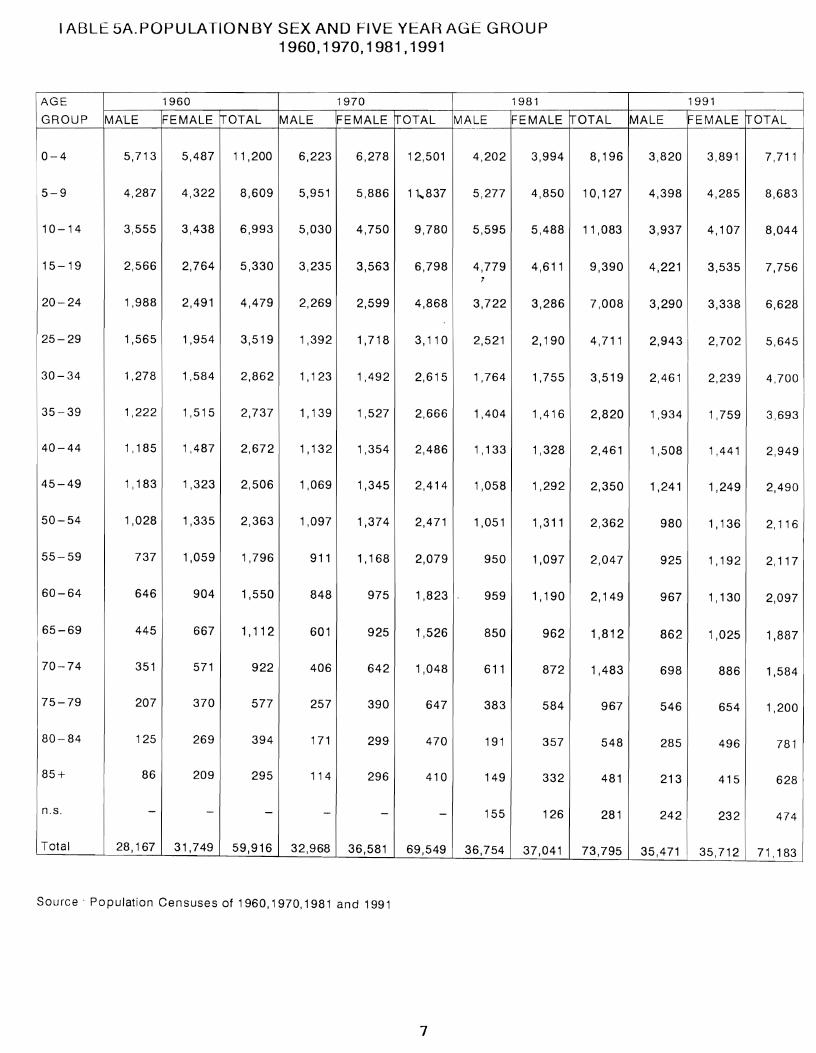
that period (Table 5). Over the census years 1960-1970 the highest percentage ofthe
total population was recorded in the 0-4 age group. However, in 1981 and 1991 the
11igllest percentage of total population shifted to the 10-14 age group and the 5-9 age
group respectively (Table 5B). The 15-39 age group reflected a 50.20/0 increase, moving
froill 18,927 in 1960 to 28,422 in 1991. An increase of 8.1 % was registered in the 40-64
age grollp recording 10,887 persons in 1960 and 11,769 persons in 1991. The 65 and
over age group il1creased steadily froill 3,300 persons in 1960 to 6,080 persons in 1991,
reflecting an 84.080/0 increase.
III 1998, 336 marriages were recorded, tIle higllest since 1988 when 345 marriages
were registered. The 25-29-age category continues to record the highest percentage of
brides while most grooms fall in the higher age grollp, the 30-34 (Table 6). Divorces
filed llave been steadily increasing from 1993 registering a 1840/0 rise over that period
(1993-1998).
1

tv
SECTION I. POPULATIONAND VITAL STATISTICS
TABLE 1. NON-INSTITUTIONALPOPULATIONAT CENSUS DATES 1881-1991
1881 1891 1901 1911 1921 1946 1960 1970 1981 19914th April 5th April 1st April 3rd April 24th April 9th April 7th April 7th April 7th April 12th May
TOTAL 28,211 26,841 28,894 33,863 37,059 47,624 59,916 69,548 73,795 71 ,183MALE 12,867 12,059 12,870 15,231 16,760 22,277 28,167 32,967 36,754 35,471FEMALE 15,344 14,782 16,024 18 632 I 20,299 25,347 31,749 36,581 37,041 35,712, I
IT I
II .,!
St. George 8,034 7,466 . 8,0681
8,941 9,988 12,382 16,545 19,470 20,501 20,3651City of Roseau 4,456 5,186 5,764 I 6.577 6,803 9,752 10,417 9,949 8,346 15,853 !Rest of St. George 3,578 2,220 2,304- 2,364
3,185
12,630 6,128 9,521 12,155 4,512
S1. John 2,430 2,342 2,568 3,359 2.958 3,600 4,658 5,226 5,412 4,99081. Peter 1,653 1,231 1,285 1,345 1,377 1,719 1,702 1,701 1,601 1,643S1. Joseph 2,570 2,544 2,682 3,287 3,152 4,205 5,507 6,362 6,606 6,183
S1. Paul 1,992 1,557 1,674 1,954 2 1367 2,939 4,156 4,456 6,386 7,495
S1. Luke 1,240 I 1,220 1,278 1,355 1,473 1,606 I 1,886 1,633 1,503 1,552
81. Mark 1,343 1,329 1 1311 1,509 1,668 1,980 1,936 1,961 1,921 1,943S1. Patrick 3,771 1
3,940 4,719 5,809 6,663 8,057 8,880 10,095 9,780 8,929St. David 1,463 1,514 1,611 2,108 2,574 4,127 5,210 6,707 7,337 6,977St. Andrew 3,715
13,698 3,648 4,196 4,839 7,009 . 9,752 11,937 12,748 11 ,106
Source:
Note:
Reports of the Dominica Census and the Census of The Windward Islands 1946 and 1960 andReports of the Dominica Censuses 1970, 1981 and 1991.
For 1991 census the City of Roseau includes Fond Cole, Goodwill, St.Aroment,Bath Estate and Elmshall
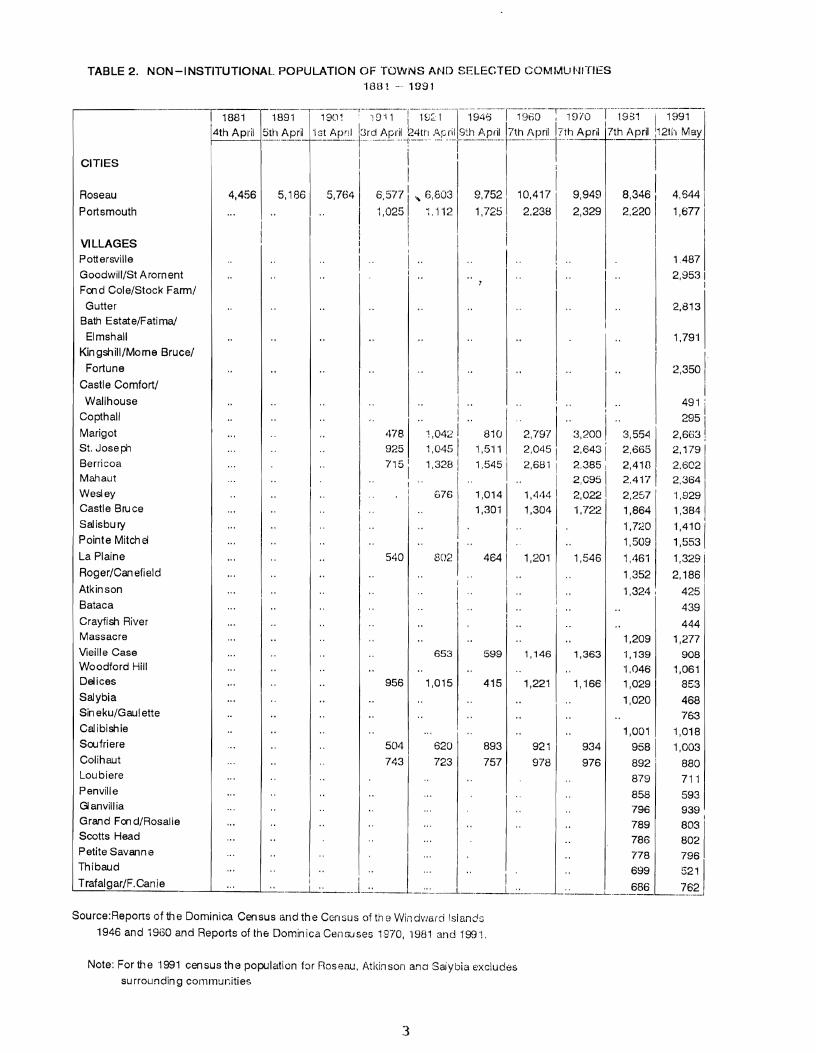
TABLE 2. NON-INSTITUTIONAL POPULATION CJF TOVlJNS AND SELE(~TED C;()~1fJtUt",UTIES
1OS 1 ._. 1991
~2,813
4.644
1,677
1,79-1
2,350 II
491
295
2,6G3
2,179
2.6022,364
'1.929
'1,384
'1,410
1,553
1,329
2,186
425
439
4441,277
908
'1,061
853
468
763
1,018
1,003
880
7'1'1
593939
I803/802
1796
52~ I
_l_?~J
1,001
9581
892 I
879
3,554
2,665
2,4182.41-l
2,257
1,864
1,7~20
1,509
1,461
1,352
1,324 I
1,020
1,209
-1.139
1,046
1,029
934
976
:: I"..
921 I978
I
..
'0 ..
'frsl '!,042 81 (J 2,797 :3,200925 1,045 '1,511 2.045 2,643715 I 1.328 1,545
1 2.681 2.385 1
I2,095
1II 676 1,014 1,444
!.. 2,022
1,301 1,304 '1.·'22
Io.
., ..540 '1(\21 464 1,201 1,5461,.,' •
I
I o.
I ..
653 599 1,146 1,363
956 1,015 415 1,221 1,'166
5,1864,456
CITIES
VILLAGESPottersville
Goodwill/St Aroment
Foo d Cole/Stock Farm/
Gutter
8ath Estate/Fatima!
Elmshall
Kingshill/Mome Bruce/
Fortune
Castle Comfort/
Wallhouse
Copthall
Marigot
St. Josep,
Berricoa
Roseau
Portsmouth
Mahaut
Wesley
Castl e 8 ru ce
Salisbury
Pointe Mitch aLa Plaine
Roger/Can efield
Atkinson
Bataca
Crayfish River
Massacre
Vieille CaseWoodford HillDelices
SaJybia
Sin eku/Gaul ette
Calibishie
Soofriere 504 620 893
Colihaut 743 723 757
1
Loubiere
Penville 858Gl anvil! ia '796
Grand Food/Rosalie 789
Scotts Head 786
Petite Savann e I .. . .. .. . j"0 0 .. 778
Thibaud ~ 699
Trafalgar/F. Canie -----'-- ~.:. L~__ .-.::.:....----1.-.. 1-.:.:.. -.:.: .L, ~~~
Source:Reports of the Dorninica Census and the Census of th e Windv/urd Islands
1946 and 19(30 and Reports of the Dominica Censuses 1970, '1981 and 199-1.
Note: For the '1991 census the population for Roseau, Atkinson and Saiybia c·xcludes
surroundin 9 corllinunities
3
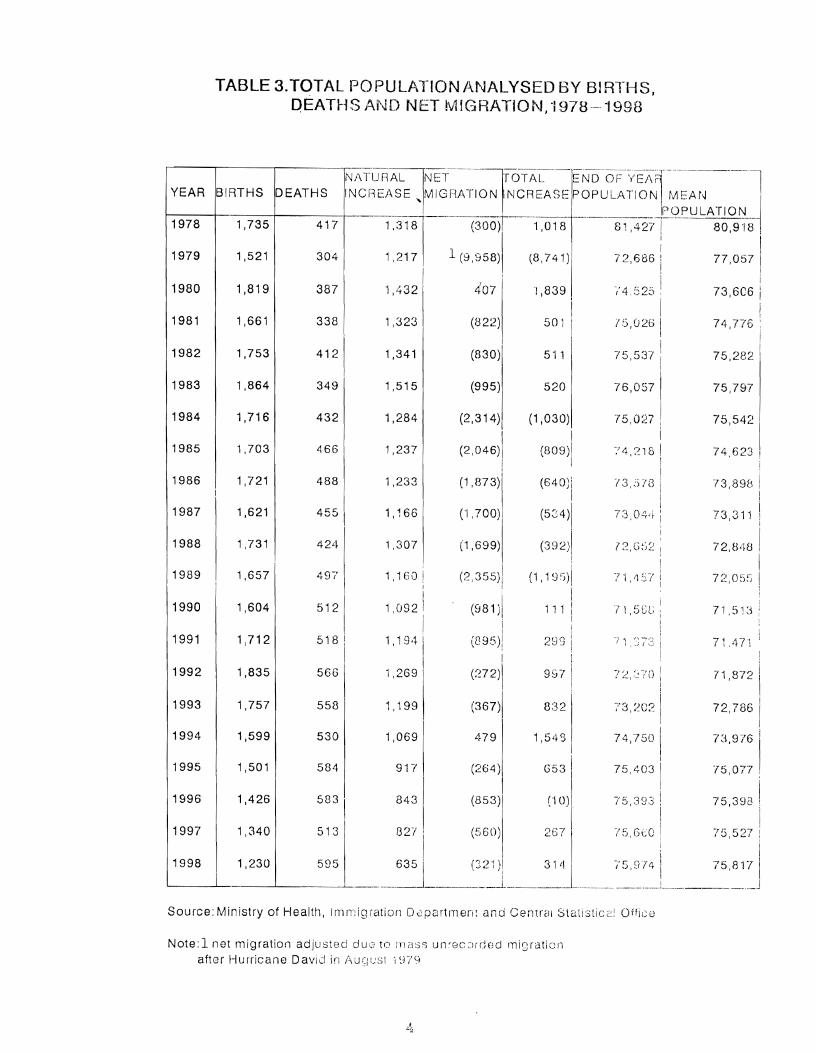
TABLE 3.TQTAL. r)OPULJ\TIONl\I\~ALy'SEDBY BIR1-I,S,PEATI-~S /\1\10 NET lVIIGRATIOt\J
1"1978--,1998
/3,898
75,797
75,282
75,542
74,623
72,B48
7 i ,47'1 !
76,057
7 s sr3-7 I'-I'"~ ,
'7) ~ {"I'I • ,0UI..)
9S7
832
Gr"3 I. ~ I
1,54·gI
479
(367)
I
(272)1
(264)
(853)843
917
1,323 (B 2~?) 501
1,341 (830) 511
1,515 (995) 520
1,284 (2,314) (1,030)
I I1 ,237 (2,046)1 (809)]
I
(640)11,233 (1.873)1I
1,166 CI,700) (534II1 ,:~Ol ('1,699) (392)1
!
1,1£30 ('J 3 h 5)1 (1 ,1 9 ,f»)I._\ .J II
Ij
(881 )1j
1,092 11 1 Ii I
1,194 (O95ll 299
1 J i 99
1,069
1,:318 (300) '1,018 81,42'7! 80,9"18,
1,217 1 (9,958) (8,741) 72,686 I 77.0571
I 1
1,432 407 "1,839 '/4, 52S ' 73,606 1
I75,026 I 74,776 \
i
!
?:~I:~:~'?O ! 71 r8l21I 1I I
""';, r:'~ I)U'\') j 72, 7, ~61iJ v I i .. ~'_! ..."
I
74,150 I 7::1,976 !
75,403 i "15,0771I i
75,393 ! 75,39B !I 'I I
82i' I (560) 267 I. 75,6CO ! /5,5"27 1
I I! J
635 I (3 21 )I 3 1 £1 I I' 5 ,9"7 4 I 75 ,8 1"1 I-.-.--__1 ,. 1 , ..__1 ,._.. ._j_.. . ..__..1
NiYEAR BIRTHS DEATHS IN
1978 1,735 417
1979 1,521 304
1980 1,819 387
1981 1 ,661 338
1982 1.753 412
1983 1,864 349
1984 1,716 432
1985 1,703 466
1986 1,721 488I
1987 1 ,621 455
,1988 1,731 424
1989 1,657 497!
1990 1,604 512
1991 1,712 518
1992 1,835 566
1993 1,757 558
1994 1,599 530
1995 1.501 584
1996 1,426 583
1991' 1,340 513
1998 1,230 595
Source: Ministry of Healttl, lmn':igration D0partrnenr and Central Statisticc:/.! ()ffice
Note :1 net rn i9 rat ion ad just e c1 d U (3 to ITI a ~3 sun ~ (! C :) rd El (J In ig rat i0 rl
after Hurricane David in /\u q t.,:s1 j 979
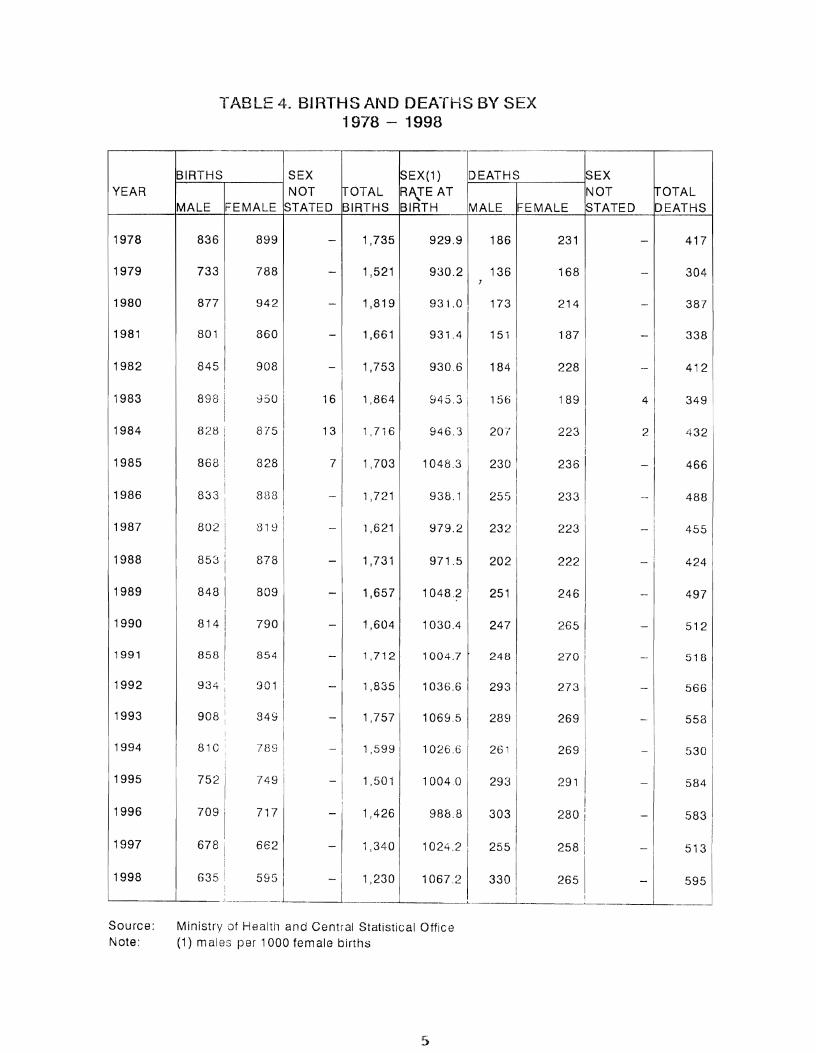
l-ABLE L~. BIRTHS Af'JD DEA-rHS BY SEX1978 - 1998
,...-----""-T---..,,------'---,----.,r-----y-----'T-------·-----,.-----..---------,
YEARBIRTHS SEX SEX(1) I--D_EA_T_r_iSr--_._---lSEX
NOT ITOTAL R"TE AT NOTMALE FEMALE STATED BIRTHS BIRTH MALE FEMALE STATED
rrOTALDEATHS
1978
1979
836
733
899
788
1,735
1,521
929.9
930.2
186
136
231
168 1
417
304
1980 877 942 1,819 931.0, 173 214 381
1981
1982
801
845
860
908 1,753
931.4
930.6
151
1
184
187
228
338
412
1983 898 950 16 1,864 945.3 15f:i 189 4 349
1984 828 875 13 1,716 946.3 207 223 2 432
1985 868 828 7 1,703 1048.3 230 236 466
1986
1987
833
802
8HB
81~
1 ,721 938.1
979.2
255
232
233
I223
488
455
1988 853 878 1 ,731 971.5 202 222 424
530
566
558
512
518
584
497
261
248
247
293
251
289
1004.7
1069.5
1026.61
1004,0
1030.4
1048.2
1036.6 I
1,712
1,599 I
1,426
1,835
1,604
1,757
',657
~30 1
749
790
/89
849
809
854
7" l
934
810:
752
858
848
814
709
908
1991
1994
1993
1990
1992
1995
1989
1996
1997
246
I2651
I
I270 I
2731
2691
I
269 II I
29~l i 291 I
I I
988.8 303[ 280!- 583 I
r ! j I
678[ 662i - 1,340 1024.2 1 2551 258[ - 513 1
1..-
1_9_9
_8
_-",--_6_)3__5! :~_L~__._1,~_30---,---_1_06._7_.~_~_L __33_0_IL 2~__! _,_.._~_59_5JSource: Ministry of HeatHl and Central Statistical OfficeNote: (1) males per 1000 female births
5
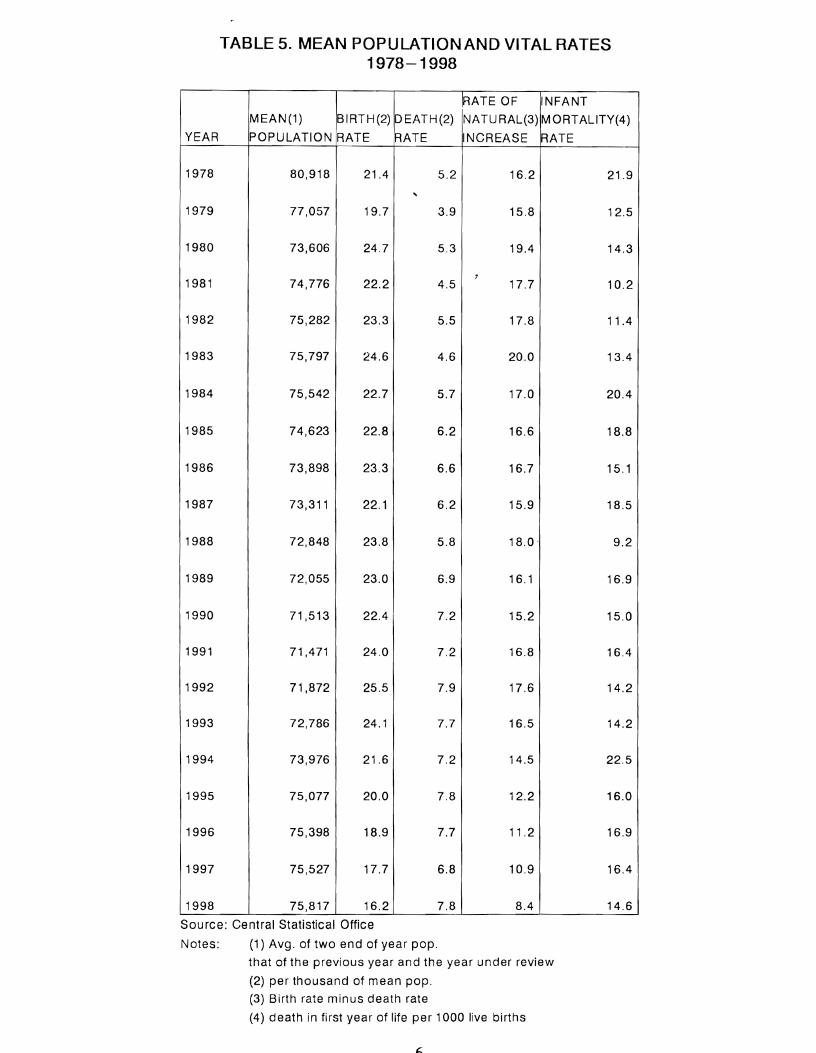
TABLE 5. MEAN POPULATIONAND VITAL RATES1978-1998
RATE OF INFANT
MEAN(1) BIRTH(2) DEATH(2) NATURAL(3) MORTALITY(4)
YEAR POPULATION RATE RATE INCREASE RATE
1978 80,918 21.4 5.2 16.2 21.9
"-
1979 77,057 19.7 3.9 15.8 12.5
1980 73,606 24.7 5.3 19.4 14.3
1981.,
74,776 22.2 4.5 17.7 10.2
1982 75,282 23.3 5.5 17.8 11 .4
1983 75,797 24.6 4.6 20.0 13.4
1984 75,542 22.7 5.7 17.0 20.4
1985 74,623 22.8 6.2 16.6 18.8
1986 73,898 23.3 6.6 16.7 15.1
1987 73,311 22.1 6.2 15.9 18.5
1988 72,848 23.8 5.8 18.0 . 9.2
1989 72,055 23.0 6.9 16.1 16.9
1990 71,513 22.4 7.2 15.2 15.0
1991 71,471 24.0 7.2 16.8 16.4
1992 71 ,872 25.5 7.9 17.6 14.2
1993 72,786 24.1 7.7 16.5 14.2
1994 73,976 21.6 7.2 14.5 22.5
1995 75,077 20.0 7.8 12.2 16.0
1996 75,398 18.9 7.7 11.2 16.9
1997 75,527 17.7 6.8 10.9 16.4
1998 75,817 16.2 7.8 8.4 14.6
Sou rce: Central Statistical Office
Notes: (1) Avg. of two end of year pop.
that of the previous year and the year under review
(2) per thousand of mean pop.
(3) Birth rate min us death rate
(4) death in first year of life per 1000 live births
IABLE5A.POPULATIONBY SEX AND FIVE YEARAGE GROUP1960,1970,1981 ,1991
AGE 1960 1970 1981 1991
GROUP MALE FEMALE IfOTAL MALE FEMALE IfOTAL MALE FEMALE rrOTAL MALE FEMALE IfOTAL
0-4 5,713 5,487 11 ,200 6,223 6,278 12,501 4,202 3,994 8,196 3,820 3,891 7,711
5-9 4,287 4,322 8,609 5,951 5,886 1~837 5,277 4,850 10,127 4,398 4,285 8,683
10-14 3,555 3,438 6,993 5,030 4,750 9,780 5,595 5,488 11 ,083 3,937 4,107 8,044
15-19 2,566 2,764 5,330 3,235 3,563 6,798 4,779 4,611 9,390 4,221 3,535 7,756.,
20-24 1,988 2,491 4,479 2,269 2,599 4,868 3,722 3,286 7,008 3,290 3,338 6,628
25-29 1,565 1,954 3,519 1,392 1,718 3,110 2,521 2,190 4,711 2,943 2,702 5,645
30-34 1,278 1,584 2,862 1,123 1,492 2,615 1,764 1,755 3,519 2,461 2,239 4,700
35-39 1,222 1,515 2,737 1,139 1,527 2,666 1,404 1,416 2,820 1,934 1,759 3,693
40-44 1,185 1,487 2,672 1,132 1,354 2,486 1,133 1,328 2,461 1,508 1,441 2,949
45-49 1,183 1,323 2,506 1,069 1,345 2,414 1,058 1,292 2,350 1,241 1,249 2,490
50-54 1,028 1,335 2,363 1,097 1,374 2,471 1,051 1,311 2,362 980 1,136 2,116
55-59 737 1,059 1,796 911 1,168 2,079 950 1,097 2,047 925 1,192 2,117
60-64 646 904 1,550 848 975 1,823 959 1,190 2,149 967 1,130 2,097
65-69 445 667 1,112 601 925 1,526 850 962 1,812 862 1,025 1,887
70-74 351 571 922 406 642 1,048 611 872 1,483 698 886 1,584
75-79 207 370 577 257 390 647 383 584 967 546 654 1,200
80-84 125 269 394 171 299 470 191 357 548 285 496 781
85+ 86 209 295 11 4 296 410 149 332 481 213 415 628
n.s. - - - - - - 155 126 281 242 232 474
Total 28,167 31,749 59,916 32,968 36,581 69,549 36,754 37,041 73,795 35,471 35,712 71 ,183
Source' Population Censuses of 1960,1970,1981 and 1991
7

TABLE 58. NON-INSTITUTIONALPOPULATION8Y FIVE YEAR AGE GROUP1960 J 1970 J 1981 J 199'1
AGE ~/o of ~/o of Yo of ~ of
GROUP 1960 rrOTAl 1970 JrOTAl 1981 !fOTAl 1991 !fOTAl.,
0-4 11,200 18.7 12,501 18.0 8,196 11 .1 7,711 10.8
5-9 8,609 14.4 11,837 17.0 10,127 13.7 8,683 12.2
.,10-14 6,993 11.7 9,780 14.1 11 ,083 15.0 8,044 11 .3
15-19 5,330 8.9 6,798 9.8 9,390 12.7 7,756 10.9
20-24 4,479 7.5 4,868 7.0 7,008 9.5 6,628 9.3
25-29 3,519 5.9 3,110 4.5 4,711 6.4 5,645 7.9
30-34 2,862 4.8 2,615 3.8 3,519 4.8 4,700 6.6
35-39 2,737 4.6 2,666 3.8 2,820 3.8 3,693 5.2
40-44 2,672 4.5 2,486 3.6 2,461 3.3 2,949 4.1
45-49 2,506 4.2 2,414 3.5 2,350 3.2 2,490 3.5
50-54 2,363 3.9 2,471 3.6 2,362 3.2 2,116 3.0
55-59 1,796 3.0 2,079 3.0 2,047 2.8 2,117 3.0
60-64 1,550 2.6 1,823 2.6 2,149 2.9 2,097 2.9
65-69 1,112 1.9 1,526 2.2 1,812 2.5 1,887 2.7
70-74 922 1.5 1,048 1.5 1,483 2.0 1,584 2.2
75-79 577 1.0 647 0.9 967 1.3 1,200 1.7
80-84 394 0.7 470 0.7 548 0.7 781 1.1
85+ 295 0.5 410 0.6 481 0.7 628 0.9
n.s. 0 0.0 0 0.0 281 0.4 474 0.7
TOTAL 59,916 100.0 69,549 100.0 73,795 100.0 71 ,183 100.0
Source: Population Censuses of 1960,1970,1981 and 1991.
8
Ttd-.3L E SC.TOTAi- END OF YEAR POPULATION BY SEX AND AGE GROUP1991-1998
~~~f~=T/B2i;~l-l~r;~I ~-~LQo-:l--:-l ;~l M I ~ffi5 ~OTPLTM- F
1
G&S@TPLM F
'ffi7
ro~J-:-~tt-:~l10
-4
I 3,83J i 3,9C2 17,7'32 I 4,135 4,10'1 I 8,239T4,318 I! 4,083 1 B,4G1 I 4,394! 4,094 8,428 1 4,443 I 4,142 8,585 4,417 4,134 8,551 4,170 4,010 8,100 I 4,115
1 3,970 I 8,085 1
i5-9 I 4,410 1 4'~,~! 8,700 4,384 4,221 8,srJS I 4,383 4,231 8,£2J 14,441 I 4,254 8,6.951
4,4::Q 4,219 8,671 4,477 4,248 8,725 4,3:Xl 4,233 8.5m I4,413 4,300 8,721 I'
i 10-14 I 3,94714,11318,065 4,151 4,003 8,25)' 4,HD 4, 127 1 8,307 4,261' 4,147 a,4ffi'i 4,270 4,1&1 8,458 4,29J 4,194 8,484 4,233 4,174 8,410 I 4,307 4,242 8,5491
15-
19I 4,232 3:545. 7,Ti7 4,263 3,583 7,846 4,303 I 3,600 I 7,912/ 4,3-3J 3,640 7,970 II 4,313 3,661 7,974 4,261 3,637 7'893
14'184 I 3,8771 8,061 4,124 3,821 ~7,945
120
-24
! 3,293 I :3,341: 6,646 3,446 3,284 6,73J 3,470 I 3,301 I 6,771 '3,535 3,293 6,82S 1 3,557 3,389 6,946 3,561 3,36J 16,921 3,647 I 3,546 7,
1931 3,6E2 3,581 7,2£3
! 25-29 ! 2,851 I 2.,7031 5,6ED I 3,134 2,716 5,85J 3,172' 2,7431 5,915 3,223 2,7fJT 6.010 13:259 2,876 6,135 3,253 2,823 6,079 3.25512
•827
6,OEQ I 3,293 2,BEQ 6,158130-34 I 2,4£:8 ! 2,24514,7131' 2,63) 2,251 4,871 2,693 2,27U I 4,969 2,T18 2,322 5,100 2,80i 2,371 5,172 2,801 2.3-'J? 5,133 I 2,871 2,433 5,~ 1
2'861 2,424 5,285
! 2)-39 I 1,~ 1,764 3,703 2,034 1,723 3,763 2,091 1,7fJ11 3,858 2,171 1,821 3,991 2,165 1,870 4,035 2,100 1,847 4,027 2,225 I 1,832 4,117 2,233 1,893 4,131
i 40-44 i 1,:5121 1,445, 2,951 1.458 1,449 1 2,'2(51 1,518 i 1.45312,971 1,594 1,513 3,107 i 1,613 1,532 3,145 1,610 I 1,481 3,091 I 1,63J.1 1,501 ,3,'33
1
1;639 1,5fJ1 3,146\45-49 1 1,
2451 1,252 1 2,4971 1,2351 1,255 2.49J I 1,200 i 1,251 1 2,545 1,353 1,2::£l 2,612\,,363, 1,232 2,595 1 1,381 !1,z:5 2,676
11,391 I 1,301 2,692 1,374 1,284 2,658
15~-54! 9831 1,1-39 1 2,1221 1,024 1 , ,094 2,1181 1,007: 1,061 2,0E'8 1,093 1,071 2,164, "063
jl 1,103 2,16911,088 I 1,141 2.223 1,087
11
,133 2,22) 1,094 1,148 2,242155-59 I 9"23! ,, 195 1' 2,123 918 1 1,159 2,071 :,03J! 1,11012,140 1,048 1,059 2,107,' 1:052 1,142 2,194 1.04811.183/2.231 1,053, 1,187 2,240 I 1,011 1.142 2,15360-64 I 970 1 1,133 2, leG t 1,0;31 , ,'55 2,1ffi 985 1 1, 157 1 2,14S 1,092 1,1S6 2,29J 1,064 I 1,234 2,CE [1,035 I 1,275 2,340 1,os) , 1,255 2,305 I 1,
0631
1,2ffi I 2,331
65-69 i 864 1,023 1,892 1 872. 1,CXQ 1,874 9Z11
' 1.0"23 1 1'953 i 9761 1.025 2,001 11.025 1"
049 2,074! 1,0121 1,059 2,071 I 1,042 1,002 2,134 1 1,O:X 1,102 2,154
70-74 I' 7eo I 8EE 1.i88
1
68J i 914 1,594! 740 I 93:) 1,670 I' 814! 944 1,753. 843 974 1,,817 872
1 973 1,8451 870 971 1,841·1 861
1970 1,837
75-79: 5471 655 1,Z'~ 558 1 638 1, 193 1 563\ 6",0.1:200 615 1 646\,,25, 1 663, 6651
,,331 621 1 676 1,2'J1\' 634 69J 1,324
1 678 7'rJ 1,417'80-84 i 2S! ~gf 783 . 32J 4001' 818 1 358 ,I 482 ! 848 43J I 541 971! 459 I 5CB I 963 449 i 4-?2j' 881 467 450
9171 4ffi I 4~ I 916
: i I I . I I . . I I •1 SS+ i 2~4 I 416 1 ~ I 1931 417 515 2OJ: 4C6 ! 6031 238 ! 300 I 633 !I, 251 I 3i2 I
563 1 231 I 374 6aJ I 245 33J I 623 I
2521 401 i 653
: ii s. ; 2Q! 231 473 100 . 172! 358 I 173 i 1241 2iJ7 193 1' 100 353 i 10'1! 169 273 I 131! 173 1 3041 13;j 178 I 3CE I 138 ! lfB i 3Z7.~~~5;,::7 :osce ~13731366'l~ !~~740 :7'")"'~ 1~-"424 i~~77-r-78n 1--t:'·""':lt"'V"'\?O? 138&:\79 'JJ': ~7"! :7475CJ- ,1 38" "763 136640 -7c:::.403138-t48!36r'645 i7~""93138h;251371~ !756'F'i ;'18 GC:CC::: 1
37306, "17c:::..Q7"'1 ;v~," ~, ' ,I I~, _~ ~, ''''-~J~~~S ,_ ,_",I", ,I, , v, = ' I v,'" , ,~ '" oJ'-" .~, I~ ,=--" ~.~, I,
Source: Centra: Statistical Office
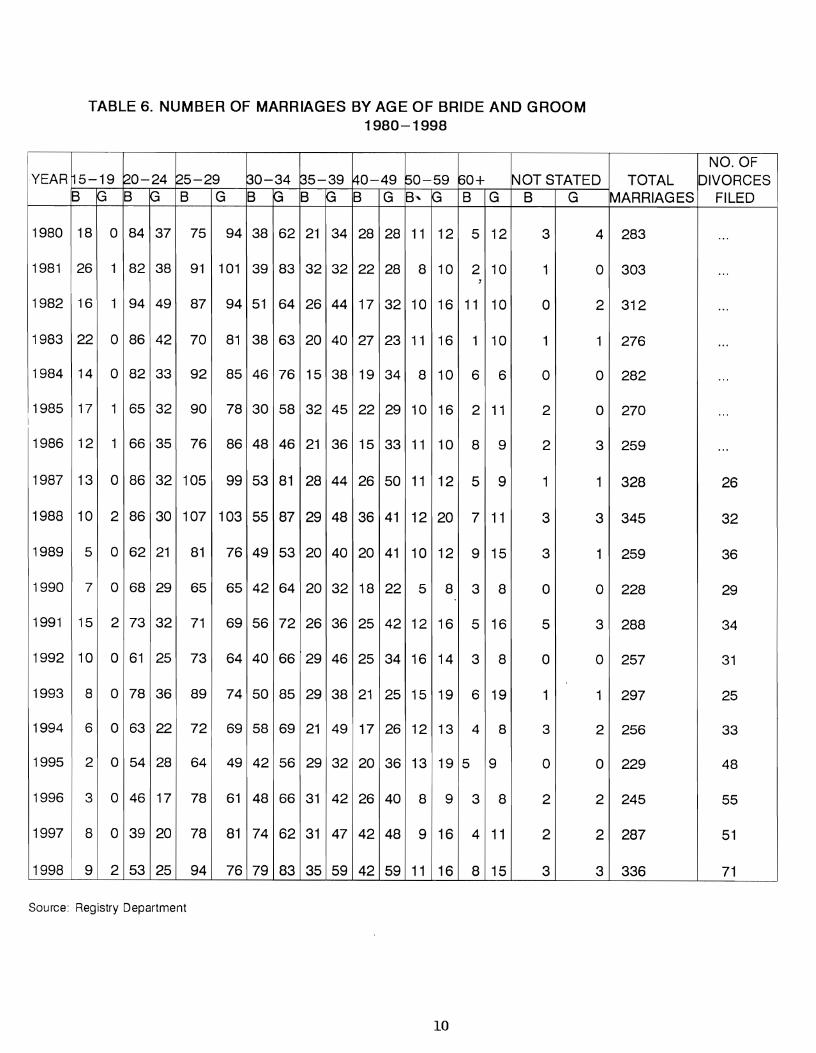
TABLE 6. NUMBER OF MARRIAGES BY AGE OF BRIDE AND GROOM1980-1998
NO. OF·YEAR ~5-19 20-24 25-29 t30-34 35-39 ~0-49 50-59 60+ NOT STATED TOTAL DIVORCES
B K3 B G B G B K3 B G B G S·' (3 B G B G MARRIAGES FILED
1980 18 0 84 37 75 94 38 62 21 34 28 28 11 12 5 12 3 4 283 ...
1981 26 1 82 38 91 101 39 83 32 32 22 28 8 10 2 10 1 0 303 ....,
1982 16 1 94 49 87 94 51 64 26 44 17 32 10 16 11 10 0 2 312 ...
1983 22 0 86 42 70 81 38 63 20 40 27 23 11 16 1 10 1 1 276 ...
1984 14 0 82 33 92 85 46 76 15 38 19 34 8 10 6 6 0 0 282 ...
1
1985 17 1 65 32 90 78 30 58 32 45 22 29 10 16 2 11 2 0 270 ...
1986 12 1 66 35 76 86 48 46 21 36 15 33 11 10 8 9 2 3 259 ...
1987 13 0 86 32 105 99 53 81 28 44 26 50 11 12 5 9 1 1 328 26
1988 10 2 86 30 107 103 55 87 29 48 36 41 12 20 7 11 3 3 345 32
1989 5 0 62 21 81 76 49 53 20 40 20 41 10 12 9 15 3 1 259 36
1990 7 0 68 29 65 65 42 64 20 32 18 22 5 8 3 8 0 0 228 29
1991 15 2 73 32 71 69 56 72 26 36 25 42 12 16 5 16 5 3 288 34
1992 10 0 61 25 73 64 40 66 29 46 25 34 16 14 3 8 0 0 257 31
1993 8 0 78 36 89 74 50 85 29 38 21 25 15 19 6 19 1 1 297 25
1994 6 0 63 22 72 69 58 69 21 49 17 26 12 13 4 8 3 2 256 33
1995 2 0 54 28 64 49 42 56 29 32 20 36 13 19 5 9 0 0 229 48
1996 3 0 46 17 78 61 48 66 31 42 26 40 8 9 3 8 2 2 245 55
1997 8 0 39 20 78 81 74 62 31 47 42 48 9 16 4 11 2 2 287 51
1998 9 2 53 25 94 76 79 83 35 59 42 59 11 16 8 15 3 3 336 71
Source: Registry Department
10

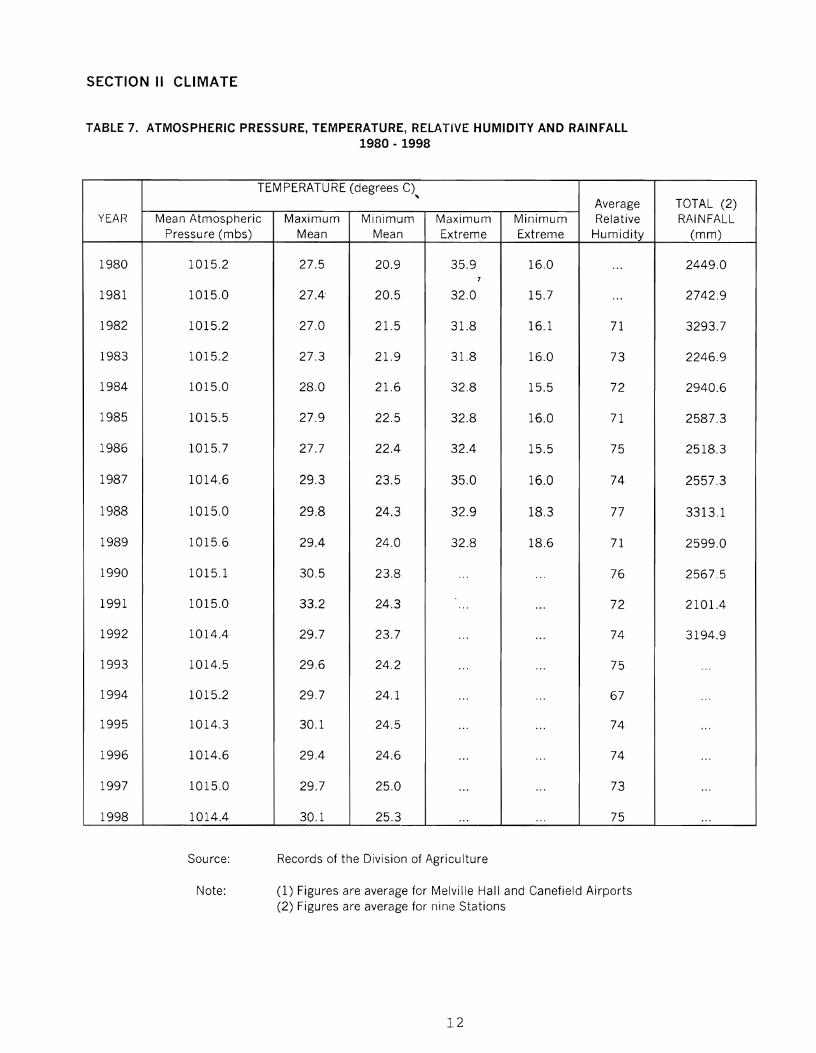
SECTION II: CLIMATE
The temperature in Dominica has increased over the years rising from a maximum
.,mean average of 27.5°C in 1980 to 30.1 °C in 1998, reflecting a 2.6°C rise (Table 7). For
the period 1980-1998 the highest maximum mean average temperature was recorded in
1991, 33.2°C while the lowest maximum mean average temperature was registered in
1982.
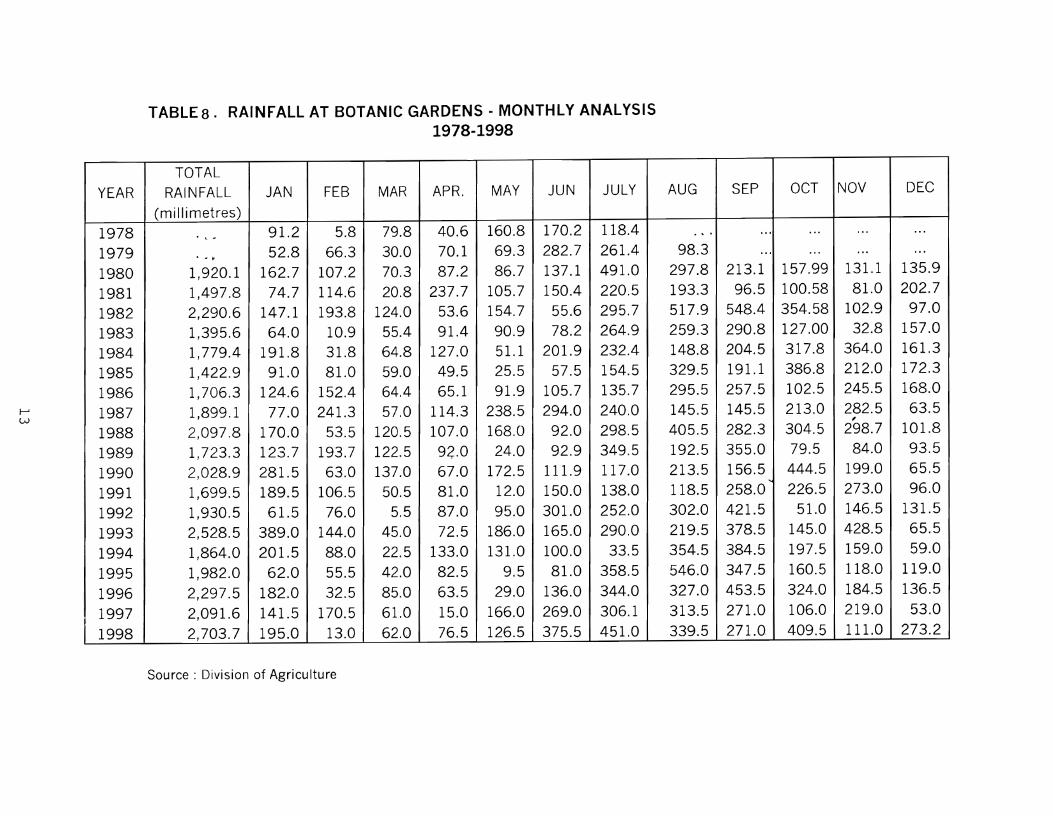
Total rainfall at the Botanic Gardens, situated in the city of Roseau on the south western
coast, increased from 1,920.1mm in 1980 to 2,703.7mm in 1998 (Table 8). Conversely,
the mean atmospheric pressure recorded a drop from 1015.2mbs in 1980 to 1014.4mbs in
1998 (Table 7). Over the years, the months of August and September have been the
wettest period, with the highest precipitation, 548.4mm, occurring in September 1982. The
driest months have been March and February, with the record lowest rainfall, 5.5mm
occurring in March 1992.
11

SECTION II CLIMATE
TABLE 7. ATMOSPHERIC PRESSURE, TEMPERATURE, RELATjVE HUMIDITY AND RAINFALL1980 - 1998
TEMPERATURE (degrees C).,Average TOTAL (2)
YEAR Mean Atmospheric Maximum Minimum Maximum Minimum Relative RAINFALLPressure (mbs) Mean Mean Extreme Extreme Humidity (mm)
1980 1015.2 27.5 20.9 35.9 16.0 ... 2449.0,1981 1015.0 27.4' 20.5 32.0 15.7 ... 2742.9
1982 1015.2 27.0 21.5 31.8 16.1 71 3293.7
1983 1015.2 27.3 21.9 31.8 16.0 73 2246.9
1984 1015.0 28.0 21.6 32.8 15.5 72 2940.6
1985 1015.5 27.9 22.5 32.8 16.0 71 2587.3
1986 1015.7 27.7 22.4 32.4 15.5 75 2518.3
1987 1014.6 29.3 23.5 35.0 16.0 74 2557.3
1988 1015.0 29.8 24.3 32.9 18.3 77 3313.1
1989 1015.6 29.4 24.0 32.8 18.6 71 2599.0
1990 1015.1 30.5 23.8 '" ... 76 2567.5
1991 1015.0 33.2 24.3 ... ... 72 2101.4
1992 1014.4 29.7 23.7 ... ... 74 3194.9
1993 1014.5 29.6 24.2 ... ... 75 ...
1994 1015.2 29.7 24.1 ... ... 67 ...
1995 1014.3 30.1 24.5 ... ... 74 ...
1996 1014.6 29.4 24.6 ... ... 74 ...
1997 1015.0 29.7 25.0 ... ... 73 ...
1998 1014.4 30.1 25.3 ... ... 75 ...
Source:
Note:
Records of the Division of Agriculture
(1) Figures are average for Melville Hall and Canefield Airports(2) Figures are average for nine Stations
12
~
w
TABLE8. RAINFALL AT BOTANIC GARDENS· MONTHLY ANALYSIS1978-1998
TOTALYEAR RAINFALL JAN FEB MAR APR. MAY JUN JULY AUG SEP OCT NOV DEC
(millimetres)
1978 . .. - 91.2 5.8 79.8 40.6 160.8 170.2 118.4 . ~ . ... ... ... ...
1979 . .... 52.8 66.3 30.0 70.1 69.3 282.7 261.4 98.3 ... ... ... ...
1980 1,920.1 162.7 107.2 70.3 87.2 86.7 137.1 491.0 297.8 213.1 157.99 131.1 135.9
1981 1,497.8 74.7 114.6 20.8 237.7 105.7 150.4 220.5 193.3 96.5 100.58 81.0 202.7
1982 2,290.6 147.1 193.8 124.0 53.6 154.7 55.6 295.7 517.9 548.4 354.58 102.9 97.0
1983 1,395.6 64.0 10.9 55.4 91.4 90.9 78.2 264.9 259.3 290.8 127.00 32.8 157.0
1984 1,779.4 191.8 31.8 64.8 127.0 51.1 201.9 232.4 148.8 204.5 317.8 364.0 161.3
1985 1,422.9 91.0 81.0 59.0 49.5 25.5 57.5 154.5 329.5 191.1 386.8 212.0 172.3
1986 1,706.3 124.6 152.4 64.4 65.1 91.9 105.7 135.7 295.5 257.5 102.5 245.5 168.0
1987 1,899.1 77.0 241.3 57.0 114.3 238.5 294.0 240.0 145.5 145.5 213.0 282.5 63.5,1988 2,097.8 170.0 53.5 120.5 107.0 168.0 92.0 298.5 405.5 282.3 304.5 298.7 101.8
1989 1,723.3 123.7 193.7 122.5 92.0 24.0 92.9 349.5 192.5 355.0 79.5 84.0 93.5
1990 2,028.9 281.5 63.0 137.0 67.0 172.5 111.9 117.0 213.5 156.5 444.5 199.0 65.5.....
1991 1,699.5 189.5 106.5 50.5 81.0 12.0 150.0 138.0 118.5 258.0 226.5 273.0 96.0
1992 1,930.5 61.5 76.0 5.5 87.0 95.0 301.0 252.0 302.0 421.5 51.0 146.5 131.5
1993 2,528.5 389.0 144.0 45.0 72.5 186.0 165.0 290.0 219.5 378.5 145.0 428.5 65.5
1994 1,864.0 201.5 88.0 22.5 133.0 131.0 100.0 33.5 354.5 384.5 197.5 159.0 59.0
1995 1,982.0 62.0 55.5 42.0 82.5 9.5 81.0 358.5 546.0 347.5 160.5 118.0 119.0
1996 2,297.5 182.0 32.5 85.0 63.5 29.0 136.0 344.0 327.0 453.5 324.0 184.5 136.5
1997 2,091.6 141.5 170.5 61.0 15.0 166.0 269.0 306.1 313.5 271.0 106.0 219.0 53.0
1998 2,703.7 195.0 13.0 62.0 76.5 126.5 375.5 451.0 339.5 271.0. 409.5 111.0 273.2
Source: Division of Agriculture
TRAVEL AND TOURISM
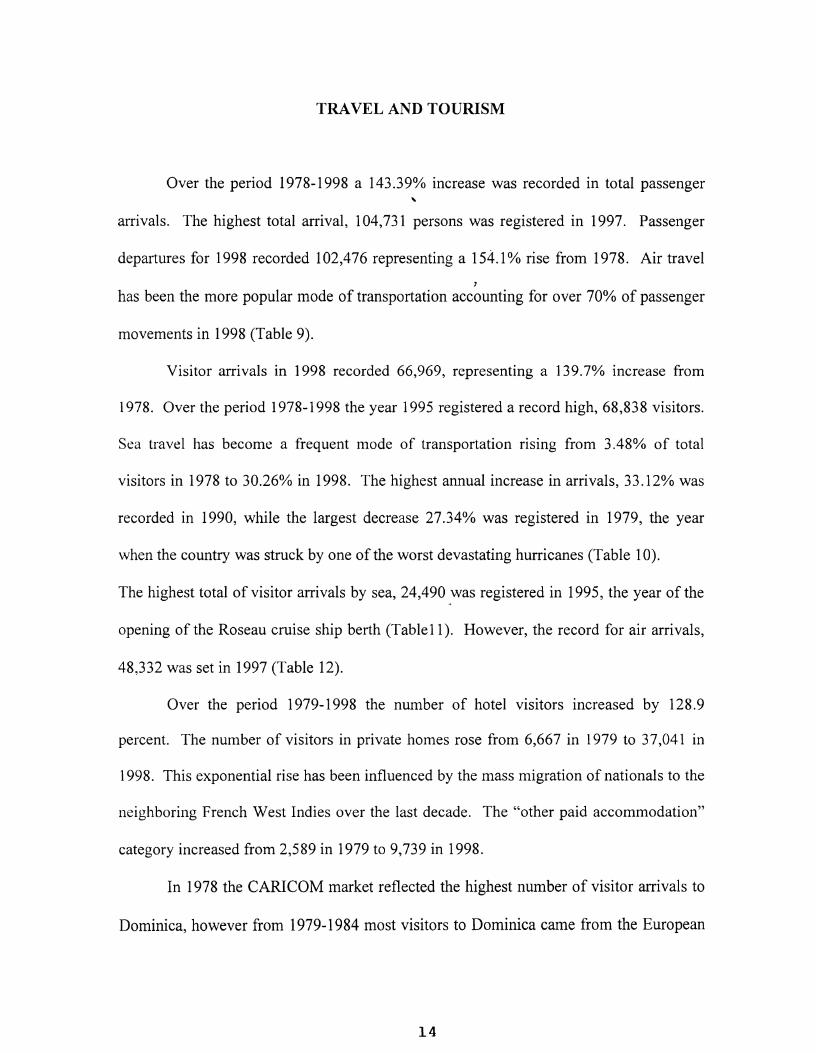
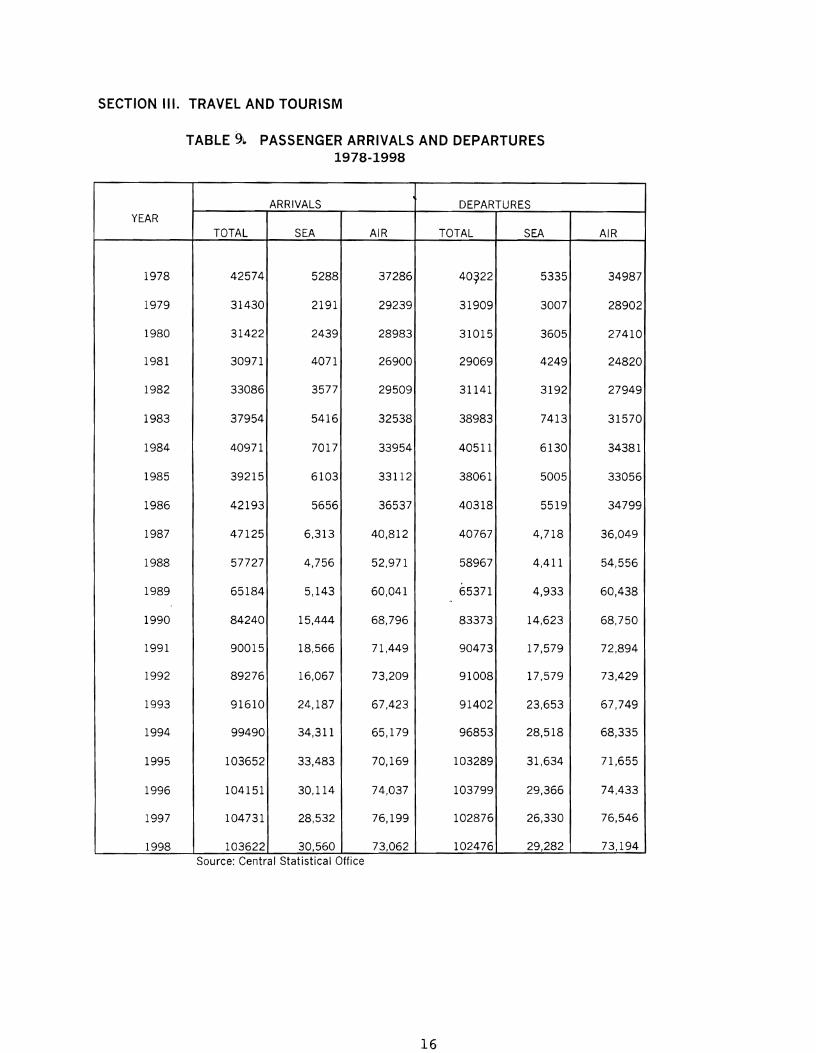
Over the period 1978-1998 a 143.39% increase was recorded in total passenger
arrivals. The highest total arrival, 104,731 persons was registered in 1997. Passenger
departures for 1998 recorded 102,476 representing a 154-.1% rise from 1978. Air travel,
has been the more popular mode of transportation accounting for over 70% of passenger
movements in 1998 (Table 9).
Visitor arrivals in 1998 recorded 66,969, representing a 139.7% increase from
1978. Over the period 1978-1998 the year 1995 registered a record high, 68,838 visitors.
Sea travel has become a frequent 1110de of transportation rising from 3.48% of total
visitors in 1978 to 30.26% in 1998. The highest annual increase in arrivals, 33.120/0 was
recorded in 1990, while the largest decrease 27.34% was registered in 1979, the year
when the country was struck by one of the worst devastating hurricanes (Table 10).
The highest total of visitor arrivals by sea, 24,490 was registered in 1995, the year of the
opening of the Roseau cruise ship berth (Table11). However, the record for air arrivals,
48,332 was set in 1997 (Table 12).
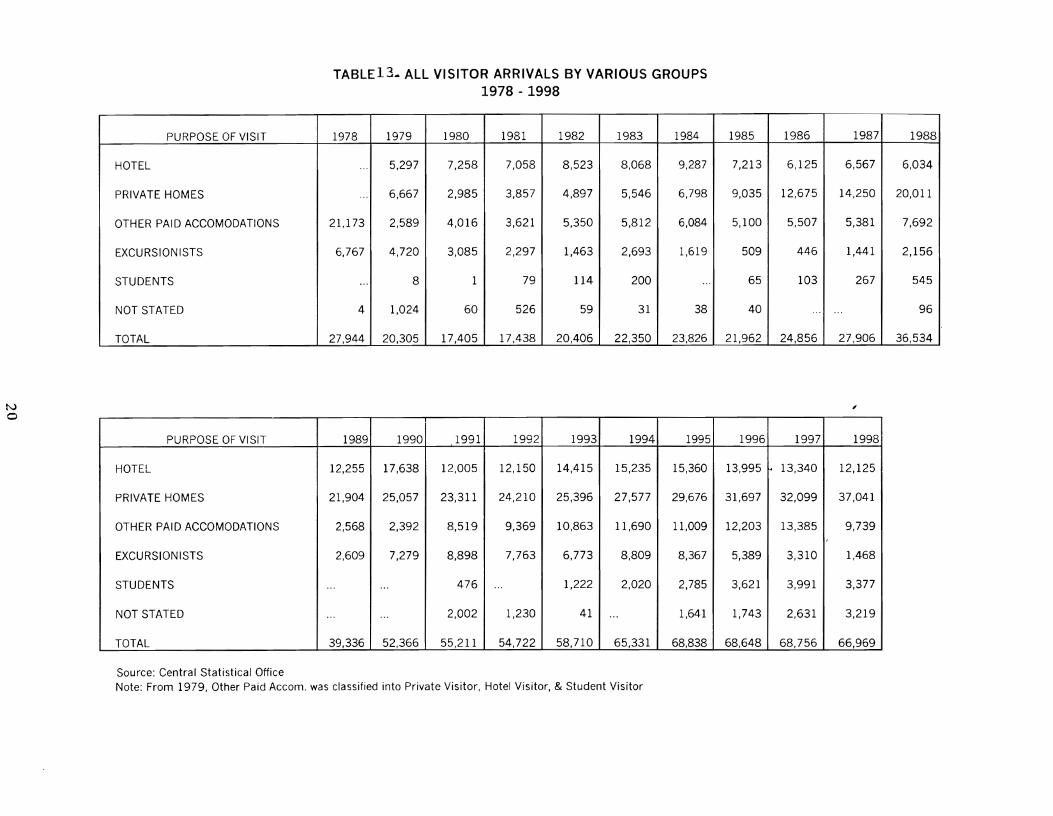
Over the period 1979-1998 the number of hotel visitors increased by 128.9
percent. The number of visitors in private homes rose from 6,667 in 1979 to 37,041 in
1998. This exponential rise has been influenced by the mass migration of nationals to the
neighbori11g Fre11ch West Indies over the last decade. The "other paid accommodation"
category increased from 2,589 in 1979 to 9,739 in 1998.
In 1978 the CARICOM market reflected the highest number of visitor arrivals to
Dominica, however from 1979-1984 most visitors to Dominica came from the European
14
market. A shift was observed again in 1985-1986, when most visitors arrived from
CARICOM countries. Europe regained dominance from 1987-1988; CARICOM was
again the leader in 1989. From 1990 to 1998 tl1e French West Indies has been the leading
market for visitor arrivals to Dominica. The American market has been increasing over
the years and since 1996 has been the second leading market. The Canadian market's
record contribution during the period was in 1988,' the commemoration of the tenth
National Independence Celebration (Table 14).
From 1978-1985 total tourist arrivals fluctuated, however from 1986-1998 total
tourist arrivals increased steadily. Total excursionists to Dominica reached a record high
8,898 ill 1991. The market has however been recording sharp decreases since 1995
(Table 15).
From 1991, Dominica became a better known cruise destination, with crUIse
arrivals increasing by 276.50/0 over the period 1991-1998 (Table 16).
Over the last five years (1994-1998) all arrivals to Dominica increased by 55.00/0 with a
95.00/0 growth in the cruise industry (Table 17).
15
SECTION III. TRAVEL AND TOURISM
TABLE ~~ PASSENGER ARRIVALS AND DEPARTURES1978-1998
ARRIVALS DEPARTURESYEAR
TOTAL SEA AIR TOTAL SEA AIR
1978 42574 5288 37286 40~22 5335 34987
1979 31430 2191 29239 31909 3007 28902
1980 31422 2439 28983 31015 3605 27410
1981 30971 4071 26900 29069 4249 24820
1982 33086 3577 29509 31141 3192 27949
1983 37954 5416 32538 38983 7413 31570
1984 40971 7017 33954 40511 6130 34381
1985 39215 6103 33112 38061 5005 33056
1986 42193 5656 36537 40318 5519 34799
1987 47125 6,313 40,812 40767 4,718 36,049
1988 57727 4,756 52,971 58967 4,411 54,556
1989 65184 5,143 60,041 65371 4,933 60,438
1990 84240 15,444 68,796 83373 14,623 68,750
1991 90015 18,566 71,449 90473 17,579 72,894
1992 89276 16,067 73,209 91008 17,579 73,429
1993 91610 24,187 67,423 91402 23,653 67,749
1994 99490 34,311 65,179 96853 28,518 68,335
1995 103652 33,483 70,169 103289 31,634 71,655
1996 104151 30,114 74,037 103799 29,366 74,433
1997 104731 28,532 76,199 102876 26,330 76,546
1998 103622 30,560 73,062 102476 29,282 73,194Source: Central Statistical Office
16
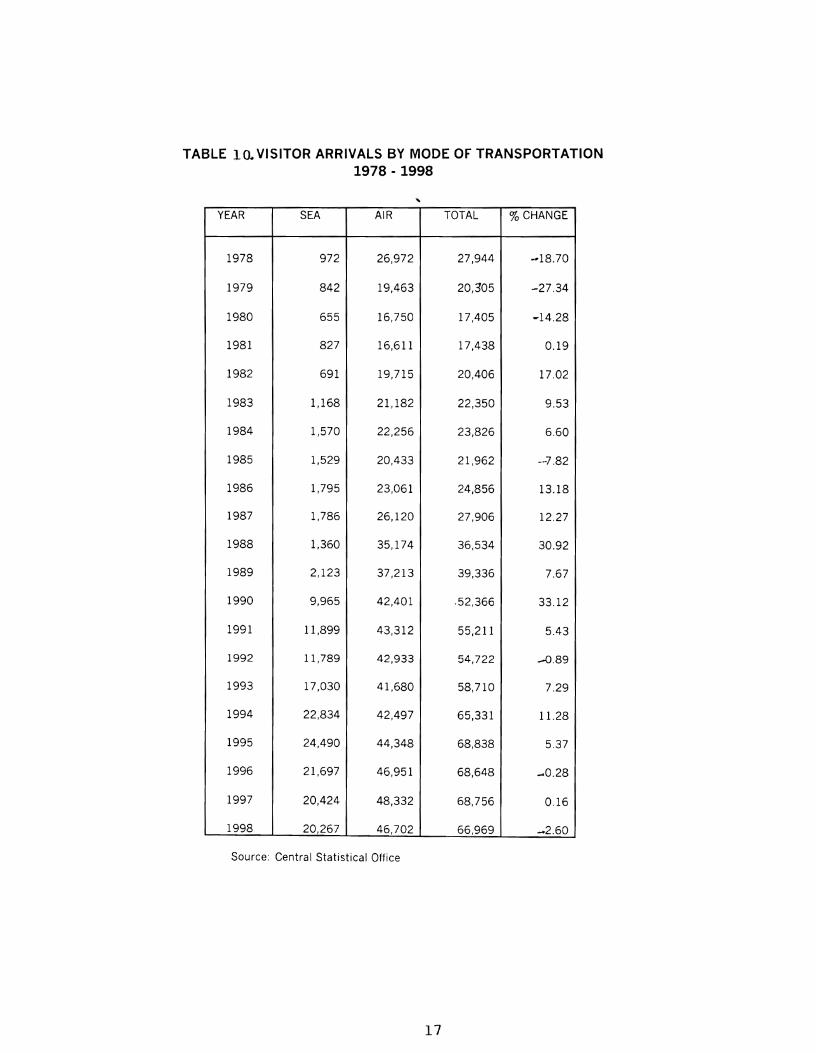
TABLE 10.. VISITOR ARRIVALS BY MODE OF TRANSPORTATION1978 · 1998
YEAR SEA AIR TOTAL %CHANGE
1978 972 26,972 27,944 ~18.70
1979 842 19,463 20,305 --27.34
1980 655 16,750 17,405 -14.28
1981 827 16,611 17,438 0.19
1982 691 19,715 20,406 17.02
1983 1,168 21,182 22,350 9.53
1984 1,570 22,256 23,826 6.60
1985 1,529 20,433 21,962 --7.82
1986 1,795 23,061 24,856 13.18
1987 1,786 26,120 27,906 12.27
1988 1,360 35,174 36,534 30.92
1989 2,123 37,213 39,336 7.67
1990 9,965 42,401 ,52,366 33.12
1991 11,899 43,312 55,211 5.43
1992 11,789 42,933 54,722 -0.89
1993 17,030 41,680 58,710 7.29
1994 22,834 42,497 65,331 11.28
1995 24,490 44,348 68,838 5.37
1996 21,697 46,951 68,648 -0.28
1997 20,424 48,332 68,756 0.16
1998 20,267 46,702 66,969 -2.60
Source: Central Statistical Office
17
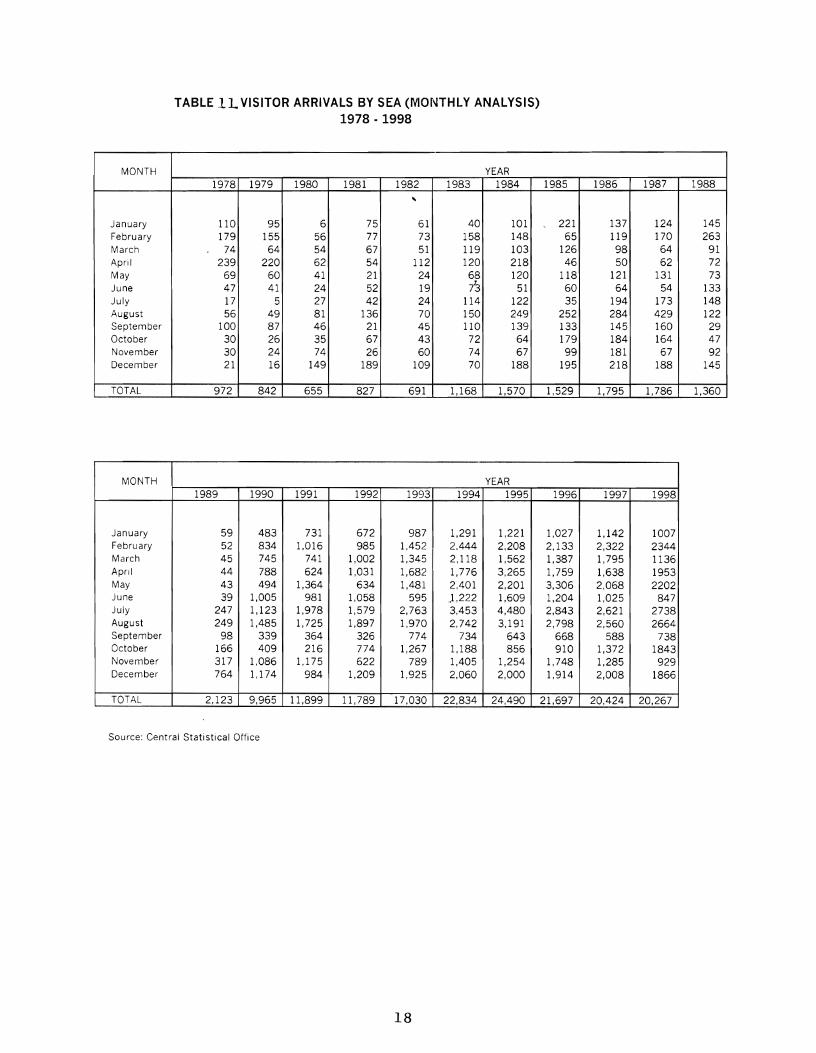
TABLE lL VISITOR ARRIVALS BY SEA (MONTHLY ANALYSIS)1978 . 1998
MONTH YEAR1978 1979 1980 1981 1982 1983 1984 1985 1986 1987 1988
"January 110 95 6 75 61 40 101 221 137 124 145February 179 155 56 77 73 158 148 65 119 170 263March 74 64 54 67 51 119 103 126 98 64 91April 239 220 62 54 112 120 218 46 50 62 72May 69 60 41 21 24 68 120 118 121 131 73June 47 41 24 52 19 73 51 60 64 54 133July 17 5 27 42 24 114 122 35 194 173 148August 56 49 81 136 70 150 249 252 284 429 122September 100 87 46 21 45 110 139 133 145 160 29October 30 26 35 67 43 72 64 179 184 164 47November 30 24 74 26 60 74 67 99 181 67 92December 21 16 149 189 109 70 188 195 218 188 145
TOTAL 972 842 655 827 691 1,168 1,570 1,529 1,795 1,786 1,360
MONTH YEAR1989 1990 1991 1992 1993 1994 1995 1996 1997 1998
January 59 483 731 672 987 1,291 1,221 1,027 1,142 1007February 52 834 1,016 985 1,452 2,444 2,208 2,133 2,322 2344March 45 745 741 1,002 1,345 2,118 1,562 1,387 1,795 1136April 44 788 624 1,031 1,682 1,776 3,265 1,759 1,638 1953May 43 494 1,364 634 1,481 2,401 2,201 3,306 2,068 2202June 39 1,005 981 1,058 595 .,1,222 1,609 1,204 1,025 847July 247 1,123 1,978 1,579 2,763 3,453 4,480 2,843 2,621 2738August 249 1,485 1,725 1,897 1,970 2,742 3,191 2,798 2,560 2664September 98 339 364 326 774 734 643 668 588 738October 166 409 216 774 1,267 1,188 856 910 1,372 1843November 317 1,086 1,175 622 789 1,405 1,254 1,748 1,285 929December 764 1,174 984 1,209 1,925 2,060 2,000 1,914 2,008 1866
TOTAL 2,123 9,965 11,899 11,789 17,030 22,834 24,490 21,697 20,424 20,267
Sou rce: Central Stati stical Office
18
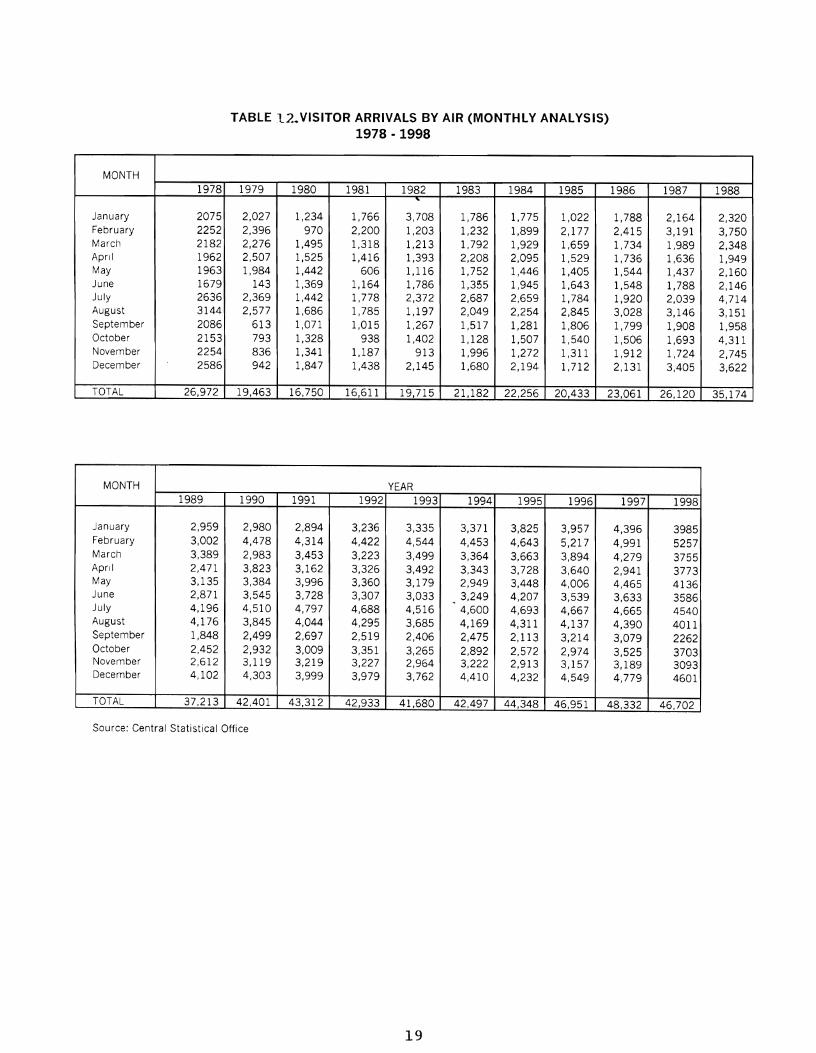
TABLE 12.. VISITOR ARRIVALS BY AIR (MONTHLY ANALYSIS)1978 ·1998
MONTH
1978 1979 1980 1981 1982 1983 1984 1985 1986 1987 1988"
January 2075 2,027 1,234 1,766 3,708 1,786 1,775 1,022 1,788 2,164 2,320February 2252 2,396 970 2,200 1,203 1,232 1,899 2,177 2,415 3,191 3,750March 2182 2,276 1,495 1,318 1,213 1,792 1,929 1,659 1,734 1,989 2,348April 1962 2,507 1,525 1,416 1,393 2,208 2,095 1,529 1,736 1,636 1,949May 1963 1,984 1,442 606 1,116 1,752 1,446 1,405 1,544 1,437 2,160June 1679 143 1,369 1,164 1,786 1,355 1,945 1,643 1,548 1,788 2,146July 2636 2,369 1,442 1,778 2,372 2,687 2,659 1,784 1,920 2,039 4,714August 3144 2,577 1,686 1,785 1,197 2,049 2,254 2,845 3,028 3,146 3,151September 2086 613 1,071 1,015 1,267 1,517 1,281 1,806 1,799 1,908 1,958October 2153 793 1,328 938 1,402 1,128 1,507 1,540 1,506 1,693 4,311November 2254 836 1,341 1,187 913 1,996 1,272 1,311 1,912 1,724 2,745December 2586 942 1,847 1,438 2,145 1,680 2,194 1,712 2,131 3,405 3,622
TOTAL 26,972 19,463 16,750 16,611 19,715 21,182 22,256 20,433 23,061 26,120 35,174
MONTH YEAR1989 1990 1991 1992 1993 1994 1995 1996 1997 1998
January 2,959 2,980 2,894 3,236 3,335 3,371 3,825 3,957 4,396 3985February 3,002 4,478 4,314 4,422 4,544 4,453 4,643 5,217 4,991 5257March 3,389 2,983 3,453 3,223 3,499 3,364 3,663 3,894 4,279 3755Apnl 2,471 3,823 3,162 3,326 3,492 3,343 3,728 3,640 2,941 3773May 3,135 3,384 3,996 3,360 3,179 2,949 3,448 4,006 4,465 4136June 2,871 3,545 3,728 3,307 3,033 3,249 4,207 3,539 3,633 3586July 4,196 4,510 4,797 4,688 4,516 4,600 4,693 4,667 4,665 4540August 4,176 3,845 4,044 4,295 3,685 4,169 4,311 4,137 4,390 4011September 1,848 2,499 2,697 2,519 2,406 2,475 2,113 3,214 3,079 2262October 2,452 2,932 3,009 3,351 3,265 2,892 2,572 2,974 3,525 3703November 2,612 3,119 3,219 3,227 2,964 3,222 2,913 3,157 3,189 3093December 4,102 4,303 3,999 3,979 3,762 4,410 4,232 4,549 4,779 4601
TOTAL 37,213 42,401 43,312 42,933 41,680 42,497 44,348 46,951 48,332 46,702
Source: Central Statistical Office
19
tvo
TABLE13- ALL VISITOR ARRIVALS BY VARIOUS GROUPS1978 - 1998
PURPOSE OF VISIT 1978 1979 1980 1981 1982 1983 1984 1985 1986 1987 1988
HOTEL ... 5,297 7,258 7,058 8,523 8,068 9,287 7,213 6,125 6,567 6,034
PRIVATE HOMES ... 6,667 2,985 3,857 4,897 5,546 6,798 9,035 12,675 14,250 20,011
OTHER PAID ACCOMODATIONS 21,173 2,589 4,016 3,621 5,350 5,812 6,084 5,100 5,507 5,381 7,692
EXCURSIONISTS 6,767 4,720 3,085 2,297 1,463 2,693 1,619 509 446 1,441 2,156
STUDENTS ... 8 1 79 114 200 ... 65 103 267 545
NOT STATED 4 1,024 60 526 59 31 38 40 ... ... 96
TOTAL 27,944 20,305 17,405 17,438 20,406 22,350 23,826 21,962 24,856 27,906 36,534
,
PURPOSE OF VISIT 1989 1990 1991 1992 1993 1994 1995 1996 1997 1998
HOTEL 12,255 17,638 12,005 12,150 14,415 15,235 15,360 13,995 13,340 12,125
PRIVATE HOMES 21,904 25,057 23,311 24,210 25,396 27,577 29,676 31,697 32,099 37,041
OTHER PAID ACCOMODATIONS 2,568 2,392 8,519 9,369 10,863 11,690 11,009 12,203 13,385 9,739
EXCURSIONISTS 2,609 7,279 8,898 7,763 6,773 8,809 8,367 5,389 3,310 1,468
STUDENTS ... ... 476 ... 1,222 2,020 2,785 3,621 3,991 3,377
NOT STATED ... ... 2,002 1,230 41 ... 1,641 1,743 2,631 3,219
TOTAL 39,336 52,366 55,211 54,722 58,710 65,331 68,838 68,648 68,756 66,969
Source: Central Statistical OfficeNote: From 1979, Other Paid Accom. was classified into Private Visitor, Hotel Visitor, & Student Visitor
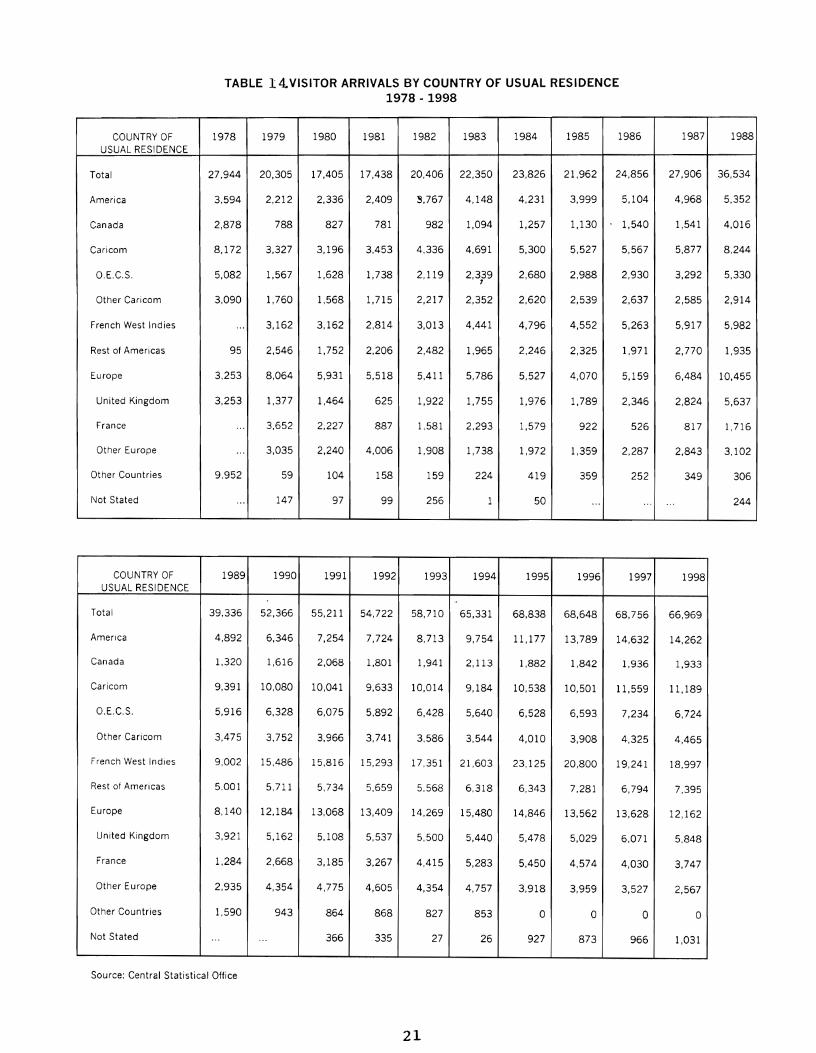
TABLE 14.VISITOR ARRIVALS BY COUNTRY OF USUAL RESIDENCE1978 - 1998
COUNTRY OF 1978 1979 1980 1981 1982 1983 1984 1985 1986 1987 1988USUAL RESIDENCE
Total 27,944 20,305 17,405 17,438 20,406 22,350 23,826 21,962 24,856 27,906 36,534
America 3,594 2,212 2,336 2,409 S,767 4,148 4,231 3,999 5,104 4,968 5,352
Canada 2,878 788 827 781 982 1,094 1,257 1,130 1,540 1,541 4,016
Caricom 8,172 3,327 3,196 3,453 4,336 4,691 5,300 5,527 5,567 5,877 8,244
O.E.C.S. 5,082 1,567 1,628 1,738 2,119 2,339 2,680 2,988 2,930 3,292 5,330,Other Caricom 3,090 1,760 1,568 1,715 2,217 2,352 2,620 2,539 2,637 2,585 2,914
French West Indies ... 3,162 3,162 2,814 3,013 4,441 4,796 4,552 5,263 5,917 5,982
Rest of Americas 95 2,546 1,752 2,206 2,482 1,965 2,246 2,325 1,971 2,770 1,935
Europe 3,253 8,064 5,931 5,518 5,411 5,786 5,527 4,070 5,159 6,484 10,455
United Kingdom 3,253 1,377 1,464 625 1,922 1,755 1,976 1,789 2,346 2,824 5,637
France ... 3,652 2,227 887 1,581 2,293 1,579 922 526 817 1,716
Other Europe ... 3,035 2,240 4,006 1,908 1,738 1,972 1,359 2,287 2,843 3,102
Other Countries 9,952 59 104 158 159 224 419 359 252 349 306
l\Jot Stated ... 147 97 99 256 1 50 ... ... ... 244
COUNTRY OF 1989 1990 1991 1992 1993 1994 1995 1996 1997 1998USUAL RESI DENCE
Total 39.336 52,366 55,211 54,722 58,710 65,331 68,838 68,648 68,756 66,969
Amenca 4,892 6,346 7,254 7,724 8,713 9,754 11,177 13,789 14,632 14,262
Canada 1,320 1,616 2,068 1,801 1,941 2,113 1,882 1,842 1,936 1,933
Caricom 9,391 10,080 10,041 9,633 10,014 9,184 10,538 10,501 11,559 11,189
O.E.C.S. 5,916 6,328 6,075 5,892 6,428 5,640 6,528 6,593 7,234 6,724
Other Caricom 3,475 3,752 3,966 3,741 3,586 3,544 4,010 3,908 4,325 4,465
French West Indies 9,002 15,486 15,816 15,293 17,351 21,603 23,125 20,800 19,241 18,997
Rest of Americas 5.001 5,711 5,734 5,659 5,568 6,318 6,343 7,281 6,794 7,395
Europe 8,140 12,184 13,068 13,409 14,269 15,480 14,846 13,562 13,628 12,162
United Kingdom 3,921 5,162 5,108 5,537 5,500 5,440 5,478 5,029 6,071 5,848
France 1,284 2,668 3,185 3,267 4,415 5,283 5,450 4,574 4,030 3,747
Other Europe 2,935 4,354 4,775 4,605 4,354 4,757 3,918 3,959 3,527 2,567
Other Countries 1,590 943 864 868 827 853 ° ° 0 0
Not Stated ... ... 366 335 27 26 927 873 966 1,031
Source: Central Statistical Office
21
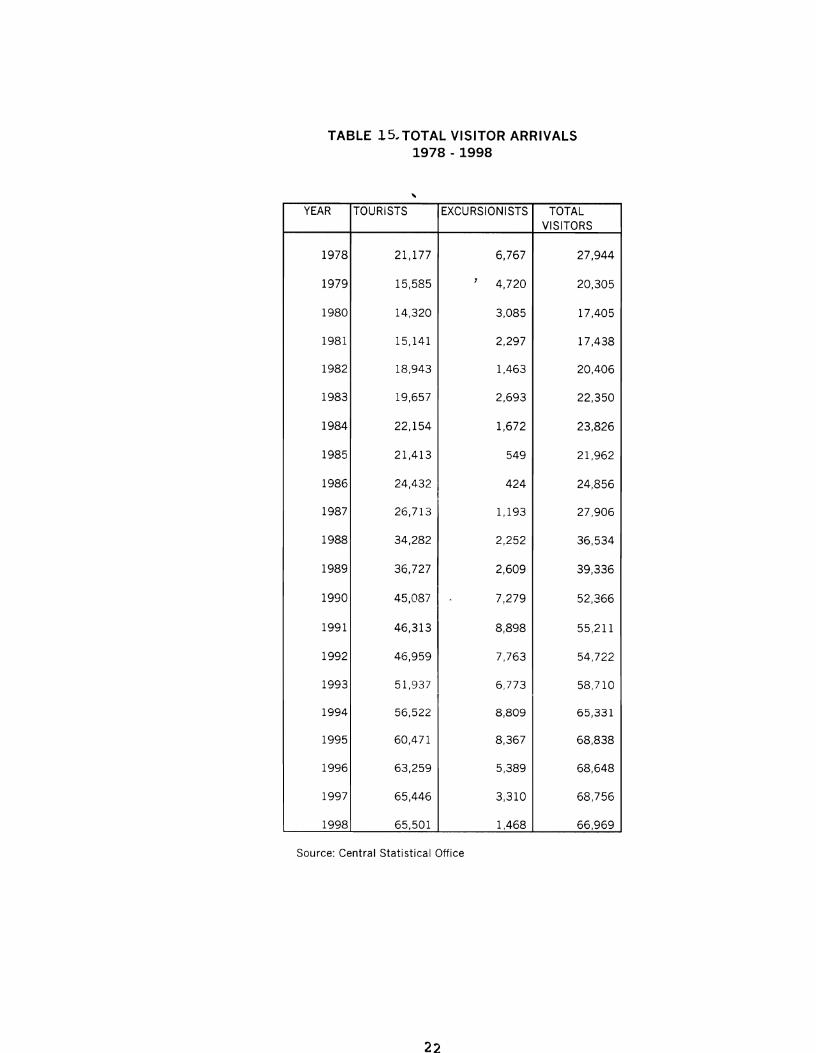
TABLE 15; TOTAL VISITOR ARRIVALS1978 - 1998
YEAR TOURISTS EXCURSIONISTS TOTALVISITORS
1978 21,177 6,767 27,944
1979 15,585.,
4,720 20,305
1980 14,320 3,085 17,405
1981 15,141 2,297 17,438
1982 18,943 1,463 20,406
1983 19,657 2,693 22,350
1984 22,154 1,672 23,826
1985 21,413 549 21,962
1986 24,432 424 24,856
1987 26,713 1,193 27,906
1988 34,282 2,252 36,534
1989 36,727 2,609 39,336
1990 45,087 7,279 52,366
1991 46,313 8,898 55,211
1992 46,959 7,763 54,722
1993 51,937 6,773 58,710
1994 56,522 8,809 65,331
1995 60,471 8,367 68,838
1996 63,259 5,389 68,648
1997 65,446 3,310 68,756
1998 65,501 1,468 66,969
Source: Central Statistical Office
22

TABLE 16.ARRIVALS BY CRUISE SHIPS1979 · 1998
YEAR NO.OF N\).OF % CHANGECALLS PASSENGERS PASSENGERS
1979 16 7770 ...
1980 22 7377 ...,5.1
1981 23 5456 ,...26.0
1982 7 2362 ~56.7
1983 17 6112 158.8
1984 11 3216 -47.4
1985 15 6602 105.3
1986 38 11454 73.5
1987 26 12,080 5.5
1988 59 9,008 -£25.4
1989 48 7,330 -18.6
1990 40 6,777 -7.5
1991 130 64,970 858.7
1992 189 89,835 38.3
1993 215 87,836 .-'2.2
1994 244 125,541 42.9
1995 267 134,921 7.5
1996 290 193,484 43.4
1997 244 230,581 19.2
1998 268 244603 6.1
Source: Central Statistical Office
23
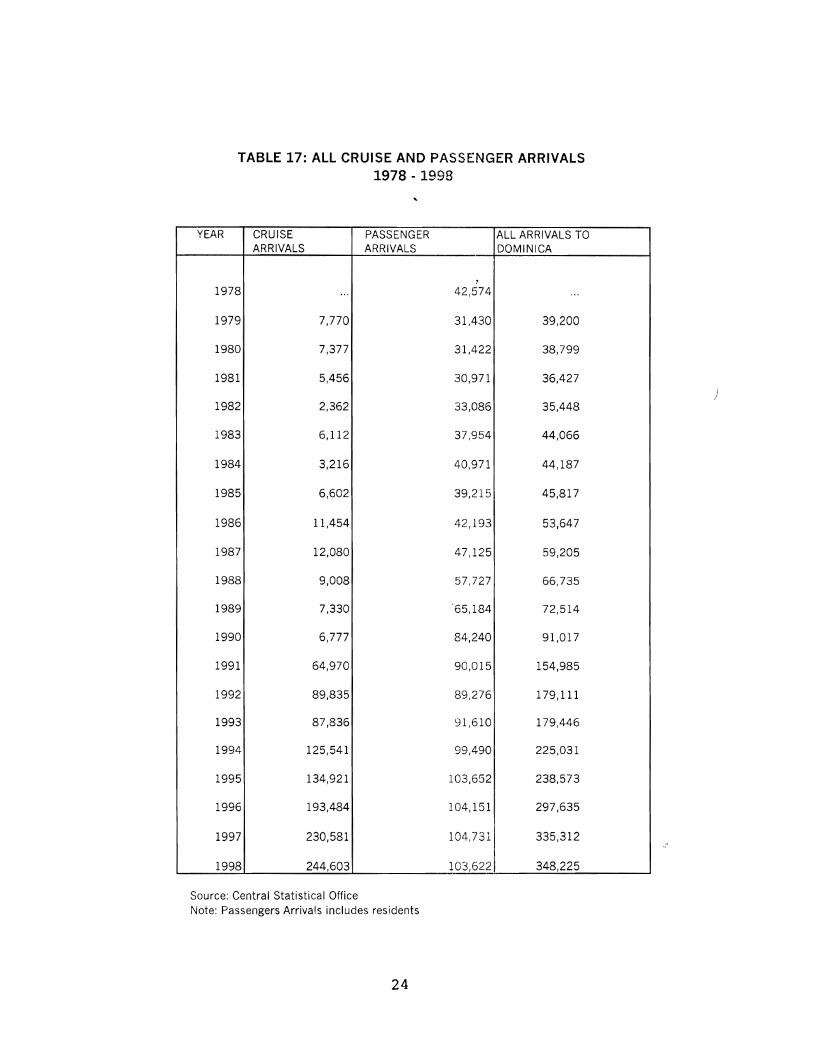
TABLE 17: ALL CRUISE AND PASSENGER ARRIVALS1978 - 1998
YEAR CRUISE PASSENGER ALL ARRIVALS TOARRIVALS ARRIVALS DOMINICA
]
1978 ... 42,574 ...
1979 7,770 31,430 39,200
1980 7,377 31,422 38,799
1981 5,456 30,971 36,427
1982 2,362 33,086 35,448
1983 6,112 37,954 44,066
1984 3,216 40,971 44,187
1985 6,602 39,215 45,817
1986 11,454 42,193 53,647
1987 12,080 47,125 59,205
1988 9,008 57,727 66,735
1989 7,330 '65,184 72,514
1990 6,777 84,240 91,017
1991 64,970 90,015 154,985
1992 89,835 89,276 179,111
1993 87,836 91,610 179,446
1994 125,541 99,490 225,031
1995 134,921 103,652 238,573
1996 193,484 104,151 297,635
1997 230,581 104,731 335,312
1998 244,603 103,622 348,225
Source: Central Statistical OfficeNote: Passengers Arrivals includes residents
24
)


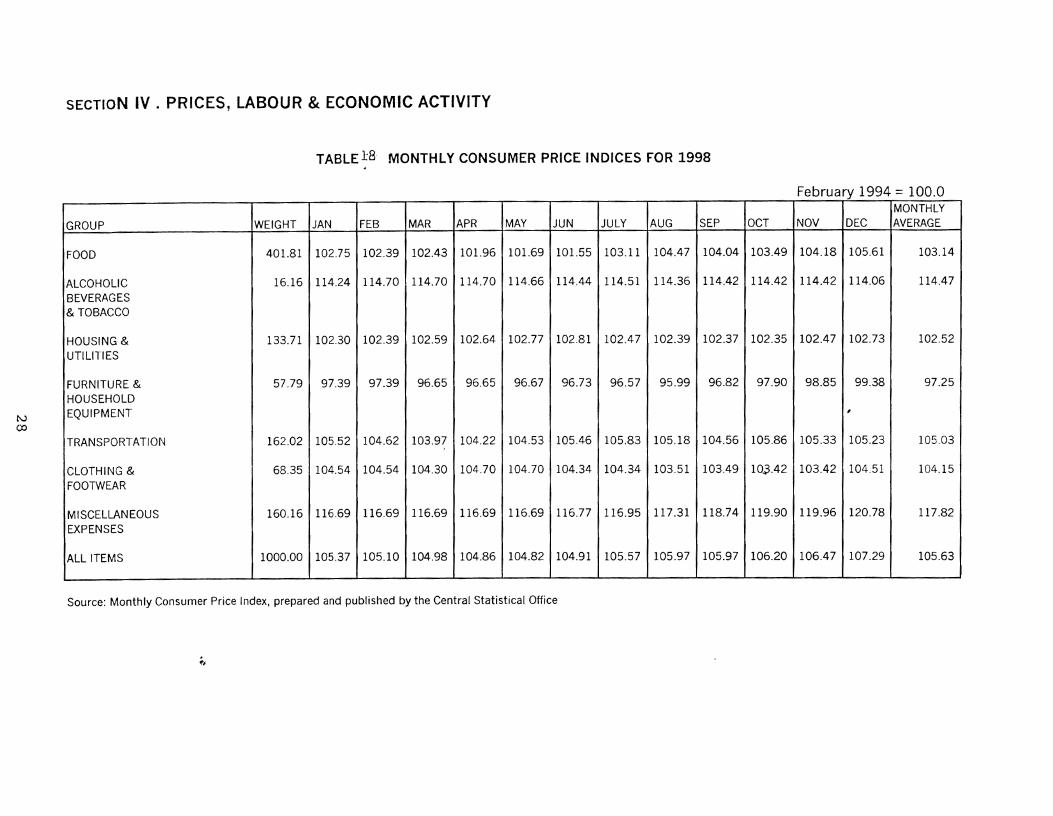
SECTION IV: Prices, Labour arld l~tonomicActivity.
1"'he All Items Index for 1998 recorded 105.63 ref1ecting a 5.63 percent increase
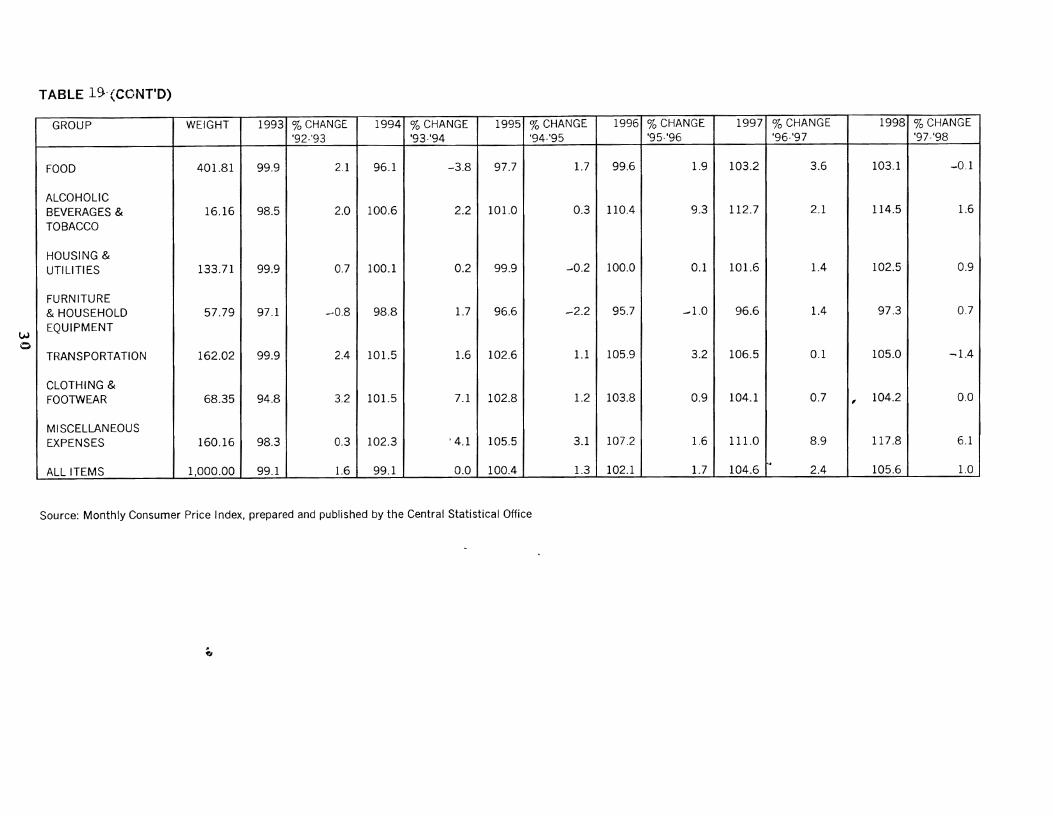
over tIle February 1994 base period (Table 18). Over tIle period 1987 to 1998 the All
Items Il1dex rose from 77.2 in 1987 to 105.6 in 1998 (\\Tith February 1994 as tIle base
period), registerillg an average annual increase of 3.35% over the 11 year period. The
highest alld lowest indices in 1987 were noted in the groups, TRANSPORTATION, 87.5
and CLOr-fHING AND FOOTWEAR, 65.5 respectively. rrhis trend changed over the
years alld in 1998 the MISCELLANEOUS EXPENSES group recorded 117.8, the
11igllCSt illdex wilile FURNITURE AND HOUSEHOLD EQUIPMENT registered t11e
lo\vest il1dex, 97.3. The HOUSING AND UTILlrrIES groUl) index recorded the highest
percelltage illcrease, 18.6 in 1990 (Table 19).
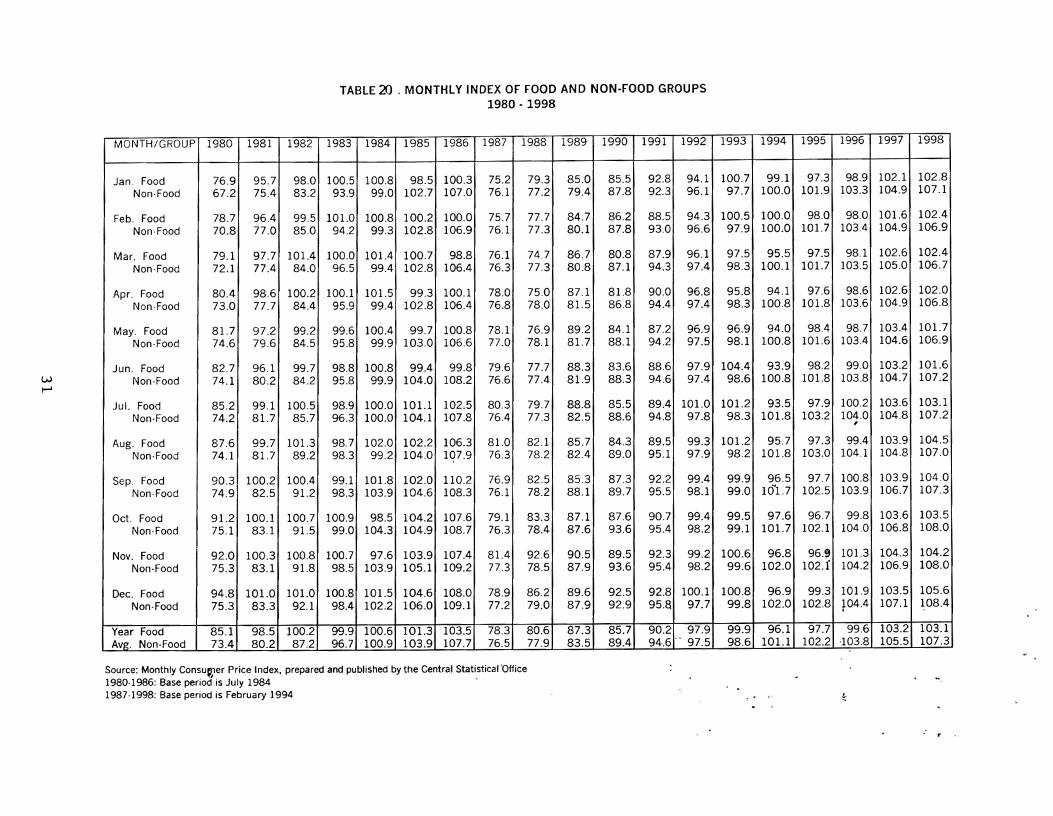
The FOOD group index registered 85.1 in 1980 and 103.5 in 1986 (with July
1984 as the base period) representing all average allnual increase of3.600/0. Over the
years 1987-1993 (with February 1994 as the base period) the FOOD group index
registered 78.3 in 1987 and 99.9 in 1993, reflectillg a 4.600/0 average annual increase. For
the period 1994-1998, tIle FOOD group illdex recorded 96.1 in 1994 alld 103.1 in 1998,
representing an average all11ual increase of 1.82~) Cl'able 20).
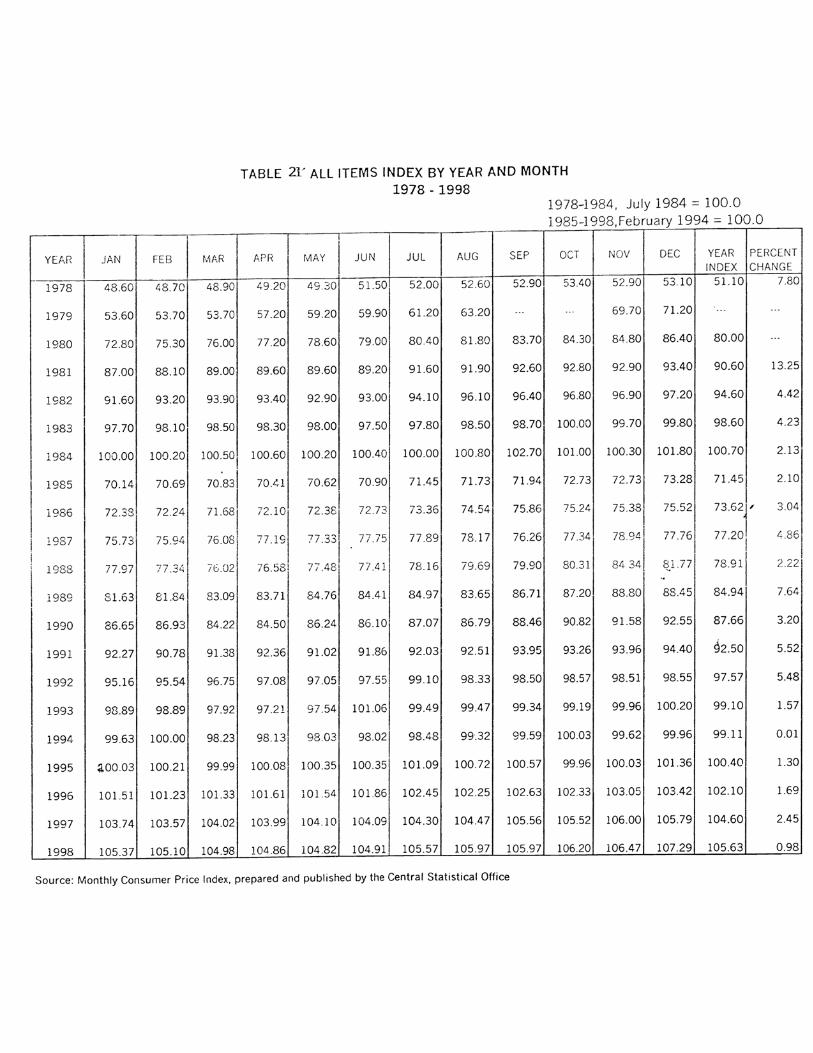
FrOll1 1985-1998 the All Iten1s index lTIoved frOlYl 71.45 in 1985 to 105.63 in 1998
reflecting an average annual increase of3.7% (rr8ble 21).
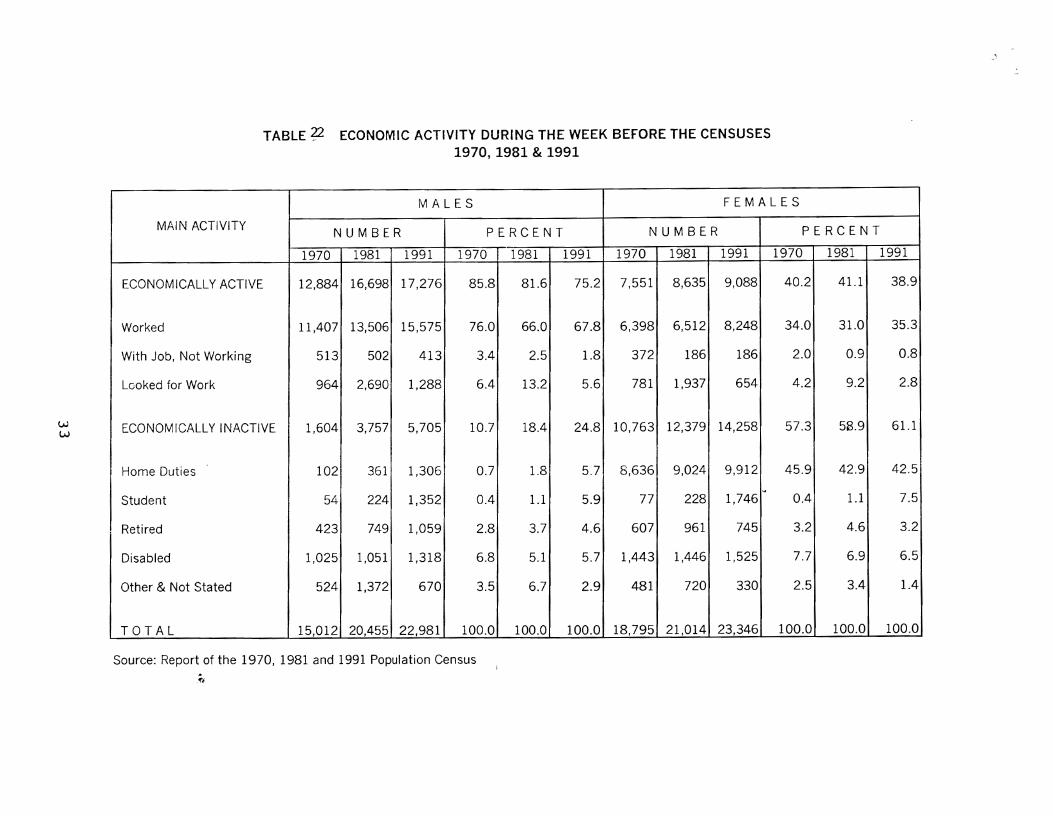
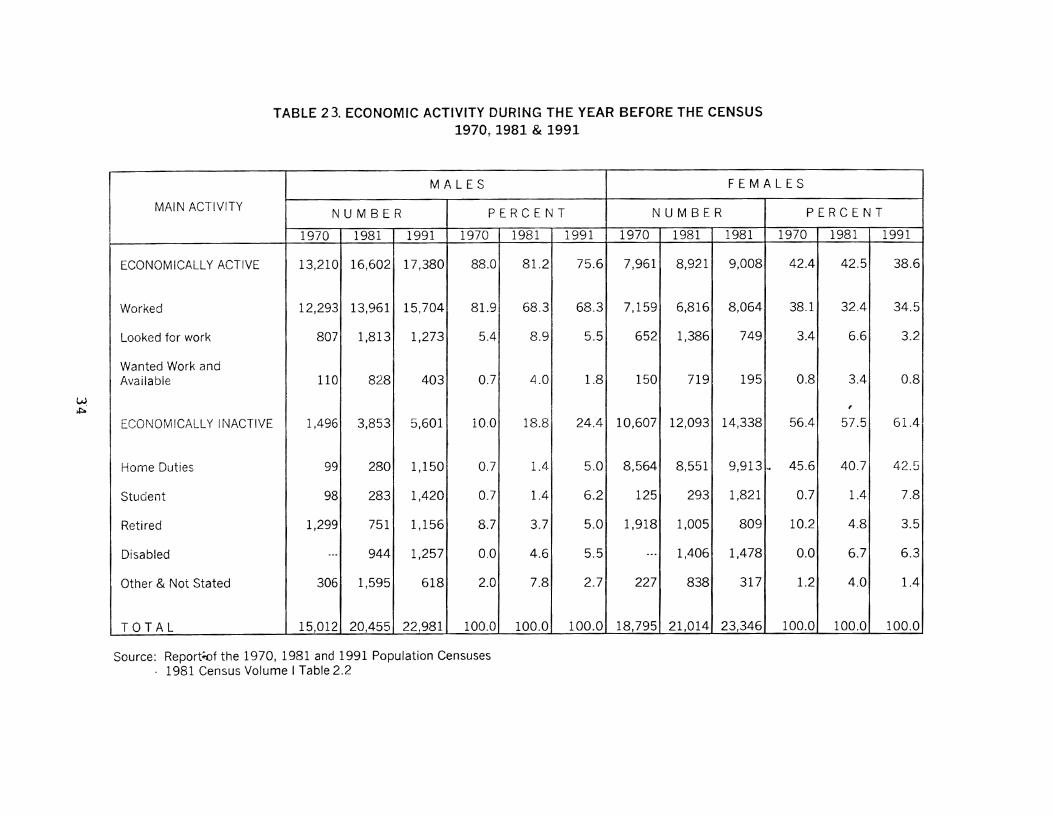
Over tIle census years 1970, 1981 al1d 1991 tIle percentage of ecollolnically active
l1lales during tIle week and year before the censuses 11ad recorded continllous decreases.
Anlong tIle econolnically inactive n1ales, the percen U.lge of stlldents increased over both
25

periods. In 1991 the percentage of female students aOlong tl1e ecoll0mically it:active
surpassed that of male students. A steady percentage illcrease was reflected over the
period 1970-1991 in the nllITlber of econom.ically i11UCtive males and females (Tables 22
& 23).
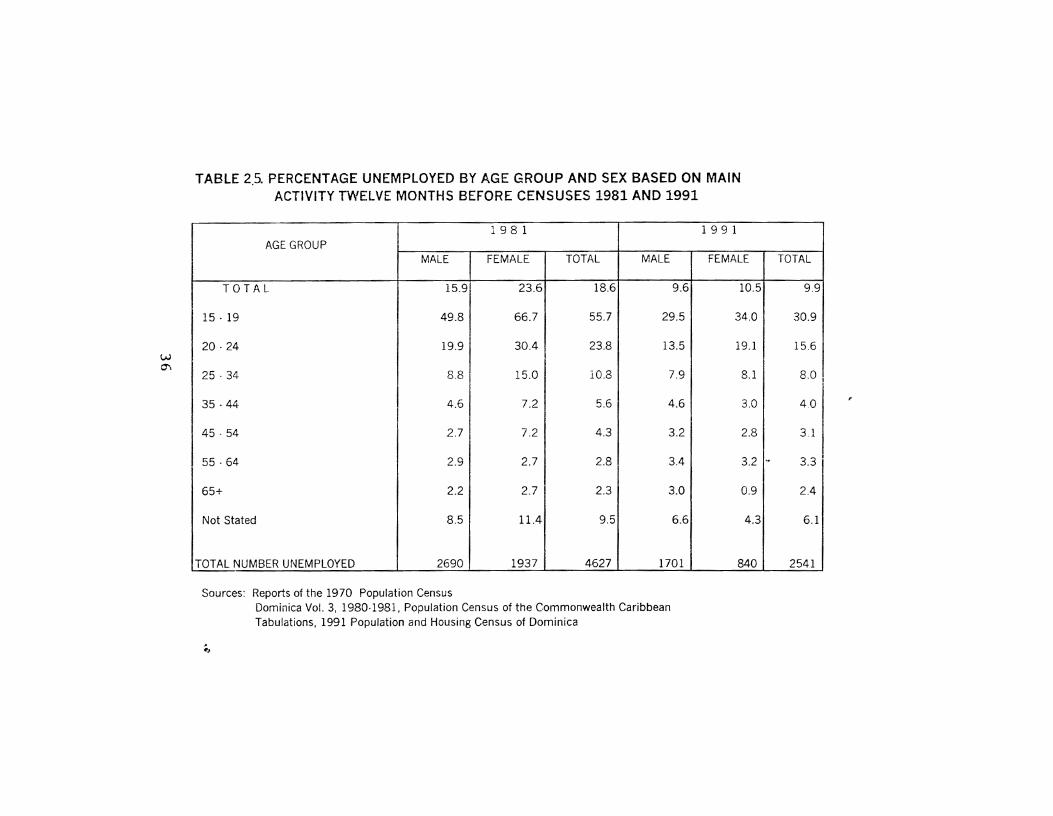
Unemployment fluctuated over the census years registering a significaIlt drop
from 1981-1991. From 1970-1981 unemployed fell1ales continllally recorded a higher
percentage than males (Table 24).
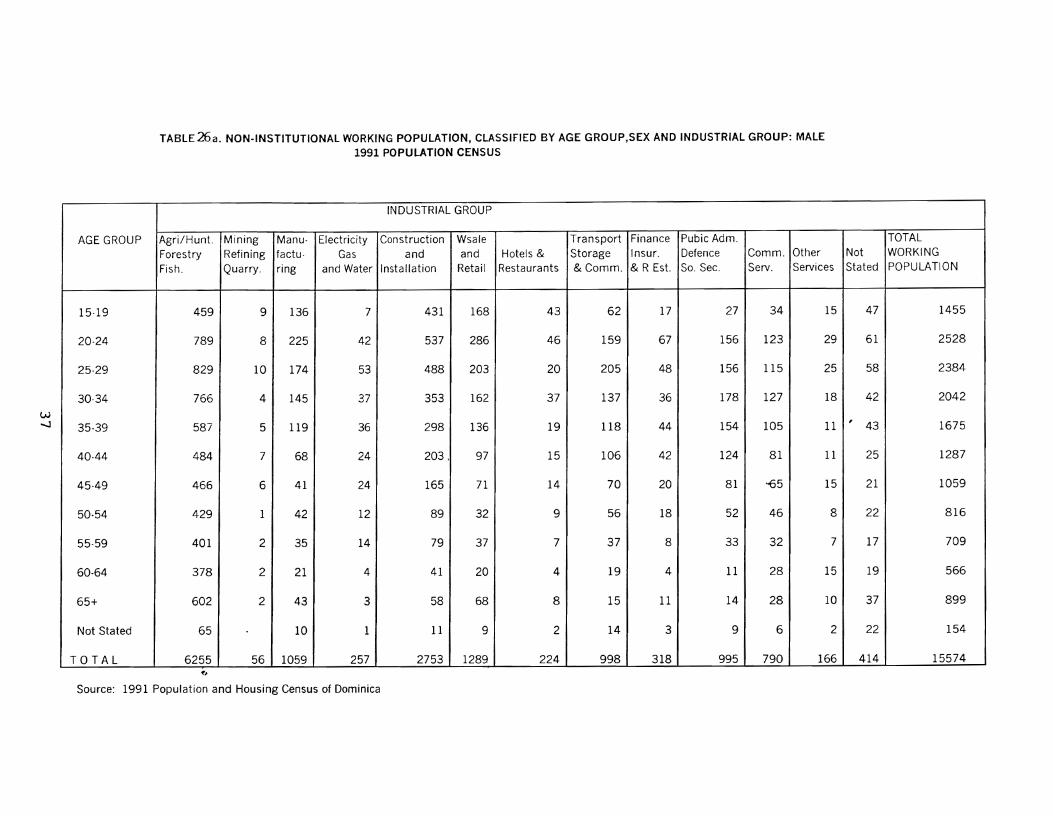
'-[he Agriculture indllstrial grollp accounted for 40.16% of the male working
populatioll. This \vas followed by the Construction ,uld InstallatioIl, 17.70/0 and
Wholesale and Retail, 8.28% industrial groups respectively. I'he age group 20-34
accounted for 45.0% of the total male working pOIJulation (Table 26A).
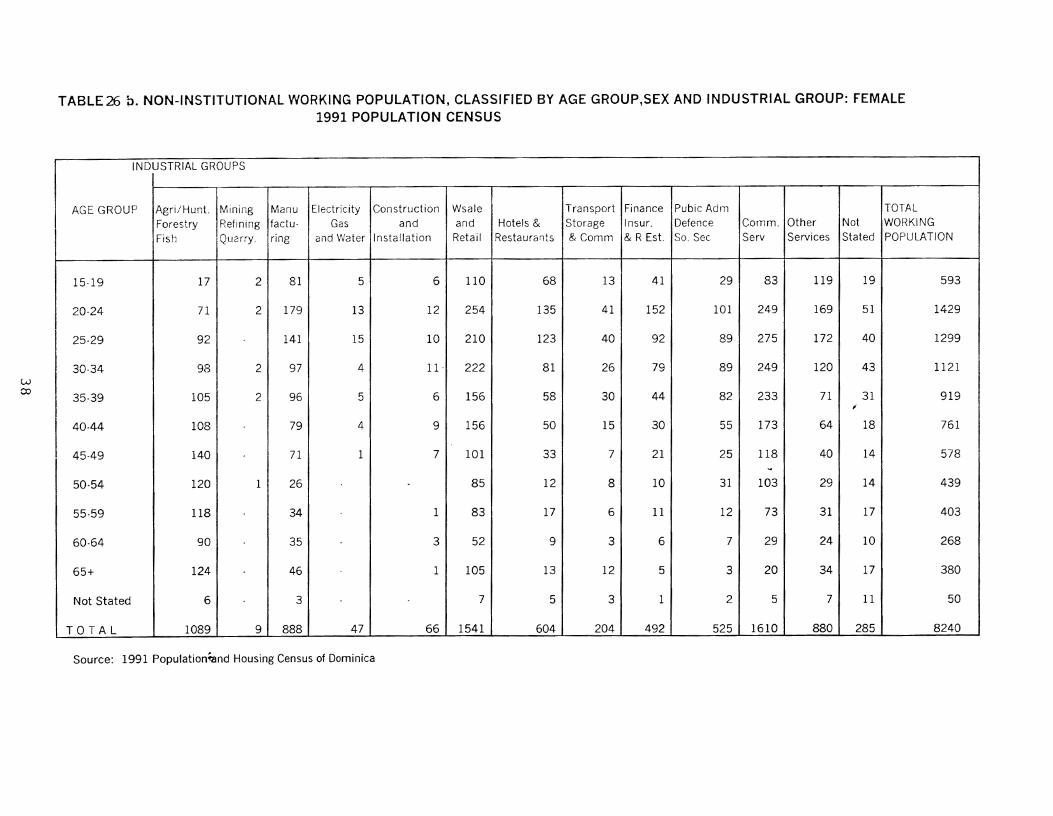
The 1991 Population Census revealed tllat 19.5 % of working women were
employed in the Community Services industrial grau.p. ~rhe Wholesale and Retail, and
Agriculture groups followed closely with 18.7% alld 13.2% respectively. The 20-34 age
group represented 47.0% of the total female \vorking pOplllation (Table 26B).
Agriclliture accollnted for al1110st one third of tlle entire working population.
I~orty-five percent oft11e total \vorl(ing popll1ation fell vv'itllin the 20-34 age grollp. The
age group 15-19 registered 2,048 reprcsenti11g about 9.0 percent of the working
pOIJulation Cfable 26C).
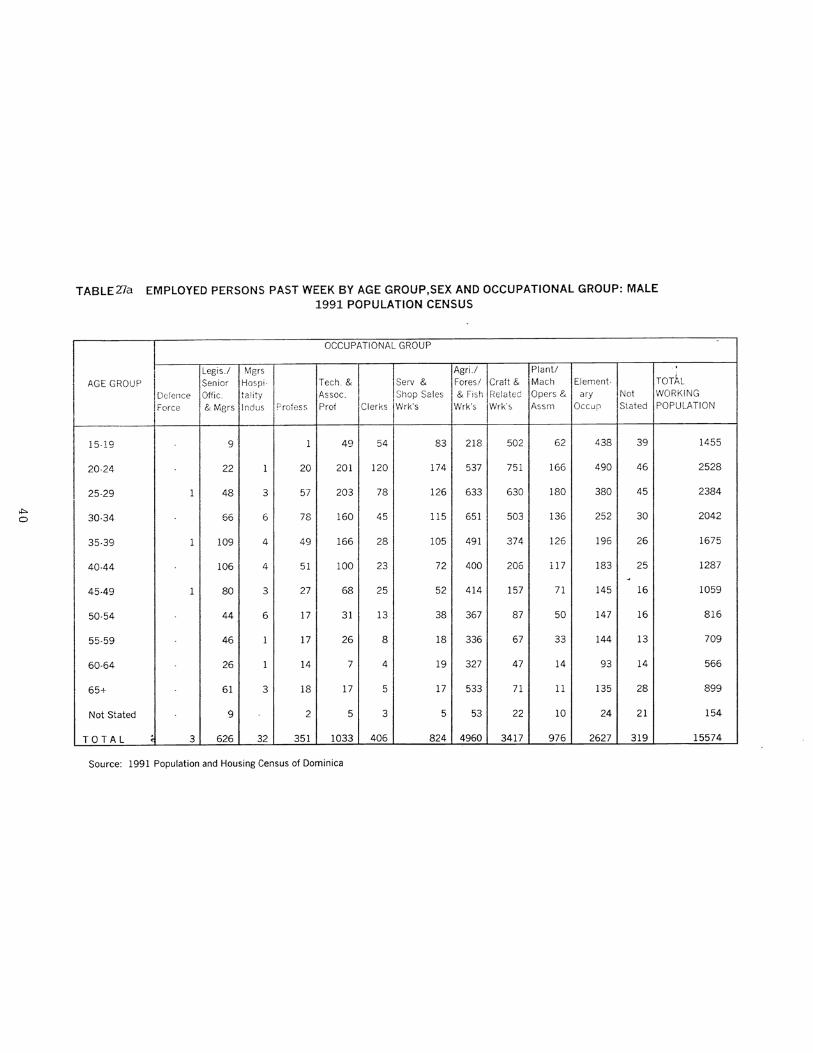
Of all oCCllpatiol1ul groups Agriculture accounted for 31.80/0 of male workers.
Craft and Related Workers, 21.90/0 and Eienlentary Occupation, 16.90/0 \vere the lle¥t
largest groups (Table 27A).

Of all female workers, 21.8% \vere enlployed in tIle Elementary Occupation. This
was followed by those holding clerical jobs, 18.30/0 and '-reaching and Associate
Professions, 15.3 percent (Table 27B).
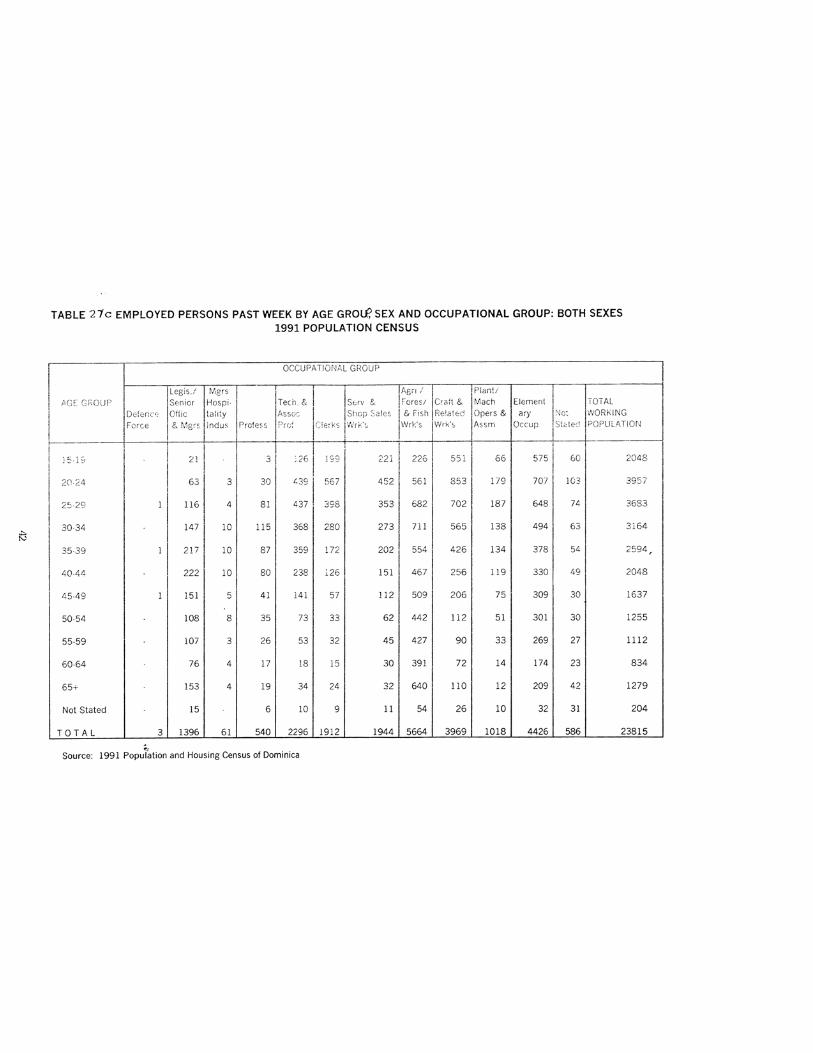
In 1991, Agriculture, the largest occupational group, accounted for 23.8% of all
elnployed persons in DOlllinica. Elementary Occupation and Craft and Related Workers
,represented 18.6 and 16.7 percent of all workers respectively (Table 27C).
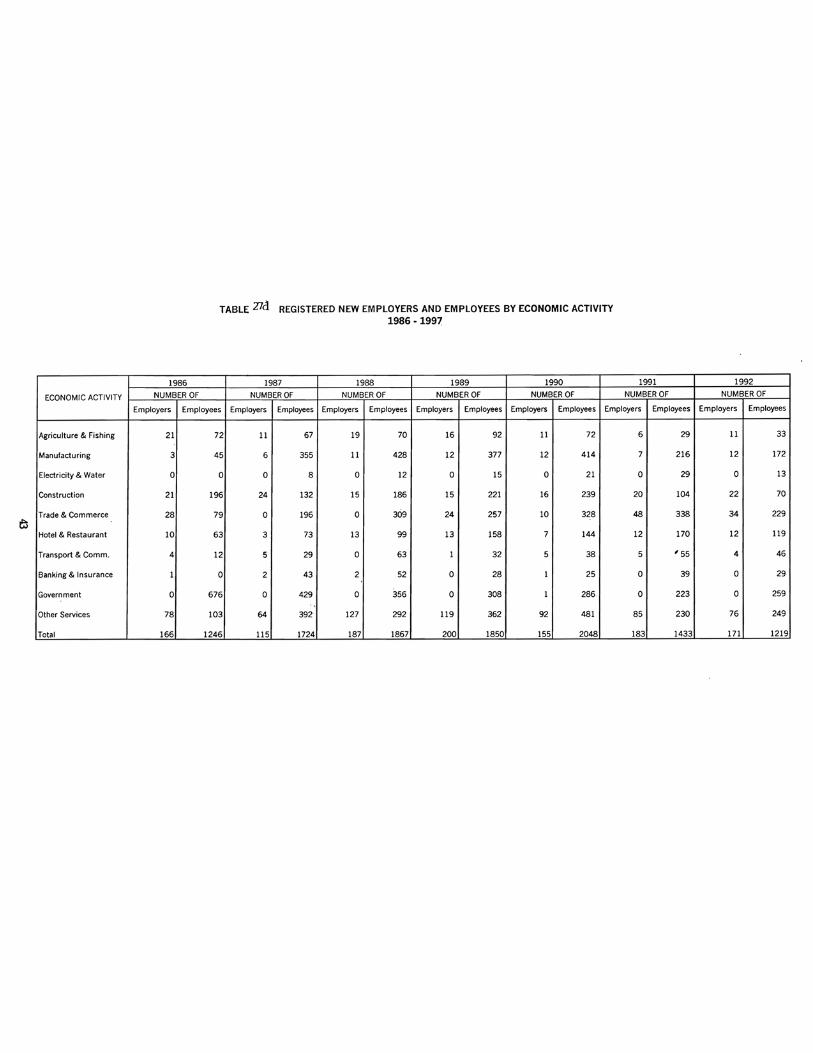
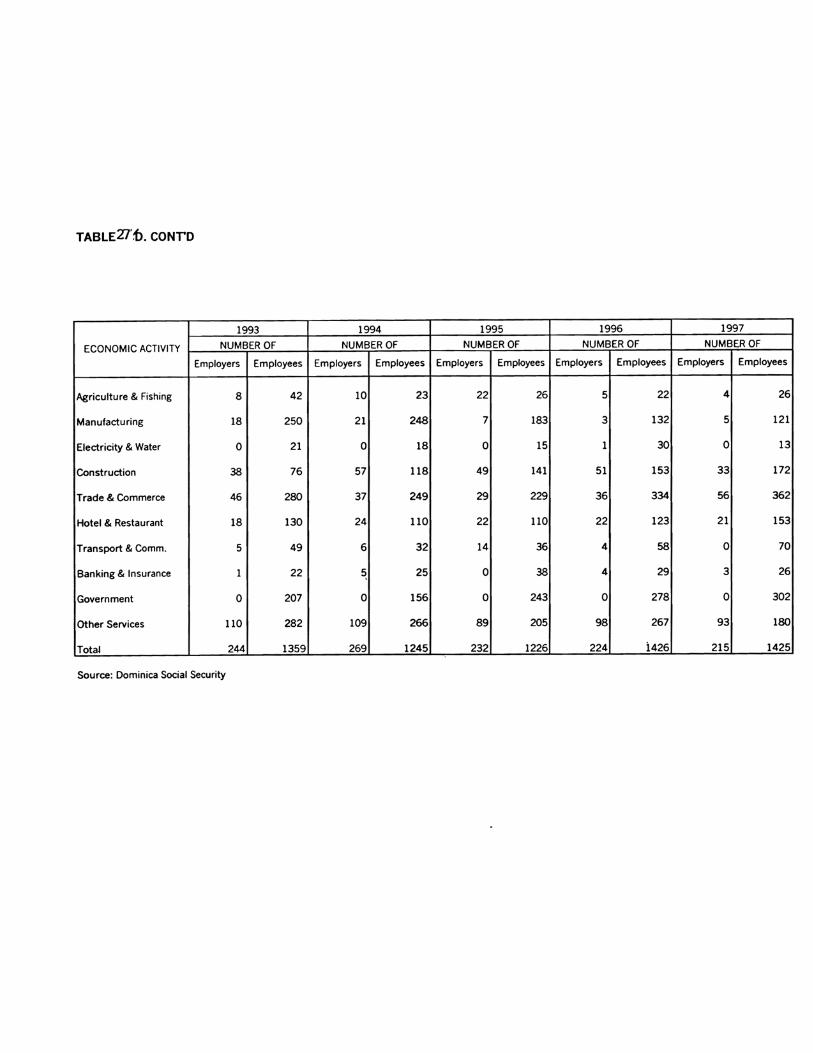
Over the period 1986-1997, 269 new employers were recorded in 1994, the
highest number over the 11 years. The nunlber of l1ew elnployees 2,048, reached a record
high in 1990 (Table 27D).
The lll1mber of registered employers by major economic activity has increased
steadily over the years, from 701 in 1983 to 3,194 ill 1997. The Other Services category
has consistently reflected the highest number of enlployers followed by the Trade and
Con1merce, Constructioll and Agriculture sectors. 'I'he groups Trade and Commerce, and
Hotel and Restaurant l1ave sllown considerable growth over tlle years, with the number 0
registered employers increasing by 83.0% and 190.0% respectively, over the last six
years (1991-1997). These sectoral growths have offset the slow or almost stagnant
activity ill the Agricultural sector (Table 27E).
The nun1ber of men recruited to and retllrning fron1 North America on the
excha11ge workers scheme reached a peak, 270 in 1989. However the number of men
recruited 11as declined from 1992, as a result of the 1994 closllre of the U.S.A. scheme
(Table 28).
Zl

SECTiON IV . PRICES, LABOUR & ECONOMIC ACTIVITY
TABLE 18· MONTHLY CONSUMER PRICE INDICES FOR 1998
February 1994 = 100.0
~
00
MONTHLY
GROUP WEIGHT JAN FEB MAR APR MAY JUN JULY AUG SEP OCT NOV DEC AVERAGE
FOOD 401.81 102.75 102.39 102.43 101.96 101.69 101.55 103.11 104.47 104.04 103.49 104.18 105.61 103.14
ALCOHOLIC 16.16 114.24 114.70 114.70 114.70 114.66 114.44 114.51 114.36 114.42 114.42 114.42 114.06 114.47
BEVERAGES& TOBACCO
HOUSING & 133.71 102.30 102.39 102.59 102.64 102.77 102.81 102.47 102.39 102.37 102.35 102.47 102.73 102.52
UTILITIES
FURNITURE & 57.79 97.39 97.39 96.65 96.65 96.67 96.73 96.57 95.99 96.82 97.90 98.85 99.38 97.25
HOUSEHOLDEQUIPMENT ,
TRANSPORTATION 162.02 105.52 104.62 103.97 104.22 104.53 105.46 105.83 105.18 104.56 105.86 105.33 105.23 105.03
CLOTHING & 68.35 104.54 104.54 104.30 104.70 104.70 104.34 104.34 103.51 103.49 10.3.42 103.42 104.51 104.15
FOOTWEAR
MISCELLANEOUS 160.16 116.69 116.69 116.69 116.69 116.69 116.77 116.95 117.31 118.74 119.90 119.96 120.78 117.82
EXPENSES
ALL ITEMS 1000.00 105.37 105.10 104.98 104.86 104.82 104.91 105.57 105.97 105.97 106.20 106.47 107.29 105.63
Source: Monthly Consumer Price Index, prepared and published by the Central Statistical Office
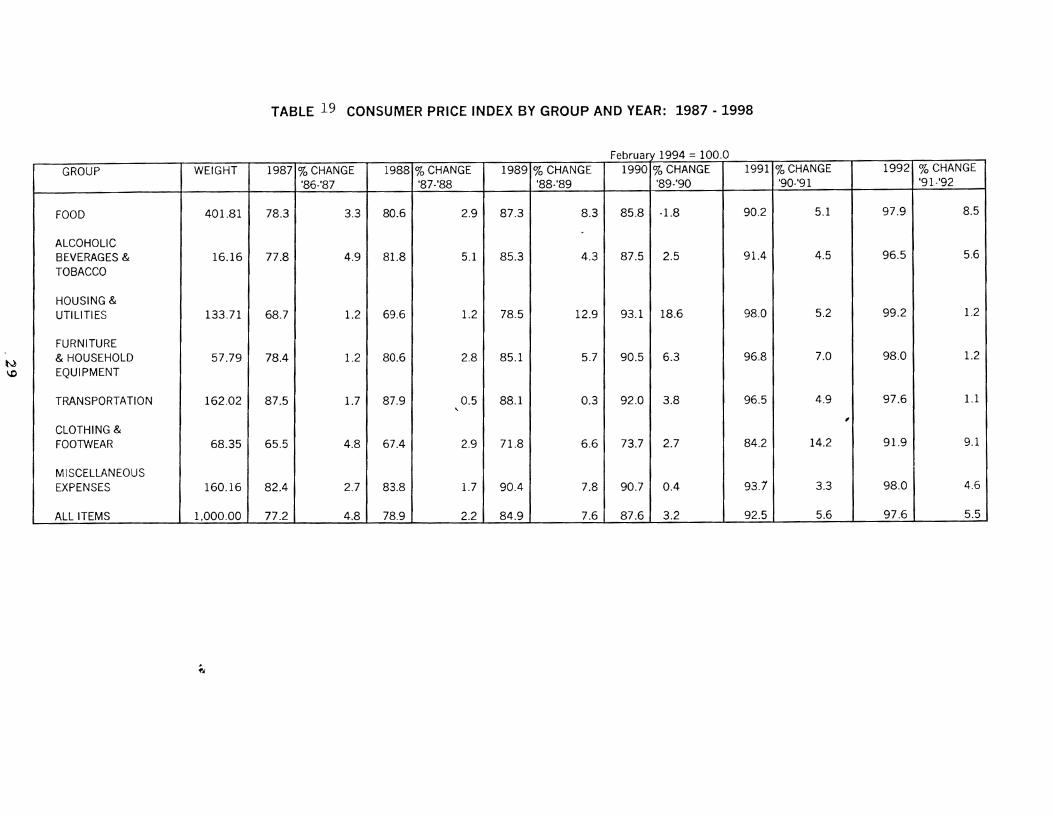
TABLE 19 CONSUMER PRICE INDEX BY GROUP AND YEAR: 1987 - 1998
994 =100.0reoruary 1
GROUP WEIGHT 1987 %CHANGE 1988 %CHANGE 1989 % CHANGE 1990 % CHANGE 1991 %CHANGE 1992 % CHANGE186.187 '87-'88 188-'89 '89-'90 '90-'91 '91·'92
FOOD 401.81 78.3 3.3 80.6 2.9 87.3 8.3 85.8 ·1.8 90.2 5.1 97.9 8.5
ALCOHOLICBEVERAGES & 16.16 77.8 4.9 81.8 5.1 85.3 4.3 87.5 2.5 91.4 4.5 96.5 5.6
TOBACCO
HOUSING &UTILITIES 133.71 68.7 1.2 69.6 1.2 78.5 12.9 93.1 18.6 98.0 5.2 99.2 1.2
FURNITURE& HOUSEHOLD 57.79 78.4 1.2 80.6 2.8 85.1 5.7 90.5 6.3 96.8 7.0 98.0 1.2
EQUIPMENT
TRANSPORTATION 162.02 87.5 1.7 87.9 0.5 88.1 0.3 92.0 3.8 96.5 4.9 97.6 1.1"
~
CLOTHING &FOOTWEAR 68.35 65.5 4.8 67.4 2.9 71.8 6.6 73.7 2.7 84.2 14.2 91.9 9.1
MISCELLANEOUSEXPENSES 160.16 82.4 2.7 83.8 1.7 90.4 7.8 90.7 0.4 93.1 3.3 98.0 4.6
ALL ITEMS 1,000.00 77.2 4.8 78.9 2.2 84.9 7.6 87.6 3.2 92.5 5.6 97.6 5.5
N\,C
~.
wo
TABLE 19.·{CCNT'D)
GROUP WEIGHT 1993 % CHANGE 1994 % CHANGE 1995 % CHANGE 1996 % CHANGE 1997 % CHANGE 1998 % CHANGE'92·'93 '93·'94 '94·'95 '95·'96 '96·'97 '97·'98
FOOD 401.81 99.9 2.1 96.1 -3.8 97.7 1.7 99.6 1.9 103.2 3.6 103.1 -0.1
ALCOHOLICBEVERAGES & 16.16 98.5 2.0 100.6 2.2 101.0 0.3 110.4 9.3 112.7 2.1 114.5 1.6
TOBACCO
HOUSING &UTILITIES 133.71 99.9 0.7 100.1 0.2 99.9 -0.2 100.0 0.1 101.6 1.4 102.5 0.9
FURNITURE& HOUSEHOLD 57.79 97.1 -0.8 98.8 1.7 96.6 -2.2 95.7 -1.0 96.6 1.4 97.3 0.7
EQU1PMENT
TRANSPORTATION 162.02 99.9 2.4 101.5 1.6 102.6 1.1 105.9 3.2 106.5 0.1 105.0 -1.4
CLOTHING &FOOTWEAR 68.35 94.8 3.2 101.5 7.1 102.8 1.2 103.8 0.9 104.1 0.7 , 104.2 0.0
MISCELLANEOUSEXPENSES 160.16 98.3 0.3 102.3 > 4.1 105.5 3.1 107.2 1.6 111.0 8.9 117.8 6.1
ALL ITEMS 1,000.00 99.1 1.6 99.1 0.0 100.4 1.3 102.1 1.7 104.6 ~ 2.4 105.6 1.0
Source: Monthly Consumer Price Index, prepared and published by the Central Statistical Office
;'.1
Wt-..J
TABLE 20 . MONTHLY INDEX OF FOOD AND NON-FOOD GROUPS1980 - 1998
MONTH/GROUP 1980 1981 1982 1983 1984 1985 1986 1987 1988 1989 1990 1991 1992 1993 1994 1995 1996 1997 1998
Jan. Food 76.9 95.7 98.0 100.5 100.8 98.5 100.3 75.2 79.3 85.0 85.5 92.8 94.1 100.7 99.1 97.3 98.9 102.1 102.8
Non·Food 67.2 75.4 83.2 93.9 99.0 102.7 107.0 76.1 77.2 79.4 87.8 92.3 96.1 97.7 100.0 101.9 103.3 104.9 107.1
Feb. Food 78.7 96.4 99.5 101.0 100.8 100.2 100.0 75.7 77.7 84.7 86.2 88.5 94.3 100.5 100.0 98.0 98.0 101.6 102.4
Non·Food 70.8 77.0 85.0 94.2 99.3 102.8 106.9 76.1 77.3 80.1 87.8 93.0 96.6 97.9 100.0 101.1 103.4 104.9 106.9
Mar. Food 79.1 97.7 101.4 100.0 101.4 100.7 98.8 76.1 74.7 86.7 80.8 87.9 96.1 97.5 95.5 97.5 98.1 102.6 102.4
Non·Food 72.1 77.4 84.0 96.5 99.4 102.8 106.4 76.3 77.3 80.8 87.1 94.3 97.4 98.3 100.1 101.7 103.5 105.0 106.7
Apr. Food 80.4 98.6 100.2 100.1 101.5 99.3 100.1 78.0 75.0 87.1 81.8 90.0 96.8 95.8 94.1 97.6 98.6 102.6 102.0
Non·Food 73.0 77.7 84.4 95.9 99.4 102.8 106.4 76.8 78.0 81.5 86.8 94.4 97.4 98.3 100.8 101.8 103.6 104.9 106.8
May. Food 81.7 97.2 99.2 99.6 100.4 99.7 100.8 78.1 76.9 89.2 84.1 87.2 96.9 96.9 94.0 98.4 98.7 103.4 101.7
Non·Food 74.6 79.6 84.5 95.8 99.9 103.0 106.6 77.0 78.1 81.7 88.1 94.2 97.5 98.1 100.8 101.6 103.4 104.6 106.9
Jun. Food 82.7 96.1 99.7 98.8 100.8 99.4 99.8 79.6 77.7 88.3 83.6 88.6 97.9 104.4 93.9 98.2 99.0 103.2 101.6
Non·Food 74.1 80.2 84.2 95.8 99.9 104.0 108.2 76.6 77.4 81.9 88.3 94.6 97.4 98.6 100.8 101.8 103.8 104.7 107.2
Jul. Food 85.2 99.1 100.5 98.9 100.0 101.1 102.5 80.3 79.7 88.8 85.5 89.4 101.0 101.2 93.5 97.9 100.2 103.6 103.1
Non·Food 74.2 81.7 85.7 96.3 100.0 104.1 107.8 76.4 77.3 82.5 88.6 94.8 97.8 98.3 101.8 103.2 104.0 104.8 107.2,
Aug. Food 87.6 99.7 101.3 98.7 102.0 102.2 106.3 81.0 82.1 85.7 84.3 89.5 99.3 101.2 95.7 97.3 99.4 103.9 104.5Non·Food 74.1 81.7 89.2 98.3 99.2 104.0 1Q7.9 76.3 78.2 82.4 89.0 95.1 97.9 98.2 101.8 103.0 104.1 104.8 107.0
Sep. Food 90.3 100.2 100.4 99.1 101.8 102.0 110.2 76.9 82.5 85.3 87.3 92.2 99.4 99.9 96.5 97.7 100.8 103.9 104.0Non·Food 74.9 82.5 91.2 98.3 103.9 104.6 108.3 76.1 78.2 88.1 89.7 95.5 98.1 99.0 10"1.7 102.5 103.9 106.7 107.3
Oct. Food 91.2 100.1 100.7 100.9 98.5 104.2 107.6 79.1 83.3 87.1 87.6 90.7 99.4 99.5 97.6 96.7 99.8 103.6 103.5Non·Food 75.1 83.1 91.5 99.0 104.3 104.9 108.7 76.3 78.4 87.6 93.6 95.4 98.2 99.1 101.7 102.1 104.0 106.8 108.0
Nov. Food 92.0 100.3 100.8 100.7 97.6 103.9 107.4 81.4 92.6 90.5 89.5 92.3 99.2 100.6 96.8 96.' 101.3 104.3 104.2
Non·Food 75.3 83.1 91.8 98.5 103.9 105.1 109.2 77.3 78.5 87.9 93.6 95.4 98.2 99.6 102.0 102.r 104.2 106.9 108.0
Dec. Food 94.8 101.0 101.0 100.8 101.5 104.6 108.0 78.9 86.2 89.6 92.5 92.8 100.1 100.8 96.9 99.3 101.9 103.5 105.6
Non·Food 75.3 83.3 92.1 98.4 102.2 106.0 109.1 77.2 79.0 87.9 92.9 95.8 97.7 99.8 102.0 102.8 }04.4 107.1 108.4
Year Food 85.1 98.5 100.2 99.9 100.6 101.3 103.5 78.3 80.6 87.3 85.7 90.L 97.9 99.9 96.1 97.7 99.6 103.2 103.1Avg. Non·Food 73.4 80.2 87.2 96.7 100.9 103.9 107.7 76.5 77.9 83.5 89.4 94.6 ., 97.5 98.6 101.1 102.2 103.8 105.5 107.3
Source: Monthly Consuwer Price Index, prepared and published by the Central Statistical 'Office1980·1986: Base period is July 19841987·1998: Base period is Februa ry 1994 ~
ww
TABLE?2 ECONOMIC ACTIVITY DURING THE WEEK BEFORE THE CENSUSES1970, 1981 & 1991
fV1ALES FEMALES
MAIN ACTIVITYNUMBER PERCENT NUMBER PERCENT
1970 1981 1991 1970 1981 1991 1970 1981 1991 1970 1981 1991
ECONOM ICALLY ACTIVE 12,884 16,698 17,276 85.8 81.6 75.2 7,551 8,635 9,088 40.2 41.1 38.9
Worked 11,407 13,506 15,575 76.0 66.0 67.8 6,398 6,512 8,248 34.0 31.0 35.3
With Job, Not Working 513 502 413 3.4 2.5 1.8 372 186 186 2.0 0.9 0.8
Leoked for Work 964 2,690 1,288 6.4 13.2 5.6 781 1,937 654 4.2 9.2 2.8
ECONOMICALLY INACTIVE 1,604 3,757 5,705 10.7 18.4 24.8 10,763 12,379 14,258 57.3 5S.9 61.1
Home Duties 102 361 1,306 0.7 1.8 5.7 8,636 9,024 9,912 45.9 42.9 42.5
Student 54 224 1,352 77 228 1,746..
0.4 1.1 7.50.4 1.1 5.9
Retired 423 749 1,059 2.8 3.7 4.6 607 961 745 3.2 4.6 3.2
Disabled 1,025 1,051 1,318 6.8 5.1 5.7 1,443 1,446 1,525 7.7 6.9 6.5
Other & Not Stated 524 1,372 670 3.5 6.7 2.9 481 720 330 2.5 3.4 1.4
TOTAL 15,012 20,455 22,981 100.0 100.0 100.0 18,795 21,014 23,346 100.0 100.0 100.0
Source: Report of the 1970, 1981 and 1991 Population Census
.;i
w~
TABLE 23. ECONOMIC ACTIVITY DURING THE YEAR BEFORE THE CENSUS1970, 1981 & 1991
MAL E S FEMALES
MAIN ACTIVITY NUMBER PERCENT NUMBER PERCENT
1970 1981 1991 1970 1981 1991 1970 1981 1981 1970 1981 1991
ECONOMICALLY ACTIVE 13,210 16,602 17,380 88.0 81.2 75.6 7,961 8,921 9,008 42.4 42.5 38.6
\,yorked 12,293 13,961 15,704 81.9 68.3 68.3 7,159 6,816 8,064 38.1 32.4 34.5
Looked for work 807 1,813 1,273 5.4 8.9 5.5 652 1,386 749 3.4 6.6 3.2
Wanted Work andAvailable 110 828 403 0.7 4.0 1.8 150 719 195 0.8 3.4 0.8
,
ECOf\JOfviICALLY INACTIVE 1,496 3,853 5,601 10.0 18.8 24.4 10,607 12,093 14,338 56.4 57.5 61.4
Horne Duties 99 280 1,150 0.7 1.4 5.0 8,564 8,551 9,913 '4 45.6 40.7 42.5
Student 98 283 1,420 0.7 1.4 6.2 125 293 1,821 0.7 1.4 7.8
Retired 1,299 751 1,156 8.7 3.7 5.0 1,918 1,005 809 10.2 4.8 3.5
Disabled -.- 944 1,257 0.0 4.6 5.5 --- 1,406 1,478 0.0 6.7 6.3
Other & Not Stated 306 1,595 618 2.0 7.8 2.7 227 838 317 1.2 4.0 1.4
TOTAL 15,012 20,455 22,981 100.0 100.0 100.0 18,795 21,014 23,346 100.0 100.0 100.0
Source: Report~f the 1970,1981 and 1991 Population Censuses. 1981 Census Volume I Table 2.2

wU"I
TABLE 24 PERCENTAGE UNEMPLOYED AMONG THE ECONOMICALLY ACTIVE1970,1981 AND 1991
YEAR MALE FEMALE BOTH SEXES
1970 7.5 10.3 8.5
1981 16.1 22.4 18.3
1991 6.4 3.2 9.6
BASED ON MAIN ACTIVITY IN PREVIOUS YEAR - ALL ADULTS
ALL ADULTS HEADS OF HOUSEHOLDS NON HOUSfHOLD HEADSYEAR
MALE FEMALE BOTH SEXES MALE FEMALE 80TH SEXES MALE FEMALE BOTH SEXES
1970 6.9 10.1 8.1 1.1 2.6 1.6 14.9 14.3 14.6
1981 15.9 23.6 18.6 4.8 9.2 5.9 28.4 30.2 29.2
1991 9.6 10.5 9.9 ... ... ... ... ... ...
Source: Report of the 1970, 1981 and 1991 Population Censuses1970 Census Volume 4 Part 9 Table 21981 Census1volume 1 Table 2.2
W0",
TABLE 2,5. PERCENTAGE UNEMPLOYED BY AGE GROUP AND SEX BASED ON MAINACTIVITY TWELVE MONTHS BEFORE CENSUSES 1981 AND 1991
198 1 199 1AGE GROUP
MALE FEMALE TOTAL MALE FEMALE TOTAL
TOTAL 15.9 23.6 18.6 9.6 10.5 9.9
15 ·19 49.8 66.7 55.7 29.5 34.0 30.9
20·24 19.9 30.4 23.8 13.5 19.1 15.6
25·34 8.8 15.0 10.8 7.9 8.1 8.0 I
35·44 4.6 7.2 5.6 4.6 3.0 4,0
45·54 2.7 7.2 4.3 3.2 2.8 3.1
55 ·64 2.9 2.7 2.8 3.4 3.2 .. 3.3 i
65+ 2.2 2.7 2.3 3.0 0.9 2.4
Not Stated 8.5 11.4 9.5 6.6 4.3 6.1
TOTAL NUMBER UNEMPLOYED 2690 1937 4627 1701 840 2541
Sources: Reports of the 1970 Population CensusDominica Vol. 3, 1980·1981, Population Census of the Commonwealth CaribbeanTabulations, 1991 Population and Housing Census of Dominica
~J
W-...J
TABLE 26.a. NON-INSTITUTIONAL WORKING POPULATION, CLASSIFIED BY AGE GROUP,SEX AND INDUSTRIAL GROUP: MALE1991 POPULATION CENSUS
INDUSTRIAL GROUP
AGE GROUP Agri/Hunt. Mining Manu- Electricity Construction Wsale Transport Finance Pubic Adm. TOTAL
Forestry Refining factu· Gas and and Hotels & Storage Insur. Defence Comm. Other Not WORKING
Fish. Quarry. ring and Water Installation Retail Restaurants &Comm. & REst. So. Sec. Servo Services Stated POPULATION
15-19 459 9 136 7 431 168 43 62 17 27 34 15 47 1455
20-24 789 8 225 42 537 286 46 159 67 156 123 29 61 2528
25-29 829 10 174 53 488 203 20 205 48 156 115 25 58 2384
30-34 766 4 145 37 353 162 37 137 36 178 127 18 42 2042
35-39 587 5 119 36 298 136 19 118 44 154 105 11,
43 1675
40-44 484 7 68 24 203, 97 15 106 42 124 81 11 25 1287
45·49 466 6 41 24 165 71 14 70 20 81 ~5 15 21 1059
50·54 429 1 42 12 89 32 9 56 18 52 46 8 22 816
55·59 401 2 35 14 79 37 7 37 8 33 32 7 17 709
60-64 378 2 21 4 41 20 4 19 4 11 28 15 19 566
65+ 602 2 43 3 58 68 8 15 11 14 28 10 37 899
Not Stated 65 10 1 11 9 2 14 3 9 6 2 22 154
TOTAL 6255 56 1059 257 2753 1289 224 998 318 995 790 166 414 15574~~
Source: 1991 Population and Housing Census of Dominica
wco
TABLE26 p. NON-INSTITUTIONAL WORKING POPULATION, CLASSIFIED BY AGE GROUP,SEX AND INDUSTRIAL GROUP: FEMALE1991 POPULATION CENSUS
INDUSTRIAL GROUPS
AGE GROUP .A.gr i/ Hunt. Mining Manu Electricity Construction Wsale Transport Finance Pubic Adm TOTAL
Forestry Refining factu- Gas and and Hotels & Storage Insur. Defence Cornm. Other Not WORKING1 Fish Querry_ ring and Water Installation Retail Restaurants & Comm & REst. So. Sec Serv Services Stated POPULATION
15-19 17 2 81 5 6 110 68 13 41 29 83 119 19 593
20-24 71 2 179 13 12 254 135 41 152 101 249 169 51 1429
25·29 92 141 15 10 210 123 40 92 89 275 172 40 1299
30-34 98 2 97 4 11· 222 81 26 79 89 249 120 43 1121
I 35·39 105 2 96 5 6 156 58 30 44 82 233 71 31 919,
I40-44 108 79 4 9 156 50 15 30 55 173 64 18 761
45-49 140 71 1 7 101 33 7 21 25 118 40 14 578'4
50-54 120 1 26 85 12 8 10 31 103 29 14 439
55-59 118 34 1 83 17 6 11 12 73 31 17 403
60-64 90 35 3 52 9 3 6 7 29 24 10 268
65+ 124 46 1 105 13 12 5 3 20 34 17 380
Not Stated 6 3 7 5 3 1 2 5 7 11 50
TOTAL 1089 9 888 47 66 1541 604 204 492 525 1610 880 285 8240
Source: 1991 Population~ndHousing Census of Dominica

W'-0
TABLE 2fC; NON-INSTITUTIONAL WORKING POPULATION, CLASSIFIED BY AGE GROUP,SEX AND INDUSTRIAL GROUP: BOTH SEXES1991 POPULATION CENSUS
INDUSTRIAL GROUPS
AGE GROUP Agri/Hunt. Mining Manu- Electricity Construction Wsale Transport Finance Pubic Adm. TOTAL
Forestry Refining factu· Gas and and Hotels & Storage lnsur Defence Comm. Other Not WORKING
Fish. Quarry. ring and Water Installation Retail Restaurants & Comm. &. REst. So. Sec. Servo Services Stated POPULATION
15-19 476 11 217 12 437 278 III 75 58 56 117 134 66 2048
20-24 860 10 404 55 549 540 181 200 219 257 372 198 112 3957
25-29 921 10 315 68 498 413 143 245 140 245 390 197 98 3683
30-34 864 6 242 41 364 384 118 163 115 267 376 138 85 3163
35-39 692 7 215 41 304 292 77 148 88 236 338 82 ' 74 2594
40-44 592 7 147 28 212 253 65 121 72 179 254 75 43 2048
45-49 606 6 112 25 172 172 47 77 41 106 183 55 35 1637
50-54 549 2 68 12 89 117 21 64 28 83 149 37 36 1255
55-59 519 2 69 14 80 120 24 43 19 45 105 38 34 1112
60-64 468 2 56 4 44 72 13 22 10 18 57 39 29 834
65+ 726 2 89 3 59 173 21 27 16 17 48 44 54 1279
Not Stated 71 13 1 11 16 7 17 4 11 11 9 33 204
TOTAL 7344 65 1947 304 2819 2830 828 1202 810 1520 2400 1046 699 23814
~J
Source: 1991 Population and Housing Census of Dominica

SECTION V: SOCIAL CONDITIONS, HEALTH, EDUCATION, HOUSING ANDELECTORATE
Sub-Section V-I: Health
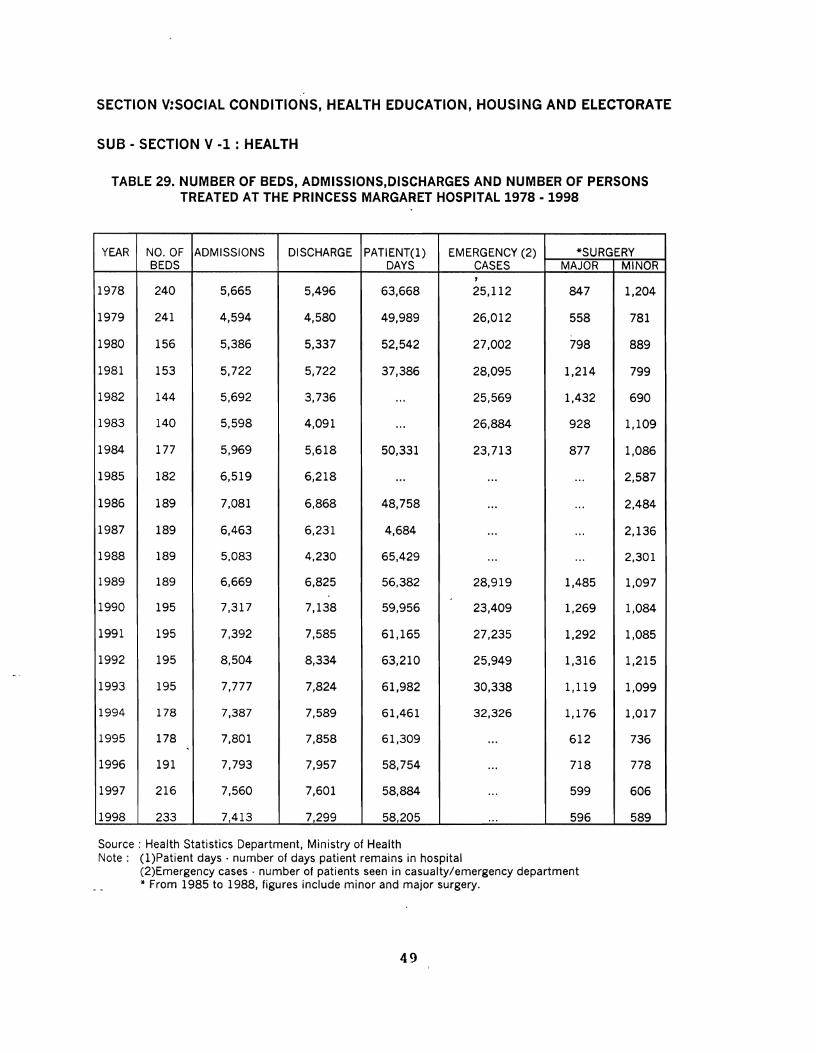
The number of admissions at the Princess Margaret Hospital, the main hospital on
the island rose by 30.86% from 1978-1998. However, the average number of days1
patients remained in the hospital registered a 27.3% decline over the period. Emergency
cases have fluctuated over the years reaching a peak, 32,326 in 1994·, ··while recording a
low of 23,409 in 1990. Of surgery performed, 589 were classified as minor in 1998, the
lowest figure over the last 20 years, whereas 596 were classified as major, the least since
1979 (Table 29).
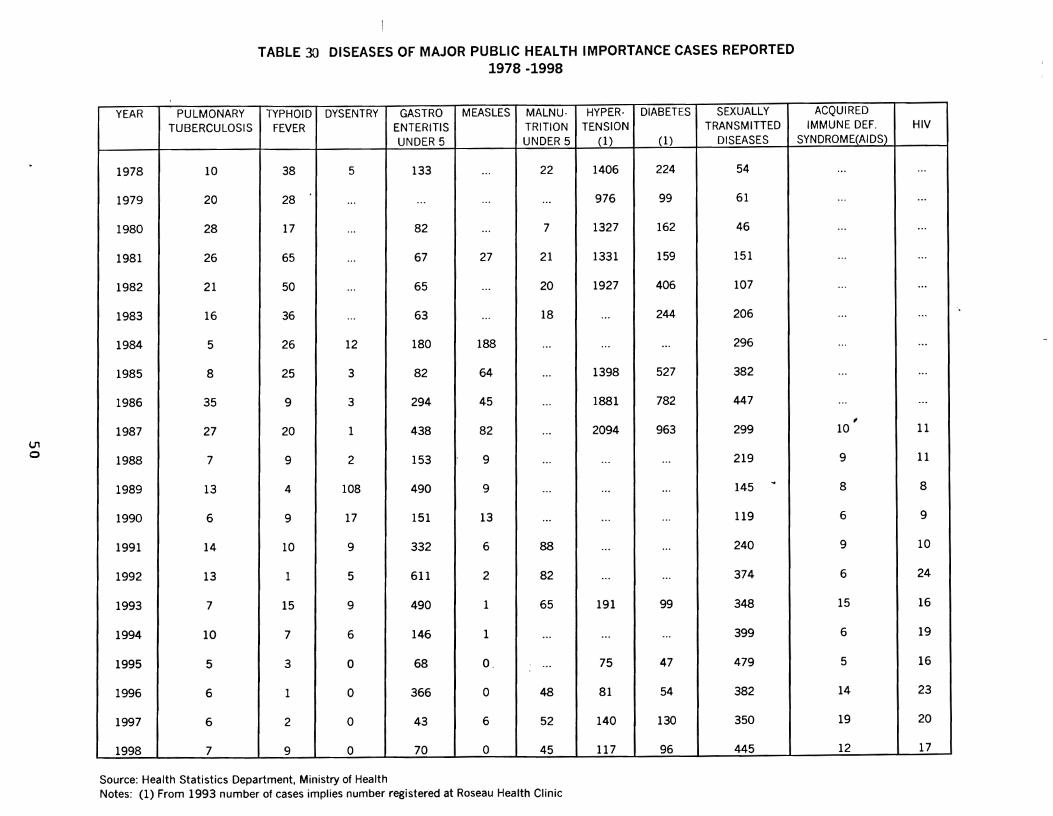
The number of reported cases of Pulmonary Tuberculosis, Typhoid Fever and
Dysentery have decreased significantly over the years. In fact, after an outburst of
Dysentery in 1989, the number of reported cases declined sharply, recording no
incidences for the last four years. Gastroenteritis (under 5) reflected a 47.0% decline in
reported cases over the 1978 to 1998 period. Among the major public health diseases
Hypertension has been more prevalent. However, cases dropped significantly from a
peak of 2,094 in 1987 to 117 cases in 1998. The number of sexually transmitted diseases
increased significantly from 54 cases in 1978 to 445 in 1998. The total nUITlber of
reported Acquired Immune Deficiency Syndrome (AIDS) cases since 1987 has reached
119, registering an average of 11 cases per year. On the other hand, Human Immuno
Deficiency Virus (HIV) has recorded a total of 184 cases, recording an average of 17
cases per year (Table 30).
47
Over the years 1978-1998, the number of deaths from infective and parasitic
diseases fluctuated but recorded its lowest, 7 in 1998. Deaths from Neoplasms increased
from 54 in 1978 to 114 in 1998, registering a 111.1% increase. Allergic, Endocrine
System, Metabolic, and Nutritional diseases registered 18 deaths in 1978 and 72 in 1998
reflecting a 300.0% rise. Deaths due to accidents (which includes poisoning, violence,
homicide and suicide) increased from 19 to 44, recording a 131.6% increase over the 21
year period. In general total deaths rose from 417 in 1978 to 595 in 1998, representing a
42.69% increase.
Diseases of the Circulatory System, the major cause of death in 1978, declined by
35.0% over the period 1978-1998. Conditions originating in the perinatal period
decreased from 25 deaths in 1978 to 11 in 1998, reflecting a 56.00/0 drop.
The three major causes of deaths were noted in Diseases of the Circulatory
System, accounting for 34.3% of all deaths in 1978 and 20.5 in 1997. In 1998, however,
Neoplasms was the main cause accounting for 22.2% of all deaths. Signs, Symptoms and
Ill-defined conditions recorded 12.70/0 of deaths in 1978. Although data for deaths from
Hypertensive disease was not recorded for the 1978-1983 period, in 1984, this disease
accounted for 12.3% of all deaths. In 1998, Hypertensive disease accounted for 15.8% of
deaths.
Altogether, in 1978 the major causes of death, Diseases of the Circulatory
System, 34.3°~; Neoplasms, 12.9°A» and Signs, Symptoms and III-Defined Conditions,
12.7% , accounted for 59.9% of all deaths. In 1998, the major causes of death,
Neoplasms, 22.2°A»; Hypertension, 15.8°A» and Diseases of the Circulatory system,
15.6°A» accounted for 53.6% of all deaths. (Table 31).
48
SECTION V:SOCIAL CONDITIONS, HEALTH EDUCATION, HOUSING AND ELECTORATE
SUB - SECTION V -1 : HEALTH
TABLE 29. NUMBER OF BEDS, ADMISSIONS,DISCHARGES AND NUMBER OF PERSONSTREATED AT THE PRINCESS MARGARET HOSPITAL 1978 -1998
YEAR NO. OF ADMISSIONS DISCHARGE PATIENT(l) EMERGENCY (2) *SURGERYBEDS DAYS CASES MAJOR MINOR
7
1978 240 5,665 5,496 63,668 25,112 847 1,204
1979 241 4,594 4,580 49,989 26,012 558 781
1980 156 5,386 5,337 52,542 27,002 798 889
1981 153 5,722 5,722 37,386 28,095 1,214 799
1982 144 5,692 3,736 ... 25,569 1,432 690
1983 140 5,598 4,091 ... 26,884 928 1,109
1984 177 5,969 5,618 50,331 23,713 877 1,086
1985 182 6,519 6,218 ... ... ... 2,587
1986 189 7,081 6,868 48,758 ... ... 2,484
1987 189 6,463 6,231 4,684 ... ... 2,136
1988 189 5,083 4,230 65,429 ... ... 2,301
1989 189 6,669 6,825 56,382 28,919 1,485 1,097
1990 195 7,317 7,138 59,956 23,409 1,269 1,084
1991 195 7,392 7,585 61,165 27,235 1,292 1,085
1992 195 8,504 8,334 63,210 25,949 1,316 1,215
1993 195 7,777 7,824 61,982 30,338 1,119 1,099
1994 178 7,387 7,589 61,461 32,326 1,176 1,017
1995 178 7,801 7,858 61,309 '" 612 736
1996 191 7,793 7,957 58,754 ... 718 778
1997 216 7,560 7,601 58,884 ... 599 606
1998 233 7,413 7,299 58,205 ... 596 589
Source: Health Statistics Department, Ministry of HealthNote: (l)Patient days· nurnber of days patient remains in hospital
(2)Emergency cases· number of patients seen in casualty/emergency department* From 1985 to 1988, figures include minor and major surgery.
49
o
TABLE 30 DISEASES OF MAJOR PUBLIC HEALTH IMPORTANCE CASES REPORTED1978-1998
YEAR PULMONARY TYPHOID DYSENTRY GASTRO MEASLES MALNU· HYPER· DIABETES SEXUALLY ACQUIRED
TUBERCULOSIS FEVER ENTERITIS TRITION TENSION TRANSMITTED IMMUNE DEF. HIV
UNDER 5 UNDER 5 (1) (1) DISEASES SYNDROME(AIDS)
1978 10 38 5 133 ... 22 1406 224 54 ... ...
1979 20 28 ... ... ... ... 976 99 61 ... ...
1980 28 17 ... 82 ... 7 1327 162 46 ... ...
1981 26 65 ... 67 27 21 1331 159 151 .. , ...
1982 21 50 .,. 65 ... 20 1927 406 107 .. , ...
1983 16 36 ... 63 ... 18 ... 244 206 ... ...
1984 5 26 12 180 188 ... ... ... 296 ... ...
1985 8 25 3 82 64 ... 1398 527 382 .. , ...
1986 35 9 3 294 45 ... 1881 782 447 .. , ...,
1987 27 20 1 438 82 ... 2094 963 299 10 11
1988 7 9 2 153 9 ... ... ... 219 9 11
1989 13 4 108 490 9 145 .. 8 8... ... ...
1990 6 9 17 151 13 ... ... ... 119 6 9
1991 14 10 9 332 6 88 ... ... 240 9 10
1992 13 1 5 611 2 82 ... ... 374 6 24
1993 7 15 9 490 1 65 191 99 348 15 16
1994 10 7 6 146 1 ... ... ... 399 6 19
1995 5 3 0 68 0> ... 75 47 479 5 16
1996 6 1 0 366 0 48 81 54 382 14 23
1997 6 2 0 43 6 52 140 130 350 19 20
1998 7 9 0 70 0 45 117 96 445 12 17
Source: Health Statistics Department, Ministry of HealthNotes: (1) From 1993 number of cases implies number registered at Roseau Health Clinic
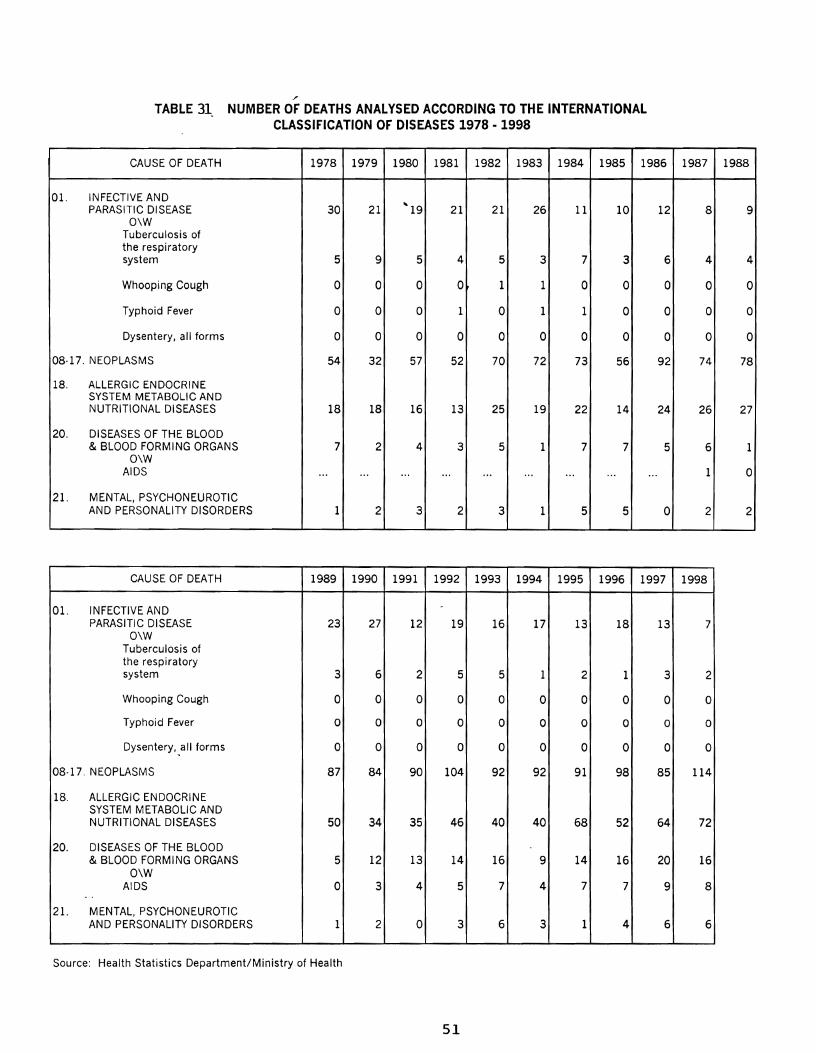
./
TABLE 31_ NUMBER OF DEATHS ANALYSED ACCORDING TO THE INTERNATIONALCLASSIFICATION OF DISEASES 1978 • 1998
CAUSE OF DEATH 1978 1979 1980 1981 1982 1983 1984 1985 1986 1987 1988
01. INFECTIVE ANDPARASITIC DISEASE 30 21 '19 21 21 26 11 10 12 8 9
O\WTuberculosis ofthe respiratorysystem 5 9 5 4 5 3 7 3 6 4 4
Whooping Cough 0 0 0 0 1 1 0 0 0 0 0
Typhoid Fever 0 0 0 1 0 1 1 0 0 0 0
Dysentery, all forms 0 0 0 0 0 0 0 0 0 0 0
08·17. NEOPLASMS 54 32 57 52 70 72 73 56 92 74 78
18. ALLERGIC ENDOCRINESYSTEM METABOLIC ANDNUTRITIONAL DISEASES 18 18 16 13 25 19 22 14 24 26 27
20. DISEASES OF THE BLOOD& BLOOD FORMING ORGANS 7 2 4 3 5 1 7 7 5 6 1
O\WAIDS ... ... ... ... ... ... ... ... ... 1 0
21. MENTAL, PSYCHONEUROTICAND PERSONALITY DISORDERS 1 2 3 2 3 1 5 5 0 2 2
CAUSE OF DEATH 1989 1990 1991 1992 1993 1994 1995 1996 1997 1998
01. INFECTIVE ANDPARASITIC DISEASE 23 27 12 19 16 17 13 18 13 7
O\WTuberculosis ofthe respiratorysystem 3 6 2 5 5 1 2 1 3 2
Whooping Cough 0 0 0 0 0 0 0 0 0 0
Typhoid Fever 0 0 0 0 0 0 0 0 0 0
Dysentery, ,all forms 0 0 0 0 0 0 0 0 0 0
08·17. NEOPLASMS 87 84 90 104 92 92 91 98 85 114
18. ALLERGIC ENDOCRINESYSTEM METABOLIC ANDNUTRITIONAL DISEASES 50 34 35 46 40 40 68 52 64 72
20. DISEASES OF THE BLOOD& BLOOD FORMING ORGANS 5 12 13 14 16 9 14 16 20 16
O\WAIDS 0 3 4 5 7 4 7 7 9 8
- .
21. MENTAL, PSYCHONEUROTICAND PERSONALITY DISORDERS 1 2 0 3 6 3 1 4 6 6
Source: Health Statistics Department/Ministry of Health
51
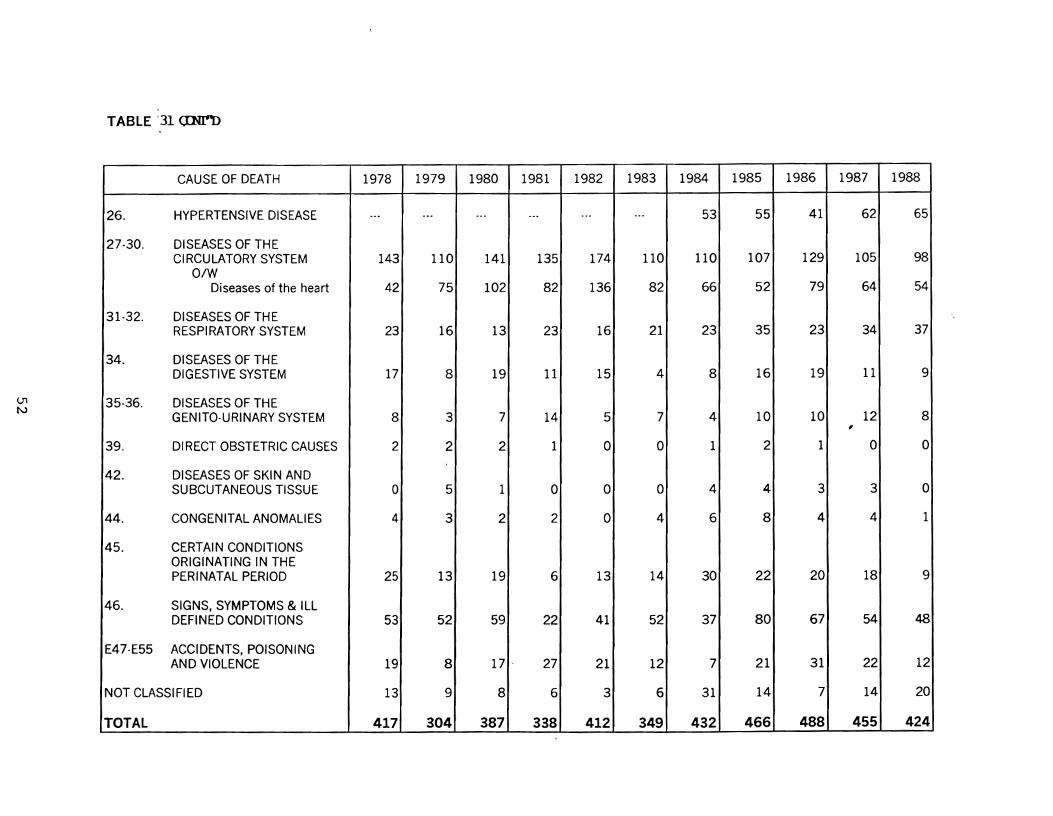
U1~
TABLE '31 (INI"D
CAUSE OF DEATH 1978 1979 1980 1981 1982 1983 1984 1985 1986 1987 1988
26. HYPERTENSIVE DISEASE ... ... ... ... ... ... 53 55 41 62 65
27·30. DISEASES OF THECIRCULATORY SYSTEM 143 110 141 135 174 110 110 107 129 105 98
O/WDiseases of the heart 42 75 102 82 136 82 66 52 79 64 54
31·32. DISEASES OF THERESPIRATORY SYSTEM 23 16 13 23 16 21 23 35 23 34 37
34. DISEASES OF THEDIGESTIVE SYSTEM 17 8 19 11 15 4 8 16 19 11 9
35·36. DISEASES OF THEGENITO·URINARY SYSTEM 8 3 7 14 5 7 4 10 10 12 8,
39. DIRECT OBSTETRIC CAUSES 2 2 2 1 0 0 1 2 1 0 0
42. DISEASES OF SKIN ANDSUBCUTANEOUS TISSUE 0 5 1 0 0 0 4 4 3 3 0
44. CONGENITAL ANOMALIES 4 3 2 2 0 4 6 8 4 4 1
45. CERTAIN CONDITIONSORIGINATING IN THEPERINATAL PERIOD 25 13 19 6 13 14 30 22 20 18 9
46. SIGNS, SYMPTOMS & ILLDEFINED CONDITIONS 53 52 59 22 41 52 37 80 67 54 48
E47·E55 ACCIDENTS, POISONINGAND VIOLENCE 19 8 17 . 27 21 12 7 21 31 22 12
NOT CLASSIFIED 13 9 8 6 3 6 31 14 7 14 20
TOTAL 417 304 387 338 412 349 432 466 488 455 424

V1W
TABLE 31 _ CONT'O
CAUSE OF DEATH 1989 1990 1991 1992 1993 1994 1995 1996 1997 1998
26. HYPERTENSIVE DISEASE 56 64 66 80 81 69 97 102 74 94
27-30. DISEASES OF THECIRCULATORY SYSTEM 121 133 103 103 106 106 101 95 105 93
O/WDiseases of the heart 84 87 73 63 76 66 63 56 78 64
31-32. DISEASES OF THERESPIRATORY SYSTEM 13 31 27 25 35 28 39 51 22 39
34. DISEASES OF THEDIGESTIVE SYSTEM 10 15 18 16 19 16 16 13 10 23
35·36. DISEASES OF THEGENITO·URINARY SYSTEM 13 10 10 16 12 5 16 12 12 8
39. 01 RECT OBSTETRIC CAUSES 0 0 1 0 0 1 1 0 0 ; 1
42. DISEASES OF SKIN ANDSUBCUTANEOUS TISSUE 0 2 6 7 6 1 3 4 0 2
44. CONGENITAL ANOMALIES 3 7 8 6 1 4 2 9 7 6
45. CERTAIN CONDITIONSORIGINATING IN THEPERINATAL PERIOD 18 12 14 15 14 15 14 14 12 11
46. SIGNS, SYMPTOMS & ILLDEFINED CONDITIONS 59 41 62 54 61 89 67 71 52 52
E47·E55 ACCIDENTS, POISONINGAND VIOLENCE 29 13 38 37 27 21 34 22 28 44
NOT CLASSIFIED 9 25 15 21 26 14 7 2 3 7
TOTAL 497 512 518 566 558 530 584 583 513 595
Source: Health Statistics Department/ Ministry of Health


Sub-Section V-II: Education
College enrollment increased by 243.59% over the period 1978/79 to 1998/99 as
I-ligh Scllool ellrollment registered a 138.81% increase over the same period. Pre-school
recorded an increase in enrollment of 761. However, total school population declined by
about 1000. This was attributed to the 36.0% drop in Primary School enrollment over the
1978/79 to 1998/99 academic years (Table 32).
Total number of schools has increased from 125 in 1980/81 to 161 in the 1997/98
acade111ic year represe11til1g a 28.8% rise. A significant increase was observed in the
nUl1lber High Schools, almost doubling over the 21-year period. Pre-schools registered
and increase of 32 n10re centers. The number of Prin1ary Schools has gradually reduced
over the period (Table 33).
Total number of teachers increased by 33.0% with High Schools registering the
highest rise, 103.47%. The ratio of total students to teachers moved from 24 to 1 in
1983/84 to 21 to 1 in 1997/98. Presently)Prin1ary Schools have reflected a student to
teacller ratio of 22 to 1 ill comparison to a 28 to 1 in the 1980/81 academic year (Tables
32 and 34).
The male repetition rate has increased from 0.035 in 1984/85 to 0.131 in 1997/98,
while the feluale repetition rate dropped from 0.078 to 0.062 over the same period. The
total repetition rate decreased from 0.140 in 1980/81 to 0.099 in 1997/98. From 1984/85
to 1996/97 the male dropout rate increased slightly from 0.007 to 0.012 while the female
dropout rate declined from 0.017 to 0.010. The total dropout rate decreased from 0.030
in 1980/81 to 0.022 in 1997/98 (Table 35).
54
From 1980/81 to 1997/98 the number of students completing High School
increased by 356, reflecting a 95.0% rise; students completing college registered a
177.0% increase, over the period (Table 36).
Of all males sitting the Common Entrance Exams (the pre-high school national
exams) 23.430/0 passed in 1979 in comparison to 52.32% in 1998. Females sitting the,
COlllnlon Entrance EXaJ.l1 registered a 19.51% pass rate in 1979 in comparison to 68.05%
in 1998. Of all students sitting the Common Entrance Exam, the per~entage passing
increased from 27.5% in 1979 to 60.5 in 1998. This national percentage pass increase is
a measure towards the goal of allowing every Primary School student an equal
opportullity to attend High School (Table 37).
According to the 1991 Population Census Results on Education, about 34.0% of
tIle male population (above 15 years) have been trained as Craft & Related workers. The
Technical and Associated Professions occupational group accounted for 25.79%. The
20-34 age group accounted for 44.0% of all trained males (Table 38A).
Forty one percent (41.0%) of women are trained in the Technical and Associated
Professions occupational group, followed by the Clerical profession group, 21.7%. The
20-34 age group accounted for 51.14% of all trained females (Table 38B).
Of trained persons above 15 years, 32.5% were trained for Technical and
Associated Professions while 22.79% were trained as Craft and Related workers. The
20-34 age group registered 47.2% of trained persons (Table 38C).
The 1991 Census data revealed that thirty-five percent (35.0%) of males have
attained a Primary School education and 6.0% have conlpleted High School. However,
32.0% of females have completed Primary but a higher percentage than males, 9.0% has
55
attained a High School education. An almost equal number had acquired a post-
secondary education but males surpassed females at the University level - recording 608
males in comparison to 352, attaining a University education in 1991 (Tables 39 A, B &C).
From the 1991 Census results, 20,124 persons were currently at educational
.,institution, accounting for 29.0% of the total population. The trend remained almost
stable as in the 1997/98 academic year a total of 22,415 persons were enrolled at
educational institutions representing 29.6% of the mean population.
56

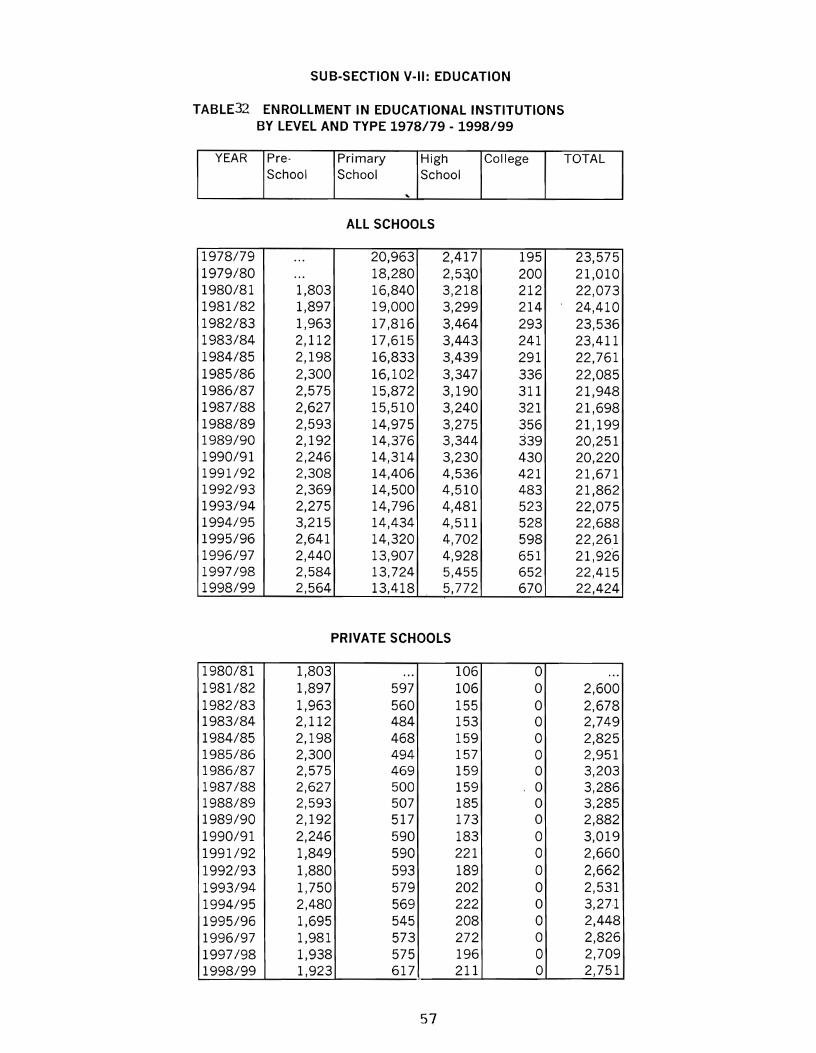
SUB-SECTION V-II: EDUCATION
TABLE32 ENROLLMENT IN EDUCATIONAL INSTITUTIONSBY LEVEL AND TYPE 1978/79 - 1998/99
YEAR Pre- Primary High College TOTALSchool School School
"
ALL SCHOOLS
1978/79 000 20,963 2,417 195 23,5751979/80 000 18,280 2,540 200 21,0101980/81 1,803 16,840 3,218 212 22,0731981/82 1,897 19,000 3,299 214 24,4101982/83 1,963 17,816 3,464 293 23,5361983/84 2,112 17,615 3,443 241 23,4111984/85 2,198 16,833 3,439 291 22,7611985/86 2,300 16,102 3,347 336 22,0851986/87 2,575 15,872 3,190 311 21,9481987/88 2,627 15,510 3,240 321 21,6981988/89 2,593 14,975 3,275 356 21,1991989/90 2,192 14,376 3,344 339 20,2511990/91 2,246 14,314 3,230 430 20,2201991/92 2,308 14,406 4,536 421 21,6711992/93 2,369 14,500 4,510 483 21,8621993/94 2,275 14,796 4,481 523 22,0751994/95 3,215 14,434 4,511 528 22,6881995/96 2,641 14,320 4,702 598 22,2611996/97 2,440 13,907 4,928 651 21,9261997/98 2,584 13,724 5,455 652 22,4151998/99 2,564 13,418 5,772 670 22,424
PRIVATE SCHOOLS
1980/81 1,803 000 106 0 000
1981/82 1,897 597 106 0 2,6001982/83 1,963 560 155 0 2,6781983/84 2,112 484 153 0 2,7491984/85 2,198 468 159 0 2,8251985/86 2,300 494 157 0 2,9511986/87 2,575 469 159 0 3,2031987/88 2,627 500 159 0 3,2861988/89 2,593 507 185 0 3,2851989/90 2,192 517 173 0 2,8821990/91 2,246 590 183 0 3,0191991/92 1,849 590 221 0 2,6601992/93 1,880 593 189 0 2,6621993/94 1,750 579 202 0 2,5311994/95 2,480 569 222 0 3,2711995/96 1,695 545 208 0 2,4481996/97 1,981 573 272 0 2,8261997/98 1,938 575 196 0 2,7091998/99 1,923 617 211 0 2,751
57
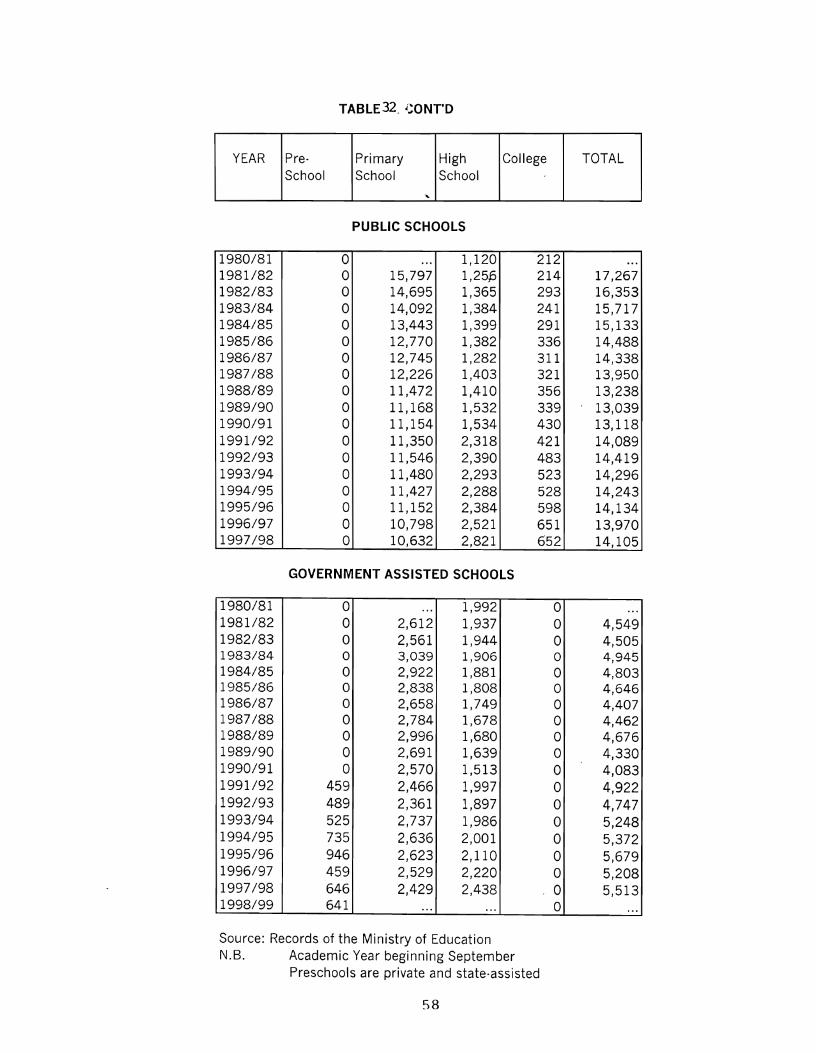
TABLE32. J;ONT'D
YEAR Pre· Primary High College TOTALSchool School School
.,
PUBLIC SCHOOLS
1980/81 0 ... 1,120 212 ...1981/82 0 15,797 1,25p 214 17,2671982/83 0 14,695 1,3~5 293 16,3531983/84 0 14,092 1,384 241 15,7171984/85 0 13,443 1,399 291 15,1331985/86 0 12,770 1,382 336 14,4881986/87 0 12,745 1,282 311 14,3381987/88 0 12,226 1,403 321 13,9501988/89 0 11,472 1,410 356 13,2381989/90 0 11,168 1,532 339 13,0391990/91 0 11,154 1,534 430 13,1181991/92 0 11,350 2,318 421 14,0891992/93 0 11,546 2,390 483 14,4191993/94 0 11,480 2,293 523 14,2961994/95 0 11,427 2,288 528 14,2431995/96 0 11,152 2,384 598 14,1341996/97 0 10,798 2,521 651 13,9701997/98 0 10,632 2,821 652 14,105
GOVERNMENT ASSISTED SCHOOLS
1980/81 0 ... 1,992 0 ...1981/82 0 2,612 1,937 0 4,5491982/83 0 2,561 1,944 0 4,5051983/84 0 3,039 1,906 0 4,9451984/85 0 2,922 1,881 0 4,8031985/86 0 2,838 1,808 0 4,6461986/87 0 2,658 1,749 0 4,4071987/88 0 2,784 1,678 0 4,4621988/89 0 2,996 1,680 0 4,6761989/90 0 2,691 1,639 0 4,3301990/91 0 2,570 1,513 0 4,0831991/92 459 2,466 1,997 0 4,9221992/93 489 2,361 1,897 0 4,7471993/94 525 2,737 1,986 0 5,2481994/95 735 2,636 2,001 0 5,3721995/96 946 2,623 2,110 0 5,6791996/97 459 2,529 2,220 0 5,2081997/98 646 2,429 2,438 ,0 5,5131998/99 641 ... ... 0 ...
Source: Records of the Ministry of EducationN.B. Academic Year beginning September
Preschools are private and state-assisted
58
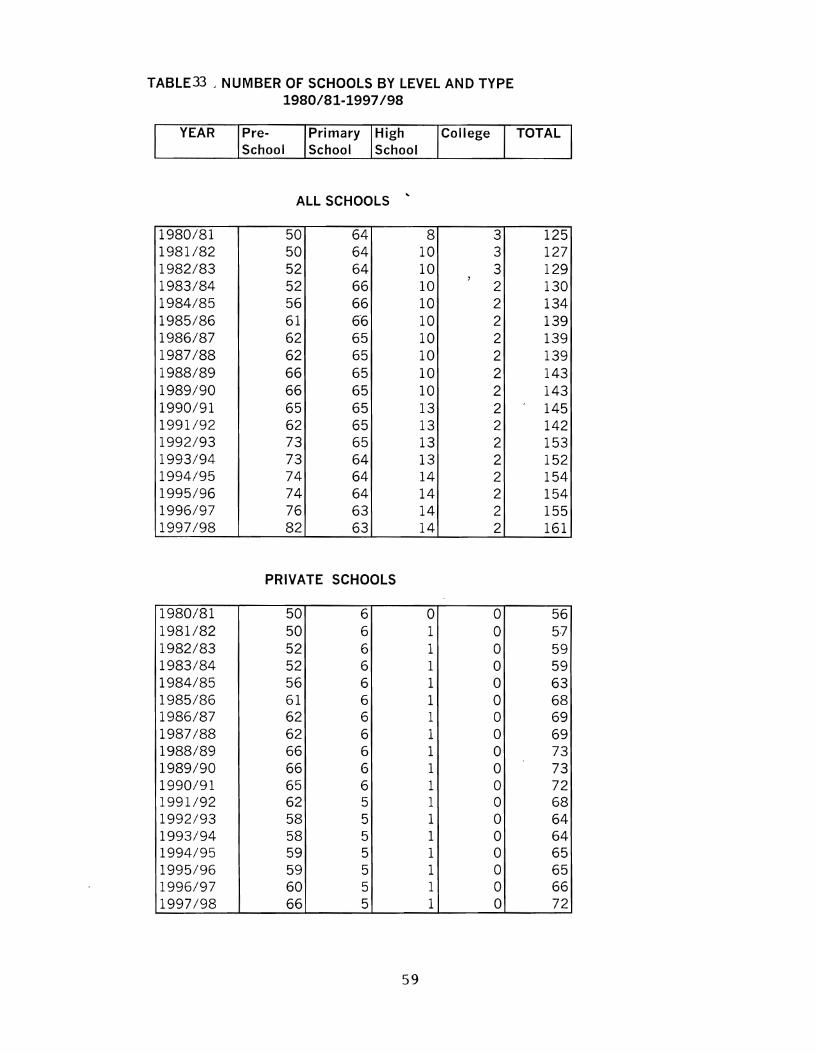
TABLE33 J NUMBER OF SCHOOLS BY LEVEL AND TYPE1980/81-1997/98
YEAR
ALL SCHOOLS "
1980/81 50 64 8 3 1251981/82 50 64 10 3 1271982/83 52 64 10 3 129
52 66 10,
2 1301983/841984/85 56 66 10 2 1341985/86 61 66 10 2 1391986/87 62 65 10 2 1391987/88 62 65 10 2 1391988/89 66 65 10 2 1431989/90 66 65 10 2 1431990/91 65 65 13 2 1451991/92 62 65 13 2 1421992/93 73 65 13 2 1531993/9L1· 73 64 13 2 1521994/95 74 64 14 2 1541995/96 74 64 14 2 1541996/97 76 63 14 2 1551997/98 82 63 14 2 161
PRIVATE SCHOOLS
1980/81 50 6 0 0 561981/82 50 6 1 0 571982/83 52 6 1 0 591983/84 52 6 1 0 591984/85 56 6 1 0 631985/86 61 6 1 0 681986/87 62 6 1 0 691987/88 62 6 1 0 691988/89 66 6 1 0 731989/90 66 6 1 0 731990/91 65 6 1 0 721991/92 62 5 1 0 681992/93 58 5 1 0 641993/94 58 5 1 0 641994/95 59 5 1 0 651995/96 59 5 1 0 651996/97 60 5 1 0 661997/98 66 5 1 0 72
59
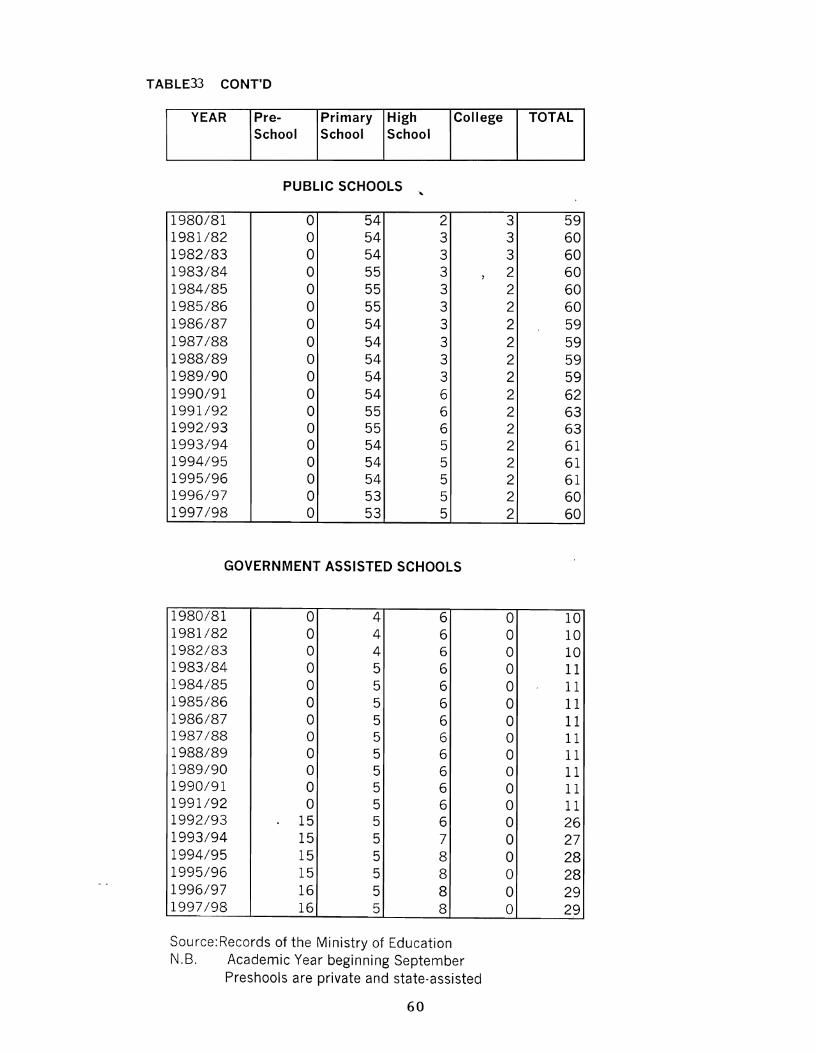
TABLE33 CONT'O
YEAR Pre- Primary High College TOTALSchool School School
PUBLIC SCHOOLS "
1980/81 0 54 2 3 591981/82 0 54 3 3 601982/83 0 54 3 3 601983/84 0 55 3 , 2 601984/85 0 55 3 2 601985/86 0 55 3 2 601986/87 0 54 3 2 591987/88 0 54 3 2 591988/89 0 54 3 2 591989/90 0 54 3 2 591990/91 0 54 6 2 621991/92 0 55 6 2 631992/93 0 55 6 2 631993/94 0 54 5 2 611994/95 0 54 5 2 611995/96 0 54 5 2 611996/97 0 53 5 2 601997/98 0 53 5 2 60
GOVERNMENT ASSISTED SCHOOLS
1980/81 0 4 6 0 101981/82 0 4 6 0 101982/83 0 4 6 0 101983/84 0 5 6 0 111984/85 0 5 6 0 111985/86 0 5 6 0 111986/87 0 5 6 0 111987/88 0 5 6 0 111988/89 0 5 6 0 111989/90 0 5 6 0 111990/91 0 5 6 0 111991/92 0 5 6 0 111992/93 15 5 6 0 261993/94 15 5 7 0 271994/95 15 5 8 0 281995/96 15 5 8 0 281996/97 16 5 8 0 291997/98 16 5 8 0 29
Source:Records of the Ministry of EducationN.B. Academic Year beginning September
Preshools are private and state-assisted
60

TABLE' 34' NUMBER OF TEACHERS & INSTRUCTORS BY LEVELOF INSTRUCTIONS & QUALIFICATION 1980/81-1997/98
YEAR Pre- Primary High College TOTAL(1) School School School
"
ALL TEACHERS
1980/81 80 592 144 8161981/82 79 614 145 , 8381982/83 81 659 157 8971983/84 86 673 160 45 9641984/85 86 612 162 35 8951985/86 86 612 166 25 8891986/87 99 616 171 25 9111987/88 102 617 182 25 9261988/89 103 624 175 26 9281989/90 103 595 142 33 8731990/91 100 670 176 37 9831991/92 102 598 251 36 9871992/93 108 637 262 39 1,0461993/94 108 674 256 39 1,0771994/95 112 641 269 39 1,0611995/96 127 628 278 45 1,0781996/97 135 626 283 45 1,0891997/98 137 611 293 47 1,088
UNQUALIFIED TEACHERS
1980/81 80 383 111 ... 5741981/82 79 406 112 ... 5971982/83 81 441 112 ... 6341983/84 86 466 114 ° 666:1984/85 86 407 115 ° 6081985/86 86 419 107 0 6121986/87 99 389 121 ° 6091987/88 102 370 116 0 5881988/89 103 354 112 0 5691989/90 98 340 100 0 5381990/91 95 417 97 0 6091991/92 95 356 160 0 6111992/93 99 379 163 0 6411993/94 99 469 159 0 7271994/95 101 457 160 ° 7181995/96 112 461 165 ° 7381996/97 129 301 194 ° 6241997/98 131 258 190 ° 579
61
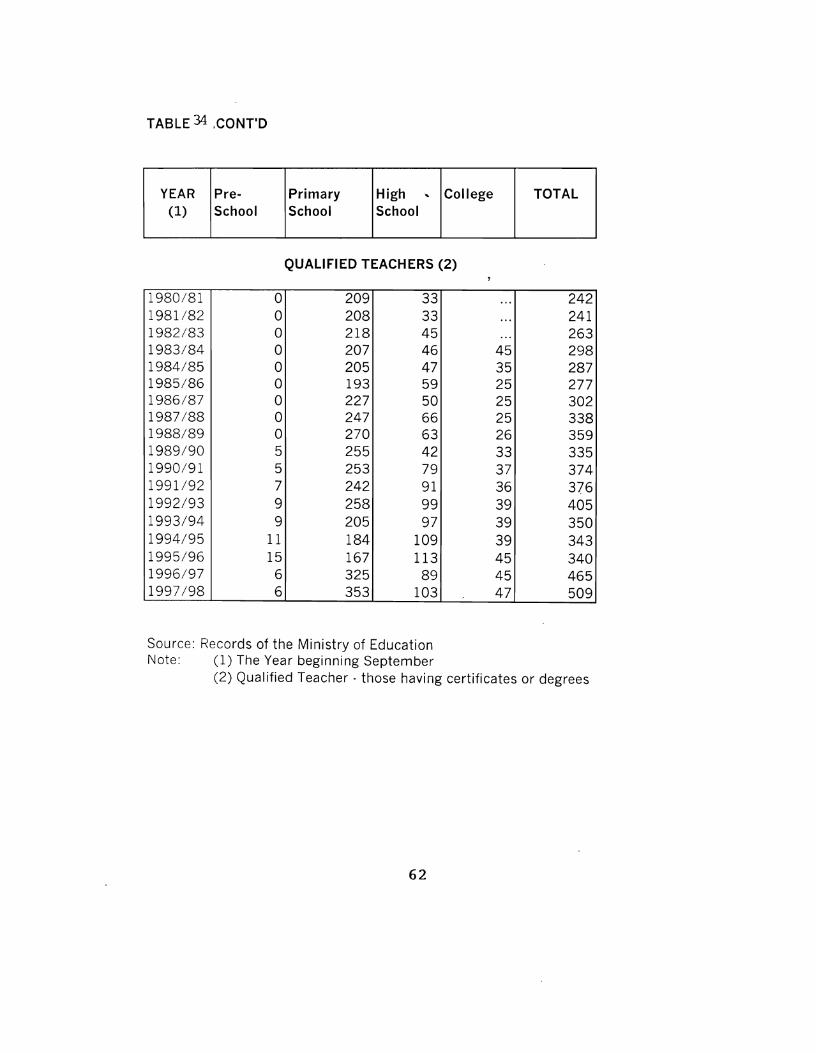
TABLE 34 .CONT'D
YEAR Pre- Primary High " College TOTAL(1) School School School
QUALIFIED TEACHERS (2)
1980/81 0 209 33 ... 2421981/82 0 208 33 ... 2411982/83 0 218 45 ... 2631983/84 0 207 46 45 2981984/85 0 205 47 35 2871985/86 0 193 59 25 2771986/87 0 227 50 25 3021987/88 0 247 66 25 3381988/89 0 270 63 26 3591989/90 5 255 42 33 3351990/91 5 253 79 37 3741991/92 7 242 91 36 3761992/93 9 258 99 39 4051993/94 9 205 97 39 3501994/95 11 184 109 39 3431995/96 15 167 113 45 3401996/97 6 325 89 45 4651997/98 6 353 103 47 509
Source: Records of the Ministry of EducationNote: (1) The Year beginning September
(2) Qualified Teacher· those having certificates or degrees
62
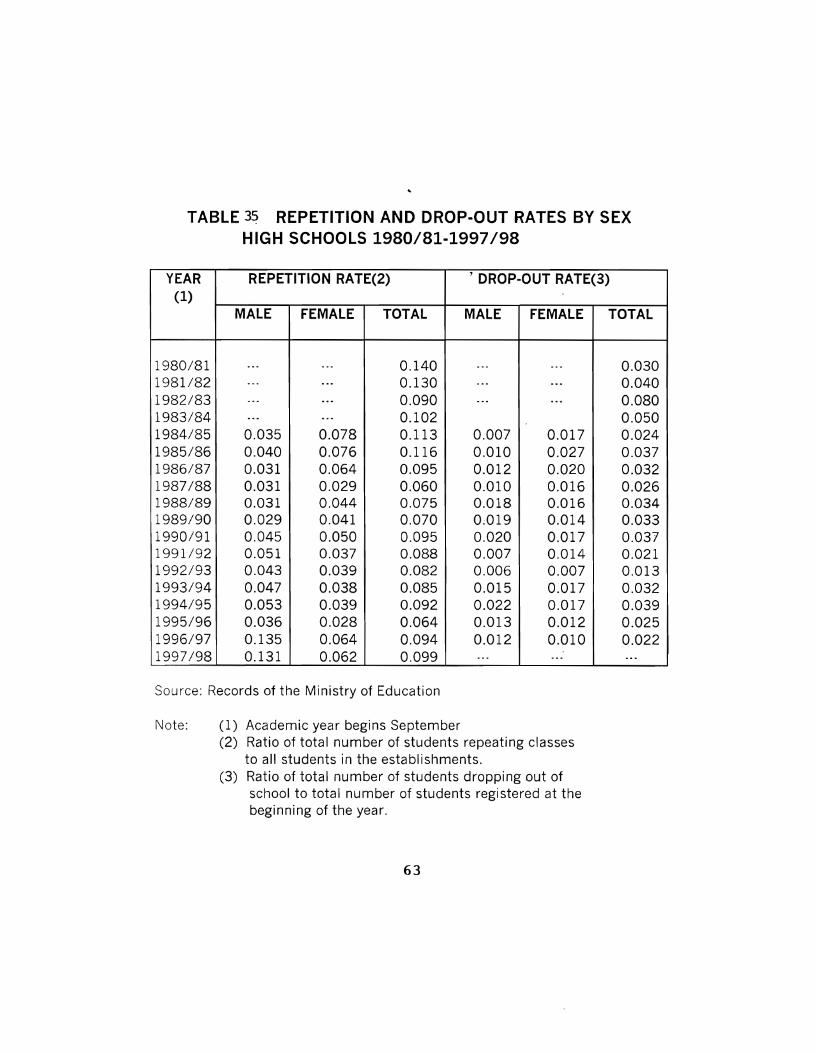
TABLE 3~ REPETITION AND DROP-OUT RATES BY SEXHIGH SCHOOLS 1980/81-1997/98
YEAR REPETITION RATE(2) , DROP-OUT RATE(3)(1)
MALE FEMALE TOTAL MALE FEMALE TOTAL
1980/81 ... ... 0.140 ... ... 0.0301981/82 ... ... 0.130 ... ... 0.0401982/83 ... ... 0.090 ... ... 0.0801983/84 ... ... 0.102 0.0501984/85 0.035 0.078 0.113 0.007 0.017 0.0241985/86 0.040 0.076 0.116 0.010 0.027 0.0371986/87 0.031 0.064 0.095 0.012 0.020 0.0321987/88 0.031 0.029 0.060 0.010 0.016 0.0261988/89 0.031 0.044 0.075 0.018 0.016 0.0341989/90 0.029 0.041 0.070 0~019 0.014 0.0331990/91 0.045 0.050 0.095 0.020 0.017 0.0371991/92 0.051 0.037 0.088 0.007 0.014 0.0211992/93 0.043 0.039 0.082 0.006 0.007 0.0131993/94 0.047 0.038 0.085 0.015 0.017 0.0321994/95 0.053 0.039 0.092 0.022 0.017 0.0391995/96 0.036 0.028 0.064 0.013 0.012 0.0251996/97 0.135 0.064 0.094 0.012 0.010 0.0221997/98 0.131 0.062 0.099 ... ... ...
Source: Records of the Ministry of Education
Note: (1) Academic year begins September(2) Ratio of total number of students repeating classes
to all students in the establishments.(3) Ratio of total number of students dropping out of
school to total number of students registered at thebeginning of the year.
63
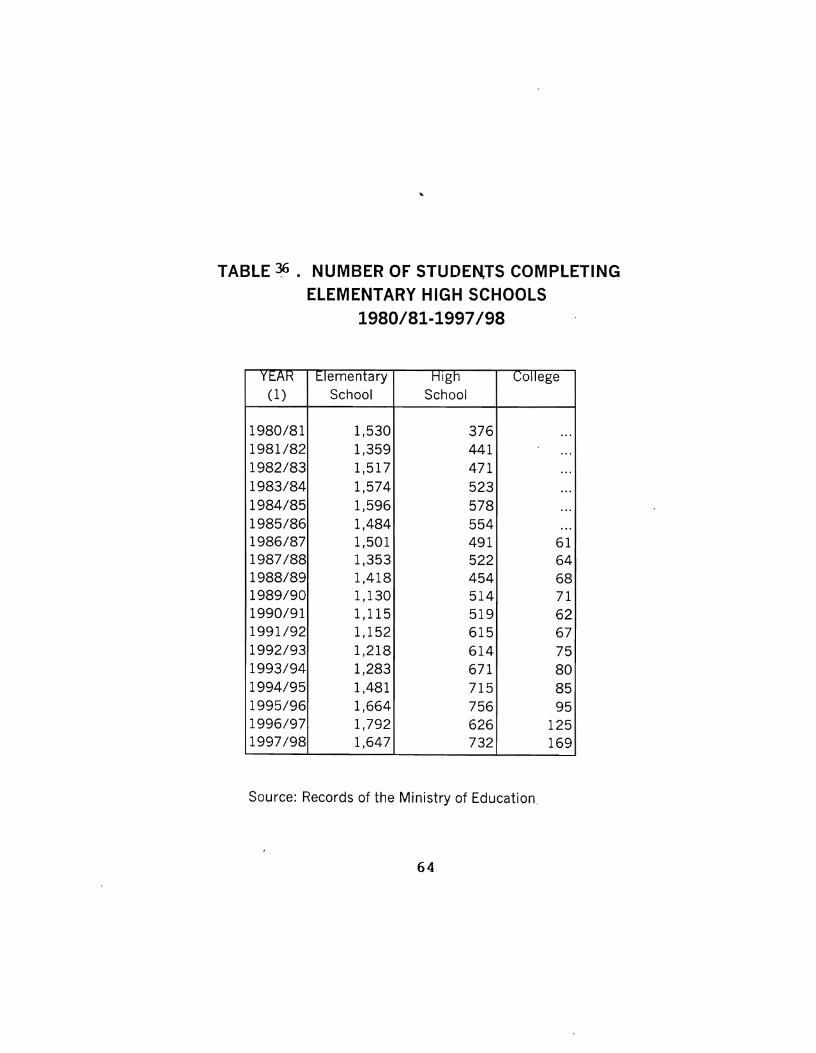
TABLE ~. NUMBER OF STUDEN,TS COMPLETINGELEMENTARY HIGH SCHOOLS
1980/81·1997/98
YEAH l:.lementary High College(1) School School
1980/81 1,530 376 ...1981/82 1,359 441 ...1982/83 1,517 471 ...1983/84 1,574 523 ...1984/85 1,596 578 ...1985/86 1,484 554 ...1986/87 1,501 491 611987/88 1,353 522 641988/89 1,418 454 681989/90 1,130 514 711990/91 1,115 519 621991/92 1,152 615 671992/93 1,218 614 751993/94 1,283 671 801994/95 1,481 715 851995/96 1,664 756 951996/97 1,792 626 1251997/98 1,647 732 169
Source: Records of the Ministry of Education,
64
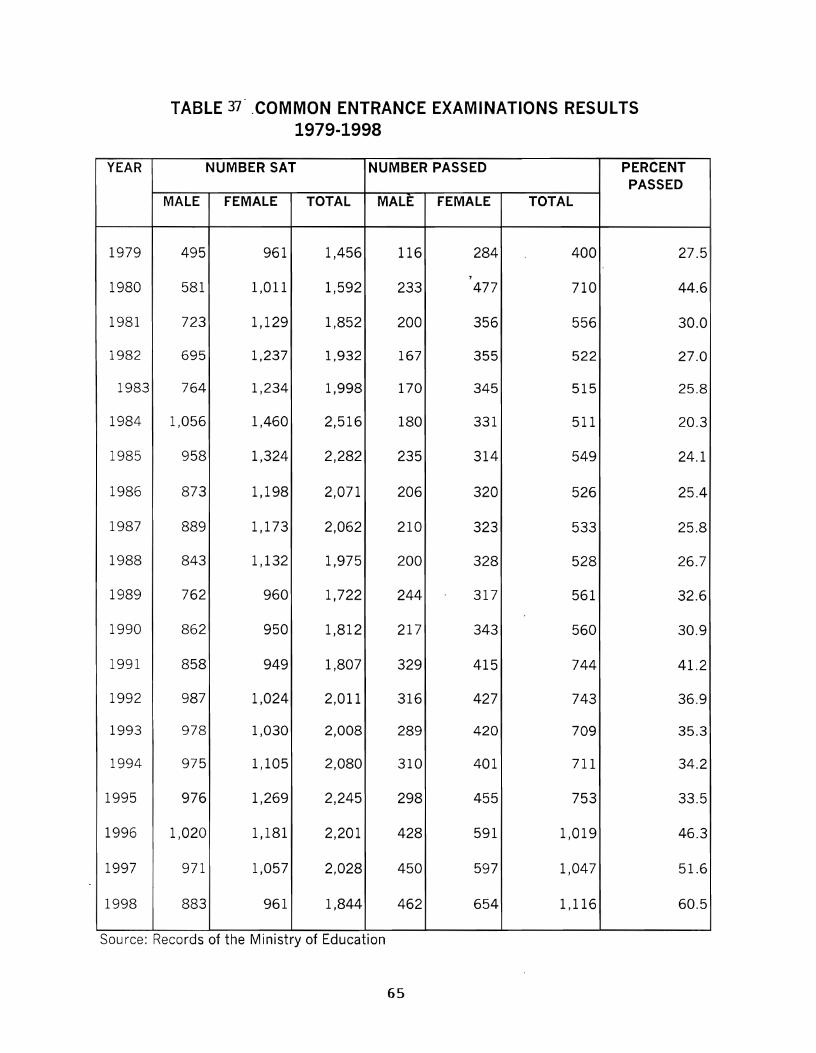
TABLE 37- ,COMMON ENTRANCE EXAMINATIONS RESULTS1979-1998
YEAR NUMBER SAT NUMBER PASSED PERCENTPASSED
MALE FEMALE TOTAL MALE FEMALE TOTAL
1979 495 961 1,456 116 284 400 27.5,
1980 581 1,011 1,592 233 477 710 44.6
1981 723 1,129 1,852 200 356 556 30.0
1982 695 1,237 1,932 167 355 522 27.0
1983 764 1,234 1,998 170 345 515 25.8
1984 1,056 1,460 2,516 180 331 511 20.3
1985 958 1,324 2,282 235 314 549 24.1
1986 873 1,198 2,071 206 320 526 25.4
1987 889 1,173 2,062 210 323 533 25.8
1988 843 1,132 1,975 200 328 528 26.7
1989 762 960 1,722 244 317 561 32.6
1990 862 950 1,812 217 343 560 30.9
1991 858 949 1,807 329 415 744 41.2
1992 987 1,024 2,011 316 427 743 36.9
1993 978 1,030 2,008 289 420 709 35.3
1994 975 1,105 2,080 310 401 711 34.2
1995 976 1,269 2,245 298 455 753 33.5
1996 1,020 1,181 2,201 428 591 1,019 46.3
1997 971 1,057 2,028 450 597 1,047 51.6
1998 883 961 1,844 462 654 1,116 60.5
Source: Records of the Ministry of Education
65
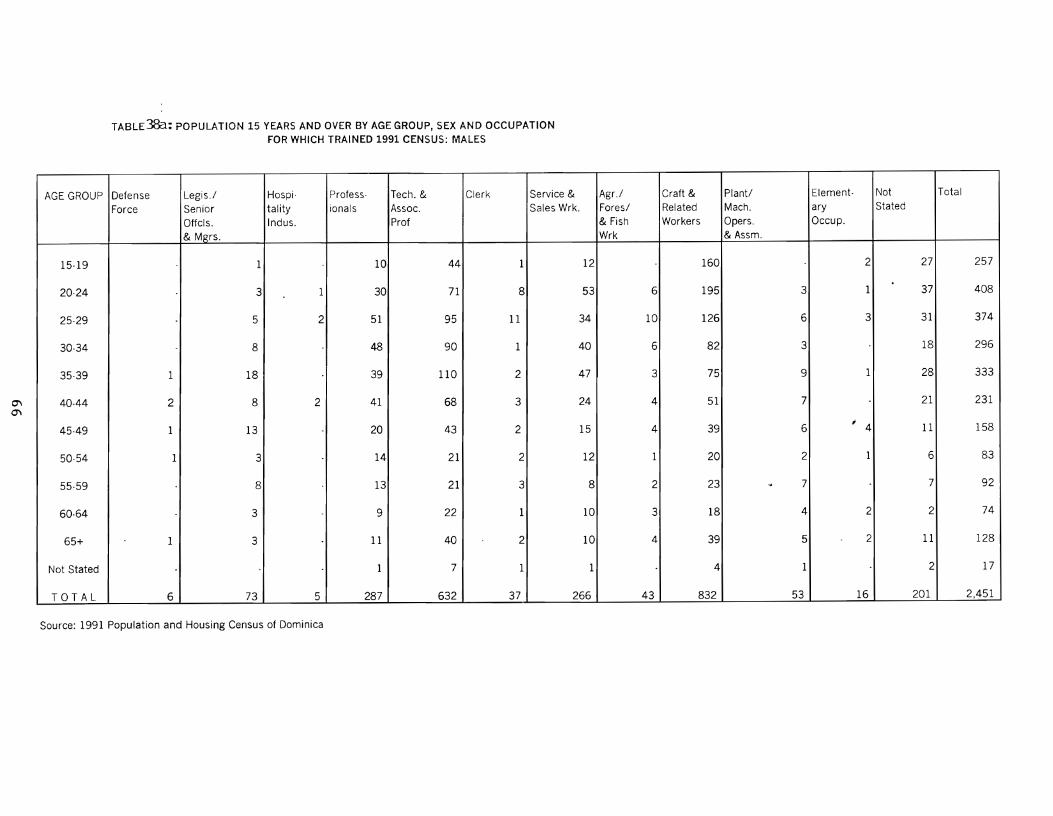
'"0"\
TABLE383; POPULATION 15 YEARS AND OVER BY AGE GROUP, SEX AND OCCUPATIONFOR WHICH TRAINED 1991 CENSUS: MALES
AGE GROUP Defense Legis.! Hospi- Profess- Tech. & Clerk Service & Agr.! Craft & Plant/ Element- Not Total
Force Senior tality ionals Assoc. Sales Wrk. Fores/ Related Mach. ary Stated
Offcls. Indus. Prof & Fish Workers Opers. Occup.
& Mgrs. Wrk & Assm.
15·19 1 10 44 1 12 160 2 27 257
20-24 3 1 30 71 8 53 6 195 3 1 37 408
25-29 5 2 51 95 11 34 10 126 6 3 31 374
30-34 8 48 90 1 40 6 82 3 18 296
35·39 1 18 39 110 2 47 3 75 9 1 28 333
40-44 2 8 2 41 68 3 24 4 51 7 21 231
45-49 1 13 20 43 2 15 4 39 6 ' 4 11 158
50-54 1 3 14 21 2 12 1 20 2 1 6 83
55-59 8 13 21 3 8 2 23 .. 7 7 92
60-64 3 9 22 1 10 3 18 4 2 2 74
65+ 1 3 11 40 2 10 4 39 5 2 11 128
Not Stated 1 7 1 1 4 1 2 17
TOTAL 6 73 5 287 632 37 266 43 832 53 16 201 2,451
Source: 1991 Population and Housing Census of Dominica
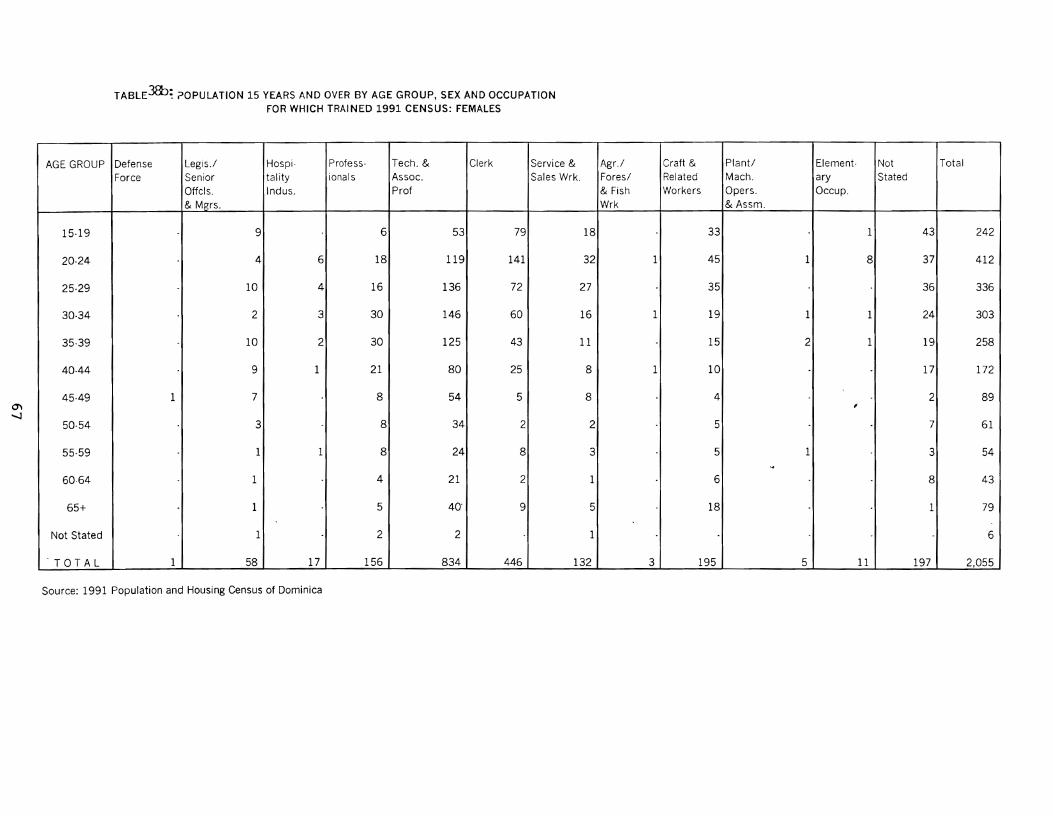
0'\-.....J
TABLE)&); ?OPULATION 15 YEARS AND OVER BY AGE GROUP, SEX AND OCCUPATION
FOR WHICH TRAINED 1991 CENSUS: FEMALES
AGE GROUP Defense Legis.! Hospj· Profess- Tech. & Clerk Service & Agr./ Craft & Plant/ Element- Not Total
Force Senior tality ionals Assoc. Sales Wrk. Fores/ Related Mach. ary Stated
Offcls. Indus. Prof & Fish Workers Opers. Occup.
& Mgrs. Wrk & Assm.
15-19 9 6 53 79 18 33 1 43 242
20-24 4 6 18 119 141 32 1 45 1 8 37 412
25-29 10 4 16 136 72 27 35 36 336
30-34 2 3 30 146 60 16 1 19 1 1 24 303
35-39 10 2 30 125 43 11 15 2 1 19 258
40-44 9 1 21 80 25 8 1 10 17 172
45-49 1 7 8 54 5 8 4 2 89,50-54 3 8 34 2 2 5 7 61
55-59 1 1 8 24 8 3 5 1 3 54....
60-64 1 4 21 2 1 6 8 43
65+ 1 5 40· 9 5 18 1 79
Not Stated 1 2 2 1 6
TOTAL 1 58 17 156 834 446 132 3 195 5 11 197 2,055
Source: 1991 Population and Housing Census of Dominica
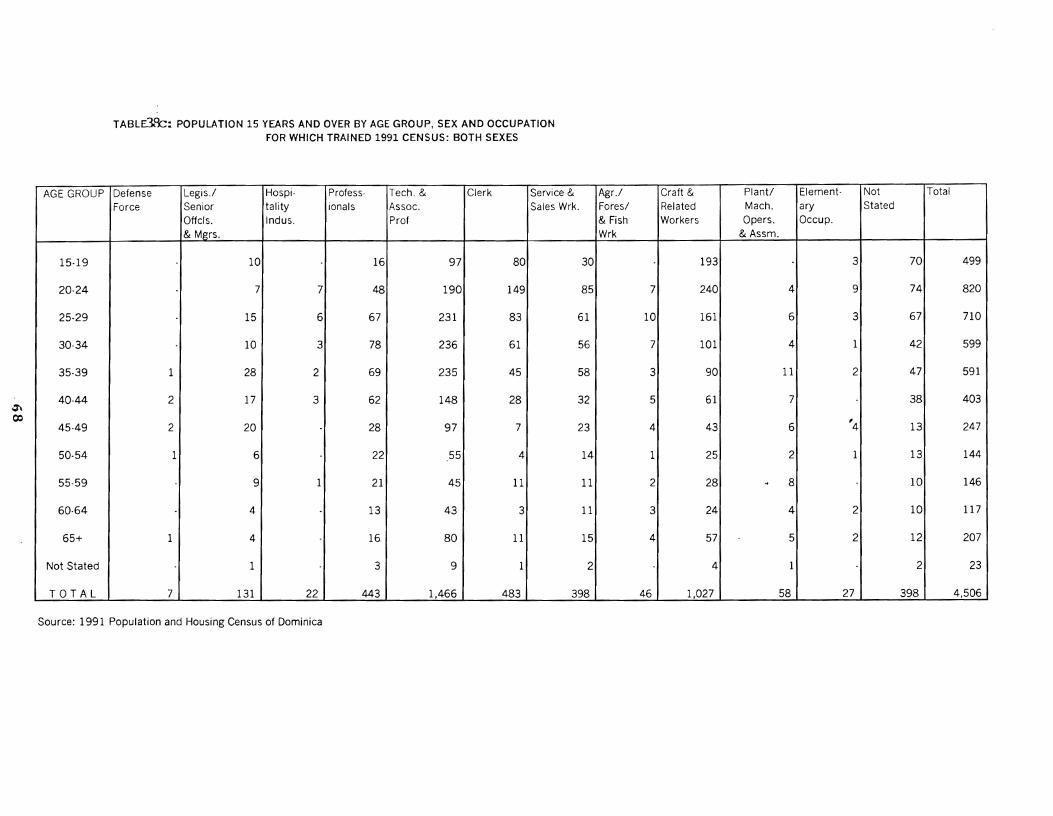
I~Ct>
TABLd'C: POPULATION 15 YEARS AND OVER BY AGE GROUP, SEX AND OCCUPATIONFOR WHICH TRAINED 1991 CENSUS: BOTH SEXES
AGE GROUP Defense Legis.! Hospi· Profess- Tech. & Clerk Service & Agr.! Craft & Plant/ Element- Not Total
Force Senior tality ionals Assoc. Sales Wrk. Fores/ Related Mach. ary Stated
Offcls. Indus. Prof & Fish Workers Opers. Occup.
& Mgrs. Wrk & Assm.
15-19 10 16 97 80 30 193 3 70 499
20-24 7 7 48 190 149 85 7 240 4 9 74 820
25-29 15 6 67 231 83 61 10 161 6 3 67 710
30-34 10 3 78 236 61 56 7 101 4 1 42 599
35-39 1 28 2 69 235 45 58 3 90 11 2 47 591
40-44 2 17 3 62 148 28 32 5 61 7 38 403
45-49 2 20 28 97,
13 2477 23 4 43 6 4
50-54 1 6 22 55 4 14 1 25 2 1 13 144
55-59 9 1 21 45 11 11 2 28 -4 8 10 146
60-64 4 13 43 3 11 3 24 4 2 10 117
65+ 1 4 16 80 11 15 4 57 5 2 12 207
Not Stated 1 3 9 1 2 4 1 2 23
TOTAL 7 131 22 443 1,466 483 398 46 1,027 58 27 398 4,506
Source: 1991 Population and Housing Census of Dominica
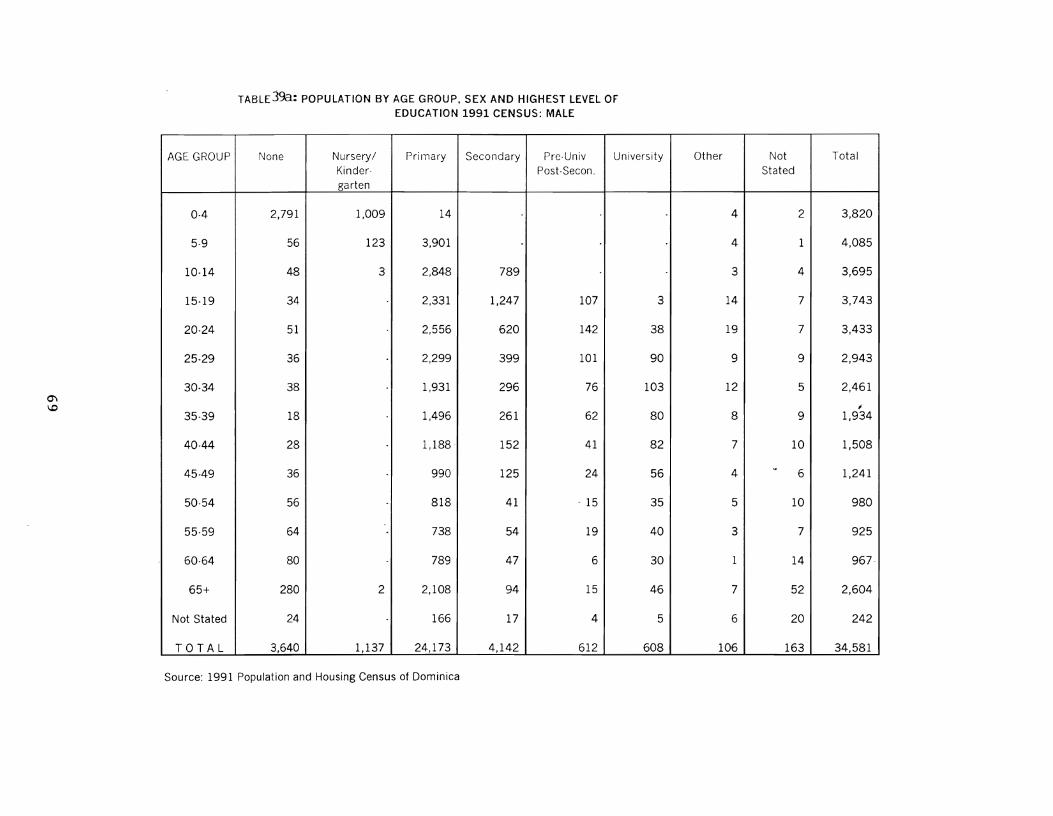
0'\
""
TABLETh: POPULATION BY AGE GROUP, SEX AND HIGHEST LEVEL OFEDUCATION 1991 CENSUS: MALE
AGE GROUP None Nursery/ Prirnary Secondary Pre-Univ University Other Not TotalKinder- Post-Secon. Statedgarten
0·4 2,791 1,009 14 4 2 3,820
5·9 56 123 3,901 4 1 4,085
10-14 48 3 2,848 789 3 4 3,695
15-19 34 2,331 1,247 107 3 14 7 3,743
20-24 51 2,556 620 142 38 19 7 3,433
25-29 36 2,299 399 101 90 9 9 2,943
30-34 38 1,931 296 76 103 12 5 2,461,
35-39 18 1,496 261 62 80 8 9 1,934
40·44 28 1,188· 152 41 82 7 10 1,508
45·49 36 990 125 24 56 4...
6 1,241
50-54 56 818 41 ~ 15 35 5 10 980
55·59 64 738 54 19 40 3 7 925
60·64 80 789 47 6 30 1 14 967-
65+ 280 2 2,108 94 15 46 7 52 2,604
Not Stated 24 166 17 4 5 6 20 242
TOTAL 3,640 1,137 24,173 4,142 612 608 106 163 34,581
Source: 1991 Population and Housing Census of Dominica

--..Jo
TABLE~~: ~OPULATION BY AGE GROUP, SEX AND HIGHEST LEVEL OF
EDUCATION 1991 CENSUS: FEMALE
AGE GROUP None Nursery! Primary Secondary Pre-Univ. University Other Not Total
Kinder- Post-Secon. Stated
garten
0-4 2,780 1,095 15 - - - 1 - 3,891
5-9 68 114 4,043 - - - 5 2 4,232
10-14 20 1 2,312 1,074 - - 6 3 3,416
15-19 33 1 1,434 1,924 102 1 14 9 3,518
20-24 21 - 1,839 1,266 160 21 23 8 3,338
25-29 23 - 1,745 765 103 47 9 10 2;702
30-34 21 - 1,600 449 88 63 15 3 2,239
35-39 12 - 1,282 298 72 68 16 11 1,759
40-44 16 - 1,136 181 42 50 7 9 1,441
45-49 29 - 1,066 95 22 29 4 4 1,249
50-54 60 - 975 50 16 22 3 10 1,136
55-59 65 1 1,028 45 10 22 2 19 1,192
60-64 74 - 971 52 7 14 - 12 1,130
65+ 382 3 2,891 113 7 12 10 58 3,476
Not Stated 24 - 107 9 3 3 4 16 166
TOTAL 3,628 1,215 22,444 6,321 632 352 119 174 34,885
Source: 1991 Population and Housing Census of Dominica
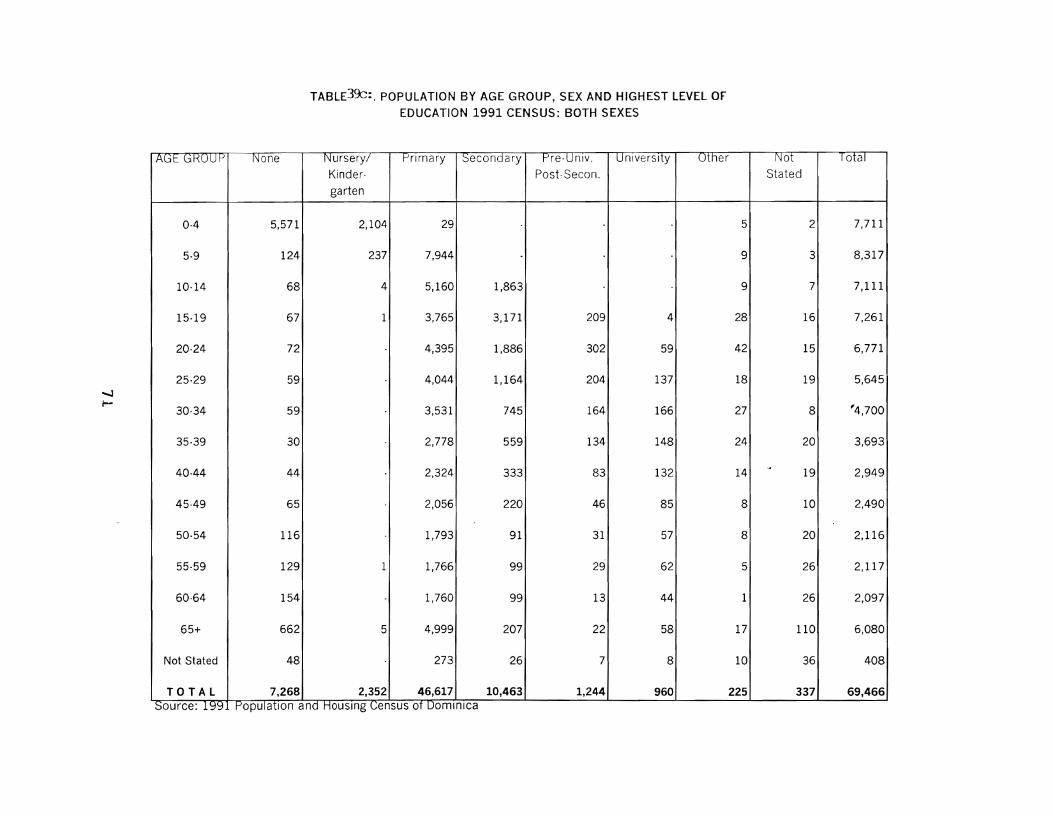
TABlE3~:. POPULATION BY AGE GROUP, SEX AND HIGHEST LEVEL OF
EDUCATION 1991 CENSUS: BOTH SEXES
gp
AGE GROUP None Nursery/ Primary Secondary Pre·Unlv. University Other Not lotal
Kinder· Post-Secon. Stated
garten
0·4 5,571 2,104 29 5 2 7,711
5-9 124 237 7,944 9 3 8,317
10-14 68 4 5,160 1,863 9 7 7,111
15-19 67 1 3,765 3,171 209 4 28 16 7,261
20-24 72 4,395 1,886 302 59 42 15 6,771
25-29 59 4,044 1,164 204 137 18 19 5,645
30-34 59 3,531 745 164 166 27 8 '4,700
35-39 30 2,778 559 134 148 24 20 3,693
40-44 44 2,324 333 83 132 14-4
19 2,949
45·49 65 2,056 220 46 85 8 10 2,490
50-54 116 1,793 91 31 57 8 20 2,116
55-59 129 1 1,766 99 29 62 5 26 2,117
60-64 154 1,760 99 13 44 1 26 2,097
65+ 662 5 4,999 207 22 58 17 110 6,080
Not Stated 48 273 26 7 8 10 36 408
TOTAL 7,268 2,352 46,617 10,463 1,244 960 225 337 69,466Source: 199 Po
-....Jr-
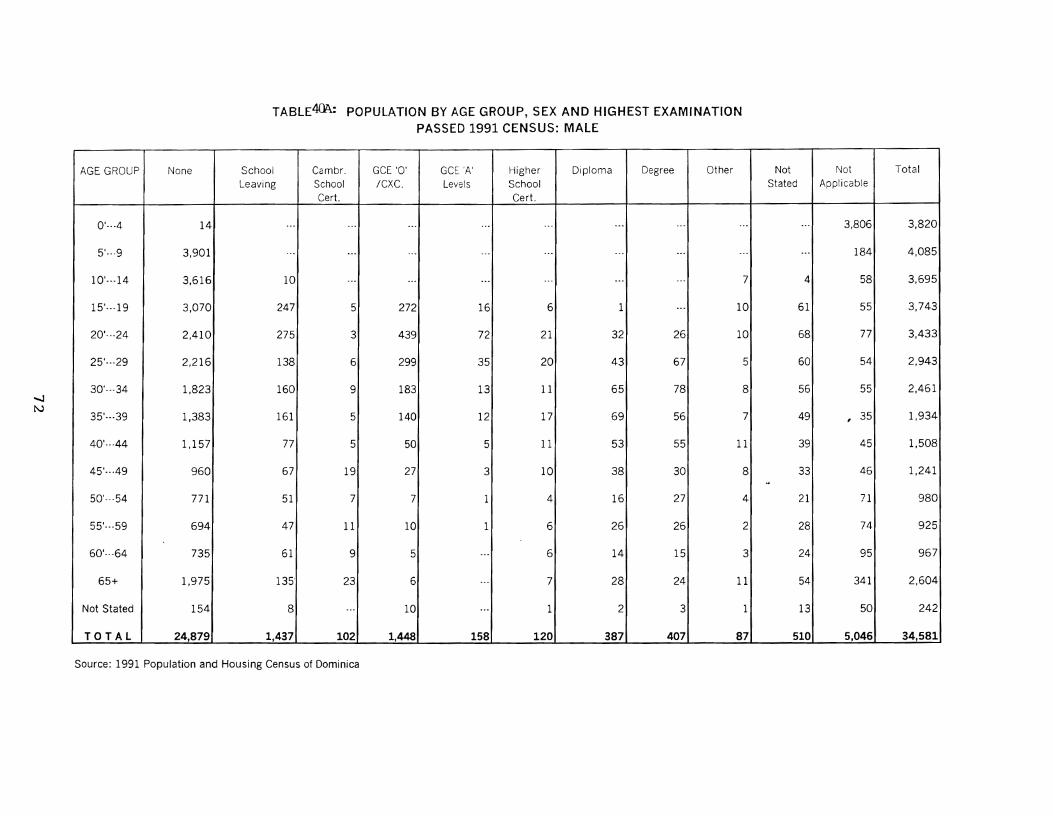
-...Jt\.)
TABLE4m: POPULATION BY AGE GROUP, SEX AND HIGHEST EXAMINATIONPASSED 1991 CENSUS: MALE
AGE GROUP None School Cambro GCE '0' GCE 'A' Higher Diploma Degree Other Not Not Total
Leaving School /CXC. Levels School Stated Applicable
Cert. Cert.
0'···4 14 ... ... ... . .. . .. ... . .. . .. ... 3,806 3,820
5····9 3,901 ... ... ". . .. ... ... ... ... ... 184 4,085
10'···14 3,616 10 ... ... ... ... ... ... 7 4 58 3,695
15'···19 3,070 247 5 272 16 6 1 ... 10 61 55 3,743
20'···24 2,410 275 3 439 72 21 32 26 10 68 77 3,433
25'···29 2,216 138 6 299 35 20 43 67 5 60 54 2,943
30'···34 1,823 160 9 183 13 11 65 78 8 56 55 2,461
35'···39 1,383 161 5 140 12 17 69 56 7 49 , 35 1,934
40'···44 1,157 77 5 50 5 11 53 55 11 39 45 1,508
45'···49 960 67 19 27 3 10 38 30 8 33 46 1,241...
50'···54 771 51 7 7 1 4 16 27 4 21 71 980
55'···59 694 47 11 10 1 6 26 26 2 28 74 925
60'···64 735 61 9 5 ... 6 14 15 3 24 95 967
65+ 1,975 135- 23 6 ... 7 28 24 11 54 341 2,604
Not Stated 154 8 ... 10 '.' 1 2 3 1 13 50 242
TOTAL 24,879 1,437 102 1,448 158 120 387 407 87 510 5,046 34,581
Source: 1991 Population and Housing Census of Dominica
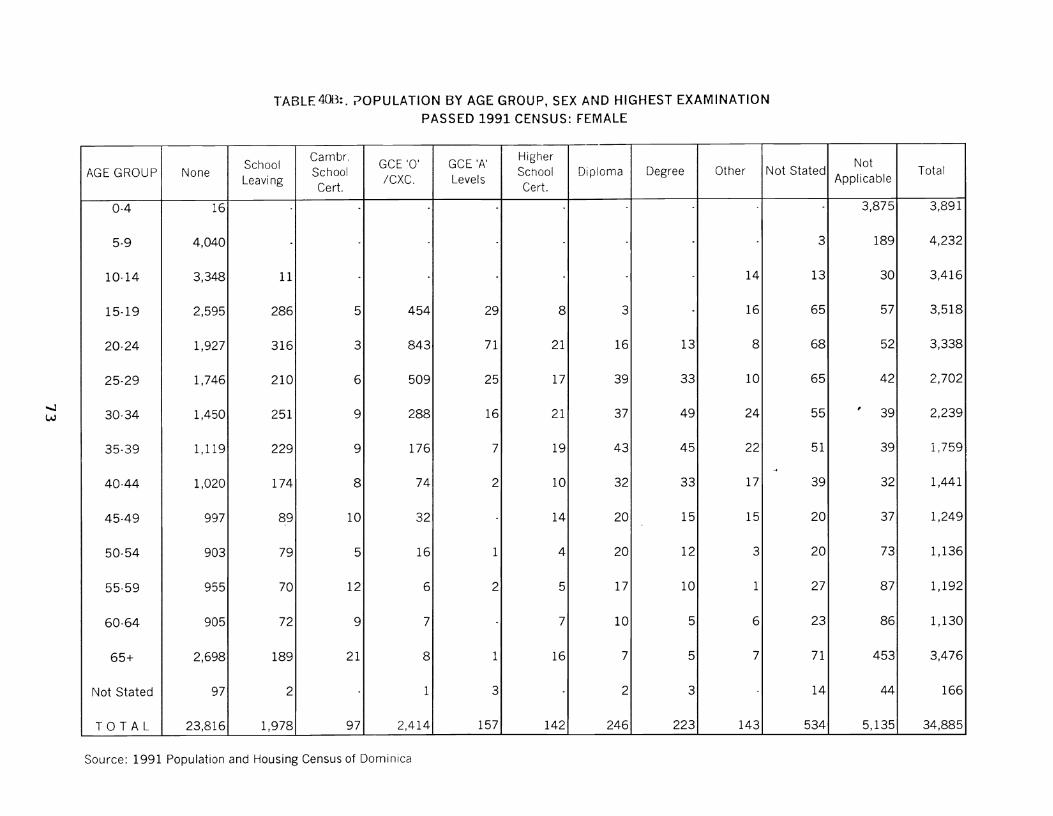
-..JW
TABLE 4013:. ?OPULATION BY AGE GROUP, SEX At.JD HIGHEST EXAMINATION
PASSED 1991 CENSUS: FEMALE
SchoolCambro
GCE '0' GCE lA' Higher NotAGE GROUP None
LeavingSchool
/CXC. LevelsSchool Diploma Degree Other Not Stated
ApplicableTotal
Cert. Cert.
0-4 16 3,875 3,891
5-9 4,040 3 189 4,232
10-14 3,348 11 14 13 30 3,416
15-19 2,595 286 5 454 29 8 3 16 65 57 3,518
20-24 1,927 316 3 843 71 21 16 13 8 68 52 3,338
25-29 1,746 210 6 509 25 17 39 33 10 65 42 2,702
30-34 1,450 251 9 288 16 21 37 49 24 55,
39 2,239
35-39 1,119 229 9 176 7 19 43 45 22 51 39 1,759
.-4
40-44 1,020 174 8 74 2 10 32 33 17 39 32 1,441
45-49 997 89 10 32 14 20 15 15 20 37 1,249
50-54 903 79 5 16 1 4 20 12 3 20 73 1,136
55-59 955 70 12 6 2 5 17 10 1 27 87 1,192
60-64 905 72 9 7 7 10 5 6 23 86 1,130
65+ 2,698 189 21 8 1 16 7 5 7 71 453 3,476J.
Not Stated 97 2 1 3 2 3 14 44 166
TOTAL 23,816 1,978 97 2,414 157 142 246 223 143 534 5,135 34,885
Source: 1991 Population and Housing Census of Dominica
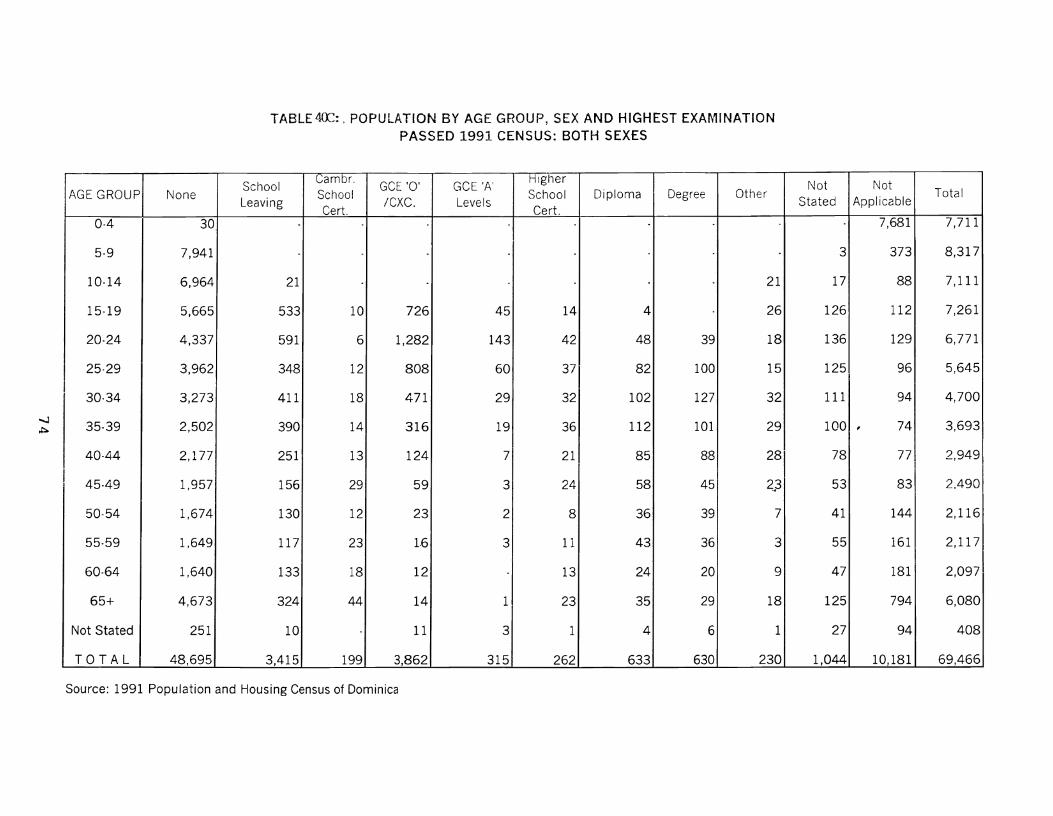
......,J
~
TABLE4OC:. POPULATION BY AGE GROUP, SEX AND HIGHEST EXAI\11NATIONPASSED 1991 CENSUS: BOTH SEXES
SchoolCambro
GCE 'a' GCE 'AI-rngher Not Not
AGE GROUP None School School Diploma Degree Other TotalLeaving
Cert./CXC. Levels
Cert.Stated Applicable
0-4 30 7,681 7,711
5-9 7,941 3 373 8,317
10-14 6,964 21 21 17 88 7,111
15-19 5,665 533 10 726 45 14 4 26 126 112 7,261
20-24 4,337 591 6 1,282 143 42 48 39 18 136 129 6,771
25-29 3,962 348 12 808 60 37 82 100 15 125 96 5,645
I 94 4,70030-34 3,273 411 18 471 29 32 102 127 32 111
35-39 2,502 390 14 316 19 36 112 101 29 100 , 74 3,693
40-44 2,177 251 13 124 7 21 85 88 28 78 77 2,949
I 45-49 1,957 156 29 59 3 24 58 45 2-43 53 83 2,490I
50-54 1,674 130 12 23 2 8 36 39 7 41 144 2,116
55-59 1,649 117 23 1.6 3 11 43 36 3 55 161 2,117
60-64 1,640 133 18 12 13 24 20 9 47 181 2,097
65+ 4,673 324 44 14 1 23 35 29 18 125 794 6,080
Not Stated 251 10 11 3 1 4 6 1 27 94 408
TOTAL 48,695 3,415 199 3,862 315 262 633 630 230 1,044 10,181 69,466
Source: 1991 Population and Housing Census of Dominica
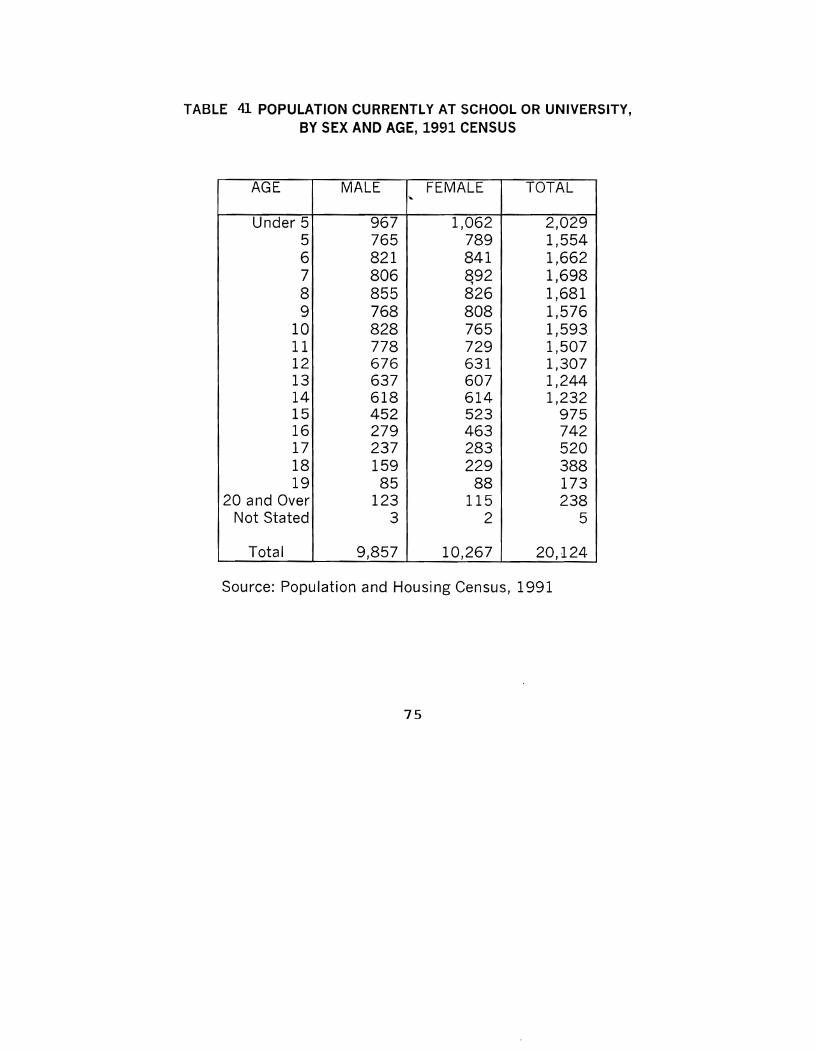
TABLE 41 POPULATION CURRENTLY AT SCHOOL OR UNIVERSITY,BY SEX AND AGE, 1991 CENSUS
AGE MALE FEMALE TOTA,L"
Under 5 967 1,062 2,0295 765 789 1,5546 821 841 1,6627 806 892 1,698,8 855 826 1,6819 768 808 1,576
10 828 765 1,593.11 778 729 1,50712 676 631 1,30713 637 607 1,24414 618 614 1,23215 452 523 97516 279 463 74217 237 283 52018 159 229 38819 85 88 173
20 and Over 123 115 238Not Stated 3 2 5
Total 9,857 10,267 20,124·
Source: Population and Housing Census, 1991
75
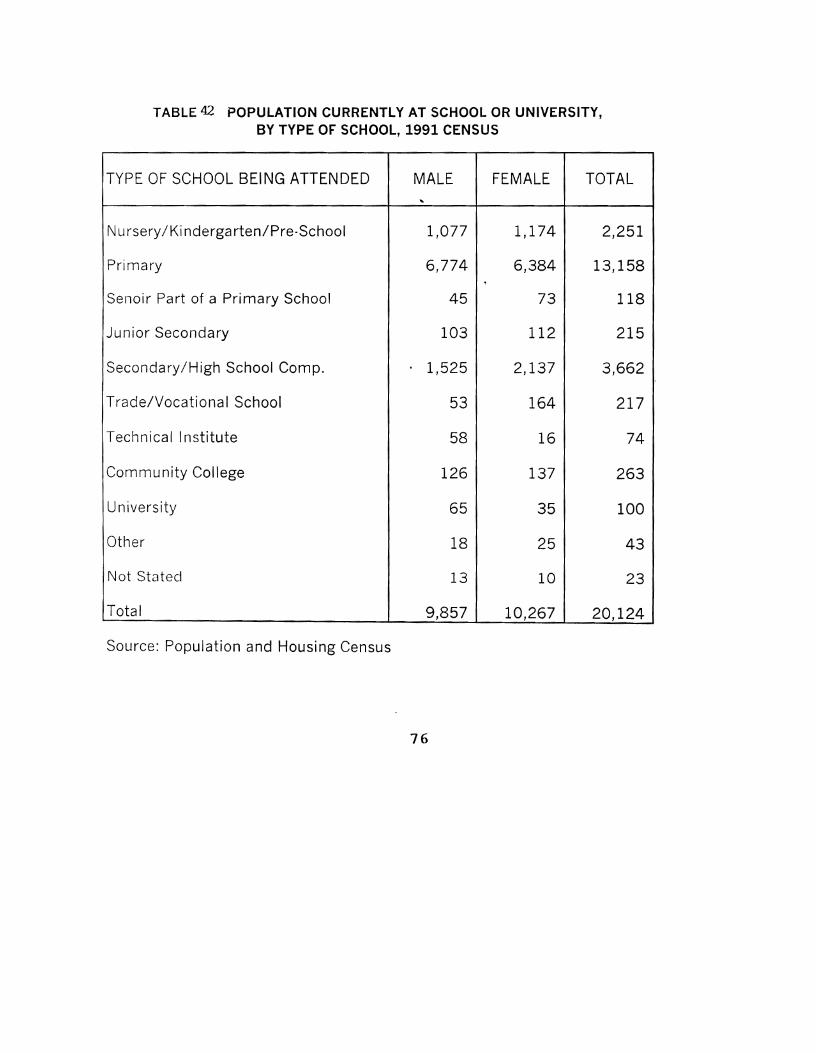
TABLE 42 POPULATION CURRENTLY AT SCHOOL OR UNIVERSITY,BY TYPE OF SCHOOL, 1991 CENSUS
TYPE OF SCHOOL BEING ATTENDED MALE FEMALE TOTAL."
Nursery/ Ki nderga rten/Pre-School 1,077 1,174 2,251
Primary 6,774 6,384 13,158,
Senoir Part of a Primary School 45 73 118
Junior Secondary 103 112 215
Secondary/High School Camp. 1,525 2,137 3,662
Trade/Vocational School 53 164 217
Technical Institute 58 16 74
Community College 126 137 263
University 65 35 100
Other 18 25 43
Not Stated 13 10 23
Total 9,857 10,267 20,124
Source: Population and Housing Census
76
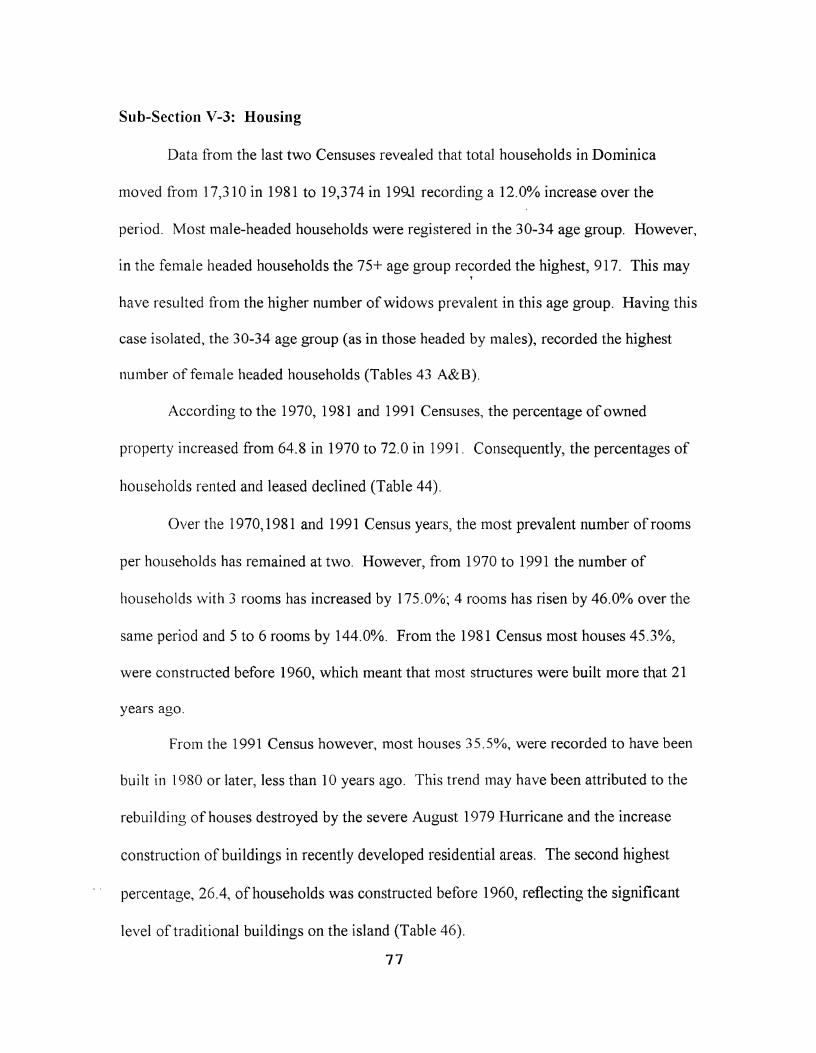
Sub-Seetioll V-3: Housing
Data from the last two Censuses revealed that total households in Dominica
moved from 17,310 in 1981 to 19,374 in 199J recording a 12.0% increase over the
period. 1\Ifost male-headed households were registered in the 30-34 age group. However,
in the female headed households the 75+ age group recorded the highest, 917. This may.,
have resulted from the higher number of widows prevalent in this age group. Having this
case isolated, the 30-34 age group (as in those headed by males), recorded the highest
t1Ull1ber of female headed households (Tables 43 A&B).
According to the 1970, 1981 and 1991 Censuses, the percentage of owned
property increased fron164.8 in 1970 to 72.0 in 1991. Consequently, the percentages of
households rented and leased declined (Table 44).
Over the 1970, 1981 and 1991 Census years, the most prevalent number of rooms
per households has remained at t\vo. However, from 1970 to 1991 the number of
households with 3 rooms has increased by 175.0%~ 4 rooms has risen by 46.00/0 over the
same period and 5 to 6 rooms by 144.0%. From the 1981 Census most houses 45.3%,
were constructed before 1960, which meant that most structures were built more that 21
years ago.
FraIn the 1991 Census however, most houses 35.5%, were recorded to have been
built in 1980 or later, less than 1a years ago. This trend lnay have been attributed to the
rebuilding of houses destroyed by the severe August 1979 Hurricane and the increase
construction of buildings in recently developed residential areas. The second highest
percentage, 26.4, ofhouse110lds was constructed before 1960, reflecting the significant
level of traditional buildings on the island (Table 46).
77

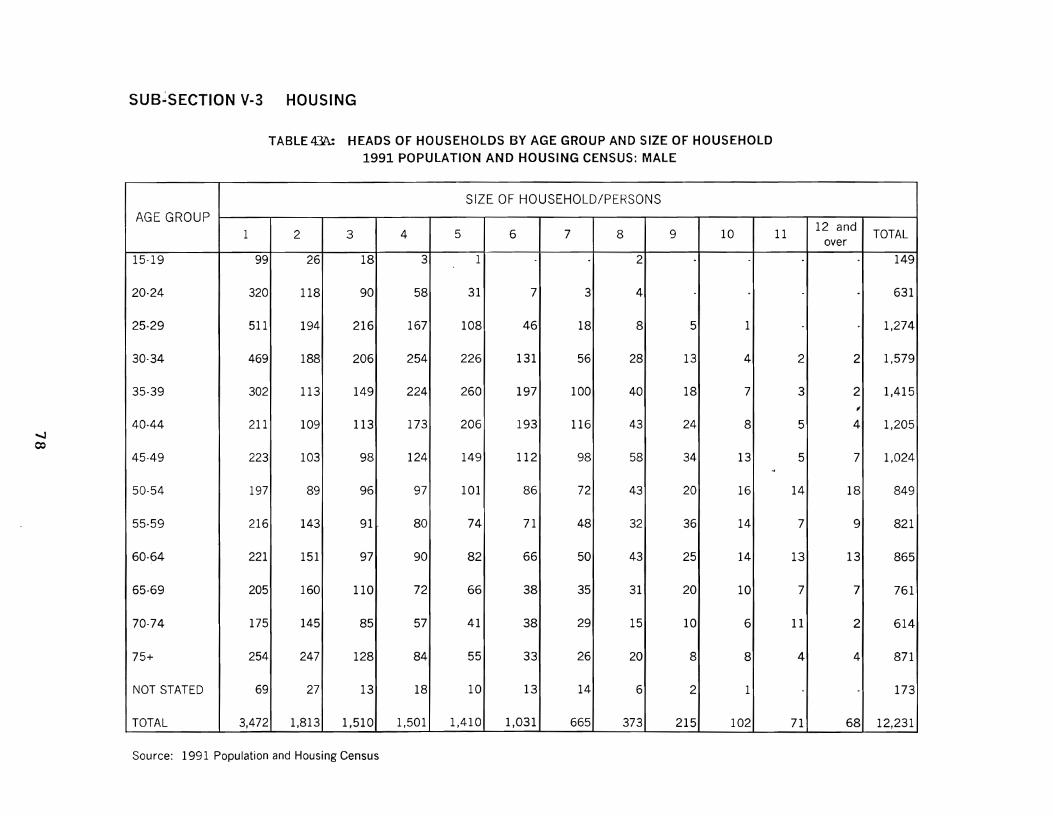
--Jco
SUB~SECTION V-3 HOUSING
TABLE 43A: HEADS OF HOUSEHOLDS BY AGE GROUP AND SIZE OF HOUSEHOLD
1991 POPULATION AND HOUSING CENSUS: MALE
SIZE OF HOUSEHOLD/PERSONSAGE GROUP
1 2 3 4 5 6 7 8 9 10 11 12 and TOTALover
15-19 99 26 18 3 1 2 149
20-24 320 118 90 58 31 7 3 4 631
25-29 511 194 216 167 108 46 18 8 5 1 1,274
30-34 469 188 206 254 226 131 56 28 13 4 2 2 1,579
35-39 302 113 149 224 260 197 100 40 18 7 3 2 1,415,
40-44 211 109 113 173 206 193 116 43 24 8 5 4 1,205
45-49 223 103 98 124 149 112 98 58 34 13 5 7 1,024...
50-54 197 89 96 97 101 86 72 43 20 16 14 18 849
55-59 216 143 91 80 74 71 48 32 36 14 7 9 821
60-64 221 151 97 90 82 66 50 43 25 14 13 13 865
65-69 205 160 110 72 66 38 35 31 20 10 7 7 761
70-74 175 145 85 57 41 38 29 15 10 6 11 2 614
75+ 254 247 128 84 55 33 26 20 8 8 4 4 871
NOT STATED 69 27 13 18 10 13 14 6 2 1 173
TOTAL 3,472 1,813 1,510 1,501 1,410 1,031 665 373 215 102 71 68 12,231
Source: 1991 Population and Housing Census
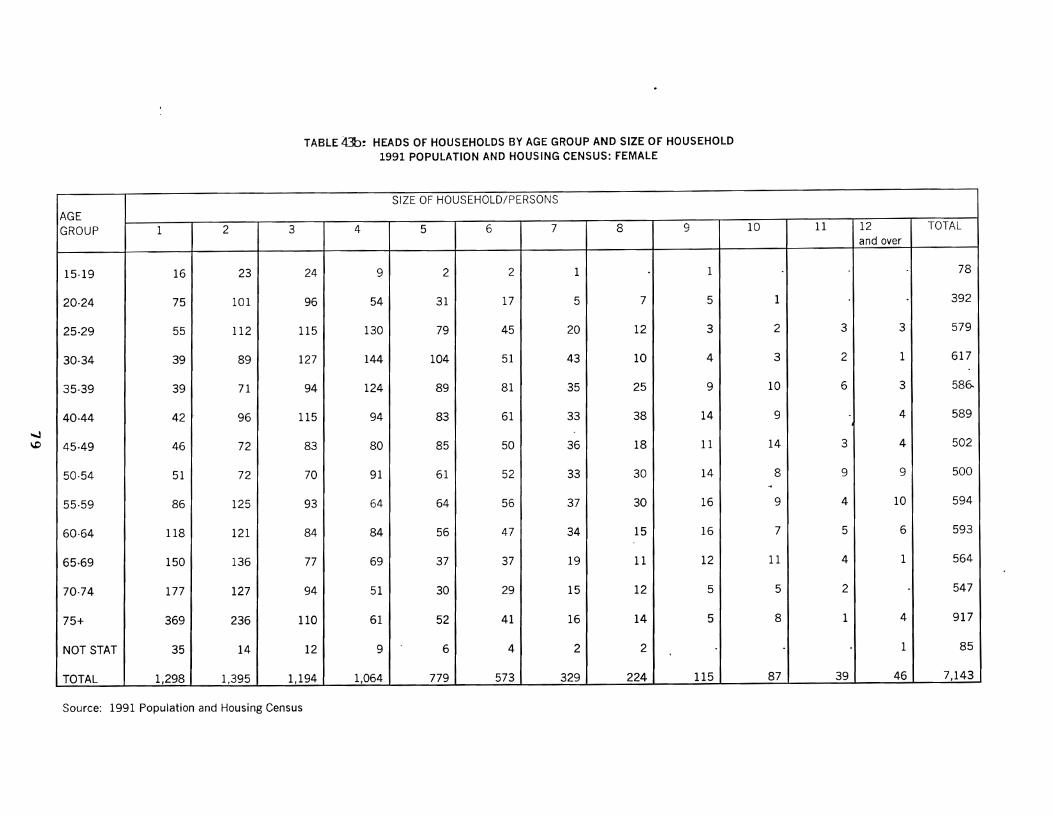
~
'-"
TABLE 43b: HEADS OF HOUSEHOLDS BY AGE GROUP AND SIZE OF HOUSEHOLD1991 POPULATION AND HOUSING CENSUS: FEMALE
SIZE OF HOUSEHOLD/PERSONS
AGEGROUP 1 2 3 4 5 6 7 8 9 10 11 12 TOTAL
and over
15-19 16 23 24 9 2 2 1 1 78
20-24 75 101 96 54 31 17 5 7 5 1 392
25-29 55 112 115 130 79 45 20 12 3 2 3 3 579
30-34 39 89 127 144 104 51 43 10 4 3 2 1 617
35-39 39 71 94 124 89 81 35 25 9 10 6 3 586..
40·44 42 96 115 94 83 61 33 38 14 9 4 589
45-49 46 72 83 80 85 50 36 18 11 14 3 4 502
50·54 51 72 70 91 61 52 33 30 14 8 9 9 500...
55·59 86 125 93 64 64 56 37 30 16 9 4 10 594
60-64 118 121 84 84 56 47 34 15 16 7 5 6 593
65-69 150 136 77 69 37 37 19 11 12 11 4 1 564
70-74 177 127 94 51 30 29 15 12 5 5 2 547
75+ 369 236 110 61 52 41 16 14 5 8 1 4 917
NOT STAT 35 14 12 9 6 4 2 2 1 85
TOTAL 1,298 1,395 1,194 1,064 779 573 329 224 115 87 39 46 7,143
Source: 1991 Population and Housing Census
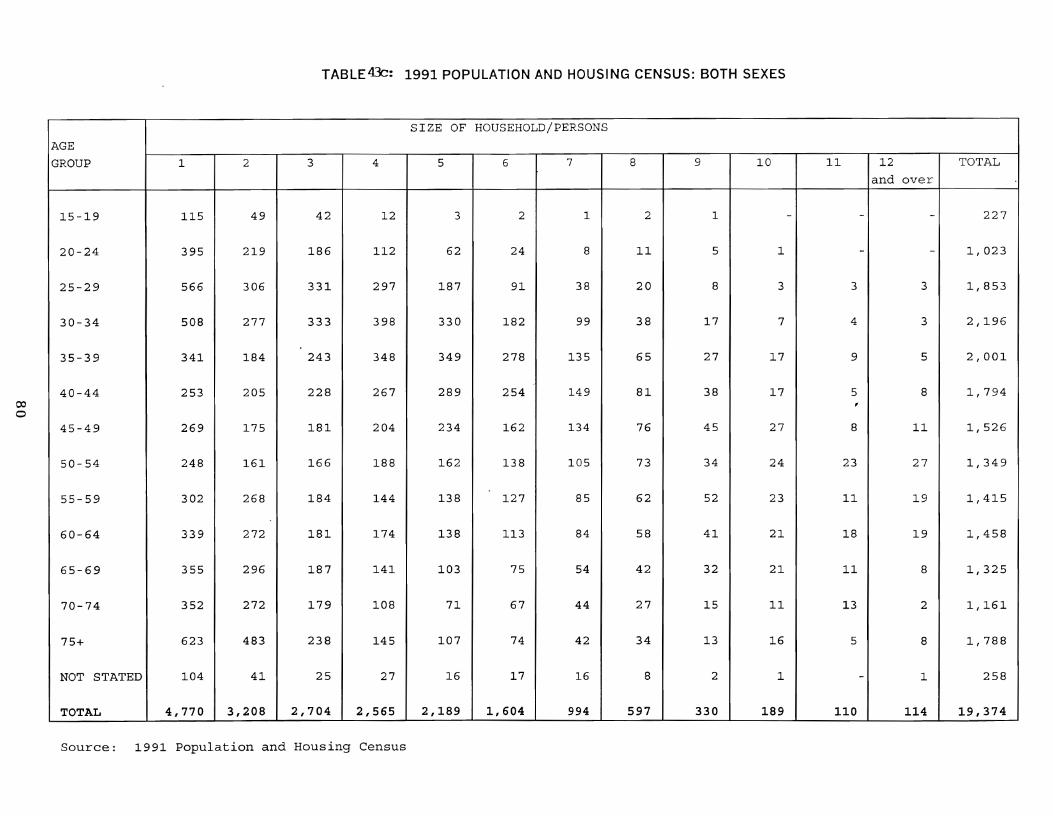
00o
TABLE4.X: 1991 POPULATION AND HOUSING CENSUS: BOTH SEXES
SIZE OF HOUSEHOLD/PERSONS
AGEGROUP 1 2 3 4 5 6 7 8 9 10 11 12 TOTAL
and over
15-19 115 49 42 12 3 2 1 2 1 - - - 227
20-24 395 219 186 112 62 24 8 11 5 1 - - 1,023
25-29 566 306 331 297 187 91 38 20 8 3 3 3 1,853
30-34 508 277 333 398 330 182 99 38 17 7 4 3 2,196
35-39 341 184 243 348 349 278 135 65 27 17 9 5 2,001
40-44 253 205 228 267 289 254 149 81 38 17 5 8 1,794,
45-49 269 175 181 204 234 162 134 76 45 27 8 11 1,526
50-54 248 161 166 188 162 138 105 73 34 24 23 27 1,349
55-59 302 268 184 144 138 127 85 62 52 23 11 19 1,415
60-64 339 272 181 174 138 113 84 58 41 21 18 19 1,458
65-69 355 296 187 141 103 75 54 42 32 21 11 8 1,325
70-74 352 272 179 108 71 67 44 27 15 11 13 2 1,161
75+ 623 483 238 145 107 74 42 34 13 16 5 8 1,788
NOT STATED 104 41 25 27 16 17 16 8 2 1 - 1 258
TOTAL 4,770 3,208 2,704 2,565 2,189 1,604 994 597 330 189 110 114 19,374
Source: 1991 Population and Housing Census
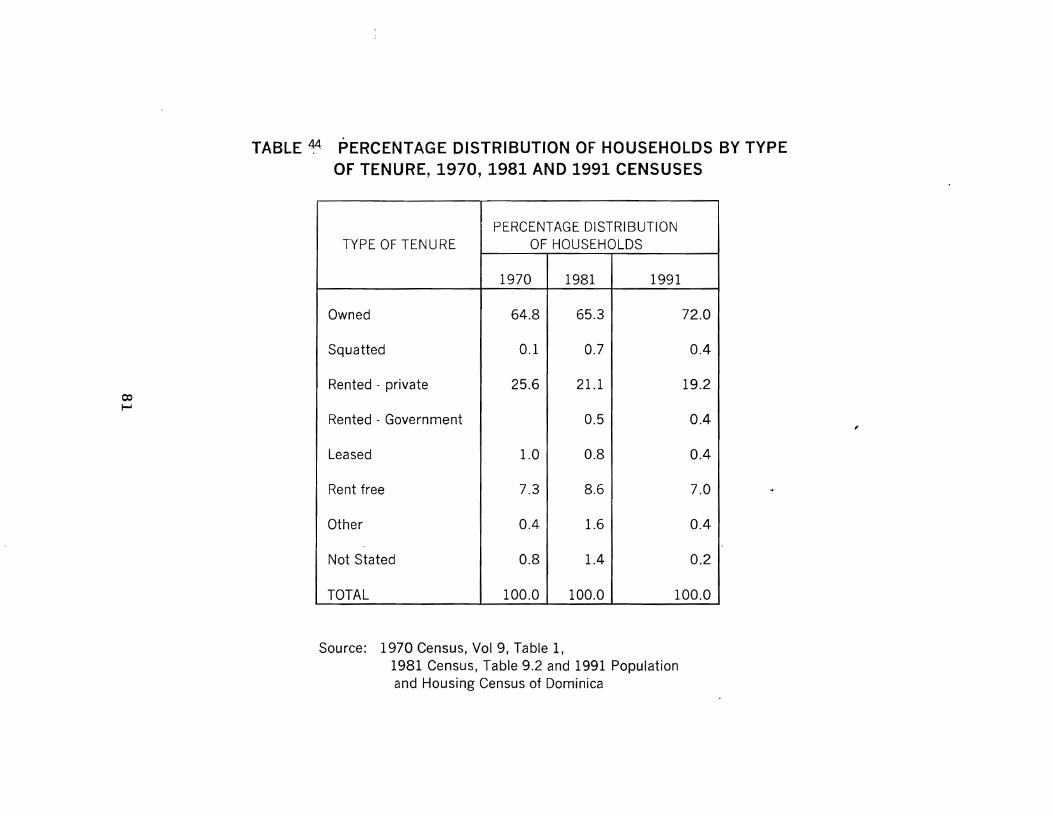
coI-'
TABLE ~ PERCENTAGE DISTRIBUTION OF HOUSEHOLDS BY TYPEOF TENURE, 1970, 1981 AND 1991 CENSUSES
PERCENTAGE DISTRIBUTIONTYPE OF TENURE OF HOUSEHOLDS
1970 1981 1991
Owned 64.8 65.3 72.0
Squatted 0.1 0.7 0.4
Rented· private 25.6 21.1 19.2
Rented· Government 0.5 0.4
Leased 1.0 0.8 0.4
Rent free 7.3 8.6 7.0
Other 0.4 1.6 0.4
Not Stated 0.8 1.4 0.2
TOTAL 100.0 100.0 100.0
Source: 1970 Census, Vol 9, Table 1,1981 Census, Table 9.2 and 1991 Populationand Housing Census of Dominica
,
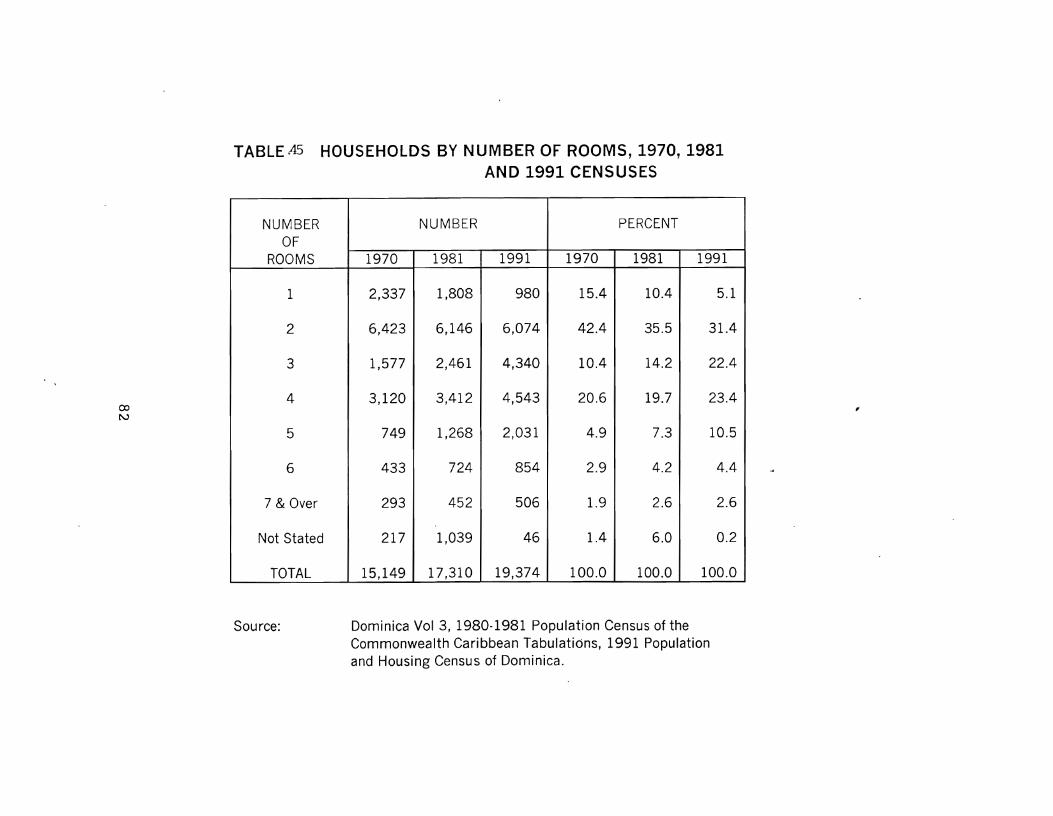
00t\.)
TABLE AS HOUSEHOLDS BY NUMBER OF ROOMS, 1970, 1981AND 1991 CENSUSES
NUMBER NUMBER PERCENTOF
ROOMS 1970 1981 1991 1970 1981 1991
1 2,337 1,808 980 15.4 10.4 5.1
2 6,423 6,146 6,074 42.4 35.5 31.4
3 1,577 2,461 4,340 10.4 14.2 22.4
4 3,120 3,412 4,543 20.6 19.7 23.4
5 749 1,268 2,031 4.9 7.3 10.5
6 433 724 854 2.9 4.2 4.4
7 & Over 293 452 506 1.9 2.6 2.6
Not Stated 217 1,039 46 1.4 6.0 0.2
TOTAL 15,149 17,310 19,374 100.0 100.0 100.0
Source: Dominica Vol 3, 1980-1981 Population Census of theCommonwealth Caribbean Tabulations, 1991 Populationand Housing Census of Dominica.

ex>w
TABLE 46 DISTRIBUTION OF HOUSEHOLDS BY YEAR OF CONSTRUCTIONOF DWELLING, 1981 AND 1991 CENSUSES
1981 1991DATE
OF NUMBER PERCENT RATE PER NUMBER PERCENT RATE PERCONSTRUCTION YEAR(l) YEAR
Before 1960 7,845 45.3 5,123 26.4
1960-1969 2,516 14.5 252 2,245 11.6 224
1970-1979 4,149 24.0 415 3,247 16.8 325
1980 or later 1,406 8.1 6,871 35.5
Don't know 1,394 8.1 1,888 9.7...
TOTAL 17,310 100.0 19,374 100.0
Source: 1981-Census Table 9.31991 Population and Housing Census of Dominica
Note (1) Annual Construction Rates are derived by dividingthe number of dwellings built in the period by thenumber of years in the period.

ex>~
TABLE 4Th: POPULATION 15 YEARS AND OVER BY AGE GROUP, SEXAND MARITAL STATUS, 1991 CENSUS: MALE
AGE GROUP MARRIED WIDOWED DIVORCED LEGALLY NEVER NOT TOTALSEPARATED MARRIED STATED
15-19 1 2 3,691 49 3,743
20-24 42 1 1 3,345 44 3,433
25-29 243 1 2 2,675 22 2,943
30-34 563 4 7 1,870 17 2,461
35-39 753 3 16 10 1,141 11 1,934
40-44 783 7 23 15 67-3 7 1,508
45-49 715 6 40 22 452 6 1,241
50-54 599 30 25 12 311 3 .. 980
55-59 558 32 28 23 276 8 925
60-64 616 67 24 13 242 5 967
65 & Over 1,532 458 49 54 490 21 2,604
Not Stated 79 5 3 137 18 242
TOTAL 6,484 609 214 160 15,303 211 22,981
Source: 1991 Population and Housing Census of Dominica
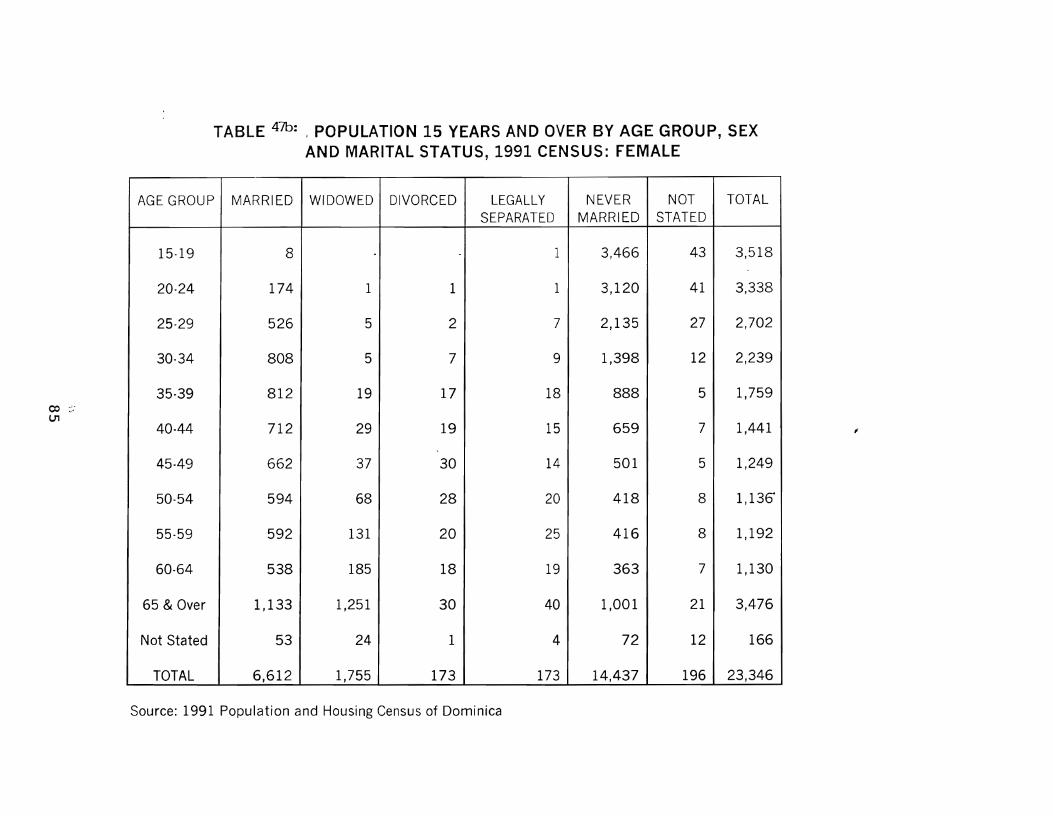
ex> '".U"1
TABLE 47b: I POPULATION 15 YEARS AND OVER BY AGE GROUP, SEXAND MARITAL STATUS, 1991 CENSUS: FEMALE
AGE GROUP MARRIED WIDOWED DIVORCED LEGALLY NEVER NOT TOTAL
SEPARATED MARRIED STATED
15-19 8 1 3,466 43 3,518
20-24 174 1 1 1 3,120 41 3,338
25-29 526 5 2 7 2,135 27 2,702
30-34 808 5 7 9 1,398 12 2,239
35-39 812 19 17 18 888 5 1,759
40-44 712 29 19 15 659 7 1,441
45-49 662 37 30 14 501 5 1,249
50-54 594 68 28 20 418 8 1,136
55-59 592 131 20 25 416 8 1,192
60-64 538 185 18 19 363 7 1,130
65 & Over 1,133 1,251 30 40 1,001 21 3,476
Not Stated 53 24 1 4 72 12 166
TOTAL 6,612 1,755 173 173 14,437 196 23,346
Source: 1991 Population and Housing Census of Dominica
;
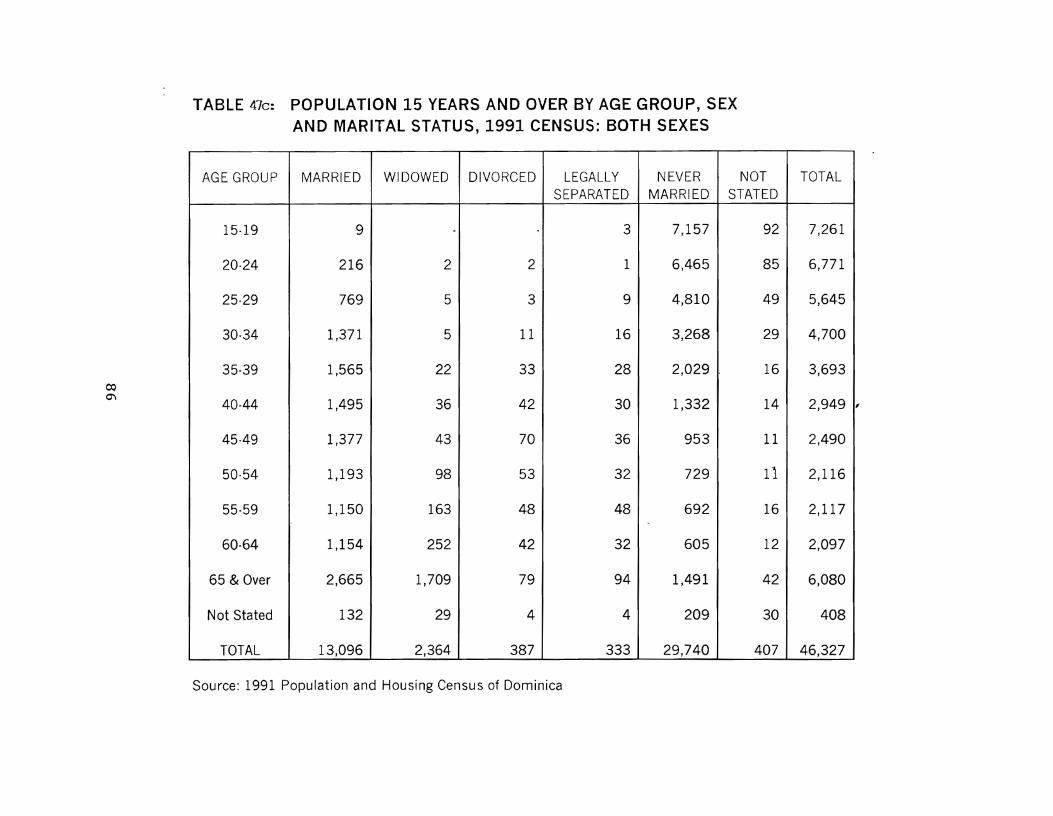
TABLE 47c: POPULATION 15 YEARS AND OVER BY AGE GROUP, SEXAND MARITAL STATUS, 1991 CENSUS: BOTH SEXES
,
AGE GROUP MARRIED WIDOWED DIVORCED LEGALLY NEVER NOT TOTALSEPARATED MARRIED STATED
15-19 9 3 7,157 92 7,261
20-24 216 2 2 1 6,465 85 6,771
25-29 769 5 3 9 4,810 49 5,645
30-34 1,371 5 11 16 3,268 29 4,700
35-39 1,565 22 33 28 2,029 . 16 3,693
40-44 1,495 36 42 30 1,332 14 2,949 I
45-49 1,377 43 70 36 953 11 2,490
50-54 1,193 98 53 32 729 11 2,116
55-59 1,150 163 48 48 692 16 2,117
60-64 1,154 252 42 32 605 12 2,097
65 & Over 2,665 1,709 79 94 1,491 42 6,080
Not Stated 132 29 4 4 209 30 408
TOTAL 13,096 2,364 387 333 29,740 407 46,327
CQ0"\
Source: 1991 Population and Housing Census of Dominica

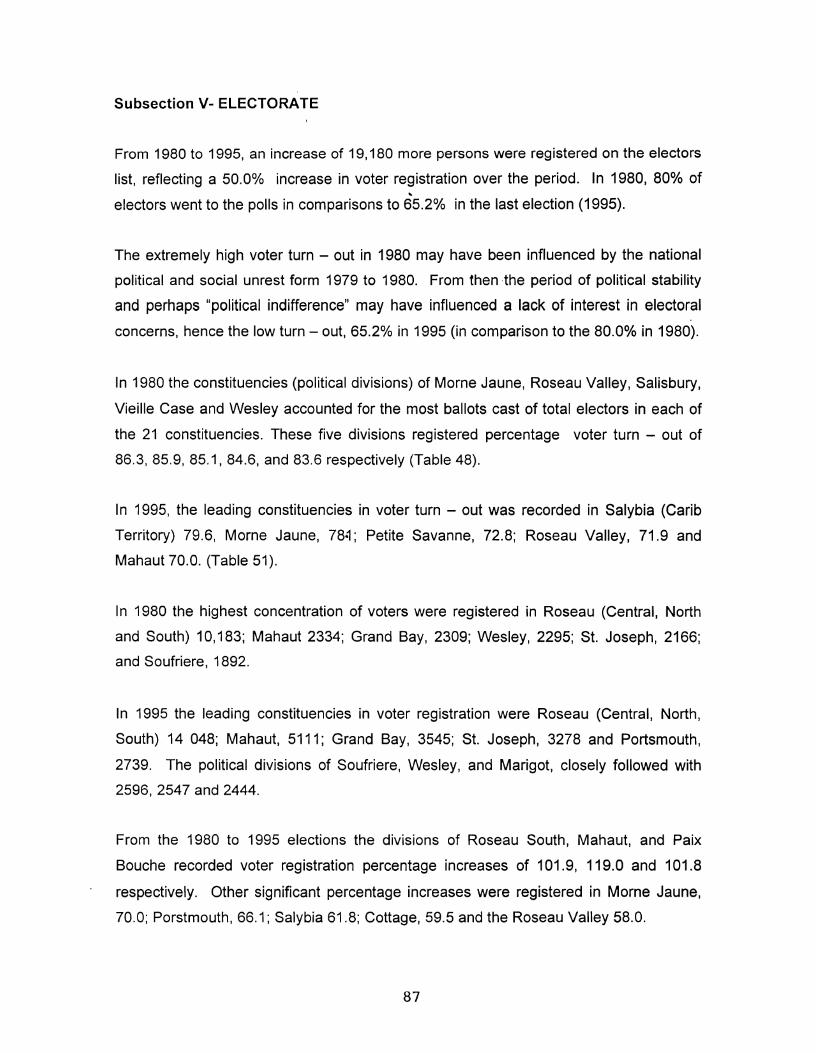
Subsection V- ELECTORATE
Fron1 1980 to 1995, an increase of 19,180 more persons were registered on the electors
list, reflecting a 50.0% increase in voter registration over the period. In 1980, 80% of'"electors went to the polls in comparisons to 65.2°A> in the last election (1995).
The extremely high voter turn - out in 1980 may have been influenced by the national
political and social unrest form 1979 to 1980. From then the period of political stability
and perhaps "political indifference" may have influenced a lack of interest in electoral
concerns, hence the low turn - out, 65.2°A> in 1995 (in comparison to the 80.0% in 1980).
In 1980 the constituencies (political divisions) of Morne Jaune, Roseau Valley, Salisbury,
Vieille Case and Wesley accounted for the most ballots cast of total electors in each of
the 21 constituencies. These five divisions registered percentage voter turn - out of
86.3, 85.9, 85.1, 84.6, and 83.6 respectively (Table 48).
In 1995, the leading constituencies in voter turn - out was recorded in Salybia (Carib
Territory) 79.6, Morne Jaune, 78·1; Petite Savanne, 72.8; Roseau Valley, 71.9 and
Mahaut 70.0. (Table 51).
In 1980 the highest concentration of voters were registered in Roseau (Central, North
and South) 10,183; Mahaut 2334; Grand Bay, 2309; Wesley, 2295; St. Joseph, 2166;
and Soufriere, 1892.
In 1995 the leading constituencies in voter registration were Roseau (Central, North,
South) 14 048; Mahaut, 5111; Grand Bay, 3545; St. Joseph, 3278 and Portsmouth,
2739. The political divisions of Soufriere, Wesley, and Marigot, closely followed with
2596,2547 and 2444.
From the 1980 to 1995 elections the divisions of Roseau South, Mahaut, and Paix
Bouche recorded voter registration percentage increases of 101.9, 119.0 and 101.8
respectively. Other significant percentage increases were registered in Morne Jaune,
70.0; Porstmouth, 66.1; Salybia 61.8; Cottage, 59.5 and the Roseau Valley 58.0.
87

The three main political parties, the Dominica Labour Party (DLP), the Dominica
Freedom Party (DFP) and the United Workers Party (UWP) have all gained power in
ruling the country over the 1978 - 1998 period.
Political reign in 1978 - 1980 was with the DLP which led the country to political
independence from Great Britain in November 1978. From 1980 to 1995 the DFP ruled
and from 1995 to present the UWP is the ruling party. '
Analysing past political trends, Dominican voters usually elect any party at least for two
terms unless there are serious reasons for social and economic change.
87 Cont'd
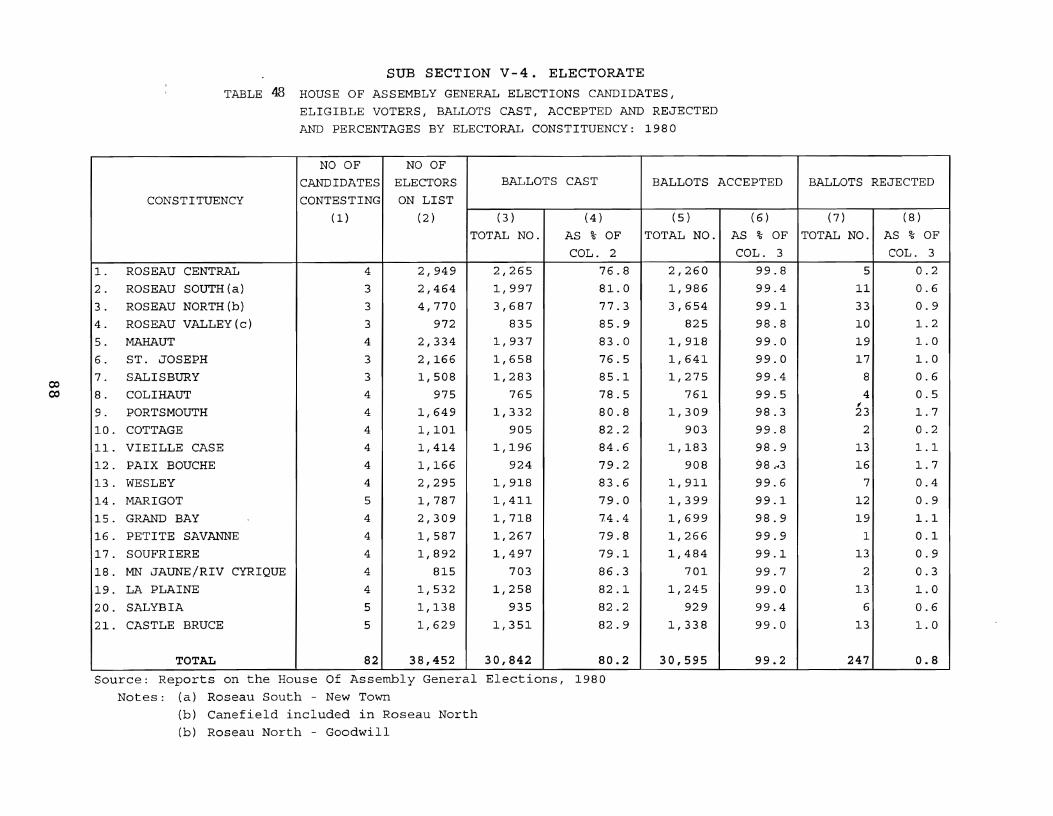
coCO
SUB SECTION V-4. ELECTORATETABLE 48 HOUSE OF ASSEMBLY GENERAL ELECTIONS CANDIDATES,
ELIGIBLE VOTERS, BALLOTS CAST, ACCEPTED AND REJECTEDAND PERCENTAGES BY ELECTORAL CONSTITUENCY: 1980
NO OF NO OF
CANDIDATES ELECTORS BALLOTS CAST BALLOTS ACCEPTED BALLOTS REJECTED
CONSTITUENCY CONTESTING ON LIST
(1) (2) (3 ) (4) (5) (6) (7) (8)
TOTAL NO. AS % OF TOTAL NO. AS % OF TOTAL NO. AS % OF
COL. 2 COL. 3 COL. 3
1. ROSEAU CENTRAL 4 2,949 2,265 76.8 2,260 99.8 5 0.2
2. ROSEAU SOUTH (a) 3 2,464 1,997 81.0 1,986 99.4 11 0.6
3. ROSEAU NORTH(b) 3 4,770 3,687 77.3 3,654 99.1 33 0.9
4. ROSEAU VALLEY(c) 3 972 835 85.9 825 98.8 10 1.2
5. MAHAUT 4 2,334 1,937 83.0 1,918 99.0 19 1.0
6. ST. JOSEPH 3 2,166 1,658 76.5 1,641 99.0 17 1.0
7. SALISBURY 3 1,508 1,283 85.1 1,275 99.4 8 0.6
8. COLI HAUT 4 975 765 78.5 761 99.5 4 0.5,9. PORTSMOUTH 4 1,649 1,332 80.8 1,309 98.3 23 1.7
10. COTTAGE 4 1,101 905 82.2 903 99.8 2 0.2
11. VIEILLE CASE 4 1,414 1,196 84.6 1,183 98.9 13 1.1
12. PAIX BOUCHE 4 1,166 924 79.2 908 98.043 16 1.7
13. WESLEY 4 2,295 1,918 83.6 1,911 99.6 7 0.4
14. MARIGOT 5 1,787 1,411 79.0 1,399 99.1 12 0.9
15. GRAND BAY 4 2,309 1,718 74.4 1,699 98.9 19 1.1
16. PETITE SAVANNE 4 1,587 1,267 79.8 1,266 99.9 1 0.1
17. SOUFRIERE 4 1,892 1,497 79.1 1,484 99.1 13 0.9
18. MN JAUNE/RIV CYRIQUE 4 815 703 86.3 701 99.7 2 0.3
19. LA PLAINE 4 1,532 1,258 82.1 1,245 99.0 13 1.0
20. SALYBIA 5 1,138 935 82.2 929 99.4 6 0.6
21. CASTLE BRUCE 5 1,629 1,351 82.9 1,338 99.0 13 1.0
TOTAL 82 38,452 30,842 80.2 30,595 99.2 247 0.8
Source: Reports on the House Of Assembly General Elections, 1980
Notes: (a) Roseau South - New Town(b) Canefield included in Roseau North
(b) Roseau North - Goodwill
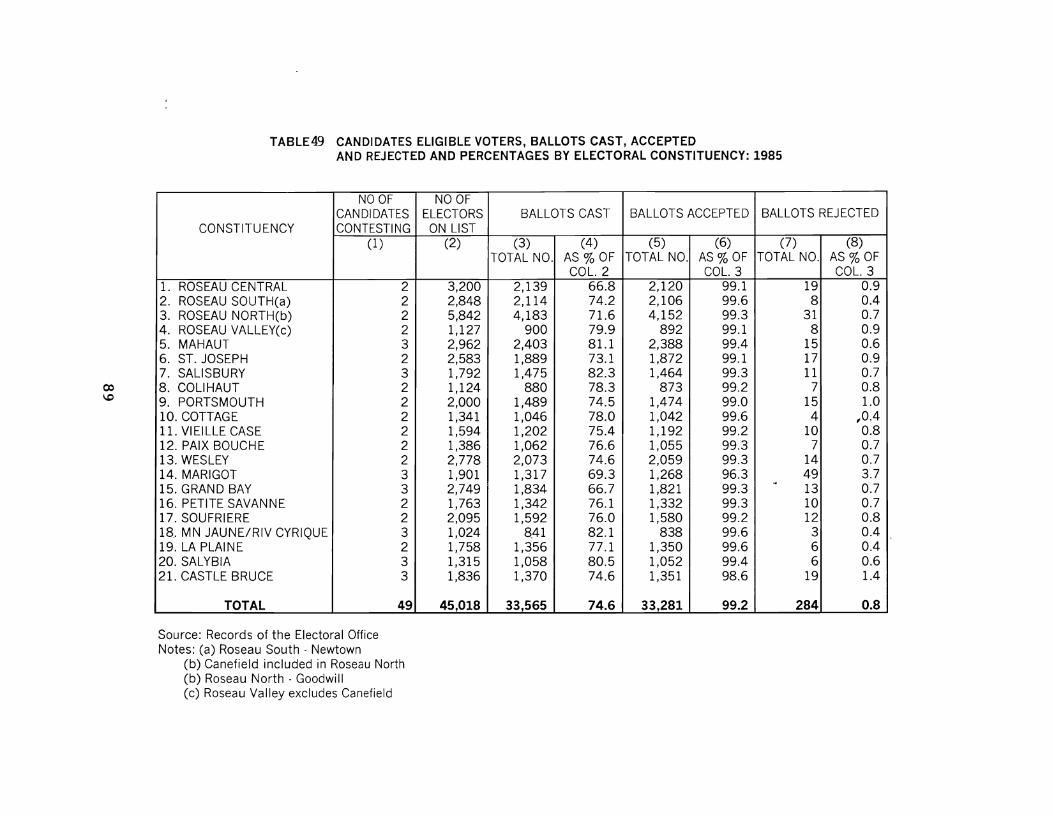
CX)
\.0
TABLE49 CANDIDATES ELIGIBLE VOTERS, BALLOTS CAST, ACCEPTEDAND REJECTED AND PERCENTAGES BY ELECTORAL CONSTITUENCY: 1985
NO OF NO OFCANDIDATES ELECTORS BALLOTS CAST BALLOTS ACCEPTED BALLOTS REJECTED
CONSTITUENCY CONTESTING ON LIST(1) (2) (3) (4) (5) (6) (7) (8)
TOTAL NO. AS % OF TOTAL NO. AS% OF TOTAL NO. AS % OFCOL. 2 COL. 3 COL. 3
1. ROSEAU CENTRAL 2 3,200 2,139 66.8 2,120 99.1 19 0.92. ROSEAU SOUTH(a) 2 2,848 2,114 74.2 2,106 99.6 8 0.43. ROSEAU NORTH(b) 2 5,842 4,183 71.6 4,152 99.3 31 0.74. ROSEAU VALLEY(c) 2 1,127 900 79.9 892 99.1 8 0.95. MAHAUT 3 2,962 2,403 81.1 2,388 99.4 15 0.66. ST. JOSEPH 2 2,583 1,889 73.1 1,872 99.1 17 0.97. SALISBURY 3 1,792 1,475 82.3 1,464 99.3 11 0.78. COLIHAUT 2 1,124 880 78.3 873 99.2 7 0.89. PORTSMOUTH 2 2,000 1,489 74.5 1,474 99.0 15 1.010. COTTAGE 2 1,341 1,046 78.0 1,042 99.6 4 ,0.411. VIEILLE CASE 2 1,594 1,202 75.4 1,192 99.2 10 0.812. PAIX BOUCHE 2 1,386 1,062 76.6 1,055 99.3 7 0.713. WESLEY 2 2,778 2,073 74.6 2,059 99.3 14 0.714. MARIGOT 3 1,901 1,317 69.3 1,268 96.3 49 3.715. GRAND BAY 3 2,749 1,834 66.7 1,821 99.3
-4
13 0.716. PETITE SAVANNE 2 1,763 1,342 76.1 1,332 99.3 10 0.717. SOUFRIERE 2 2,095 1,592 76.0 1,580 99.2 12 0.818,. MN JAUNE/RIV CYRIQUE 3 1,024 8,41 82.1 838 99.6 3 0.419. LA PLAINE 2 1,758 1,356 77.1 1,350 99.6 6 0.420. SALYBIA 3 1,315 1,058 80.5 1,052 99.4 6 0.621. CASTLE BRUCE 3 1,836 1,370 74.6 1,351 98.6 19 1.4
TOTAL 49 45,018 33,565 74.6 33,281 99.2 284 0.8
Source: Records of the Electoral OfficeNotes: (a) Roseau South· Newtown
(b) Canefield included in Roseau North(b) Roseau North· Goodwill(c) Roseau Valley excludes Canefield
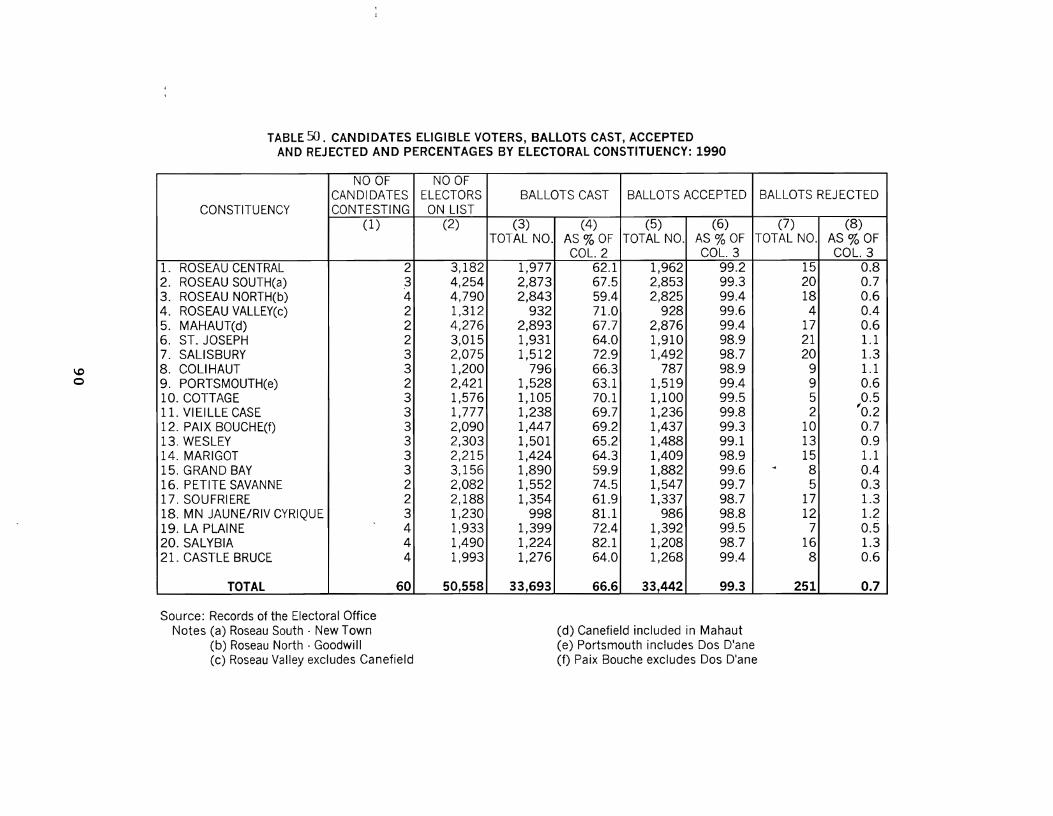
\.0o
TABLE 50. CANDIDATES ELIGIBLE VOTERS, BALLOTS CAST, ACCEPTEDAND REJECTED AND PERCENTAGES BY ELECTORAL CONSTITUENCY: 1990
NO OF NO OFCANDIDATES ELECTORS BALLOTS CAST BALLOTS ACCEPTED BALLOTS REJECTED
CONSTITUENCY CONTESTING ON LIST(1) (2) (3) (4) (5) (6) (7) (8)
TOTAL NO. AS%OF TOTAL NO. AS %OF TOTAL NO. AS%OFCOL. 2 COL. 3 COL. 3
1. ROSEAU CENTRAL 2 3,182 1,977 62.1 1,962 99.2 15 0.82. ROSEAU SOUTH(a) 3 4,254 2,873 67.5 2,853 99.3 20 0.73. ROSEAU NORTH(b) 4 4,790 2,843 59.4 2,825 99.4 18 0.64. ROSEAU VALLEY(c) 2 1,312 932 71.0 928 99.6 4 0.45. MAHAUT(d) 2 4,276 2,893 67.7 2,876 99.4 17 0.66. ST. JOSEPH 2 3,015 1,931 64.0 1,910 98.9 21 1.17. SALISBURY 3 2,075 1,512 72.9 1,492 98.7 20 1.38. COLIHAUT 3 1,200 796 66.3 787 98.9 9 1.19. PORTSMOUTH(e) 2 2,421 1,528 63.1 1,519 99.4 9 0.610. COTTAGE 3 1,576 1,105 70.1 1,100 99.5 5 0.511. VIEILLE CASE 3 1,777 1,238 69.7 1,236 99.8 2 ;0.2
12. PAIX BOUCHE(f) 3 2,090 1,447 69.2 1,437 99.3 10 0.713. WESLEY 3 2,303 1,501 65.2 1,488 99.1 13 0.914. MARIGOT 3 2,215 1,424 64.3 1,409 98.9 15 1.115. GRAND BAY 3 3,156 1,890 59.9 1,882 99.6 04 8 0.416. PETITE SAVANNE 2 2,082 1,552 74.5 1,547 99.7 5 0.317. SOUFRIERE 2 2,188 1,354 61.9 1,337 98.7 17 1.318. MN JAUNE/RIV CYRIQUE 3 1,230 998 81.1 986 98.8 12 1.219. LA PLAINE 4 1,933 1,399 72.4 1,392 99.5 7 0.520. SALYBIA 4 1,490 1,224 82.1 1,208 98.7 16 1.321. CASTLE BRUCE 4 1,993 1,276 64.0 1,268 99.4 8 0.6
TOTAL 60 50,558 33,693 66.6 33,442 99.3 251 0.7
Source: Records of the Electoral OfficeNotes (a) Roseau South· New Town
(b) Roseau North· Goodwill(c) Roseau Valley excludes Canefield
(d) Canefield included in Mahaut(e) Portsmouth includes Dos DIane(f) Paix Bouche excludes Dos DIane

\.0~
TABLE, 51. CANDIDATES, ELIGIBLE VOTERS, BALLOTS CAST, ACCEPTEDAND REJECTED AND PERCENTAGES BY ELECTORAL CONSTITUENCY: 1995
NOOF NO OFCANDIDATES ELECTORS BALLOTS CAST BALLOTS ACCEPTED BALLOTS REJECTED
CONSTITUENCY CONTESTING ON LIST(1) (2) (3) (4) (5) (6) (7) (8)
TOTAL NO. AS%OF TOTAL NO. AS%OF TOTAL NO. AS%OFCOL. 2 COL. 3 COL. 3
1. ROSEAU CENTRAL 4 3,577 2,150 60.1 2,135 99.3 15 0.72. ROSEAU SOUTH(a) 3 4,974 3,325 66.8 3,304 99.4 21 0.63. ROSEAU NORTH(b) 4 5,497 3,271 59.5 3,255 99.5 16 0.54. ROSEAU VALLEY(c) 3 1,536 1,105 71.9 1,094 9"9.0 11 1.05. MAHAUT(d) 3 5,111 3,580 70.0 3,545 99.0 35 1.06. ST. JOSEPH 3 3,278 1,945 59.3 1,909 98.1 36 1.97. SALISBURY . 3 2,304 1,568 68.1 1,553 99.0 15 1.08. COLIHAUT 3 1,361 917 67.4 901 98.3 16 1.79. PORTSMOUTH(e) 2 2,739 1,647 60.1 1,612 97.9 35 2.110~COTTAGE 3 1,756 1,222 69.6 1,203 98.4 19 1.611. VIEILLE CASE 3 1,939 1,299 67.0 1,291 99.4 8
,0.6
12. PAIX BOUCHE(f) 3 2,353 1,506 64.0 1,495 99.3 11 0.713. WESLEY 3 2,547 1,608 63.1 1,582 98.4 26 1.614. MARIGOT 3 2,444 1,501 61.4 1,486 99.0 15 1.015. GRAND BAY 3 3,545 1,943 54.8 1,936 99.6 04 7 0.416. PETITE SAVANNE 3 2,324 1,693 72.8 1,674 98.9 19 1.117. SOUFRIERE 3 2,596 1,694 65.3 1,677 99.0 17 1.018. MN JAUNE/RIV CYRIQUE 2 1,386 1,082 78.1 1,073 99.2 9 0.819. LA PLAINE 3 2,172 1,456 67.0 1,450 99.6 6 0.420. SALYBIA 3 1,841 1,465 79.6 1,446 98.7 19 1.321. CASTLE BRUCE 3 2,352 1,~86 67.4 1,566 98.7 20 1.3
TOTAL 63 57,632 37,563 65.2 37,187 99.0 376 1.0
Source: Records of the Electoral OfficeNotes: (a) Roseau South - Newtown
(b) Roseau North - Goodwill(c) Roseau Valley excludes Canefield
(d) Canefield included in Mahaut(e) Portsmouth includes Dos Diane(f) Paix Bouche excludes Dos DIane
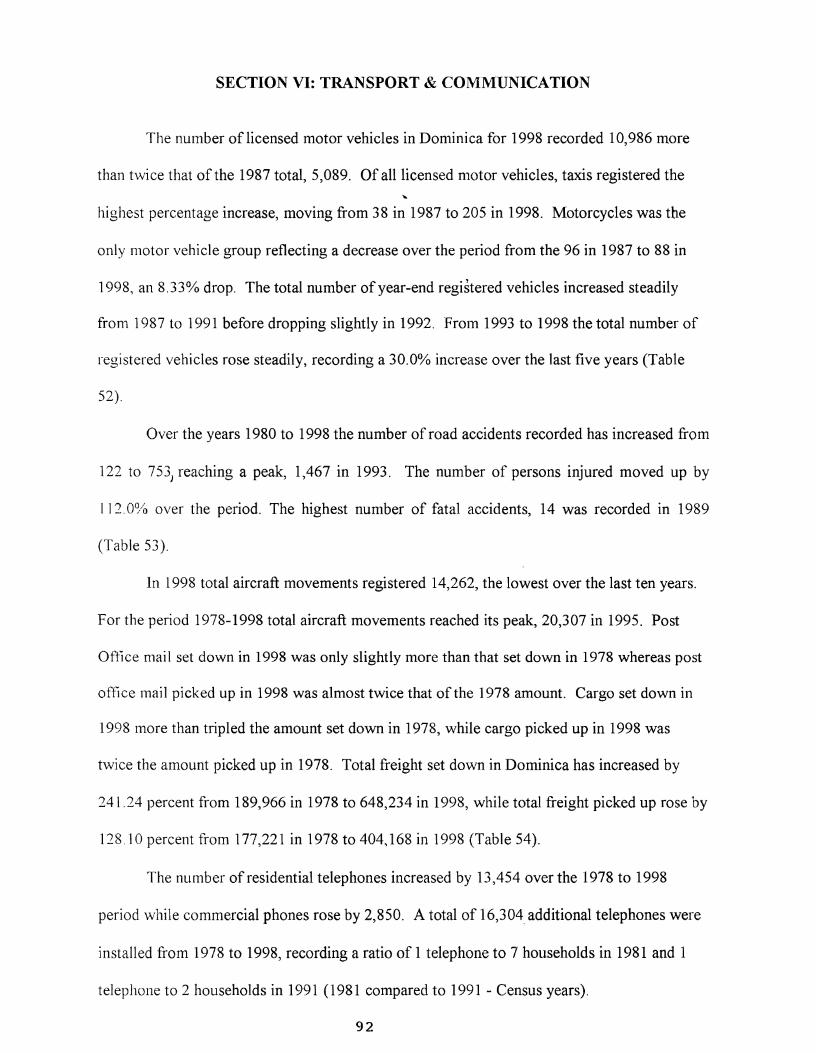
SECTION VI: TRANSPORT & COMMUNICATION
The nUlllber of licensed motor vehicles in Dominica for 1998 recorded 10,986 more
than twice that of the 1987 total, 5,089. Of all licensed nlotor vehicles, taxis registered the
highest percentage increase, moving from 38 in 1987 to 205 in 1998. Motorcycles was the
only 111otor vehicle group reflecting a decrease over the period from the 96 in 1987 to 88 in
1998, an 8.33% drop. The total number of year-end registered vehicles increased steadily
from 1987 to 1991 before dropping slightly in 1992. Froin 1993 to 1998 the total number of
registered vehicles rose steadily, recording a 30.0% increase over the last five years (Table
52).
Over the years 1980 to 1998 the number of road accidents recorded has increased from
122 to 753) reaching a peak, 1,467 in 1993. The number of persons injured moved up by
112. O~/O over the period. The highest number of fatal accidents, 14 was recorded in 1989
(Table 53).
In 1998 total aircraft movements registered 14,262, the lowest over tIle last ten years.
For the period 1978-1998 total aircraft movements reached its peak, 20,307 in 1995. Post
Oftice nlail set down in 1998 was only slightly more than that set down in 1978 whereas post
office lnail picked up in 1998 was almost twice that of the 1978 amount. Cargo set down in
1998 more than tripled the amount set down in 1978, while cargo picked up in 1998 was
twice the amount picked up in 1978. Total freight set down in Dominica has increased by
241.24 percent from 189,966 in 1978 to 648,234 in 1998, while total freight picked up rose by
128.10 percent from 177,221 in 1978 to 404,168 in 1998 (Table 54).
The number of residential teleph.ones increased by 13,454 over the 1978 to 1998
period while commercial phones rose by 2,850. A total of 16,304, additional telephones were
illstalled from 1978 to 1998, recording a ratio of 1 telephone to 7 hOllseholds in 1981 and 1
telephone to 2 households in 1991 (1981 compared to 1991 - Census years).
92


SECTION VI - TRANSPORT AND COMMUNICATION
TABLE 52~ ROAD VEHICLES LICENSED AND REGISTERED1987 • 1998-
NUMBER OF MOTOR VECHICLES LICENSED DURING THE YEAR (1)TOTALREGISTERED
PRIVATE MOTOR TRUCKS TRACTORS AT ENDYEAR CARS(2) TAXIS BUSES CYCLES(3) ETC(4) JEEPS (5) TOTAL OF YEAR
1987 2,891 38 258 96 1,514 272 20 5,089 5,678
1988 3,081 34 307 92 1,764 272 21 5,571 6,388
1989 3,379 38 369 85 2,089 265 20 6,245 7,143
1990 3,668 58 482 128 2,642 347 23 7,348 8,467
1991 4,046 58 565 151 2,796 427 21 8.,064 8,947
1992 4,366 78 446 124 2,322 354 22 7,712 8,482
1993 5,420 78 351 78 2,294 277 28 8,526 9,491
1994 6,491 90 559 94 2,266 461 24 9,985 10,49.7
1995 6,747 95 631 98 2,280 446 28 10,325 10,837
1996 7,230 108 749 102 2,531 475 33 11,228 11,616
1997 7,224 133 709 95 2,331 415 50 10,957 12,174
1998 7,330 205 649 88 2,296 370 48 10,986 12,332
Source: Traffic Department, Computer Centre and Dominica Taxi Association
Notes: (1) including tax-exempt vehicles(2) including state cars(3) including scooters and mopeds(4) including pickups and vans(5) including excavators and trailers
93
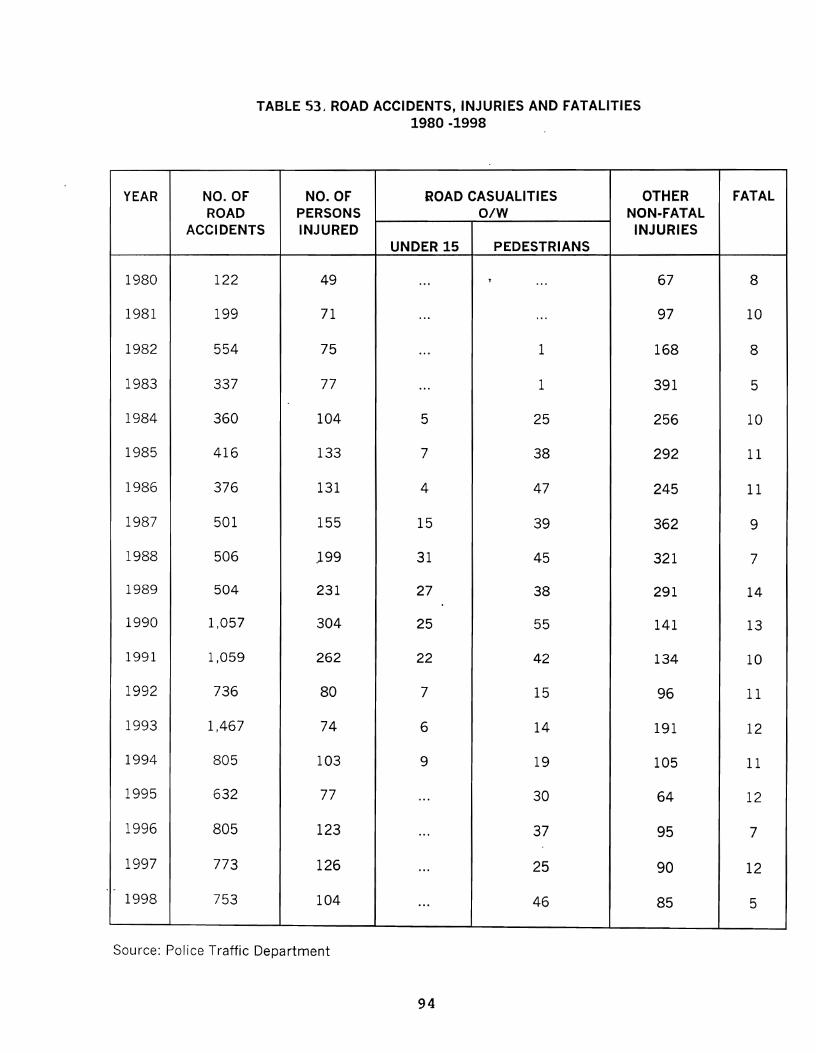
TABLE 53J ROAD ACCIDENTS, INJURIES AND FATALITIES1980-1998
YEAR NO. OF NO. OF ROAD CASUALITIES OTHER FATALROAD PERSONS O/W NON-FATAL
ACCIDENTS INJURED INJURIESUNDER 15 PEDESTRIANS
1980 122 49 ... 1 ... 67 8
1981 199 71 ... ... 97 10
1982 554 75 ... 1 168 8
1983 337 77 ... 1 391 5
1984 360 104 5 25 256 10
1985 416 133 7 38 292 11
1986 376 131 4 47 245 11
1987 501 155 15 39 362 9
1988 506 199 31 45 321 7
1989 504 231 27 38 291 14
1990 1,057 304 25 55 141 13
1991 1,059 262 22 42 134 10
1992 736 80 7 15 96 11
1993 1,467 74 6 14 191 12
1994 805 103 9 19 105 11
1995 632 77 ... 30 64 12
1996 805 123 ... 37 95 7
1997 773 126 ... 25 90 12- -
1998 753 104 ... 46 85 5
Source: Police Traffic Department
94
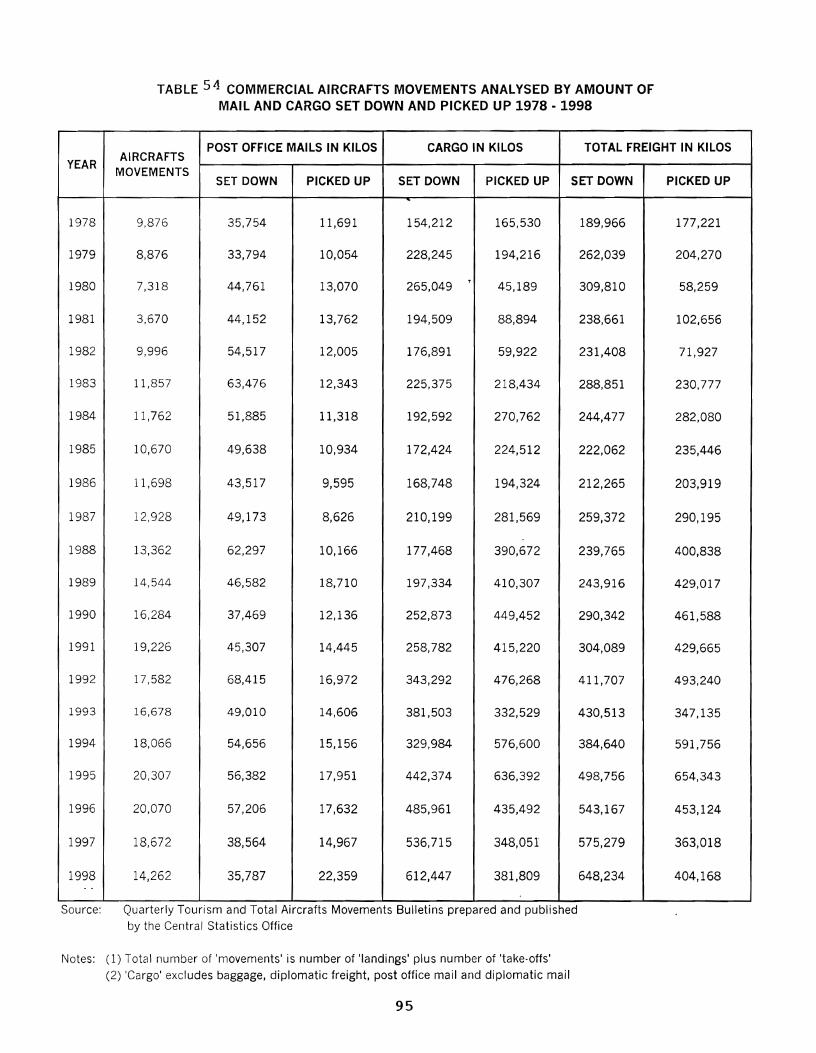
TABLE 54 COMMERCIAL AIRCRAFTS MOVEMENTS ANALYSED BY AMOUNT OFMAIL AND CARGO SET DOWN AND PICKED UP 1978 · 1998
POST OFFICE MAILS IN KILOS CARGO IN KILOS TOTAL FREIGHT IN KILOSYEAR
AIRCRAFTSMOVEMENTS
SET DOWN PICKED UP SET DOWN PICKED UP SET DOWN PICKED UP...
1978 9,876 35,754 11,691 154,212 165,530 189,966 177,221
1979 8,876 33,794 10,054 228,245 194,216 262,039 204,270
1980 7,318 44,761 13,070 265,049.,
45,189 309,810 58,259
1981 3,670 44,152 13,762 194,509 88,894 238,661 102,656
1982 9,996 54,517 12,005 176,891 59,922 231,408 71,927
1983 11,857 63,476 12,343 225,375 218,434 288,851 230,777
1984 11,762 51,885 11,318 192,592 270,762 244,477 282,080
1985 10,670 49,638 10,934 172,424 224,512 222,062 235,446
1986 11,698 43,517 9,595 168,748 194,324 212,265 203,919
1987 12,928 49,173 8,626 210,199 281,569 259,372 290,195
1988 13,362 62,297 10,166 177,468 390,672 239,765 400,838
1989 14,544 46,582 18,710 197,334 410,307 243,916 429,017
1990 16,284 37,469 12,136 252,873 449,452 290,342 461,588
1991 19,226 45,307 14,445 258,782 415,220 304,089 429,665
1992 17,582 68,415 16,972 343,292 476,268 411,707 493,240
1993 16,678 49,010 14,606 381,503 332,529 430,513 347,135
1994 18,066 54,656 15,156 329,984 576,600 384,640 591,756
1995 20,307 56,382 17,951 442,374 636,392 498,756 654,343
1996 20,070 57,206 17,632 485,961 435,492 543,167 453,124
1997 18,672 38,564 14,967 536,715 348,051 575,279 363,018
1998 14,262 35,787 22,359 612,447 381,809 648,234 404,168..
Source: Quarterly Tourism and Total Aircrafts Movements Bulletins prepared and publishedby the Central Statistics Office
Notes: (1) Total number of 'movements' is number of 'landings' plus number of 'take-offs'
(2) 'Cargo' excludes baggage, diplomatic freight, post office mail and diplomatic mail
95
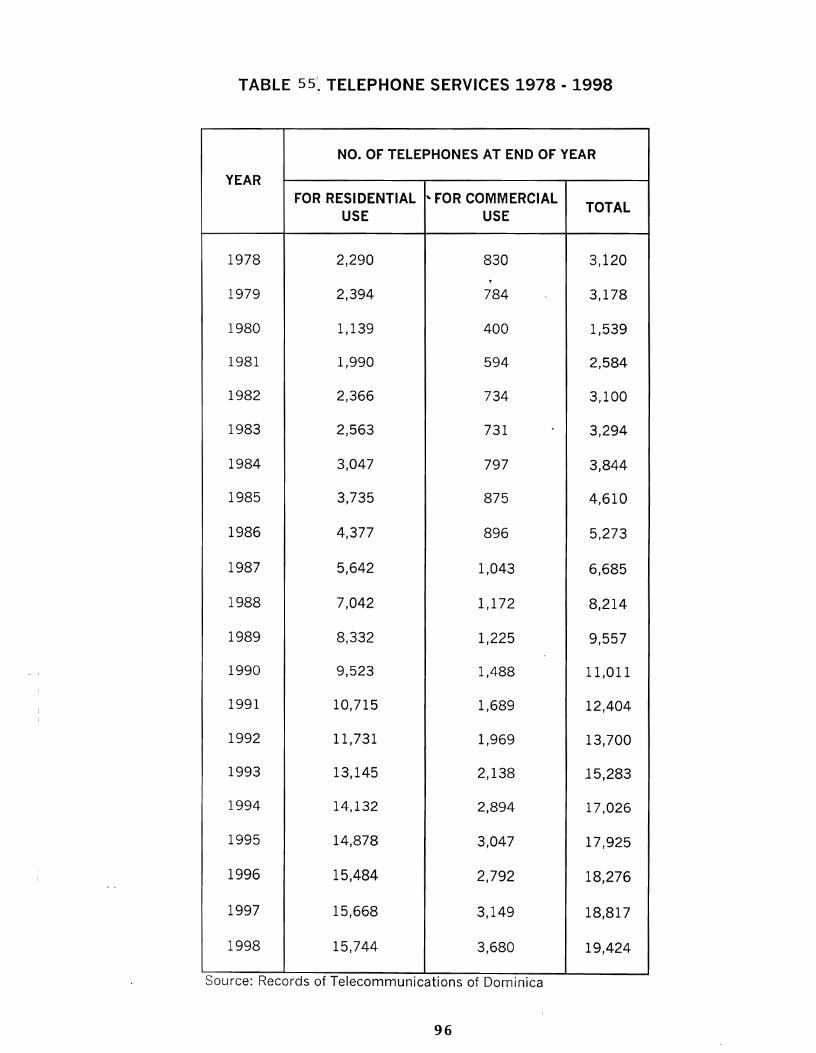
TABLE 55". TELEPHONE SERVICES 1978 · 1998
NO. OF TELEPHONES AT END OF YEAR
YEARFOR RESIDENTIAL 'FOR COMMERCIAL
TOTALUSE USE
1978 2,290 830 3,120,
1979 2,394 784 3,178
1980 1,139 400 1,539
1981 1,990 594 2,584
1982 2,366 734 3,100
1983 2,563 731 3,294
1984 3,047 797 3,844
1985 3,735 875 4,610
1986 4,377 896 5,273
1987 5,642 1,043 6,685
1988 7,042 1,172 8,214
1989 8,332 1,225 9,557
1990 9,523 1,488 11,011
1991 10,715 1,689 12,404
1992 11,731 1,969 13,700
1993 13,145 2,138 15,283
1994 14,132 2,894 17,026
1995 14,878 3,047 17,925
1996 15,484 2,792 18,276
1997 15,668 3,149 18,817
1998 15,744 3,680 19,424
Source: Records of Telecommunications of Dominica
96
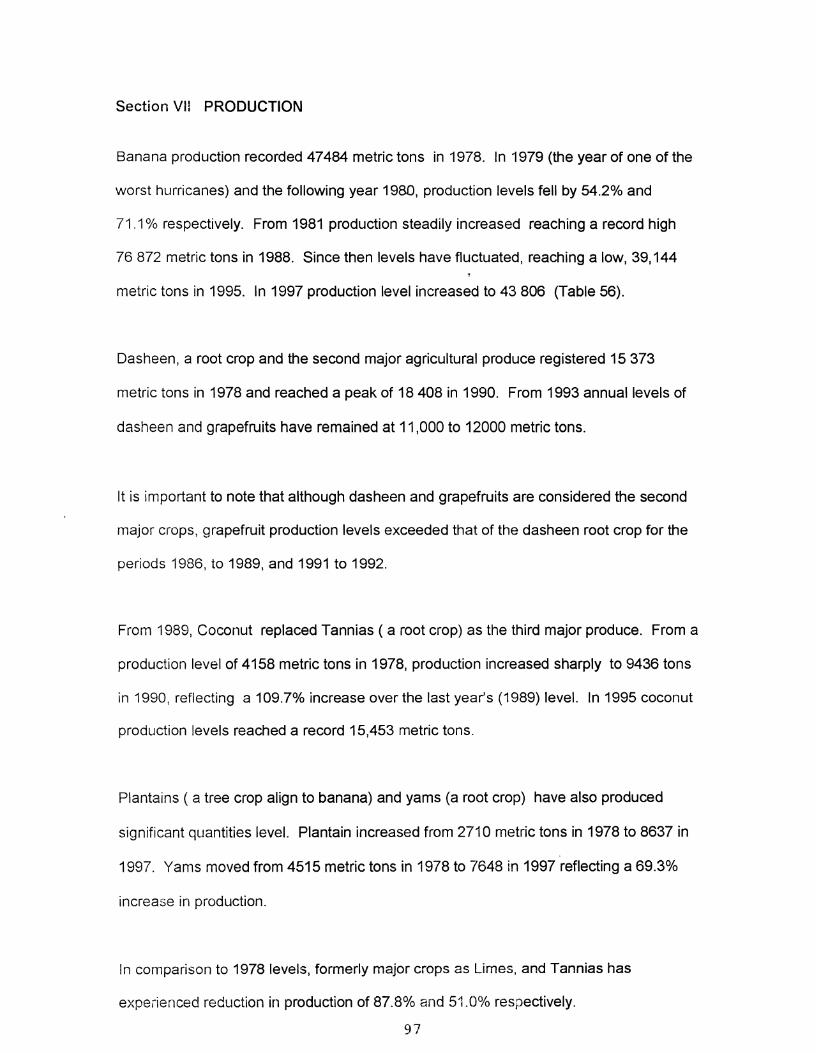
Section VII PRODUCTION
Banana production recorded 47484 metric tons in 1978. In 1979 (the year of one of the
worst hurricanes) and the following year 1980, production levels fell by 54.2% and
71.1 % respectively. From 1981 production steadily increased reaching a record high
76 872 metric tons in 1988. Since then levels have fluctuated, reaching a low, 39,144
metric tons in 1995. In 1997 production level increased to 43 806 (Table 56).
Dasheen, a root crop and the second major agricultural produce registered 15 373
metric tons in 1978 and reached a peak of 18408 in 1990. From 1993 annual levels of
dasheen and grapefruits have remained at 11,000 to 12000 metric tons.
It is important to note that although dasheen and grapefruits are considered the second
major crops, grapefruit production levels exceeded that of the dasheen root crop for the
periods 1986, to 1989, and 1991 to 1992.
From 1989, Coconut replaced Tannias ( a root crop) as the third major produce. From a
production level of 4158 metric tons in 1978, production increased sharply to 9436 tons
in 1990, reflecting a 109.7% increase over the last year's (1989) level. In 1995 coconut
production levels reached a record 15,453 metric tons.
Plantains ( a tree crop align to banana) and yams (a root crop) have also produced
significant quantities level. Plantain increased from 2710 metric tons in 1978 to 8637 in
1997. Yanls moved from 4515 metric tons in 1978 to 7648 in 1997 reflecting a 69.3%
increase in production.
In comparison to 1978 levels, formerly major crops as Limes, and Tannias has
experienced reduction in production of 87.8% and 51.DOlo respectively.
97
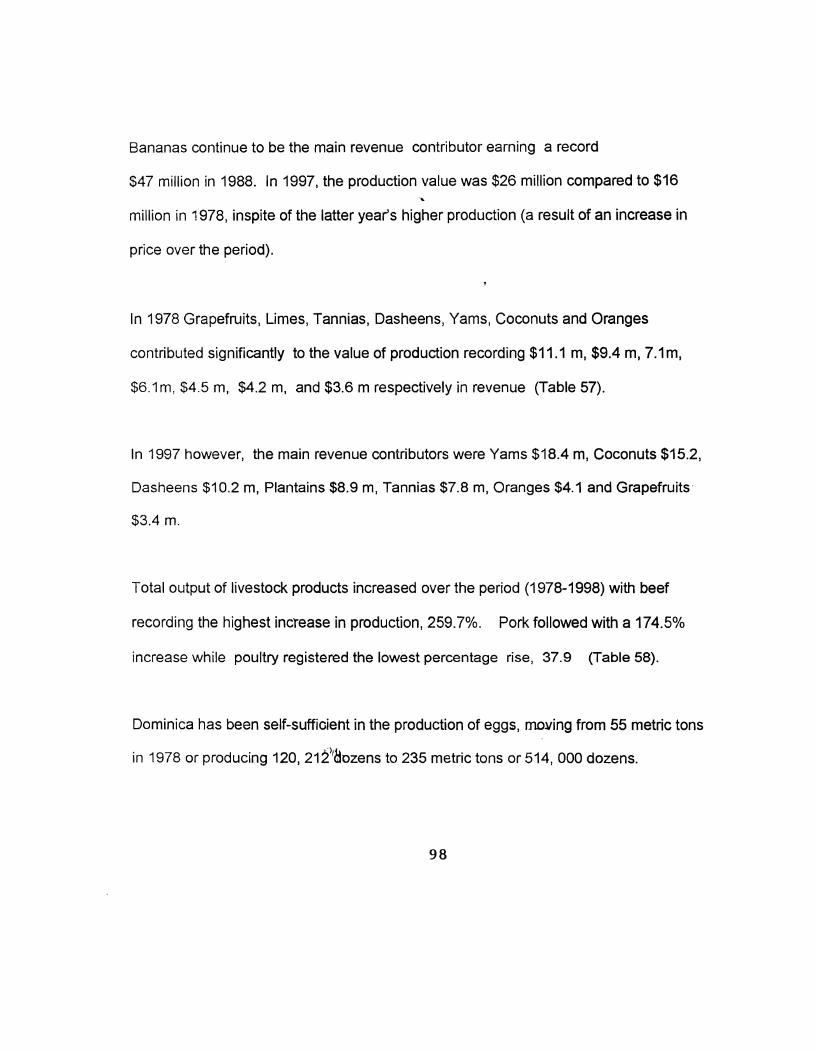
Bananas continue to be the main revenue contributor earning a record
$47 million in 1988. In 1997, the production value was $26 million compared to $16
million in 1978, inspite of the latter year's higher production (a result of an increase in
price over the period).
In 1978 Grapefruits, Limes, Tannias, Dasheens, Yams, Coconuts and Oranges
contributed significantly to the value of production recording $11.1 m, $9.4 m, 7.1 m,
$6.1 m, $4.5 m, $4.2 m, and $3.6 m respectively in revenue (Table 57).
In 1997 however, the ma.in revenue contributors were Yams $18.4 m, Coconuts $15.2,
Dasheens $10.2 m, Plantains $8.9 m, Tannias $7.8 m, Oranges $4.1 and Grapefruits'
$3.4 m.
Total output of livestock products increased over the period (1978-1998) with beef
recording the highest increase in production, 259.7%. Pork followed with a 174.5%
increase while poultry registered the lowest percentage rise, 37.9 (Table 58).
Dominica has been self-suffioient in the production of eggs, molting from 55 metric tons
in 1978 or producing 120, 212);~ozens to 235 metric tons or 514, 000 dozens.
98
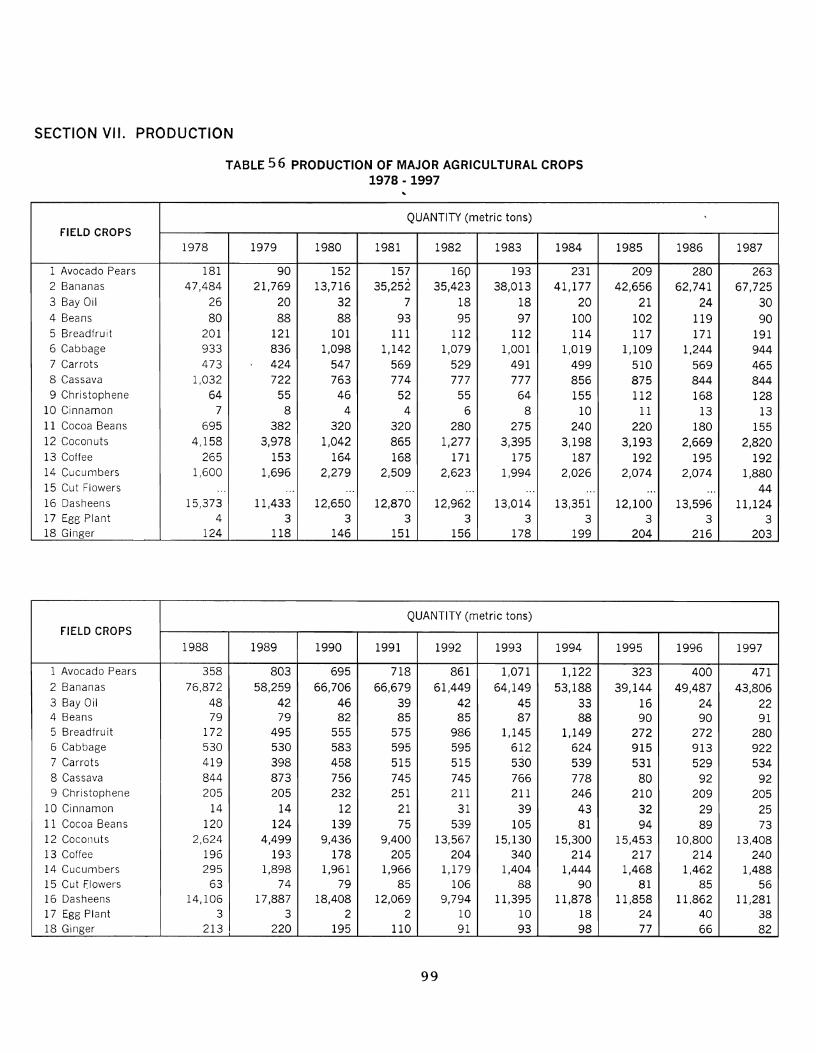
SECTION VII. PRODUCTION
TABLE 56. PRODUCTION OF MAJOR AGRICULTURAL CROPS1978 • 1997
QUANTITY (metric tons)
FIELD CROPS
1978 1979 1980 1981 1982 1983 1984 1985 1986 1987
1 Avocado Pears 181 90 152 157 16D 193 231 209 280 2632 Bananas 47,484 21,769 13,716 35,252 35,423 38,013 41,177 42,656 62,741 67,7253 Bay Oil 26 20 32 7 18 18 20 21 24 304 Beans 80 88 88 93 95 97 100 102 119 905 Breadfru it 201 121 101 111 112 112 114 117 171 1916 Cabbage 933 836 1,098 1,142 1,079 1,001 1,019 1,109 1,244 9447 Carrots 473 424 547 569 529 491 499 510 569 4658 Cassava 1,032 722 763 774 777 777 856 875 844 8449 Christophene 64 55 46 52 55 64 155 112 168 128
10 Cinnamon 7 8 4 4 6 8 10 11 13 1311 Cocoa Beans 695 382 320 320 280 275 240 220 180 15512 Coconuts 4,158 3,978 1,042 865 1,277 3,395 3,198 3,193 2,669 2,82013 Coffee 265 153 164 168 171 175 187 192 195 19214 Cucumbers 1,600 1,696 2,279 2,509 2,623 1,994 2,026 2,074 2,074 1,88015 Cut Flowers ... ... ... ... ... ... ... ... ... 4416 Dasheens 15,373 11,433 12,650 12,870 12,962 13,014 13,351 12,100 13,596 11,12417 Eg8 Plant 4 3 3 3 3 3 3 3 3 318 Ginger 124 118 146 151 156 178 199 204 216 203
QUANTITY (metric tons)
FIELD CROPS
1988 1989 1990 1991 1992 1993 1994 1995 1996 1997
1 Avocado Pears 358 803 695 718 861 1,071 1,122 323 400 4712 Bananas 76,872 58,259 66,706 66,679 61,449 64,149 53,188 39,144 49,487 43,8063 Bay Oil 48 42 46 39 42 45 33 16 24 224 Beans 79 79 82 85 85 87 88 90 90 915 Breadfruit 172 495 555 575 986 1,145 1,149 272 272 2806 Cabbage 530 530 583 595 595 612 624 915 913 9227 Carrots 419 398 458 515 515 530 539 531 529 5348 Cassava 844 873 756 745 745 766 778 80 92 929 Christophene 205 205 232 251 211 211 246 210 209 205
10 Cinnamon 14 14 12 21 31 39 43 32 29 2511 Cocoa Beans 120 124 139 75 539 105 81 94 89 7312 COCOlluts 2,624 4,499 9,436 9,400 13,567 15,130 15,300 15,453 10,800 13,40813 Coffee 196 193 178 205 204 340 214 217 214 24014 Cucumbers 295 1,898 1,961 1,966 1,179 1,404 1,444 1,468 1,462 1,48815 Cut Flowers 63 74 79 85 106 88 90 81 85 5616 Dasheens 14,106 17,887 18,408 12,069 9,794 11,395 11,878 11,858 11,862 11,28117 Egg Plant 3 3 2 2 10 10 18 24 40 3818 Ginger 213 220 195 110 91 93 98 77 66 82
99

TABLE 56 CONT'D
QUANTITY (metric tons)
FIELD CROPS
1978 1979 1980 1981 1982 1983 1984 1985 1986 1987
19 Grapefruit 11,050 6,630 7,700 8,360 8,986 5,388 5,537 8,250 23,735 19,028
20 Irish Potatoes ... ... ... ... ., ... ... ... 75 45 62
21 Lettuce 280 297 366 384 399 405 415 392 168 128
22 Limes 9,375 3,749 6,188 6,380 6,513 6,078 6,258 6,357 5,834 5,56923 Manderine ... ... ... ... ... ... ... ... ... ...24 Mangoes 235 94 132 139 144 159 1,514 3,920 4,055 3,821
1
25 Nutmegs 9 4 6 6 4 3 3 3 3 326 Okra 6 4 6 7 3 3 3 3 3 327 Oranges 3,570 2,142 2,356 2,403 2,427 2,213 2,284 2,750 5,123 5,00028 Passion Fruit ... ... ... ... ... ... ... ... ... ...29 Pawpaw ... ... ... ... ... ... ... ... ... ...30 Peppers
31 Plantains 2,710 2,028 1,344 1,478 1,565 1,393 1,530 1,820 2,160 2,12232 Pumpkins 360 381 493 517 538 479 463 672 903 68533 Sweet Potatoes 1,548 1,417 1,760 1,725 1,609 1,604 1,632 1,664 1,971 1,79234 Tannias 7,095 5,722 7,920 6,218 6,199 6,241 6,420 4,400 4,914 5,64535 Tomatoes 116 119 147 160 174 166 169 179 242 18436 Water Melon '" ... ... ... ... ... ... ... ... ...37 Yams 4,515 3,128 4,950 5,280 5,350 5,027 5,139 5,500 6,600 5,700
QUANTITY (metric tons)FIELD CROPS
1988 1989 1990 1991 1992 1993 1994 1995 1996 1997
19 Grapefruit 21,179 19,568 15,600 14,107 17,507 12,212 12,252 10,682 11,641 11,01220 Irish Potatoes 73 150 ... 102 102 105 107 148 305 23021 Lettuce 128 130 422 154 154 158 161 159 150 15122 Limes 5,870 4,402 2,585 1,716 980 990 1,058 1,102 1,353 1,14323 Manderine ... ... ... 26 17 29 10 500 699 71024 Mangoes 4,374 4,068 4,030 2,916 1,410 2,171 2,329 2,362 1,714 1,76625 Nutmegs 3 4 22 4 16 4 4 4 3 226 Okra 3 2 12 2 2 2 2 4 2 327 Oranges 5,773 4,616 3,185 3,190 3,719 3,232 3,335 3,367 3,514 3,87128 Passion Fru it ... ... 749 301 334 381 394 419 432 43429 Pawpaw ... 13 8 17 12 12 37 57 71 7530 Peppers ... ... ... 28 ... 19 30 277 388 34231 Plantains 6,217 5,595 3,258 6,128 6,637 8,097 7,886 7,899 8,212 8,63732 Pumpkins 747 597 552 742 732 824 935 841 876 911
.3_3. Sweet Potatoes 1,732 1,287 1,743 1,271 1,262 1,646 1,679 1,734 1,715 1,72234 Tannias 4,516 3,838 5,239 4,286 4,337 4,463 4,379 4,408 3,636 3,50035 Tomatoes 184 174 680 197 195 198 204 201 198 22536 Water Melon 205 166 158 162 149 189 192 156 240 16237 Yams 6,300 5,670 9,241 6,131 6,228 6,578 6,659 7,066 7,672 7,648
Source: Records of the Central Statistical Office, and the Agricultural Statistics Unit,Ministry of Agriculture
100
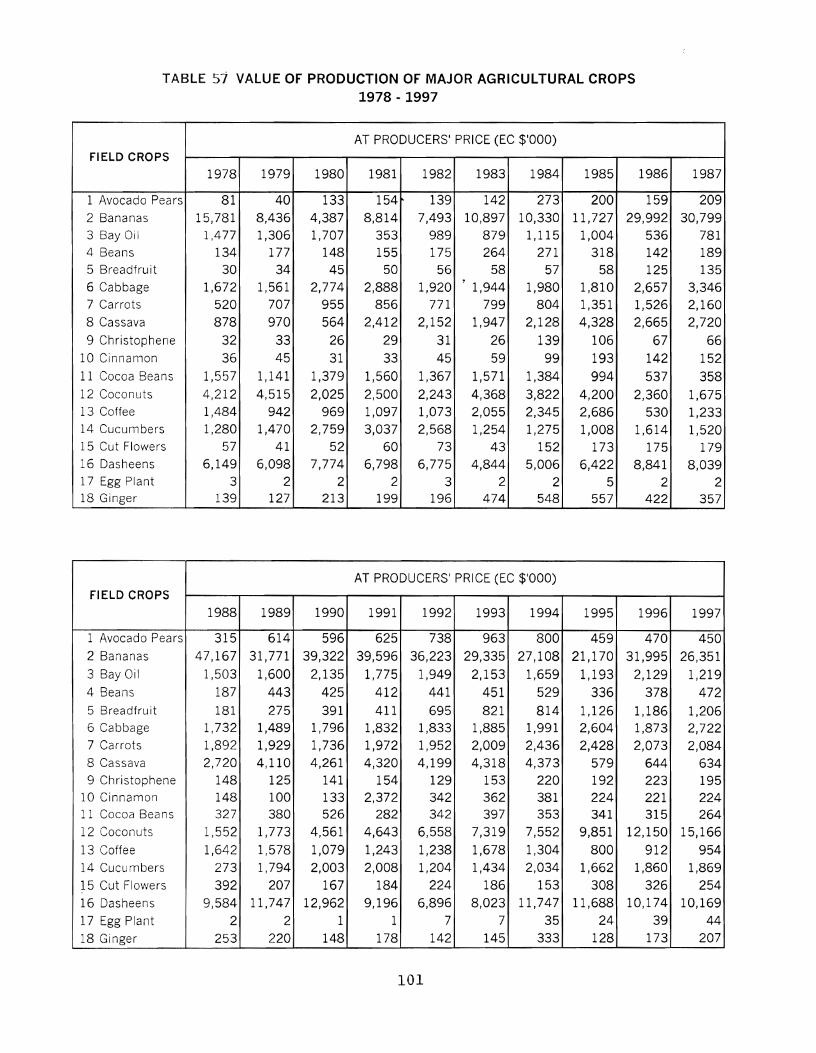
TABLE 57 VALUE OF PRODUCTION OF MAJOR AGRICULTURAL CROPS1978 - 1997
AT PRODUCERS' PRICE (EC $1000)FIELD CROPS
1978 1979 1980 1981 1982 1983 1984 1985 1986 1987
1 Avocado Pears 81 40 133 154 139 142 273 200 159 2092 Bananas 15,781 8,436 4,387 8,814 7,493 10,897 10,330 11,727 29,992 30,7993 Bay Oil 1,477 1,306 1,707 353 989 879 1,115 1,004 536 7814 Beans 134 177 148 155 175 264 271 318 142 1895 Breadfruit 30 34 45 50 56 58 57 58 125 1356 Cabbage 1,672 1,561 2,774 2,888 1,920 ' 1,944 1,980 1,810 2,657 3,3467 Carrots 520 707 955 856 771 799 804 1,351 1,526 2,1608 Cassava 878 970 564 2,412 2,152 1,947 2,128 4,328 2,665 2,7209 Christophene 32 33 26 29 31 26 139 106 67 66
10 Cinnamon 36 45 31 33 45 59 99 193 142 15211 Cocoa Beans 1,557 1,141 1,379 1,560 1,367 1,571 1,384 994 537 35812 Coconuts 4,212 4,515 2,025 2,500 2,243 4,368 3,822 4,200 2,360 1,67513 Coffee 1,484 942 969 1,097 1,073 2,055 2,345 2,686 530 1,23314 Cucumbers 1,280 1,470 2,759 3,037 2,568 1,254 1,275 1,008 1,614 1,52015 Cut Flowers 57 41 52 60 73 43 152 173 175 17916 Dasheens 6,149 6,098 7,774 6,798 6,775 4,844 5,006 6,422 8,841 8,03917 Egg Plant 3 2 2 2 3 2 2 5 2 218 Ginger 139 127 213 199 196 474 548 557 422 357
AT PRODUCERS' PRICE (EC $1000)FIELD CROPS
1988 1989 1990 1991 1992 1993 1994 1995 1996 1997
1 Avocado Pears 315 614 596 625 738 963 800 459 470 4502 Bananas 47,167 31,771 39,322 39,596 36,223 29,335 27,108 21,170 31,995 26,3513 Bay Oil 1,503 1,600 2,135 1,775 1,949 2,153 1,659 1,193 2,129 1,2194 Beans 187 443 425 412 441 451 529 336 378 4725 Breadfru it 181 275 391 411 695 821 814 1,126 1,186 1,2066 Cabbage 1,732 1,489 1,796 1,832 1,833 1,885 1,991 2,604 1,873 2,7227 Carrots 1,892 1,929 1,736 1,972 1,952 2,009 2,436 2,428 2,073 2,0848 Cassava 2,720 4,110 4,261 4,320 4,199 4,318 4,373 579 644 6349 Christophene 148 125 141 154 129 153 220 192 223 195
10 Cinnamon 148 100 133 2,372 342 362 381 224 221 22411 Cocoa Beans 327 380 526 282 342 397 353 341 315 26412 Coconuts 1,552 1,773 4,561 4,643 6,558 7,319 7,552 9,851 12,150 15,16613 Coffee 1,642 1,578 1,079 1,243 1,238 1,678 1,304 800 912 95414 Cucumbers 273 1,794 2,003 2,008 1,204 1,434 2,034 1,662 1,860 1,86915 Cut Flowers 392 207 167 184 224 186 153 308 326 25416 Dasheens 9,584 11,747 12,962 9,196 6,896 8,023 11,747 11,688 10,174 10,16917 Egg Plant 2 2 1 1 7 7 35 24 39 4418 Ginger 253 220 148 178 142 145 333 128 173 207
101
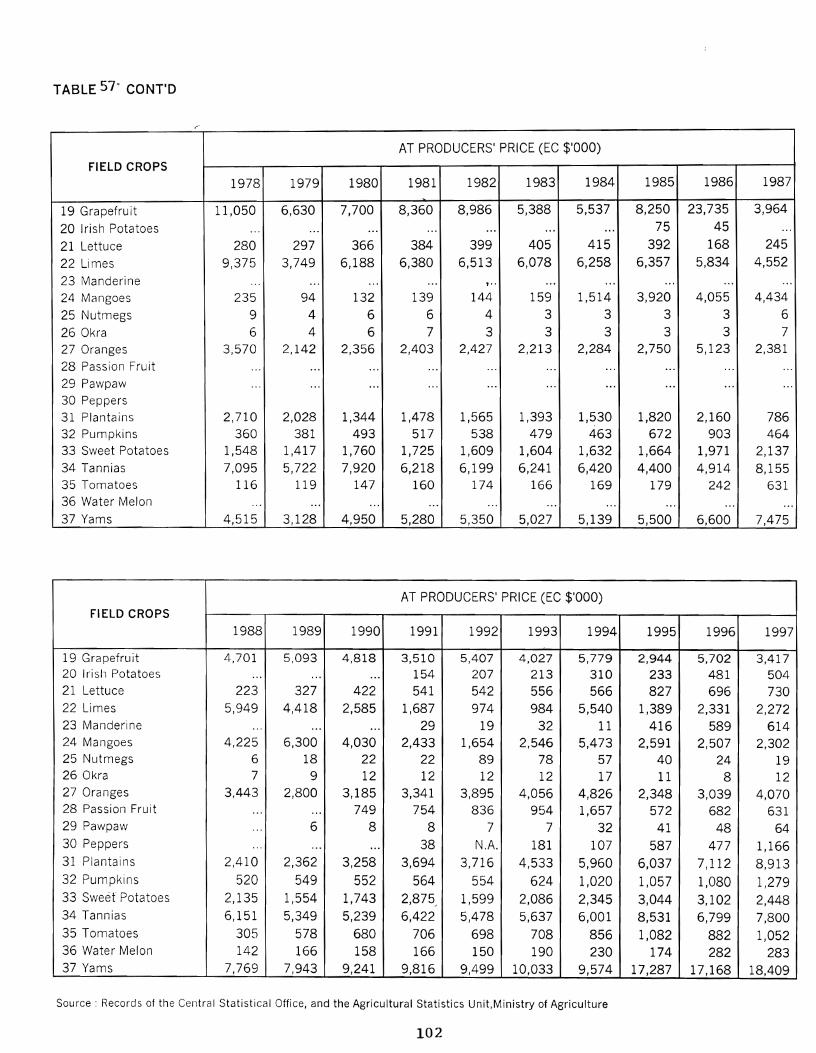
TABLE 57'1 CONT'D
,--
AT PRODUCERS' PRICE (EC $1000)
FIELD CROPS
1978 1979 1980 1981 1982 1983 1984 1985 1986 1987
19 Grapefruit 11,050 6,630 7,700 8,360 8,986 5,388 5,537 8,250 23,735 3,964
20 Irish Potatoes ... ... ... ... ... ... ... 75 45 ...
21 Lettuce 280 297 366 384 399 405 415 392 168 245
22 Limes 9,375 3,749 6,188 6,380 6,513 6,078 6,258 6,357 5,834 4,552
23 Manderine ... ... ... ... ., .. ... ... ... ... ...
24 Mangoes 235 94 132 139 144 159 1,514 3,920 4,055 4,434
25 Nutmegs 9 4 6 6 4 3 3 3 3 6
26 Okra 6 4 6 7 3 3 3 3 3 7
27 Oranges 3,570 2,142 2,356 2,403 2,427 2,213 2,284 2,750 5,123 2,381
28 Passion Fruit ... ... ... ... ... ... ... ... ... ...29 Pawpaw ... ... ... ... ... ... ... ... ... ...30 Peppers31 Plantains 2,710 2,028 1,344 1,478 1,565 1,393 1,530 1,820 2,160 78632 Pumpkins 360 381 493 517 538 479 463 672 903 46433 Sweet Potatoes 1,548 1,417 1,760 1,725 1,609 1,604 1,632 1,664 1,971 2,13734 Tannias 7,095 5,722 7,920 6,218 6,199 6,241 6,420 4,400 4,914 8,15535 Tomatoes 116 119 147 160 174 166 169 179 242 63136 Water Melon ... ... ... ... ... ... ... ... ... ...
37 Yams 4,515 3,128 4,950 5,280 5,350 5,027 5,139 5,500 6,600 7,475
AT PRODUCERS' PRICE (EC $'000)FIELD CROPS
1988 1989 1990 1991 1992 1993 1994 1995 1996 1997
19 Grapefruit 4,701 5,093 4,818 3,510 5,407 4,027 5,779 2,944 5,702 3,41720 Irisll Potatoes ... ... ... 154 207 213 310 233 481 50421 Lettuce 223 327 422 541 542 556 566 827 696 73022 Limes 5,949 4,418 2,585 1,687 974 984 5,540 1,389 2,331 2,27223 Manderine ... ... ... 29 19 32 11 416 589 61424 Mangoes 4,225 6,300 4,030 2,433 1,654 2,546 5,473 2,591 2,507 2,30225 Nutmegs 6 18 22 22 89 78 57 40 24 1926 Okra 7 9 12 12 12 12 17 11 8 1227 Oranges 3,443 2,800 3,185 3,341 3,895 4,056 4,826 2,348 3,039 4,07028 Passion Fruit ... ... 749 754 836 954 1,657 572 682 63129 Pawpaw ... 6 8 8 7 7 32 41 48 6430 Peppers .. , ... ... 38 N.A. 181 107 587 477 1,16631 Plantains 2,410 2,362 3,258 3,694 3,716 4,533 5,960 6,037 7,112 8,91332 Pumpkins 520 549 552 564 554 624 1,020 1,057 1,080 1,27933 Sweet Potatoes 2,135 1,554 1,743 2,875/ 1,599 2,086 2,345 3,044 3,102 2,44834 Tannias 6,151 5,349 5,239 6,422 5,478 5,637 6,001 8,531 6,799 7,80035 Tomatoes 305 578 680 706 698 708 856 1,082 882 1,05236 Water Melon 142 166 158 166 150 190 230 174 282 28337 Yams 7,769 7,943 9,241 9,816 9,499 10,033 9,574 17,287 17,168 18,409
Source: Records of the Central Statistical Office, and the Agricultural Statistics Unit,Ministry of Agriculture
102

TABLE 584
OUTPUT OF LIVESTOCK PRODUCTS1978 · 1998
LIVESTOCK QUANTITY (metric tons)
PRODUCTS 1978 1979 1980 1981 "1982 1983 1984 1985 1986 1987 1988
Beef 159 162 163 204 208 348 418 439 439 452 464
Pork 161 164 191 227 267 359 370 381 400 420 602,
Mutton 53 53 53 55 56 98 102 113 119 125 76
Pou Itry 66 64 58 64 69 95 88 80 84 88 85
Eggs 55 42 101 156 172 190 139 388 382 362 325
Milk 113 115 116 114 126 276 287 301 286 271 224
LIVESTOCK QUANTI.TY (metric tons)
PRODUCTS 1989 1990 1991 1992 1993 1994 1995 1996 1997 1998
Beef 510 537 568 581 582 550 557 579 572 572
Pork 128 179 216 282 363 381 419 417 421 442
Mutton 132 135 135 145 141 143 146 142 140 139
Poultry 81 83 86 89 89 90 93 93 90 91
Eggs 335 345 344 348 385 384 384 382 379 375
Milk 230 231 235 235 231 232 235 245 240 235
Source: Records of the Central Statistical Office and theAgricu Itura I Statistics Unit, Ministry of Agriculture
103

Section VIII PUBLIC FINANCE
Over the twenty one year period the larges! surplus, $17.5m, was recorded in the
1987/1988 Financial Year, (July 1997 to June 1988). Other years, 1978f79,
1979/80, 1986/87, 1988/89, 1991/92 recorded surplus of $1.7m, $2.7m, $3.2m,
$5.7m, and $O.7m, respectively. The largest deficit~ $19.5m, was registered in the
1990191 financial year (Table 59)_
Over the last three years, Revenue has been steadily increasing; in 1978/79 total revenue
registered $36.8m. However in the 1997198 financial year, total revenue increased to
$243.0 m with Consumption and Import Duty accounting for 42.0% of Total Local Revenue 1
(Table 59 and 60).
In 1978/79 total recurrent expenditure recorded $33.4m, of which Social & Community
Services and General Services accounted for 37.9 and 37.8% (respectively) of
expenditure .
In 1997/98 Recurrent Expenditure registered $208_4 m, with Social and Community
Services and General Services accounting for 34.5 and 31.90/0 (respectively) of total
expenditure.
From the 1978fl9 Sodal and Community Services budget, 500/0 was allocated to
Education and 35.70/0 to Health. In the 1997/98 budget 470/0 was allocated to Education
while Health Services accounted for 410/0 (Table 61)"
In 1978, Ca,pital Expenditure. registered $1 ~6mJ accounting for 4.60/0 of Total Expenditure
In the 1997/98 financial year, Capital Expenditure estimated at $41.5m, recorded 16.60/011
of Total Expenditure. Capital Expenditure recorded the highest, $80.8 m, in the 1989/9011
financial year accounting for 42.1% of Total Expenditure. I
1
1
104 1

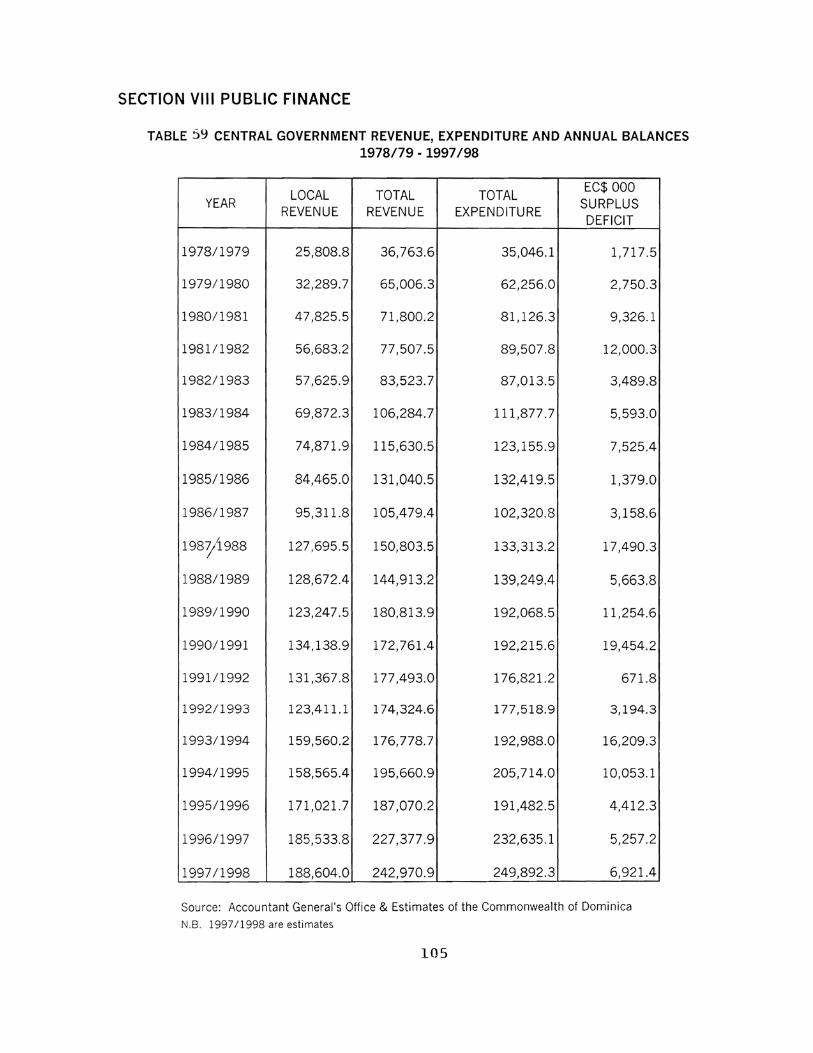
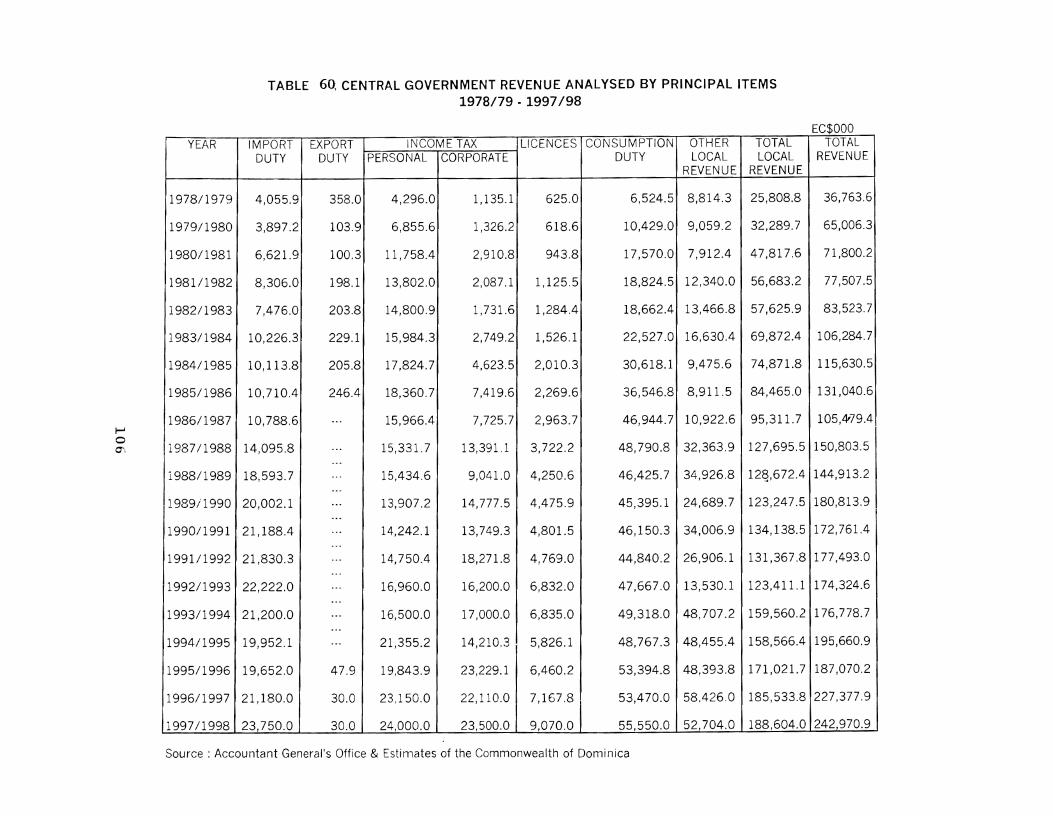
TABLE 6Q CENTRAL GOVERNMENT REVENUE ANALYSED BY PRINCIPAL ITEMS1978/79 . 1997/98
EC$OOO
~10
11 0 \1
1
I
I
I
I
I
I
I
I
I
I
YEAR IMPORT EXPORT INCOME TAX LICENCES CONSUMPTION OTHER TOTAL TOTAL
DUTY DUTY PERSONAL CORPORATE DUTY LOCAL LOCAL REVENUEREVENUE REVENUE
1978/1979 4,055.9 358.0 4,296.0 1,135.1 625.0 6,524.5 8,814.3 25,808.8 36,763.6
1979/1980 3,897.2 103.9 6,855.6 1,326.2 618.6 10,429.0 9,059.2 32,289.7 65,006.3
1980/1981 6,621.9 100.3 11,758.4 2,910.8 943.8 17,570.0 7,912.4 47,817.6 71,800.2
1981/1982 8,306.0 198.1 13,802.0 2,087.1 1,125.5 18,824.5 12,340.0 56,683.2 77,507.5
1982/1983 7,476.0 203.8 14,800.9 1,731.6 1,284.4 18,662.4 13,466.8 57,625.9 83,523.7
1983/1984 10,226.3 229.1 15,984.3 2,749.2 1,526.1 22,527.0 16,630.4 69,872.4 106,284.7
1984/1985 10,113.8 205.8 17,824.7 4,623.5 2,010.3 30,618.1 9,475.6 74,871.8 115,630.5
1985/1986 10,710.4 246.4 18,360.7 7,419.6 2,269.6 36,546.8 8,911.5 84,465.0 131,040.6
1986/1987 10,788.6 ... 15,966.4 7,725.7 2,963.7 46,944.7 10,922.6 95,311.7 105,4179.4
11987/1988 14,095.8 ... 15,331.7 13,391.1 3,722.2 48,790.8 32,363.9 127,695.5 150,803.5...
11988/1989 18,593.7 .. , 15,434.6 9,041.0 4,250.6 46,425.7 34,926.8 12~,672.4 144,913.2...
1989/1990 20,002.1 .. , 13,907.2 14,777.5 4,475.9 45,395.1 24,689.7 123,247.5 180,813.9...
1990/1991 ,21,188.4 ... 14,242.1 13,749.3 4,801.5 46,150.3 34,006.9 134,138.5 172,761.4...
1991/1992 21,830.3 .. , 14,750.4 18,271.8 4 1 769.0 44,840.2 26,906.1 131,367.8 177,493.0...
1992/1993 22,222.0 ... 16,960.0 16,200.0 6,832.0 47,667.0 13,530.1 123,411.1 174,324.6...
1993/1994 21,200.0 .. , 16,500.0 17,000.0 6,835.0 49,318.0 48,707.2 159,560.2 176,778.7...
1994/1995 19,952.1 ... 21,355.2 14,210.3 5,826.1 48,767.3 48,455.4 158,566.4 195,660.9
1995/1996 19,652.0 47.9 19,843.9 23,229.1 6,460.2 53,394.8 48,393.8 171,021.7 187,070.2
1996/1997 21,180.0 30.0 23,150.0 22,110.0 7,167.8 53,470.0 58.426.0 185,533.8 227,377.9
1997/1998 23,750.0 30.0 24,000.0 23,500.0 9,070.0 55,550.0 52,704.0 188,604.0 242,970.9
Source: Accountant General's Office & Estimates of the Commonwealth of Dominica
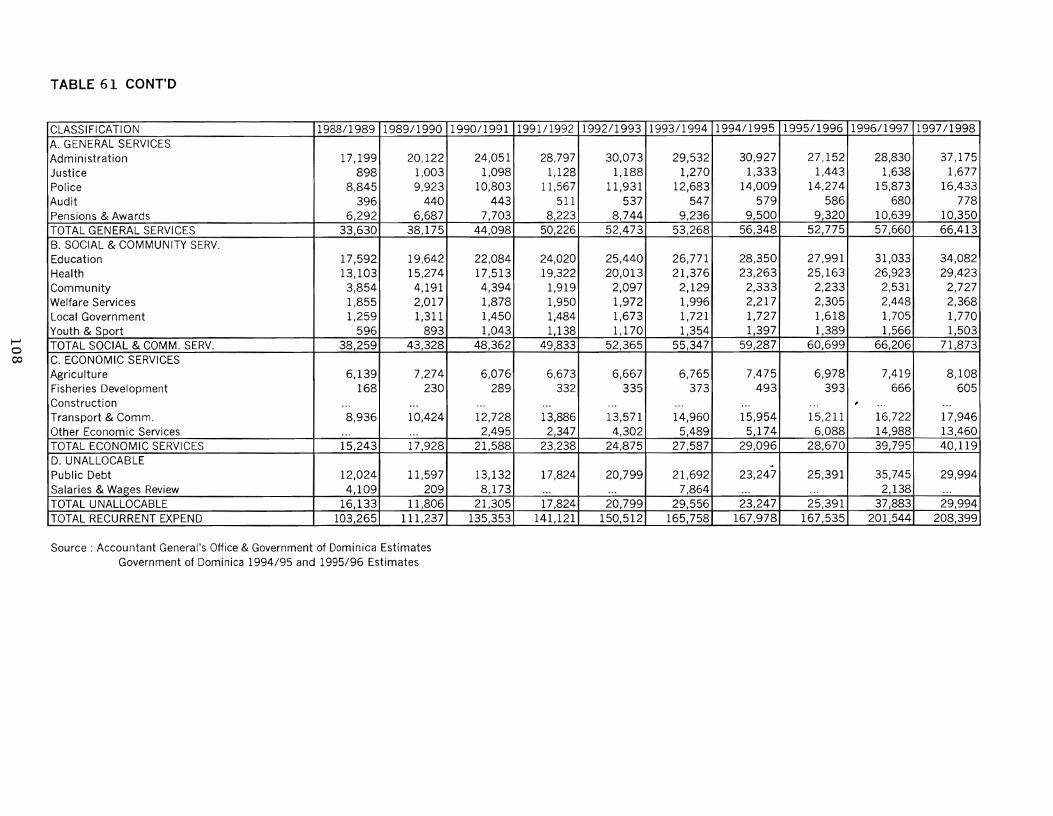
t-Joco
TABLE 61 CONT'O
CLASSIFICATION 1988/1989 1989/1990 1990/1991 1991/1992 1992/1993 1993/1994 1994/1995 1995/1996 1996/1997 1997/1998A. GENERAL SERVICESAdministration 17,199 20,122 24,051 28,797 30,073 29,532 30,927 27,152 28,830 37,175Justice 898 1,003 1,098 1,128 1,188 1,270 1,333 1,443 1,638 1,677Police 8,845 9,923 10,803 11,567 11,931 12,683 14,009 14,274 15,873 16,433Audit 396 440 443 511 537 547 579 586 680 778Pensions & Awards 6,292 6,687 7,703 8,223 8,744 9,236 9,500 9,320 10,639 10,350TOTAL GENERAL SERVICES 33,630 38,175 44,098 50,226 52,473 53,268 56,348 52,775 57,660 66,413B. SOCIAL & COMMUNITY SERVoEducation 17,592 19,642 22,084 24,020 25,440 26,771 28,350 27,991 31,033 34,082Health 13,103 15,274 17,513 19,322 20,013 21,376 23,263 25,163 26,923 29,423Community 3,854 4,191 4,394 1,919 2,097 2,129 2,333 2,233 2,531 2,727Welfare Services 1,855 2,017 1,878 1,950 1,972 1,996 2,217 2,305 2,448 2,368Local Government 1,259 1,311 1,450 1,484 1,673 1,721 1,727 1,618 1,705 1,770Youth & Sport 596 893 1,043 1,138 1,170 1,354 1,397 1,389 1,566 1,503TOTAL SOCIAL & COMM. SERVo 38,259 43,328 48,362 49,833 52,365 55,347 59,287 60,699 66,206 71,873C. ECONOMIC SERVICESAgriculture 6,139 7,274 6,076 6,673 6,667 6,765 7,475 6,978 7,419 8,108Fisheries Development 168 230 289 332 335 373 493 393 666 605Construction ... ... ... ... ... ... ... ... , ... . ..Transport & Comm. 8,936 10,424 12,728 13,886 13,571 14,960 15,954 15,211 16,722 17,946Other Economic Services ... ... 2,495 2,347 4,302 5,489 5,174 6,088 14,988 13,460TOTAL ECONOMIC SERVICES 15,243 17,928 21,588 23,238 24,875 27,587 29,096 28,670 39,795 40,119D. UNALLOCABLE ...Public Debt 12,024 11,597 13,132 17,824 20,799 21,692 23,247 25,391 35,745 29,994Salaries & Wages Review 4,109 209 8,173 ... ... 7,864 ... ... 2,138 ...TOTAL UNALLOCABLE 16,133 11,806 21,305 17,824 20,799 29,556 23,247 25,391 37,883 29,994TOTAL RECURRENT EXPEND 103,265 111,237 135,353 141,121 150,512 165,75.8 167,978 167,535 201,544 208,399
Source: Accountant General's Office & Government of Dominica EstimatesGovernment of Dominica 1994/95 and 1995/96 Estimates

TABLE 61. FUNCTIONAL CLASSIFICATION OF RECURRENT EXPENDITURE1978/79 . 1997/98
EC$'OOO
/-Io-.....J
CLASSIFICATION 1978/1979 1979/1980 1980/1981 1981/1982 1982/1983 1983/1984 1984/1985 1985/1987 1986/1987 1987/1988A. GENERAL SERVICESAdministration 8,028 6,441 12,184 9,413 11,040 11,894 12,683 12,874 12,456 18,685Justice 369 781 625 680 623 676 735 769 806 826Police 2,418 3,488 4,742 5,058 5,690 6,617 7,003 7,266 8,303 8,627Audit 123 172 215 211 260 322 304 309 367 402Pensions & Awards 1,687 1,638 2,833 3,258 4,332 4,284 5,008 4,949 5,514 5,814TOTAL GENERAL SERVICES 12,625 12,520 20,599 18,620 21,945 23,793 25,733 26,167 27,446 34.,354B. SOCIAL & COMMUNITY SERVoEducation 6,314 7,956 9,993 7,399 12,236 12,751 13,902 14,460 16,132 17,275Health 4,517 6,015 7,652 8,497 9,499 10,119 10,515 12,053 12,063 12,914Community 807 3,086 1,178 1,351 1,776 2,146 2,987 3,350 3,639 3,778Welfare Services 429 1,087 934 1,043 1,160 13 1,552 1,633 1,751 1,761Local Government 425 582 579 638 682 824 880 893 1,027 1,154Youth & Sport 172 85 220 254 269 498 560 489 559 575TOTAL SOCIAL & COMM. SERVo 12,664 18,811 20,556 19,182 25,622 26,351 30,396 32,878 , 35,171 37,457C. ECONOMIC SERVICESAgriculture 1,965 3,571 1,855 2,091 3,246 3,426 4,209 4,915 7,188 5,739Fisheries Development ... ... 74 84 1,799 110 108 118 107 10LConstruction 316 641 3,453 2,690 2,650 619 ....... ... ... . .
Transport & Comm. 1,946 4,372 495 519 523 5,119 7,155 6,193 8,237 8,681Other Economic Services 1,393 9,138 3,676 9,303 2,538 4,728 ... '" 1,516 1,349TOTAL ECONOMIC SERVICES 5,620 17,722 9,553 14,687 10,756 14,002 11,472 11,226 17,048 15,873D. UNALLOCABLEPublic Debt 2,332 2,699 5,955 5,041 7,677 9,050 9,873 10,135 8,985 13,809Salaries & Wages Review 179 193 5,914 6,609 ... .. , ... 3,202 ... 272TOTAL UNALLOCABLE 2,511 2,892 11,869 11,650 7,677 9,050 9,873 13,337 8,985 14,081TOTAL RECURRENT EXPEND 33,420 51,945 62,577 64,139 66,000 73,196 77,474 83,608 88,650 101,765

TABLE 62 CENTRAL GOVERNMENT REVENUE AND EXPENDITURE ANALYSED
BY RECURRENT AND CAPITAL ACCOUNTS AND SOURCES OF REVENUE1978/79 - 1997/98
EC$OOO
ACCOUNTS LOCAL DUTYREVENUE GRANTSFROM OVERSEAS '~'
LOANS TOTALTOTAL
EXPENDITURE
1978/1979
Recurrent
Capital
25,766.542.3
8,781.02,085.8 88.0
34,547.52,216.1
33,419.91,626.2
TOTAL 25,808.8 10,866.8 88.0 36,763.6 35,046.1
1979/1980f,)ccurref7l
C:Jpita/
32,289.619.2
26,809.54,548.3
1,226.1113.6
60,325.,24,681.1
51,945.110,311.0
ITOTAL 32,308.8 31,357.8 1,339.7 65,006.3 62,256.1
1980/1981Recurrent
~a;J/tal
~~.OT/\L
47,825.5 \24.8
47,850.3
2,405.716,901.619,307.3
4,642.64,642.6
50,231.221,569.071,800.2 ".
62,576.718,549.681,126.3
F\\; curren t
Capital56,743.2
59.5
1981/19822,246.6
10,027.8. ~
8,490.358,989.818,517.7
64,139.325,368.5
TOTAL 56,802.7 12,274.4 8,490.3 77,507.5 89,507.8
I 1982/1983I-~\)-fl-~~-Jr-re-n-t--., 57,625.9 970.7 58,596.6 66,000.0
\ \ ',iplt:J! 513.3 9,704.4 14,709.3 24,927.0 21,013.5
73,195.838,681.8
111,877.6
69,671.836,612.8
106,284.610,337.910,337.9
26,074.426,074.469,872.3
69,671.8
200.5ITOTAL
iI _O"_fA__L__----L 5_8_,1_3_9_.2---J..- l_0_,_6_75_._1...l..--__1_4_,7_0_9_._3..1....-__8_3_,_52_3_._6..&-- 87_,_0_1_3.--/5
I 1983/1984~------,-------y----------r-------.___-----,.----------fI ~~cC L~ rre 17 tI L Jpltal
109

TABLE 62~ CONT'OEC$OOO
REVENUE GRANTSLOANS TOTAL
TOTALACCOUNTS LOCAL DUTY
FROM OVERSEAS EXPENDITURE
198411985Recurrent 74,819.8 74,819.8 77,473.6
Capital 52.1 30,411.9 10,346.8 40,810.8 45,682.2
TOTAL 74,871.9 30,411.9 10,346.8 115,630.6 123,155.8
1985/1986,
Recurrent 84,396.9 84,396.9 83,608.1
Capital 68.1 39,678.8 6,896.7 46,643.6 48,811.4
TOTAL 84,465.0 39,678.8 6,896.7 131,040.5 132,419.5
1986-1987Recurrent 93,274.8 93,274.8 88,650.3Capital 2,037.0 4,751.8 5,415.8 12,204.6 13,670.5TOTAL 95,311.8 4,751.8 5,415.8 105,479.4 102,320.8
1987/1988
Recurrent 109,663.9 109,663.9 101,765.4Capital 18,031.6 7,935.3 15,172.7 41,139.6 31,547.7TOTAL 127,695.5 7,935.3 15,172.7 150,803.5 133,313.1
1988/1989Recurrent 120,805.9 120,805.9 103,264.6Capital 7,866.5 6,643.5 9,597.3 24,107.3 35,984.8TOTAL 128,672.4 6,643.5 9,597.3 144,913.2 139,249.4
1989/1990
Recurrent 122,878.7 122,878.7 111,236.5Capital 368.8 19,799.3 37,767.1 57,935.2 80,832.0TOTAL 123,247.5 19,799.3 37,767.1 180,813.9 192,068.5
1990/1991Recurrent 133,490.0 133,490.0 135,353.3Capital 1,342.6 12,241.1 25,687.7 39,271.4 56,862.3TOTAL 134,832.6 12,241.1 25,687.7 172,761.4 192,215.6
110
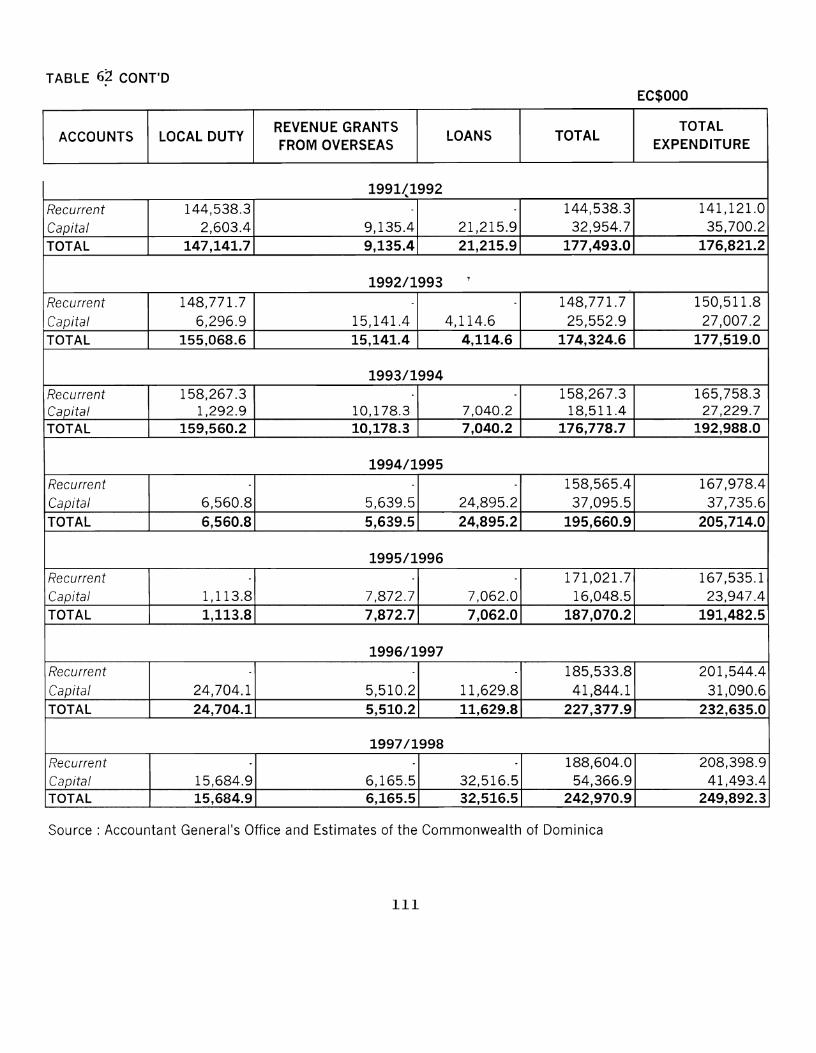
TABLE 6~ CONT'OEC$OOO
LOCAL DUTYREVENUE GRANTS
LOANS TOTALTOTAL
ACCOUNTSFROM OVERSEAS EXPENDITURE
1991~1992
Recurrent 144,538.3 144,538.3 141,121.0Capital 2,603.4 9,135.4 21,215.9 32,954.7 35,700.2TOTAL 147,141.7 9,135.4 21,215.9 177,493.0 176,821.2
1992/1993.,
Recurrent 148,771.7 148,771.7 150,511.8Capital 6,296.9 15,141.4 4,114.6 25,552.9 27,007.2TOTAL 155,068.6 15,141.4 4,114.6 174,324.6 177,519.0
1993/1994Recurrent 158,267.3 158,267.3 165,758.3Capital 1,292.9 10,178.3 7,040.2 18,511.4 27,229.7TOTAL 159,560.2 10,178.3 7,040.2 176,778.7 192,988.0
1994/1995Recurrent 158,565.4 167,978.4Capital 6,560.8 5,639.5 24,895.2 37,095.5 37,735.6TOTAL 6,560.8 5,639.5 24,895.2 195,660.9 205,714.0
1995/1996Recurrent 171,021.7 167,535.1Capital 1,113.8 7,872.7 7,062.0 16,048.5 23,947.4TOTAL 1,113.8 7,872.7 7,062.0 187,070.2 191,482.5
1996/1997Recurrent 185,533.8 201,544.4Capital 24,704.1 5,510.2 11,629.8 41,844.1 31,090.6TOTAL 24,704.1 5,510.2 11,629.8 227,377.9 232,635.0
1997/1998Recurrent 188,604.0 208,398.9Capital 15,684.9 6,165.5 32,516.5 54,366.9 41,493.4TOTAL 15,684.9 6,165.5 32,516.5 242,970.9 249,892.3
Source: Accountant General's Office and Estimates of the Commonwealth of Dominica
III


SECTION IX BANKING
Commercial Banks total liabilities moved from $126.8 m, in 1981 to $727.5m, in 1998.
Savings Deposits recording $50.1 m, in 1981 increased to $299.8m in 1998 reflecting,
39.5% and 41 % (respectively) of commercial bank liabilities (Table 63).
Loans and Advances accounted for 57.1 % of commercial banks assets in 1980 iny
comparison to 70.2% in 1998. Total loans granted recorded $109.5m, in 1984 with
loans to Private Individuals and to Business Firms accounting for 42.7% and 31.5%
respectively. Fifteen years later in (1998) total loans granted recorded $510.8m in 1998
with Loans to Individuals and Business Firms registering 42.1 % and 38.2% respectively
(Table 65).
Interest Rates on savings increased by 500/0 on the minimum and 83.3% on the
maximum rate over the last fifteen years, moving from a 2.00 - 3.000/0 interest rate in
1981 to a 4.00 - 5.50% in 1998.
Lending Rates also increased by 18.75 on the lo\vest rates and 39.3% on the highest
rate over the same period, moving from an average lending rate of 8.00 - 14.00% in
1981 to 9.50 -19.50% in'1998 (Table 67).
Conversely, interest on time deposits recorded reduction in rates. In 1984 Deposits of
3 -6 months received a 4.50 to 5.50 interest rate. This rate declined steadily over the
years until reaching a fixed rate of 1.50 - 4.00 since 1995. Interest rates on Deposits of
12 months and over also declined from 4.00 - 6.00% in 1981 to 2.00 - 5.50 in 1998.
The number of Credit Unions decreased from 25 in 1998 to 21 in 1998. However
membership increased by 40,498 over the last 20 years, an average of 2025, additional
members per year. From a Share Capital of $5.7 m, in 1978, Credit Unions recorded
$105.4m (in share capital) in 1998.
112
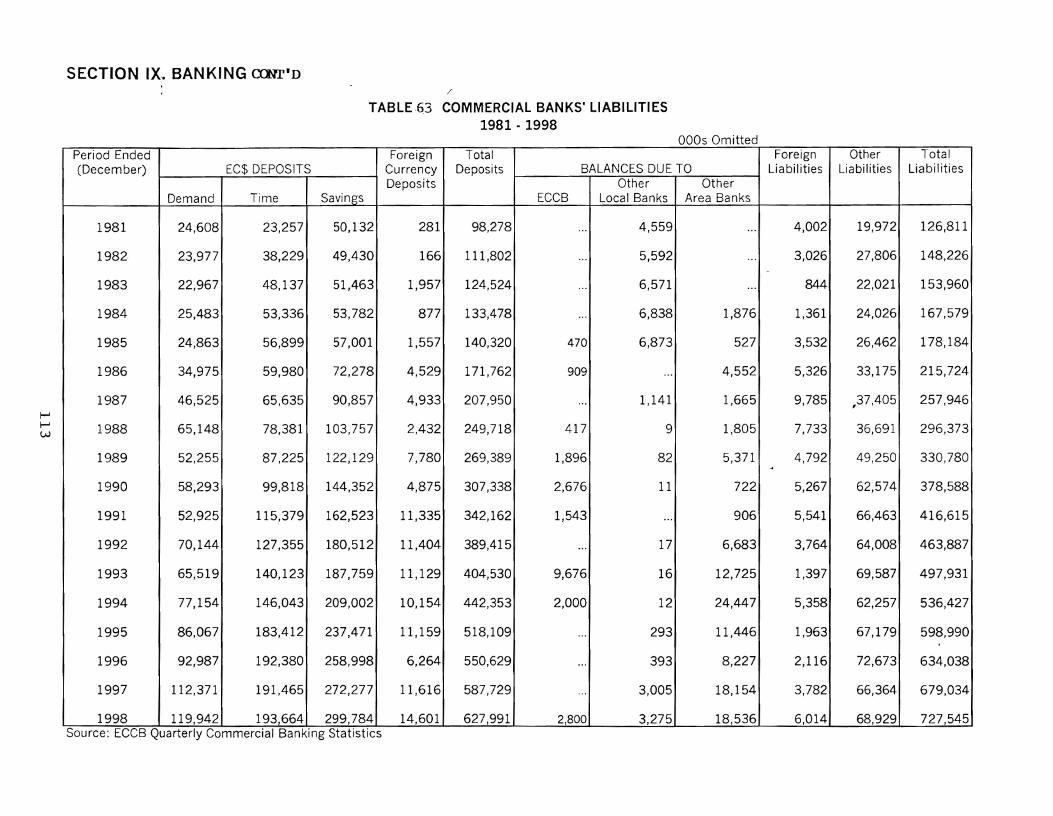
SECTION IX.. BANKING aBr'DI'
TABLE·G3 COMMERCIAL BANKS' LIABILITIES1981 - 1998
OOOs Omitted
~
f-JW
Period Ended Foreign Total Foreign Other Total(December) EC$ DEPOSITS Currency Deposits BALANCES DUE TO Liabilities Liabilities Liabilities
Deposits Other OtherDemand Time Savings ECCB Local Banks Area Banks
1981 24,608 23,257 50,132 281 98,278 ... 4,559 ... 4,002 19,972 126,811
1982, 23,977 38,229 49,430 166 111,802 ... 5,592 ... 3,026 27,806 148,226
1983 22,967 48,137 51,463 1,957 124,524 ... 6,571 ... 844 22,021 153,960
1984 25,483 53,336 53,782 877 133,478 ... 6,838 1,876 1,361 24,026 167,579
1985 24,863 56,899 57,001 1,557 140,320 470 6,873 527 3,532 26,462 178,184
1986 34,975 59,980 72,278 4,529 171,762 909 ... 4,552 5,326 33,175 215,724
1987 46,525 65,635 90,857 4,933 207,950 ... 1,141 1,665 9,785 ,37,405 257,946
1988 65,148 78,381 103,757 2,432 249,718 417 9 1,805 7,733 36,691 296,373
1989 52,255 87,225 122,129 7,780 269,389 1,896 82 5,371 4,792 49,250 330,780~
1990 58,293 99,818 144,352 4,875 307,338 2,676 11 722 5,267 62,574 378,588
1991 52,925 115~379 162,523 11,335 342,162 1,543 ... 906 5,541 66,463 416,615
1992 70,144 127,355 180,512 11,404 389,415 ... 17 6,683 3,764 64,008 463,887
1993 65,519 140,123 187,759 11,129 404,530 9,676 16 12,725 1,397 69,587 497,931
1994 77,154 146,043 209,002 10,154 442,353 2,000 12 24,447 5,358 62,257 536,427
1995 86,067 183,412 237,471 11,159 518,109 ... 293 11,446 1,963 67,179 598,990
1996 92,987 192,380 258,998 6,264 550,629 ... 393 8,227 2,116 72,673 634,038
1997 112,371 191,465 272,277 11,616 587,729 ... 3,005 18,154 3,782 66,364 679,034
1998 119,942 193,664 299,784 14,601 627,991 2,800 3,275 18,536 6,014 68,929 727,545Source: ECCB Quarterly Commercial Banking StatistiCS

~
~
~
TABLE 64 COMMERCIAL BANKS' ASSETS1980-1998
Period EndedCLAIMS ON CENTRAL BANK Loans INVESTMENT Foreign Other
(December) Cash DepositsStatutory Other Local Other ECCB and Treasury Government Assets Assets
Tota I Assets
Res.& Dep * Banks Area Banks Advances Bills Securities
1980 2,679 10,170 ... 4,619 3,160 68,492 394 6,845 8,932 14,595 119,886
1981 2,355 2,285 ... 4,631 2,869 80,638 394 8,721 12,134 12,784 126,811
1982 3,297 7,410 ... 6,067 2,884 83,653 394 17,669 14,858 11,994 148,226
1983 3,158 1,033 ... 7,382 6,334 96,277 394 11,548 13,998 13,836 153,960
1984 4,169 11,873 ... 8,313 1,160 109,474 394 2,150 10,711 19,335 167,579
1985 5,001 12,807 ... 8,368 2,491 118,633 394 1,918 12,498 16,074 178,184
1986 4,491 34,816 8,822 1,211 11,860 115,735 394 1,340 26,893 10,162 215,724
1987 5,429 28,677 12,356 2,847 15,650 109,776 1,870 2,440 57,906 20,995 257,946,1988 6,392 7,988 14,807 1,543 19,741 143,477 1,870 2,440 80,727 17,388 296,373
1989 6,749 8,455 14,684 1,752 7,934 190,136 5,270 2,440 75,431 17,929 330,780...
1990 7,996 11,804 18,437 2,333 7,341 250,736 1,870 9,440 51,282 17,349 378,588
1991 8,034 13,384 20,234 5,188 6,587 291,152 3,051 9,440 48,220 11,325 416,615
1992 5,821 13,003 22,853 2,262 7,845 317,343 9,841 10,640 58,004 16,275 463,887
1993 10,950 7,464 24,366 2,200 2,752 365,865 11,317 10,640 43,839 18,538 497,931
1994 9,934 23,527 ... 1,470 5,201 405,689 11,814 10,640 46,784 21,368 536,427
1995 11,853 34,005 ... 17 8,654 445,274 11,814 9,720 51,503 26,150 598,990
1996 13,652 32,867 ... 35 9,472 450,006 11,814 9,720 81,262 25,210 634,038
1997 13,897 31,030 ... 3,017 9,892 486,463 14,005 9,720 92,321 18,689 679,034
1998 11,373 44,785 ... 3,081 977 510,766 14,005 10,220 123,068 9,270 727,545
Source: ECCS Quarterly Commercial Banking Statistics & ECCB 1998 Statistical DigestNote: * From 1994 onwards Claims on Central Bank Deposits includes Statutory Reserves & Deposits
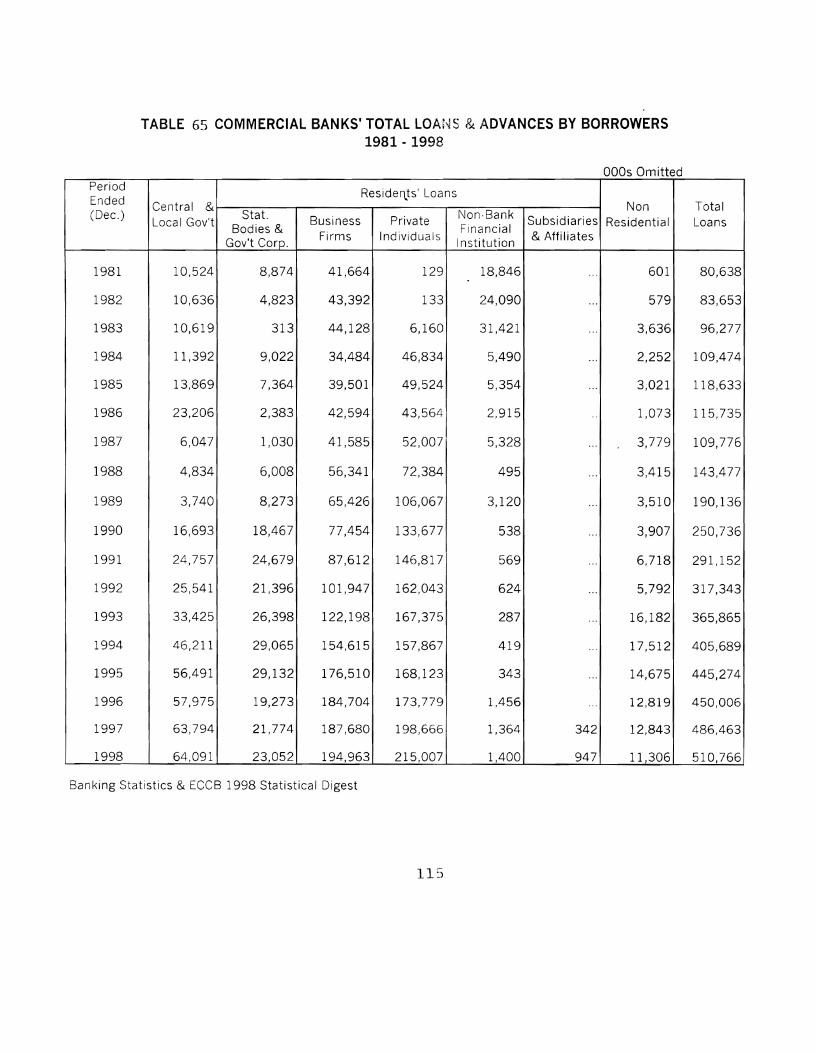
TABLE 65 COMMERCIAL BANKS' TOTAL LOAj,JS (~ ADVANCES BY BORROWERS1981 - 1998
OOOs On1ittedPeriod
Residel1.ts' LoansEnded Central &
Stat. Non-BankNon Total
(Dec.)Local Gov't Business Private Subsidiaries Residential Loans
Bodies &Firms Individuals
Financial& Affi Iiates
Gov't Corp. Institution
1981 10,524 8,874 41,664 129 18,846 ... 601 80,638
1982 10,636 4,823 43,392 133 24,090 ... 579 83,653
1983 10,619 313 44,128 6,160 31,421 '" 3,636 96,277
1984 11,392 9,022 34,484 46,834 5,490 ... 2,252 109,474
1985 13,869 7,364 39,501 49,524 5,354 ... 3,021 118,633
1986 23,206 2,383 42,594 43,564 2,915 .. 1,073 115,735
1987 6,047 1,030 41,585 52,007 5,328 ... 3,779 109,776
1988 4,834 6,008 56,341 72,384 495 .,. 3,415 143,477
1989 3,740 8,273 65,426 106,067 3,120 ... 3,510 190,136
1990 16,693 18,467 77,454 133,677 538 '" 3,907 250,736
1991 24,757 24,679 87,612 146,817 569 ... 6,718 291,152
1992 25,541 21,396 101,947 162,043 624 '" 5,792 317,343
1993 33,425 26,398 122,198 167,375 287 ... 16,182 365,865
1994 46,211 29,065 154,615 157,867 419 ... 17,512 405,689
1995 56,491 29,132 176,510 168,123 343 ... 14,675 445,274
1996 57,975 19,273 184,704 173,779 1,456 ... 12,819 450,006
1997 63,794 21,774 187,680 198,666 1,364 342 12,843 486,463
1998 64,091 23,052 194,963 215,007 1,400 947 11,306 510,766
Banking Statistics & ECCB 1998 Statistical Digest
115
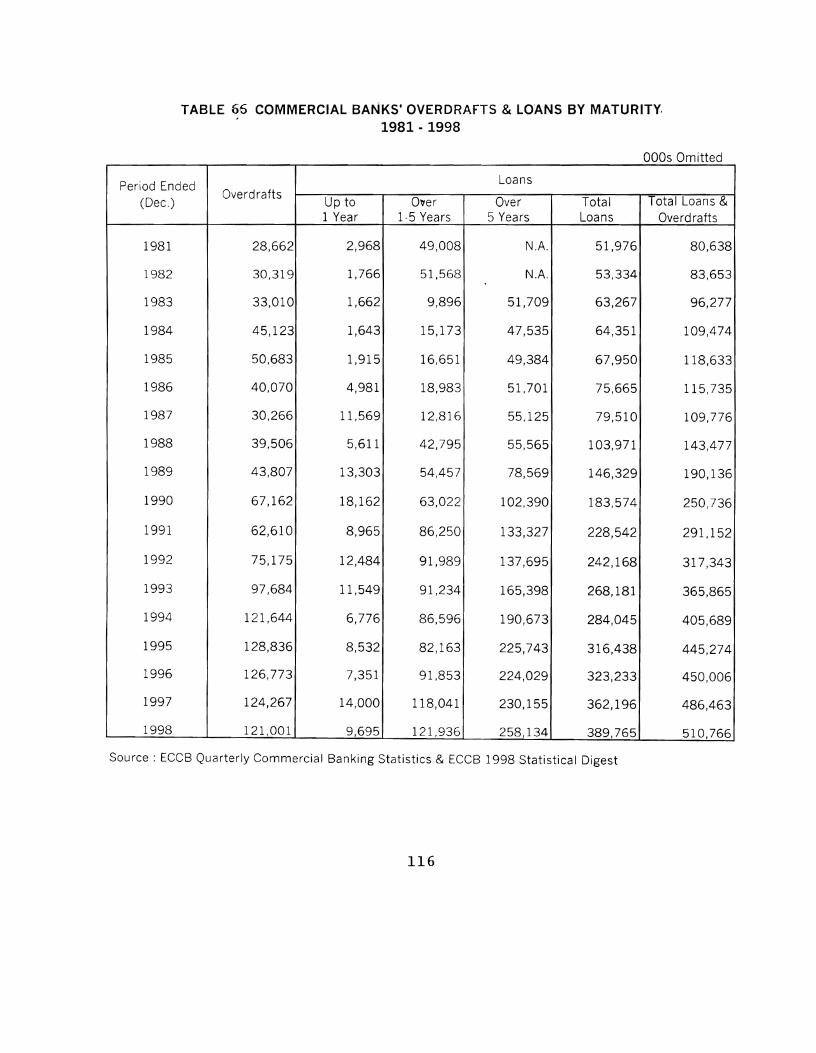
TABLE 66 COMMERCIAL BANKS' OVERDRAFTS & LO'ANS BY MATURITY,, 1981 · 1998
ODDs Omitted
Period EndedLoans
(Dec.)Overd rafts
Up to Ol1er Over Total Total Loans &1 Year 1·5 Years 5 Years Loans Overdrafts
1981 28,662 2,968 49,008 N.A. 51,976 80,638
1982 30,319 1,766 51,568 N.A. 53,334 83,653
1983 33,010 1,662 9,896 51,709 63,267 96,277
1984 45,123 1,643 15,173 47,535 64,351 109,474
1985 50,683 1,915 16,651 49,384 67,950 118,633
1986 40,070 4,981 18,983 51,701 75,665 115,735
1987 30,266 11,569 12,816 55,125 79,510 109,776
1988 39,506 5,611 42,795 55,565 103,971 143,477
1989 43,807 13,303 54,457 78,569 146,329 190,136
1990 67,162 18,162 63,022 102,390 183,574 250,736
1991 62,610 8,965 86,250 133,327 228,542 291,152
1992 75,175 12,484 91,989 137,695 242,168 317,343
1993 97,684 11,549 91,234 165,398 268,181 365,865
1994 121,644 6,776 86,596 190,673 284,045 405,689
1995 128,836 8,532 82,163 225,743 316,438 445,274
1996 126,773 7,351 91,853 224,029 323,233 450,006
1997 124,267 14,000 118,041 230,155 362,196 486,463
1998 121,001 9,695 121,936 258,134 389,765 510,766
Source: ECCB Quarterly Commercial Banking Statistics & ECCB 1998 Statistical Digest
116

TABLE 67 COMMERCIAL BANKS' SELECTED INTEREST RATES1981 · 1998
DEPOSITS"
Other Prime LendingPeriod Ended TIME(Dec.) Savings Lending Rates
Three Six TwelveMonths Months Months
1981 2.00-3.00 4.00-5.00 ... 4.00-6.00 8.00-9.00 8.00-14.00
1982 2.00-3.00 4.00-5.00 .. , 6.00-6.00 8.50-9.50 8.50-14.50
1983 2.50-3.00 5.00-5.00 ... 5.50-6.00 8.50-9.50 8.50-14.00
1984 4.00-4.00 4.50-5.00 5.00-5.50 5.50-6.00 9.00-10.00 9.00-15.00
1985 4.00-4.00 4.50-5.00 5.00-5.50 5.50-6.00 9.00-10.50 9.00-15.00
1986 4.00--4.00 3.50-5.00 3.50-5.50 4.00-6.00 9.00-10.50 9.00-15.00
1987 4.00-4.00 3.50-5.00 3.50-5.50 3.50-6.00 9.00-10.50 5.00-15.00
1988 4.00-4.00 3.50-5.00 3.50-5.50 3.50-6.00 9.00-10.50 5.00-15.00
1989 4.00-5.00 3.00-4.50 3.50-4.00 3.50-6.00 9.00-10.50 5.00-15.00
1990 3.50-6.50 3.00-4.00 3.50-5.00 3.50-8.00 9.00-10.50 8.00-15.00
1991 4.00-6.50 3.00-4.50 3.25-4.50 3.50-7.00 9.00-10.00 8.00-15.00
1992 3.50-5.00 2.00-4.00 2.00-4.50 2.50-6.00 9.00-10.00 5.00-15.50
1993 4.00-5.00 1.50-4.00 1.50-4.50 2.00-6.00 9.00-10.00 8.00-15.50
1994 4.00-5.50 1.50-4.00 1.50-5.00 2.00-5.50 9.00-10.00 8.00-15.50
1995 4.00-5.50 1.50-4.00 1.50-4.00 2.00-5.50 9.00-10.50 9.00-15.50
1996 4.00-5.50 1.50-4.00 1.500-4.0 2.00-5.50 9.00-10.50 9.00-15.50
1997 4.00-5.50 1.50-4.00 1.50-4.00 2.00-5.50 9.00-10.50 9.00-15.50
1998 4.00-5.50 1.50-4.00 1.50-4.00 2.00-5.50 9.50-10.50 9.50-19.50
Source: ECCS Quarterly Commercial Banking Statistics & ECCB 1998 Statistical Digest
117
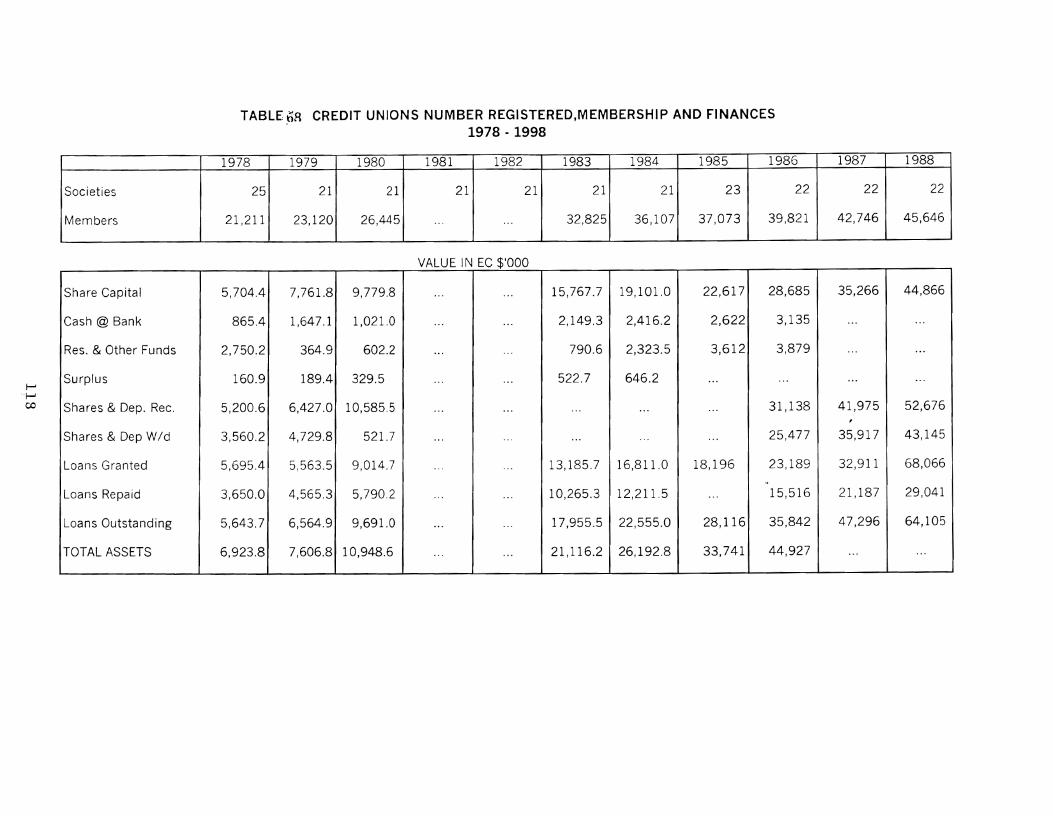
~"~
co
TABLE,ti'R CREDIT UNIONS NUMBER REGISTERED,MEMBERSHIP AND FINANCES1978 - 1998
1978 1979 1980 1981 1982 1983 1984 1985 1986 1987 1988
Societies 25 21 21 21 21 21 21 23 22 22 22
Members 21,211 23,120 26,445 .,. ... 32,825 36,107 37,073 39,821 42,746 45,646
VALUE IN EC $'000
Share Capital 5,704.4 7,761.8 9,779.8 ... .., 15,767.7 19,101.0 22,617 28,685 35,266 44,866
Cash @ Bank 865.4 1,647.1 1,021.0 ... .,. 2,149.3 2,416.2 2,622 3,135 ... ...
Res. & Other Funds 2,750.2 364.9 602.2 ... ... 790.6 2,323.5 3,612 3,879 ... ...
Surplus 160.9 189.4 329.5 ... ... 522.7 646.2 ... ... ... ...
Shares & Dep. Rec. 5,200.6 6,427.0 10,585.5 ... ... ... ... ... 31,138 41,975 52,676,
Shares & Dep Wid 3,560.2 4,729.8 521.7 ... ... ... '" ... 25,477 35,917 43,145
Loans Granted 5,695.4 5,563.5 9,014.7 .,.'" 13,185.7 16,811.0 18,196 23,189 32,911 68,066
..Loans Repaid 3,650.0 4,565.3 5,790.2 ... . .. 10,265.3 12,211.5 ... 15,516 21,187 29,041
Loans Outstanding 5,643.7 6,564.9 9,691.0 ... ... 17,955.5 22,555.0 28,116 35,842 47,296 64,105
TOTAL ASSETS 6,923.8 7,606.8 10,948.6 ... ... 21,116.2 26,192.8 33,741 44,927 ... ...
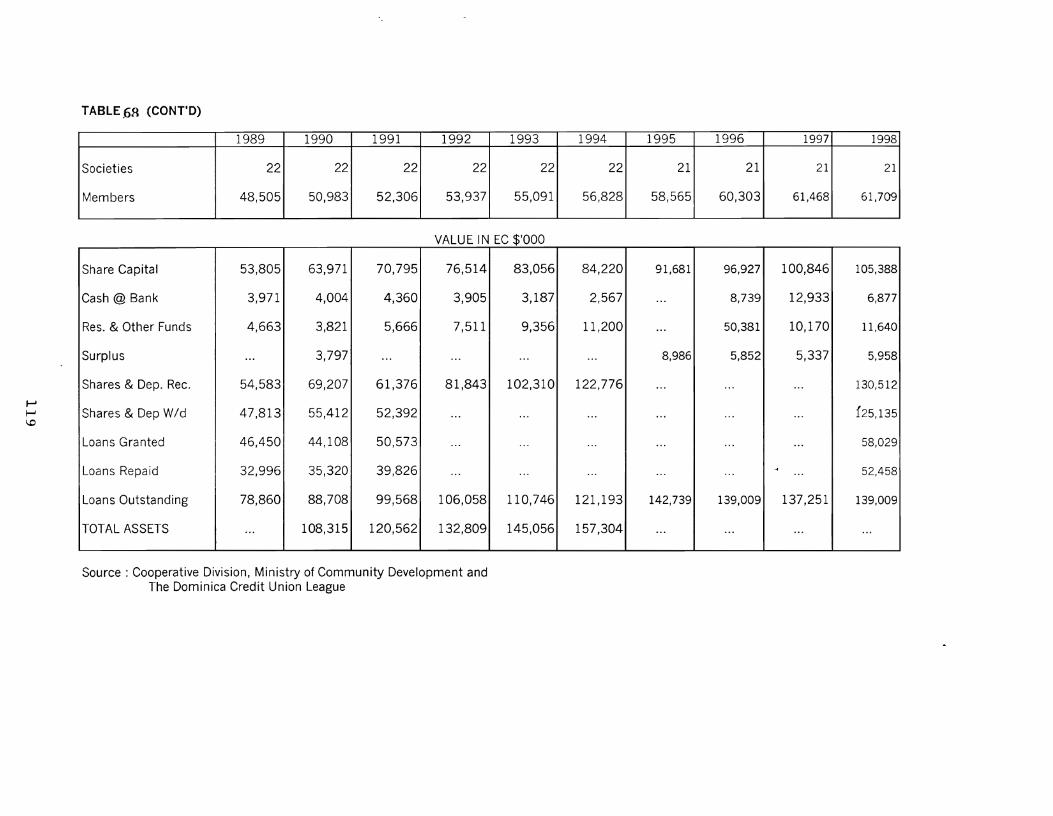
t-'I---J\.0
TABLE 6R (CONT'D)
1989 1990 1991 1992 1993 1994 1995 1996 1997 1998
Societies 22 22 22 22 22 22 21 21 21 21
Members 48,505 50,983 52,306 53,937 55,091 56,828 58,565 60,303 61,468 61,709
VALUE IN EC $'000
Share Capital 53,805 63,971 70,795 76,514 83,056 84,220 91,681 96,927 100,846 105,388
Cash @ Bank 3,971 4,004 4,360 3,905 3,187 2,567 ... 8,739 12,933 6,877
Res. & Other Funds 4,663 3,821 5,666 7,511 9,356 11,200 ... 50,381 10,170 11,640
Surplus ... 3,797 ... ... ... ... 8,986 5,852 5,337 5,958
Shares & Dep. Rec. 54,583 69,207 61,376 81,843 102,310 122,776 ... ... ... 130,512
Shares & Dep Wid 47,813 55,412 52,392 ... ... ... ... ... ... 125,135
Loans Granted 46,450 44,108 50,573 ... ... ... ... ... ... 58,029
Loans Repaid 32,996 35,320 39,826 ... 52,458.. , ... ... ... ". ...
Loans Outstanding 78,860 88,708 99,568 106,058 110,746 121,193 142,739 139,009 137,251 139,009
TOTAL ASSETS ... 108,315 120,562 132,809 145,056 157,304 ... ... ... ...
Source: Cooperative Division, Ministry of Community Development andThe Dominica Credit Union League


SECTION X NATIONAL ACCOUNTS AND BALANCE OF PAYMENTS.
Gross Domestic Product (based on 1990 current prices) moved from $283.63m, in 1987
to $S57.08m in 1997. In 1987, the Agricultural Sector recorded $84.46m accounting for
30.0% of the Gross Domestic Product In 1997 however, that sector recorded
$114.00 m, representing a lower percentage, 20.5.
From 1987 to 1997, two sectors, the Hotel and Restaurant (which controls the Tourism
Sector) and the Construction sector revealed significant increases in activity. The Hotel
and Restaurant Sector moved from $3.81, in 1987 to $14.5m, in 1997; the Construction
Sector contributing $14.42m in 1987 increased to $50.91 m, in 1997. (Table 69).
The highest economic growth, 7.38% was recorded in 1988. This peak was mainly
attributed to the sharp increases in activity in the Construction, Banking and
Insurance, Communications and Mining and Quarry sectors. However a slump, - 1.12
was registered in the following year. This trough was mainly influenced by a decline in
the Agricultural Sector. Over the last seven years (1991 - 1997), the average annual
growth has been recorded as 2.20/0. (Table 70).
Dominica's Extemal Account recorded an $18.58m deficit in the Current Account in
1987. The larger deficit of $102.72m in 1997 was relative to the increase in both credit
and debit flows.
The credit and debit flows of 1997 reflected an amount twice that of 1987. The largest
deficit, $122.88m, in the Current Account was recorded in 1989.
.-120
The net flow in the Financial Account moved from $43.65m in 1987 to $1 00.53m, in
1997. The highest net flow, $165.85m, was registered in 1995 with Direct Investment
accounting for 88.00/0 of the Net Capital & Financial Account
121
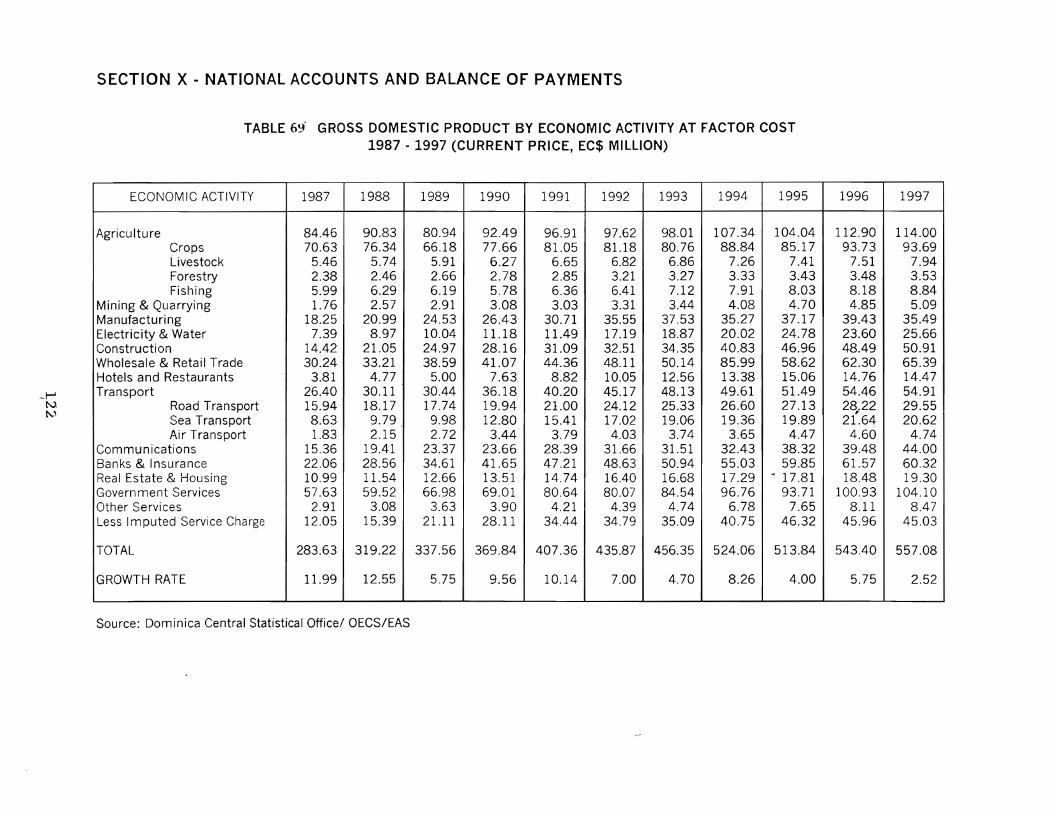
_. t--Jf\.),
t\.-'
SECTION X - NATIONAL ACCOUNTS AND BALANCE OF PAYMENTS
TABLE 69' GROSS DOMESTIC PRODUCT BY ECONOMIC ACTIVITY AT FACTOR COST1987 - 1997 (CURRENT PRICE, EC$ MILLION)
ECONOMIC ACTIVITY 1987 1988 1989 1990 1991 1992 1993 1994 1995 1996 1997
Agricu Itu re 84.46 90.83 80.94 92.49 96.91 97.62 98.01 107.34 104.04 112.90 114.00Crops 70.63 76.34 66.18 77.66 81.05 81.18 80.76 88.84 85.17 93.73 93.69Livestock 5.46 5.74 5.91 6.27 6.65 6.82 6.86 7.26 7.41 7.51 7.94Forestry 2.38 2.46 2.66 2.78 2.85 3.21 3.27 3.33 3.43 3.48 3.53Fishing 5.99 6.29 6.19 5.78 6.36 6.41 7.12 7.91 8.03 8.18 8.84
Mining & Quarrying 1.76 2.57 2.91 3.08 3.03 3.31 3.44 4.08 4.70 4.85 5.09Manufacturing 18.25 20.99 24.53 26.43 30.71 35.55 37.53 35.27 37.17 39.43 35.49Electricity & Water 7.39 8.97 10.04 11.18 11.49 17.19 18.87 20.02 24.78 23.60 25.66Construction 14.42 21.05 24.97 28.16 31.09 32.51 34.35 40.83 46.96 48.49 50.91Wholesale & Retail Trade 30.24 33.21 38.59 41.07 44.36 48.11 50.14 85.99 58.62 62.30 65.39Hotels and Restaurants 3.81 4.77 5.00 7.63 8.82 10.05 12.56 13.38 15.06 14.76 14.47Transport 26.40 30.11 30.44 36.18 40.20 45.17 48.13 49.61 51.49 54.46 54.91
Road Transport 15.94 18.17 17.74 19.94 21.00 24.12 25.33 26.60 27.13 28.22 29.55,Sea Transport 8.63 9.79 9.98 12.80 15.41 17.02 19.06 19.36 19.89 21.64 20.62Air Transport 1.83 2.15 2.72 3.44 3.79 4.03 3.74 3.65 4.47 4.60 4.74
Communications 15.36 19.41 23.37 23.66 28.39 31.66 31.51 32.43 38.32 39.48 44.00Banks & Insurance 22.06 28.56 34.61 41.65 47.21 48.63 50.94 55.03 59.85 61.57 60.32Real Estate & Housing 10.99 11.54 12.66 13.51 14.74 16.40 16.68 17.29 >4 17.81 18.48 19.30Government Services 57.63 59.52 66.98 69.01 80.64 80.07 84.54 96.76 93.71 100.93 104.10Other Services 2.91 3.08 3.63 3.90 4.21 4.39 4.74 6.78 7.65 8.11 8.47Less Imputed Service Charge 12.05 15.39 21.11 28.11 34.44 34.79 35.09 40.75 46.32 45.96 45.03
TOTAL 283.63 319.22 337.56 369.84 407.36 435.87 456.35 524.06 513.84 543.40 557.08
GROWTH RATE 11.99 12.55 5.75 9.56 10.14 7.00 4.70 8.26 4.00 5.75 2.52
Source: Dominica Central Statistical Office/ OECS/EAS
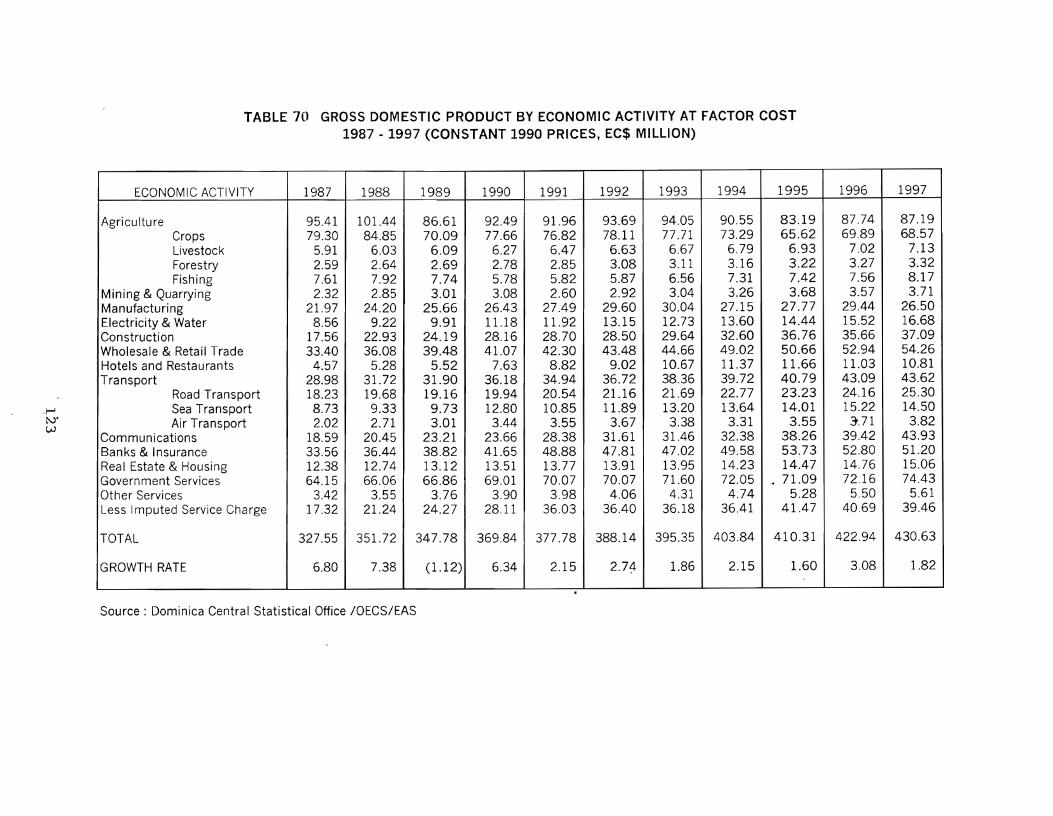
-1-1N 4I
W
TABLE 70 GROSS DOMESTIC PRODUCT BY ECONOMIC ACTIVITY AT FACTOR COST1987 - 1997 (CONSTANT 1990 PRICES, EC$ MILLION)
ECONOMIC ACTIVITY 1987 1988 1989 1990 1991 1992 1993 1994 1995 1996 1997
Agriculture 95.41 101.44 86.61 92.49 91.96 93.69 94.05 90.55 83.19 87.74 87.19Crops 79.30 84.85 70.09 77.66 76.82 78.11 77.71 73.29 65.62 69.89 68.57Livestock 5.91 6.03 6.09 6.27 6.47 6.63 6.67 6.79 6.93 7.02 7.13Forestry 2.59 2.64 2.69 2.78 2.85 3.08 3.11 3.16 3.22 3.27 3.32Fishing 7.61 7.92 7.74 5.78 5.82 5.87 6.56 7.31 7.42 7.56 8.17
Mining & Quarrying 2.32 2.85 3.01 3.08 2.60 2.92 3.04 3.26 3.68 3.57 3.71Manufacturing 21.97 24.20 25.66 26.43 27.49 29.60 30.04 27.15 27.77 29.44 26.50Electricity & Water 8.56 9.22 9.91 11.18 11.92 13.15 12.73 13.60 14.44 15.52 16.68Construction 17.56 22.93 24.19 28.16 28.70 28.50 29.64 32.60 36.76 35.66 37.09Wholesale & Retail Trade 33.40 36.08 39.48 41.07 42.30 43.48 44.66 49.02 50.66 52.94 54.26Hotels and Restaurants 4.57 5.28 5.52 7.63 8.82 9.02 10.67 11.37 11.66 11.03 10.81Transport 28.98 31.72 31.90 36.18 34.94 36.72 38.36 39.72 40.79 43.09 43.62
Road Transport 18.23 19.68 19.16 19.94 20.54 21.16 21.69 22.77 23.23 24.16 25.30Sea Transport 8.73 9.33 9.73 12.80 10.85 11.89 13.20 13.64 14.01 15.22 14.50Air Transport 2.02 2.71 3.01 3.44 3.55 3.67 3.38 3.31 3.55 3'.71 3.82
Communications 18.59 20.45 23.21 23.66 28.38 31.61 31.46 32.38 38.26 39.42 43.93Banks & Insurance 33.56 36.44 38.82 41.65 48.88 47.81 47.02 49.58 53.73 52.80 51.20Real Estate & Housing 12.38 12.74 13.12 13.51 13.77 13.91 13.95 14.23 14.47 14.76 15.06Government Services 64.15 66.06 66.86 69.01 70.07 70.07 71.60 72.05 -4 71.09 72.16 74.43Other Services 3.42 3.55 3.76 3.90 3.98 4.06 4.31 4.74 5.28 5.50 5.61Less Imputed Service Charge 17.32 21.24 24.27 28.11 36.03 36.40 36.18 36.41 41.47 40.69 39.46
TOTAL 327.55 351.72 347.78 369.84 377.78 388.14 395.35 403.84 410.31 422.94 430.63
GRO\VTH RATE 6.80 7.38 (1.12) 6.34 2.15 2.74 1.86 2.15 1.60 3.08 1.82
Source: Dominica Central Statistical Office IOECS/EAS
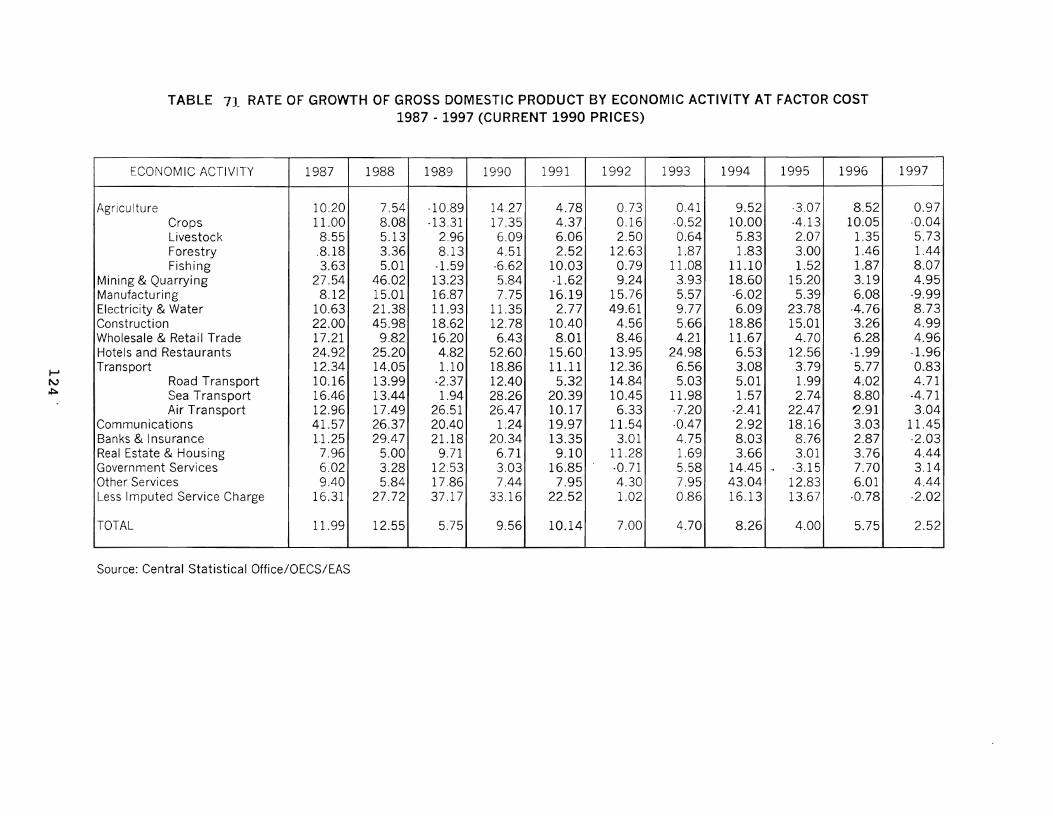
t--'~
~
TABLE 71 RATE OF GROWTH OF GROSS DOMESTIC PRODUCT BY ECONOMIC ACTIVITY AT FACTOR COST1987 - 1997 (CURRENT 1990 PRICES)
ECONOMIC ACTIVITY 1987 1988 1989 1990 1991 1992 1993 1994 1995 1996 1997
Agriculture 10.20 7.54 -10.89 14.27 4.78 0.73 0.41 9.52 -3.07 8.52 0.97Crops 11.00 8.08 -13.31 17.35 4.37 0.16 -0.52 10.00 -4.13 10.05 -0.04Livestock 8.55 5.13 2.96 6.09 6.06 2.50 0.64 5.83 2.07 1.35 5.73Forestry .8.18 3.36 8.13 4.51 2.52 12.63 1.87 1.83 3.00 1.46 1.44Fishing 3.63 5.01 -1.59 ·6.62 10.03 0.79 11.08 11.10 1.52 1.87 8.07
Mining & Quarrying 27.54 46.02 13.23 5.84 -1.62 9.24 3.93 18.60 15.20 3.19 4.95Manufacturing 8.12 15.01 16.87 7.75 16.19 15.76 5.57 -6.02 5.39 6.08 -9.99Electricity & Water 10.63 21.38 11.93 11.35 2.77 49.61 9.77 6.09 23.78 -4.76 8.73Construction 22.00 45.98 18.62 12.78 10.40 4.56 5.66 18.86 15.01 3.26 4.99Wholesale & Retail Trade 17.21 9.82 16.20 6.43 8.01 8.46 4.21 11.67 4.70 6.28 4.96Hotels and Restaurants 24.92 25.20 4.82 52.60 15.60 13.95 24.98 6.53 12.56 -1.99 -1.96Transport 12.34 14.05 1.10 18.86 11.11 12.36 6.56 3.08 3.79 5.77 0.83
Road Transport 10.16 13.99 -2.37 12.40 5.32 14.84 5.03 5.01 1.99 4.02 4.71Sea Transport 16.46 13.44 1.94 28.26 20.39 10.45 11.98 1.57 2.74 8.80 -4.71Air Transport 12.96 17.49 26.51 26.47 10.17 6.33 -7.20 -2.41 22.47 ~.91 3.04
Communications 41.57 26.37 20.40 1.24 19.97 11.54 -0.47 2.92 18.16 3.03 11.45Banks & Insurance 1.1.25 29.47 21.18 20.34 13.35 3.01 4.75 8.03 8.76 2.87 -2.03Real Estate & Housing 7.96 5.00 9.71 6.71 9.10 11.28 1.69 3.66 3.01 3.76 4.44Government Services 6.02 3.28 12.53 3.03 16.85 . -0.71 5.58 14.45 -4 -3.15 7.70 3.14Other Services 9.40 5.84 17.86 7.44 7.95 4.30 7.95 43.04 12.83 6.01 4.44Less Imputed Service Charge 16.31 27.72 37.17 33.16 22.52 1.02 0.86 16.13 13.67 -0.78 -2.02
TOTAL 11.99 12.55 5.75 9.56 10.14 7.00 4.70 8.26 4.00 5.75 2.52
Source: Central Statistical Office/OECS/EAS
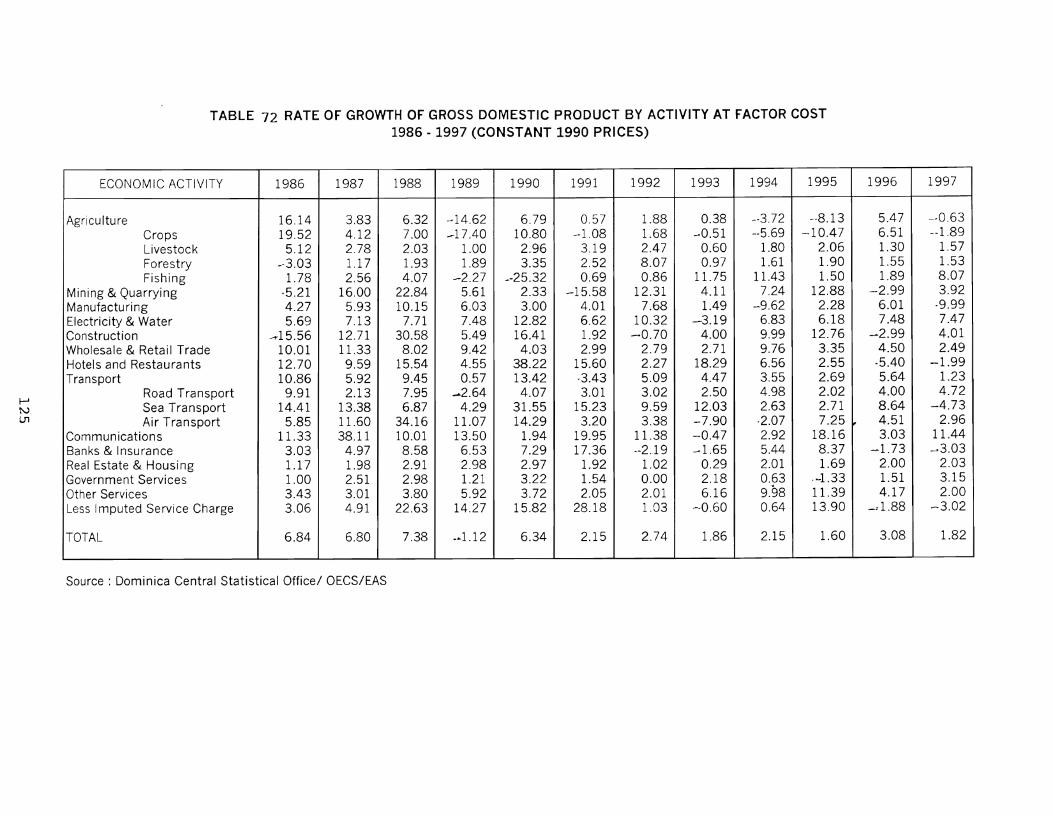
t-Jt\..)
U'1
TABLE 72 RATE OF GROWTH OF GROSS DOMESTIC PRODUCT BY ACTIVITY AT FACTOR COST1986 - 1997 (CONSTANT 1990 PRICES)
ECONOMIC ACTIVITY 1986 1987 1988 1989 1990 1991 1992 1993 1994 1995 1996 1997
Agricu Iture 16.14 3.83 6.32 -14.62 6.79 0.57 1.88 0.38 --3.72 --8.13 5.47 --0.63Crops 19.52 4.12 7.00 -17.40 10.80 --1.08 1.68 ---0.51 --5.69 -10.47 6.51 --1.89Livestock 5.12 2.78 2.03 1.00 2.96 3.19 2.47 0.60 1.80 2.06 1.30 1.57Forestry --3.03 1.17 1.93 1.89 3.35 2.52 8.07 0.97 1.61 1.90 1.55 1.53Fishing 1.78 2.56 4.07 -2.27 ~-25.32 0.69 0.86 11.75 11.43 1.50 1.89 8.07
Mining & Quarrying -5.21 16.00 22.84 5.61 2.33 -15.58 12.31 4.11 7.24 12.88 -2.99 3.92Manufacturing 4.27 5.93 10.15 6.03 3.00 4.01 7.68 1.49 -9.62 2.28 6.01 -9.99Electricity & Water 5.69 7.13 7.71 7.48 12.82 6.62 10.32 -3.19 6.83 6.18 7.48 7.47Construction .,.,.15.56 12.71 30.58 5.49 16.41 1.92 -0.70 4.00 9.99 12.76 -2.99 4.01Wholesale & Retail Trade 10.01 11.33 8.02 9.42 4.03 2.99 2.79 2.71 9.76 3.35 4.50 2.49Hotels and Restaurants 12.70 9.59 15.54 4.55 38.22 15.60 2.27 18.29 6.56 2.55 -5.40 -1.99Transport 10.86 5.92 9.45 0.57 13.42 -3.43 5.09 4.47 3.55 2.69 5.64 1.23
Road Transport 9.91 2.13 7.95 --.2.64 4.07 3.01 3.02 2.50 4.98 2.02 4.00 4.72Sea Transport 14.41 13.38 6.87 4.29 31.55 15.23 9.59 12.03 2.63 2.71 8.64 -4.73Air Transport 5.85 11.60 34.16 11.07 14.29 3.20 3.38 -7.90 ·2.07 7.25 ~ 4.51 2.96
Communications 11.33 38.11 10.01 13.50 1.94 19.95 11.38 -0.47 2.92 18.16 3.03 11.44Banks & Insurance 3.03 4.97 8.58 6.53 7.29 17.36 --2.19 -1.65 5.44 8.37 -1.73 ~3.03
Real Estate & Housing 1.17 1.98 2.91 2.98 2.97 1.92 1.02 0.29 2.01 1.69 2.00 2.03Government Services 1.00 2.51 2.98 1.21 3.22 1.54 0.00 2.18 0.63 .--1.33 1.51 3.15Other Services 3.43 3.01 3.80 5.92 3.72 2.05 2.01 6.16 9.98 11.39 4.17 2.00Less Imputed Service Charge 3.06 4.91 22.63 14.27 15.82 28.18 1.03 --0.60 0.64 13.90 -: 1.88 .-.3.02
TOTAL 6.84 6.80 7.38 -.1.12 6.34 2.15 2.74 1.86 2.15 1.60 3.08 1.82
Source: Dominica Central Statistical Officel OECS/EAS
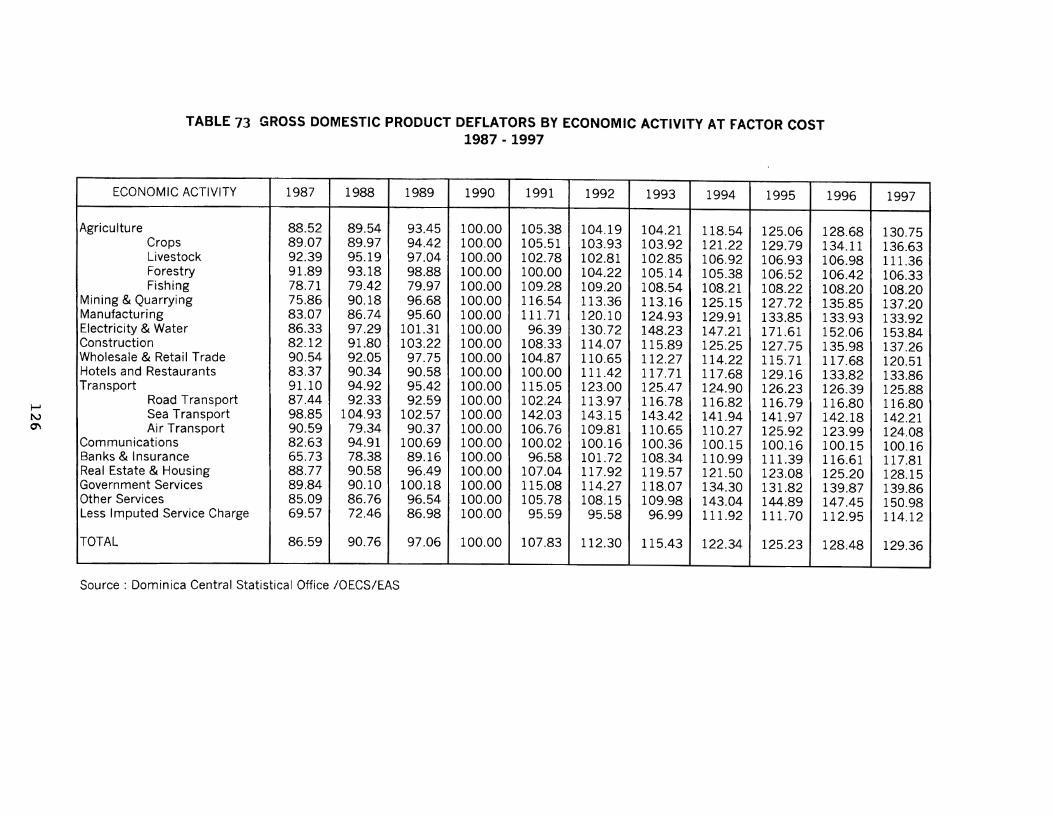
I--'l\)
'"
TABLE 73 GROSS DOMESTIC PRODUCT DEFLATORS BY ECONOMIC ACTIVITY AT FACTOR COST1987 - 1997
ECONOMIC ACTIVITY 1987 1988 1989 1990 1991 1992 1993 1994 1995 1996 1997
Agriculture 88.52 89.54 93.45 100.00 105.38 104.19 104.21 118.54 125.06 128.68 130.75Crops 89.07 89.97 94.42 100.00 105.51 103.93 103.92 121.22 129.79 134.11 136.63Livestock 92.39 95.19 97.04 100.00 102.78 102.81 102.85 106.92 106.93 106.98 111.36Forestry 91.89 93.18 98.88 100.00 100.00 104.22 105.14 105.38 106.52 106.42 106.33Fishing 78.71 79.42 79.97 100.00 109.28 109.20 108.54 108.21 108.22 108.20 108.20
Mining & Quarrying 75.86 90.18 96.68 100.00 116.54 113.36 113.16 125.15 127.72 135.85 137.20Manufacturing 83.07 86.74 95.60 100.00 111.71 120.10 124.93 129.91 133.85 133.93 133.92Electricity & Water 86.33 97.29 101.31 100.00 96.39 130.72 148.23 147.21 171.61 152.06 153.84Construction 82.12 91.80 103.22 100.00 108.33 114.07 115.89 125.25 127.75 135.98 137.26Wholesale & Retail Trade 90.54 92.05 97.75 100.00 104.87 110.65 112.27 114.22 115.71 117.68 120.51Hotels and Restaurants 83.37 90.34 90.58 100.00 100.00 111.42 117.71 117.68 129.16 133.82 133.86Transport 91.10 94.92 95.42 100.00 115.05 123.00 125.47 124.90 126.23 126.39 125.88
Road Transport 87.44 92.33 92.59 100.00 102.24 113.97 116.78 116.82 116.79 116.80 116.80Sea Transport 98.85 104.93 102.57 100.00 142.03 143.15 143.42 141.94 141.97 142.18 142.21Air Transport 90.59 79.34 90.37 100.00 106.76 109.81 110.65 110.27 125.92 123.99 124.08
Communications 82.63 94.91 100.69 100.00 100.02 100.16 100.36 100.15 100.16 100.15 100.16Banks & Insurance 65.73 78.38 89.16 100.00 96.58 101.72 108.34 110.99 111.39 116.61 117.81Real Estate & Housing 88.77 90.58 96.49 100.00 107.04 117.92 119.57 121.50 123.08 125.20 128.15Government Services 89.84 90.10 100.18 100.00 115.08 114.27 118.07 134.30 131.82 139.87 139.86Other Services 85.09 86.76 96.54 100.00 105.78 108.15 109.98 143.04 144.89 147.45 150.98Less Imputed Service Charge 69.57 72.46 86.98 100.00 95.59 95.58 96.99 111.92 111.70 112.95 114.12
TOTAL 86.59 90.76 97.06 100.00 107.83 112.30 115.43 122.34 125.23 128.48 129.36
Source: Dominica Central Statistical Office IOECS/EAS
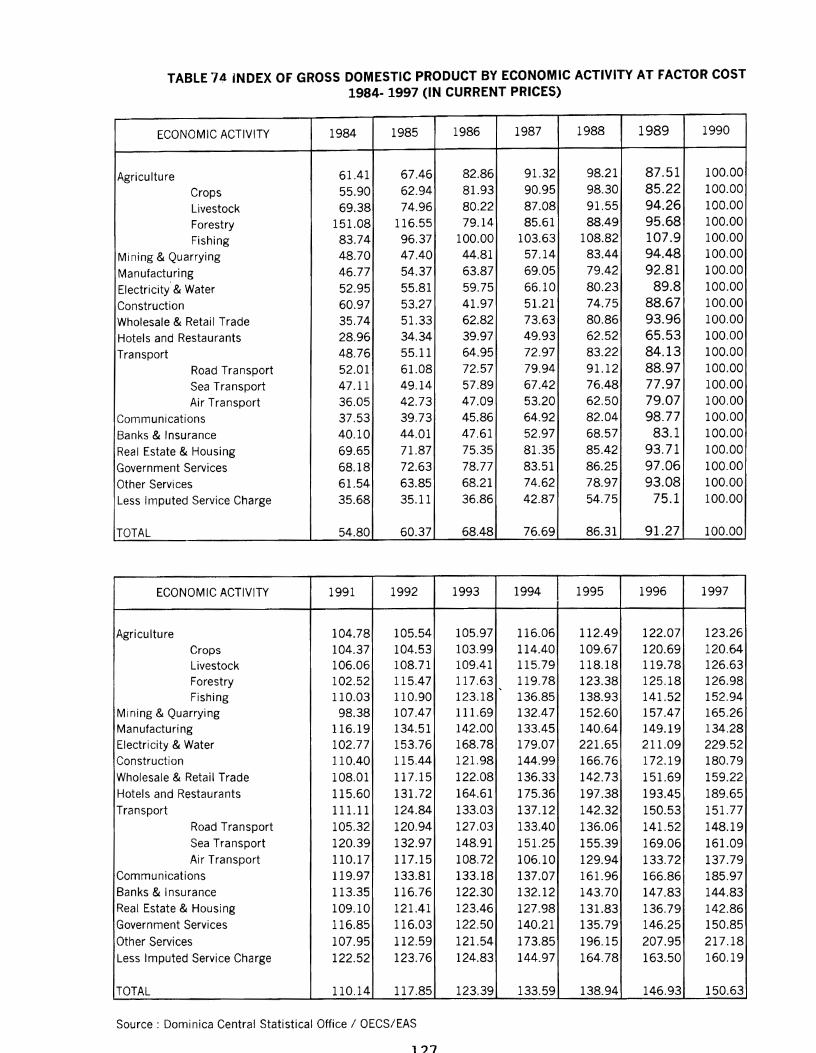
TABLE 74 iNDEX OF GROSS DOMESTIC PRODUCT BY ECONOMIC ACTIVITY AT FACTOR COST1984- 1997 (IN CURRENT PRICES)
ECONOMIC ACTIVITY 1984 1985 1986 1987 1988 1989 1990
Agriculture 61.41 67.46 82.86 91.32 98.21 87.51 100.00
Crops 55.90 62.94 81.93 90.95 98.30 85.22 100.00
Livestock 69.38 74.96 80.22 87.08 91.55 94.26 100.00
Forestry 151.08 116.55 79.14 85.61 88.49 95.68 100.00
Fishing 83.74 96.37 100.00 103.63 108.82 107.9 100.00
Mining & Quarrying 48.70 47.40 44.81 57.14 83.44 94.48 100.00
Manufacturing 46.77 54.37 63.87 69.05 79.42 92.81 100.00
Electricity' & Water 52.95 55.81 59.75 66.10 80.23 89.8 100.00
Construction 60.97 53.27 41.97 51.21 74.75 88.67 100.00
Wholesale & Retail Trade 35.74 51.33 62.82 73.63 80.86 93.96 100.00
Hotels and Restaurants 28.96 34.34 39.97 49.93 62.52 65.53 100.00
Transport 48.76 55.11 64.95 72.97 83.22 84.13 100.00
Road Transport 52.01 61.08 72.57 79.94 91.12 88.97 100.00
Sea Transport 47.11 49.14 57.89 67.42 76.48 77.97 100.00
Air Transport 36.05 42.73 47.09 53.20 62.50 79.07 100.00
Communications 37.53 39.73 45.86 64.92 82.04 98.77 100.00
Banks & Insurance 40.10 44.01 47.61 52.97 68.57 83.1 100.00
Real Estate & Housing 69.65 71.87 75.35 81.35 85.42 93.71 100.00
Government Services 68.18 72.63 78.77 83.51 86.25 97.06 100.00
'Other Services 61.54 63.85 68.21 74.62 78.97 93.08 100.00
Less Imputed Service Charge 35.68 35.11 36.86 42.87 54.75 75.1 100.00
TOTAL 54.80 60.37 68.48 76.69 86.31 91.27 100.00
ECONOMIC ACTIVITY 1991 1992 1993 1994 1995 1996 1997
Agriculture 104.78 105.54 105.97 116.06 112.49 122.07 123.26Crops 104.37 104.53 103.99 114.40 109.67 120.69 120.64Livestock 106.06 108.71 109.41 115.79 118.18 119.78 126.63Forestry 102.52 115.47 117.63 119.78 123.38 125.18 126.98
....
Fishing 110.03 110.90 123.18 136.85 138.93 141.52 152.94Mining & Quarrying 98.38 107.47 111.69 132.47 152.60 157.47 165.26Manufacturing 116.19 134.51 142.00 133.45 140.64 149.19 134.28Electricity & Water 102.77 153.76 168.78 179.07 221.65 211.09 229.52Construction 110.40 115.44 121.98 144.99 166.76 172.19 180.79Wholesale & Retail Trade 108.01 117.15 122.08 136.33 142.73 151.69 159.22Hotels and Restaurants 115.60 131.72 164.61 175.36 197.38 193.45 189.65Transport 111.11 124.84 133.03 137.12 142.32 150.53 151.77
Road Transport 105.32 120.94 127.03 133.40 136.06 141.52 148.19Sea Transport 120.39 132.97 148.91 151.25 155.39 169.06 161.09Air Transport 110.17 117.15 108.72 106.10 129.94 133.72 137.79
Communications 119.97 133.81 133.18 137.07 161.96 166.86 185.97Banks & Insurance 113.35 116.76 122.30 132.12 143.70 147.83 144.83Real Estate & Housing 109.10 121.41 123.46 127.98 131.83 136.79 142.86Government Services 116.85 116.03 122.50 140.21 135.79 146.25 150.85Other Services 107.95 112.59 121.54 173.85 196.15 207.95 217.18Less Imputed Service Charge 122.52 123.76 124.83 144.97 164.78 163.50 160.19
TOTAL 110.14 117.85 123.39 133.59 138.94 146.93 150.63
Source: Dominica Central Statistical Office I OECS/EAS
1 ??
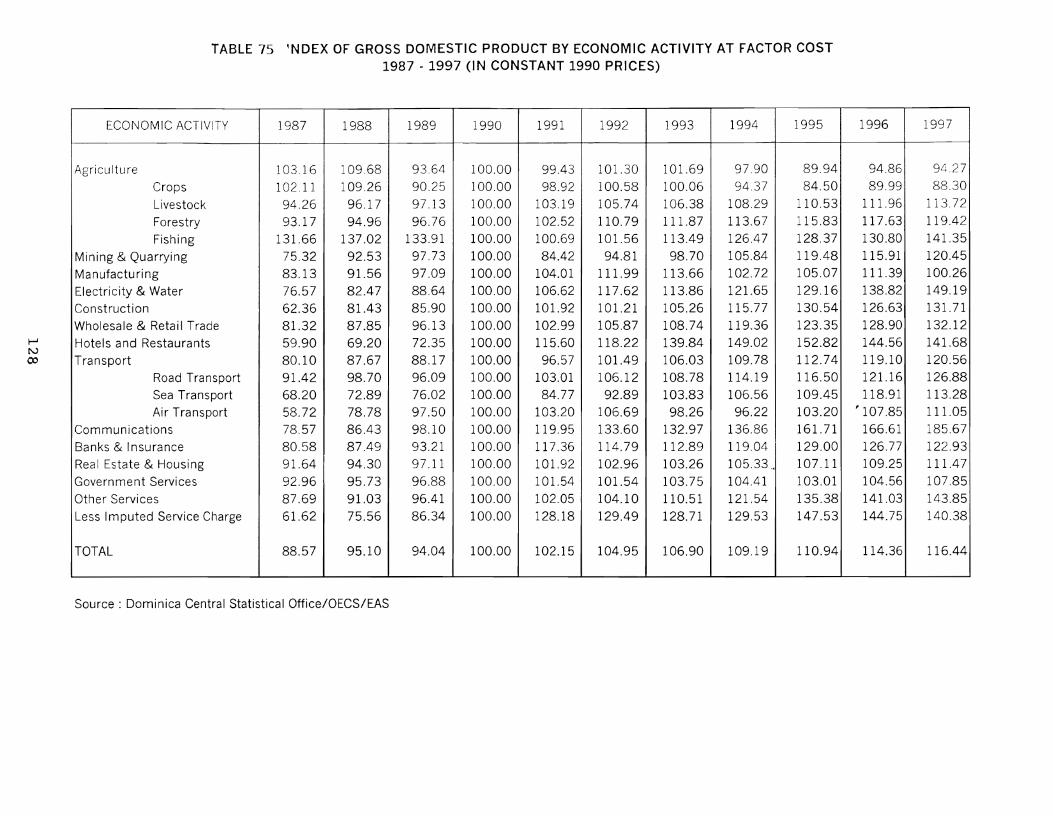
~
r-vco
TABLE 75 ~NDEX OF GROSS DOMESTIC PRODUCT BY ECONOMIC ACTIVITY AT FACTOR COST1987 - 1997 (IN CONSTANT 1990 PRICES)
ECONOMIC ACTIVITY 1987 1988 1989 1990 1991 1992 1993 1994 1995 1996 1997
Agriculture 103.16 109.68 93.64 100.00 99.43 101.30 101.69 97.90 89.94 94.86 94.27
Crops 102.11 109.26 90.25 100.00 98.92 100.58 100.06 94.37 84.50 89.99 88.30
Livestock 94.26 96.17 97.13 100.00 103.19 105.74 106.38 108.29 110.53 111.96 113.72
Forestry 93.17 94.96 96.76 100.00 102.52 110.79 111.87 113.67 115.83 117.63 119.42
Fishing 131.66 137.02 133.91 100.00 100.69 101.56 113.49 126.47 128.37 130.80 141.35
Mining & Quarrying 75.32 92.53 97.73 100.00 84.42 94.81 98.70 105.84 119.48 115.91 120.45
Manufacturing 83.13 91.56 97.09 100.00 104.01 111.99 113.66 102.72 105.07 111.39 100.26
Electricity & Water 76.57 82.47 88.64 100.00 106.62 117.62 113.86 121.65 129.16 138.82 149.19
Construction 62.36 81.43 85.90 100.00 101.92 101.21 105.26 115.77 130.54 126.63 131.71
Wholesale & Retail Trade 81.32 87.85 96.13 100.00 102.99 105.87 108.74 119.36 123.35 128.90 132.12
Hotels and Restaurants 59.90 69.20 72.35 100.00 115.60 118.22 139.84 149.02 152.82 144.56 141.68
Transport 80.10 87.67 88.17 100.00 96.57 101.49 106.03 109.78 112.74 119.10 120.56
Road Transport 91.42 98.70 96.09 100.00 103.01 106.12 108.78 114.19 116.50 121.16 126.88
Sea Transport 68.20 72.89 76.02 100.00 84.77 92.89 103.83 106.56 109.45 118.91 113.28
Air Transport 58.72 78.78 97.50 100.00 103.20 106.69 98.26 96.22 103.20 ' 107.85 111.05
Communications 78.57 86.43 98.10 100.00 119.95 133.60 132.97 136.86 161.71 166.61 185.67
Banks & Insurance 80.58 87.49 93.21 100.00 117.36 114.79 112.89 119.04 129.00 126.77 122.93
Real Estate & Housing 91.64 94.30 97.11 100.00 101.92 102.96 103.26 105.33 .. 107.11 109.25 111.47
Government Services 92.96 95.73 96.88 100.00 101.54 101.54 103.75 104.41 103.01 104.56 107.85
Other Services 87.69 91.03 96.41 100.00 102.05 104.10 110.51 121.54 135.38 141.03 143.85
Less Imputed Service Charge 61.62 75.56 86.34 100.00 128.18 129.49 128.71 129.53 147.53 144.75 140.38
TOTAL 88.57 95.10 94.04 100.00 102.15 104.95 106.90 109.19 110.94 114.36 116.44
Source: Dominica Central Statistical Office/OECS/EAS

J--I.. t\J
'"
TABLE 76 THE BALANCE OF PAYMENTS OF DOMINICA (SUMMARY) 1987 - 1997
1987 1988 1989 1990 1991 1992
CREDIT DEBIT CREDIT DEBIT CREDIT DEBIT CREDIT DEBIT CREDIT DEBIT CREDIT DEBIT
. "', ,/ -- .... './
CURRENT ACCOUNT 212.50 231.08 247.80 290.82 229.81 352.69 280.46 398.11 288.46 379.22 305.26 373.86
GOODS AND SERVICES 178.99 209.25 210.41 267.00 192.38 324.70 241.51 361.66 251.18 341.06 269.14 338.11
A Goods 133.09 158.93 154.00 208.56 125.02 254.94 151.39 280.66 150.17 260.48 148.76 250.54
Merchandise 133.07 158.93 153.98 208.56 125.00 254.94 151.36 280.66 150.00 260.48 147.32 250.54
Stores and Bunkers 0.02 0.00 0.02 0.00 0.02 0.00 0.03 0.00 0.17 0.00 1.L!~ I 0.00
B Service 45.90 50.32 56.41 58.44 67.36 69.76 90.12 81.00 101.01 80.58 120.38 87.57
Transportation 5.10 26.26 6.30 32.70 7.74 39.88 9.65 41.11 10.82 41.17 13.32 44.65
Travel 28.90 6.50 35.32 6.00 42.39 9.64 55.16 11.90 65.20 12.49 69.79 15.24
Insurance Service 2.60 3.96 2.75 6.27 5.60 8.52 10.06 9.61 3.62 8.96 9.78 9.69
Financial Service 0.00 0.00 0.00 0.00
Other Business Services 7.60 11.30 10.24 12.07 9.78 9.92 14.13 17.38 19.37 12.14 24.59 12.11
Government Services 1.70 2.30 1.80 1.40 1.85 1.80 1.12 1.00 2.00 5.82 2.90 5.88
C Income 7.26 13.59 11.69 15.91 9.72 20.49 10.88 24.22 . 7.03 27.72 6.75 26.62
Compensation of Employees 1.80 0.90 1.80 0.90 2.10 1.22 1.16 0.44 1.08 0.54 0.66 0.33
Investment Income 5.46 12.69 9.89 15.01 7.62 19.27 9.72 23.78 5.95 27.18 6.09 26.29
D Current Transfers 25.90 8.24 25.70 7.91 27.71 7.50 28.07 12.23 30.25 10.44 29.37 9.13
General Government 1.90 3.30 1.00 4.40 1.00 3.50 1.04 4.80 4.03 5.20 5.13 5.53
Other Services 24.00 4.94 24.70 3.51 26.71 4.00 27.03 7.43 26.22 5.24 24.24 3.60
CAPITAL AND FINANCIAL ACCOUNT 91.93 48.28 88.32 40.98 142.03 18.88 136.50 20.87 120.42 18.43 108.46 20.07
A Financial Account 27.00 5.50 38.70 5.16 42.07 5.41 40.38 3.92 39.81 4.21 30.45 4.00
Capital Transfers 27.00 5.50 38.70 5.16 42.07 5.41 40.38 3.92 .. 39.81 4.21 30.45 4.00
Acquisition & Disposition of 0.00 0.00 0.00 0.00 0.00 0.00 0.00 0.00 0.00 0.00 0.00 0.00
Nonproduce Non· Financial Assets
B Financial Account 64.93 42.78 49.62 35.82 99.96 13.47 96.12 16.95 80.61 14.22 77.61 16.07
Direct Investment 36.50 0.00 32.20 0.00 46.43 0.00 34.80 0.00 41.10 0.00 55.56 0.00
Portfolio Investment 0.00 0.00 0.00 0.00 0.00 0.00 0.00 0.99 0.00 0.00 0.00 0.00
Other Investment 28.43 42.78 17.42 35.82 53.53 13.47 61.32 15.96 39.51 14.22 22.05 16.07
Public Sector Long Term Loans 26.43 10.07 16.42 11.78 30.74 11.97 32.13 12.86 30.14 8.52 19.79 10.92
Other Public Sector Capital 0.00 0.00 0.00 0.00 0.00 0.00 0.00 0.00 0.00 0.00 2.03 0.00
Commercial Banks 0.00 30.80 0.00 22.90 22.09 0.00 29.10 0.00 8.25 0.00 2.44 0.00
Other 2.00 1.91 0.70 1.14 0.70 1.50 0.09 3.10 1.12 5.70 0.23 3.54
OVERALL BALANCE 22.90 -2.10 2.00 13.90 12.09 8.86
FINANCING 0.00 22.90 9.10 7.00 5.60 7.60 0.00 13.90 0.05 12.14 0.10 8.78
Change in SDR Holdings 0.00 0.00 0.00 0.00 0.00 0.00 0.00 0.00 0.00 0.00 0.00 0.00
Change in Reserve Position with IMF 0.00 1.10 0.00 6.00 0.00 6.10 0.00 3.50 0.00 2.43 0.00 1.89
Change in Government Foreign Assets 0.00 0.00 0.00 1.00 0.00 1.50 0.00 2.50 0.05 0.00 0.10 0.00
Change in Imputed Reserves 0.00 21.80 9.10 0.00 5.60 0.00 0.00 7.90 0.00 9.71 0.00 6.89
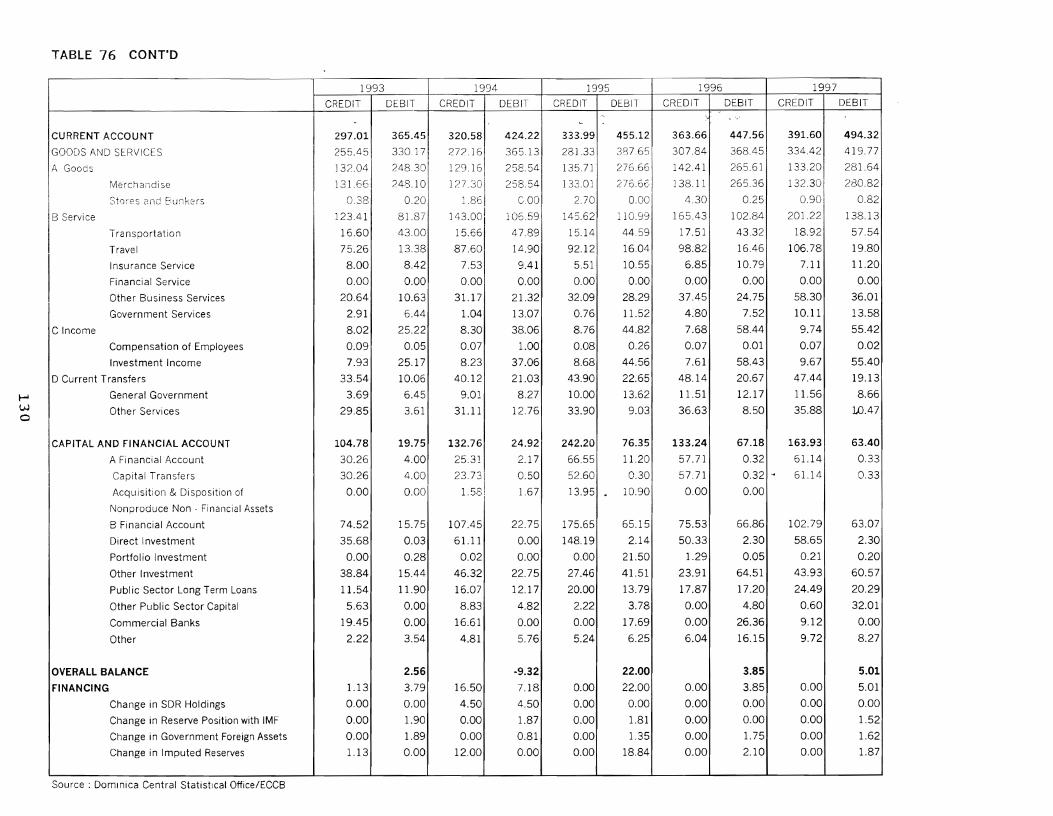
~
wo
TABLE 76 CONT'D
1993 1994 1995 1996 1997
CREDIT DEBIT CREDIT DEBIT CREDIT DEBIT CREDIT DEBIT CREDIT DEBIT~. \'
"-
CURRENT ACCOUNT 297.01 365.45 320.58 424.22 333.99 455.12 363.66 447.56 391.60 494.32
GOODS AND SERVICES 255.45 330,17 27?16 365.13 281.33 387,65 307.84 368.45 334.42 419.77
A Goods J3?04 248.30 129.16 258.54 135.71 276.66 142.41 265.61 133.20 281.64
Merchandise 131.66 248.10 1')- .,.'" I 258.54 133.01 276.6c, 138.11 265.36 132.30 280.82'- l.jUI
St()f"eS and E:unkers 0.38 0.20 1.86\ C.OO 2.70 0.00 4.30 0.25 0.90 0.82
B Service 123.41 81.87 143.0°1 106.59 145.62 110.99 165.43 102.84 201.22 138.13
Transportation 16.60 43.00 15.66 47.89 15.14 44.59 17.51 43.32 18.92 57.54
Travel 75.26 13.38 87.60 14.90 92.12 16.04 98.82 16.46 106.78 19.80
Insurance Service 8.00 8.42 7.53 9.41 5.51 10.55 6.85 10.79 7.11 11.20
Financial Service 0.00 0.00 0.00 0.00 0.00 0.00 0.00 0.00 0.00 0.00
Other Business Services 20.64 10.63 31.17 21.32 32.09 28.29 37.45 24.75 58.30 36.01
Government Services 2.91 6.44 1.04 13.07 0.76 11.52 4:80 7.52 10.11 13.58
C Income 8.02 25.22 8.30 38.06 8.76 44.82 7.68 58.44 9.74 55.42
Compensation of Employees 0.09 0.05 0.07 1.00 0.08 0.26 0.07 0.01 0.07 0.02
Investment Income 7.93 25.17 8.23 37.06 8.68 44.56 7.61 58.43 9.67 55.40
D Current Transfers 33.54 10.06 40.12 21.03 43.90 22.65 48.14 20.67 47.44 19.13
General Government 3.69 6.45 9.01 8.27 10.00 13.62 11.51 12.17 11.56 8.66
Other Services 29.85 3.61 31.11 12.76 33.90 9.03 36.63 8.50 35.88 10.47
CAPITAL AND FINANCIAL ACCOUNT 104.78 19.75 132.76 24.92 242.20 76.35 133.24 67.18 163.93 63.40
A Financial Account 30.26 4.00 25.31 2.17 66.55 11.20 57.71 0.32 61.14 0.33
Capital Transfers 30.26 4.00 23.73\ 0.50 52.60 0.30 57.71 0.32 ~ 61.14 0.33
Acquisition & Disposition of 0.00 0.00 1. 58! 1.67 13.95 - 10.90 0.00 0.00I
Nonproduce Non· Financial Assets
B Financial Account 74.52 15.75 107.45 22.75 175.65 65.15 75.53 66.86 102.79 63.07
Direct Investment 35.68 0.03 61.11 0.00 148.19 2.14 50.33 2.30 58.65 2.30
Portfol io Investment 0.00 0.28 0.02 0.00 0.00 21.50 1.29 0.05 0.21 0.20
Other Investment 38.84 15.44 46.32 22.75 27.46 41.51 23.91 64.51 43.93 60.57
Public Sector Long Term Loans 11.54 11.90 16.07 12.17 20.00 13.79 17.87 17.20 24.49 20.29
Other Public Sector Capital 5.63 0.00 8.83 4.82 2.22 3.78 0.00 4.80 0.60 32.01
Commercial Banks 19.45 0.00 16.61 0.00 0.00 17.69 0.00 26.36 9.12 0.00
Other 2.22 3.54 4.81 5.76 5.24 6.25 6.04 16.15 9.72 8.27
OVERALL BALANCE 2.56 -9.32 22.00 3.85 5.01
FINANCING 1.13 3.79 16.50 7.18 0.00 22.00 0.00 3.85 0.00 5.01
Change in SDR Holdings 0.00 0.00 4.50 4.50 0.00 0.00 0.00 0.00 0.00 0.00
Change in Reserve Position with IMF 0.00 1.90 0.00 1.87 0.00 1.81 0.00 0.00 0.00 1.52
Change in Government Foreign Assets 0.00 1.89 0.00 0.81 0.00 1.35 0.00 1.75 0.00 1.62
Change in Imputed Reserves 1.13 0.00 12.00 0.00 0.00 18.84 0.00 2.10 0.00 1.87
Source: Dominica Central Statistical Office/ECCB

Section XI Trade
The total value of Exports increased from $42.9m, in 1978 to $141.3 m, in 1997.
Imports moved from a value of $76.8m, to $363.1 m, over the same period.
(Table 77).
From 1978 to 1983 the principal Domestic Exports were Bananas, Stlap§, and
Grapefruits; from 1984 to 1989 the order of principal exports WaS Bananas,
Soaps and Coconut Oil; from 1990, Plantains became the third principal
domestic export, (except for 1991, 1992, 1995, and 1996 when the exports of
paint exceeded that of plantains).
In 1978 Dominica's main markets for exports were Europe accounting for 68.1 Off>
and the Caribbean, 27.5%. In 1997 Dominica's main trading partners remained
the same but switched positions as it~ Caribbean neighbours accounted for
61.3 % of its total exports, while Europe registered 32.3°ff> (Table 83).
In 1978, Imports from the Caribbean, Europe and North America accounted for
37.0%, 31.10/0 and 20.0°;b respectively. In 1997, the North American market
captured, a larger share, 40.3°;b. The Caribbean contributed 3D.DOlOof all imports
to Dominica while Europe also recorded a lower, 14.4°A> in comparison to the
31 1% share in 1978.
In 1978 the principal imports were Transport Equipment, 8.0%; Cardboard boxes,
6.9%; rV1eat and fV1eat Products 6.3%; ~\I~eta! and Metal products, 5.60/0;
Machinery, 4.9%; Dairy Products, 4.6°ff> and Flour, 4.3°ff>.
131
-However, if taken as one group FOOD would record the highest percentage,
representing at least 21.2°A> of total imports.
In 1997 the principal items imported were Machinery, 9.3°A>; Transport Equipment
6.8%; Machinery Electric, 6.7%; Metal and Metal Products, 6.1 0A>; Meat and Meat
Products, 4.20/0, Woods and Lumber, 3.1 0A>; Dairy Products 2.8°A>; Gasolene 2.6°A>
and Other Fuels 2.4°A>. However, taken as one group, FOOD recorded at least
12.0% of total imports in 1997.
132
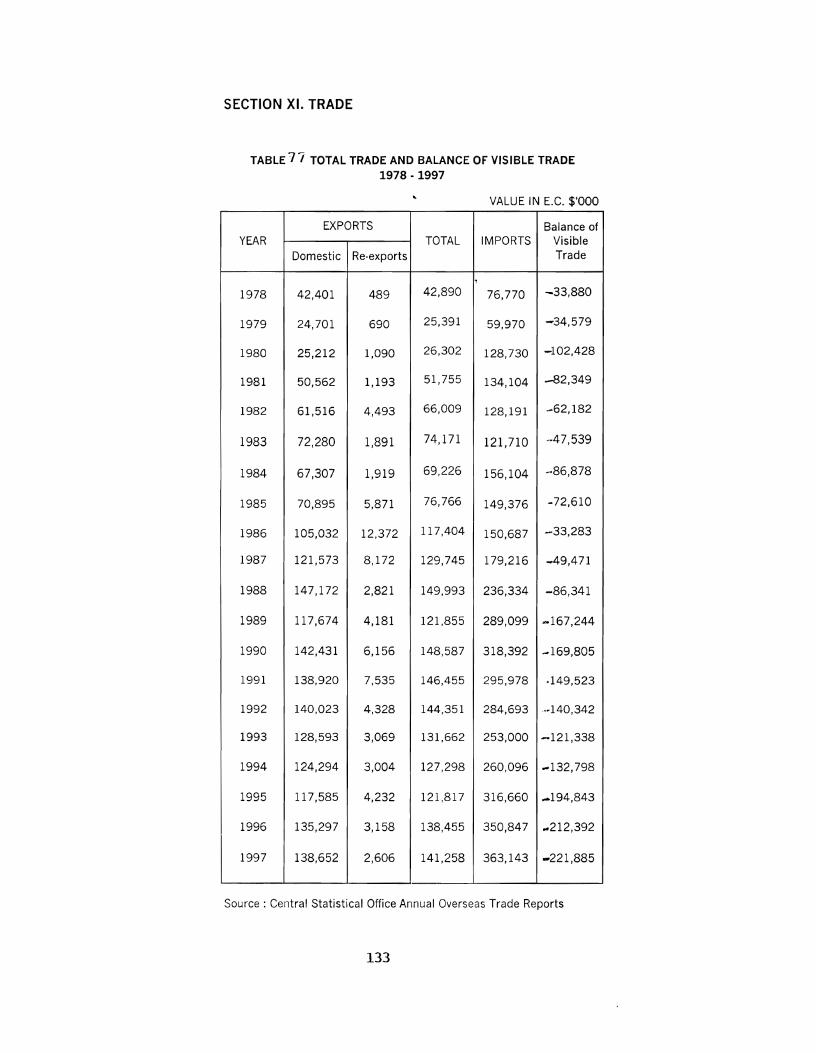
SECTION XI. TRADE
TABLE?7 TOTAL TRADE AND BALANCE OF VISIBLE TRADE1978· 1997
VALUE IN E.C. $'000
EXPORTS Balance ofYEAR TOTAL IMPORTS Visible
Domestic Re-exports Trade
"1
1978 42,401 489 42,890 76,770 -33,880
1979 24,701 690 25,391 59,970 -34,579
1980 25,212 1,090 26,302 128,730 -102,428
1981 50,562 1,193 51,755 134,104 -82,349
1982 61,516 4,493 66,009 128,191 -62,182
1983 72,280 1,891 74,171 121,710 ..·47,539
1984 67,307 1,919 69,226 156,104 -86,878
1985 70,895 5,871 76,766 149,376 -72,610
1986 105,032 12,372 117,404 150,687 -33,283
1987 121,573 8,172 129,745 179,216 -49,471
1988 147,172 2,821 149,993 236,334 -86,341
1989 117,674 4,181 121,855 289,099 -167,244
1990 142,431 6,156 148,587 318,392 -169,805
1991 138,920 7,535 146,455 295,978 .149,523
1992 140,023 4,328 144,351 284,693 ....140,342
1993 128,593 3,069 131,662 253,000 -121,338
1994 124,294 3,004 127,298 260,096 ... 132,798
1995 117,585 4,232 121,817 316,660 ...194,843
1996 135,297 3,158 138,455 350,847 ...212,392
1997 138,652 2,606 141,258 363,143 -221,885
Source: Central Statistical Office Annual Overseas Trade Reports
133

TABLE 'I (3 QUANTUM AND UNIT VALUE INDICES OF IMPORTS AND EXPORTSAND TERMS OF TRADE: 1978 - 1993
(1983-1993), 1990 = 100
Sou rce: Centra I Statlstlca I OffIce Annual Overseas Trade Reports
QUANTUM UNIT VALUECommodity Income Terms
YEARTerms of Trade of Trade
Irnports Exports Imports '"Exports
1978 114.8 122.9 108.2 108.9 100.6 123.6
1979 83.5 63.8 121.7 121.1 99.5 63.5,
1980 143.3 52.7 162.3 150.7 92.9 49.0
1981 148.1 103.9 164.4 147.8 89.9 93.4
1982 125.2 110.3 161.6 158.2 97.9 108.0
1983 45.1 58.1 88.2 83.6 92.6 53.8
1984 61.7 58.5 90.8 74.4 80.0 46.8
1985 56.7 61.9 78.6 81.0 100.6 62.3
1986 63.4 83.4 76.9 91.4 116.1 96.8
1987 75.4 95.7 85.5 91.5 107.0 102.4
1988 80.0 107.1 92.5 98.9 106.9 114.5
1989 92.6 88.2 94.2 93.0 98.7 87.1
1990 100.0 100.0 100.0 100.0 100.0 100.0
1991 89.5 93.9 104.3 105.1 100.8 94.6
1992 '" 96.8 ... 99.6 ... ...
1993 ... 94.5 ... 88.9 ... ...
1994 ... ... . .. . .. ...
1995 ... ... ... ... ... ...
1996 ... ... ... ... ... ...
1997'" ... ... ... ... ...
1998 ... ... ... ... ... ...
NOTE:1. COMMODITY TERMS OF TRADE = __U_n_it_V_a_1u_e_l_n_de_x_o_f_E_xpl..o"o_r_ts__ x 100
Unit Value Index of Imports
2. INCOME TERMS OR TRADE =13~
Commodity Terms of Trade100
x Quantum Indexof Exports
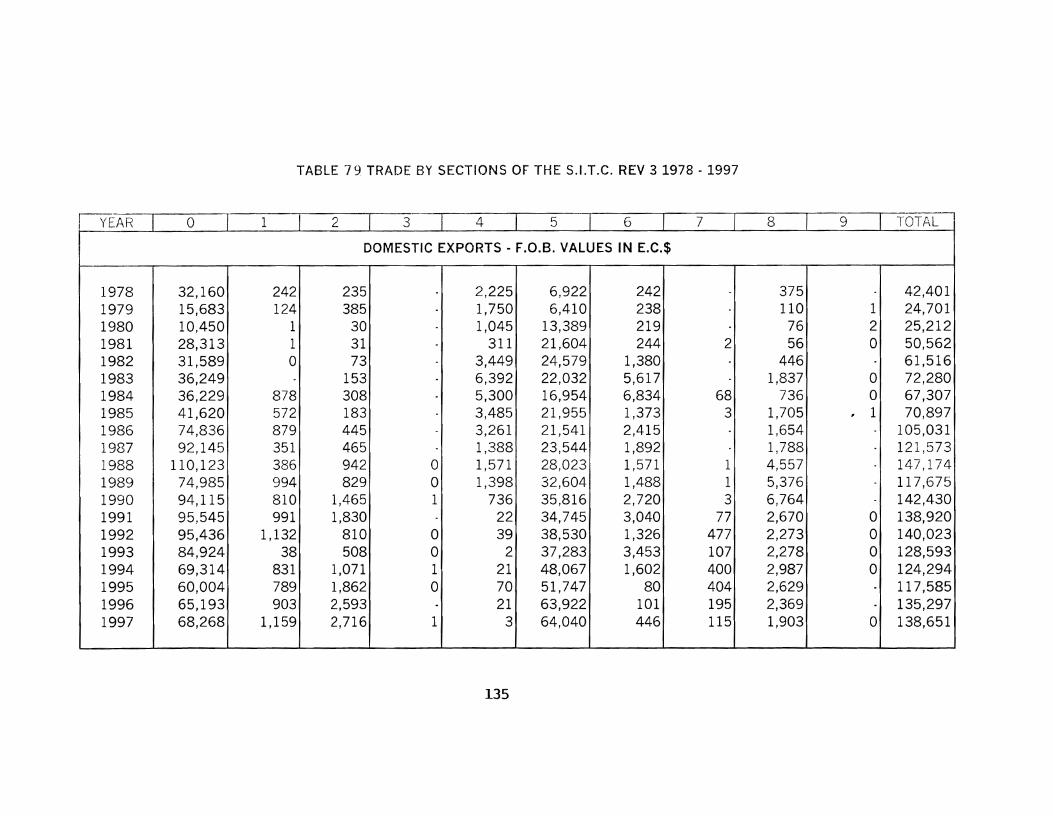
TABLE 79 TRADE BY SECTIONS OF THE S.I.T.C. REV 3 1978 - 1997
I yt:AR a 1 2 3 4 5 6 7 8 9 lUIf-\L
DOMESTIC EXPORTS - F.O.B. VALUES IN E.C.$
1978 32,160 242 235 2,225 6,922 242 375 42,4011979 15,683 124 385 1,750 6,410 238 110 1 24,7011980 10,450 1 30 1,045 13,389 219 76 2 25,2121981 28,313 1 31 311 21,604 244 2 56 0 50,5621982 31,589 0 73 3,449 24,579 1,380 446 61,5161983 36,249 153 6,392 22,032 5,617 1,837 0 72,2801984 36,229 878 308 5,300 16,954 6,834 68 736 0 67,3071985 41,620 572 183 3,485 21,955 1,373 3 1,705 , 1 70,8971986 74,836 879 445 3,261 21,541 2,415 1,654 105,0311987 92,145 351 465 1,388 23,544 1,892 1,788 121,5731988 110,123 386 942 0 1,571 28,023 1,571 1 4,557 147,1741989 74,985 994 829 0 1,398 32,604- 1,488 1 5,376 117,6751990 94,115 810 1,465 1 736 35,816 2,720 3 6,764 142,4301991 95,545 991 1,830 22 34,745 3,040 77 2,670 0 138,9201992 95,436 1,132 810 0 39 38,530 1,326 477 2,273 0 140,0231993 84,924 38 508 0 2 37,283 3,453 107 2,278 0 128,5931994 69,314 831 1,071 1 21 48,067 1,602 400 2,987 0 124,2941995 60,004 789 1,862 0 70 51,747 80 404 2,629 117,5851996 65,193 903 2,593 21 63,922 101 195 2,369 135,2971997 68,268 1,159 2,716 1 3 64,040 446 115 1,903 0 138,651
135
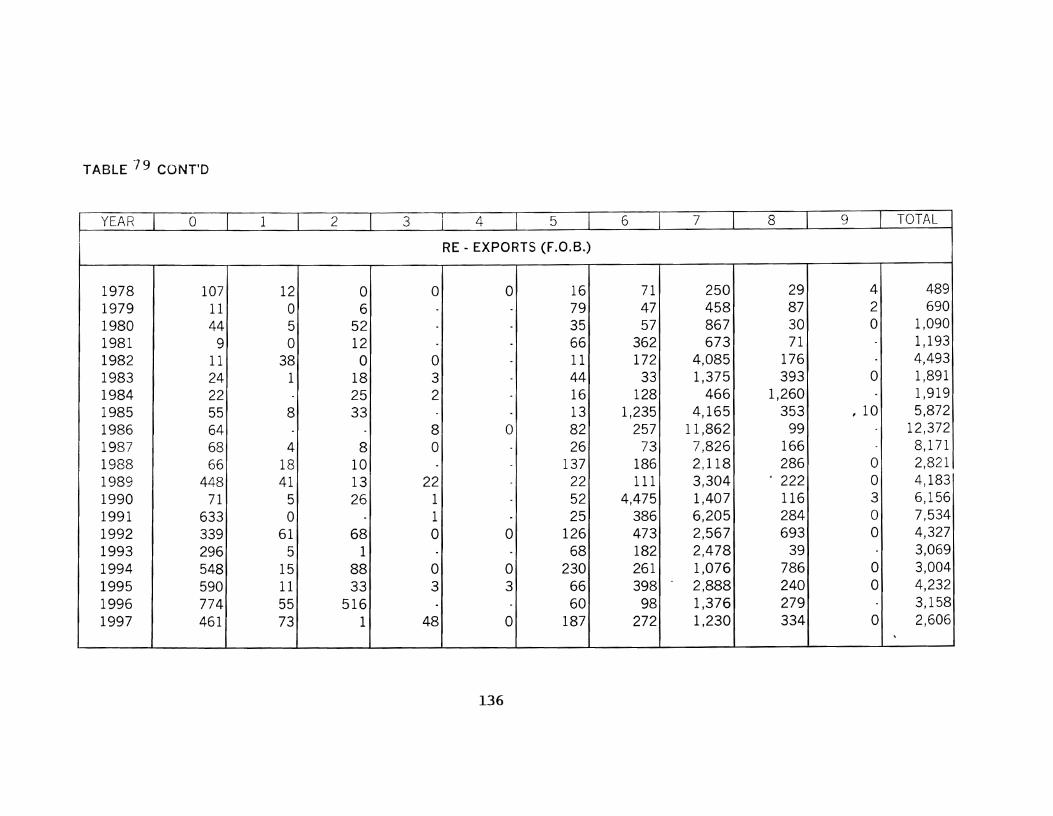
TABLE 79 CONT'D
YEAR 0 1 2 3 4 5 6 7 8 9 TOTAL
RE - EXPORTS (F.O.B.)
1978 107 12 0 0 0 16 71 250 29 4 4891979 11 0 6 79 47 458 87 2 6901980 44 5 52 35 57 867 30 ° 1,0901981 9 ° 12 66 362 673 71 1,1931982 11 38 0 0 11 172 4,085 176 4,4931983 24 1 18 3 44 33 1,375 393 ° 1,8911984 22 25 2 16 128 466 1,260 1,9191985 55 8 33 13 1,235 4,165 353 , 10 5,8721986 64 8 a 82 257 11,862 99 12,3721987 68 4 8 ° 26 73 7,826 166 8,1711988 66 18 10 137 186 2,118 286 a 2,8211989 448 41 13 22 22 111 3,304 · 222 ° 4,1831990 71 5 26 1 52 4,475 1,407 116 3 6,1561991 633 0 1 25 386 6,205 284 a 7,5341992 339 61 68 0 0 126 473 2,567 693 0 4,3271993 296 5 1 68 182 2,478 39 3,0691994 548 15 88 0 0 230 261 1,076 786 0 3,0041995 590 11 33 3 3 66 398 2,888 240 0 4,2321996 774 55 516 60 98 1,376 279 3,1581997 461 73 1 48 ° 187 272 1,230 334 0 2,606
\
136
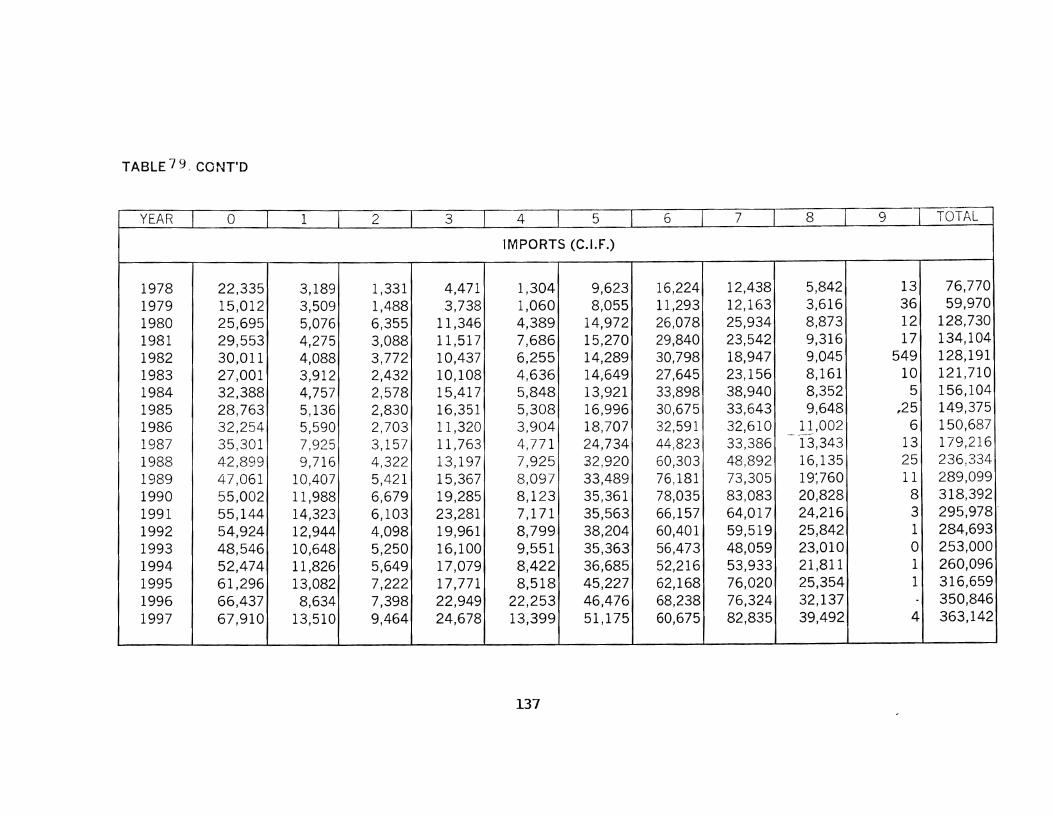
TABLE79. CONT'D
YEAR ° 1 2 3 4 5 6 7 8 9 TOTAL
IMPORTS (C.I.F.)
1978 22,335 3,189 1,331 4,471 1,304 9,623 16,224 12,438 5,842 13 76,770
1979 15,012 3,509 1,488 3,738 1,060 8,055 11,293 12,163 3,616 36 59,970
1980 25,695 5,076 6,355 11,346 4,389 14,972 26,078 25,934 8,873 12 128,730
1981 29,553 4,275 3,088 11,517 7,686 15,270 29,840 23,542 9,316 17 134,104
1982 30,011 4,088 3,772 10,437 6,255 14,289 30,798 18,947 9,045 549 128,191
1983 27,001 3,912 2,432 10,108 4,636 14,649 27,645 23,156 8,161 10 121,7101984 32,388 4,757 2,578 15,417 5,848 13,921 33,898 38,940 8,352 5 156,1041985 28,763 5,136 2,830 16,351 5,308 16,996 30,675 33,643 9,648 ,25 149,375
1986 32,254 5,590 2,703 11,320 3,904 18,707 32,591 32,610 __~!,002 6 150,687
1987 35,301 7,925 3,157 11,763 4,771 24,734 44,823 33,386 13,343 13 179,2161988 42,899 9,716 4,322 13,197 7,925 32,920 60,303 48,892 16,135 25 236,334
1989 47,061 10,407 5,421 15,367 8,097 33,489 76,181 73,305 19:760 11 289,099
1990 55,002 11,988 6,679 19,285 8,123 35,361 78,035 83,083 20,828 8 318,392
1991 55,144 14,323 6,103 23,281 7,171 35,563 66,157 64,017 24,216 3 295,978 .
1992 54,924 12,944 4,098 19,961 8,799 38,204 60,401 59,519 25,842 1 284,6931993 48,546 10,648 5,250 16,100 9,551 35,363 56,473 48,059 23,010 ° 253,0001994 52,474 11,826 5,649 17,079 8,422 36,685 52,216 53,933 21,811 1 260,096
1995 61,296 13,082 7,222 17,771 8,518 45,227 62,168 76,020 25,354 1 316,6591996 66,437 8,634 7,398 22,949 22,253 46,476 68,238 76,324 32,137 350,846
1997 67,910 13,510 9,464 24,678 13,399 51,175 60,675 82,835 39,492 4 363,142
137
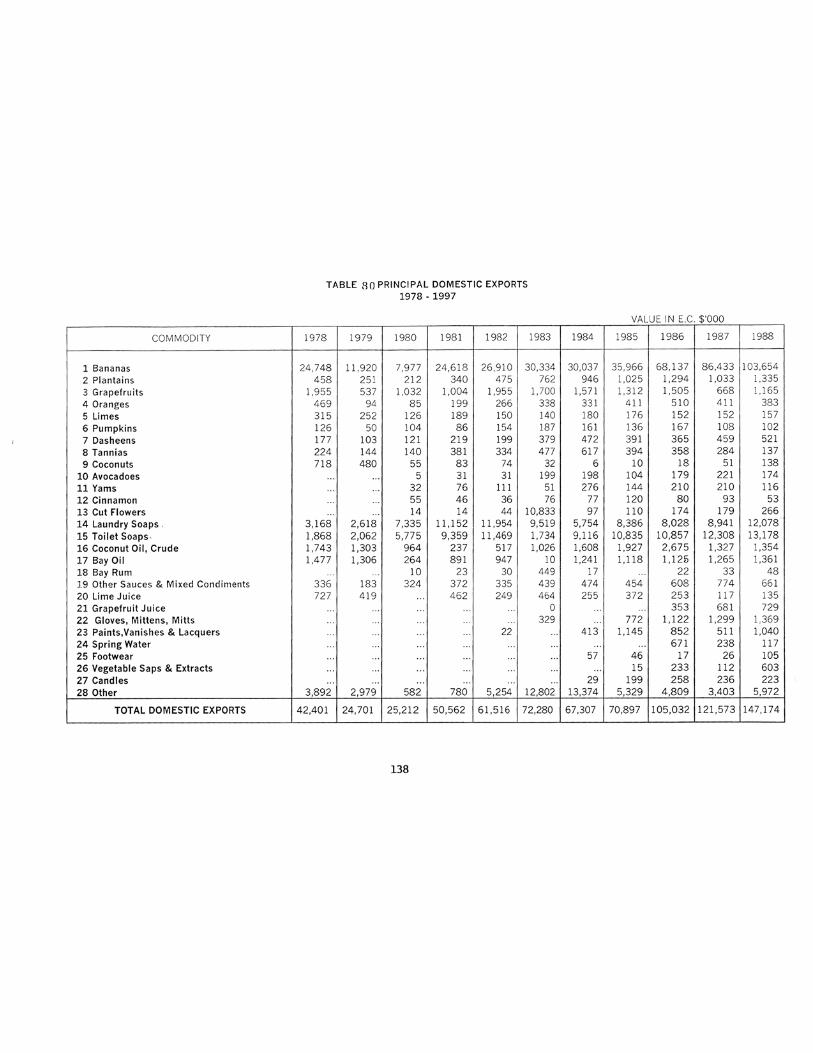
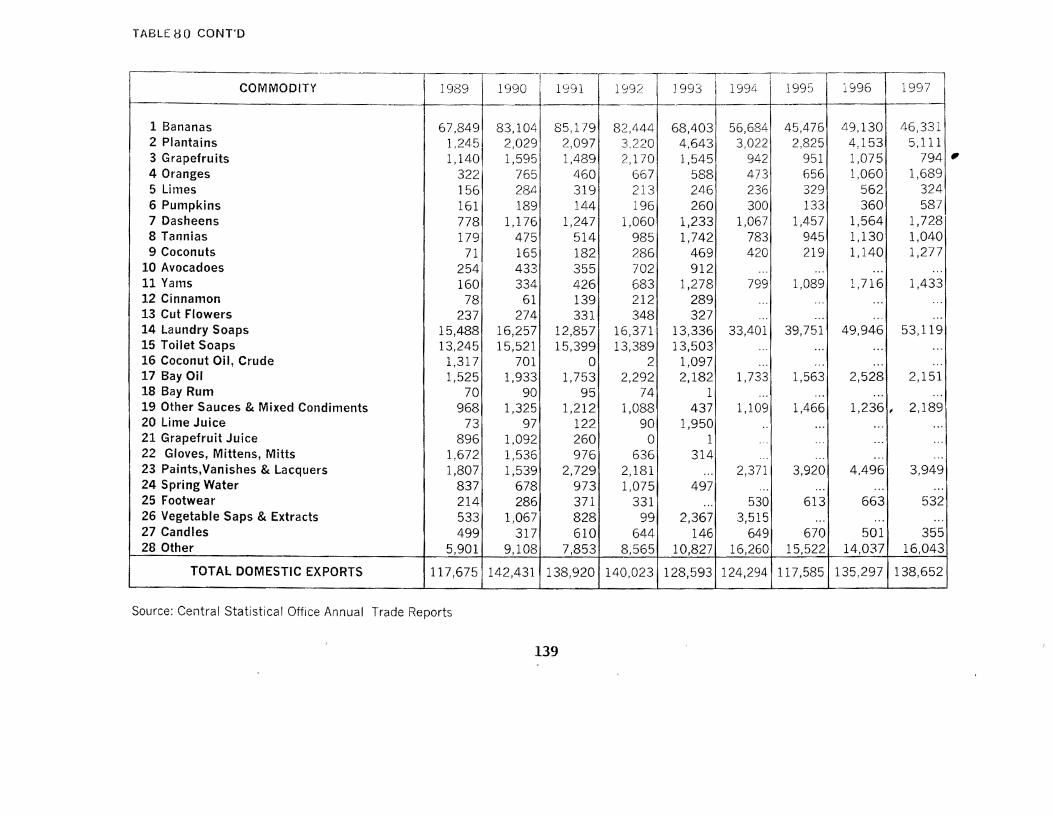
TABLE HO CONT~D
I -19971
I I
COMMODITY 1990 I J993I
1994 1995 19961989 1991 1992 I
I
1 Bananas 67,849 83,104 85,179 82,444 68,403 56,684 45,476 49,130 46,3312 Plantains 1,245 2,029 2:097 3,220 4,643 3,022 2,825 4,153 5,1113 Grapefruits 1,140 1,595 1,489 2,170 1,545 942 951 1,075 7944 Oranges 322 765 460 667 588 473 656 1,060 1,6895 Lirnes 156 284 319 213 246 236 329 562 3246 Pumpkins 161 189 144 196 260 300 133 360 5877 Dasheens 778 1,176 1,247 1,060 1,233 1,067 1,457 1,564 1,7288 Tannias 179 475 514 985 1,742 783 945 1,130 1,0409 Coconuts 71 165 182 286 469 420 219 1,140 1,277
10 Avocadoes 254 433 355 702 912 '" ... ... ...11 Yams 160 334 426 683 1,278 799 1,089 1,716 1,43312 Cinnalllon 78 61 139 212 289 '" ... ... ...13 Cut Flowers 237 274 331 348 327 ... ... '" .,.
14 Laundry Soaps 15,488 16,257 12,857 16,371 13,336 33,401 39,751 49,946 53,11915 Toilet Soaps 13,245 15,521 15,399 13,389 13,503 .,. ... ... ...16 Coconut Oil, Crude 1,317 701 0 2 1,097 ... ... ... ...17 Bay Oil 1,525 1,933 1,753 2,292 2,182 1,733 1,563 2,528 2,15118 Bay Rum 70 90 95 74 1 ... ... ... ...19 Other Sauces & Mixed Condiments 968 1,325 1,212 1,088 437 1,109 1,466 1,236 , 2,18920 Lime Juice 73 97 122 90 1,950 .. ... ... .. ,
21 Grapefruit Juice 896 1:092 260 0 1 ... ... ... .. ,
22 Gloves~ Mittens, Mitts 1,672 1,536 976 636 314 ... ... ... ...
23 Paints,Vanishes & Lacquers 1,807 1,539 2,729 2,181 ... 2,371 3,920 4,496 3,94924 Spring Water 837 678 973 1,075 497 '" ... ... ...25 Footwear 214 286 371 331 ... 530 613 663 53226 Vegetable Saps & Extracts 533 1,067 828 99 2,367 3,515 ... ... ...27 Candles 499 317 610 644 146 649 670 501 35528 Other 5,901 9,108 7,853 8,565 10,827 16,260 15,522 14,037 16,043
TOTAL DOMESTIC EXPORTS 117,675 142,431 138,920 140,023 128,593 124,294 117,585 135,297 138,652
Source: Central Statistical Office Annual Trade Reports
139
,

TABLE bi 1MPORTS or PRINCiPf\.L l'i'ElViS1-3, #~ ]_ 99 'j'
I-,-- - -----~-------- ---,.._~--
1987!I COMMODITY 1978 1979 1980 1981 1982 i 1983 1984 1985 1986
!- r
7,772 11 Meat & Meat Products 4,834 3,143 4,350 5.817 5,480: 5,682 6,537 7,583 8,986
2 Butter,Milk & Cheese 3,561 2,752 3,858 5.031 4,448! 4,364 4,364 4,116 5,176 5,133
3 Fish & Fish Preparation 1,597 1,350 964 1,605 1,548: 1,450 1,778 1,85°1 1,794 1,749
4 RiceI
1,105 837 1,361 1,006559 385 176 991 1,0821 555I I
5 Flour, Wheat 3,352 2,562 4,580 4,785 5.097
1
5,353 5,083 5,206' 4,678 5,504
6 Sugar 2,363 2,602 3,740 2,809 4,573 1,680 3,774 850 2,288 1,935
7 Animal Feed 747 556 701 1,003 1,2021 1,169 971 1,026 921 971
8 Margarine 893 701 936 1,270 1,2051 1,262 1,268 1,219 1,219 1,089
9 Liquor 2,380 2,195 3,475 3,860 3,2751 3,186 3,739 4,049 4,469 5,89410 Wood & Lumber 1,487 1,665 7,849 3,862 3,5851 2,334 3,036 3,407 346 4,31611 Gasolene 2,359 1,741 5,130 6,055 5,569
1
4,409 4,806 5,323 3,553 4,22012 Kerosene 241 79 726 688 647 626 607 634 503 36613 Other Fuels 898 992 4,206 3,622 2,593 1,311 4,114 6,866 4,650 4,62214 Medical & Pharmaceutical Prod. 1,852 1,027 1,679 1,522 1,899 1,247 1,749 1,819 1,872 2,18515 Manures 2,420 2,994 3,749 4,259 3,622 3,372 3,083 4,069 3,523 5,594.16 Cardboard boxes 5,261 2,268 2,442 7,187 7,072 6~O88 6,541 7,530 8,613 16,54717 Cement 352 78 1,698 2,444 1,783 1,738 2,537 2,554 2,277 2,37318 Metal & their Products 4,339 4,537 12,402 11,560 8,861 10,480 14,739 10,~1 10,616 11,348
I 19 Machinery other than Electric 3,795 2,537 5,813 6.599 3,040 7.028 14,194 15,105 8,597 11,336I 20 Machinery Electric 2,470 3.437 6,721 6,792 5,022 1 8,060 7,482 5,715 14,606 9,962
21 Transport Equipment 6,173 6,190 13,400 8,260 6,462 7.750 17,264 12,823 9,406 12,08922 Clothing 1,125 685 1,254 1,410 1,643 1,518 1,656 2,653 2,178 2,62923 Footwear 915 523 1,084 1,249 1,062 1,157 1,179 1,217 1,725 1,78124 Liquified Propane & Butane Gas ... .., .,. ". ... ." ... ... .. , '"
Sub-total 53,973 44,999 90,933 92,680 80,770 81,819 112,841 105,826 101,954 121,635Other IInports 22,797 14,971 37,797 41,424 47,421 39,893 43,263 43,550 48,733 57,581
TOTAL IMPORTS 76,770 59,970 128,730 134,104 128,191 121,712 156,104 149,376 150,687 '179,216
140
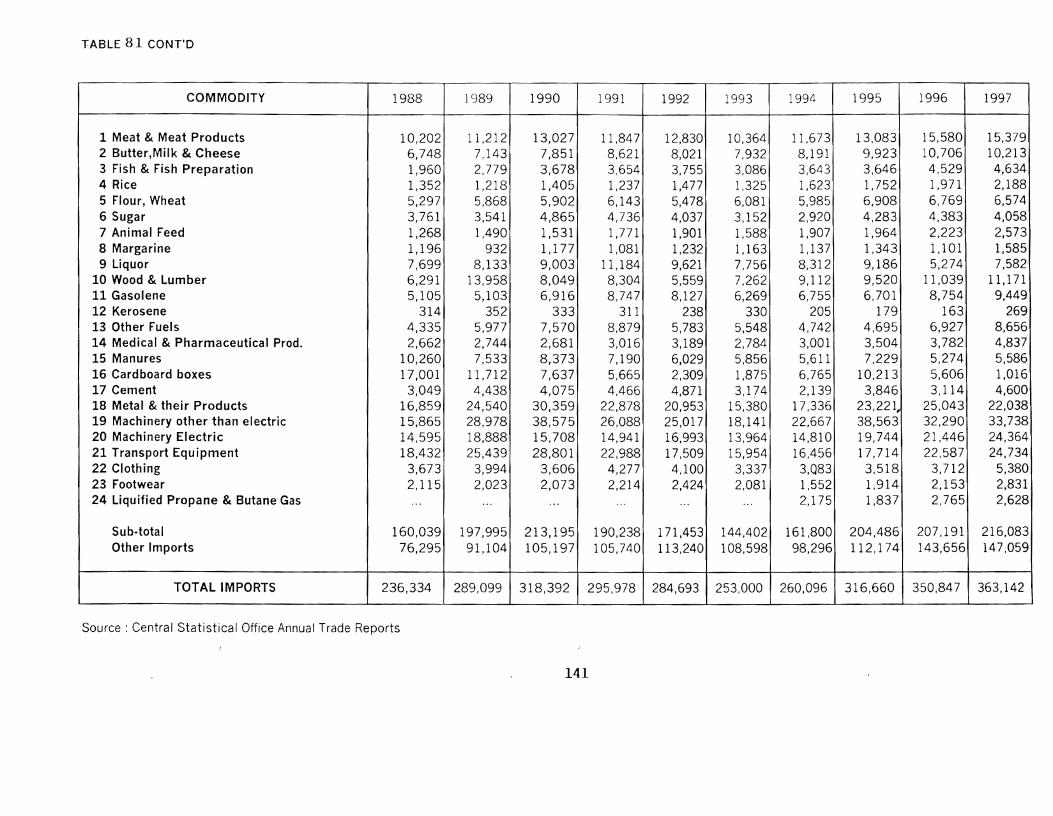
TABLE 81 CONT'D
CO:MMODITY 1988 1989 1990 1991 1992 1993 1994 1995 1996 1997
1 Meat & Meat Products 10,202 11 ,212 13,027 11,847 12,830 10,364 11,673 13,083 15,580 15,3792 Butter,Milk & Cheese 6,748 7,143 7,851 8,621 8,021 7,932 8,191 9,923 10,706 10,2133 Fish & Fish Preparation 1,960 2,779 3,678 3,654 3,755 3,086 3,643 3,646 4,529 4,6344 Rice 1,352 1,218 1,405 1,237 1,477 1,325 1,623 1,752 1,971 2,1885 Flour, Wheat 5,297 5,868 5,902 6,143 5,478 6,081 5,985 6,908 6,769 6,5746 Sugar 3,761 3,541 4,865 4,736 4,037 3,152 2,920 4,283 4,383 4,0587 Animal Feed 1,268 1,490 1,531 1,771 1,901 1,588 1,907 1,964 2,223 2,5738 Margarine 1,196 932 1,177 1,081 1,232 1,163 1,137 1,343 1,101 1,5859 Liquor 7,699 8,133 9,003 11,184 9,621 7,756 8,312 9,186 5,274 7,582
10 Wood & Lumber 6,291 13,958 8,049 8,304 5,559 7,262 9,112 9,520 11,039 11,17111 Gasolene 5,105 5,103 6,916 8,747 8,127 6,269 6,755 6,701 8,754 9,44912 Kerosene 314 352 333 311 238 330 205 179 163 26913 Other Fuels 4,335 5,977 7,570 8,879 5,783 5,548 4,742 4,695 6,927 8,65614 Medical & Pharmaceutical Prod. 2,662 2,744 2,681 3,016 3,189 2,784 3,001 3,504 3,782 4,83715 Manures 10,260 7,533 8,373 7,190 6,029 5,856 5,611 7,229 5,274 5,58616 Cardboard boxes 17,001 11,712 7,637 5,665 2,309 1,875 6,765 10,213 5,606 1,01617 Cement 3,049 4,438 4,075 4,466 4,871 3,174 2,139 3,846 3,114 4,60018 Metal & their Products 16,859 24,540 30,359 22,878 20,953 15,380 17,336 23,221, 25,043 22,03819 Machinery other than electric 15,865 28,978 38,575 26,088 25,017 18,141 22,667 38,563 32,290 33,73820 Machinery Electric 14,595 18,888 15,708 14,941 16,993 13,964 14,810 19,744 21,446 24,36421 Transport Equipment 18,432 25,439 28,801 22,988 17,509 15,954 16,456 17,714 22,587 24,73422 Clothing 3,673 3,994 3,606 4,277 4,100 3,337 3,Q83 3,518 3,712 5,38023 Footwear 2,115 2,023 2,073 2,214 2,424 2,081 1,552 1,914 2,153 2,83124 Liquified Propane & Butane Gas ... ..' ... . .. ... ' .. 2,175 1,837 2,765 2,628
Sub-total 160,039 197,995 213,195 190,238 171,453 144,402 161,800 204,486 207,191 216,083Other Imports 76,295 91,104 105,197 105,740 113,240 108,598 98,296 112,174 143,656 147,059
TOTAL IMPORTS 236,334 289,099 318,392 295,978 284,693 253,000 260,096 316,660 350,847 363,142
Source: Central Statistical Office Annual Trade Reports
141
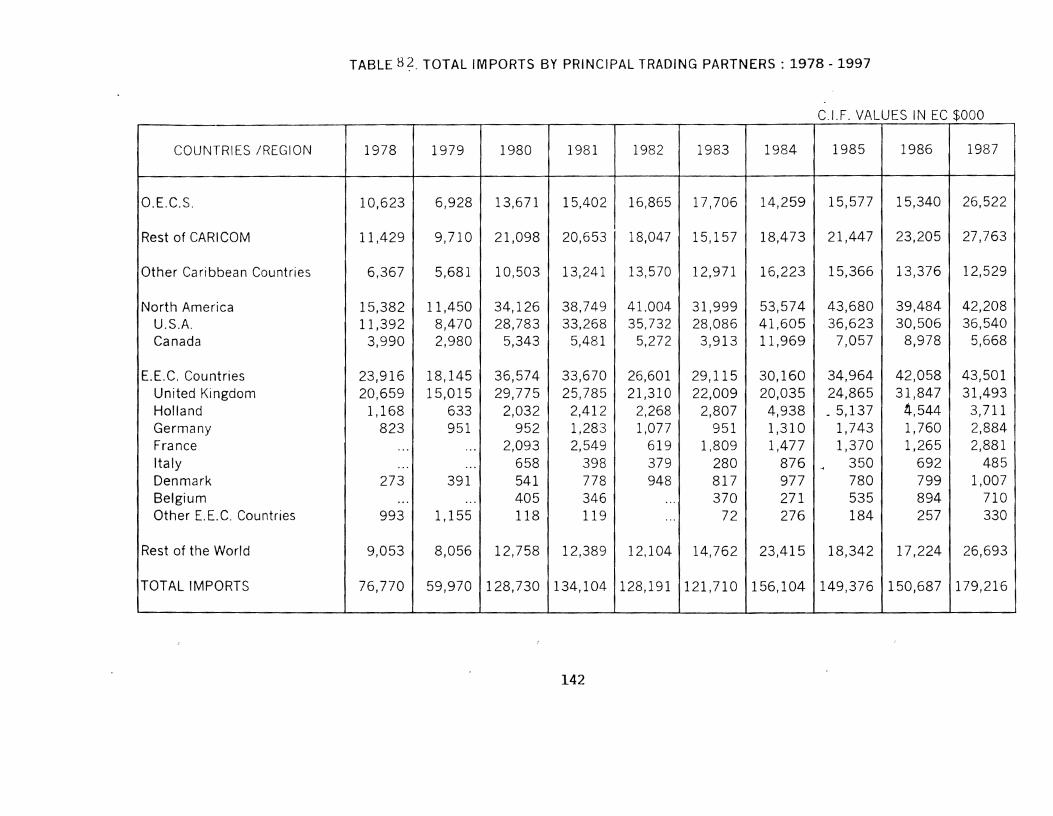
TABLE 8? TOTAL IMPORTS BY PRINCIPAL TRADING PARTNERS: 1978 - 1997
C.I.F. VALUES IN EC $000
COUNTRIES IREGION 1978 1979 1980 1981 1982 1983 1984 1985 1986 1987
O.E.C.S. 10,623 6,928 13,671 15,402 16,865 17,706 14,259 15,577 15,340 26,522
Rest of CARICOM 11,429 9,710 21,098 20,653 18,047 15,157 18,473 21,447 23,205 27,763
Other Caribbean Countries 6,367 5,681 10,503 13,241 13,570 12,971 16,223 15,366 13,376 12,529
North America 15,382 11,450 34,126 38,749 41.004 31,999 53,574 43,680 39,484 42,208U.S.A. 11,392 8,470 28,783 33,268 35,732 28,086 41,605 36,623 30,506 36,540Canada 3,990 2,980 5,343 5,481 5,272 3,913 11,969 7,057 8,978 5,668
E.E.C. Countries 23,916 18,145 36,574 33,670 26,601 29,115 30,160 34,964 42,058 43,501United Kingdom 20,659 15,015 29,775 25,785 21,310 22,009 20,035 24,865 31,847 31,493Holland 1,168 633 2,032 2,412 2,268 2,807 4,938 ~ 5,137 4,544 3,711Germany 823 951 952 1,283 1,077 951 1,310 1,743 1,760 2,884France ... ... 2,093 2,549 619 1,809 1,477 1,370 1,265 2,881Italy ... ... 658 398 379 280 876 .. 350 692 485Denmark 273 391 541 778 948 817 977 780 799 1,007Belgium ... ... 405 346 ... 370 271 535 894 710Other E. E. C. Countries 993 1,155 118 119 ... 72 276 184 257 330
Rest of the World 9,053 8,056 12,758 12,389 12,104 14,762 23,415 18,342 17,224 26,693
TOTAL IMPORTS 76,770 59,970 128,730 134,104 128,191 121,710 156,104 149,376 150,687 179,21'6
142
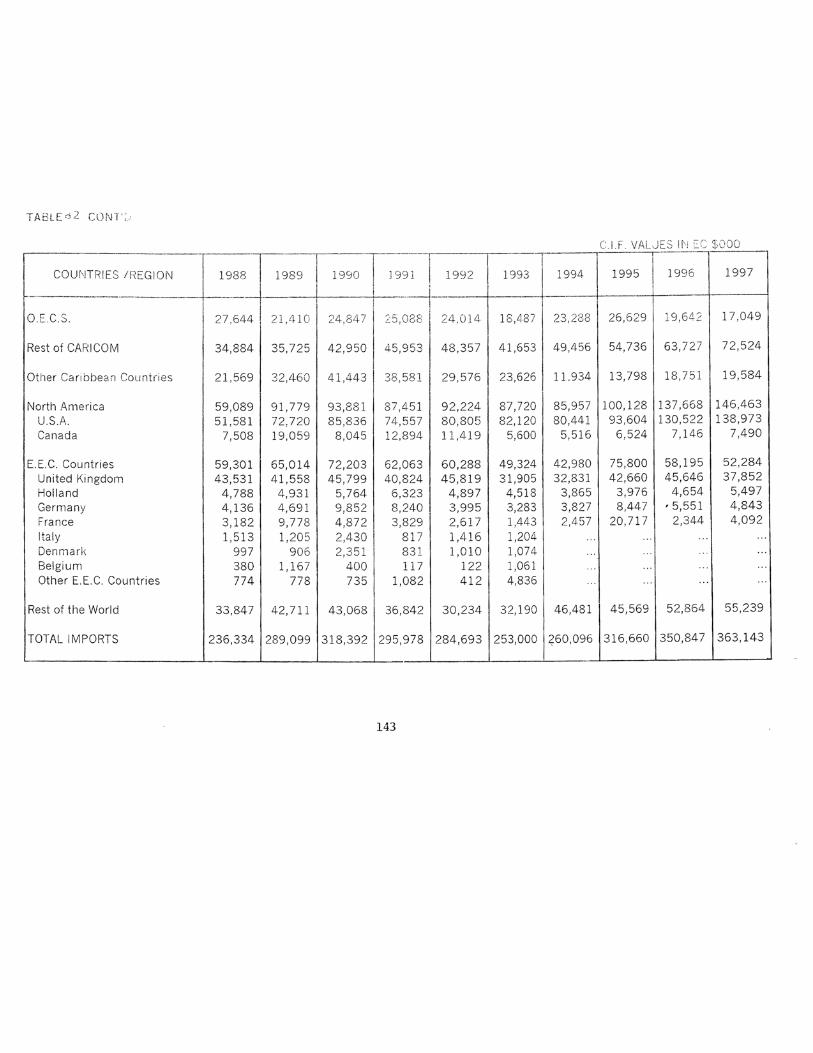
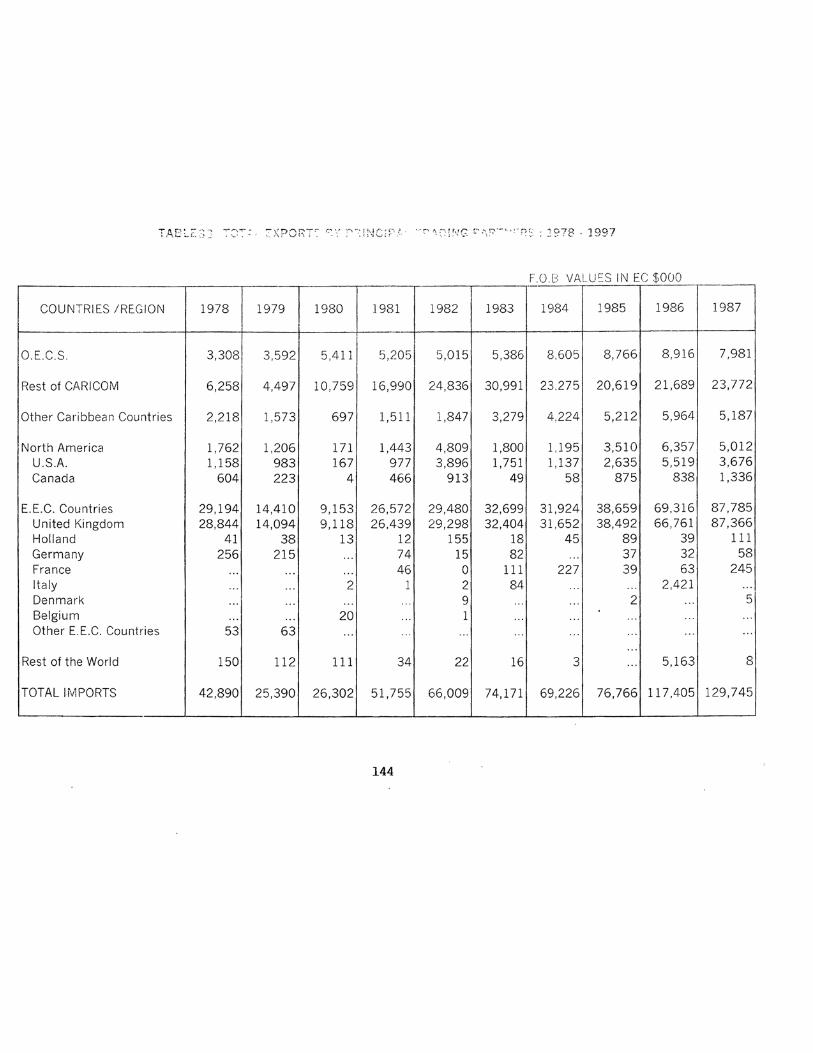
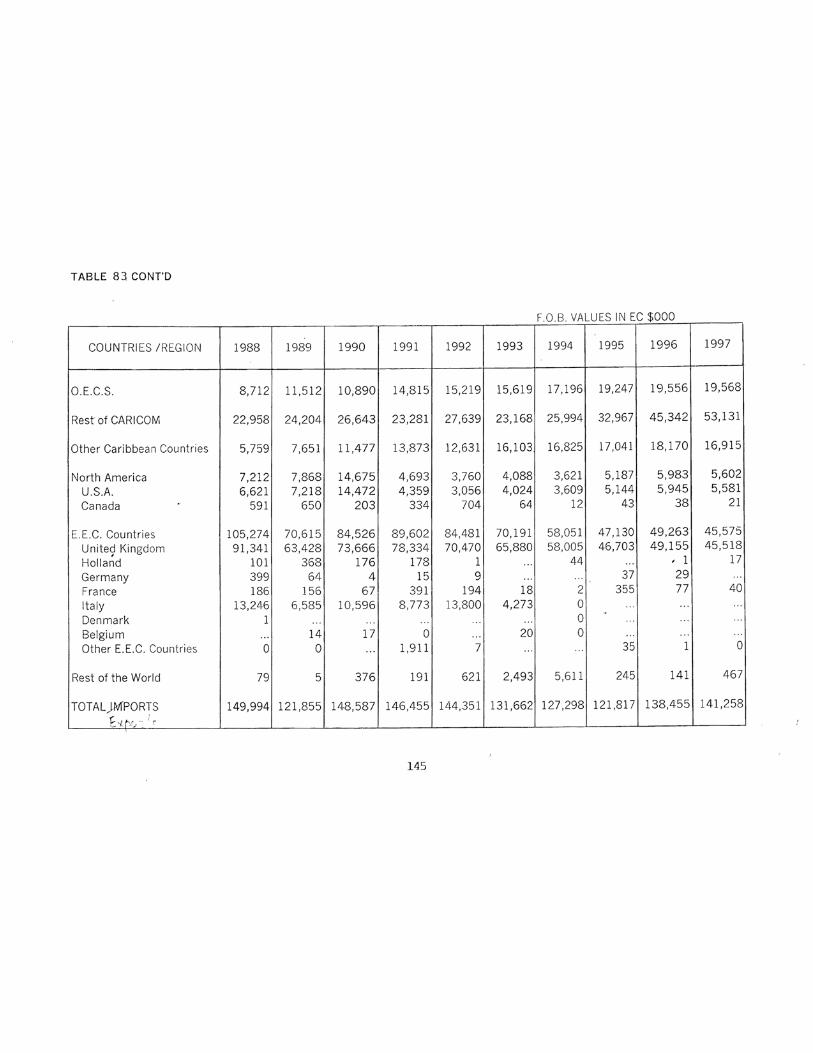

TABLER4 TOTAL EXPORTS TO CARICOM COUNTRIES :1978 - 1997
F.O.B. VALUES IN EC $000
COUNTRIES IREGION 1978 1979 1980 1981 1982 1983 1984 1985 1986 1987
O~£.C;-S.- 3,308· 3,592 5,410 5,206 5,015 5,386 8,606 8,767 8,916 7,981
Antigua 866 1265 1056 1267 2977 1757 2573 1,674
Grenada 1064 743 1099 937 1901 1707 1295 1,344
Montserrat 111 45 113 150 83 337 95 93
St.Kitts/NevislAnguilla 559 531 554 885 1024 786 1097 1,146
St.Lucia 1675 1411 1230 1378 1414 1932 1902 2,179
SLVincent 1135 1211 963 769 1207 2248 1954 1,545
REST OF CARICOM 6,258 4,497 10,761 16,990 24,836 30,991 23,275 20,620 21,689 23,773
"Bahamas ... ... 1 68 38
Barbados 1431 1611 1392 1753 2099 3334 4047 2,466Belize ... 93 1 ... ... 2 ... 1Guyana 5 ... 163 379 645 2'721 2243 1,943Jamaica 8115 14083 22907 20962 10775 11292 11831 11,628Trinidad & Tobago 1210 1203 373 7897 9758 3270 3500 7,697Suriname
TOTAL EXPORTS TO CARICOM 9,566 8,089 16,171 22,196 29,851 36,377 31,881 29,387 30,605 31,754
146
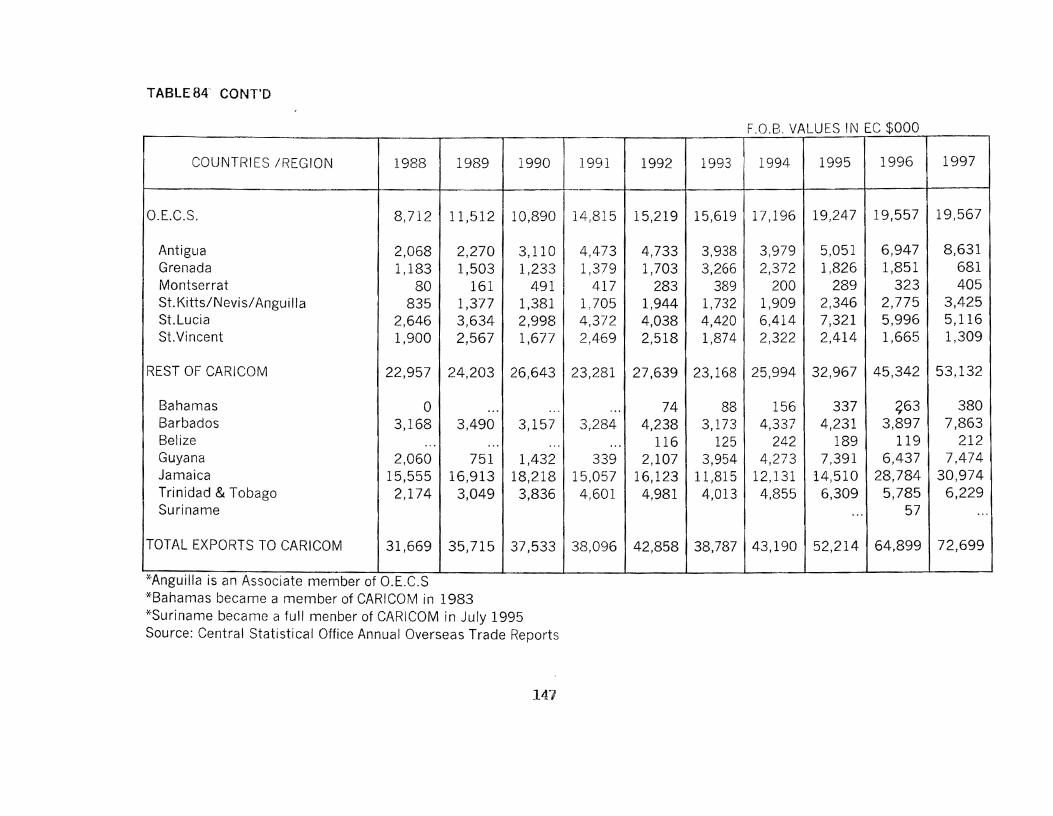
TABLE 84"' CONT'D
F.O.B. VALUES IN EC $000
COUNTRIES /REGION 1988 1989 1990 1991 1992 1993 1994 1995 1996 1997
G.E.C.S. 8,712 11,512 10,890 14,815 15,219 15,619 17,196 19,247 19,557 19,567
Antigua 2,068 2,270 3,110 4,473 4,733 3,938 3,979 5,051 6,947 8,631Grenada 1,183 1,503 1,233 1,379 1,703 3,266 2,372 1,826 1,851 681Montserrat 80 161 491 417 283 389 200 289 323 405St. Kitts/Nevis/Angui Iia 835 1,377 1,381 1,705 1,944 1,732 1,909 2,346 2,775 3,425St.Lucia 2,646 3,634 2,998 4,372 4,038 4,420 6,414 7,321 5,996 5,116St.Vincent 1,900 2,567 1,677 2,469 2,518 1,874 2,322 2,414 1,665 1,309
REST OF CARICOM 22,957 24,203 26,643 23,281 27,639 23,168 25,994 32,967 45,342 53,132
Bahamas 0 ... ... ... 74 88 156 337 ~63 380Barbados 3,168 3,490 3,157 3,284 4,238 3,173 4,337 4,231 3,897 7,863Belize ... ... ... ... 116 125 242 189 119 212Guyana 2,060 751 1,432 339 2,107 3,954 4,273 7,391 6,437 7,474Jamaica 15,555 16,913 18,218 15,057 16,123 11,815 12,131 14,510 28,784 30,974Trinidad & Tobago 2,174 3,049 3,836 4,601 4,981 4,013 4,855 6,309 5,785 6,229Suriname ... 57 ...
TOTAL EXPORTS TO CARICOM 31,669 35,715 37,533 38,096 42,858 38,787 43,190 52,214 64,899 72,699
-X-Anguilla is an Associate member of O.E.C.S-x-Bahamas became a member of CARICOM in 1983-x-Suriname became a full menber of CARl COM in July 1995Source: Central Statistical Office Annual Overseas Trade Reports
147
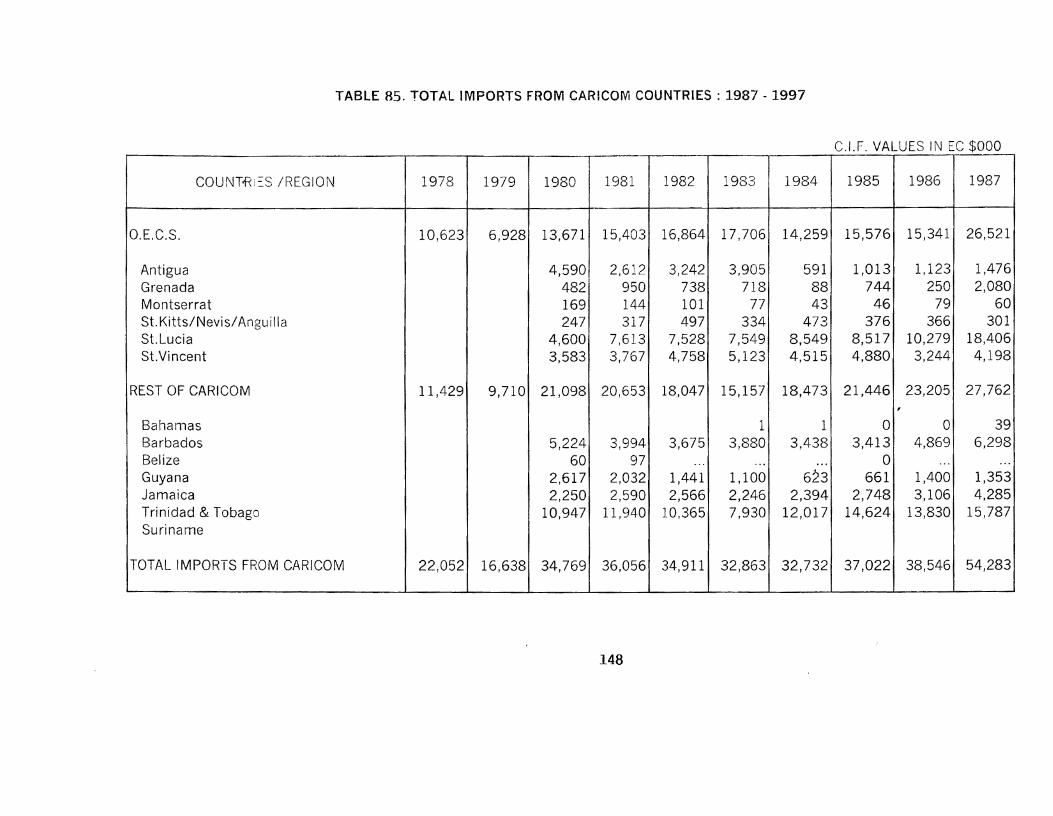
TABLE 85. TOTAL IMPORTS FROM CARICOM COUNTRIES: 1987 - 1997
C.I.F. VALUES IN EC $000
COUNTf<i ~S IREGION 1978 1979 1980 1981 1982 1983 1984 1985 1986 1987
G.E.C.S. 10,623 6,928 13,671 15,403 16,864 17,706 14,259 15,576 15,341 26,521
Antigua 4,590 2,612 3,242 3,905 591 1,013 1,123 1,476Grenada 482 950 738 718 88 744 250 2,080Montserrat 169 144 101 77 43 46 79 60St. Kitts/Nevis/Angui Iia 247 317 497 334 473 376 366 301St.Lucia 4,600 7,613 7,528 7,549 8,549 8,517 10,279 18,406St.Vincent 3,583 3,767 4,758 5,123 4,515 4,880 3,244 4,198
REST OF CARICOM 11,429 9,710 21,098 20,653 18,047 15,157 18,473 21,446 23,205 27,762,
Bahamas 1 1 0 0 39Barbados 5,224 3,994 3,675 3,880 3,438 3,413 4,869 6,298Belize 60 97 ... ... ... ° ... ...Guyana 2,617 2,032 1,441 1,100 623 661 1,400 1,353Jamaica 2,250 2,590 2,566 2,246 2,394 2,748 3,106 4,285Trinidad & Tobago 10,947 11,940 10,365 7,930 12,017 14,624 13,830 15,787Suriname
TOTAL IMPORTS FROM CARICOM 22,052 16,638 34,769 36,056 34,911 32,863 32,732 37,022 38,546 54,283
148
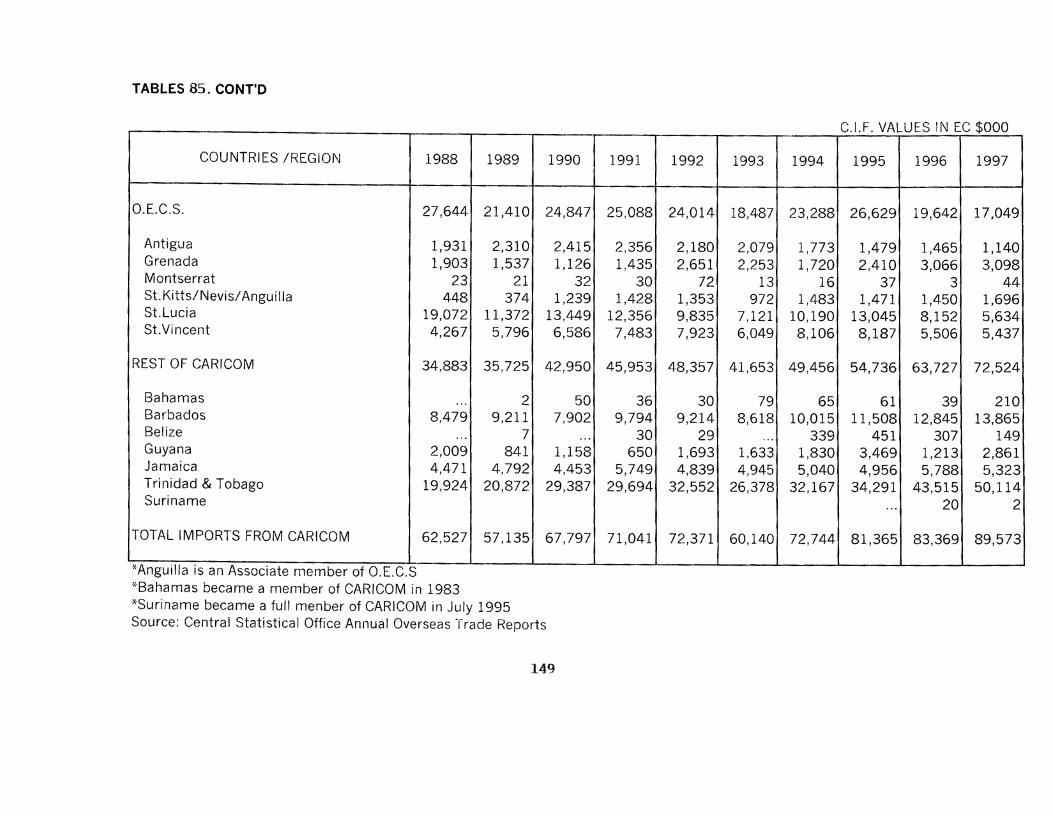
TABLES 85. CONT'O
C.I.F. VALUES IN EC $000
COUNTRIES /REGIOl'J 1988 1989 1990 1991 1992 1993 1994 1995 1996 1997
G.E.C.S. 27,644 21,410 24,847 25,088 24,014 18,487 23,288 26,629 19,642 17,049
Antigua 1,931 2,310 2,415 2,356 2,180 2,079 1,773 1,479 1,465 1,140Grenada 1,903 1,537 1,126 1,435 2,651 2,253 1,720 2,410 3,066 3,098Montserrat 23 21 32 30 72 13 16 37 3 44St. Kitts/Nevis/Anguilla 448 374 1,239 1,428 1,353 972 1,483 1,471 1,450 1,696St.Lucia 19,072 11,372 13,449 12,356 9,835 7,121 10,190 13,045 8,152 5,634St.Vincent 4,267 5,796 6,586 7,483 7,923 6,049 8,106 8,187 5,506 5,437
REST OF CARICOM 34,883 35,725 42,950 45,953 48,357 41,653 49,456 54,736 63,727 72,524
Bahamas ... 2 50 36 30 79 65 61 39 210Barbados 8,479 9,211 7,902 9,794 9,214 8,618 10,015 11,508 12,845 13,865Belize ... 7 ... 30 29 ... 339 451 307 149Guyana 2,009 841 1,158 650 1,693 1,633 1,830 3,469 1,213 2,861Jamaica 4,471 4,792 4,453 5,749 4,839 4,945 5,040 4,956 5,788 5,323Trinidad & Tobago 19,924 20,872 29,387 29,694 32,552 26,378 32,167 34,291 43,515 50,114Suriname ... 20 2
TOTAL IMPORTS FROM CARICOM 62,527 57,135 67,797 71,041 72,371 60,140 72,744 81,365 83,369 89,573
-X-Anguilla is an Associate member of O.E.C.S-x-Bahamas became a member of CARICOM in 1983-x-Suriname became a full menber of CARICOM in July 1995Source: Central Statistical Office Annual Overseas Trade Reports
149

SECTION XII: FACILITIES
Water Distribution
The Number of metered households increased from 145 in 1987 to 6387 in 1997.
This sharp increase was influence by the new system for meter installation in newly
built structures and reconnected buildings. The old system of fixed rate still exists in
5,717 structures. Domestic consumption of water moved from 27 million gallons in
1987 to 307 million gallons in 1997. This rise in consumption was relative to the
increase from 7178 households, to the availability of water in 12,104 households in
1997. Again this increase in water distribution to households influenced the almost
stable consumption of water in standpipes, consuming an annual average of 165
million gallons since 1991. (Table 86).
The number of metered public institutions increased from 60 in 1987 to 153 in 1997.
In the 1991 Census period, water was privately available to 41.6% of total
households. However, 47.9% had access to public standpipe. This was evident
in the 47.5 % in standpipe consumption in the same period.
In 1997, household consumption accounted for 42.8°A, of total consumption while
standpipes registered 23.0°A,. The value of water consumption moved up from
$1.9m, in 1987 to $7.1 m, in 1997.
150
Electricity
The number of domestic consumers recorded 3458 in 1980, as households were
bein~ reconnected after the storms of 1979 and 1980.
In 1981, the Census period one out of three households (or 32.0%) was electrified.
In 1991, 88.9% of households were electrified. Electrified commercial and industrial
buildings moved from 288 in 1980 to 1774 in 1997. Domestic lighting increased from
3,453 to 20,903 over the same period.
The total value of electricity consumption increased from $1.9m, in 1980 to $37.1m,
in 1998 (Tables 87 and 88).
Tourist Accommodation
Over the 1988 to 1997 period, the number of hotels moved from 8 to 16, reflecting
100% increase with an additional 88 rooms. Guesthouses increased from 15 to 23,
adding 87 more rooms. Apartment and cottages recorded a 122.2% rise in nLlmber,
registering 20 units in 1998.
In 1988, all registered tourist accommodation numbered 32 with 400 available
rooms. In 1997, 59 was recorded with 679 rooms (Table 90).
151

Crime Statistics
In 1980, 63 indictable offences were recorded with burglary accounting for 39.7%.
However in 1998, numbers increased significantly to 1975 with burglary registering
77.6% of all offences (Table 91).
From 1982 to 1997, the number of offenders committed to prison rose by 70.4%,
registering 748 (committed during the year (1997).
The prison capacity moved from 250 in 1984 to 275 in 1997. Prisoners at the end of
the year were always below capacity except for 1993 when the 250 capacity was
exceeded by only 5. The daily average number of prisoners was also below capacity
throughout the period. Death by execution has not been instituted since 1985, when
only one political prisoner was executed.
152

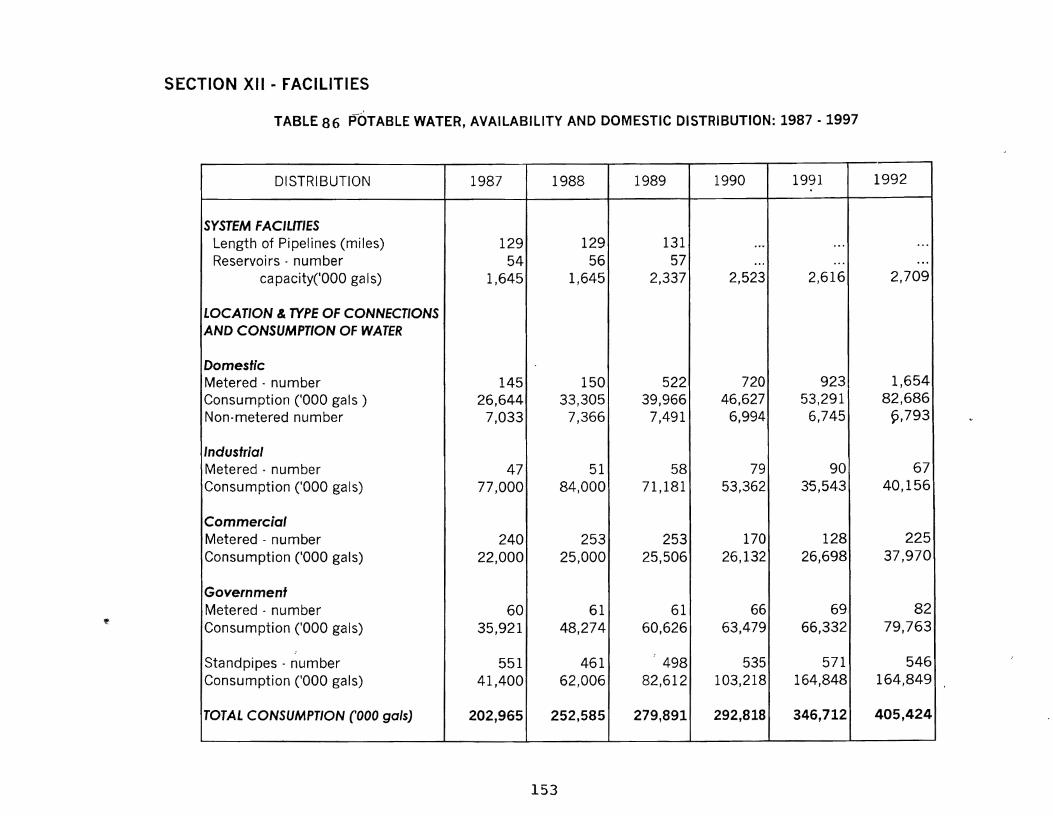
'fi
SECTION XII - FACILITIES
TABLE 86 POTABLE WATER, AVAILABILITY AND DOMESTIC DISTRIBUTION: 1987 - 1997
DISTRIBUTION 1987 1988 1989 1990 1991 1992
SYSTEM FACILITIESLength of Pipelines (miles) 129 129 131 ..-. ... ...Reservoirs· number 54 56 57 ... ... ...
capacity('OOO gals) 1,645 1,645 2,337 2,523 2,616 2,709
LOCATION & TYPE OF CONNECTIONSAND CONSUMPTION OF WATER
DomesticMetered· number 145 150 522 720 923 1,654Consumption COOO gals) 26,644 33,305 39,966 46,627 53,291 82,686Non-metered number 7,033 7,366 7,491 6,994 6,745 p,793
IndustrialMetered· number 47 51 58 79 90 67Consumption ('000 gals) 77,000 84,000 71,181 53,362 35,543 40,156
CommercialMetered - number 240 253 253 170 128 225Consumption COOO gals) 22,000 25,000 25,506 26,132 26,698 37,970
GovernmentMetered - number 60 61 61 66 69 82Consumption ('000 gals) 35,921 48,274 60,626 63,479 66,332 79,763
.'
Standpipes· number 551 461 498 535 571 546Consumption ('000 gals) 41,400 62,006 82,612 103,218 164,848 164,849
TOTAL CONSUMPTION (000 gals) 202,965 252,585 279,891 292,818 346,712 405,424
153
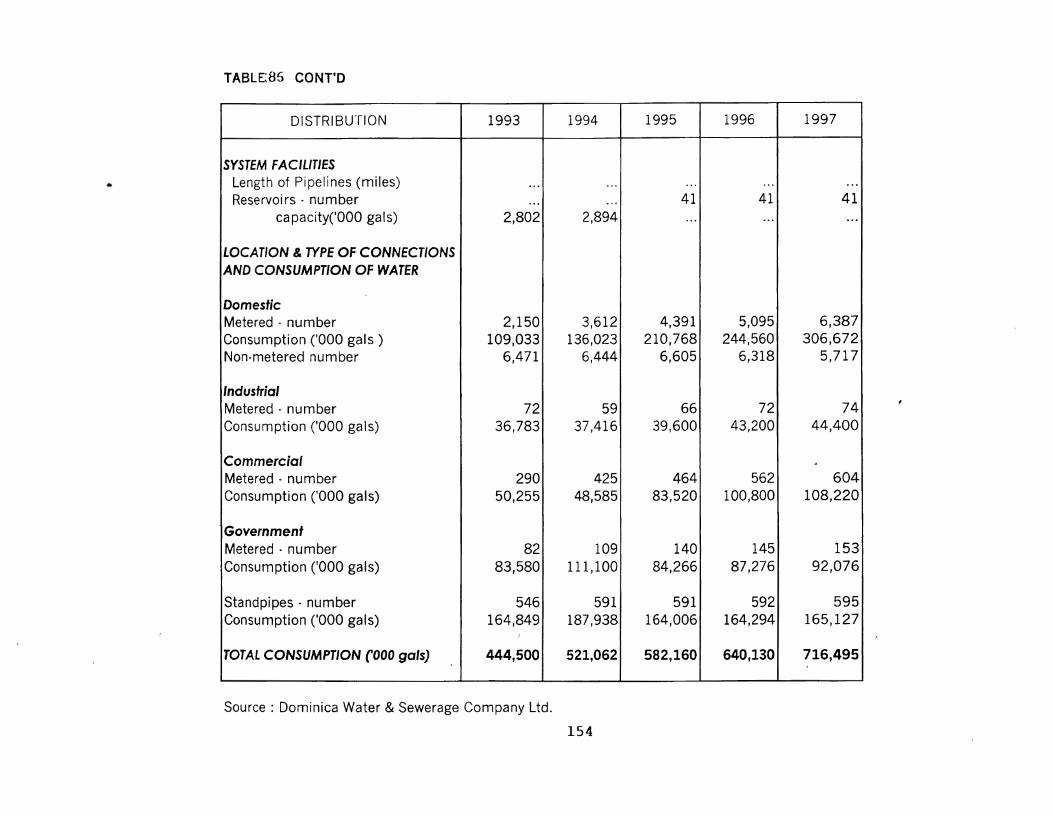
..
TABLE85 CONT'O
DISTRIBU'rION 1993 1994 1995 1996 1997
SYSTEM FACILITIESLength of Pipelines (miles) ... ... ... ... ...Reservoirs· number ... ... 41 41 41
capacity('OOO gals) 2,802 2,894 ... ... ...
LOCATION & TYPE OF CONNECTIONSAND CONSUMPTION OF WATER
DomesticMetered· number 2,150 3,612 4,391 5,095 6,387Consumption COOO gals) 109,033 136,023 210,768 244,560 306,672Non·metered number 6,471 6,444 6,605 6,318 5,717
IndustrialMetered· number 72 59 66 72 74Consumption ('000 gals) 36,783 37,416 39,600 43,200 44,400
CommercialMetered· number 290 425 464 562 604Consumption ('000 gals) 50,255 48,585 83,520 100,800 108,220
.GovernmentMetered· number 82 109 140 145 153Consumption ('000 gals) 83,580 111,100 84,266 87,276 92,076
Standpipes - number 546 591 591 592 595Consumption ('000 gals) 164,849 187,938 164,006 164,294 165,127
TOTAL CONSUMPTION (000 gals) 444,500 521,062 582,160 640,130 716,495
Source: Dominica Water & Sewerage Company Ltd.
154
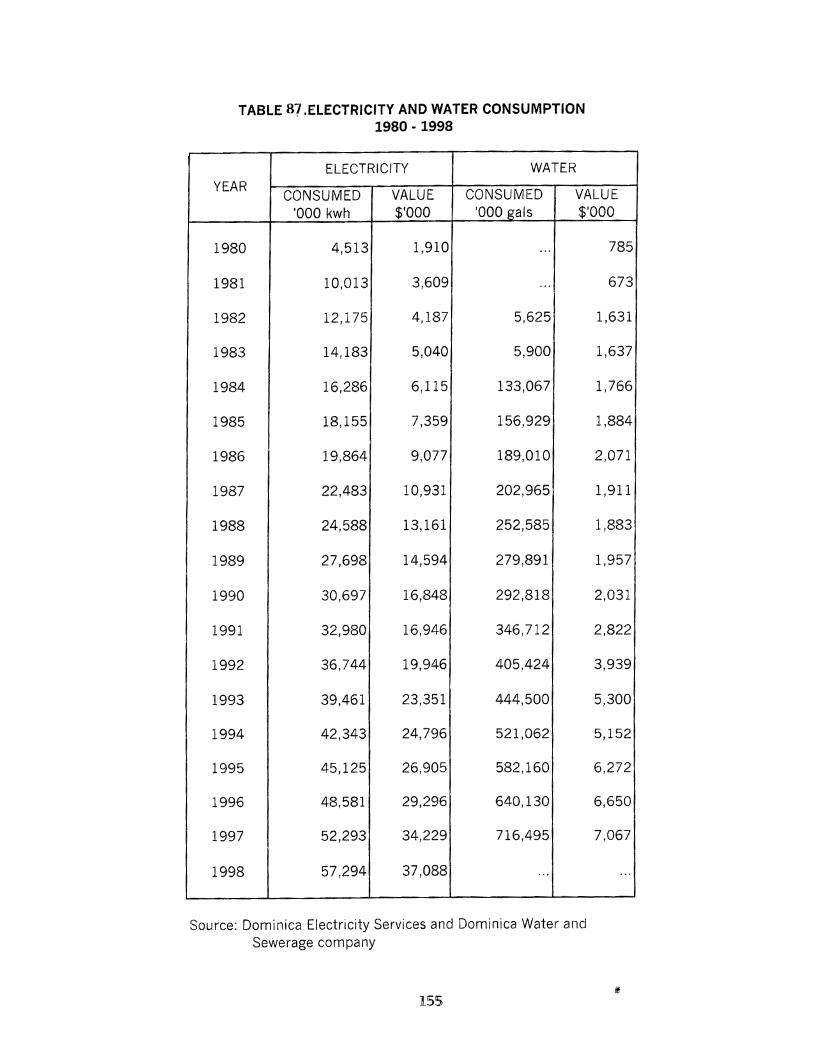
TABLE 87 .ELECTRICITY AND WATER CONSUMPTION1980 · 1998
ELECTRICITY WATER
YEARCONSUMED VALUE CONSUMED VALUE
'000 kwh $'000 1000 gals $'000
1980 4,513 1,910 ... 785
1981 10,013 3,609 ... 673
1982 12,175 4,187 5,625 1,631
1983 14,183 5,040 5,900 1,637
1984 16,286 6,115 133,067 1,766
1985 18,155 7,359 156,929 1,884
1986 19,864 9,077 189,010 2,071
1987 22,483 10,931 202,965 1,911
1988 24,588 13,161 252,585 1,883
1989 27,698 14,594 279,891 1,957
1990 30,697 16,848 292,818 2,031
1991 32,980 16,946 346,712 2,822
1992 36,744 19,946 405,424 3,939
1993 39,461 23,351 444,500 5,300
1994 42,343 24,796 521,062 5,152
1995 45,125 26,905 582,160 6,272
1996 48,581 29,296 640,130 6,650
1997 52,293 34,229 716,495 7,067
1998 57,294 37,088 ... ...
Source: Dominica Electricity Services and Dominica Water andSewerage company
155

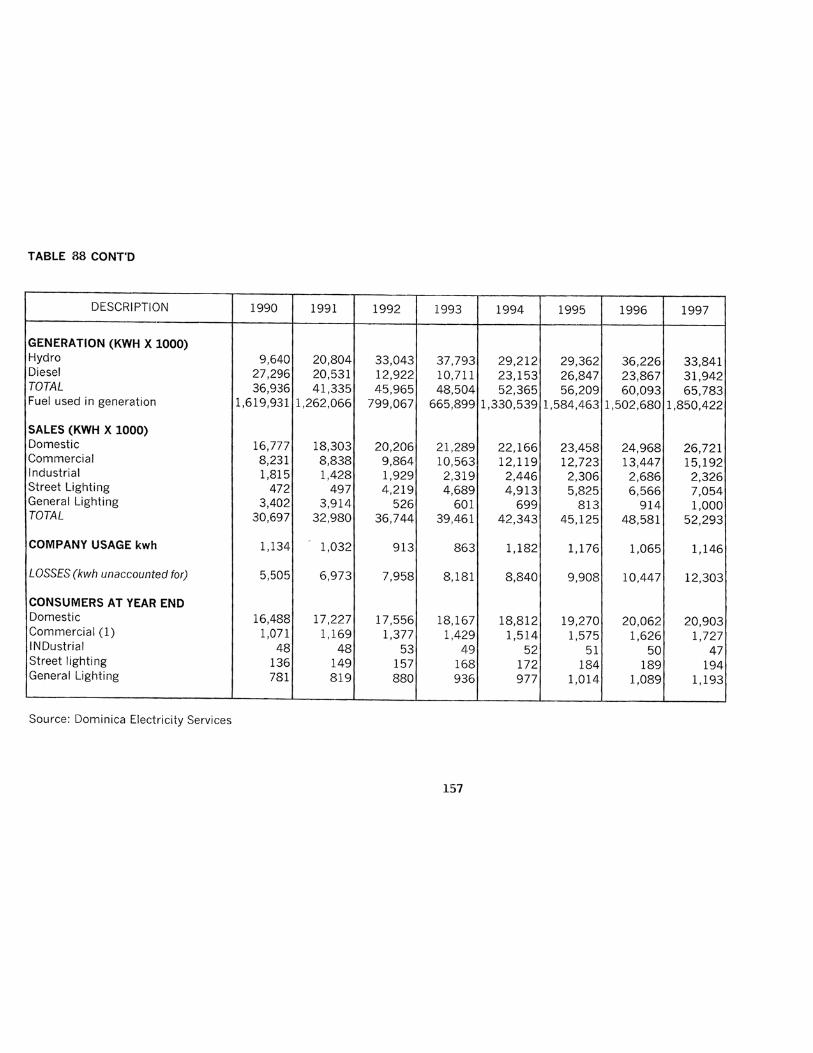
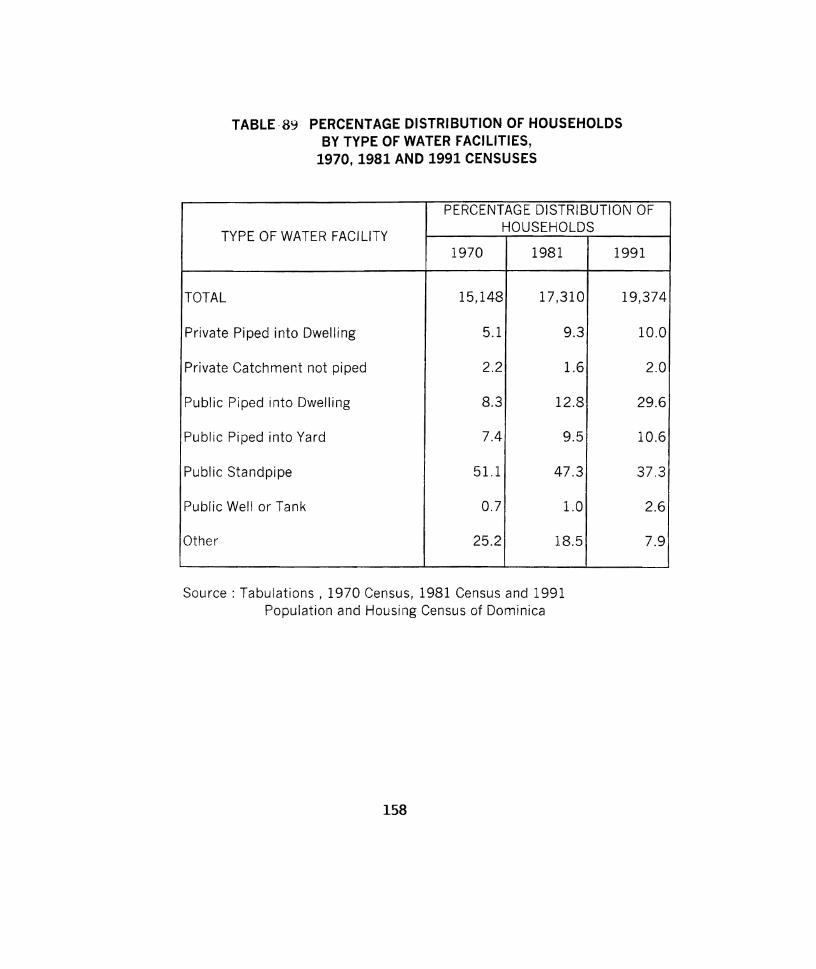
TABLE -89 PERCENTAGE DISTRIBUTION OF HOUSEHOLDSBY TYPE OF WATER FACILITIES,
1970, 1981 AND 1991 CENSUSES
PERCENTAGE DISTRIBUTION OF
TYPE OF WATER FACILITYHOUSEHOLDS
1970 1981 1991
TOTAL 15,148 17,310 19,374
Private Piped into Dwelling 5.1 9.3 10.0
Private Catchment not piped 2.2 1.6 2.0
Public Piped into Dwelling 8.3 12.8 29.6
Public Piped into Yard 7.4 9.5 10.6
Public Standpipe 51.1 47.3 37.3
Public Well or Tank 0.7 1.0 2.6
Other 25.2 18.5 7.9
Source: Tabulations, 1970 Census, 1981 Census and 1991Population and Housing Census of Dominica
158

TABLE' '90 NUMBER OF HOTELS,GUEST HOUSES AND APARTMENT/COTTAGES1988·1997
HOTELS GUEST HOUSESAPARTMENT
YEAR /COTTAGES
NO.NO.OF NO. NO.OF
NO. NO.OFROOMS ROOMS ROOMS
1988 8 241 15 128 9 31
1989 11 328 12 104 10 72
1990 12 335 14 120 13 76
1991 13 331 17 137 15 99
1992 14 341 18 152 21 110
1993 16 379 20 159 24 127
1994 17 409 21 175 32 173
1995 20 335 18 160 20 93
1996 17 422 24 225 25 117
1997 16 329 23 215 20 135
Source: Division of Tourism, National Development Corporation
159
•
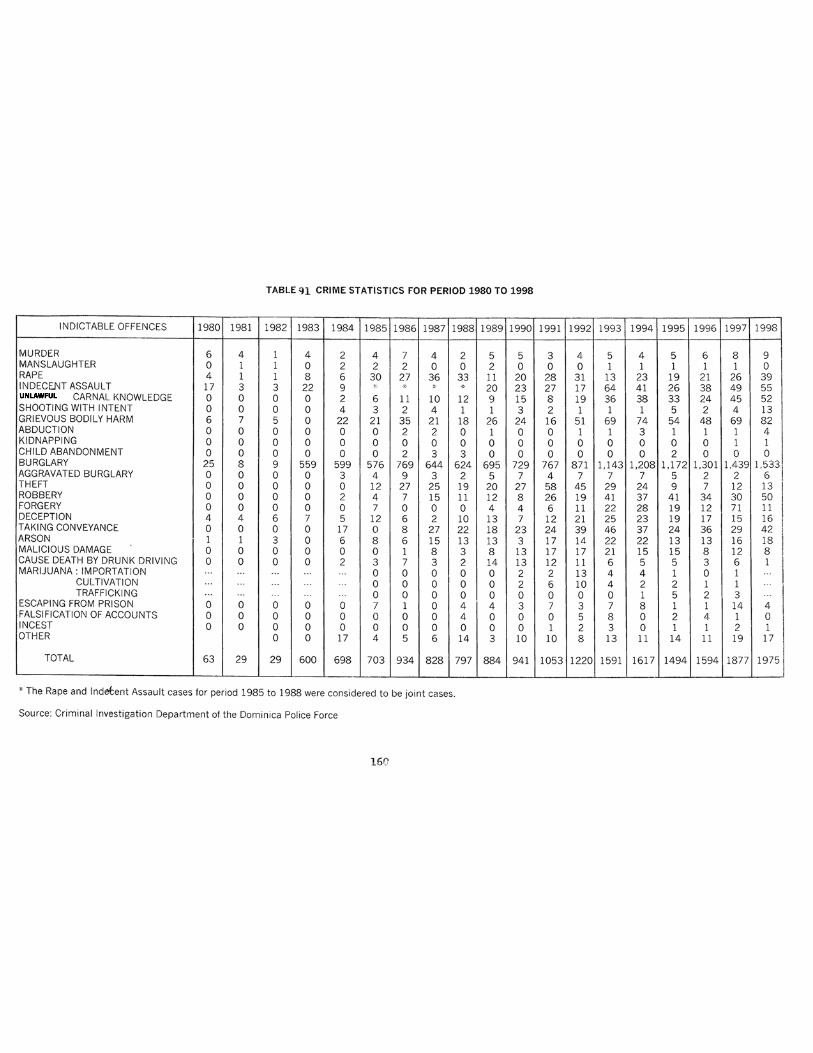
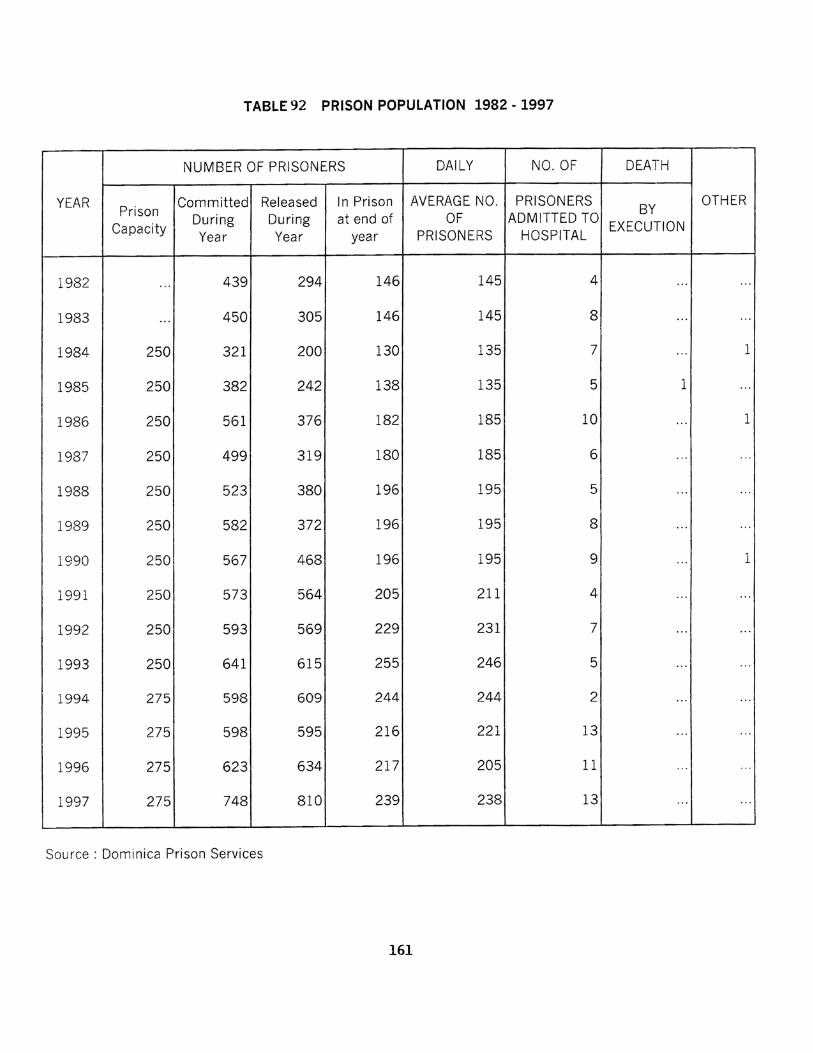

•