STATE OF THE PARK REPORT: - Stanley Park Ecology Society
229
State of the Park Report for the Ecological Integrity of Stanley Park A project of the Stanley Park Ecology Society Vancouver, British Columbia 2010
-
Upload
khangminh22 -
Category
Documents
-
view
4 -
download
0
Transcript of STATE OF THE PARK REPORT: - Stanley Park Ecology Society

State of the Park Report for the Ecological Integrity of
Stanley Park
A project of the Stanley Park Ecology Society Vancouver, British Columbia
2010

2
PROJECT SPONSORS
3
ACKNOWLEDGEMENTS
Author: Robyn Worcester, Dipl. Tech., B.Sc, BiT, Conservation Programs Manager, Stanley Park Ecology Society (SPES)
Editors: Dalyce Epp and Koren Johnstone Contributing writers: Koren Johnstone (Environmental Indicators, Lost Lagoon water quality, Appendix 2 and 6); Jennifer Getsinger (Geological History); Caroline Astley (Blackberry and Biodiversity); Amy Hendel, Bo Ocampo, Tania Vrijmoed (background report); Mariee Devereux (SPES School Programs); John McLean, Peter Woods (sidebars); Michael Price, (Appendix 11), Betsy Waddington (Appendix 14), Jillayne Peers (Appendix 18), Mike Buffo (Appendix 21), Jacquelynn Papineau (Appendix 1). Peer Review: Al Grass, Naturalist, Wild Bird Trust of British Columbia Bill Stephen, Superintendent – Forestry, Vancouver Board of Parks and Recreation Dalyce Epp, BSc., Technical Writer/Editor and SPES volunteer Daniel J. Catt, Instructor of Applied Ecology & Recreation Land Management; Fish, Wildlife and Recreation Program, British
Columbia Institute of Technology; SPES Board Member David Cook, Geological Engineer, Biologist, and Nature Interpreter Diane Haynes, Senior Writer, Office of the President, University of BC Dieter Geesing, PhD, University of the Fraser Valley Don Enright, SPES Board Member, Stanley Park Ecology Society Doug Swanston, Aquatic Biologist, Seacology Elke Wind, Amph. Biologist (RPBio), E. Wind Consulting Glenn Brown, Consultant, Arbutus Institute. Jillayne Peers, Species at Risk Consultation Officer, Parks Canada Jennifer Getsinger, PhD, PGeo, WordsRock! Geology - Writing - Editing Jennifer Swanston, Young Naturalists' Club of BC, Executive Coordinator John Gray, Assistant Manager, Animal Control Community Services; SPES Board Member Jude Grass, Naturalist, SPES Board Member Karen M. Needham, Curator Spencer Entomological Collection, Beaty Biodiversity Museum, UBC Kristine Lampa, YNC Nature Clubs in Schools Coordinator Maria Morlin, Science Professor, Vancouver Community College, and SPES volunteer Mark T. White, Naturalist and SPES volunteer (www.mtwphoto.ca ) Matthew MacKinnon, Dillon Consulting Limited Michael Price, Naturalist Michel Desrochers, Research Planner, Vancouver Board of Parks and Recreation Mike Mackintosh, Wildlife Manager (retired), Vancouver Board of Parks and Recreation Ofer Marum, City of Vancouver, Engineering Assistant Patricia Stevens, SPES President of the Board Patricia Thomson, SPES Executive Director Peter Woods, Naturalist Ralph Wells, Sustainability Manager, UBC University Neighbourhoods Association Rex Kenner, Curator Cowan Vertebrate Museum Sheila Byers, Past Chair, Marine Biology Section, Nature Vancouver Susan Leech, RPBio, Echo Biology and Extension Terry Taylor, Naturalist Ziggy Jones, Wildlife Technician, Vancouver Board of Parks and Recreation Additional Editing, Data Entry, Maps, Graphics: Josie Pedro (citations); James Humphrey; Ofer Marum, Bahram Bahrami, Jillian Mallon, Etienne Ouellet, Karen Tso, Robyn Worcester (maps); Sara Mimick, Wanggi Jaung, Jacquelynn Papineau, Mark Blanchette (data entry); Edmund Wong, Robyn Worcester, Jesse Hannigan (Graphics) Photo Credits: Peter Woods, Mark T. White, Martin Passchier, Isabelle Groc, Peter Kerr, Brian Titaro, and Robyn Worcester (all uncredited photos).
4
EXECUTIVE SUMMARY
INTRODUCTION In December of 2006, Stanley Park was struck by a major windstorm resulting in substantial disturbance and windthrow. The storm triggered the need for extensive restoration work and also raised awareness about the lack of ecological information available for the Park and the need for an assessment of its ecological integrity. Author The report is the creation of the Stanley Park Ecology Society (SPES). Founded in 1988, the Society plays a leadership role in promoting awareness of and respect for the natural world through collaborative initiatives in Stanley Park. Based on similar reports created for National Parks by Parks Canada, the State of the Park for the Ecological Integrity of Stanley Park report was undertaken to fulfill the organization‘s strategic goals with respect to stewardship, education, research, and conservation. Rationale It is hoped that the report will serve as the sound basis for a future Stanley Park Master Plan and provide a step towards the long-term maintenance and restoration of the Park‘s ecological health and biodiversity. The primary purposes of this report are to:
Establish a framework to assess the current state of ecological integrity;
Describe what is happening with respect to the Park‘s major ecosystems and the potential stressors acting on them; and
Identify gaps in ecological knowledge. Methodology The report is based on similar reports created for National Parks by Parks Canada but this report has a stronger focus on the ecological aspects of the Park and a more detailed biophysical inventory section. The Overview and Biophysical Inventory sections are based on a review of available literature, recent research, monitoring data, and local knowledge. The Environmental Indicators section was used as a framework to assess and evaluate the current state and future trend of the Park‘s natural resources. These indicators provide a broad representation of key factors influencing the Park‘s ecosystems, are based on reliable data, and are defined by ecosystem, not institutional, boundaries. BIOPHYSICAL INVENTORY The biophysical inventory includes detailed information on the Park‘s species, ecosystems, and processes as well as the stressors influencing the Ecological Integrity (EI) of the Park.
5
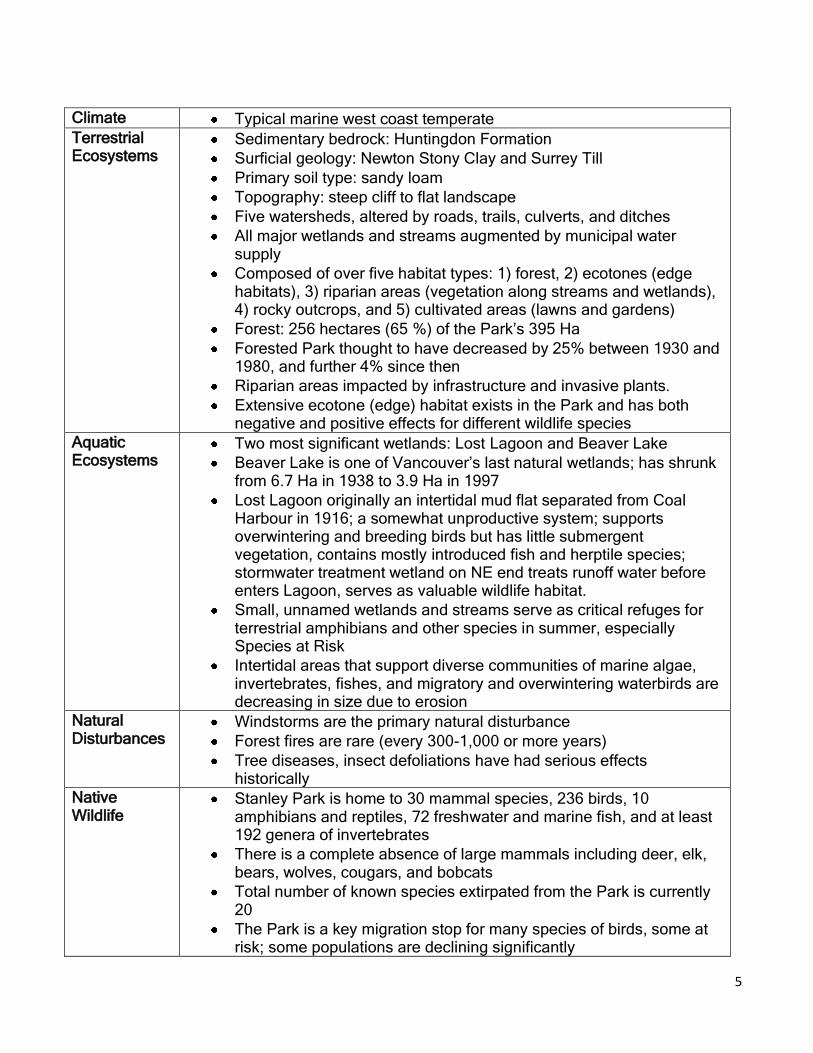
Climate Typical marine west coast temperate
Terrestrial Ecosystems
Sedimentary bedrock: Huntingdon Formation
Surficial geology: Newton Stony Clay and Surrey Till
Primary soil type: sandy loam
Topography: steep cliff to flat landscape
Five watersheds, altered by roads, trails, culverts, and ditches
All major wetlands and streams augmented by municipal water supply
Composed of over five habitat types: 1) forest, 2) ecotones (edge habitats), 3) riparian areas (vegetation along streams and wetlands), 4) rocky outcrops, and 5) cultivated areas (lawns and gardens)
Forest: 256 hectares (65 %) of the Park‘s 395 Ha
Forested Park thought to have decreased by 25% between 1930 and 1980, and further 4% since then
Riparian areas impacted by infrastructure and invasive plants.
Extensive ecotone (edge) habitat exists in the Park and has both negative and positive effects for different wildlife species
Aquatic Ecosystems
Two most significant wetlands: Lost Lagoon and Beaver Lake
Beaver Lake is one of Vancouver‘s last natural wetlands; has shrunk from 6.7 Ha in 1938 to 3.9 Ha in 1997
Lost Lagoon originally an intertidal mud flat separated from Coal Harbour in 1916; a somewhat unproductive system; supports overwintering and breeding birds but has little submergent vegetation, contains mostly introduced fish and herptile species; stormwater treatment wetland on NE end treats runoff water before enters Lagoon, serves as valuable wildlife habitat.
Small, unnamed wetlands and streams serve as critical refuges for terrestrial amphibians and other species in summer, especially Species at Risk
Intertidal areas that support diverse communities of marine algae, invertebrates, fishes, and migratory and overwintering waterbirds are decreasing in size due to erosion
Natural Disturbances
Windstorms are the primary natural disturbance
Forest fires are rare (every 300-1,000 or more years)
Tree diseases, insect defoliations have had serious effects historically
Native Wildlife
Stanley Park is home to 30 mammal species, 236 birds, 10 amphibians and reptiles, 72 freshwater and marine fish, and at least 192 genera of invertebrates
There is a complete absence of large mammals including deer, elk, bears, wolves, cougars, and bobcats
Total number of known species extirpated from the Park is currently 20
The Park is a key migration stop for many species of birds, some at risk; some populations are declining significantly
6
Stanley Park is home to both terrestrial and pond-breeding amphibians; several species have been extirpated in the past 30 years
Stressors Environmental Climate change (warming) appears consistent with broader
North American and global trends
Invasive alien species (at least 50)
Forest fragmentation (from being surrounded by ocean and urbanization), leading to loss of gene flow, crowding and increased competition, and degradation of the existing habitat due to edge effects and invasive species
Management Operations
Park maintenance activities such as tree planting, stand thinning, rock scaling, hazard tree removal, grass moving, trailside vegetation brushing, and trail maintenance, conducted primarily on behalf of Park patrons, often causes negative impacts on wildlife habitat; the Vancouver Park Board‘s Forest Management Plan outlines some mitigating measures, including timing windows of operations
Social Issues Human use: trails and roads cause habitat loss, create problems with hydrology, wildlife movement, and the spread of invasive plants; off-trail use damages understory plants and soils
Off-leash dogs and wildlife feeding are detrimental or deadly to wildlife
Air quality is decreasing
Marine contaminates (marine traffic, oil spills)
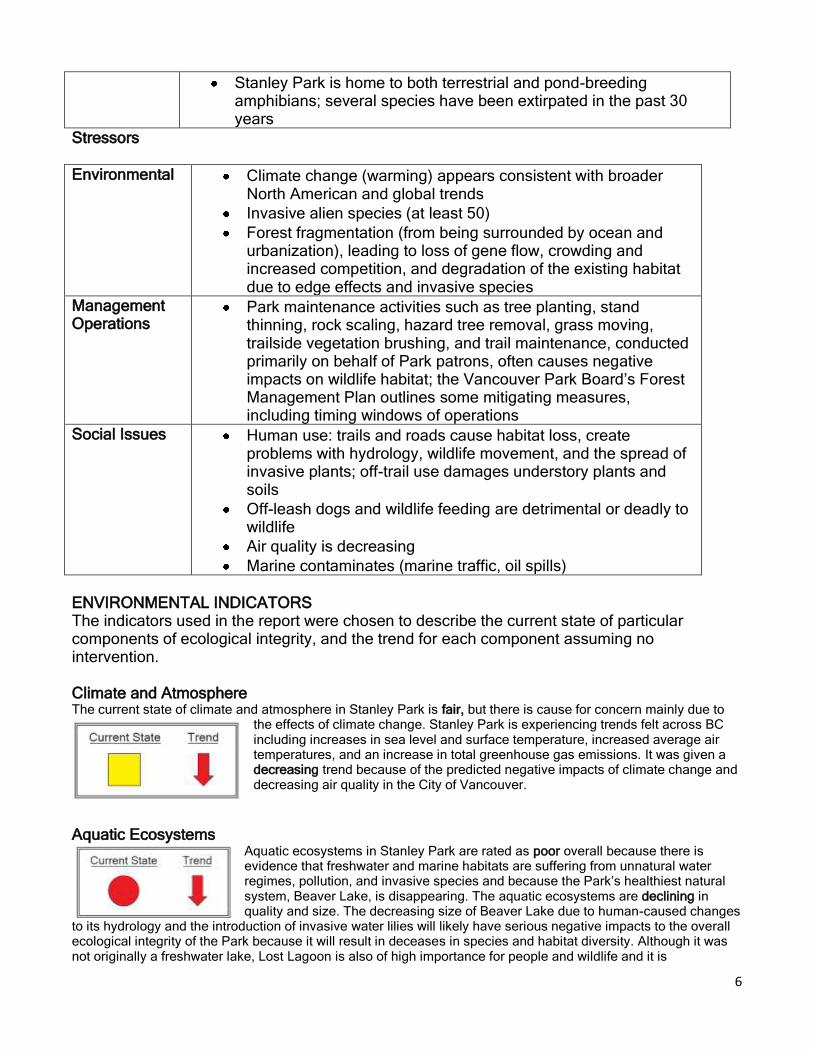
ENVIRONMENTAL INDICATORS The indicators used in the report were chosen to describe the current state of particular components of ecological integrity, and the trend for each component assuming no intervention. Climate and Atmosphere The current state of climate and atmosphere in Stanley Park is fair, but there is cause for concern mainly due to
the effects of climate change. Stanley Park is experiencing trends felt across BC including increases in sea level and surface temperature, increased average air temperatures, and an increase in total greenhouse gas emissions. It was given a decreasing trend because of the predicted negative impacts of climate change and decreasing air quality in the City of Vancouver.
Aquatic Ecosystems
Aquatic ecosystems in Stanley Park are rated as poor overall because there is evidence that freshwater and marine habitats are suffering from unnatural water regimes, pollution, and invasive species and because the Park‘s healthiest natural system, Beaver Lake, is disappearing. The aquatic ecosystems are declining in quality and size. The decreasing size of Beaver Lake due to human-caused changes
to its hydrology and the introduction of invasive water lilies will likely have serious negative impacts to the overall ecological integrity of the Park because it will result in deceases in species and habitat diversity. Although it was not originally a freshwater lake, Lost Lagoon is also of high importance for people and wildlife and it is

7
experiencing decreasing water quality. The intertidal areas of the Park may be declining in quality but more study is needed to determine how rapidly or to what extent this is happening.
Terrestrial Ecosystems Terrestrial ecosystems are rated as fair because there have been many impacts to their integrity over the Park‘s long history and invasive species have taken hold in most areas, but there have also been dramatic improvements as a result of the 2006 windstorms and subsequent restoration. The health of terrestrial ecosystems are improving. Many of the Environmentally Sensitive Areas in the Park are now called `Wildlife Management Emphasis Areas` under the Park Board‘s new Forest
Management Plan, and this will especially benefit riparian zones, deciduous patches, and forested wetlands. The connectivity between terrestrial habitats is expected to remain stable, and previously low CWD levels will improve as a result of the provisions in the new Forest Management Plan.
Native Biodiversity
The state of biodiversity in the Park is fair because although there is a large diversity of animals living in and using the Park, several key species have declined or have been locally extirpated in the last 30 years. Overall native biodiversity in the Park has declined in recent years, and stressors such as habitat fragmentation, climate change effects, and invasive species are acting on those that remain. However, it is thought
that the current state is relatively stable, more baseline data is needed for several groups of wildlife (including reptiles and small mammals), and efforts to restore and enhance existing habitat should benefit biodiversity in the future.
FUTURE DIRECTIONS AND RECOMMENDATIONS
The Stanley Park Ecology Society (SPES) created this report to compile baseline information about Stanley Park‘s ecosystems and determine the current state and future trend of key indicators of ecological integrity. In doing so, it has become evident where the major gaps in information lie in our understanding of the Park and where we should focus our environmental conservation and educational efforts. As a step towards improving our understanding of the Park‘s ecology and working towards the goal of Ecological Integrity, the following recommendations were made to guide SPES‘s conservation and education activities in the Park in the coming years:
Fill gaps in information with baseline data collection and local knowledge in order to better understand and conserve the ecology of Stanley Park.
Maintain existing monitoring programs and create new ones to track changes concerning the Park‘s ecological integrity.
Undertake restoration and enhancement activities to benefit the ecological health and biodiversity of the Park`s ecosystems with priority given to: aquatic species and habitats, Environmentally Sensitive Areas, invasive species management, Species at Risk, and human-caused stressors
Continue to provide environmental education in Stanley Park and the greater community for the benefit of the Park and its surrounding environment.
Use measurable factors to assess environmental indicators and update the ‗State of the Park for the Ecological Integrity of Stanley Park‘ as a regular activity of SPES.
8
LIST OF FIGURES
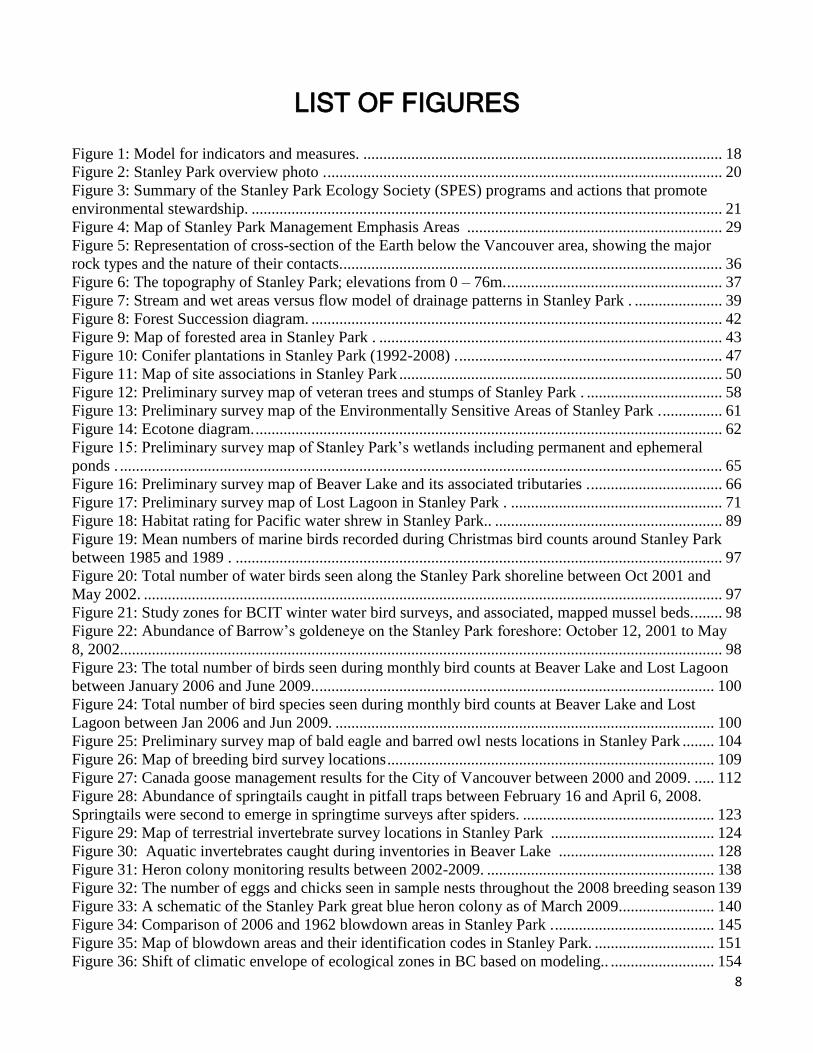
Figure 1: Model for indicators and measures. .......................................................................................... 18
Figure 2: Stanley Park overview photo . ................................................................................................... 20
Figure 3: Summary of the Stanley Park Ecology Society (SPES) programs and actions that promote
environmental stewardship. ...................................................................................................................... 21
Figure 4: Map of Stanley Park Management Emphasis Areas ................................................................ 29
Figure 5: Representation of cross-section of the Earth below the Vancouver area, showing the major
rock types and the nature of their contacts. ............................................................................................... 36
Figure 6: The topography of Stanley Park; elevations from 0 – 76m. ...................................................... 37
Figure 7: Stream and wet areas versus flow model of drainage patterns in Stanley Park . ...................... 39
Figure 8: Forest Succession diagram. ....................................................................................................... 42
Figure 9: Map of forested area in Stanley Park . ...................................................................................... 43
Figure 10: Conifer plantations in Stanley Park (1992-2008) . .................................................................. 47
Figure 11: Map of site associations in Stanley Park ................................................................................. 50
Figure 12: Preliminary survey map of veteran trees and stumps of Stanley Park . .................................. 58
Figure 13: Preliminary survey map of the Environmentally Sensitive Areas of Stanley Park . ............... 61
Figure 14: Ecotone diagram. ..................................................................................................................... 62
Figure 15: Preliminary survey map of Stanley Park’s wetlands including permanent and ephemeral
ponds . ....................................................................................................................................................... 65
Figure 16: Preliminary survey map of Beaver Lake and its associated tributaries . ................................. 66
Figure 17: Preliminary survey map of Lost Lagoon in Stanley Park . ..................................................... 71
Figure 18: Habitat rating for Pacific water shrew in Stanley Park.. ......................................................... 89
Figure 19: Mean numbers of marine birds recorded during Christmas bird counts around Stanley Park
between 1985 and 1989 . .......................................................................................................................... 97
Figure 20: Total number of water birds seen along the Stanley Park shoreline between Oct 2001 and
May 2002. ................................................................................................................................................. 97
Figure 21: Study zones for BCIT winter water bird surveys, and associated, mapped mussel beds. ....... 98
Figure 22: Abundance of Barrow’s goldeneye on the Stanley Park foreshore: October 12, 2001 to May
8, 2002....................................................................................................................................................... 98
Figure 23: The total number of birds seen during monthly bird counts at Beaver Lake and Lost Lagoon
between January 2006 and June 2009.. ................................................................................................... 100
Figure 24: Total number of bird species seen during monthly bird counts at Beaver Lake and Lost
Lagoon between Jan 2006 and Jun 2009. ............................................................................................... 100
Figure 25: Preliminary survey map of bald eagle and barred owl nests locations in Stanley Park ........ 104
Figure 26: Map of breeding bird survey locations .................................................................................. 109
Figure 27: Canada goose management results for the City of Vancouver between 2000 and 2009. ..... 112
Figure 28: Abundance of springtails caught in pitfall traps between February 16 and April 6, 2008.
Springtails were second to emerge in springtime surveys after spiders. ................................................ 123
Figure 29: Map of terrestrial invertebrate survey locations in Stanley Park ......................................... 124
Figure 30: Aquatic invertebrates caught during inventories in Beaver Lake ....................................... 128
Figure 31: Heron colony monitoring results between 2002-2009. ......................................................... 138
Figure 32: The number of eggs and chicks seen in sample nests throughout the 2008 breeding season 139
Figure 33: A schematic of the Stanley Park great blue heron colony as of March 2009........................ 140
Figure 34: Comparison of 2006 and 1962 blowdown areas in Stanley Park . ........................................ 145
Figure 35: Map of blowdown areas and their identification codes in Stanley Park. .............................. 151
Figure 36: Shift of climatic envelope of ecological zones in BC based on modeling.. .......................... 154
9
Figure 37: Preliminary survey map of English Ivy extent in Stanley Park comparing 2002 and 2009 data
................................................................................................................................................................. 159
Figure 38: Multicriteria analysis of land suitability for Himalayan blackberry, Stanley Park, 2007. .... 160
Figure 39: Multicriteria analysis of land suitability for giant knotweed, Stanley Park, 2007. ............... 160
Figure 40: Preliminary survey map of land use in Stanley Park. ............................................................ 169
Figure 41: Proportion of different land use types in Stanley Park. ......................................................... 169
Figure 42: Trends of total air emissions in Vancouver. .......................................................................... 180
LIST OF TABLES Table 1: Symbols used for indicator evaluation . ..................................................................................... 19
Table 2: Watersheds of Stanley Park . ...................................................................................................... 38
Table 3: Site Associations and their associated soils. ............................................................................... 41
Table 4: Comparison between 1989 and 2009 forest cover types in Stanley Park. .................................. 44
Table 5: Relative areas of conifer forest canopy types. ............................................................................ 46
Table 6: Ecological Communities (site associations) at risk in Stanley Park ........................................... 53
Table 7: List of large trees in Stanley Park. .............................................................................................. 56
Table 8: Largest Trees of Stanley Park. .................................................................................................... 57
Table 9: Big Trees of British Columbia Registry .................................................................................... 57
Table 10: Substrate and fauna characteristics of select Stanley Park intertidal areas . ............................ 82
Table 11: Analysis of bald eagle prey items found under nests in Stanley Park in 2009 ....................... 104
Table 12: Owl Survey Results from Stanley Park 2007-2009. ............................................................... 106
Table 13: Number of barred owl chicks recorded at 4 nest sites between 2001-2009 .......................... 107
Table 14: Summary of species recorded during May-June Breeding Bird surveys in Stanley Park
between 2007 and 2009. ......................................................................................................................... 109
Table 15: Results of amphibian funnel trapping surveys conducted in various locations in Stanley Park
in 2007 and 2009. .................................................................................................................................... 115
Table 16: Amphibians found per minute of search time during visual surveys conducted in various
locations in Stanley Park between 2007 and 2009.................................................................................. 116
Table 17: Threespine stickleback caught during funnel trapping surveys in Stanley Park water bodies in
2007 and 2009. ........................................................................................................................................ 119
Table 18: Identification of Spiders Collected from Stanley Park, Vancouver, BC 2007-07-07 ............ 122
Table 19: Examples of common aquatic invertebrate indicators. ........................................................... 127
Table 20: The relative abundance of clam and crab species at four intertidal sites in Stanley Park. ..... 131
Table 21: The indicator taxa used for zonation at Brockton Point. ........................................................ 131
Table 22: List of Species at Risk found in Stanley Park......................................................................... 135
Table 23: Great Blue Heron Colony nesting records for Stanley Park. .................................................. 137
Table 24: Results of bald eagle nest monitoring in Stanley Park from 2004-2009. ............................... 141
Table 25: Stanley Park bald eagle nest tree details. ................................................................................ 142
Table 26: Food items collected around bald eagle nests in the Greater Vancouver region, BC. ........... 143
Table 27: General description of the 16 major Stanley Park Restoration Plan blowdown areas. .......... 150
Table 28: General restoration prescriptions applied to most of the 16 major blowdown areas in Stanley
Park. ........................................................................................................................................................ 152
Table 29: Climate change indicators and trends as reported by the BC Government 2007 ................... 154
Table 30: List of invasive plants currently found in Stanley Park. ......................................................... 158

10
Table 32: Description of regular operations and their impacts on wildlife and habitat in Stanley Park. 165
Table 33: Long-term trends in persistent organic pollutants in great blue heron eggs from UBC. ........ 175
Table 34: Results of limnology study in Lost Lagoon. ........................................................................... 177
Table 35: Annual baseline emissions for vehicles travelling through the Causeway and over the Lions
Gate Bridge in 1993 compared to total GVRD emissions for 1990. ...................................................... 180
Table 36: Air quality indicators and trends reported by the BC Government 2007. .............................. 181
Table 37: The direct and indirect effects of common forms of recreation impacts on different ecological
components of the environment. ............................................................................................................. 182
Table 38: Summary of Environmental Indicator Assessment for Stanley Park. .................................... 184
Table 39: Possible measures for environmental indicators..................................................................... 217
11
TABLE OF CONTENTS
EXECUTIVE SUMMARY ......................................................................................................................................................... 4
FUTURE DIRECTIONS AND RECOMMENDATIONS ........................................................................................................ 7
LIST OF FIGURES ................................................................................................................................................................... 8
LIST OF TABLES ...................................................................................................................................................................... 9
LIST OF APPENDICES ......................................................................................................................................................... 15
1 INTRODUCTION ........................................................................................................................................................... 16
1.1 STATE OF THE PARK REPORTING........................................................................................................................... 16
1.2 THE NEED FOR A STATE OF THE PARK REPORT FOR STANLEY PARK .................................................................. 16
1.3 BIOPHYSICAL INVENTORY METHODS AND LIMITATIONS ......................................................................................... 17
1.4 ASSESSMENT AND EVALUATION METHODS AND LIMITATIONS ............................................................................... 18
2 OVERVIEW OF STANLEY PARK ............................................................................................................................... 20
2.1 LOCATION AND REGIONAL CONTEXT ..................................................................................................................... 20
2.2 THE STANLEY PARK ECOLOGY SOCIETY ............................................................................................................... 21 2.2.1 SPES Conservation Programs ...................................................................................................................... 22 2.2.2 Environmental Education ............................................................................................................................... 23
2.3 PARK MANAGEMENT ............................................................................................................................................... 23 2.3.1 The Vancouver Park Board ............................................................................................................................ 23 2.3.2 Park Management Background ..................................................................................................................... 24 2.3.3 Management Guidelines ................................................................................................................................ 26 2.3.4 Laws and Best Management Practices ........................................................................................................ 30
2.4 RECREATION AND FACILITIES ................................................................................................................................. 31
3 BIOPHYSICAL INVENTORY ....................................................................................................................................... 34
3.1 CLIMATE .................................................................................................................................................................. 34
3.2 TERRESTRIAL ECOSYSTEMS .................................................................................................................................. 35 3.2.1 Geology and Topography ............................................................................................................................... 35
3.2.1.1 Geological History ................................................................................................................................................... 35 3.2.1.2 Parent Material ........................................................................................................................................................ 37 3.2.1.3 Topography .............................................................................................................................................................. 37
3.2.2 Hydrology ......................................................................................................................................................... 38 3.2.2.1 Hydrological Models ............................................................................................................................................... 39
3.2.3 Soils ................................................................................................................................................................... 40 3.2.4 Forest ................................................................................................................................................................ 42
3.2.4.1 Forest History .......................................................................................................................................................... 44 3.2.4.2 Forest Cover Types ................................................................................................................................................ 46
3.2.4.2.1 Mature Conifer Forest ....................................................................................................................................... 46 3.2.4.2.2 Young Conifer Forest (Plantations) ................................................................................................................. 47 3.2.4.2.3 Deciduous Forest ............................................................................................................................................... 48 3.2.4.2.4 Mixed Forest ....................................................................................................................................................... 49
3.2.4.3 Ecological Classification of Stanley Park‘s Forest .............................................................................................. 50
12
3.2.4.4 Forest Ecosystems at Risk .................................................................................................................................... 53 3.2.4.5 Forest Features ....................................................................................................................................................... 54
3.2.4.5.1 Wildlife Trees ...................................................................................................................................................... 54 3.2.4.5.2 Coarse Woody Debris (CWD) .......................................................................................................................... 55 3.2.4.5.3 Veteran Trees and Old Growth ........................................................................................................................ 56 3.2.4.5.4 Rare Plants ......................................................................................................................................................... 59
3.2.5 Riparian Areas ................................................................................................................................................. 59 3.2.6 Ecotones ........................................................................................................................................................... 61 3.2.7 Rocky Outcrops and Surficial Geology ........................................................................................................ 62 3.2.8 Cultivated Areas .............................................................................................................................................. 63
3.3 AQUATIC ECOSYSTEMS .......................................................................................................................................... 65 3.3.1 Wetlands ........................................................................................................................................................... 65
3.3.1.1 Beaver Lake ............................................................................................................................................................. 65 3.3.1.1.1 Beaver Lake Succession .................................................................................................................................. 67 3.3.1.1.2 Beaver Lake Studies ......................................................................................................................................... 68 3.3.1.1.3 Beaver Lake Stewardship Efforts .................................................................................................................... 69
3.3.1.2 Lost Lagoon ............................................................................................................................................................. 70 3.3.1.2.1 Lost Lagoon Biofiltration Wetland .................................................................................................................... 72 3.3.1.2.2 Lost Lagoon Studies .......................................................................................................................................... 73
3.3.1.3 Unnamed Wetlands ................................................................................................................................................ 75 3.3.1.3.1 Treed Swamps ................................................................................................................................................... 75 3.3.1.3.2 Ephemeral and Permanent Ponds .................................................................................................................. 75
3.3.1.4 Beaver Lake Bog ..................................................................................................................................................... 76 3.3.2 Watercourses ................................................................................................................................................... 77
3.3.2.1 North Creek .............................................................................................................................................................. 77 3.3.2.2 Beaver Creek ........................................................................................................................................................... 78 3.3.2.3 Unnamed Creeks .................................................................................................................................................... 79
3.3.3 Intertidal Zones ................................................................................................................................................ 81 3.3.3.1 Coal Harbour............................................................................................................................................................ 82 3.3.3.2 Brockton Point ......................................................................................................................................................... 83 3.3.3.3 Stanley Park North Shoreline: Brockton Point to Prospect Point ..................................................................... 83 3.3.3.4 Prospect Point to Siwash Rock ............................................................................................................................. 84 3.3.3.5 Stanley Park West Shoreline: Siwash Rock to Second Beach ......................................................................... 84 3.3.3.6 South of Second Beach .......................................................................................................................................... 85
3.4 NATIVE WILDLIFE .................................................................................................................................................... 86 3.4.1 Mammals .......................................................................................................................................................... 86
3.4.1.1 Rodents .................................................................................................................................................................... 87 3.4.1.2 Shrews and Moles ................................................................................................................................................... 88 3.4.1.3 Mustelids (weasels, mink, otter, and marten) ...................................................................................................... 90 3.4.1.4 Raccoons and Skunks ............................................................................................................................................ 90 3.4.1.5 Coyotes..................................................................................................................................................................... 92 3.4.1.6 Bats ........................................................................................................................................................................... 94
3.4.2 Birds .................................................................................................................................................................. 96 3.4.2.1 Important Bird Area (IBA) of Canada: English Bay and Burrard Inlet .............................................................. 96 3.4.2.2 Birds of Marine Areas ............................................................................................................................................. 96
3.4.2.2.1 Winter Seawall Surveys .................................................................................................................................... 97 3.4.2.2.2 Barrow‘s Goldeneye .......................................................................................................................................... 98 3.4.2.2.3 Surf Scoter .......................................................................................................................................................... 99
3.4.2.3 Wetland Birds ........................................................................................................................................................ 100 3.4.2.4 Raptors ................................................................................................................................................................... 102
3.4.2.4.1 Bald Eagles ....................................................................................................................................................... 103 3.4.2.4.2 Owls ................................................................................................................................................................... 106
3.4.2.5 Forest Birds ............................................................................................................................................................ 108 3.4.2.6 Colonial nesting Birds ........................................................................................................................................... 110 3.4.2.7 Canada Goose Management .............................................................................................................................. 111
3.4.3 Reptiles ........................................................................................................................................................... 112 3.4.4 Amphibians..................................................................................................................................................... 113
3.4.4.1 Terrestrial Amphibians ......................................................................................................................................... 113 3.4.4.2 Pond-breeding Amphibians ................................................................................................................................. 114
3.4.5 Fish .................................................................................................................................................................. 117 3.4.5.1 Freshwater and Anadromous Fish ...................................................................................................................... 117
13
3.4.5.2 Marine Fishes ........................................................................................................................................................ 119 3.4.6 Invertebrates .................................................................................................................................................. 120
3.4.6.1 Terrestrial Invertebrates ....................................................................................................................................... 120 3.4.6.1.1 Soil Biota ........................................................................................................................................................... 123 3.4.6.1.2 Terrestrial Invertebrate Studies...................................................................................................................... 124
3.4.6.2 Aquatic Freshwater Invertebrates ....................................................................................................................... 126 3.4.6.2.1 Aquatic Invertebrate Studies .......................................................................................................................... 127
3.4.6.3 Marine Invertebrates ............................................................................................................................................. 128 3.4.6.3.1 Marine Invertebrate Studies ........................................................................................................................... 129
3.4.7 Keystone Species.......................................................................................................................................... 132 3.4.7.1 Woodpeckers ......................................................................................................................................................... 132 3.4.7.2 Beaver .................................................................................................................................................................... 133
3.4.8 Protected Wildlife .......................................................................................................................................... 134 3.4.8.1 Species at Risk ...................................................................................................................................................... 134 3.4.8.2 Migratory Birds ...................................................................................................................................................... 136 3.4.8.3 Great Blue Heron Colony ..................................................................................................................................... 137 3.4.8.4 Bald Eagle Nests ................................................................................................................................................... 141
3.5 NATURAL DISTURBANCES ..................................................................................................................................... 144 3.5.1 Windstorms .................................................................................................................................................... 144 3.5.2 Fire .................................................................................................................................................................. 146 3.5.3 Insects and Disease ...................................................................................................................................... 146
3.6 THE RESTORATION PLAN AND BLOWDOWN AREAS ............................................................................................. 148
3.7 STRESSORS .......................................................................................................................................................... 153 3.7.1 Environmental ................................................................................................................................................ 153
3.7.1.1 Climate Change ..................................................................................................................................................... 153 3.7.1.2 Habitat Fragmentation and Isolation................................................................................................................... 155 3.7.1.3 Invasive Exotic Plants ........................................................................................................................................... 157
3.7.1.3.1 English Ivy Mapping ........................................................................................................................................ 159 3.7.1.3.2 Invasive Species Spread Analysis................................................................................................................. 160
3.7.1.4 Introduced Animal Species .................................................................................................................................. 162 3.7.2 Park Management Operations .................................................................................................................... 165 3.7.3 Social Issues .................................................................................................................................................. 167
3.7.3.1 Wildlife Feeding ..................................................................................................................................................... 167 3.7.3.2 Infrastructure and Developments ........................................................................................................................ 168
3.7.3.2.1 Trails and Roads .............................................................................................................................................. 170 3.7.3.3 Off-trail Activities ................................................................................................................................................... 171 3.7.3.4 Off-leash Dogs ....................................................................................................................................................... 173 3.7.3.5 Pollution .................................................................................................................................................................. 174
3.7.3.5.1 Environmental Contaminates ......................................................................................................................... 175 3.7.3.5.2 Lost Lagoon Water Quality ............................................................................................................................ 175 3.7.3.5.3 Air Pollution ....................................................................................................................................................... 179
3.7.3.6 Visitor Management .............................................................................................................................................. 181
4 ECOLOGICAL INTEGRITY AND ENVIRONMENTAL INDICATORS ................................................................. 184
4.1 ECOLOGICAL INTEGRITY ....................................................................................................................................... 184
4.2 ENVIRONMENTAL INDICATORS.............................................................................................................................. 186 4.2.1 Climate and Atmosphere Indicators ........................................................................................................... 188
4.2.1.1 Indicator: Air Quality ............................................................................................................................................. 188 4.2.1.2 Indicator: Climate Change ................................................................................................................................... 189
4.2.2 Aquatic Ecosystem Indicators ..................................................................................................................... 190 4.2.2.1 Indicator: Water Quality ........................................................................................................................................ 190 4.2.2.2 Indicator: Stream Flow and Freshwater Levels ................................................................................................. 191 4.2.2.3 Indicator: Diversity and Extent of Wetland Habitats ......................................................................................... 192 4.2.2.4 Indicator: Connectivity Between Freshwater Habitats ..................................................................................... 193 4.2.2.5 Indicator: Diversity of Structure in Freshwater Habitats ................................................................................... 194 4.2.2.6 Indicator: Diversity and Abundance of Indicator Species in Freshwater Habitat .......................................... 195
14
4.2.2.7 Indicator: Diversity and Abundance of Native Intertidal Species .................................................................... 196 4.2.2.8 Indicator: Diversity and Extent of Intertidal Habitats ........................................................................................ 197 4.2.2.9 Indicator: Degree of Connectivity between Intertidal and Upland Habitats ................................................... 198
4.2.3 Terrestrial Ecosystem Indicators ................................................................................................................. 199 4.2.3.1 Indicator: Natural Soil Quality .............................................................................................................................. 199 4.2.3.2 Indicator: Diversity of Species and Successional Stages in Forest Stands .................................................. 200 4.2.3.3 Indicator: Diversity and Quality of Terrestrial Habitat Types ........................................................................... 201 4.2.3.4 Indicator: Connectivity between Terrestrial Habitats ........................................................................................ 202 4.2.3.5 Indicator: Diversity of Habitat Structure.............................................................................................................. 203 4.2.3.6 Indicator: Riparian Areas ...................................................................................................................................... 204 4.2.3.7 Indicator: Frequency and Severity of Natural Disturbances ............................................................................ 205 4.2.3.8 Indicator: Number of Native Veteran and Record Trees .................................................................................. 206
4.2.4 Native Biodiversity Indicators ...................................................................................................................... 207 4.2.4.1 Indicator: Species Richness ................................................................................................................................ 207 4.2.4.2 Indicator: Number and Extent of Invasive Plant and Animal Species ............................................................ 208 4.2.4.3 Indicator: Wildlife Species Productivity .............................................................................................................. 209 4.2.4.4 Indicator: Genetic Diversity within Species........................................................................................................ 210 4.2.4.5 Indicator: Number of Species at Risk and Extent of Park Area they Inhabit ................................................. 211 4.2.4.6 Indicator: Population Status of Keystone Species ............................................................................................ 212
5 FUTURE DIRECTIONS AND RECOMMENDATIONS .......................................................................................... 213
5.1 GAP FILLING INITIATIVES: BASELINE INFORMATION GATHERING ......................................................................... 213
5.2 GAP FILLING INITIATIVES: LONG-TERM MONITORING PROGRAMS ....................................................................... 214
5.3 RESTORATION AND ENHANCEMENT ACTIVITIES .................................................................................................. 215
5.4 EDUCATION PROGRAMS ....................................................................................................................................... 216
5.5 FUTURE SOPEI REPORTS ................................................................................................................................... 217
REFERENCES CITED ......................................................................................................................................................... 219
15
LIST OF APPENDICES
Appendix 1: Glossary of terms Appendix 2: Environmentally Sensitive Areas in Stanley Park Appendix 3: Applicable wildlife and habitat laws for Stanley Park Appendix 4: Applicable Best Management Practices for Stanley Park Appendix 5: Native Plant Inventory for Stanley Park Appendix 6: Species at Risk in Stanley Park Appendix 7: Ornamental Plant Inventory for Stanley Park Appendix 8: Marine Algae and Seagrasses of Stanley Park Appendix 9: Invertebrate Species List for Stanley Park Appendix 10: Vertebrate Species List for Stanley Park Appendix 11: Seabird species declines around Stanley Park Appendix 12: BCIT Winter Water Bird Survey Bird List Appendix 13: Stanley Park Bald Eagle nests Appendix 14: SPES Long term Monitoring stations Appendix 15: Stanley Park Heron Colony Management Plan Appendix 16: Restoration Plan Site Prescriptions Appendix 17: Invasive plant species of Stanley Park Appendix 18: Invasive plant species Best Management Practices for Stanley Park Appendix 19: Plankton of Stanley Park Appendix 20: Historical Overview of Stanley Park Appendix 21: Forest Stand Compostion Appendix 22: Stewardship Programs Final Reports 2009
16
1 INTRODUCTION
1.1 State of the Park Reporting A State of the Park report describes the condition or ‗state‘ of a particular park. It is usually structured around the objectives of a park management plan and is designed to reflect the unique and special qualities of that park. The report describes changes or trends within the park and provides baseline information for present and future monitoring projects. Long-term monitoring provides information that can aid decision-making with the aim of ultimately improving the ecological integrity of the park. The State of the Park report is also intended to provide a historical context for the park‘s ecological health and describe existing gaps in knowledge.
1.2 The Need for a State of the Park Report for Stanley Park
State of the Park reports are part of a new policy for National Parks under the Parks Canada Guide to Management Planning (Parks Canada, 2006), required so that a management plan can be prepared for each park. Although Stanley Park is not a National Park it is on federal land that is leased to the City of Vancouver. SPES chose to create a State of the Park style report as a way to assess the Park‘s ecological integrity. Stanley Park is prominent in the community, and as a National Historic Site of Canada is a ―place of profound importance to Canada‖ (Parks Canada, 2008a). This report differs from many Parks Canada reports in that it focuses mainly on the ecological aspects of the Park (as opposed to cultural aspects) and contains a more detailed biophysical inventory component within the body text, hence the name ‗State of the Park for the Ecological Integrity of Stanley Park‘ (hereafter reffered to as SOPEI) was chosen. Although Stanley Park has existed for over 100 years, a complete biophysical inventory of the Park has never been completed. In December 2006 and January 2007, Stanley Park was struck by three major windstorms, resulting in substantial disturbance and windthrow within the park. The storm triggered the need for extensive facility and ecological restoration work which was undertaken through the Restoration Plan (see Section 3.8 for details). As a consequence of this process, awareness was raised about the gaps in available ecological information for the Park and the need for an assessment of the current state of Stanley Park. The storms not only generated an overall public interest in the management of Stanley Park but also triggered the involvement of the Stanley Park Ecology Society (SPES) in restoration and management initiatives. As a result, opportunities arose for SPES to play a key role in restoration activities, and instigated the creation of the ―Conservation Programs‖ division within SPES. The need for a State of the Park report was identified in SPES‘s Strategic Plan 2005-2010. Two of the plan‘s goals are to:
Preserve and restore the ecological health and biodiversity of Stanley Park‘s ecosystems
Undertake research in collaboration with others that provides the basis for informed decisions for our education and conservation initiatives
Under these goals, one of the objectives is to ―lead a collaborative effort resulting in a State of the Park report‖.
17
In March 2007, experts from a variety of fields, including forest ecology and related subjects, came together at SPES for an ―Advisors‘ Forum‖ concerning the long-term ecological management of Stanley Park. The need for compiling baseline information was identified at this forum. It was suggested that State of the Environment reporting be used to make a synthesis of past and current information on the Park‘s ecosystems. It was also advised that the report identify what is known about the Park and be used for gap analysis so that strategies could then be developed to fill in this missing information (Brown, 2007). Thus, the purpose of this report is to fulfill one of SPES‘s strategic goals and to act on the suggestion made by our advisors.
The primary objectives of the SOPEI report for Stanley Park are to:
Describe what is happening with respect to the Park‘s major ecosystems and the potential stressors acting on them; and
Identify gaps in ecological knowledge.
Establish a framework to assess the current state of ecological integrity;
It is hoped that this report may serve as a sound basis for a future Stanley Park Master Plan and will act as a step towards the long-term maintenance and restoration of the Park‘s ecological health and biodiversity.
1.3 Biophysical Inventory Methods and Limitations Although this report was based on similar reports created by Park‘s Canada, it also contains a biophysical inventory of Stanley Park including the abiotic and biotic components of its ecosystems as well as some of the processes that drive them.The inventory uses an Ecosystem Approach to understanding the Park‘s natural resources by recognizing the connections between the land, air, water and all living things, including people and their activities. It provides detailed information about the ecological history of the Park and the stressors influencing its ecological integrity. The inventory was created by conducting a literature review and by compiling recent research, monitoring data, and local knowledge. The inventory was compiled using an exhaustive literature review of existing information and compilation on available data. The sources include all available research projects, Park Board reports, consultant reports, unpublished data, SPES monitoring data, newspaper and other print media, reliable web sources, and federal and provincial documentation. Additional information in the form of personal communications and side bar additions were provided by local naturalists, experts in a variety of fields and Park Board and SPES staff. All information obtained from outside sources is referenced accordingly, and all other un-cited information found in this report has originated from SPES data. Many of the references used have been collected in the SPES library or can be obtained online. The biophysical inventory is not meant to provide analysis, but is simply to compile all of the known information concerning the ecology of the Park. As explained in the previous section, gaps in the data exist and more information may come to light after the completion of this report, and so future reports will hopefully contain a more complete picture of the Park‘s natural ecology. Where conflicting information has emerged, the available data has been provided for the reader‘s consideration.
18
Much of the available data and baseline information came about following the winter storms and subsequent restoration in Stanley Park in 2007-2008. Forest technicians, ecologists, wildlife biologists, academics, students and many others undertook research projects, surveys or otherwise consulted with park managers and SPES during the Restoration. SPES was invited by the Park Board to be a part of the Restoration process, including advising on activities and planning, collaborating in the field with biologists and forest technicians, and undertaking stewardship and research activities in the Park. One of the central purposes of the biophysical inventory is to document the valuable information that was obtained through this process for public record and future reference. Each section of the inventory was reviewed by experts in that field as well as by Park Board and SPES staff. All figures, tables, graphics, photos, and Preliminary survey maps were created by SPES staff and volunteers (unless otherwise cited). Wherever possible, terminology is explained within the text, but a glossary is also included in Appendix 1 for clarity.
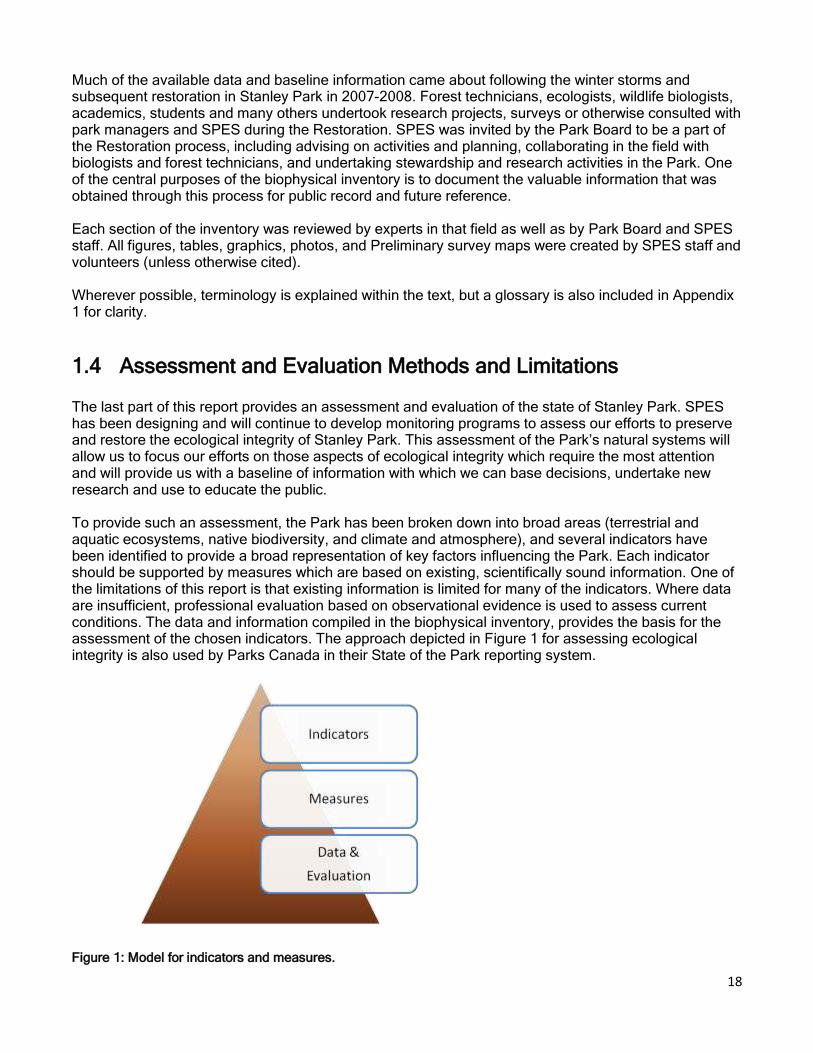
1.4 Assessment and Evaluation Methods and Limitations The last part of this report provides an assessment and evaluation of the state of Stanley Park. SPES has been designing and will continue to develop monitoring programs to assess our efforts to preserve and restore the ecological integrity of Stanley Park. This assessment of the Park‘s natural systems will allow us to focus our efforts on those aspects of ecological integrity which require the most attention and will provide us with a baseline of information with which we can base decisions, undertake new research and use to educate the public. To provide such an assessment, the Park has been broken down into broad areas (terrestrial and aquatic ecosystems, native biodiversity, and climate and atmosphere), and several indicators have been identified to provide a broad representation of key factors influencing the Park. Each indicator should be supported by measures which are based on existing, scientifically sound information. One of the limitations of this report is that existing information is limited for many of the indicators. Where data are insufficient, professional evaluation based on observational evidence is used to assess current conditions. The data and information compiled in the biophysical inventory, provides the basis for the assessment of the chosen indicators. The approach depicted in Figure 1 for assessing ecological integrity is also used by Parks Canada in their State of the Park reporting system.
Figure 1: Model for indicators and measures.
19
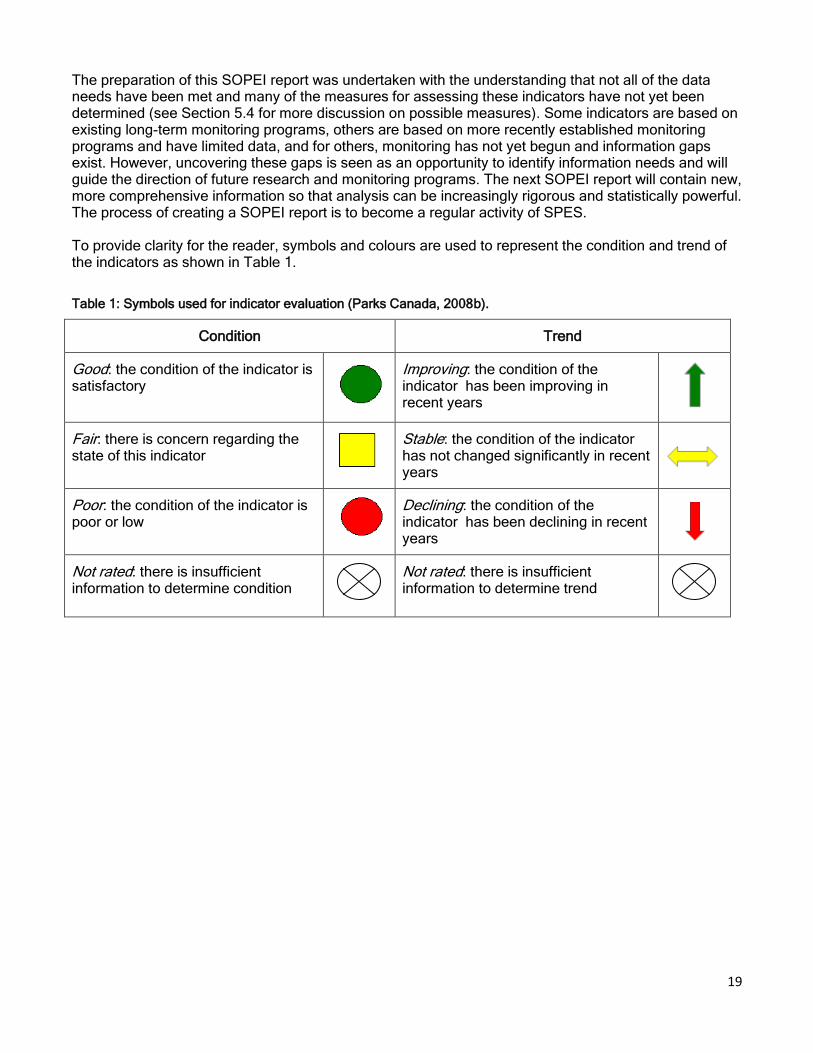
The preparation of this SOPEI report was undertaken with the understanding that not all of the data needs have been met and many of the measures for assessing these indicators have not yet been determined (see Section 5.4 for more discussion on possible measures). Some indicators are based on existing long-term monitoring programs, others are based on more recently established monitoring programs and have limited data, and for others, monitoring has not yet begun and information gaps exist. However, uncovering these gaps is seen as an opportunity to identify information needs and will guide the direction of future research and monitoring programs. The next SOPEI report will contain new, more comprehensive information so that analysis can be increasingly rigorous and statistically powerful. The process of creating a SOPEI report is to become a regular activity of SPES. To provide clarity for the reader, symbols and colours are used to represent the condition and trend of the indicators as shown in Table 1.
Table 1: Symbols used for indicator evaluation (Parks Canada, 2008b).
Condition Trend
Good: the condition of the indicator is satisfactory
Improving: the condition of the indicator has been improving in recent years
Fair: there is concern regarding the state of this indicator
Stable: the condition of the indicator has not changed significantly in recent years
Poor: the condition of the indicator is poor or low
Declining: the condition of the indicator has been declining in recent years
Not rated: there is insufficient information to determine condition
Not rated: there is insufficient information to determine trend

20
2 OVERVIEW OF STANLEY PARK
2.1 Location and Regional Context
Stanley Park is located in the Fraser Lowland or Lower Mainland region of British Columbia (BC) next to Vancouver‘s downtown core. This area of the province is rich in biodiversity, and includes a variety of habitat types that support many species of wildlife. Located near the centre of the Georgia Basin, the surrounding sea and shores provide vital habitat for millions of birds that migrate each year along the Pacific Flyway. Water birds and raptors winter here in abundance, and marine mammals use these waters as do five species of salmon as they travel to and from their spawning rivers.
The Lower Mainland is also the most densely populated area of BC. The population of this area has nearly doubled in the last quarter century to over 2.5 million people. Many people living here, as well as visitors from around the world, treasure Stanley Park as an oasis of forest in the heart of this growing metropolis. The forested peninsula is surrounded by ocean on three sides and city development to the south. The land juts out into the ocean, separating Burrard Inlet from English Bay (Figure 2) through the First Narrows. The Park lies between the Coastal Mountains to the north and the Fraser estuary to the south, and supports a wide variety of wildlife within a range of habitats. The seashore and intertidal areas provide vital overwintering habitat for water birds and rocky, sandy, and muddy substrates for marine organisms. The wetlands and streams provide cover for aquatic creatures such as invertebrates and fish, and serve as egg-laying sites for amphibians and birds. About 1/3 of the Park has retained a Coastal Western Hemlock forest which has been altered over time through natural and human forces. This lush temperate rainforest is home to many wildlife species from mink and eagles to slugs and beetles. The cultivated areas and recreational facilities within the Park are also part of its rich heritage. The oldest park in the region, Stanley Park boasts a cultural heritage spanning from the time when early Coast Salish people lived on the peninsula until the present day. Ancient shell middens and totem poles, heritage buildings and gardens, and the famous seawall are some of the most treasured historical features of the Park.
Figure 2: Stanley Park overview photo (Photo by Vancouver Park Board).
21
Stanley Park is unique because it is such a large, forested area in the heart of a major city. Although the forest was logged before the Park was created, many of the large veteran trees were spared and remain standing today. This easily accessible public park is rich in both natural and cultural history and appeals to people from all walks of life. As a refuge for wildlife in the city, it serves as vital habitat for many resident and transient species. It is one of the few places left in the Lower Mainland where ancient rainforest trees, natural forest wetlands, and seashores are found in close proximity.
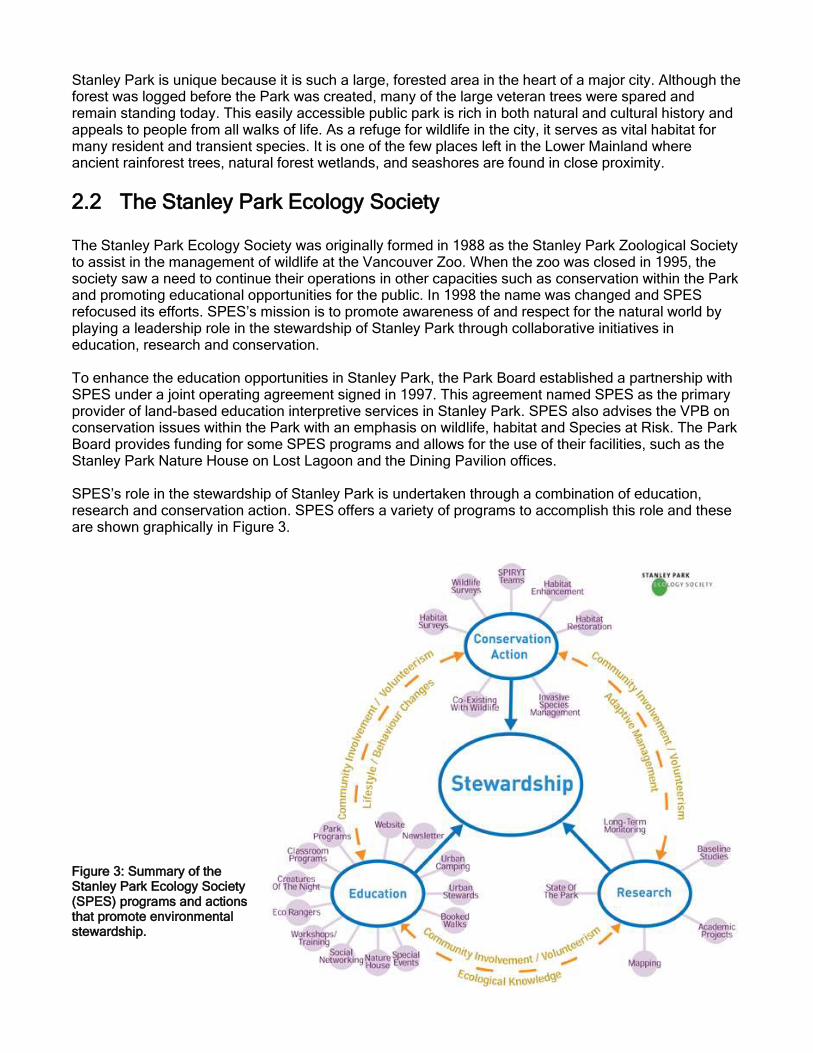
2.2 The Stanley Park Ecology Society The Stanley Park Ecology Society was originally formed in 1988 as the Stanley Park Zoological Society to assist in the management of wildlife at the Vancouver Zoo. When the zoo was closed in 1995, the society saw a need to continue their operations in other capacities such as conservation within the Park and promoting educational opportunities for the public. In 1998 the name was changed and SPES refocused its efforts. SPES‘s mission is to promote awareness of and respect for the natural world by playing a leadership role in the stewardship of Stanley Park through collaborative initiatives in education, research and conservation. To enhance the education opportunities in Stanley Park, the Park Board established a partnership with SPES under a joint operating agreement signed in 1997. This agreement named SPES as the primary provider of land-based education interpretive services in Stanley Park. SPES also advises the VPB on conservation issues within the Park with an emphasis on wildlife, habitat and Species at Risk. The Park Board provides funding for some SPES programs and allows for the use of their facilities, such as the Stanley Park Nature House on Lost Lagoon and the Dining Pavilion offices. SPES‘s role in the stewardship of Stanley Park is undertaken through a combination of education, research and conservation action. SPES offers a variety of programs to accomplish this role and these are shown graphically in Figure 3.
Figure 3: Summary of the Stanley Park Ecology Society (SPES) programs and actions that promote environmental stewardship.
22
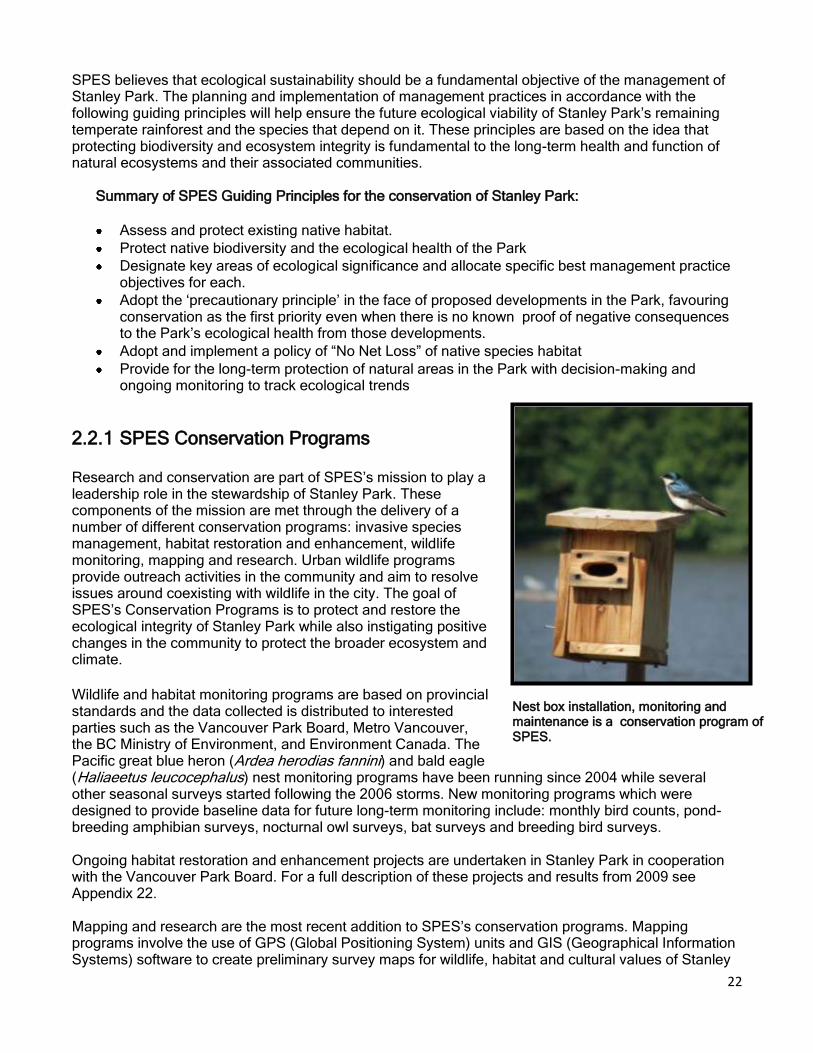
Nest box installation, monitoring and maintenance is a conservation program of SPES.
SPES believes that ecological sustainability should be a fundamental objective of the management of Stanley Park. The planning and implementation of management practices in accordance with the following guiding principles will help ensure the future ecological viability of Stanley Park‘s remaining temperate rainforest and the species that depend on it. These principles are based on the idea that protecting biodiversity and ecosystem integrity is fundamental to the long-term health and function of natural ecosystems and their associated communities.
Summary of SPES Guiding Principles for the conservation of Stanley Park:
Assess and protect existing native habitat.
Protect native biodiversity and the ecological health of the Park
Designate key areas of ecological significance and allocate specific best management practice objectives for each.
Adopt the ‗precautionary principle‘ in the face of proposed developments in the Park, favouring conservation as the first priority even when there is no known proof of negative consequences to the Park‘s ecological health from those developments.
Adopt and implement a policy of ―No Net Loss‖ of native species habitat
Provide for the long-term protection of natural areas in the Park with decision-making and ongoing monitoring to track ecological trends
2.2.1 SPES Conservation Programs Research and conservation are part of SPES‘s mission to play a leadership role in the stewardship of Stanley Park. These components of the mission are met through the delivery of a number of different conservation programs: invasive species management, habitat restoration and enhancement, wildlife monitoring, mapping and research. Urban wildlife programs provide outreach activities in the community and aim to resolve issues around coexisting with wildlife in the city. The goal of SPES‘s Conservation Programs is to protect and restore the ecological integrity of Stanley Park while also instigating positive changes in the community to protect the broader ecosystem and climate.
Wildlife and habitat monitoring programs are based on provincial standards and the data collected is distributed to interested parties such as the Vancouver Park Board, Metro Vancouver, the BC Ministry of Environment, and Environment Canada. The Pacific great blue heron (Ardea herodias fannini) and bald eagle (Haliaeetus leucocephalus) nest monitoring programs have been running since 2004 while several other seasonal surveys started following the 2006 storms. New monitoring programs which were designed to provide baseline data for future long-term monitoring include: monthly bird counts, pond-breeding amphibian surveys, nocturnal owl surveys, bat surveys and breeding bird surveys. Ongoing habitat restoration and enhancement projects are undertaken in Stanley Park in cooperation with the Vancouver Park Board. For a full description of these projects and results from 2009 see Appendix 22. Mapping and research are the most recent addition to SPES‘s conservation programs. Mapping programs involve the use of GPS (Global Positioning System) units and GIS (Geographical Information Systems) software to create preliminary survey maps for wildlife, habitat and cultural values of Stanley
23
Park. Mapping is an essential tool for the collection and analysis of habitat and wildlife data, and also provides for clear communication with the public and Park management. SPES staff also work with academic institutions to support research activities in the Park including undergraduate and Masters level student projects.
2.2.2 Environmental Education
Public Programs Through Public Programs, Park visitors from Vancouver and beyond expand their environmental awareness and learn how to shrink their environmental footprint. Many programs run from the Stanley Park Nature House at Lost Lagoon. This interpretive facility is run by SPES in cooperation with the Park Board and acts as a gathering place for people and information in the Park. Weekly Discovery Walks led by interpreters take participants deeper into the natural world to explore a variety of topics in an exceptional outdoor setting. In the summer, volunteer Eco Rangers are trained to patrol the park and teach visitors about local ecology and the perils of feeding wildlife. English as a Second Language (ESL) schools and other groups partake in interactive programs which encourage discussion and expose people to the native flora and fauna of the Park. Other Public Programs include Young Naturalist Club, private and group events, and monthly bird walks. School Programs SPES‘s School Programs aim to teach children about nature, local biodiversity and how humans play a part in our changing ecosystems. Skilled educators use the Park as a classroom and students participate in activities such as pond-dipping for aquatic insects, hiking in the forest, or combing the beach. Urban camping in the spring provides students with an overnight camping experience in the Park. For many inner city children, this is the first time they have ever slept in a tent in the woods. Students learn how to prepare meals, navigate and have fun in a ‗wilderness‘ setting. Whether students come to the Park or SPES staff go to their classrooms, the goal of school programs is to foster environmental stewardship by empowering kids to take action in ways that make a difference in their environment.
2.3 Park Management
2.3.1 The Vancouver Park Board
In 1888 when Stanley Park was leased to the City of Vancouver by the federal government, the City Council established a separately elected committee called the ―Vancouver Board of Parks‖ (now known as the Vancouver Board of Parks and Recreation or the Vancouver Park Board) to govern all park and recreation matters. This is the only such board in Canada and it is responsible for the management of more than 200 parks in Vancouver including the largest and oldest, Stanley Park. The Park Board is comprised of a group of seven commissioners, who are elected every three years. The Park Board‘s mission is to provide, preserve and advocate for parks and recreation services to benefit people, communities and the environment. They are responsible for the management and maintenance of playgrounds, sports fields, ice rinks, fitness centers, indoor and outdoor pools, beaches, tennis courts, golf courses, 23 community centers and over 200 parks in the City of Vancouver (VBPR, 2008a).
24
2.3.2 Park Management Background
Since the Vancouver Park Board was first conceived, park management and public attitudes have changed dramatically. Parks were created in the late 19th and early 20th centuries as places for nature preservation and tourism. These wilderness areas became venues for formal recreation as facilities and roads were built, attractions were marketed, and public lands became destinations for tourism. As land development took place around parks, they began to serve as islands of wilderness amidst human cultivation. Their function changed in favour of conservation, so that now, new parks are often created to preserve wilderness areas and there is a growing sensitivity to human intervention in existing parks. The removal of the zoo in Stanley Park and the transformation of the area into a salmon stream reflect how public attitudes towards the recreational use of the Park have changed over time. Public attitudes and popular opinion have shaped the Stanley Park we know today. It is not an untouched wilderness and has been closely managed since its creation. The policies and operations undertaken in the Park have changed as dramatically as the city that grew up beside it. Park management policies as well as shifting public values have changed over time alongside changes in our knowledge of forest ecosystems.
Vancouverites have always been passionate about Stanley Park. This was demonstrated most recently with the outpouring of support and lively discussion following the 2006 windstorm. As early as 1912, some members of the public spoke out against the development of the Park and the removal of forest using the slogan ―Hands off Stanley Park‖ (Vancouver Daily Province, 1912). When the construction of a new stadium in the park was proposed, a group called the ―City Beautiful Association‖ said it would take legal means to stop the development, using a clause in the federal land lease. The lease required that alterations to the Park and the removal of trees (other than for road building) were not allowed without permission from the minister (Vancouver Daily Province, 1912).
Major windstorms, a natural driving force for forest succession on BC‘s coast, have also been a considerable force driving changes in Stanley Park management policies. After the first windstorm hit the Park after its creation in 1901, Park managers accepted the idea of being Park stewards who needed to ‗restore‘ it to a normal state (Kheraj, 2007). Due to lack of funding, however, they did not actively engage in forest management operations until another major storm hit in 1934. By the 1950s, forest regeneration was a regularly funded program in the Park and involved the systematic removal and replacement of dead and dying trees. It has been estimated that more than 150,000 trees were planted in the Park from the 1940s to the 1980s with the dominant species being Douglas-fir (Pseudotsuga menziesii) (90%) and to a lesser extent western red cedar (Thuja plicata) and grand fir (Abies grandis) (Fry, 1990). The popular public belief that Stanley Park was a piece of pristine wilderness caused managers to hide their restoration activities from the public. The Chief Forester of the Park in the1950s, Harry Booth, said that Park workers would ―try to do [their] work so that the public won‘t know the forest is being touched‖ (Kheraj, 2007). Although there had been about 20 major windstorms recorded by 1960, the largest to hit was ―Typhoon Frieda‖ which struck the Park in 1962 and felled thousands of trees. Restoration efforts followed as debris was cleared and Douglas-fir trees were planted. Following the cleanup, the large cleared area east of Pipeline Road was developed to accommodate the miniature train attraction. Insect outbreaks and tree disease have also been responsible for instigating forestry management actions in the Park. In 1910 Park Superintendent W.S. Rawlings called for the first study of forest health with the help of the Dominion Entomological Department after an insect outbreak occurred (Fry, 1990). These experts recommended several forest management activities including: the removal of dead, dying or diseased trees, the topping of selected trees, the use of pesticides and rigorous fire suppression (Fry, 1990).

25
Reports made over the years by entomologists for Park managers suggested the replanting of primarily Douglas-fir trees and the rigorous removal of all newly fallen trees and underbrush from the Park. In a 1931 report, one entomologist reported that ―the ground is densely covered with undergrowth, dead trees, and limbs also cover the ground so that the whole park is almost an impenetrable jungle, shutting out light and air‖ (Kheraj, 2007). The suggestion was that keeping the forest floor clear would help the germination and growth of naturally regenerating trees. In 1948, another report was submitted about the condition of the Park‘s forest, and explained that the western hemlock (Tsuga heterophylia) and Sitka spruce (Picea sitchensis) in the Park were seriously affected by destructive insects and caused an ―unhealthy appearance‖. The report suggested that these trees be felled, burned and replaced with Douglas-fir to remove all insect breeding possibilities. This program was implemented and the 1950 Park Board Annual Report claimed that the situation had improved. In 1984, Stanley Park‘s first Master Plan called for the implementation of a ―comprehensive forest management program‖ (VBPR, 1984). By 1989 a new forestry plan for the Park Board was written by MacMillan Bloedel. This plan included the selective conversion of deciduous forest to coniferous stands through the removal of trees and brush, and subsequent planting. The plan also outlined further plans to plant seedlings and clear debris and regrowth from small blowdown areas. Some parts of the plan benefited wildlife including the maintenance of ‗wildlife trees‘ which were recognized as vital habitat. Bill Beese and others working on this plan created the first detailed maps of the forests of the Park including detailed stand descriptions and locations of important bird nesting sites. Despite some public opposition to the plan, some parts of it were approved by the board and many of its recommended practices were followed for almost 20 years until the latest major windstorm in 2006 (Park Board, pers. comm.). Hurricane-force winds levelled about 10,000 trees in Stanley Park on December 15, 2006. Again the public was shocked by damage to their beloved Park and a massive outpouring of support and donations were bestowed on it by the citizens of Vancouver and all levels of government. This windstorm was again believed to have caused negative impacts in the Park and cleanup efforts were started to get things back to normal. However, scientific knowledge of forest ecosystems had changed, and our new understanding of the role of these windstorms as a natural process was finally recognized. Park managers elicited the help of professionals in the fields of forestry, ecology and geoengineering to formulate a Restoration Plan (VBPR, 2007). The Park Board facilitated public participation through public opinion surveys and the creation of a stakeholders‘ committee. This committee was made up of interested parties including local environmental groups and businesses, First Nations representatives, and other Park users. The resulting Restoration Plan was implemented in 2007-2008 as thousands of fallen and damaged trees were removed and thousands more were planted in their place. The difference between this plan and previous ones was that for the first time the forest was given due consideration as a diverse ecosystem. Each blowdown area was taken into account in terms of its species composition and structural diversity as well as its role in providing wildlife habitat. Biologists were on site to survey wildlife values and Species at Risk (SAR); foresters made recommendations on appropriate Coarse Woody Debris (CWD) levels and replanting prescriptions; entomologists monitored levels of potential insect outbreaks; geographic information system (GIS) technicians and forestry students created and updated maps on forest resources; and environmental monitors worked with forestry operations staff to reduce the disruption to natural processes while the Restoration took place. One of the recommendations of the Restoration Plan was to create an updated Forest Management Plan for the Park. This plan was finished in March 2009 and was based on the 1989 forestry plan, the 2007 Restoration Plan, and new knowledge about the Park that had been learned over the years. Although this new Forest Management Plan is the most comprehensive and ecologically-based to date, it only represents the management of the forested areas of the Park (2/3 of the Park or 260 ha). Stanley Park lacks an overall management plan that integrates both its cultural and ecological integrity. The
26
Park is currently managed using several guiding documents and applicable laws which are described in the following section.
2.3.3 Management Guidelines
Although there is no current Master Plan for the management of Stanley Park, there are several documents that exist to guide its management:
The Stanley Park Master Plan (VBPR, 1984)
The Parks Canada: National Historic Site of Canada, Commemorative Integrity Statement (Parks Canada, 2002)
The Vancouver Board of Parks and Recreation Strategic Plan (VBPR, 2005)
The Stanley Park Forest Management Plan (VBPR, 2009)
The Recreation and Transportation Plan (VBPR, 1996): Stanley Park Master Plan The Stanley Park Master Plan was created in 1984 by an independent consultant (MacLaren Plansearch) on behalf of the Park Board (VBPR, 1984). It examined issues, opportunities and constraints concerning natural and heritage resources, transportation, recreation facilities and programs, commercial operations, and park operations. The plan does not state a vision or mission for the Park but it identified a ‗theme‘ which could be used to guide management decisions and future developments. Detailed strategies to address park issues that were identified by Park Board commissioners and the public in the 1980‘s. In terms of resource management, the plan includes some background information on forests, habitats and wildlife, and makes several recommendations for managers including:
that there be an immediate undertaking of a comprehensive forest management program;
that open space not be expanded (except through clearing underbrush);
that the seabird colony, great blue heron habitats, foreshore, and Beaver Lake be recognized as ―areas of ecological importance‖ and be given special protection;
that a wildlife management program be implemented (including a biophysical inventory of the Park, enhancement of Beaver Lake, snag management, nesting boxes and Canada goose control (VBPR, 1984).
After the Master Plan was submitted to the Park Board, commissioners decided not to approve the plan in its entirety and instead passed several resolutions based on its recommendations. The approved resolutions concerning natural resource management included that:
a forest management program be created (for thinning plantations, brushing undergrowth, preserving monument trees, planting new trees, and topping dead tops),
adequate steps be taken to avoid forest fires,
the recommendations on Beaver Lake enhancement and management proposal be documented more specifically,
a biophysical resource survey be approved,
a public education program to reduce the dumping of domestic pets be undertaken,
snags [dead standing trees] be left for bird nesting,
nesting boxes be introduced,
there be a policy for the control of Canada goose populations, and
the natural resources be used for non-intrusive and non-commercial interpretation programs (VBPR, 1984).
27
Several other recommendation concerning heritage resources, transportation, recreation facilities and programs, commercial operations, and park operations were also made. These included that there should be:
improvements to nature interpretation opportunities,
improvements to facilities and landscaping,
restrictions on new developments in the Park,
increased transit opportunities and transportation improvements,
reductions to the zoo areas,
infrastructure upgrading,
increased recreational programming.
Stanley Park Forest Management Plans Based on the recommendation made in the 1984 Stanley Park Master Plan, the Park Board worked with MacMillan Bloedel to create the first Forest Regeneration Program for the Park (Beese and Paris, 1989a,1989b). A forest inventory crew led by Bill Beese undertook a comprehensive timber cruise of Stanley Park to assess its forest regeneration needs and to undertake detailed forest inventories. The program aimed to rehabilitate the Park‘s coniferous forest by reducing the amount of deciduous growth and planting young trees to replace older trees as they died. The program was to last 10 years and prescribed several silvicultural treatments such as deciduous tree conversion (the removal and replacement of deciduous trees with conifers), thinning, brushing, pruning, fertilization and planting close to 30,000 seedling conifer trees. It also called for the removal of diseased and hazardous trees, but also called for their protection, when possible, in the interest of wildlife. Other wildlife information was derived from research conducted by Robertson Environmental Services regarding forest bird use of different forest types (Beese and Paris, 1989b). The wildlife section of the program report attempts to predict the effects certain forest prescriptions would have on birds and other wildlife, and makes recommendations accordingly. The report also provides a broad overview of habitat types and wildlife use of the Park. Because there was so much public opposition to the Forest Regeneration Program, it was never approved or fully adopted, but some recommendations within the plan were used by Park foresters over the next 20 years. The recommendations to underplant deciduous tree stands with conifers, and to clear, replant, and brush small windfall areas were used extensively in the Park during this time. However, the recommendations to clear and replant deciduous stands and thin out existing plantations were not followed. The latest Stanley Park Forestry Management Plan was created by the Park Board in March 2009 (VBPR, 2009). This plan was loosely based on the previous one, but also incorporated new information, ideas, and prescriptions for forest management that came about during the Restoration Plan that existed in 2007-2008. The vision for the 2009 Stanley Park Forestry Management Plan is the same as the vision created for the Restoration Plan, which is:
―That Stanley Park‘s forest be a resilient coastal forest with a diversity of native tree and other species and habitats, that allows park visitors to experience nature in the city.‖
This new plan contains detailed appendices outlining baseline data, prescriptions for forestry work, operational guidelines, and best management practices for certain activities taking place in the Park‘s forested areas. One of the most notable differences between this and previous plans was the
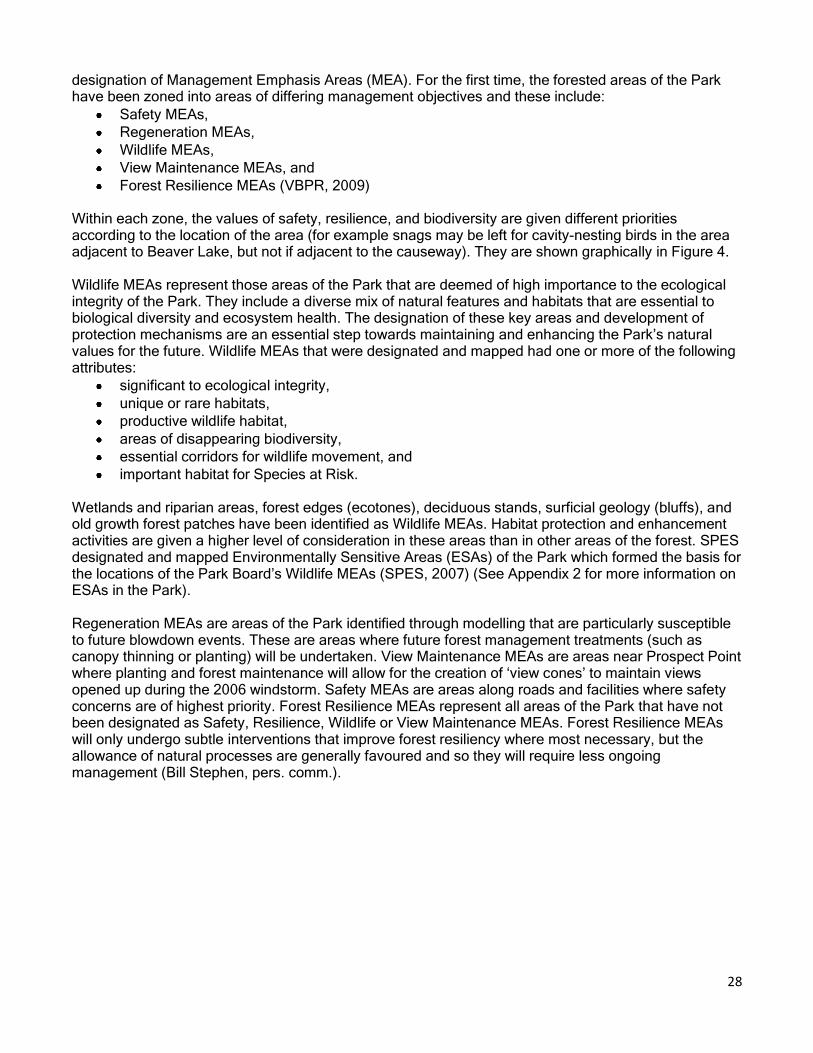
28
designation of Management Emphasis Areas (MEA). For the first time, the forested areas of the Park have been zoned into areas of differing management objectives and these include:
Safety MEAs,
Regeneration MEAs,
Wildlife MEAs,
View Maintenance MEAs, and
Forest Resilience MEAs (VBPR, 2009)
Within each zone, the values of safety, resilience, and biodiversity are given different priorities according to the location of the area (for example snags may be left for cavity-nesting birds in the area adjacent to Beaver Lake, but not if adjacent to the causeway). They are shown graphically in Figure 4. Wildlife MEAs represent those areas of the Park that are deemed of high importance to the ecological integrity of the Park. They include a diverse mix of natural features and habitats that are essential to biological diversity and ecosystem health. The designation of these key areas and development of protection mechanisms are an essential step towards maintaining and enhancing the Park‘s natural values for the future. Wildlife MEAs that were designated and mapped had one or more of the following attributes:
significant to ecological integrity,
unique or rare habitats,
productive wildlife habitat,
areas of disappearing biodiversity,
essential corridors for wildlife movement, and
important habitat for Species at Risk. Wetlands and riparian areas, forest edges (ecotones), deciduous stands, surficial geology (bluffs), and old growth forest patches have been identified as Wildlife MEAs. Habitat protection and enhancement activities are given a higher level of consideration in these areas than in other areas of the forest. SPES designated and mapped Environmentally Sensitive Areas (ESAs) of the Park which formed the basis for the locations of the Park Board‘s Wildlife MEAs (SPES, 2007) (See Appendix 2 for more information on ESAs in the Park). Regeneration MEAs are areas of the Park identified through modelling that are particularly susceptible to future blowdown events. These are areas where future forest management treatments (such as canopy thinning or planting) will be undertaken. View Maintenance MEAs are areas near Prospect Point where planting and forest maintenance will allow for the creation of ‗view cones‘ to maintain views opened up during the 2006 windstorm. Safety MEAs are areas along roads and facilities where safety concerns are of highest priority. Forest Resilience MEAs represent all areas of the Park that have not been designated as Safety, Resilience, Wildlife or View Maintenance MEAs. Forest Resilience MEAs will only undergo subtle interventions that improve forest resiliency where most necessary, but the allowance of natural processes are generally favoured and so they will require less ongoing management (Bill Stephen, pers. comm.).
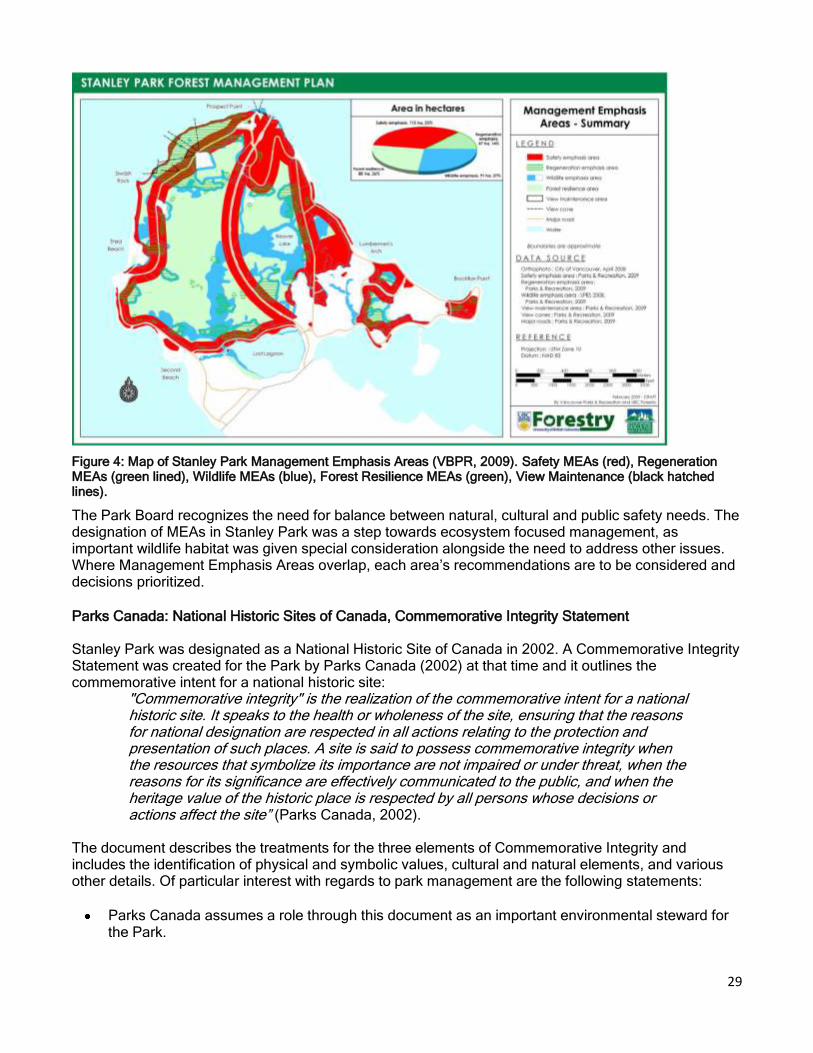
29
Figure 4: Map of Stanley Park Management Emphasis Areas (VBPR, 2009). Safety MEAs (red), Regeneration MEAs (green lined), Wildlife MEAs (blue), Forest Resilience MEAs (green), View Maintenance (black hatched lines).
The Park Board recognizes the need for balance between natural, cultural and public safety needs. The designation of MEAs in Stanley Park was a step towards ecosystem focused management, as important wildlife habitat was given special consideration alongside the need to address other issues. Where Management Emphasis Areas overlap, each area‘s recommendations are to be considered and decisions prioritized.
Parks Canada: National Historic Sites of Canada, Commemorative Integrity Statement Stanley Park was designated as a National Historic Site of Canada in 2002. A Commemorative Integrity Statement was created for the Park by Parks Canada (2002) at that time and it outlines the commemorative intent for a national historic site:
"Commemorative integrity" is the realization of the commemorative intent for a national historic site. It speaks to the health or wholeness of the site, ensuring that the reasons for national designation are respected in all actions relating to the protection and presentation of such places. A site is said to possess commemorative integrity when the resources that symbolize its importance are not impaired or under threat, when the reasons for its significance are effectively communicated to the public, and when the heritage value of the historic place is respected by all persons whose decisions or actions affect the site‖ (Parks Canada, 2002).
The document describes the treatments for the three elements of Commemorative Integrity and includes the identification of physical and symbolic values, cultural and natural elements, and various other details. Of particular interest with regards to park management are the following statements:
Parks Canada assumes a role through this document as an important environmental steward for the Park.

30
Wildlife habitat of species that have been designated as rare, threatened or endangered by the Committee on the Status of Endangered Wildlife in Canada (COSEWIC), or by the Government of BC, will be protected.
Natural ecosystem features, which by virtue of their strategic location and physical or biological characteristics are of value to government agencies involved in environmental monitoring and programs to maintain biodiversity and genetic resources in Canada, will be protected.
Natural ecosystem features of special significance [similar to SPES‘s ESAs] will be managed in accordance with the principles and relevant policies regarding the protection and management of natural ecosystems set out in Section 3.0 of the National Parks Policy, and by the applicable directives and procedures used to guide the management of natural ecosystem features in the national parks (Parks Canada, 2002).
Vancouver Board of Parks and Recreation Strategic Plan Another document guiding management in Stanley Park is the Vancouver Board of Parks and Recreation Strategic Plan (VBPR, 2005). The strategic plan states that ―the preservation and enhancement of the natural environment is a core responsibility of the Park Board‖ and that their Strategic Direction to ―develop sustainable policies and practices that achieve environmental objectives while meeting the needs of the community‖. This Strategic Direction includes pertinent actions to:
Integrate sustainability concepts into the design, construction, and maintenance of parks.
Preserve existing native habitat and vegetation.
Strengthen and expand the Park environments: local wildlife, native biodiversity.
Train staff in sustainable maintenance and environmental management best practices.
The Park Board strategic plan will likely be reviewed in the near future as it was a 5 year plan.
2.3.4 Laws and Best Management Practices
There are several different pieces of legislation and by-laws that are applicable in Stanley Park management. These are namely:
Provincial Wildlife Act (BC MOE, 1996)
Federal Species at Risk Act (SARA) (SARA, 2002)
Migratory Birds Convention Act (MBCA, 1994)
Federal Fisheries Act ( R.S., 1985, c. F-14 ) (DFO, 1985)
Provincial Water Act [RSBC 1996] CHAPTER 483 (BC Gov., 1996)
Vancouver Board of Parks and Recreation - PARK BY-LAWS (VBPR, 2008)
Guidelines and Best Management Practices (BMPs) are documents created by the BC Ministry of the Environment which are based on known science, and exist to help guide responsible stewardship of the environment. They are usually written in a way that is directed towards land developers, but are also commonly consulted and observed by local municipalities to ensure that their activities are planned and carried out in compliance with the related legislation, regulations, and policies. BMP‘s pertinent to Stanley Park include:
Best Management Practices of Raptors (BC MOE, 2005)
Standards and Best Practices for Instream Works ( BC MOE, 2004a)
Best Management Practices for Protecting Amphibians and Reptiles in British Columbia (BC MOE, 2004b)
An explanation of these BMPs are detailed in Appendices 3 and 4 respectively.

31
Lumberman‘s Arch in Stanley Park (Photo by Vancouver Park Board).
2.4 Recreation and facilities
Stanley Park‘s coniferous, deciduous, and mixed forest stands cover 65% of the Park and the remaining 35% has been developed into infrastructure, recreation and entertainment facilities (Best, 2002). The Park provides a wide variety of recreational opportunities and is used by bird watchers, naturalists, tourists, students, local residents and the general public. Visitors can enjoy picnicking, formal dining, the Children‘s Farmyard and Miniature Railway, an outdoor swimming pool, a water park and swimming
beaches, flower gardens, tennis courts, playgrounds, a pitch and putt golf course, a visitor centre and the seawall. There are presently four restaurants in Stanley Park as well as four picnic sites, located at Prospect Point, Ceperley/Second Beach and two sites near the Miniature Railway (VBPR, 2008a). Vancouver‘s first children‘s playground was developed at Ceperley Meadow near Second Beach and there are other play areas near Lumbermen‘s Arch and the Stanley Park Dining Pavilion (VBPR, 2008a). Malkin Bowl has been an entertainment venue since the late 1950s. It has showcased many outdoor theatre productions and concerts for the general public (VBPR, 2008a). The Children‘s Farmyard was built in 1982 and extended in 1993, but recent funding cutbacks have left its fate undetermined at the present time. Second Beach is used for swimming and there is also a large public outdoor swimming pool at this location. There is a children‘s water park situated next to Burrard Inlet on the Park‘s east side. Sport clubs have been in Stanley Park since the late 1880s (VBPR, 2008a). Within the Park there are athletic fields located at Brockton Oval, first opened in 1891. They are equipped with a running track and an interior playing field and serve as many as 10 different sport groups (VBPR, 2008a). The Royal Vancouver Yacht Club has been in the Park since 1905 as well as the Vancouver Rowing Club which was built in 1911. There are many club sports represented at the Rowing Club including rowing, rugby, cricket, yachting, jogging, tennis and field hockey (VBPR, 2008a). There are three main roadways that go through Stanley Park: the central Causeway, Pipeline Road and Park Drive. The main circulation route was established before the official dedication of Stanley Park in 1888 (VBPR, 1984). Park Drive encircles the peninsula and was partially paved with calcined shells from a First Nations midden (VBPR, 1984). The Coal Harbour Bridge was built in 1888 and provided the main entrance to Stanley Park. There were
'People Amongst the People' Welcome Gate by Susan Point. Photo by Vancouver Park Board

32
also numerous walking paths that were developed to contact visitors with points of interest (VBPR, 1984). By 1919 there were 55 km of walking trails and 13 km of Park Drive had already been completed (VBPR, 1984). Seawall construction was underway and the original Park road had been hard-surfaced to carry horse drawn carriages and motor buses. During this time, the Coal Harbour Bridge was replaced by a Causeway to facilitate traffic movement and Park Drive was changed from two-way to one-way flow (VBPR, 1984). In 1938, the Lions Gate Bridge and Causeway was opened. This marked a major change in traffic movement through Stanley Park, and the fragmentation of the habitat into two distinct halves. Stanley Park‘s forest trails now cover 27 km within the Park. Many of these trails were first created as 'skid rows'
when loggers pulled felled trees to the water‘s edge for log booming in the 1860s (VBPR, 2009c). The seawall, an 8.8 km walkway around the perimeter of Stanley Park, is one of its most familiar features and is a popular route for walking, jogging, inline skating and cycling. It was completed in 1975 and by 1981 it was adapted for separate use by bicycles and pedestrians (VPBR, 1984). The Vancouver Aquarium is also located in the Park. The Aquarium was opened in 1956, and it has become the largest in Canada with a wide collection of marine life including dolphins, whales, pinnipeds and a wide variety of fish and other aquatic organisms.
The Stanley Park Dining Pavilion (shown here in winter) was built in 1911 and is currently the site of a restaurant, banquet hall and the offices of the Stanley Park Ecology Society.
33
BIOPHYSICAL INVENTORY
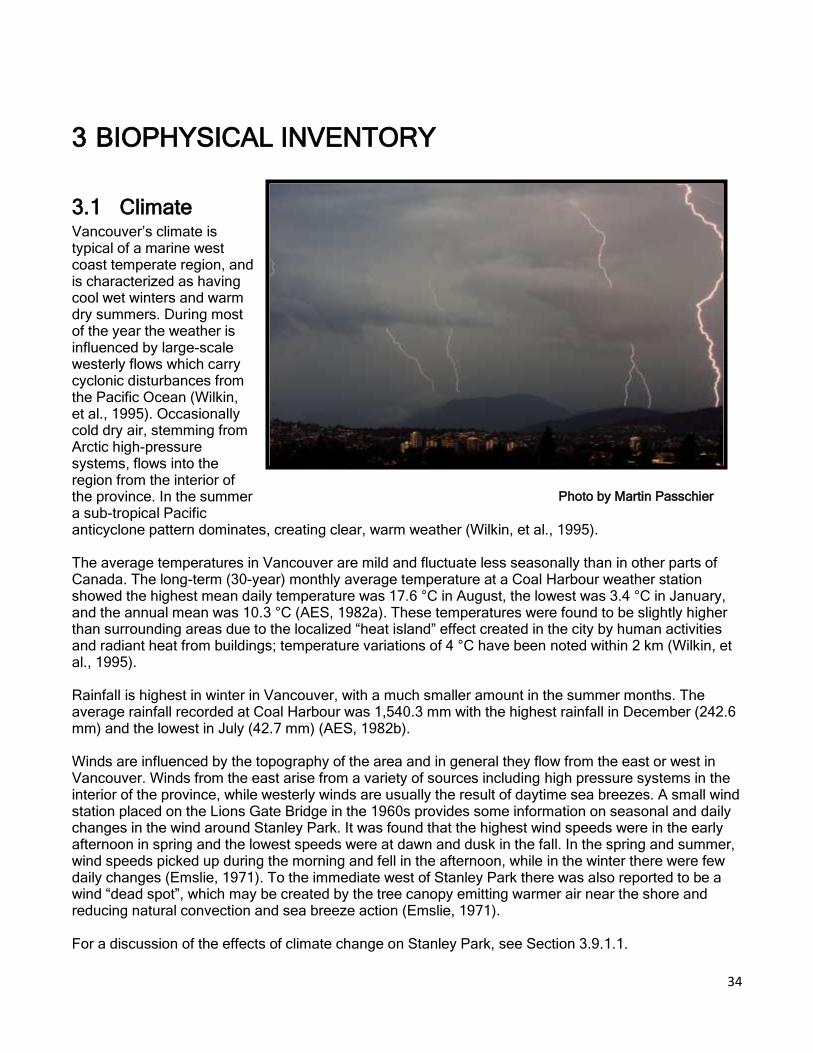
34
Photo by Martin Passchier
3 BIOPHYSICAL INVENTORY
3.1 Climate Vancouver‘s climate is typical of a marine west coast temperate region, and is characterized as having cool wet winters and warm dry summers. During most of the year the weather is influenced by large-scale westerly flows which carry cyclonic disturbances from the Pacific Ocean (Wilkin, et al., 1995). Occasionally cold dry air, stemming from Arctic high-pressure systems, flows into the region from the interior of the province. In the summer a sub-tropical Pacific anticyclone pattern dominates, creating clear, warm weather (Wilkin, et al., 1995). The average temperatures in Vancouver are mild and fluctuate less seasonally than in other parts of Canada. The long-term (30-year) monthly average temperature at a Coal Harbour weather station showed the highest mean daily temperature was 17.6 °C in August, the lowest was 3.4 °C in January, and the annual mean was 10.3 °C (AES, 1982a). These temperatures were found to be slightly higher than surrounding areas due to the localized ―heat island‖ effect created in the city by human activities and radiant heat from buildings; temperature variations of 4 °C have been noted within 2 km (Wilkin, et al., 1995). Rainfall is highest in winter in Vancouver, with a much smaller amount in the summer months. The average rainfall recorded at Coal Harbour was 1,540.3 mm with the highest rainfall in December (242.6 mm) and the lowest in July (42.7 mm) (AES, 1982b). Winds are influenced by the topography of the area and in general they flow from the east or west in Vancouver. Winds from the east arise from a variety of sources including high pressure systems in the interior of the province, while westerly winds are usually the result of daytime sea breezes. A small wind station placed on the Lions Gate Bridge in the 1960s provides some information on seasonal and daily changes in the wind around Stanley Park. It was found that the highest wind speeds were in the early afternoon in spring and the lowest speeds were at dawn and dusk in the fall. In the spring and summer, wind speeds picked up during the morning and fell in the afternoon, while in the winter there were few daily changes (Emslie, 1971). To the immediate west of Stanley Park there was also reported to be a wind ―dead spot‖, which may be created by the tree canopy emitting warmer air near the shore and reducing natural convection and sea breeze action (Emslie, 1971). For a discussion of the effects of climate change on Stanley Park, see Section 3.9.1.1.
35
3.2 Terrestrial Ecosystems
3.2.1 Geology and Topography
3.2.1.1 Geological History
Rock formations underlying what is now Stanley Park first began to form in the Mesozoic era, around 200 to 100 million years ago. Encompassing even older metamorphosed volcanic and sedimentary rocks, Jurassic and Cretaceous granitic intrusions formed during convergent tectonic episodes uplifted, and began to be eroded by active rivers from continental mountains in the east. Thick sediments including conglomerate, sandstone, siltstone, and shale were deposited in the Georgia Basin, a low-lying deltaic to seawater basin overlying granitic bedrock in an area that now extends from Nanaimo to Bellingham to the Fraser Lowland to Vancouver‘s North Shore.
The older, deeper water strata in the Nanaimo Group (which underlies many of the Gulf Islands and parts of Nanaimo) included marine fossils such as ammonites and other mollusks as well as large marine reptiles such as the Elasmosaurus (Courtenay). Younger and shallower strata from ancient river deltas contained fossil forests that turned to coal and are now represented by sediments in Nanaimo and Coal Harbour (Stanley Park).
The sedimentary bedrock of Stanley Park consists of layers dipping south from uplift of the North Shore granitic bedrock mountains, such that the layers exposed overlying the granodiorite in Capilano Canyon, at the base of the sequence, are the oldest in the Vancouver area (85 million years old). These get progressively younger through Stanley Park towards the Kitsilano Foreshore, where the layers are as young as 50 million years old). These ages were established by detailed palynological studies based at the University of British Columbia (UBC). Although the stratigraphic names have changed from the Burrard and Kitsilano formations to the now more generally accepted Huntingdon Formation, the story has remained the same.
Fossil leaves and other plant parts have been found in sandstone and shale of the lower Capilano River exposures throughout Stanley Park, in Kitsilano and the Grandview Cut, on Burnaby Mountain, at Kanaka Creek (Maple Ridge), and at Sumas Mountain (Abbotsford). However, no animal fossils have ever been reported from these strata, which is unfortunate because the older layers in the Capilano River area and in the northern part of Stanley Park predate the extinction of dinosaurs approximately 65 million years ago. Somewhere between Siwash Rock and Third Beach, hidden under younger glacial deposits, lie traces of where the Cretaceous–Tertiary boundary would have been if it hadn‘t been eroded long ago in late Cretaceous to early Paleocene time.
Plant fossils reported from Stanley Park in the past have included palmetto leaves, Metasequoia needles (modern specimens are growing in Stanley Park for comparison), cedar and cypress-like branches, and leaves that look like relatives of alders and other Betulaceae. Most of the best plant fossil localities in Stanley Park and Coal Harbour have been obscured under the seawall. Dark carbon impressions of leaves in shale layers are still visible beneath the cliffs of Ferguson Point at the southern end of Third Beach.
Currently, Stanley Park rests mainly on brown sandstones and mudstones of the Kitsilano and Burrard formations (VBPR, 1984), now considered part of the Huntingdon Formation (Roddick 2001). These sedimentary formations, which formed about 70 to 50 million years ago (Clague, 2003), can be viewed along a large part of the seawall, especially between Third Beach and Prospect Point, where they can
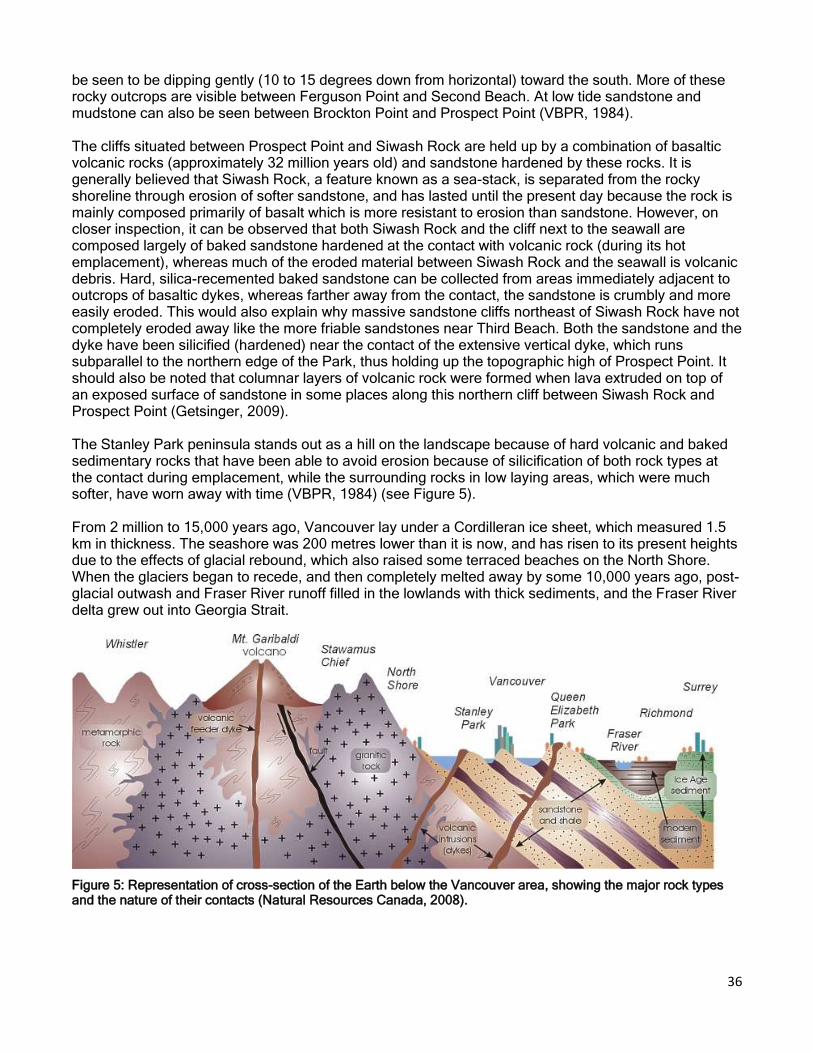
36
be seen to be dipping gently (10 to 15 degrees down from horizontal) toward the south. More of these rocky outcrops are visible between Ferguson Point and Second Beach. At low tide sandstone and mudstone can also be seen between Brockton Point and Prospect Point (VBPR, 1984). The cliffs situated between Prospect Point and Siwash Rock are held up by a combination of basaltic volcanic rocks (approximately 32 million years old) and sandstone hardened by these rocks. It is generally believed that Siwash Rock, a feature known as a sea-stack, is separated from the rocky shoreline through erosion of softer sandstone, and has lasted until the present day because the rock is mainly composed primarily of basalt which is more resistant to erosion than sandstone. However, on closer inspection, it can be observed that both Siwash Rock and the cliff next to the seawall are composed largely of baked sandstone hardened at the contact with volcanic rock (during its hot emplacement), whereas much of the eroded material between Siwash Rock and the seawall is volcanic debris. Hard, silica-recemented baked sandstone can be collected from areas immediately adjacent to outcrops of basaltic dykes, whereas farther away from the contact, the sandstone is crumbly and more easily eroded. This would also explain why massive sandstone cliffs northeast of Siwash Rock have not completely eroded away like the more friable sandstones near Third Beach. Both the sandstone and the dyke have been silicified (hardened) near the contact of the extensive vertical dyke, which runs subparallel to the northern edge of the Park, thus holding up the topographic high of Prospect Point. It should also be noted that columnar layers of volcanic rock were formed when lava extruded on top of an exposed surface of sandstone in some places along this northern cliff between Siwash Rock and Prospect Point (Getsinger, 2009). The Stanley Park peninsula stands out as a hill on the landscape because of hard volcanic and baked sedimentary rocks that have been able to avoid erosion because of silicification of both rock types at the contact during emplacement, while the surrounding rocks in low laying areas, which were much softer, have worn away with time (VBPR, 1984) (see Figure 5). From 2 million to 15,000 years ago, Vancouver lay under a Cordilleran ice sheet, which measured 1.5 km in thickness. The seashore was 200 metres lower than it is now, and has risen to its present heights due to the effects of glacial rebound, which also raised some terraced beaches on the North Shore. When the glaciers began to recede, and then completely melted away by some 10,000 years ago, post-glacial outwash and Fraser River runoff filled in the lowlands with thick sediments, and the Fraser River delta grew out into Georgia Strait.
Figure 5: Representation of cross-section of the Earth below the Vancouver area, showing the major rock types and the nature of their contacts (Natural Resources Canada, 2008).
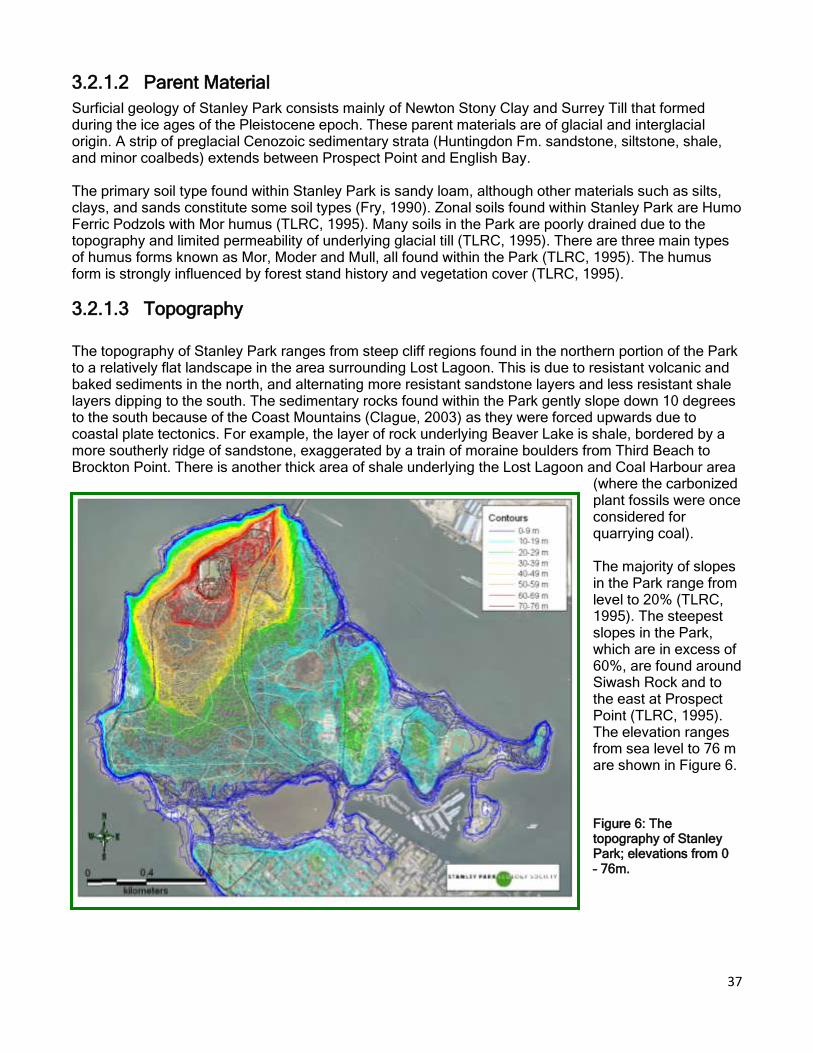
37
3.2.1.2 Parent Material
Surficial geology of Stanley Park consists mainly of Newton Stony Clay and Surrey Till that formed during the ice ages of the Pleistocene epoch. These parent materials are of glacial and interglacial origin. A strip of preglacial Cenozoic sedimentary strata (Huntingdon Fm. sandstone, siltstone, shale, and minor coalbeds) extends between Prospect Point and English Bay. The primary soil type found within Stanley Park is sandy loam, although other materials such as silts, clays, and sands constitute some soil types (Fry, 1990). Zonal soils found within Stanley Park are Humo Ferric Podzols with Mor humus (TLRC, 1995). Many soils in the Park are poorly drained due to the topography and limited permeability of underlying glacial till (TLRC, 1995). There are three main types of humus forms known as Mor, Moder and Mull, all found within the Park (TLRC, 1995). The humus form is strongly influenced by forest stand history and vegetation cover (TLRC, 1995).
3.2.1.3 Topography
The topography of Stanley Park ranges from steep cliff regions found in the northern portion of the Park to a relatively flat landscape in the area surrounding Lost Lagoon. This is due to resistant volcanic and baked sediments in the north, and alternating more resistant sandstone layers and less resistant shale layers dipping to the south. The sedimentary rocks found within the Park gently slope down 10 degrees to the south because of the Coast Mountains (Clague, 2003) as they were forced upwards due to coastal plate tectonics. For example, the layer of rock underlying Beaver Lake is shale, bordered by a more southerly ridge of sandstone, exaggerated by a train of moraine boulders from Third Beach to Brockton Point. There is another thick area of shale underlying the Lost Lagoon and Coal Harbour area
(where the carbonized plant fossils were once considered for quarrying coal). The majority of slopes in the Park range from level to 20% (TLRC, 1995). The steepest slopes in the Park, which are in excess of 60%, are found around Siwash Rock and to the east at Prospect Point (TLRC, 1995). The elevation ranges from sea level to 76 m are shown in Figure 6.
Figure 6: The topography of Stanley Park; elevations from 0 – 76m.

38
Vegetated swales were constructed at Prospect Point to redirect surface water flow away from the slopes.
3.2.2 Hydrology
The science of water flow involves, in part, the movement and distribution of water in the environment. As water falls as precipitation in Stanley Park it is either taken up by plants or it runs into streams, lakes, or sewers and ultimately ends up back in the ocean. The natural hydrology of the Park is influenced by climate, topography, and the underlying geology and the flow of water has been altered since the Park was developed through the creation of roads, trails, culverts and ditches. The Park can be divided into five different watersheds based on topographic information (see Table 2).
Table 2: Watersheds of Stanley Park (based on information in Talisman, 1995a).
Watershed Location Size Inputs Outputs
Lost Lagoon
South boundary of the Park, Ceperley Meadow, north of Lagoon Drive
(Lagoon is 16.57 ha)
Precipitation, groundwater, runoff from 1000 m of Causeway, Ceperley Creek (180 gal/min municipal water supply), Park Drive, Lagoon Drive and trail runoff, and a small amount of salt water from Coal Harbour.
One-way check valve in tidal gate and weir system allows water to escape into Coal Harbour
Beaver Lake North and centre of the Park
Total 242ha (lake is 3.85 ha)
Precipitation, groundwater, runoff from 1,000 m of Causeway, trail runoff, North Creek (0.184 m
3/s chlorinated municipal water) (Wu et al.,
1999), Railway Creek (250 m long municipal water supply), seepage from a fire hydrant near the intake pipe (Zimmerman et al. 1999).
Culvert and concrete weir drop structure leads to Beaver Creek (300 m long).
Brockton Point East of Pipeline Road
Precipitation, groundwater, runoff from some of Park Drive, Salmon Stream (municipal water supply)
All road/trail/field drainage flows out to the ocean through catch basins, ditches and culverts
Prospect Point Slopes around Prospect Point
Precipitation, groundwater, runoff from some of Park Drive, Causeway and trails.
Unnamed streams into catch basins, ditches and culverts end up in the ocean
Devonian Pond Southeast end of the Park
(pond is 0.25 ha)
Municipal water supply (3.8 cm pipe) Short overflow channel enters Coal Harbour
Following the 2007 Restoration Plan, changes were made to the drainage pattern around the Prospect Point lookout. The culvert, catch basin and ditch system were altered on the slopes in the hopes of repairing the previous system which led to wet soils on the slopes and may have contributed to the constant debris slides that were seen after the storm. A new parking lot and catchment basin were created to divert surface runoff away from the slopes. The catchment area was planted with native vegetation and was connected to the Beaver Creek watershed via North Creek through culverts. The runoff goes through a constructed linear biofiltration pond on the southeast side of
Park Drive at Prospect Point before entering North Creek (Bill Stephen, pers. comm.).

39
3.2.2.1 Hydrological Models
In 1999, UBC students created a hydrological model to predict the effects that would occur if the municipal water supply was shut off to Beaver Lake. Using parameters such as rainfall, evaporation and surface runoff, they created a five-year predictive model of what would happen if the water supply to North Creek was shut off. The model showed that the lake could maintain its level in winter (1.2-1.3 m depth) but would become far too low to adequately support aquatic life in summer (0.4-0.6 m depth) (Zimmerman et al. 1999). When they refined the model to a one-year time span to better analyze the details, they found that the lake would completely dry up for three months of the year. From this study, they concluded that Beaver Lake would benefit in terms of natural processes and succession if the municipal water supply was shut off in the winter and water was only added to Beaver Creek in the summer months (Zimmerman et al. 1999). A model was created by B.A. Blackwell & Associates during the 2007-2008 Restoration show the hypothetical flow of surface water in the Park (Bill Stephen, pers. comm.). The model, shown in Figure 7, uses topographical maps, existing water bodies, streams and rainfall to show areas of water accumulation and flow (shown in pink). However, the model does not account for roads, trails and their associated ditches and culverts, so actual flow patterns and water accumulations are significantly different in most areas.
Figure 7: Stream and wet areas versus flow model of drainage patterns in Stanley Park (B.A. Blackwell & Associates, unpublished data).
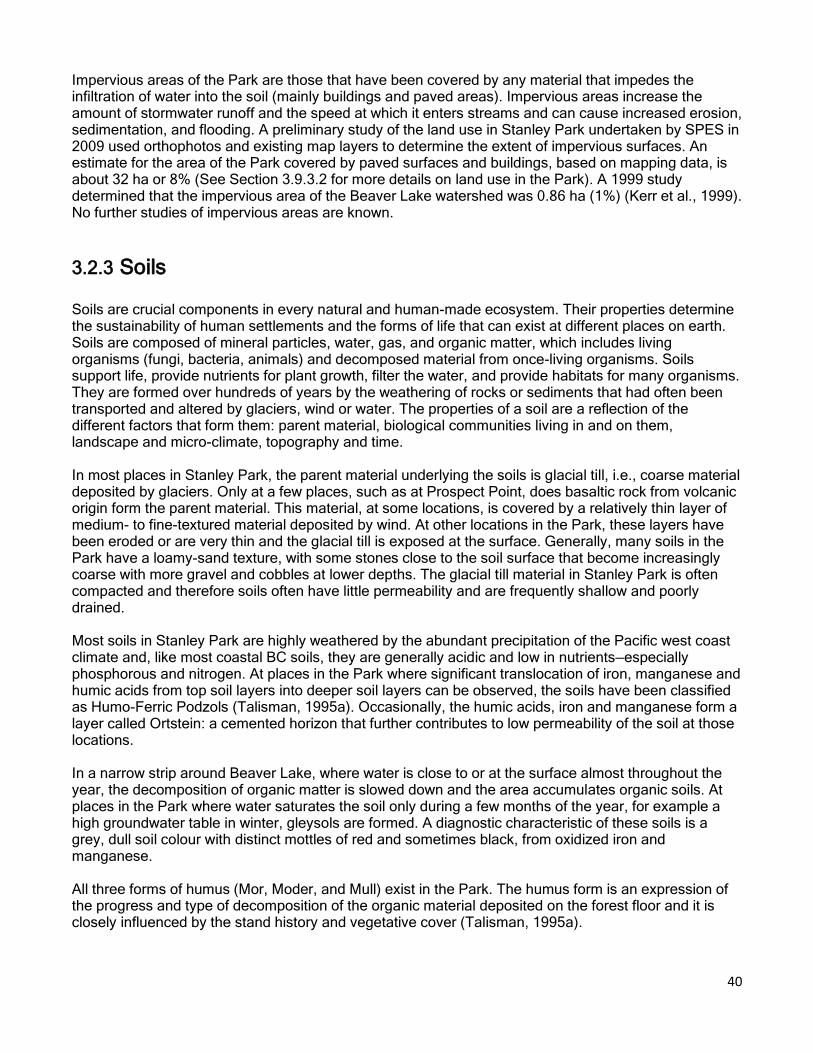
40
Impervious areas of the Park are those that have been covered by any material that impedes the infiltration of water into the soil (mainly buildings and paved areas). Impervious areas increase the amount of stormwater runoff and the speed at which it enters streams and can cause increased erosion, sedimentation, and flooding. A preliminary study of the land use in Stanley Park undertaken by SPES in 2009 used orthophotos and existing map layers to determine the extent of impervious surfaces. An estimate for the area of the Park covered by paved surfaces and buildings, based on mapping data, is about 32 ha or 8% (See Section 3.9.3.2 for more details on land use in the Park). A 1999 study determined that the impervious area of the Beaver Lake watershed was 0.86 ha (1%) (Kerr et al., 1999). No further studies of impervious areas are known.
3.2.3 Soils Soils are crucial components in every natural and human-made ecosystem. Their properties determine the sustainability of human settlements and the forms of life that can exist at different places on earth. Soils are composed of mineral particles, water, gas, and organic matter, which includes living organisms (fungi, bacteria, animals) and decomposed material from once-living organisms. Soils support life, provide nutrients for plant growth, filter the water, and provide habitats for many organisms. They are formed over hundreds of years by the weathering of rocks or sediments that had often been transported and altered by glaciers, wind or water. The properties of a soil are a reflection of the different factors that form them: parent material, biological communities living in and on them, landscape and micro-climate, topography and time. In most places in Stanley Park, the parent material underlying the soils is glacial till, i.e., coarse material deposited by glaciers. Only at a few places, such as at Prospect Point, does basaltic rock from volcanic origin form the parent material. This material, at some locations, is covered by a relatively thin layer of medium- to fine-textured material deposited by wind. At other locations in the Park, these layers have been eroded or are very thin and the glacial till is exposed at the surface. Generally, many soils in the Park have a loamy-sand texture, with some stones close to the soil surface that become increasingly coarse with more gravel and cobbles at lower depths. The glacial till material in Stanley Park is often compacted and therefore soils often have little permeability and are frequently shallow and poorly drained. Most soils in Stanley Park are highly weathered by the abundant precipitation of the Pacific west coast climate and, like most coastal BC soils, they are generally acidic and low in nutrients—especially phosphorous and nitrogen. At places in the Park where significant translocation of iron, manganese and humic acids from top soil layers into deeper soil layers can be observed, the soils have been classified as Humo-Ferric Podzols (Talisman, 1995a). Occasionally, the humic acids, iron and manganese form a layer called Ortstein: a cemented horizon that further contributes to low permeability of the soil at those locations. In a narrow strip around Beaver Lake, where water is close to or at the surface almost throughout the year, the decomposition of organic matter is slowed down and the area accumulates organic soils. At places in the Park where water saturates the soil only during a few months of the year, for example a high groundwater table in winter, gleysols are formed. A diagnostic characteristic of these soils is a grey, dull soil colour with distinct mottles of red and sometimes black, from oxidized iron and manganese. All three forms of humus (Mor, Moder, and Mull) exist in the Park. The humus form is an expression of the progress and type of decomposition of the organic material deposited on the forest floor and it is closely influenced by the stand history and vegetative cover (Talisman, 1995a).
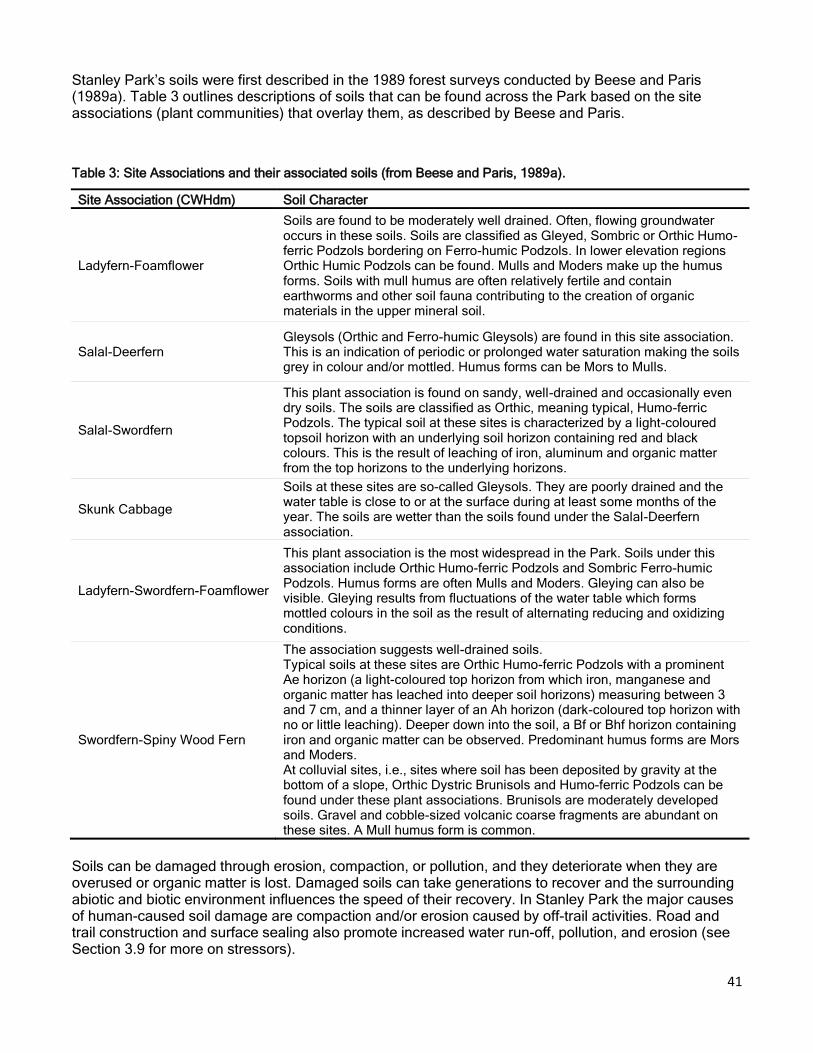
41
Stanley Park‘s soils were first described in the 1989 forest surveys conducted by Beese and Paris (1989a). Table 3 outlines descriptions of soils that can be found across the Park based on the site associations (plant communities) that overlay them, as described by Beese and Paris.
Table 3: Site Associations and their associated soils (from Beese and Paris, 1989a).
Site Association (CWHdm) Soil Character
Ladyfern-Foamflower
Soils are found to be moderately well drained. Often, flowing groundwater occurs in these soils. Soils are classified as Gleyed, Sombric or Orthic Humo-ferric Podzols bordering on Ferro-humic Podzols. In lower elevation regions Orthic Humic Podzols can be found. Mulls and Moders make up the humus forms. Soils with mull humus are often relatively fertile and contain earthworms and other soil fauna contributing to the creation of organic materials in the upper mineral soil.
Salal-Deerfern Gleysols (Orthic and Ferro-humic Gleysols) are found in this site association. This is an indication of periodic or prolonged water saturation making the soils grey in colour and/or mottled. Humus forms can be Mors to Mulls.
Salal-Swordfern
This plant association is found on sandy, well-drained and occasionally even dry soils. The soils are classified as Orthic, meaning typical, Humo-ferric Podzols. The typical soil at these sites is characterized by a light-coloured topsoil horizon with an underlying soil horizon containing red and black colours. This is the result of leaching of iron, aluminum and organic matter from the top horizons to the underlying horizons.
Skunk Cabbage
Soils at these sites are so-called Gleysols. They are poorly drained and the water table is close to or at the surface during at least some months of the year. The soils are wetter than the soils found under the Salal-Deerfern association.
Ladyfern-Swordfern-Foamflower
This plant association is the most widespread in the Park. Soils under this association include Orthic Humo-ferric Podzols and Sombric Ferro-humic Podzols. Humus forms are often Mulls and Moders. Gleying can also be visible. Gleying results from fluctuations of the water table which forms mottled colours in the soil as the result of alternating reducing and oxidizing conditions.
Swordfern-Spiny Wood Fern
The association suggests well-drained soils. Typical soils at these sites are Orthic Humo-ferric Podzols with a prominent Ae horizon (a light-coloured top horizon from which iron, manganese and organic matter has leached into deeper soil horizons) measuring between 3 and 7 cm, and a thinner layer of an Ah horizon (dark-coloured top horizon with no or little leaching). Deeper down into the soil, a Bf or Bhf horizon containing iron and organic matter can be observed. Predominant humus forms are Mors and Moders. At colluvial sites, i.e., sites where soil has been deposited by gravity at the bottom of a slope, Orthic Dystric Brunisols and Humo-ferric Podzols can be found under these plant associations. Brunisols are moderately developed soils. Gravel and cobble-sized volcanic coarse fragments are abundant on these sites. A Mull humus form is common.
Soils can be damaged through erosion, compaction, or pollution, and they deteriorate when they are overused or organic matter is lost. Damaged soils can take generations to recover and the surrounding abiotic and biotic environment influences the speed of their recovery. In Stanley Park the major causes of human-caused soil damage are compaction and/or erosion caused by off-trail activities. Road and trail construction and surface sealing also promote increased water run-off, pollution, and erosion (see Section 3.9 for more on stressors).
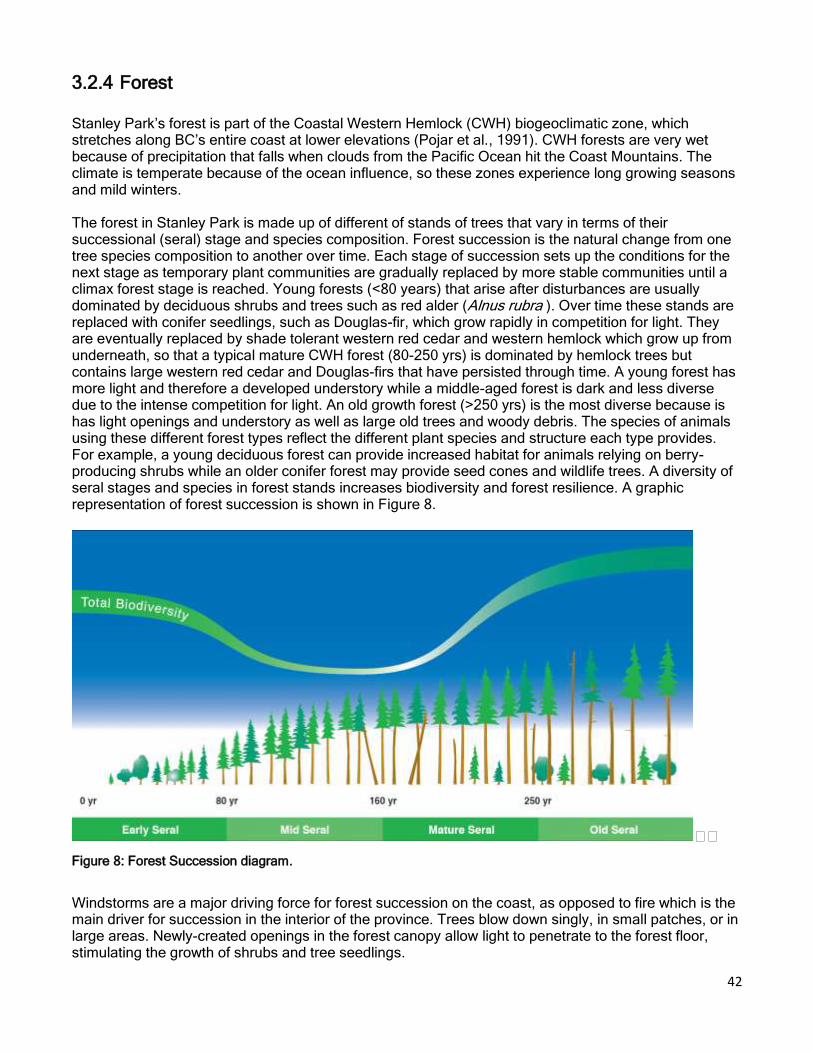
42
3.2.4 Forest
Stanley Park‘s forest is part of the Coastal Western Hemlock (CWH) biogeoclimatic zone, which stretches along BC‘s entire coast at lower elevations (Pojar et al., 1991). CWH forests are very wet because of precipitation that falls when clouds from the Pacific Ocean hit the Coast Mountains. The climate is temperate because of the ocean influence, so these zones experience long growing seasons and mild winters. The forest in Stanley Park is made up of different of stands of trees that vary in terms of their successional (seral) stage and species composition. Forest succession is the natural change from one tree species composition to another over time. Each stage of succession sets up the conditions for the next stage as temporary plant communities are gradually replaced by more stable communities until a climax forest stage is reached. Young forests (<80 years) that arise after disturbances are usually dominated by deciduous shrubs and trees such as red alder (Alnus rubra ). Over time these stands are replaced with conifer seedlings, such as Douglas-fir, which grow rapidly in competition for light. They are eventually replaced by shade tolerant western red cedar and western hemlock which grow up from underneath, so that a typical mature CWH forest (80-250 yrs) is dominated by hemlock trees but contains large western red cedar and Douglas-firs that have persisted through time. A young forest has more light and therefore a developed understory while a middle-aged forest is dark and less diverse due to the intense competition for light. An old growth forest (>250 yrs) is the most diverse because is has light openings and understory as well as large old trees and woody debris. The species of animals using these different forest types reflect the different plant species and structure each type provides. For example, a young deciduous forest can provide increased habitat for animals relying on berry-producing shrubs while an older conifer forest may provide seed cones and wildlife trees. A diversity of seral stages and species in forest stands increases biodiversity and forest resilience. A graphic representation of forest succession is shown in Figure 8.
��
Figure 8: Forest Succession diagram.
Windstorms are a major driving force for forest succession on the coast, as opposed to fire which is the main driver for succession in the interior of the province. Trees blow down singly, in small patches, or in large areas. Newly-created openings in the forest canopy allow light to penetrate to the forest floor, stimulating the growth of shrubs and tree seedlings.
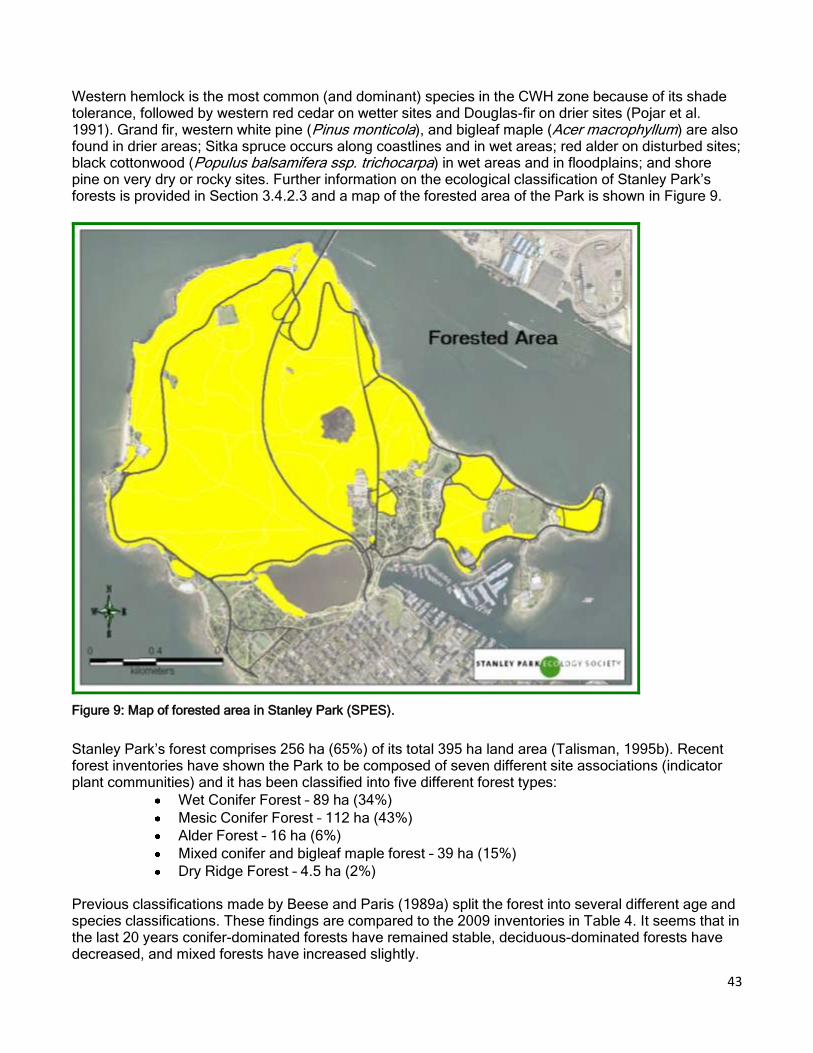
43
Western hemlock is the most common (and dominant) species in the CWH zone because of its shade tolerance, followed by western red cedar on wetter sites and Douglas-fir on drier sites (Pojar et al. 1991). Grand fir, western white pine (Pinus monticola), and bigleaf maple (Acer macrophyllum) are also found in drier areas; Sitka spruce occurs along coastlines and in wet areas; red alder on disturbed sites; black cottonwood (Populus balsamifera ssp. trichocarpa) in wet areas and in floodplains; and shore pine on very dry or rocky sites. Further information on the ecological classification of Stanley Park‘s forests is provided in Section 3.4.2.3 and a map of the forested area of the Park is shown in Figure 9.
Figure 9: Map of forested area in Stanley Park (SPES).
Stanley Park‘s forest comprises 256 ha (65%) of its total 395 ha land area (Talisman, 1995b). Recent forest inventories have shown the Park to be composed of seven different site associations (indicator plant communities) and it has been classified into five different forest types:
Wet Conifer Forest – 89 ha (34%)
Mesic Conifer Forest – 112 ha (43%)
Alder Forest – 16 ha (6%)
Mixed conifer and bigleaf maple forest – 39 ha (15%)
Dry Ridge Forest – 4.5 ha (2%) Previous classifications made by Beese and Paris (1989a) split the forest into several different age and species classifications. These findings are compared to the 2009 inventories in Table 4. It seems that in the last 20 years conifer-dominated forests have remained stable, deciduous-dominated forests have decreased, and mixed forests have increased slightly.
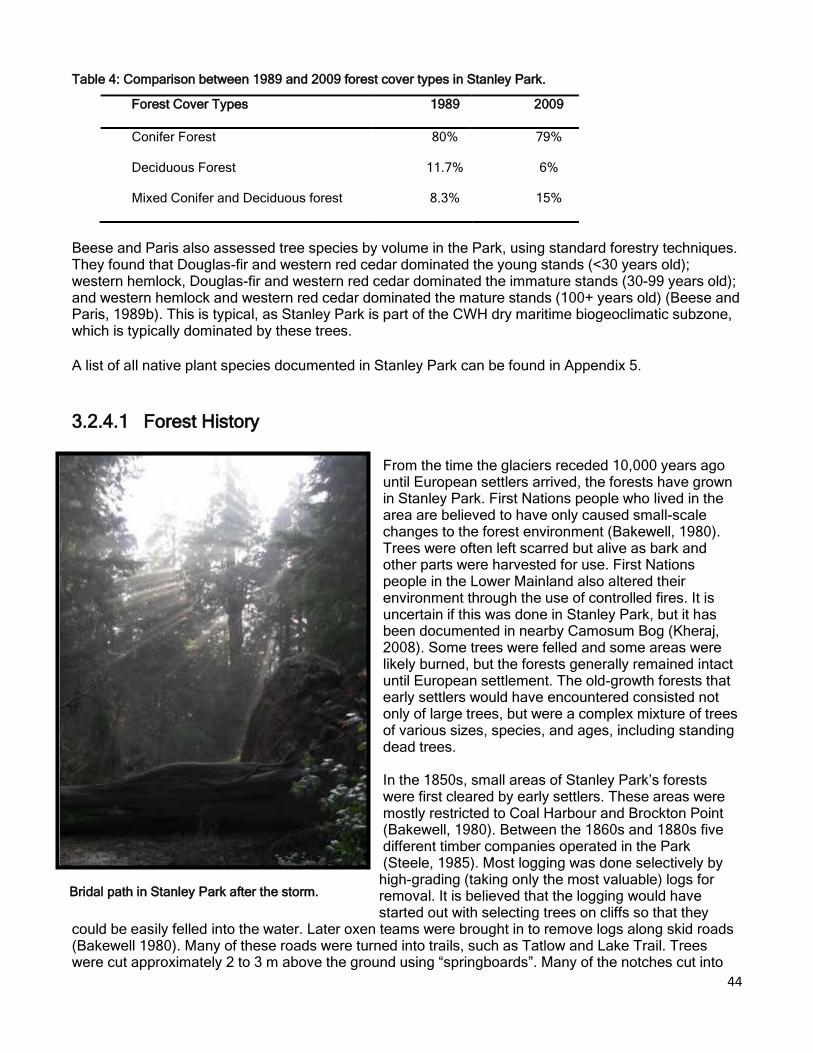
44
Bridal path in Stanley Park after the storm.
Table 4: Comparison between 1989 and 2009 forest cover types in Stanley Park.
Forest Cover Types 1989 2009
Conifer Forest 80% 79%
Deciduous Forest 11.7% 6%
Mixed Conifer and Deciduous forest 8.3% 15%
Beese and Paris also assessed tree species by volume in the Park, using standard forestry techniques. They found that Douglas-fir and western red cedar dominated the young stands (<30 years old); western hemlock, Douglas-fir and western red cedar dominated the immature stands (30-99 years old); and western hemlock and western red cedar dominated the mature stands (100+ years old) (Beese and Paris, 1989b). This is typical, as Stanley Park is part of the CWH dry maritime biogeoclimatic subzone, which is typically dominated by these trees.
A list of all native plant species documented in Stanley Park can be found in Appendix 5.
3.2.4.1 Forest History
From the time the glaciers receded 10,000 years ago until European settlers arrived, the forests have grown in Stanley Park. First Nations people who lived in the area are believed to have only caused small-scale changes to the forest environment (Bakewell, 1980). Trees were often left scarred but alive as bark and other parts were harvested for use. First Nations people in the Lower Mainland also altered their environment through the use of controlled fires. It is uncertain if this was done in Stanley Park, but it has been documented in nearby Camosum Bog (Kheraj, 2008). Some trees were felled and some areas were likely burned, but the forests generally remained intact until European settlement. The old-growth forests that early settlers would have encountered consisted not only of large trees, but were a complex mixture of trees of various sizes, species, and ages, including standing dead trees. In the 1850s, small areas of Stanley Park‘s forests were first cleared by early settlers. These areas were mostly restricted to Coal Harbour and Brockton Point (Bakewell, 1980). Between the 1860s and 1880s five different timber companies operated in the Park (Steele, 1985). Most logging was done selectively by
high-grading (taking only the most valuable) logs for removal. It is believed that the logging would have started out with selecting trees on cliffs so that they
could be easily felled into the water. Later oxen teams were brought in to remove logs along skid roads (Bakewell 1980). Many of these roads were turned into trails, such as Tatlow and Lake Trail. Trees were cut approximately 2 to 3 m above the ground using ―springboards‖. Many of the notches cut into
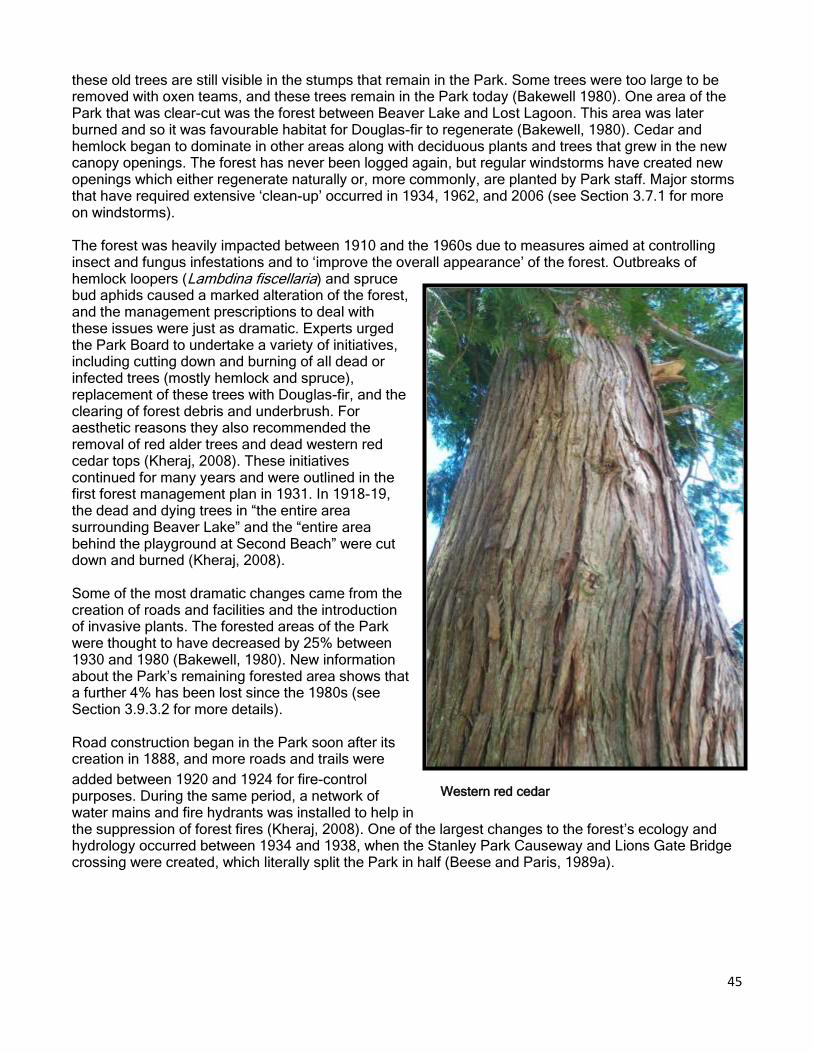
45
Western red cedar
these old trees are still visible in the stumps that remain in the Park. Some trees were too large to be removed with oxen teams, and these trees remain in the Park today (Bakewell 1980). One area of the Park that was clear-cut was the forest between Beaver Lake and Lost Lagoon. This area was later burned and so it was favourable habitat for Douglas-fir to regenerate (Bakewell, 1980). Cedar and hemlock began to dominate in other areas along with deciduous plants and trees that grew in the new canopy openings. The forest has never been logged again, but regular windstorms have created new openings which either regenerate naturally or, more commonly, are planted by Park staff. Major storms that have required extensive ‗clean-up‘ occurred in 1934, 1962, and 2006 (see Section 3.7.1 for more on windstorms). The forest was heavily impacted between 1910 and the 1960s due to measures aimed at controlling insect and fungus infestations and to ‗improve the overall appearance‘ of the forest. Outbreaks of hemlock loopers (Lambdina fiscellaria) and spruce bud aphids caused a marked alteration of the forest, and the management prescriptions to deal with these issues were just as dramatic. Experts urged the Park Board to undertake a variety of initiatives, including cutting down and burning of all dead or infected trees (mostly hemlock and spruce), replacement of these trees with Douglas-fir, and the clearing of forest debris and underbrush. For aesthetic reasons they also recommended the removal of red alder trees and dead western red cedar tops (Kheraj, 2008). These initiatives continued for many years and were outlined in the first forest management plan in 1931. In 1918-19, the dead and dying trees in ―the entire area surrounding Beaver Lake‖ and the ―entire area behind the playground at Second Beach‖ were cut down and burned (Kheraj, 2008). Some of the most dramatic changes came from the creation of roads and facilities and the introduction of invasive plants. The forested areas of the Park were thought to have decreased by 25% between 1930 and 1980 (Bakewell, 1980). New information about the Park‘s remaining forested area shows that a further 4% has been lost since the 1980s (see Section 3.9.3.2 for more details). Road construction began in the Park soon after its creation in 1888, and more roads and trails were
added between 1920 and 1924 for fire-control purposes. During the same period, a network of water mains and fire hydrants was installed to help in the suppression of forest fires (Kheraj, 2008). One of the largest changes to the forest‘s ecology and hydrology occurred between 1934 and 1938, when the Stanley Park Causeway and Lions Gate Bridge crossing were created, which literally split the Park in half (Beese and Paris, 1989a).

46
Typical mature forest in Stanley Park.
3.2.4.2 Forest Cover Types
3.2.4.2.1 Mature Conifer Forest
The mature coniferous forest in Stanley Park is dominated by western red cedar, Douglas-fir and western hemlock. This is typical of temperate coniferous forests that are found on the west coast of BC. Recent forest inventories conducted by the UBC Faculty of Forestry classified the conifer forests into two categories, mesic (adapted to moderately moist habitat) (112 ha, 43% of forest cover) and moist (89 ha, 34% of forest cover) (VBPR, 2009). The mature wet conifer type is dominated, in terms of basal area, by very large western red cedar, while the mature dry conifer type is dominated by Douglas-fir. In both forest types western hemlock is the dominant species in the smallest size class by basal area and stems per hectare (Buffo, 2010) (see Appendix 21 for more data). These characterizations were used to prescribe silvicultural treatments and target stand objectives. Similar forest inventories conducted in 1989 showed 80% of the forest was dominated by conifers (less than 25% deciduous) which could be split into three age classes: mature (59.3%), immature (17.4 %), and young (3.3%) (Beese and Paris, 1989b). In 1980, a forest inventory was conducted (through ortho photos and ground-truthing) and showed slightly different results. Bakewell (1980) classified the conifer forest as closed, open, or scattered and very open (Table 5). This study was mostly concerned with the degradation of forest cover over time; Table 5 outlines the results.
Table 5: Relative areas of conifer forest canopy types (Bakewell, 1980).
1933 1952 1966 1979
Closed Canopy 179.2 ha (64%)
92.7 ha (39%)
47.3 ha (20%)
35.6 ha (17%)
Open Canopy 40 ha (14%)
61.5 ha (26%)
27.9 ha (12%)
40 ha (22%)
Scattered and very open canopy 26.7 ha (10%)
-- -- 108.9 ha (47%)
72.8 ha (34%)
Total conifer forest 245.9 ha (87.6%)
-- 184.1 ha (78.8%)
148.4 ha (70.5%)
Total forest cover 280.8 ha 237.1 ha 233.5 ha 210.4 ha
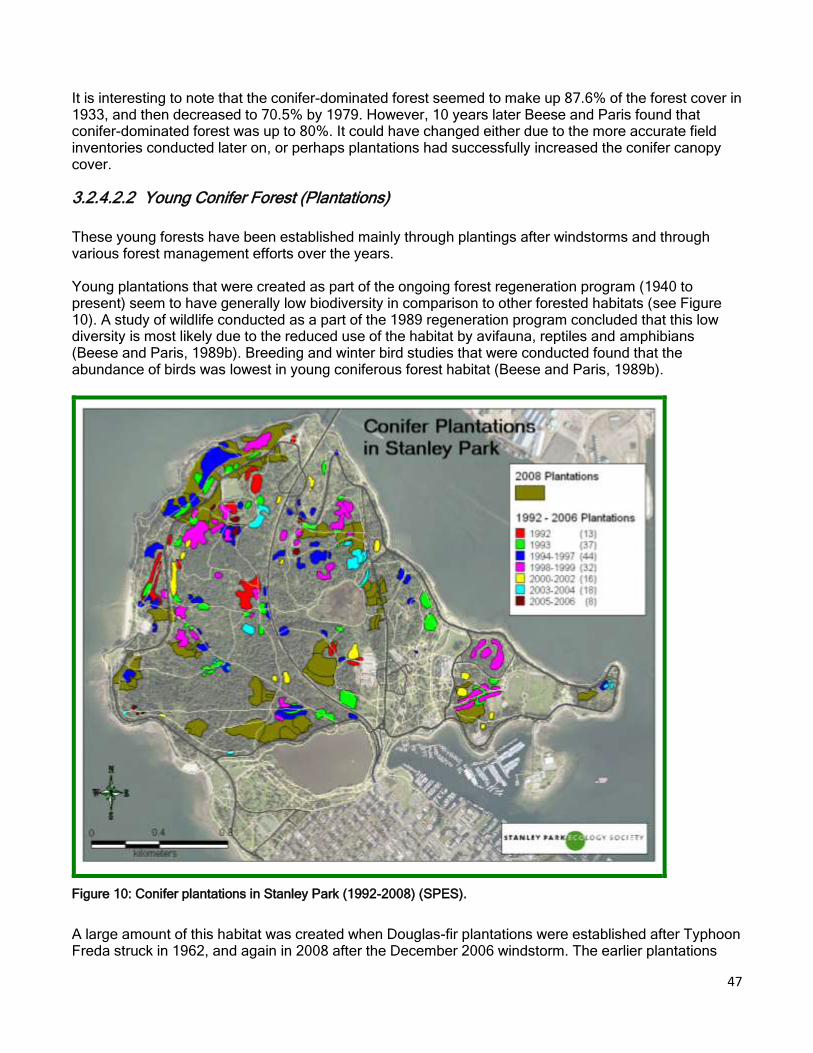
47
It is interesting to note that the conifer-dominated forest seemed to make up 87.6% of the forest cover in 1933, and then decreased to 70.5% by 1979. However, 10 years later Beese and Paris found that conifer-dominated forest was up to 80%. It could have changed either due to the more accurate field inventories conducted later on, or perhaps plantations had successfully increased the conifer canopy cover.
3.2.4.2.2 Young Conifer Forest (Plantations)
These young forests have been established mainly through plantings after windstorms and through various forest management efforts over the years. Young plantations that were created as part of the ongoing forest regeneration program (1940 to present) seem to have generally low biodiversity in comparison to other forested habitats (see Figure 10). A study of wildlife conducted as a part of the 1989 regeneration program concluded that this low diversity is most likely due to the reduced use of the habitat by avifauna, reptiles and amphibians (Beese and Paris, 1989b). Breeding and winter bird studies that were conducted found that the abundance of birds was lowest in young coniferous forest habitat (Beese and Paris, 1989b).
Figure 10: Conifer plantations in Stanley Park (1992-2008) (SPES).
A large amount of this habitat was created when Douglas-fir plantations were established after Typhoon Freda struck in 1962, and again in 2008 after the December 2006 windstorm. The earlier plantations
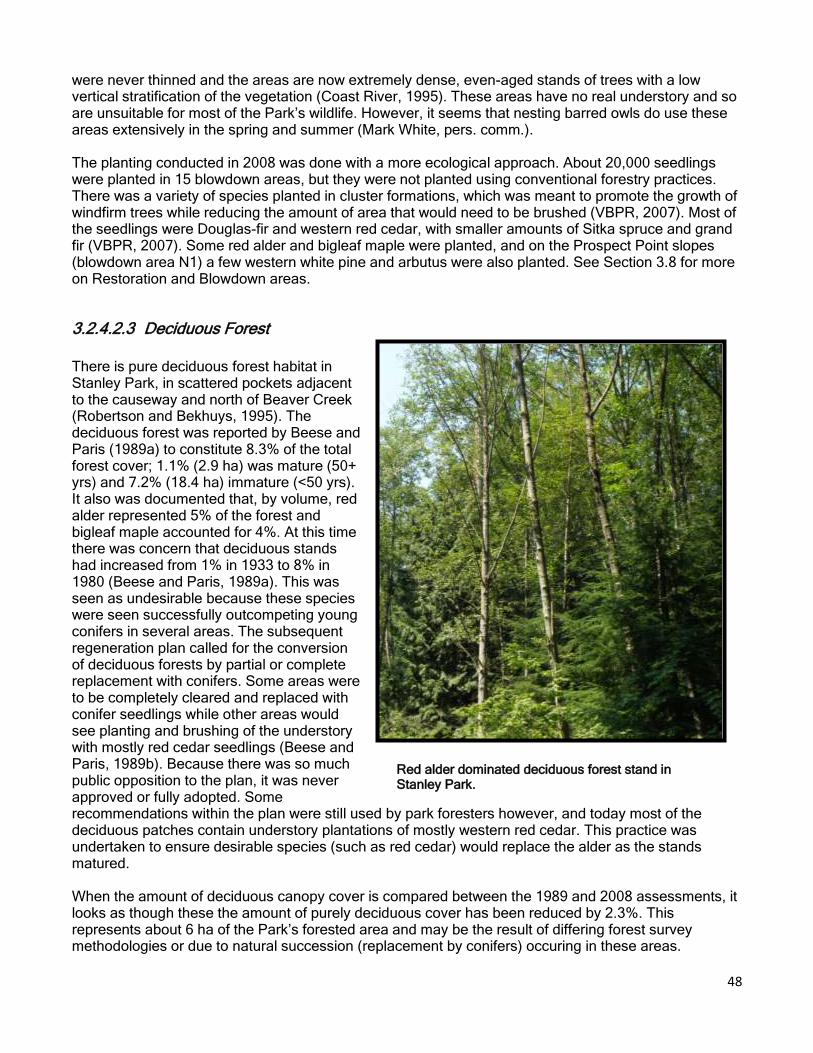
48
Red alder dominated deciduous forest stand in Stanley Park.
were never thinned and the areas are now extremely dense, even-aged stands of trees with a low vertical stratification of the vegetation (Coast River, 1995). These areas have no real understory and so are unsuitable for most of the Park‘s wildlife. However, it seems that nesting barred owls do use these areas extensively in the spring and summer (Mark White, pers. comm.). The planting conducted in 2008 was done with a more ecological approach. About 20,000 seedlings were planted in 15 blowdown areas, but they were not planted using conventional forestry practices. There was a variety of species planted in cluster formations, which was meant to promote the growth of windfirm trees while reducing the amount of area that would need to be brushed (VBPR, 2007). Most of the seedlings were Douglas-fir and western red cedar, with smaller amounts of Sitka spruce and grand fir (VBPR, 2007). Some red alder and bigleaf maple were planted, and on the Prospect Point slopes (blowdown area N1) a few western white pine and arbutus were also planted. See Section 3.8 for more on Restoration and Blowdown areas.
3.2.4.2.3 Deciduous Forest
There is pure deciduous forest habitat in Stanley Park, in scattered pockets adjacent to the causeway and north of Beaver Creek (Robertson and Bekhuys, 1995). The deciduous forest was reported by Beese and Paris (1989a) to constitute 8.3% of the total forest cover; 1.1% (2.9 ha) was mature (50+ yrs) and 7.2% (18.4 ha) immature (<50 yrs). It also was documented that, by volume, red alder represented 5% of the forest and bigleaf maple accounted for 4%. At this time there was concern that deciduous stands had increased from 1% in 1933 to 8% in 1980 (Beese and Paris, 1989a). This was seen as undesirable because these species were seen successfully outcompeting young conifers in several areas. The subsequent regeneration plan called for the conversion of deciduous forests by partial or complete replacement with conifers. Some areas were to be completely cleared and replaced with conifer seedlings while other areas would see planting and brushing of the understory with mostly red cedar seedlings (Beese and Paris, 1989b). Because there was so much public opposition to the plan, it was never approved or fully adopted. Some recommendations within the plan were still used by park foresters however, and today most of the deciduous patches contain understory plantations of mostly western red cedar. This practice was undertaken to ensure desirable species (such as red cedar) would replace the alder as the stands matured. When the amount of deciduous canopy cover is compared between the 1989 and 2008 assessments, it looks as though these the amount of purely deciduous cover has been reduced by 2.3%. This represents about 6 ha of the Park‘s forested area and may be the result of differing forest survey methodologies or due to natural succession (replacement by conifers) occuring in these areas.
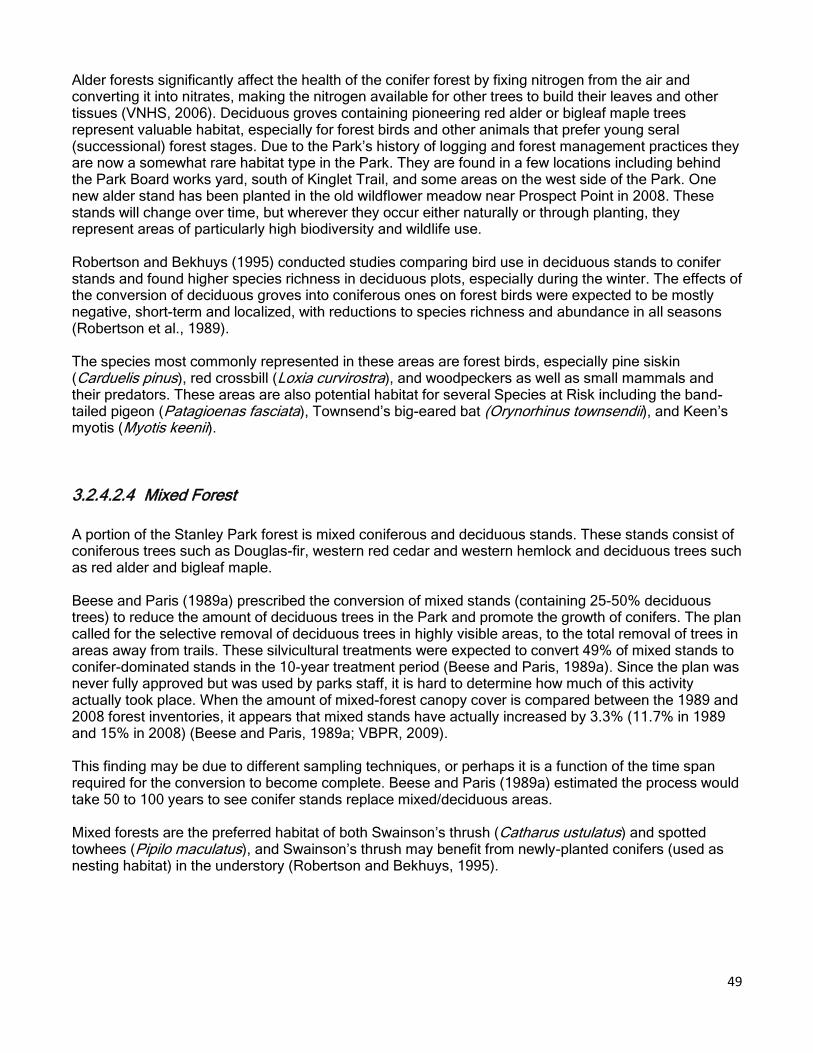
49
Alder forests significantly affect the health of the conifer forest by fixing nitrogen from the air and converting it into nitrates, making the nitrogen available for other trees to build their leaves and other tissues (VNHS, 2006). Deciduous groves containing pioneering red alder or bigleaf maple trees represent valuable habitat, especially for forest birds and other animals that prefer young seral (successional) forest stages. Due to the Park‘s history of logging and forest management practices they are now a somewhat rare habitat type in the Park. They are found in a few locations including behind the Park Board works yard, south of Kinglet Trail, and some areas on the west side of the Park. One new alder stand has been planted in the old wildflower meadow near Prospect Point in 2008. These stands will change over time, but wherever they occur either naturally or through planting, they represent areas of particularly high biodiversity and wildlife use. Robertson and Bekhuys (1995) conducted studies comparing bird use in deciduous stands to conifer stands and found higher species richness in deciduous plots, especially during the winter. The effects of the conversion of deciduous groves into coniferous ones on forest birds were expected to be mostly negative, short-term and localized, with reductions to species richness and abundance in all seasons (Robertson et al., 1989). The species most commonly represented in these areas are forest birds, especially pine siskin (Carduelis pinus), red crossbill (Loxia curvirostra), and woodpeckers as well as small mammals and their predators. These areas are also potential habitat for several Species at Risk including the band-tailed pigeon (Patagioenas fasciata), Townsend‘s big-eared bat (Orynorhinus townsendii), and Keen‘s myotis (Myotis keenii).
3.2.4.2.4 Mixed Forest
A portion of the Stanley Park forest is mixed coniferous and deciduous stands. These stands consist of coniferous trees such as Douglas-fir, western red cedar and western hemlock and deciduous trees such as red alder and bigleaf maple. Beese and Paris (1989a) prescribed the conversion of mixed stands (containing 25-50% deciduous trees) to reduce the amount of deciduous trees in the Park and promote the growth of conifers. The plan called for the selective removal of deciduous trees in highly visible areas, to the total removal of trees in areas away from trails. These silvicultural treatments were expected to convert 49% of mixed stands to conifer-dominated stands in the 10-year treatment period (Beese and Paris, 1989a). Since the plan was never fully approved but was used by parks staff, it is hard to determine how much of this activity actually took place. When the amount of mixed-forest canopy cover is compared between the 1989 and 2008 forest inventories, it appears that mixed stands have actually increased by 3.3% (11.7% in 1989 and 15% in 2008) (Beese and Paris, 1989a; VBPR, 2009). This finding may be due to different sampling techniques, or perhaps it is a function of the time span required for the conversion to become complete. Beese and Paris (1989a) estimated the process would take 50 to 100 years to see conifer stands replace mixed/deciduous areas. Mixed forests are the preferred habitat of both Swainson‘s thrush (Catharus ustulatus) and spotted towhees (Pipilo maculatus), and Swainson‘s thrush may benefit from newly-planted conifers (used as nesting habitat) in the understory (Robertson and Bekhuys, 1995).
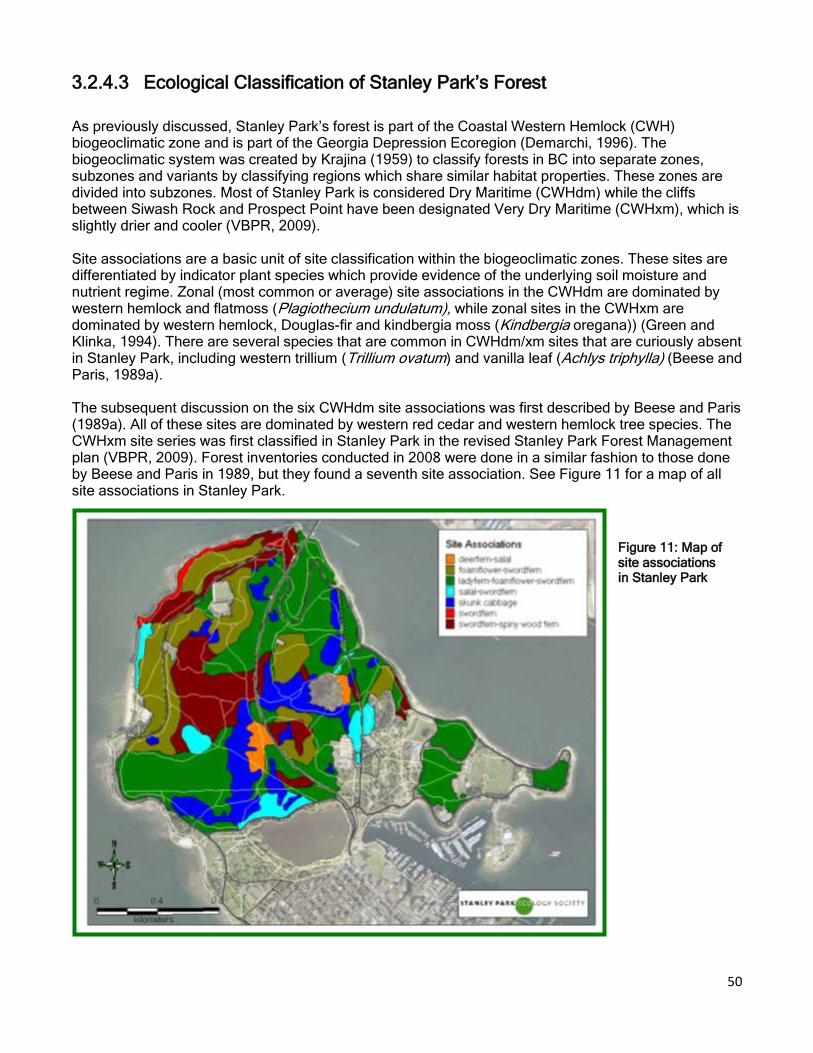
50
3.2.4.3 Ecological Classification of Stanley Park‘s Forest
As previously discussed, Stanley Park‘s forest is part of the Coastal Western Hemlock (CWH) biogeoclimatic zone and is part of the Georgia Depression Ecoregion (Demarchi, 1996). The biogeoclimatic system was created by Krajina (1959) to classify forests in BC into separate zones, subzones and variants by classifying regions which share similar habitat properties. These zones are divided into subzones. Most of Stanley Park is considered Dry Maritime (CWHdm) while the cliffs between Siwash Rock and Prospect Point have been designated Very Dry Maritime (CWHxm), which is slightly drier and cooler (VBPR, 2009). Site associations are a basic unit of site classification within the biogeoclimatic zones. These sites are differentiated by indicator plant species which provide evidence of the underlying soil moisture and nutrient regime. Zonal (most common or average) site associations in the CWHdm are dominated by western hemlock and flatmoss (Plagiothecium undulatum), while zonal sites in the CWHxm are dominated by western hemlock, Douglas-fir and kindbergia moss (Kindbergia oregana)) (Green and Klinka, 1994). There are several species that are common in CWHdm/xm sites that are curiously absent in Stanley Park, including western trillium (Trillium ovatum) and vanilla leaf (Achlys triphylla) (Beese and Paris, 1989a). The subsequent discussion on the six CWHdm site associations was first described by Beese and Paris (1989a). All of these sites are dominated by western red cedar and western hemlock tree species. The CWHxm site series was first classified in Stanley Park in the revised Stanley Park Forest Management plan (VBPR, 2009). Forest inventories conducted in 2008 were done in a similar fashion to those done by Beese and Paris in 1989, but they found a seventh site association. See Figure 11 for a map of all site associations in Stanley Park.
Figure 11: Map of site associations in Stanley Park
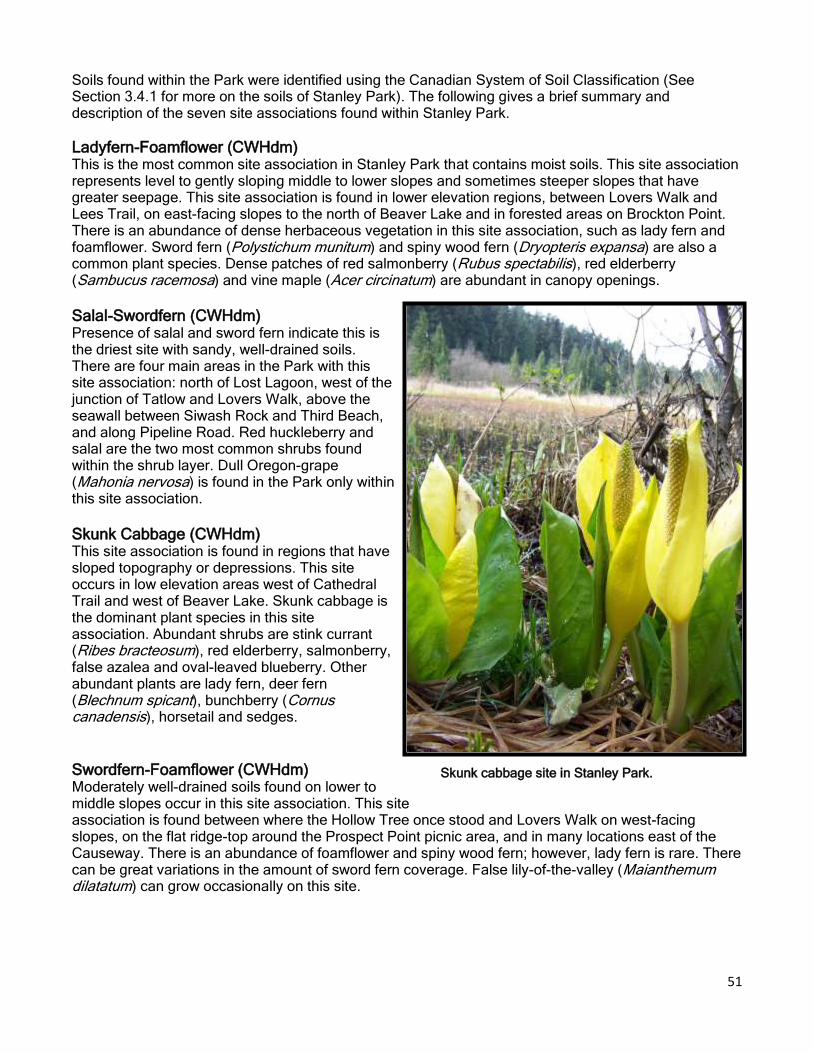
51
Skunk cabbage site in Stanley Park.
Soils found within the Park were identified using the Canadian System of Soil Classification (See Section 3.4.1 for more on the soils of Stanley Park). The following gives a brief summary and description of the seven site associations found within Stanley Park.
Ladyfern-Foamflower (CWHdm) This is the most common site association in Stanley Park that contains moist soils. This site association represents level to gently sloping middle to lower slopes and sometimes steeper slopes that have greater seepage. This site association is found in lower elevation regions, between Lovers Walk and Lees Trail, on east-facing slopes to the north of Beaver Lake and in forested areas on Brockton Point. There is an abundance of dense herbaceous vegetation in this site association, such as lady fern and foamflower. Sword fern (Polystichum munitum) and spiny wood fern (Dryopteris expansa) are also a common plant species. Dense patches of red salmonberry (Rubus spectabilis), red elderberry (Sambucus racemosa) and vine maple (Acer circinatum) are abundant in canopy openings.
Salal-Swordfern (CWHdm) Presence of salal and sword fern indicate this is the driest site with sandy, well-drained soils. There are four main areas in the Park with this site association: north of Lost Lagoon, west of the junction of Tatlow and Lovers Walk, above the seawall between Siwash Rock and Third Beach, and along Pipeline Road. Red huckleberry and salal are the two most common shrubs found within the shrub layer. Dull Oregon-grape (Mahonia nervosa) is found in the Park only within this site association.
Skunk Cabbage (CWHdm) This site association is found in regions that have sloped topography or depressions. This site occurs in low elevation areas west of Cathedral Trail and west of Beaver Lake. Skunk cabbage is the dominant plant species in this site association. Abundant shrubs are stink currant (Ribes bracteosum), red elderberry, salmonberry, false azalea and oval-leaved blueberry. Other abundant plants are lady fern, deer fern (Blechnum spicant), bunchberry (Cornus canadensis), horsetail and sedges.
Swordfern-Foamflower (CWHdm) Moderately well-drained soils found on lower to middle slopes occur in this site association. This site association is found between where the Hollow Tree once stood and Lovers Walk on west-facing slopes, on the flat ridge-top around the Prospect Point picnic area, and in many locations east of the Causeway. There is an abundance of foamflower and spiny wood fern; however, lady fern is rare. There can be great variations in the amount of sword fern coverage. False lily-of-the-valley (Maianthemum dilatatum) can grow occasionally on this site.

52 Sword fern
Deer fern
Swordfern-Spiny Wood Fern (CWHdm) This area is well-drained as it is situated on middle to upper slopes. This region can be found on the ridge between the Prospect Point picnic area and Lovers Walk and the slopes between Prospect Point and Siwash Rock. This site can also be identified on a ridge situated southwest of Beaver Lake and in certain scattered areas on raised ground. Two types of site associations were classified based on slope steepness and soil type:
1) The colluvial type site, in this case slopes that were steeper than 65%, had dense sword fern and spiny wood fern cover. There is little moss cover. 2) In the typical type site, sword fern is scattered with between 1 and 5% cover. The most common fern species is spiny wood fern with an average of 40% cover. Foamflower grows occasionally in this region.
Salal-Deerfern (CWHdm) This site association is the least common in Stanley Park. It is found in two areas only: a narrow area between Beaver Lake and Pipeline Road, and west of the Causeway between Lake Trail and Tatlow Walk. Soils lack an abundance of nutrients and drain poorly and as a result don‘t support skunk cabbage (Lysichitum americanum). Three-leaved foamflower (Tiarella trifoliata) and lady fern (Athyrium fillix-femina) are uncommon plant species in this region. The region of this site association on the east side of Beaver Lake has a 90% total cover of tall salal (Gaultheria shallon), due to the abundance of sunlight that can penetrate the area. Other common plant species that occur in this region include false azalea (Menziesia ferruginea), red salmonberry, red huckleberry (Vaccinium parvifolium), oval-leaved blueberry (Vaccinium ovalifolium) and Alaskan blueberry (Vaccinium alaskaense). The site west of the Causeway has similar plant species; however, salal is not as abundant.
Sword Fern (CWHxm) The areas in Stanley Park classified as CWHxm – Very Dry Maritime – are restricted to the slopes between Siwash Rock and Prospect Point. This zone is rare in the Lower Mainland but it does extend on the south side of the Fraser River to Chilliwack and along the Sunshine Coast to Desolation Sound (Green and Klinka, 1994). It occurs usually only up to 150 m in elevation in wet areas such as Stanley Park, and features water deficits on zonal sites (Green and Klinka, 1994). The forests on zonal CWHxm sites are characterized by Douglas-fir and smaller amounts of western hemlock and western red cedar. Major understory plants include: salal, dull Oregon-grape, red huckleberry, step moss (Hylocomium splendens), Oregon beaked moss (Kindbergia oregano), and small amounts of sword fern and bracken fern (Pteridum aquilinum) (Green and Klinka, 1994).
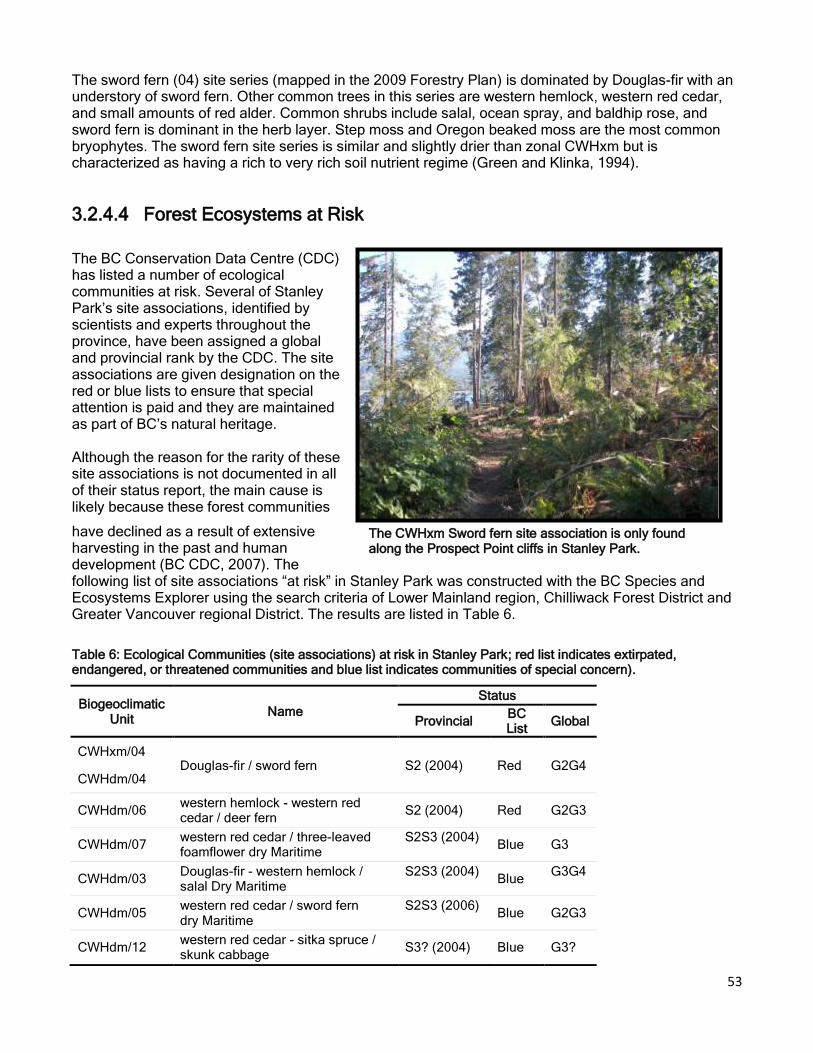
53
The CWHxm Sword fern site association is only found along the Prospect Point cliffs in Stanley Park.
The sword fern (04) site series (mapped in the 2009 Forestry Plan) is dominated by Douglas-fir with an understory of sword fern. Other common trees in this series are western hemlock, western red cedar, and small amounts of red alder. Common shrubs include salal, ocean spray, and baldhip rose, and sword fern is dominant in the herb layer. Step moss and Oregon beaked moss are the most common bryophytes. The sword fern site series is similar and slightly drier than zonal CWHxm but is characterized as having a rich to very rich soil nutrient regime (Green and Klinka, 1994).
3.2.4.4 Forest Ecosystems at Risk
The BC Conservation Data Centre (CDC) has listed a number of ecological communities at risk. Several of Stanley Park‘s site associations, identified by scientists and experts throughout the province, have been assigned a global and provincial rank by the CDC. The site associations are given designation on the red or blue lists to ensure that special attention is paid and they are maintained as part of BC‘s natural heritage. Although the reason for the rarity of these site associations is not documented in all of their status report, the main cause is likely because these forest communities
have declined as a result of extensive harvesting in the past and human development (BC CDC, 2007). The following list of site associations ―at risk‖ in Stanley Park was constructed with the BC Species and Ecosystems Explorer using the search criteria of Lower Mainland region, Chilliwack Forest District and Greater Vancouver regional District. The results are listed in Table 6.
Table 6: Ecological Communities (site associations) at risk in Stanley Park; red list indicates extirpated, endangered, or threatened communities and blue list indicates communities of special concern).
Biogeoclimatic Unit
Name
Status
Provincial BC List
Global
CWHxm/04 Douglas-fir / sword fern S2 (2004) Red G2G4
CWHdm/04
CWHdm/06 western hemlock - western red cedar / deer fern
S2 (2004) Red G2G3
CWHdm/07 western red cedar / three-leaved foamflower dry Maritime
S2S3 (2004)
Blue G3
CWHdm/03 Douglas-fir - western hemlock / salal Dry Maritime
S2S3 (2004)
Blue G3G4
CWHdm/05 western red cedar / sword fern dry Maritime
S2S3 (2006)
Blue G2G3
CWHdm/12 western red cedar - sitka spruce / skunk cabbage
S3? (2004) Blue G3?
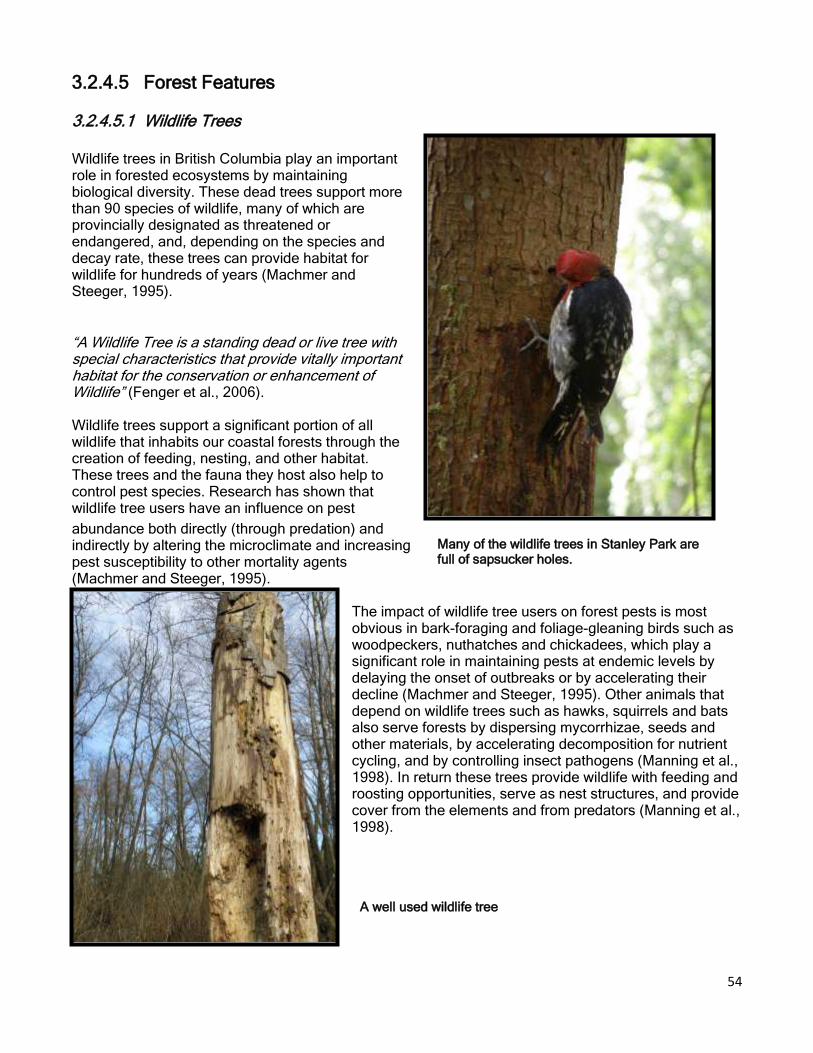
54
Many of the wildlife trees in Stanley Park are full of sapsucker holes.
A well used wildlife tree
3.2.4.5 Forest Features
3.2.4.5.1 Wildlife Trees
Wildlife trees in British Columbia play an important role in forested ecosystems by maintaining biological diversity. These dead trees support more than 90 species of wildlife, many of which are provincially designated as threatened or endangered, and, depending on the species and decay rate, these trees can provide habitat for wildlife for hundreds of years (Machmer and Steeger, 1995).
―A Wildlife Tree is a standing dead or live tree with special characteristics that provide vitally important habitat for the conservation or enhancement of Wildlife‖ (Fenger et al., 2006). Wildlife trees support a significant portion of all wildlife that inhabits our coastal forests through the creation of feeding, nesting, and other habitat. These trees and the fauna they host also help to control pest species. Research has shown that wildlife tree users have an influence on pest
abundance both directly (through predation) and indirectly by altering the microclimate and increasing pest susceptibility to other mortality agents (Machmer and Steeger, 1995).
The impact of wildlife tree users on forest pests is most obvious in bark-foraging and foliage-gleaning birds such as woodpeckers, nuthatches and chickadees, which play a significant role in maintaining pests at endemic levels by delaying the onset of outbreaks or by accelerating their decline (Machmer and Steeger, 1995). Other animals that depend on wildlife trees such as hawks, squirrels and bats also serve forests by dispersing mycorrhizae, seeds and other materials, by accelerating decomposition for nutrient cycling, and by controlling insect pathogens (Manning et al., 1998). In return these trees provide wildlife with feeding and roosting opportunities, serve as nest structures, and provide cover from the elements and from predators (Manning et al., 1998).

55
Much of the CWD in the Park was a result of the 2006 windstorm.
3.2.4.5.2 Coarse Woody Debris (CWD)
Coarse Woody Debris (CWD) is a term used for dead trees (standing or fallen) and the remains of branches on the ground in forests. Large woody material contains significant stores of carbon and energy and is the foundation of an important forest food web. This large material usually decays more slowly and therefore provides a more steady input of energy and nutrients and longer-lasting structures. For example, approximately one-third of the time that a mature Douglas-fir tree is in an ecosystem, it is dead wood; Douglas-fir can live to be 1,200 years old and the time to full decay after death is approximately 300 years (Fenger et al., 2006). Coarse Woody Debris serves as (Manning et al. 1998):
Feeding, breeding and shelter habitat for many organisms (invertebrates, small mammals, and amphibians)
Nutrient source and growing substrate for bacteria, fungi, lichens, mosses, and higher plants. These organisms are important in decay, nitrogen production, and other nutrient and moisture cycling.
Carbon storage
Erosion control
Buffered microclimates for seedling establishment
Perching sites for territorial birds
Escape cover and travel corridors for small mammals
Travel corridors and access routes for predators in heavy snow cover
Fallen debris and trees also play an important role in streams as they provide food and shelter for fish, invertebrates and other animals; they trap floating leaves into dams and they alter the flow of the water, creating habitat and reducing soil erosion. In Stanley Park, for many decades CWD was seen as a breeding ground for insect pests and ―unsightly‖ to Park visitors (Fry, 1990). Fallen limbs and trees were both systematically and opportunistically removed. Today the view of CWD has shifted so that forest ecologists and managers now realize the ecological benefits of this decaying material. The current forest management plan for Stanley Park (VBPR, 2009) describes different treatments of these fallen trees in different situations. Those trees and limbs less than 10 cm in diameter will usually be chipped and blown back into the forest, while larger stems are considered by circumstance. For example, if they fall in ‖natural areas‖ and pose a fire risk they may be limbed and bucked before being put back into the forest. Those trees that fall onto roads or in garden areas will be removed after being assessed for ―low‖ or ―high‖ value (only those trees deemed ―high aesthetic value‖ or ―culturally modified‖ will be left in situ) (VBPR, 2009). During the restoration efforts following the 2006 windstorm, prescriptions including the amount of CWD were written for all 15 blowdown areas. In areas that were considered high-quality Pacific water shrew (Sorex bendirii) habitat or which required restoration work during the breeding bird period (April-July), CWD levels were checked daily by on-site environmental monitors during the operational phase of the restoration. These areas of the Park (designated S1, N6-6A, S3, S4, and N1) have increased levels and diversity of CWD and wildlife trees due to the high habitat value they have for Species at Risk and other wildlife.

56
Photo of the ‗old tree grove‘ in Stanley Park
3.2.4.5.3 Veteran Trees and Old Growth
Prior to the 2006 windstorm, two old-growth stands could be found between Siwash Rock and Prospect Point northwest of Park Drive, and between Pipeline Road and Tunnel Trail (Beese and Paris, 1989a). Most of the stand once found near Prospect Point fell during windstorm. The remaining ―tall tree grove‖ is high in both its ecological and cultural significance and is one of very few of its type left in the Lower Mainland. Veteran trees usually occur in species that provide ever-increasing bark thickness over the years. They stand out over the forest canopy and they usually develop deformities and dimensions that attract many wildlife tree-dependent species (Fenger et al., 2006). There are many veteran trees that have persisted in the Park since before logging took most of them in the mid-1860s. These trees provide
essential habitat to many species including bald eagles, owls, bats, and northern flying squirrels (Glaucomys sabrinus). These trees are considered ―special forest attributes‖ and were first documented in their highest density on either side of the Causeway (Coast River,1995) and west of Third Beach (Stoltmann, 1987). Most of the largest and oldest trees in the Park are western red cedar, with smaller amounts of Douglas-fir and western hemlock (Coast River 1995). Douglas-fir and western red cedar can reach over 1,000 years of age, while hemlock can only live about 500 years. The first description of veteran trees in Stanley Park was written by Randy Stoltmann in 1987. The trees he described included record trees for BC and Canada. They are listed in Table 7.
Table 7: List of large trees in Stanley Park; from Stoltmann‘s ―Hiking Guide to the Big Trees of Southwestern British Columbia‖ (1987).
Species Diameter (m) Height (m) Notes
Red Alder 1.8 29.6 record tree
Bigleaf maple 3.4 28.9
Bigleaf maple 2.7 -
Hollow Tree 5.5 n/a Stump
Western red cedar 4.3 39.6
Western red cedar 5.0 33.5 Topped
Western red cedar 3.5 57.9 Triple trunk
Douglas-fir 1.5 71.6
Douglas-fir 2.5 61.0
Douglas-fir - 68.0 Topped
Douglas-fir - 72.5 Dead top
Douglas-fir 1.8 76.2 Dead
Douglas-fir 2.5 61.0 Broken top

57
In 1989 Beese and Paris added to this list by describing the largest and tallest trees they found in the Park during their forest inventory. A sample of their complete list is shown in Table 8.
Table 8: Largest Trees of Stanley Park (from Beese and Paris, 1989b).
Species DBH (cm)
Height (m)
Location Comments
Western red cedar
432.0 45.5 Southwest of Hollow Tree Largest tree
315.2 56.2 Junction of Lovers and Tatlow Tallest tree
Douglas-fir 250.0 61.0 Junction of Lees and Cathedral Largest tree
175.6 72.2 In "tall tree grove" off Pipeline Rd. tallest tree
Bigleaf maple 304.0 31.7 South of Hollow Tree Largest tree
114.5 37.6 Near junction of Avison and Eldon Tallest tree
Red alder 129.3 30.6 Near Third Beach concession Largest tree
83.3 41.0 Junction of Lees and Tatlow Tallest tree
Western hemlock 146.0 50.4 North end of Merilees Trail Largest and tallest tree
Grand fir 77.4 45.8 Near Causeway and Reservoir trail Only mature true fir found
Sitka spruce 182.0 58.5 East of Third Beach Largest and tallest tree
Black cottonwood 113.4 43.1 North end of Thompson Trail Largest and tallest tree
The BC Ministry of Forests and Range has an online registry that aims to record the 10 biggest specimens of each tree species native to BC An online search of this registry produced the following list of record trees in BC that are located in Stanley Park (Table 9).
Table 9: Big Trees of British Columbia Registry (BC MOFR, 2009).
Species Circum. at DBH
Height Crown Spread
Total AFA Points Wood Volume
Location of Tree/ Nominator/ Date of Last Measurement/ Condition, Date Condition
Bigleaf Maple (Acer macrophyllum)
10.70 m 29.00 m 19.50 m 533 Stanley Park/ R. Stoltmann/1980
9.39 m 31.70 m 18.30 m 489 Stanley Park/ R. Stoltmann/1980
8.84 m 33.53 m 23.16 m 477 Stanley Park/R. Stoltmann/2000
8.73 m 30.18 m 20.42 m 460 Stanley Park/S. Muc/1999
7.23 m 31.10 m 22.56 m 406 Stanley Park/ S. Muc/1999
Red Alder (Alnus rubra)
6.53 m 29.50 m 22.50 m 373 Third Beach, Stanley Park/R. Stoltmann/1980
2.69 m 41.00 m 16.80 m 254 Stanley Park/R. Stoltmann/1990
Vine Maple (Acer circinatum)
1.24 m 12.50 m 12.80 m 101 Stanley Park/ R. Kelman1992
1.40 m 11.28 m 7.93 m 99 Stanley Park/ R. Kelman/ 1992/dead, 2000
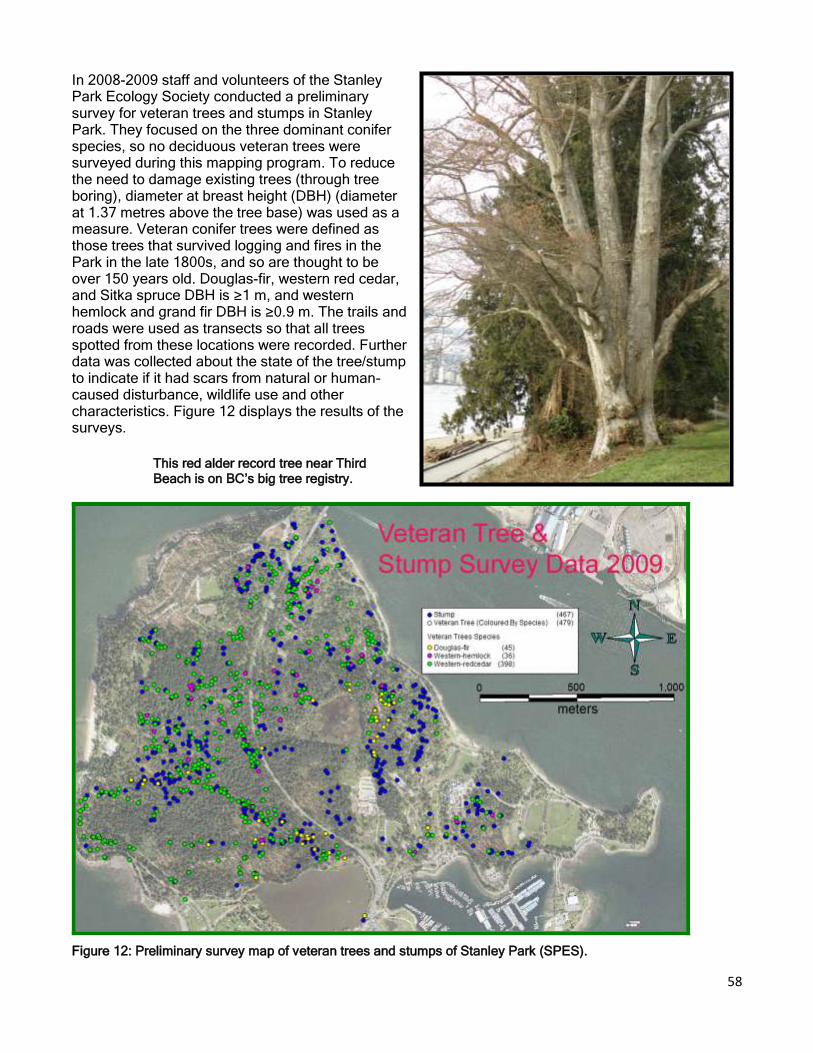
58
This red alder record tree near Third Beach is on BC‘s big tree registry.
In 2008-2009 staff and volunteers of the Stanley Park Ecology Society conducted a preliminary survey for veteran trees and stumps in Stanley Park. They focused on the three dominant conifer species, so no deciduous veteran trees were surveyed during this mapping program. To reduce the need to damage existing trees (through tree boring), diameter at breast height (DBH) (diameter at 1.37 metres above the tree base) was used as a measure. Veteran conifer trees were defined as those trees that survived logging and fires in the Park in the late 1800s, and so are thought to be over 150 years old. Douglas-fir, western red cedar, and Sitka spruce DBH is ≥1 m, and western hemlock and grand fir DBH is ≥0.9 m. The trails and roads were used as transects so that all trees spotted from these locations were recorded. Further data was collected about the state of the tree/stump to indicate if it had scars from natural or human-caused disturbance, wildlife use and other characteristics. Figure 12 displays the results of the surveys.
Figure 12: Preliminary survey map of veteran trees and stumps of Stanley Park (SPES).
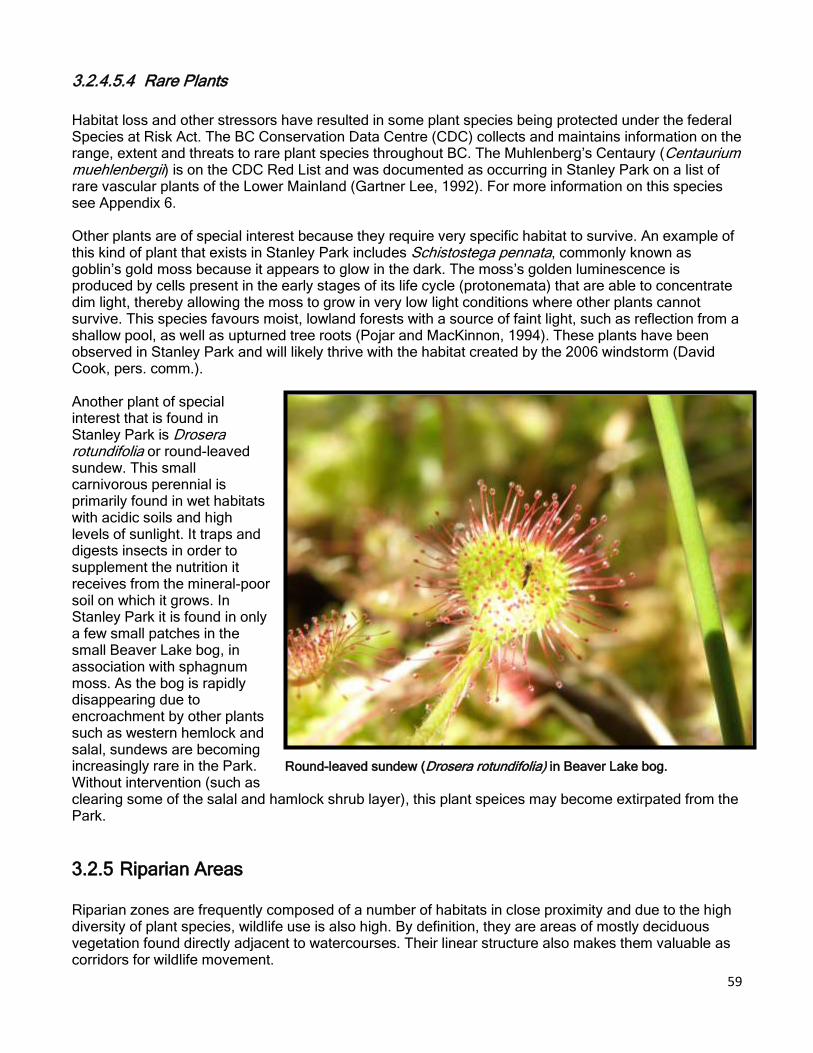
59
3.2.4.5.4 Rare Plants
Habitat loss and other stressors have resulted in some plant species being protected under the federal Species at Risk Act. The BC Conservation Data Centre (CDC) collects and maintains information on the range, extent and threats to rare plant species throughout BC. The Muhlenberg‘s Centaury (Centaurium muehlenbergii) is on the CDC Red List and was documented as occurring in Stanley Park on a list of rare vascular plants of the Lower Mainland (Gartner Lee, 1992). For more information on this species see Appendix 6. Other plants are of special interest because they require very specific habitat to survive. An example of this kind of plant that exists in Stanley Park includes Schistostega pennata, commonly known as goblin‘s gold moss because it appears to glow in the dark. The moss‘s golden luminescence is produced by cells present in the early stages of its life cycle (protonemata) that are able to concentrate dim light, thereby allowing the moss to grow in very low light conditions where other plants cannot survive. This species favours moist, lowland forests with a source of faint light, such as reflection from a shallow pool, as well as upturned tree roots (Pojar and MacKinnon, 1994). These plants have been observed in Stanley Park and will likely thrive with the habitat created by the 2006 windstorm (David Cook, pers. comm.). Another plant of special interest that is found in Stanley Park is Drosera rotundifolia or round-leaved sundew. This small carnivorous perennial is primarily found in wet habitats with acidic soils and high levels of sunlight. It traps and digests insects in order to supplement the nutrition it receives from the mineral-poor soil on which it grows. In Stanley Park it is found in only a few small patches in the small Beaver Lake bog, in association with sphagnum moss. As the bog is rapidly disappearing due to encroachment by other plants such as western hemlock and salal, sundews are becoming increasingly rare in the Park. Without intervention (such as clearing some of the salal and hamlock shrub layer), this plant speices may become extirpated from the Park.
3.2.5 Riparian Areas
Riparian zones are frequently composed of a number of habitats in close proximity and due to the high diversity of plant species, wildlife use is also high. By definition, they are areas of mostly deciduous vegetation found directly adjacent to watercourses. Their linear structure also makes them valuable as corridors for wildlife movement.
Round-leaved sundew (Drosera rotundifolia) in Beaver Lake bog.
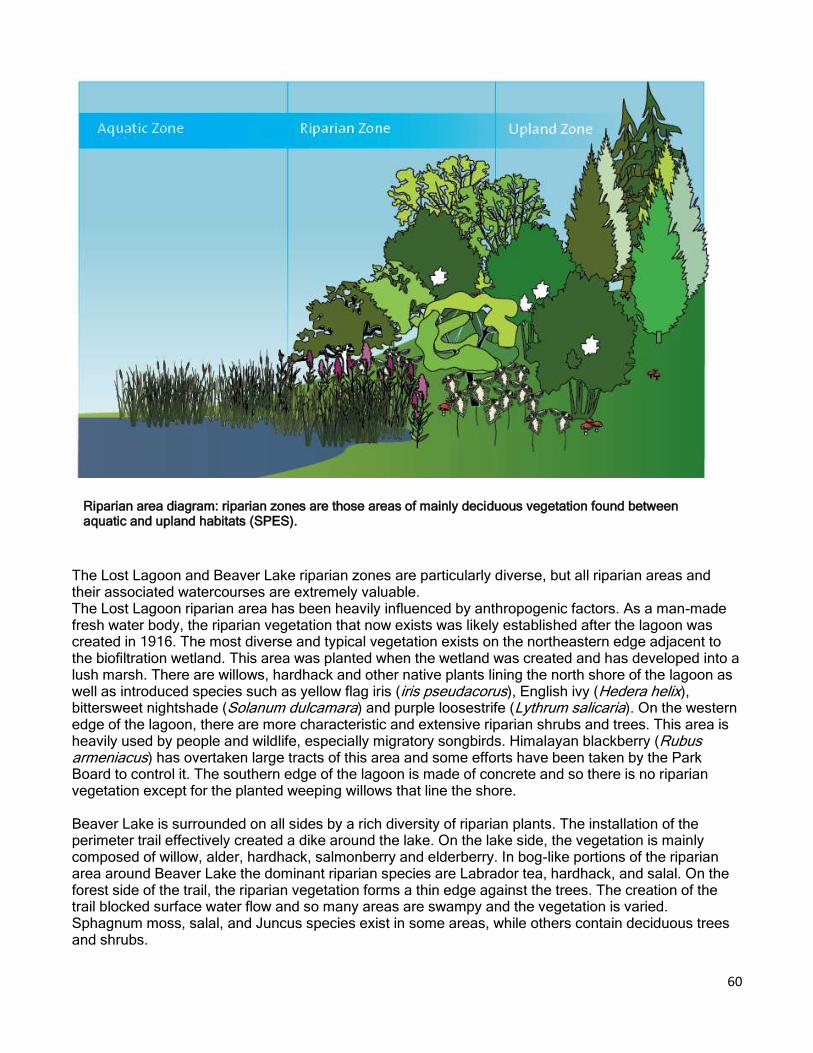
60
The Lost Lagoon and Beaver Lake riparian zones are particularly diverse, but all riparian areas and their associated watercourses are extremely valuable. The Lost Lagoon riparian area has been heavily influenced by anthropogenic factors. As a man-made fresh water body, the riparian vegetation that now exists was likely established after the lagoon was created in 1916. The most diverse and typical vegetation exists on the northeastern edge adjacent to the biofiltration wetland. This area was planted when the wetland was created and has developed into a lush marsh. There are willows, hardhack and other native plants lining the north shore of the lagoon as well as introduced species such as yellow flag iris (iris pseudacorus), English ivy (Hedera helix), bittersweet nightshade (Solanum dulcamara) and purple loosestrife (Lythrum salicaria). On the western edge of the lagoon, there are more characteristic and extensive riparian shrubs and trees. This area is heavily used by people and wildlife, especially migratory songbirds. Himalayan blackberry (Rubus armeniacus) has overtaken large tracts of this area and some efforts have been taken by the Park Board to control it. The southern edge of the lagoon is made of concrete and so there is no riparian vegetation except for the planted weeping willows that line the shore. Beaver Lake is surrounded on all sides by a rich diversity of riparian plants. The installation of the perimeter trail effectively created a dike around the lake. On the lake side, the vegetation is mainly composed of willow, alder, hardhack, salmonberry and elderberry. In bog-like portions of the riparian area around Beaver Lake the dominant riparian species are Labrador tea, hardhack, and salal. On the forest side of the trail, the riparian vegetation forms a thin edge against the trees. The creation of the trail blocked surface water flow and so many areas are swampy and the vegetation is varied. Sphagnum moss, salal, and Juncus species exist in some areas, while others contain deciduous trees and shrubs.
Riparian area diagram: riparian zones are those areas of mainly deciduous vegetation found between aquatic and upland habitats (SPES).

61
Within Stanley Park most streams flow in narrow, confined channels, and as a result have only a narrow band of typical riparian vegetation. Because of the small size of Stanley Park‘s riparian areas, they have been defined for the Park‘s maps as a 15 m buffer around the active channel. Due to their sensitivity to disturbance and their importance for wildlife habitat, riparian areas have been designated as Environmentally Sensitive Areas (ESA) by SPES and Wildlife Management Emphasis Areas in the Park Board Forest Management Plan (2009). Figure 13 shows a map of riparian areas in the park and other ESAs.
Figure 13: Preliminary survey map of the Environmentally Sensitive Areas of Stanley Park (SPES).
3.2.6 Ecotones
Areas in the Park where two structurally distinct habitat types meet are considered ecotones. These edge habitats provide special refuge, breeding and feeding opportunities for wildlife, and represent high species diversity. There is abundant edge habitat in Stanley Park, much of which is low contrast (i.e., edges between two forest types) but there is also plenty of high contrast (i.e., a forest and lawn edge) (Robertson et al., 1989). Ecotones can be difficult to define and identify consistently, so for their designation as ESAs in Stanley Park, only high-contrast edges, where mature coniferous forest met deciduous patches, fields, clearings or young plantations, were identified. Shrub-forest ecotones are the most productive for wildlife in Stanley Park but all edges are used preferentially by certain species of breeding birds, aerial predators, grazers and opportunistic hunters. A graphic illustration of both hard edge and soft edge ecotones is shown in Figure 14.
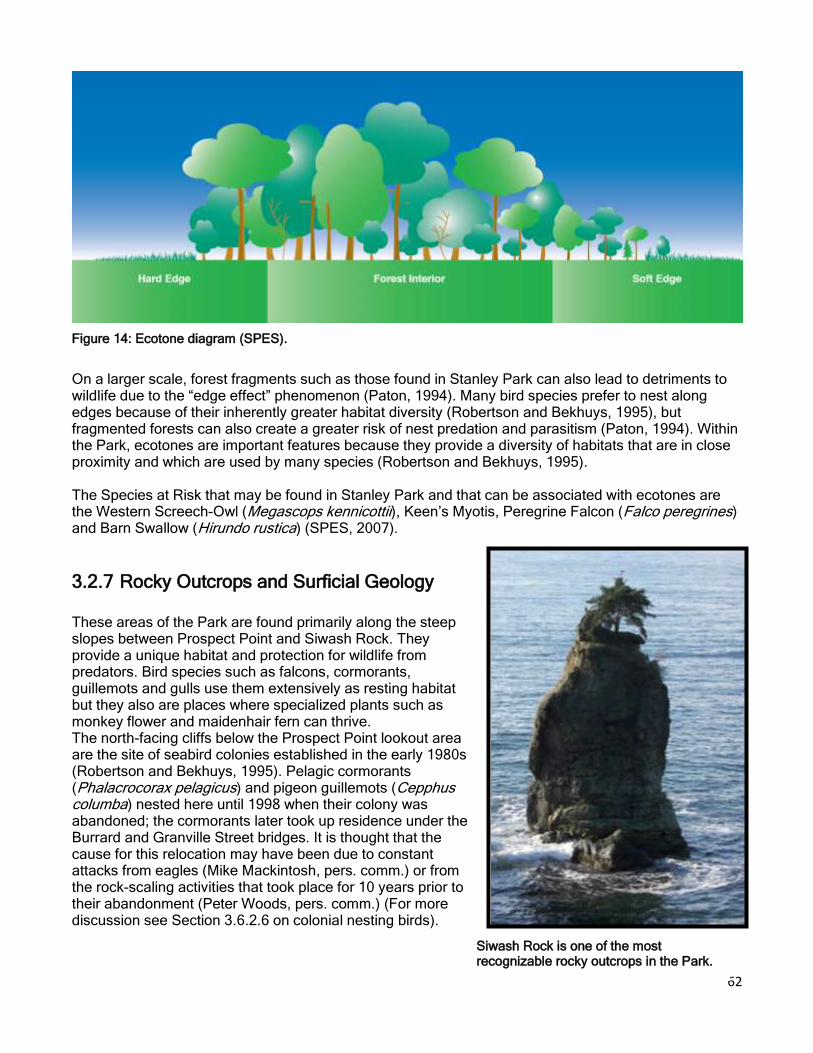
62
Figure 14: Ecotone diagram (SPES).
On a larger scale, forest fragments such as those found in Stanley Park can also lead to detriments to wildlife due to the ―edge effect‖ phenomenon (Paton, 1994). Many bird species prefer to nest along edges because of their inherently greater habitat diversity (Robertson and Bekhuys, 1995), but fragmented forests can also create a greater risk of nest predation and parasitism (Paton, 1994). Within the Park, ecotones are important features because they provide a diversity of habitats that are in close proximity and which are used by many species (Robertson and Bekhuys, 1995). The Species at Risk that may be found in Stanley Park and that can be associated with ecotones are the Western Screech-Owl (Megascops kennicottii), Keen‘s Myotis, Peregrine Falcon (Falco peregrines) and Barn Swallow (Hirundo rustica) (SPES, 2007).
3.2.7 Rocky Outcrops and Surficial Geology
These areas of the Park are found primarily along the steep slopes between Prospect Point and Siwash Rock. They provide a unique habitat and protection for wildlife from predators. Bird species such as falcons, cormorants, guillemots and gulls use them extensively as resting habitat but they also are places where specialized plants such as monkey flower and maidenhair fern can thrive. The north-facing cliffs below the Prospect Point lookout area are the site of seabird colonies established in the early 1980s (Robertson and Bekhuys, 1995). Pelagic cormorants (Phalacrocorax pelagicus) and pigeon guillemots (Cepphus columba) nested here until 1998 when their colony was abandoned; the cormorants later took up residence under the Burrard and Granville Street bridges. It is thought that the cause for this relocation may have been due to constant attacks from eagles (Mike Mackintosh, pers. comm.) or from the rock-scaling activities that took place for 10 years prior to their abandonment (Peter Woods, pers. comm.) (For more discussion see Section 3.6.2.6 on colonial nesting birds).
Siwash Rock is one of the most recognizable rocky outcrops in the Park.

63
Grassy areas and gardens provide habitat for some wildlife species like these Canada geese.
During the 2006 windstorm large sections of the slopes above the cliffs gave way, causing trees, soil and plants to fall to the seawall. Following this event the soil and vegetation was scaled back from the edge of the cliff in unstable areas to prevent future slides. These areas were replanted with ferns and other shrub species and the runoff water (which may have contributed to the slide) was redirected into fortified swales.
3.2.8 Cultivated Areas
The grassy areas of Stanley Park can be classified as either long un-mowed areas, open grass areas with canopy cover, or mowed grass lawns. These areas occur mostly in the eastern half of the Park and at its very southern edges (Robertson and Bekhuys, 1995), but also in a variety of locations such as the picnic area near Prospect Point, the Hollow Tree, and Second Beach. Wildlife species use these areas primarily for feeding and resting. They are particularly attractive to grass eaters such as Canada geese (Branta canadensis) and American wigeon (Anas americana) as wells as squirrels, insects, small mammals, robins and northern flickers (Colaptes auratus). Their use is greatest during the waterfowl overwintering and migratory periods, when these species concentrate on areas immediately adjacent to protected water bodies like Lost Lagoon and Coal Harbour (Robertson and
Bekhuys, 1995). Grassy areas that have not been mowed provide a special habitat for select species. Two invertebrate Species at Risk, the Johnson‘s hairstreak butterfly (Callophrys johnsoni) and blue dasher dragonfly (Pachydiplax longipennis), have been observed in these areas (Peter Woods, pers. comm.). There are four ornamental gardens and one community garden in Stanley Park. During the beginning of the 20th century nursery plants were grown in a series of greenhouses in the park for use in the gardens, but they are now grown offsite (VBPR, 2009b). The Community Garden and the Native Plant Demonstration Garden were constructed in 2003 and are located next to the tennis courts near the Nature House on Lost Lagoon. This was a Park Partners cooperative project primarily created through volunteers and jointly managed by SPES and the West End Residents Society. The azaleas and rhododendrons in the Ted and Mary Greig Rhododendron Garden were part of an extensive collection obtained from Ted and Mary Greig of Royston Nurseries in the 1960s (VBPR, 2009b). The Stanley Park Rose Garden was established in 1921 by the Kiwanis Club and there are now over 3,500 plants on display (VBPR, 2009b). Large floral beds extend down to the causeway and up to the Dining Pavilion. This garden is the most extensively used and cultivated.

64
At Prospect Point there was a horticultural craft of carpet bedding, where a picture or a phrase is depicted through the display of flowers and plants (VBPR, 2009b). This area was highly disturbed during the 2006 winter storms and has now been modified to include both horticultural and native plantings. The garden flowers provide a highly used habitat for butterflies, bees, and hummingbirds. The gardens have recently begun to provide a secure refuge for resident overwintering Anna‘s hummingbirds (Calypte anna), and gardeners have even begun planting species specifically for the benefit of wildlife (Betina Harvey, pers. comm.). To increase wildlife use, a large mason bee ‘supercondo‘ was installed in the Rose Garden in 2009 through a partnership with the Environmental Youth Alliance (EYA), the Park Board, and SPES. This structure added to the several smaller bee houses placed at the Dining Pavilion and in the Native Plant garden by SPES staff and volunteers in 2008. Skunks, squirrels, and a variety of songbirds also use regularly use the gardens. For a list of ornamental plants found in Stanley Park please see Appendix 7
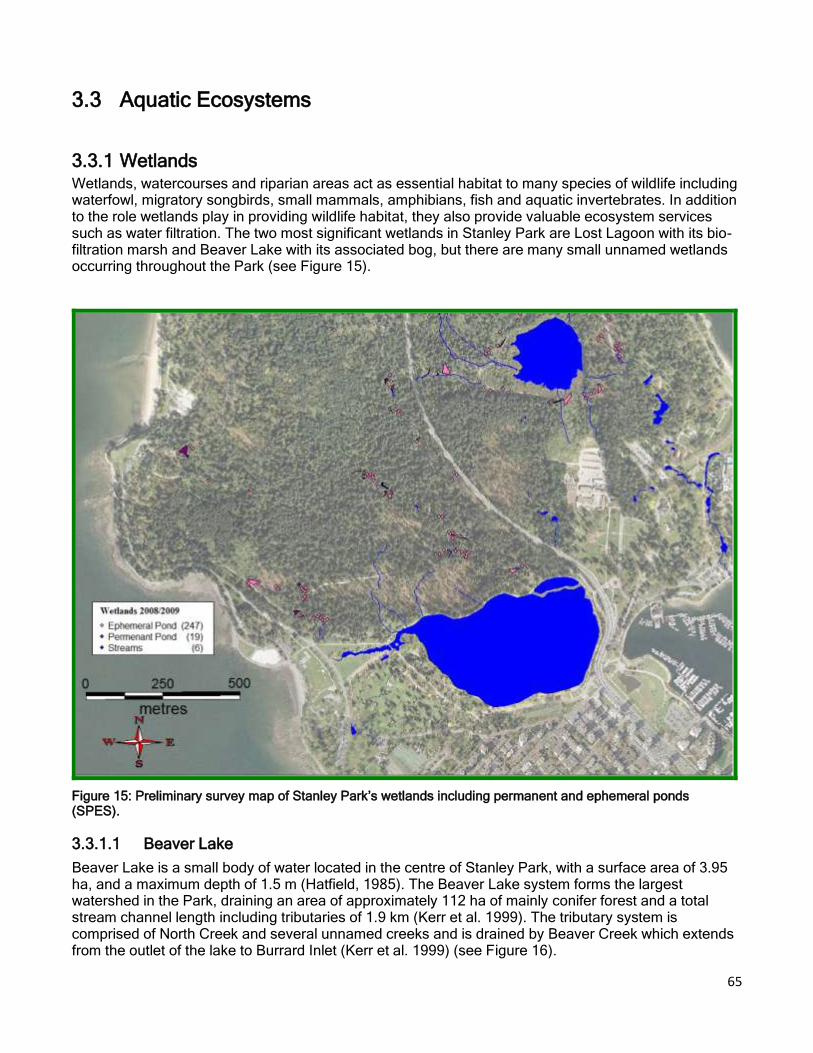
65
3.3 Aquatic Ecosystems
3.3.1 Wetlands Wetlands, watercourses and riparian areas act as essential habitat to many species of wildlife including waterfowl, migratory songbirds, small mammals, amphibians, fish and aquatic invertebrates. In addition to the role wetlands play in providing wildlife habitat, they also provide valuable ecosystem services such as water filtration. The two most significant wetlands in Stanley Park are Lost Lagoon with its bio-filtration marsh and Beaver Lake with its associated bog, but there are many small unnamed wetlands occurring throughout the Park (see Figure 15).
Figure 15: Preliminary survey map of Stanley Park‘s wetlands including permanent and ephemeral ponds (SPES).
3.3.1.1 Beaver Lake
Beaver Lake is a small body of water located in the centre of Stanley Park, with a surface area of 3.95 ha, and a maximum depth of 1.5 m (Hatfield, 1985). The Beaver Lake system forms the largest watershed in the Park, draining an area of approximately 112 ha of mainly conifer forest and a total stream channel length including tributaries of 1.9 km (Kerr et al. 1999). The tributary system is comprised of North Creek and several unnamed creeks and is drained by Beaver Creek which extends from the outlet of the lake to Burrard Inlet (Kerr et al. 1999) (see Figure 16).
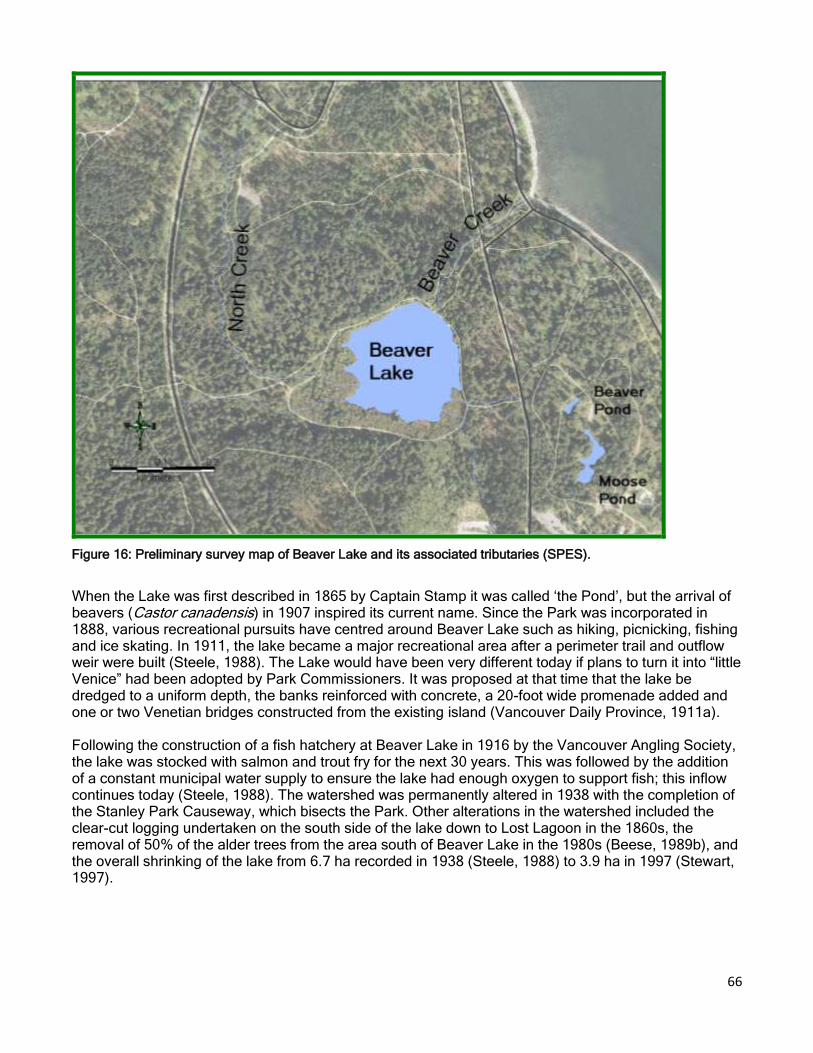
66
Figure 16: Preliminary survey map of Beaver Lake and its associated tributaries (SPES).
When the Lake was first described in 1865 by Captain Stamp it was called ‗the Pond‘, but the arrival of beavers (Castor canadensis) in 1907 inspired its current name. Since the Park was incorporated in 1888, various recreational pursuits have centred around Beaver Lake such as hiking, picnicking, fishing and ice skating. In 1911, the lake became a major recreational area after a perimeter trail and outflow weir were built (Steele, 1988). The Lake would have been very different today if plans to turn it into ―little Venice‖ had been adopted by Park Commissioners. It was proposed at that time that the lake be dredged to a uniform depth, the banks reinforced with concrete, a 20-foot wide promenade added and one or two Venetian bridges constructed from the existing island (Vancouver Daily Province, 1911a). Following the construction of a fish hatchery at Beaver Lake in 1916 by the Vancouver Angling Society, the lake was stocked with salmon and trout fry for the next 30 years. This was followed by the addition of a constant municipal water supply to ensure the lake had enough oxygen to support fish; this inflow continues today (Steele, 1988). The watershed was permanently altered in 1938 with the completion of the Stanley Park Causeway, which bisects the Park. Other alterations in the watershed included the clear-cut logging undertaken on the south side of the lake down to Lost Lagoon in the 1860s, the removal of 50% of the alder trees from the area south of Beaver Lake in the 1980s (Beese, 1989b), and the overall shrinking of the lake from 6.7 ha recorded in 1938 (Steele, 1988) to 3.9 ha in 1997 (Stewart, 1997).
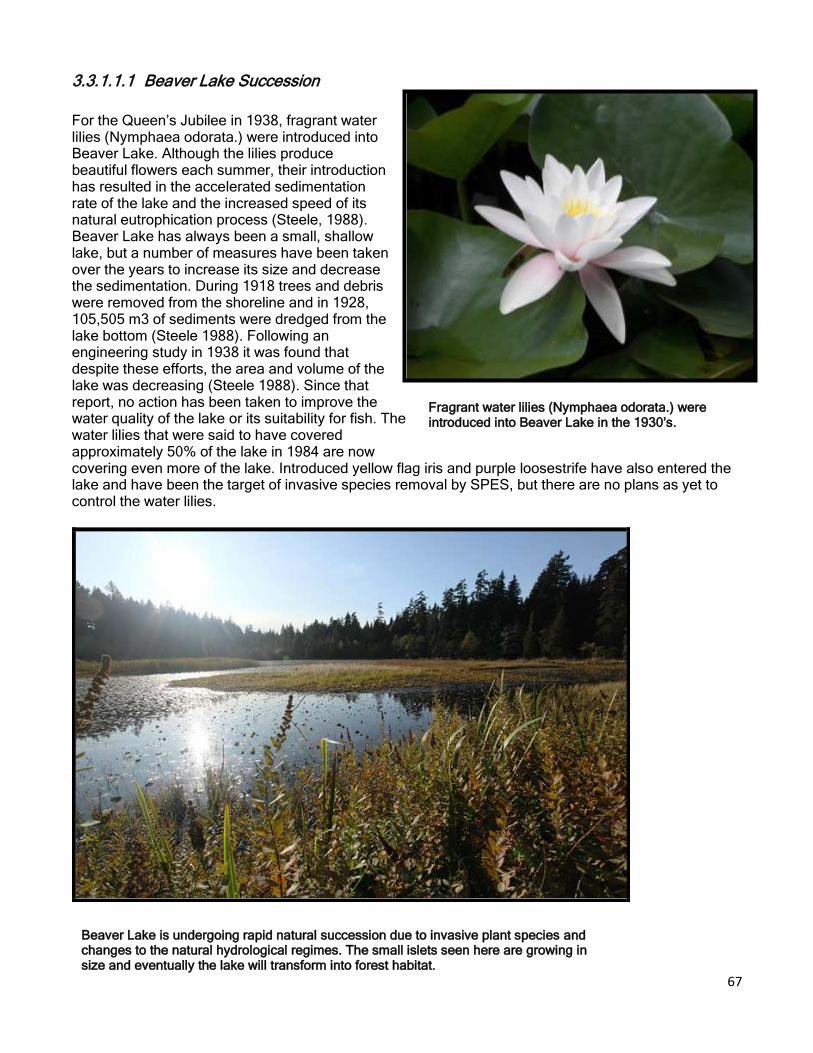
67
Fragrant water lilies (Nymphaea odorata.) were introduced into Beaver Lake in the 1930‘s.
Beaver Lake is undergoing rapid natural succession due to invasive plant species and changes to the natural hydrological regimes. The small islets seen here are growing in size and eventually the lake will transform into forest habitat.
3.3.1.1.1 Beaver Lake Succession
For the Queen‘s Jubilee in 1938, fragrant water lilies (Nymphaea odorata.) were introduced into Beaver Lake. Although the lilies produce beautiful flowers each summer, their introduction has resulted in the accelerated sedimentation rate of the lake and the increased speed of its natural eutrophication process (Steele, 1988). Beaver Lake has always been a small, shallow lake, but a number of measures have been taken over the years to increase its size and decrease the sedimentation. During 1918 trees and debris were removed from the shoreline and in 1928, 105,505 m3 of sediments were dredged from the lake bottom (Steele 1988). Following an engineering study in 1938 it was found that despite these efforts, the area and volume of the lake was decreasing (Steele 1988). Since that report, no action has been taken to improve the water quality of the lake or its suitability for fish. The water lilies that were said to have covered approximately 50% of the lake in 1984 are now covering even more of the lake. Introduced yellow flag iris and purple loosestrife have also entered the lake and have been the target of invasive species removal by SPES, but there are no plans as yet to control the water lilies.
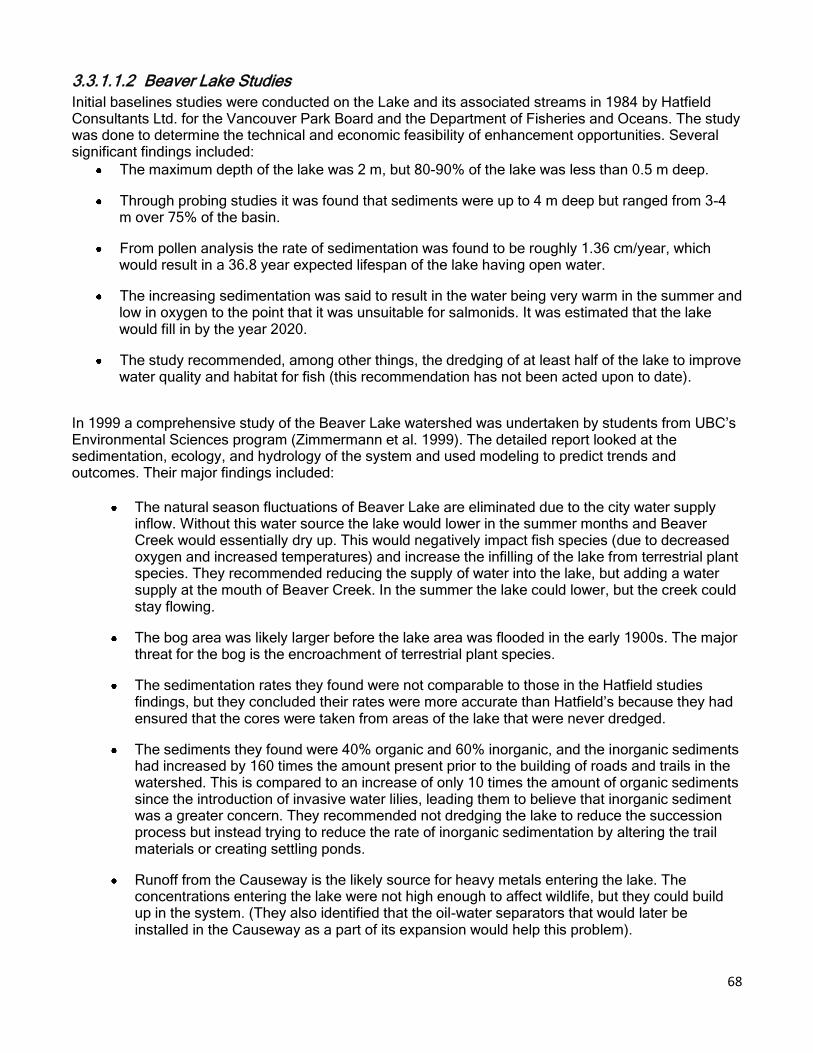
68
3.3.1.1.2 Beaver Lake Studies
Initial baselines studies were conducted on the Lake and its associated streams in 1984 by Hatfield Consultants Ltd. for the Vancouver Park Board and the Department of Fisheries and Oceans. The study was done to determine the technical and economic feasibility of enhancement opportunities. Several significant findings included:
The maximum depth of the lake was 2 m, but 80-90% of the lake was less than 0.5 m deep.
Through probing studies it was found that sediments were up to 4 m deep but ranged from 3-4 m over 75% of the basin.
From pollen analysis the rate of sedimentation was found to be roughly 1.36 cm/year, which would result in a 36.8 year expected lifespan of the lake having open water.
The increasing sedimentation was said to result in the water being very warm in the summer and low in oxygen to the point that it was unsuitable for salmonids. It was estimated that the lake would fill in by the year 2020.
The study recommended, among other things, the dredging of at least half of the lake to improve water quality and habitat for fish (this recommendation has not been acted upon to date).
In 1999 a comprehensive study of the Beaver Lake watershed was undertaken by students from UBC‘s Environmental Sciences program (Zimmermann et al. 1999). The detailed report looked at the sedimentation, ecology, and hydrology of the system and used modeling to predict trends and outcomes. Their major findings included:
The natural season fluctuations of Beaver Lake are eliminated due to the city water supply inflow. Without this water source the lake would lower in the summer months and Beaver Creek would essentially dry up. This would negatively impact fish species (due to decreased oxygen and increased temperatures) and increase the infilling of the lake from terrestrial plant species. They recommended reducing the supply of water into the lake, but adding a water supply at the mouth of Beaver Creek. In the summer the lake could lower, but the creek could stay flowing.
The bog area was likely larger before the lake area was flooded in the early 1900s. The major threat for the bog is the encroachment of terrestrial plant species.
The sedimentation rates they found were not comparable to those in the Hatfield studies findings, but they concluded their rates were more accurate than Hatfield‘s because they had ensured that the cores were taken from areas of the lake that were never dredged.
The sediments they found were 40% organic and 60% inorganic, and the inorganic sediments had increased by 160 times the amount present prior to the building of roads and trails in the watershed. This is compared to an increase of only 10 times the amount of organic sediments since the introduction of invasive water lilies, leading them to believe that inorganic sediment was a greater concern. They recommended not dredging the lake to reduce the succession process but instead trying to reduce the rate of inorganic sedimentation by altering the trail materials or creating settling ponds.
Runoff from the Causeway is the likely source for heavy metals entering the lake. The concentrations entering the lake were not high enough to affect wildlife, but they could build up in the system. (They also identified that the oil-water separators that would later be installed in the Causeway as a part of its expansion would help this problem).
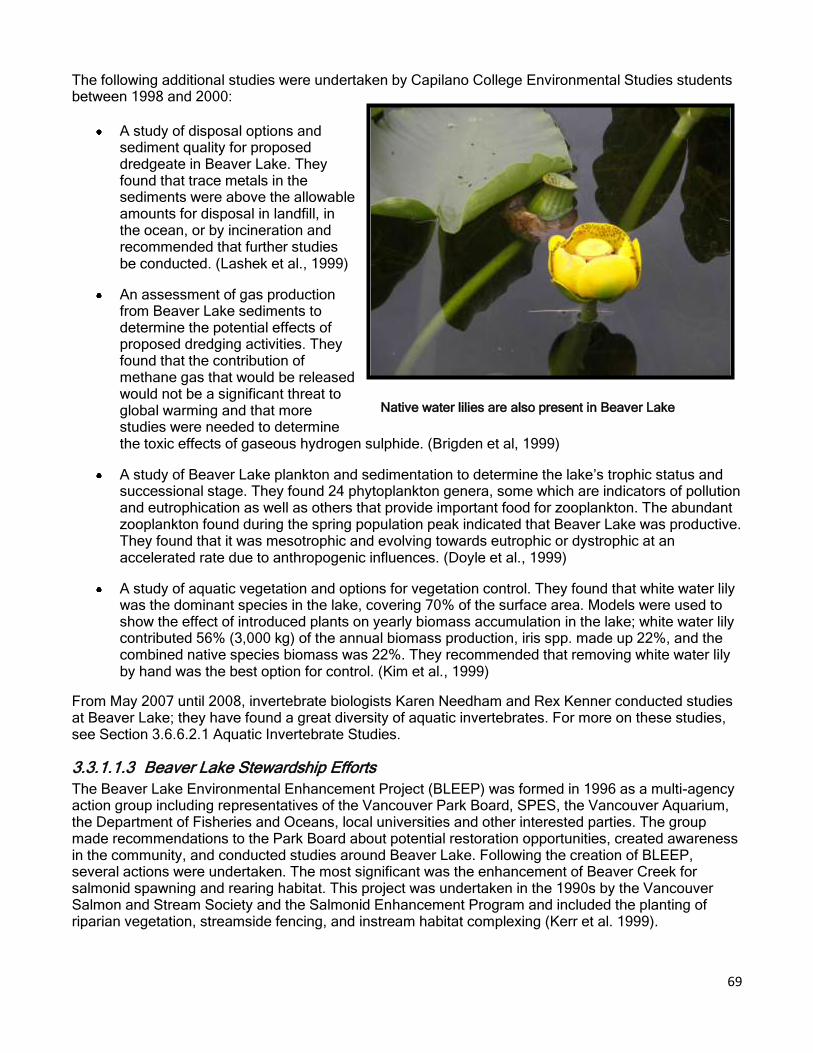
69
Native water lilies are also present in Beaver Lake
The following additional studies were undertaken by Capilano College Environmental Studies students between 1998 and 2000:
A study of disposal options and sediment quality for proposed dredgeate in Beaver Lake. They found that trace metals in the sediments were above the allowable amounts for disposal in landfill, in the ocean, or by incineration and recommended that further studies be conducted. (Lashek et al., 1999)
An assessment of gas production from Beaver Lake sediments to determine the potential effects of proposed dredging activities. They found that the contribution of methane gas that would be released would not be a significant threat to global warming and that more studies were needed to determine the toxic effects of gaseous hydrogen sulphide. (Brigden et al, 1999)
A study of Beaver Lake plankton and sedimentation to determine the lake‘s trophic status and successional stage. They found 24 phytoplankton genera, some which are indicators of pollution and eutrophication as well as others that provide important food for zooplankton. The abundant zooplankton found during the spring population peak indicated that Beaver Lake was productive. They found that it was mesotrophic and evolving towards eutrophic or dystrophic at an accelerated rate due to anthropogenic influences. (Doyle et al., 1999)
A study of aquatic vegetation and options for vegetation control. They found that white water lily was the dominant species in the lake, covering 70% of the surface area. Models were used to show the effect of introduced plants on yearly biomass accumulation in the lake; white water lily contributed 56% (3,000 kg) of the annual biomass production, iris spp. made up 22%, and the combined native species biomass was 22%. They recommended that removing white water lily by hand was the best option for control. (Kim et al., 1999)
From May 2007 until 2008, invertebrate biologists Karen Needham and Rex Kenner conducted studies at Beaver Lake; they have found a great diversity of aquatic invertebrates. For more on these studies, see Section 3.6.6.2.1 Aquatic Invertebrate Studies.
3.3.1.1.3 Beaver Lake Stewardship Efforts
The Beaver Lake Environmental Enhancement Project (BLEEP) was formed in 1996 as a multi-agency action group including representatives of the Vancouver Park Board, SPES, the Vancouver Aquarium, the Department of Fisheries and Oceans, local universities and other interested parties. The group made recommendations to the Park Board about potential restoration opportunities, created awareness in the community, and conducted studies around Beaver Lake. Following the creation of BLEEP, several actions were undertaken. The most significant was the enhancement of Beaver Creek for salmonid spawning and rearing habitat. This project was undertaken in the 1990s by the Vancouver Salmon and Stream Society and the Salmonid Enhancement Program and included the planting of riparian vegetation, streamside fencing, and instream habitat complexing (Kerr et al. 1999).

70
Pond breeding amphibian surveys in Beaver Lake began in 2007. (Photo by Peter Woods)
Beavers can be found in both Beaver Lake and Lost Lagoon (Photo by Mark T. White)
For many years, elementary school students have been releasing salmon fry into the creek from the Capilano River hatchery in cooperation with the DFO. Other projects have included multiple student-led projects of the Beaver Creek system through Capilano College‘s Environmental Studies program and the installation of bat and bird nest boxes through the Stanley Park Ecology Society in the 1990s (Mike Mackintosh, pers. comm.). Recent studies, started as a part of the 2007 Restoration Program, resulted in the first amphibian inventories in the lake. Since 2007, SPES has been conducting yearly amphibian surveys in the lake and in the spring of 2009 installed wood duck boxes. SPES has also conducted monthly bird counts for Beaver Lake for many years.
The 2008 arrival of a beaver in the lake for the first time in nearly 60 years has altered the environment already. Although no formal studies have been undertaken to assess the changes, the beaver has dredged areas around the outflow weir, created an island where its lodge is located, and has been seen eating water lilies and other aquatic vegetation and trees. Since the beaver was deemed to be helping the lake, Park Board staff installed a ‘Beaver Baffler‘ device in the overflow culvert of the lake. This pipe allows water to escape the lake despite the beaver‘s constant efforts to plug it up (for more on beavers in Stanley Park see Section 3.6.7.2).
3.3.1.2 Lost Lagoon
Lost Lagoon is a shallow (1.2 m average depth), brackish body of water with an area of 16 ha and a perimeter of 1.79 km (see Figure 17). It was originally an intertidal mud flat prior to the construction of the Causeway in 1916, which then isolated it from Coal Harbour (Carl, 1932). Between 1916 and 1929,
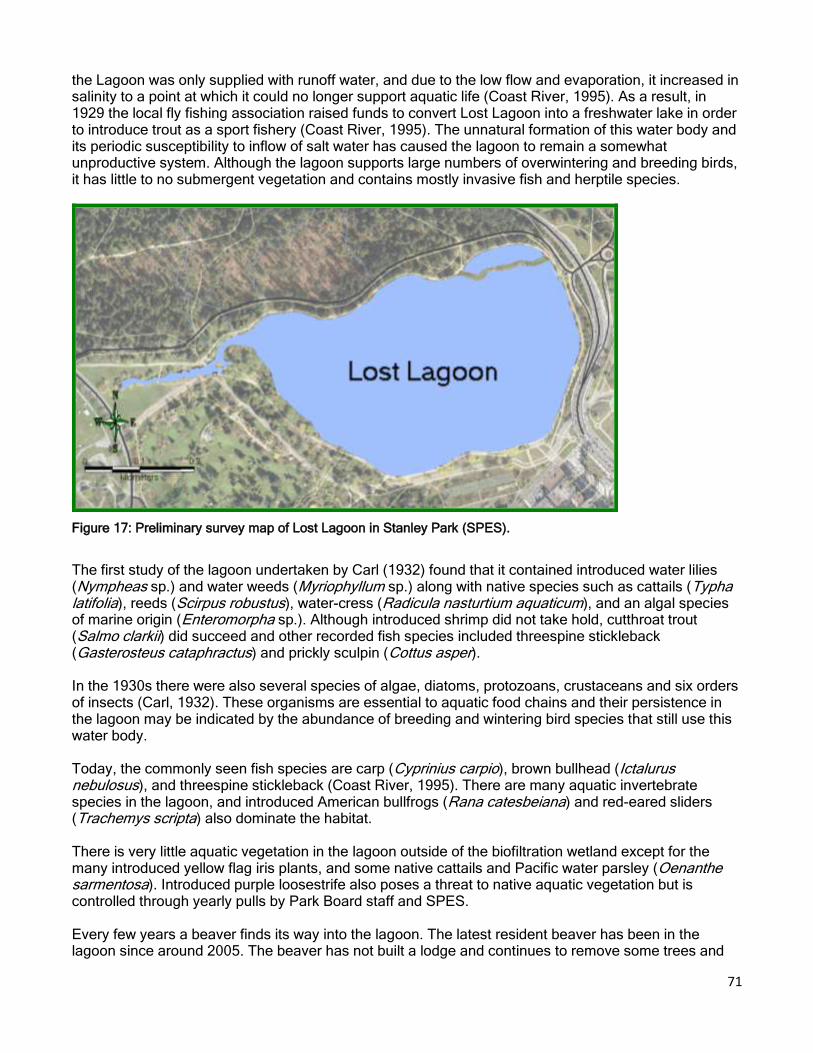
71
the Lagoon was only supplied with runoff water, and due to the low flow and evaporation, it increased in salinity to a point at which it could no longer support aquatic life (Coast River, 1995). As a result, in 1929 the local fly fishing association raised funds to convert Lost Lagoon into a freshwater lake in order to introduce trout as a sport fishery (Coast River, 1995). The unnatural formation of this water body and its periodic susceptibility to inflow of salt water has caused the lagoon to remain a somewhat unproductive system. Although the lagoon supports large numbers of overwintering and breeding birds, it has little to no submergent vegetation and contains mostly invasive fish and herptile species.
Figure 17: Preliminary survey map of Lost Lagoon in Stanley Park (SPES).
The first study of the lagoon undertaken by Carl (1932) found that it contained introduced water lilies (Nympheas sp.) and water weeds (Myriophyllum sp.) along with native species such as cattails (Typha latifolia), reeds (Scirpus robustus), water-cress (Radicula nasturtium aquaticum), and an algal species of marine origin (Enteromorpha sp.). Although introduced shrimp did not take hold, cutthroat trout (Salmo clarkii) did succeed and other recorded fish species included threespine stickleback (Gasterosteus cataphractus) and prickly sculpin (Cottus asper). In the 1930s there were also several species of algae, diatoms, protozoans, crustaceans and six orders of insects (Carl, 1932). These organisms are essential to aquatic food chains and their persistence in the lagoon may be indicated by the abundance of breeding and wintering bird species that still use this water body. Today, the commonly seen fish species are carp (Cyprinius carpio), brown bullhead (Ictalurus nebulosus), and threespine stickleback (Coast River, 1995). There are many aquatic invertebrate species in the lagoon, and introduced American bullfrogs (Rana catesbeiana) and red-eared sliders (Trachemys scripta) also dominate the habitat. There is very little aquatic vegetation in the lagoon outside of the biofiltration wetland except for the many introduced yellow flag iris plants, and some native cattails and Pacific water parsley (Oenanthe sarmentosa). Introduced purple loosestrife also poses a threat to native aquatic vegetation but is controlled through yearly pulls by Park Board staff and SPES. Every few years a beaver finds its way into the lagoon. The latest resident beaver has been in the lagoon since around 2005. The beaver has not built a lodge and continues to remove some trees and
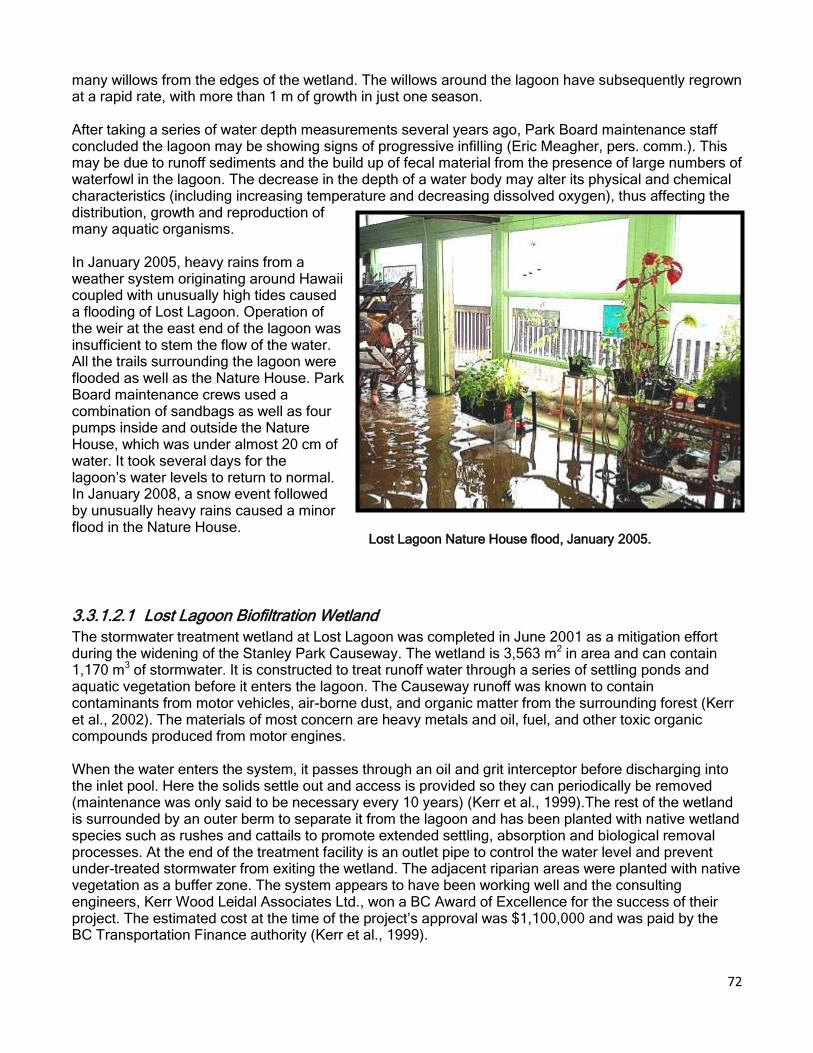
72
Lost Lagoon Nature House flood, January 2005.
many willows from the edges of the wetland. The willows around the lagoon have subsequently regrown at a rapid rate, with more than 1 m of growth in just one season.
After taking a series of water depth measurements several years ago, Park Board maintenance staff concluded the lagoon may be showing signs of progressive infilling (Eric Meagher, pers. comm.). This may be due to runoff sediments and the build up of fecal material from the presence of large numbers of waterfowl in the lagoon. The decrease in the depth of a water body may alter its physical and chemical characteristics (including increasing temperature and decreasing dissolved oxygen), thus affecting the distribution, growth and reproduction of many aquatic organisms. In January 2005, heavy rains from a weather system originating around Hawaii coupled with unusually high tides caused a flooding of Lost Lagoon. Operation of the weir at the east end of the lagoon was insufficient to stem the flow of the water. All the trails surrounding the lagoon were flooded as well as the Nature House. Park Board maintenance crews used a combination of sandbags as well as four pumps inside and outside the Nature House, which was under almost 20 cm of water. It took several days for the lagoon‘s water levels to return to normal. In January 2008, a snow event followed by unusually heavy rains caused a minor flood in the Nature House.
3.3.1.2.1 Lost Lagoon Biofiltration Wetland
The stormwater treatment wetland at Lost Lagoon was completed in June 2001 as a mitigation effort during the widening of the Stanley Park Causeway. The wetland is 3,563 m2 in area and can contain 1,170 m3 of stormwater. It is constructed to treat runoff water through a series of settling ponds and aquatic vegetation before it enters the lagoon. The Causeway runoff was known to contain contaminants from motor vehicles, air-borne dust, and organic matter from the surrounding forest (Kerr et al., 2002). The materials of most concern are heavy metals and oil, fuel, and other toxic organic compounds produced from motor engines. When the water enters the system, it passes through an oil and grit interceptor before discharging into the inlet pool. Here the solids settle out and access is provided so they can periodically be removed (maintenance was only said to be necessary every 10 years) (Kerr et al., 1999).The rest of the wetland is surrounded by an outer berm to separate it from the lagoon and has been planted with native wetland species such as rushes and cattails to promote extended settling, absorption and biological removal processes. At the end of the treatment facility is an outlet pipe to control the water level and prevent under-treated stormwater from exiting the wetland. The adjacent riparian areas were planted with native vegetation as a buffer zone. The system appears to have been working well and the consulting engineers, Kerr Wood Leidal Associates Ltd., won a BC Award of Excellence for the success of their project. The estimated cost at the time of the project‘s approval was $1,100,000 and was paid by the BC Transportation Finance authority (Kerr et al., 1999).
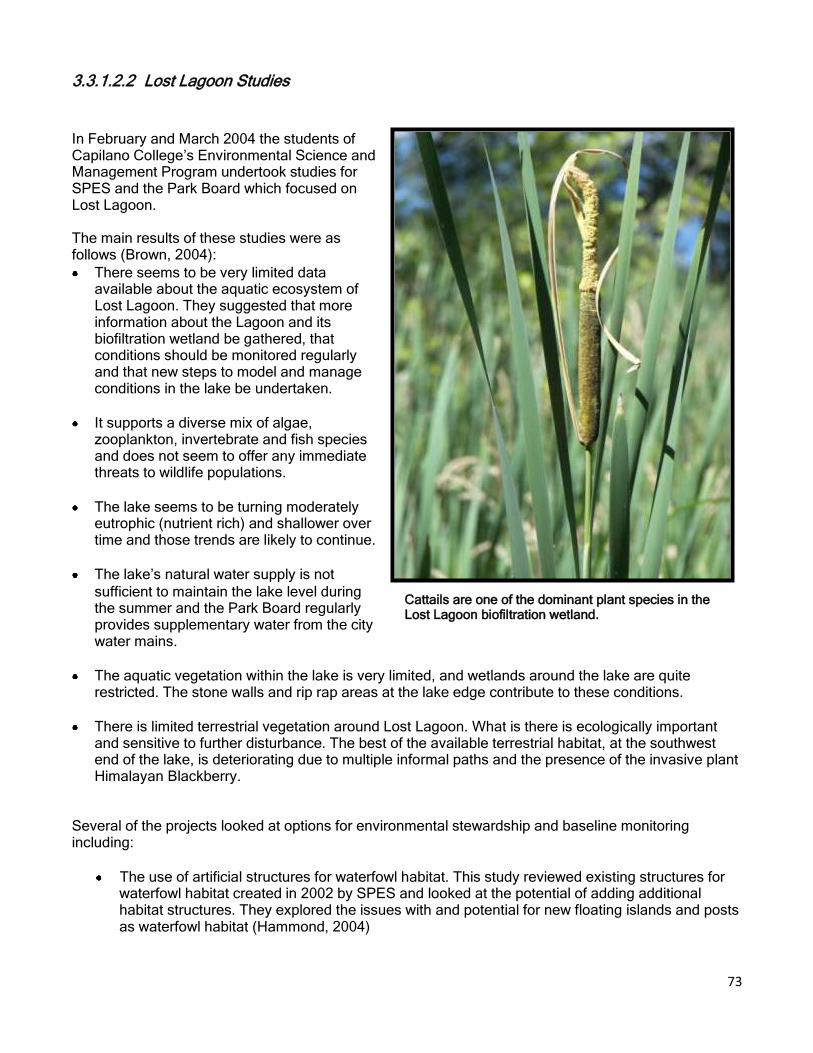
73
Cattails are one of the dominant plant species in the Lost Lagoon biofiltration wetland.
3.3.1.2.2 Lost Lagoon Studies
In February and March 2004 the students of Capilano College‘s Environmental Science and Management Program undertook studies for SPES and the Park Board which focused on Lost Lagoon. The main results of these studies were as follows (Brown, 2004):
There seems to be very limited data available about the aquatic ecosystem of Lost Lagoon. They suggested that more information about the Lagoon and its biofiltration wetland be gathered, that conditions should be monitored regularly and that new steps to model and manage conditions in the lake be undertaken.
It supports a diverse mix of algae, zooplankton, invertebrate and fish species and does not seem to offer any immediate threats to wildlife populations.
The lake seems to be turning moderately eutrophic (nutrient rich) and shallower over time and those trends are likely to continue.
The lake‘s natural water supply is not
sufficient to maintain the lake level during the summer and the Park Board regularly provides supplementary water from the city water mains.
The aquatic vegetation within the lake is very limited, and wetlands around the lake are quite restricted. The stone walls and rip rap areas at the lake edge contribute to these conditions.
There is limited terrestrial vegetation around Lost Lagoon. What is there is ecologically important and sensitive to further disturbance. The best of the available terrestrial habitat, at the southwest end of the lake, is deteriorating due to multiple informal paths and the presence of the invasive plant Himalayan Blackberry.
Several of the projects looked at options for environmental stewardship and baseline monitoring including:
The use of artificial structures for waterfowl habitat. This study reviewed existing structures for waterfowl habitat created in 2002 by SPES and looked at the potential of adding additional habitat structures. They explored the issues with and potential for new floating islands and posts as waterfowl habitat (Hammond, 2004)
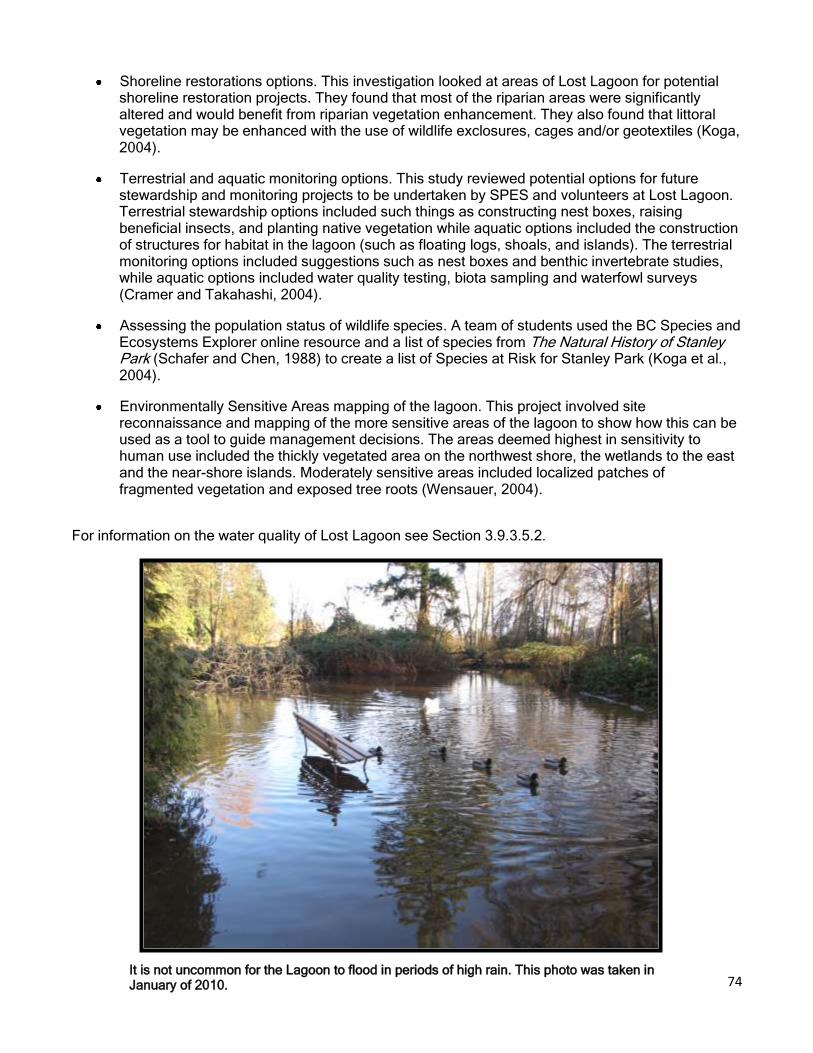
74 It is not uncommon for the Lagoon to flood in periods of high rain. This photo was taken in January of 2010.
Shoreline restorations options. This investigation looked at areas of Lost Lagoon for potential shoreline restoration projects. They found that most of the riparian areas were significantly altered and would benefit from riparian vegetation enhancement. They also found that littoral vegetation may be enhanced with the use of wildlife exclosures, cages and/or geotextiles (Koga, 2004).
Terrestrial and aquatic monitoring options. This study reviewed potential options for future stewardship and monitoring projects to be undertaken by SPES and volunteers at Lost Lagoon. Terrestrial stewardship options included such things as constructing nest boxes, raising beneficial insects, and planting native vegetation while aquatic options included the construction of structures for habitat in the lagoon (such as floating logs, shoals, and islands). The terrestrial monitoring options included suggestions such as nest boxes and benthic invertebrate studies, while aquatic options included water quality testing, biota sampling and waterfowl surveys (Cramer and Takahashi, 2004).
Assessing the population status of wildlife species. A team of students used the BC Species and Ecosystems Explorer online resource and a list of species from The Natural History of Stanley Park (Schafer and Chen, 1988) to create a list of Species at Risk for Stanley Park (Koga et al., 2004).
Environmentally Sensitive Areas mapping of the lagoon. This project involved site reconnaissance and mapping of the more sensitive areas of the lagoon to show how this can be used as a tool to guide management decisions. The areas deemed highest in sensitivity to human use included the thickly vegetated area on the northwest shore, the wetlands to the east and the near-shore islands. Moderately sensitive areas included localized patches of fragmented vegetation and exposed tree roots (Wensauer, 2004).
For information on the water quality of Lost Lagoon see Section 3.9.3.5.2.
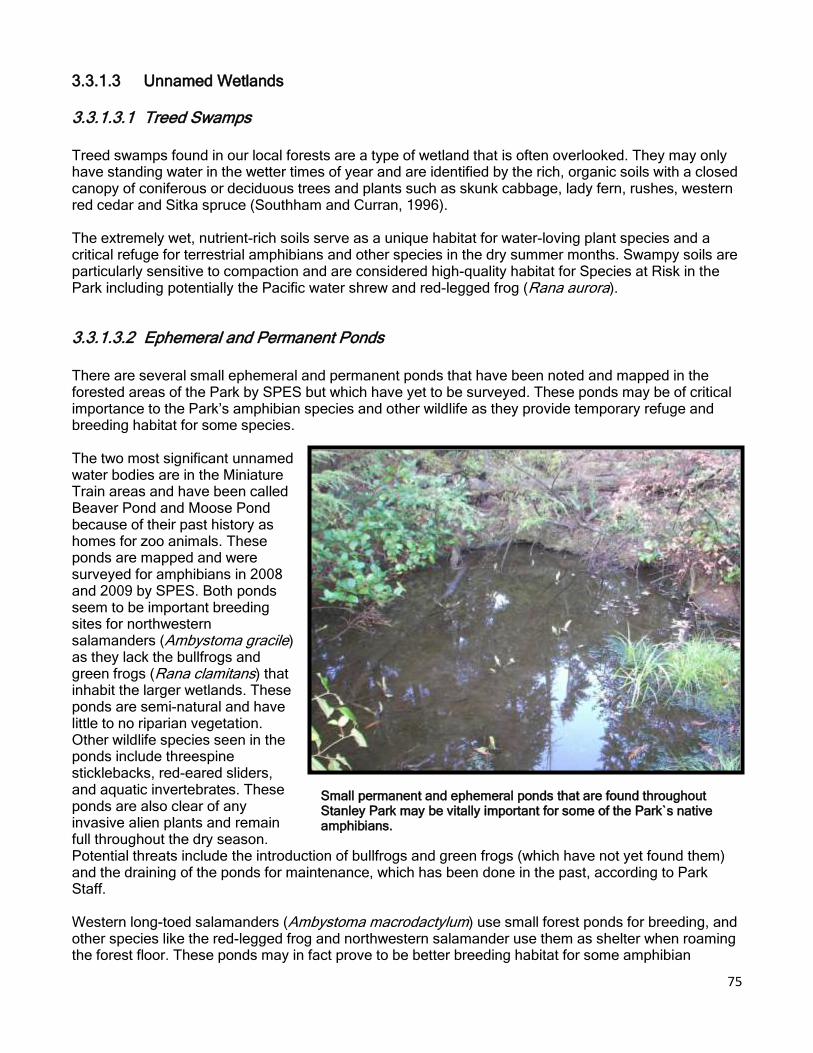
75
Small permanent and ephemeral ponds that are found throughout Stanley Park may be vitally important for some of the Park`s native amphibians.
3.3.1.3 Unnamed Wetlands
3.3.1.3.1 Treed Swamps
Treed swamps found in our local forests are a type of wetland that is often overlooked. They may only have standing water in the wetter times of year and are identified by the rich, organic soils with a closed canopy of coniferous or deciduous trees and plants such as skunk cabbage, lady fern, rushes, western red cedar and Sitka spruce (Southham and Curran, 1996). The extremely wet, nutrient-rich soils serve as a unique habitat for water-loving plant species and a critical refuge for terrestrial amphibians and other species in the dry summer months. Swampy soils are particularly sensitive to compaction and are considered high-quality habitat for Species at Risk in the Park including potentially the Pacific water shrew and red-legged frog (Rana aurora).
3.3.1.3.2 Ephemeral and Permanent Ponds
There are several small ephemeral and permanent ponds that have been noted and mapped in the forested areas of the Park by SPES but which have yet to be surveyed. These ponds may be of critical importance to the Park‘s amphibian species and other wildlife as they provide temporary refuge and breeding habitat for some species. The two most significant unnamed water bodies are in the Miniature Train areas and have been called Beaver Pond and Moose Pond because of their past history as homes for zoo animals. These ponds are mapped and were surveyed for amphibians in 2008 and 2009 by SPES. Both ponds seem to be important breeding sites for northwestern salamanders (Ambystoma gracile) as they lack the bullfrogs and green frogs (Rana clamitans) that inhabit the larger wetlands. These ponds are semi-natural and have little to no riparian vegetation. Other wildlife species seen in the ponds include threespine sticklebacks, red-eared sliders, and aquatic invertebrates. These ponds are also clear of any invasive alien plants and remain full throughout the dry season. Potential threats include the introduction of bullfrogs and green frogs (which have not yet found them) and the draining of the ponds for maintenance, which has been done in the past, according to Park Staff. Western long-toed salamanders (Ambystoma macrodactylum) use small forest ponds for breeding, and other species like the red-legged frog and northwestern salamander use them as shelter when roaming the forest floor. These ponds may in fact prove to be better breeding habitat for some amphibian
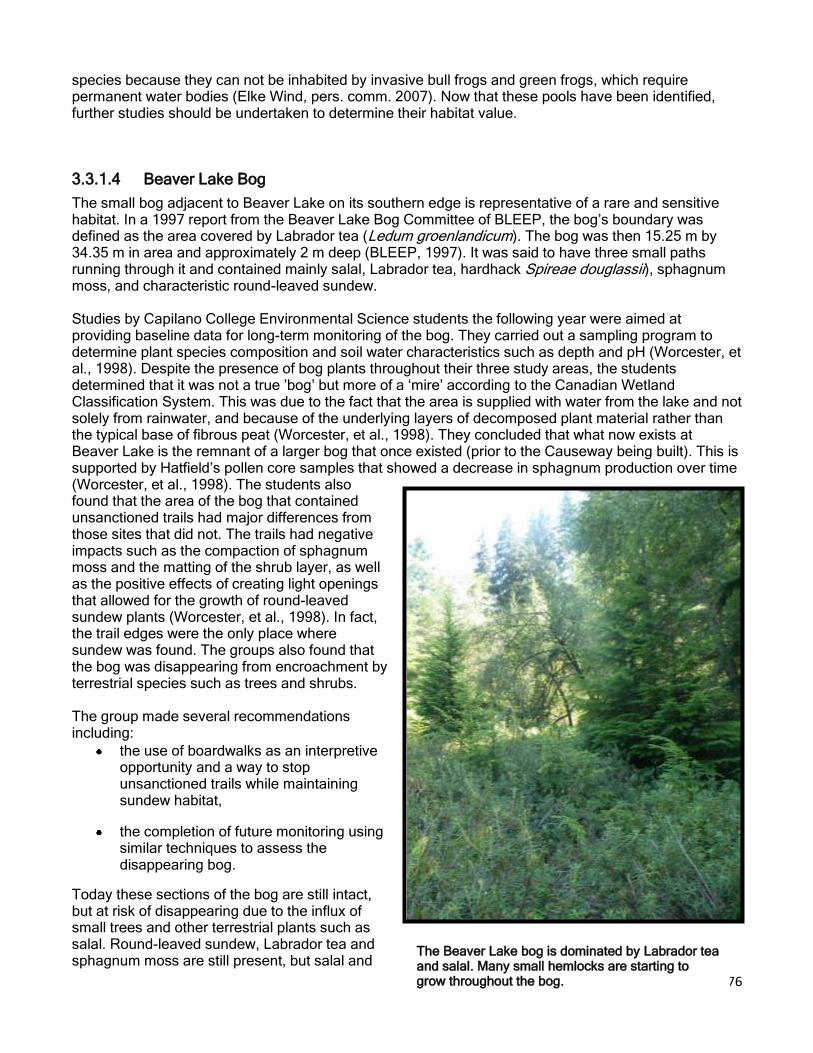
76
The Beaver Lake bog is dominated by Labrador tea and salal. Many small hemlocks are starting to grow throughout the bog.
species because they can not be inhabited by invasive bull frogs and green frogs, which require permanent water bodies (Elke Wind, pers. comm. 2007). Now that these pools have been identified, further studies should be undertaken to determine their habitat value.
3.3.1.4 Beaver Lake Bog
The small bog adjacent to Beaver Lake on its southern edge is representative of a rare and sensitive habitat. In a 1997 report from the Beaver Lake Bog Committee of BLEEP, the bog‘s boundary was defined as the area covered by Labrador tea (Ledum groenlandicum). The bog was then 15.25 m by 34.35 m in area and approximately 2 m deep (BLEEP, 1997). It was said to have three small paths running through it and contained mainly salal, Labrador tea, hardhack Spireae douglassii), sphagnum moss, and characteristic round-leaved sundew. Studies by Capilano College Environmental Science students the following year were aimed at providing baseline data for long-term monitoring of the bog. They carried out a sampling program to determine plant species composition and soil water characteristics such as depth and pH (Worcester, et al., 1998). Despite the presence of bog plants throughout their three study areas, the students determined that it was not a true ‘bog‘ but more of a ‗mire‘ according to the Canadian Wetland Classification System. This was due to the fact that the area is supplied with water from the lake and not solely from rainwater, and because of the underlying layers of decomposed plant material rather than the typical base of fibrous peat (Worcester, et al., 1998). They concluded that what now exists at Beaver Lake is the remnant of a larger bog that once existed (prior to the Causeway being built). This is supported by Hatfield‘s pollen core samples that showed a decrease in sphagnum production over time (Worcester, et al., 1998). The students also found that the area of the bog that contained unsanctioned trails had major differences from those sites that did not. The trails had negative impacts such as the compaction of sphagnum moss and the matting of the shrub layer, as well as the positive effects of creating light openings that allowed for the growth of round-leaved sundew plants (Worcester, et al., 1998). In fact, the trail edges were the only place where sundew was found. The groups also found that the bog was disappearing from encroachment by terrestrial species such as trees and shrubs. The group made several recommendations including:
the use of boardwalks as an interpretive opportunity and a way to stop unsanctioned trails while maintaining sundew habitat,
the completion of future monitoring using similar techniques to assess the disappearing bog.
Today these sections of the bog are still intact, but at risk of disappearing due to the influx of small trees and other terrestrial plants such as salal. Round-leaved sundew, Labrador tea and sphagnum moss are still present, but salal and
77
western hemlock are becoming the dominant species. Future enhancement efforts should include the removal of some of the western hemlock trees as well as salal to prevent the bog from turning into a forested habitat. In August 2009, three small test patches were created in the bog to see if sundew growth would increase with the removal of competing salal and Labrador tea. A few growing seasons will be needed before results of this test can be seen. The small trails that run through the bog are only occasionally used (presumably by local photographers), and no interpretation efforts around the bog have been pursued to date.
3.3.2 Watercourses
Several permanent and ephemeral streams are found throughout the Park. All of the watercourses have been altered, culverted or created by human intervention. A Capilano College student project conducted in 1998 looked at the effect of trails on Beaver Creek and North Creek. Water quality sampling results showed that Beaver Creek had an average pH of 6.18 (slightly lower than North Creek at 6.93), an average water temperature of 13.1 °C (significantly higher than 8.6 °C for North Creek), and a dissolved oxygen content of 14.15 ppm (significantly lower than 16.9 ppm in North Creek) (Benitah et al. 1998). The macroinvertebrates were found to be nine times more abundant in Beaver Creek than in North Creek, but both creeks were similar in the diversity of species. After rating both the instream and riparian habitat, both creeks were found to be dominated by ‗average‘ habitat quality, but Beaver Creek had more ‗poor‘ habitat while North Creek had more ‗excellent‘ habitat. Overall, the water chemistry for North Creek was slightly better than Beaver Creek for aquatic life, and would likely retain an excellent quality rating throughout the year. Beaver Creek would likely decrease in quality in the summer months due to higher water temperature and related decrease in dissolved oxygen (Benitah et al. 1998). This study concluded that both streams were negatively affected by the trails adjacent to them due to off-trail human use which causes sedimentation, soil compaction and decreased riparian vegetation cover.
3.3.2.1 North Creek
North Creek originates from a domestic water supply near the Prospect Point picnic area and discharges a flow of approximately 0.184 m3/s 600 m downstream into Beaver Lake (Zimmermann, 1999). Originally the headwaters of this creek were located farther north, and the old creek bed can be seen near the Park Board works yard (Coast River, 1995). The small, cool creek would be almost natural except for the municipal water supply which prevents seasonal flow variation and adds chlorine to the water. The temperature of the water remains at approximately 12 °C and the chlorine concentration gradient away from the source has never been determined; however, its odour is evident at the Causeway culvert crossing (Kerr et al., 1999). Although salmonids have likely inhabited North Creek since before World War I, they were definitely provided access to the system when the fish hatchery was constructed at Beaver Lake in 1916 (Steele, 1988). The first formal fish surveys were undertaken in North Creek by Hatfield Consultants in 1985. After sampling 85.8 m2 of the stream they found 38 cutthroat trout at a density of 0.45 fish/m2. Further studies conducted 10 years later found that there were still resident trout in the stream as well as the recently introduced coho salmon (Oncorhynchus kisutch) (Coast River, 1995). These fish were considered a ‗geographically isolated‘ population because of the barrier to upstream migration from Beaver Creek, and the fry were observed at a distance of 250 m upstream of Beaver Lake (Coast River, 1995). The surveyors did not expect fish to go any higher upstream because of physical barriers or possibly due to chlorine concentrations in the creek. They also reported (but could not confirm) that
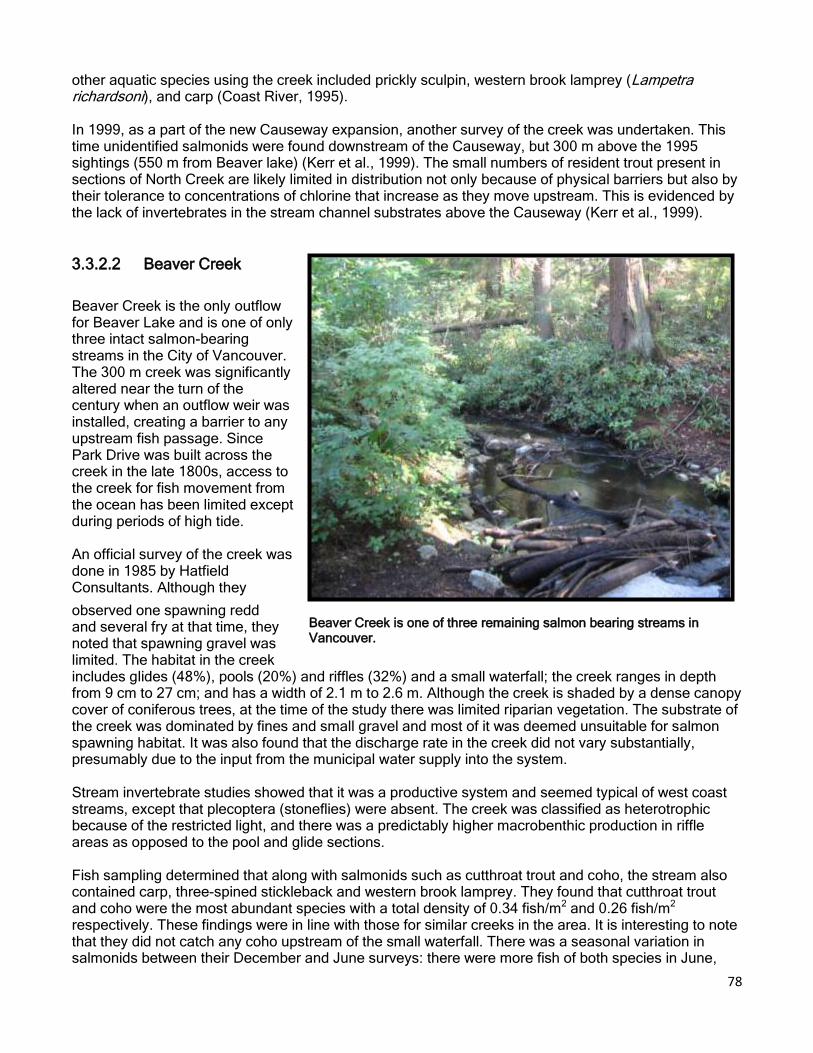
78
Beaver Creek is one of three remaining salmon bearing streams in Vancouver.
other aquatic species using the creek included prickly sculpin, western brook lamprey (Lampetra richardsoni), and carp (Coast River, 1995). In 1999, as a part of the new Causeway expansion, another survey of the creek was undertaken. This time unidentified salmonids were found downstream of the Causeway, but 300 m above the 1995 sightings (550 m from Beaver lake) (Kerr et al., 1999). The small numbers of resident trout present in sections of North Creek are likely limited in distribution not only because of physical barriers but also by their tolerance to concentrations of chlorine that increase as they move upstream. This is evidenced by the lack of invertebrates in the stream channel substrates above the Causeway (Kerr et al., 1999).
3.3.2.2 Beaver Creek
Beaver Creek is the only outflow for Beaver Lake and is one of only three intact salmon-bearing streams in the City of Vancouver. The 300 m creek was significantly altered near the turn of the century when an outflow weir was installed, creating a barrier to any upstream fish passage. Since Park Drive was built across the creek in the late 1800s, access to the creek for fish movement from the ocean has been limited except during periods of high tide. An official survey of the creek was done in 1985 by Hatfield Consultants. Although they
observed one spawning redd and several fry at that time, they noted that spawning gravel was limited. The habitat in the creek includes glides (48%), pools (20%) and riffles (32%) and a small waterfall; the creek ranges in depth from 9 cm to 27 cm; and has a width of 2.1 m to 2.6 m. Although the creek is shaded by a dense canopy cover of coniferous trees, at the time of the study there was limited riparian vegetation. The substrate of the creek was dominated by fines and small gravel and most of it was deemed unsuitable for salmon spawning habitat. It was also found that the discharge rate in the creek did not vary substantially, presumably due to the input from the municipal water supply into the system. Stream invertebrate studies showed that it was a productive system and seemed typical of west coast streams, except that plecoptera (stoneflies) were absent. The creek was classified as heterotrophic because of the restricted light, and there was a predictably higher macrobenthic production in riffle areas as opposed to the pool and glide sections. Fish sampling determined that along with salmonids such as cutthroat trout and coho, the stream also contained carp, three-spined stickleback and western brook lamprey. They found that cutthroat trout and coho were the most abundant species with a total density of 0.34 fish/m2 and 0.26 fish/m2
respectively. These findings were in line with those for similar creeks in the area. It is interesting to note that they did not catch any coho upstream of the small waterfall. There was a seasonal variation in salmonids between their December and June surveys: there were more fish of both species in June,

79 This unnamed creek runs through the center of the Park and ends at the south end of Cathedral Trail.
and the presence of more coho fry indicated that spawning was likely to have occurred in the stream despite the low amounts of coho spawning habitat. Following this study, the Capilano River hatchery began releasing coho fry into Beaver Creek in 1990 and various enhancement efforts have been undertaken by other societies, including the Vancouver Salmon and Stream Society and the Salmonid Enhancement Program (Coast River, 1995). Their projects included riparian planting, streamside fencing, instream habitat complexing, and armouring of some of the banks. Along with excess sedimentation, barriers to fish passage, and low stream complexity, one of the challenges this creek faces is the channelization and compaction to the stream edge from walking trails. These trails have compacted the soil, altered drainage patterns and added sediments to the system. This creek has also recently been colonized by invasive Japanese knotweed (Polygonum cuspidatum), and if not effectively controlled it may take over as the dominant riparian and instream vegetation.
3.3.2.3 Unnamed Creeks
There is very little known about the smaller unnamed creeks in the Park. Several of these, including the ones that flow into Beaver Lake, were observed and mapped during the 2007-2008 Restoration. For the purpose of this report the creeks are called Railway Creek, South Creek, North Creek Tributary, Cathedral Creek, the Salmon Stream, and unnamed creeks in N1. Railway Creek is a small tributary that flows from a two-inch culvert running underneath Pipeline Road (Zimmerman et al., 1999). This artificial creek drains road runoff water and is likely connected to the small ponds in the miniature train area. It runs year-round, in the winter from road runoff and in the summer from an augmented water supply. This creek has been mapped and it is used by wildlife, but no fish, invertebrate or water sampling has been conducted in it to date. South Creek is a small, semi-permanent, braided stream that originates at the north end of the Park Board works yard on Pipeline Road. This small creek has been mapped, but no other surveys have been conducted in it. The water flowing from this drainage is blocked by Beaver Lake Trail and in the winter there are large pools and skunk cabbage swamps at its terminus. Since the creek runs through a patch of alder and ends in a skunk cabbage swamp, it is heavily used by wildlife. The North Creek Tributary is a small stream that joins North Creek before it drains into Beaver Lake on the west side. This stream has been described as ‗seasonal‘ and forms at the Causeway during high rainfall events (Zimmerman et al., 1999). This stream is the least disturbed and has abundant woody debris and riparian vegetation.
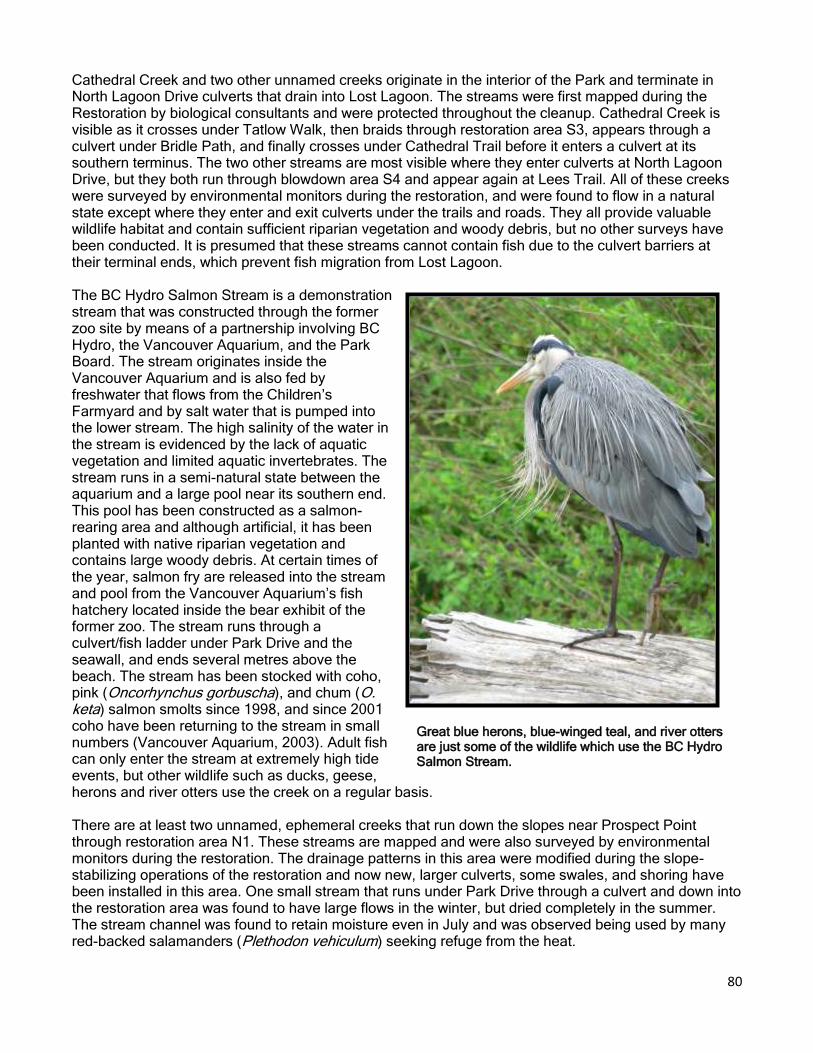
80
Great blue herons, blue-winged teal, and river otters are just some of the wildlife which use the BC Hydro Salmon Stream.
Cathedral Creek and two other unnamed creeks originate in the interior of the Park and terminate in North Lagoon Drive culverts that drain into Lost Lagoon. The streams were first mapped during the Restoration by biological consultants and were protected throughout the cleanup. Cathedral Creek is visible as it crosses under Tatlow Walk, then braids through restoration area S3, appears through a culvert under Bridle Path, and finally crosses under Cathedral Trail before it enters a culvert at its southern terminus. The two other streams are most visible where they enter culverts at North Lagoon Drive, but they both run through blowdown area S4 and appear again at Lees Trail. All of these creeks were surveyed by environmental monitors during the restoration, and were found to flow in a natural state except where they enter and exit culverts under the trails and roads. They all provide valuable wildlife habitat and contain sufficient riparian vegetation and woody debris, but no other surveys have been conducted. It is presumed that these streams cannot contain fish due to the culvert barriers at their terminal ends, which prevent fish migration from Lost Lagoon. The BC Hydro Salmon Stream is a demonstration stream that was constructed through the former zoo site by means of a partnership involving BC Hydro, the Vancouver Aquarium, and the Park Board. The stream originates inside the Vancouver Aquarium and is also fed by freshwater that flows from the Children‘s Farmyard and by salt water that is pumped into the lower stream. The high salinity of the water in the stream is evidenced by the lack of aquatic vegetation and limited aquatic invertebrates. The stream runs in a semi-natural state between the aquarium and a large pool near its southern end. This pool has been constructed as a salmon-rearing area and although artificial, it has been planted with native riparian vegetation and contains large woody debris. At certain times of the year, salmon fry are released into the stream and pool from the Vancouver Aquarium‘s fish hatchery located inside the bear exhibit of the former zoo. The stream runs through a culvert/fish ladder under Park Drive and the seawall, and ends several metres above the beach. The stream has been stocked with coho, pink (Oncorhynchus gorbuscha), and chum (O. keta) salmon smolts since 1998, and since 2001 coho have been returning to the stream in small numbers (Vancouver Aquarium, 2003). Adult fish can only enter the stream at extremely high tide events, but other wildlife such as ducks, geese, herons and river otters use the creek on a regular basis. There are at least two unnamed, ephemeral creeks that run down the slopes near Prospect Point through restoration area N1. These streams are mapped and were also surveyed by environmental monitors during the restoration. The drainage patterns in this area were modified during the slope-stabilizing operations of the restoration and now new, larger culverts, some swales, and shoring have been installed in this area. One small stream that runs under Park Drive through a culvert and down into the restoration area was found to have large flows in the winter, but dried completely in the summer. The stream channel was found to retain moisture even in July and was observed being used by many red-backed salamanders (Plethodon vehiculum) seeking refuge from the heat.
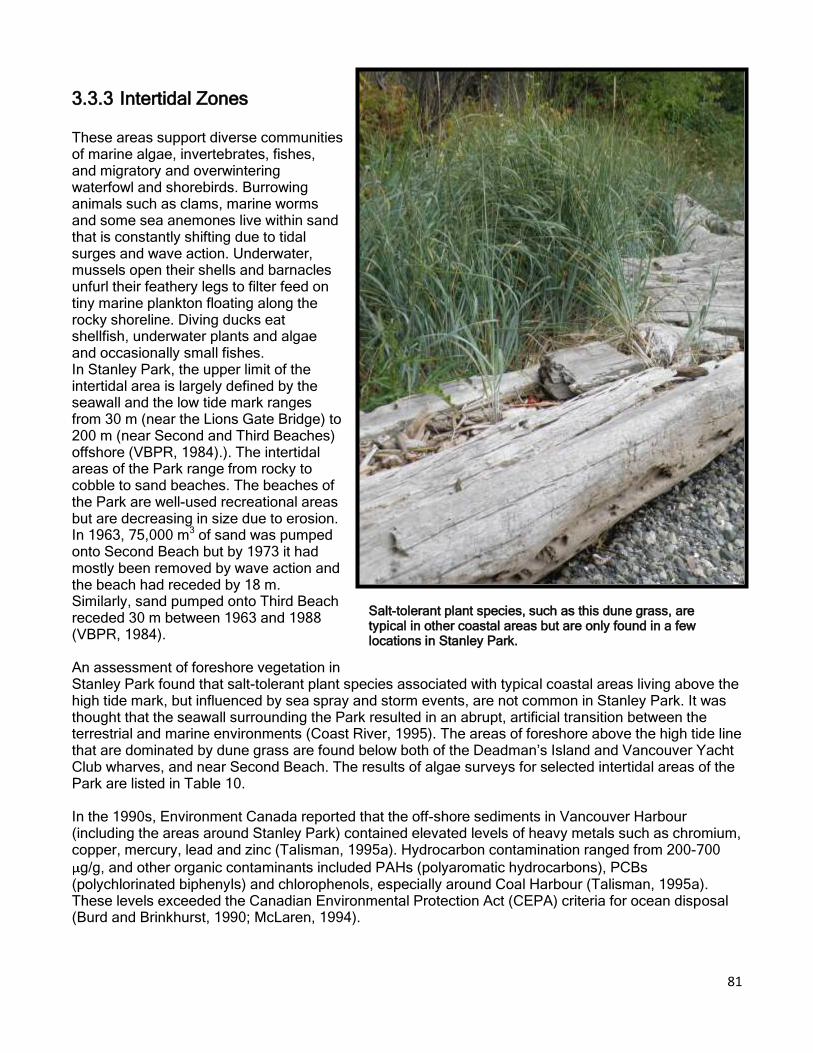
81
Salt-tolerant plant species, such as this dune grass, are typical in other coastal areas but are only found in a few locations in Stanley Park.
3.3.3 Intertidal Zones These areas support diverse communities of marine algae, invertebrates, fishes, and migratory and overwintering waterfowl and shorebirds. Burrowing animals such as clams, marine worms and some sea anemones live within sand that is constantly shifting due to tidal surges and wave action. Underwater, mussels open their shells and barnacles unfurl their feathery legs to filter feed on tiny marine plankton floating along the rocky shoreline. Diving ducks eat shellfish, underwater plants and algae and occasionally small fishes. In Stanley Park, the upper limit of the intertidal area is largely defined by the seawall and the low tide mark ranges from 30 m (near the Lions Gate Bridge) to 200 m (near Second and Third Beaches) offshore (VBPR, 1984).). The intertidal areas of the Park range from rocky to cobble to sand beaches. The beaches of the Park are well-used recreational areas but are decreasing in size due to erosion. In 1963, 75,000 m3 of sand was pumped onto Second Beach but by 1973 it had mostly been removed by wave action and the beach had receded by 18 m. Similarly, sand pumped onto Third Beach receded 30 m between 1963 and 1988 (VBPR, 1984). An assessment of foreshore vegetation in Stanley Park found that salt-tolerant plant species associated with typical coastal areas living above the high tide mark, but influenced by sea spray and storm events, are not common in Stanley Park. It was thought that the seawall surrounding the Park resulted in an abrupt, artificial transition between the terrestrial and marine environments (Coast River, 1995). The areas of foreshore above the high tide line that are dominated by dune grass are found below both of the Deadman‘s Island and Vancouver Yacht Club wharves, and near Second Beach. The results of algae surveys for selected intertidal areas of the Park are listed in Table 10. In the 1990s, Environment Canada reported that the off-shore sediments in Vancouver Harbour (including the areas around Stanley Park) contained elevated levels of heavy metals such as chromium, copper, mercury, lead and zinc (Talisman, 1995a). Hydrocarbon contamination ranged from 200-700
g/g, and other organic contaminants included PAHs (polyaromatic hydrocarbons), PCBs (polychlorinated biphenyls) and chlorophenols, especially around Coal Harbour (Talisman, 1995a). These levels exceeded the Canadian Environmental Protection Act (CEPA) criteria for ocean disposal (Burd and Brinkhurst, 1990; McLaren, 1994).
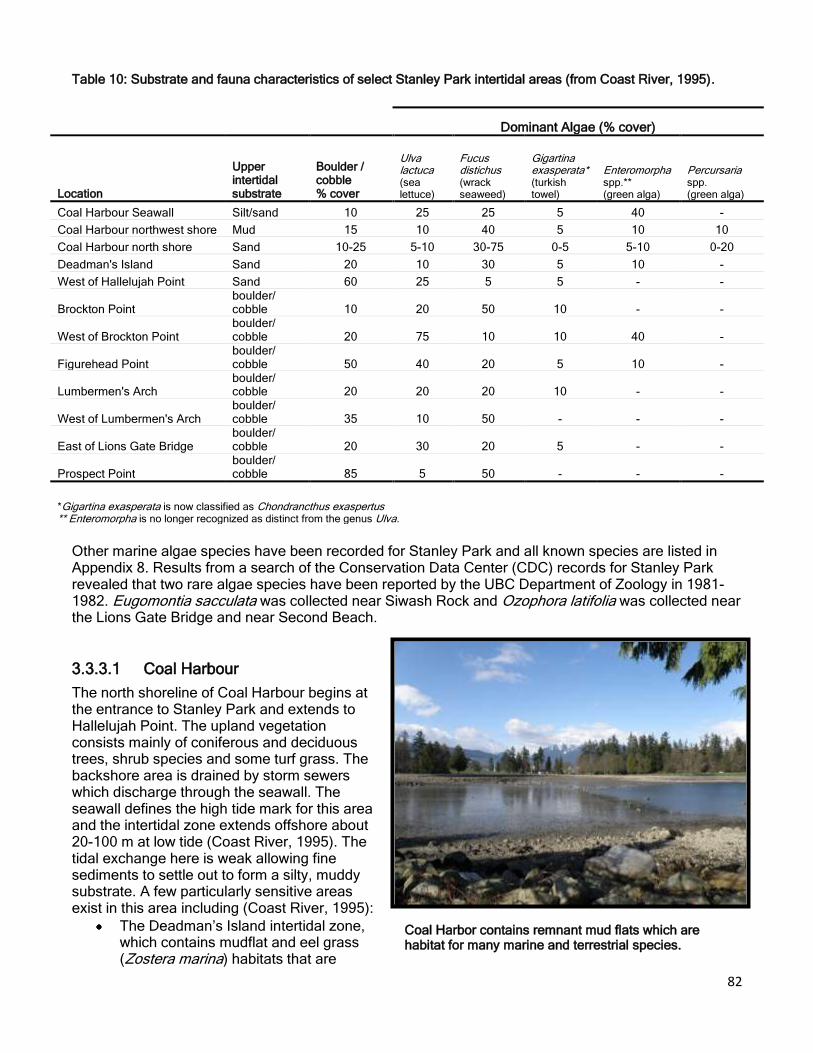
82
Coal Harbor contains remnant mud flats which are habitat for many marine and terrestrial species.
Table 10: Substrate and fauna characteristics of select Stanley Park intertidal areas (from Coast River, 1995).
Other marine algae species have been recorded for Stanley Park and all known species are listed in Appendix 8. Results from a search of the Conservation Data Center (CDC) records for Stanley Park revealed that two rare algae species have been reported by the UBC Department of Zoology in 1981-1982. Eugomontia sacculata was collected near Siwash Rock and Ozophora latifolia was collected near the Lions Gate Bridge and near Second Beach.
3.3.3.1 Coal Harbour
The north shoreline of Coal Harbour begins at the entrance to Stanley Park and extends to Hallelujah Point. The upland vegetation consists mainly of coniferous and deciduous trees, shrub species and some turf grass. The backshore area is drained by storm sewers which discharge through the seawall. The seawall defines the high tide mark for this area and the intertidal zone extends offshore about 20-100 m at low tide (Coast River, 1995). The tidal exchange here is weak allowing fine sediments to settle out to form a silty, muddy substrate. A few particularly sensitive areas exist in this area including (Coast River, 1995):
The Deadman‘s Island intertidal zone, which contains mudflat and eel grass (Zostera marina) habitats that are
Dominant Algae (% cover)
Location
Upper intertidal substrate
Boulder / cobble % cover
Ulva lactuca (sea lettuce)
Fucus distichus (wrack seaweed)
Gigartina exasperata* (turkish towel)
Enteromorpha spp.** (green alga)
Percursaria spp. (green alga)
Coal Harbour Seawall Silt/sand 10 25 25 5 40 -
Coal Harbour northwest shore Mud 15 10 40 5 10 10
Coal Harbour north shore Sand 10-25 5-10 30-75 0-5 5-10 0-20
Deadman's Island Sand 20 10 30 5 10 -
West of Hallelujah Point Sand 60 25 5 5 - -
Brockton Point boulder/ cobble 10 20 50 10 - -
West of Brockton Point boulder/ cobble 20 75 10 10 40 -
Figurehead Point boulder/ cobble 50 40 20 5 10 -
Lumbermen's Arch boulder/ cobble 20 20 20 10 - -
West of Lumbermen's Arch boulder/ cobble 35 10 50 - - -
East of Lions Gate Bridge boulder/ cobble 20 30 20 5 - -
Prospect Point boulder/ cobble 85 5 50 - - -
*Gigartina exasperata is now classified as Chondrancthus exaspertus ** Enteromorpha is no longer recognized as distinct from the genus Ulva.
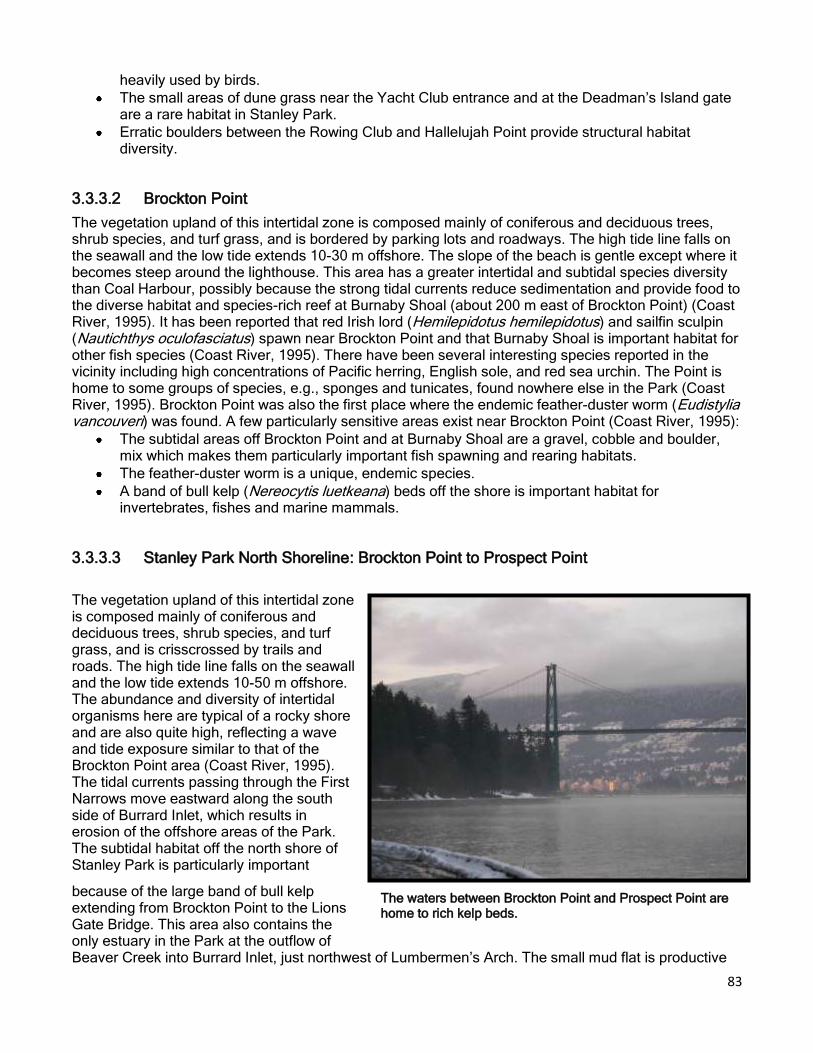
83
The waters between Brockton Point and Prospect Point are home to rich kelp beds.
heavily used by birds.
The small areas of dune grass near the Yacht Club entrance and at the Deadman‘s Island gate are a rare habitat in Stanley Park.
Erratic boulders between the Rowing Club and Hallelujah Point provide structural habitat diversity.
3.3.3.2 Brockton Point
The vegetation upland of this intertidal zone is composed mainly of coniferous and deciduous trees, shrub species, and turf grass, and is bordered by parking lots and roadways. The high tide line falls on the seawall and the low tide extends 10-30 m offshore. The slope of the beach is gentle except where it becomes steep around the lighthouse. This area has a greater intertidal and subtidal species diversity than Coal Harbour, possibly because the strong tidal currents reduce sedimentation and provide food to the diverse habitat and species-rich reef at Burnaby Shoal (about 200 m east of Brockton Point) (Coast River, 1995). It has been reported that red Irish lord (Hemilepidotus hemilepidotus) and sailfin sculpin (Nautichthys oculofasciatus) spawn near Brockton Point and that Burnaby Shoal is important habitat for other fish species (Coast River, 1995). There have been several interesting species reported in the vicinity including high concentrations of Pacific herring, English sole, and red sea urchin. The Point is home to some groups of species, e.g., sponges and tunicates, found nowhere else in the Park (Coast River, 1995). Brockton Point was also the first place where the endemic feather-duster worm (Eudistylia vancouveri) was found. A few particularly sensitive areas exist near Brockton Point (Coast River, 1995):
The subtidal areas off Brockton Point and at Burnaby Shoal are a gravel, cobble and boulder, mix which makes them particularly important fish spawning and rearing habitats.
The feather-duster worm is a unique, endemic species.
A band of bull kelp (Nereocytis luetkeana) beds off the shore is important habitat for invertebrates, fishes and marine mammals.
3.3.3.3 Stanley Park North Shoreline: Brockton Point to Prospect Point
The vegetation upland of this intertidal zone is composed mainly of coniferous and deciduous trees, shrub species, and turf grass, and is crisscrossed by trails and roads. The high tide line falls on the seawall and the low tide extends 10-50 m offshore. The abundance and diversity of intertidal organisms here are typical of a rocky shore and are also quite high, reflecting a wave and tide exposure similar to that of the Brockton Point area (Coast River, 1995). The tidal currents passing through the First Narrows move eastward along the south side of Burrard Inlet, which results in erosion of the offshore areas of the Park. The subtidal habitat off the north shore of Stanley Park is particularly important
because of the large band of bull kelp extending from Brockton Point to the Lions Gate Bridge. This area also contains the only estuary in the Park at the outflow of Beaver Creek into Burrard Inlet, just northwest of Lumbermen‘s Arch. The small mud flat is productive
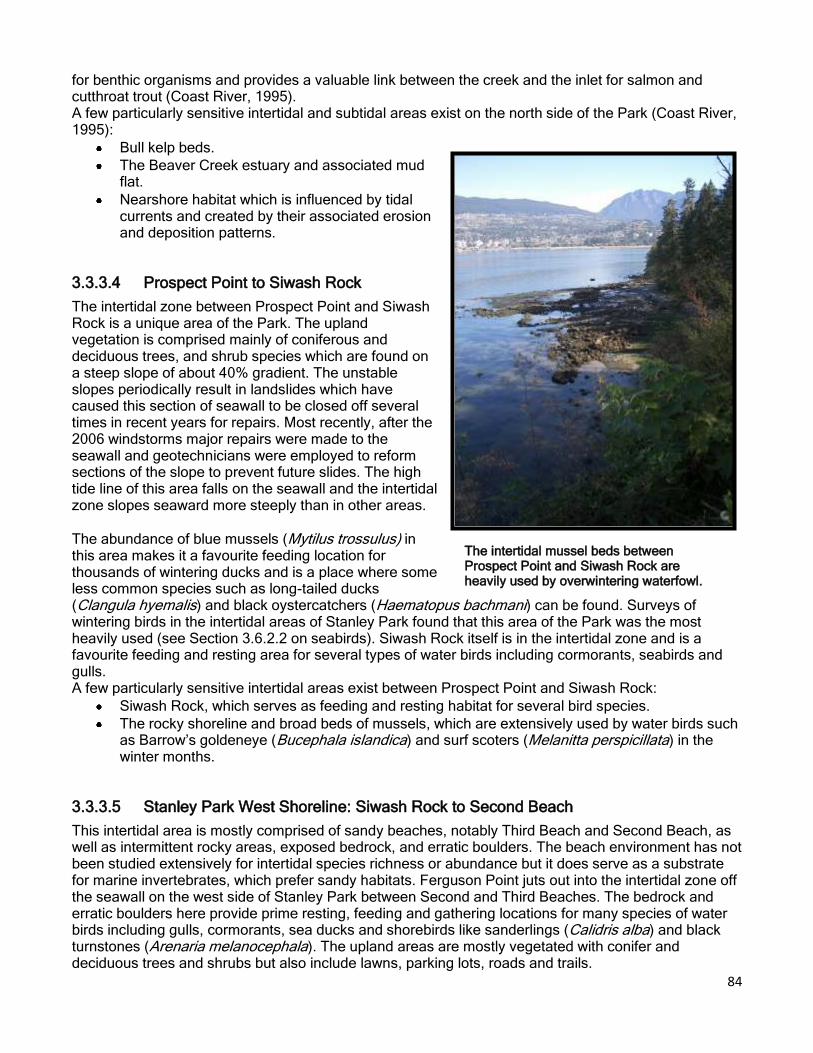
84
The intertidal mussel beds between Prospect Point and Siwash Rock are heavily used by overwintering waterfowl.
for benthic organisms and provides a valuable link between the creek and the inlet for salmon and cutthroat trout (Coast River, 1995). A few particularly sensitive intertidal and subtidal areas exist on the north side of the Park (Coast River, 1995):
Bull kelp beds.
The Beaver Creek estuary and associated mud flat.
Nearshore habitat which is influenced by tidal currents and created by their associated erosion and deposition patterns.
3.3.3.4 Prospect Point to Siwash Rock
The intertidal zone between Prospect Point and Siwash Rock is a unique area of the Park. The upland vegetation is comprised mainly of coniferous and deciduous trees, and shrub species which are found on a steep slope of about 40% gradient. The unstable slopes periodically result in landslides which have caused this section of seawall to be closed off several times in recent years for repairs. Most recently, after the 2006 windstorms major repairs were made to the seawall and geotechnicians were employed to reform sections of the slope to prevent future slides. The high tide line of this area falls on the seawall and the intertidal zone slopes seaward more steeply than in other areas. The abundance of blue mussels (Mytilus trossulus) in this area makes it a favourite feeding location for thousands of wintering ducks and is a place where some less common species such as long-tailed ducks (Clangula hyemalis) and black oystercatchers (Haematopus bachmani) can be found. Surveys of wintering birds in the intertidal areas of Stanley Park found that this area of the Park was the most heavily used (see Section 3.6.2.2 on seabirds). Siwash Rock itself is in the intertidal zone and is a favourite feeding and resting area for several types of water birds including cormorants, seabirds and gulls. A few particularly sensitive intertidal areas exist between Prospect Point and Siwash Rock:
Siwash Rock, which serves as feeding and resting habitat for several bird species.
The rocky shoreline and broad beds of mussels, which are extensively used by water birds such as Barrow‘s goldeneye (Bucephala islandica) and surf scoters (Melanitta perspicillata) in the winter months.
3.3.3.5 Stanley Park West Shoreline: Siwash Rock to Second Beach
This intertidal area is mostly comprised of sandy beaches, notably Third Beach and Second Beach, as well as intermittent rocky areas, exposed bedrock, and erratic boulders. The beach environment has not been studied extensively for intertidal species richness or abundance but it does serve as a substrate for marine invertebrates, which prefer sandy habitats. Ferguson Point juts out into the intertidal zone off the seawall on the west side of Stanley Park between Second and Third Beaches. The bedrock and erratic boulders here provide prime resting, feeding and gathering locations for many species of water birds including gulls, cormorants, sea ducks and shorebirds like sanderlings (Calidris alba) and black turnstones (Arenaria melanocephala). The upland areas are mostly vegetated with conifer and deciduous trees and shrubs but also include lawns, parking lots, roads and trails.

85
The rocky and sandy shores between Siwash Rock and Second Beach are frequented by shorebirds such as these black oystercatchers. (Photo by Peter Woods)
A few of the particularly sensitive intertidal areas between Siwash Rock and Second Beach include:
Small areas of upland dune grass habitat which are rare in Stanley Park.
Erratic boulders which provide habitat complexity and serve as roosting sites for birds.
The rocky areas of the shoreline used by water birds such as Barrow‘s goldeneye and surf scoters in the winter months.
3.3.3.6 South of Second Beach
The area south of Second Beach is mainly composed of rocks and cobbles and provides excellent winter foraging areas for seabirds such as ducks, cormorants, and great blue herons. The upland habitat is highly developed and is composed predominantly of lawns and roads with some trees. The intertidal areas are not very large and they are regularly occupied by walkers, swimmers and dogs. The most sensitive intertidal areas here are
the rocky shoreline and mussel beds. Competition for access to the intertidal zone between wildlife and Park visitors is most apparent in winter when herons, cormorants, surf scoters and Barrow‘s goldeneye rely heavily on the mussel beds in this area. A complete survey of intertidal organisms was completed in 1995 during the Lions Gate Crossing Options assessment and all species documented are included in the species list in Appendix 9. Section 3.6.6.3 has more information on marine invertebrates.

86
Some wildlife species, such as this yellow-bellied marmot, end up in Stanley Park as released unwanted pets, or as hitchhikers underneath vehicles from other areas of the Province (Photo by Mark T. White).
In summer, seal pups can commonly be seen around Stanley Park (Photo by Peter Kerr).
3.4 Native Wildlife Stanley Park is home to a diversity of wildlife from many different taxonomic groups: mammals, birds, reptiles, amphibians, fish and invertebrates. Complete inventories of all invertebrate and vertebrate wildlife species known to occur in the Park are provided in Appendices 9 and 10 respectively. The Park has a long history of being a place where people can come to be close to nature and see wildlife in its natural environment. Many of the wildlife species are habituated to human presence and co-exist well with the multitudes of visitors that come each year. Over the years the
wildlife composition has changed and although it was not always documented, it has been noticed by Vancouver residents and Park staff. The most noticeable difference between the Park and more wild areas is the complete absence of large mammals. Deer, elk, bears, wolves, cougars, and bobcats were all once residents of the Vancouver area until it began to grow as a city. More recently, the disappearance of smaller animals such as native frogs and toads has been documented and it is likely that others have disappeared unnoticed. Long-term monitoring programs have never been carried out in the Park for most species and so wildlife information has been gathered by SPES over the past several years to try and document the current status of the Park‘s animals. Some wildlife studies were first undertaken in 2007 during the Restoration and now long-term monitoring has begun for several groups of interest.
3.4.1 Mammals Mammals can be characterized as warm-blooded vertebrates that produce milk to feed their young and have hair or fur on their bodies at some point in their life. Large mammals may have been absent from Stanley Park since its creation in 1888. Aside from zoo attractions, black bear, grey wolf, cougar, bobcat, and elk have not been resident for over 100 years. The last large predator that roamed the Park may have been a cougar which was shot in October 1911 (Vancouver Daily Province, 1911b). The Province newspaper reported that the 137-pound animal killed several captive deer and goats before it was tracked and killed. The same reports originally blamed a black
bear, which had been seen swimming from the North Shore to the Park weeks earlier,
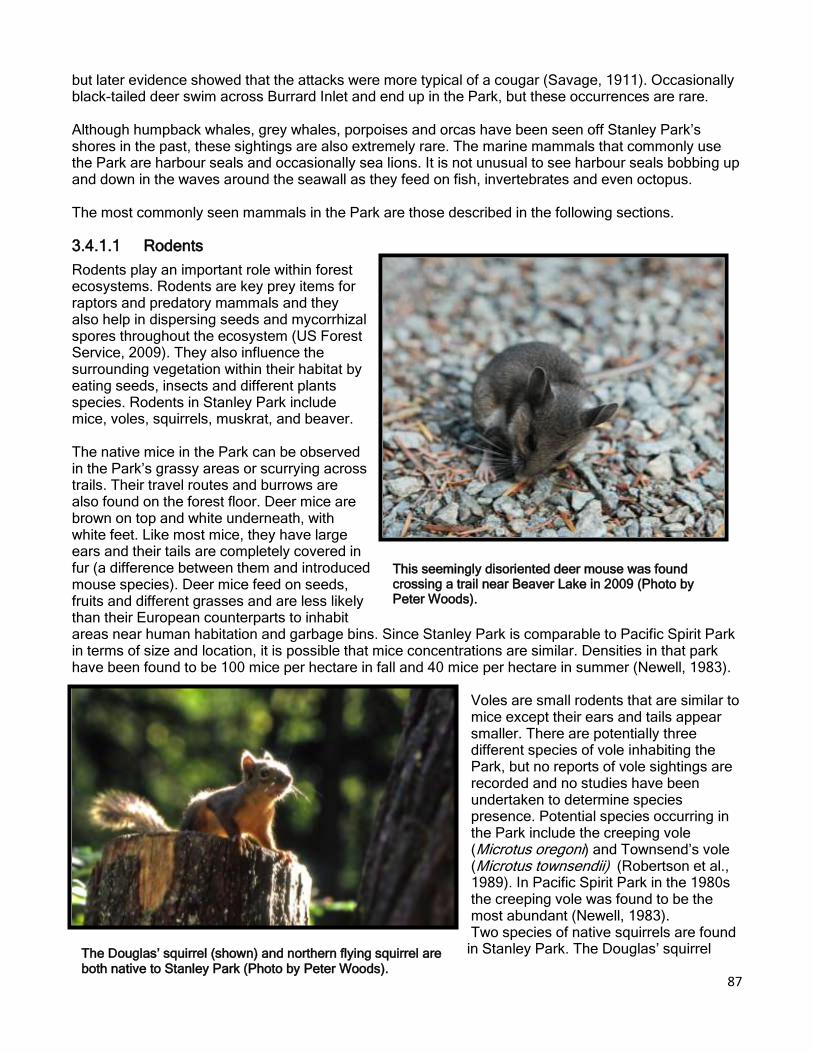
87
This seemingly disoriented deer mouse was found crossing a trail near Beaver Lake in 2009 (Photo by Peter Woods).
The Douglas‘ squirrel (shown) and northern flying squirrel are both native to Stanley Park (Photo by Peter Woods).
but later evidence showed that the attacks were more typical of a cougar (Savage, 1911). Occasionally black-tailed deer swim across Burrard Inlet and end up in the Park, but these occurrences are rare. Although humpback whales, grey whales, porpoises and orcas have been seen off Stanley Park‘s shores in the past, these sightings are also extremely rare. The marine mammals that commonly use the Park are harbour seals and occasionally sea lions. It is not unusual to see harbour seals bobbing up and down in the waves around the seawall as they feed on fish, invertebrates and even octopus. The most commonly seen mammals in the Park are those described in the following sections.
3.4.1.1 Rodents
Rodents play an important role within forest ecosystems. Rodents are key prey items for raptors and predatory mammals and they also help in dispersing seeds and mycorrhizal spores throughout the ecosystem (US Forest Service, 2009). They also influence the surrounding vegetation within their habitat by eating seeds, insects and different plants species. Rodents in Stanley Park include mice, voles, squirrels, muskrat, and beaver. The native mice in the Park can be observed in the Park‘s grassy areas or scurrying across trails. Their travel routes and burrows are also found on the forest floor. Deer mice are brown on top and white underneath, with white feet. Like most mice, they have large ears and their tails are completely covered in fur (a difference between them and introduced mouse species). Deer mice feed on seeds, fruits and different grasses and are less likely than their European counterparts to inhabit areas near human habitation and garbage bins. Since Stanley Park is comparable to Pacific Spirit Park in terms of size and location, it is possible that mice concentrations are similar. Densities in that park have been found to be 100 mice per hectare in fall and 40 mice per hectare in summer (Newell, 1983).
Voles are small rodents that are similar to mice except their ears and tails appear smaller. There are potentially three different species of vole inhabiting the Park, but no reports of vole sightings are recorded and no studies have been undertaken to determine species presence. Potential species occurring in the Park include the creeping vole (Microtus oregoni) and Townsend‘s vole (Microtus townsendii) (Robertson et al., 1989). In Pacific Spirit Park in the 1980s the creeping vole was found to be the most abundant (Newell, 1983). Two species of native squirrels are found
in Stanley Park. The Douglas‘ squirrel

88
Pacific Water Shrew (Sorex bendirii)
Range: The Lower Mainland of BC (BC MOE,
1995)
Identification: Largest shrew in BC; average
about 15 cm long , including tail which is
almost ½ of length; tiny eyes; sharp teeth; fur blackish brown to black; prominent whiskers on
snout, side glands produce musky odour.
Biology: Females produce at least one litter of
four to six young between March and June.
Researchers know little else about the shrew's breeding habits. Its diet consists largely of
earthworms, sowbugs, spiders, centipedes,
termites, snails and slugs. About 25 % of the species' diet comes from aquatic sources.
Habitat Requirements: Riparian habitat specialist; associated with wet forests, marshes,
and areas adjacent to water (usually
streams/springs); generally in areas of
coniferous or mixed forest with downed logs;
Distribution: Occur along Pacific Coast from northern California to southern BC where they
are only found in the lower Fraser Valley.
Threats: Habitat loss and fragmentation; poor
water quality; domestic house cats.
(Tamiasciurus douglasii) is easily observed throughout the Park, especially around the Seven Sisters site and near Beaver Lake. These reddish-brown squirrels are usually about 30 cm in length including the tail, with white fur on their undersides. They tend to be more active in the more heavily forested parts of the Park where greater concentrations of Douglas-fir and other evergreen seeds and cones can be gathered. They eat mushrooms and berries as part of their diet and tend to nest in tree cavities or at the tops of evergreens. The northern flying squirrel is also present in the Park. These squirrels have a fold of skin called a ―patagium‖ that connects their front and rear legs and enables them to glide from tree to tree or to the forest floor. They are found in the densely forested portions of the Park, where they nest in tree cavities or tops. Forestry workers have reported seeing the squirrels exiting tree cavities during routine work (Mike Mackintosh, pers. comm.) and the most recent sighting was in 2008 when a biologist consultant saw one during forest Restoration activities (Mike Coulthard, pers. Comm.). The squirrel was observed exiting a tree cavity in a large old-growth cedar tree that was being climbed by a faller near the Seven Sisters site in blowdown area S3. Muskrat (Ondatra zibethicus) are seldom seen in the Park, but they have been noted near Beaver Lake in past years. These brown-haired, cat-sized creatures feed mainly on aquatic plants but also eat invertebrates, small fish and frogs they find along pond or lake shorelines. The largest rodent in the Park is the beaver. It is described further in Section 3.6.7.2. To date there have been no small mammal trapping surveys conducted in the Park and no attempt has been made to study or inventory the rodent species except for studies of grey squirrels (see Section 3.9.1.4 Introduced Animal Species).
3.4.1.2 Shrews and Moles
The insectivorous shrews and moles are perhaps the least understood or documented animals in the Park. They have been described in previous park reports as likely occurring in similar composition and density as has been found in nearby Pacific Spirit Park (Robertson et al., 1989), but there have been no inventories or trapping surveys to date in Stanley Park itself. It is thought that Stanley Park is home to three shrew species and two mole species. The coast mole (Scapanus orarius) is a relatively common species in the Lower Mainland and feeds primarily on earthworms. They inhabit agricultural or grassy areas and riparian habitat, but can also live in forested areas. Evidence of coast mole activity is apparent in the lawn and garden areas of the Park, and a local photographer has captured an image of this animals being eaten by resident barred owls (Mark White, pers. comm). Although they are seldom seen, it appears (from mounds of dirt seen on the grass) that coast mole populations are healthy in the Park. A dead mole was found near the Hollow Tree (Robertson, et al., 1989) and in 2008 a live mole was found on a road near the Vancouver Aquarium. No shrew moles (Neurotrichus gibbsii) have been documented in the Park to date. Shrews are small insectivorous mammals with long noses and small ears and eyes. They have sharp teeth for catching and eating prey and some use echolocation for navigation. During Dr. John McLean‘s insect trapping surveys in the Park, he reported capturing several dusky and wandering shrews, both
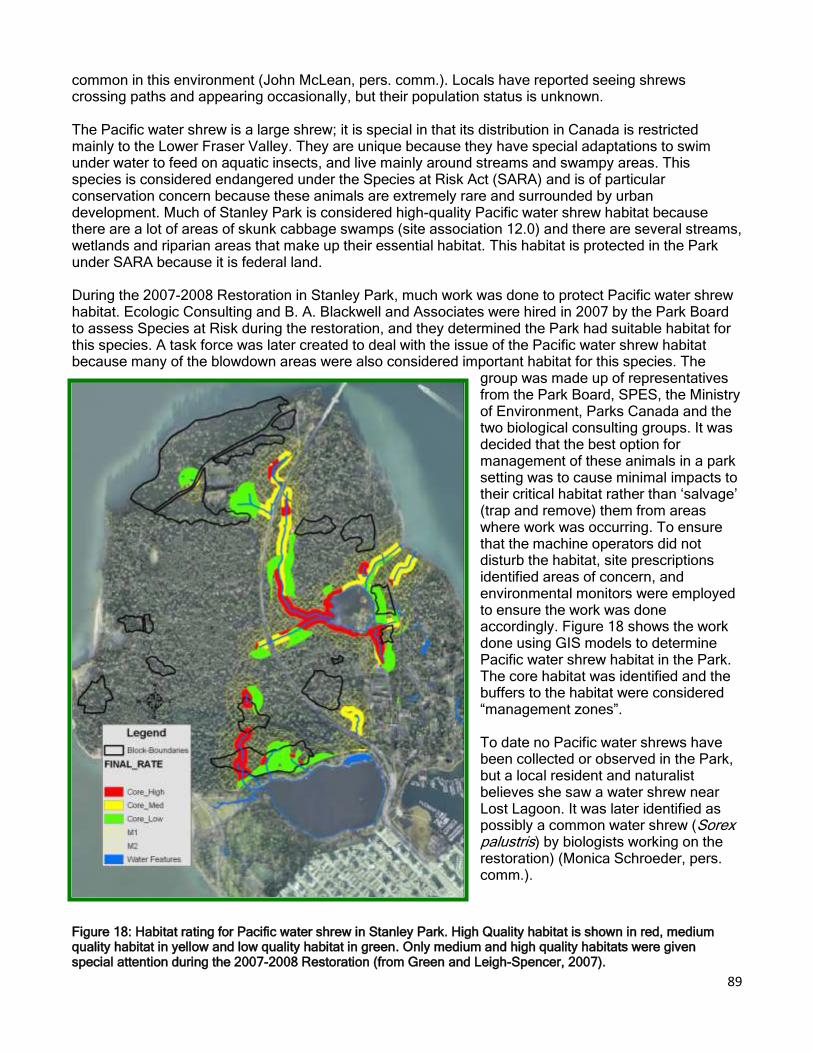
89
common in this environment (John McLean, pers. comm.). Locals have reported seeing shrews crossing paths and appearing occasionally, but their population status is unknown. The Pacific water shrew is a large shrew; it is special in that its distribution in Canada is restricted mainly to the Lower Fraser Valley. They are unique because they have special adaptations to swim under water to feed on aquatic insects, and live mainly around streams and swampy areas. This species is considered endangered under the Species at Risk Act (SARA) and is of particular conservation concern because these animals are extremely rare and surrounded by urban development. Much of Stanley Park is considered high-quality Pacific water shrew habitat because there are a lot of areas of skunk cabbage swamps (site association 12.0) and there are several streams, wetlands and riparian areas that make up their essential habitat. This habitat is protected in the Park under SARA because it is federal land. During the 2007-2008 Restoration in Stanley Park, much work was done to protect Pacific water shrew habitat. Ecologic Consulting and B. A. Blackwell and Associates were hired in 2007 by the Park Board to assess Species at Risk during the restoration, and they determined the Park had suitable habitat for this species. A task force was later created to deal with the issue of the Pacific water shrew habitat because many of the blowdown areas were also considered important habitat for this species. The
group was made up of representatives from the Park Board, SPES, the Ministry of Environment, Parks Canada and the two biological consulting groups. It was decided that the best option for management of these animals in a park setting was to cause minimal impacts to their critical habitat rather than ‗salvage‘ (trap and remove) them from areas where work was occurring. To ensure that the machine operators did not disturb the habitat, site prescriptions identified areas of concern, and environmental monitors were employed to ensure the work was done accordingly. Figure 18 shows the work done using GIS models to determine Pacific water shrew habitat in the Park. The core habitat was identified and the buffers to the habitat were considered ―management zones‖. To date no Pacific water shrews have been collected or observed in the Park, but a local resident and naturalist believes she saw a water shrew near Lost Lagoon. It was later identified as possibly a common water shrew (Sorex palustris) by biologists working on the restoration) (Monica Schroeder, pers. comm.).
Figure 18: Habitat rating for Pacific water shrew in Stanley Park. High Quality habitat is shown in red, medium quality habitat in yellow and low quality habitat in green. Only medium and high quality habitats were given special attention during the 2007-2008 Restoration (from Green and Leigh-Spencer, 2007).

90
River otters are commonly seen around the Park, most often in Coal Harbour and Lost Lagoon (Photo by Mark T. White.).
3.4.1.3 Mustelids (weasels, mink, otter, and marten)
Mustelids are a group of animals that include weasels, mink, otter, marten, and ermine in BC. These animals are all carnivores and most prey on rodents and other small animals. Lost Lagoon is frequently visited by river otters (Lutra canadensis), which tend to appear in higher concentrations and frequency in the spring months when they come to feed on carp. Larger otters can weigh 8-12 kg and are a favourite of Park visitors because of their seemingly playful activities. Otters depend on aquatic habitats for most of their fish, crustacean or shellfish-based diet, but they are considered land animals and live in dens. In Stanley Park, den sites have been observed near the outlet of Beaver Creek, and another group lives near the Vancouver Yacht Club; a third family commonly appears around Ferguson Point where they are seen feeding along the shoreline. Otters have made a comeback in recent years, as they were once much less common (Mike Mackintosh, pers. comm.). Otters can be seen using the Park‘s streams as traveling routes and have been observed running up the artificial salmon stream (near the aquarium) into the miniature train ponds, as well as up Beaver Creek to feed on fish and ducklings. Photographers have often captured images of them using the culvert between Lost Lagoon and Coal Harbour. American Mink (Mustela vison) are much smaller than otters, weighing less than 2 kg and reaching slightly more than half of a metre in length. Like otters, they prefer seashores, streams, and wetland habitats to catch fish, amphibians, and crabs. They also eat small mammals and intertidal creatures. Mink can be recognized by their long, sleek bodies, dark coats, and distinct white chin patch. They have been seen at Beaver Lake, Lost Lagoon and along the
Park shorelines. A mink family was spotted near the Prospect Point Café in 2004 and an individual animal was seen at Lost Lagoon in the winter of 2009. Although other mustelids such as the short- and long-tailed weasels may exist undetected in the Park, the only other species seen recently has been a lone American marten (Martes Americana) observed by local naturalists between 2007 and 2009. No studies have been undertaken to inventory mustelids in the Park.
3.4.1.4 Raccoons and Skunks
Raccoons (Procyon lotor) are among Stanley Park‘s most notable large mammal and are common around any water source or picnic area. They are both hunters and scavengers, and feed on small rodents, fish, shellfish, eggs, fruit, and handouts from people. The raccoon population in the Park has appeared to fluctuate over the years. These intelligent animals have learned that people are a consistent food source and have become adept at getting handouts from Park visitors. Their ‗cute‘ appearance often fools tourists into providing treats, which commonly consist of bread, popcorn, and ice cream. Unfortunately these encounters often result in bites, which have been reported on a regular basis especially around Prospect Point and Lost Lagoon. Raccoons also suffer from regular encounters with off-leash dogs, which can result in injury to the raccoon, and/or the spread of disease.

91
Striped skunks are a common sight in Stanley Park after dark (Photo by Mark T. White).
In 1998, canine distemper spread through the population, causing their numbers to decline (Mike Mackintosh, pers. comm.). The rapid spread of this disease in raccoons was said to be exacerbated by their close proximity to each other when people feed them, as most of the diseased animals were found in common ‘feeding‘ areas. On any given morning 8 to 10 raccoons can be seen being fed by a man
who has been coming to the Lagoon for years, and on several occasions up to 20 raccoons have been seen feeding together when ‗serial feeders‘ bring them large amounts of food (usually dog or cat kibbles, but also eggs, hotdogs and bread). Necropsies of deceased animals have shown that they also suffer from nutritional deficiencies and other ailments as a result of their high-calorie diets (Ziggy Jones, pers. comm.). In June 2004, the Park Board began the ―Prospect Point Raccoon Patrol‖ in response to a potential rabies outbreak in the Park. Wildlife technicians spent weeknights and weekends at Prospect Point trying to deter people from feeding raccoons
and raccoons from approaching people for food. Every year a handful of people are bitten while feeding or petting raccoons at Prospect Point but
16 people were bitten that June. The method used to deter the raccoons included spraying them with a vinegar and water solution. The program was successful at first, but the raccoons eventually figured out ways to avoid the spraying. The raccoon problem at Prospect Point has diminished since the new road and parking lot were created in 2008 but it is likely the raccoons will come back if they continue to be fed by humans. Necropsies conducted in 2009 found that at least eight raccoons tested positive for feline parvovirus, confirming that it is present in the population, but no major population declines have yet been observed (Ziggy Jones, pers. comm.). The striped skunk (Mephitis mephitis) is best known for its defense — its smelly spray. Skunks are usually quite reluctant to use their defense and only spray when imminently threatened, such as when they are being chased by predators or dogs. Skunks inhabit the forest and wetland areas of the Park where they feed on grubs, worms, fruit or edible vegetation. Historically, they were also commonly fed by Park visitors around Lost Lagoon, but
this has been less common in recent years. Between May and July 2004, four skunks tested positive for the rabies virus near Lost Lagoon. The skunks were believed to have gotten the virus from bats in Stanley Park; a small percentage of bats carry the rabies virus and these skunks could have contracted it through eating or coming into contact with an infected bat.The western spotted skunk (Spilogale gracilis) used to be common in the Park but has not been seen for many years.
Raccoons are no longer nocturnal in Stanley Park due to human supplemental feeding problems.
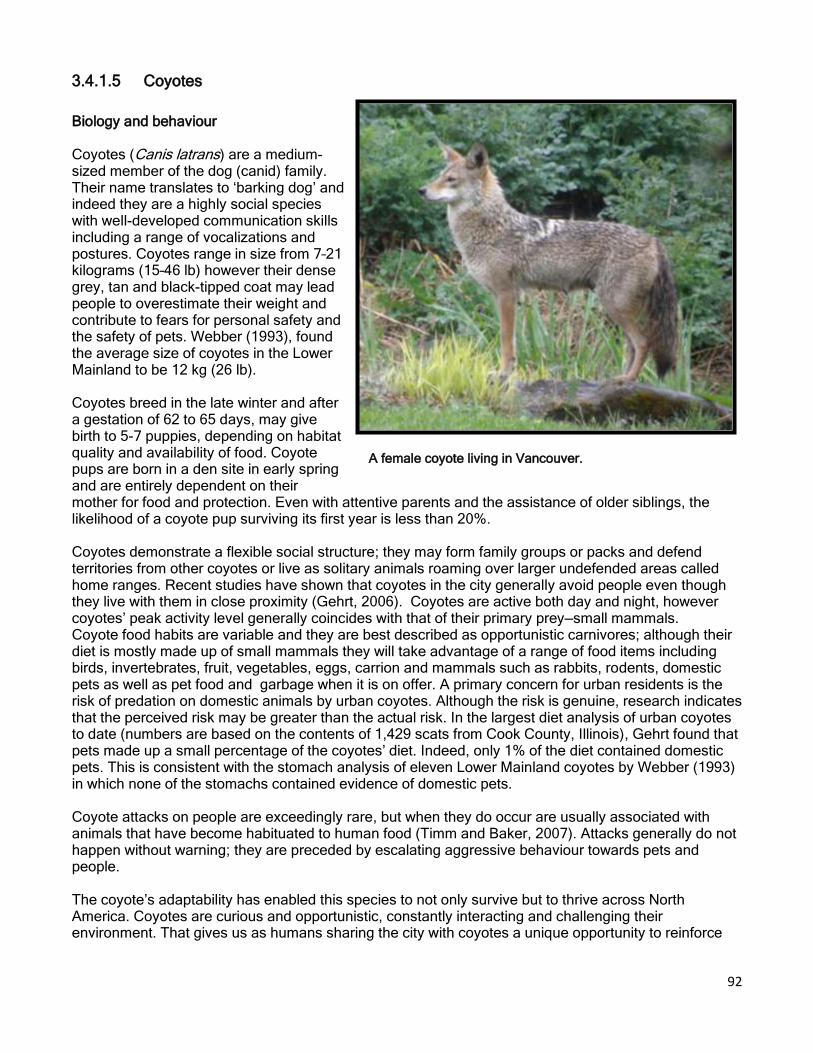
92
A female coyote living in Vancouver.
3.4.1.5 Coyotes
Biology and behaviour Coyotes (Canis latrans) are a medium-sized member of the dog (canid) family. Their name translates to ‗barking dog‘ and indeed they are a highly social species with well-developed communication skills including a range of vocalizations and postures. Coyotes range in size from 7–21 kilograms (15–46 lb) however their dense grey, tan and black-tipped coat may lead people to overestimate their weight and contribute to fears for personal safety and the safety of pets. Webber (1993), found the average size of coyotes in the Lower Mainland to be 12 kg (26 lb). Coyotes breed in the late winter and after a gestation of 62 to 65 days, may give birth to 5-7 puppies, depending on habitat quality and availability of food. Coyote pups are born in a den site in early spring and are entirely dependent on their mother for food and protection. Even with attentive parents and the assistance of older siblings, the likelihood of a coyote pup surviving its first year is less than 20%. Coyotes demonstrate a flexible social structure; they may form family groups or packs and defend territories from other coyotes or live as solitary animals roaming over larger undefended areas called home ranges. Recent studies have shown that coyotes in the city generally avoid people even though they live with them in close proximity (Gehrt, 2006). Coyotes are active both day and night, however coyotes‘ peak activity level generally coincides with that of their primary prey—small mammals. Coyote food habits are variable and they are best described as opportunistic carnivores; although their diet is mostly made up of small mammals they will take advantage of a range of food items including birds, invertebrates, fruit, vegetables, eggs, carrion and mammals such as rabbits, rodents, domestic pets as well as pet food and garbage when it is on offer. A primary concern for urban residents is the risk of predation on domestic animals by urban coyotes. Although the risk is genuine, research indicates that the perceived risk may be greater than the actual risk. In the largest diet analysis of urban coyotes to date (numbers are based on the contents of 1,429 scats from Cook County, Illinois), Gehrt found that pets made up a small percentage of the coyotes‘ diet. Indeed, only 1% of the diet contained domestic pets. This is consistent with the stomach analysis of eleven Lower Mainland coyotes by Webber (1993) in which none of the stomachs contained evidence of domestic pets. Coyote attacks on people are exceedingly rare, but when they do occur are usually associated with animals that have become habituated to human food (Timm and Baker, 2007). Attacks generally do not happen without warning; they are preceded by escalating aggressive behaviour towards pets and people. The coyote‘s adaptability has enabled this species to not only survive but to thrive across North America. Coyotes are curious and opportunistic, constantly interacting and challenging their environment. That gives us as humans sharing the city with coyotes a unique opportunity to reinforce

93
This coyote, photographed in 2008, was one of the first seen in the Park in many years (Photo by Peter Woods).
the coyote‘s natural aversion to people and a responsibility not to habituate coyotes through unnecessary contact or feeding. History of Coyotes in the Lower Mainland Historically coyotes were an important member of their native prairie and grassland habitat: as a top predator they assisted in controlling rodent populations. Over the past 200 years, coyotes have expanded their range to include most of North America and have become a common sight in most urban and rural areas. The role of coyotes in an urban landscape is poorly understood, however there are some indications that as a top meso-predator they may assist in controlling numbers of Canada Geese (through nest predation) and feral cats, and influence both the diversity and number of small mammal species. Coyotes first arrived in the City of Vancouver in the 1980s although they had been in the surrounding areas since the 1930s. In early 1990s, after a series of highly publicized attacks on pets by coyotes, some Vancouver citizens raised concerns about the safety of their children and pets. However when they sought assistance, it appeared that urban coyotes were a jurisdictional conundrum. The provincial government, responsible for matters pertaining to wildlife, had limited resources and techniques to deal with problem urban coyotes; agencies such as the SPCA‘s primary mandate were domestic animals, and municipal governments had a limited capacity to respond to concerns about coyotes and were hampered by the Wildlife Act which designated responsibility for coyotes to the Ministry of Environment. As a result, a research project was undertaken to look at the issue of coyotes in Greater Vancouver with the support of the provincial and municipal governments, Vancouver Park Board and in cooperation with the BCSPCA (Webber 1997). The research demonstrated a diversity of opinions about urban coyotes and highlighted a plethora of misunderstandings about their biology and habits. Recognizing the limited tools available to controlling coyotes in an urban environment, the project provided a framework for cooperation between municipal and provincial government through the development of a public information and education program. The resulting Co-existing with Coyotes program was created in 2001 to provide public education and information-sharing with the partners involved in the long-term management of urban coyotes. The approach adopted to manage urban coyotes is a sliding scale of interventions from public awareness/education and the removal of attractants, through aversive conditioning tactics, and ultimately the removal of individual nuisance coyotes by the Ministry of Environment Conservation Officers as a last resort. Status of coyotes in Stanley Park Coyotes were a common sight in the Park in the 1980s and ‗90s, but coyote sightings are now only rarely reported to the coyote hotline. In 1988 a pack of 5 to 7 coyotes was seen in the park (Robertson et al., 1989), and these group sightings continued for years afterwards, but since about 2000 infrequent
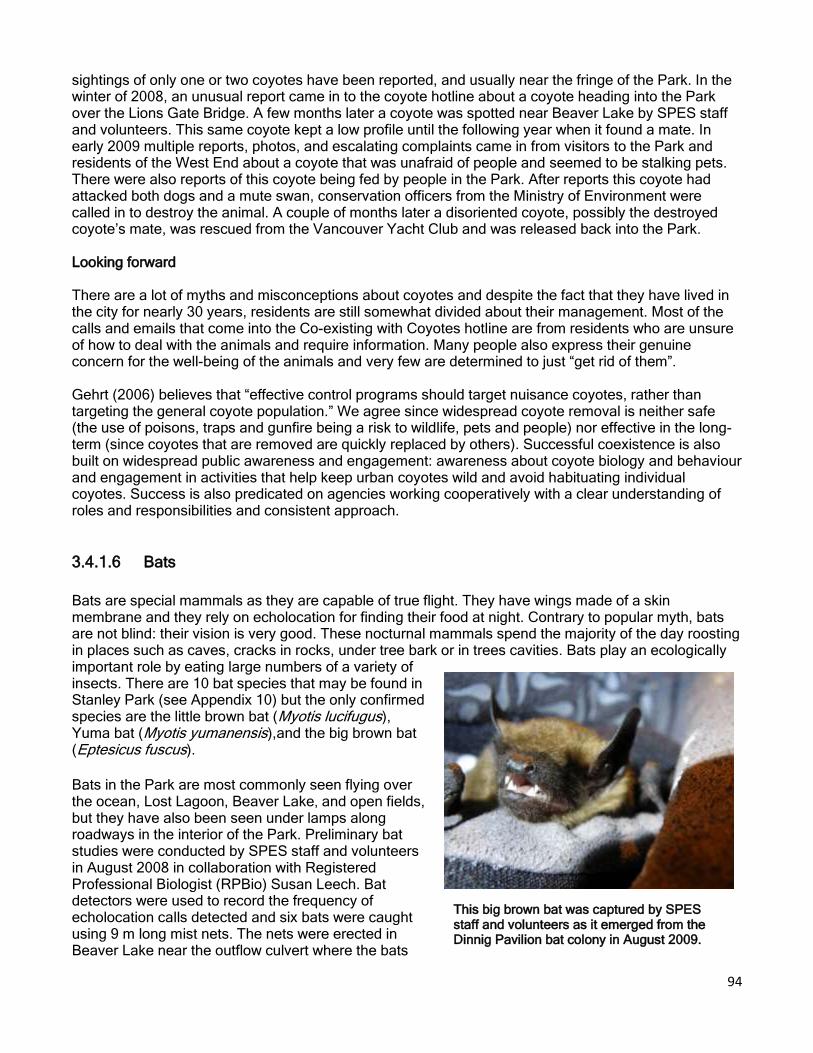
94
This big brown bat was captured by SPES staff and volunteers as it emerged from the Dinnig Pavilion bat colony in August 2009.
sightings of only one or two coyotes have been reported, and usually near the fringe of the Park. In the winter of 2008, an unusual report came in to the coyote hotline about a coyote heading into the Park over the Lions Gate Bridge. A few months later a coyote was spotted near Beaver Lake by SPES staff and volunteers. This same coyote kept a low profile until the following year when it found a mate. In early 2009 multiple reports, photos, and escalating complaints came in from visitors to the Park and residents of the West End about a coyote that was unafraid of people and seemed to be stalking pets. There were also reports of this coyote being fed by people in the Park. After reports this coyote had attacked both dogs and a mute swan, conservation officers from the Ministry of Environment were called in to destroy the animal. A couple of months later a disoriented coyote, possibly the destroyed coyote‘s mate, was rescued from the Vancouver Yacht Club and was released back into the Park. Looking forward There are a lot of myths and misconceptions about coyotes and despite the fact that they have lived in the city for nearly 30 years, residents are still somewhat divided about their management. Most of the calls and emails that come into the Co-existing with Coyotes hotline are from residents who are unsure of how to deal with the animals and require information. Many people also express their genuine concern for the well-being of the animals and very few are determined to just ―get rid of them‖. Gehrt (2006) believes that ―effective control programs should target nuisance coyotes, rather than targeting the general coyote population.‖ We agree since widespread coyote removal is neither safe (the use of poisons, traps and gunfire being a risk to wildlife, pets and people) nor effective in the long-term (since coyotes that are removed are quickly replaced by others). Successful coexistence is also built on widespread public awareness and engagement: awareness about coyote biology and behaviour and engagement in activities that help keep urban coyotes wild and avoid habituating individual coyotes. Success is also predicated on agencies working cooperatively with a clear understanding of roles and responsibilities and consistent approach.
3.4.1.6 Bats
Bats are special mammals as they are capable of true flight. They have wings made of a skin membrane and they rely on echolocation for finding their food at night. Contrary to popular myth, bats are not blind: their vision is very good. These nocturnal mammals spend the majority of the day roosting in places such as caves, cracks in rocks, under tree bark or in trees cavities. Bats play an ecologically important role by eating large numbers of a variety of insects. There are 10 bat species that may be found in Stanley Park (see Appendix 10) but the only confirmed species are the little brown bat (Myotis lucifugus), Yuma bat (Myotis yumanensis),and the big brown bat (Eptesicus fuscus).
Bats in the Park are most commonly seen flying over the ocean, Lost Lagoon, Beaver Lake, and open fields, but they have also been seen under lamps along roadways in the interior of the Park. Preliminary bat studies were conducted by SPES staff and volunteers in August 2008 in collaboration with Registered Professional Biologist (RPBio) Susan Leech. Bat detectors were used to record the frequency of echolocation calls detected and six bats were caught using 9 m long mist nets. The nets were erected in Beaver Lake near the outflow culvert where the bats
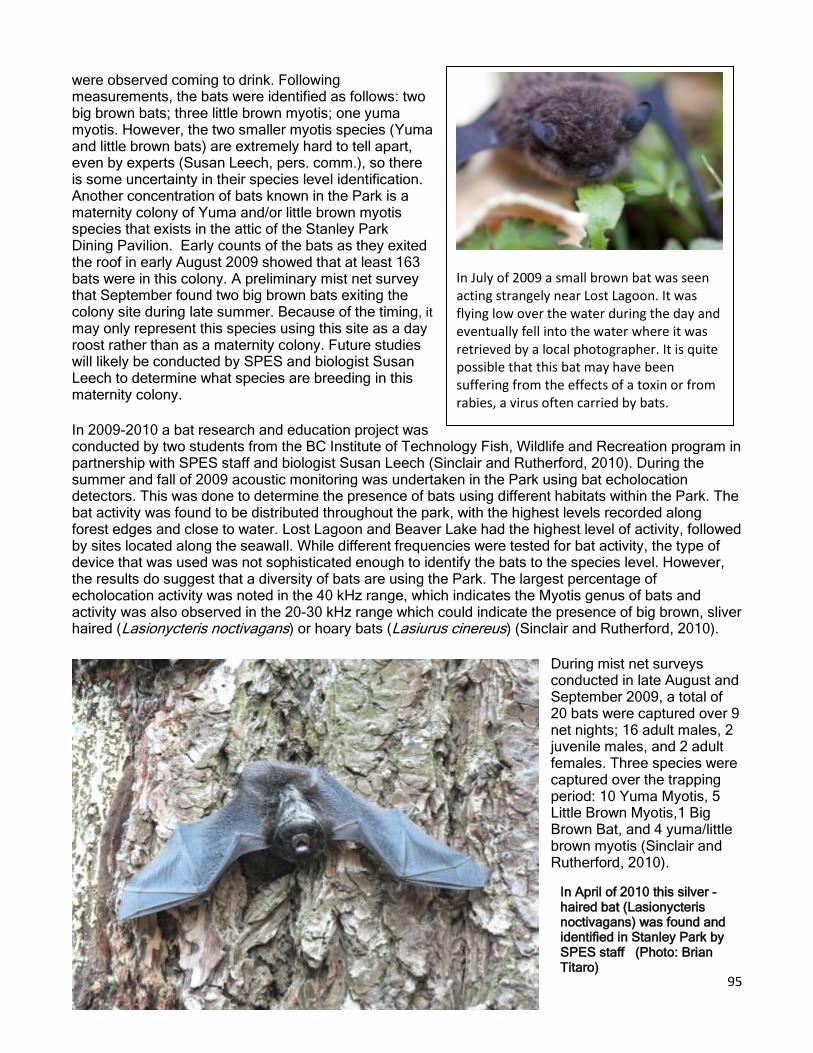
95
In April of 2010 this silver -haired bat (Lasionycteris noctivagans) was found and identified in Stanley Park by SPES staff (Photo: Brian Titaro)
In July of 2009 a small brown bat was seen acting strangely near Lost Lagoon. It was flying low over the water during the day and eventually fell into the water where it was retrieved by a local photographer. It is quite possible that this bat may have been suffering from the effects of a toxin or from rabies, a virus often carried by bats.
were observed coming to drink. Following measurements, the bats were identified as follows: two big brown bats; three little brown myotis; one yuma myotis. However, the two smaller myotis species (Yuma and little brown bats) are extremely hard to tell apart, even by experts (Susan Leech, pers. comm.), so there is some uncertainty in their species level identification. Another concentration of bats known in the Park is a maternity colony of Yuma and/or little brown myotis species that exists in the attic of the Stanley Park Dining Pavilion. Early counts of the bats as they exited the roof in early August 2009 showed that at least 163 bats were in this colony. A preliminary mist net survey that September found two big brown bats exiting the colony site during late summer. Because of the timing, it may only represent this species using this site as a day roost rather than as a maternity colony. Future studies will likely be conducted by SPES and biologist Susan Leech to determine what species are breeding in this maternity colony.
In 2009-2010 a bat research and education project was conducted by two students from the BC Institute of Technology Fish, Wildlife and Recreation program in partnership with SPES staff and biologist Susan Leech (Sinclair and Rutherford, 2010). During the summer and fall of 2009 acoustic monitoring was undertaken in the Park using bat echolocation detectors. This was done to determine the presence of bats using different habitats within the Park. The bat activity was found to be distributed throughout the park, with the highest levels recorded along forest edges and close to water. Lost Lagoon and Beaver Lake had the highest level of activity, followed by sites located along the seawall. While different frequencies were tested for bat activity, the type of device that was used was not sophisticated enough to identify the bats to the species level. However, the results do suggest that a diversity of bats are using the Park. The largest percentage of echolocation activity was noted in the 40 kHz range, which indicates the Myotis genus of bats and activity was also observed in the 20-30 kHz range which could indicate the presence of big brown, sliver haired (Lasionycteris noctivagans) or hoary bats (Lasiurus cinereus) (Sinclair and Rutherford, 2010).
During mist net surveys conducted in late August and September 2009, a total of 20 bats were captured over 9 net nights; 16 adult males, 2 juvenile males, and 2 adult females. Three species were captured over the trapping period: 10 Yuma Myotis, 5 Little Brown Myotis,1 Big Brown Bat, and 4 yuma/little brown myotis (Sinclair and Rutherford, 2010).
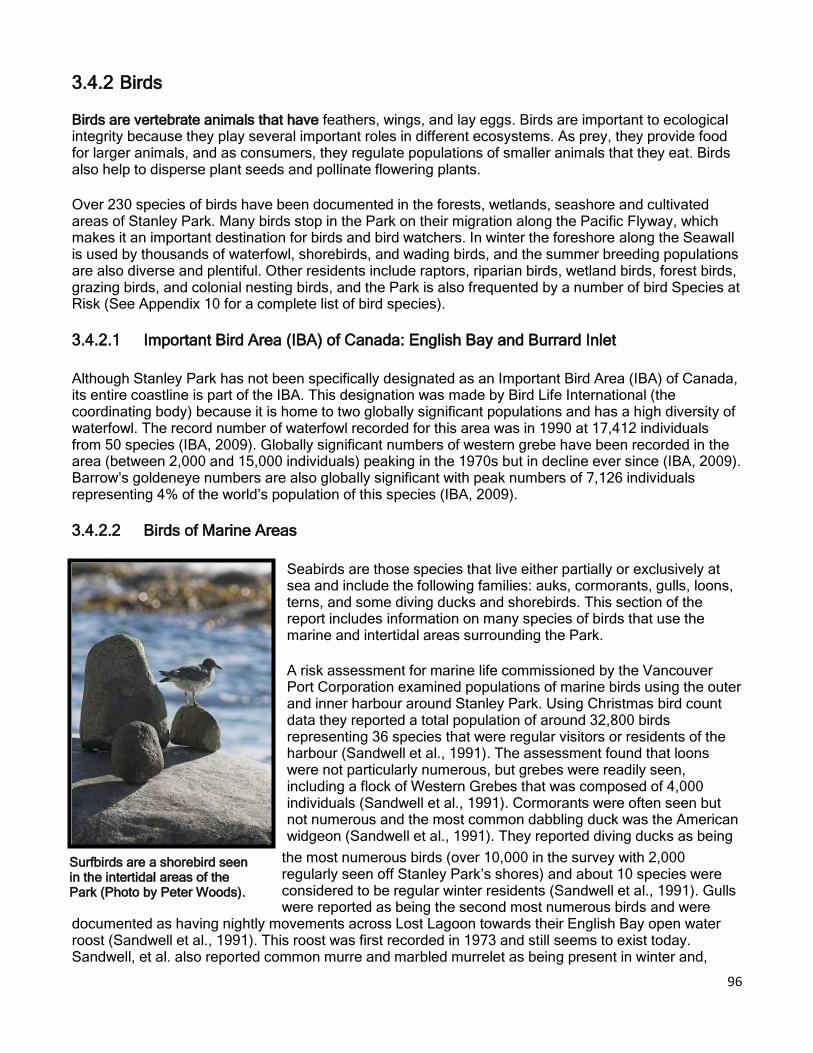
96
Surfbirds are a shorebird seen in the intertidal areas of the Park (Photo by Peter Woods).
3.4.2 Birds
Birds are vertebrate animals that have feathers, wings, and lay eggs. Birds are important to ecological integrity because they play several important roles in different ecosystems. As prey, they provide food for larger animals, and as consumers, they regulate populations of smaller animals that they eat. Birds also help to disperse plant seeds and pollinate flowering plants.
Over 230 species of birds have been documented in the forests, wetlands, seashore and cultivated areas of Stanley Park. Many birds stop in the Park on their migration along the Pacific Flyway, which makes it an important destination for birds and bird watchers. In winter the foreshore along the Seawall is used by thousands of waterfowl, shorebirds, and wading birds, and the summer breeding populations are also diverse and plentiful. Other residents include raptors, riparian birds, wetland birds, forest birds, grazing birds, and colonial nesting birds, and the Park is also frequented by a number of bird Species at Risk (See Appendix 10 for a complete list of bird species).
3.4.2.1 Important Bird Area (IBA) of Canada: English Bay and Burrard Inlet
Although Stanley Park has not been specifically designated as an Important Bird Area (IBA) of Canada, its entire coastline is part of the IBA. This designation was made by Bird Life International (the coordinating body) because it is home to two globally significant populations and has a high diversity of waterfowl. The record number of waterfowl recorded for this area was in 1990 at 17,412 individuals from 50 species (IBA, 2009). Globally significant numbers of western grebe have been recorded in the area (between 2,000 and 15,000 individuals) peaking in the 1970s but in decline ever since (IBA, 2009). Barrow‘s goldeneye numbers are also globally significant with peak numbers of 7,126 individuals representing 4% of the world‘s population of this species (IBA, 2009).
3.4.2.2 Birds of Marine Areas
Seabirds are those species that live either partially or exclusively at sea and include the following families: auks, cormorants, gulls, loons, terns, and some diving ducks and shorebirds. This section of the report includes information on many species of birds that use the marine and intertidal areas surrounding the Park.
A risk assessment for marine life commissioned by the Vancouver Port Corporation examined populations of marine birds using the outer and inner harbour around Stanley Park. Using Christmas bird count data they reported a total population of around 32,800 birds representing 36 species that were regular visitors or residents of the harbour (Sandwell et al., 1991). The assessment found that loons were not particularly numerous, but grebes were readily seen, including a flock of Western Grebes that was composed of 4,000 individuals (Sandwell et al., 1991). Cormorants were often seen but not numerous and the most common dabbling duck was the American widgeon (Sandwell et al., 1991). They reported diving ducks as being
the most numerous birds (over 10,000 in the survey with 2,000 regularly seen off Stanley Park‘s shores) and about 10 species were considered to be regular winter residents (Sandwell et al., 1991). Gulls were reported as being the second most numerous birds and were
documented as having nightly movements across Lost Lagoon towards their English Bay open water roost (Sandwell et al., 1991). This roost was first recorded in 1973 and still seems to exist today. Sandwell, et al. also reported common murre and marbled murrelet as being present in winter and,
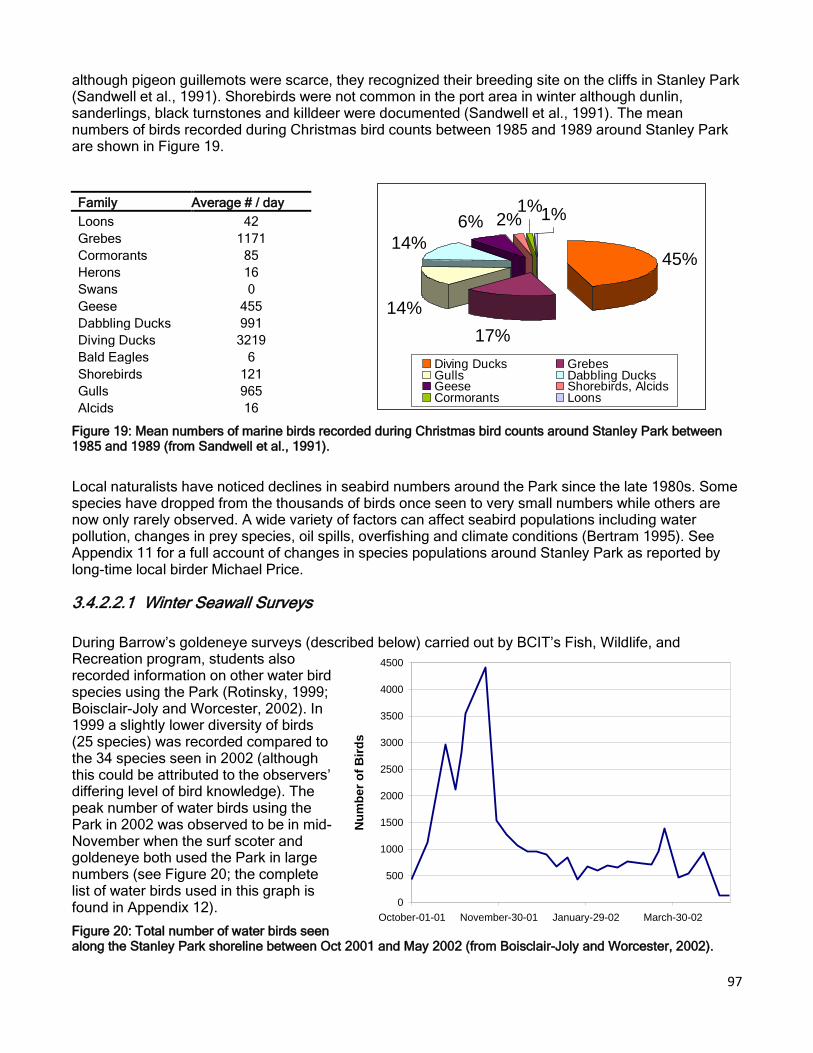
97
45%
17%
14%
14%
6% 2%1%
1%
Diving Ducks GrebesGulls Dabbling DucksGeese Shorebirds, AlcidsCormorants Loons
0
500
1000
1500
2000
2500
3000
3500
4000
4500
October-01-01 November-30-01 January-29-02 March-30-02
Nu
mb
er
of
Bir
ds
although pigeon guillemots were scarce, they recognized their breeding site on the cliffs in Stanley Park (Sandwell et al., 1991). Shorebirds were not common in the port area in winter although dunlin, sanderlings, black turnstones and killdeer were documented (Sandwell et al., 1991). The mean numbers of birds recorded during Christmas bird counts between 1985 and 1989 around Stanley Park are shown in Figure 19.
Family Average # / day
Loons 42
Grebes 1171
Cormorants 85
Herons 16
Swans 0
Geese 455
Dabbling Ducks 991
Diving Ducks 3219
Bald Eagles 6
Shorebirds 121
Gulls 965
Alcids 16
Figure 19: Mean numbers of marine birds recorded during Christmas bird counts around Stanley Park between 1985 and 1989 (from Sandwell et al., 1991).
Local naturalists have noticed declines in seabird numbers around the Park since the late 1980s. Some species have dropped from the thousands of birds once seen to very small numbers while others are now only rarely observed. A wide variety of factors can affect seabird populations including water pollution, changes in prey species, oil spills, overfishing and climate conditions (Bertram 1995). See Appendix 11 for a full account of changes in species populations around Stanley Park as reported by long-time local birder Michael Price.
3.4.2.2.1 Winter Seawall Surveys
During Barrow‘s goldeneye surveys (described below) carried out by BCIT‘s Fish, Wildlife, and Recreation program, students also recorded information on other water bird species using the Park (Rotinsky, 1999; Boisclair-Joly and Worcester, 2002). In 1999 a slightly lower diversity of birds (25 species) was recorded compared to the 34 species seen in 2002 (although this could be attributed to the observers‘ differing level of bird knowledge). The peak number of water birds using the Park in 2002 was observed to be in mid-November when the surf scoter and goldeneye both used the Park in large numbers (see Figure 20; the complete list of water birds used in this graph is found in Appendix 12).
Figure 20: Total number of water birds seen along the Stanley Park shoreline between Oct 2001 and May 2002 (from Boisclair-Joly and Worcester, 2002).

98
0
200
400
600
800
1000
1200
12 19 24 31 7 14 21 28 5 13 20 26 2 9 16 23 30 6 13 20 27 9 15 20 24 3 10 20 1 8
October November December January Feruary March April May
Nu
mb
er
of
Ind
ivid
ua
ls
Barrow's Goldeneye
3.4.2.2.2 Barrow‘s Goldeneye
Since 1999, surveys have been conducted for Barrow‘s goldeneye and other water birds on Stanley Park‘s foreshore by students from BCIT‘s Fish, Wildlife and Recreation (FWR) Program in cooperation with the Candaian Wildlife Service (Danny Catt, pers. comm.). The survey sites along the seawall were based on those created for an earlier study (Breault and Watts, 1996). In 1999 the first Barrow‘s goldeneye to arrive at Stanley Park were seen in mid-October and about 650 were observed as a peak number in mid-March.
Figure 21: Study zones for BCIT winter water bird surveys, and associated, mapped mussel beds (from Boisclair-Joly and Worcester, 2002).
The 1999 study found that the highest numbers of Barrow‘s goldeneye were seen in zones 59, 55, 51, and 48 (see Figure 21) but that this species also used different areas of the Park depending on the tides, food availability, and weather conditions as well as at different times of the season (Rotinsky, 1999). The 1999 study also looked at paired birds and found that there were as many as 67 pairs using the foreshore during that winter with peak numbers in mid-January.
Between October 2001 and May 2002 a similar study was conducted by BCIT FWR students. In addition to information collected on seabirds and Barrow‘s goldeneye, these students also collected
baseline information on the mussel beds that surround the Park (Boisclair-Joly and Worcester, 2002). The first Barrow‘s goldeneye appeared around October 24th, the numbers peaked in late November and then fell until a second late spring peak in mid-March. No goldeneye were recorded at the last survey on May 8, 2002 (see Figure 22).
Figure 22: Abundance of Barrow‘s goldeneye on the Stanley Park foreshore: October 12, 2001 to May 8, 2002. (Stars refer to days on which the entire seawall was not surveyed because it was closed for repairs and therefore the count is lower than expected) (from Boisclair-Joly and Worcester, 2002).

99
Barrow‘s goldeneye numbers are globally significant in English Bay and Burrard Inlet. Peak numbers have been recorded at 7,126 individuals representing 4% of the world‘s population of this species (IBA, 2009).
A flock of surf scoter on English Bay (Photo by Peter Woods).
The peak in November 2001 (of almost 1,000 individuals) differs slightly from the 1999 study in which the peak numbers were in March (about 650 individuals), although in 2002 there was also a mid-March peak of birds as they congregated around the Park prior to spring migration. The zone locations found to be used by the Barrow‘s goldeneye in the 2002 study were different from those found in 2001. The most birds were seen in zones 49, 51, 52, 53 centering the majority of the birds to the area between Siwash Rock and the Lions Gate Bridge in 2002, while in the earlier study the birds were seen in several more spread-out locations (Boisclair-Joly and Worcester, 2002). The maximum number of pairs was lower in 2002 at 54 pairs (versus 67 in 1999) and the peak numbers for pairs were also later in the season at the end of February in 2002 (Boisclair-Joly and Worcester, 2002). The 2002 study also looked at the relationship between Barrow‘s Goldeneye and the mussel beds on which they rely for food. They found that all of the significant mussel beds along the seawall were located on the west side of the Park in zones 45 to 54, which is the same area where most of the goldeneyes were observed (see Figure 21) (Boisclair-Joly and Worcester, 2002). Statistical analysis showed that although there may be some relationship between the presence of Barrow‘s and the presence of mussel beds, there was little relationship between the percent cover of mussels and the abundance of goldeneye in any given zone (Boisclair-Joly and Worcester, 2002).
3.4.2.2.3 Surf Scoter
Surf scoters wintering in the Strait of Georgia are likely breeding in the Yukon, Alaska and the Northwest Territories as well as on some lakes in central BC (Palmer, 1976). Their spring migration starts in late March when birds often congregate at herring spawning sites before heading north. On 16 March 1977, 663 surf scoters were seen in Stanley Park but none were recorded only 14 days later (Din, 1977). Surf scoters return
to this area in late October to early November and are the most abundant sea ducks in the Georgia Strait in winter; between 8,000 and 13,000 birds were counted during Christmas Bird Counts between 1975 and 1985 (Savard, 1989). In 1990 peak numbers for this species in English Bay and Burrard Inlet were 6,150 individuals (IBA, 2009). In those ten years the numbers remained relatively stable with no obvious upward or downward trend (Savard, 1989). Since surf scoters have been added to the provincial Blue List as a species of special concern, long-term monitoring programs would provide valuable information on trends in their local abundance.
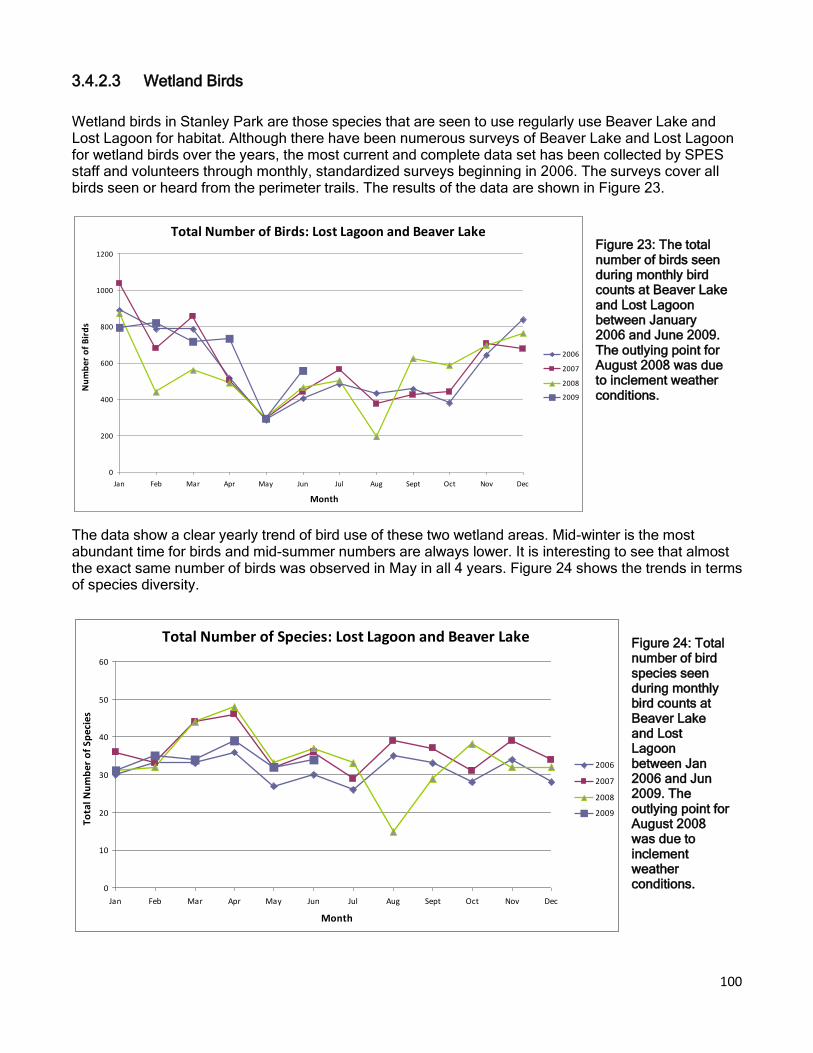
100
Total Number of Birds: Lost Lagoon and Beaver Lake
0
200
400
600
800
1000
1200
Jan Feb Mar Apr May Jun Jul Aug Sept Oct Nov Dec
Month
Nu
mb
er o
f B
ird
s
2006
2007
2008
2009
Total Number of Species: Lost Lagoon and Beaver Lake
0
10
20
30
40
50
60
Jan Feb Mar Apr May Jun Jul Aug Sept Oct Nov Dec
Month
Tota
l Nu
mb
er o
f Sp
ecie
s
2006
2007
2008
2009
3.4.2.3 Wetland Birds
Wetland birds in Stanley Park are those species that are seen to use regularly use Beaver Lake and Lost Lagoon for habitat. Although there have been numerous surveys of Beaver Lake and Lost Lagoon for wetland birds over the years, the most current and complete data set has been collected by SPES staff and volunteers through monthly, standardized surveys beginning in 2006. The surveys cover all birds seen or heard from the perimeter trails. The results of the data are shown in Figure 23.
Figure 23: The total number of birds seen during monthly bird counts at Beaver Lake and Lost Lagoon between January 2006 and June 2009. The outlying point for August 2008 was due to inclement weather conditions.
The data show a clear yearly trend of bird use of these two wetland areas. Mid-winter is the most abundant time for birds and mid-summer numbers are always lower. It is interesting to see that almost the exact same number of birds was observed in May in all 4 years. Figure 24 shows the trends in terms of species diversity.
Figure 24: Total number of bird species seen during monthly bird counts at Beaver Lake and Lost Lagoon between Jan 2006 and Jun 2009. The outlying point for August 2008 was due to inclement weather conditions.
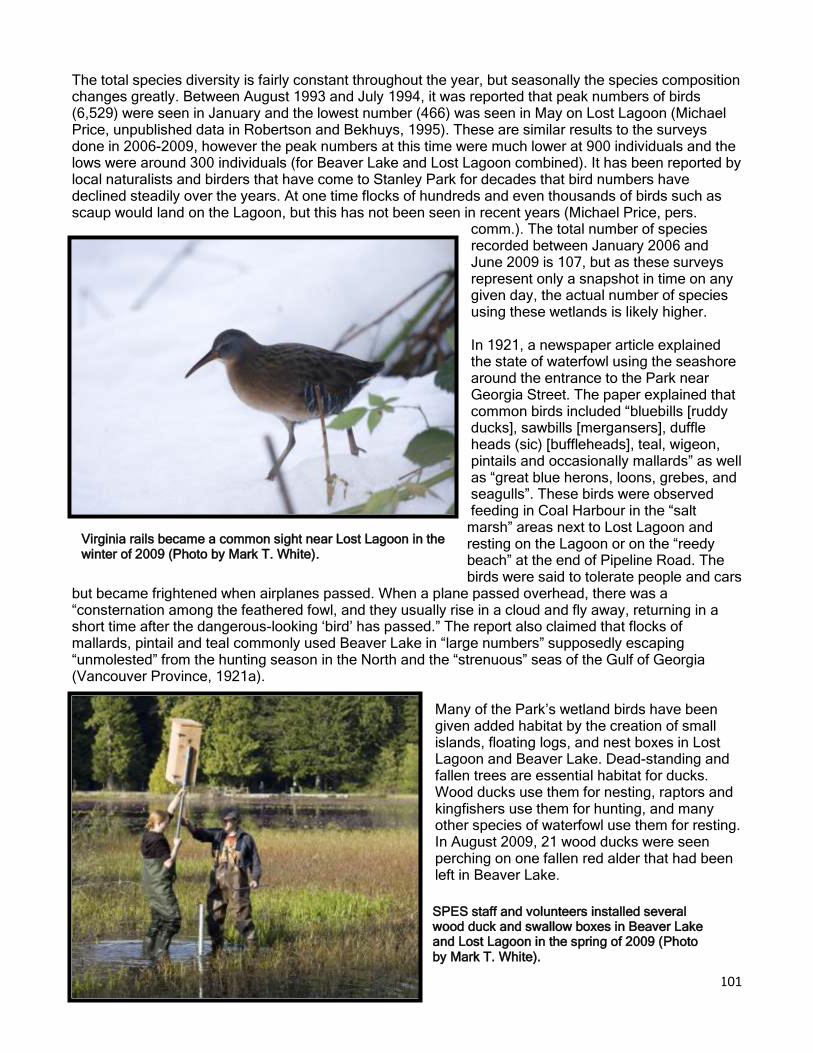
101
Virginia rails became a common sight near Lost Lagoon in the winter of 2009 (Photo by Mark T. White).
SPES staff and volunteers installed several wood duck and swallow boxes in Beaver Lake and Lost Lagoon in the spring of 2009 (Photo by Mark T. White).
The total species diversity is fairly constant throughout the year, but seasonally the species composition changes greatly. Between August 1993 and July 1994, it was reported that peak numbers of birds (6,529) were seen in January and the lowest number (466) was seen in May on Lost Lagoon (Michael Price, unpublished data in Robertson and Bekhuys, 1995). These are similar results to the surveys done in 2006-2009, however the peak numbers at this time were much lower at 900 individuals and the lows were around 300 individuals (for Beaver Lake and Lost Lagoon combined). It has been reported by local naturalists and birders that have come to Stanley Park for decades that bird numbers have declined steadily over the years. At one time flocks of hundreds and even thousands of birds such as scaup would land on the Lagoon, but this has not been seen in recent years (Michael Price, pers.
comm.). The total number of species recorded between January 2006 and June 2009 is 107, but as these surveys represent only a snapshot in time on any given day, the actual number of species using these wetlands is likely higher. In 1921, a newspaper article explained the state of waterfowl using the seashore around the entrance to the Park near Georgia Street. The paper explained that common birds included ―bluebills [ruddy ducks], sawbills [mergansers], duffle heads (sic) [buffleheads], teal, wigeon, pintails and occasionally mallards‖ as well as ―great blue herons, loons, grebes, and seagulls‖. These birds were observed feeding in Coal Harbour in the ―salt
marsh‖ areas next to Lost Lagoon and resting on the Lagoon or on the ―reedy beach‖ at the end of Pipeline Road. The birds were said to tolerate people and cars
but became frightened when airplanes passed. When a plane passed overhead, there was a ―consternation among the feathered fowl, and they usually rise in a cloud and fly away, returning in a short time after the dangerous-looking ‗bird‘ has passed.‖ The report also claimed that flocks of mallards, pintail and teal commonly used Beaver Lake in ―large numbers‖ supposedly escaping ―unmolested‖ from the hunting season in the North and the ―strenuous‖ seas of the Gulf of Georgia (Vancouver Province, 1921a).
Many of the Park‘s wetland birds have been given added habitat by the creation of small islands, floating logs, and nest boxes in Lost Lagoon and Beaver Lake. Dead-standing and fallen trees are essential habitat for ducks. Wood ducks use them for nesting, raptors and kingfishers use them for hunting, and many other species of waterfowl use them for resting. In August 2009, 21 wood ducks were seen perching on one fallen red alder that had been left in Beaver Lake.
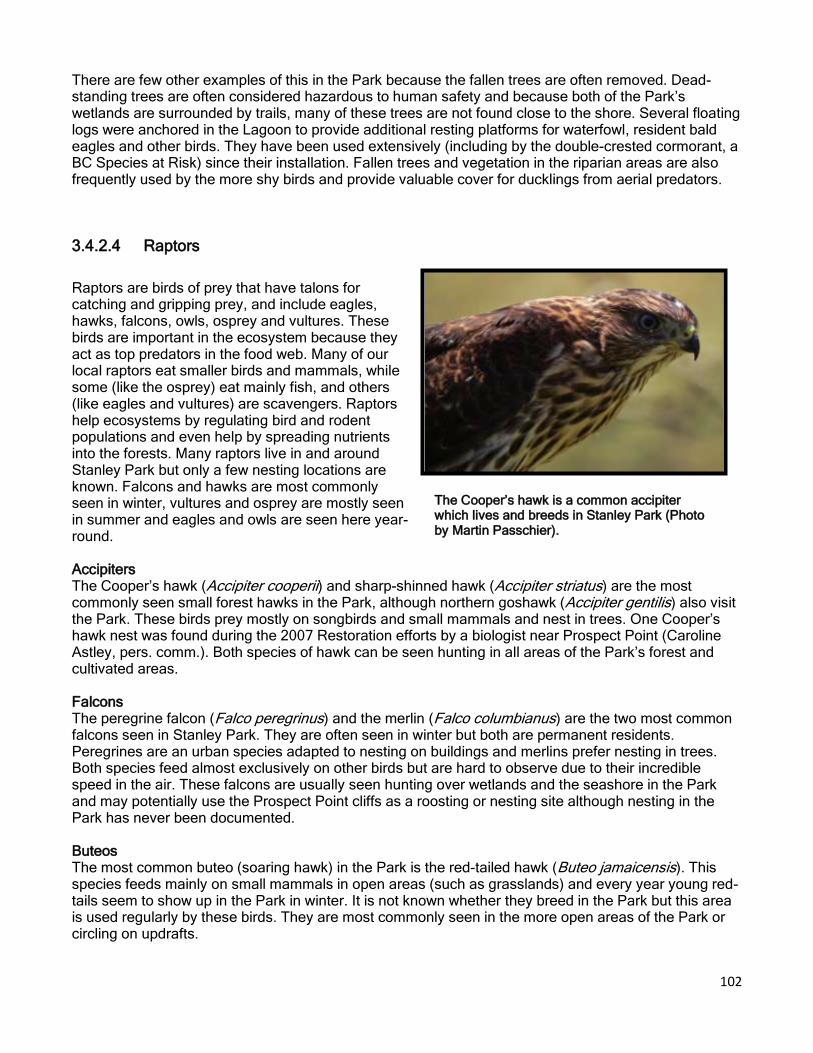
102
The Cooper‘s hawk is a common accipiter which lives and breeds in Stanley Park (Photo by Martin Passchier).
There are few other examples of this in the Park because the fallen trees are often removed. Dead-standing trees are often considered hazardous to human safety and because both of the Park‘s wetlands are surrounded by trails, many of these trees are not found close to the shore. Several floating logs were anchored in the Lagoon to provide additional resting platforms for waterfowl, resident bald eagles and other birds. They have been used extensively (including by the double-crested cormorant, a BC Species at Risk) since their installation. Fallen trees and vegetation in the riparian areas are also frequently used by the more shy birds and provide valuable cover for ducklings from aerial predators.
3.4.2.4 Raptors
Raptors are birds of prey that have talons for catching and gripping prey, and include eagles, hawks, falcons, owls, osprey and vultures. These birds are important in the ecosystem because they act as top predators in the food web. Many of our local raptors eat smaller birds and mammals, while some (like the osprey) eat mainly fish, and others (like eagles and vultures) are scavengers. Raptors help ecosystems by regulating bird and rodent populations and even help by spreading nutrients into the forests. Many raptors live in and around Stanley Park but only a few nesting locations are known. Falcons and hawks are most commonly seen in winter, vultures and osprey are mostly seen in summer and eagles and owls are seen here year-round. Accipiters The Cooper‘s hawk (Accipiter cooperii) and sharp-shinned hawk (Accipiter striatus) are the most commonly seen small forest hawks in the Park, although northern goshawk (Accipiter gentilis) also visit the Park. These birds prey mostly on songbirds and small mammals and nest in trees. One Cooper‘s hawk nest was found during the 2007 Restoration efforts by a biologist near Prospect Point (Caroline Astley, pers. comm.). Both species of hawk can be seen hunting in all areas of the Park‘s forest and cultivated areas. Falcons The peregrine falcon (Falco peregrinus) and the merlin (Falco columbianus) are the two most common falcons seen in Stanley Park. They are often seen in winter but both are permanent residents. Peregrines are an urban species adapted to nesting on buildings and merlins prefer nesting in trees. Both species feed almost exclusively on other birds but are hard to observe due to their incredible speed in the air. These falcons are usually seen hunting over wetlands and the seashore in the Park and may potentially use the Prospect Point cliffs as a roosting or nesting site although nesting in the Park has never been documented. Buteos The most common buteo (soaring hawk) in the Park is the red-tailed hawk (Buteo jamaicensis). This species feeds mainly on small mammals in open areas (such as grasslands) and every year young red-tails seem to show up in the Park in winter. It is not known whether they breed in the Park but this area is used regularly by these birds. They are most commonly seen in the more open areas of the Park or circling on updrafts.
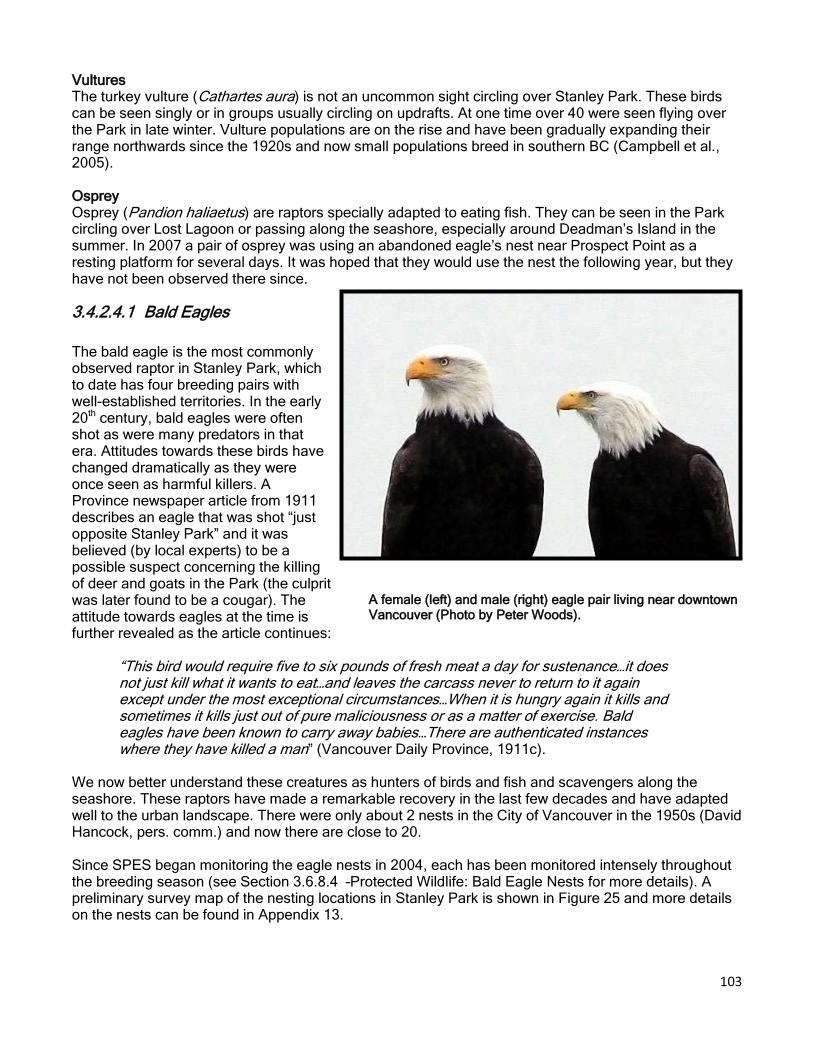
103
A female (left) and male (right) eagle pair living near downtown Vancouver (Photo by Peter Woods).
Vultures The turkey vulture (Cathartes aura) is not an uncommon sight circling over Stanley Park. These birds can be seen singly or in groups usually circling on updrafts. At one time over 40 were seen flying over the Park in late winter. Vulture populations are on the rise and have been gradually expanding their range northwards since the 1920s and now small populations breed in southern BC (Campbell et al., 2005). Osprey Osprey (Pandion haliaetus) are raptors specially adapted to eating fish. They can be seen in the Park circling over Lost Lagoon or passing along the seashore, especially around Deadman‘s Island in the summer. In 2007 a pair of osprey was using an abandoned eagle‘s nest near Prospect Point as a resting platform for several days. It was hoped that they would use the nest the following year, but they have not been observed there since.
3.4.2.4.1 Bald Eagles
The bald eagle is the most commonly observed raptor in Stanley Park, which to date has four breeding pairs with well-established territories. In the early 20th century, bald eagles were often shot as were many predators in that era. Attitudes towards these birds have changed dramatically as they were once seen as harmful killers. A Province newspaper article from 1911 describes an eagle that was shot ―just opposite Stanley Park‖ and it was believed (by local experts) to be a possible suspect concerning the killing of deer and goats in the Park (the culprit was later found to be a cougar). The attitude towards eagles at the time is further revealed as the article continues:
―This bird would require five to six pounds of fresh meat a day for sustenance…it does not just kill what it wants to eat…and leaves the carcass never to return to it again except under the most exceptional circumstances…When it is hungry again it kills and sometimes it kills just out of pure maliciousness or as a matter of exercise. Bald eagles have been known to carry away babies…There are authenticated instances where they have killed a man‖ (Vancouver Daily Province, 1911c).
We now better understand these creatures as hunters of birds and fish and scavengers along the seashore. These raptors have made a remarkable recovery in the last few decades and have adapted well to the urban landscape. There were only about 2 nests in the City of Vancouver in the 1950s (David Hancock, pers. comm.) and now there are close to 20. Since SPES began monitoring the eagle nests in 2004, each has been monitored intensely throughout the breeding season (see Section 3.6.8.4 –Protected Wildlife: Bald Eagle Nests for more details). A preliminary survey map of the nesting locations in Stanley Park is shown in Figure 25 and more details on the nests can be found in Appendix 13.
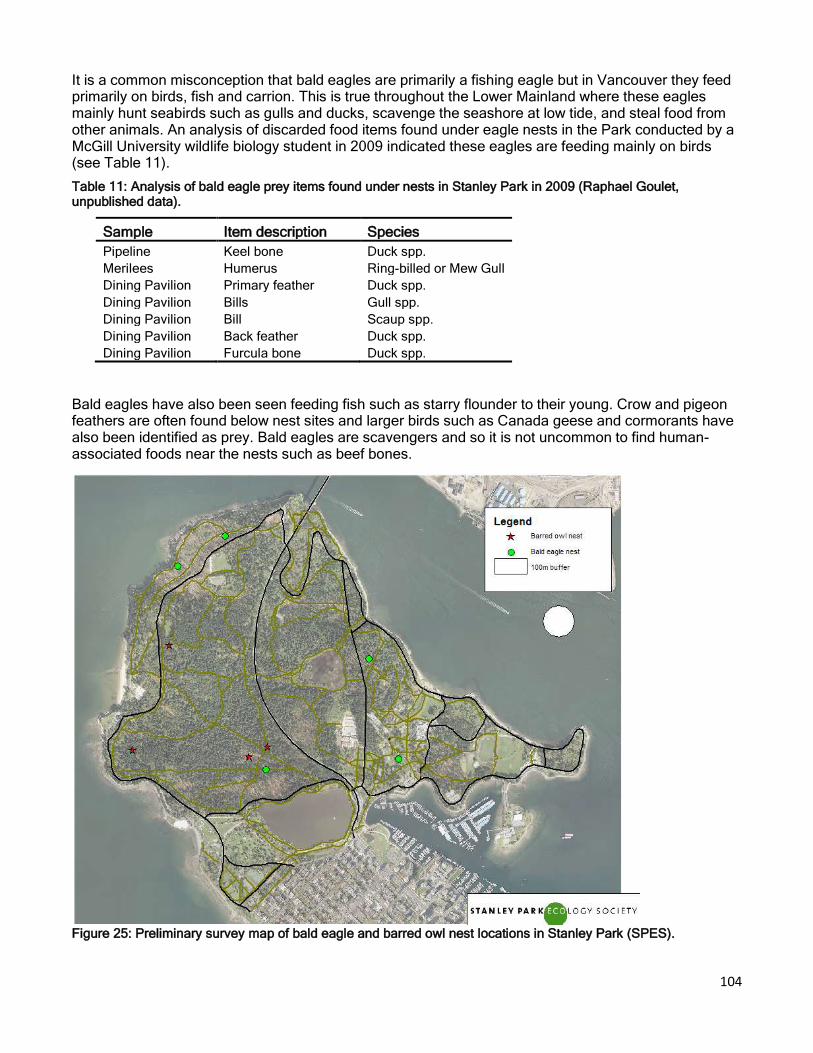
104
It is a common misconception that bald eagles are primarily a fishing eagle but in Vancouver they feed primarily on birds, fish and carrion. This is true throughout the Lower Mainland where these eagles mainly hunt seabirds such as gulls and ducks, scavenge the seashore at low tide, and steal food from other animals. An analysis of discarded food items found under eagle nests in the Park conducted by a McGill University wildlife biology student in 2009 indicated these eagles are feeding mainly on birds (see Table 11).
Table 11: Analysis of bald eagle prey items found under nests in Stanley Park in 2009 (Raphael Goulet, unpublished data).
Sample Item description Species
Pipeline Keel bone Duck spp.
Merilees Humerus Ring-billed or Mew Gull
Dining Pavilion Primary feather Duck spp.
Dining Pavilion Bills Gull spp.
Dining Pavilion Bill Scaup spp.
Dining Pavilion Back feather Duck spp.
Dining Pavilion Furcula bone Duck spp.
Bald eagles have also been seen feeding fish such as starry flounder to their young. Crow and pigeon feathers are often found below nest sites and larger birds such as Canada geese and cormorants have also been identified as prey. Bald eagles are scavengers and so it is not uncommon to find human-associated foods near the nests such as beef bones.
Figure 25: Preliminary survey map of bald eagle and barred owl nest locations in Stanley Park (SPES).
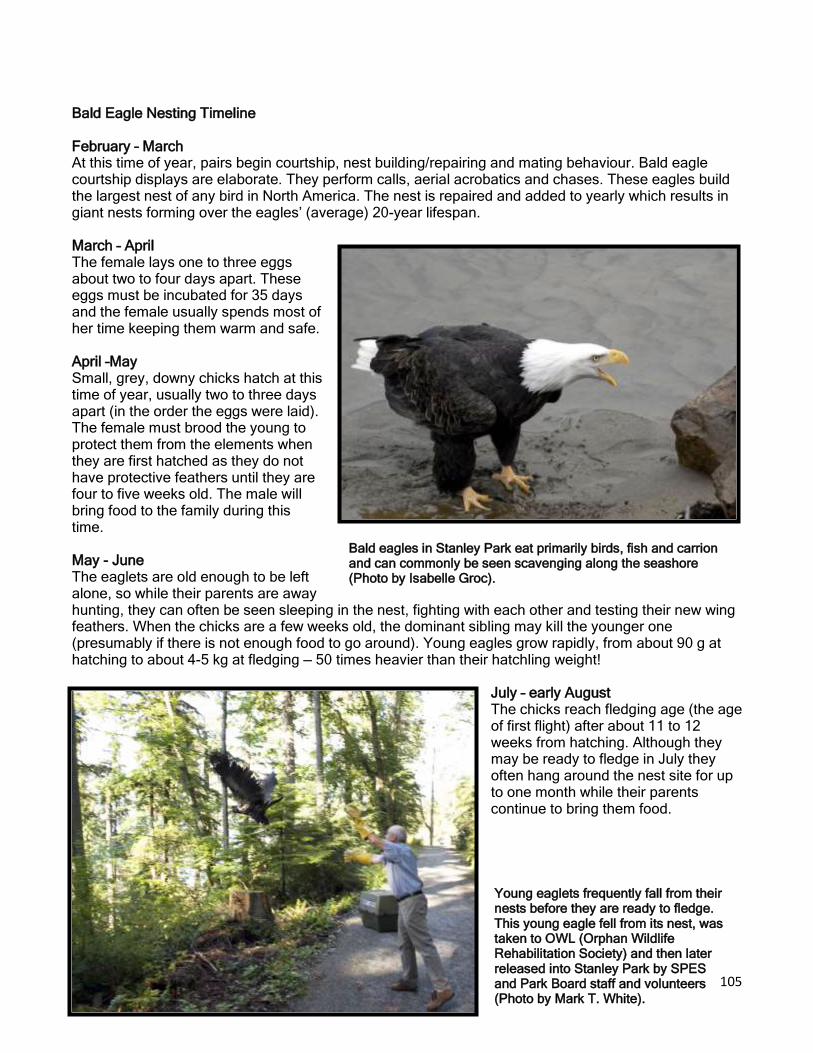
105
Bald eagles in Stanley Park eat primarily birds, fish and carrion and can commonly be seen scavenging along the seashore (Photo by Isabelle Groc).
Young eaglets frequently fall from their nests before they are ready to fledge. This young eagle fell from its nest, was taken to OWL (Orphan Wildlife Rehabilitation Society) and then later released into Stanley Park by SPES and Park Board staff and volunteers (Photo by Mark T. White).
Bald Eagle Nesting Timeline February – March At this time of year, pairs begin courtship, nest building/repairing and mating behaviour. Bald eagle courtship displays are elaborate. They perform calls, aerial acrobatics and chases. These eagles build the largest nest of any bird in North America. The nest is repaired and added to yearly which results in giant nests forming over the eagles‘ (average) 20-year lifespan. March – April The female lays one to three eggs about two to four days apart. These eggs must be incubated for 35 days and the female usually spends most of her time keeping them warm and safe. April –May Small, grey, downy chicks hatch at this time of year, usually two to three days apart (in the order the eggs were laid). The female must brood the young to protect them from the elements when they are first hatched as they do not have protective feathers until they are four to five weeks old. The male will bring food to the family during this time. May - June The eaglets are old enough to be left alone, so while their parents are away hunting, they can often be seen sleeping in the nest, fighting with each other and testing their new wing feathers. When the chicks are a few weeks old, the dominant sibling may kill the younger one (presumably if there is not enough food to go around). Young eagles grow rapidly, from about 90 g at hatching to about 4-5 kg at fledging — 50 times heavier than their hatchling weight!
July – early August The chicks reach fledging age (the age of first flight) after about 11 to 12 weeks from hatching. Although they may be ready to fledge in July they often hang around the nest site for up to one month while their parents continue to bring them food.
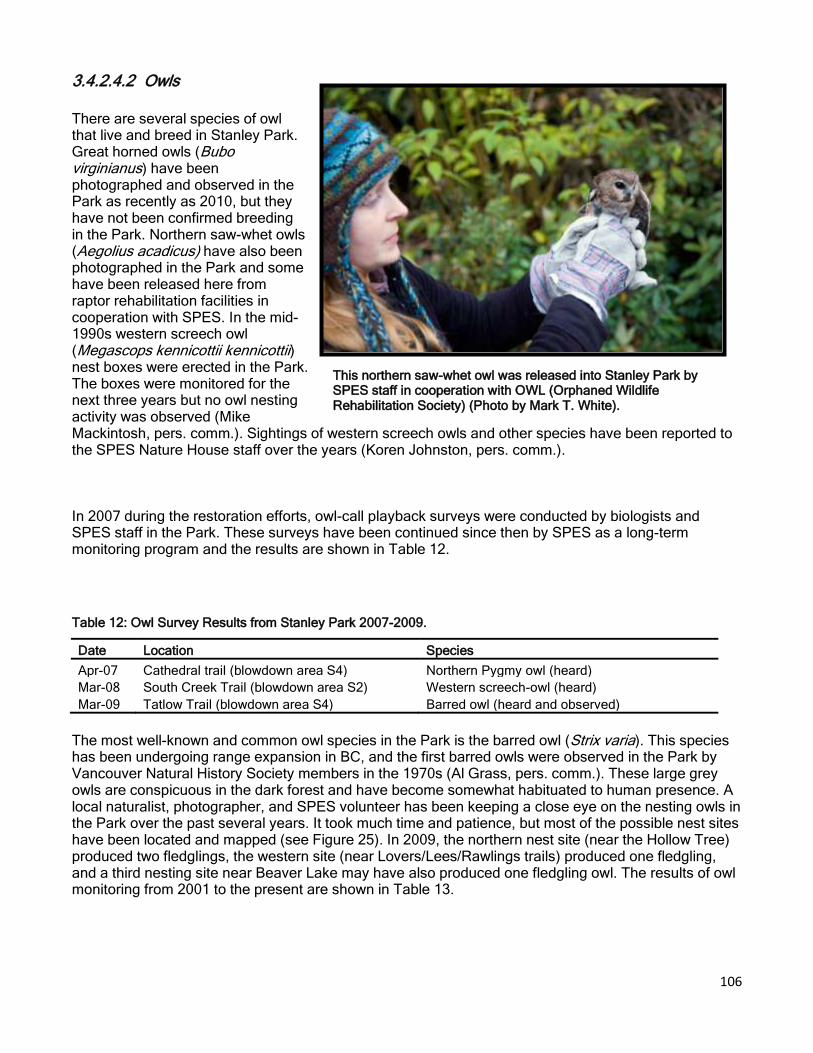
106
This northern saw-whet owl was released into Stanley Park by SPES staff in cooperation with OWL (Orphaned Wildlife Rehabilitation Society) (Photo by Mark T. White).
3.4.2.4.2 Owls
There are several species of owl that live and breed in Stanley Park. Great horned owls (Bubo virginianus) have been photographed and observed in the Park as recently as 2010, but they have not been confirmed breeding in the Park. Northern saw-whet owls (Aegolius acadicus) have also been photographed in the Park and some have been released here from raptor rehabilitation facilities in cooperation with SPES. In the mid-1990s western screech owl (Megascops kennicottii kennicottii) nest boxes were erected in the Park. The boxes were monitored for the next three years but no owl nesting activity was observed (Mike Mackintosh, pers. comm.). Sightings of western screech owls and other species have been reported to the SPES Nature House staff over the years (Koren Johnston, pers. comm.). In 2007 during the restoration efforts, owl-call playback surveys were conducted by biologists and SPES staff in the Park. These surveys have been continued since then by SPES as a long-term monitoring program and the results are shown in Table 12.
Table 12: Owl Survey Results from Stanley Park 2007-2009.
Date Location Species
Apr-07 Cathedral trail (blowdown area S4) Northern Pygmy owl (heard)
Mar-08 South Creek Trail (blowdown area S2) Western screech-owl (heard)
Mar-09 Tatlow Trail (blowdown area S4) Barred owl (heard and observed)
The most well-known and common owl species in the Park is the barred owl (Strix varia). This species has been undergoing range expansion in BC, and the first barred owls were observed in the Park by Vancouver Natural History Society members in the 1970s (Al Grass, pers. comm.). These large grey owls are conspicuous in the dark forest and have become somewhat habituated to human presence. A local naturalist, photographer, and SPES volunteer has been keeping a close eye on the nesting owls in the Park over the past several years. It took much time and patience, but most of the possible nest sites have been located and mapped (see Figure 25). In 2009, the northern nest site (near the Hollow Tree) produced two fledglings, the western site (near Lovers/Lees/Rawlings trails) produced one fledgling, and a third nesting site near Beaver Lake may have also produced one fledgling owl. The results of owl monitoring from 2001 to the present are shown in Table 13.
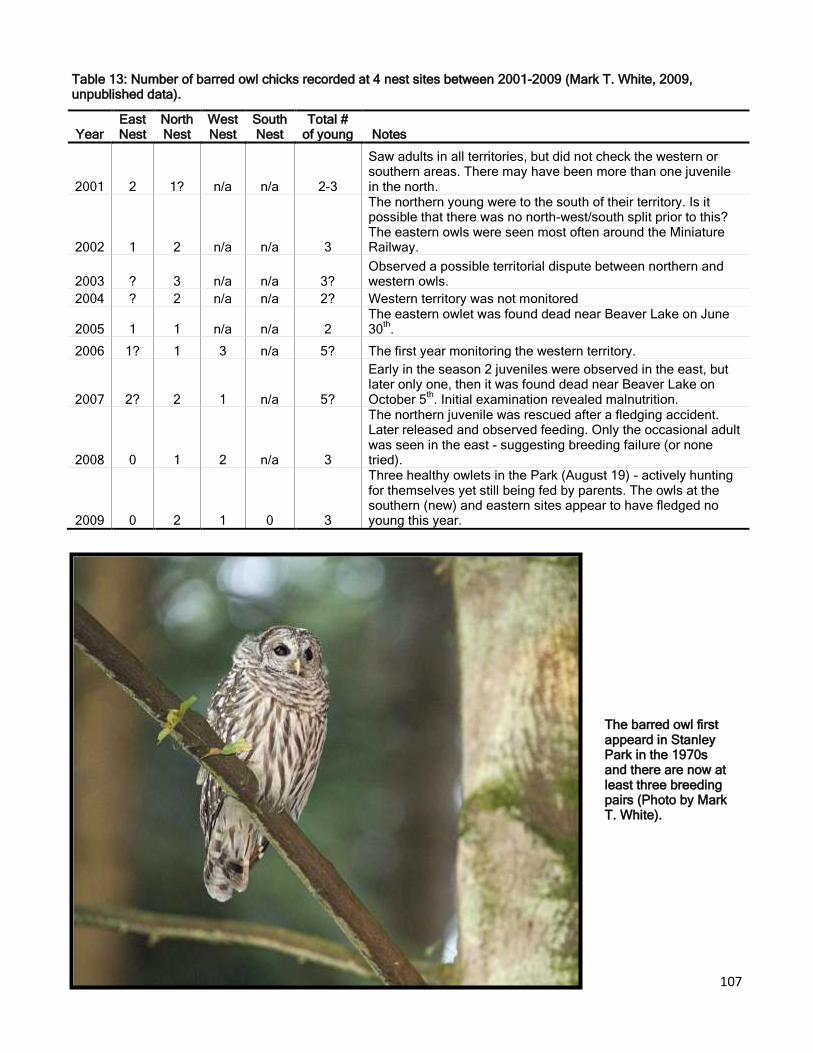
107
The barred owl first appeard in Stanley Park in the 1970s and there are now at least three breeding pairs (Photo by Mark T. White).
Table 13: Number of barred owl chicks recorded at 4 nest sites between 2001-2009 (Mark T. White, 2009, unpublished data).
Year East Nest
North Nest
West Nest
South Nest
Total # of young Notes
2001 2 1? n/a n/a 2-3
Saw adults in all territories, but did not check the western or southern areas. There may have been more than one juvenile in the north.
2002 1 2 n/a n/a 3
The northern young were to the south of their territory. Is it possible that there was no north-west/south split prior to this? The eastern owls were seen most often around the Miniature Railway.
2003 ? 3 n/a n/a 3? Observed a possible territorial dispute between northern and western owls.
2004 ? 2 n/a n/a 2? Western territory was not monitored
2005 1 1 n/a n/a 2 The eastern owlet was found dead near Beaver Lake on June 30
th.
2006 1? 1 3 n/a 5? The first year monitoring the western territory.
2007 2? 2 1 n/a 5?
Early in the season 2 juveniles were observed in the east, but later only one, then it was found dead near Beaver Lake on October 5
th. Initial examination revealed malnutrition.
2008 0 1 2 n/a 3
The northern juvenile was rescued after a fledging accident. Later released and observed feeding. Only the occasional adult was seen in the east - suggesting breeding failure (or none tried).
2009 0 2 1 0 3
Three healthy owlets in the Park (August 19) - actively hunting for themselves yet still being fed by parents. The owls at the southern (new) and eastern sites appear to have fledged no young this year.
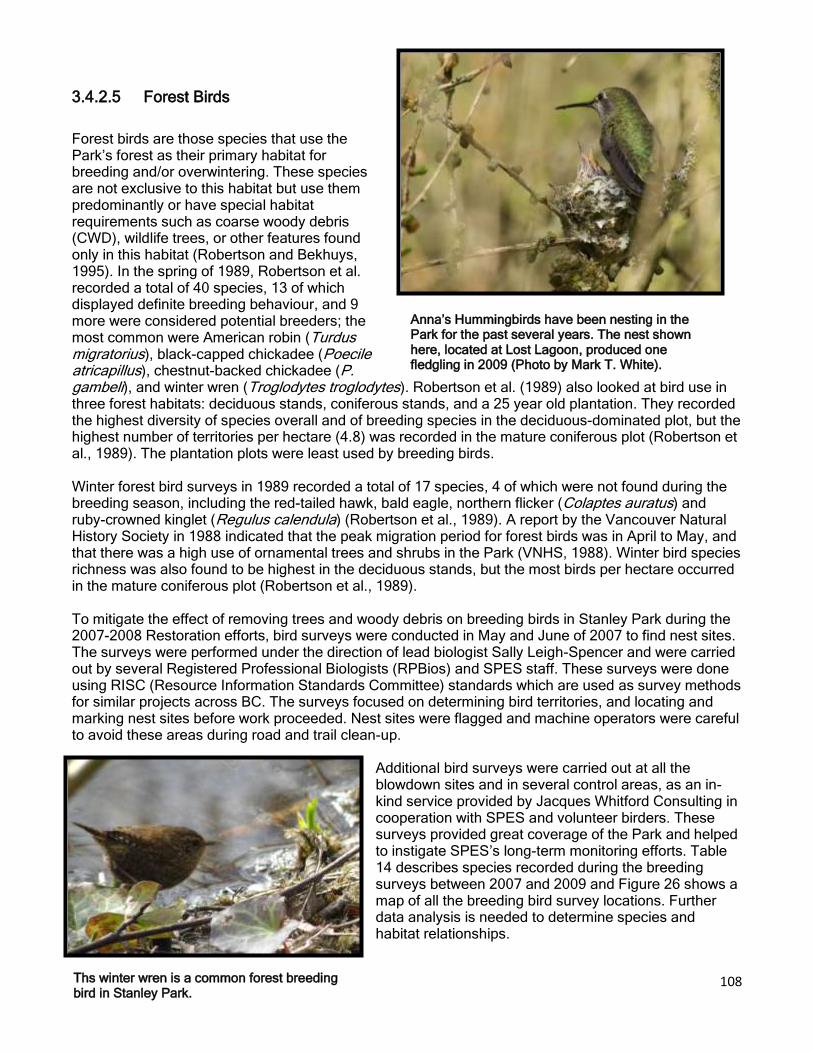
108
Anna‘s Hummingbirds have been nesting in the Park for the past several years. The nest shown here, located at Lost Lagoon, produced one fledgling in 2009 (Photo by Mark T. White).
Ths winter wren is a common forest breeding bird in Stanley Park.
3.4.2.5 Forest Birds
Forest birds are those species that use the Park‘s forest as their primary habitat for breeding and/or overwintering. These species are not exclusive to this habitat but use them predominantly or have special habitat requirements such as coarse woody debris (CWD), wildlife trees, or other features found only in this habitat (Robertson and Bekhuys, 1995). In the spring of 1989, Robertson et al. recorded a total of 40 species, 13 of which displayed definite breeding behaviour, and 9 more were considered potential breeders; the most common were American robin (Turdus migratorius), black-capped chickadee (Poecile atricapillus), chestnut-backed chickadee (P. gambeli), and winter wren (Troglodytes troglodytes). Robertson et al. (1989) also looked at bird use in three forest habitats: deciduous stands, coniferous stands, and a 25 year old plantation. They recorded the highest diversity of species overall and of breeding species in the deciduous-dominated plot, but the highest number of territories per hectare (4.8) was recorded in the mature coniferous plot (Robertson et al., 1989). The plantation plots were least used by breeding birds. Winter forest bird surveys in 1989 recorded a total of 17 species, 4 of which were not found during the breeding season, including the red-tailed hawk, bald eagle, northern flicker (Colaptes auratus) and ruby-crowned kinglet (Regulus calendula) (Robertson et al., 1989). A report by the Vancouver Natural History Society in 1988 indicated that the peak migration period for forest birds was in April to May, and that there was a high use of ornamental trees and shrubs in the Park (VNHS, 1988). Winter bird species richness was also found to be highest in the deciduous stands, but the most birds per hectare occurred in the mature coniferous plot (Robertson et al., 1989). To mitigate the effect of removing trees and woody debris on breeding birds in Stanley Park during the 2007-2008 Restoration efforts, bird surveys were conducted in May and June of 2007 to find nest sites. The surveys were performed under the direction of lead biologist Sally Leigh-Spencer and were carried out by several Registered Professional Biologists (RPBios) and SPES staff. These surveys were done using RISC (Resource Information Standards Committee) standards which are used as survey methods for similar projects across BC. The surveys focused on determining bird territories, and locating and marking nest sites before work proceeded. Nest sites were flagged and machine operators were careful to avoid these areas during road and trail clean-up.
Additional bird surveys were carried out at all the blowdown sites and in several control areas, as an in-kind service provided by Jacques Whitford Consulting in cooperation with SPES and volunteer birders. These surveys provided great coverage of the Park and helped to instigate SPES‘s long-term monitoring efforts. Table 14 describes species recorded during the breeding surveys between 2007 and 2009 and Figure 26 shows a map of all the breeding bird survey locations. Further data analysis is needed to determine species and habitat relationships.
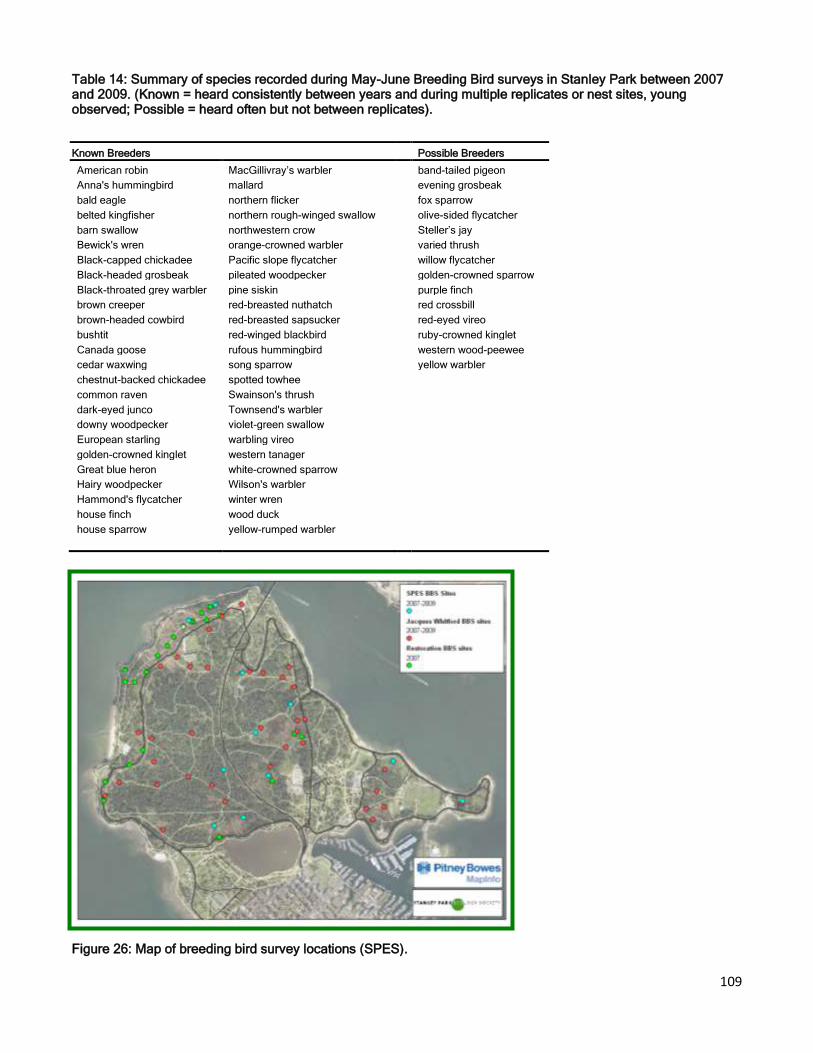
109
Table 14: Summary of species recorded during May-June Breeding Bird surveys in Stanley Park between 2007 and 2009. (Known = heard consistently between years and during multiple replicates or nest sites, young observed; Possible = heard often but not between replicates).
Known Breeders Possible Breeders
American robin MacGillivray‘s warbler band-tailed pigeon
Anna's hummingbird mallard evening grosbeak
bald eagle northern flicker fox sparrow
belted kingfisher northern rough-winged swallow olive-sided flycatcher
barn swallow northwestern crow Steller‘s jay
Bewick's wren orange-crowned warbler varied thrush
Black-capped chickadee Pacific slope flycatcher willow flycatcher
Black-headed grosbeak pileated woodpecker golden-crowned sparrow
Black-throated grey warbler pine siskin purple finch
brown creeper red-breasted nuthatch red crossbill
brown-headed cowbird red-breasted sapsucker red-eyed vireo
bushtit red-winged blackbird ruby-crowned kinglet
Canada goose rufous hummingbird western wood-peewee
cedar waxwing song sparrow yellow warbler
chestnut-backed chickadee spotted towhee
common raven Swainson's thrush
dark-eyed junco Townsend's warbler
downy woodpecker violet-green swallow
European starling warbling vireo
golden-crowned kinglet western tanager
Great blue heron white-crowned sparrow
Hairy woodpecker Wilson's warbler
Hammond's flycatcher winter wren
house finch wood duck
house sparrow yellow-rumped warbler
Figure 26: Map of breeding bird survey locations (SPES).

110
In 1988 there were an estimated 90 pairs of pelagic cormorants nesting on the Prospect Point cliffs but by 1998 they had left the site (Photo by Peter Woods).
It is difficult to compare the 1989 breeding studies to more recent surveys because they used a different methodology (intense plot surveys were conducted at four sites in 1989, unlike the point count surveys used in 2007-2009). One species that was suspected of breeding in 1989 but not found during the 2007-2009 surveys was Vaux‘s swift (Chaetura vauxi) and the chipping sparrow (Spizella passerina) was recorded in 1989 but not in 2007-2009. It is also interesting to note that 18 species were confirmed to be breeding in the Park between 2007-2009, were not confirmed during the 1989 surveys (this may be due to the fact that the more recent surveys covered more habitat types).
3.4.2.6 Colonial nesting Birds
Siwash Rock and the rocky cliffs below Prospect Point have historically been sites used by colony-breeding seabirds. Prior to 1980, pelagic cormorants nested at Siwash Rock, abut they moved to the cliffs below Prospect Point (Robertson and Bekhuys, 1995). In 1988 there was an estimated 90 pairs at this location and similar numbers persisted until 1995 along with at least three pairs of pigeon guillemots and several glaucous-winged gulls (Larus glaucescens) (Robertson and Bekhuys, 1995). Despite the continued use of the site as a resting place for these birds, there has been no evidence of pelagic cormorant nests since 1998 when they moved under the Granville and Burrard Street bridges. Park Board staff cite the cause for this movement as being due to the increased predation pressure from bald eagles nesting in the area (Mike Mackintosh, pers. comm.). However, there is some evidence that cliff scaling at Prospect Point in the years prior may have contributed to their abandonment of the cliffs. Rock scaling was carried out each year from 1988 to 2005 by contractors along the cliffs. This was done to prevent rocks from falling on people using the seawall and the timing was dependant on climatic conditions (usually early spring when freezing and thawing cycles had stopped). Although these activities took place for many years, they were documented in early May 1989, and in March-April in 1990 which overlapped with accepted start date for courtship activities in this species (Peter Woods, pers. comm.). A biologist with the provincial government commented in 2005 with respect to the situation saying that "... the birds in the early stages of nesting are more vulnerable to disturbance and will abandon nests more easily than later in the nesting season"; by that time the birds had already abandoned the nesting site. Between 1998 and 2007, the only species reported nesting at the site were glaucous-winged gulls (one or two pairs per year) and one pair of pigeon guillemots (Peter Woods, pers. comm.). Stanley Park‘s Commemorative Integrity Statement also describes the colony of pelagic cormorants as having become established at the site in the 1980s and continuing until the time of its writing in 2002 (Parks Canada, 2002). However, the source of the data was likely out of date as no cormorants had been nesting at the site between 1998-2002. The largest colony of nesting birds in Stanley Park is the great blue heron colony that has existed at various locations in the Park since 1921 (see Section 3.6.8.3 for more details).
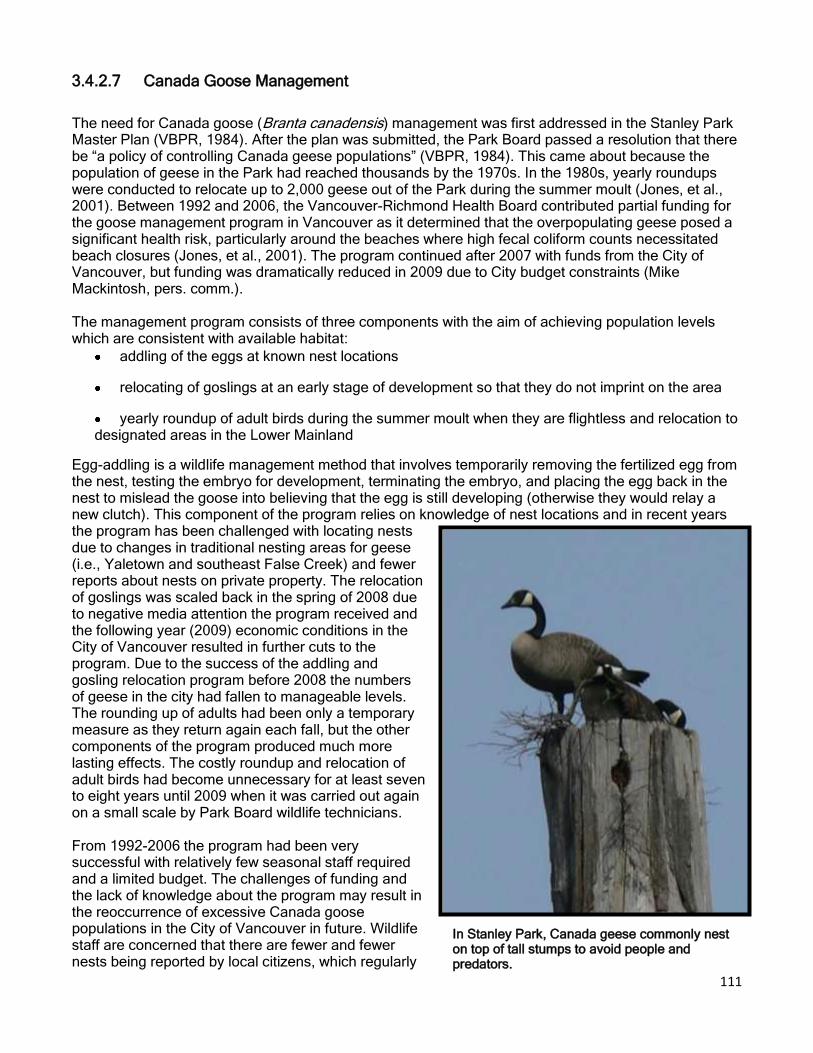
111
In Stanley Park, Canada geese commonly nest on top of tall stumps to avoid people and predators.
3.4.2.7 Canada Goose Management
The need for Canada goose (Branta canadensis) management was first addressed in the Stanley Park Master Plan (VBPR, 1984). After the plan was submitted, the Park Board passed a resolution that there be ―a policy of controlling Canada geese populations‖ (VBPR, 1984). This came about because the population of geese in the Park had reached thousands by the 1970s. In the 1980s, yearly roundups were conducted to relocate up to 2,000 geese out of the Park during the summer moult (Jones, et al., 2001). Between 1992 and 2006, the Vancouver-Richmond Health Board contributed partial funding for the goose management program in Vancouver as it determined that the overpopulating geese posed a significant health risk, particularly around the beaches where high fecal coliform counts necessitated beach closures (Jones, et al., 2001). The program continued after 2007 with funds from the City of Vancouver, but funding was dramatically reduced in 2009 due to City budget constraints (Mike Mackintosh, pers. comm.). The management program consists of three components with the aim of achieving population levels which are consistent with available habitat:
addling of the eggs at known nest locations
relocating of goslings at an early stage of development so that they do not imprint on the area
yearly roundup of adult birds during the summer moult when they are flightless and relocation to designated areas in the Lower Mainland
Egg-addling is a wildlife management method that involves temporarily removing the fertilized egg from the nest, testing the embryo for development, terminating the embryo, and placing the egg back in the nest to mislead the goose into believing that the egg is still developing (otherwise they would relay a new clutch). This component of the program relies on knowledge of nest locations and in recent years the program has been challenged with locating nests due to changes in traditional nesting areas for geese (i.e., Yaletown and southeast False Creek) and fewer reports about nests on private property. The relocation of goslings was scaled back in the spring of 2008 due to negative media attention the program received and the following year (2009) economic conditions in the City of Vancouver resulted in further cuts to the program. Due to the success of the addling and gosling relocation program before 2008 the numbers of geese in the city had fallen to manageable levels. The rounding up of adults had been only a temporary measure as they return again each fall, but the other components of the program produced much more lasting effects. The costly roundup and relocation of adult birds had become unnecessary for at least seven to eight years until 2009 when it was carried out again on a small scale by Park Board wildlife technicians. From 1992-2006 the program had been very successful with relatively few seasonal staff required and a limited budget. The challenges of funding and the lack of knowledge about the program may result in the reoccurrence of excessive Canada goose populations in the City of Vancouver in future. Wildlife staff are concerned that there are fewer and fewer nests being reported by local citizens, which regularly
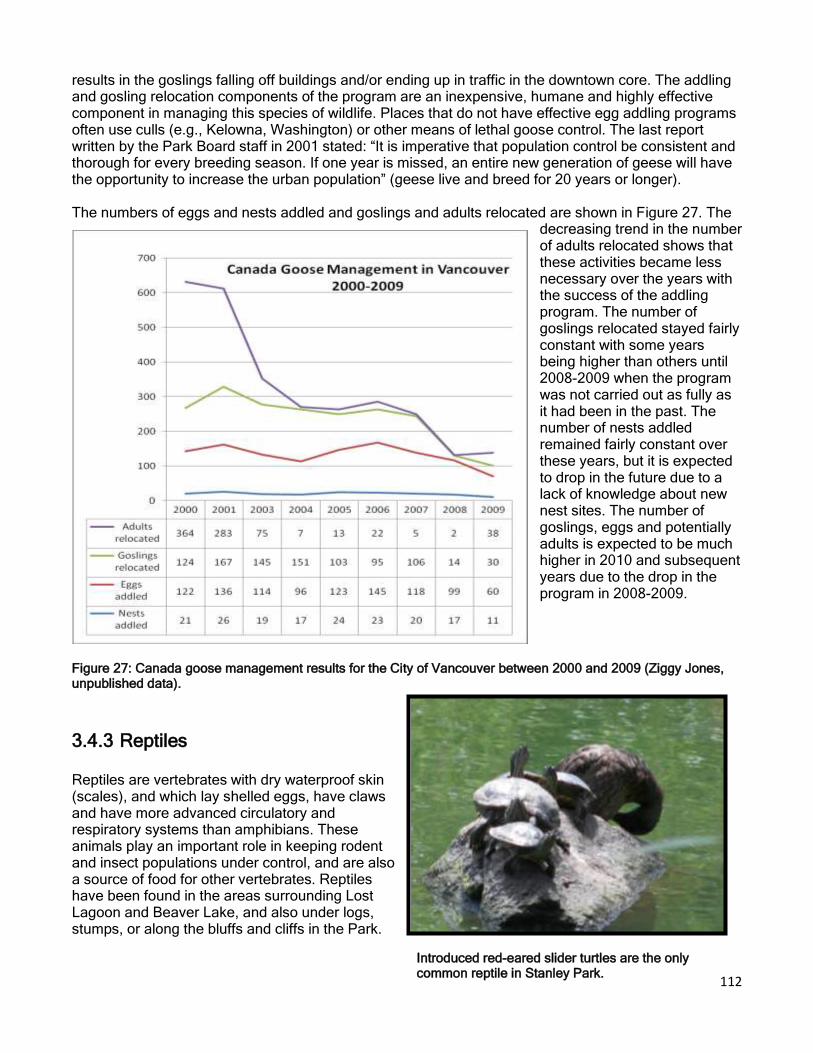
112
Introduced red-eared slider turtles are the only common reptile in Stanley Park.
results in the goslings falling off buildings and/or ending up in traffic in the downtown core. The addling and gosling relocation components of the program are an inexpensive, humane and highly effective component in managing this species of wildlife. Places that do not have effective egg addling programs often use culls (e.g., Kelowna, Washington) or other means of lethal goose control. The last report written by the Park Board staff in 2001 stated: ―It is imperative that population control be consistent and thorough for every breeding season. If one year is missed, an entire new generation of geese will have the opportunity to increase the urban population‖ (geese live and breed for 20 years or longer). The numbers of eggs and nests addled and goslings and adults relocated are shown in Figure 27. The
decreasing trend in the number of adults relocated shows that these activities became less necessary over the years with the success of the addling program. The number of goslings relocated stayed fairly constant with some years being higher than others until 2008-2009 when the program was not carried out as fully as it had been in the past. The number of nests addled remained fairly constant over these years, but it is expected to drop in the future due to a lack of knowledge about new nest sites. The number of goslings, eggs and potentially adults is expected to be much higher in 2010 and subsequent years due to the drop in the program in 2008-2009.
Figure 27: Canada goose management results for the City of Vancouver between 2000 and 2009 (Ziggy Jones, unpublished data).
3.4.3 Reptiles Reptiles are vertebrates with dry waterproof skin (scales), and which lay shelled eggs, have claws and have more advanced circulatory and respiratory systems than amphibians. These animals play an important role in keeping rodent and insect populations under control, and are also a source of food for other vertebrates. Reptiles have been found in the areas surrounding Lost Lagoon and Beaver Lake, and also under logs, stumps, or along the bluffs and cliffs in the Park.
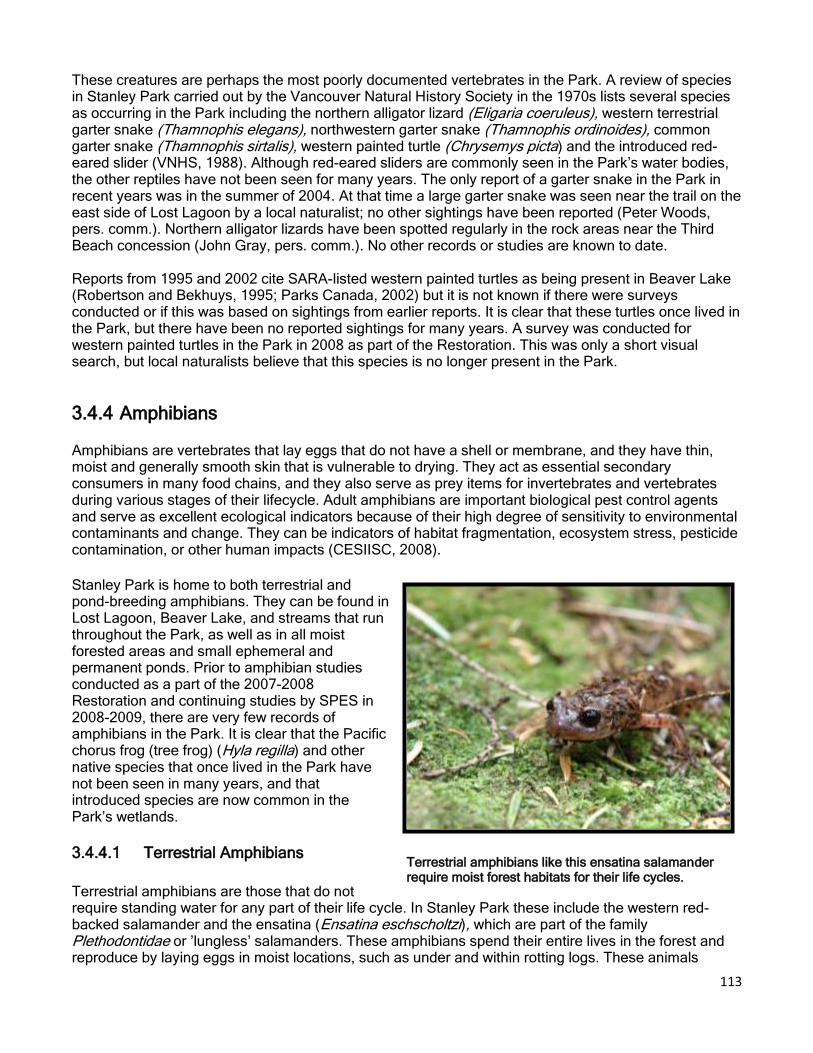
113
Terrestrial amphibians like this ensatina salamander require moist forest habitats for their life cycles.
These creatures are perhaps the most poorly documented vertebrates in the Park. A review of species in Stanley Park carried out by the Vancouver Natural History Society in the 1970s lists several species as occurring in the Park including the northern alligator lizard (Eligaria coeruleus), western terrestrial garter snake (Thamnophis elegans), northwestern garter snake (Thamnophis ordinoides), common garter snake (Thamnophis sirtalis), western painted turtle (Chrysemys picta) and the introduced red-eared slider (VNHS, 1988). Although red-eared sliders are commonly seen in the Park‘s water bodies, the other reptiles have not been seen for many years. The only report of a garter snake in the Park in recent years was in the summer of 2004. At that time a large garter snake was seen near the trail on the east side of Lost Lagoon by a local naturalist; no other sightings have been reported (Peter Woods, pers. comm.). Northern alligator lizards have been spotted regularly in the rock areas near the Third Beach concession (John Gray, pers. comm.). No other records or studies are known to date. Reports from 1995 and 2002 cite SARA-listed western painted turtles as being present in Beaver Lake (Robertson and Bekhuys, 1995; Parks Canada, 2002) but it is not known if there were surveys conducted or if this was based on sightings from earlier reports. It is clear that these turtles once lived in the Park, but there have been no reported sightings for many years. A survey was conducted for western painted turtles in the Park in 2008 as part of the Restoration. This was only a short visual search, but local naturalists believe that this species is no longer present in the Park.
3.4.4 Amphibians
Amphibians are vertebrates that lay eggs that do not have a shell or membrane, and they have thin, moist and generally smooth skin that is vulnerable to drying. They act as essential secondary consumers in many food chains, and they also serve as prey items for invertebrates and vertebrates during various stages of their lifecycle. Adult amphibians are important biological pest control agents and serve as excellent ecological indicators because of their high degree of sensitivity to environmental contaminants and change. They can be indicators of habitat fragmentation, ecosystem stress, pesticide contamination, or other human impacts (CESIISC, 2008).
Stanley Park is home to both terrestrial and pond-breeding amphibians. They can be found in Lost Lagoon, Beaver Lake, and streams that run throughout the Park, as well as in all moist forested areas and small ephemeral and permanent ponds. Prior to amphibian studies conducted as a part of the 2007-2008 Restoration and continuing studies by SPES in 2008-2009, there are very few records of amphibians in the Park. It is clear that the Pacific chorus frog (tree frog) (Hyla regilla) and other native species that once lived in the Park have not been seen in many years, and that introduced species are now common in the Park‘s wetlands.
3.4.4.1 Terrestrial Amphibians
Terrestrial amphibians are those that do not require standing water for any part of their life cycle. In Stanley Park these include the western red-backed salamander and the ensatina (Ensatina eschscholtzi), which are part of the family Plethodontidae or ‘lungless‘ salamanders. These amphibians spend their entire lives in the forest and reproduce by laying eggs in moist locations, such as under and within rotting logs. These animals
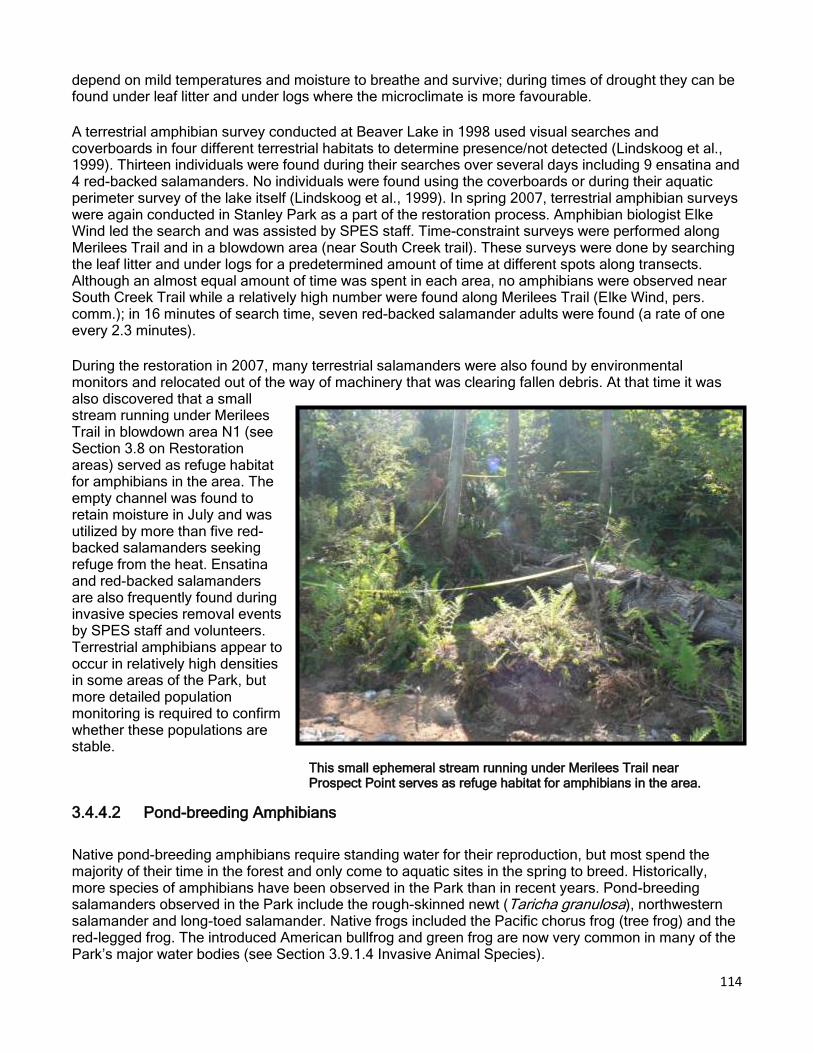
114
This small ephemeral stream running under Merilees Trail near Prospect Point serves as refuge habitat for amphibians in the area.
depend on mild temperatures and moisture to breathe and survive; during times of drought they can be found under leaf litter and under logs where the microclimate is more favourable.
A terrestrial amphibian survey conducted at Beaver Lake in 1998 used visual searches and coverboards in four different terrestrial habitats to determine presence/not detected (Lindskoog et al., 1999). Thirteen individuals were found during their searches over several days including 9 ensatina and 4 red-backed salamanders. No individuals were found using the coverboards or during their aquatic perimeter survey of the lake itself (Lindskoog et al., 1999). In spring 2007, terrestrial amphibian surveys were again conducted in Stanley Park as a part of the restoration process. Amphibian biologist Elke Wind led the search and was assisted by SPES staff. Time-constraint surveys were performed along Merilees Trail and in a blowdown area (near South Creek trail). These surveys were done by searching the leaf litter and under logs for a predetermined amount of time at different spots along transects. Although an almost equal amount of time was spent in each area, no amphibians were observed near South Creek Trail while a relatively high number were found along Merilees Trail (Elke Wind, pers. comm.); in 16 minutes of search time, seven red-backed salamander adults were found (a rate of one every 2.3 minutes).
During the restoration in 2007, many terrestrial salamanders were also found by environmental monitors and relocated out of the way of machinery that was clearing fallen debris. At that time it was also discovered that a small stream running under Merilees Trail in blowdown area N1 (see Section 3.8 on Restoration areas) served as refuge habitat for amphibians in the area. The empty channel was found to retain moisture in July and was utilized by more than five red-backed salamanders seeking refuge from the heat. Ensatina and red-backed salamanders are also frequently found during invasive species removal events by SPES staff and volunteers. Terrestrial amphibians appear to occur in relatively high densities in some areas of the Park, but more detailed population monitoring is required to confirm whether these populations are stable.
3.4.4.2 Pond-breeding Amphibians
Native pond-breeding amphibians require standing water for their reproduction, but most spend the majority of their time in the forest and only come to aquatic sites in the spring to breed. Historically, more species of amphibians have been observed in the Park than in recent years. Pond-breeding salamanders observed in the Park include the rough-skinned newt (Taricha granulosa), northwestern salamander and long-toed salamander. Native frogs included the Pacific chorus frog (tree frog) and the red-legged frog. The introduced American bullfrog and green frog are now very common in many of the Park‘s major water bodies (see Section 3.9.1.4 Invasive Animal Species).

115
Amphibian biologist Elke Wind (left) and SPES staff Robyn Worcester (right) conducting pond-breeding amphibian surveys in Beaver Lake in 2007. Photo by Peter Woods.
In spring 2007, pond-breeding amphibian surveys were also conducted in Beaver Lake and Lost Lagoon as a part of the Restoration. Elke Wind and SPES staff conducted visual searches and funnel trapping over several days in the spring. The visual searches revealed many invasive green frogs and bullfrogs as well as four northwestern salamander egg masses. Funnel trapping was conducted by setting collapsible, unbaited, nylon mesh minnow traps in the water overnight. Following similar protocols, a second visual search and funnel trapping survey was conducted in the Park in 2009 that produced similar results.
Table 15 shows the results of the trapping surveys in various locations in the Park in 2007 and 2009. The data show that there were many more green
frog/bullfrog tadpoles recovered in Beaver Lake in 2007 (about 1.0 tadpole per trap) as opposed to 2009 (about 0.4 per trap) despite the traps being set in similar locations. This may not actually indicate a decrease in population, as half of the traps were set about one month earlier in 2009, which may have skewed the results. The trapping also revealed similar numbers of northwestern salamander larvae observed in the lake between the two years. In 2009, Beaver Pond and Moose Pond (located in the miniature train area) were also added to the study but only one northwestern salamander larva was caught.
Table 15: Results of amphibian funnel trapping surveys conducted in various locations in Stanley Park in 2007 and 2009.
Visual searches in the major water bodies of the Park revealed that there are many egg masses being laid by northwestern salamanders and they are especially prominent in Beaver Pond and Moose Pond (see Table 16). These two water bodies also appear to be free, so far, from invasive bull frogs and
Location Dates
Green/ Bullfrog Tadpoles
Green Frog Juv./Adults
Bullfrog Juv./Adults
Northwestern Salamander Larvae/Neotene
# Traps (all traps were left for one night)
Beaver Lake (2007) 18-May 19 - - 1 18
Beaver Lake (2009) 19-Apr 16-May 7 1 2 16
Biofiltration pond (2007) 18-May 2 1 - 5
Beaver Pond (2009) 29-Apr - - - 1 3
Moose Pond (2009) 29-Apr - - - - 5 Total 28 1 1 4
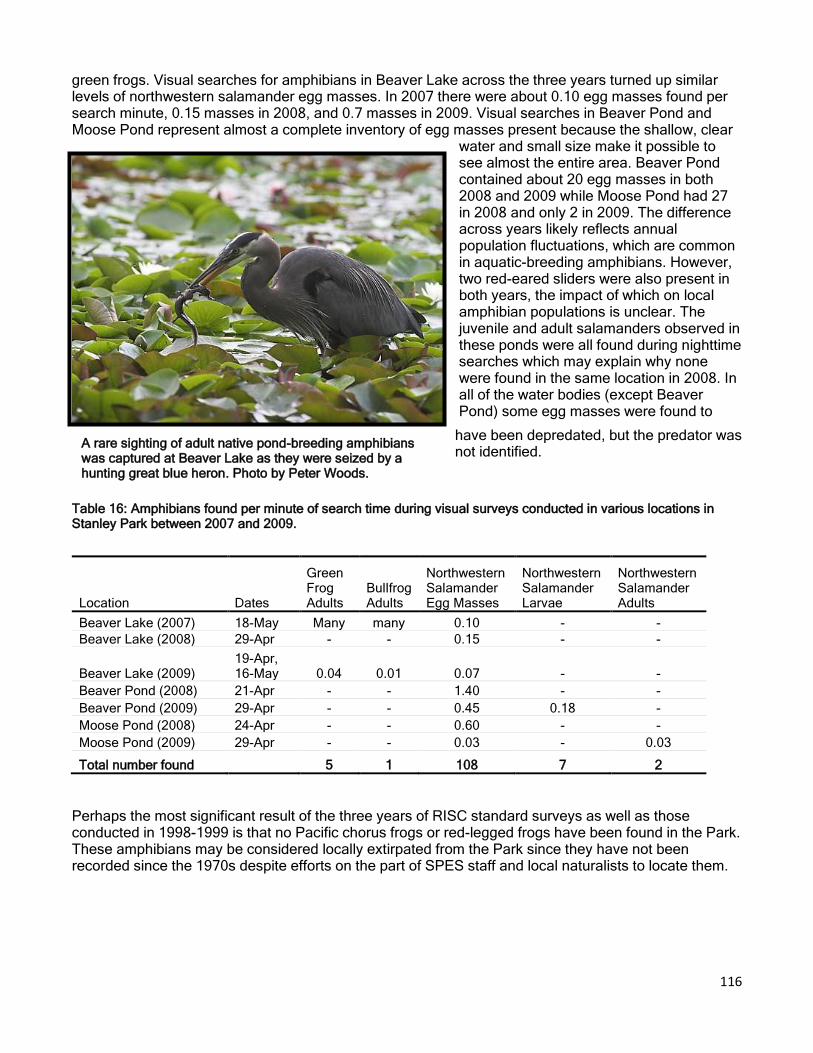
116
A rare sighting of adult native pond-breeding amphibians was captured at Beaver Lake as they were seized by a hunting great blue heron. Photo by Peter Woods.
green frogs. Visual searches for amphibians in Beaver Lake across the three years turned up similar levels of northwestern salamander egg masses. In 2007 there were about 0.10 egg masses found per search minute, 0.15 masses in 2008, and 0.7 masses in 2009. Visual searches in Beaver Pond and Moose Pond represent almost a complete inventory of egg masses present because the shallow, clear
water and small size make it possible to see almost the entire area. Beaver Pond contained about 20 egg masses in both 2008 and 2009 while Moose Pond had 27 in 2008 and only 2 in 2009. The difference across years likely reflects annual population fluctuations, which are common in aquatic-breeding amphibians. However, two red-eared sliders were also present in both years, the impact of which on local amphibian populations is unclear. The juvenile and adult salamanders observed in these ponds were all found during nighttime searches which may explain why none were found in the same location in 2008. In all of the water bodies (except Beaver Pond) some egg masses were found to
have been depredated, but the predator was not identified.
Table 16: Amphibians found per minute of search time during visual surveys conducted in various locations in Stanley Park between 2007 and 2009.
Location Dates
Green Frog Adults
Bullfrog Adults
Northwestern Salamander Egg Masses
Northwestern Salamander Larvae
Northwestern Salamander Adults
Beaver Lake (2007) 18-May Many many 0.10 - -
Beaver Lake (2008) 29-Apr - - 0.15 - -
Beaver Lake (2009) 19-Apr, 16-May 0.04 0.01 0.07 - -
Beaver Pond (2008) 21-Apr - - 1.40 - -
Beaver Pond (2009) 29-Apr - - 0.45 0.18 -
Moose Pond (2008) 24-Apr - - 0.60 - -
Moose Pond (2009) 29-Apr - - 0.03 - 0.03
Total number found 5 1 108 7 2
Perhaps the most significant result of the three years of RISC standard surveys as well as those conducted in 1998-1999 is that no Pacific chorus frogs or red-legged frogs have been found in the Park. These amphibians may be considered locally extirpated from the Park since they have not been recorded since the 1970s despite efforts on the part of SPES staff and local naturalists to locate them.
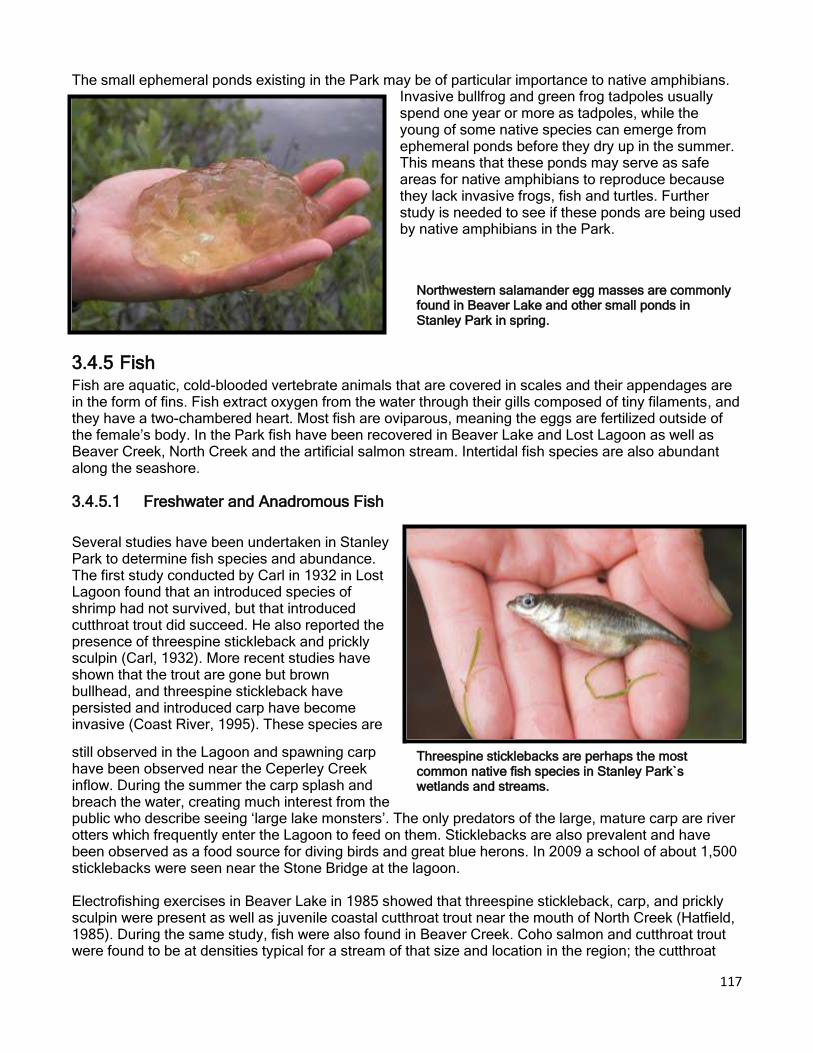
117
Northwestern salamander egg masses are commonly found in Beaver Lake and other small ponds in Stanley Park in spring.
Threespine sticklebacks are perhaps the most common native fish species in Stanley Park`s wetlands and streams.
The small ephemeral ponds existing in the Park may be of particular importance to native amphibians. Invasive bullfrog and green frog tadpoles usually spend one year or more as tadpoles, while the young of some native species can emerge from ephemeral ponds before they dry up in the summer. This means that these ponds may serve as safe areas for native amphibians to reproduce because they lack invasive frogs, fish and turtles. Further study is needed to see if these ponds are being used by native amphibians in the Park.
3.4.5 Fish Fish are aquatic, cold-blooded vertebrate animals that are covered in scales and their appendages are in the form of fins. Fish extract oxygen from the water through their gills composed of tiny filaments, and they have a two-chambered heart. Most fish are oviparous, meaning the eggs are fertilized outside of the female‘s body. In the Park fish have been recovered in Beaver Lake and Lost Lagoon as well as Beaver Creek, North Creek and the artificial salmon stream. Intertidal fish species are also abundant along the seashore.
3.4.5.1 Freshwater and Anadromous Fish
Several studies have been undertaken in Stanley Park to determine fish species and abundance. The first study conducted by Carl in 1932 in Lost Lagoon found that an introduced species of shrimp had not survived, but that introduced cutthroat trout did succeed. He also reported the presence of threespine stickleback and prickly sculpin (Carl, 1932). More recent studies have shown that the trout are gone but brown bullhead, and threespine stickleback have persisted and introduced carp have become invasive (Coast River, 1995). These species are
still observed in the Lagoon and spawning carp have been observed near the Ceperley Creek inflow. During the summer the carp splash and breach the water, creating much interest from the public who describe seeing ‗large lake monsters‘. The only predators of the large, mature carp are river otters which frequently enter the Lagoon to feed on them. Sticklebacks are also prevalent and have been observed as a food source for diving birds and great blue herons. In 2009 a school of about 1,500 sticklebacks were seen near the Stone Bridge at the lagoon. Electrofishing exercises in Beaver Lake in 1985 showed that threespine stickleback, carp, and prickly sculpin were present as well as juvenile coastal cutthroat trout near the mouth of North Creek (Hatfield, 1985). During the same study, fish were also found in Beaver Creek. Coho salmon and cutthroat trout were found to be at densities typical for a stream of that size and location in the region; the cutthroat
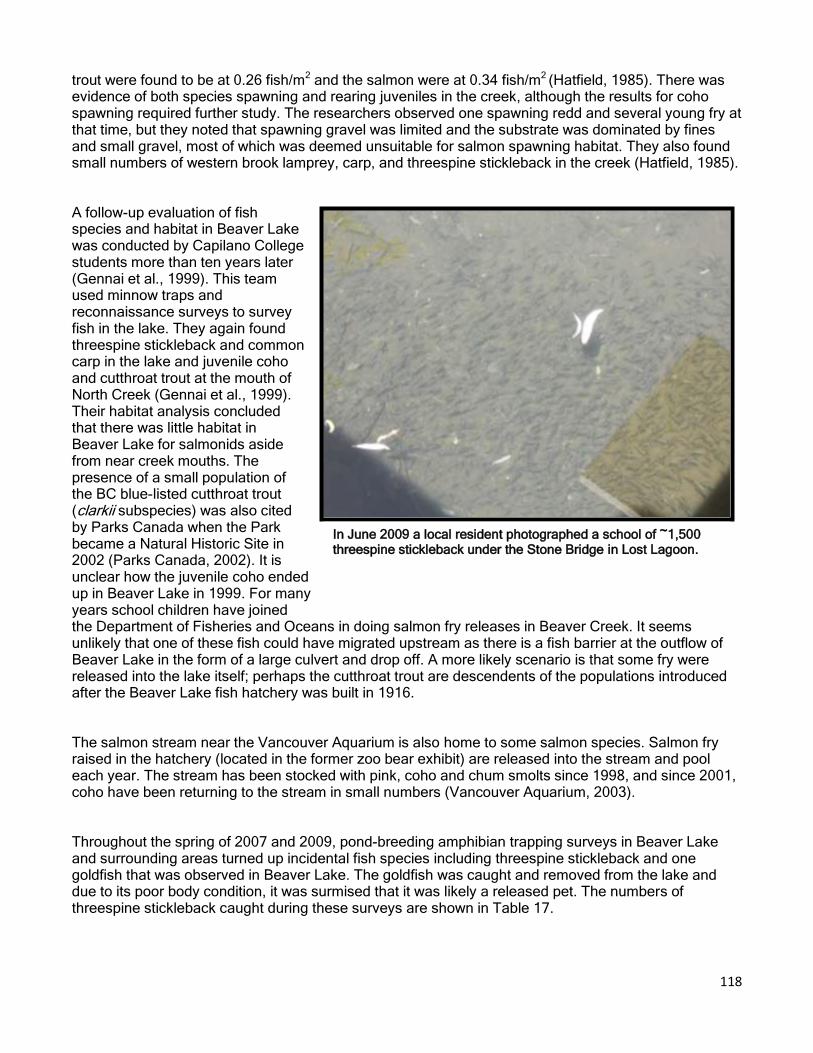
118
trout were found to be at 0.26 fish/m2 and the salmon were at 0.34 fish/m2 (Hatfield, 1985). There was evidence of both species spawning and rearing juveniles in the creek, although the results for coho spawning required further study. The researchers observed one spawning redd and several young fry at that time, but they noted that spawning gravel was limited and the substrate was dominated by fines and small gravel, most of which was deemed unsuitable for salmon spawning habitat. They also found small numbers of western brook lamprey, carp, and threespine stickleback in the creek (Hatfield, 1985). A follow-up evaluation of fish species and habitat in Beaver Lake was conducted by Capilano College students more than ten years later (Gennai et al., 1999). This team used minnow traps and reconnaissance surveys to survey fish in the lake. They again found threespine stickleback and common carp in the lake and juvenile coho and cutthroat trout at the mouth of North Creek (Gennai et al., 1999). Their habitat analysis concluded that there was little habitat in Beaver Lake for salmonids aside from near creek mouths. The presence of a small population of the BC blue-listed cutthroat trout (clarkii subspecies) was also cited by Parks Canada when the Park became a Natural Historic Site in 2002 (Parks Canada, 2002). It is unclear how the juvenile coho ended up in Beaver Lake in 1999. For many years school children have joined the Department of Fisheries and Oceans in doing salmon fry releases in Beaver Creek. It seems unlikely that one of these fish could have migrated upstream as there is a fish barrier at the outflow of Beaver Lake in the form of a large culvert and drop off. A more likely scenario is that some fry were released into the lake itself; perhaps the cutthroat trout are descendents of the populations introduced after the Beaver Lake fish hatchery was built in 1916. The salmon stream near the Vancouver Aquarium is also home to some salmon species. Salmon fry raised in the hatchery (located in the former zoo bear exhibit) are released into the stream and pool each year. The stream has been stocked with pink, coho and chum smolts since 1998, and since 2001, coho have been returning to the stream in small numbers (Vancouver Aquarium, 2003). Throughout the spring of 2007 and 2009, pond-breeding amphibian trapping surveys in Beaver Lake and surrounding areas turned up incidental fish species including threespine stickleback and one goldfish that was observed in Beaver Lake. The goldfish was caught and removed from the lake and due to its poor body condition, it was surmised that it was likely a released pet. The numbers of threespine stickleback caught during these surveys are shown in Table 17.
In June 2009 a local resident photographed a school of ~1,500 threespine stickleback under the Stone Bridge in Lost Lagoon.
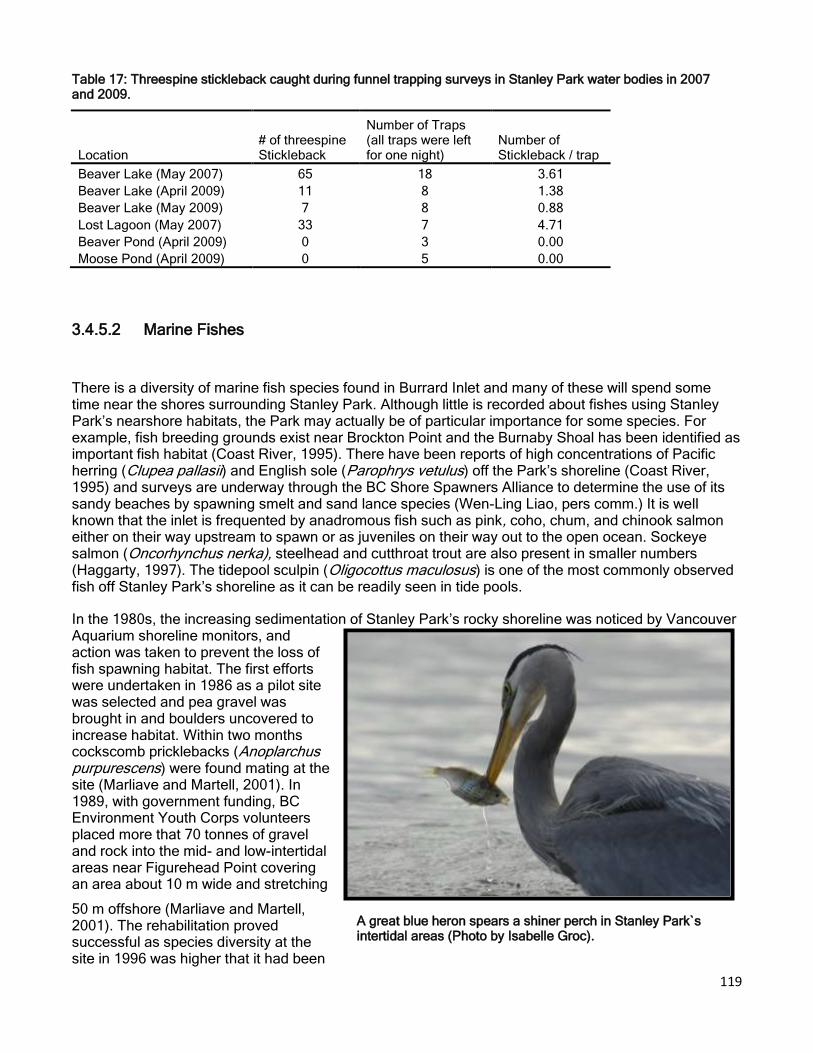
119
Table 17: Threespine stickleback caught during funnel trapping surveys in Stanley Park water bodies in 2007 and 2009.
Location # of threespine Stickleback
Number of Traps (all traps were left for one night)
Number of Stickleback / trap
Beaver Lake (May 2007) 65 18 3.61
Beaver Lake (April 2009) 11 8 1.38
Beaver Lake (May 2009) 7 8 0.88
Lost Lagoon (May 2007) 33 7 4.71
Beaver Pond (April 2009) 0 3 0.00
Moose Pond (April 2009) 0 5 0.00
3.4.5.2 Marine Fishes
There is a diversity of marine fish species found in Burrard Inlet and many of these will spend some time near the shores surrounding Stanley Park. Although little is recorded about fishes using Stanley Park‘s nearshore habitats, the Park may actually be of particular importance for some species. For example, fish breeding grounds exist near Brockton Point and the Burnaby Shoal has been identified as important fish habitat (Coast River, 1995). There have been reports of high concentrations of Pacific herring (Clupea pallasii) and English sole (Parophrys vetulus) off the Park‘s shoreline (Coast River, 1995) and surveys are underway through the BC Shore Spawners Alliance to determine the use of its sandy beaches by spawning smelt and sand lance species (Wen-Ling Liao, pers comm.) It is well known that the inlet is frequented by anadromous fish such as pink, coho, chum, and chinook salmon either on their way upstream to spawn or as juveniles on their way out to the open ocean. Sockeye salmon (Oncorhynchus nerka), steelhead and cutthroat trout are also present in smaller numbers (Haggarty, 1997). The tidepool sculpin (Oligocottus maculosus) is one of the most commonly observed fish off Stanley Park‘s shoreline as it can be readily seen in tide pools.
In the 1980s, the increasing sedimentation of Stanley Park‘s rocky shoreline was noticed by Vancouver Aquarium shoreline monitors, and action was taken to prevent the loss of fish spawning habitat. The first efforts were undertaken in 1986 as a pilot site was selected and pea gravel was brought in and boulders uncovered to increase habitat. Within two months cockscomb pricklebacks (Anoplarchus purpurescens) were found mating at the site (Marliave and Martell, 2001). In 1989, with government funding, BC Environment Youth Corps volunteers placed more that 70 tonnes of gravel and rock into the mid- and low-intertidal areas near Figurehead Point covering an area about 10 m wide and stretching
50 m offshore (Marliave and Martell, 2001). The rehabilitation proved successful as species diversity at the site in 1996 was higher that it had been
A great blue heron spears a shiner perch in Stanley Park`s intertidal areas (Photo by Isabelle Groc).
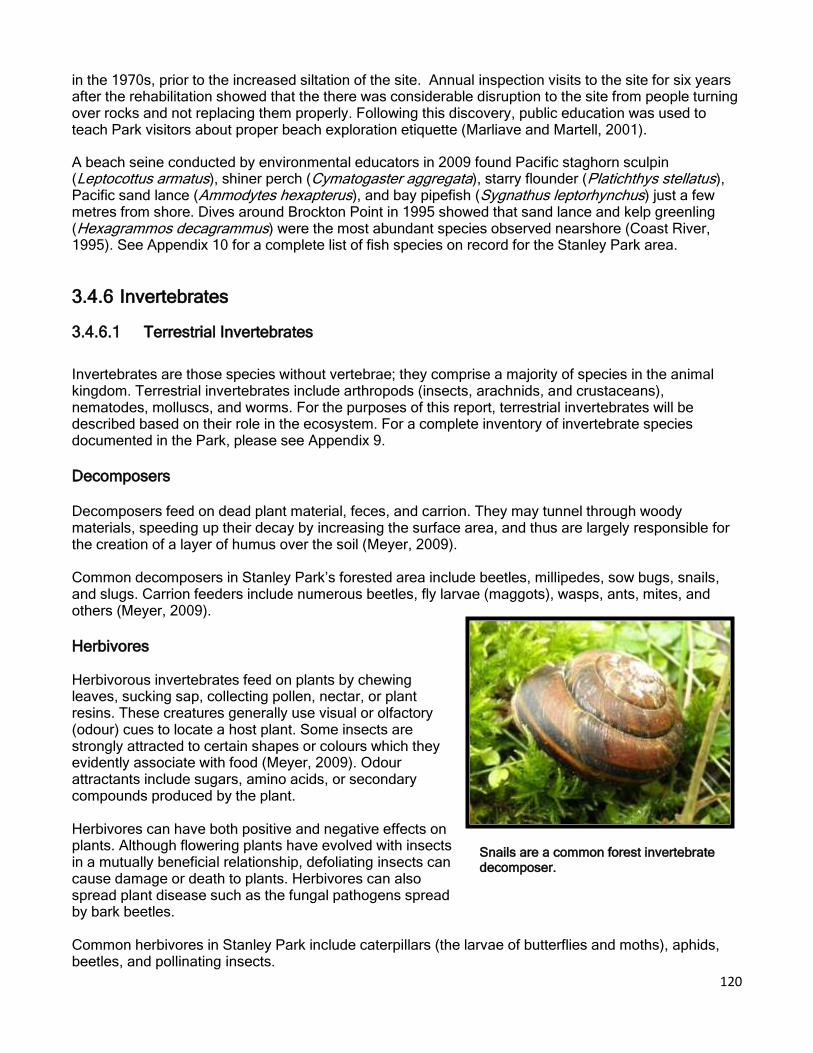
120
in the 1970s, prior to the increased siltation of the site. Annual inspection visits to the site for six years after the rehabilitation showed that the there was considerable disruption to the site from people turning over rocks and not replacing them properly. Following this discovery, public education was used to teach Park visitors about proper beach exploration etiquette (Marliave and Martell, 2001).
A beach seine conducted by environmental educators in 2009 found Pacific staghorn sculpin (Leptocottus armatus), shiner perch (Cymatogaster aggregata), starry flounder (Platichthys stellatus), Pacific sand lance (Ammodytes hexapterus), and bay pipefish (Sygnathus leptorhynchus) just a few metres from shore. Dives around Brockton Point in 1995 showed that sand lance and kelp greenling (Hexagrammos decagrammus) were the most abundant species observed nearshore (Coast River, 1995). See Appendix 10 for a complete list of fish species on record for the Stanley Park area.
3.4.6 Invertebrates
3.4.6.1 Terrestrial Invertebrates
Invertebrates are those species without vertebrae; they comprise a majority of species in the animal kingdom. Terrestrial invertebrates include arthropods (insects, arachnids, and crustaceans), nematodes, molluscs, and worms. For the purposes of this report, terrestrial invertebrates will be described based on their role in the ecosystem. For a complete inventory of invertebrate species documented in the Park, please see Appendix 9.
Decomposers Decomposers feed on dead plant material, feces, and carrion. They may tunnel through woody materials, speeding up their decay by increasing the surface area, and thus are largely responsible for the creation of a layer of humus over the soil (Meyer, 2009). Common decomposers in Stanley Park‘s forested area include beetles, millipedes, sow bugs, snails, and slugs. Carrion feeders include numerous beetles, fly larvae (maggots), wasps, ants, mites, and others (Meyer, 2009).
Herbivores Herbivorous invertebrates feed on plants by chewing leaves, sucking sap, collecting pollen, nectar, or plant resins. These creatures generally use visual or olfactory (odour) cues to locate a host plant. Some insects are strongly attracted to certain shapes or colours which they evidently associate with food (Meyer, 2009). Odour attractants include sugars, amino acids, or secondary compounds produced by the plant. Herbivores can have both positive and negative effects on plants. Although flowering plants have evolved with insects in a mutually beneficial relationship, defoliating insects can cause damage or death to plants. Herbivores can also spread plant disease such as the fungal pathogens spread by bark beetles. Common herbivores in Stanley Park include caterpillars (the larvae of butterflies and moths), aphids, beetles, and pollinating insects.
Snails are a common forest invertebrate decomposer.
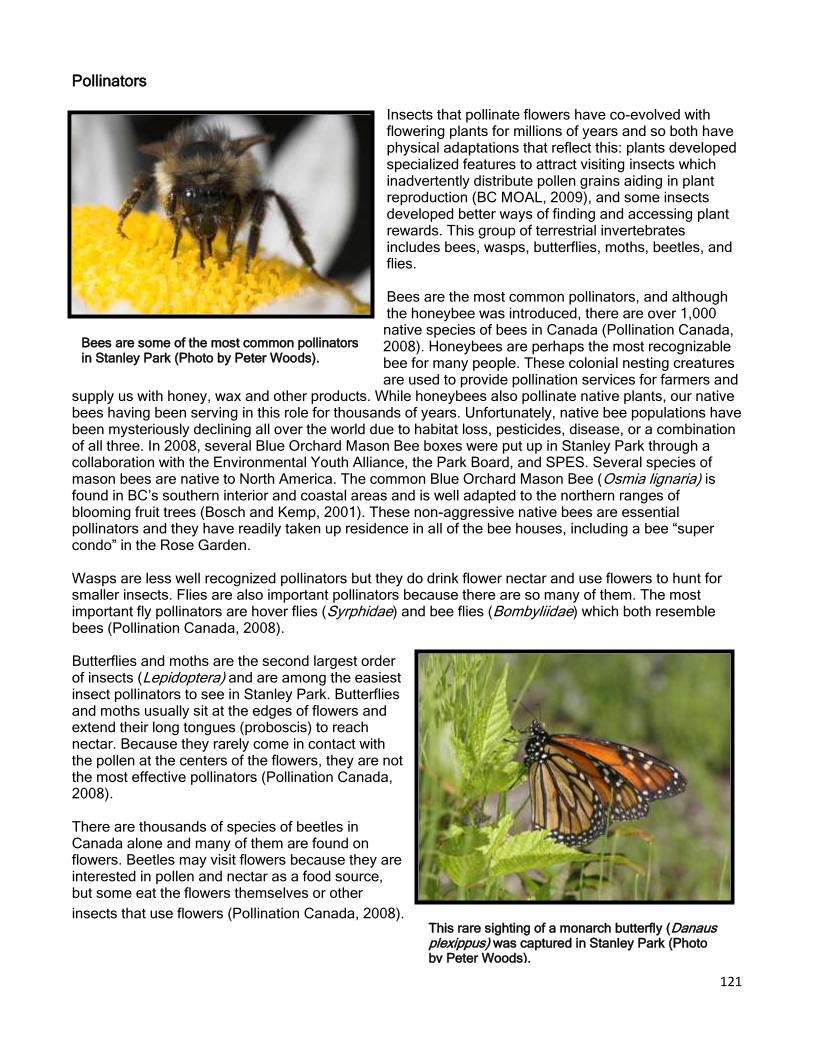
121
This rare sighting of a monarch butterfly (Danaus plexippus) was captured in Stanley Park (Photo by Peter Woods).
Pollinators
Insects that pollinate flowers have co-evolved with flowering plants for millions of years and so both have physical adaptations that reflect this: plants developed specialized features to attract visiting insects which inadvertently distribute pollen grains aiding in plant reproduction (BC MOAL, 2009), and some insects developed better ways of finding and accessing plant rewards. This group of terrestrial invertebrates includes bees, wasps, butterflies, moths, beetles, and flies. Bees are the most common pollinators, and although the honeybee was introduced, there are over 1,000 native species of bees in Canada (Pollination Canada, 2008). Honeybees are perhaps the most recognizable bee for many people. These colonial nesting creatures are used to provide pollination services for farmers and
supply us with honey, wax and other products. While honeybees also pollinate native plants, our native bees having been serving in this role for thousands of years. Unfortunately, native bee populations have been mysteriously declining all over the world due to habitat loss, pesticides, disease, or a combination of all three. In 2008, several Blue Orchard Mason Bee boxes were put up in Stanley Park through a collaboration with the Environmental Youth Alliance, the Park Board, and SPES. Several species of mason bees are native to North America. The common Blue Orchard Mason Bee (Osmia lignaria) is found in BC‘s southern interior and coastal areas and is well adapted to the northern ranges of blooming fruit trees (Bosch and Kemp, 2001). These non-aggressive native bees are essential pollinators and they have readily taken up residence in all of the bee houses, including a bee ―super condo‖ in the Rose Garden. Wasps are less well recognized pollinators but they do drink flower nectar and use flowers to hunt for smaller insects. Flies are also important pollinators because there are so many of them. The most important fly pollinators are hover flies (Syrphidae) and bee flies (Bombyliidae) which both resemble bees (Pollination Canada, 2008). Butterflies and moths are the second largest order of insects (Lepidoptera) and are among the easiest insect pollinators to see in Stanley Park. Butterflies and moths usually sit at the edges of flowers and extend their long tongues (proboscis) to reach nectar. Because they rarely come in contact with the pollen at the centers of the flowers, they are not the most effective pollinators (Pollination Canada, 2008). There are thousands of species of beetles in Canada alone and many of them are found on flowers. Beetles may visit flowers because they are interested in pollen and nectar as a food source, but some eat the flowers themselves or other
insects that use flowers (Pollination Canada, 2008).
Bees are some of the most common pollinators in Stanley Park (Photo by Peter Woods).
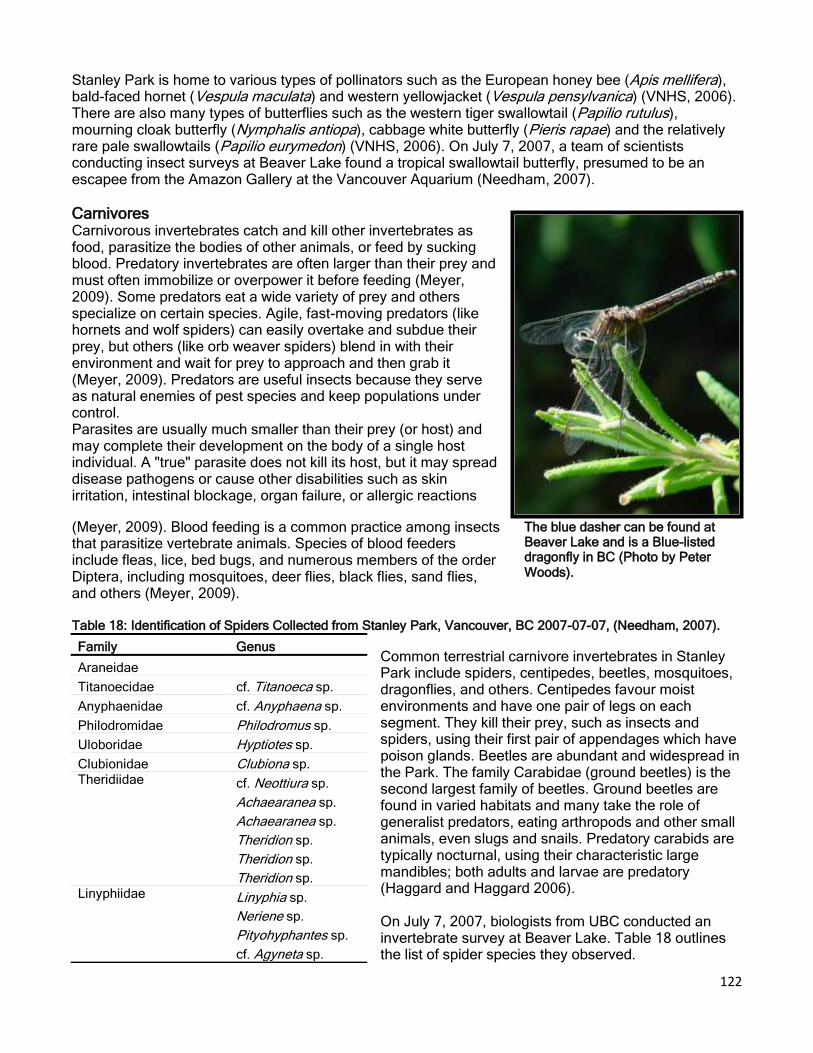
122
Stanley Park is home to various types of pollinators such as the European honey bee (Apis mellifera), bald-faced hornet (Vespula maculata) and western yellowjacket (Vespula pensylvanica) (VNHS, 2006). There are also many types of butterflies such as the western tiger swallowtail (Papilio rutulus), mourning cloak butterfly (Nymphalis antiopa), cabbage white butterfly (Pieris rapae) and the relatively rare pale swallowtails (Papilio eurymedon) (VNHS, 2006). On July 7, 2007, a team of scientists conducting insect surveys at Beaver Lake found a tropical swallowtail butterfly, presumed to be an escapee from the Amazon Gallery at the Vancouver Aquarium (Needham, 2007).
Carnivores Carnivorous invertebrates catch and kill other invertebrates as food, parasitize the bodies of other animals, or feed by sucking blood. Predatory invertebrates are often larger than their prey and must often immobilize or overpower it before feeding (Meyer, 2009). Some predators eat a wide variety of prey and others specialize on certain species. Agile, fast-moving predators (like hornets and wolf spiders) can easily overtake and subdue their prey, but others (like orb weaver spiders) blend in with their environment and wait for prey to approach and then grab it (Meyer, 2009). Predators are useful insects because they serve as natural enemies of pest species and keep populations under control. Parasites are usually much smaller than their prey (or host) and may complete their development on the body of a single host individual. A "true" parasite does not kill its host, but it may spread disease pathogens or cause other disabilities such as skin irritation, intestinal blockage, organ failure, or allergic reactions
(Meyer, 2009). Blood feeding is a common practice among insects that parasitize vertebrate animals. Species of blood feeders include fleas, lice, bed bugs, and numerous members of the order Diptera, including mosquitoes, deer flies, black flies, sand flies, and others (Meyer, 2009). Table 18: Identification of Spiders Collected from Stanley Park, Vancouver, BC 2007-07-07, (Needham, 2007).
Common terrestrial carnivore invertebrates in Stanley Park include spiders, centipedes, beetles, mosquitoes, dragonflies, and others. Centipedes favour moist environments and have one pair of legs on each segment. They kill their prey, such as insects and spiders, using their first pair of appendages which have poison glands. Beetles are abundant and widespread in the Park. The family Carabidae (ground beetles) is the second largest family of beetles. Ground beetles are found in varied habitats and many take the role of generalist predators, eating arthropods and other small animals, even slugs and snails. Predatory carabids are typically nocturnal, using their characteristic large mandibles; both adults and larvae are predatory (Haggard and Haggard 2006). On July 7, 2007, biologists from UBC conducted an invertebrate survey at Beaver Lake. Table 18 outlines the list of spider species they observed.
Family Genus
Araneidae
Titanoecidae cf. Titanoeca sp.
Anyphaenidae cf. Anyphaena sp.
Philodromidae Philodromus sp.
Uloboridae Hyptiotes sp.
Clubionidae Clubiona sp. Theridiidae cf. Neottiura sp.
Achaearanea sp.
Achaearanea sp.
Theridion sp.
Theridion sp.
Theridion sp. Linyphiidae Linyphia sp.
Neriene sp.
Pityohyphantes sp.
cf. Agyneta sp.
The blue dasher can be found at Beaver Lake and is a Blue-listed dragonfly in BC (Photo by Peter Woods).
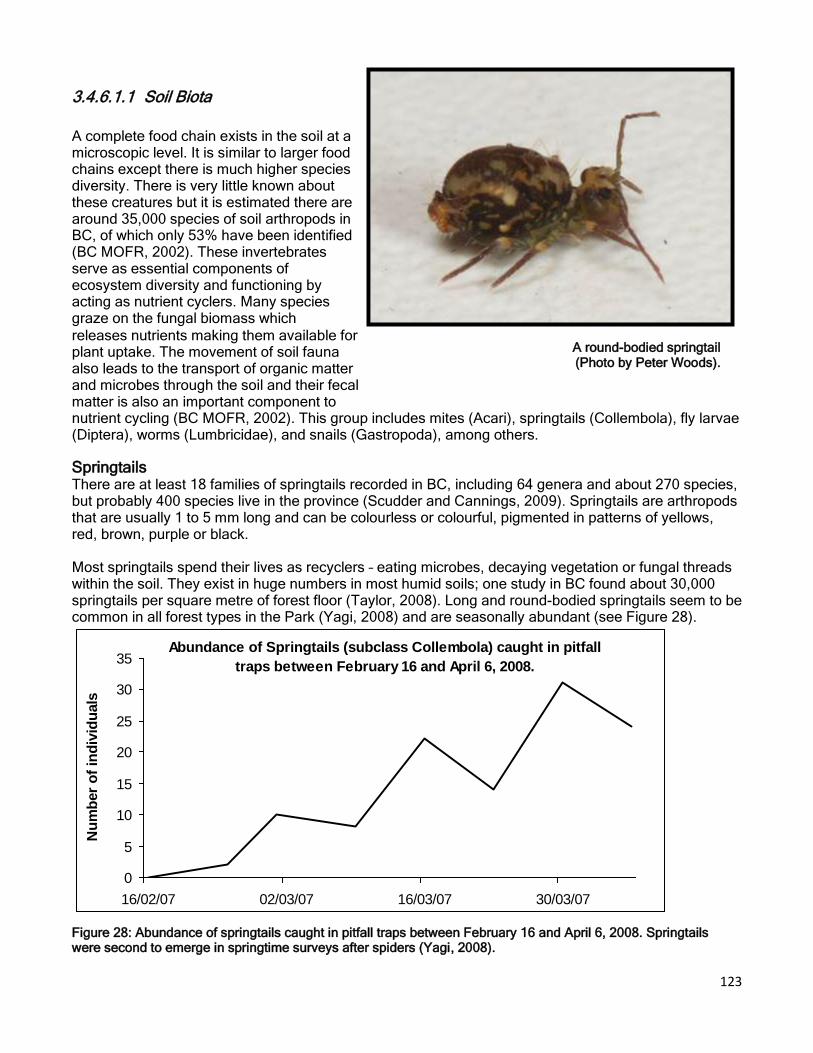
123
3.4.6.1.1 Soil Biota
A complete food chain exists in the soil at a microscopic level. It is similar to larger food chains except there is much higher species diversity. There is very little known about these creatures but it is estimated there are around 35,000 species of soil arthropods in BC, of which only 53% have been identified (BC MOFR, 2002). These invertebrates serve as essential components of ecosystem diversity and functioning by acting as nutrient cyclers. Many species graze on the fungal biomass which
releases nutrients making them available for plant uptake. The movement of soil fauna also leads to the transport of organic matter and microbes through the soil and their fecal matter is also an important component to nutrient cycling (BC MOFR, 2002). This group includes mites (Acari), springtails (Collembola), fly larvae (Diptera), worms (Lumbricidae), and snails (Gastropoda), among others.
Springtails There are at least 18 families of springtails recorded in BC, including 64 genera and about 270 species, but probably 400 species live in the province (Scudder and Cannings, 2009). Springtails are arthropods that are usually 1 to 5 mm long and can be colourless or colourful, pigmented in patterns of yellows, red, brown, purple or black. Most springtails spend their lives as recyclers – eating microbes, decaying vegetation or fungal threads within the soil. They exist in huge numbers in most humid soils; one study in BC found about 30,000 springtails per square metre of forest floor (Taylor, 2008). Long and round-bodied springtails seem to be common in all forest types in the Park (Yagi, 2008) and are seasonally abundant (see Figure 28).
Abundance of Springtails (subclass Collembola) caught in pitfall
traps between February 16 and April 6, 2008.
0
5
10
15
20
25
30
35
16/02/07 02/03/07 16/03/07 30/03/07
Nu
mb
er
of
ind
ivid
uals
Figure 28: Abundance of springtails caught in pitfall traps between February 16 and April 6, 2008. Springtails were second to emerge in springtime surveys after spiders (Yagi, 2008).
A round-bodied springtail (Photo by Peter Woods).
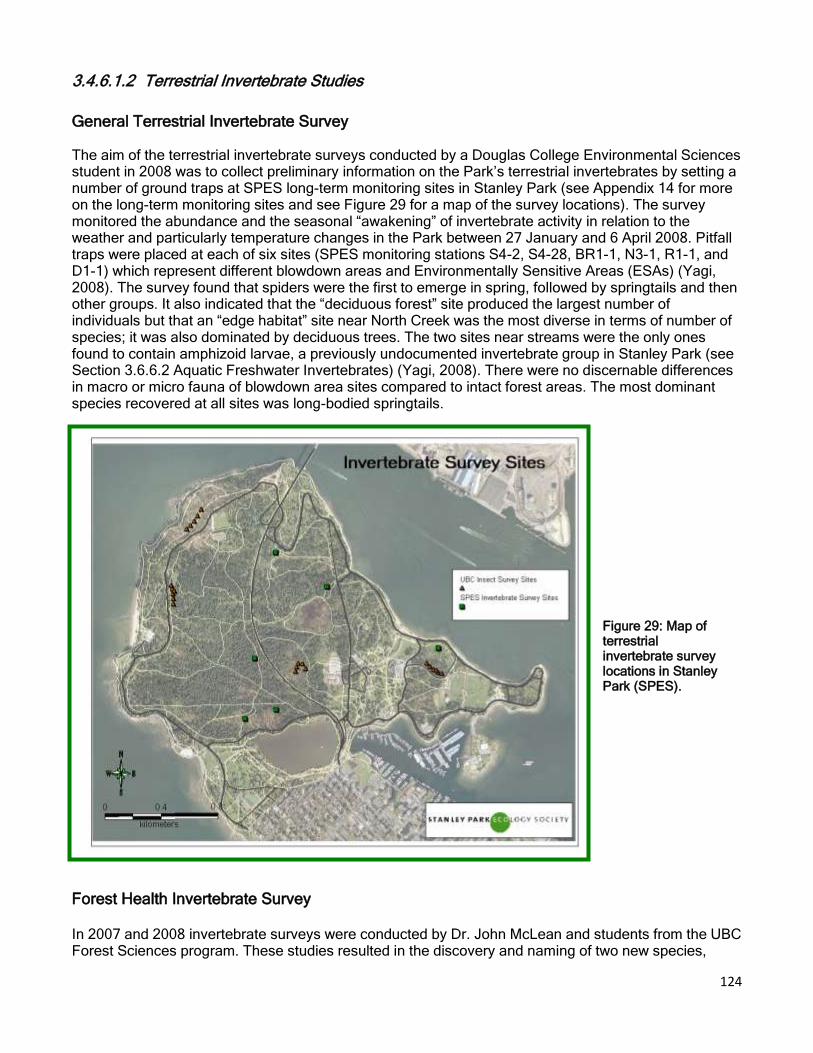
124
3.4.6.1.2 Terrestrial Invertebrate Studies
General Terrestrial Invertebrate Survey The aim of the terrestrial invertebrate surveys conducted by a Douglas College Environmental Sciences student in 2008 was to collect preliminary information on the Park‘s terrestrial invertebrates by setting a number of ground traps at SPES long-term monitoring sites in Stanley Park (see Appendix 14 for more on the long-term monitoring sites and see Figure 29 for a map of the survey locations). The survey monitored the abundance and the seasonal ―awakening‖ of invertebrate activity in relation to the weather and particularly temperature changes in the Park between 27 January and 6 April 2008. Pitfall traps were placed at each of six sites (SPES monitoring stations S4-2, S4-28, BR1-1, N3-1, R1-1, and D1-1) which represent different blowdown areas and Environmentally Sensitive Areas (ESAs) (Yagi, 2008). The survey found that spiders were the first to emerge in spring, followed by springtails and then other groups. It also indicated that the ―deciduous forest‖ site produced the largest number of individuals but that an ―edge habitat‖ site near North Creek was the most diverse in terms of number of species; it was also dominated by deciduous trees. The two sites near streams were the only ones found to contain amphizoid larvae, a previously undocumented invertebrate group in Stanley Park (see Section 3.6.6.2 Aquatic Freshwater Invertebrates) (Yagi, 2008). There were no discernable differences in macro or micro fauna of blowdown area sites compared to intact forest areas. The most dominant species recovered at all sites was long-bodied springtails.
Figure 29: Map of terrestrial invertebrate survey locations in Stanley Park (SPES).
Forest Health Invertebrate Survey In 2007 and 2008 invertebrate surveys were conducted by Dr. John McLean and students from the UBC Forest Sciences program. These studies resulted in the discovery and naming of two new species,
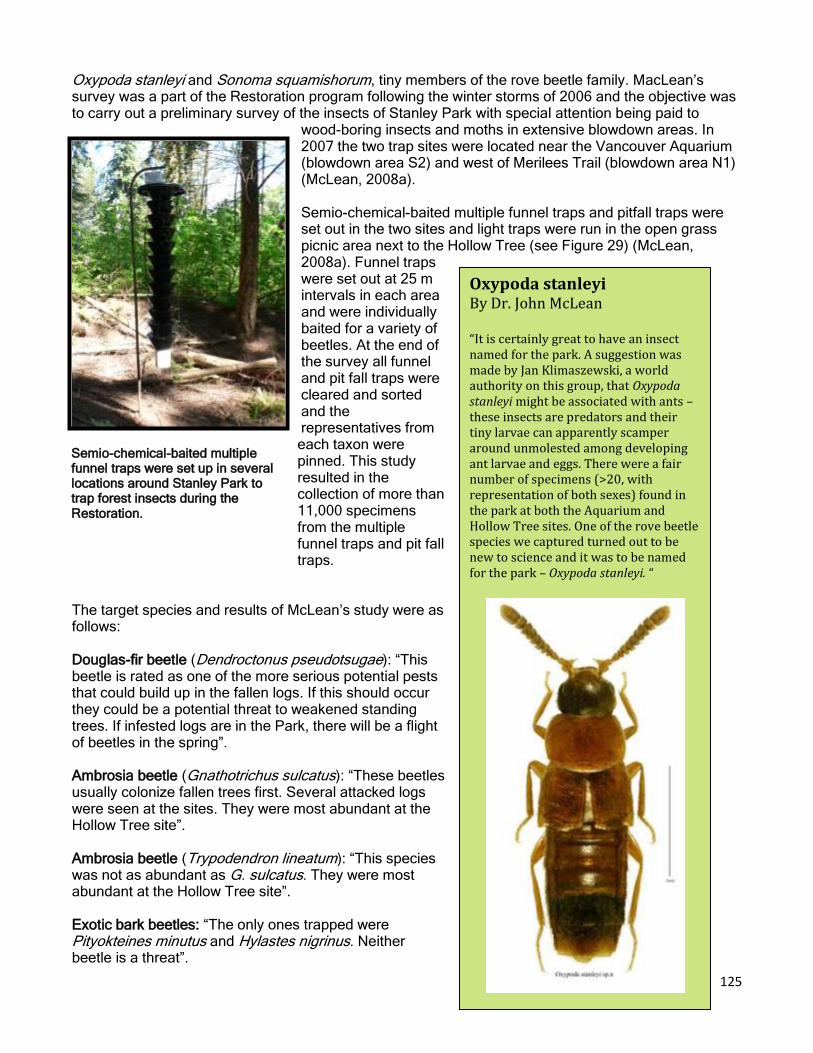
125
Oxypoda stanleyi By Dr. John McLean “It is certainly great to have an insect named for the park. A suggestion was made by Jan Klimaszewski, a world authority on this group, that Oxypoda stanleyi might be associated with ants – these insects are predators and their tiny larvae can apparently scamper around unmolested among developing ant larvae and eggs. There were a fair number of specimens (>20, with representation of both sexes) found in the park at both the Aquarium and Hollow Tree sites. One of the rove beetle species we captured turned out to be new to science and it was to be named for the park – Oxypoda stanleyi. “
Oxypoda stanleyi and Sonoma squamishorum, tiny members of the rove beetle family. MacLean‘s survey was a part of the Restoration program following the winter storms of 2006 and the objective was to carry out a preliminary survey of the insects of Stanley Park with special attention being paid to
wood-boring insects and moths in extensive blowdown areas. In 2007 the two trap sites were located near the Vancouver Aquarium (blowdown area S2) and west of Merilees Trail (blowdown area N1) (McLean, 2008a). Semio-chemical-baited multiple funnel traps and pitfall traps were set out in the two sites and light traps were run in the open grass picnic area next to the Hollow Tree (see Figure 29) (McLean, 2008a). Funnel traps were set out at 25 m intervals in each area and were individually baited for a variety of beetles. At the end of the survey all funnel and pit fall traps were cleared and sorted and the representatives from each taxon were pinned. This study resulted in the collection of more than 11,000 specimens from the multiple funnel traps and pit fall traps.
The target species and results of McLean‘s study were as follows: Douglas-fir beetle (Dendroctonus pseudotsugae): ―This beetle is rated as one of the more serious potential pests that could build up in the fallen logs. If this should occur they could be a potential threat to weakened standing trees. If infested logs are in the Park, there will be a flight of beetles in the spring‖. Ambrosia beetle (Gnathotrichus sulcatus): ―These beetles usually colonize fallen trees first. Several attacked logs were seen at the sites. They were most abundant at the Hollow Tree site‖. Ambrosia beetle (Trypodendron lineatum): ―This species was not as abundant as G. sulcatus. They were most abundant at the Hollow Tree site‖. Exotic bark beetles: ―The only ones trapped were Pityokteines minutus and Hylastes nigrinus. Neither beetle is a threat‖.
Semio-chemical-baited multiple funnel traps were set up in several locations around Stanley Park to trap forest insects during the Restoration.
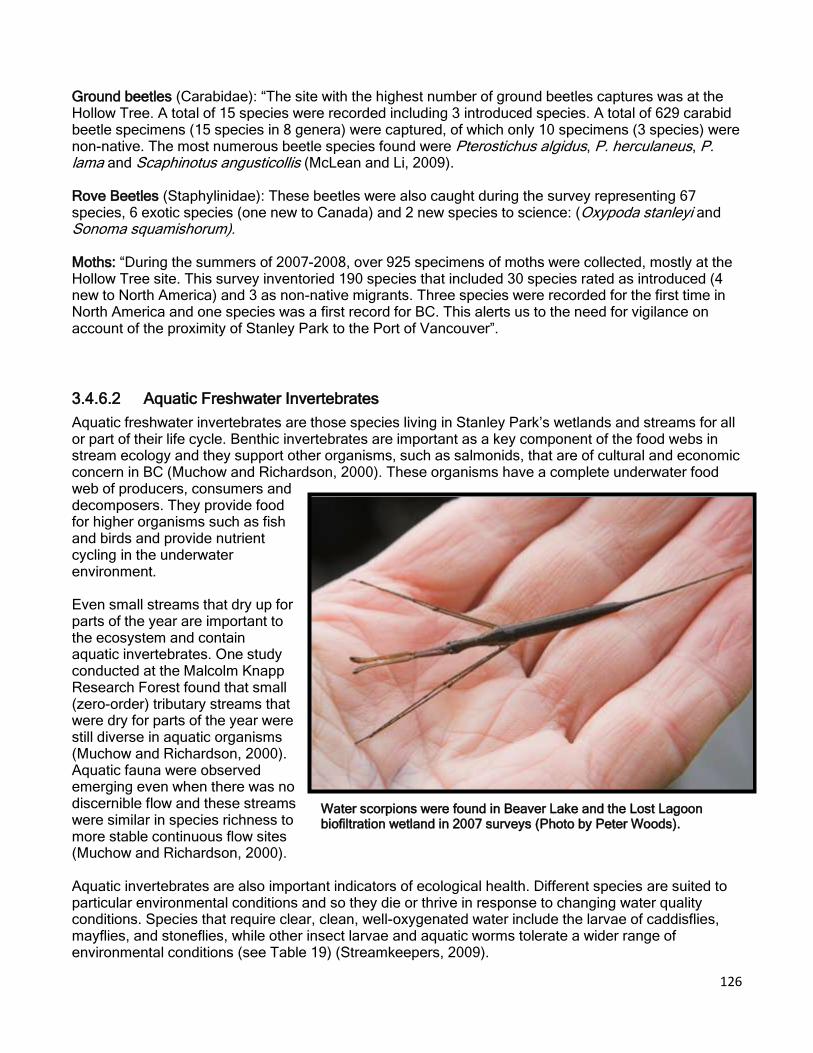
126
Ground beetles (Carabidae): ―The site with the highest number of ground beetles captures was at the Hollow Tree. A total of 15 species were recorded including 3 introduced species. A total of 629 carabid beetle specimens (15 species in 8 genera) were captured, of which only 10 specimens (3 species) were non-native. The most numerous beetle species found were Pterostichus algidus, P. herculaneus, P. lama and Scaphinotus angusticollis (McLean and Li, 2009). Rove Beetles (Staphylinidae): These beetles were also caught during the survey representing 67 species, 6 exotic species (one new to Canada) and 2 new species to science: (Oxypoda stanleyi and Sonoma squamishorum). Moths: ―During the summers of 2007-2008, over 925 specimens of moths were collected, mostly at the Hollow Tree site. This survey inventoried 190 species that included 30 species rated as introduced (4 new to North America) and 3 as non-native migrants. Three species were recorded for the first time in North America and one species was a first record for BC. This alerts us to the need for vigilance on account of the proximity of Stanley Park to the Port of Vancouver‖.
3.4.6.2 Aquatic Freshwater Invertebrates
Aquatic freshwater invertebrates are those species living in Stanley Park‘s wetlands and streams for all or part of their life cycle. Benthic invertebrates are important as a key component of the food webs in stream ecology and they support other organisms, such as salmonids, that are of cultural and economic concern in BC (Muchow and Richardson, 2000). These organisms have a complete underwater food web of producers, consumers and decomposers. They provide food for higher organisms such as fish and birds and provide nutrient cycling in the underwater environment. Even small streams that dry up for parts of the year are important to the ecosystem and contain aquatic invertebrates. One study conducted at the Malcolm Knapp Research Forest found that small (zero-order) tributary streams that were dry for parts of the year were still diverse in aquatic organisms (Muchow and Richardson, 2000). Aquatic fauna were observed emerging even when there was no discernible flow and these streams were similar in species richness to more stable continuous flow sites (Muchow and Richardson, 2000). Aquatic invertebrates are also important indicators of ecological health. Different species are suited to particular environmental conditions and so they die or thrive in response to changing water quality conditions. Species that require clear, clean, well-oxygenated water include the larvae of caddisflies, mayflies, and stoneflies, while other insect larvae and aquatic worms tolerate a wider range of environmental conditions (see Table 19) (Streamkeepers, 2009).
Water scorpions were found in Beaver Lake and the Lost Lagoon biofiltration wetland in 2007 surveys (Photo by Peter Woods).
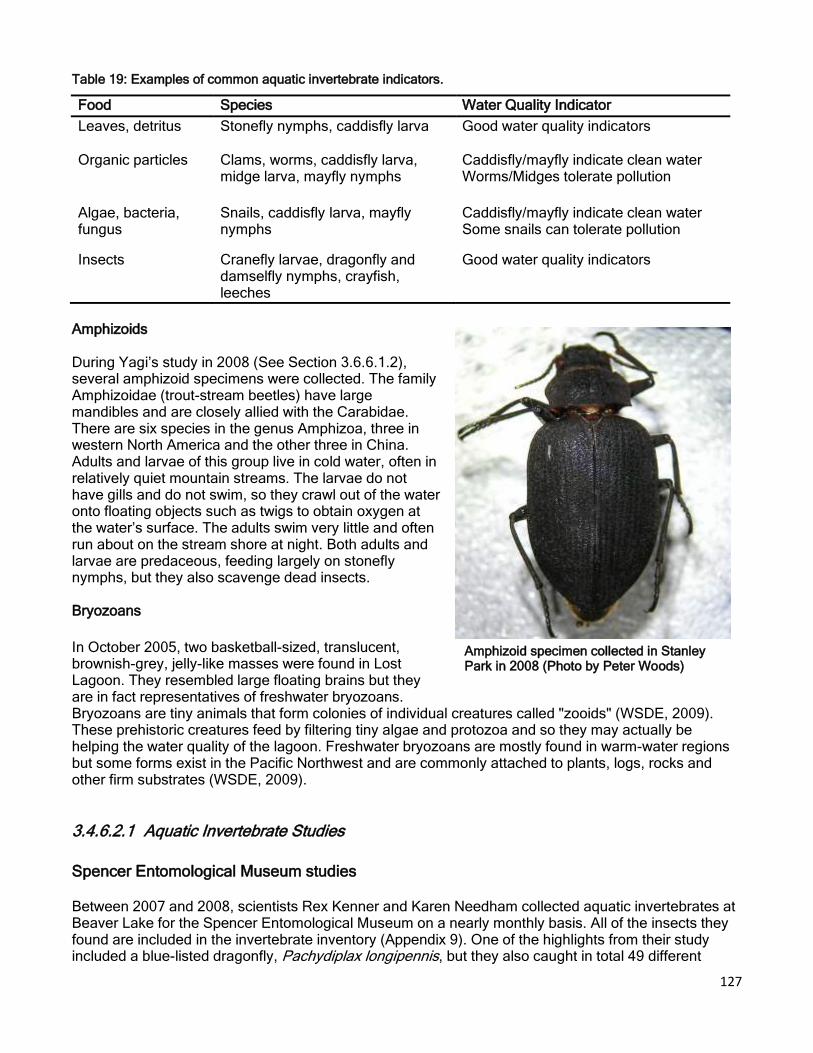
127
Table 19: Examples of common aquatic invertebrate indicators.
Food Species Water Quality Indicator
Leaves, detritus Stonefly nymphs, caddisfly larva Good water quality indicators
Organic particles Clams, worms, caddisfly larva, midge larva, mayfly nymphs
Caddisfly/mayfly indicate clean water Worms/Midges tolerate pollution
Algae, bacteria, fungus
Snails, caddisfly larva, mayfly nymphs
Caddisfly/mayfly indicate clean water Some snails can tolerate pollution
Insects Cranefly larvae, dragonfly and damselfly nymphs, crayfish, leeches
Good water quality indicators
Amphizoids During Yagi‘s study in 2008 (See Section 3.6.6.1.2), several amphizoid specimens were collected. The family Amphizoidae (trout-stream beetles) have large mandibles and are closely allied with the Carabidae. There are six species in the genus Amphizoa, three in western North America and the other three in China. Adults and larvae of this group live in cold water, often in relatively quiet mountain streams. The larvae do not have gills and do not swim, so they crawl out of the water onto floating objects such as twigs to obtain oxygen at the water‘s surface. The adults swim very little and often run about on the stream shore at night. Both adults and larvae are predaceous, feeding largely on stonefly nymphs, but they also scavenge dead insects. Bryozoans
In October 2005, two basketball-sized, translucent, brownish-grey, jelly-like masses were found in Lost Lagoon. They resembled large floating brains but they are in fact representatives of freshwater bryozoans. Bryozoans are tiny animals that form colonies of individual creatures called "zooids" (WSDE, 2009). These prehistoric creatures feed by filtering tiny algae and protozoa and so they may actually be helping the water quality of the lagoon. Freshwater bryozoans are mostly found in warm-water regions but some forms exist in the Pacific Northwest and are commonly attached to plants, logs, rocks and other firm substrates (WSDE, 2009).
3.4.6.2.1 Aquatic Invertebrate Studies
Spencer Entomological Museum studies Between 2007 and 2008, scientists Rex Kenner and Karen Needham collected aquatic invertebrates at Beaver Lake for the Spencer Entomological Museum on a nearly monthly basis. All of the insects they found are included in the invertebrate inventory (Appendix 9). One of the highlights from their study included a blue-listed dragonfly, Pachydiplax longipennis, but they also caught in total 49 different
Amphizoid specimen collected in Stanley Park in 2008 (Photo by Peter Woods)
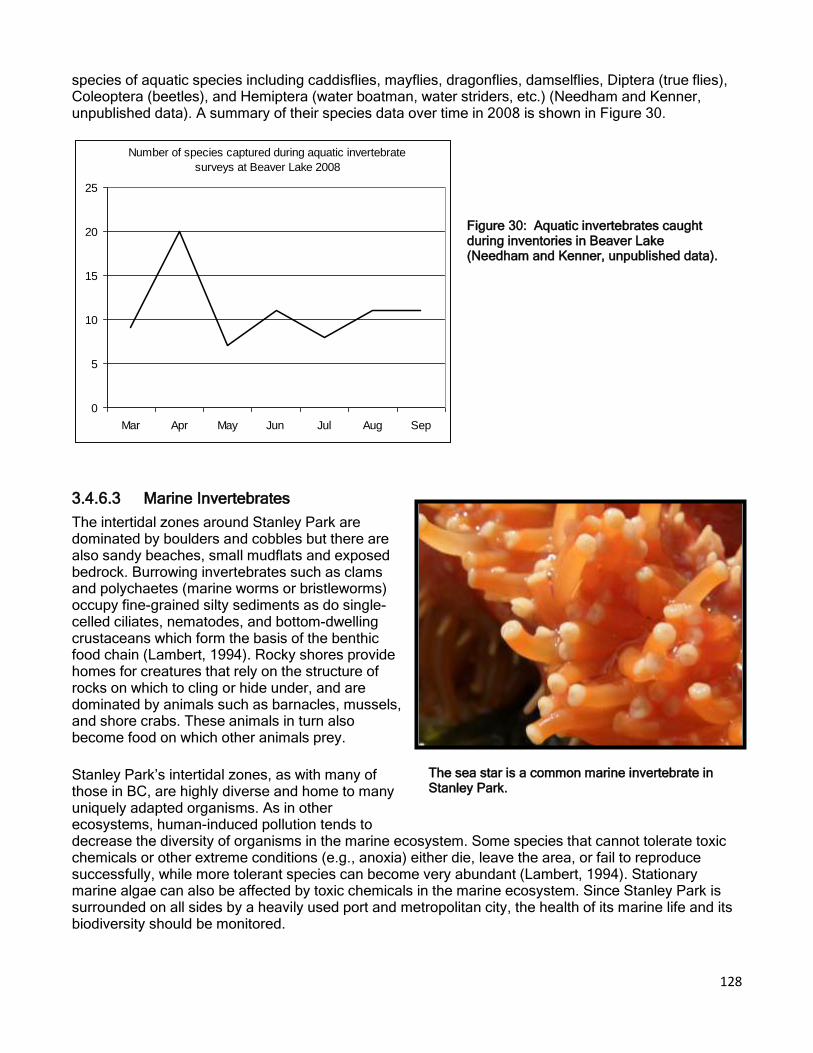
128
species of aquatic species including caddisflies, mayflies, dragonflies, damselflies, Diptera (true flies), Coleoptera (beetles), and Hemiptera (water boatman, water striders, etc.) (Needham and Kenner, unpublished data). A summary of their species data over time in 2008 is shown in Figure 30.
Figure 30: Aquatic invertebrates caught during inventories in Beaver Lake (Needham and Kenner, unpublished data).
3.4.6.3 Marine Invertebrates
The intertidal zones around Stanley Park are dominated by boulders and cobbles but there are also sandy beaches, small mudflats and exposed bedrock. Burrowing invertebrates such as clams and polychaetes (marine worms or bristleworms) occupy fine-grained silty sediments as do single-celled ciliates, nematodes, and bottom-dwelling crustaceans which form the basis of the benthic food chain (Lambert, 1994). Rocky shores provide homes for creatures that rely on the structure of rocks on which to cling or hide under, and are dominated by animals such as barnacles, mussels, and shore crabs. These animals in turn also become food on which other animals prey.
Stanley Park‘s intertidal zones, as with many of those in BC, are highly diverse and home to many uniquely adapted organisms. As in other ecosystems, human-induced pollution tends to decrease the diversity of organisms in the marine ecosystem. Some species that cannot tolerate toxic chemicals or other extreme conditions (e.g., anoxia) either die, leave the area, or fail to reproduce successfully, while more tolerant species can become very abundant (Lambert, 1994). Stationary marine algae can also be affected by toxic chemicals in the marine ecosystem. Since Stanley Park is surrounded on all sides by a heavily used port and metropolitan city, the health of its marine life and its biodiversity should be monitored.
The sea star is a common marine invertebrate in Stanley Park.
0
5
10
15
20
25
Mar Apr May Jun Jul Aug Sep
Number of species captured during aquatic invertebrate
surveys at Beaver Lake 2008

129
Contaminants can originate from a variety of point sources including ship-loading facilities, marinas, shipyards, fuel docks, the Lions Gate Wastewater Treatment Plant, or Combined Sewer Outfalls (CSO). CSOs are located near Brockton Point in Coal Harbour and at several other locations in Burrard Inlet (Coast River, 1995). Boyd et al. (1998) identified details of the quality of sediments in Burrard Inlet using various chemical and biological benchmarks. The effects of contaminants in Burrard Inlet on marine life are not clear since there are sparse data available. One study showed that Vancouver Harbour has some of the highest occurrences of skin papillomas (tumours) in flatfish in the world (Waters, 1985) while another study documented that macrobenthic infaunal species richness and abundance in the harbour and the inlet are similar to other (less polluted) nearshore areas of coastal BC (Burd and Brinkhurst, 1990). For more on environmental contaminates see Section 3.9.3.5.1. A newspaper article from 1911 reports that a girl was ―attacked‖ near the Coal Harbour rowing club by an octopus. The animal was killed by men nearby and was found to have arms five feet long (Vancouver Daily Province, 1911d). No other reports of octopus near the Park occurred until 2008 when a local naturalist also saw one as it was being eaten by a seal underneath the Lions Gate Bridge (Alan
Jenson, pers. comm.). Many common marine invertebrates can be found off the Park‘s shores and some rare species are present, but there have been no further formal inventories conducted in the Park in the last 10 years. Further study is needed to determine the health of the marine ecosystem and species biodiversity in the nearshore sediments around the Park (see Appendix 9 for a complete list of invertebrate species on record for the Park).
3.4.6.3.1 Marine Invertebrate Studies
The 1991 study of Stanley Park described it as having mostly rocky shores with sandy sediments around Second and Third Beaches, and large areas of muddy/silty sediments in Coal Harbour (Sandwell et al., 1991). It also reported the findings of an earlier study near Figurehead Point which found that the composition of the intertidal flora and fauna included polychaetes (38.9%), algae (12.1%), amphipods (10.1%), and bivalves (8.1%). The amphipods were dominated by Oligochinus lighti and the bivalves were mostly Macoma inquinata, the pointed macoma (Barreca, 1985). During surveys of the intertidal areas between Prospect Point, Brockton Point, and Coal Harbour, Coast River (1995) found that there were at least 64 species of invertebrates including 23 polychaetes, 7 molluscs, 3 sea stars, 3 crabs, 6 echinoderms and several species of barnacles and amphipods. The area of highest species diversity was found to be around Brockton Point, which was also home to Porifera (sponges) and Chordates (tunicates) found nowhere else in the study location, as well as one endemic bristleworm species, the Vancouver feather-duster worm (Coast River, 1995). Historical Records Historical species records for Stanley Park compiled by the Vancouver Natural History Society included an inventory of intertidal species seen at Brockton Point on May 18, 1946. Although the record is not
Small marine invertebrates, such as this isopod, form the basis of complex food webs.
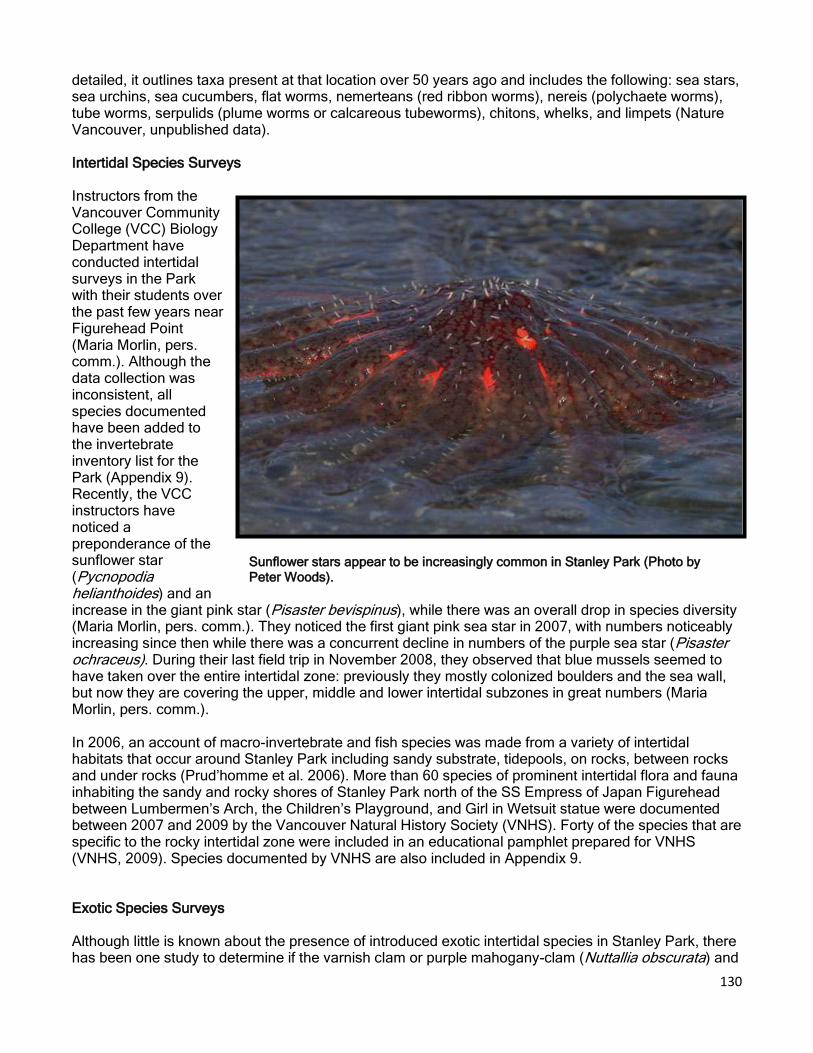
130
detailed, it outlines taxa present at that location over 50 years ago and includes the following: sea stars, sea urchins, sea cucumbers, flat worms, nemerteans (red ribbon worms), nereis (polychaete worms), tube worms, serpulids (plume worms or calcareous tubeworms), chitons, whelks, and limpets (Nature Vancouver, unpublished data). Intertidal Species Surveys Instructors from the Vancouver Community College (VCC) Biology Department have conducted intertidal surveys in the Park with their students over the past few years near Figurehead Point (Maria Morlin, pers. comm.). Although the data collection was inconsistent, all species documented have been added to the invertebrate inventory list for the Park (Appendix 9). Recently, the VCC instructors have noticed a preponderance of the sunflower star (Pycnopodia helianthoides) and an increase in the giant pink star (Pisaster bevispinus), while there was an overall drop in species diversity (Maria Morlin, pers. comm.). They noticed the first giant pink sea star in 2007, with numbers noticeably increasing since then while there was a concurrent decline in numbers of the purple sea star (Pisaster ochraceus). During their last field trip in November 2008, they observed that blue mussels seemed to have taken over the entire intertidal zone: previously they mostly colonized boulders and the sea wall, but now they are covering the upper, middle and lower intertidal subzones in great numbers (Maria Morlin, pers. comm.). In 2006, an account of macro-invertebrate and fish species was made from a variety of intertidal habitats that occur around Stanley Park including sandy substrate, tidepools, on rocks, between rocks and under rocks (Prud‘homme et al. 2006). More than 60 species of prominent intertidal flora and fauna inhabiting the sandy and rocky shores of Stanley Park north of the SS Empress of Japan Figurehead between Lumbermen‘s Arch, the Children‘s Playground, and Girl in Wetsuit statue were documented between 2007 and 2009 by the Vancouver Natural History Society (VNHS). Forty of the species that are specific to the rocky intertidal zone were included in an educational pamphlet prepared for VNHS (VNHS, 2009). Species documented by VNHS are also included in Appendix 9. Exotic Species Surveys Although little is known about the presence of introduced exotic intertidal species in Stanley Park, there has been one study to determine if the varnish clam or purple mahogany-clam (Nuttallia obscurata) and
Sunflower stars appear to be increasingly common in Stanley Park (Photo by Peter Woods).
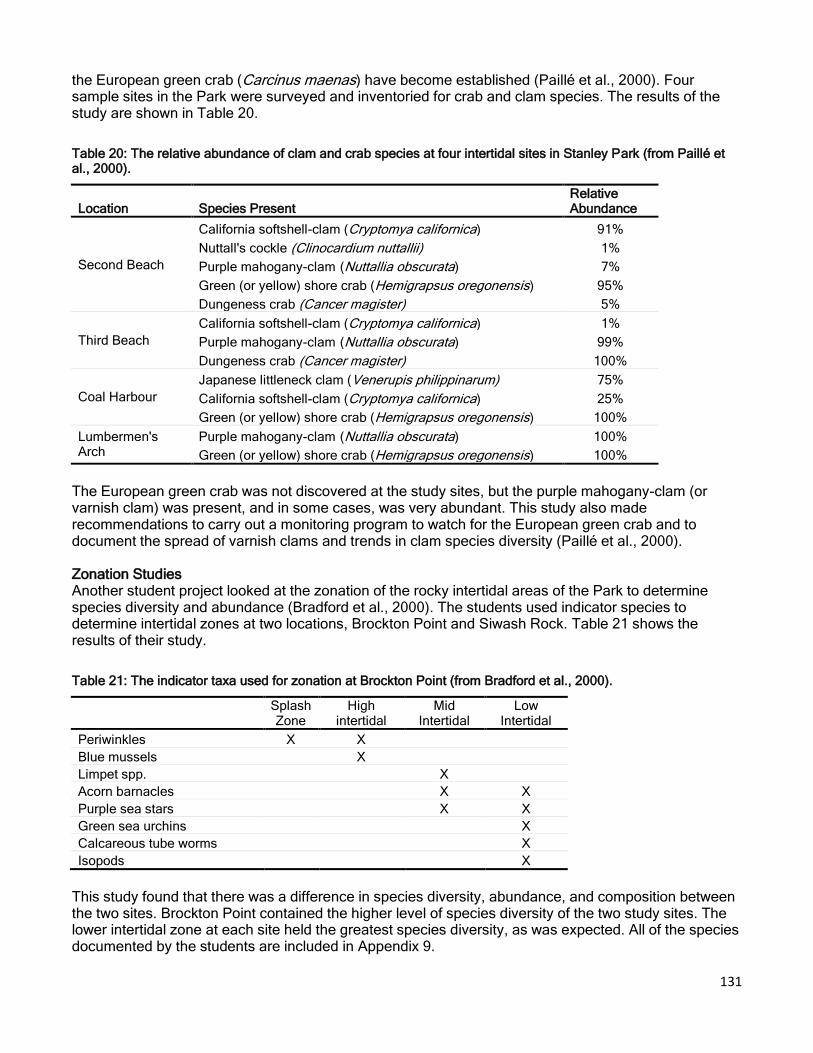
131
the European green crab (Carcinus maenas) have become established (Paillé et al., 2000). Four sample sites in the Park were surveyed and inventoried for crab and clam species. The results of the study are shown in Table 20.
Table 20: The relative abundance of clam and crab species at four intertidal sites in Stanley Park (from Paillé et al., 2000).
Location Species Present Relative Abundance
Second Beach
California softshell-clam (Cryptomya californica) 91%
Nuttall's cockle (Clinocardium nuttallii) 1%
Purple mahogany-clam (Nuttallia obscurata) 7%
Green (or yellow) shore crab (Hemigrapsus oregonensis) 95%
Dungeness crab (Cancer magister) 5%
Third Beach
California softshell-clam (Cryptomya californica) 1%
Purple mahogany-clam (Nuttallia obscurata) 99%
Dungeness crab (Cancer magister) 100%
Coal Harbour
Japanese littleneck clam (Venerupis philippinarum) 75%
California softshell-clam (Cryptomya californica) 25%
Green (or yellow) shore crab (Hemigrapsus oregonensis) 100%
Lumbermen's Arch
Purple mahogany-clam (Nuttallia obscurata) 100%
Green (or yellow) shore crab (Hemigrapsus oregonensis) 100%
The European green crab was not discovered at the study sites, but the purple mahogany-clam (or varnish clam) was present, and in some cases, was very abundant. This study also made recommendations to carry out a monitoring program to watch for the European green crab and to document the spread of varnish clams and trends in clam species diversity (Paillé et al., 2000). Zonation Studies Another student project looked at the zonation of the rocky intertidal areas of the Park to determine species diversity and abundance (Bradford et al., 2000). The students used indicator species to determine intertidal zones at two locations, Brockton Point and Siwash Rock. Table 21 shows the results of their study.
Table 21: The indicator taxa used for zonation at Brockton Point (from Bradford et al., 2000).
Splash Zone
High intertidal
Mid Intertidal
Low Intertidal
Periwinkles X X
Blue mussels X
Limpet spp. X
Acorn barnacles X X
Purple sea stars X X
Green sea urchins X
Calcareous tube worms X
Isopods X
This study found that there was a difference in species diversity, abundance, and composition between the two sites. Brockton Point contained the higher level of species diversity of the two study sites. The lower intertidal zone at each site held the greatest species diversity, as was expected. All of the species documented by the students are included in Appendix 9.
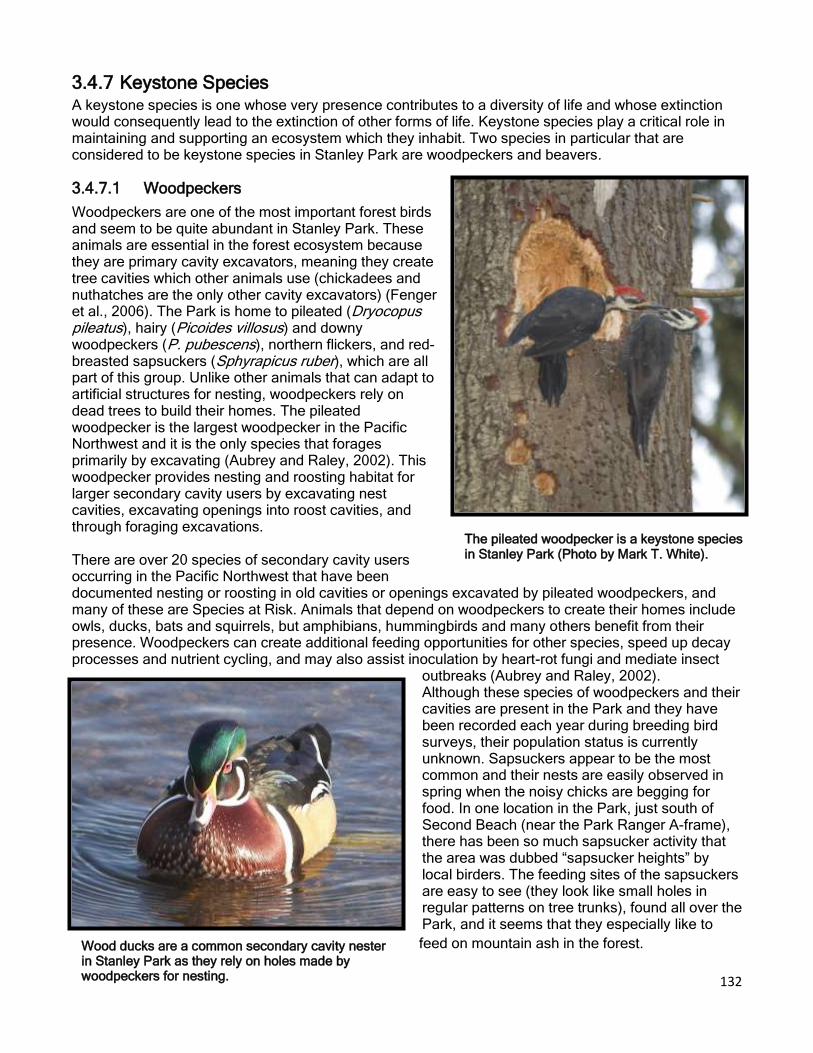
132
3.4.7 Keystone Species A keystone species is one whose very presence contributes to a diversity of life and whose extinction would consequently lead to the extinction of other forms of life. Keystone species play a critical role in maintaining and supporting an ecosystem which they inhabit. Two species in particular that are considered to be keystone species in Stanley Park are woodpeckers and beavers.
3.4.7.1 Woodpeckers
Woodpeckers are one of the most important forest birds and seem to be quite abundant in Stanley Park. These animals are essential in the forest ecosystem because they are primary cavity excavators, meaning they create tree cavities which other animals use (chickadees and nuthatches are the only other cavity excavators) (Fenger et al., 2006). The Park is home to pileated (Dryocopus pileatus), hairy (Picoides villosus) and downy woodpeckers (P. pubescens), northern flickers, and red-breasted sapsuckers (Sphyrapicus ruber), which are all part of this group. Unlike other animals that can adapt to artificial structures for nesting, woodpeckers rely on dead trees to build their homes. The pileated woodpecker is the largest woodpecker in the Pacific Northwest and it is the only species that forages primarily by excavating (Aubrey and Raley, 2002). This woodpecker provides nesting and roosting habitat for larger secondary cavity users by excavating nest cavities, excavating openings into roost cavities, and through foraging excavations. There are over 20 species of secondary cavity users occurring in the Pacific Northwest that have been documented nesting or roosting in old cavities or openings excavated by pileated woodpeckers, and many of these are Species at Risk. Animals that depend on woodpeckers to create their homes include owls, ducks, bats and squirrels, but amphibians, hummingbirds and many others benefit from their presence. Woodpeckers can create additional feeding opportunities for other species, speed up decay processes and nutrient cycling, and may also assist inoculation by heart-rot fungi and mediate insect
outbreaks (Aubrey and Raley, 2002). Although these species of woodpeckers and their cavities are present in the Park and they have been recorded each year during breeding bird surveys, their population status is currently unknown. Sapsuckers appear to be the most common and their nests are easily observed in spring when the noisy chicks are begging for food. In one location in the Park, just south of Second Beach (near the Park Ranger A-frame), there has been so much sapsucker activity that the area was dubbed ―sapsucker heights‖ by local birders. The feeding sites of the sapsuckers are easy to see (they look like small holes in regular patterns on tree trunks), found all over the Park, and it seems that they especially like to
feed on mountain ash in the forest.
The pileated woodpecker is a keystone species in Stanley Park (Photo by Mark T. White).
Wood ducks are a common secondary cavity nester in Stanley Park as they rely on holes made by woodpeckers for nesting.
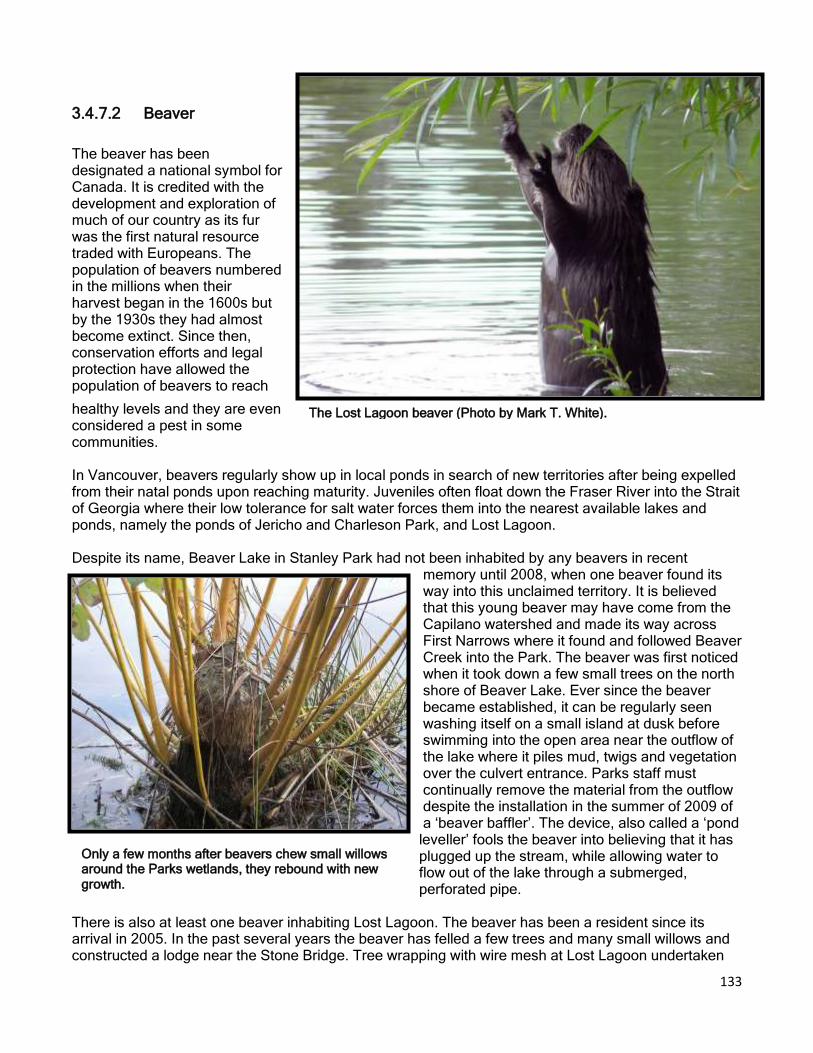
133
3.4.7.2 Beaver
The beaver has been designated a national symbol for Canada. It is credited with the development and exploration of much of our country as its fur was the first natural resource traded with Europeans. The population of beavers numbered in the millions when their harvest began in the 1600s but by the 1930s they had almost become extinct. Since then, conservation efforts and legal protection have allowed the population of beavers to reach
healthy levels and they are even considered a pest in some communities. In Vancouver, beavers regularly show up in local ponds in search of new territories after being expelled from their natal ponds upon reaching maturity. Juveniles often float down the Fraser River into the Strait of Georgia where their low tolerance for salt water forces them into the nearest available lakes and ponds, namely the ponds of Jericho and Charleson Park, and Lost Lagoon. Despite its name, Beaver Lake in Stanley Park had not been inhabited by any beavers in recent
memory until 2008, when one beaver found its way into this unclaimed territory. It is believed that this young beaver may have come from the Capilano watershed and made its way across First Narrows where it found and followed Beaver Creek into the Park. The beaver was first noticed when it took down a few small trees on the north shore of Beaver Lake. Ever since the beaver became established, it can be regularly seen washing itself on a small island at dusk before swimming into the open area near the outflow of the lake where it piles mud, twigs and vegetation over the culvert entrance. Parks staff must continually remove the material from the outflow despite the installation in the summer of 2009 of a ‗beaver baffler‘. The device, also called a ‗pond
leveller‘ fools the beaver into believing that it has plugged up the stream, while allowing water to flow out of the lake through a submerged, perforated pipe.
There is also at least one beaver inhabiting Lost Lagoon. The beaver has been a resident since its arrival in 2005. In the past several years the beaver has felled a few trees and many small willows and constructed a lodge near the Stone Bridge. Tree wrapping with wire mesh at Lost Lagoon undertaken
Only a few months after beavers chew small willows around the Parks wetlands, they rebound with new growth.
The Lost Lagoon beaver (Photo by Mark T. White).

134
by SPES conservation programs in cooperation with the Park Board aims to protect some of the more significant trees around the lagoon from beaver damage while allowing the beaver access sufficient food sources. The beaver plays a crucial role as keystone species in its environment, with many other species benefiting from its activities. At Beaver Lake, this ‗ecosystem engineer‘ has been dredging the lake bottom and removing invasive lilies to the benefit of native fish, amphibians, birds and invertebrates which rely on deeper, colder water pools that can now persist into the summer. People have also benefited from the presence of the beaver with increased opportunities for wildlife observation, nature photography, and environmental education. In the urban environment, however, beavers can cause problems by taking down too many trees for food and by flooding watercourses that are close to human infrastructure such as houses, trails, and roads. An adult beaver can take down many alder, willow and other trees in one year, so to prevent the removal of the Park‘s limited supply of these riparian trees, metal wraps are sometimes used to protect them.
3.4.8 Protected Wildlife
Some wildlife species and their habitat are protected under Canadian laws. The following section details the protected species in the Park and more information on the laws and their applications in the Park can be found in Appendix 3.
3.4.8.1 Species at Risk
The Canadian Species at Risk Act (SARA) is a key piece of federal government legislation that is designed to prevent wildlife species
from becoming extinct through sound management, and secures the necessary actions for their recovery. It provides for the legal protection of wildlife species and the conservation of their biological diversity (Species at Risk Public Registry, 2008). A Species at Risk may be imperiled for a number or combinations of reasons such as (Henderson and Ryder, 2002):
natural occurrence in small numbers
dependence on unique or rare habitats or habitat features
habitat destruction
habitat fragmentation
increased competition (possibly from exotic species)
increased predation
The Committee on the Status of Endangered Wildlife in Canada (COSEWIC) is responsible for assessing and designating the status of species at risk of disappearing from the wild in Canada. This group consists of scientists, government managers, and non-governmental specialists who determine the status of plants and animals at risk throughout Canada (Henderson and Ryder, 2002). COSEWIC makes recommendations to the federal government to list species under SARA. If the Governor in Council accepts COSEWIC‘s assessment, the species is listed in Schedule 1 of the Species at Risk
Many people are not aware that seemingly common species like these barn swallows are Species at Risk in BC.
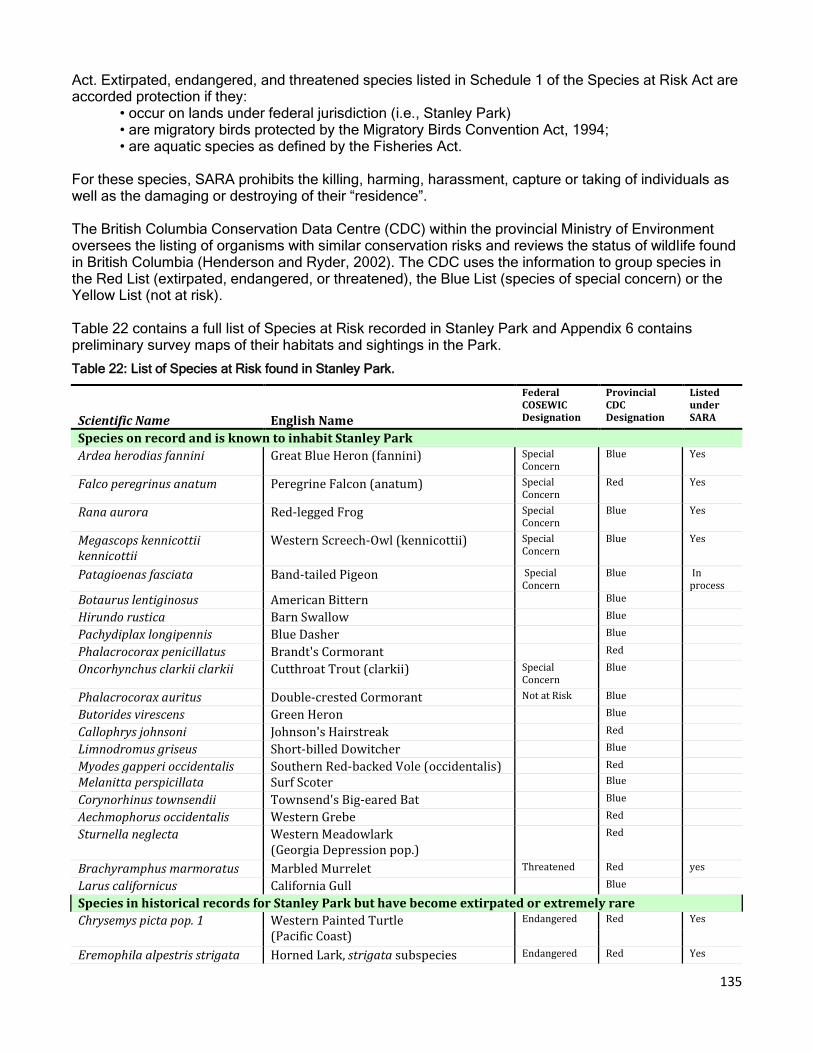
135
Act. Extirpated, endangered, and threatened species listed in Schedule 1 of the Species at Risk Act are accorded protection if they:
• occur on lands under federal jurisdiction (i.e., Stanley Park) • are migratory birds protected by the Migratory Birds Convention Act, 1994; • are aquatic species as defined by the Fisheries Act.
For these species, SARA prohibits the killing, harming, harassment, capture or taking of individuals as well as the damaging or destroying of their ―residence‖. The British Columbia Conservation Data Centre (CDC) within the provincial Ministry of Environment oversees the listing of organisms with similar conservation risks and reviews the status of wildlife found in British Columbia (Henderson and Ryder, 2002). The CDC uses the information to group species in the Red List (extirpated, endangered, or threatened), the Blue List (species of special concern) or the Yellow List (not at risk). Table 22 contains a full list of Species at Risk recorded in Stanley Park and Appendix 6 contains preliminary survey maps of their habitats and sightings in the Park.
Table 22: List of Species at Risk found in Stanley Park.
Scientific Name English Name
Federal COSEWIC Designation
Provincial CDC Designation
Listed under SARA
Species on record and is known to inhabit Stanley Park
Ardea herodias fannini Great Blue Heron (fannini) Special Concern
Blue Yes
Falco peregrinus anatum Peregrine Falcon (anatum) Special Concern
Red Yes
Rana aurora Red-legged Frog Special Concern
Blue Yes
Megascops kennicottii kennicottii
Western Screech-Owl (kennicottii) Special Concern
Blue Yes
Patagioenas fasciata Band-tailed Pigeon Special Concern
Blue In process
Botaurus lentiginosus American Bittern Blue
Hirundo rustica Barn Swallow Blue
Pachydiplax longipennis Blue Dasher Blue
Phalacrocorax penicillatus Brandt's Cormorant Red
Oncorhynchus clarkii clarkii Cutthroat Trout (clarkii) Special Concern
Blue
Phalacrocorax auritus Double-crested Cormorant Not at Risk Blue
Butorides virescens Green Heron Blue
Callophrys johnsoni Johnson's Hairstreak Red
Limnodromus griseus Short-billed Dowitcher Blue
Myodes gapperi occidentalis Southern Red-backed Vole (occidentalis) Red
Melanitta perspicillata Surf Scoter Blue
Corynorhinus townsendii Townsend's Big-eared Bat Blue
Aechmophorus occidentalis Western Grebe Red
Sturnella neglecta Western Meadowlark (Georgia Depression pop.)
Red
Brachyramphus marmoratus Marbled Murrelet Threatened Red yes
Larus californicus California Gull Blue
Species in historical records for Stanley Park but have become extirpated or extremely rare
Chrysemys picta pop. 1 Western Painted Turtle (Pacific Coast)
Endangered Red Yes
Eremophila alpestris strigata Horned Lark, strigata subspecies Endangered Red Yes

136
Grus canadensis Sandhill Crane Not at Risk Blue
Melanerpes lewis pop.1 Lewis's Woodpecker (Georgia Depression)
Red
Asio flammeus Short-eared Owl Special Concern
Blue Yes
Hydroprogne caspia Caspian Tern Not at Risk Blue
Uria aalge Common Murre Red
Sterna forsteri Forster's Tern Data Deficient
Red
Ammodramus savannarum Grasshopper Sparrow Red
Falco rusticolus Gyrfalcon Not at Risk Blue
Phalaropus lobatus Red-necked Phalarope Blue
Species not on Record in Stanley Park but may exist
Allogona townsendiana Oregon Forest Snail Endangered Red Yes
Fissidens pauperculus Poor Pocket Moss Endangered Red Yes
Sorex bendirii Pacific Water Shrew Endangered Red Yes
Lupinus rivularis Streambank lupine Endangered Red Yes
3.4.8.2 Migratory Birds
Migratory birds include a large number of species residing in and passing through Stanley Park. As it is located on the Pacific Migratory Flyway, the Park is frequently used by birds moving north and south on migration. Species of neotropical migrants such as warblers, flycatchers and swallows leave their southern wintering grounds in the tropics to seek out northern and inland breeding areas in BC. Wilson‘s warblers, black-throated grey warblers, barn swallows, and tree swallows are some of the species that regularly pass through and breed in significant numbers in the Park. Some migratory birds migrate from the south coast of BC to inland and northern breeding sites. Sea ducks such as Barrow‘s goldeneyes and surf scoter spend the winter off Stanley Park‘s shores, and fly inland and northward to breed on interior lakes in the summer. Migratory bird species also include some resident birds such as Canada geese and American wigeons. These birds live in Vancouver year-round but are considered migratory species under the federal legislation. The Migratory Birds Convention Act (MBCA, 1994) regulations ban the disturbance, destruction or removal of nests, eggs or duck boxes of migratory birds. However, some activities, such as hunting or egg addling, may be practiced with the appropriate permits. The regulations also ban the depositing of oil, oil wastes or any other substance harmful to migratory birds in any waters or any area frequented by migratory birds. For more on this law and its application in Stanley Park, including a full listing of applicable species, please see Appendix 3.
Neotropical migrants, like this Wilson‘s warbler, are protected in Canada under the Migratory Species Act.
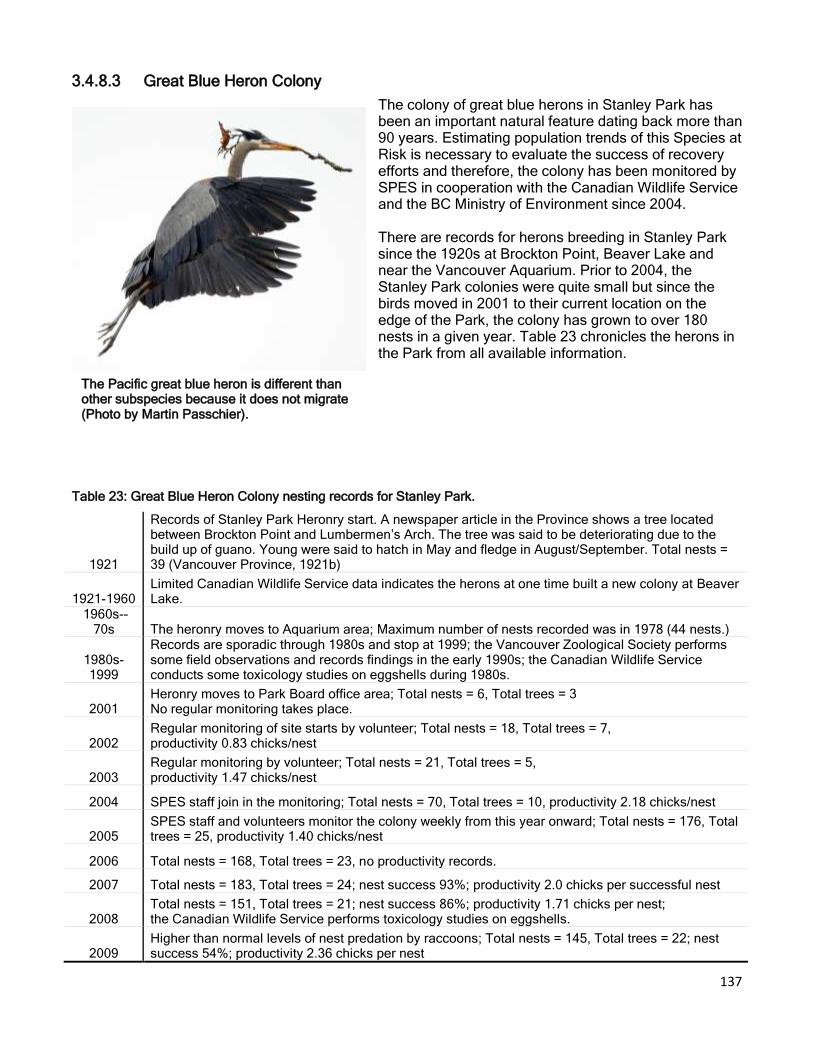
137
3.4.8.3 Great Blue Heron Colony
The colony of great blue herons in Stanley Park has been an important natural feature dating back more than 90 years. Estimating population trends of this Species at Risk is necessary to evaluate the success of recovery efforts and therefore, the colony has been monitored by SPES in cooperation with the Canadian Wildlife Service and the BC Ministry of Environment since 2004. There are records for herons breeding in Stanley Park since the 1920s at Brockton Point, Beaver Lake and near the Vancouver Aquarium. Prior to 2004, the Stanley Park colonies were quite small but since the birds moved in 2001 to their current location on the edge of the Park, the colony has grown to over 180 nests in a given year. Table 23 chronicles the herons in the Park from all available information.
Table 23: Great Blue Heron Colony nesting records for Stanley Park.
1921
Records of Stanley Park Heronry start. A newspaper article in the Province shows a tree located between Brockton Point and Lumbermen‘s Arch. The tree was said to be deteriorating due to the build up of guano. Young were said to hatch in May and fledge in August/September. Total nests = 39 (Vancouver Province, 1921b)
1921-1960 Limited Canadian Wildlife Service data indicates the herons at one time built a new colony at Beaver Lake.
1960s--70s The heronry moves to Aquarium area; Maximum number of nests recorded was in 1978 (44 nests.)
1980s-1999
Records are sporadic through 1980s and stop at 1999; the Vancouver Zoological Society performs some field observations and records findings in the early 1990s; the Canadian Wildlife Service conducts some toxicology studies on eggshells during 1980s.
2001 Heronry moves to Park Board office area; Total nests = 6, Total trees = 3 No regular monitoring takes place.
2002 Regular monitoring of site starts by volunteer; Total nests = 18, Total trees = 7, productivity 0.83 chicks/nest
2003 Regular monitoring by volunteer; Total nests = 21, Total trees = 5, productivity 1.47 chicks/nest
2004 SPES staff join in the monitoring; Total nests = 70, Total trees = 10, productivity 2.18 chicks/nest
2005 SPES staff and volunteers monitor the colony weekly from this year onward; Total nests = 176, Total trees = 25, productivity 1.40 chicks/nest
2006 Total nests = 168, Total trees = 23, no productivity records.
2007 Total nests = 183, Total trees = 24; nest success 93%; productivity 2.0 chicks per successful nest
2008 Total nests = 151, Total trees = 21; nest success 86%; productivity 1.71 chicks per nest; the Canadian Wildlife Service performs toxicology studies on eggshells.
2009 Higher than normal levels of nest predation by raccoons; Total nests = 145, Total trees = 22; nest success 54%; productivity 2.36 chicks per nest
The Pacific great blue heron is different than other subspecies because it does not migrate (Photo by Martin Passchier).
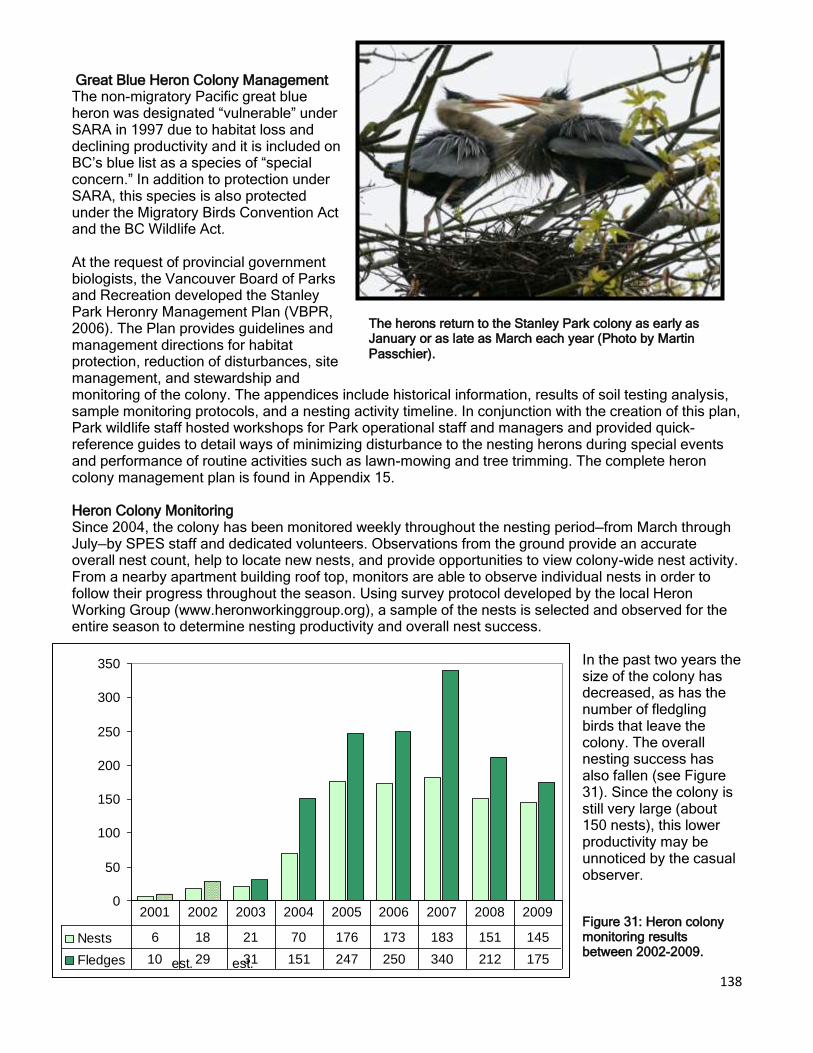
138
0
50
100
150
200
250
300
350
Nests 6 18 21 70 176 173 183 151 145
Fledges 10 29 31 151 247 250 340 212 175
2001 2002 2003 2004 2005 2006 2007 2008 2009
est. est.
Great Blue Heron Colony Management The non-migratory Pacific great blue heron was designated ―vulnerable‖ under SARA in 1997 due to habitat loss and declining productivity and it is included on BC‘s blue list as a species of ―special concern.‖ In addition to protection under SARA, this species is also protected under the Migratory Birds Convention Act and the BC Wildlife Act. At the request of provincial government biologists, the Vancouver Board of Parks and Recreation developed the Stanley Park Heronry Management Plan (VBPR, 2006). The Plan provides guidelines and management directions for habitat protection, reduction of disturbances, site management, and stewardship and monitoring of the colony. The appendices include historical information, results of soil testing analysis, sample monitoring protocols, and a nesting activity timeline. In conjunction with the creation of this plan, Park wildlife staff hosted workshops for Park operational staff and managers and provided quick-reference guides to detail ways of minimizing disturbance to the nesting herons during special events and performance of routine activities such as lawn-mowing and tree trimming. The complete heron colony management plan is found in Appendix 15. Heron Colony Monitoring Since 2004, the colony has been monitored weekly throughout the nesting period—from March through July—by SPES staff and dedicated volunteers. Observations from the ground provide an accurate overall nest count, help to locate new nests, and provide opportunities to view colony-wide nest activity. From a nearby apartment building roof top, monitors are able to observe individual nests in order to follow their progress throughout the season. Using survey protocol developed by the local Heron Working Group (www.heronworkinggroup.org), a sample of the nests is selected and observed for the entire season to determine nesting productivity and overall nest success.
In the past two years the size of the colony has decreased, as has the number of fledgling birds that leave the colony. The overall nesting success has also fallen (see Figure 31). Since the colony is still very large (about 150 nests), this lower productivity may be unnoticed by the casual observer.
Figure 31: Heron colony monitoring results between 2002-2009.
The herons return to the Stanley Park colony as early as January or as late as March each year (Photo by Martin Passchier).

139
0
5
10
15
20
25
30
35
40
45
09-M
ar
23-M
ar
06-A
pr
13-A
pr
27-A
pr
18-M
ay
01-J
un
15-J
un
27-J
un
13-J
ul
27-J
ul
10-A
ug
Eggs
Chicks
The initial colonization of the trees each spring has become increasingly later in the past several years (January 14 in 2006, February 14 in 2007, February 24 in 2008, and March 13 in 2009). Once the herons arrive they spend time claiming nests and forming pairs. After the first nests are completed, monitors usually begin seeing birds incubating eggs in late March or early April. The herons incubate their eggs for 28 days and the first fuzzy grey chicks are seen in April or May. From hatching until they are able leave the nest, usually about two months, the heron chicks are fed and cared for by their parents. The first young birds begin a life on their own in June and most are gone by late July. Some of the late-nesters fledge chicks in mid-August and the colony is usually quiet again by September. Figure 32 shows the number of eggs and chicks seen in the sample nests throughout the 2008 season.
Figure 32: The number of eggs and chicks seen in sample nests throughout the 2008 breeding season. (Note that the dip to zero eggs seen on April 27 was due to poor visibility from bad weather conditions).
Nest Predation and Disturbance
In 2008 and 2009 the pressure on the herons from predation has grown. This is a concern because heron colonies have been known to abandon their locations due to increased predation (Vennesland and Butler, 2005). Eagles may enter the heron colony early in the season to feed on eggs, while raccoons and owls may appear slightly later in pursuit of small chicks. Raccoons are commonly seen climbing the trees and sleeping in empty nests during the daytime and have been observed attacking chicks during both day and night. In 2009 approximately 44 nests were estimated to be predated, mostly by raccoons. This was the highest incidence to date and is a growing concern for the colony. Predator guards were installed in the colony to reduce access for the raccoons in January 2010 by Park Board
and SPES staff. Since 2001 the heron colony has resided between the tennis courts and the Park
Board head office at 2099 Beach Avenue. The number of trees occupied has grown over the years and the Park Board has followed up by installing fencing below most of the occupied trees. A schematic of the colony as of March 2009 is shown in Figure 33.
A raccoon eating heron chicks in the Stanley Park colony in 2009 (Photo by Mark T. White).
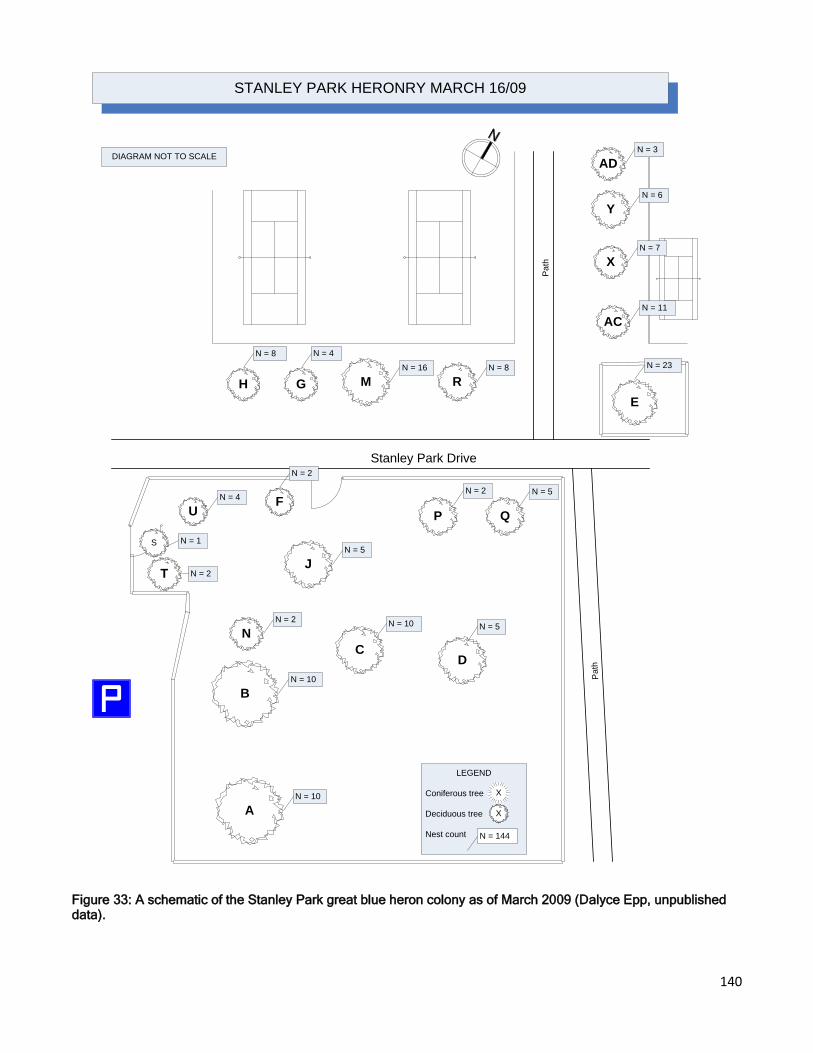
140
Stanley Park Drive
H G M R
E
Y
AD
X
AC
U
T
F
J
N
B
A
D
P Q
C
Pa
th
Path
STANLEY PARK HERONRY MARCH 16/09
N = 10
N = 5
N = 10
N = 2N = 10
N = 2
N = 4
N = 2
N = 5
N = 2 N = 5
N = 23
N = 3
N = 6
N = 7
N = 11
N = 8N = 16
N = 4N = 8
DIAGRAM NOT TO SCALE
S N = 1
LEGEND
Coniferous tree
Deciduous tree
Nest count N = 144
X
X
Figure 33: A schematic of the Stanley Park great blue heron colony as of March 2009 (Dalyce Epp, unpublished data).
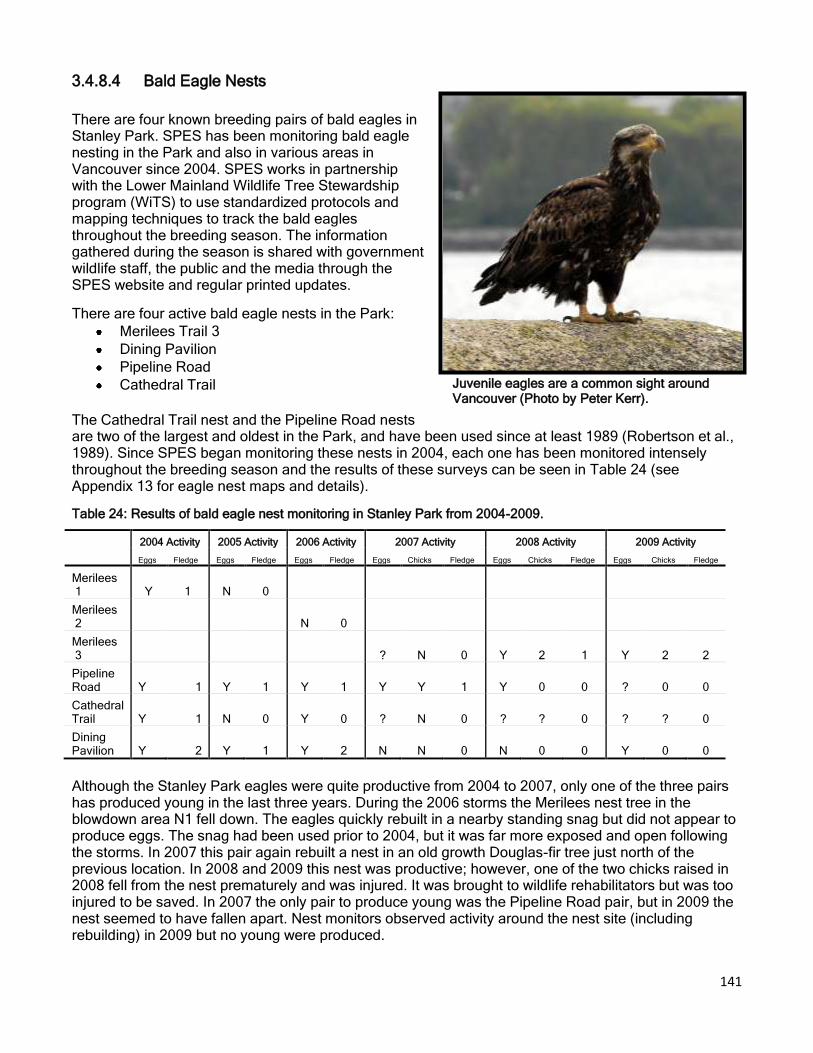
141
3.4.8.4 Bald Eagle Nests
There are four known breeding pairs of bald eagles in Stanley Park. SPES has been monitoring bald eagle nesting in the Park and also in various areas in Vancouver since 2004. SPES works in partnership with the Lower Mainland Wildlife Tree Stewardship program (WiTS) to use standardized protocols and mapping techniques to track the bald eagles throughout the breeding season. The information gathered during the season is shared with government wildlife staff, the public and the media through the SPES website and regular printed updates.
There are four active bald eagle nests in the Park:
Merilees Trail 3
Dining Pavilion
Pipeline Road
Cathedral Trail
The Cathedral Trail nest and the Pipeline Road nests are two of the largest and oldest in the Park, and have been used since at least 1989 (Robertson et al., 1989). Since SPES began monitoring these nests in 2004, each one has been monitored intensely throughout the breeding season and the results of these surveys can be seen in Table 24 (see Appendix 13 for eagle nest maps and details).
Table 24: Results of bald eagle nest monitoring in Stanley Park from 2004-2009.
2004 Activity 2005 Activity 2006 Activity 2007 Activity 2008 Activity 2009 Activity
Eggs Fledge Eggs Fledge Eggs Fledge Eggs Chicks Fledge Eggs Chicks Fledge Eggs Chicks Fledge
Merilees 1 Y 1 N 0
Merilees 2 N 0
Merilees 3 ? N 0 Y 2 1 Y 2 2
Pipeline Road Y 1 Y 1 Y 1 Y Y 1 Y 0 0 ? 0 0
Cathedral Trail Y 1 N 0 Y 0 ? N 0 ? ? 0 ? ? 0
Dining Pavilion Y 2 Y 1 Y 2 N N 0 N 0 0 Y 0 0
Although the Stanley Park eagles were quite productive from 2004 to 2007, only one of the three pairs has produced young in the last three years. During the 2006 storms the Merilees nest tree in the blowdown area N1 fell down. The eagles quickly rebuilt in a nearby standing snag but did not appear to produce eggs. The snag had been used prior to 2004, but it was far more exposed and open following the storms. In 2007 this pair again rebuilt a nest in an old growth Douglas-fir tree just north of the previous location. In 2008 and 2009 this nest was productive; however, one of the two chicks raised in 2008 fell from the nest prematurely and was injured. It was brought to wildlife rehabilitators but was too injured to be saved. In 2007 the only pair to produce young was the Pipeline Road pair, but in 2009 the nest seemed to have fallen apart. Nest monitors observed activity around the nest site (including rebuilding) in 2009 but no young were produced.
Juvenile eagles are a common sight around Vancouver (Photo by Peter Kerr).
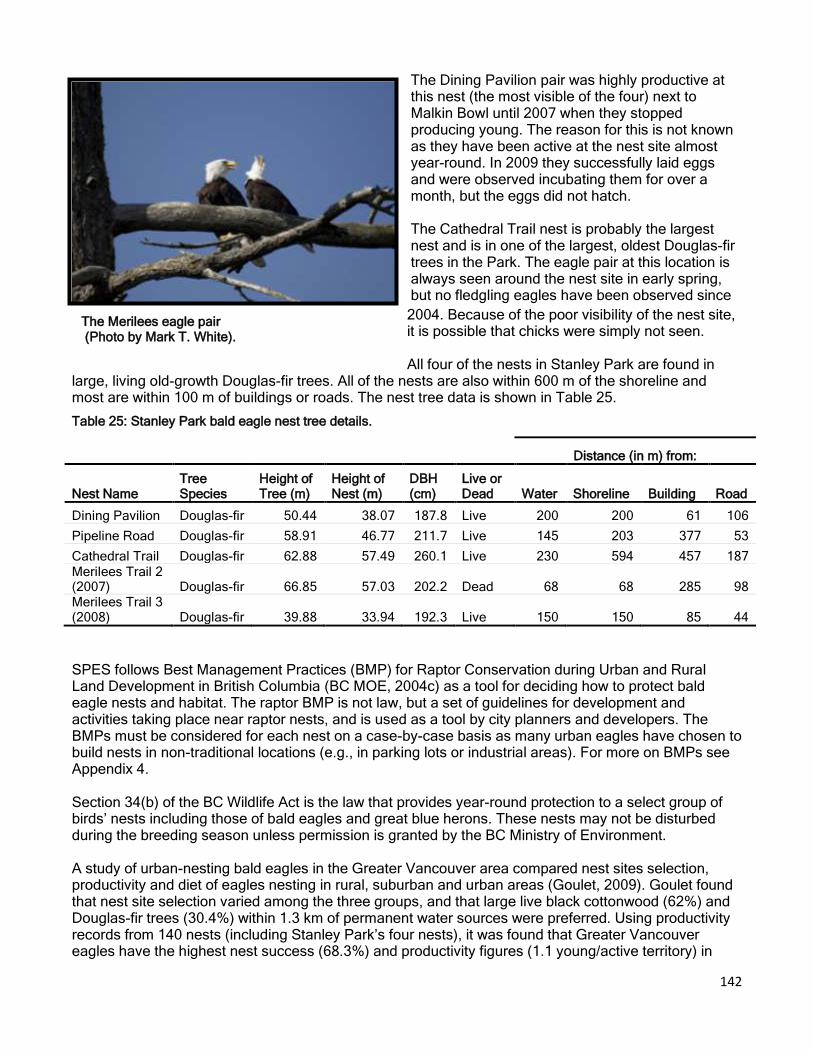
142
The Dining Pavilion pair was highly productive at this nest (the most visible of the four) next to Malkin Bowl until 2007 when they stopped producing young. The reason for this is not known as they have been active at the nest site almost year-round. In 2009 they successfully laid eggs and were observed incubating them for over a month, but the eggs did not hatch. The Cathedral Trail nest is probably the largest nest and is in one of the largest, oldest Douglas-fir trees in the Park. The eagle pair at this location is always seen around the nest site in early spring, but no fledgling eagles have been observed since
2004. Because of the poor visibility of the nest site, it is possible that chicks were simply not seen. All four of the nests in Stanley Park are found in
large, living old-growth Douglas-fir trees. All of the nests are also within 600 m of the shoreline and most are within 100 m of buildings or roads. The nest tree data is shown in Table 25.
Table 25: Stanley Park bald eagle nest tree details.
Distance (in m) from:
Nest Name Tree Species
Height of Tree (m)
Height of Nest (m)
DBH (cm)
Live or Dead Water Shoreline Building Road
Dining Pavilion Douglas-fir 50.44 38.07 187.8 Live 200 200 61 106
Pipeline Road Douglas-fir 58.91 46.77 211.7 Live 145 203 377 53
Cathedral Trail Douglas-fir 62.88 57.49 260.1 Live 230 594 457 187 Merilees Trail 2 (2007) Douglas-fir 66.85 57.03 202.2 Dead 68 68 285 98 Merilees Trail 3 (2008) Douglas-fir 39.88 33.94 192.3 Live 150 150 85 44
SPES follows Best Management Practices (BMP) for Raptor Conservation during Urban and Rural Land Development in British Columbia (BC MOE, 2004c) as a tool for deciding how to protect bald eagle nests and habitat. The raptor BMP is not law, but a set of guidelines for development and activities taking place near raptor nests, and is used as a tool by city planners and developers. The BMPs must be considered for each nest on a case-by-case basis as many urban eagles have chosen to build nests in non-traditional locations (e.g., in parking lots or industrial areas). For more on BMPs see Appendix 4. Section 34(b) of the BC Wildlife Act is the law that provides year-round protection to a select group of birds‘ nests including those of bald eagles and great blue herons. These nests may not be disturbed during the breeding season unless permission is granted by the BC Ministry of Environment. A study of urban-nesting bald eagles in the Greater Vancouver area compared nest sites selection, productivity and diet of eagles nesting in rural, suburban and urban areas (Goulet, 2009). Goulet found that nest site selection varied among the three groups, and that large live black cottonwood (62%) and Douglas-fir trees (30.4%) within 1.3 km of permanent water sources were preferred. Using productivity records from 140 nests (including Stanley Park‘s four nests), it was found that Greater Vancouver eagles have the highest nest success (68.3%) and productivity figures (1.1 young/active territory) in
The Merilees eagle pair (Photo by Mark T. White).
143
North America, indicating that our local population is currently stable (Goulet, 2009). This research also looked at the discarded remains of food items and pellets found under nests to determine general food preferences during the breeding season. Greater Vancouver eagle diets are made up of about 85% birds (35 species), 7% mammals (8 species), 7% fish (6 species) and 1% invertebrates (3 species). Eagle diets also varied based on their location. Urban eagles relied on primarily crows, gulls, and pigeons and ate more C-O sole (Pleuronichthys coenosus), Pacific sanddab (Citharichthys sordidus), and ring-billed gulls than the suburban and rural eagles. Urban eagles were also the only group that ate Dungeness crab, blue mussel and softshell clams, and the only group which did not eat American wigeon. A complete list of prey items that were found during the research is listed by family in Table 26.
Table 26: Food items collected around bald eagle nests in the Greater Vancouver region, BC (Goulet, 2009).
Family Common Names %
Anatidae Ducks, Geese, Swans 80.9
Laridae Gulls, Terns 54.4
Corvidae Crows, Jays 29.4
Columbidae Doves, Pigeons 25
Pleuronectidae Dabs, Halibuts, Righteye Flounders 8.8
Paralichthyidae Lefteye Flounders, Sand Flounders 8.8
Muridae Mice, Rats, Voles 7.4
Leporidae Hares, Rabbits 7.4
Cyprinidae Carps, Minnows 7.4
Bovidae Bovids, Cattle, Sheep, Goats 5.9
Ardeidae Bitterns, Herons 4.4
Gaviidae Loons 4.4
Tytonidae Barn Owls 4.4
Phasianidae Grouse, Quail, Turkeys, Pheasants 2.9
Phalacrocoracidae Cormorants 2.9
Podicipedidae Grebes 2.9
Didelphidae American Opossums 2.9
Alcidae Auklets, Murrelets, Guillemots 1.5
Emberizidae Sparrows, Emberizid Finches, Towhees 1.5
Parulidae New World Warblers 1.5
Mimidae Mockingbirds, Thrashers 1.5
Rallidae Coots, rails 1.5
Strigidae Owls 1.5
Accipitridae Eagles, Hawks 1.5
Felidae Cats 1.5
Batrachoididae Toadfishes 1.5
Scorpaenidae Rockfishes, Scorpionfishes 1.5
Salmonidae Salmon, Trout 1.5
Cancridae Rock Crabs 1.5
Mytilidae Mussels 1.5
Myidae Softshell Clams 1.5
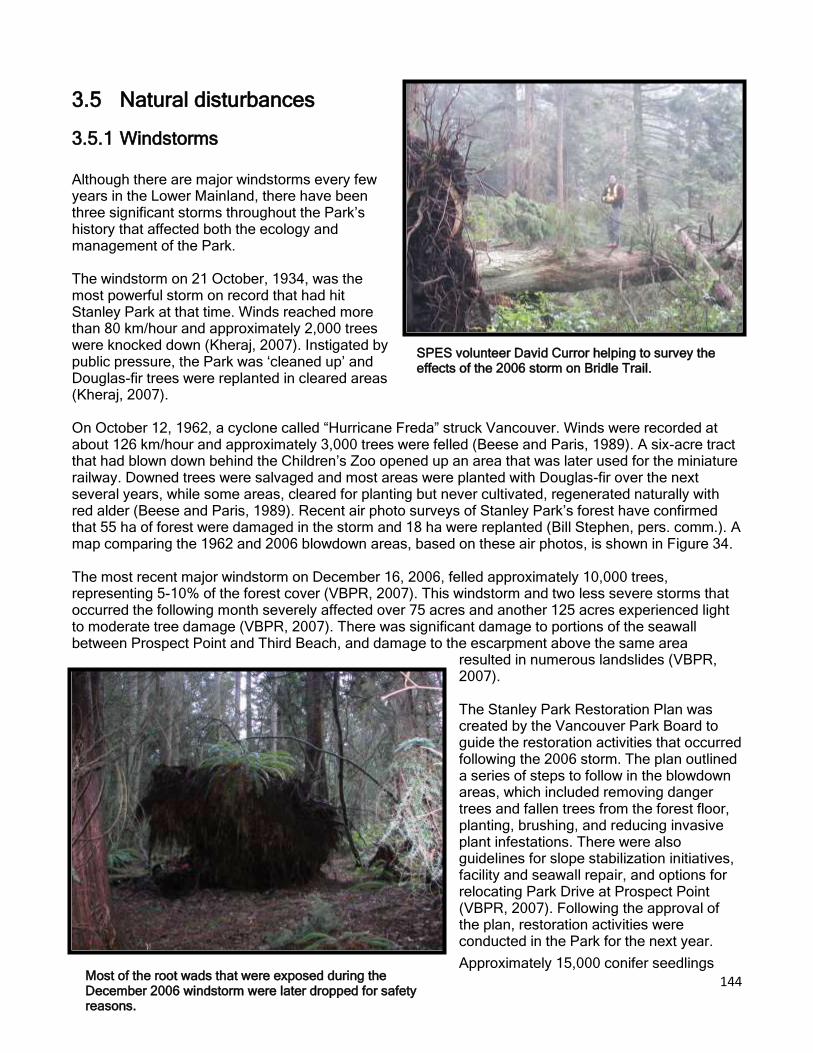
144
3.5 Natural disturbances
3.5.1 Windstorms
Although there are major windstorms every few years in the Lower Mainland, there have been three significant storms throughout the Park‘s history that affected both the ecology and management of the Park. The windstorm on 21 October, 1934, was the most powerful storm on record that had hit Stanley Park at that time. Winds reached more than 80 km/hour and approximately 2,000 trees were knocked down (Kheraj, 2007). Instigated by public pressure, the Park was ‗cleaned up‘ and Douglas-fir trees were replanted in cleared areas (Kheraj, 2007). On October 12, 1962, a cyclone called ―Hurricane Freda‖ struck Vancouver. Winds were recorded at about 126 km/hour and approximately 3,000 trees were felled (Beese and Paris, 1989). A six-acre tract that had blown down behind the Children‘s Zoo opened up an area that was later used for the miniature railway. Downed trees were salvaged and most areas were planted with Douglas-fir over the next several years, while some areas, cleared for planting but never cultivated, regenerated naturally with red alder (Beese and Paris, 1989). Recent air photo surveys of Stanley Park‘s forest have confirmed that 55 ha of forest were damaged in the storm and 18 ha were replanted (Bill Stephen, pers. comm.). A map comparing the 1962 and 2006 blowdown areas, based on these air photos, is shown in Figure 34. The most recent major windstorm on December 16, 2006, felled approximately 10,000 trees, representing 5-10% of the forest cover (VBPR, 2007). This windstorm and two less severe storms that occurred the following month severely affected over 75 acres and another 125 acres experienced light to moderate tree damage (VBPR, 2007). There was significant damage to portions of the seawall between Prospect Point and Third Beach, and damage to the escarpment above the same area
resulted in numerous landslides (VBPR, 2007). The Stanley Park Restoration Plan was created by the Vancouver Park Board to guide the restoration activities that occurred following the 2006 storm. The plan outlined a series of steps to follow in the blowdown areas, which included removing danger trees and fallen trees from the forest floor, planting, brushing, and reducing invasive plant infestations. There were also guidelines for slope stabilization initiatives, facility and seawall repair, and options for relocating Park Drive at Prospect Point (VBPR, 2007). Following the approval of the plan, restoration activities were conducted in the Park for the next year.
Approximately 15,000 conifer seedlings
SPES volunteer David Curror helping to survey the effects of the 2006 storm on Bridle Trail.
Most of the root wads that were exposed during the December 2006 windstorm were later dropped for safety reasons.
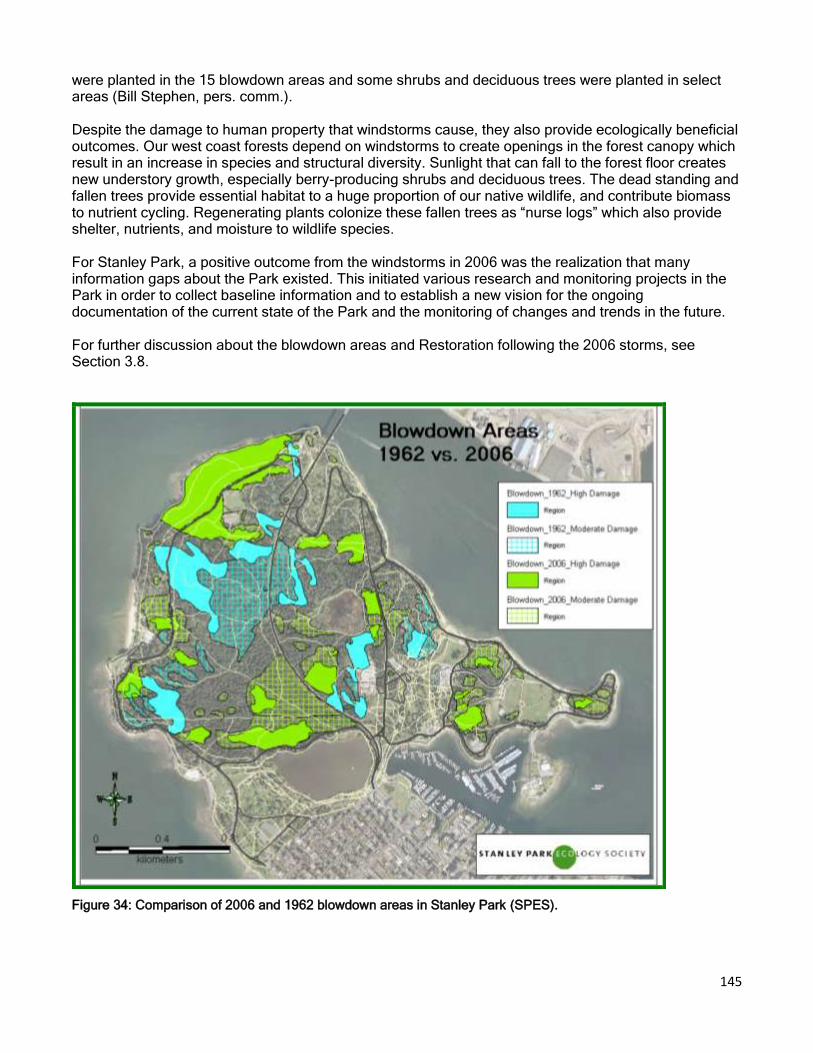
145
were planted in the 15 blowdown areas and some shrubs and deciduous trees were planted in select areas (Bill Stephen, pers. comm.). Despite the damage to human property that windstorms cause, they also provide ecologically beneficial outcomes. Our west coast forests depend on windstorms to create openings in the forest canopy which result in an increase in species and structural diversity. Sunlight that can fall to the forest floor creates new understory growth, especially berry-producing shrubs and deciduous trees. The dead standing and fallen trees provide essential habitat to a huge proportion of our native wildlife, and contribute biomass to nutrient cycling. Regenerating plants colonize these fallen trees as ―nurse logs‖ which also provide shelter, nutrients, and moisture to wildlife species. For Stanley Park, a positive outcome from the windstorms in 2006 was the realization that many information gaps about the Park existed. This initiated various research and monitoring projects in the Park in order to collect baseline information and to establish a new vision for the ongoing documentation of the current state of the Park and the monitoring of changes and trends in the future. For further discussion about the blowdown areas and Restoration following the 2006 storms, see Section 3.8.
Figure 34: Comparison of 2006 and 1962 blowdown areas in Stanley Park (SPES).

146
3.5.2 Fire In the Coastal Western Hemlock subzone the natural fire cycle has been debated and may occur every 300 to 400 years (Beese and Paris, 1989) or even after thousands of years (Lertzman et al., 2002). Wildfires have been excluded from Stanley Park since it was founded in 1888, as a management practice to reduce risks to people and property. Although most people would not like to see the Park burn, the exclusion of fire can also pose problems to the health of the forest. Fire is one of nature‘s cleansing agents for dwarf mistletoe, a parasitic plant effecting western hemlock trees. The most mistletoe-free area of the Park is the stand of mostly Douglas-fir trees between Beaver Lake and Lost Lagoon. This area was clear-cut and burned more than 100 years ago and so the hemlock trees in the area are relatively free of the parasite (Beese and Paris, 1989). Although fire serves a function in coastal temperate rainforests in terms of changing successional stages and influencing biodiversity, because these forests are characterized by ‗long return interval crown fires‘, the negative ecological effects of fire suppression programs in Stanley Park have likely been small (Parminter, 1992).
A great fire destroyed Vancouver and much of Stanley Park in 1886; this event resulted in the establishment of fire prevention programs. Fire control became a priority with the creation of the Park and a network of trails for hydrants and water delivery systems was developed through the Park beginning in 1910 (VBPR, 2009). However, fire was also used as a management tool to dispose of brush piles until 1995 (Bill Stephen, pers. comm.). The Forest Management Plan of 1989 and the new 2009 Forest Management Plan outline a detailed fire prevention program. The objective of the 2009 plan is to strengthen and implement the existing Stanley Park Fire Management Plan and to implement an ecologically sensitive fuel reduction program (VBPR, 2009). The plan aims to reduce the likelihood of uncontrolled fires burning in the forest and to minimize damage and risk to Park visitors caused by these escaped fires. Fire prevention will likely always be part of the management of Stanley Park because it experiences a high number of fires started by arson or by accident being so close to an urban center; approximately 12 fires are said to be extinguished annually (Patrick Cullen, pers. comm.).
3.5.3 Insects and Disease
Insects and diseases have also made their mark on the Park‘s forests. A 1914 report by Swaine, the chief of forest entomology at the Dominion Entomological Department, found that hemlock loopers had affected large areas of hemlock trees; he recommended they be cut down, burned, and replaced with Douglas-fir (Kheraj, 2008). Another investigation by J.B. Mitchell from the provincial forest branch found that 25% of the hemlock had already died, about 60% were seriously affected, and the remaining 15% were apparently healthy (Kheraj, 2008). Swaine also noted that the spruce trees were almost totally killed off by an unidentified species of gall aphid, and recommended that they too be removed and burned; less than 8% were in a healthy state, over 50% were diseased, and the remainder were dead (Kheraj, 2008). Swaine also made recommendations to remove all of the hemlock trees on the peninsula and replace them with Douglas fir (believed to be a more durable and pleasant-looking tree species), to remove understory vegetation to reduce insect habitat, and to remove the dead tops from the cedars for aesthetic reasons (Kheraj, 2008). The Park Board approved his recommendations but
This anciet western red cedar was destroyed by a fire started by a camper in 2008.
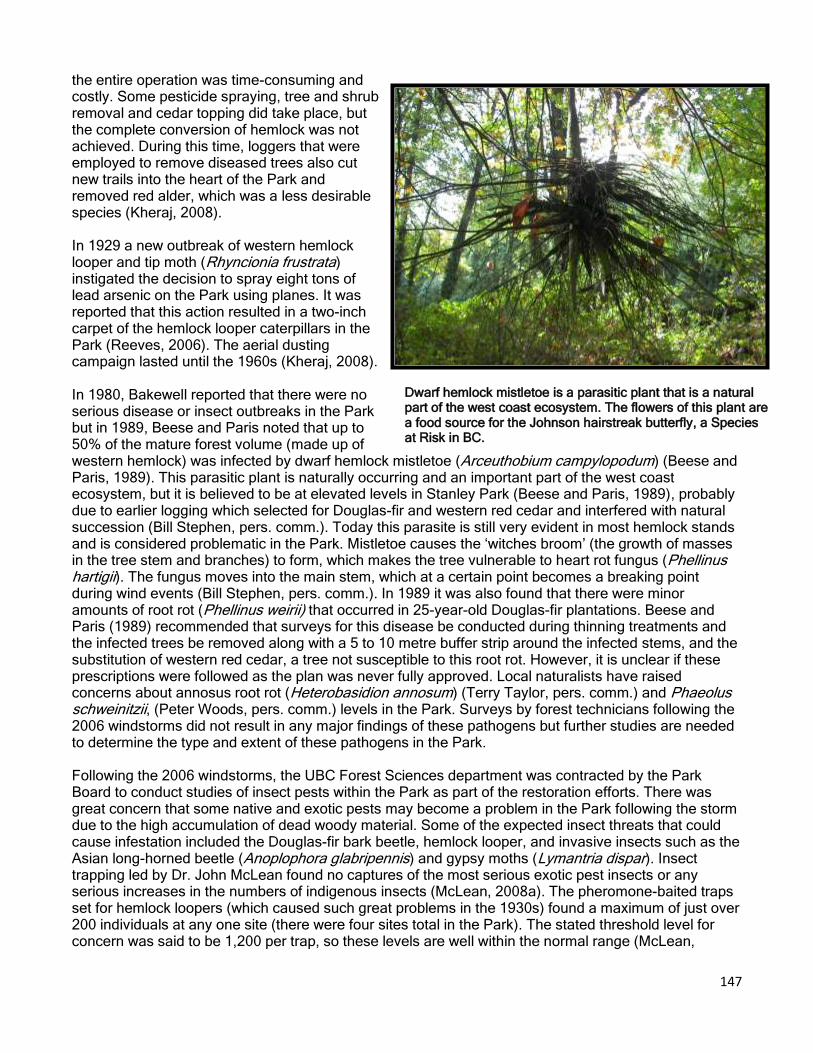
147
the entire operation was time-consuming and costly. Some pesticide spraying, tree and shrub removal and cedar topping did take place, but the complete conversion of hemlock was not achieved. During this time, loggers that were employed to remove diseased trees also cut new trails into the heart of the Park and removed red alder, which was a less desirable species (Kheraj, 2008). In 1929 a new outbreak of western hemlock looper and tip moth (Rhyncionia frustrata) instigated the decision to spray eight tons of lead arsenic on the Park using planes. It was reported that this action resulted in a two-inch carpet of the hemlock looper caterpillars in the Park (Reeves, 2006). The aerial dusting campaign lasted until the 1960s (Kheraj, 2008). In 1980, Bakewell reported that there were no serious disease or insect outbreaks in the Park but in 1989, Beese and Paris noted that up to 50% of the mature forest volume (made up of western hemlock) was infected by dwarf hemlock mistletoe (Arceuthobium campylopodum) (Beese and Paris, 1989). This parasitic plant is naturally occurring and an important part of the west coast ecosystem, but it is believed to be at elevated levels in Stanley Park (Beese and Paris, 1989), probably due to earlier logging which selected for Douglas-fir and western red cedar and interfered with natural succession (Bill Stephen, pers. comm.). Today this parasite is still very evident in most hemlock stands and is considered problematic in the Park. Mistletoe causes the ‗witches broom‘ (the growth of masses in the tree stem and branches) to form, which makes the tree vulnerable to heart rot fungus (Phellinus hartigii). The fungus moves into the main stem, which at a certain point becomes a breaking point during wind events (Bill Stephen, pers. comm.). In 1989 it was also found that there were minor amounts of root rot (Phellinus weirii) that occurred in 25-year-old Douglas-fir plantations. Beese and Paris (1989) recommended that surveys for this disease be conducted during thinning treatments and the infected trees be removed along with a 5 to 10 metre buffer strip around the infected stems, and the substitution of western red cedar, a tree not susceptible to this root rot. However, it is unclear if these prescriptions were followed as the plan was never fully approved. Local naturalists have raised concerns about annosus root rot (Heterobasidion annosum) (Terry Taylor, pers. comm.) and Phaeolus schweinitzii, (Peter Woods, pers. comm.) levels in the Park. Surveys by forest technicians following the 2006 windstorms did not result in any major findings of these pathogens but further studies are needed to determine the type and extent of these pathogens in the Park. Following the 2006 windstorms, the UBC Forest Sciences department was contracted by the Park Board to conduct studies of insect pests within the Park as part of the restoration efforts. There was great concern that some native and exotic pests may become a problem in the Park following the storm due to the high accumulation of dead woody material. Some of the expected insect threats that could cause infestation included the Douglas-fir bark beetle, hemlock looper, and invasive insects such as the Asian long-horned beetle (Anoplophora glabripennis) and gypsy moths (Lymantria dispar). Insect trapping led by Dr. John McLean found no captures of the most serious exotic pest insects or any serious increases in the numbers of indigenous insects (McLean, 2008a). The pheromone-baited traps set for hemlock loopers (which caused such great problems in the 1930s) found a maximum of just over 200 individuals at any one site (there were four sites total in the Park). The stated threshold level for concern was said to be 1,200 per trap, so these levels are well within the normal range (McLean,
Dwarf hemlock mistletoe is a parasitic plant that is a natural part of the west coast ecosystem. The flowers of this plant are a food source for the Johnson hairstreak butterfly, a Species at Risk in BC.
148
Phaeolus schweinitzii – Douglas-fir Root Butt Rot
Phaeolus schweinitzii, a polypore (bracket or shelf –fungus), is a decomposer – an organism capable of digesting, releasing, and recycling nutrients locked-up in woody debris. Phaeolus brackets grow on many of the Douglas-fir stumps left from ~1860s logging in Stanley Park. The numerous and widely distributed stumps provide the fungus with a large and widespread food reservoir.
P. schweinitzii is a pathogen causing root butt rot disease in Douglas-fir. Although young trees can be infected, the visible signs of infection (brackets) do not usually appear until the trees mature. Phaeolus brackets are found on mature Douglas-fir growing in plantations established in Stanley Park in the 1940s and in areas burned after 1860s logging. Phaeolus is present in plantations with large numbers of young Douglas-firs established through 1989-1998, 1999-2006 and the post-2006 forest restoration effort. Young Douglas-fir growing near infected stumps are very likely to be infected by the fungus. The incidence of infection is typically much higher than indicated by the number of trees showing brackets. Tree death usually occurs within 50 years of infection.
The few remaining old growth Douglas-firs found in Stanley Park show a very high incidence of infection. Of a concentration seven old growth firs greater than 1 meter dbh monitored along a 200 m stretch of Bridle Path since 1998 – four have died and two are infected. Phaeolus brackets are also found in the grove of firs off Pipeline Road (bald eagle nest and roost trees).
Effective management of forest 'health', heritage and safety issues depends upon developing an improved understanding of the present and future impact of Phaeolus on Douglas-fir in Stanley Park.
Peter Woods, Naturalist (Sept. 4, 2009)
2008a). The levels found in the summer of 2009 have been consistent with those of the previous two years (Bill Stephen, pers. comm.). The Stanley Park Forest Management Plan (VBPR, 2009) made recommendations for managing insect pests and disease. This included the implementation of an Integrated Pest Management approach, developing/adapting existing monitoring programs for expected threats, and developing a GIS storage system to manage data from monitors and to implement
3.6 The Restoration Plan and Blowdown Areas After the winter windstorms hit the Park in December 2006, the need for comprehensive restoration planning became apparent. The Restoration Plan was created by a steering committee in cooperation with the Park Board. It consisted of two ecologists, four foresters and two geotechnical engineers. The vision for the plan was ―that Stanley Park‘s forest be a resilient coastal forest with a diversity of native tree and other species and habitats, that allows Park visitors to experience nature in the city‖ (VBPR, 2007). The plan was approved in April 2007 and although some of the work was already under way, the restoration process stemmed from this vision. There were three main goals: fostering a ‗resilient forest‘, repairing the Park‘s infrastructure, and creating legacies to support the forest in the long term. Guiding principles for the process were also created based on advice from Park staff, consultants, and volunteer advisors. These included (VBPR, 2007): 1) To foster a resilient coastal forest
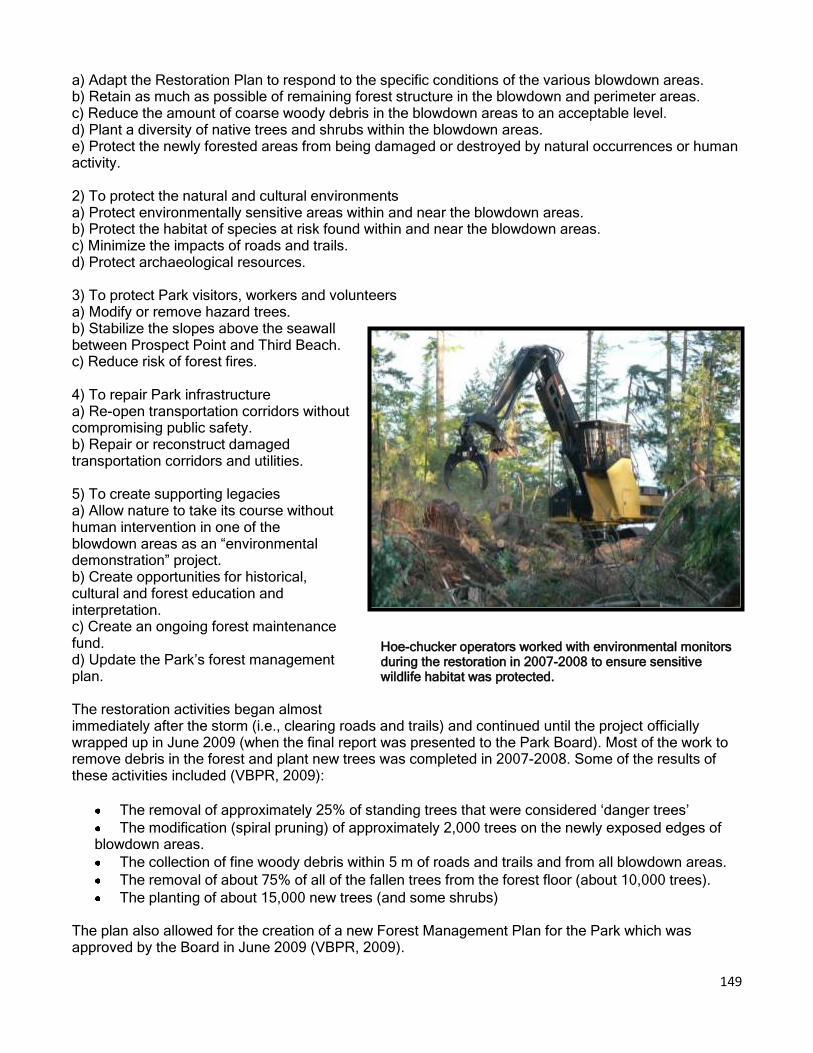
149
a) Adapt the Restoration Plan to respond to the specific conditions of the various blowdown areas. b) Retain as much as possible of remaining forest structure in the blowdown and perimeter areas. c) Reduce the amount of coarse woody debris in the blowdown areas to an acceptable level. d) Plant a diversity of native trees and shrubs within the blowdown areas. e) Protect the newly forested areas from being damaged or destroyed by natural occurrences or human activity. 2) To protect the natural and cultural environments a) Protect environmentally sensitive areas within and near the blowdown areas. b) Protect the habitat of species at risk found within and near the blowdown areas. c) Minimize the impacts of roads and trails. d) Protect archaeological resources. 3) To protect Park visitors, workers and volunteers a) Modify or remove hazard trees. b) Stabilize the slopes above the seawall between Prospect Point and Third Beach. c) Reduce risk of forest fires. 4) To repair Park infrastructure a) Re-open transportation corridors without compromising public safety. b) Repair or reconstruct damaged transportation corridors and utilities. 5) To create supporting legacies a) Allow nature to take its course without human intervention in one of the blowdown areas as an ―environmental demonstration‖ project. b) Create opportunities for historical, cultural and forest education and interpretation. c) Create an ongoing forest maintenance fund. d) Update the Park‘s forest management plan. The restoration activities began almost immediately after the storm (i.e., clearing roads and trails) and continued until the project officially wrapped up in June 2009 (when the final report was presented to the Park Board). Most of the work to remove debris in the forest and plant new trees was completed in 2007-2008. Some of the results of these activities included (VBPR, 2009):
The removal of approximately 25% of standing trees that were considered ‗danger trees‘
The modification (spiral pruning) of approximately 2,000 trees on the newly exposed edges of blowdown areas.
The collection of fine woody debris within 5 m of roads and trails and from all blowdown areas.
The removal of about 75% of all of the fallen trees from the forest floor (about 10,000 trees).
The planting of about 15,000 new trees (and some shrubs) The plan also allowed for the creation of a new Forest Management Plan for the Park which was approved by the Board in June 2009 (VBPR, 2009).
Hoe-chucker operators worked with environmental monitors during the restoration in 2007-2008 to ensure sensitive wildlife habitat was protected.

150
There were a total of 16 ―blowdown areas‖ in the Park representing about 30 ha and another 50 ha had ‗light to moderate damage‘ (VBPR, 2007). Each of the blowdown areas was mapped and prescriptions were made for the restoration and subsequent planting. Information on these prescriptions was obtained for this report directly from the prescription documents that were created and disseminated to Park and consultant staff during field operations by B.A. Blackwell Forestry Consultants. The Restoration prescriptions deal with soils, coarse woody debris (CWD), wildlife and other resource values, culturally modified trees (CMTs), and invasive species. The planting prescriptions describe the density, species composition and number of trees planted in the blowdown areas. Not all of the prescriptions were available at the time of the creation of the Appendix 16, so it only includes those blowdown areas that had sufficient data. The general description of each blowdown area is listed in Table 27.
Table 27: General description of the 16 major Stanley Park Restoration Plan blowdown areas.
Blowdown Area (ha) Elevation Location Description Forest Cover Site Associations *WMEAs
E1 0.4 5-15 m West of Brockton Point Conifer - wetter sites lady fern-foamflower-sword fern E
E2 2.1 5-25 m East of Aquarium Conifer - drier sites lady fern-foamflower-sword fern E, DF
E3 ? 5-15 m Northeast of Aquarium Conifer - drier sites; alder lady fern-foamflower-sword fern E
N1 (TU:1) 18.1 0-75 m Southwest of Prospect Point
Mixed maple/conifer; dry exposed ridge
sword fern; lady fern-sword fern; sword fern-spiny wood fern E, S, R
N1 (TU:2) 4.6 55-75 m Southeast of Prospect Point
Conifer - wetter sites; Conifer - drier sites; Mixed maple/conifer
lady fern-foamflower-sword fern; lady fern-sword fern; sword fern-spiny wood fern; skunk cabbage
E, S, R, SCS
N3 1.2 25-45 m Northwest of Beaver Lake; east of Causeway
Conifer - wetter sites; Mixed maple/conifer
lady fern-foamflower-sword fern; lady fern-sword fern E
N4_N5 2 5-25 m North of Beaver Lake; west of Park Drive
Conifer - wetter sites; alder
lady fern-foamflower-sword fern; skunk cabbage
E, S, R, SCS
N6-6A 1.1 5-25 m East of Beaver Lake, north of Tisdall Trail Conifer - wetter sites;
lady fern-foamflower-sword fern; deer fern-salal; sword fern-spiny wood fern; skunk cabbage
E, SCS, OGF
S1 0.4 5-25 m East of Beaver Lake, south of Tisdall Trail
Conifer - wetter sites; Conifer - drier sites
lady fern-foamflower-sword fern; deer fern-salal; skunk cabbage E, SCS
S2 2.6 5-25 m East of the Causeway, west of South Creek Trail
Conifer - wetter sites; Conifer - drier sites
skunk cabbage; lady fern-foamflower-sword fern; sword fern-spiny wood fern; lady fern-sword fern E, S, R
S3 1.5 5-25 m Off Bridle Trail, north of Cathedral Trail Conifer - wetter sites; skunk cabbage; deer fern–salal
E, S, R, SCS
S4 4.8 5-15 m
Between Rawlings Trail and the Causeway north of Lagoon Drive
Conifer - wetter sites; Conifer - drier sites; Mixed maple/conifer
skunk cabbage; lady fern-foamflower-sword fern; salal-sword fern
E, S, R, SCS
S5 0.9 5-15 m West of Rawlings Trail, north of Second Beach
Conifer - wetter sites; alder
lady fern-foamflower-sword fern; skunk cabbage E, SCS
S7 1.9 15-25 m East of Ferguson Point Conifer - wetter sites; Conifer - drier sites
lady fern-foamflower-sword fern; lady fern-sword fern E
S8 0.8 15-35 m
Southeast of Third Beach, east of Rawlings Trail Conifer - drier sites
lady fern-foamflower-sword fern; sword fern-spiny wood fern; salal-sword fern E
S9 1.0 15-45 m
Northeast of Third Beach, east and west of Park Drive Conifer - drier sites lady fern-sword fern E
*WMEAs (Wildlife Management Emphasis Areas): Stream (S), Riparian ( R), Ecotone (E), Skunk Cabbage Swamp (SCS), Deciduous Forest (DF), Old Growth Forest (OGF)
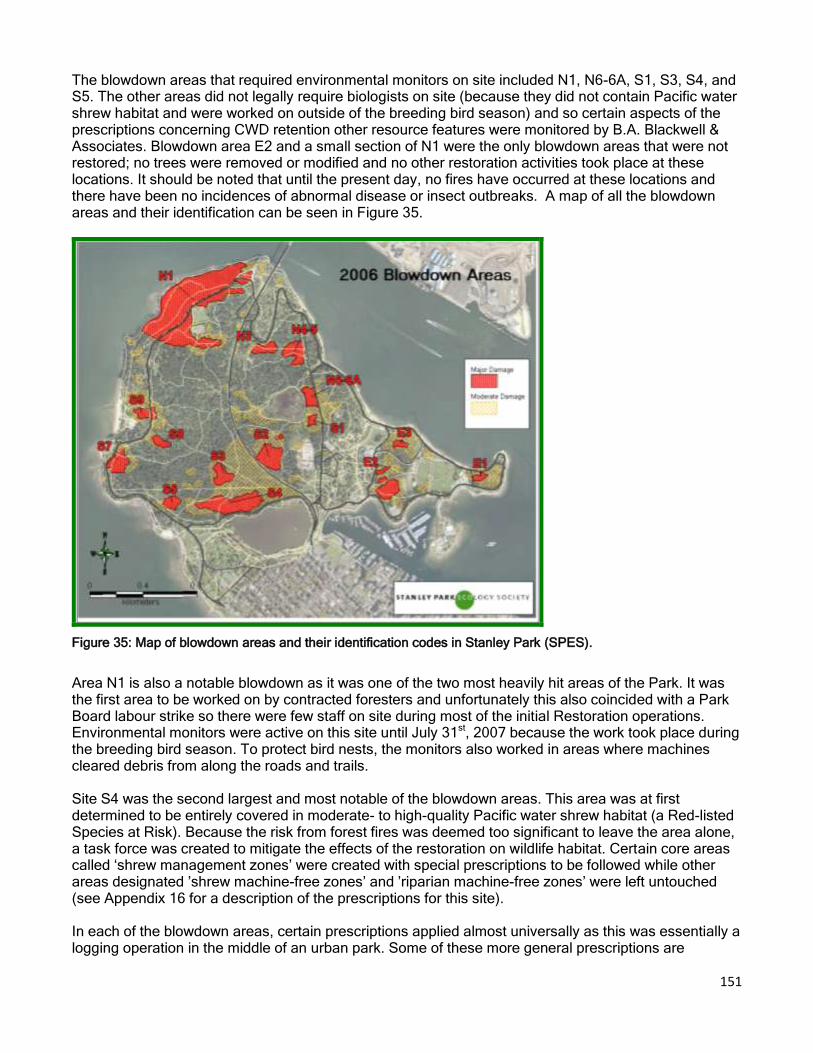
151
The blowdown areas that required environmental monitors on site included N1, N6-6A, S1, S3, S4, and S5. The other areas did not legally require biologists on site (because they did not contain Pacific water shrew habitat and were worked on outside of the breeding bird season) and so certain aspects of the prescriptions concerning CWD retention other resource features were monitored by B.A. Blackwell & Associates. Blowdown area E2 and a small section of N1 were the only blowdown areas that were not restored; no trees were removed or modified and no other restoration activities took place at these locations. It should be noted that until the present day, no fires have occurred at these locations and there have been no incidences of abnormal disease or insect outbreaks. A map of all the blowdown areas and their identification can be seen in Figure 35.
Figure 35: Map of blowdown areas and their identification codes in Stanley Park (SPES).
Area N1 is also a notable blowdown as it was one of the two most heavily hit areas of the Park. It was the first area to be worked on by contracted foresters and unfortunately this also coincided with a Park Board labour strike so there were few staff on site during most of the initial Restoration operations. Environmental monitors were active on this site until July 31st, 2007 because the work took place during the breeding bird season. To protect bird nests, the monitors also worked in areas where machines cleared debris from along the roads and trails. Site S4 was the second largest and most notable of the blowdown areas. This area was at first determined to be entirely covered in moderate- to high-quality Pacific water shrew habitat (a Red-listed Species at Risk). Because the risk from forest fires was deemed too significant to leave the area alone, a task force was created to mitigate the effects of the restoration on wildlife habitat. Certain core areas called ‗shrew management zones‘ were created with special prescriptions to be followed while other areas designated ‘shrew machine-free zones‘ and ‘riparian machine-free zones‘ were left untouched (see Appendix 16 for a description of the prescriptions for this site). In each of the blowdown areas, certain prescriptions applied almost universally as this was essentially a logging operation in the middle of an urban park. Some of these more general prescriptions are
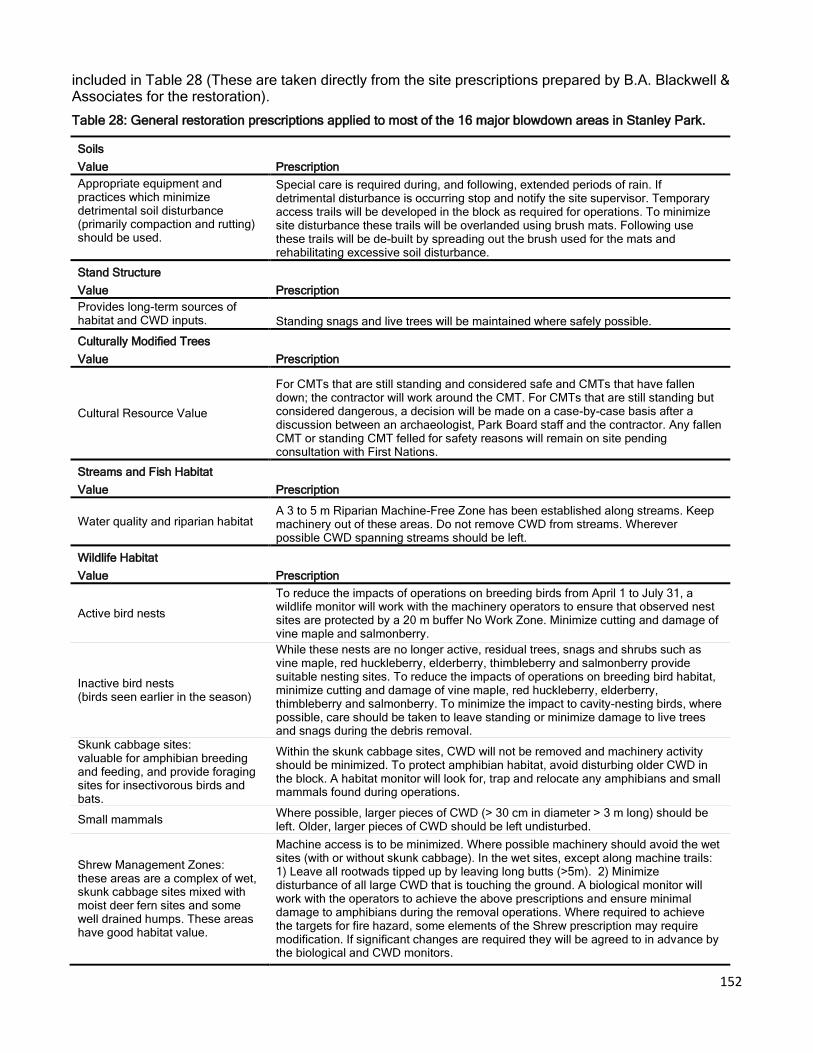
152
included in Table 28 (These are taken directly from the site prescriptions prepared by B.A. Blackwell & Associates for the restoration).
Table 28: General restoration prescriptions applied to most of the 16 major blowdown areas in Stanley Park.
Soils
Value Prescription
Appropriate equipment and practices which minimize detrimental soil disturbance (primarily compaction and rutting) should be used.
Special care is required during, and following, extended periods of rain. If detrimental disturbance is occurring stop and notify the site supervisor. Temporary access trails will be developed in the block as required for operations. To minimize site disturbance these trails will be overlanded using brush mats. Following use these trails will be de-built by spreading out the brush used for the mats and rehabilitating excessive soil disturbance.
Stand Structure
Value Prescription
Provides long-term sources of habitat and CWD inputs. Standing snags and live trees will be maintained where safely possible.
Culturally Modified Trees
Value Prescription
Cultural Resource Value
For CMTs that are still standing and considered safe and CMTs that have fallen down; the contractor will work around the CMT. For CMTs that are still standing but considered dangerous, a decision will be made on a case-by-case basis after a discussion between an archaeologist, Park Board staff and the contractor. Any fallen CMT or standing CMT felled for safety reasons will remain on site pending consultation with First Nations.
Streams and Fish Habitat
Value Prescription
Water quality and riparian habitat A 3 to 5 m Riparian Machine-Free Zone has been established along streams. Keep machinery out of these areas. Do not remove CWD from streams. Wherever possible CWD spanning streams should be left.
Wildlife Habitat
Value Prescription
Active bird nests
To reduce the impacts of operations on breeding birds from April 1 to July 31, a wildlife monitor will work with the machinery operators to ensure that observed nest sites are protected by a 20 m buffer No Work Zone. Minimize cutting and damage of vine maple and salmonberry.
Inactive bird nests (birds seen earlier in the season)
While these nests are no longer active, residual trees, snags and shrubs such as vine maple, red huckleberry, elderberry, thimbleberry and salmonberry provide suitable nesting sites. To reduce the impacts of operations on breeding bird habitat, minimize cutting and damage of vine maple, red huckleberry, elderberry, thimbleberry and salmonberry. To minimize the impact to cavity-nesting birds, where possible, care should be taken to leave standing or minimize damage to live trees and snags during the debris removal.
Skunk cabbage sites: valuable for amphibian breeding and feeding, and provide foraging sites for insectivorous birds and bats.
Within the skunk cabbage sites, CWD will not be removed and machinery activity should be minimized. To protect amphibian habitat, avoid disturbing older CWD in the block. A habitat monitor will look for, trap and relocate any amphibians and small mammals found during operations.
Small mammals Where possible, larger pieces of CWD (> 30 cm in diameter > 3 m long) should be left. Older, larger pieces of CWD should be left undisturbed.
Shrew Management Zones: these areas are a complex of wet, skunk cabbage sites mixed with moist deer fern sites and some well drained humps. These areas have good habitat value.
Machine access is to be minimized. Where possible machinery should avoid the wet sites (with or without skunk cabbage). In the wet sites, except along machine trails: 1) Leave all rootwads tipped up by leaving long butts (>5m). 2) Minimize disturbance of all large CWD that is touching the ground. A biological monitor will work with the operators to achieve the above prescriptions and ensure minimal damage to amphibians during the removal operations. Where required to achieve the targets for fire hazard, some elements of the Shrew prescription may require modification. If significant changes are required they will be agreed to in advance by the biological and CWD monitors.

153
3.7 Stressors As an old and intensively-used park near a large urban centre, Stanley Park has been significantly impacted by human use. The following section outlines some of the major threats and everyday influences that continue to affect the ecological integrity of the Park. It is unlikely that every possible consequence of human impacts has been represented, as many of their effects are as yet unknown or poorly understood.
3.7.1 Environmental
3.7.1.1 Climate Change
The Intergovernmental Panel on Climate Change Working Group II‘s Fourth Report on climate change concludes that there is significant evidence pointing to human impacts being major contributors to global warming (IPCC, 2007). Anthropogenic influences have a major effect on both physical and biological systems. Trends and changes in data have been monitored since the 1970s. These statistics show there is an alarming increase in the earth‘s atmospheric CO2 and the overall temperature, which is expected to increase by several degrees Celsius by the end of the century. The report states that ―major changes in ecosystem structure and function, species ecological interactions, and species geographical ranges, with predominantly negative consequences for biodiversity and ecosystem goods and services‖ are to be expected in the future. Other factors such as urban development will continue to contribute to ecosystem degradation and biodiversity loss. As a result, the report states, climate change will likely be amplified by these factors. Climate change is a significant problem in BC, but its most noticeable effects can be observed in the Lower Mainland. The temperature and precipitation in the province are increasing (Wilson and Hebda, 2008) and the plant communities are adapting to changing conditions. It is predicted that the range of Coastal Douglas-fir zone will expand 336% of its current size while the Coastal Western Hemlock (CWH) zone will shift northward and will be found at higher elevations (Hamann and Wang, 2006). A climate model by Hamann and Wang predicts that Vancouver, including Stanley Park, will, by 2085, shift towards a Coastal Douglas-fir (CDF) ecosystem (Wilson and Hebda, 2008), and as a result, this may alter basic natural ecosystem properties (Dukes and Mooney, 1999). Figure 36 models the predicted results of range changes in several of the major plant communities in BC. Over time, dry communities like the Bunch Grass (BG) and CDF zones, and wet communities such as the CWH zone, will increase in size while colder areas like the Boreal White and Black Spruce (BWBS) zone will decrease in size. Overall, many of the zones will move northward and higher in elevation and the Alpine Tundra (AT) zones will almost be lost completely except at very high elevations.
The increased severity of winter storms is one effect of our changing climate (Photo by Martin Passchier).
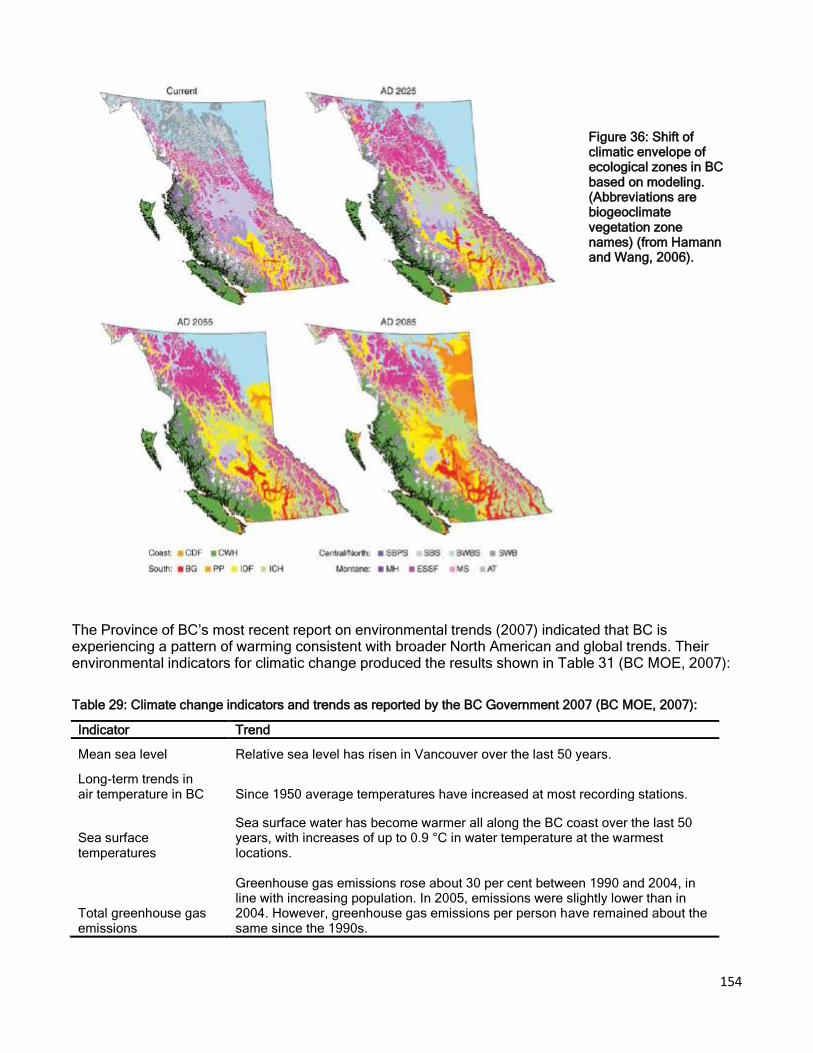
154
Figure 36: Shift of climatic envelope of ecological zones in BC based on modeling. (Abbreviations are biogeoclimate vegetation zone names) (from Hamann and Wang, 2006).
The Province of BC‘s most recent report on environmental trends (2007) indicated that BC is experiencing a pattern of warming consistent with broader North American and global trends. Their environmental indicators for climatic change produced the results shown in Table 31 (BC MOE, 2007):
Table 29: Climate change indicators and trends as reported by the BC Government 2007 (BC MOE, 2007):
Indicator Trend
Mean sea level Relative sea level has risen in Vancouver over the last 50 years.
Long-term trends in air temperature in BC Since 1950 average temperatures have increased at most recording stations.
Sea surface temperatures
Sea surface water has become warmer all along the BC coast over the last 50 years, with increases of up to 0.9 °C in water temperature at the warmest locations.
Total greenhouse gas emissions
Greenhouse gas emissions rose about 30 per cent between 1990 and 2004, in line with increasing population. In 2005, emissions were slightly lower than in 2004. However, greenhouse gas emissions per person have remained about the same since the 1990s.
155
A key report on climate change that was prepared for nearby Puget Sound highlighted some of the projected changes on coastal-marine features for the 21st Century (Snover et al., 2003). These included:
increases in air and water temperature,
alteration of river and stream flows with decreased snow pack,
increased flooding from more rain and less snow,
accelerated sea-level rise,
changes in size and productivity of near-shore habitats (e.g., salt marshes, eelgrass beds, kelp
communities),
water flow and temperature impacts on salmon migration and spawning, and
temperature shifts to the marine plankton trophic dynamics with linkages to invertebrates, fish
and marine mammals.
These projected changes will also apply to the coastal environment in the Lower Mainland.
3.7.1.2 Habitat Fragmentation and Isolation
Stanley Park has always been a fragment of forest, as it began as an island only connected to the mainland at low tide. When the nearest forests were cleared and replaced with the developments of downtown Vancouver, movement into the Park by land animals was further restricted. When Stanley Park was cut off from its original landscape it became a smaller ―island‖ of habitat, and as expected, it has gradually decreased in its total native biodiversity. Birds, mammals, amphibians, reptiles and insects could historically travel to and from the Park before 1920, but since then, the only wildlife able to enter or leave the Park has been restricted to creatures that can fly or swim. Stanley Park is an island of trees surrounded by a landscape of ocean and urbanization. Although forests are often naturally patchy in terms of the habitats and successional stages, forest fragments that are created by humans have localized and immediate effects especially when they are surrounded by development (Schmiegelow and Mönkkönen, 2002; McComb, 1999). The separation of forest fragments from the surrounding landscape results in habitat loss and changes in the spatial arrangement of the habitat (Houde, 2007). This can result in both positive and negative changes. For example, a positive effect may be the increase in abundance of some species, while negative effects include loss of gene flow, crowding and increased competition, and degradation of the existing habitat due to edge effects and species invasions (Fahrig, 2003).
Some species in the Park are likely to have been negatively impacted by the separation of the Park from the mainland and the loss of habitat in the surrounding areas. The genetic diversity of small mammals, reptiles, and amphibians in the Park is likely limited since the possibility of new individuals finding their way to the Park seems improbable. On occasion, black-tailed deer have swum over to the Park (presumably from the North Shore) and beavers frequently find their way to the Park. Historically, black bear, elk, wolves and other large animals all existed in the Park, and their persistent absence may also continue to affect the local ecology.
Edges (or ―ecotones‖) are boundary areas between two habitats and are not easily spatially defined. Edge habitats themselves do not have discrete boundaries, but there are measurable differences between the forest interior and edge which are named ―edge effects‖ (Matlack and Litvaitis, 1999; Murcia, 1995). These effects are defined as ―abiotic characteristics that are influenced by an

156
ecosystem, and the biotic responses to them‖ (Houde, 2007). The abiotic edge in the Pacific Northwest is said to extend about two to three tree lengths (<150 m) into the forest (Kremsater and Bunnell, 1999) and include factors such as sunlight, relative humidity, and temperature (Fenger et al, 2006). Biotic effects can range from increased understory vegetation and windthrow at forest edges, to higher level effects such as increased levels of herbivores and the corresponding increase in predators (Matlack and Litvaitis, 1999; Murcia, 1995). Some songbirds, small mammals and ungulates thrive on forest edges but other species need undisturbed mature or old-growth habitat instead (Fenger et al, 2006). The construction of roads and larger trails in Stanley Park has led to the fragmentation of the forest and has created new edges, hence an increase in edge effects and a loss of interior habitat.
Forest birds may not suffer from the loss of habitat and fragmentation of the forest in terms of gene flow, but may be significantly impacted in other ways as a result of these edge effects. Bird species may be affected either negatively or positively by an increase in forest edge, but the continent-wide decline of some migrants has been partially attributed to the increased nest predation and parasitism associated with habitat fragmentation and alteration (Houde, 2007). One hypothesis is that the edge acts like an ―ecological trap‖; it is an attractive place for songbirds to nest, yet it is also more attractive to nest parasites (like cowbirds) and predators (like squirrels, jays and crows) (Lahti, 2001). Another hypothesis is that edges are used as travel corridors by nest parasites and predators, making birds nesting in these areas more susceptible (Lariviere, 2003). Stanley Park certainly has an abundance of nest parasites and predators. Brown-headed cowbirds are regularly seen around forest edges in the Park and have been observed parasitizing several species of native songbirds (Peter Woods, pers. comm.). The abundant crow and squirrel populations in the Park must also have negative impacts on native songbirds but there have been no studies of this in the Park to date. A newspaper article from 1916 claimed that ―murderous crows‖ were decimating native songbirds. A Park commissioner said that about 70% of the eggs and young were being destroyed, but it is not clear where this number came from (Smedman, 2004).
It is possible that Stanley Park may act as ‗sink‘ for some songbird populations. This means that the birth rates in the Park for those species would be lower than the death rates, causing the population to decline. The populations that breed in the Park would rely on immigration from other ‗source‘ populations to maintain their numbers and so there would be a net flow of individuals from other sources into Stanley Park (Pulliam, 1988). However, the opposite is also true and may be the case in other species (e.g., raccoons) as the Park may act as a ‗source‘ for these creatures to emigrate into other areas of the city.
Connectivity between the forest fragment and the surrounding landscape is often thought of in terms of the movement of animals, but it also includes the movement of plant spores, pollen and seeds (Houde, 2007). Some species may even depend on the connectivity of habitat on a much smaller scale. The connectivity of course woody debris in the forest understory can influence the movement of small mammals as can the connectivity between forest ponds for amphibians. Forest birds that are able to move large distances during migration may also be sensitive to small gaps in forest cover in their breeding territories (Belisle and Desrochers, 2002).
Completely isolated populations run the risk of losing genetic variability and can experience inbreeding depression, but the degree that the landscape provides connectivity depends on the ability of the species to move and the habitat requirements, and is therefore species-specific (Houde, 2007).
The issues of habitat fragmentation and isolation have been extensively studied by researchers all over the world. There is much literature about this topic and Stanley Park may be an excellent place to study these effects in an urban setting. To date, no such studies have taken place in the Park.

157
3.7.1.3 Invasive Exotic Plants
Invasive exotic plants are species that have been introduced by humans, are far from their natural geographic range, and pose undesired or negative impacts on native biota and ecosystems, managed landscapes and/or human health. These species are able to spread quickly, grow rapidly, and thrive in their new environments, resulting in impacts to environmental, economic and social systems. Invasive species are considered one of the greatest threats to biodiversity in our world today, second only to habitat loss. Many invasive plants are able to shade-out, smother and displace native plants that provide valuable habitat in our ecosystems. Some of these plants also produce toxic substances that inhibit the growth of native species, while others are poisonous to local wildlife or humans. Others can
cause damage to abiotic elements of an ecosystem—altering water flows, causing erosion, or increasing fire hazard. Invasive plants causing each of these effects can be found in Stanley Park‘s forests today. See Appendix 17 for a complete list of invasive plant species in Stanley Park and Appendix 18 for Best Management Practices for their management. Introductions of invasive plants can happen in a number of ways. Many invasives have been introduced into new settings and planted as garden ornamentals. In parks and
greenways, many invasive plant infestations have been started through unsanctioned dumping or improper
disposal of garden waste from residences or managed areas. Similarly, seeds, fruit and other plant matter can be spread — by wind, wildlife, or ‗hitch-hiking‘ on vehicles, shoes, or even pets — to new locations. Due to the fact that Stanley Park is located in an urban setting and is a high-traffic area, all of these means of introduction are of concern. A range of research has shown that some of the potential impacts of climate change, such as increased concentration in atmospheric carbon dioxide and nitrogen disposition, may increase the invasiveness of some plant species (Dukes and Mooney, 1999). With a predicted increase in the number of invasives entering our ecosystems, it is possible that these potential ―biological invaders would alter basic ecosystem properties in ways that feed back to affect many components of global change‖ (Dukes and Mooney, 1999). Taking current as well as future conditions into consideration, a rigorous and adaptive invasive plant management plan is needed to ensure that the Stanley Park‘s ecological integrity is maintained. Methodology concerning the best management practices for the removal of invasive plants has been created and used by SPES Stewardship Programs. SPES began removing English ivy from Stanley Park in 2004 and now works on over 11 different species. These methodologies were also adopted into the 2009 Stanley Park Forest Management Plan.
Invasive giant hogweed is a concern in Stanley Park not only because of its effects on local ecology, but it is also a human health concern. This patch near Prospect Point was removed during the 2007-2008 Restoration.
158
Preliminary mapping surveys for all invasive alien plant species have been undertaken by SPES staff and volunteers in Stanley Park since 2007. Much of the data was collected by volunteers trained in species identification as they walked all of the roads and trails in the Park. Additional data was collected by SPES staff and a Park Board GIS technician working in the Park during the 2007-2008 Restoration. The results of the mapping surveys and descriptions of the species can be found in Appendix 18 and all known invasive plant species recorded in Stanley Park are listed in Appendix 17 and Table 30.
Table 30: List of invasive plants currently found in Stanley Park.
Broad Leaved Plantain (Plantago major)
Burdock (Arctium spp)
Butterfly Bush (Buddleja davidii)
California Poppy (Eschscholzia californica)
Canada Thistle (Cirsium arvense)
Climbing Nightshade (Bittersweet) (Solanum dulcamara)
Common Foxglove (Digitalis purpurea)
Common Tansy (Tanacetum vulgare)
Creeping Buttercup (Ranunculus repens)
English Holly (Ilex aquifolium)
English Ivy (Hedera helix)
English Laurel (Prunus laurocerasus)
Evergreen Blackberry (Rubus laciniatus)
Fragrant Water Lily (Nymphaea odorata)
Giant Hogweed (Heracleum mantegazzianum)
Gorse (Ulex europaeus)*
Great Mullein (Verbascum thapsus)
Herb Robert (Geranium robertianum)
Himalayan Blackberry (Rubus armeniacus [formally discolor])
Japanese Knotweed (Polygonum cuspidatum)*
Lesser Periwinkle (Vinca minor)
Morning Glory (Bindweed) (Convolvulus sepium)
Nipplewort (Lapsana communis)
Pineapple Weed (Matricaria discoidea)
Portugal Laurel (Prunus lusitanica)
Purple Loosestrife (Lythrum salicaria)*
Reed Canary Grass (Phalaris arundinacea)
Rose Campion (Lychnis coronaria)
Scotch Broom (Cytisus scoparius)
Small-Flower-Touch -Me-Not (Impatiens parviflora)
Sorrel/ Dock (Rumex spp.)
Sow Thistle (Sonchus spp)
Spurge Laurel (Daphne) (Daphne laureola)
St John’s Wort (Hypericum calycinum)
Wall Lettuce (Lactuca muralis)
Yellow Flag Iris (Iris pseudacorus)
Yellow Lamium (Yellow Archangel) (Lamiastrum galeobdolon)
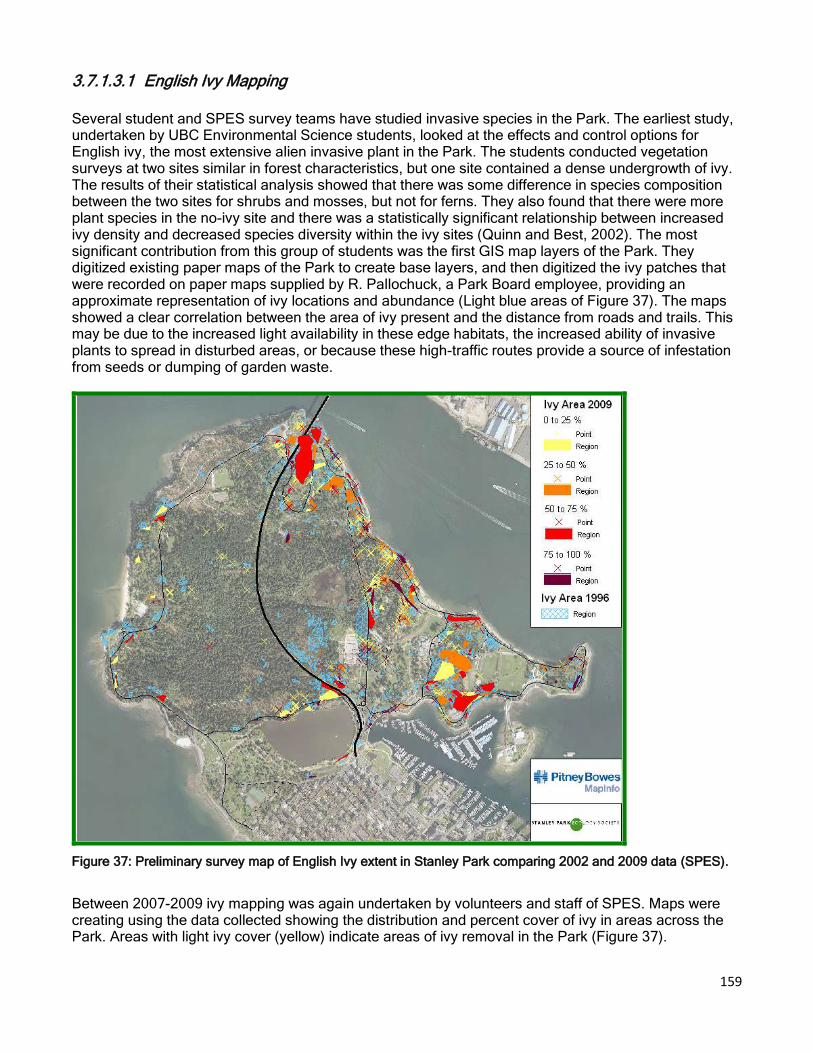
159
3.7.1.3.1 English Ivy Mapping
Several student and SPES survey teams have studied invasive species in the Park. The earliest study, undertaken by UBC Environmental Science students, looked at the effects and control options for English ivy, the most extensive alien invasive plant in the Park. The students conducted vegetation surveys at two sites similar in forest characteristics, but one site contained a dense undergrowth of ivy. The results of their statistical analysis showed that there was some difference in species composition between the two sites for shrubs and mosses, but not for ferns. They also found that there were more plant species in the no-ivy site and there was a statistically significant relationship between increased ivy density and decreased species diversity within the ivy sites (Quinn and Best, 2002). The most significant contribution from this group of students was the first GIS map layers of the Park. They digitized existing paper maps of the Park to create base layers, and then digitized the ivy patches that were recorded on paper maps supplied by R. Pallochuck, a Park Board employee, providing an approximate representation of ivy locations and abundance (Light blue areas of Figure 37). The maps showed a clear correlation between the area of ivy present and the distance from roads and trails. This may be due to the increased light availability in these edge habitats, the increased ability of invasive plants to spread in disturbed areas, or because these high-traffic routes provide a source of infestation from seeds or dumping of garden waste.
Figure 37: Preliminary survey map of English Ivy extent in Stanley Park comparing 2002 and 2009 data (SPES).
Between 2007-2009 ivy mapping was again undertaken by volunteers and staff of SPES. Maps were creating using the data collected showing the distribution and percent cover of ivy in areas across the Park. Areas with light ivy cover (yellow) indicate areas of ivy removal in the Park (Figure 37).
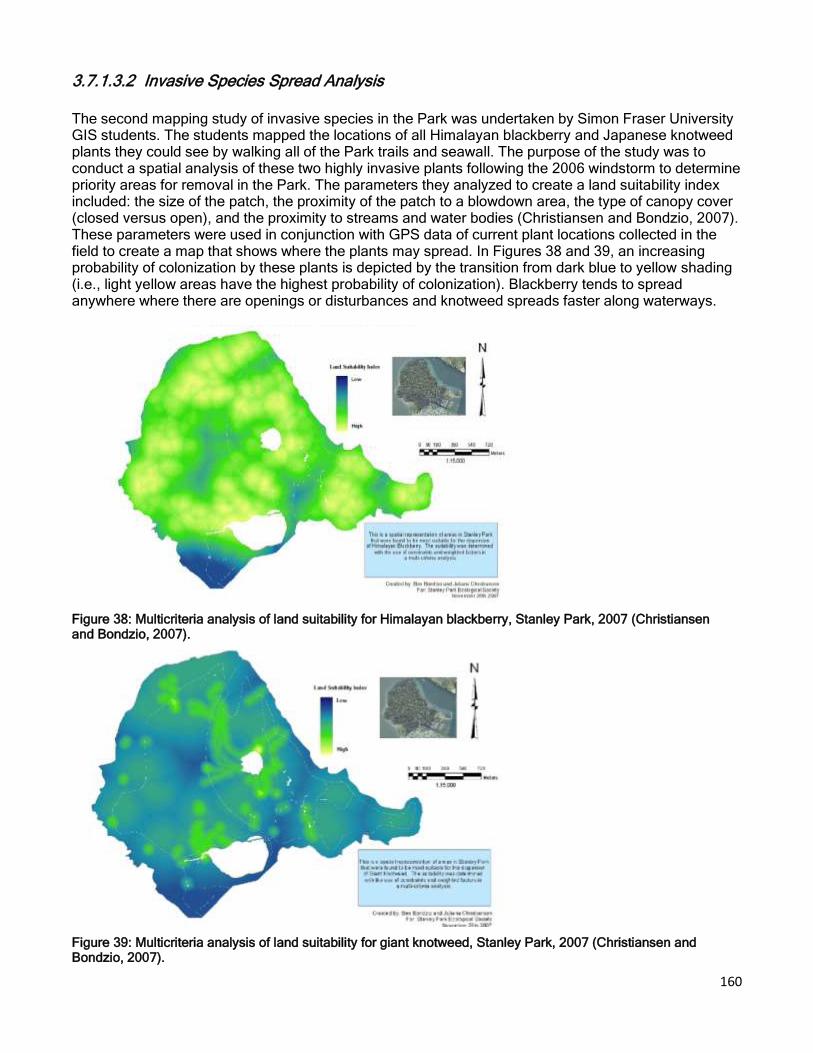
160
3.7.1.3.2 Invasive Species Spread Analysis
The second mapping study of invasive species in the Park was undertaken by Simon Fraser University GIS students. The students mapped the locations of all Himalayan blackberry and Japanese knotweed plants they could see by walking all of the Park trails and seawall. The purpose of the study was to conduct a spatial analysis of these two highly invasive plants following the 2006 windstorm to determine priority areas for removal in the Park. The parameters they analyzed to create a land suitability index included: the size of the patch, the proximity of the patch to a blowdown area, the type of canopy cover (closed versus open), and the proximity to streams and water bodies (Christiansen and Bondzio, 2007). These parameters were used in conjunction with GPS data of current plant locations collected in the field to create a map that shows where the plants may spread. In Figures 38 and 39, an increasing probability of colonization by these plants is depicted by the transition from dark blue to yellow shading (i.e., light yellow areas have the highest probability of colonization). Blackberry tends to spread anywhere where there are openings or disturbances and knotweed spreads faster along waterways.
Figure 38: Multicriteria analysis of land suitability for Himalayan blackberry, Stanley Park, 2007 (Christiansen and Bondzio, 2007).
Figure 39: Multicriteria analysis of land suitability for giant knotweed, Stanley Park, 2007 (Christiansen and Bondzio, 2007).
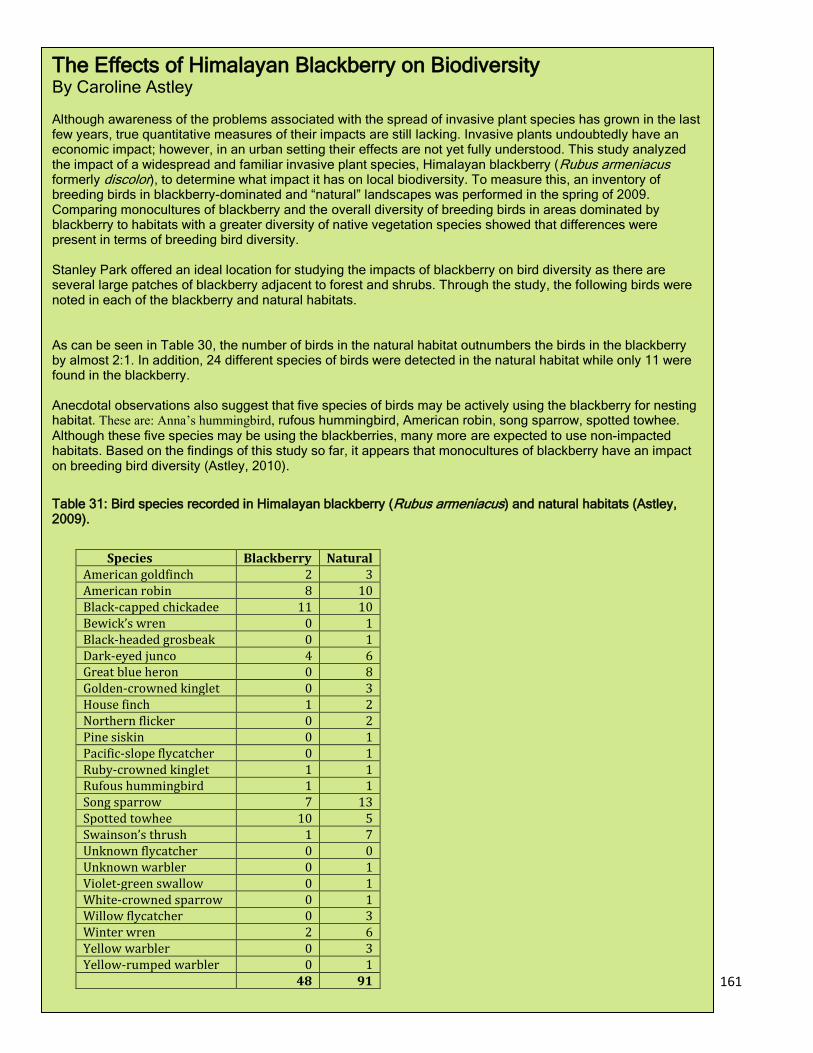
161
The Effects of Himalayan Blackberry on Biodiversity By Caroline Astley Although awareness of the problems associated with the spread of invasive plant species has grown in the last few years, true quantitative measures of their impacts are still lacking. Invasive plants undoubtedly have an economic impact; however, in an urban setting their effects are not yet fully understood. This study analyzed the impact of a widespread and familiar invasive plant species, Himalayan blackberry (Rubus armeniacus formerly discolor), to determine what impact it has on local biodiversity. To measure this, an inventory of breeding birds in blackberry-dominated and ―natural‖ landscapes was performed in the spring of 2009. Comparing monocultures of blackberry and the overall diversity of breeding birds in areas dominated by blackberry to habitats with a greater diversity of native vegetation species showed that differences were present in terms of breeding bird diversity. Stanley Park offered an ideal location for studying the impacts of blackberry on bird diversity as there are several large patches of blackberry adjacent to forest and shrubs. Through the study, the following birds were noted in each of the blackberry and natural habitats. As can be seen in Table 30, the number of birds in the natural habitat outnumbers the birds in the blackberry by almost 2:1. In addition, 24 different species of birds were detected in the natural habitat while only 11 were found in the blackberry. Anecdotal observations also suggest that five species of birds may be actively using the blackberry for nesting habitat. These are: Anna’s hummingbird, rufous hummingbird, American robin, song sparrow, spotted towhee. Although these five species may be using the blackberries, many more are expected to use non-impacted habitats. Based on the findings of this study so far, it appears that monocultures of blackberry have an impact on breeding bird diversity (Astley, 2010).
Table 31: Bird species recorded in Himalayan blackberry (Rubus armeniacus) and natural habitats (Astley, 2009).
Species Blackberry Natural American goldfinch 2 3 American robin 8 10 Black-capped chickadee 11 10 Bewick’s wren 0 1 Black-headed grosbeak 0 1 Dark-eyed junco 4 6 Great blue heron 0 8 Golden-crowned kinglet 0 3 House finch 1 2 Northern flicker 0 2 Pine siskin 0 1 Pacific-slope flycatcher 0 1 Ruby-crowned kinglet 1 1 Rufous hummingbird 1 1 Song sparrow 7 13 Spotted towhee 10 5 Swainson’s thrush 1 7 Unknown flycatcher 0 0 Unknown warbler 0 1 Violet-green swallow 0 1 White-crowned sparrow 0 1 Willow flycatcher 0 3 Winter wren 2 6 Yellow warbler 0 3 Yellow-rumped warbler 0 1 48 91
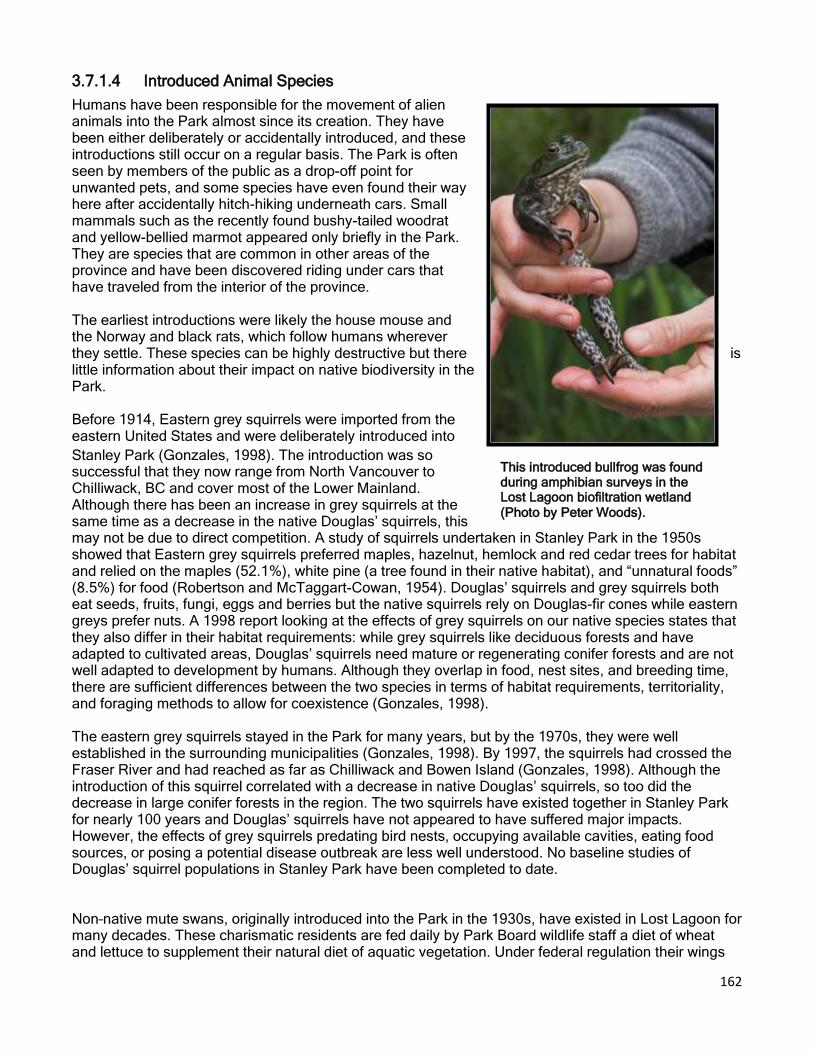
162
3.7.1.4 Introduced Animal Species
Humans have been responsible for the movement of alien animals into the Park almost since its creation. They have been either deliberately or accidentally introduced, and these introductions still occur on a regular basis. The Park is often seen by members of the public as a drop-off point for unwanted pets, and some species have even found their way here after accidentally hitch-hiking underneath cars. Small mammals such as the recently found bushy-tailed woodrat and yellow-bellied marmot appeared only briefly in the Park. They are species that are common in other areas of the province and have been discovered riding under cars that have traveled from the interior of the province. The earliest introductions were likely the house mouse and the Norway and black rats, which follow humans wherever they settle. These species can be highly destructive but there is little information about their impact on native biodiversity in the Park. Before 1914, Eastern grey squirrels were imported from the eastern United States and were deliberately introduced into
Stanley Park (Gonzales, 1998). The introduction was so successful that they now range from North Vancouver to Chilliwack, BC and cover most of the Lower Mainland. Although there has been an increase in grey squirrels at the same time as a decrease in the native Douglas‘ squirrels, this may not be due to direct competition. A study of squirrels undertaken in Stanley Park in the 1950s showed that Eastern grey squirrels preferred maples, hazelnut, hemlock and red cedar trees for habitat and relied on the maples (52.1%), white pine (a tree found in their native habitat), and ―unnatural foods‖ (8.5%) for food (Robertson and McTaggart-Cowan, 1954). Douglas‘ squirrels and grey squirrels both eat seeds, fruits, fungi, eggs and berries but the native squirrels rely on Douglas-fir cones while eastern greys prefer nuts. A 1998 report looking at the effects of grey squirrels on our native species states that they also differ in their habitat requirements: while grey squirrels like deciduous forests and have adapted to cultivated areas, Douglas‘ squirrels need mature or regenerating conifer forests and are not well adapted to development by humans. Although they overlap in food, nest sites, and breeding time, there are sufficient differences between the two species in terms of habitat requirements, territoriality, and foraging methods to allow for coexistence (Gonzales, 1998). The eastern grey squirrels stayed in the Park for many years, but by the 1970s, they were well established in the surrounding municipalities (Gonzales, 1998). By 1997, the squirrels had crossed the Fraser River and had reached as far as Chilliwack and Bowen Island (Gonzales, 1998). Although the introduction of this squirrel correlated with a decrease in native Douglas‘ squirrels, so too did the decrease in large conifer forests in the region. The two squirrels have existed together in Stanley Park for nearly 100 years and Douglas‘ squirrels have not appeared to have suffered major impacts. However, the effects of grey squirrels predating bird nests, occupying available cavities, eating food sources, or posing a potential disease outbreak are less well understood. No baseline studies of Douglas‘ squirrel populations in Stanley Park have been completed to date. Non–native mute swans, originally introduced into the Park in the 1930s, have existed in Lost Lagoon for many decades. These charismatic residents are fed daily by Park Board wildlife staff a diet of wheat and lettuce to supplement their natural diet of aquatic vegetation. Under federal regulation their wings
This introduced bullfrog was found during amphibian surveys in the Lost Lagoon biofiltration wetland (Photo by Peter Woods).

163
are pinioned so that they cannot leave the lagoon area. Up to 80 swans existed in the Lagoon in the 1970s but that number dropped to about 30 in the 1980s, and as of 2009 there are about 11 swans still residing at that location. The swans are fairly unsuccessful at producing cygnets despite their yearly attempts, and they commonly suffer injuries from off-leash dogs, bicycles, and other sources. These swans appear to prevent the use of the Lagoon by native swan species as they have been observed successfully chasing off trumpeter and/or tundra swans that periodically visit in the winter.
European rabbits are also commonly seen in the Park and can be observed grazing on grassy lawns; they have likely been released as unwanted pets. Although there was an abundance of rabbits in the Park in the 1970s and 80s, the first appearance of coyotes in the area coincided with a reduction in rabbit numbers. Another introduction that can be attributed to the release of unwanted pets involves red-eared sliders, a turtle native to the southern United States and popular in the pet trade. These turtles live in all of the Park‘s major water bodies including Lost Lagoon, Beaver Lake and the Miniature Train area ponds. This species may be responsible for the local extirpation of native western painted turtles that once existed in the Park but which have not been seen for many years. Although it was believed that red-eared sliders could not reproduce in our climate, for several years SPES staff and volunteers have witnessed these turtles creating nests and laying eggs near Lost Lagoon. It is believed that our local climate is too cold for the eggs to be viable. In 2009 some very small turtles were seen for the first time in the Lagoon and further study is needed to confirm if this species is in fact reproducing in this area. Some of the most harmful introductions in recent years were of bullfrogs and green frogs in the Park‘s major water bodies. There is no reliable date for the introduction of these invasive frogs into Stanley Park. Nature Vancouver (VNHS) lists American bullfrogs in an article written by Al Grass in their 1988 publication The Natural History of Stanley Park (VNHS, 1988). It is likely that bullfrogs first established a breeding population in Beaver Lake since Lost Lagoon with its numerous predators and lack of sheltering, floating, and submerged vegetation lacked suitable amphibian habitat. Only later in 2003, two years after the construction of the wastewater treatment wetland at the northeast corner of Lost Lagoon, could bullfrogs breed in the 'settling pond' (Peter Woods, pers. comm.). After living successfully in Beaver Lake for many years, green frogs made their first appearance in Lost Lagoon in September 2009.
Native tundra and trumpeter swans (left: photo by Peter Woods) that occasionally visit Lost Lagoon are immediately chased away by the introduced mute swans (right: photo by Mike Mackintosh).

164
Bullfrogs are implicated in the demise of some species of native amphibians and are also thought to spread a newly discovered frog disease, called Bd or chytrid fungus (Batrachochytrium dendrobatidis), although they are not affected by this disease (Govindarajulu and Dodd, 2008). It appears that native frogs in Stanley Park such as the Pacific chorus frog may be completely extirpated but it is unclear whether this is due to the introduction of these exotic species. The presence of bullfrogs and green frogs must have some impact as they can out-compete native species for food and habitat, and even feed on our local species of amphibians. Many bullfrog eradication programs have been largely unsuccessful, but a newly developed technique using electroshocker equipment has been used effectively in areas near Victoria, BC (Stan Orchard, pers. comm.). Amphibian surveys conducted in Beaver Lake and other water bodies in the Park in 2007-2009 have turned up mostly green frog and bullfrog adults
and larvae, mixed with a few native northwestern salamander larvae. It may be possible that these species are able to coexist (Elke Wind, pers. comm.) but we have no baseline data to see if the population of these salamanders has changed since the introduced species began occupying the Park. House sparrows and European starlings are the main exotic bird species using the Park. The starlings and sparrows are restricted mostly to the outer edges of the Park, and although they are both cavity nesters, only house sparrows have been observed breeding here. The sparrows have regularly taken over nest boxes that were installed for native swallow species near the Stanley Park Nature House at Lost Lagoon. These sparrows aggressively use and defend the nest boxes despite efforts (through the design of the boxes) to deter them. Although starlings have not been documented nesting in the Park, they can be seen feasting on berry bushes in large groups, which may reduce the abundance of this food source for native wildlife. As they have also been observed eating English ivy and holly berries, they may be a significant vector for dispersal of these exotic plants within the Park.
The first green frog observed in the Lost Lagoon biofiltration wetland, September 2009 (Photo by Peter Woods).
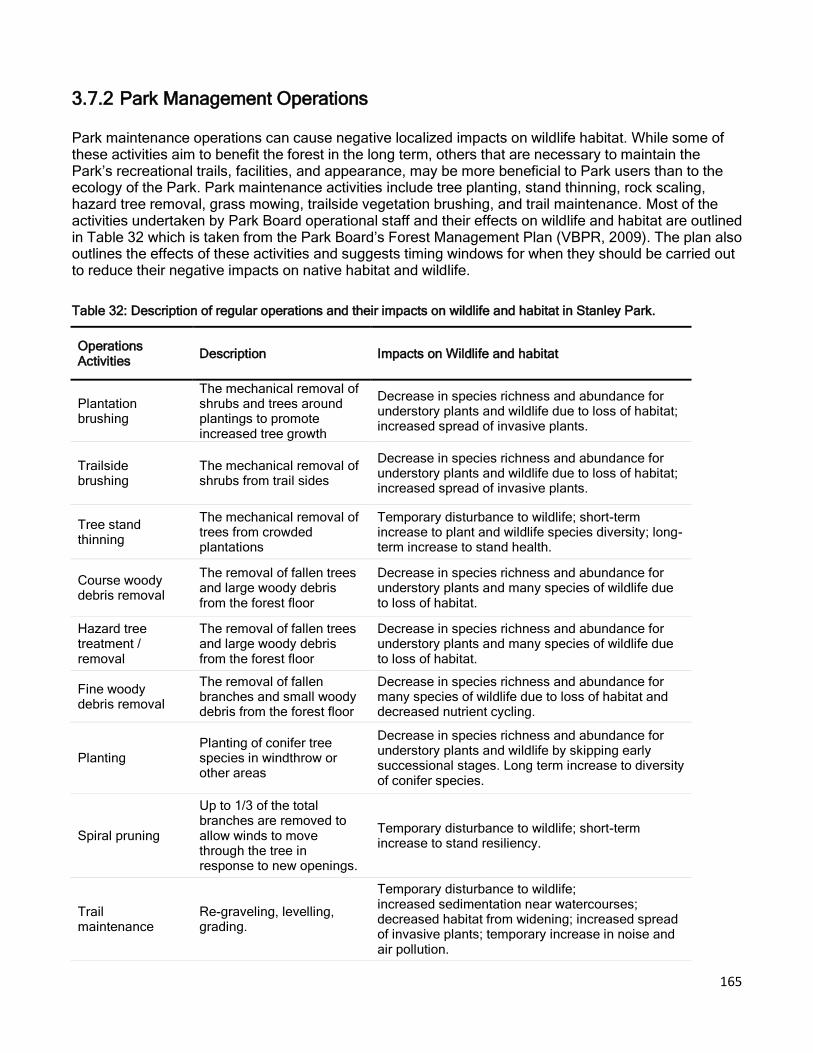
165
3.7.2 Park Management Operations
Park maintenance operations can cause negative localized impacts on wildlife habitat. While some of these activities aim to benefit the forest in the long term, others that are necessary to maintain the Park‘s recreational trails, facilities, and appearance, may be more beneficial to Park users than to the ecology of the Park. Park maintenance activities include tree planting, stand thinning, rock scaling, hazard tree removal, grass mowing, trailside vegetation brushing, and trail maintenance. Most of the activities undertaken by Park Board operational staff and their effects on wildlife and habitat are outlined in Table 32 which is taken from the Park Board‘s Forest Management Plan (VBPR, 2009). The plan also outlines the effects of these activities and suggests timing windows for when they should be carried out to reduce their negative impacts on native habitat and wildlife.
Table 32: Description of regular operations and their impacts on wildlife and habitat in Stanley Park.
Operations Activities
Description Impacts on Wildlife and habitat
Plantation brushing
The mechanical removal of shrubs and trees around plantings to promote increased tree growth
Decrease in species richness and abundance for understory plants and wildlife due to loss of habitat; increased spread of invasive plants.
Trailside brushing
The mechanical removal of shrubs from trail sides
Decrease in species richness and abundance for understory plants and wildlife due to loss of habitat; increased spread of invasive plants.
Tree stand thinning
The mechanical removal of trees from crowded plantations
Temporary disturbance to wildlife; short-term increase to plant and wildlife species diversity; long-term increase to stand health.
Course woody debris removal
The removal of fallen trees and large woody debris from the forest floor
Decrease in species richness and abundance for understory plants and many species of wildlife due to loss of habitat.
Hazard tree treatment / removal
The removal of fallen trees and large woody debris from the forest floor
Decrease in species richness and abundance for understory plants and many species of wildlife due to loss of habitat.
Fine woody debris removal
The removal of fallen branches and small woody debris from the forest floor
Decrease in species richness and abundance for many species of wildlife due to loss of habitat and decreased nutrient cycling.
Planting Planting of conifer tree species in windthrow or other areas
Decrease in species richness and abundance for understory plants and wildlife by skipping early successional stages. Long term increase to diversity of conifer species.
Spiral pruning
Up to 1/3 of the total branches are removed to allow winds to move through the tree in response to new openings.
Temporary disturbance to wildlife; short-term increase to stand resiliency.
Trail maintenance
Re-graveling, levelling, grading.
Temporary disturbance to wildlife; increased sedimentation near watercourses; decreased habitat from widening; increased spread of invasive plants; temporary increase in noise and air pollution.

166
Special events and filming
Use of the forest by people, equipment and/or vehicles while filming and/or the construction of movie sets
Temporary disturbance to wildlife; soil compaction and erosion; increased spread of invasive plants.
Invasive species removal
The manual removal of alien invasive plants by Park staff or Stanley Park Ecology Society staff and volunteers
Increase in species richness and abundance for plants and wildlife; temporary disturbance to habitat and loss of ground cover; temporary disturbance to wildlife.
Rock scaling
Trained rock-climbing professionals rappel down on ropes to hand-scale loose rock
Loss of species richness and abundance of delicate plants; temporary disturbance to wildlife.
Mowing The use of lawn mowers on grassy areas
Loss of habitat for some invertebrate species; temporary increase in noise and air pollution; temporary disturbance to wildlife; damage to trees and tree root systems.
Drainage alterations
Creation or modification of natural or man-made waterways or wet areas
Decrease in species relying on wet environment; temporary or permanent disturbance to wildlife inhabiting the drainage; temporary siltation of waterway.
Culvert maintenance /replacement
The removal, addition, maintenance or replacement of culverts under roadways and trails
Temporary or permanent disturbance to wildlife inhabiting the drainage; temporary siltation of waterway.
Inventory, or monitoring activities
The systematic collection of data over time using recognized techniques and protocols
Increased understanding of Park ecosystems and increased ability to employ adaptive management; temporary disturbance to wildlife.
Suppression of natural processes
The reduction of perceived danger from natural forces by a variety of human interventions
Reduced biodiversity and ecosystem heath; potential increases in insect pests and tree disease; protection of forest from fire; potential increase to stand health through planting of desirable tree species.
Machines and vehicles
Trucks, cars, mowers, or other machinery.
Pollution (oil, gas, lubricant) can be toxic or deadly to wildlife and detrimental to streams and other watercourses; increased noise and air pollution; increased spread of invasive plants.

167
3.7.3 Social Issues
3.7.3.1 Wildlife Feeding
There are many opportunities to view and interact with wildlife in Stanley Park and this can be an important part of many visitors‘ experience. Unfortunately those wildlife interactions that include feeding often result in significant negative impacts for native animals. Many of the animal species living in the Park such as raccoons, coyotes, Canada geese, and squirrels have adapted well to urban life and survive on garbage and habitat provided intentionally or unintentionally by humans (VBPR, 2009a). Although it is against park and city by-laws to feed birds and wildlife (Vancouver Park Board By Laws section 14(i); see Appendix 3), lack of enforcement and the encouragement of these activities in the early years (bird feeders were once installed in the Park) have caused the problem to reach critical levels in the Park. Although feeding by tourists is often believed to be the source of the problem, it is the ‗serial feeders‘ who come to the Park daily to feed animals who appear to cause the most lasting damage. Although many people feel that they are helping animals by feeding them, the opposite is most often the case. The increased spread of disease is often cited as one of the negative effects of wildlife feeding and this has been observed in the Park. Most of the raccoons in the Park were killed off by a naturally occurring disease (canine distemper virus) which quickly spread through the population in 1998. It is thought that the effect of this outbreak was more serious and rapid due to the overpopulation of raccoons made possible by constant feeding and the animals‘ close proximity as they gathered together to be fed (Mike Mackintosh, pers. comm.). The spread of disease has more recently become an even greater concern for Park staff as new viruses such as avian flu and West Nile Virus are shown to be transmitted by birds in other areas. In 2007 some local people also began feeding great blue herons near the heron colony. Although they were being fed fish, which is a normal part of their diet, these herons began staying in garden areas away from their normal habitat and became habituated to human presence. Although it may seem harmless at first, feeding puts those herons at a greater risk of encountering other human impacts such as cars and off-leash dogs (which regularly cause mortalities to birds in the Park). Feeding wildlife also causes increased levels of aggression in those individuals. In Stanley Park people are regularly bitten and injured by aggressive animals, and they are almost always in areas where wildlife feeding is rampant. In 2004 an outbreak of rabies virus in a skunk family in the Park drew
Wildlife feeding is most problematic at Lost Lagoon.
168
attention to the problem of wildlife feeding. If the skunks could have rabies, then so too could the other mammals that were in regular contact with people. During that summer, an estimated 17 people were bitten in one month by raccoons looking for handouts at Prospect Point (Rob Boelens, pers. comm.). This initiated a campaign by Park Board and SPES staff to educate tourists about the danger. When coyotes first made their appearance in Stanley Park and the rest of Vancouver, people began feeding them. Between 2000 and 2001, six or seven people were bitten by coyotes, which were all found to have been fed by people. These coyotes had to be destroyed but a vigorous education campaign and the creation of the Co-existing with Coyotes program has significantly reduced the problem with this species. Since that time (nearly eight years) only three or four people have reported being bitten by coyotes in the Lower Mainland. Other wildlife that have become aggressive towards people because of habitual feeding include the peafowl at the Children‘s Zoo and grey squirrels, which commonly attack and bite visitors, but with less serious consequences. Feeding wildlife does not just increase aggression and the spread of disease, but it can also make the animals unhealthy and even sick from eating inappropriate food. Raccoons are commonly reported to have health problems, thought to be a result of their high calorie diets (Ziggy Jones, pers. comm). People have been seen feeding cookies, ice cream, popcorn, white bread, pet food, hotdogs, peanuts and rice to wildlife in the Park. Obesity is a common sight in grey squirrels and other wildlife, while empty calories cause decreased body weight in others. The most harmful consequences of wildlife feeding may be felt well away from the Park. Feeding of waterfowl can cause them to abandon their migration and may actually result in their deaths in the winter months. For example, a documented case of the effects of impacting migration happened in West Haven, Connecticut. During a particularly harsh winter 30 swans died from starvation at an artificial feeding site while over 800 swans survived nearby on natural food (NYSDEC, 2009). Occasionally northern pintail, lesser scaup and other water birds have stayed through the summer at the Lagoon, although this is not their normal summer territory. It is suspected that wildlife feeding may be the cause for them choosing not to migrate. One negative implication for resident wildlife is the lack of supplemental feeding through the winter. The elevated population levels, which are possible in the summer months when feeding is at the highest level, cannot be maintained through the winter when feeding is less common. All of the species inhabiting the Park can exist without supplemental feeding from people, and the negative impacts of this activity far outweighs any small benefit it may provide.
3.7.3.2 Infrastructure and Developments
The land area of Stanley Park is covered by natural features such as forests and wetlands as well as by infrastructure and other developments such as roads, trails, buildings, playgrounds, gardens and swimming pools. In 2009 a preliminary survey map was created by SPES staff and volunteers to determine the amount of park area that has been developed since the Park was created. This was done in a variety of steps using GIS software, orthophotos of Stanley Park and ground reconnaissance surveys. Existing and newly created layers illustrated the following land use categories:
Forest (intact forested areas)
Grass, lawn and gardens (including some areas with tree canopy cover)
Trails, roads and parking lots (including all major and minor roads and trails)
Facilities (including swimming pools, playgrounds, Brockton Oval, miniature train area, buildings, etc.)
Wetlands, lakes and streams (including all permanent and ephemeral wetlands and streams)

169
65.0
12.0
12.6
4.46.0
Forest
Grass/Lawn
Trails, Roads, Parking lots
Facilities
Wetlands,lakes, streams
The widths of the different park trails and roads were determined by averaging data collected through field surveys. The parking lot, lawn, building and facility footprints were digitized using detailed orthophotos. Existing map layers were used for the forested area, wetlands, and streams. The different layers were overlapped and cut so that the area of each land use type could be calculated. At the end of this procedure these layers were used to build the following map of land use in Stanley Park (Figure 40).
Figure 40: Preliminary survey map of land use in Stanley Park (SPES).
It is interesting to note that about 71% (~275 ha) of the Park remains valuable wildlife habitat while the remaining 29% (~112 ha) of forest and wetlands has been lost (See Figure 41). Of the developed areas of the Park, about 46 ha of lawns and gardens do provide habitat for some wildlife species. The remaining 66 ha of trails, roads, parking lots and buildings provides little to no habitat for most wildlife, with the exception of a few species such as native bees, bats and blue-listed barn swallows.
Figure 41: Proportion of different land use types in Stanley Park.
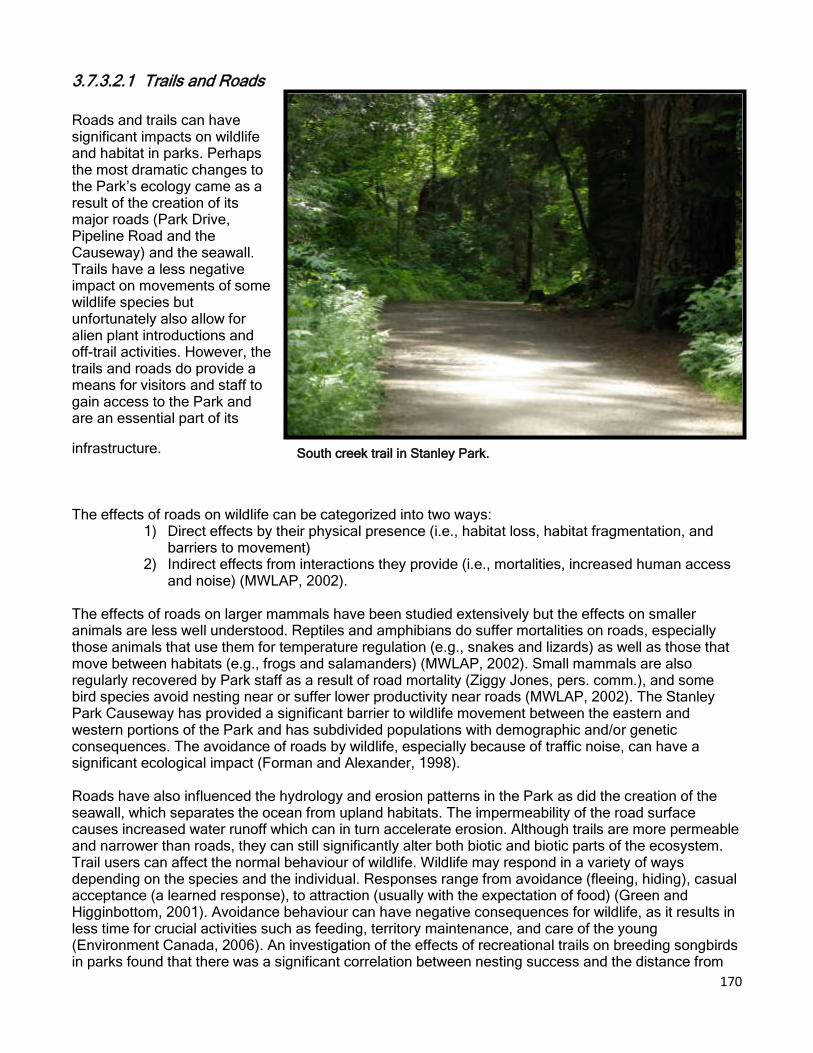
170
3.7.3.2.1 Trails and Roads
Roads and trails can have significant impacts on wildlife and habitat in parks. Perhaps the most dramatic changes to the Park‘s ecology came as a result of the creation of its major roads (Park Drive, Pipeline Road and the Causeway) and the seawall. Trails have a less negative impact on movements of some wildlife species but unfortunately also allow for alien plant introductions and off-trail activities. However, the trails and roads do provide a means for visitors and staff to gain access to the Park and are an essential part of its
infrastructure. The effects of roads on wildlife can be categorized into two ways:
1) Direct effects by their physical presence (i.e., habitat loss, habitat fragmentation, and barriers to movement)
2) Indirect effects from interactions they provide (i.e., mortalities, increased human access and noise) (MWLAP, 2002).
The effects of roads on larger mammals have been studied extensively but the effects on smaller animals are less well understood. Reptiles and amphibians do suffer mortalities on roads, especially those animals that use them for temperature regulation (e.g., snakes and lizards) as well as those that move between habitats (e.g., frogs and salamanders) (MWLAP, 2002). Small mammals are also regularly recovered by Park staff as a result of road mortality (Ziggy Jones, pers. comm.), and some bird species avoid nesting near or suffer lower productivity near roads (MWLAP, 2002). The Stanley Park Causeway has provided a significant barrier to wildlife movement between the eastern and western portions of the Park and has subdivided populations with demographic and/or genetic consequences. The avoidance of roads by wildlife, especially because of traffic noise, can have a significant ecological impact (Forman and Alexander, 1998). Roads have also influenced the hydrology and erosion patterns in the Park as did the creation of the seawall, which separates the ocean from upland habitats. The impermeability of the road surface causes increased water runoff which can in turn accelerate erosion. Although trails are more permeable and narrower than roads, they can still significantly alter both biotic and biotic parts of the ecosystem. Trail users can affect the normal behaviour of wildlife. Wildlife may respond in a variety of ways depending on the species and the individual. Responses range from avoidance (fleeing, hiding), casual acceptance (a learned response), to attraction (usually with the expectation of food) (Green and Higginbottom, 2001). Avoidance behaviour can have negative consequences for wildlife, as it results in less time for crucial activities such as feeding, territory maintenance, and care of the young (Environment Canada, 2006). An investigation of the effects of recreational trails on breeding songbirds in parks found that there was a significant correlation between nesting success and the distance from
South creek trail in Stanley Park.

171
trails (Miller et al., 1998). Although some species (such as western wood-pewees and chipping sparrows) are more sensitive and negatively affected, other more tolerant species (such as blackbirds and American robins) can become habituated to human presence (Miller et al., 1998). Overall, research has shown that human disturbances to forest birds in urban areas are detrimental to all but a few tolerant species, and may result in the actual loss of some species of birds (Environment Canada, 2006). In Stanley Park, there are no new roads or trails planned for construction. In 2008, the road and trails near the Prospect Point lookout area (which was opened up during the 2006 windstorm) were altered to create better traffic flow. A survey of the public confirmed that no new trails were desired as the established trails were sufficient to accommodate visitor use. The Prospect Point alterations in the roadway and parking areas were offset by the planting and enhancement of the previous area that had been covered in asphalt. Several of the trails were widened during the 2007-2008 Restoration including
Cathedral Trail and Siwash Rock Trail. At the same time, ‗wildlife-friendly‘ culverts were installed on Cathedral Trail, and new swales and culverts were added to Siwash Trail to improve drainage. The 1984 Stanley Park Master Plan recommends that the Park Board ―maintain the existing balance of open space and forest cover, and minimize, where possible, any further loss of vegetation‖ (VBPR, 2005). This description leaves room for interpretation, but in general most Park Managers agree that no new trails or roads are desirable.
3.7.3.3 Off-trail Activities
In Stanley Park there exist several different sources of off-trail use which all result in vegetation trampling, soil compaction, and the spread of invasive plants. These modifications to the habitats change the microclimate and ultimately affect the organisms, from soil biota to forest birds, which inhabit them. Off-trail bicycle use is a widespread problem in the Park as mountain bike enthusiasts create new trails and structures for recreational purposes. Studies on the effects of mountain bikes compared to regular hikers on trails have shown there is not a large difference in their impact in terms of increased erosion (Thurston and Reader, 2001), but in Stanley Park many new trails have been created by mountain bike riders. The increased access into the forest not only increases soil compaction and vegetation trampling, but also allows for more human disturbance as walkers use the trails as well. Bicycle tires can also easily disperse seeds from invasive plant species, especially trailside weeds. Mountain bike jumps and other structures reduce and alter the forest floor structure as fallen trees and other woody material are used in their construction. Although there are designated cycling trails, bicycles can be
New ‗wildlife-friendly‘ culverts were installed on Cathedral Trail in 2008.
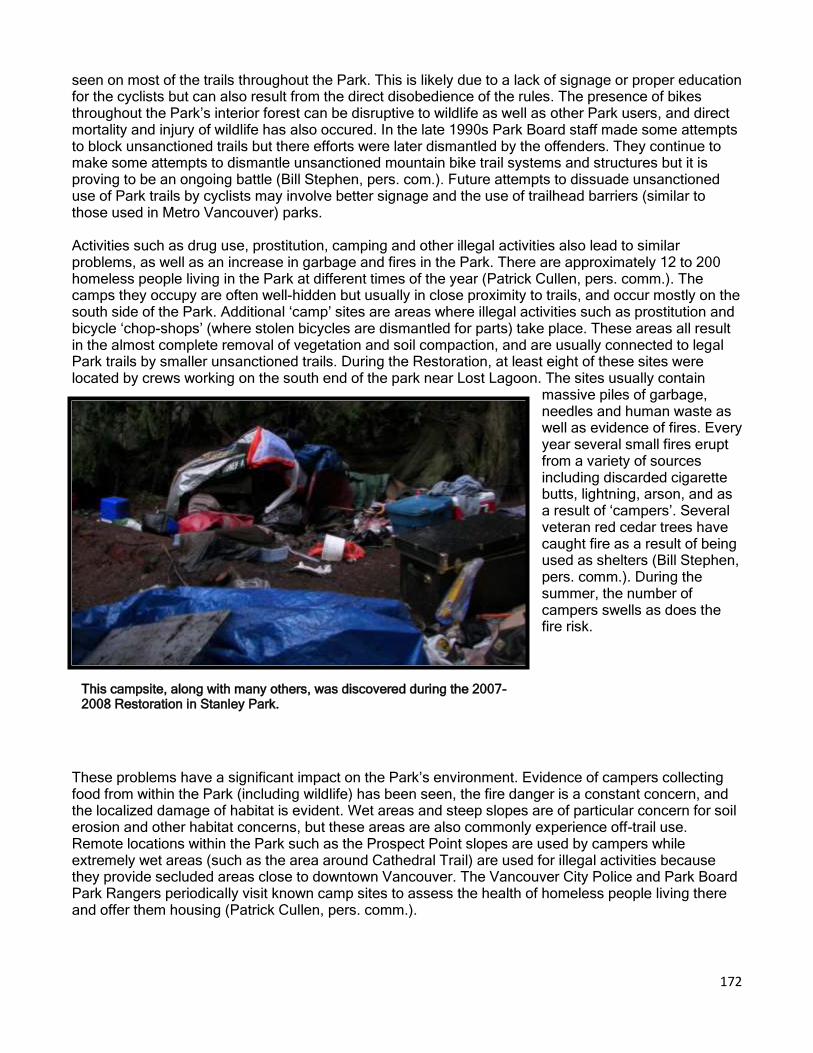
172
seen on most of the trails throughout the Park. This is likely due to a lack of signage or proper education for the cyclists but can also result from the direct disobedience of the rules. The presence of bikes throughout the Park‘s interior forest can be disruptive to wildlife as well as other Park users, and direct mortality and injury of wildlife has also occured. In the late 1990s Park Board staff made some attempts to block unsanctioned trails but there efforts were later dismantled by the offenders. They continue to make some attempts to dismantle unsanctioned mountain bike trail systems and structures but it is proving to be an ongoing battle (Bill Stephen, pers. com.). Future attempts to dissuade unsanctioned use of Park trails by cyclists may involve better signage and the use of trailhead barriers (similar to those used in Metro Vancouver) parks. Activities such as drug use, prostitution, camping and other illegal activities also lead to similar problems, as well as an increase in garbage and fires in the Park. There are approximately 12 to 200 homeless people living in the Park at different times of the year (Patrick Cullen, pers. comm.). The camps they occupy are often well-hidden but usually in close proximity to trails, and occur mostly on the south side of the Park. Additional ‗camp‘ sites are areas where illegal activities such as prostitution and bicycle ‗chop-shops‘ (where stolen bicycles are dismantled for parts) take place. These areas all result in the almost complete removal of vegetation and soil compaction, and are usually connected to legal Park trails by smaller unsanctioned trails. During the Restoration, at least eight of these sites were located by crews working on the south end of the park near Lost Lagoon. The sites usually contain
massive piles of garbage, needles and human waste as well as evidence of fires. Every year several small fires erupt from a variety of sources including discarded cigarette butts, lightning, arson, and as a result of ‗campers‘. Several veteran red cedar trees have caught fire as a result of being used as shelters (Bill Stephen, pers. comm.). During the summer, the number of campers swells as does the fire risk.
These problems have a significant impact on the Park‘s environment. Evidence of campers collecting food from within the Park (including wildlife) has been seen, the fire danger is a constant concern, and the localized damage of habitat is evident. Wet areas and steep slopes are of particular concern for soil erosion and other habitat concerns, but these areas are also commonly experience off-trail use. Remote locations within the Park such as the Prospect Point slopes are used by campers while extremely wet areas (such as the area around Cathedral Trail) are used for illegal activities because they provide secluded areas close to downtown Vancouver. The Vancouver City Police and Park Board Park Rangers periodically visit known camp sites to assess the health of homeless people living there and offer them housing (Patrick Cullen, pers. comm.).
This campsite, along with many others, was discovered during the 2007-2008 Restoration in Stanley Park.
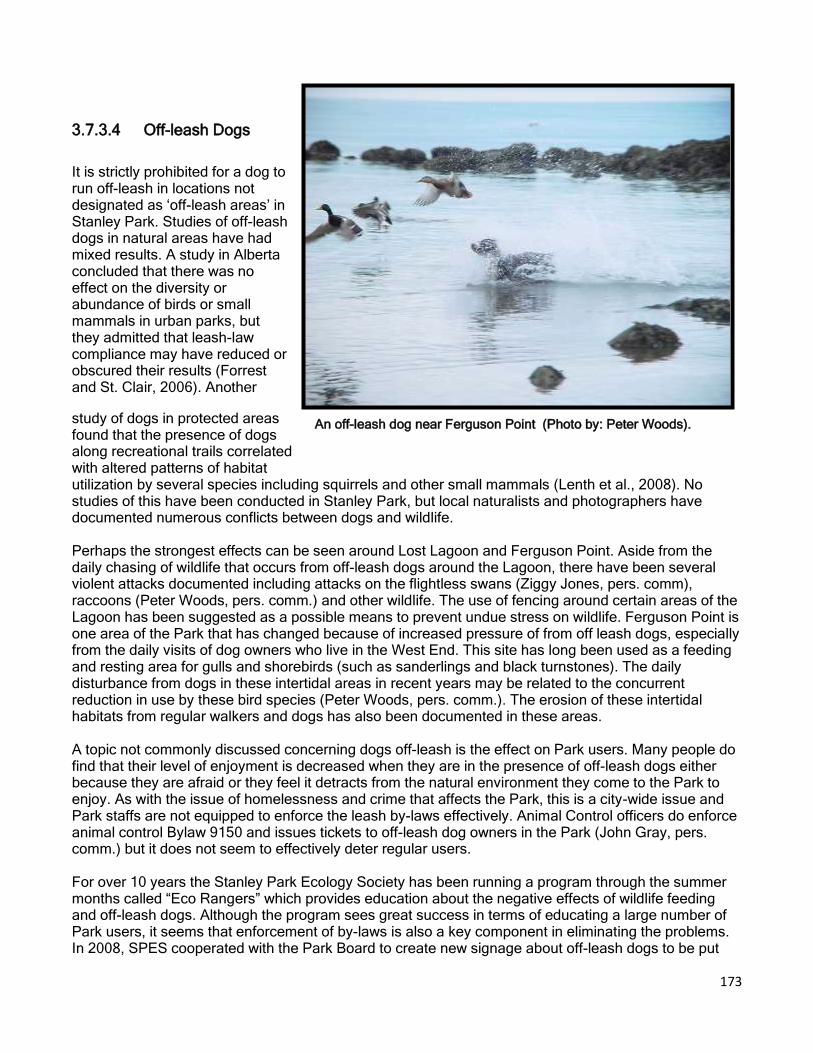
173
3.7.3.4 Off-leash Dogs
It is strictly prohibited for a dog to run off-leash in locations not designated as ‗off-leash areas‘ in Stanley Park. Studies of off-leash dogs in natural areas have had mixed results. A study in Alberta concluded that there was no effect on the diversity or abundance of birds or small mammals in urban parks, but they admitted that leash-law compliance may have reduced or obscured their results (Forrest and St. Clair, 2006). Another
study of dogs in protected areas found that the presence of dogs along recreational trails correlated with altered patterns of habitat utilization by several species including squirrels and other small mammals (Lenth et al., 2008). No studies of this have been conducted in Stanley Park, but local naturalists and photographers have documented numerous conflicts between dogs and wildlife. Perhaps the strongest effects can be seen around Lost Lagoon and Ferguson Point. Aside from the daily chasing of wildlife that occurs from off-leash dogs around the Lagoon, there have been several violent attacks documented including attacks on the flightless swans (Ziggy Jones, pers. comm), raccoons (Peter Woods, pers. comm.) and other wildlife. The use of fencing around certain areas of the Lagoon has been suggested as a possible means to prevent undue stress on wildlife. Ferguson Point is one area of the Park that has changed because of increased pressure of from off leash dogs, especially from the daily visits of dog owners who live in the West End. This site has long been used as a feeding and resting area for gulls and shorebirds (such as sanderlings and black turnstones). The daily disturbance from dogs in these intertidal areas in recent years may be related to the concurrent reduction in use by these bird species (Peter Woods, pers. comm.). The erosion of these intertidal habitats from regular walkers and dogs has also been documented in these areas. A topic not commonly discussed concerning dogs off-leash is the effect on Park users. Many people do find that their level of enjoyment is decreased when they are in the presence of off-leash dogs either because they are afraid or they feel it detracts from the natural environment they come to the Park to enjoy. As with the issue of homelessness and crime that affects the Park, this is a city-wide issue and Park staffs are not equipped to enforce the leash by-laws effectively. Animal Control officers do enforce animal control Bylaw 9150 and issues tickets to off-leash dog owners in the Park (John Gray, pers. comm.) but it does not seem to effectively deter regular users. For over 10 years the Stanley Park Ecology Society has been running a program through the summer months called ―Eco Rangers‖ which provides education about the negative effects of wildlife feeding and off-leash dogs. Although the program sees great success in terms of educating a large number of Park users, it seems that enforcement of by-laws is also a key component in eliminating the problems. In 2008, SPES cooperated with the Park Board to create new signage about off-leash dogs to be put
An off-leash dog near Ferguson Point (Photo by: Peter Woods).
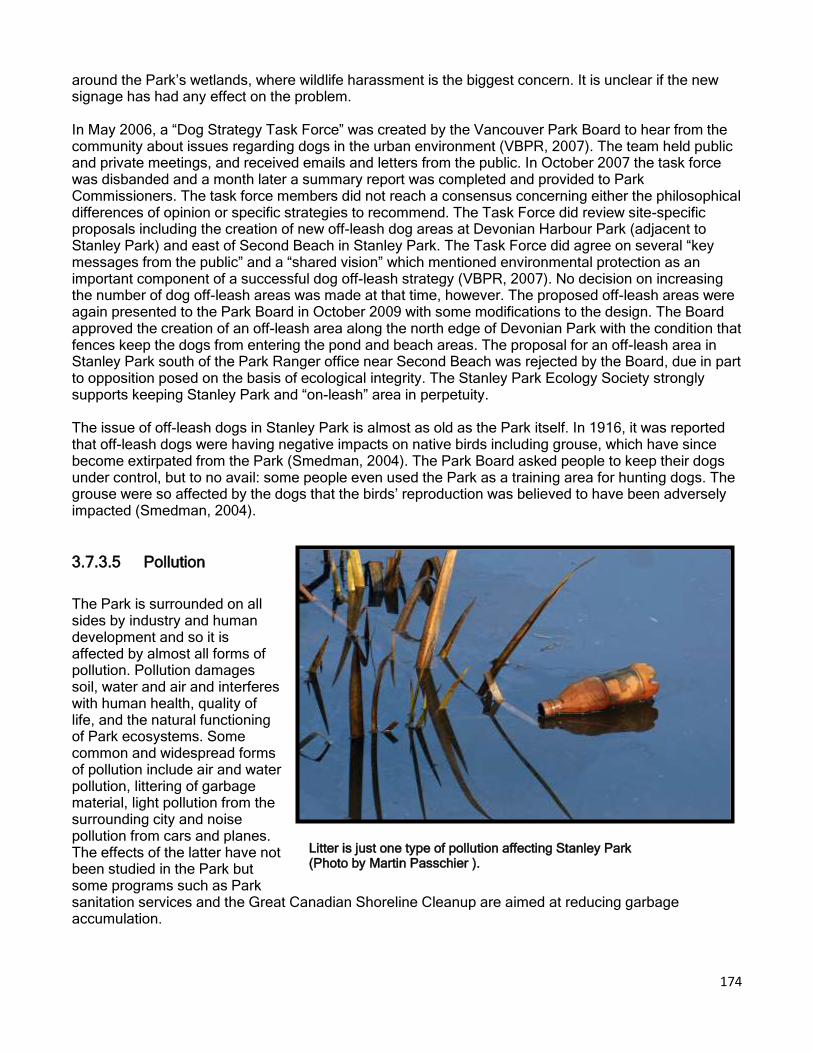
174
around the Park‘s wetlands, where wildlife harassment is the biggest concern. It is unclear if the new signage has had any effect on the problem. In May 2006, a ―Dog Strategy Task Force‖ was created by the Vancouver Park Board to hear from the community about issues regarding dogs in the urban environment (VBPR, 2007). The team held public and private meetings, and received emails and letters from the public. In October 2007 the task force was disbanded and a month later a summary report was completed and provided to Park Commissioners. The task force members did not reach a consensus concerning either the philosophical differences of opinion or specific strategies to recommend. The Task Force did review site-specific proposals including the creation of new off-leash dog areas at Devonian Harbour Park (adjacent to Stanley Park) and east of Second Beach in Stanley Park. The Task Force did agree on several ―key messages from the public‖ and a ―shared vision‖ which mentioned environmental protection as an important component of a successful dog off-leash strategy (VBPR, 2007). No decision on increasing the number of dog off-leash areas was made at that time, however. The proposed off-leash areas were again presented to the Park Board in October 2009 with some modifications to the design. The Board approved the creation of an off-leash area along the north edge of Devonian Park with the condition that fences keep the dogs from entering the pond and beach areas. The proposal for an off-leash area in Stanley Park south of the Park Ranger office near Second Beach was rejected by the Board, due in part to opposition posed on the basis of ecological integrity. The Stanley Park Ecology Society strongly supports keeping Stanley Park and ―on-leash‖ area in perpetuity. The issue of off-leash dogs in Stanley Park is almost as old as the Park itself. In 1916, it was reported that off-leash dogs were having negative impacts on native birds including grouse, which have since become extirpated from the Park (Smedman, 2004). The Park Board asked people to keep their dogs under control, but to no avail: some people even used the Park as a training area for hunting dogs. The grouse were so affected by the dogs that the birds‘ reproduction was believed to have been adversely impacted (Smedman, 2004).
3.7.3.5 Pollution
The Park is surrounded on all sides by industry and human development and so it is affected by almost all forms of pollution. Pollution damages soil, water and air and interferes with human health, quality of life, and the natural functioning of Park ecosystems. Some common and widespread forms of pollution include air and water pollution, littering of garbage material, light pollution from the surrounding city and noise pollution from cars and planes. The effects of the latter have not been studied in the Park but some programs such as Park sanitation services and the Great Canadian Shoreline Cleanup are aimed at reducing garbage accumulation.
Litter is just one type of pollution affecting Stanley Park (Photo by Martin Passchier ).
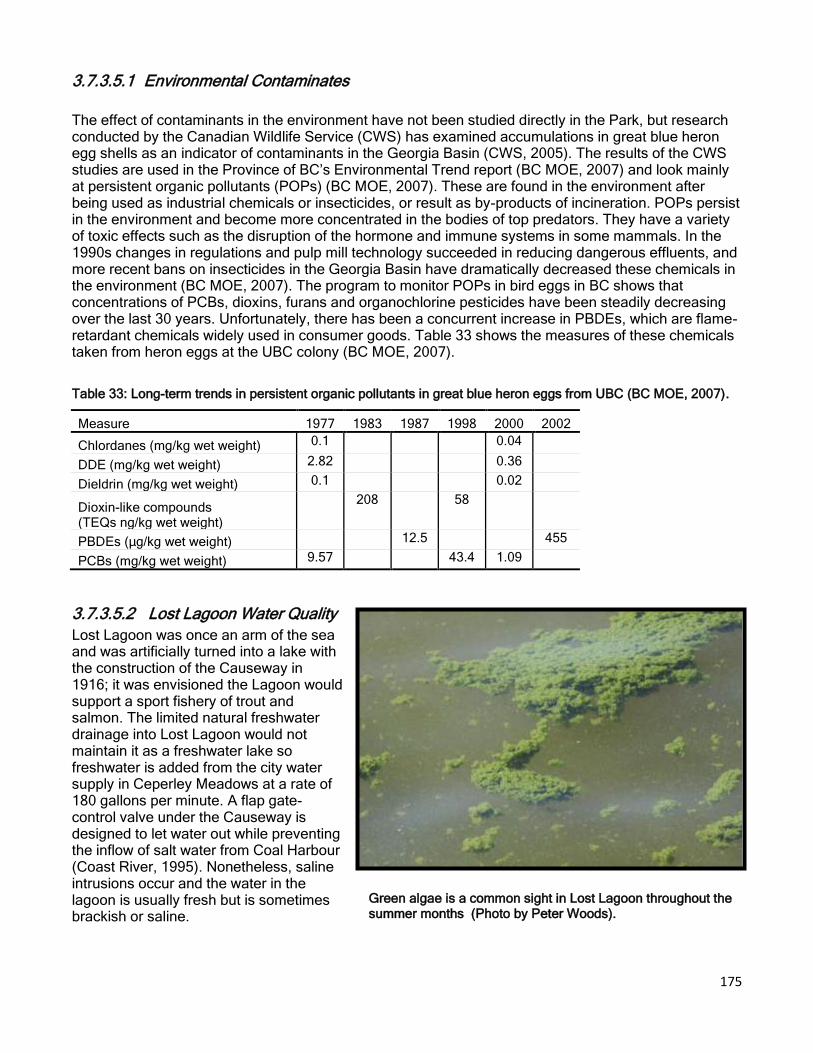
175
3.7.3.5.1 Environmental Contaminates
The effect of contaminants in the environment have not been studied directly in the Park, but research conducted by the Canadian Wildlife Service (CWS) has examined accumulations in great blue heron egg shells as an indicator of contaminants in the Georgia Basin (CWS, 2005). The results of the CWS studies are used in the Province of BC‘s Environmental Trend report (BC MOE, 2007) and look mainly at persistent organic pollutants (POPs) (BC MOE, 2007). These are found in the environment after being used as industrial chemicals or insecticides, or result as by-products of incineration. POPs persist in the environment and become more concentrated in the bodies of top predators. They have a variety of toxic effects such as the disruption of the hormone and immune systems in some mammals. In the 1990s changes in regulations and pulp mill technology succeeded in reducing dangerous effluents, and more recent bans on insecticides in the Georgia Basin have dramatically decreased these chemicals in the environment (BC MOE, 2007). The program to monitor POPs in bird eggs in BC shows that concentrations of PCBs, dioxins, furans and organochlorine pesticides have been steadily decreasing over the last 30 years. Unfortunately, there has been a concurrent increase in PBDEs, which are flame-retardant chemicals widely used in consumer goods. Table 33 shows the measures of these chemicals taken from heron eggs at the UBC colony (BC MOE, 2007).
Table 33: Long-term trends in persistent organic pollutants in great blue heron eggs from UBC (BC MOE, 2007).
Measure 1977 1983 1987 1998 2000 2002
Chlordanes (mg/kg wet weight) 0.1 0.04
DDE (mg/kg wet weight) 2.82 0.36
Dieldrin (mg/kg wet weight) 0.1 0.02
Dioxin-like compounds (TEQs ng/kg wet weight)
208
58
PBDEs (µg/kg wet weight) 12.5 455
PCBs (mg/kg wet weight) 9.57 43.4 1.09
3.7.3.5.2 Lost Lagoon Water Quality
Lost Lagoon was once an arm of the sea and was artificially turned into a lake with the construction of the Causeway in 1916; it was envisioned the Lagoon would support a sport fishery of trout and salmon. The limited natural freshwater drainage into Lost Lagoon would not maintain it as a freshwater lake so freshwater is added from the city water supply in Ceperley Meadows at a rate of 180 gallons per minute. A flap gate-control valve under the Causeway is designed to let water out while preventing the inflow of salt water from Coal Harbour (Coast River, 1995). Nonetheless, saline intrusions occur and the water in the lagoon is usually fresh but is sometimes brackish or saline.
Green algae is a common sight in Lost Lagoon throughout the summer months (Photo by Peter Woods).
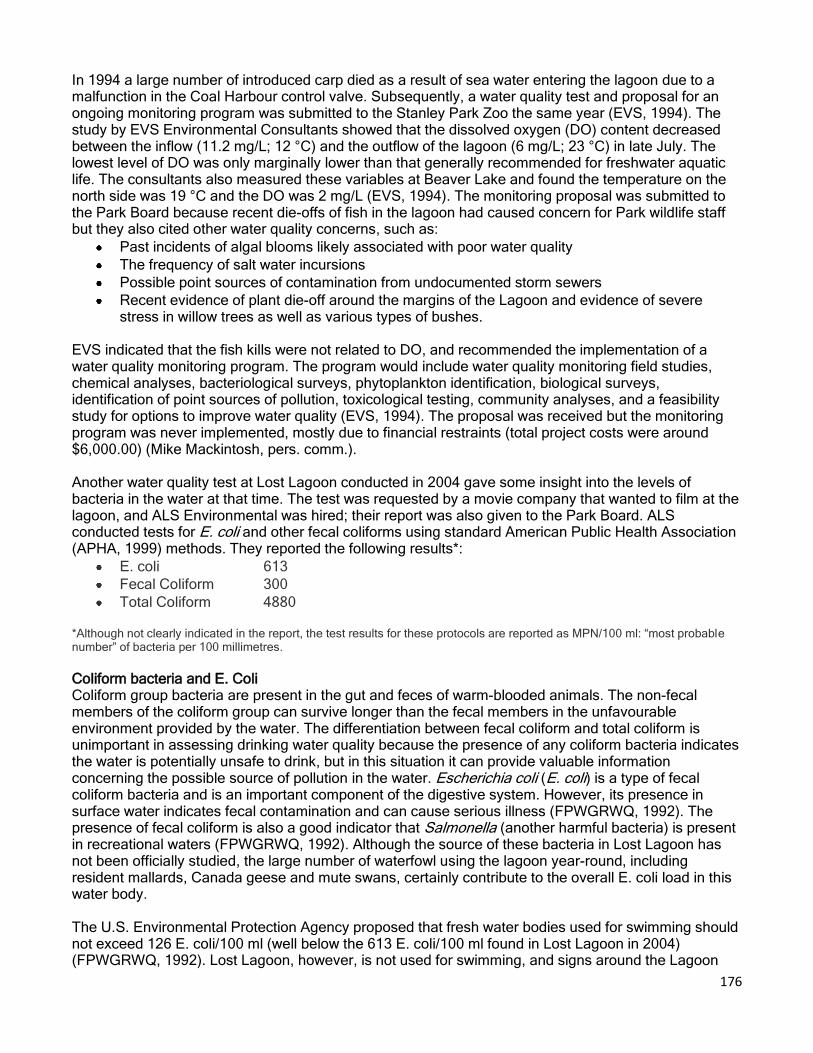
176
In 1994 a large number of introduced carp died as a result of sea water entering the lagoon due to a malfunction in the Coal Harbour control valve. Subsequently, a water quality test and proposal for an ongoing monitoring program was submitted to the Stanley Park Zoo the same year (EVS, 1994). The study by EVS Environmental Consultants showed that the dissolved oxygen (DO) content decreased between the inflow (11.2 mg/L; 12 °C) and the outflow of the lagoon (6 mg/L; 23 °C) in late July. The lowest level of DO was only marginally lower than that generally recommended for freshwater aquatic life. The consultants also measured these variables at Beaver Lake and found the temperature on the north side was 19 °C and the DO was 2 mg/L (EVS, 1994). The monitoring proposal was submitted to the Park Board because recent die-offs of fish in the lagoon had caused concern for Park wildlife staff but they also cited other water quality concerns, such as:
Past incidents of algal blooms likely associated with poor water quality
The frequency of salt water incursions
Possible point sources of contamination from undocumented storm sewers
Recent evidence of plant die-off around the margins of the Lagoon and evidence of severe stress in willow trees as well as various types of bushes.
EVS indicated that the fish kills were not related to DO, and recommended the implementation of a water quality monitoring program. The program would include water quality monitoring field studies, chemical analyses, bacteriological surveys, phytoplankton identification, biological surveys, identification of point sources of pollution, toxicological testing, community analyses, and a feasibility study for options to improve water quality (EVS, 1994). The proposal was received but the monitoring program was never implemented, mostly due to financial restraints (total project costs were around $6,000.00) (Mike Mackintosh, pers. comm.). Another water quality test at Lost Lagoon conducted in 2004 gave some insight into the levels of bacteria in the water at that time. The test was requested by a movie company that wanted to film at the lagoon, and ALS Environmental was hired; their report was also given to the Park Board. ALS conducted tests for E. coli and other fecal coliforms using standard American Public Health Association (APHA, 1999) methods. They reported the following results*:
E. coli 613
Fecal Coliform 300
Total Coliform 4880 *Although not clearly indicated in the report, the test results for these protocols are reported as MPN/100 ml: ―most probable number‖ of bacteria per 100 millimetres.
Coliform bacteria and E. Coli Coliform group bacteria are present in the gut and feces of warm-blooded animals. The non-fecal members of the coliform group can survive longer than the fecal members in the unfavourable environment provided by the water. The differentiation between fecal coliform and total coliform is unimportant in assessing drinking water quality because the presence of any coliform bacteria indicates the water is potentially unsafe to drink, but in this situation it can provide valuable information concerning the possible source of pollution in the water. Escherichia coli (E. coli) is a type of fecal coliform bacteria and is an important component of the digestive system. However, its presence in surface water indicates fecal contamination and can cause serious illness (FPWGRWQ, 1992). The presence of fecal coliform is also a good indicator that Salmonella (another harmful bacteria) is present in recreational waters (FPWGRWQ, 1992). Although the source of these bacteria in Lost Lagoon has not been officially studied, the large number of waterfowl using the lagoon year-round, including resident mallards, Canada geese and mute swans, certainly contribute to the overall E. coli load in this water body. The U.S. Environmental Protection Agency proposed that fresh water bodies used for swimming should not exceed 126 E. coli/100 ml (well below the 613 E. coli/100 ml found in Lost Lagoon in 2004) (FPWGRWQ, 1992). Lost Lagoon, however, is not used for swimming, and signs around the Lagoon

177
clearly warn the public not to go in the water. Although the effects of the high concentration of coliform bacteria in the lagoon on wildlife are not well understood, there have been several deaths of wildlife that may have been caused by contamination. Necropsies of deceased mute swans and cygnets in recent years have shown very high levels of E. coli, aeromonas and streptococcus. One cygnet is presumed to have died because a small wound became a source of infection for the deadly bacteria. In 2001, several scaup (a wintering duck) were found dead in the lagoon. Tests showed they were loaded with E. coli, clostridium, and salmonella species of bacteria (Ziggy Jones, pers. comm.). Lost Lagoon Water Quality studies A limnology study conducted by graduate students from Capilano College‘s Environmental Science program in May 2000 aimed to assess the water quality of the lagoon using abiotic and biotic studies. This pivotal study was the first (and to date, only) attempt at providing comprehensive baseline biological and chemical water testing data for Lost Lagoon. More importantly, it formulated a protocol for future testing and included a long-term management plan for the lagoon.
The study was limited in its scope since it was only performed during one month and in the late spring. However, there were some significant findings. The students reported that the lagoon has mostly eutrophic characteristics but also exhibits some oligotrophic features: see Table 34. Although the study showed no trace of phosphates, the report pointed out this may be misleading, as only the inorganic form was measured, even though most of the phosphate content in the lake is in the organic form and present in the accumulation of sediments in the lake.
Table 34: Results of limnology study in Lost Lagoon (Braybn, et al., 2000).
Characteristic Eutrophic Lost Lagoon
Morphology Shallow (<10 m), broad littoral, cultivated or disturbed
√ Average 1 m depth, broad littoral, disturbed
Water Colour Brown-green, green-yellow √ brown, green Substrate Organic sediment, muddy √ fine particulate, muddy
Transparency Small, very small (Secchi disk 0.1-2 m)
√ very small (avg. 24.3 cm)
Suspended Detritus Rich, planktogenic √ Rich, planktogenic Oxygen 0-40% min, X 77% Littoral Plant Production
Rich √ Rich
Plankton Large quantity, low diversity, often blooms
√ Large quantity, medium diversity, often blooms
Nitrates/Phosphates Rich in N and P X only trace N or P
CaCO3 High X low CaCO3 (slightly ―hard‖)
The same study looked at the periphyton community in the Lagoon and found large quantities of diatoms and a diverse community of rotifers were present. This may be attributable to the fact that the study was conducted in spring when blooms are common. There were several species of protozoa and
Daphnia is a common form of zooplankton (Photo by Peter Woods).

178
cyanobacteria (blue-green algae) such as Anabaena, Microcystis and Nodularia spp., including some species that are indicators of grossly organic pollution. The high abundance and low diversity of zooplankton is common in eutrophic systems (Braybn et al., 2000). For a complete list of plankton species documented in Stanley Park please see Appendix 19. The benthic community in the Lagoon was found to be dominated by midges (family Chironomidae) and also contained aquatic worms, both of which are tolerant of polluted waters, and may indicate a high organic content and/or some degree of pollution. There were also a number of caddisflies recovered, which are considered pollution intolerant, as well as two hydra and one copepod species. Their conclusion was that there is a definite lack of species richness and abundance in the system, and although the water quality in the lagoon was not excellent, it was better than was expected (Braybn, et al., 2000). Possible pathogens in Lost Lagoon Of growing concern have been the algal blooms that have been occurring increasingly every summer on the lagoon. Along with these have been reports of decreasing levels of zooplankton usually visible on the surface of the water (Peter Woods, pers. comm.). During a heat wave at the end of July 2009 (with July 29, at 33.9 oC, being the hottest day ever recorded in Vancouver), there occurred particularly intense blooms in the Stone Bridge pond area at the southwest corner of Lost Lagoon. The effect was so remarkable that the bloom received extensive media coverage. The water had an unusual milky turquoise colour ‗like that of glacial silt‘, unlike the solid green blooms usually seen each summer around the lagoon. The strange colour and putrid odour persisted for several days until more normal temperatures resumed, and rain and wind helped to disperse the blooms. Laboratory testing of water samples collected by the Stone Bridge and in front of the Nature House revealed the presence of green algae as well as cyanobacteria, including genera of Anabaena and Anacystis. No toxicology was performed. The same day the collection was made, two people were reported swimming in the lagoon. Even though it seems like a foolhardy act given the questionable appearance of the water, there have been several reports of people doing this each year (Stanley Park Nature House staff, pers. comm.).
During a heat wave at the end of July 2009 there occurred a particularly intense bloom at the southwest corner of Lost Lagoon. Laboratory testing of water samples collected by the Stone Bridge and in front of the Nature House revealed the presence of green algae as well as cyanobacteria, including Anabaena and Anacystis (Photo by Peter Woods).

179
Since blue-green algae have many characteristics of bacteria, they are more appropriately called cyanobacteria (SWCSMH, 2007). They use chlorophyll to trap the energy of the sun for their own metabolism and release oxygen via photosynthesis. As primary oxygen producers, they are an essential component of pond and lake ecosystems. Some cyanobacteria are able to fix atmospheric nitrogen, which can sometimes give them a competitive advantage over other algal species living in the water (SWCSMH, 2007). During the hot summer months, when temperature and nutrient levels (especially nitrogen and phosphorus) are particularly high and the water is still, cyanobacteria can grow to excess, becoming visible as ‗pond scum‘ or ‗blooms‘. These blooms can occur in various colours. They most commonly appear blue-green and may turn a pale blue when scums are dying off. The blue-green colouration comes from their chlorophyll, in combination with phycocyanin, a photosynthetic accessory pigment (SWCSMH, 2007). Problems resulting from large blooms include:
1) Reduced sunlight penetration into the water, which inhibits the growth of rooted aquatic plants. 2) Depletion of oxygen from the lower layers of the water when the cyanobacteria die, fall to the
bottom, and decompose. Besides being detrimental to aquatic species including fish, such oxygen depletion also results in a greater release of phosphorus (a limiting growth factor for algae and cyanobacteria) from the bottom sediments. Subsequently, when the lake layers mix, some of this released phosphorus will become available to the algae in the surface water, thus creating more algal blooms (CWMPSC, 2007).
3) Toxicity: Between 30 and 50% of cyanobacterial blooms are harmless because they contain
only non-toxic species of freshwater cyanobacteria (Health Canada, 2008). However, when large blooms of toxic species of cyanobacteria die off, they can release toxins into the water. These may remain for several weeks before being broken down by sunlight and the water‘s natural populations of bacteria. Some of these toxins may attack the liver (hepatotoxins) or the nervous system (neurotoxins) (HealthLink BC, 2005). They can be detrimental to ecosystems as they affect organisms from zooplankton to others further up the food chain (SWCSMH, 2007). There have been widespread reports of poisoning from cyanobacteria, affecting a variety of animals including rodents, amphibians, fish, waterfowl, and bats (QGNRW, 2006). Cyanobacterial toxins pose a potential risk to wildlife, which consume large amounts of untreated water daily. These toxins can also accumulate in the tissues of fish, particularly in the viscera, with tissue levels depending on the magnitude of the bloom in the area (Health Canada, 2008).
Even though a cyanobacterium that is capable of producing toxin is present in a lake, it will not necessarily always be producing that toxin. To determine if a particular bloom is toxic, samples have to be analyzed in a laboratory for species identification and measurement of toxins (CWMPSC, 2007). Health Canada issues standards for cyanotoxins only for drinking water for a certain type of toxin; currently there are none for the recreational use of water. Both Health Canada and Healthlink BC advise treating all blooms with caution as some may be toxic. They recommend refraining from wading, swimming or bathing in water with visible blooms, and not allowing pets to drink water containing blooms because they risk damage to the liver or to the nervous system, depending on which toxins were prevalent in the water (Health Canada, 2008; Healthlink BC, 2005). Runoff from some areas around the Lagoon may be further contributing to the deterioration of water quality, but further study is needed to determine these effects.
3.7.3.5.3 Air Pollution
Because Stanley Park is located in a major city, it is surrounded by the pollutants that contribute to poor air quality. Some of the more important air pollutants in the City of Vancouver are fine particles and

180
nitrogen oxides (NOx) which can be produced by combustion processes, and sulphur dioxide (SOx) which is found in fuel (City of Vancouver, 2005). In 1993 it was reported that air quality in Vancouver had not deteriorated since the 1980s, and in fact, improvements had been observed. A GVRD monitoring station at Robson and Hornby St. (the closest one to the Park) showed that carbon monoxide (CO) levels had been declining, Ozone levels remained constant as did the levels of NOx and SOx. Carbon monoxide and ozone levels had exceeded Canadian federal objectives on some occasions while the other pollutants did not (Wilkin, et al., 1995).Total air emissions have slowly been decreasing in the city (Figure 42) but that is expected to change in Vancouver within the next few years as the population and city continue to expand. The population in greater Vancouver has risen in previous years from 662 people per km2 in 1996 to 757 people per km2 in 2006, and is projected to be 1,004 people per km2 by 2031 (BC MOE, 2007). The City of Vancouver‘s State of the Environment Report Card in 2005 gave the city an overall "Fair-Good" rating for air quality (City of Vancouver, 2005).
The major contributor to air pollution in the Park, as with many parks, is from the thousands of cars that pass through it each day. Pollutants emitted by vehicles can be from fuel combustion, brake and tire wear, evaporation of fuel, and from the action of the tire on the road surface (Wilkin, et al., 1995). A study of air quality in the Park was undertaken in 1993 as part of the Causeway expansion project. Table 35 shows the annual emissions for vehicles traveling through the Park.
Figure 42: Trends of total air emissions in Vancouver.
Table 35: Annual baseline emissions for vehicles travelling through the Causeway and over the Lions Gate Bridge in 1993 compared to total GVRD emissions for 1990 (taken from Wilkin, et al., 1995).
Pollutant Causeway/bridge traffic (tonnes)
% of GVRD average
Carbon Monoxide 851 0.3% Oxides of Nitrogen 99 0.19% Volatile Organic Compounds 94 0.13% Oxides of Sulphur 5 0.07% Exhaust particulate 4 0.02%
The study indicated that the air quality was generally good and did not exceed the most stringent provincial objectives for regulated pollutants. However, traffic jams on the bridge and Causeway were likely to cause the localized increase in levels of CO and NOx (Wilkin, et al., 1995). Since Stanley Park has approximately 250 hectares of forested area, it is a contributor to the overall air quality of the area and helps to reduce harmful air pollution. Urban trees provide air quality benefits in four main ways (ISA, 2009):
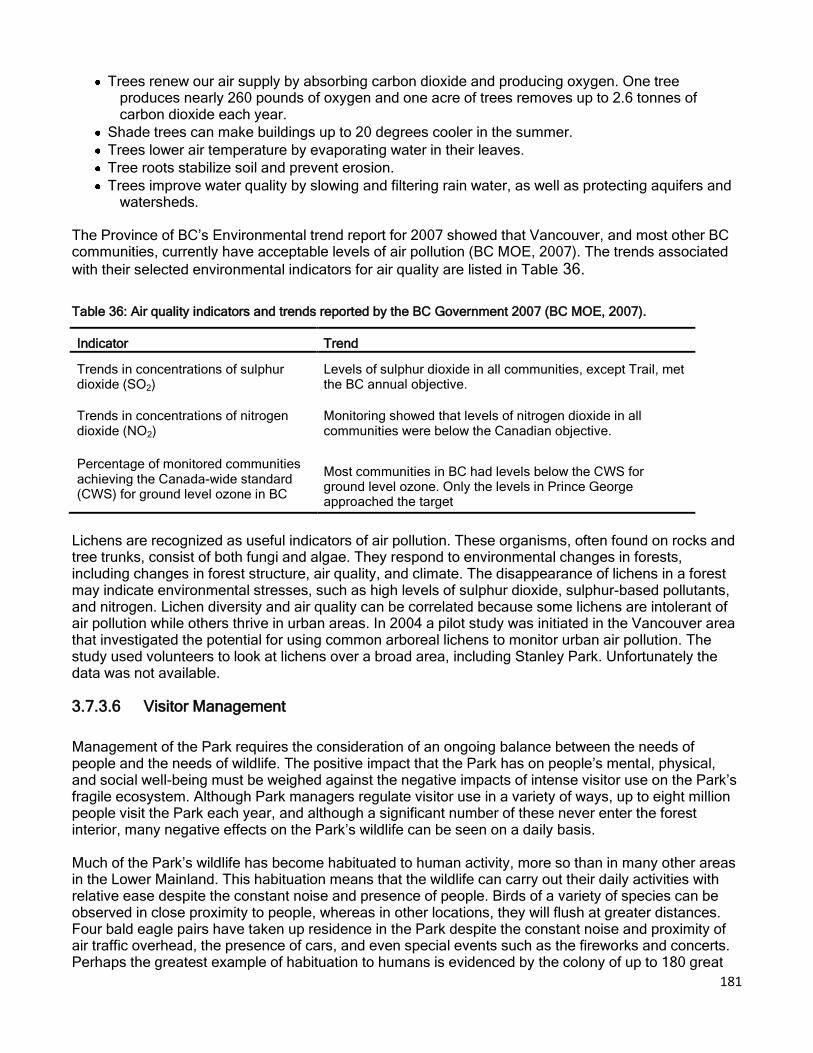
181
Trees renew our air supply by absorbing carbon dioxide and producing oxygen. One tree produces nearly 260 pounds of oxygen and one acre of trees removes up to 2.6 tonnes of carbon dioxide each year.
Shade trees can make buildings up to 20 degrees cooler in the summer.
Trees lower air temperature by evaporating water in their leaves.
Tree roots stabilize soil and prevent erosion.
Trees improve water quality by slowing and filtering rain water, as well as protecting aquifers and watersheds.
The Province of BC‘s Environmental trend report for 2007 showed that Vancouver, and most other BC communities, currently have acceptable levels of air pollution (BC MOE, 2007). The trends associated
with their selected environmental indicators for air quality are listed in Table 36.
Table 36: Air quality indicators and trends reported by the BC Government 2007 (BC MOE, 2007).
Indicator Trend
Trends in concentrations of sulphur dioxide (SO2)
Levels of sulphur dioxide in all communities, except Trail, met the BC annual objective.
Trends in concentrations of nitrogen dioxide (NO2)
Monitoring showed that levels of nitrogen dioxide in all communities were below the Canadian objective.
Percentage of monitored communities achieving the Canada-wide standard (CWS) for ground level ozone in BC
Most communities in BC had levels below the CWS for ground level ozone. Only the levels in Prince George approached the target
Lichens are recognized as useful indicators of air pollution. These organisms, often found on rocks and tree trunks, consist of both fungi and algae. They respond to environmental changes in forests, including changes in forest structure, air quality, and climate. The disappearance of lichens in a forest may indicate environmental stresses, such as high levels of sulphur dioxide, sulphur-based pollutants, and nitrogen. Lichen diversity and air quality can be correlated because some lichens are intolerant of air pollution while others thrive in urban areas. In 2004 a pilot study was initiated in the Vancouver area that investigated the potential for using common arboreal lichens to monitor urban air pollution. The study used volunteers to look at lichens over a broad area, including Stanley Park. Unfortunately the data was not available.
3.7.3.6 Visitor Management
Management of the Park requires the consideration of an ongoing balance between the needs of people and the needs of wildlife. The positive impact that the Park has on people‘s mental, physical, and social well-being must be weighed against the negative impacts of intense visitor use on the Park‘s fragile ecosystem. Although Park managers regulate visitor use in a variety of ways, up to eight million people visit the Park each year, and although a significant number of these never enter the forest interior, many negative effects on the Park‘s wildlife can be seen on a daily basis. Much of the Park‘s wildlife has become habituated to human activity, more so than in many other areas in the Lower Mainland. This habituation means that the wildlife can carry out their daily activities with relative ease despite the constant noise and presence of people. Birds of a variety of species can be observed in close proximity to people, whereas in other locations, they will flush at greater distances. Four bald eagle pairs have taken up residence in the Park despite the constant noise and proximity of air traffic overhead, the presence of cars, and even special events such as the fireworks and concerts. Perhaps the greatest example of habituation to humans is evidenced by the colony of up to 180 great
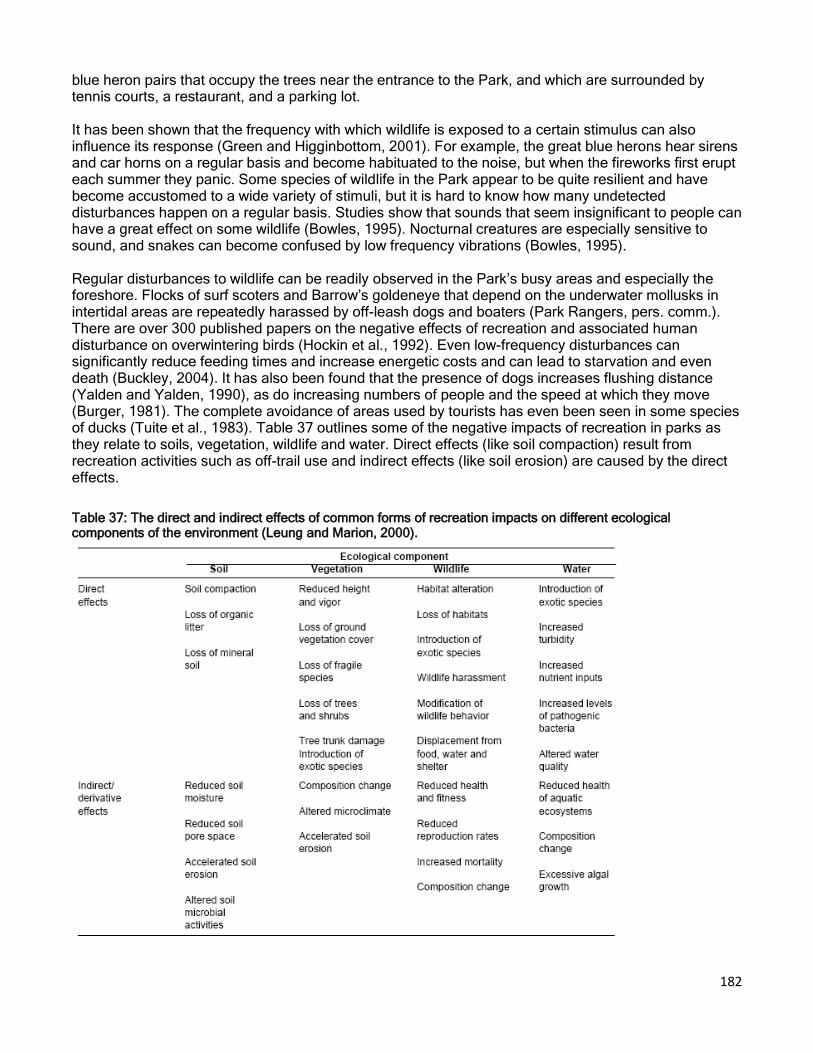
182
blue heron pairs that occupy the trees near the entrance to the Park, and which are surrounded by tennis courts, a restaurant, and a parking lot. It has been shown that the frequency with which wildlife is exposed to a certain stimulus can also influence its response (Green and Higginbottom, 2001). For example, the great blue herons hear sirens and car horns on a regular basis and become habituated to the noise, but when the fireworks first erupt each summer they panic. Some species of wildlife in the Park appear to be quite resilient and have become accustomed to a wide variety of stimuli, but it is hard to know how many undetected disturbances happen on a regular basis. Studies show that sounds that seem insignificant to people can have a great effect on some wildlife (Bowles, 1995). Nocturnal creatures are especially sensitive to sound, and snakes can become confused by low frequency vibrations (Bowles, 1995). Regular disturbances to wildlife can be readily observed in the Park‘s busy areas and especially the foreshore. Flocks of surf scoters and Barrow‘s goldeneye that depend on the underwater mollusks in intertidal areas are repeatedly harassed by off-leash dogs and boaters (Park Rangers, pers. comm.). There are over 300 published papers on the negative effects of recreation and associated human disturbance on overwintering birds (Hockin et al., 1992). Even low-frequency disturbances can significantly reduce feeding times and increase energetic costs and can lead to starvation and even death (Buckley, 2004). It has also been found that the presence of dogs increases flushing distance (Yalden and Yalden, 1990), as do increasing numbers of people and the speed at which they move (Burger, 1981). The complete avoidance of areas used by tourists has even been seen in some species of ducks (Tuite et al., 1983). Table 37 outlines some of the negative impacts of recreation in parks as they relate to soils, vegetation, wildlife and water. Direct effects (like soil compaction) result from recreation activities such as off-trail use and indirect effects (like soil erosion) are caused by the direct effects.
Table 37: The direct and indirect effects of common forms of recreation impacts on different ecological components of the environment (Leung and Marion, 2000).
183
4
Ecological Integrity and Environmental Indicators
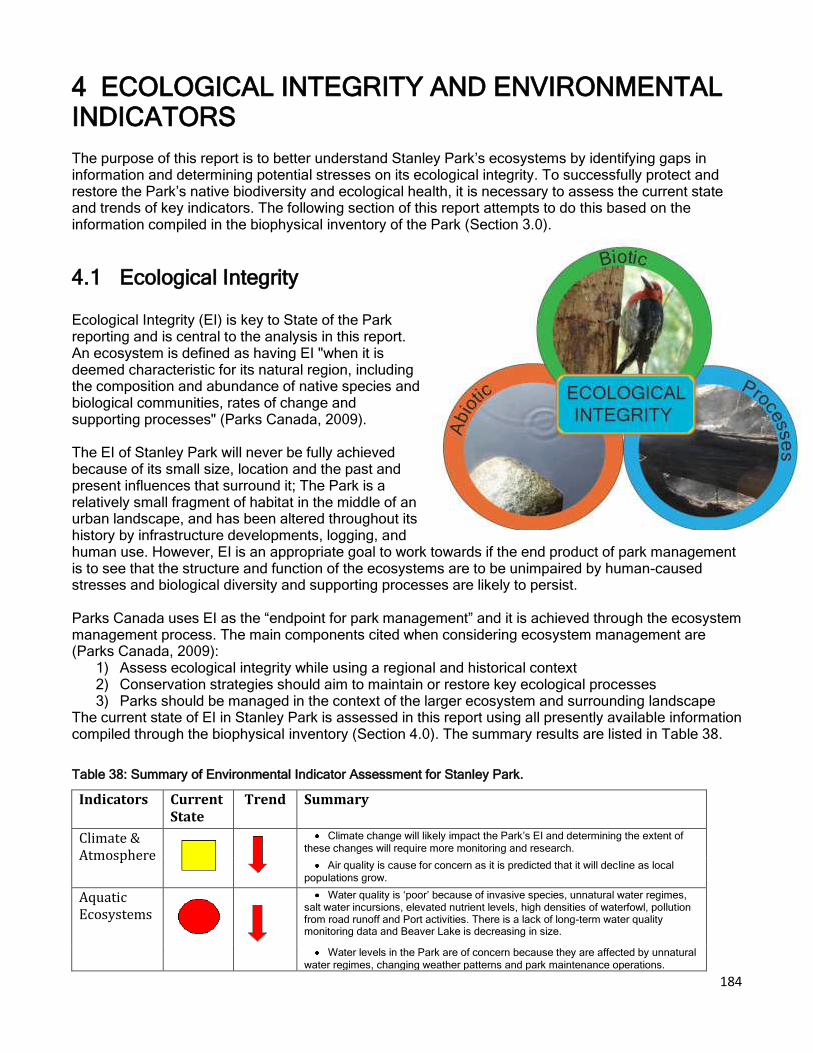
184
4 ECOLOGICAL INTEGRITY AND ENVIRONMENTAL INDICATORS
The purpose of this report is to better understand Stanley Park‘s ecosystems by identifying gaps in information and determining potential stresses on its ecological integrity. To successfully protect and restore the Park‘s native biodiversity and ecological health, it is necessary to assess the current state and trends of key indicators. The following section of this report attempts to do this based on the information compiled in the biophysical inventory of the Park (Section 3.0).
4.1 Ecological Integrity Ecological Integrity (EI) is key to State of the Park reporting and is central to the analysis in this report. An ecosystem is defined as having EI "when it is deemed characteristic for its natural region, including the composition and abundance of native species and biological communities, rates of change and supporting processes" (Parks Canada, 2009). The EI of Stanley Park will never be fully achieved because of its small size, location and the past and present influences that surround it; The Park is a relatively small fragment of habitat in the middle of an urban landscape, and has been altered throughout its history by infrastructure developments, logging, and human use. However, EI is an appropriate goal to work towards if the end product of park management is to see that the structure and function of the ecosystems are to be unimpaired by human-caused stresses and biological diversity and supporting processes are likely to persist. Parks Canada uses EI as the ―endpoint for park management‖ and it is achieved through the ecosystem management process. The main components cited when considering ecosystem management are (Parks Canada, 2009):
1) Assess ecological integrity while using a regional and historical context 2) Conservation strategies should aim to maintain or restore key ecological processes 3) Parks should be managed in the context of the larger ecosystem and surrounding landscape
The current state of EI in Stanley Park is assessed in this report using all presently available information compiled through the biophysical inventory (Section 4.0). The summary results are listed in Table 38.
Table 38: Summary of Environmental Indicator Assessment for Stanley Park.
Indicators Current State
Trend Summary
Climate & Atmosphere
Climate change will likely impact the Park‘s EI and determining the extent of these changes will require more monitoring and research.
Air quality is cause for concern as it is predicted that it will decline as local populations grow.
Aquatic Ecosystems
Water quality is ‗poor‘ because of invasive species, unnatural water regimes, salt water incursions, elevated nutrient levels, high densities of waterfowl, pollution from road runoff and Port activities. There is a lack of long-term water quality monitoring data and Beaver Lake is decreasing in size.
Water levels in the Park are of concern because they are affected by unnatural water regimes, changing weather patterns and park maintenance operations.
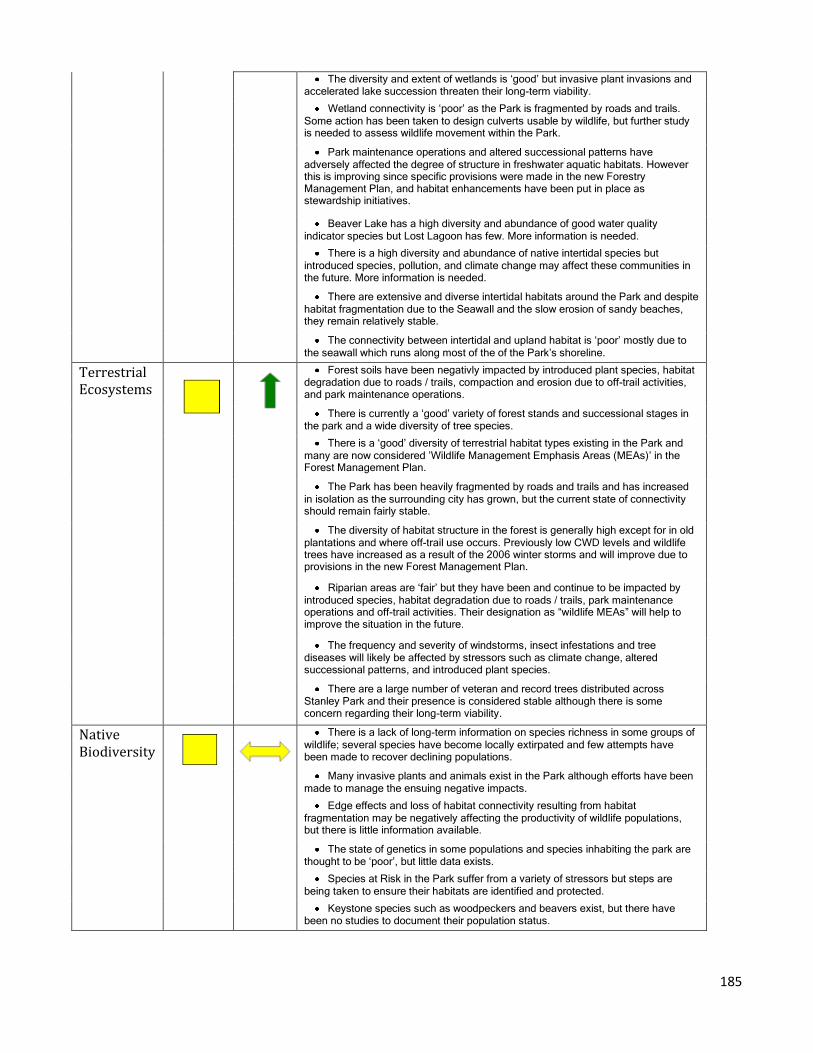
185
The diversity and extent of wetlands is ‗good‘ but invasive plant invasions and accelerated lake succession threaten their long-term viability.
Wetland connectivity is ‗poor‘ as the Park is fragmented by roads and trails. Some action has been taken to design culverts usable by wildlife, but further study is needed to assess wildlife movement within the Park.
Park maintenance operations and altered successional patterns have adversely affected the degree of structure in freshwater aquatic habitats. However this is improving since specific provisions were made in the new Forestry Management Plan, and habitat enhancements have been put in place as stewardship initiatives.
Beaver Lake has a high diversity and abundance of good water quality indicator species but Lost Lagoon has few. More information is needed.
There is a high diversity and abundance of native intertidal species but introduced species, pollution, and climate change may affect these communities in the future. More information is needed.
There are extensive and diverse intertidal habitats around the Park and despite habitat fragmentation due to the Seawall and the slow erosion of sandy beaches, they remain relatively stable.
The connectivity between intertidal and upland habitat is ‗poor‘ mostly due to the seawall which runs along most of the of the Park‘s shoreline.
Terrestrial Ecosystems
Forest soils have been negativly impacted by introduced plant species, habitat degradation due to roads / trails, compaction and erosion due to off-trail activities, and park maintenance operations.
There is currently a ‗good‘ variety of forest stands and successional stages in the park and a wide diversity of tree species.
There is a ‗good‘ diversity of terrestrial habitat types existing in the Park and many are now considered ‘Wildlife Management Emphasis Areas (MEAs)‘ in the Forest Management Plan.
The Park has been heavily fragmented by roads and trails and has increased in isolation as the surrounding city has grown, but the current state of connectivity should remain fairly stable.
The diversity of habitat structure in the forest is generally high except for in old plantations and where off-trail use occurs. Previously low CWD levels and wildlife trees have increased as a result of the 2006 winter storms and will improve due to provisions in the new Forest Management Plan.
Riparian areas are ‗fair‘ but they have been and continue to be impacted by introduced species, habitat degradation due to roads / trails, park maintenance operations and off-trail activities. Their designation as ―wildlife MEAs‖ will help to improve the situation in the future.
The frequency and severity of windstorms, insect infestations and tree diseases will likely be affected by stressors such as climate change, altered successional patterns, and introduced plant species.
There are a large number of veteran and record trees distributed across Stanley Park and their presence is considered stable although there is some concern regarding their long-term viability.
Native Biodiversity
There is a lack of long-term information on species richness in some groups of wildlife; several species have become locally extirpated and few attempts have been made to recover declining populations.
Many invasive plants and animals exist in the Park although efforts have been made to manage the ensuing negative impacts.
Edge effects and loss of habitat connectivity resulting from habitat fragmentation may be negatively affecting the productivity of wildlife populations, but there is little information available.
The state of genetics in some populations and species inhabiting the park are thought to be ‗poor‘, but little data exists.
Species at Risk in the Park suffer from a variety of stressors but steps are being taken to ensure their habitats are identified and protected.
Keystone species such as woodpeckers and beavers exist, but there have been no studies to document their population status.
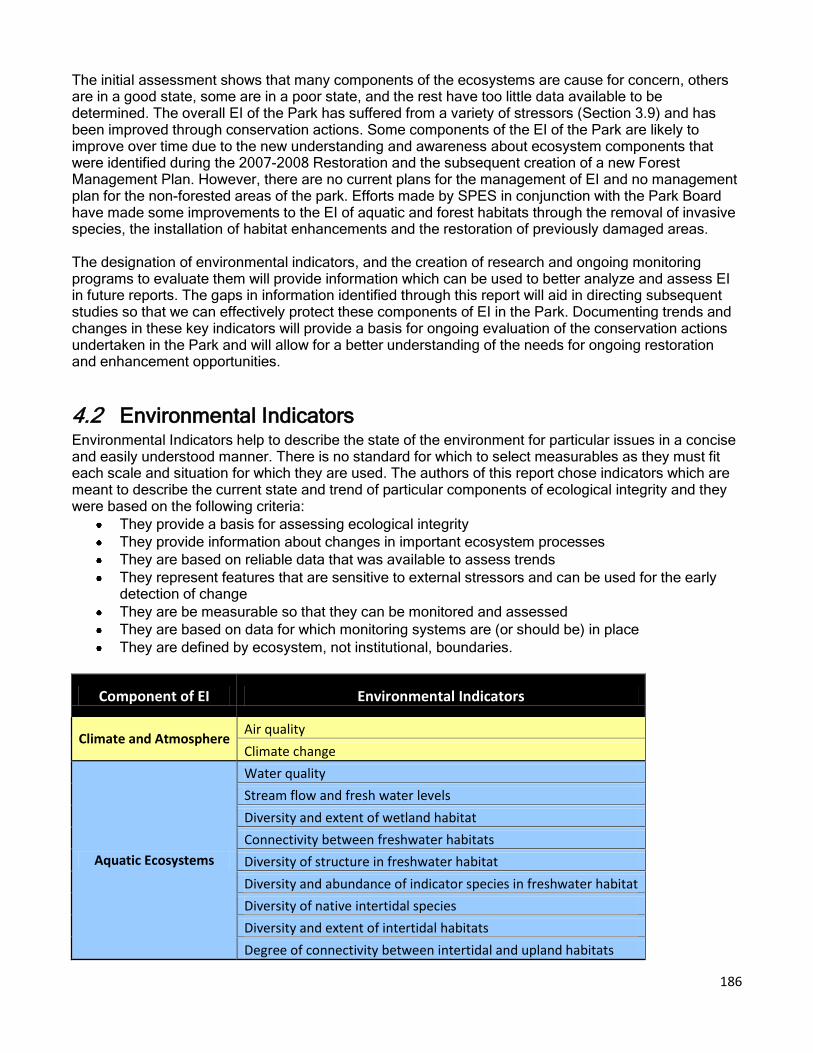
186
The initial assessment shows that many components of the ecosystems are cause for concern, others are in a good state, some are in a poor state, and the rest have too little data available to be determined. The overall EI of the Park has suffered from a variety of stressors (Section 3.9) and has been improved through conservation actions. Some components of the EI of the Park are likely to improve over time due to the new understanding and awareness about ecosystem components that were identified during the 2007-2008 Restoration and the subsequent creation of a new Forest Management Plan. However, there are no current plans for the management of EI and no management plan for the non-forested areas of the park. Efforts made by SPES in conjunction with the Park Board have made some improvements to the EI of aquatic and forest habitats through the removal of invasive species, the installation of habitat enhancements and the restoration of previously damaged areas. The designation of environmental indicators, and the creation of research and ongoing monitoring programs to evaluate them will provide information which can be used to better analyze and assess EI in future reports. The gaps in information identified through this report will aid in directing subsequent studies so that we can effectively protect these components of EI in the Park. Documenting trends and changes in these key indicators will provide a basis for ongoing evaluation of the conservation actions undertaken in the Park and will allow for a better understanding of the needs for ongoing restoration and enhancement opportunities.
4.2 Environmental Indicators Environmental Indicators help to describe the state of the environment for particular issues in a concise and easily understood manner. There is no standard for which to select measurables as they must fit each scale and situation for which they are used. The authors of this report chose indicators which are meant to describe the current state and trend of particular components of ecological integrity and they were based on the following criteria:
They provide a basis for assessing ecological integrity
They provide information about changes in important ecosystem processes
They are based on reliable data that was available to assess trends
They represent features that are sensitive to external stressors and can be used for the early detection of change
They are be measurable so that they can be monitored and assessed
They are based on data for which monitoring systems are (or should be) in place
They are defined by ecosystem, not institutional, boundaries.
Component of EI Environmental Indicators
Climate and Atmosphere Air quality
Climate change
Aquatic Ecosystems
Water quality
Stream flow and fresh water levels
Diversity and extent of wetland habitat
Connectivity between freshwater habitats
Diversity of structure in freshwater habitat
Diversity and abundance of indicator species in freshwater habitat
Diversity of native intertidal species
Diversity and extent of intertidal habitats
Degree of connectivity between intertidal and upland habitats

187
Terrestrial Ecosystems
Natural soil quality
Diversity of species and successional stages in forest stands
Diversity and quality of terrestrial habitat types
Connectivity between terrestrial habitats
Diversity of habitat structure
Riparian areas
Frequency and severity of natural disturbances
Number and distribution of native veteran and record trees
Native Biodiversity
Indigenous plant and animal species richness
Number and extent of invasive plant and animal species
Native species productivity
Genetic diversity within species
Number of SARs and extent of park used by them
Population status of keystone species
Dragonfly nymph in Beaver Lake
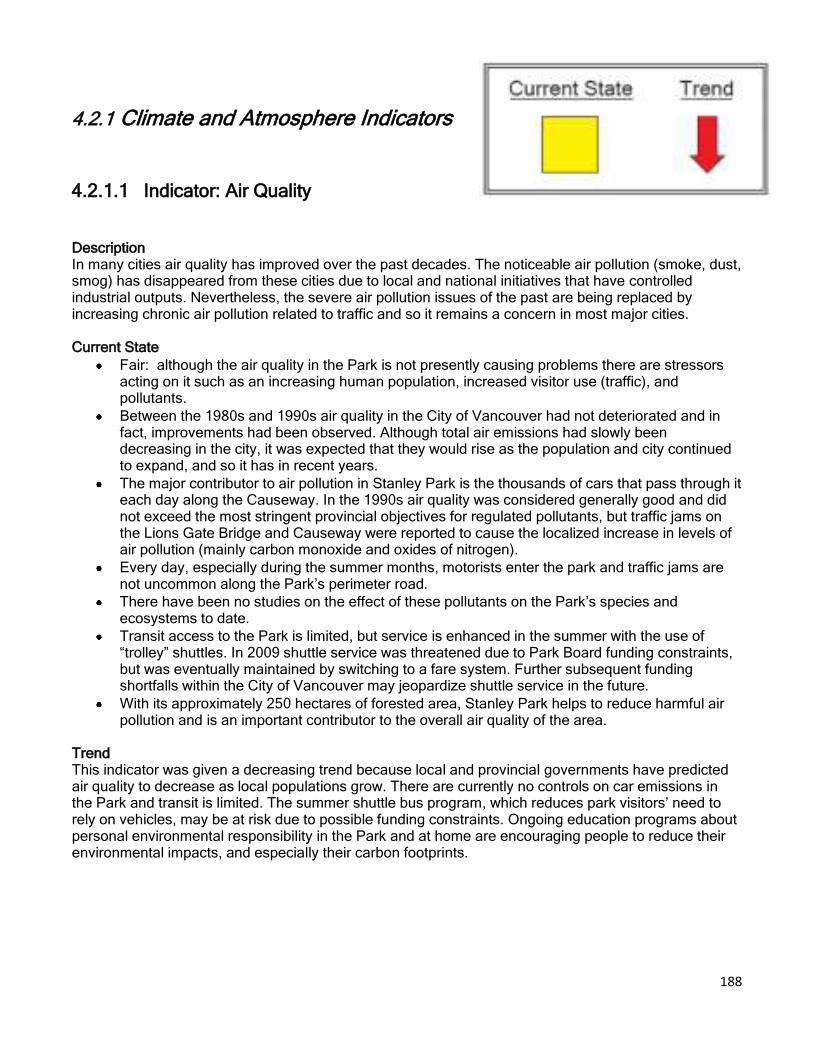
188
4.2.1 Climate and Atmosphere Indicators
4.2.1.1 Indicator: Air Quality
Description In many cities air quality has improved over the past decades. The noticeable air pollution (smoke, dust, smog) has disappeared from these cities due to local and national initiatives that have controlled industrial outputs. Nevertheless, the severe air pollution issues of the past are being replaced by increasing chronic air pollution related to traffic and so it remains a concern in most major cities. Current State
Fair: although the air quality in the Park is not presently causing problems there are stressors acting on it such as an increasing human population, increased visitor use (traffic), and pollutants.
Between the 1980s and 1990s air quality in the City of Vancouver had not deteriorated and in fact, improvements had been observed. Although total air emissions had slowly been decreasing in the city, it was expected that they would rise as the population and city continued to expand, and so it has in recent years.
The major contributor to air pollution in Stanley Park is the thousands of cars that pass through it each day along the Causeway. In the 1990s air quality was considered generally good and did not exceed the most stringent provincial objectives for regulated pollutants, but traffic jams on the Lions Gate Bridge and Causeway were reported to cause the localized increase in levels of air pollution (mainly carbon monoxide and oxides of nitrogen).
Every day, especially during the summer months, motorists enter the park and traffic jams are not uncommon along the Park‘s perimeter road.
There have been no studies on the effect of these pollutants on the Park‘s species and ecosystems to date.
Transit access to the Park is limited, but service is enhanced in the summer with the use of ―trolley‖ shuttles. In 2009 shuttle service was threatened due to Park Board funding constraints, but was eventually maintained by switching to a fare system. Further subsequent funding shortfalls within the City of Vancouver may jeopardize shuttle service in the future.
With its approximately 250 hectares of forested area, Stanley Park helps to reduce harmful air pollution and is an important contributor to the overall air quality of the area.
Trend This indicator was given a decreasing trend because local and provincial governments have predicted air quality to decrease as local populations grow. There are currently no controls on car emissions in the Park and transit is limited. The summer shuttle bus program, which reduces park visitors‘ need to rely on vehicles, may be at risk due to possible funding constraints. Ongoing education programs about personal environmental responsibility in the Park and at home are encouraging people to reduce their environmental impacts, and especially their carbon footprints.
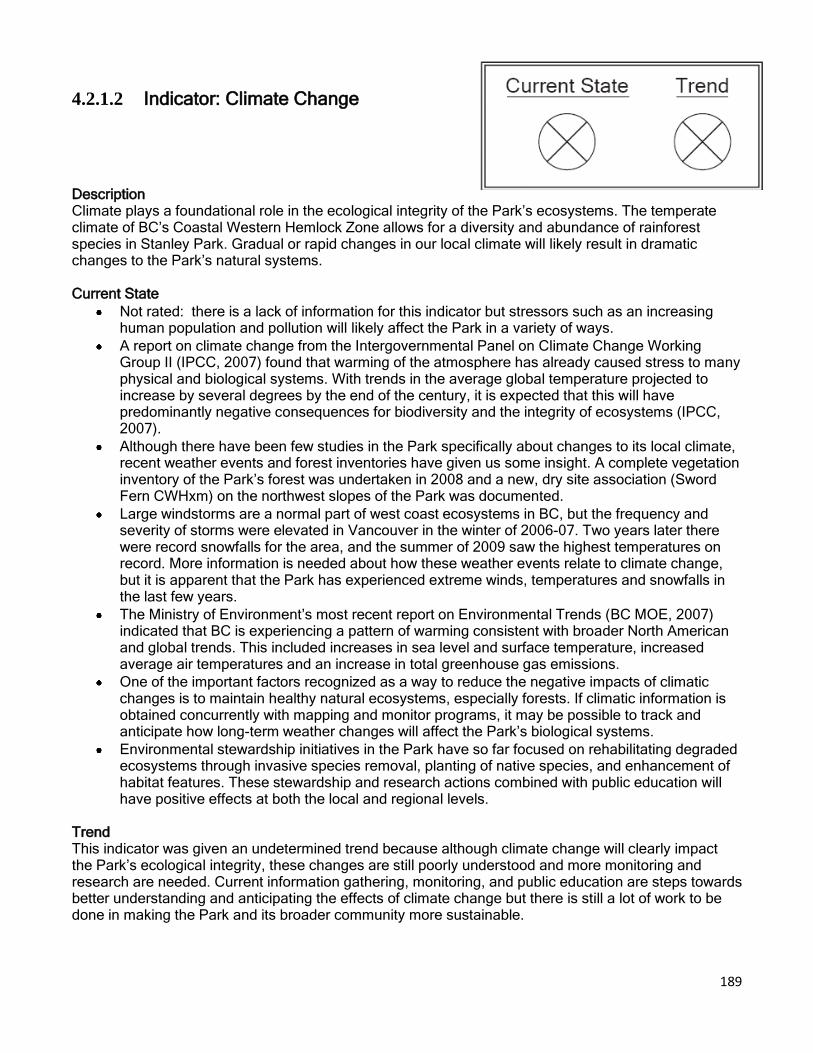
189
4.2.1.2 Indicator: Climate Change
Description Climate plays a foundational role in the ecological integrity of the Park‘s ecosystems. The temperate climate of BC‘s Coastal Western Hemlock Zone allows for a diversity and abundance of rainforest species in Stanley Park. Gradual or rapid changes in our local climate will likely result in dramatic changes to the Park‘s natural systems. Current State
Not rated: there is a lack of information for this indicator but stressors such as an increasing human population and pollution will likely affect the Park in a variety of ways.
A report on climate change from the Intergovernmental Panel on Climate Change Working Group II (IPCC, 2007) found that warming of the atmosphere has already caused stress to many physical and biological systems. With trends in the average global temperature projected to increase by several degrees by the end of the century, it is expected that this will have predominantly negative consequences for biodiversity and the integrity of ecosystems (IPCC, 2007).
Although there have been few studies in the Park specifically about changes to its local climate, recent weather events and forest inventories have given us some insight. A complete vegetation inventory of the Park‘s forest was undertaken in 2008 and a new, dry site association (Sword Fern CWHxm) on the northwest slopes of the Park was documented.
Large windstorms are a normal part of west coast ecosystems in BC, but the frequency and severity of storms were elevated in Vancouver in the winter of 2006-07. Two years later there were record snowfalls for the area, and the summer of 2009 saw the highest temperatures on record. More information is needed about how these weather events relate to climate change, but it is apparent that the Park has experienced extreme winds, temperatures and snowfalls in the last few years.
The Ministry of Environment‘s most recent report on Environmental Trends (BC MOE, 2007) indicated that BC is experiencing a pattern of warming consistent with broader North American and global trends. This included increases in sea level and surface temperature, increased average air temperatures and an increase in total greenhouse gas emissions.
One of the important factors recognized as a way to reduce the negative impacts of climatic changes is to maintain healthy natural ecosystems, especially forests. If climatic information is obtained concurrently with mapping and monitor programs, it may be possible to track and anticipate how long-term weather changes will affect the Park‘s biological systems.
Environmental stewardship initiatives in the Park have so far focused on rehabilitating degraded ecosystems through invasive species removal, planting of native species, and enhancement of habitat features. These stewardship and research actions combined with public education will have positive effects at both the local and regional levels.
Trend This indicator was given an undetermined trend because although climate change will clearly impact the Park‘s ecological integrity, these changes are still poorly understood and more monitoring and research are needed. Current information gathering, monitoring, and public education are steps towards better understanding and anticipating the effects of climate change but there is still a lot of work to be done in making the Park and its broader community more sustainable.
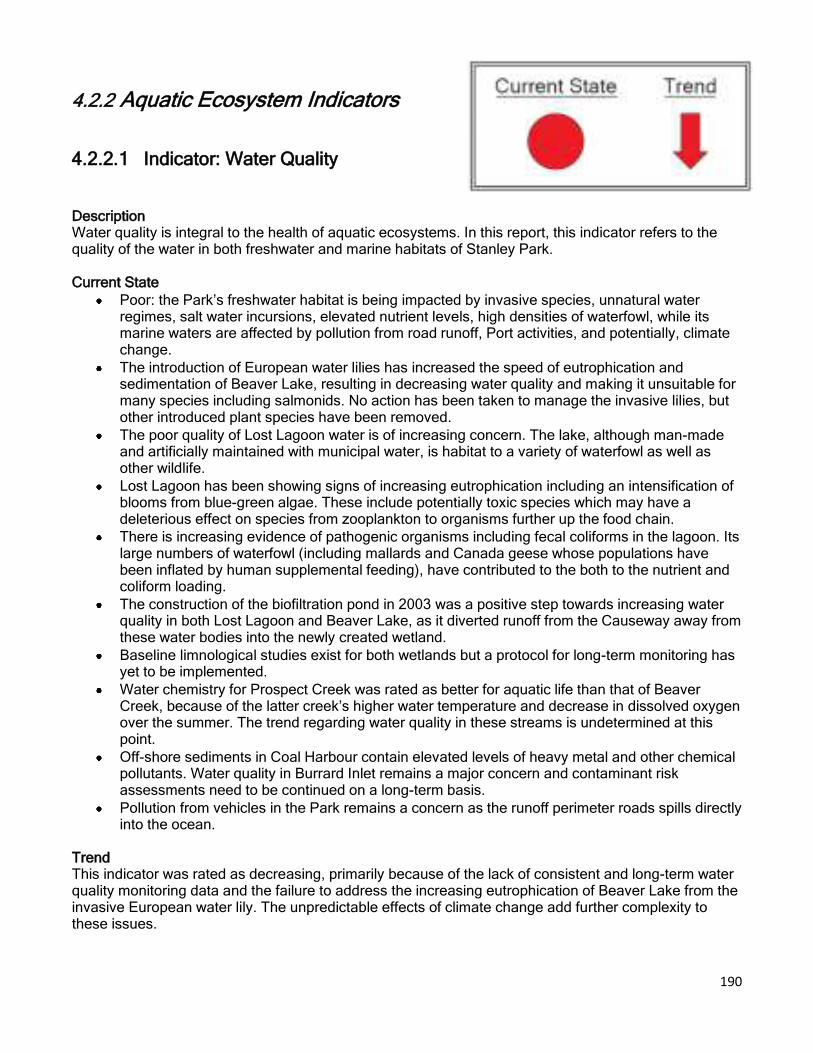
190
4.2.2 Aquatic Ecosystem Indicators
4.2.2.1 Indicator: Water Quality
Description Water quality is integral to the health of aquatic ecosystems. In this report, this indicator refers to the quality of the water in both freshwater and marine habitats of Stanley Park. Current State
Poor: the Park‘s freshwater habitat is being impacted by invasive species, unnatural water regimes, salt water incursions, elevated nutrient levels, high densities of waterfowl, while its marine waters are affected by pollution from road runoff, Port activities, and potentially, climate change.
The introduction of European water lilies has increased the speed of eutrophication and sedimentation of Beaver Lake, resulting in decreasing water quality and making it unsuitable for many species including salmonids. No action has been taken to manage the invasive lilies, but other introduced plant species have been removed.
The poor quality of Lost Lagoon water is of increasing concern. The lake, although man-made and artificially maintained with municipal water, is habitat to a variety of waterfowl as well as other wildlife.
Lost Lagoon has been showing signs of increasing eutrophication including an intensification of blooms from blue-green algae. These include potentially toxic species which may have a deleterious effect on species from zooplankton to organisms further up the food chain.
There is increasing evidence of pathogenic organisms including fecal coliforms in the lagoon. Its large numbers of waterfowl (including mallards and Canada geese whose populations have been inflated by human supplemental feeding), have contributed to the both to the nutrient and coliform loading.
The construction of the biofiltration pond in 2003 was a positive step towards increasing water quality in both Lost Lagoon and Beaver Lake, as it diverted runoff from the Causeway away from these water bodies into the newly created wetland.
Baseline limnological studies exist for both wetlands but a protocol for long-term monitoring has yet to be implemented.
Water chemistry for Prospect Creek was rated as better for aquatic life than that of Beaver Creek, because of the latter creek‘s higher water temperature and decrease in dissolved oxygen over the summer. The trend regarding water quality in these streams is undetermined at this point.
Off-shore sediments in Coal Harbour contain elevated levels of heavy metal and other chemical pollutants. Water quality in Burrard Inlet remains a major concern and contaminant risk assessments need to be continued on a long-term basis.
Pollution from vehicles in the Park remains a concern as the runoff perimeter roads spills directly into the ocean.
Trend This indicator was rated as decreasing, primarily because of the lack of consistent and long-term water quality monitoring data and the failure to address the increasing eutrophication of Beaver Lake from the invasive European water lily. The unpredictable effects of climate change add further complexity to these issues.
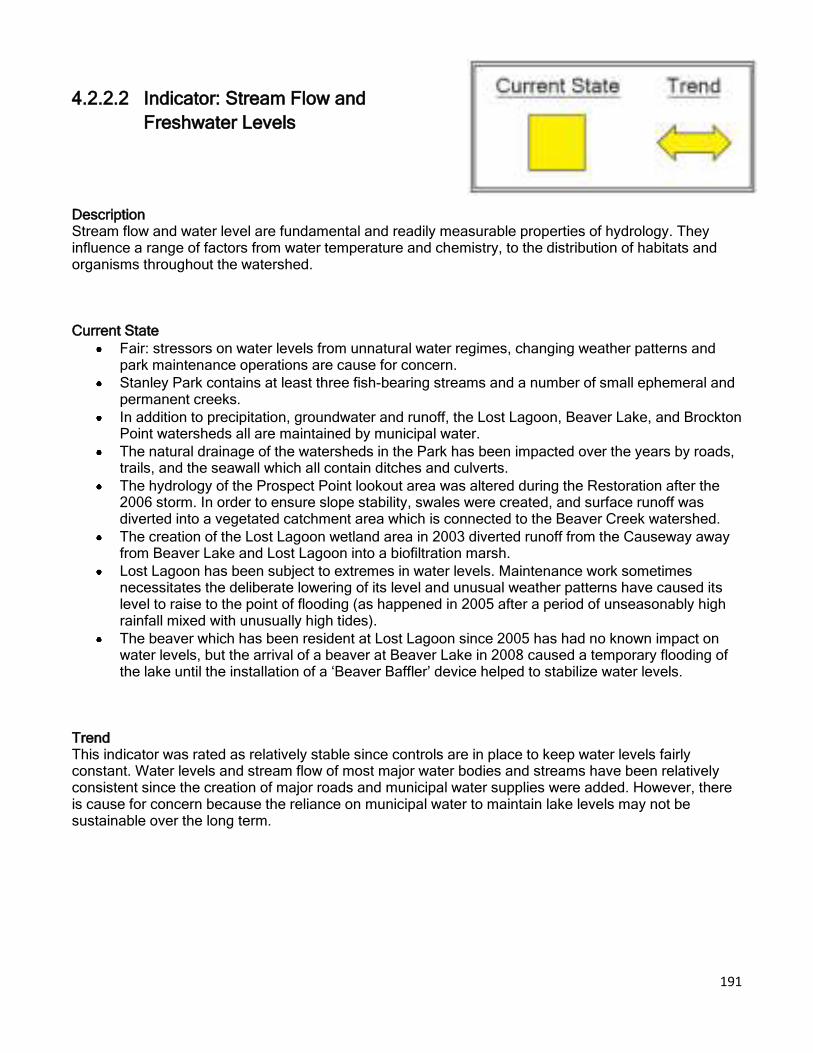
191
4.2.2.2 Indicator: Stream Flow and
Freshwater Levels
Description Stream flow and water level are fundamental and readily measurable properties of hydrology. They influence a range of factors from water temperature and chemistry, to the distribution of habitats and organisms throughout the watershed. Current State
Fair: stressors on water levels from unnatural water regimes, changing weather patterns and park maintenance operations are cause for concern.
Stanley Park contains at least three fish-bearing streams and a number of small ephemeral and permanent creeks.
In addition to precipitation, groundwater and runoff, the Lost Lagoon, Beaver Lake, and Brockton Point watersheds all are maintained by municipal water.
The natural drainage of the watersheds in the Park has been impacted over the years by roads, trails, and the seawall which all contain ditches and culverts.
The hydrology of the Prospect Point lookout area was altered during the Restoration after the 2006 storm. In order to ensure slope stability, swales were created, and surface runoff was diverted into a vegetated catchment area which is connected to the Beaver Creek watershed.
The creation of the Lost Lagoon wetland area in 2003 diverted runoff from the Causeway away from Beaver Lake and Lost Lagoon into a biofiltration marsh.
Lost Lagoon has been subject to extremes in water levels. Maintenance work sometimes necessitates the deliberate lowering of its level and unusual weather patterns have caused its level to raise to the point of flooding (as happened in 2005 after a period of unseasonably high rainfall mixed with unusually high tides).
The beaver which has been resident at Lost Lagoon since 2005 has had no known impact on water levels, but the arrival of a beaver at Beaver Lake in 2008 caused a temporary flooding of the lake until the installation of a ‗Beaver Baffler‘ device helped to stabilize water levels.
Trend This indicator was rated as relatively stable since controls are in place to keep water levels fairly constant. Water levels and stream flow of most major water bodies and streams have been relatively consistent since the creation of major roads and municipal water supplies were added. However, there is cause for concern because the reliance on municipal water to maintain lake levels may not be sustainable over the long term.
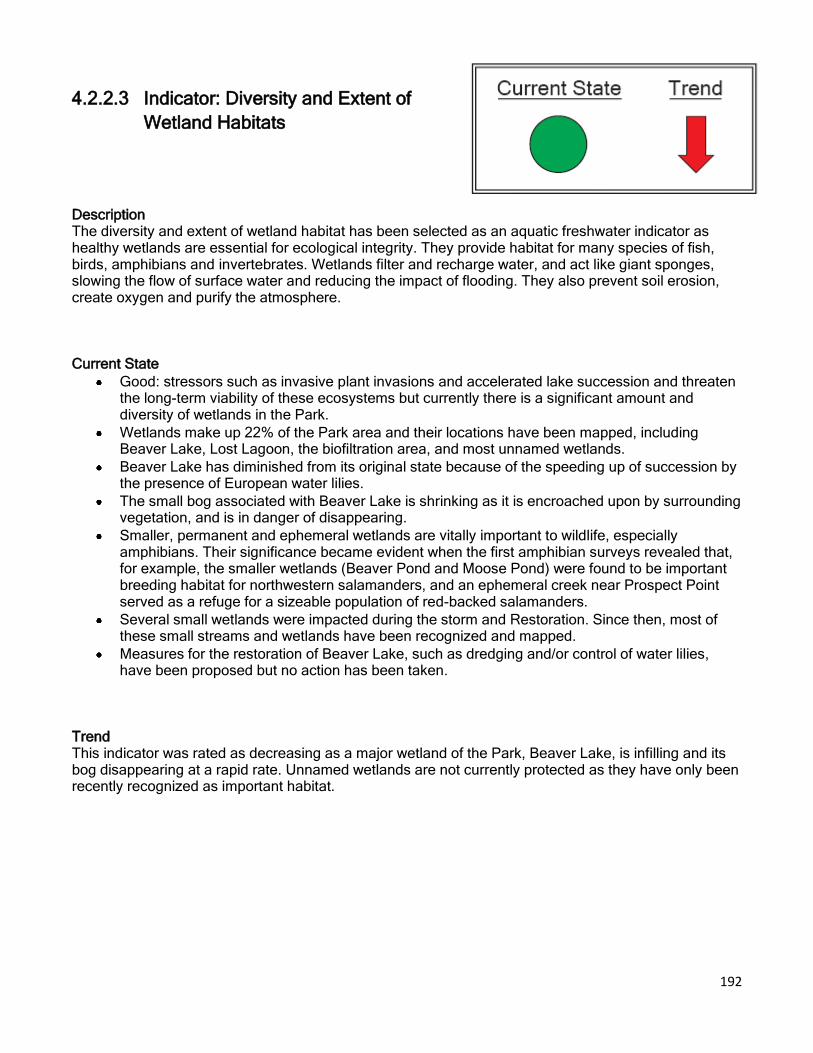
192
4.2.2.3 Indicator: Diversity and Extent of
Wetland Habitats
Description The diversity and extent of wetland habitat has been selected as an aquatic freshwater indicator as healthy wetlands are essential for ecological integrity. They provide habitat for many species of fish, birds, amphibians and invertebrates. Wetlands filter and recharge water, and act like giant sponges, slowing the flow of surface water and reducing the impact of flooding. They also prevent soil erosion, create oxygen and purify the atmosphere. Current State
Good: stressors such as invasive plant invasions and accelerated lake succession and threaten the long-term viability of these ecosystems but currently there is a significant amount and diversity of wetlands in the Park.
Wetlands make up 22% of the Park area and their locations have been mapped, including Beaver Lake, Lost Lagoon, the biofiltration area, and most unnamed wetlands.
Beaver Lake has diminished from its original state because of the speeding up of succession by the presence of European water lilies.
The small bog associated with Beaver Lake is shrinking as it is encroached upon by surrounding vegetation, and is in danger of disappearing.
Smaller, permanent and ephemeral wetlands are vitally important to wildlife, especially amphibians. Their significance became evident when the first amphibian surveys revealed that, for example, the smaller wetlands (Beaver Pond and Moose Pond) were found to be important breeding habitat for northwestern salamanders, and an ephemeral creek near Prospect Point served as a refuge for a sizeable population of red-backed salamanders.
Several small wetlands were impacted during the storm and Restoration. Since then, most of these small streams and wetlands have been recognized and mapped.
Measures for the restoration of Beaver Lake, such as dredging and/or control of water lilies, have been proposed but no action has been taken.
Trend This indicator was rated as decreasing as a major wetland of the Park, Beaver Lake, is infilling and its bog disappearing at a rapid rate. Unnamed wetlands are not currently protected as they have only been recently recognized as important habitat.

193
4.2.2.4 Indicator: Connectivity Between
Freshwater Habitats
Description At the scale of Stanley Park, the connectivity indicator is used to indicate natural linkages between existing water bodies and streams. Connectivity between these features is vital for the life cycles of many aquatic organisms, and for the health and resilience of aquatic ecosystems in general. Developments such as roads lead to the loss of habitat size and quality due to fragmentation. Current State
Poor: the park is extensively fragmented by roads and trails.
Roads such as the Causeway present a major barrier to wildlife movement and are a source of mortality for species such as amphibians which need to move between habitats during part of their life cycle.
There is little remaining natural linkage between the Park‘s aquatic habitats, since most streams associated with wetlands have been culverted and/or blocked, thereby altering natural flow patterns.
The inadequate size and/or poor placement of culverts often results in their avoidance by wildlife. For example, the culvert that exists between Beaver Lake and Beaver Creek currently presents a major barrier to fish migration. On the positive side, guidelines for culvert construction to accommodate wildlife movement and passage have been discussed, and the post 2006-storm Restoration on Cathedral Trail included the creation of ‗amphibian-friendly‘ culverts, which provided for proper drainage as well as the movement of these species. However, there are no baseline data on fish and wildlife movement within the Park to date, including an assessment of important crossing areas, behaviors, and frequencies. The effect of the large number of existing culverts on connectivity and wildlife movement is yet to be determined.
Trend This was rated as stable since this issue is now being recognized, some action was taken during the Restoration to design culverts usable by wildlife, and further enhancement initiatives are being planned. However further study is needed to assess the effect of roads and culverts on wildlife movement within the Park.

194
4.2.2.5 Indicator: Diversity of Structure in
Freshwater Habitats
Description In-stream and wetland structure includes rocks, boulders and woody debris in varying sizes and configurations. Structure plays a vital role in energy flow, nutrient dynamics, and stream morphology. It is important for water quality and ensures a variety of habitats for many species dwelling in streams and wetlands, including fish and a diversity of aquatic invertebrates. Current State
Poor: stressors such as Park maintenance operations and altered successional patterns have adversely affected the degree of structure in freshwater aquatic habitats.
Diversity of structure in aquatic environments is especially low in the Park‘s major wetlands, Lost Lagoon and Beaver Lake, but is present in most of the creeks and small wetlands. Beaver Creek and the artificial salmon stream have been enhanced with instream habitat complexing features, but there is a scarcity of Coarse Woody Debris (CWD) in Beaver Lake and resting and nesting habitat on Lost Lagoon.
Small islands and floating logs were added to Lost Lagoon and they are used extensively by birds as resting areas.
Nesting boxes have been added around Lost Lagoon and Beaver Lake to provide suitable cavity-nesting habitat.
Until recently, large woody material which had fallen into Beaver Lake was removed.
Dead standing snags are considered hazardous to humans when they are near park trails and roads, and since wetlands like Beaver Lake and Lost Lagoon are surrounded by trails, many dead trees have been removed from these riparian areas. However, the new Forestry Management Plan outlines procedures for dealing with fallen CWD around ‗natural areas‘ which includes forest water bodies like Beaver Lake.
The recent arrival of beavers (at least one in both Lost Lagoon and Beaver Lake) has helped provide for structural diversity by increasing amount of large woody material on the banks and in the water.
Trend This was rated as increasing since specific provisions are being made for aquatic habitat structure in the new Forestry Management Plan, and logs and nesting boxes have been put in place as additional habitat in various stewardship initiatives.

195
4.2.2.6 Indicator: Diversity and Abundance of
Indicator Species in Freshwater
Habitat
Description Indicator species are organisms which, by their abundance, can be used to measure environmental quality. Algae, fish and aquatic invertebrates can conveniently be used to assess the ecological health of a water body or stream including changing water quality conditions or contamination. For example, algae in aquatic systems serve as important indicators of organic pollution and nutrient (nitrogen and phosphorus) loading. Some aquatic worms can tolerate low oxygen in water, whereas other species such as mayflies and stoneflies require well-oxygenated conditions and unpolluted waters. Amphibians also very sensitive to environmental pollution and therefore also serve as valuable indicator species. Current State
Fair: while Lost Lagoon has a low diversity and abundance of indicators species, Beaver Lake contains many indicators of good water quality.
Beaver Lake contains macroinvertebrates such as caddisflies and mayflies which are indicators of a relatively healthy aquatic environment. A study conducted in 1999 in Beaver Lake found 24 phytoplankton genera, including some which are indicators of pollution and eutrophication, but the abundance of zooplankton indicated that the lake was productive. Aquatic invertebrate inventories in 2007 and 2008 yielded a variety of insects including caddisflies, mayflies, dragonflies, damselflies, Diptera and Hemiptera.
In 1998, macroinvertebrates at Beaver Creek were found to be more abundant than at Prospect Creek, but both creeks were similar in the diversity of species.
Salmonids, which require cool, oxygenated waters, have inhabited both Prospect Creek and Beaver Creek, but there is little salmonid habitat in Beaver Lake.
Beaver Lake (and Lost Lagoon) fish populations are now predominantly composed of the native threespine stickleback and brown bullhead along with the introduced common carp which has become invasive in the lagoon.
The number of native species of pond-breeding amphibians in the Park has dropped. Pacific tree-frogs and red-legged frogs that once were found in the major waterways are now considered extremely rare or extirpated from the Park.
Native frogs have been replaced in Beaver Lake in the 1980s by introduced bullfrogs and green frogs. Bullfrogs are also very common in Lost Lagoon, and the first sighting of a green frog in the lagoon was made in September 2009.
Studies at Beaver Lake and smaller wetlands revealed that they were important breeding sites for northwestern salamanders.
Historically, Beaver Lake was predominated by the native yellow pond lily and buckbean, but these species are being outcompeted by invasive water lilies and iris species.
The blue-green algae blooms regularly seen each year in mid-late summer in Lost Lagoon are an indication of high nutrient levels and compromised water quality
Trend This indicator was rated as decreasing, which coincides with the decreasing trend for aquatic habitat diversity and extent. The diversity and abundance of indicator species in Beaver Lake appears good but no action has been taken regarding the spread of invasive water lily. More long-term studies are needed to assess these species in Lost Lagoon.

196
4.2.2.7 Indicator: Diversity and Abundance
of Native Intertidal Species
Description Intertidal species are those that live between the low and high tide lines. At low tide, these organisms are exposed to the air whereas at high tide, they are submerged by water, and must therefore be able to live in both wet and dry conditions. They must be adapted to life in a highly variable and often harsh environment, coping with challenges such as desiccation, intense wave action, changes in salinity, and competition with other species. As edges between the land and the sea, intertidal zones are areas of high species diversity. They provide habitat for a variety of wildlife including shorebirds, waterfowl, and fish, as well as benthic invertebrates. Current State
Good: there is currently a high diversity and abundance of native intertidal species but stressors such as introduced species, pollution, and potentially, climate change, may affect these communities in the future.
Typical inhabitants of the intertidal rocky shore include shore crabs, mussels and barnacles.
Silty areas are inhabited by burrowing clams and polychaetes, as well as benthic organisms such as ciliates, crustaceans and nematodes.
Surveys done in 1991 in areas between Prospect Point, Brockton Point and Coal Harbour found a variety of invertebrates, including mollusks, sea stars, crabs, echinoderms, barnacles and amphipods. The highest species diversity was around Brockton Point, an area particularly rich in species (including poriferae and chordates), likely because its strong tidal currents reduce sedimentation and bring in nutrients.
Recent small surveys have shown that some intertidal species may be decreasing in abundance and diversity, while others are increasing (for example, pink stars and mussels).
Little is known regarding introduced intertidal species but a study recommended that varnish clam and green crab populations be monitored for presence and rate of spread.
There is little data available regarding the effect of pollution, off-leash dogs, or visitor use of intertidal areas on Stanley Park‘s intertidal life.
Trend This was not rated as little current information is available and more inventories are needed. Further studies are also required to anticipate the effects of new and developing stressors on intertidal communities and to assess how intertidal organisms will be able to adapt to new environmental conditions. Climate change is expected to result in an acceleration of sea level rise, flooding many low-lying coastal and intertidal areas. This could have important implications for organisms that depend on these sites, including shorebirds that rely on them for foraging during their migration and over the winter. Many species will be required to adapt to new developments in environmental conditions over relatively short periods of time. Invasive species may become more prevalent in intertidal areas with climate change as well as increasing volumes of shipping traffic in the Burrard Inlet.

197
4.2.2.8 Indicator: Diversity and Extent of
Intertidal Habitats
Description The intertidal zone is the area along the seashore that is exposed to the air at low tide and remains under water at high tide. This area includes a range of habitats, such as rocky shores, sandy beaches, and mudflats. Rocky shores are generally subjected to more intense wave action, requiring the associated organisms to attach firmly to rocks. Soft-bottomed habitats are usually more protected and tend to be inhabited by organisms that are adapted for burrowing. As edges between the land and the sea, intertidal areas are very high in species diversity. They are vital as foraging areas and refugia for many wildlife species and especially birds, and they also serve other key ecological functions such as nutrient cycling and carbon storage, and act as buffers against the fluctuating conditions of the tide cycle. Current State
Good: Stanley Park contains extensive and diverse intertidal habitats, despite habitat fragmentation due to the seawall and engineered fortifications to prevent erosion.
The rocky shores, sandy beaches, mudflats, silty areas and exposed bedrock have a range of hard and soft substrates including boulders, cobbles, sand, silt, and mud. Driftwood and erratic boulders found along the beaches also serve as additional habitat.
The Park has many sensitive intertidal habitats, including limited eelgrass beds, dune grass areas, large bull kelp beds, a small estuary and mudflat, and rocky shorelines with associated mussel beds.
At present, most habitats in the intertidal areas of the Park are disconnected from upland habitat by the seawall.
Most mudflats and associated clam-beds which once existed at Lost Lagoon are gone due to the construction of the Causeway. Such transitional zones would also have been found in areas such as Third Beach, Second Beach and Lumbermen‘s Arch prior to the building of the seawall.
One of the best intertidal habitat areas is found around Deadman‘s Island which unfortunately is not officially recognized as part of the Park. Although much of the perimeter is made of riprap, which is a poor substrate for intertidal organisms, it does have mudflats with eelgrass beds as well as areas of dunegrass, and is heavily used by many species of birds.
The sandy beaches of Stanley Park, which were created as recreational areas, are subject to erosion by wave action and are steadily decreasing in size. Sand has been pumped onto Second and Third Beach in 1973 and 1988 in an attempt to compensate for the loss of beach area.
Trend This indicator was rated as stable because these habitats are not under any immediate threat and few actions have been taken to enhance them. However, intertidal habitats are sensitive to a variety of factors ranging from localized human impacts to the larger scale, less predictable effects of climate change. The latter may include increased temperatures, sea level rise, and an increase in the severity and frequency of storms, and could have far-reaching consequences on the Park‘s intertidal habitats. Some severe losses of these habitats could occur in sites where the current coastline is prevented from moving inland because of steep cliffs or the seawall. Further monitoring is required to address these concerns.
198
4.2.2.9 Indicator: Degree of Connectivity
between Intertidal and Upland
Habitats
Description Connectivity is essential for the proper functioning of ecosystems, including nutrient cycling and productivity. In this context, the connectivity indicator is used to indicate natural linkages between the Park‘s intertidal zone and upland areas (those above the high tide line). Connectivity is essential between intertidal areas and the upper parkland to provide foraging and movement corridors for many species of birds and other wildlife. These connections are important to the proper functioning of food webs, nutrient flow and productivity between these interdependent habitats. Current State
Poor: there is disrupted connectivity between much of the intertidal and upland areas in the Park resulting in habitat loss and fragmentation, mostly due to the seawall which runs along most of the of the Park‘s shoreline.
The seawall has modified the natural tidal flow, drainage, sedimentation patterns, and ultimately, the ecological productivity of these areas. In addition, the creation of the seawall has caused some of the natural shore habitat to be lost or divided into small fragments which makes them more vulnerable to potential human impacts.
The edge habitat between the parkland and its marine areas is important for a host of species of wildlife in the Park. For example, bats forage over the intertidal areas such as those near the Beaver Creek outflow, and roost in the nearby forest. Gulls and bald eagles perch on upland trees and move to the shores to forage or scavenge – their wastes in turn becomes nutrient sources for intertidal organisms.
There has been no research done of the effects of disrupted connectivity and fragmentation on the various species using these areas. It is likely that ground-dwelling animals are more restricted by the lack of connectivity imposed by the seawall, however species like river otter and mink who den in the forest and forage along the Park‘s shores have compensated by using suitable culverts as corridors.
Trend This indicator was rated as stable, as there are no plans to increase the extent of the seawall nor are there are any plans to increase connectivity between these habitats. The possible effects that this disruption of connectivity has on organisms that use these areas needs further study. It is uncertain what the potential impacts are in terms of native biodiversity and what changes may occur as a result of climate change.
199
4.2.3 Terrestrial Ecosystem Indicators
4.2.3.1 Indicator: Natural Soil Quality
Description Soils are basic to biological processes and are a fundamental component of the forest ecosystem. They provide nutrients and substrates for plant growth, filter the air and water, and are habitat for many organisms including those responsible for nutrient cycling. They are composed of air, mineral particles, water, living organisms (fungi, bacteria, animals) and dead organic matter. Soils contain a large diversity of organisms and can be damaged through erosion, compaction, or pollution especially in wet areas or along steep slopes. Such damage to soil habitats change the microclimate and ultimately affect the organisms, from the soil biota to others further up the food chain, and takes many years to recover. Current State
Fair: the quality of natural soils in Stanley Park is vulnerable to continuing impacts from introduced species, habitat degradation due to roads / trails, off-trail activities, and park maintenance operations causing compaction, erosion, and changes to nutrient regimes.
The glacial till that underlies Stanley Park is not very permeable and with the sloping topography, most soils are poorly drained. Like most coastal BC soils, they are generally acidic and low in nutrients, although the treed swamp areas are identified by rich, organic soils. Extremely wet, nutrient rich soils in the Park serve as a unique habitat for water-loving plant species and a critical refuge for terrestrial amphibians and other species in the dry summer months. Swampy soils are particularly sensitive to compaction and are considered high quality habitat for Species at Risk such as red-legged frogs and Pacific water shrews.
The major causes of soil damage in the Park occur as a result of compaction from off-trail activities, erosion, and invasive plants.
Off-trail bicycle use is a widespread problem and is creating an array of new trails. The increased access into the forest results in increasing soil compaction and vegetation trampling.
The extensive illegal activities occurring in the Park have led to the complete removal of understory vegetation and soil compaction in some areas (such as south Rawlings Trail). These problems have a significant impact on the Park‘s ecology and the localized damage of habitat is evident.
Some efforts have been made to decommission unsanctioned trail sites and bicycle jumps but they have had a minimal impact and no soil or vegetation rehabilitation has been undertaken to date.
During the Restoration there were specific prescriptions for soil management put in place regarding the use of appropriate equipment and practices to minimize detrimental soil disturbance (primarily compaction), and special care was taken in wet areas.
The ecological effects of bringing new soils into the park have yet to be investigated, in particular with respect to the possible contamination with weed species and non-native invertebrates.
Trend This was rated as decreasing because although the new Forest Management Plan has made some provisions to protect soils from disturbances during maintenance operations in specific instances, extensive off-trail activities in the Park have yet to be addressed.
200
4.2.3.2 Indicator: Diversity of Species and
Successional Stages in Forest
Stands
Description The forest in Stanley Park is made up of different of stands of trees that vary in terms of their successional (seral) stage and species composition. Forest succession is the natural change from one tree species composition to another over time. Each stage of succession sets up the conditions for the next stage as temporary plant communities are gradually replaced by more stable communities until a climax forest stage is reached. In Stanley Park the climax forest is part of the Coastal Western Hemlock (CWH) zone. The species of animals using these different forest types reflect the different plant species and structure each type provides. For example, a young deciduous forest can provide increased habitat for animals relying on berry-producing shrubs while an older conifer forest may provide seed cones and wildlife trees. A diversity of seral stages and species in forest stands in Stanley Park increases biodiversity and forest resilience. Current State
Good: there are a variety of forest stands and a diversity of tree species in the Park.
The youngest seral stage is now common in the Park since the winter windstorms of 2006 created new openings in the forest. These areas were planted with conifers and the stands will reach maturity sooner than natural succession would have allowed, but they were planted in clusters so that deciduous trees and shrubs would exist and the increased biodiversity they provide would be maintained.
The forest stands planted in 1962 are the least healthy and diverse forested areas of the Park because they were planted too densely with only one species and support the lowest diversity of wildlife.
The mature forest stands are relatively healthy but may have elevated dwarf mistletoe and lower CWD levels due to their unnatural start as a result of logging.
There are no intact old growth forest stands in Stanley Park, but it has retained a fair number of veteran and wildlife trees so parts of the forest have characteristics of this stage.
There are a few remaining deciduous stands representative of the pioneering seral stage in the Park and these were planted with conifers during the 1990s. A new deciduous stand was planted during the 2008 Restoration.
There are several areas of mixed stands containing mature bigleaf maple trees and there is a wide variety of tree species in the Park, especially conifers.
Some tree species that had been lost or diminished due to forest pests in the past have been encouraged in recent years (e.g., white pine and Sitka spruce).
Trend This indicator was given an increasing trend because of the new appreciation of the importance of forest succession and species diversity in the new Forest Management Plan. The recent creation of early seral stages through windstorms and planting has increased the diversity of stages as well as species in the Park. The shrub layer and deciduous stands that had previously been negatively impacted by forest practices are now encouraged and planted. Although there are no intact areas of old growth in pristine condition and concerns have been raised over the health of the veteran trees, mature forest stands existing in the Park now represent the future recruitment of these important areas.

201
4.2.3.3 Indicator: Diversity and Quality of
Terrestrial Habitat Types
Description The terrestrial ecosystems in Stanley Park are composed of the community of organisms and their environment which occurs on the land and not in the wetlands, streams or surrounding ocean. In this report, the habitat types have been defined as the forest stands that are at a variety of ages and species composition, riparian areas adjacent to water bodies and streams, ecotones, rocky outcrops and surficial geology, and cultivated areas. A diversity of quality habitats in terrestrial ecosystems provides resilience against environmental changes and allows for a diversity of organisms to maintain ecosystem function. Current State
Good: there is a diversity of terrestrial habitat types existing in the Park but these may be threatened in the future from a variety of stressors including introduced species, climate change and Park maintenance operations.
The diversity of forest types is based on their successional stage and stand species composition, includes one old-growth stand, mature conifer stands, young conifer stands, mixed conifer and deciduous stands, and pure deciduous stands.
Riparian areas and ecotones are areas where two habitat types meet and so they are especially high in diversity. The limited supply of riparian areas in the Park (due to natural hydrology) may be aggravated by the presence of roads and trails.
Rocky outcrops and surficial geology such as the cliffs above Prospect Point provide a unique habitat for specialized species. These areas have been altered due to persistent failures during the Restoration and may be subject to ongoing disturbance.
The cultivated areas of the Park, although unnatural, do provide some habitat. Lawns, gardens, and treed grassy areas are all utilized by a variety of species including ducks, hummingbirds, and moles.
Most of the deciduous patches in the Park have been planted and will follow succession into conifer forests in time. One small cleared area in the Park was planted with deciduous species following the Restoration in 2007, but no other significant patches are likely to be recruited as future deciduous stands.
Skunk cabbage habitat in the Park was protected during the Restoration but it remains sensitive to human disturbances and alterations to hydrology.
Some terrestrial habitats in the Park have been designated as Environmentally Sensitive Areas (ESAs) because they are particularly rich in species diversity and abundance or because they are a rare habitat type in the park. These include: riparian areas, rocky outcrops, ecotones, deciduous forest patches, old-growth forest patches, steep slopes and skunk cabbage swamps.
Trend This indicator was given a stable trend because there are both positive and negative influences on the diversity of habitats at this time. Following the 2006 windstorm, young forest stands were created and one area was planted with deciduous trees to combat the need for future deciduous stands. The subsequent Forest Management plan zoned many of the important habitats as ‘Wildlife Management Emphasis Areas‘ and gave them added protection as important habitat components. Invasive plants are having a negative impact on habitat diversity in the Park, but removal and restoration programs are helping to prevent the spread of many of these species.

202
4.2.3.4 Indicator: Connectivity between
Terrestrial Habitats
Description The intensification of land use can lead to the break-up of large areas of habitat into small, isolated patches, which are often then subjected to high levels of disturbance from a variety of human activities. Such fragments are often too small to support viable populations of many plant and animal species, and their movement within or adjacent to these areas is disrupted. This especially affects the dispersal of plant spores, pollen and seeds, and the movement of small mammals and of breeding forest birds. Other negative effects of fragmentation include changes in microclimate and species composition, loss of gene flow resulting in inbreeding, increased competition and predation, and degradation of the existing habitat due to edge effects and exotic species invasions. Overall, habitat fragmentation can have serious impacts on an ecosystem‘s function and biodiversity. The long-term viability and resilience of the remaining fragmented populations must be secured through the establishment of ecological connectivity, including corridors linking isolated habitat patches to support ecological flow. Current State
Poor: the Park is an isolated patch of forest which has been further fragmented by roads and trails. It may be impacted by an array of edge effects which may be further exacerbated by climate change.
Stanley Park is bordered on all sides by ocean or human development so the only wildlife types able to enter or leave the park are those that can fly or swim. This means that the genetic diversity of small mammals, reptiles, and amphibians in the Park is likely limited since the chance of new individuals finding their way into the Park is low.
Past and present human influences on the Park‘s landscape include developments such as roads and trails, which have had a significant impact on wildlife and habitat in the Park, including habitat loss, habitat fragmentation and barriers to movement. Perhaps the most dramatic changes to the Park‘s ecology came as a result of the creation of its major roads (Park Drive, Pipeline Road and the Causeway) as well as the seawall.
Trails have a less severe impact on the movements of wildlife species but, unfortunately also lead to increased off-trail activities, resulting in further habitat loss and small-scale fragmentation.
To date, there have been no specific studies on the effects of fragmentation in the Park.
There are no plans for a net increase in roads and trails and no actions have yet been taken to decommission and restore trail areas.
Trend This indicator is rated as stable because there are no plans for the creation of further roads, nor are there are any plans as yet to increase connectivity between these habitats. The effects of the disruption of connectivity on organisms that use these ecosystems are not well understood and require further study. Fragmented populations may experience intensified pressure from unpredictable novel environmental events as a result of changing climatic conditions. As conditions change species will increasingly need to able to move across the landscape to stay within the habitat they require. Species at Risk may be especially imperiled from habitat loss and increased predation.

203
4.2.3.5 Indicator: Diversity of Habitat
Structure
Description Forest habitat structure, or the spatial configuration of the forest, can be measured both in terms of the heterogeneity of habitat features as well as its vertical stratification. The vertical layers of the forest include the upper canopy, the understory of smaller trees and shrubs, and the ground or herbaceous layer. Each layer, with its own structural characteristics and microclimate, offers additional complexity to the forest resulting in a unique set of habitat features and a diversity of niches for wildlife and other species. Structural features such as wildlife trees (dead standing trees) and coarse woody debris (CWD) (such fallen dead trees, nurse stumps, and root wads), add heterogeneity to forest habitat, and provide many other ecosystem functions. Current State
Fair: the degree of stratification is generally high in the forest except for a few areas which are lacking in shrub and forb layers (e.g., old plantations and the damaged understory around south Rawlings Trail). CWD levels, the abundance of wildlife trees and other habitat structure elements increased as a result of the 2006 winter storms.
CWD was historically removed from the Park as it was considered unsightly and a breeding ground for insect infestations; however, its ecological benefits are now recognized by Park managers and CWD levels are at acceptable levels in blowdown areas.
Areas of the Park which were not affected by recent storms are generally low in the amount of CWD present. These amounts will likely increase in the future as the new Forest Management Plan has made provisions for its retention.
Many root wads resulted from the 2006 storm but most of them were overturned during the restoration and were only retained in areas when environmental monitors were on site (for example, near Cathedral Trail).
There are a large number of nurse stumps in the Park, mainly from logging in the 1860s.
The Park has many wildlife trees, especially after the 2006 storm. However these are still routinely removed for safety reasons around trails and roads. The new Forest Management Plan provides for the retention of standing snags where safely possible.
Off-trail mountain bike constructions such as jumps, beams, and ramps reduce and alter the forest floor structure as fallen trees and other woody material are collected and used in their creation.
English ivy threatens to reduce canopy layers as it smothers shrub and herb layers, but ongoing stewardship efforts have been made to remove ivy and restore these areas.
Trend This indicator is rated as increasing because of new provisions in the Forest Management Plan and since the invasives issue is being addressed through stewardship initiatives. The Forestry Management Plan provides for the retention of CWD and wildlife trees whenever possible and potential restoration of structure in some areas has been discussed (e.g., thinning old plantations). The Forest Management Plan also provides for the maintenance and enhancement of the shrub layer.
204
4.2.3.6 Indicator: Riparian Areas
Description Riparian zones are areas of mostly deciduous vegetation which are found directly adjacent to watercourses and water bodies. Riparian zones are frequently composed of a variety of habitats in close proximity, and due to their high diversity of plant species, wildlife use of these areas is high. Their linear structure makes them valuable as corridors for wildlife movement, and they are essential habitat to many species of wildlife especially water birds, migratory songbirds, small mammals, amphibians, fish and aquatic invertebrates. Riparian vegetation also performs other important functions such as improving water quality and absorbing CO2. Current State
Fair: although these areas are fairly well represented in the Park, they have been and continue to be impacted by introduced species, habitat degradation due to roads / trails, park maintenance operations and off-trail activities.
Riparian vegetation around Lost Lagoon is fair to limited except on the northeastern edge adjacent to the biofiltration wetland where it is excellent. This area is a constructed wetland and is important wildlife habitat, especially for many species of birds.
The west side of the lagoon has some riparian shrubs and trees, and is highly used by people and wildlife, especially migratory songbirds. Himalayan blackberry has overtaken large tracts of this area and some efforts have been taken by the Park Board to control it. This area has also been impacted negatively by off-trail use.
Beaver Lake contains a diversity of riparian plants but is impacted by the perimeter trail which effectively creates a dike around the lake, off-trail use, yearly brushing and invasive plants.
Moose Pond and Beaver Pond, two small wetlands and important breeding sites for northwestern salamanders, are semi-natural and have little to no riparian vegetation.
Within the Park, most streams flow in narrow, confined channels, and as a result have only a narrow band of typical riparian vegetation. Both Prospect and Beaver Creeks‘ riparian areas have been negatively affected by off-trail human use.
All of the Park‘s major wetland riparian areas have been colonized by purple loosestrife, yellow flag iris, and Himalayan blackberry (highly invasive plant species) and Beaver Creek has also been recently colonized by Japanese Knotweed.
Stewardship initiatives, such as removing invasive species and establishing or enhancing riparian vegetation along Beaver Creek and the artificial Salmon Stream in the late 1990s, have improved riparian conditions in these areas.
In the new Forestry Management plan, riparian areas are recognized as one of the Wildlife Management Emphasis Areas.
Trend This indicator was rated as stable because although there have been improvements in recent years, there is still cause for concern about the quality of riparian habitat in the Park. The threat of invasive plants, off-trail activities, and perimeter trails are causing ongoing degradation in these areas. Some improvements have been made including the creation of the biofiltration area, the control of invasive plants in some areas, and recognition of these areas as important for wildlife in the new Forestry Management Plan.
205
4.2.3.7 Indicator: Frequency and Severity
of Natural Disturbances
Description Natural disturbances are events that disrupt the vegetation and abiotic environment in an area. On the coast of BC frequent windstorms are the primary natural disturbance shaping forests. Small canopy gaps are most common and major, stand-replacing wind events such as the one that hit the Park in December 2006 are rare. Forest fires only occur in south coastal forests every 350-1000s of years (estimates vary). Tree diseases and insect defoliators only play a minor role in forest dynamics on their own, but they are an important factor when they interact with wind events. Natural disturbances result in changes to forest composition and structure and are essential in maintaining ecosystem health. Current State
Not rated: the Park‘s location in an urban setting makes it difficult to compare the natural disturbances influencing it to those typical for a natural coastal forest system. This indicator is subject to outside stressors such as climate change, altered successional patterns, and introduced plant species.
The Park has experienced a number of wind events in its history with major wind storms occurring in 1934, 1962, and 2006. Following these storms, much of the fallen tree mass was removed and the areas were planted.
During the 2007 Restoration an effort was made to simulate natural succession in blowdown areas by leaving a suitable amount of CWD on the ground and by replanting in patches with a diversity of trees. Also as a part of this restoration, windfirming of trees along the blowdown edges was performed to reduce the impact of future storms.
Smaller wind events occur seasonally and small groups of trees fall as a result. The removal of minor wind accumulations was at one time performed to maintain the perceived aesthetic quality of the forest. The new Forest Management Plan allows for natural succession to take place in areas where public safety is not a concern.
Since 1888 fire has been excluded as a management practice in the Park.
Insect infestations and tree disease have resulted in dramatic tree loss and defoliation the Park in the past, but they are now seemingly under control and monitored through insect trapping stations and visual inspection by Park staff.
Some local naturalists believe that there is a higher than normal incidence of Douglas-fir diseases in the Park, but more research is needed to determine if this is a threat to the integrity of the forest ecosystem.
Climate change is likely to significantly alter forest dynamics in the future and it is possible that the effects have already been felt with the most recent severe wind events.
Trend This indicator was given a decreasing trend because the Park will likely be negatively impacted by changes to forest dynamics as a result of climate change. The new Forest Management Plan for Stanley Park adequately addresses the role of natural disturbances and allows for some small-scale disturbance to take place. However, these disturbances will be controlled or mitigated if they pose a threat to the public. Climate change predictions indicate that we will see an increase in windstorm and forest fire severity and frequency due to changes in weather patterns as well as an increase in insect and disease outbreaks. The potential threat of damaging insect infestations is further elevated in the Park because of its close proximity to the Port of Vancouver which may be a source of introduced exotic pest insects.
206
4.2.3.8 Indicator: Number of Native Veteran
and Record Trees
Description Veteran trees vary in age depending upon their species and growing site. Smaller, shorter-lived tree species such as Pacific crab apple may be called veterans trees when they are only a few decades old, while conifers such as Douglas-fir may reach over 800 years. Veteran conifer trees in Stanley Park have been defined as those trees that survived logging and fires in the Park in the late 1800s. While close to 500 coniferous veteran trees have been identified in the park, only a handful of deciduous veteran trees have been documented. Record trees are those trees listed in Ministry of Forests and Range Big Trees of BC Registry. Veteran and record trees contain unique features (such as dead limbs, hollows, rot-holes, seepages, woodpecker holes, splits, scars and epiphytic plants and lichens) which are rarely found on young trees, and provide habitat for a variety of wildlife and plant species. Old-growth trees also help to support the gene pool and act as recruits for future wildlife trees. Current State
Good: there are a large number of veteran and record trees across Stanley Park.
The first inventory of record trees in Stanley Park was conducted in 1987. Those trees and several others are found in the BC Big Tree registry including five bigleaf maples, two red alders, and two vine maples. Other big trees documented in the late 1980s were included in the latest surveys and preliminary survey maps completed in 2009.
In 1989 a list was compiled describing the largest and tallest trees in the Park found during forest inventories, including the largest specimens from each of the major tree species.
A preliminary survey in 2008-09 aimed to map veteran conifer trees in the Park based on their size at DBH. The study resulted in 45 Douglas-fir, 36 western hemlock and 398 western red cedar veteran trees being documented and mapped.
One of the Environmentally Sensitive Areas designated in the Park includes a patch of veterans (the last remaining stand in the Park) near Pipeline Road. This area was also designated in the Forest Management Plan as a Wildlife Management Emphasis Area.
Veteran trees are well used by wildlife in the Park. All of the known barred owl nests are in veteran red cedar, the four bald eagle nests in the Park are all in veteran Douglas-fir, and northern flying squirrels have been documented using them as well.
Although a seemingly disproportionate number of these veterans remained standing during the winter storms of 2006, some did succumb to the wind, some fell in the following months, and several others were determined to be unsafe and were felled during the Restoration (especially near Prospect Point).
Local naturalists have raised concerns about the health of the veteran trees in the Park, but more research is needed.
Trend The number and distribution of veteran and record trees in Stanley Park is thought to be stable but there is concern regarding their long-term viability in the Park. All of these old veterans are in the later stages of life and are subject to insects, disease, and windthrow. They will not last forever, but if there is an increased spread of forest pathogens perhaps they will disappear sooner than expected. Since many have now been mapped and documented, tracking their persistence in the Park is now possible. A new generation of veteran and record trees is being cultivated in the Park and there are likely to be more veterans in the future.
207
4.2.4 Native Biodiversity Indicators
4.2.4.1 Indicator: Species Richness
Description Species richness is the total number of different native plant and animal species inhabiting the Park. It can be influenced by ecological factors such as the productivity of the habitat or the incidence of natural disturbances and stressors on the environment. Long-term environmental changes from stressors such as climate change, pollution or forest fragmentation can cause vulnerable species to be reduced or eliminated resulting in a simplification of species diversity. Species richness is integral to natural cycles and maintains stability in ecosystems making them less vulnerable to extreme events, pests, disease and changing climatic conditions. Current State
Fair: there is concern regarding this indicator because of stressors such as introduced species and climate change.
Some species groups seem to be in decline and others have no data available.
There are at least 266 native terrestrial plant species, 36 species of marine algae and seagrasses and 368 ornamental plant species.
There are at least 361 species of native vertebrates and 192 genera of native invertebrates on record for Stanley Park.
20 native species have been locally extirpated, most recently many of the native amphibians and reptiles.
Over 30 species of birds that once were abundant in the intertidal areas and wetlands of the Park are now thought to be in serious decline.
There have been population declines in most of the native pond-breeding amphibians and reptiles.
Fish species diversity has declined in Beaver Lake and recent intertidal surveys may indicate declines for marine invertebrates in the area.
There are no long-term data available for the Park‘s invertebrate species, but there are at least two invertebrate (CDC listed) Species at Risk (SAR) currently in the Park.
Recent plant inventories indicate that native plant species composition has remained fairly stable since the Park‘s creation, but it is likely that some of the more sensitive species (such as certain bryophytes, orchids, and algae) have been lost.
There are over 50 invasive species to the Park (including 13 vertebrates, 37 plants, and more than 46 invertebrates) which have increased overall species richness, but have likely influenced the decline of indigenous species.
Trend This indicator was given a decreasing trend, although there is a lack of long-term baseline information for many species and it is difficult to assess declines in most cases. There are rare species that exist across most taxonomic groups on record for the Park, and exotic plants and animals have invaded most of the Park environment. Several native species have been locally extirpated in recent years and few attempts have been made to recover declining populations. In the face of changing climatic conditions, more study is needed to gather baseline data on the species richness of several groups including bats, reptiles and small mammals.
208
4.2.4.2 Indicator: Number and Extent of
Invasive Plant and Animal Species
Description Invasive exotic plants are species that have been introduced by humans, are outside their natural geographic range and pose undesired or negative stresses on native biota and ecosystems. These species are able to spread quickly, grow rapidly, and thrive in their new environments, resulting in impacts to environmental, economic and social systems and represent one of the greatest threats to biodiversity in the world today. Current State
Poor: the Park contains a large number of invasive plants and animals and stressors such as soil disturbance and climate change have further exacerbated the problem.
Three of the Park‘s invasive plants and four of its exotic animals are currently listed by the International Union for Conservation of Nature as being in the ‗top 100 worse invasive alien species in the world‘ (Lowe et al., 2000).
There are currently at least 50 documented invasive species that have become established in the Park including at least 37 plants, 4 rodents, 5 birds, 1 reptile, 2 amphibians, 2 fish, and 46 invertebrates.
Some of the exotic animal introductions occurred deliberately early in the Park‘s history (e.g., grey squirrels), others have occurred as a result of being unwanted pets (e.g., red-eared slider turtles), and the rest are species that have spread with urbanization across the continent (e.g., European starlings).
Of the 37 plants there are 15 trailside weeds (of minor concern because they tend not to spread into forested areas) and 3 wetland plants.
The most potentially serious colonization‘s include fast spreading and harmful plants such as Japanese knotweed (Polygonum cuspidatum), purple loosestrife (Lythrum salicaria), and English ivy (Hedera helix).
Invasive plants have arrived from a variety of sources including: seeds dropped into the forest by birds, nursery soils, landscaping plants, or transported on contaminated shoes, tire treads, or paws.
Locations of most of the invasive plants (aside from trailside weeds) are identified on preliminary maps, but an accurate estimate of their percent cover within the Park landscape is undetermined.
These species thrive in disturbed areas and most are concentrated in areas such as trail sides, unsanctioned trails, maintenance areas, and dump sites in the Park.
During the 2007 Restoration, efforts were made to reduce the spread of these species during operations, but much of the interior forest area that was previously relatively unaffected by weeds was also opened up and disturbed.
The new Forest Management Plan recognizes the need for invasive species management in the Park to mitigate the increased threat in these areas. However, resources to do this are at present limited.
Trend This indicator was given a stable trend. Baseline data has been collected on most plant species and best management practices for each have been added to the Forest Management Plan, but more monitoring is needed. SPES stewardship programs involving community volunteers in collaboration with the Park Board have made progress with some species of plants, but there are many more that have not yet been adequately addressed. No attempt has yet been made to deal with exotic animals species and this work will be an ongoing challenge.
209
4.2.4.3 Indicator: Wildlife Species
Productivity
Description Wildlife productivity can generally be defined as the number of individuals recruited into a population in a given time period (e.g., each breeding season). Productivity is an important part of understanding wildlife population dynamics. Current State
Fair: stressors such as edge effects and loss of habitat connectivity resulting from habitat fragmentation may be negatively effecting the Park‘s wildlife populations.
This indicator is of concern in the Park because there have been so few studies on wildlife productivity to date and exotic introduced species may be causing undetected problems.
There is little productivity data for wildlife species in the Park and no data for mammals, reptiles, fish, and most invertebrates.
There is some long-term productivity data for great blue herons and bald eagles. The productivity of these species was considered to be very high around 2004-2005 but has dropped slightly in the last few years.
Barred owl nesting has been monitored closely by local naturalists and their population seems to have increased in recent years, however this species may have a negative effect on smaller owls.
Baseline information has been collected since 2007 on invertebrates, pond-breeding amphibians and breeding birds in the Park so that trends may be determined in future years.
The effect of habitat fragmentation on local bird populations has not been studied, but data exists for similar situations in other areas. The high population of crows in the Park as well as the more recent arrival of European starlings, house sparrows, and brown-headed cowbirds may already have been detrimental to our local breeding birds.
Some populations of land-locked species may be experiencing inbreeding depression, but there is no data available on this for the Park.
The recent local extirpation of some of the Park‘s amphibians and reptiles may be attributed to exotic species, disease, or changes in climate and these factors may be acting more slowly on wildlife further up the food web.
Recent habitat enhancements and monitoring programs may give insights into swallow, wood duck, bat, and mason bee productivity in the future, but they have only just begun. Almost nothing is known about the current state of productivity in mammals, reptiles, fish, and most invertebrates.
Trend The trend for this indicator is not rated because of a lack of information. Monitoring programs initiated in recent years may provide insight for the future, but long-term data is not currently available. It appears that some selected wildlife populations may be stable or increasing while others may be decreasing. More research and time is needed to determine the productivity of the Park‘s wildlife.

210
4.2.4.4 Indicator: Genetic Diversity within
Species
Description An essential component of biodiversity is genetic diversity which is the degree of variation in all the genes for all individuals within a species. Genetic variability within a species allows for evolution and adaptation to changing environmental conditions. Without genetic diversity, species are less resilient and are more likely to go extinct or face local extirpation. Current State
Fair: there is concern that stressors such as habitat fragmentation and the loss of habitat connectivity has negatively impacted select groups of organisms in the Park.
There have been no research studies in Stanley Park on the genetics of animals or plant populations. We have no information about how animals and plants in the Park have been affected by the isolation resulting from the separation of the Park from a contiguous forest landscape.
There are several assumptions we can make: o Low immigration and emigration rates are expected for land-locked species (such as
small rodents and amphibians) and so there is likely to have been little genetic mixing between the populations within and outside the Park.
o Birds, fish, bats, flying insects, wind-pollinated plants, and other flying or airborne organisms may be less affected and should be more genetically diverse because they can travel freely.
o Less numerous species that prefer not to leave the Park are expected to have decreased genetic diversity (e.g., flying squirrels).
o There may be barriers to gene flow within Park populations. For example, small ground dwelling animals that are not likely to cross roads or large trails (e.g., snails) will be isolated from individuals on the other side.
Trend This indicator has been given an undetermined trend because there is very little known about the state of genetics in populations and species inhabiting the Park. It is believed that some land-locked organisms may be negatively affected by the isolation of the Park from the larger forest ecosystem and they are experiencing decreased fitness (the ability to survive and reproduce) due to inbreeding. Some species may have been isolated further by the creation of roads, while others may be relatively unaffected. Since genetic diversity is such an important component of biodiversity, and it has not yet been addressed in Stanley Park, this indicator needs further study.
211
4.2.4.5 Indicator: Number of Species at Risk
and Extent of Park Area they Inhabit
Description Species at Risk (SAR) in Canada are native species that have been listed by the Minister of the Environment based on recommendations from the Committee on the Status of Endangered Wildlife in Canada (COSEWIC). Species listed under Schedule 1 of the Species at Risk Act (SARA) are extirpated, endangered or threatened in Canada and are afforded protection under the law. The Government of BC lists species that are imperiled in the province through the Conservation Data Center (CDC). In BC, Species at Risk are designated as either ―red listed‖ (extirpated, endangered, or threatened), ―blue listed‖ (special concern) or ―yellow listed‖ (secure). Species at Risk can be used as a measure of biodiversity and help to indicate where stresses are occurring on the natural system. Current State
Fair: there is pressure on SAR in the Park from a variety of stressors including introduced species, pollution, and climate change.
There are eight species which have been documented in Stanley Park and are listed on Schedule 1 of the SARA; five of these use the park regularly, two are incidental sightings and at least one is thought to be extirpated from the Park.
There are 32 species that have been seen in Stanley Park which are listed by the CDC (either on the red or blue list); 21 are known to inhabit and/or breed in the park, 4 are extirpated from the Park or extremely rare, and 7 were incidental sightings.
Several CDC listed species rely heavily on the Park for breeding or wintering including the Pacific great blue heron, surf scoter, barn swallow and double-crested cormorant. SARA listed Marbled murrelets and western screech-owls once commonly bred in the Park but are now rarely seen and have not been confirmed breeding for many years.
There are several species that are on record for the Park but we currently know little about their population status (e.g., Johnson‘s hairstreak butterfly, red-legged frog) and at least another four SAR that are not on record in the Park yet, but are found in similar areas (e.g., Pacific water shrew and Oregon forest snail).
The first field surveys aimed at locating SAR in Stanley Park were undertaken as a part of the 2007-2008 storm Restoration Plan. During the Restoration, potential shrew habitat and other features such as wetlands and wildlife trees were protected in the interest of SAR and a task force was created to mitigate damage to their habitat.
A comprehensive list and preliminary survey maps have been created by SPES for all species occurrences and habitat preferences in the Park (see Appendix 6).
Exotic invasives, such as red-eared slider turtles and American bullfrogs have put pressure on some of the Park‘s SAR in recent years, and may be the cause of the disappearance of some species such as the western painted turtle.
Trend This indicator was given a decreasing trend because five species that are listed on Schedule 1 of the SARA and were once common in the Park have declined or disappeared in the last 30 years. There are no specific directions in the Stanley Park Forest Management Plan for the protection of Species at Risk or their habitat. Ongoing monitoring programs undertaken by SPES aim to track some of these species including owls, amphibians, bats, and breeding birds, but many others are still very poorly understood (especially small mammals, invertebrates and plants).

212
4.2.4.6 Indicator: Population Status of
Keystone Species
Description A keystone species is one whose very presence contributes to a diversity of life and whose extinction would consequently lead to the extinction of other forms of life. These species play a critical role in maintaining and supporting the Park ecosystem. Two animals that are considered keystone species in Stanley Park are woodpeckers and beavers. Keystone species modify habitat on which many other species depend. Current State
Not rated: although these species exist in the Park, there have been no studies to document their population status.
The Park is used by all of the local varieties of woodpeckers including pileated, hairy and downy woodpeckers, northern flickers and red-breasted sapsuckers.
The largest woodpecker, the pileated woodpecker, is of particular interest because it provides large tree cavities that can be used by ducks, owls, squirrels and other large animals. Although this bird is regularly seen in the Park and recorded on breeding bird surveys, there are no records concerning its population status.
Dead trees in the Park are removed or modified if they are close to trails or roads due to the danger they pose to the public. This reduces habitat for these species especially since about 66% of the Park is composed of human transportation corridors and buildings.
Despite the large number of trails and roads, the Park has retained a significant amount of wildlife trees and many more were recruited as a result of the 2006 storms.
Historically, beavers that found their way into the Park every few years were usually trapped and removed to prevent damage to trees. However, since 2005 there has been a beaver in Lost Lagoon and in 2008 a beaver made its way into Beaver Lake (for the first time in nearly 60 years).
The current resident beavers have caused some damage to the trees but have also made improvements to the wetlands by dredging sediments, eating willows, and digging up invasive plants.
In 2008, the Park Board installed a pond leveling device to prevent the flooding of Beaver Lake and so that the beaver could coexist with other Park users.
Although there are beavers now in both of the major wetlands, they should be monitored because they may not persist (if a pair is not formed) or they may overpopulate (if a pair is formed) in the future.
The trapping and removal of beavers is still undertaken by Park staff in some cases. Trend This indicator was given a stable trend because it appears that these keystone species have persisted in Stanley Park for many years and some have recently taken up residence in the Park. Woodpecker populations appear healthy because the Park is home to a diversity of species and they are regularly observed breeding. However there have been no studies concerning the population status and long-term sustainability of these birds, so more research is needed to determine their population status. Beaver populations in the Park should be monitored to ensure that it remains in balance with the small amount of wetland habitat that is available.
213
5 Future Directions and Recommendations
The Stanley Park Ecology Society created this report to compile baseline information about Stanley Park‘s ecosystems and determine the current state and future trend of key indicators of environmental integrity. In doing so, we hoped that it would become evident where the major gaps in ecological knowledge lie in our understanding of the Park and where we should focus our environmental conservation and educational efforts. The preparation of this report was undertaken with the understanding that not all of the data needs have been met and many of the measures for assessing the environmental integrity of the Park have not yet been determined. However, as a first step towards improving our understanding of the Park‘s natural ecology and working towards the goal of ecological integrity, the following recommendations were made to guide SPES‘s conservation activities in the Park in the coming years.
5.1 Gap filling Initiatives: Baseline information Gathering Uncovering gaps in information is a necessary exercise in being able to understand the ecology of Stanley Park. In the past, information had been gathered through Park Board commissioned surveys and academic research projects, and more recently, SPES‘s collaborative research initiatives and local knowledge. The following list of identified baseline information needs will guide SPES‘s future conservation research programs involving volunteer programs and partnerships with academic institutions and local biologists.
Aquatic Ecosystems Inventories of the unnamed creeks and wetlands.
The effect of beavers on the Beaver Lake and Lost Lagoon wetlands.
The effect of marine contaminants, off-leash dogs, or visitor use on intertidal species and habitats.
The health of the marine ecosystem and species biodiversity in the nearshore sediments around the Park.
The effect of broken connectivity between intertidal and upland areas.
Terrestrial Ecosystems The extent and effects of impervious areas (covered in asphalt, concrete, and stone) in the Park.
The extent of areas impacted by off-trail uses.
The effects of habitat fragmentation and isolation on biodiversity due to the Park‘s location as well as from roads and trails.
The ecological effects of bringing new soils into the Park.
The effect of roads, trails and the seawall on wildlife movement within the Park.
The percent cover of invasive species and their ecological effect within the Park.
Native Biodiversity The species diversity of bats, small mammals and reptiles in the Park.
The population status of the Park‘s insectivores, bats, mustelids, and small mammal species.
The population status of the Park‘s pond-breeding and terrestrial amphibians, as well as reptile species.
The population status of Species at Risk and keystone species living in the Park.
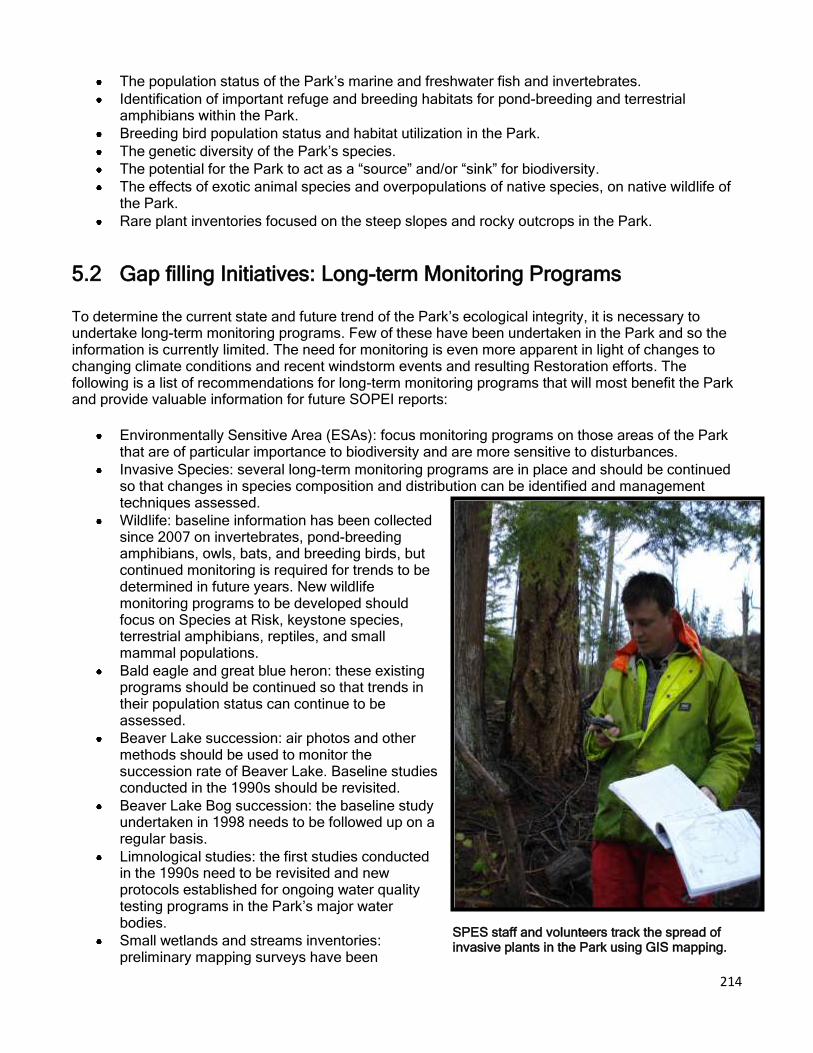
214
SPES staff and volunteers track the spread of invasive plants in the Park using GIS mapping.
The population status of the Park‘s marine and freshwater fish and invertebrates.
Identification of important refuge and breeding habitats for pond-breeding and terrestrial amphibians within the Park.
Breeding bird population status and habitat utilization in the Park.
The genetic diversity of the Park‘s species.
The potential for the Park to act as a ―source‖ and/or ―sink‖ for biodiversity.
The effects of exotic animal species and overpopulations of native species, on native wildlife of the Park.
Rare plant inventories focused on the steep slopes and rocky outcrops in the Park.
5.2 Gap filling Initiatives: Long-term Monitoring Programs To determine the current state and future trend of the Park‘s ecological integrity, it is necessary to undertake long-term monitoring programs. Few of these have been undertaken in the Park and so the information is currently limited. The need for monitoring is even more apparent in light of changes to changing climate conditions and recent windstorm events and resulting Restoration efforts. The following is a list of recommendations for long-term monitoring programs that will most benefit the Park and provide valuable information for future SOPEI reports:
Environmentally Sensitive Area (ESAs): focus monitoring programs on those areas of the Park
that are of particular importance to biodiversity and are more sensitive to disturbances.
Invasive Species: several long-term monitoring programs are in place and should be continued so that changes in species composition and distribution can be identified and management techniques assessed.
Wildlife: baseline information has been collected since 2007 on invertebrates, pond-breeding amphibians, owls, bats, and breeding birds, but continued monitoring is required for trends to be determined in future years. New wildlife monitoring programs to be developed should focus on Species at Risk, keystone species, terrestrial amphibians, reptiles, and small mammal populations.
Bald eagle and great blue heron: these existing programs should be continued so that trends in their population status can continue to be assessed.
Beaver Lake succession: air photos and other methods should be used to monitor the succession rate of Beaver Lake. Baseline studies conducted in the 1990s should be revisited.
Beaver Lake Bog succession: the baseline study undertaken in 1998 needs to be followed up on a regular basis.
Limnological studies: the first studies conducted in the 1990s need to be revisited and new protocols established for ongoing water quality testing programs in the Park‘s major water bodies.
Small wetlands and streams inventories: preliminary mapping surveys have been
215
conducted and some of the streams were inventoried in the 1990s. Regular monitoring needs to be undertaken in these areas.
Aquatic indicator species: protocols for water quality monitoring with the use of aquatic indicator species in the Lost Lagoon biofiltration wetland were developed but never used. Such protocols need to be updated and implemented.
Intertidal species and habitat monitoring: some baseline data exists to facilitate ongoing monitoring of species and habitat diversity and quality; regular, long-term monitoring is required.
Introduced intertidal species: preliminary searches for invasive varnish clam and green crab were conducted once, but this should become a regular monitoring program.
Veteran trees: many of these trees have been mapped but there is concern for their long-term viability and so monitoring is needed.
Exotic insects: suggestions have been made to create a community-based program in collaboration with the Canadian Food Inspection Agency to monitor for the appearance of exotic insects in the Park and to assess their effect in the long term.
5.3 Restoration and Enhancement Activities SPES‘s Stewardship Programs aim to restore and enhance the ecological health and biodiversity of Stanley Park‘s ecosystems. There have been many efforts over the past two decades to undertake such efforts in the Park in collaboration with the Park Board including the installation of nesting boxes and resting structures in wetlands, the use of wildlife-friendly culverts, and the restoration of habitat affected by invasive plant species.
Future Park stewardship efforts should focus on the following areas:
Aquatic Habitats: wetlands, watercourses, and intertidal areas are the habitats in the most need of stewardship attention. Specific actions may include increasing structural diversity within and connectivity between these areas.
Environmentally Sensitive Areas (ESAs): they are particularly rich in species diversity and represent areas of particular importance to the Park‘s ecological integrity.
Invasive Species Management: invasive plants are having a negative impact on habitat diversity and represent one of the greatest threats to biodiversity in the Park.
Species at Risk: restoration and enhancement programs should focus on helping those species which are undergoing the greatest declines in population. Several CDC-listed species rely heavily on the Park for breeding or wintering, including the Pacific great blue heron, surf scoter, barn swallow and double-crested cormorant. SARA-listed marbled murrelets and western screech-owls once commonly bred in the Park, but are now rarely seen and have not been confirmed breeding here for many years.
Wildlife habitat enhancements: bats, amphibians, reptiles.
Social Stressors: there are areas in the Park that have been negatively affected by human action and are in need of restoration. These include areas impacted by roads and trails, dump sites, pollution sources, and off-trail access.
Specific Stewardship Actions (in cooperation with the Park Board) may include:
Maintaining and restoring wildlife trees and coarse woody debris in both aquatic and terrestrial ecosystems for the benefit of Species at Risk, keystone species and other wildlife.
Revisiting the recommendations made through the Beaver Lake Environmental Enhancement Project (BLEEP) and determining options for Beaver Lake restoration including control of the introduced aquatic plants, a reduction in the dependence on the municipal water supply, and potentially dredging of the lake bottom.

216
Community involvement is a part of all SPES projects, but especially our stewardship programs.
Decommissioning of some or all of Beaver Lake‘s perimeter trail and/or replacement with boardwalks.
Restoring riparian habitat and structural complexity of Moose Pond and Beaver Pond for the benefit of native pond-breeding amphibians.
Implementing restoration and maintenance activities in the Beaver Lake bog to prevent this rare habitat in the Park from disappearing.
Enhancing intertidal habitats through the addition of rocky spawning structures, increasing connectivity with upland habitats, restoring salt marsh habitat and maintaining the Park‘s beaches with new sand.
Determining potential options to increase water quality in Lost Lagoon.
Enhancing habitat and restoring the Park‘s small, unnamed wetlands and streams for the benefit of declining amphibian species.
Working with Park Board staff to replace old culverts with larger, more wildlife-friendly versions.
Enhancing potential snake and lizard habitats.
Decommissioning and restoring unsanctioned trail and off-trail sites, mountain bike structures, and dumping sites.
Increasing the extent of riparian areas in the Park where appropriate through plantings and other enhancments.
Determining and acting on the potential for exotic animal control, especially red-eared slider turtles and American bullfrogs, for the benefit of all native wildlife and several Species at Risk in the Park.
Using wire wrapping and pond-leveling devices to enable coexistence with beavers in the Park‘s wetlands.
5.4 Education Programs Providing environmental education in Stanley Park is a central role of the Stanley Park Ecology Society. Through school and public programs as well as youth skills training and post-secondary student projects, SPES is a leader in interpretive education programming in the Park. Some of the stressors outlined in this report originate outside of the Park‘s boundaries and affect the greater ecosystem as a whole. To work on changing the root of these problems for the benefit of the Park and future generations of Park visitors, SPES will continue to provide high-quality educational programming in the park and beyond. Recommendations for current and future SPES education programs include:
Incorporate the latest information about the Park‘s natural ecology into all educational materials
and programming.
Encourage people to reduce their environmental impacts especially with regards to climate change. This is critical to the future of Stanley Park—many of the serious environmental impacts affecting the Park come from outside its borders.

217
Continue programs, such as Eco Rangers, that aim to inform visitors about Park etiquette and by-laws, as they are vitally important in reducing the effects of off-leash dogs, intertidal habitat disturbances, wildlife feeding, berry picking and a myriad of other visitor impacts.
Instill an appreciation and respect for the natural world through children‘s programming to help make the broader community more sustainable and reduce stressors in the larger ecosystem.
Use signage regarding wildlife feeding and dogs off-leash to help localized impacts from these activities.
Create interpretive signage and displays about Environmentally Sensitive Areas and Species at Risk to better inform the public about these critical components of ecological integrity in the Park.
Deliver messaging through the Stanley Park Nature House and the SPES website to inform Park users and the public at large about this report and the information within.
5.5 Future SOPEI Reports This is the first report of its kind for Stanley Park, but the Stanley Park Ecology Society is committed through our strategic plan to making SOPEI reporting a regular activity of our society. Through the implementation of baseline data gathering and long-term monitoring programs recommended in this report, the next SOPEI report will contain new, more comprehensive information so that analysis can be increasingly rigorous and statistically powerful. The incorporation of ecological knowledge through regular meetings with local naturalists is an essential component for future reporting. The use of measurable factors for assessing environmental indicators is a helpful way to provide data that can be used for trend analysis. The list in Table 39 is a first attempt at identifying some of the possible measures that can be used for assessing ecological integrity in Stanley Park.
Table 39: Possible measures for environmental indicators.
Possible Measures for Environmental Indicators Indicator Measures
Native Biodiversity
Indigenous plant and animal species richness Number and diversity of native plant and animal species inhabiting the Park.
Number and extent of invasive plant and animal species Number and extent of existing and new invasive plant and animal species
Native species productivity Productivity of great blue herons, bald eagles, pond-breeding amphibians, bat colonies, wood ducks, cavity-nesting swallows, raccoons
Genetic diversity within species Genetic diversity of small mammals, amphibians, reptiles, ground-dwelling invertebrates
Number of SARs and extent of park used by them
Number of Species at Risk in the Park; extent of Species at Risk habitat in the Park; presence of Pacific water shrew, Oregon forest snail, poor pocket moss, and streambank lupine
Population status of keystone species
Number and diversity of woodpecker species; productivity of pileated woodpecker and beaver
Climate and Atmosphere
Air quality
Total air emissions in the city; levels of CO and NOx in the Park; annual number of cars on the Causeway; annual number of cars, buses in the Park; total forested area of the Park
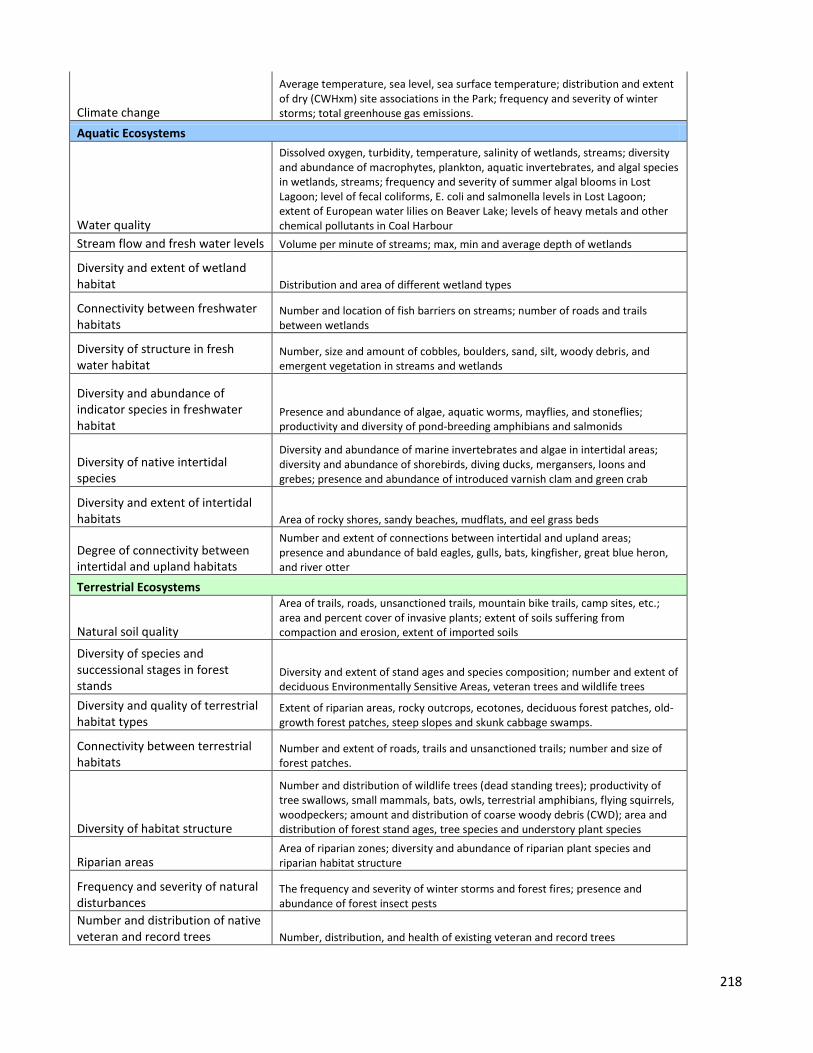
218
Climate change
Average temperature, sea level, sea surface temperature; distribution and extent of dry (CWHxm) site associations in the Park; frequency and severity of winter storms; total greenhouse gas emissions.
Aquatic Ecosystems
Water quality
Dissolved oxygen, turbidity, temperature, salinity of wetlands, streams; diversity and abundance of macrophytes, plankton, aquatic invertebrates, and algal species in wetlands, streams; frequency and severity of summer algal blooms in Lost Lagoon; level of fecal coliforms, E. coli and salmonella levels in Lost Lagoon; extent of European water lilies on Beaver Lake; levels of heavy metals and other chemical pollutants in Coal Harbour
Stream flow and fresh water levels Volume per minute of streams; max, min and average depth of wetlands
Diversity and extent of wetland habitat Distribution and area of different wetland types
Connectivity between freshwater habitats
Number and location of fish barriers on streams; number of roads and trails between wetlands
Diversity of structure in fresh water habitat
Number, size and amount of cobbles, boulders, sand, silt, woody debris, and emergent vegetation in streams and wetlands
Diversity and abundance of indicator species in freshwater habitat
Presence and abundance of algae, aquatic worms, mayflies, and stoneflies; productivity and diversity of pond-breeding amphibians and salmonids
Diversity of native intertidal species
Diversity and abundance of marine invertebrates and algae in intertidal areas; diversity and abundance of shorebirds, diving ducks, mergansers, loons and grebes; presence and abundance of introduced varnish clam and green crab
Diversity and extent of intertidal habitats Area of rocky shores, sandy beaches, mudflats, and eel grass beds
Degree of connectivity between intertidal and upland habitats
Number and extent of connections between intertidal and upland areas; presence and abundance of bald eagles, gulls, bats, kingfisher, great blue heron, and river otter
Terrestrial Ecosystems
Natural soil quality
Area of trails, roads, unsanctioned trails, mountain bike trails, camp sites, etc.; area and percent cover of invasive plants; extent of soils suffering from compaction and erosion, extent of imported soils
Diversity of species and successional stages in forest stands
Diversity and extent of stand ages and species composition; number and extent of deciduous Environmentally Sensitive Areas, veteran trees and wildlife trees
Diversity and quality of terrestrial habitat types
Extent of riparian areas, rocky outcrops, ecotones, deciduous forest patches, old-growth forest patches, steep slopes and skunk cabbage swamps.
Connectivity between terrestrial habitats
Number and extent of roads, trails and unsanctioned trails; number and size of forest patches.
Diversity of habitat structure
Number and distribution of wildlife trees (dead standing trees); productivity of tree swallows, small mammals, bats, owls, terrestrial amphibians, flying squirrels, woodpeckers; amount and distribution of coarse woody debris (CWD); area and distribution of forest stand ages, tree species and understory plant species
Riparian areas Area of riparian zones; diversity and abundance of riparian plant species and riparian habitat structure
Frequency and severity of natural disturbances
The frequency and severity of winter storms and forest fires; presence and abundance of forest insect pests
Number and distribution of native veteran and record trees Number, distribution, and health of existing veteran and record trees
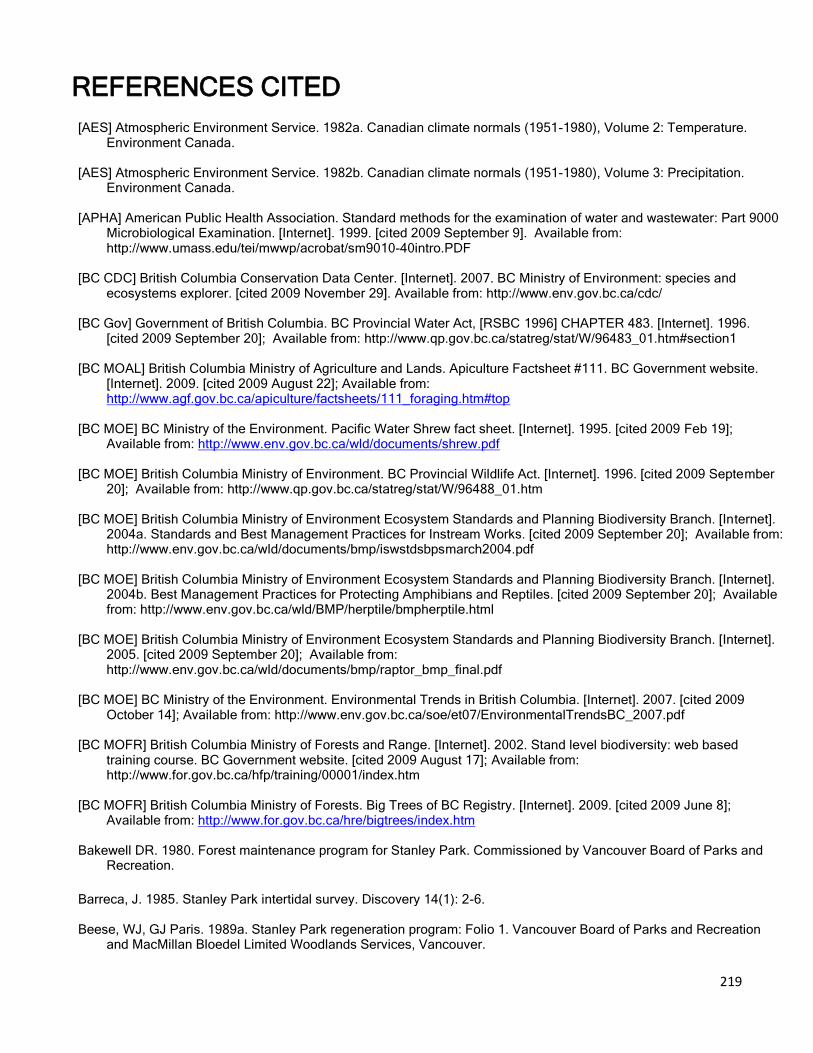
219
REFERENCES CITED
[AES] Atmospheric Environment Service. 1982a. Canadian climate normals (1951-1980), Volume 2: Temperature.
Environment Canada. [AES] Atmospheric Environment Service. 1982b. Canadian climate normals (1951-1980), Volume 3: Precipitation.
Environment Canada. [APHA] American Public Health Association. Standard methods for the examination of water and wastewater: Part 9000
Microbiological Examination. [Internet]. 1999. [cited 2009 September 9]. Available from: http://www.umass.edu/tei/mwwp/acrobat/sm9010-40intro.PDF
[BC CDC] British Columbia Conservation Data Center. [Internet]. 2007. BC Ministry of Environment: species and
ecosystems explorer. [cited 2009 November 29]. Available from: http://www.env.gov.bc.ca/cdc/ [BC Gov] Government of British Columbia. BC Provincial Water Act, [RSBC 1996] CHAPTER 483. [Internet]. 1996.
[cited 2009 September 20]; Available from: http://www.qp.gov.bc.ca/statreg/stat/W/96483_01.htm#section1 [BC MOAL] British Columbia Ministry of Agriculture and Lands. Apiculture Factsheet #111. BC Government website.
[Internet]. 2009. [cited 2009 August 22]; Available from: http://www.agf.gov.bc.ca/apiculture/factsheets/111_foraging.htm#top
[BC MOE] BC Ministry of the Environment. Pacific Water Shrew fact sheet. [Internet]. 1995. [cited 2009 Feb 19];
Available from: http://www.env.gov.bc.ca/wld/documents/shrew.pdf [BC MOE] British Columbia Ministry of Environment. BC Provincial Wildlife Act. [Internet]. 1996. [cited 2009 September
20]; Available from: http://www.qp.gov.bc.ca/statreg/stat/W/96488_01.htm [BC MOE] British Columbia Ministry of Environment Ecosystem Standards and Planning Biodiversity Branch. [Internet].
2004a. Standards and Best Management Practices for Instream Works. [cited 2009 September 20]; Available from: http://www.env.gov.bc.ca/wld/documents/bmp/iswstdsbpsmarch2004.pdf
[BC MOE] British Columbia Ministry of Environment Ecosystem Standards and Planning Biodiversity Branch. [Internet].
2004b. Best Management Practices for Protecting Amphibians and Reptiles. [cited 2009 September 20]; Available from: http://www.env.gov.bc.ca/wld/BMP/herptile/bmpherptile.html
[BC MOE] British Columbia Ministry of Environment Ecosystem Standards and Planning Biodiversity Branch. [Internet].
2005. [cited 2009 September 20]; Available from: http://www.env.gov.bc.ca/wld/documents/bmp/raptor_bmp_final.pdf
[BC MOE] BC Ministry of the Environment. Environmental Trends in British Columbia. [Internet]. 2007. [cited 2009
October 14]; Available from: http://www.env.gov.bc.ca/soe/et07/EnvironmentalTrendsBC_2007.pdf [BC MOFR] British Columbia Ministry of Forests and Range. [Internet]. 2002. Stand level biodiversity: web based
training course. BC Government website. [cited 2009 August 17]; Available from: http://www.for.gov.bc.ca/hfp/training/00001/index.htm
[BC MOFR] British Columbia Ministry of Forests. Big Trees of BC Registry. [Internet]. 2009. [cited 2009 June 8];
Available from: http://www.for.gov.bc.ca/hre/bigtrees/index.htm Bakewell DR. 1980. Forest maintenance program for Stanley Park. Commissioned by Vancouver Board of Parks and
Recreation.
Barreca, J. 1985. Stanley Park intertidal survey. Discovery 14(1): 2-6. Beese, WJ, GJ Paris. 1989a. Stanley Park regeneration program: Folio 1. Vancouver Board of Parks and Recreation
and MacMillan Bloedel Limited Woodlands Services, Vancouver.
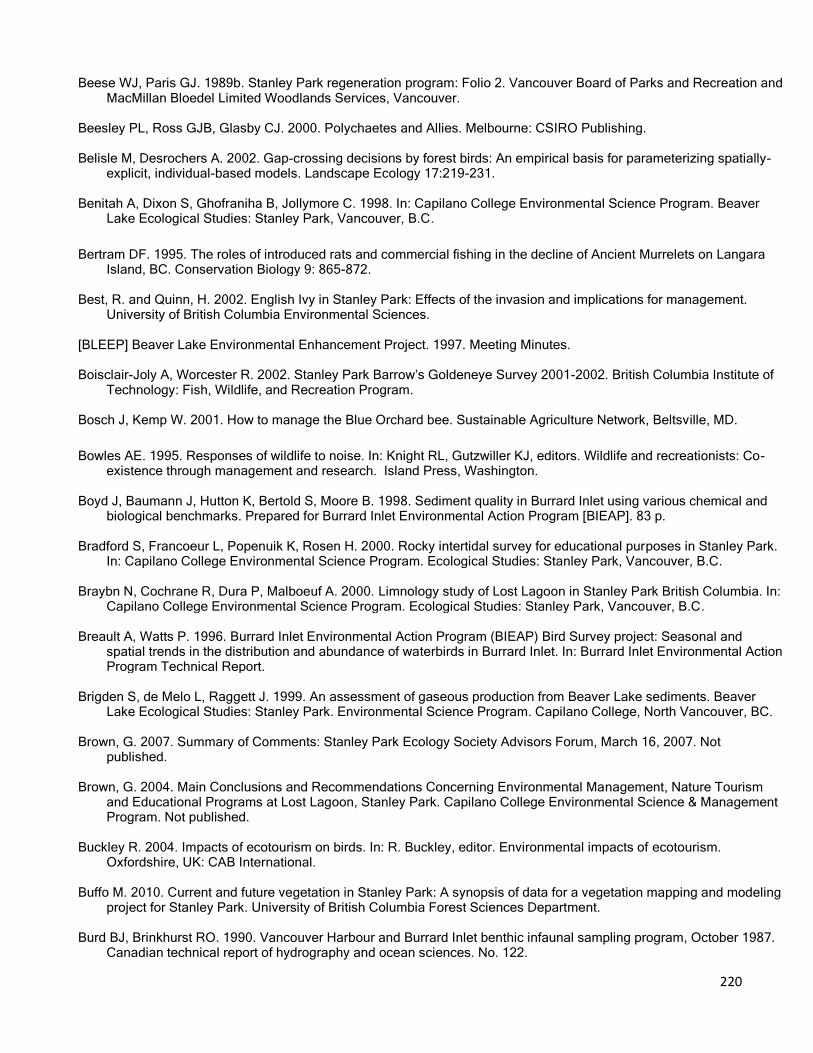
220
Beese WJ, Paris GJ. 1989b. Stanley Park regeneration program: Folio 2. Vancouver Board of Parks and Recreation and MacMillan Bloedel Limited Woodlands Services, Vancouver.
Beesley PL, Ross GJB, Glasby CJ. 2000. Polychaetes and Allies. Melbourne: CSIRO Publishing. Belisle M, Desrochers A. 2002. Gap-crossing decisions by forest birds: An empirical basis for parameterizing spatially-
explicit, individual-based models. Landscape Ecology 17:219-231. Benitah A, Dixon S, Ghofraniha B, Jollymore C. 1998. In: Capilano College Environmental Science Program. Beaver
Lake Ecological Studies: Stanley Park, Vancouver, B.C.
Bertram DF. 1995. The roles of introduced rats and commercial fishing in the decline of Ancient Murrelets on Langara Island, BC. Conservation Biology 9: 865-872.
Best, R. and Quinn, H. 2002. English Ivy in Stanley Park: Effects of the invasion and implications for management.
University of British Columbia Environmental Sciences. [BLEEP] Beaver Lake Environmental Enhancement Project. 1997. Meeting Minutes. Boisclair-Joly A, Worcester R. 2002. Stanley Park Barrow‘s Goldeneye Survey 2001-2002. British Columbia Institute of
Technology: Fish, Wildlife, and Recreation Program. Bosch J, Kemp W. 2001. How to manage the Blue Orchard bee. Sustainable Agriculture Network, Beltsville, MD.
Bowles AE. 1995. Responses of wildlife to noise. In: Knight RL, Gutzwiller KJ, editors. Wildlife and recreationists: Co-existence through management and research. Island Press, Washington.
Boyd J, Baumann J, Hutton K, Bertold S, Moore B. 1998. Sediment quality in Burrard Inlet using various chemical and
biological benchmarks. Prepared for Burrard Inlet Environmental Action Program [BIEAP]. 83 p. Bradford S, Francoeur L, Popenuik K, Rosen H. 2000. Rocky intertidal survey for educational purposes in Stanley Park.
In: Capilano College Environmental Science Program. Ecological Studies: Stanley Park, Vancouver, B.C. Braybn N, Cochrane R, Dura P, Malboeuf A. 2000. Limnology study of Lost Lagoon in Stanley Park British Columbia. In:
Capilano College Environmental Science Program. Ecological Studies: Stanley Park, Vancouver, B.C. Breault A, Watts P. 1996. Burrard Inlet Environmental Action Program (BIEAP) Bird Survey project: Seasonal and
spatial trends in the distribution and abundance of waterbirds in Burrard Inlet. In: Burrard Inlet Environmental Action Program Technical Report.
Brigden S, de Melo L, Raggett J. 1999. An assessment of gaseous production from Beaver Lake sediments. Beaver
Lake Ecological Studies: Stanley Park. Environmental Science Program. Capilano College, North Vancouver, BC. Brown, G. 2007. Summary of Comments: Stanley Park Ecology Society Advisors Forum, March 16, 2007. Not
published.
Brown, G. 2004. Main Conclusions and Recommendations Concerning Environmental Management, Nature Tourism and Educational Programs at Lost Lagoon, Stanley Park. Capilano College Environmental Science & Management Program. Not published.
Buckley R. 2004. Impacts of ecotourism on birds. In: R. Buckley, editor. Environmental impacts of ecotourism.
Oxfordshire, UK: CAB International. Buffo M. 2010. Current and future vegetation in Stanley Park: A synopsis of data for a vegetation mapping and modeling
project for Stanley Park. University of British Columbia Forest Sciences Department. Burd BJ, Brinkhurst RO. 1990. Vancouver Harbour and Burrard Inlet benthic infaunal sampling program, October 1987.
Canadian technical report of hydrography and ocean sciences. No. 122.
221
Burger J. 1981. The effect of human activity on birds at a coastal bay. Biol. Conserv. 21: 231-241. Campbell WR, Preston MI, Van Damme LM, MacRae D. 2005. Wildlife data center featured species - Turkey vulture.
Wildlife Afield 2(2): 96-115.
Carl CG. 1932. A Biological Study of Lost Lagoon. Masters Thesis, University of British Columbia, Vancouver. [CESIISC] Centre for Ecological Sciences, Indian Institute of Science. 2008. Ecological Significance [cited 2009 April
14]. Available from: http://ces.iisc.ernet.in/biodiversity/amphibians/ecological.htm.
Christiansen J, Bondzio B. (n.d.) Spatial analysis report of two invasive species. Himalayan Blackberry (R. discolor) and Giant Knotweed (P. sachalinense) found in Stanley Park.
City of Vancouver. Air Quality; [Internet]. 2005. [cited 2009 February 21]. Available from:
http://vancouver.ca/commsvcs/licandinsp/inspections/environment/agenda/ii.htm. Clague J, Turner B. 2003. Vancouver, city on the edge: living with a dynamic geological landscape. Vancouver: Tricouni
Press.
[Coast River] Coast River Environmental Services. 1995. Comparative Environmental Assessment of Lions Gate Crossing Options Related to Stanley Park and First Narrows. Fisheries and Aquatic Resources. Vancouver, BC.
Cramer K, Takahashi L. 2004. Terrestrial and aquatic stewardship options for the Stanley Park Ecology Society.
Capilano College Environmental Science and Management Program. [CWMPSC] Cusheon Watershed Management Plan Steering Committee. 2007. Cusheon Watershed Management Plan
2007. [CWS] Canadian Wildlife Service. Toxins in Great Blue Heron eggs an indicator of contaminants in the Georgia Basin.
[Internet]. 2005 [cited 2009 October 14]. Available from: http://www.ecoinfo.gc.ca/env_ind/region/gbhtoxin/gbhtoxin_e.cfm
Demarchi DA. 1996. An introduction to the eco-regions of BC. Victoria: BC Ministry of Water, Land and Air Protection,
Wildlife Branch. 1996. [DFO] Department of Fisheries and Oceans Canada. Federal Fisheries Act, (R.S., 1985, c. F-14 ). [Internet] 1985. [cited
2009 September 20]; Available from: http://laws.justice.gc.ca/en/ShowTdm/cs/F-14///en Din NA. 1977. Counts of waterbirds in Vancouver. Discovery 6:32-34. Dukes J, Mooney H. 1999. Does global change increase the success of biological invaders? TREE. 14 (4): 135-139.
Emslie. 1971. English Bay weather. Pacific Yachting. Environment Canada. Area-sensitive forest birds in urban areas. [Internet]. 2006 [cited 2009 July 20]. Available from:
http://www.on.ec.gc.ca/wildlife/docs/pdf/forestbirdsreport-e.pdf.
[EVS] EVS Environment Consultants. 1994. Lost Lagoon Water Quality Monitoring Survey. Prepared for the Stanley
Park Zoological Gardens. Fahrig L. 2003. Effects of habitat fragmentation on biodiversity. Annual Review in Ecology, Evolution, and Systematics
34: 487-515. Fenger M, Manning T, Cooper J, Guy S, Bradford P. 2006. Wildlife & Trees in British Columbia. Vancouver: Lone Pine
Publishing.

222
Forman RT, Alexander LE. 1998. Roads and their major ecological effects. Annual Review of Ecology and Systematics 29: 207-231.
Forrest A, St. Clair C. 2006. Effects of dog leash laws and habitat type on avian and small mammal communities in
urban parks. Urban Ecosystems 9 (2): 51-66. [FPWGRWQ] Federal-Provincial Working Group on Recreational Water Quality of the Federal-Provincial Advisory
Committee on Environmental and Occupational Health. Guidelines for Canadian recreational water quality. Indicator organisms for fresh water: Escherichia coli and fecal coliforms. [Internet]. 1992 [cited 2009 September 9]. Available from: http://www.hc-sc.gc.ca/ewh-semt/pubs/water-eau/guide_water-1992-guide_eau/section3-eng.php#sec3_1
Fry AD. 1990. An Analysis of the natural area management of Stanley Park. Unpublished. Gartner Lee Limited. 1992. Greater Vancouver‘s Ecology: Volume 2. Technical Report. 1992. Report to Development
Services Department of Greater Vancouver Regional District.
Gehrt ST. 2006. Urban coyote ecology and management: The Cook County, Illinois, coyote project. Ohio State
University Extension. Gennai A, Keeling T, Yadao T. 1999. An evaluation of fish species and fish habitat in Beaver Lake, Vancouver, British
Columbia. Capilano College Environmental Science Program. Getsinger JS. 2009. Stanley Park field trip assignment (Third Beach to Siwash Rock). Capilano University. Unpublished
data. Gonzales E. 1998. Preliminary report on Eastern grey squirrel introduction and expansion in Greater Vancouver, British
Columbia, Canada. Masters Thesis, Simon Fraser University. Govindarajulu, P and M. Dodd. The Bullfrog Project. University of Victoria webpage. [Internet]. 2008. Geological Survey
of Canada. [cited 2009 August 26]. Available from: http://web.uvic.ca/bullfrogs/. Green R, Higginbottom K. 2001. Negative effects of wildlife tourism on wildlife, Wildlife. Tourism Research Report
Series, No. 5, Sustainable Tourism CRC, Gold Coast. [Internet]. [cited 2009 July 20]; Available from: http://www.crctourism.com.au/WMS/Upload/Resources/bookshop/FINAL-WildlifeTourism_web.pdf#page=103.
Green RN, Leigh-Spencer S. 2007. Identifying potential Pacific water shrew habitat in Stanley Park through GIS
analysis. BA Blackwell and Associates Ltd. and Ecologic Consulting.
Green RN, Klinka K. 1994. A field guide to the identification and interpretation for the Vancouver forest region. Land
Management Handbook No. 28. British Columbia Ministry of Forests. Goulet, R. 2009. Aspects of the Ecology of Urban-nesting Bald Eagles (Haliaeeus leucocephalus) in South-Coastal
British Columbia. Masters of Science Thesis: McGill University p. 98.
Haggard P, Haggard J. 2006. Insects of the Pacific Northwest. Portland, Oregon: Timber Press Inc. Haggarty DR. 1997. An evaluation of fish habitat in Burrard Inlet, British Columbia. Masters Thesis, University of
Victoria, Department of Zoology. Hamann A, Wang T. 2006. Potential effects of climate change on ecosystem and tree species distribution in British
Columbia. Ecology. 87(11): 2773-2786. Hammond, M. 2004. A Preliminary review of artificial structures for waterfowl at Lost Lagoon. Capilano College
Environmental Science and Management Program. Hatfeild Consultants Ltd. 1985. A technical and economic feasibility study of the Beaver Lake Creek Enhancement
Project.

223
[Health Canada] Health Canada, Environmental and Workplace Health.Blue-green algae (Cyanobacteria) and their toxins. [Internet]. 2008. [cited 2009 September 20]; Available from: http://www.hc-sc.gc.ca/ewh-semt/pubs/water-eau/cyanobacter-eng.php
HealthLink BC. Blue-green algae blooms: HealthLink BC File #47, October 2005. [Internet]. 2005. [cited 2009
September 20]; Available from: http://www.healthlinkbc.ca/healthfiles/hfile47.stm Henderson P, Ryder G. 2002. Species at risk in GVRD parks. British Columbia: Strix Environmental Consulting and
Ryder Wildlife Research, 2002. Prepared for Greater Vancouver Regional District Parks. Hockin D, Ounsted M, Gorman M, Hill D, Keller V, and Barker MA. 1992. Examination of the effects of disturbance on
birds with reference to its importance in ecological assessment. Journal of Environmental Management 36: 253-286.
Houde I. Biodiversity and forest management in British Columbia. Forest Sciences Department, University of British
Columbia. [Internet]. 2007. [cited 2009 July 20]; Available from: http://www.forestbiodiversityinbc.ca/manage_issues_fragment.asp
[IBA] Important Bird Areas of Canada. Coordinated by Bird Life international. [Internet]. 2004-2009. [Canada]:
ibacanada.com; [cited 2009 July 20]; Available from: http://www.ibacanada.com/contact.jsp?lang=en [ISA] International Society of Arboriculture. Trees are good website. [Internet] 2009. [cited 2009 Oct 20]; Available from:
http://www.treesaregood.com/funfacts/Environment.aspx [IPCC] Intergovernmental Panel on Climate Change. 2007. Climate Change 2007 - Impacts, Adaptation and
Vulnerability. Contribution of Working Group II to the Fourth Assessment Report of the Intergovernmental Panel on Climate Change, M.L. Parry, O.F. Canziani, J.P. Palutikof, P.J. van der Linden and C.E. Hanson, Eds., Cambridge University Press, Cambridge, UK, 976pp.
Jones Z., Mackintosh M, Gray, J. 2001. The management of Canada Goose populations in the City of Vancouver. The Canada Goose Management Team of the Vancouver Park Board. Unpublished report.
Kerr Wood Leidal Associates LTD. 1999. Environmental overview of Lost Lagoon and Beaver Lake. Appendix E of the
Stanley Park Stormwater Management Plan Final Report. Kerr Wood Leidal Associates LTD. 2002. Detailed description of the Lost Lagoon stormwater treatment facility.
Unpublished.
Kheraj S. 2008. Improving nature: remaking Stanley Park's forest, 1888-1931. BC Studies .158: 63-90.
Kheraj S. 2007. Restoring nature: ecology, memory, and the storm history of Vancouver's Stanley Park. Canadian
Historical Review. 88 (4): 577-612.
Koga E, Prang L, Hammond M. 2004. The population status of bird, amphibian and reptile species in Stanley Park.
Capilano College Environmental Science and Management Program. Koga E. 2004. A preliminary investigation of shoreline restoration at Lost Lagoon. Capilano College Environmental
Science and Management Program. Krajina, V. J. Biogeoclimatic zones in British Columbia. 1959. Vancouver: University of British Columbia. 47 p. Kremsater LL, Bunnell FL. 1999. Edges: Theory, evidence, and implications to management of western forests. In:
Rochelle JA, Lehmann LA, Wisniewski J, editors. Forest fragmentation: wildlife and management implications. Leiden, Netherlands: Brill Academic Publishers. p. 117-153.
Lahti DC. 2001. The ―edge effect on nest predation‖ hypothesis after twenty years. Biological Conservation. 99: 365-374. Lambert P. 1994. Biodiversity of marine invertebrates in British Columbia. In: Harding L, McCullum E, editors.
Biodiversity in British Columbia. Ottawa: Environment Canada. p. 57 - 69.
224
Lariviere S. 2003. Edge effects, predator movements, and the travel-lane paradox. Wildlife Society Bulletin 31: 315-320. Lashek J, Schmidt T, Schaffeild T. 1999. A study of disposal options and sediment quality for proposed dredgate in
Beaver Lake. In: Capilano College Environmental Science Program. Beaver Laek Ecological Studies: Stanley Park, Vancouver, B.C.
Lenth BE, Knight RL, Brennan ME. 2008. The effects of dogs on wildlife communities. Natural Areas Journal 28(3):218-
227.
Lertzman K, Gavin D, Hallett D, Brubaker L, Lepofsky D, Mathewes R. 2002. Long-term fire regime estimated from soil charcoal in coastal temperate rainforests. Conservation Ecology 6(2): 5.
Leung Yu-Fai, Marion Jeffrey L. 2000. Recreation impacts and management in wilderness: a state-of-knowledge review.
USDA Forest Service Proceedings RMRSP 15(5).
Lindskoog R, Quinlan C, Robertson R. 1999. Amphibian survey of the Beaver Lake area in Stanley Park, Vancouver, British Columbia. Capilano College Environmental Science Program. p. 36.
Lowe SJ, Browne M, Boudjelas S.. 100 of the world's worst invasive alien species. [Internet] 2000. IUCN/SSC Invasive Species Specialist Group. [cited 2009 October 16]; Available from: http://www.issg.org/publications.htm#worst100
Machmer MM, Steeger C. The ecological roles of wildlife tree users in forest ecosystems. [Internet] 1995.BC Ministry of
Forests Research Branch: Land Management Handbook. [cited 2009 February 1]; Available from: http://www.for.gov.bc.ca/hfd/pubs/docs/Lmh/Lmh35.pdf
Manning T, Guy S, Bradford P. 1998. Wildlife / danger tree assessor‘s course: parks and recreation sites. Forest
Practices Branch, Worker‘s Compensation Board, and Ministry of Environment, Lands and Parks course workbook. Marliave, J.B. and S.J.D. Martell, 2001. Rehabilitation of Spawning Habitat for Intertidal Marine Fish Along Rocky
Shoreline of Stanley Park, Vancouver, British Columbia. In W. G. Conway, M. Hutchins, M. Souza, Y. Kapetanakos & E. Paul (Eds.), AZA Field Conservation Resource Guide p. 323.
Matlack GR, Litvaitis JA. 1999. Forest edges. In: Hunter ML Jr, editor. Maintaining biodiversity in forest ecosystems. Cambridge (UK): Cambridge University Press. p.210-233.
[MBCA] Migratory Birds Convention Act. 1994. [Internet] Department of Justice Canada. [cited 2009 March 30];
Available from: http://laws.justice.gc.ca/en/showdoc/cs/M-7.01///en?page=1 McComb WC. 1999. Forest fragmentation: wildlife and management implications synthesis of the conference. In:
Rochelle JA, Lehmann LA, Wisniewski J, editors. Forest fragmentation: wildlife and management implications. Leiden, Netherlands: Brill Academic Publishers. p. 295-301.
McLaren, P. 1994. Sediment transport in Vancouver Harbour: implications to the fate of contaminated sediments and/or
dredged material disposal. Final report. Prepared for the Burrard Inlet Environmental Action Program by Geosea Consulting Inc.
McLean JA. 2008a. Survey of insect biodiversity in Stanley Park, Vancouver following the winter storms of 2006. Report
to Canadian Food and Inspection Agency. Department of Forest Sciences, University of British Columbia. McLean JA. 2008b. Report on: Biodiversity in Stanley Park symposium and public forum, Saturday, October 4th, 2008.
[Internet] [cited 2009 July 21]; Available from: www.stanleyparkecology.ca McLean, J.A. and A. Li. 2009. Ground Beetles (Coleoptera: Carabidae) of Stanley Park, Vancouver, British Columbia
following the storms of December 2006. Journal of the Entomological Society of British Columbia 106: 53-60.
Meyer JR. General Entomology 424. [Internet]. 2009. Department of Entomology, NC State University. [cited 2009 August 19]; Available from: http://www.cals.ncsu.edu/course/ent425/index.html
225
Miller SG, Knight RL, Miller CK. 1998. The influence of recreational trails on breeding bird communities. Ecological Applications 8(1): 162-169.
Muchow CL, Richardson JS. 2000. Unexplored diversity: macroinvertebrates in coastal British Columbia headwater
streams. In: Darling LM , editor. Proceedings Conference of Biology and Management of Species and Habitats at Risk, Kamloops, BC, 1999 February 15-19 Vol. 2. B.C. Victoria, BC: Ministry Environment, Lands and Parks. p. 503–506
[MWLAP] Interim Wildlife Guidelines for Commercial Backcountry Recreation in British Columbia. 2002. Ministry of
Water, Land and Air Protection Ecosystem Planning and Standards Section. Retrieved 2009 July 20. http://wlapwww.gov.bc.ca/wld/documents/crecguidelines_ch6may02s.pdf
Murcia C. 1995. Edge effects in fragmented forests: implications for conservation. Trends in Ecology and Evolution 10:
58-62. Natural Resources Canada. [Internet]. 2008. Geological Survey of Canada: Urban Geology. [cited 2010 February 24];
Available from: http://gsc.nrcan.gc.ca/urbgeo/vanrock/index_e.php. Needham, K. Q: What does an entomologist do with a new millennium? A: Your mission, if you choose to accept it…
Excerpt from the Entomological Society of British Columbia Newsletter. Boreus 27(2): 34-36. Newell DMG. 1983. The terrestrial vertebrates of the University Endowment Lands. U.B.C Technical Committee on the
Endowment Lands. Technical paper No. 1 Published by the G.V.R.D. [NYSDEC] New York State Department of Environmental Conservation. Feeding Waterfowl webpage. [Internet]. 2009.
[cited 2009 August 26]; Available from: http://www.dec.ny.gov/animals/7001.html Paillé N, Slezak B, Sulek L, Wittaker AM. 2000. Intertidal survey of clam and crab species in Stanley Park: development
of baseline information and monitoring program in ecological studies: Stanley Park, Vancouver, BC. Capilano College Environmental Science Program.
Palmer RS. 1976. Handbook of North American Birds. Volume 3. Waterfowl, Part 2. New Haven (CT): Yale University
Press. Parks Canada. [Internet]. 2009. National Parks of Canada: ecological integrity. [cited 2009 October 14]. Available from:
http://www.pc.gc.ca/eng/progs/np-pn/ie-ei.aspx Parks Canada. [Internet]. 2008a. Parks Canada National Historic site of Canada webpage. [cited 2010 January 20].
Available from: http://www.pc.gc.ca/progs/lhn-nhs/index_E.asp Parks Canada. [Internet]. 2008b. Waterton Lakes, National Park of Canada: state of the park report. [cited 2009
December 3]. Available from: http://www.pc.gc.ca/~/media/pn-np/ab/waterton/pdf/a-i/2008_SOPR_e.ashx Parks Canada. 2006. National Parks of Canada: Management Planning webpage. [cited 2009 October 20]. Available
from: http://www.pc.gc.ca/progs/np-pn/p_r/p_r1_e.asp Parks Canada. 2002. Stanley Park national historic site of Canada: commemorative integrity statement Parminter J. 1992. Fire management technical session: effects of fire on forest ecology: fire and biodiversity. Canadian
Institute of Forestry Annual Meeting 1992. Paton PWC. 1994. The effect of edge on avian nest success: how strong is the evidence? Conservation Biology. 8(1):
17-26. Pojar J, Klinka K, Demarchi DA. Ecosystems of British Columbia: Coastal Western Hemlock Zone.
[Internet].1991.Research Branch, BC ministry of Forests and Range. [cited 2009 June 1]; Available from: http://www.for.gov.bc.ca/hfd/pubs/docs/Srs/Srs06/chap6.pdf
226
Pojar J, MacKinnon A. 1994. Plants of Coastal British Columbia. Edmonton: Lone Pine Publishing Pollination Canada. [Internet]. 2008. Seeds of Diversity Canada webpage. [cited 2009 August 19]; Available from:
http://www.pollinationcanada.ca/index.php?n=pc_home Provincial Water Act. [Internet]. 1996. [cited 2009 March 30]; Available from:
http://www.bclaws.ca/Recon/document/freeside/--%20W%20-/Water%20Act%20%20RSBC%201996%20%20c.%20483/00_96483_01.xml
Pulliam HR. 1988. Sources, sinks, and population regulation. American Naturalist 132:652-661.
[QGNRW] Queensland Government Natural Resources and Water. [Internet]. 2006. Blue-green algae factsheet, March
2006. [cited 2009 September 20]; Available from: http://www.nrw.qld.gov.au/factsheets/pdf/water/w3.pdf Quinn H, Best R.. 2002. English ivy in Stanley Park: effects of the invasion and implications for management. UBC
Environmental Sciences Masters Thesis. p. 129. Reeves A. 2006. In Stanley Park, you say? Killing caterpillars on a Sunday. British Columbia History. 39(1): 3p. Robertson DJ, McTaggart-Cowan I. 1954. An introduced population of the gray squirrel (Sciurus carolinensis gmelin) in
British Columbia. Canadian Journal of Zoology. 32: 261-282. Robertson I, Bekhuys TJ. 1995. Comparative environmental assessment of Lions Gate crossing options related to
Stanley Park and First Narrows: wildlife resources. B.C. Ministry of Transportation and Highways Report. Robertson I, Hetherington A, Jones R. 1989. Stanley Park regeneration program: wildlife implications. In: Stanley Park
Regeneration Program: Folio 2. Vancouver: Vancouver Board of Parks and Recreation and MacMillan Bloedel Limited Woodlands Services.
Roddick JA. 2001. Capsule geology of the Vancouver area and teacher‘s field-trip guide. Geological Survey of Canada,
Open File 4022. Rotinsky BT. 1999. Final report: Stanley Park Barrow‘s Goldeneye survey 1998-1999. British Columbia Institute of
Technology: Fish, Wildlife, and Recreation Program. Sandwell Inc., Bennet Environmental Consultants Ltd., Seacoast Marine Research Ltd. 1991. A risk assessment and
tanker traffic movement within the Port of Vancouver. Report to the Vancouver Port Corporation. [SARA] Species at Risk Act. 2002. Department of Justice Canada. [cited 2009 March 30]; Available from:
http://laws.justice.gc.ca/en/showdoc/cs/S-15.3///en?page=1
Savage H. 1911. Cougar is shot by Cloverdale hunters. Vancouver Daily Province. 1911 October 27. p 1. Savard, JPL. 1989. Birds of the rocky coastlines and pelagic waters of the Straight of Georgia. In: Vermeer K, Butler
RW, editors. The ecology and status of marine and shoreline birds in the Straight of Georgia, BC. Ottowa: Can. Wildl. Serv., Spec. Publ.
Schafer V, Chen A. 1988. The natural history of Stanley Park. Vancouver (BC): Discovery Press. Schmiegelow FKA, Mönkkönen M. 2002. Habitat loss and fragmentation in dynamic landscapes: avian perspectives
from the boreal forest. Ecological Applications 12: 375-389. Scudder G, Cannings D. 2009. Insect Families of British Columbia. In: Klinkenberg B, editor. E-fauna BC: electronic
atlas of the fauna of British Columbia. Lab for Advanced Spatial Analysis, Department of Geography, University of British Columbia, Vancouver. Available from: http://efauna.bc.ca/
227
Sinclair D, Rutherford E. 2010. Bats of Stanley Park. British Columbia Institute of Technology: Fish, Wildlife, and Recreation Program.
Smedman L. 2004 August 18. ―Frolicsome‖ dogs plagued Stanley Park in 1916. The Vancouver Courier. Snover AK, Hamlet A.F, Lettenmaier DP. 2003. Climate change scenarios for water planning studies: pilot applications
in the Pacific Northwest. Bulletin of the American Meteorological Society 84(11):1513-1518. Southham T, Curran EA, editors. 1996. The wetland keepers handbook: a practical guide to wetland care. B.C. Wildlife
Federation, Surrey, BC, and Environment Canada, Delta, BC. [SPES] Stanley Park Ecology Society. 2007. Species at risk, environmentally sensitive areas and invasive species in
Stanley Park. Unpublished report prepared for the Vancouver Park Board. Steele M. 1988. The first 100 years: an illustrated celebration. Vancouver (BC): The Vancouver Board of Parks and
Recreation. Stewart JM. 1997. Beaver Lake bathymetric survey. J.M. Stewart Surveys Ltd. Prepared for Beaver Lake Environmental
Enhancement Project. Not Published. Stoltmann R. 1987. Hiking guide to the big trees of British Columbia. Vancouver: Western Canada Wilderness
Committee. [Streamkeepers] The Pacific Streamkeepers Federation. [Internet]. 2009. The streamkeepers handbook and modules:
Module 4: Stream Invertebrate Survey. [cited 2009 August 19]; Available from: http://www.pskf.ca/publications/ [SWCSMH] Soil & Water Conservation Society of Metro Halifax. [Internet]. 2007. The blue-green algae (cyanobacteria).
[cited 2009 September 20]; Available from: www.chebucto.ns.ca/ccn/info/Science/SWCS/cyano.html [Talisman] Land Resource Consultants. 1995a. Comparative environmental assessment of Lions Gate crossing
options related to Stanley Park and First Narrows: soils and drainage. Prepared for Ministry of Transportation and Highways, Highway Environment Branch.
[Talisman] Talisman Land Resource Consultants. 1995b. Comparative environmental assessment of Lions Gate
crossing options related to Stanley Park and First Narrows. Vegetation Resources. Prepared for Ministry of Transportation and Highways, Highway Environment Branch.
Taylor T. 2008. Rarely noticed arthropod plays key role in forest. Magazine of BC Nature. 46(4). Thurston E, Reader RJ. 2001. Impacts of experimentally applied mountain biking and hiking on vegetation and soil of a
deciduous forest. Journal of Environmental Management. 27(3): 397-409. Timm RM, Baker RO. 2007. A history of urban coyote problems. In: Nolte DL, Arjo WM, Stalman DH, editors.
Proceedings, 12th Wildlife Damage Management Conference Wildlife Damage Management Working Group of the Wildlife Society.
Tuite CH, Owen M, Paynter D. 1983. Interaction between wildfowl and recreation at Llangorse Lake and Tlybont
Reservoir, South Wales. Wildfowl. 34: 48-63. US Forest Service. [Internet]. 2009. Rocky Mountain Research Station. [cited 2009 April 15]; Available from:
http://www.treesearch.fs.fed.us/pubs/21661
Vancouver Aquarium. [Internet]. 2003. BC Hydro Salmon Stream Project. Vancouver Aquarium website. [cited 2009 Sept 20]; Available from: www.vanaqua.org/salmontales
Vancouver Daily Province. 1911a Little Venice for Stanley Park Proposed. 1911 January 12. p 4. Vancouver Daily Province. 1911b. Predatory beast is killing deer in the park. 1911 October 14. p. 1.

228
Vancouver Daily Province. 1911c. Monster bald eagle shot across narrows from park. 1911 October 27. p. 27. Vancouver Daily Province. 1911d. Coal Harbour devil fish grabs child. 1911 May 29. p 1. Vancouver Daily Province. 1912. Hands off Stanley Park, Their Slogan. 1912 December 20. p. 32. Vancouver Province. 1921b November 7. Ducks discover bird sanctuary: fearless birds flock in hundreds to Coal
Harbour and park lake. Vancouver Province; p. 7 (author unknown). Vancouver Province. 1921b June 30. Stanley Park herons at home. Vancouver Province; p. 12 (author unknown). [VBPR] Vancouver Board of Parks and Recreation, City of Vancouver. 1984. Stanley Park master plan. Vancouver,
Vancouver City Council. [VBPR] Vancouver Board of Parks and Recreation, City of Vancouver. 1992. Stanley Park Task Force: Final Report. [VBPR ] Vancouver Board of Parks and Recreation. 1996. Stanley Park transportation and recreation report. [VBPR] Board of Parks and Recreation, City of Vancouver. 2005. Strategic plan (2005-2010). [VBPR] Vancouver Board of Parks and Recreation. 2006. Stanley Park heronry management plan. Internal Document.
[VBPR] Vancouver Board of Parks and Recreation. 2007a. Stanley Park Restoration. Vancouver, British Columbia. [VBPR] Vancouver Board of Parks and Recreation. 2007b. Minutes of Park Board meeting: 2007 November 30. [VBPR] Vancouver Board of Parks and Recreation. [Internet]. 2008a. Stanley Park. [cited 2008 Dec. 2008]; Available
from: http://www.city.vancouver.bc.ca/parks/parks/stanley/index.htm. [VBPR] Vancouver Board of Parks and Recreation. [Internet]. 2008b. Park By-Laws. City of Vancouver website. [cited
2009 August 31]; Available from: http://vancouver.ca/Parks/info/regs/parkscontrolbylaw.pdf [VBPR] Vancouver Board of Parks and Recreation. [Internet]. 2009a. Stanley Park Gardens. [cited 2009 March 12];
Available from: http://vancouver.ca/parks/parks/stanley/gardens.htm [VBPR ] Vancouver Board of Parks and Recreation. 2009b. Stanley Park forest management plan. Vancouver (BC):
Vancouver Board of Parks and Recreation. [VBPR] Vancouver Board of Parks and Recreation. 2009c. [Internet]. Stanley Park Trails. [cited 2009 March 12];
Available from: http://vancouver.ca/parks/parks/stanley/nature.htm
Vennesland RG, Butler RW. 2004. Factors influencing Great Blue Heron nesting productivity on the Pacific Coast of Canada from 1998 to 1999. Waterbirds 27: 289-296.
[VNHS] Vancouver Natural History Society. 1988. The natural history of Stanley Park. Schaefer, V. and A. Chen,
editors. Vancouver: Discovery Press. [VNHS] Vancouver Natural History Society. 2006. Wilderness on the Doorstep. Discovering Nature in Stanley Park.
Parkinson, A, editor. British Columbia: Harbour Publishing. [VNHS] Vancouver Natural History Society. 2009. Explore the rocky shore at Stanley Park. Pamphlet. Waters RD. 1985. Initial environmental assessment profile of Vancouver Harbour. Volume I and II. Regional
Manuscript report 85-07. Webber K. 1993. Urban coyotes (Canis latrans Say, 1823) in the Lower Mainland, British Columbia: public
perceptions and education. Masters Thesis, Science in Department of Animal Studies, UBC.

229
Wensauer D. 2004. Environmentally sensitive areas map. Capilano College Environmental Science and Management Program.
Wilkin JG, Edwards WC, Rawlings MA. 1995. Comparative environmental assessment of Lions Gate crossing options
related to Stanley Park and First Narrows: air quality. BH Levelton & Associates Ltd. Richmond, BC. Wilson, S.J., R. Hebda. 2008. Mitigating and Adapting to Climate Change through the Conservation of Nature. The
Land Trust of Alliance of BC. Salt Spring Island, BC. Worcester T, Coulson J, McDonald B. 1998. Characterization of Beaver Lake bog areas in Stanley Park, Vancouver.
In: Capilano College Environmental Science Program. Beaver Lake Ecological Studies: Stanley Park, Vancouver, B.C.
[WSDE, 2009] Washington State Department of Ecology website. 2009. Bryozoans. Retrieved 21 August, 2009.
http://www.ecy.wa.gov/programs/wq/plants/plantid2/descriptions/bryozoan.html Wu, B. and C. Starzyk. 1999. Civil 306, Assignment #3 Culvert Design/Evaluation. Project for the Beaver Lake Weir
(unpublished), In Zimmerman et al. 1999. A Study of the Beaver Creek Watershed: Historical Sedimentation, Contemporary Ecology and Hydrology with Predictive Modeling. UBC Environmental Sciences student project.
Yagi, H. 2008. A Preliminary Field Study of Ground-dwelling Invertebrates from Stanley Park.Douglas College
Environmental Sciences. Yalden, D.W. and P.E. Yalden. 1989. The sensitivity of breeding golden plovers Pluvialis apricaria to human intruders.
Bird Study 36: 49-55. Zimmermann, A., C. McIlhagga, C. Jarock, and O. Rogers. 1999. A Study of the Beaver Lake Watershed: Historical
Sedimentation, Contemporary Ecology and Hydrology with predictive Modeling. Environmental Sciences, University of British Ciolumbia. Not published.