Mitsubishi UFJ Morgan Stanley Securities Co., Ltd. Guidance ...
Upload
khangminh22Category
view
3download
0
( )
Morgan Stanley Bank International (China) Limited
1
Table of Contents

( )
Morgan Stanley Bank International (China) Limited
- 2 -

( )
Morgan Stanley Bank International (China) Limited
- 3 -

( )
Morgan Stanley Bank International (China) Limited
- 4 -
!
!
!
!
!


( )
Morgan Stanley Bank International (China) Limited
- 6 -
China, lead us to believe on the sustainable growth of China’s economy
in the next 5-10 years, and on it gradually becoming an important
consumer market. Despite the potential challenges it may encounter
through the process.
Last year, consistent with the recovery of the China economy, we saw
a satisfactory performance of the bank:
Firstly, the bank focused on building and expanding into the traditional
commercial banking business, established a corporate client base, is
seeking to diversify banking products and services. In 2010, the Bank
has established a strong client base mainly composed of the large and
medium sized state-owned enterprises and industry-leading private
enterprises, for example, China Petro, China Gold and Qingdao Hair
etc. From the product perspective, our bank has built up a high-quality
loan portfolio, It took advantage of our talent expertise, enhanced fee
income business through syndication arrangements, entrusted loans,
and by providing financial advisory services. In addition, the trading
desk covered trading transactions for treasury bonds, financial bonds
and corporate bonds. During the year, it was more actively involved in
the bond market, increased turnover and generated significant profit
also from this activity. By the end of 2010, the bank's total assets had
increased to RMB 5 bn, 105% higher than the previous year, and the

( )
Morgan Stanley Bank International (China) Limited
- 7 -
net income also increased by 16 times to RMB 58.6 million, compared
to 2009.
Secondly, all the regulatory ratios were greatly improved. By
December 31, 2010, all the regulatory ratios, including the Capital
Adequacy Ratio, Liquidity Ratio and Loan to Deposit Ratio have met
regulatory requirements. Particularly noteworthy is that in spite of
fierce market competition, the bank having only one branch and not yet
being able to offer structured deposits (due to the lack of a derivative
license) met the regulatory requirement on Loan to Deposit Ratio one
year ahead of deadline.
In addition, the bank continuously put efforts on the improvement of
corporate governance, especially on strengthening risk management
and internal control. During the year, the Bank has approved the 2010
Capital Planning, Liquidity and Funding Risk Management Policy,
revised the Operational Risk Policy, and also held emergency drills
according to the Business Continuity Plan.
All six of the relevant internal audits conducted in 2010 that covered
the main activities and support functions of the bank businesses
resulted in Satisfactory ratings.

( )
Morgan Stanley Bank International (China) Limited
- 8 -
The new year has begun, given its unprecedented opportunities. At the
same time, we are learning about how to deal with the unique
challenges presented by China.
In 2011, we will focus on:
! Grow loan book at a moderate pace, no more than 10% yoy;
! Further expand deposit client base and diversify funding sources;
! Enlarge turnover and gradually build a greater presence in the
bond market, while further improve profitability with market risk
well under control;
! Enhance risk management team and its capabilities; in particular,
owing to the relatively small size and concentration on wholesale
banking business, the bank will pay more attention on
strengthening liquidity and funding risk management;
! To strive for the approval of derivative license, in order to
enhance hedging capabilities and improve competitiveness by
developing new products and leveraging group expertise;
In the mid-term, the bank may consider to increase the registered
capital to support business development while enhancing the ability of
risk management. Also application of wealth management license is
under discussion as a mid-term plan.


( )
Morgan Stanley Bank International (China) Limited
- 10 -

( )
Morgan Stanley Bank International (China) Limited
- 11 -
Basic Information
Registered Corporate Name in Chinese:
Registered Corporate Name in English:
Morgan Stanley Bank International (China) Limited
Legal Representative: Carlos Alfonso Oyarbide
Registered Address: 28/F 2801-2807, 2816, Yuecai Building,
No.188 Jingshan Road, Jida, Zhuhai, Guangdong, P. R. China
Office Address: 28/F 2801-2807, 2816, Yuecai Building, No.188
Jingshan Road, Jida, Zhuhai, Guangdong, P. R. China
Date of First Registration: 14 December 1984
Authority of Registration:
Guangdong Provincial Administrative Bureau of Industry and Commerce
Corporate Business License Serial Number: 440000400000859
Financial Institution License Serial Number B0029H144040001
Tax Registration Certificate Number 440401X17502779
440401X17502779
Auditor Deloitte Touche Tohmatsu CPA Ltd
30/F Bund Center, 222 Yan An Road East, Shanghai 200002, PRC
( )
Morgan Stanley Bank International (China) Limited
- 12 -
( ) “ ”
(Morgan
Stanley Bank International Limited)
2006 9 29
2007 5 30
1984
42 1300

( )
Morgan Stanley Bank International (China) Limited
- 13 -
Introduction of Morgan Stanley
Bank International (China) Limited
Morgan Stanley Bank International (China) Limited (“the Bank”) is
wholly owned by Morgan Stanley Bank International Limited, a
subsidiary of Morgan Stanley.
The Bank, formerly known as Nan Tung Bank Ltd, Zhuhai, is a wholly
owned subsidiary of Morgan Stanley since September 2006.
Established in 1984 with the approval from the People’s Bank of China,
Nan Tung Bank was the first foreign-funded bank incorporated and
headquartered in mainland China. During the past two decades, the
Bank has been operating from its head office in Zhuhai and providing
banking products and services to its target clients. Subsequent to its
acquisition by Morgan Stanley, the Bank officially changed its name on
May 30, 2007 to Morgan Stanley Bank International (China) Limited.
The Bank’s ultimate holding company is a leading global financial
services firm that provides a wide range of investment banking,
securities, investment management and wealth management services.
Morgan Stanley serves corporations, governments, institutions and
individuals worldwide from more than 1300 offices in 42 countries.

( )
Morgan Stanley Bank International (China) Limited
- 14 -
Shareholder Name & Changes
Morgan Stanley Bank International Limited is the sole shareholder of
The Bank. There has been no change within the reporting period.

( )
Morgan Stanley Bank International (China) Limited
- 15 -
Shareholder Background
Morgan Stanley Bank International Limited (“MSBIL”), is a private
limited company duly incorporated on 23rd February 1999 and existing
in accordance with the laws of England, registered at the Companies
Registration Office for England and Wales under number 3722571 and
with registered office at 25 Cabot Square, Canary Wharf, London E14
4QA, England. The principal activity of MSBIL is the provision of
financial services to corporations, governments, financial institutions
and individuals. Such financial services include the provision of loans
and loan facilities, repurchase tendering to the European Central Bank
and trading in loans and financial instruments, including derivative
contracts and repurchase agreements. MSBIL holds a wholly owned
subsidiary in China – Morgan Stanley Bank International (China)
Limited, and operates 1 branch respectively in each country of Italy,
Germany and Korea. MSBIL is an indirect, wholly owned subsidiary of
Morgan Stanley and had total assets in excess of USD 12 billion at its
2010 financial year-end.

( )
Morgan Stanley Bank International (China) Limited
- 16 -
Shareholder Meeting Information
MSBIL being the sole shareholder of the Bank, its board of directors
acts in the capacity of the Bank’s shareholder. In 2010, the board of
directors of MSBIL:
o held regular quarterly meetings and ad hoc meetings when
required;
o received reports on the Bank that covered: 1) Market updates, 2)
Strategic Initiatives, 3) Business updates, and 4) Financial
updates
o MSBIL board of directors also approves director/supervisor
nominees of the Bank and any new capital injection proposals.
Change in Registered Capital, Merger or Spin-Off
There are no changes in registered Capital, merger or spin-off in 2010.

()
Morg
an S
tanley
Ban
k In
ternatio
nal (C
hin
a) Lim
ited
- 17 -
2010 12 31

()
Morg
an S
tanley
Ban
k In
ternatio
nal (C
hin
a) Lim
ited
- 18 -
Organization Chart – MSBIC Zhuhai
As of Dec 31, 2010
Finance
Chairman
General
Manager
Compliance OperationsTrading Admin.
Internal
Audit
Risk
ManagementITSales

( )
Morgan Stanley Bank International (China) Limited
- 19 -

( )
Morgan Stanley Bank International (China) Limited
- 20 -
Board of Directors and Senior Management Information
Functions of the Board
The board of directors shall be responsible to the Shareholder and
exercise the following powers in accordance with relevant laws and the
articles of association of the Bank:
(1) Formulating and amending the Bank’s articles of association;
(2) Determining the Bank’s business plans, investment plans and
strategic policies;

( )
Morgan Stanley Bank International (China) Limited
- 21 -
(3) Hearing, examining and approving the general manager’s work
reports;
(4) Examining and approving the annual final accounts of the Bank
and plans for dealing with any surplus profits;
(5) Appointing and dismissing the Bank’s senior management
personnel and deciding on remuneration programs for directors,
supervisors and senior management personnel, and appointing
external auditors;
(6) Examining and finalizing the establishment and the dissolution of
the Bank’s internal organizations;
(7) Reporting to the Shareholder on a regular basis;
(8) Approving the basic management system, internal rules and
business plans for daily operations of the Bank;
(9) Setting up various special committees, in accordance with the
Bank’s needs and actual circumstances, for making decisions in
various areas on behalf of the board of directors, or for providing
expert opinions in various areas to the board of directors, and for
carrying out inspection and supervision activities with respect to
the business situations in such areas. These special committees
shall each have clear objectives, powers and responsibilities;

( )
Morgan Stanley Bank International (China) Limited
- 22 -
(10) Examining and discussing capital increase, capital reduction,
share transfers and other important matters relating to the Bank;
(11) Determining and approving the establishment and termination of
business branches;
(12) Determining and approving the investment by the Bank in other
enterprises;
(13) Determining and approving profit allocation plans;
(14) Approving any application for extension of the term of the Bank;
(15) Approving the conduct of court proceedings, arbitrations and
other legal proceedings on behalf of the Bank; and
(16) Other powers as stipulated by laws and regulations, and the
Bank’s articles of association, or authorized by the Shareholder.
1
MicroStep,Inc

( )
Morgan Stanley Bank International (China) Limited
- 23 -

( )
Morgan Stanley Bank International (China) Limited
- 24 -
Carlos Alfonso OYARBIDE

( )
Morgan Stanley Bank International (China) Limited
- 25 -
Anthony Philip MULLINEAUX

( )
Morgan Stanley Bank International (China) Limited
- 26 -
Patrick Albert LYNCH

( )
Morgan Stanley Bank International (China) Limited
- 27 -
There were Six members on the Board of Directors of the Bank in
2010. Details are provided below:
1. Mr.He-Ning studied in Beijing College of Economics and then
University of Texas, obtained Bachelor of Economics and Master
of Arts respectively. From April 1985 to September 1989, he
worked for the Microstep, Inc as vice president of Operation.
During March 1990 to July 1993, he was an associate in Morgan
Stanley NY; Started from August 1993, he entered into Stock
Exchange Executive Council taking the position as Director
General of Fund Management Department. On January 1997, He-
Ning assumed the responsibility as Chief Representative of
Merrill Lynch Beijing Representative Office. From October 2000
to October 2002, he worked for the Beijing CCG Technology
Company as CEO. Since November 2002, he joined CITIC
Capital Inc. as a director and left this company in March 2005.
He Ning again joined Morgan Stanley in April 2005, he firstly
worked for the Morgan Stanley Asia Limited and then
relocated to Morgan Stanley Bank International Ltd. Beijing
Representative Office working as the Chief Representative from
December 2005 to December 2008. On January 2009, He Ning
was appointed as the chairman as well as the legal representative
of Morgan Stanley Bank International (China) Limited when
received the approval from CBRC Head Quarter. On May 2010,
He Ning changed his role from chairman to director of MSBIC
( )
Morgan Stanley Bank International (China) Limited
- 28 -
with the approval from CBRC Guangdong. On Nov 2010, the
MSBIL board accepted He Ning’s resignation as director.
2. Ms. Juliana Wang studied in York University, Toronto, Canada
and received a Bachelor and a Master Degree in business
management in June 1988 and June 1994 respectively. She
worked as an auditor for Price Waterhouse in Toronto, Canada
from September 1988 to May 1992 and received a Chartered
Accountant designation in Canada. From May 1992 to August
1995, she worked for Canadian Imperial Bank of Commerce in
its Structured Distribution Department, Corporate Banking
Department and Derivatives Product Development area. She
then joined Toronto Dominion Bank as a Senior Manager in the
Institutional Securities Internal Audit Department in August 1995.
In October 1997, Ms. Wang moved from Canada to Hong Kong
and joined as the Senior Manager and head of the Capital Market
Consultancy Department of Deloitte & Touche, Hong Kong. In
July 1998, Ms Wang joined Morgan Stanley in Hong Kong, and
in the past 10 years with Morgan Stanley has worked in the
Internal Audit, Operational Risk Management and the Fixed
Income Division. She was an Executive Director and the head of
Strategy and Execution in the Fixed Income Division of Morgan
Stanley Hong Kong regional office from March 2004 to 13 April
2008. From 14 April 2008 until present, she has been the General

( )
Morgan Stanley Bank International (China) Limited
- 29 -
Manager of Morgan Stanley Bank International (China) Ltd and
in addition, she was appointed as executive director of MSBIC
from 1 September 2009 onwards.
3 Mr. Carlos Alfonso OYARBIDE was a partner of C.E.S.E.A
from March 1979 to May 1980. He acted as a managing partner
at McKinsey & Company from August 1982 to December 1985.
From January 1986 to May 1988, he was a director of Manhattan
Bank in charge of the finance department. He also worked at
UBS Philips & Drew as an Executive Director supervising the
finance department. Mr Oyarbide joined Morgan Stanley in July
1993 and worked for the Firm until May 2003; in this decade, he
held various positions including Managing Director and Head of
Mergers & Acquisitions of Morgan Stanley Europe Ltd,
Managing Director and Head of Mergers & Acquisitions of
Morgan Stanley Asia Ltd, as well as CEO of Morgan Stanley
Spain Ltd. In 2003, he joined UBS as a Managing Director and
Asia Pacific Head of Financial Institutions Group from June
2003 to July 2007. From July 2007 onwards, he has been a
Managing Director of Morgan Stanley Asia Ltd and the Chief
Operating Officer of Morgan Stanley China. On Sep 2008
Carlos was appointed as director of MSBIC with the approval
from CBRC Guangdong. Effective from Aug 27, 2010, Carlos

( )
Morgan Stanley Bank International (China) Limited
- 30 -
was nominated as MSBIC chairman after obtaining the approval
from CBRC.
4 Mr. Anthony Philip MULLINEAUX was qualified as an ACA
and acted as Financial Statement Auditor to various financial
institutions, mainly within the insurance industry, with Coopers
Lybrand from September 1989 to November 1993. He joined
Morgan Stanley in November 1993, initially as a financial
controller for European investment grade bonds at Morgan
Stanley & Co. International Limited. From January 1995 to
March 2002 he moved to Morgan Stanley UK Group as European
Debt Capital Markets and Interest Rate Structured Bonds
Controller, European Head of Asset Swap Controllers, European
Head of Emerging Markets, Asset Swaps, Credit Derivative
Controllers and European Head of Fixed Income Derivative
Product Controllers Projects Team. From April 2002 to March
2003, he became European Head of Fixed Income Division
Management Reporting and Operations Officer to European
Head of Fixed Income Controllers. From April 2003 to June 2005,
he worked as European Head of Credit and Product Controllers
of Morgan Stanley UK Group. From June 2005 to August 2007,
he was European Head of Fixed Income and Equities Valuation
Review Group in Morgan Stanley UK Group, where he was

( )
Morgan Stanley Bank International (China) Limited
- 31 -
responsible for the independent audit of financial instruments.
From September 2007 until present, he has been the Head of the
Finance Control Group across the Asia Pacific (excluding Japan)
and Australasia region at Morgan Stanley.
5. Mr. Patrick Albert LYNCH was a Financial Analyst in the
Mergers & Acquisitions department of Salomon Brothers from
August 1991 to March 1993. He joined Cowen & Co. as as
Associate in its Healthcare Investment Banking division from
March 1993 to April 1995. He then joined InPhynet Medical
Management as Mergers & Acquisitions Consultant from April
to August 1995. He left the post in September 1995 and pursued
an MBA in the following two years. He came back in June 1997
and joined Morgan Stanley as a Trader for US Credit with
Morgan Stanley& Co. Incorporated. From August 2003 to March
2007, he was appointed as Head of Credit Trading, Risk
management and Special Situations for the European Corporate
Credit Group of Morgan Stanley & Co. International Limited in
London. From March 2007 to June 2008, he moved to Morgan
Stanley Asia Limited as Managing Director, Head of Asian
Corporate Credit Group and Co-Head of Asia Markets. In July
2008, he was deployed to Hong Kong as Managing Director of
Fixed Income Division, Head of International Corporate Credit
group in Morgan Stanley & Co. International plc. On Nov 2010,

( )
Morgan Stanley Bank International (China) Limited
- 32 -
Mr. Patrick officially resigned his position as MSBIC director
which was approved by MSBIL board as well.
6 Mr. Shangquan Gao graduated from the Faculty of Economics of
St. Paul’s University in Shanghai with a degree in Economics. He
is the Chairman of the China Society of Economic Reform, the
Chairman of China Enterprise Reform & Development Society, the
President of China Institute for Reform and Development (Hainan),
and a member of the United Nations Development Policy
Committee. He is also a professor and doctorial adviser at Beijing
University, Shanghai Jiaotong University and Nankai University,
and the President and Professor of the School of Management,
Zhejiang University. Mr. Gao has been an independent director of
the Bank since September 2006.

( )
Morgan Stanley Bank International (China) Limited
- 33 -

( )
Morgan Stanley Bank International (China) Limited
- 34 -
( )
Morgan Stanley Bank International (China) Limited
- 35 -
Senior Management Members:
The senior management of the Bank, under the leadership of the Board
of Directors, is responsible for managing the day-to-day operations of
the Bank. The members of the Senior Management Committee are:
( )
Morgan Stanley Bank International (China) Limited
- 36 -
1 Ms. Juliana Wang studied in York University, Toronto, Canada
and received a Bachelor and a Master Degree in business
management in June 1988 and June 1994 respectively. She
worked as an auditor for Price Waterhouse in Toronto, Canada
from September 1988 to May 1992 and received a Chartered
Accountant designation in Canada. From May 1992 to August
1995, she worked for Canadian Imperial Bank of Commerce in
its Structured Distribution Department, Corporate Banking
Department and Derivatives Product Development area. She
then joined Toronto Dominion Bank as a Senior Manager in the
Institutional Securities Internal Audit Department in August 1995.
In October 1997, Ms. Wang moved from Canada to Hong Kong
and joined as the Senior Manager and head of the Capital Market
Consultancy Department of Deloitte & Touche, Hong Kong. In
July 1998, Ms Wang joined Morgan Stanley in Hong Kong, and
in the past 10 years with Morgan Stanley has worked in the
Internal Audit, Operational Risk Management and the Fixed
Income Division. She was an Executive Director and the head of
Strategy and Execution in the Fixed Income Division of Morgan
Stanley Hong Kong regional office from March 2004 to 13 April
2008. From 14 April 2008 until present, she has been the General
Manager of Morgan Stanley Bank International (China) Ltd and
in addition, she was appointed as executive director of MSBIC
from 1 September 2009 onwards.

( )
Morgan Stanley Bank International (China) Limited
- 37 -
2 Mr, Steve Yang studied and received his Masters degree at Leeds
University, majoring in Economics. He worked at Aquazone
London as a market representative from 1998 to 1999. Mr. Yang
moved back to China and worked with U.S.Sino-sourcing Inc. as
a manager of the purchasing department from 1999 to 2000. He
joined Standard Chartered Shenzhen Branch, working as a senior
consultant in cash management, from 2001 to 2004. He joined
ABN-AMRO from June 2005 to August 2008, when he acted as
regional compliance manager, China coverage compliance officer
and anti-money-laundering (AML) officer. Since August 25,
2008, Mr. Yang has been the head of the Legal and Compliance
department of MSBIC.
3 Ms. Fay Chen received her Masters degree in Accountancy from
Glasgow University. She worked at Shenzhen Commercial Bank
as a supervisor from June 1995 to October 1999. She
subsequently joined Shanghai Pudong Development Bank,
Shenzhen branch, as Deputy Manager from November 1999 to
September 2002. From May 2004 to August 2007, she worked as
Lead Auditor at British Standards Institution, based in Shenzhen.
Since September 2007, Ms Chen has been the head of the Internal
Audit department of MSBIC. Since Aug 2010, Ms. Fay
transferred to Hongkong due to internal job relocation and no
longer took charge of Internal Audit Department.

( )
Morgan Stanley Bank International (China) Limited
- 38 -
4 Ms. Linda Li obtained her Bachelor Degree of Accountancy from
Harbin Institute of Technology. And she also earned the
qualification of CPA in China. From September 1996 to May
2003, she worked for the Dandong Branch of The Industry and
Commercial Bank of China as Accounting Manager. During June
2003 to July 2006, she worked with Standard Chartered Bank
Shanghai Branch as Finance Supervisor. From August 2006 to
May 2007, she worked in Development Bank of Singapore as
Financial Project Manager. On June 2007, she joined United
Overseas Bank acted as the head of Finance Department. Since
February 2009, she joined MSBIC and now takes the position as
the head of the Finance Department.
5 Ms. Amanda Zhao studied in Renmin University of China and
obtained her Bachelor degree of Law in 1994. From July 1994 to
Dec 1995, Ms Amanda Zhao worked for ChemChina Group in
Sales, Import & Export Dept. Since Jan 1996, she worked with
the Mizuho Corporate Bank, Beijing Branch as the Senior
Accountant and then Senior Loan Officer. Almost during the time
from 1995 to 1999, she continued to pursue the master degree in
Chinese Academy of Social Sciences. From April 2000 to Sep
2009, she worked as the representative with Landesbank Baden-
Wuerttemberg, Beijing office. In Sep 2003. Ms, Amanda Zhao

( )
Morgan Stanley Bank International (China) Limited
- 39 -
joined Citic Ka Wah Bank, Beijing Representative Office as
Chief Representative. Since Jan 2006, she became the Head of
the Preparatory Office of Citic Ka Wah Bank. In Oct 2006, she
played a role as First Vice President, China Banking Dept. in
Citic Ka Wah Bank, Hongkkong. In March 2008, she was
appointed as Beijing Branch manager of Citic Ka Wah Bank until
Aug 2008, and she held the concurrent post as the Deputy
General Manager during the time from June 2010 to Aug 2010.
On Aug, 2010, Ms. Amanda Zhao joined Morgan Stanley and
was approved by CBRC Beijing as Beijing Branch manager later
on Nov 2010.

( )
Morgan Stanley Bank International (China) Limited
- 40 -
Composition of the Board of Supervisors and its Work
Functions of the Board of Supervisors
The board of supervisors shall constitute the Bank’s supervisory
organization, responsible to the Shareholder, with the following powers:
(1) Exercising scrutiny over the acts of the directors and senior
management personnel in the performance of their duties that
contravene laws and regulations or the articles of association of the
Bank; bringing forward proposals for the removal of any director
or senior management member who violates any law,
administrative regulation, the Articles of Association or any
resolution of the Shareholder’s meeting;
(2) Requesting the rectification of any acts of the directors and senior

( )
Morgan Stanley Bank International (China) Limited
- 41 -
management personnel that harm the rights and interests of the
Bank, Shareholder, employees, deposit customers, or other
interested parties; organizing the investigation of and proposing
solutions for major cases;
(3) Examining and monitoring the Bank’s financial activities, and
examining the Bank’s annual final accounts;
(4) Reporting to the Shareholder on the status of work performance of
the directors and senior management personnel;
(5) Initiating actions against directors or senior management according
to Article 152 of the PRC Company Law implemented, and which
may be amended from time to time, effective from 1st January
2006; and
(6) Other powers as stipulated by laws and regulations, and the Bank’s
articles of association, or authorized by the Shareholder.
The supervisors have the right to attend but not vote at meetings of the
board of directors.
Christopher Jackson

( )
Morgan Stanley Bank International (China) Limited
- 42 -
Jackson
Christopher
Jackson
Philip A.May
Philip May

( )
Morgan Stanley Bank International (China) Limited
- 43 -
Composition of the Board of Supervisors
The Board of Supervisors is composed of three supervisors, and their
detailed information is as follows:
1. Mr. Christopher Jackson holds a bachelor degree from London
University and a masters degree from CASS, City University
London. From 1989 to 1995 he worked in London and New York
for Merrill Lynch in Corporate Finance and Debt Capital Markets
positions. Mr. Jackson has been based in Asia since 1995. In this
region, he has had responsibility for Debt Capital Markets coverage
and management of Fixed Income and Equity business infrastructure.
Prior to joining Morgan Stanley Mr. Jackson's most recent role was
the Chief Administrative Officer for the Asia Pacific Equities
business at Lehman Brothers from 2003 to 2008. Mr. Jackson joined
Morgan Stanley in October 2008 as the Chief Operating Officer of
the Asia Pacific IRCC Division. In this role Mr. Jackson is
responsible for maintaining operational standards and excellence in
all the products functions of the business as well as aligning the
business with the Global & Regional franchises. Mr. Jackson is also
responsible for planning and executing the
( )
Morgan Stanley Bank International (China) Limited
- 44 -
strategic growth of the business in the region.
2. Mr. Philip A. May is a managing director in the Legal and
Compliance department of Morgan Stanley Asia Ltd. He is
responsible for the legal business of fund transactions, including
asset management and fixed income business coverage in Asia
Pacific. Mr. Philip May joined Morgan Stanley Hong Kong in 2000
and worked on the expansion of the company’s presence, including
the acquisition and merger of Nan Tung Bank (the former bank of
MSBIC).
3. Ms. Yena Lei holds a bachelor degree from Tianjin University of
Finance. From July 1991 to August 1993, she worked in the
Industrial and Commercial Bank of China as Accountant. From
September 1993 to March 2002, she acted as a Deputy Branch
Manger with Standard Chartered Bank, Tianjin Branch. During
April 2002 to January 2004, she was appointed as Senior Officer in
Operation department of Citibank. And then she left for UBS,
Beijing branch working as the Deputy Director. Since May 2008,
she joined MSBIC taking the role as vice president of Operation
Department.

( )
Morgan Stanley Bank International (China) Limited
- 45 -

( )
Morgan Stanley Bank International (China) Limited
- 46 -

( )
Morgan Stanley Bank International (China) Limited
- 47 -
( )
Morgan Stanley Bank International (China) Limited
- 48 -

( )
Morgan Stanley Bank International (China) Limited
- 49 -

( )
Morgan Stanley Bank International (China) Limited
- 50 -
Risk Management
During 2010, strictly following the management requirements of the
regulatory authority and the Board of Directors, the Bank continued to
make active efforts in promoting proactive and comprehensive risk
management, which provided strong support to the stable and vigorous
operation of the Bank. The Board of Directors of the Bank and its
subordinate Risk Management Committee, the Senior Management and
its subordinate Credit Management Committee, Operational risk
Management Committee and Assets & Liabilities Management
Committee and other specialized management committees, the Risk
Management Department, the Internal Auditing Department and the
Compliance Department constitute the main organizational structure for
risk management of the Bank, and directly manage all kinds of risks
through vertical management.

( )
Morgan Stanley Bank International (China) Limited
- 51 -
I. Credit Risks
Credit risks refer to the risks related to the losses incurred due to the
default of debtors or counterparties. They are among the major risks
encountered in a bank’s operations. The Bank has constructed a
scientific and sophisticated credit risk management system to guide and
regulate credit business, so as to achieve comprehensive, unified,
timely and effective supervision on and control over credit risks.
During 2010, in active response to the changes in the macroeconomic
situation, the Bank implemented stable and vigorous credit policies
with focus on expanding the low-risk credit services for high-quality
enterprises.
During the same year, the Bank witnessed a significant increase in its
loans, with its year-end credit assets, including issued loans, advances
and purchased loans, totaled to RMB 1,033,800,000 Yuan, an increase
of 180% over the end of 2009. This is mainly attributable to the Bank’s
active efforts in identifying new high-quality corporate clients across
the nation and in increasing working capital loans. As of December 31,
2010, the newly added net corporate credit assets were RMB
600,046,000 Yuan, accounting for 61.9% of the total year-end loan
balance.

( )
Morgan Stanley Bank International (China) Limited
- 52 -
Quality of credit assets
During 2010, the Bank mainly issued its loans to domestic large-scale
enterprises with stable and vigorous operations as well as corporate
clients with adequate guarantees and sound corporate backgrounds. The
previous mortgage assets have been transferred and all the loans issued
to small and medium-sized enterprises (SMEs) have been repaid. As of
December 31, 2010, all the loans of the Bank have been issued to large-
scale state-owned enterprises (SOEs).
The Bank classified its credit assets into five levels in accordance with
the Guidance on Classification of Loan Risks promulgated by China
Banking Regulatory Commission and with consideration of its internal
management requirements. In 2010, all the credit assets were in normal
category according to this five-level classification and there were no
bad loans. This mainly because the newly added loans during the year
were all high-quality corporate loans, and meanwhile the previous
SMEs mortgage loans were fully repaid, which further improved the
overall quality of its credit assets.
The Bank applies individual evaluation to the loans and advances
which show indications of asset impairment or satisfy the single major
loan standard, and accrues impairment reserves in a case-by-case
manner. In terms of the loans and advances which have no asset
impairment upon individual evaluation and those that are not covered

( )
Morgan Stanley Bank International (China) Limited
- 53 -
in the scope of the above-mentioned individual evaluation, the
combined evaluation method is applied to accrue impairment reserves.
According to evaluation, as of December 31, 2010, the total credit
assets of the Bank were RMB 1,033,800,000 Yuan, and the credit
assets impairment reserves accrued by the Bank through individual
evaluation method and combined evaluation method were both zero;
pursuant to the relevant regulatory requirements, the Bank actually
accrued general risk reserves of RMB 13,667,360 Yuan with the
cumulative balance reaching RMB 22,071,000 Yuan. The balance of
the reserves accrued by the Bank satisfies the relevant regulatory
requirements.
Concentration risk
The Bank strictly follows the requirements of the regulatory authority
to prudently manage the degree of loan concentration. By the end of
2010, the ratio of loans issued to the single largest debtor by the Bank
was 8.03% and the ratio of loans issued to associate debtors was zero,
both in compliance to the relevant regulatory requirements.
Risks in securities investment
As of December 31, 2009, all the investments of the Bank were in
trading financial assets, with the balance of RMB 2,529,763,000. In
terms of investment structure, the domestic investment of the Bank
mainly involved Chinese government bonds, central bank notes and

( )
Morgan Stanley Bank International (China) Limited
- 54 -
policy bank bond. The corporate bonds in which we invested were also
medium-term notes maintaining AAA credit rating in the ratings made
by China Securities Depository and Clearing Corporation Limited.
Therefore the credit risks of the investments of the Bank are relatively
low.
II. Market Risk Management
Market risks refer to the risks related to losses of on-balance sheet
activities and off-balance sheet activities of a bank due to adverse
changes in market prices. The market risks of a bank mainly include
interest rate risk and foreign exchange risk.
In order to ensure effective implementation of market risk management,
the Bank has organically integrated the identification, measuring,
monitoring and control of market risks with the overall strategic
planning, business decision making, financial budgeting and other
operation and management activities of the entire Bank. The Bank has
set up related rules and management procedures in accordance with
global market risk management practices so as to ensure management
of market risks in respect of legal entities. To this end, the Bank has
appointed market risk managers to monitor whether its market risk
management complies with the relevant rules and management
procedures.

( )
Morgan Stanley Bank International (China) Limited
- 55 -
With consideration of its major trading business (bond investments –
government bonds, central bank notes, policy financial bonds and
corporate bonds) in 2010, the Bank applied the following major market
risk management methods: limits management (including trading limits,
risk limits and stop-loss limits), comparison of daily market value of
bonds, and market risk capital management. The Bank utilized, among
others, the FLOW System (risk system) of the Group to achieve excess
management. In case an excess appears, the relevant department must
explain the reason for excess and measures to be adopted, and make
responses through appropriately authorized procedures.
Market risk managers are responsible for market risk monitoring and
control, and will report to the Assets & Liability Management
Committee on a regular basis. The Bank has established and improved
the market risk limits management system and has standardized the
policies, procedures and report mechanisms with respect to market risk
management. The Internal Auditing Department carries out regular
audits for market risk management to ensure effective operation of the
risk management system. The market risk management of the Bank is
sufficient and effective.
III. Operational Risks
Operational risks refer to the risks related to financial losses or other
losses incurred due to internal procedures, employees and malfunction

( )
Morgan Stanley Bank International (China) Limited
- 56 -
of the information technology system of a bank as well as external
events (for example, external or internal fraud, legal and compliance
risks, damage to physical assets ), including those related to potential
damage to the goodwill of a bank.
In order to ensure its sustained development, the Bank has established
governance structure, management strategy and overall policies for
operational risks which have been implemented with the authorization
of the Board of Directors. The Operational Risk Committee of the Bank
is responsible for the actual implementation and management of the
policies.
The framework of operational risk management aims to establish the
operational risk standards applicable to the entire Bank, which involve
risk evaluation, monitoring and management. Under this framework,
the Operational Risk Committee, the Senior Management and chiefs of
departments jointly monitor and manage the operational risks of the
Bank to lower down the possibility for accidental events during
operations. The identification, recording and reporting of solutions to
internal operational risk events applied by the Bank are mainly used to
transmit important information and identify the root causes of problems
and risk relief measures so as to meet the requirements of the Bank and
the regulatory authority on operational risk management. Through
monthly operational risk meetings and the operational risk management

( )
Morgan Stanley Bank International (China) Limited
- 57 -
and report mechanism, the Bank makes timely report to the Senior
Management in relation to the the evaluations on major risks in the
operational risk area and internal control efforts, with a view to
adjusting and improving the operational risk management procedures.
IV. Liquidity Risks
Liquidity risks refer to the risks related to the losses or bankruptcy of a
commercial bank due to its incapability of providing financing to
decrease liabilities and/or increase assets.
The Assets & Liability Committee, the Finance and Accounting
Department, the Treasury Department, the Capital Transaction
Department and the Treasury Department of the Group work together
to carry out effective liquidity management, promptly identify and
control short-term as well as medium and long-term liquidity risks to
ensure that the Bank is able to operate under the optimized liquidity
status, to effectively control lending cost and drive up the Bank’s
investment returns, and to ensure that the capital of the Bank is able to
meet the demands related to daily operations.
The Capital Transaction Department collects capital demands of each
business unit and the corresponding terms every day and, on this basis,
makes statistics on the surpluses or shortage of all kinds of capitals of
the Bank and accordingly make foreign exchange transactions and

( )
Morgan Stanley Bank International (China) Limited
- 58 -
capital allocation or carry out Renminbi borrowing in the nation-wide
inter-bank borrowing market. The Capital Transaction Department of
the Bank is responsible for controlling liquidity ratio of the current day
and the Finance and Accounting Department is responsible for
calculating the liquidity ratio of the previous working day on a daily
basis, so as to ensure that the liquidity of the Bank complies with the
requirements under the Regulations on the Administration of Foreign-
funded Banks of the People’s Republic of China.
The Bank has applied the liquidity risk pressure test/emergency
financing program, and submits to the Assets & Liabilities Committee
for its review on a monthly basis. The main purpose of establishing the
emergency financing program is to ensure that the Bank is able to
maintain normal business operation for one year in the context of long-
term credit/liquidity crunch in the market.
In conclusion, the Bank has set up a risk management system suitable
for the nature, scope and sophistication of its business and is able to
effectively monitor and control risks.

( )
Morgan Stanley Bank International (China) Limited
- 59 -
!
!
!
!
!
!
!

( )
Morgan Stanley Bank International (China) Limited
- 60 -

( )
Morgan Stanley Bank International (China) Limited
- 61 -
Morgan Stanley Bank International (China) Limited (MSBIC)
Internal Audit Annual Work Report for 2010
Internal Audit prepares and submits its Internal Audit Annual Work
Report for 2010 in accordance with CBRC guidelines. The audit status
and accomplishments of Internal Audit for 2010 are as follows:
1 Internal Audit reported to the MSBIC Audit Committee in every
quarter of 2010 to update the Audit Committee on the overall control
environment of MSBIC, audit plan status, high risk audit findings and
any significant matters or disagreements, of which there were none.
2 Internal Audit completed the following audits in 2010 according
to the approved audit plan:
! Operational Risk Management
! Lending and Loan Operations
! Related Party Transactions
! Anti-Money Laundering
! Emergency Response & Precautionary Measures (BCP)
! Trading and Market Risk Management
3 The following unplanned review was added to the audit plan for
2010:

( )
Morgan Stanley Bank International (China) Limited
- 62 -
! Special Audit of Information Technology Risks for 2010 Asian
Games was added in Q2 as an ad-hoc exercise required by the
provincial CBRC for all banks.
The list of audits and a summary of their risk findings are
provided in the Appendix to this report.
4 The Audit Committee approved the 2011 internal audit plan in
December 2010, with audit scope covering Liquidity Risk Management,
Beijing Branch, Anti-Money Laundering, Related Party Transactions,
Trading and Market Risk Management, and Emergency Response &
Precautionary Measures (BCP).
Appendix: 2010 Audits and Findings
Audit Rating Findings and Risks
Operational
Risk
Management
Satisfactory Internal Audit identified one Moderate risk that the outsourcing risk management
policy has not been established at Morgan Stanley Bank International (China)
Limited (MSBIC) onshore in accordance with Rule 20 of the Operational Risk
Management Guideline for Commercial Banks issued by the China Banking
Regulatory Commission (CBRC).
Special Audit
of Information
Technology
Risks for 2010
Asian Games
Not
applicable
Not rated. No High risk finding.
Lending and
Loan
Operations
Internal Audit identified one Moderate risk and one Low risk findings. The
Moderate risk finding related to the bank’s credit policy manual is inconsistent with
the firm’s Global Financial Holding Company Credit Policy and is pending update
by the Credit Department. The Low risk finding related to lack of documented pre-
clearance from Legal with respect to the use of an outside legal counsel.
Related Party
Transaction
Satisfactory Internal Audit identified two Low risk findings: MSBIC lacks a procedure to inform
new senior management of its related-party disclosure obligations, and the Related
Party Transactions Committee (RPTC) failed to submit related-party listings to the
Board of Supervisors, as required by regulation.
Anti-Money Satisfactory No risk finding.

( )
Morgan Stanley Bank International (China) Limited
- 63 -
Audit Rating Findings and Risks
Laundering
Emergency
Response &
Precautionary
Measures
(BCP)
Satisfactory Internal Audit identified one Moderate risk and one Low risk findings. The
Moderate risk finding related to the omission of certain key information required by
CBRC in the Zhuhai and Beijing 2010 Business Continuity Plan when the plan was
transitioned to a new format. The Low risk finding related to the 2010 disaster
recovery drill plan excluding certain technical recovery procedures for Beijing. Trading and
Market Risk
Management
Satisfactory Internal Audit identified one high risk, three Moderate and three Low risk findings. The
High finding is related to failures to timely report legal-entity limit breaches to onshore
management, as one limit was not set up correctly by FID management in the global risk
signoff system, FLOW. The Moderate findings relate to delays in meeting a regulatory
requirement on interest-rate risk management for savings and deposits, a trader’s
inconsistent signoff of daily risk positions, and MRD’s lack of review of an onshore risk-
management policy manual. The Low risk findings relate to reporting of monthly stress-test
results to the China Banking Regulatory Commission (CBRC), maintenance of MSBIC
Risk Committee meeting minutes, and timely escalation of limit breaches to bank
management. The High risk finding has been closed.
Note: Internal Audit tracks the remediation actions of all High risk findings quarterly and review the remediation of
Moderate and Low risks findings in the next audit.

( )
Morgan Stanley Bank International (China) Limited
( )
2010 12 31
64

( )
Morgan Stanley Bank International (China) Limited
2010 12 31
1 - 2
3 - 4
5
6
7
8 - 56
65

( )
Morgan Stanley Bank International (China) Limited
( ) (11) P0
( )
( ) ( “ ”)
2010 12 31 2010
(1)
(2)
66

67

( )
Morgan Stanley Bank International (China) Limited
2010 12 31
7 66,635,189.42 79,298,187.46
8 128,907,824.53 437,025,462.65
9 666,227,000.00 -
10 2,529,763,390.00 1,497,641,342.53
11 25,013,920.47 17,287,586.56
12 968,681,000.00 268,634,637.82
13 - 100,000,000.00
14 19,488,787.00 18,418,859.00
15 7,958,323.63 9,424,862.46
16 5,196,693.32 6,851,050.23
17 4,155,439.36 242,700.63
18 334,803,503.00 29,006,499.49 ______________ ______________
4,756,831,070.73 2,463,831,188.83 ______________ ______________ ______________ ______________
( )
68

69

( )
Morgan Stanley Bank International (China) Limited
2010 12 31
148,761,061.04 65,932,270.90 ______________ ______________
31 59,889,122.09 57,931,851.41 ______________ ______________
31 93,807,794.60 75,870,461.20
31 33,918,672.51 17,938,609.79
32 91,514,563.36 62,860,240.23 ______________ ______________
32 99,151,870.52 63,534,069.42
32 7,637,307.16 673,829.19
33 9,635,143.22 33,154,153.93
34 (21,791,297.75) (93,472,260.40)
/( ) 8,306,558.60 (657,807.80)
35 1,206,971.52 6,116,093.53 ______________ ______________
75,406,326.35 65,346,503.90 ______________ ______________
36 10,897,977.15 8,672,047.55
37 64,508,349.20 57,056,490.83
38 - (382,034.48) ______________ ______________
73,354,734.69 585,767.00 ______________ ______________
39 1,155,842.92 99,249.98
40 357,249.37 8,346.72 ______________ ______________
74,153,328.24 676,670.26 ______________ ______________
41 15,913,727.07 (2,920,434.64) ______________ ______________
58,239,601.17 3,597,104.90 ______________ ______________ ______________ ______________
- - ______________ ______________
58,239,601.17 3,597,104.90 ______________ ______________ ______________ ______________
7070

( )
Morgan Stanley Bank International (China) Limited
2010 12 31
2,058,264.44 19,283,616.69
- 607,357,274.46
1,673,549,624.75 163,785,001.49
257,224,430.00 -
302,000,000.00 -
96,824,631.02 82,362,170.40
34,392,000.25 1,163,360.42 ________________ ________________
2,366,048,950.46 873,951,423.46 ________________ ________________
700,046,362.18 -
- 1,058,758,000.00
66,227,000.00 -
35,199,550.37 12,636,165.43
31,438,089.06 26,651,822.09
42,883,150.20 29,592,751.59
312,319,810.85 27,746,708.48 ________________ ________________
1,188,113,962.66 1,155,385,447.59 ________________ ________________
1,177,934,987.80 (281,434,024.13) ________________ ________________
100,000,000.00 400,271,326.07
71,800,866.57 76,198,737.98
25,935.03 127,735.03 ________________ ________________
171,826,801.60 476,597,799.08 ________________ ________________
3,263,968.86 11,487,839.72
1,054,983,273.22 - ________________ ________________
1,058,247,242.08 11,487,839.72 ________________ ________________
(886,420,440.48) 465,109,959.36 ________________ ________________
(10,236,919.04) (2,624,620.15) ________________ ________________
281,277,628.28 181,051,315.08 ________________ ________________
42 481,590,187.71 300,538,872.63
42 762,867,815.99 481,590,187.71 ________________ ________________ ________________ ________________
7171
( )
Morgan Stanley Bank International (China) Limited
2010 12 31
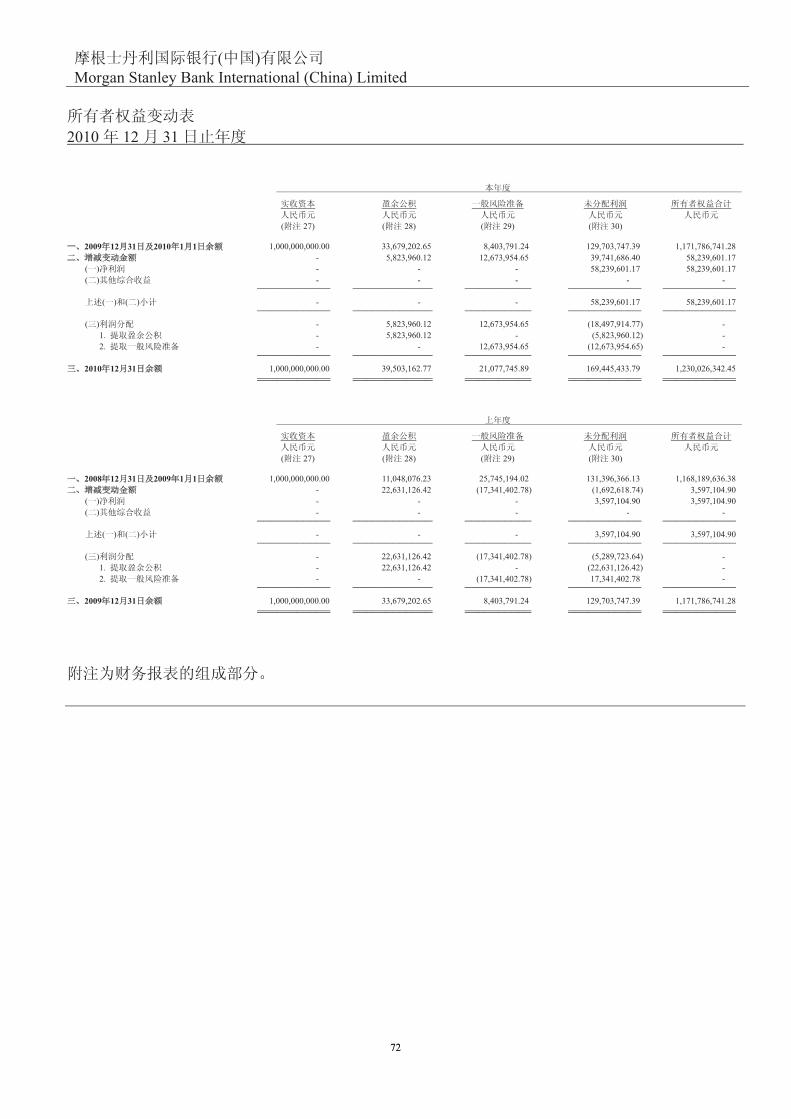
( 27) ( 28) ( 29) ( 30)
2009 12 31 2010 1 1 1,000,000,000.00 33,679,202.65 8,403,791.24 129,703,747.39 1,171,786,741.28
- 5,823,960.12 12,673,954.65 39,741,686.40 58,239,601.17
( ) - - - 58,239,601.17 58,239,601.17
( ) - - - - - ___________ ____________ __________ ___________ ___________
( ) ( ) - - - 58,239,601.17 58,239,601.17 ___________ ____________ __________ ___________ ___________
( ) - 5,823,960.12 12,673,954.65 (18,497,914.77) -
1. - 5,823,960.12 - (5,823,960.12) -
2. - - 12,673,954.65 (12,673,954.65) - ___________ ____________ __________ ___________ ___________
2010 12 31 1,000,000,000.00 39,503,162.77 21,077,745.89 169,445,433.79 1,230,026,342.45 ___________ ____________ __________ ___________ ___________ ___________ ____________ __________ ___________ ___________
( 27) ( 28) ( 29) ( 30)
2008 12 31 2009 1 1 1,000,000,000.00 11,048,076.23 25,745,194.02 131,396,366.13 1,168,189,636.38
- 22,631,126.42 (17,341,402.78) (1,692,618.74) 3,597,104.90
( ) - - - 3,597,104.90 3,597,104.90
( ) - - - - - ___________ ____________ __________ ___________ ___________
( ) ( ) - - - 3,597,104.90 3,597,104.90 ___________ ____________ __________ ___________ ___________
( ) - 22,631,126.42 (17,341,402.78) (5,289,723.64) -
1. - 22,631,126.42 - (22,631,126.42) -
2. - - (17,341,402.78) 17,341,402.78 - ___________ ____________ __________ ___________ ___________
2009 12 31 1,000,000,000.00 33,679,202.65 8,403,791.24 129,703,747.39 1,171,786,741.28 ___________ ____________ __________ ___________ ___________ ___________ ____________ __________ ___________ ___________
7272

( )
Morgan Stanley Bank International (China) Limited
2010 12 31
1.
( ) ( “ ”)
1984 10 19 1984 12 14
20 300,000,000
2002 8 22 100,000,000
400,000,000 2002 11
2004 9 2 003414
1984 12 14 2024 12 14
2006 9 8 ( “ ”)
100%
2006 9 21 003573
2007 4 2 600,000,000
1,000,000,000 2007 5 14
( ) 2007 7 17
2007 7 19
440000400000859 2007 12 31
1,000,000,000 250,000,000
750,000,000
2008 6 281,477,395.13
250,000,000.00 2009 12 31
1,000,000,000 500,000,000
500,000,000
2010 1 167,803,891.84
166,000,000.00 2010 12 31
1,000,000,000 666,000,000.00
334,000,000.00 27
2009 6 10 2009 6 24
2009 6 24 2024 12 14
188 28 2801-2807
2816
7373

( )
Morgan Stanley Bank International (China) Limited
1. -
2.
2006 2 15 (
“ ”)
3.
2010 12
31 2010
4.
1 1 12 31
7474

( )
Morgan Stanley Bank International (China) Limited
4. -
( )
( )
7575
( )
Morgan Stanley Bank International (China) Limited
4. -
-
-
(1)
(2)
(3)
7676

( )
Morgan Stanley Bank International (China) Limited
4. -
-
(1)
(2)
(3)
(4)
(5)
(6)
-
-
(7)
( )
( )
7777

( )
Morgan Stanley Bank International (China) Limited
4. -
-
-
(1)
(2)
(3)
( )
7878

( )
Morgan Stanley Bank International (China) Limited
4. -
-
-
13 — 14
—
( )
(
)
7979
( )
Morgan Stanley Bank International (China) Limited
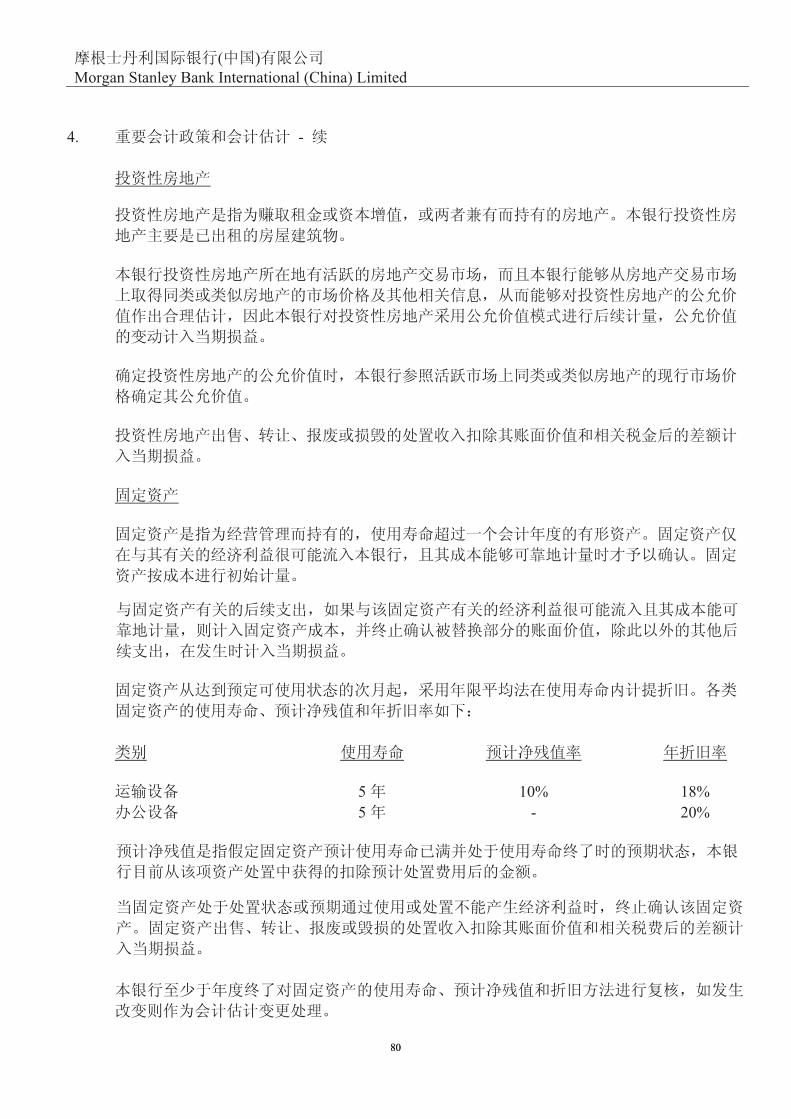
4. -
5 10% 18%
5 - 20%
8080

( )
Morgan Stanley Bank International (China) Limited
4. -
8181

( )
Morgan Stanley Bank International (China) Limited
4. -
( [2005]49 )
(
) (
) (
) ( ) (
)
1%
2006 1 1 1
( )
( )
8282

( )
Morgan Stanley Bank International (China) Limited
4. -
-
8383

( )
Morgan Stanley Bank International (China) Limited
4. -
( )
5.
4
8484

( )
Morgan Stanley Bank International (China) Limited
5. -
(
)
8585

( )
Morgan Stanley Bank International (China) Limited
6.
2007 3 ( “ ”)
2008 1 1
( [2008]10 )
( [2008]28 )
[2007]39
2008 1 1 5
15% 2008 18% 2009 20%
2010 22% 2011 24% 2012 25%
2010 22%(2009 20%)
5%
(
[2010]35 ) (
[2010]103 ) 2010 12 1
7% 3%
7.
74.375,992 -
04.264,337,43 69.791,576,23
95.151,562,44 64.199,959,33 _____________ ______________
64.781,892,97 24.981,536,66 _____________ ______________ _____________ ______________
[ (2007)134 ]
2007 5 15
5% 5%
2010 12 16
2010 12 20 16.5%
16.5%
8686

87
( )
Morgan Stanley Bank International (China) Limited
8.
10.507,277,21 96.113,453,5
46.757,252,424 48.215,355,321 _____________ ______________
56.264,520,734 35.428,709,821 _____________ ______________
9.
- 00.000,722,666 _____________ ______________
10.
00.066,812,25 00.030,995,112
35.286,030,563,1 00.063,411,912,2
00.000,293,08 00.000,050,99 ______________ ______________
35.243,146,794,1 00.093,367,925,2 ______________ ______________
( 21)
1,212,000,000 (2009 910,000,000 ) 3
11.
(1)
30.806,093,02 65.685,782,71
02.164,078,57 06.497,708,39
)76.284,379,87( )96.064,180,68( _____________ _____________
65.685,782,71 74.029,310,52 _____________ _____________
87

( )
Morgan Stanley Bank International (China) Limited
11. -
(2)
- 71,288.86 293,738.08
- 1,462,982.93 -
- 4,551,751.84 682,869.11
- 18,927,896.84 16,257,879.37
- - 53,100.00 _____________ _____________
25,013,920.47 17,287,586.56 _____________ _____________ _____________ _____________
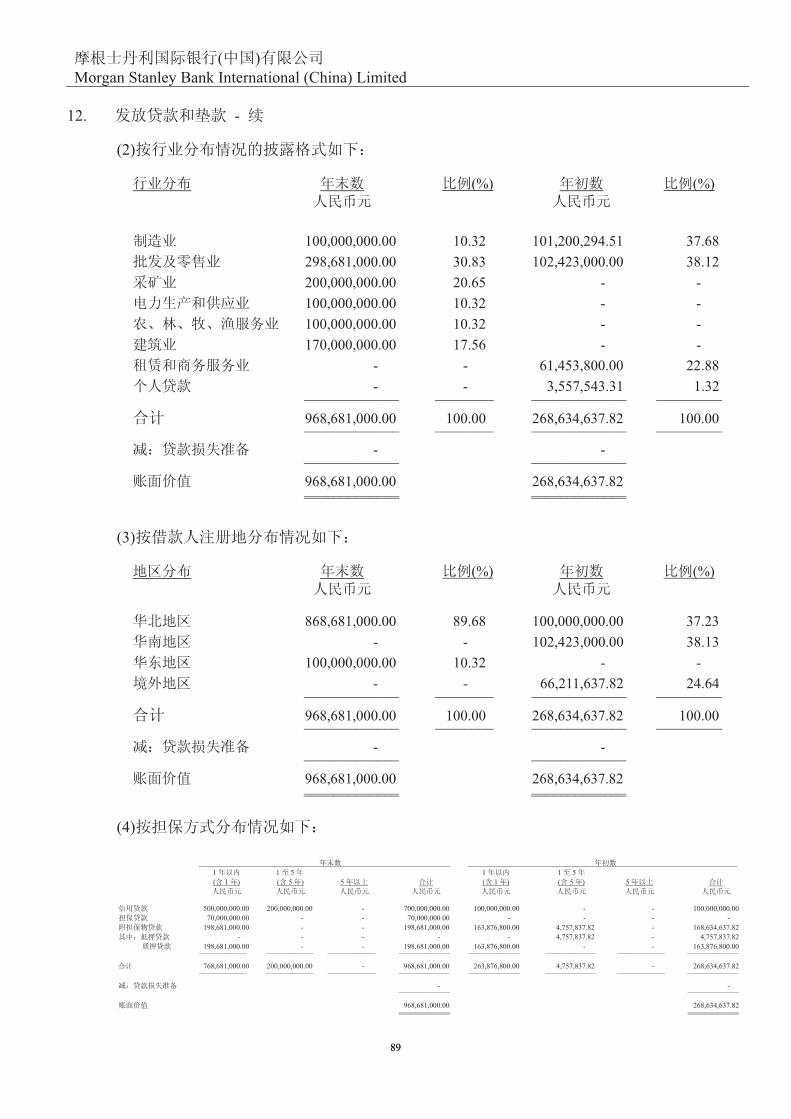
12.
(1)
968,681,000.00 265,077,094.51
- 3,557,543.31 _____________ _____________
968,681,000.00 268,634,637.82 _____________ _____________
- - _____________ _____________
968,681,000.00 268,634,637.82 _____________ _____________ _____________ _____________
8888
( )
Morgan Stanley Bank International (China) Limited
12. -
(2)
(%) (%)
100,000,000.00 10.32 101,200,294.51 37.68
298,681,000.00 30.83 102,423,000.00 38.12
200,000,000.00 20.65 - -
100,000,000.00 10.32 - -
100,000,000.00 10.32 - -
170,000,000.00 17.56 - -
- - 61,453,800.00 22.88
23.1 13.345,755,3 - - _________ _____________ ________ _____________
968,681,000.00 100.00 268,634,637.82 100.00 _________ _____________ ________ _____________
- - _____________ _____________
968,681,000.00 268,634,637.82 _____________ _____________ _____________ _____________
(3)
(%) (%)
868,681,000.00 89.68 100,000,000.00 37.23
31.83 00.000,324,201 - -
100,000,000.00 10.32 - -
46.42 28.736,112,66 - - _________ _____________ ________ _____________
968,681,000.00 100.00 268,634,637.82 100.00 _________ _____________ ________ _____________
- - _____________ _____________
968,681,000.00 268,634,637.82 _____________ _____________ _____________ _____________
(4)
1 1 5 1 1 5
( 1 ) ( 5 ) 5 ( 1 ) ( 5 ) 5
500,000,000.00 200,000,000.00 - 700,000,000.00 100,000,000.00 - - 100,000,000.00
70,000,000.00 - - 70,000,000.00 - - - -
198,681,000.00 - - 198,681,000.00 163,876,800.00 4,757,837.82 - 168,634,637.82
- - - - - 4,757,837.82 - 4,757,837.82
198,681,000.00 - - 198,681,000.00 163,876,800.00 - - 163,876,800.00 ______________ _____________ ______________ ______________ ______________ _____________ _____________ _____________
768,681,000.00 200,000,000.00 - 968,681,000.00 263,876,800.00 4,757,837.82 - 268,634,637.82 ______________ _____________ ______________ ______________ ______________ _____________ _____________ _____________
- - ______________ ______________
28.736,436,862 00.000,186,869 ______________ ______________ ______________ ______________
8989

( )
Morgan Stanley Bank International (China) Limited
13.
- 100,000,000.00 _____________ _____________ _____________ _____________
14.
18,418,859.00
1,069,928.00 ______________
19,488,787.00 ______________ ______________
15.
251,665.98 13,885,259.53 14,136,925.51
- 1,603,486.02 1,603,486.02
- (682,325.33) (682,325.33) ____________ ____________ _____________
251,665.98 14,806,420.22 15,058,086.20 ____________ ____________ _____________
117,024.69 4,595,038.36 4,712,063.05
45,299.88 2,642,461.55 2,687,761.43
- (300,061.91) (300,061.91) ____________ ____________ _____________
162,324.57 6,937,438.00 7,099,762.57 ____________ ____________ _____________
134,641.29 9,290,221.17 9,424,862.46 ____________ ____________ _____________ ____________ ____________ _____________
89,341.41 7,868,982.22 7,958,323.63 ____________ ____________ _____________ ____________ ____________ _____________
9090

( )
Morgan Stanley Bank International (China) Limited
16.
8,936,152.55
150,423.00 ______________
9,086,575.55 ______________
2,085,102.32
1,804,779.91 ______________
3,889,882.23 ______________
6,851,050.23 ______________ ______________
5,196,693.32 ______________ ______________
17.
(1)
1,230,340.16 - 295,281.64 -
1,944,941.06 1,042,551.13 486,235.27 260,637.78
47,396,560.00 24,535,335.47 11,375,174.40 5,397,773.80
3,311,350.00 - 794,724.00 - ___________ ___________ ___________ ___________
53,883,191.22 25,577,886.60 12,951,415.31 5,658,411.58 ___________ ___________ ___________ ___________ ___________ ___________ ___________ ___________
19,488,787.00 18,418,859.00 4,872,196.75 4,604,714.75
16,349,080.00 3,686,346.38 3,923,779.20 810,996.20 ___________ ___________ ___________ ___________
35,837,867.00 22,105,205.38 8,795,975.95 5,415,710.95 ___________ ___________ ___________ ___________ ___________ ___________ ___________ ___________
9191

( )
Morgan Stanley Bank International (China) Limited
17. -
(2)
12,951,415.31 5,658,411.58
(8,795,975.95) (5,415,710.95) _____________ _____________
4,155,439.36 242,700.63 _____________ _____________ _____________ _____________
(3) 2008 1 1 [2007]39
2008 1
1 5
15% 2008 18% 2009 20%
2010 22% 2011 24% 2012 25%
2010 22%(2009
20%)
(4)
18.
1,024,953.61 1,035,153.61
679,777.65 -
71,096.17 709,117.80
(1) 4,566,236.30 10,129,975.47
- 11,643,840.06
26,242,976.84 5,467,163.58
297,676,000.00 -
4,542,462.43 21,248.97 ______________ ______________
334,803,503.00 29,006,499.49 ______________ ______________ ______________ ______________
9292

( )
Morgan Stanley Bank International (China) Limited
18. -
(1)
16,275,024.26
1,510,059.84
(1,047,474.01)
(4,122,713.76) ______________
12,614,896.33 ______________
6,145,048.79
6,026,325.00
(4,122,713.76) ______________
8,048,660.03 ______________
10,129,975.47 ______________ ______________
4,566,236.30 ______________ ______________
19.
173,175,536.74 2,652.38 _____________ ____________ _____________ ____________
20.
220,000,000.00 -
98,678,230.00 61,453,800.00 ______________ _____________
318,678,230.00 61,453,800.00 ______________ _____________ ______________ _____________
9393

( )
Morgan Stanley Bank International (China) Limited
21.
1,212,000,000.00 910,000,000.00 ______________ ______________ ______________ ______________
22.
68,445,698.62 104,432,116.51
1,718,236.45 5,343,482.15
1,709,880,001.28 168,910,080.00
5,725,558.16 6,707,075.46 _______________ _____________
1,785,769,494.51 285,392,754.12 _______________ _____________ _______________ _____________
23.
6,836,877.75 23,848,795.22 (26,766,271.39) 3,919,401.58
- 2,485,356.94 (1,662,501.91) 822,855.03
- 1,070,766.15 (1,070,766.15) -
- 532,749.30 (532,749.30) -
- 1,415,645.81 (1,405,800.31) 9,845.50 ___________ ____________ ____________ ____________
6,836,877.75 29,353,313.42 (31,438,089.06) 4,752,102.11 ___________ ____________ ____________ ____________ ___________ ____________ ____________ ____________
9494

( )
Morgan Stanley Bank International (China) Limited
24.
7,714,696.74 18,445,325.84
4,148,735.15 3,741,518.22
60,677.35 1,770,970.96
102,271.15 21,308.93 ____________ ____________
12,026,380.39 23,979,123.95 ____________ ____________ ____________ ____________
25.
(1)
848,030.20 11,157,386.82
33,918,672.51 17,938,609.79
(27,562,243.21) (28,247,966.41) ____________ ____________
7,204,459.50 848,030.20 ____________ ____________ ____________ ____________
(2)
- 2,534,976.83 531,842.77
- 1,201,061.94 0.29
- 844,422.96 215,719.91
- 2,623,997.77 100,467.23 ____________ ____________
7,204,459.50 848,030.20 ____________ ____________ ____________ ____________
9595

( )
Morgan Stanley Bank International (China) Limited
26.
301,742.88 301,742.88
6,993,198.35 1,554,132.16
5,903,583.80 1,675,334.11 ____________ ______________
13,198,525.03 3,531,209.15 ____________ ______________ ____________ ______________
27.
1,000,000,000.00 2010 12 31
%
67% 666,000,000.00
33% 334,000,000.00 _______________
1,000,000,000.00 _______________ _______________
%
50% 500,000,000.00
50% 500,000,000.00 _______________
1,000,000,000.00 _______________ _______________
(2002)
72 (2007) 11
9696
( )
Morgan Stanley Bank International (China) Limited
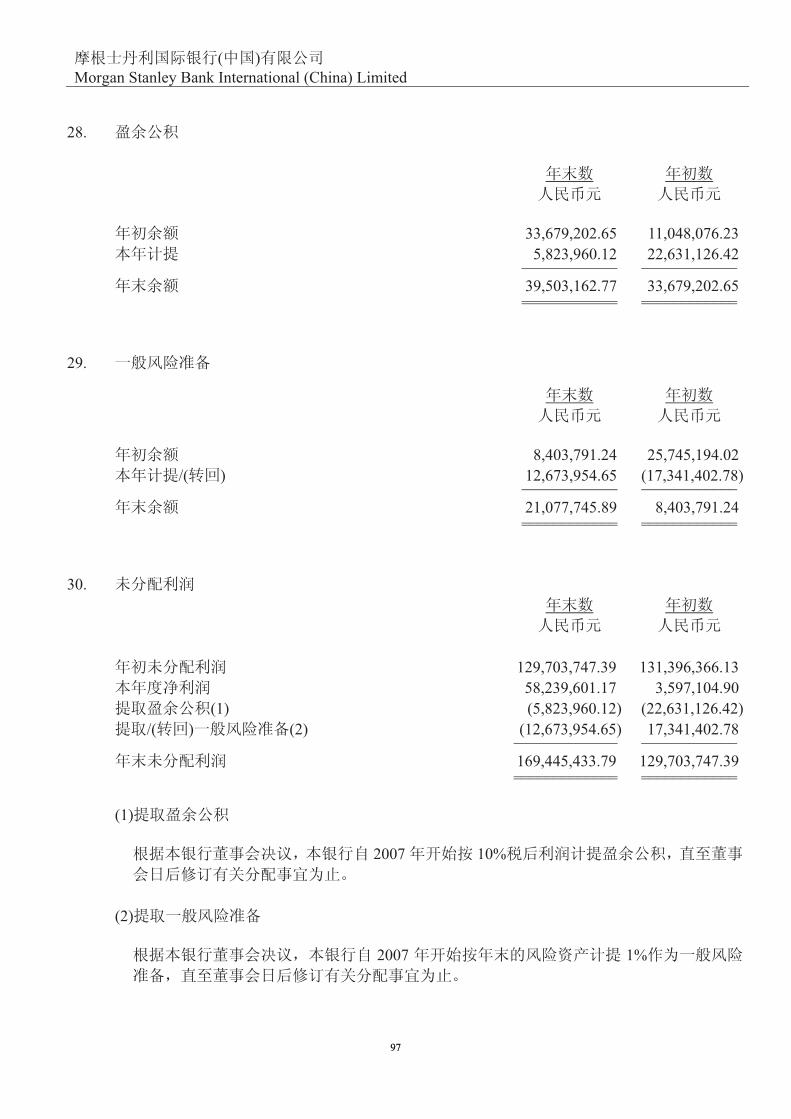
28.
33,679,202.65 11,048,076.23
5,823,960.12 22,631,126.42 ____________ ____________
39,503,162.77 33,679,202.65 ____________ ____________ ____________ ____________
29.
8,403,791.24 25,745,194.02
/( ) 12,673,954.65 (17,341,402.78) ____________ ____________
21,077,745.89 8,403,791.24 ____________ ____________ ____________ ____________
30.
129,703,747.39 131,396,366.13
58,239,601.17 3,597,104.90
(1) (5,823,960.12) (22,631,126.42)
/( ) (2) (12,673,954.65) 17,341,402.78 _____________ ____________
169,445,433.79 129,703,747.39 _____________ ____________ _____________ ____________
(1)
2007 10%
(2)
2007 1%
9797

( )
Morgan Stanley Bank International (China) Limited
31.
- 69.930,225,2 63.590,663,2
- 63.208,246,1 17.677,017,1
- 15.768,765,1 97.922,468,2
- 75.162,906,44 28.097,014,16
- 08.983,574,52 29.159,030,22
- 00.001,35 00.059,424,3 ____________ _____________
02.164,078,57 06.497,708,39 ____________ _____________
- 75.701 10.170,102,1
- 51.577,028,4 05.056,612,5
- 54.747,464,11 29.901,390,22
- 26.979,256,1 80.148,704,5 ____________ _____________
97.906,839,71 15.276,819,33 ____________ _____________
14.158,139,75 90.221,988,95 ____________ _____________ ____________ _____________
32.
- 00.000,002 00.000,046,1
- 08.567,697,22 30.787,812,92
- 12.971,364,93 90.980,722,66
- 89.526,32 08.709,43
- 83.957,351 05.067
- 45.584,577 56.826,039,1
- 15.352,121 54.796,99 ____________ _____________
24.960,435,36 25.078,151,99 ____________ _____________
- - 00.000,078,6
- 91.928,376 61.703,767 ____________ _____________
91.928,376 61.703,736,7 ____________ _____________
32.042,068,26 63.365,415,19 ____________ _____________ ____________ _____________
9898

( )
Morgan Stanley Bank International (China) Limited
33.
9,635,143.22 33,154,153.93 _____________ ____________ _____________ ____________
34. ( )/
(22,861,225.75) (93,982,708.40)
1,069,928.00 510,448.00 _____________ ____________
(21,791,297.75) (93,472,260.40) _____________ ____________ _____________ ____________
35.
- 5,408,782.26
1,206,971.52 707,311.27 _____________ ____________
1,206,971.52 6,116,093.53 _____________ ____________ _____________ ____________
36.
10,717,871.22 8,619,297.67
180,105.93 52,749.88 _____________ ____________
10,897,977.15 8,672,047.55 _____________ ____________ _____________ ____________
9999

( )
Morgan Stanley Bank International (China) Limited
37.
29,353,313.42 29,351,320.37
6,701,715.85 7,548,488.35
1,073,836.45 671,229.43
5,610,792.02 4,990,819.57
271,373.49 56,274.57
572,344.77 773,856.95
205,185.64 125,421.84
2,687,761.43 2,358,863.52
6,026,325.00 3,939,112.60
1,804,779.91 1,787,230.56
4,511,350.00 929,032.26
5,689,571.22 4,524,840.81 _____________ ____________
64,508,349.20 57,056,490.83 _____________ ____________ _____________ ____________
38.
- (382,034.48) _____________ ____________ _____________ ____________
39.
1,148,700.00 -
6,254.92 24,381.43
- 74,868.55
888.00 - _____________ ____________
1,155,842.92 99,249.98 _____________ ____________ _____________ ____________
2010
100100

( )
Morgan Stanley Bank International (China) Limited
40.
357,106.44 949.80
142.93 7,396.92 _____________ ____________
357,249.37 8,346.72 _____________ ____________ _____________ ____________
41.
19,643,238.74 20,645,325.68
(3,912,738.73) (18,448,895.12)
183,227.06 (5,116,865.20)
183,227.06 (3,535,188.59)
- (1,581,676.61) _____________ ____________
15,913,727.07 (2,920,434.64) _____________ ____________ _____________ ____________
74,153,328.24 676,670.26
22% ( 20%) 16,313,732.21 135,334.05
305,940.50 727,717.78
(706,756.96) (137,073.75)
416,115.67 -
183,227.06 (3,535,188.59)
(598,531.41) (111,224.13) _____________ ____________
15,913,727.07 (2,920,434.64) _____________ ____________ _____________ ____________
101101

( )
Morgan Stanley Bank International (China) Limited
42.
66,635,189.42 79,298,187.46
(32,675,197.96) (34,733,462.40)
128,907,824.53 437,025,462.65
600,000,000.00 - _______________ _____________
762,867,815.99 481,590,187.71 _______________ _____________ _______________ _____________
43.
58,239,601.17 3,597,104.90
- (382,034.48)
2,687,761.43 2,358,863.52
1,804,779.91 1,787,230.56
6,026,325.00 3,939,112.60
/( ) 357,106.44 (73,918.75)
(9,635,143.22) (33,154,153.93)
(64,835,740.82) (44,609,261.57)
21,791,297.75 93,472,260.40
(3,912,738.73) (18,448,895.12)
/( ) (1,079,584,682.87) 656,378,752.92
/( ) 2,244,996,421.74 (946,299,085.18) _______________ _______________
1,177,934,987.80 (281,434,024.13) _______________ _______________
- 299,573.47
299,573.47 2,968,794.79
762,867,815.99 481,290,614.24
481,290,614.24 297,570,077.84 _______________ _______________
281,277,628.28 181,051,315.08 _______________ _______________ _______________ _______________
102102

( )
Morgan Stanley Bank International (China) Limited
44.
135,584,536.34 13,176,524.70 - 148,761,061.04
51,564,896.39 8,324,225.70 - 59,889,122.09
749,577.63 (749,577.63) - -
86,684,570.06 4,829,993.30 - 91,514,563.36
(2,664,930.11) 22,305.70 - (2,642,624.41) _____________ ____________ ____________ _____________
45,609,619.28 29,796,707.07 - 75,406,326.35 _____________ ____________ ____________ _____________
( ) 89,974,917.06 (16,620,182.37) - 73,354,734.69 _____________ ____________ ____________ _____________
4,467,564,565.74 1,936,455,349.55 1,651,344,283.92 4,752,675,631.37 _____________ ____________ ____________ _____________ _____________ ____________ ____________ _____________
3,210,750,031.41 1,867,398,980.79 1,551,344,283.92 3,526,804,728.28 _____________ ____________ ____________ _____________ _____________ ____________ ____________ _____________
6,511,565.63 4,007,300.71 - 10,518,866.34
797,506.60 2,466,462.26 - 3,263,968.86
70,800.00 1,532,686.02 - 1,603,486.02
576,283.60 933,776.24 - 1,510,059.84
150,423.00 - - 150,423.00
103103

( )
Morgan Stanley Bank International (China) Limited
44. -
65,144,790.25 787,480.65 - 65,932,270.90
57,135,092.81 796,758.60 - 57,931,851.41
(212,954.38) 212,954.38 - -
62,869,685.73 (9,445.50) - 62,860,240.23
(54,859,988.29) 167.55 - (54,859,820.74) _____________ ____________ ____________ _____________
52,549,490.81 12,797,013.09 - 65,346,503.90 _____________ ____________ ____________ _____________
( ) 12,595,299.44 (12,009,532.44) - 585,767.00 _____________ ____________ ____________ _____________
2,547,088,331.38 92,430,274.11 175,687,416.66 2,463,831,188.83 _____________ ____________ ____________ _____________ _____________ ____________ ____________ _____________
1,363,292,057.66 4,439,806.55 75,687,416.66 1,292,044,447.55 _____________ ____________ ____________ _____________ _____________ ____________ ____________ _____________
5,188,872.34 2,896,334.34 - 8,085,206.68
(382,034.48) - - (382,034.48)
3,100.00 11,484,739.72 - 11,487,839.72
3,100.00 3,503,482.52 - 3,506,582.52
- 7,981,257.20 - 7,981,257.20
(1)
36,835,278.16 54,572,509.02
111,925,782.88 11,359,761.88 _____________ _____________
148,761,061.04 65,932,270.90 _____________ _____________ _____________ _____________
(2)
62,033,699.16 6,435,520.62
86,727,361.88 59,496,750.28 _____________ _____________
148,761,061.04 65,932,270.90 _____________ _____________ _____________ _____________
(3)
104104

( )
Morgan Stanley Bank International (China) Limited
44. –
(4)
45.
(1)
790,000,000.00 100%
2010
Morgan Stanley
(2)
( )
( )
( )
( )
105105
( )
Morgan Stanley Bank International (China) Limited
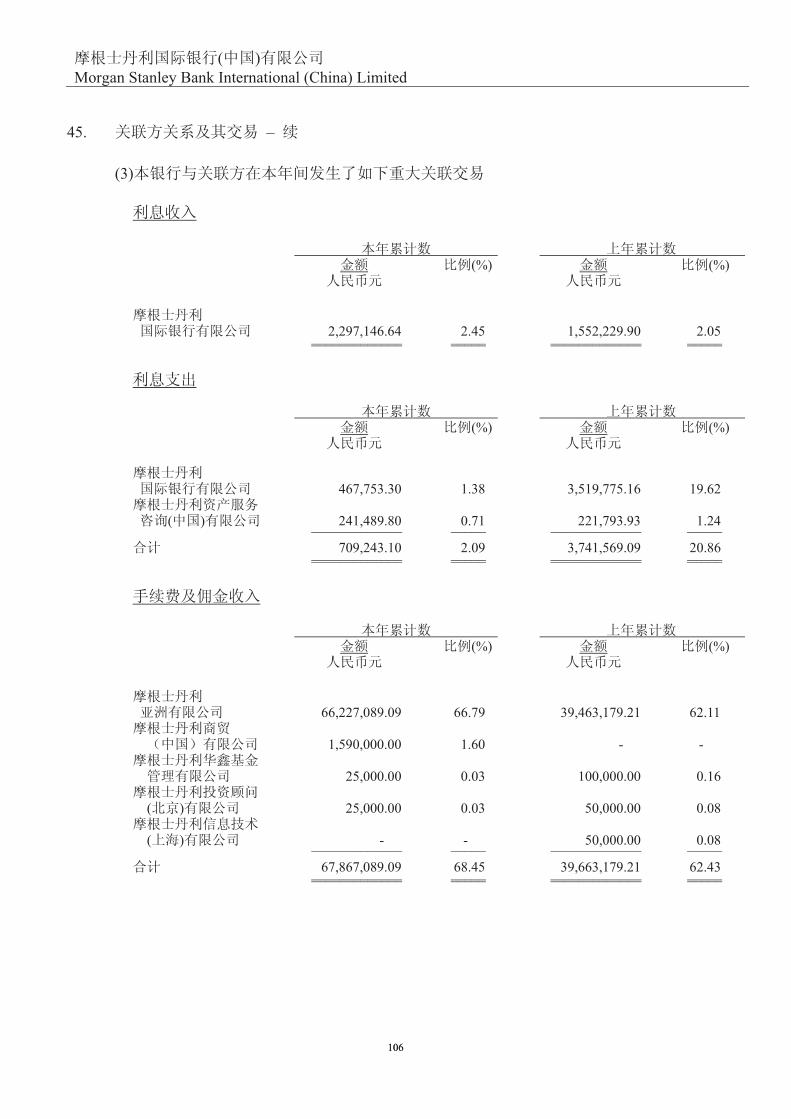
45. –
(3)
(%) (%)
2,297,146.64 2.45 1,552,229.90 2.05 _____________ _____ _____________ _____ _____________ _____ _____________ _____
(%) (%)
467,753.30 1.38 3,519,775.16 19.62
( ) 241,489.80 0.71 221,793.93 1.24 _____________ _____ _____________ _____
709,243.10 2.09 3,741,569.09 20.86 _____________ _____ _____________ _____ _____________ _____ _____________ _____
(%) (%)
66,227,089.09 66.79 39,463,179.21 62.11
1,590,000.00 1.60 - -
25,000.00 0.03 100,000.00 0.16
( ) 25,000.00 0.03 50,000.00 0.08
( ) - - 50,000.00 0.08 _____________ _____ _____________ _____
67,867,089.09 68.45 39,663,179.21 62.43 _____________ _____ _____________ _____ _____________ _____ _____________ _____
106106

( )
Morgan Stanley Bank International (China) Limited
45. –
(3) –
(%) (%)
3,311,350.00 5.13 - -
( ) 1,200,000.00 1.86 929,032.26 1.63 _____________ _____ _____________ _____
4,511,350.00 6.99 929,032.26 1.63 _____________ _____ _____________ _____ _____________ _____ _____________ _____
(4)
(%) (%)
- - 412,747,400.00 94.44 _____________ _____ _____________ _____ _____________ _____ _____________ _____
(%) (%)
98,678,230.00 30.96 61,453,800.00 100.00 _____________ _____ _____________ _____ _____________ _____ _____________ _____
(%) (%)
( ) 38,186,666.28 2.14 39,122,777.08 13.71
179.44 0.00 124.66 0.00 _____________ _____ _____________ _____
38,186,845.72 2.14 39,122,901.74 13.71 _____________ _____ _____________ _____ _____________ _____ _____________ _____
107107

( )
Morgan Stanley Bank International (China) Limited
45. –
(4) –
(%) (%)
- - 265,131.06 1.53 _____________ _____ _____________ _____ _____________ _____ _____________ _____
(%) (%)
52,409.07 0.73 215,719.91 25.44
( ) 1,909.32 0.03 1,793.15 0.21
0.02 0.00 - - _____________ _____ _____________ _____
54,318.41 0.76 217,513.06 25.65 _____________ _____ _____________ _____ _____________ _____ _____________ _____
(%) (%)
26,242,976.84 7.84 5,467,163.58 18.85
6,300.51 0.00 21,249.36 0.07 _____________ _____ _____________ _____
26,249,277.35 7.84 5,488,412.94 18.92 _____________ _____ _____________ _____ _____________ _____ _____________ _____
(%) (%)
3,442,064.44 26.08 268,040.51 7.59
( ) 300,000.00 2.27 300,000.00 8.50 _____________ _____ _____________ _____
3,742,064.44 28.35 568,040.51 16.09 _____________ _____ _____________ _____ _____________ _____ _____________ _____
108108

( )
Morgan Stanley Bank International (China) Limited
45. –
(5)
(%) (%)
4,650,391.10 15.84 6,866,451.30 23.39 _____ _____________ _____ _____________ _____ _____________ _____ _____________
46.
00.002,337,4 00.002,055,4 ____________ ____________ ____________ ____________
47.
- 00.000,000,323 _____________ ______________ _____________ ______________
- 00.000,000,323 _____________ ______________ _____________ ______________
48.
( 2004 2 )
049,353 482,678
404,85 898,67
235,761,1 555,522,1
406,751,1 014,512,1
829,9 541,01
%97.601 %41.66
%17.701 %07.66
109109

( )
Morgan Stanley Bank International (China) Limited
49.
1 3,340 4,841
2 69 3,583
3 - 133 _________ ________
3,409 8,557 _________ ________ _________ ________
50.
(I)
(1)
110110
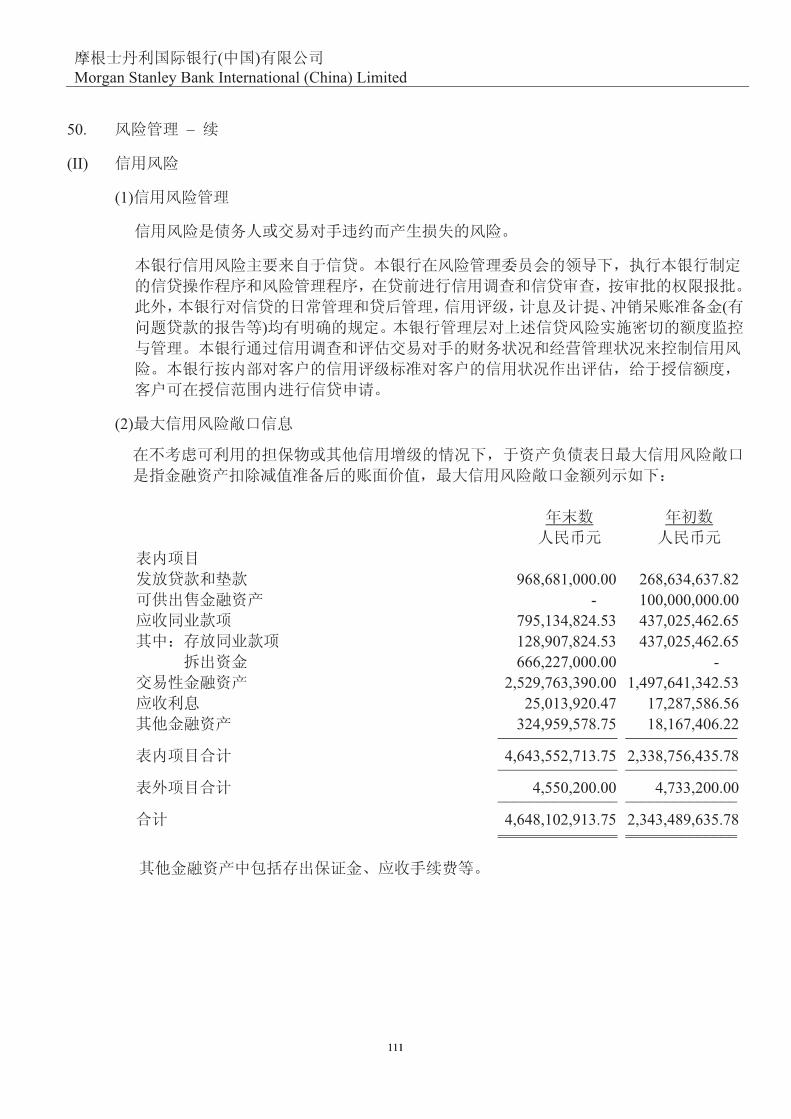
( )
Morgan Stanley Bank International (China) Limited
50. –
(II)
(1)
(
)
(2)
968,681,000.00 268,634,637.82
- 100,000,000.00
795,134,824.53 437,025,462.65
128,907,824.53 437,025,462.65
666,227,000.00 -
2,529,763,390.00 1,497,641,342.53
25,013,920.47 17,287,586.56
324,959,578.75 18,167,406.22 _______________ ______________
4,643,552,713.75 2,338,756,435.78 _______________ ______________
4,550,200.00 4,733,200.00 _______________ ______________
4,648,102,913.75 2,343,489,635.78 _______________ ______________ _______________ ______________
111111

( )
Morgan Stanley Bank International (China) Limited
50. –
(II) –
(2) –
(3)
(i) 2010 12 31 (2009 )
(ii)
- 00.000,186,869 00.000,186,869 ______________ ______________ ______________ ______________
35.428,431,597 35.428,431,597 ______________ ______________ ______________ ______________
- 28.736,436,862 28.736,436,862 ______________ ______________ ______________ ______________
56.264,520,734 56.264,520,734 ______________ ______________ ______________ ______________
112112

( )
Morgan Stanley Bank International (China) Limited
50. –
(II) –
(4)
(i) 2,529,763,390.00 1,497,641,342.53 ______________ ______________ ______________ ______________
(i)
A1 - 49,200,000.00
AA3 211,599,030.00 -
( ) 2,318,164,360.00 1,448,441,342.53 _______________ ______________
2,529,763,390.00 1,497,641,342.53 _______________ ______________ _______________ ______________
AAA
(5)
- 100,000,000.00 _______________ ______________ _______________ ______________
(6)
12(2)
113113

( )
Morgan Stanley Bank International (China) Limited
50. –
(III)
(1)
25%
(i)
(ii)
/
(iii) ALCO
(2)
/ 1 1-3 3-12 1
33,960 - - - - 32,675 66,635
128,908 - - - - - 128,908
- 600,000 66,227 - - - 666,227
- 2,328,371 201,392 - - 2,529,763
- 893 5,228 18,893 - - 25,014
- - 499,340 269,341 200,000 - 968,681
198,336 125,593 - 6 1,025 324,960 __________ _________ __________ __________ __________ __________ ___________
361,204 3,054,857 772,187 288,240 200,000 33,700 4,710,188 __________ _________ __________ __________ __________ __________ ___________
3 - - 173,173 - - 173,176
- - 220,000 98,678 - - 318,678
192,000 820,000 200,000 - - - 1,212,000
70,164 - 211,512 1,504,093 - - 1,785,769
93 1,808 1,800 3,504 - - 7,205
- 5,480 - - 2,041 301 7,822 __________ _________ __________ __________ __________ __________ ___________
262,260 827,288 633,312 1,779,448 2,041 301 3,504,650 __________ _________ __________ __________ __________ __________ ___________
98,944 2,227,569 138,875 (1,491,208) 197,959 33,399 1,205,538 __________ _________ __________ __________ __________ __________ ___________ __________ _________ __________ __________ __________ __________ ___________
114114
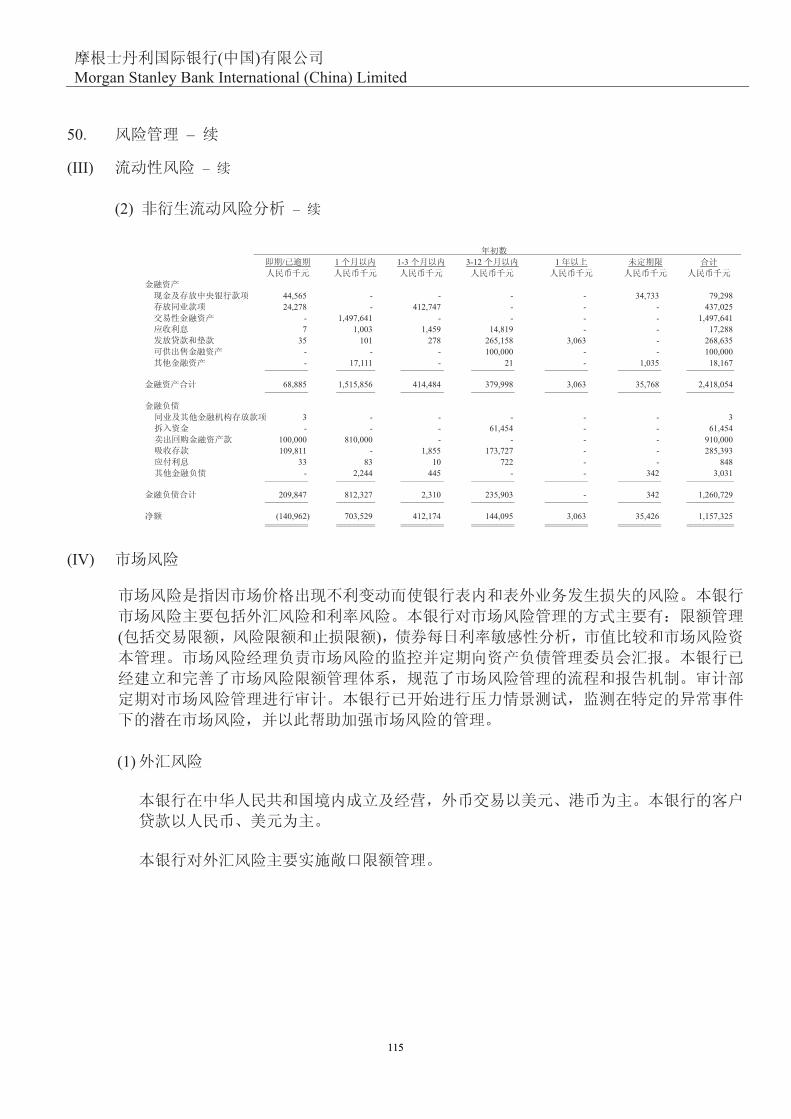
( )
Morgan Stanley Bank International (China) Limited
50. –
(III) –
(2) –
/ 1 1-3 3-12 1
44,565 - - - - 34,733 79,298
24,278 - 412,747 - - - 437,025
- 1,497,641 - - - - 1,497,641
7 1,003 1,459 14,819 - - 17,288
35 101 278 265,158 3,063 - 268,635
- - - 100,000 - - 100,000
- 17,111 - 21 - 1,035 18,167 __________ _________ __________ __________ __________ __________ ___________
68,885 1,515,856 414,484 379,998 3,063 35,768 2,418,054 __________ _________ __________ __________ __________ __________ ___________
3 - - - - - 3
- - - 61,454 - - 61,454
100,000 810,000 - - - - 910,000
109,811 - 1,855 173,727 - - 285,393
33 83 10 722 - - 848
- 2,244 445 - - 342 3,031 __________ _________ __________ __________ __________ __________ ___________
209,847 812,327 2,310 235,903 - 342 1,260,729 __________ _________ __________ __________ __________ __________ ___________
(140,962) 703,529 412,174 144,095 3,063 35,426 1,157,325 __________ _________ __________ __________ __________ __________ ___________ __________ _________ __________ __________ __________ __________ ___________
(IV)
( )
(1)
115115

( )
Morgan Stanley Bank International (China) Limited
50. –
(IV) –
(1) –
61,182 5,232 221 - 66,635 5,354 102,926 20,581 47 128,908
600,000 66,227 - - 666,227 2,529,763 - - - 2,529,763
22,075 2,939 - - 25,014 770,000 198,681 - - 968,681
100,024 224,930 6 - 324,960 ___________ _______ ________ _________ __________
4,088,398 600,935 20,808 47 4,710,188 ___________ _______ ________ _________ __________
173,176 - - - 173,176 220,000 98,678 - - 318,678
1,212,000 - - - 1,212,000 1,678,683 104,559 2,527 - 1,785,769 7,055 150 - - 7,205
2,470 3,527 1,825 - 7,822 ___________ _______ ________ _________ __________
3,293,384 206,914 4,352 - 3,504,650 ___________ _______ ________ _________ __________
795,014 394,021 16,456 47 1,205,538 ___________ _______ ________ _________ __________ ___________ _______ ________ _________ __________
76,619 1,967 708 4 79,298 12,046 41,417 383,380 182 437,025
1,497,641 - - - 1,497,641 16,473 546 268 1 17,288
100,000 163,877 4,758 - 268,635 100,000 - - - 100,000
1,045 5,488 11,634 - 18,167 ___________ _______ ________ _________ __________
1,803,824 213,295 400,748 187 2,418,054 ___________ _______ ________ _________ __________
3 - - - 3 454,16 - - 454,16 -
910,000 - - - 910,000 239,387 39,413 6,566 27 285,393 610 218 19 1 848
3,006 24 - 1 3,031 ___________ _______ ________ _________ __________
1,153,006 101,109 6,585 29 1,260,729 ___________ _______ ________ _________ __________
650,818 112,186 394,163 158 1,157,325 ___________ _______ ________ _________ __________ ___________ _______ ________ _________ __________
116

( )
Morgan Stanley Bank International (China) Limited
50. –
(IV) –
(1) –
5% 5%
5% (11,825) (11,825) (20,260) (20,260)
5% 11,825 11,825 20,260 20,260
(2)
1 1 3 3 12 1 5 5
61,182 - - - - 5,453 66,635
128,908 - - - - - 128,908
600,000 66,227 - - - - 666,227
- 793,584 300,779 512,143 923,257 - 2,529,763
- - - - - 25,014 25,014
- 599,341 369,340 - - - 968,681
- - - - - 324,960 324,960 _________ __________ _________ _________ _________ _________ _________
790,090 1,459,152 670,119 512,143 923,257 355,427 4,710,188 _________ __________ _________ _________ _________ _________ _________
3 - 173,173 - - - 173,176
98,678 220,000 - - - - 318,678
1,012,000 200,000 - - - - 1,212,000
70,164 211,512 1,504,093 - - - 1,785,769
- - - - - 7,205 7,205
- - - - - 7,822 7,822 _________ __________ _________ _________ _________ _________ _________
1,180,845 631,512 1,677,266 - - 15,027 3,504,650 _________ __________ _________ _________ _________ _________ _________
(390,755) 827,640 (1,007,147) 512,143 923,257 340,400 1,205,538 _________ __________ _________ _________ _________ _________ _________ _________ __________ _________ _________ _________ _________ _________
117117

( )
Morgan Stanley Bank International (China) Limited
50. –
(IV) –
(2) –
1 1 3 3 12 1 5 5
76,583 - - - - 2,715 79,298
24,278 412,747 - - - - 437,025
- - 43,202 209,537 1,244,902 - 1,497,641
- - - - - 17,288 17,288
4,758 - 263,877 - - - 268,635
- - 100,000 - - - 100,000
- - - - - 18,167 18,167 _________ __________ _________ _________ _________ _________ _________
105,619 412,747 407,079 209,537 1,244,902 38,170 2,418,054 _________ __________ _________ _________ _________ _________ _________
3 - - - - - 3
- - 61,454 - - - 61,454
910,000 - - - - - 910,000
109,811 1,855 173,727 - - - 285,393
- - - - - 848 848
- - - - - 3,031 3,031 _________ __________ _________ _________ _________ _________ _________
1,019,814 1,855 235,181 - - 3,879 1,260,729 _________ __________ _________ _________ _________ _________ _________
(914,195) 410,892 171,898 209,537 1,244,902 34,291 1,157,325 _________ __________ _________ _________ _________ _________ _________ _________ __________ _________ _________ _________ _________ _________
50
“ ” “ ”
50
50 18 18 (1,877) (1,877)
50 (18) (18) 1,877 1,877
118118

( )
Morgan Stanley Bank International (China) Limited
51.
( 4)
!
! ( )
!
( )
66,635,189.42 66,635,189.42 79,298,187.46 79,298,187.46
128,907,824.53 128,907,824.53 437,025,462.65 437,025,462.65
666,227,000.00 666,227,000.00 - -
2,529,763,390.00 2,529,763,390.00 1,497,641,342.53 1,497,641,342.53
25,013,920.47 25,013,920.47 17,287,586.56 17,287,586.56
968,681,000.00 968,681,000.00 268,634,637.82 268,634,637.82
- - 100,000,000.00 100,000,000.00
324,959,578.75 324,959,578.75 18,167,406.22 18,167,406.22 ________________ ________________ ________________ ________________
4,710,187,903.17 4,710,187,903.17 2,418,054,623.24 2,418,054,623.24 ________________ ________________ ________________ ________________ ________________ ________________ ________________ ________________
173,175,536.74 173,175,536.74 2,652.38 2,652.38
318,678,230.00 318,678,230.00 61,453,800.00 61,453,800.00
1,212,000,000.00 1,212,000,000.00 910,000,000.00 910,000,000.00
1,785,769,494.51 1,785,769,494.51 285,392,754.12 285,392,754.12
7,204,459.50 7,204,459.50 848,030.20 848,030.20
7,821,871.45 7,821,871.45 3,030,669.50 3,030,669.50 ________________ ________________ ________________ ________________
3,504,649,592.20 3,504,649,592.20 1,260,727,906.20 1,260,727,906.20 ________________ ________________ ________________ ________________ ________________ ________________ ________________ ________________
119119

( )
Morgan Stanley Bank International (China) Limited
51. –
1 ( )
2 ( ) ( )
3 (
)
1 2 3
00.093,367,925,2 - 00.093,367,925,2 - ________________ ________________ ________________ ________________
00.093,367,925,2 - 00.093,367,925,2 - ________________ ________________ ________________ ________________ ________________ ________________ ________________ ________________
1 2 3
35.243,146,794,1 - 35.243,146,794,1 -
- 100,000,000.00 - 100,000,000.00 ________________ ________________ ________________ ________________
35.243,146,795,1 - 35.243,146,795,1 - ________________ ________________ ________________ ________________ ________________ ________________ ________________ ________________
1 2
22,861,225.75 ( 93,982,708.40 )
0.00
120120

( )
Morgan Stanley Bank International (China) Limited
51. –
52.
2010
53.
2011 4 21
* * * *
121121

( )
Morgan Stanley Bank International (China) Limited
122122

( )
Morgan Stanley Bank International (China) Limited
( )
( )
( )
( )
( )
123123

( )
Morgan Stanley Bank International (China) Limited
( )
( )
2010 12 31
74,153,328.24
1. 586,936.30
2. 695,010.02
3. 142.92
4. 902,389.93
5. 108,549.40
6. 22,861,225.75
7. 1,230,340.16
8. 3,311,350.00 _____________
29,695,944.48 _____________
1. 12,662,733.62
2. 2,720,597.33
3. 1,069,928.00 _____________
16,453,258.95 _____________
87,396,013.77 _____________ _____________
“ ”
124124

( )
Morgan Stanley Bank International (China) Limited
( )
( )
( )
2010 12 31
66,568,705.12 79,288,171.28
124,232,863.29 431,472,800.47
167,946,552.79 235,603.69
600,000,000.00 -
2,529,763,390.00 1,497,641,342.53
21,135,748.78 17,287,586.56
499,340,500.00 268,634,637.82
- 100,000,000.00
19,488,787.00 18,418,859.00
2,820,365.61 4,725,918.08
5,196,693.32 6,851,050.23
4,155,439.36 242,700.63
331,070,959.83 22,289,661.09
100,000,000.00 100,000,000.00 ______________ ______________
4,471,720,005.10 2,547,088,331.38 ______________ ______________ ______________ ______________
( )
125125

( )
Morgan Stanley Bank International (China) Limited
( )
( )
( )
-
2010 12 31
2,561.74 2,652.38
1,383,397,731.13 75,451,812.97
318,678,230.00 61,453,800.00
1,212,000,000.00 910,000,000.00
268,970,919.90 285,292,927.67
1,288,372.24 4,750,189.29
8,550,404.00 23,979,113.92
5,529,120.84 848,019.22
12,332,691.56 1,513,542.21 ______________ ______________
3,210,750,031.41 1,363,292,057.66 ______________ ______________
1,000,000,000.00 1,000,000,000.00
39,503,162.77 33,679,202.65
21,077,745.89 8,403,791.24
200,389,065.03 141,713,279.83 ______________ ______________
1,260,969,973.69 1,183,796,273.72 ______________ ______________
4,471,720,005.10 2,547,088,331.38 ______________ ______________ ______________ ______________
126126

( )
Morgan Stanley Bank International (China) Limited
( )
( )
( )
2010 12 31
135,584,536.34 65,144,790.25 ______________ ______________
51,564,896.39 57,135,092.81 ______________ ______________
82,944,824.72 75,286,619.05
2,312,397.94 -
32,129,505.96 17,938,571.86
1,562,820.31 212,954.38
86,684,570.06 62,869,685.73 ______________ ______________
94,320,498.72 63,533,868.92
7,635,928.66 664,183.19
9,635,143.22 33,154,153.93
(21,791,297.75) (93,472,260.40)
/( ) 8,284,252.90 (657,975.35)
1,206,971.52 6,116,093.53 ______________ ______________
45,609,619.28 52,549,490.81 ______________ ______________
10,164,829.75 8,672,037.52
35,444,789.53 44,259,487.77
- (382,034.48) ______________ ______________
89,974,917.06 12,595,299.44 ______________ ______________
2,128.83 99,249.98
357,249.37 8,346.72 ______________ ______________
89,619,796.52 12,686,202.70 ______________ ______________
12,446,096.55 (2,920,434.64) ______________ ______________
77,173,699.97 15,606,637.34 ______________ ______________ ______________ ______________
- - ______________ ______________
77,173,699.97 15,606,637.34 ______________ ______________ ______________ ______________
127127

( )
Morgan Stanley Bank International (China) Limited
( )
( )
( )
2010 12 31
66,484.30 10,016.18
4,674,961.24 5,552,662.18
1,383,397,731.13 75,451,812.97
66,227,000.00 -
3,878,171.69 -
469,340,500.00 -
5,137,958.02 4,698,944.38
3,732,543.17 6,716,838.40 _______________ ______________
1,936,455,349.55 92,430,274.11 _______________ ______________ _______________ ______________
173,172,975.00 -
167,946,552.79 235,603.69
1,516,798,574.61 99,826.45
3,463,729.87 2,086,688.46
3,475,976.39 10.03
1,675,338.66 10.98
865,833.47 2,017,666.94 _______________ ______________
1,867,398,980.79 4,439,806.55 _______________ ______________
100,000,000.00 100,000,000.00
(30,943,631.24) (12,009,532.44) _______________ ______________
69,056,368.76 87,990,467.56 _______________ ______________
1,936,455,349.55 92,430,274.11 _______________ ______________ _______________ ______________
128128

( )
Morgan Stanley Bank International (China) Limited
( )
( )
( )
2010 12 31
13,176,524.70 787,480.65 ______________ ______________
8,324,225.70 796,758.60 ______________ ______________
10,862,969.88 583,842.15
1,562,820.31 212,954.38
1,789,166.55 37.93
2,312,397.94 -
4,829,993.30 (9,445.50) _______________ ______________
4,831,371.80 200.50
1,378.50 9,646.00
22,305.70 167.55 _______________ ______________
29,796,707.07 12,797,013.09 ______________ ______________
733,147.40 10.03
29,063,559.67 12,797,003.06 _______________ ______________
(16,620,182.37) (12,009,532.44) _______________ ______________
1,153,714.09 - ______________ ______________
(15,466,468.28) (12,009,532.44) _______________ ______________
3,467,630.52 - _______________ ______________
(18,934,098.80) (12,009,532.44) _______________ ______________ _______________ ______________
- - _______________ ______________ _______________ ______________
(18,934,098.80) (12,009,532.44) _______________ ______________ _______________ ______________
129129

( )
Morgan Stanley Bank International (China) Limited
MORGAN STANLEY BANK INTERNATIONAL
(CHINA) LIMITED
Financial Statements and Auditors’ Report
For the year ended 31 December 2010
The financial statements and auditors’ report have been issued in Chinese. The English translation is prepared for your
reference only. If there is any conflict of meaning between the Chinese and English versions, the Chinese version prevails.
.
130130

( )
Morgan Stanley Bank International (China) Limited
FINANCIAL STATEMENTS AND AUDITORS’ REPORT
FOR THE YEAR ENDED 31 DECEMBER 2010
CONTENTS PAGE(S)
AUDITORS’ REPORT 1 - 2
BALANCE SHEET 3 - 4
INCOME STATEMENT 5
CASH FLOW STATEMENT 6
STATEMENT OF CHANGES IN OWNER'S EQUITY 7
NOTES TO THE FINANCIAL STATEMENTS 8 - 61
131131

( )
Morgan Stanley Bank International (China) Limited
AUDITOR'S REPORT
De Shi Bao (Shen) Zi (11) No.PXXX
[Translation]
TO THE BOARD OF DIRECTORS OF
MORGAN STANLEY BANK INTERNATIONAL (CHINA) LIMITED
We have audited the accompanying financial statements of Morgan Stanley Bank International
(China) Limited (the "Bank"), which comprise the balance sheet as at 31 December 2010, and the
income statement, the statement of changes in owner's equity and the cash flow statement for the
year then ended, and the notes to the financial statements.
1. Management's responsibility for the financial statements
Management of the Bank is responsible for the preparation and fair presentation of these financial
statements. This responsibility includes: (1) preparing the financial statements in accordance with
Accounting Standards for Business Enterprises to achieve fair presentation of the financial
statements; (2) designing, implementing and maintaining internal control that is necessary to
enable the financial statements that are free from material misstatement, whether due to fraud or
error.
2. Auditors' responsibility
Our responsibility is to express an opinion on these financial statements based on our audit. We
conducted our audit in accordance with China Standards on Auditing. Those standards require
that we comply with the Code of Ethics for Chinese Certified Public Accountants and plan and
perform the audit to obtain reasonable assurance about whether the financial statements are free
from material misstatement.
An audit involves performing procedures to obtain audit evidence about the amounts and
disclosures in the financial statements. The procedures selected depend on the auditors’ judgment,
including the assessment of the risks of material misstatement of the financial statements, whether
due to fraud or error. In making those risk assessments, we consider the internal control relevant
to the preparation and fair presentation of the financial statements in order to design audit
procedures that are appropriate in the circumstances, but not for the purpose of expressing an
opinion on the effectiveness of the internal control. An audit also includes evaluating the
appropriateness of accounting policies used and the reasonableness of accounting estimates made
by management, as well as evaluating the overall presentation of the financial statements.
We believe that the audit evidence we have obtained is sufficient and appropriate to provide a
basis for our audit opinion.
132132

( )
Morgan Stanley Bank International (China) Limited
3. Opinion
In our opinion, the financial statements of the Bank present fairly, in all material respects, the
financial position of the Bank as of 31 December 2010, and the results of its operations and cash
flows for the year then ended in accordance with Accounting Standards for Business Enterprises.
Deloitte Touche Tohmatsu CPA Ltd. Chinese Certified Public Accountant
Shanghai, China
21 April 2011
133133

( )
Morgan Stanley Bank International (China) Limited
BALANCE SHEET
AT 31 DECEMBER 2010
Notes 31/12/2010 31/12/2009
RMB RMB
ASSETS
Cash and balances with the Central Bank 7 66,635,189.42 79,298,187.46
Due from banks 8 128,907,824.53 437,025,462.65
Placements with banks and
other financial institutions 9 666,227,000.00 -
Financial assets held for trading 10 2,529,763,390.00 1,497,641,342.53
Interest receivable 11 25,013,920.47 17,287,586.56
Loans and advances to customers 12 968,681,000.00 268,634,637.82
Available-for-sale financial assets 13 - 100,000,000.00
Investment property 14 19,488,787.00 18,418,859.00
Fixed assets 15 7,958,323.63 9,424,862.46
Intangible assets 16 5,196,693.32 6,851,050.23
Deferred tax assets 17 4,155,439.36 242,700.63
Other assets 18 334,803,503.00 29,006,499.49 ______________ ______________
TOTAL ASSETS 4,756,831,070.73 2,463,831,188.83 ______________ ______________ ______________ ______________
(Continued)
134134

( )
Morgan Stanley Bank International (China) Limited
BALANCE SHEET - continued
AT 31 DECEMBER 2010
Notes 31/12/2010 31/12/2009
RMB RMB
LIABILITIES
Due to banks and other financial institutions 19 173,175,536.74 2,652.38
Placements from banks and
other financial institutions 20 318,678,230.00 61,453,800.00
Repurchase agreements 21 1,212,000,000.00 910,000,000.00
Customer deposits 22 1,785,769,494.51 285,392,754.12
Employee benefit payable 23 4,752,102.11 6,836,877.75
Current tax payable 24 12,026,380.39 23,979,123.95
Interest payable 25 7,204,459.50 848,030.20
Other liabilities 26 13,198,525.03 3,531,209.15 ______________ ______________
TOTAL LIABILITIES 3,526,804,728.28 1,292,044,447.55 ______________ ______________
OWNER'S EQUITY
Paid-in capital 27 1,000,000,000.00 1,000,000,000.00
Surplus reserves 28 39,503,162.77 33,679,202.65
General reserves 29 21,077,745.89 8,403,791.24
Retained earnings 30 169,445,433.79 129,703,747.39 ______________ ______________
TOTAL OWNER'S EQUITY 1,230,026,342.45 1,171,786,741.28 ______________ ______________
TOTAL LIABILITIES AND OWNER'S EQUITY 4,756,831,070.73 2,463,831,188.83 ______________ ______________ ______________ ______________
The accompanying notes are part of the financial statements.
The financial statements on pages 3 to 61 were signed by the following:
Head of the Bank Head of Finance Department
135135

( )
Morgan Stanley Bank International (China) Limited
INCOME STATEMENT
FOR THE YEAR ENDED 31 DECEMBER 2010
Notes 2010 2009
RMB RMB
Operating income 148,761,061.04 65,932,270.90 ______________ ______________
Net interest income 31 59,889,122.09 57,931,851.41 ______________ ______________
Interest income 31 93,807,794.60 75,870,461.20
Interest expenses 31 33,918,672.51 17,938,609.79
Net fee and commission income 32 91,514,563.36 62,860,240.23 ______________ ______________
Fee and commission income 32 99,151,870.52 63,534,069.42
Fee and commission expenses 32 7,637,307.16 673,829.19
Investment income 33 9,635,143.22 33,154,153.93
Losses from changes in fair value 34 (21,791,297.75) (93,472,260.40)
Exchange gains/(losses) 8,306,558.60 (657,807.80)
Other operating income 35 1,206,971.52 6,116,093.53 ______________ ______________
Operating expenses 75,406,326.35 65,346,503.90 ______________ ______________
Business tax and surcharge 36 10,897,977.15 8,672,047.55
Operating expenses 37 64,508,349.20 57,056,490.83
Impairment reversal on assets 38 - (382,034.48) ______________ ______________
Operating profit 73,354,734.69 585,767.00 ______________ ______________
Add: Non-operating income 39 1,155,842.92 99,249.98
Less: Non-operating expenses 40 357,249.37 8,346.72 ______________ ______________
PROFIT BEFORE TAX 74,153,328.24 676,670.26 ______________ ______________
Less: Income tax expenses 41 15,913,727.07 (2,920,434.64) ______________ ______________
NET PROFIT 58,239,601.17 3,597,104.90 ______________ ______________ ______________ ______________
OTHER COMPREHENSIVE INCOME - - ______________ ______________
TOTAL COMPREHENSIVE INCOME 58,239,601.17 3,597,104.90 ______________ ______________ ______________ ______________
The accompanying notes are part of the financial statements.
136136
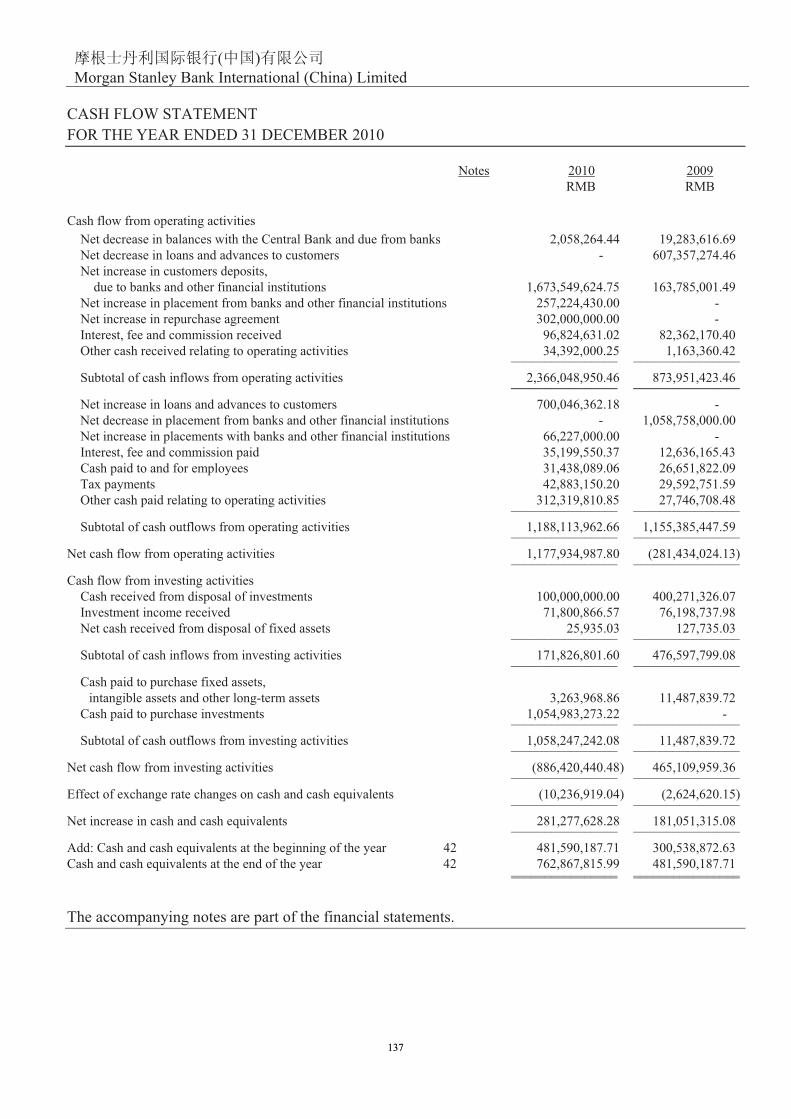
( )
Morgan Stanley Bank International (China) Limited
CASH FLOW STATEMENT
FOR THE YEAR ENDED 31 DECEMBER 2010
Notes 2010 2009
RMB RMB
Cash flow from operating activities
Net decrease in balances with the Central Bank and due from banks 2,058,264.44 19,283,616.69
Net decrease in loans and advances to customers - 607,357,274.46
Net increase in customers deposits,
due to banks and other financial institutions 1,673,549,624.75 163,785,001.49
Net increase in placement from banks and other financial institutions 257,224,430.00 -
Net increase in repurchase agreement 302,000,000.00 -
Interest, fee and commission received 96,824,631.02 82,362,170.40
Other cash received relating to operating activities 34,392,000.25 1,163,360.42 ________________ ________________
Subtotal of cash inflows from operating activities 2,366,048,950.46 873,951,423.46 ________________ ________________
Net increase in loans and advances to customers 700,046,362.18 -
Net decrease in placement from banks and other financial institutions - 1,058,758,000.00
Net increase in placements with banks and other financial institutions 66,227,000.00 -
Interest, fee and commission paid 35,199,550.37 12,636,165.43
Cash paid to and for employees 31,438,089.06 26,651,822.09
Tax payments 42,883,150.20 29,592,751.59
Other cash paid relating to operating activities 312,319,810.85 27,746,708.48 ________________ ________________
Subtotal of cash outflows from operating activities 1,188,113,962.66 1,155,385,447.59 ________________ ________________
Net cash flow from operating activities 1,177,934,987.80 (281,434,024.13) ________________ ________________
Cash flow from investing activities
Cash received from disposal of investments 100,000,000.00 400,271,326.07
Investment income received 71,800,866.57 76,198,737.98
Net cash received from disposal of fixed assets 25,935.03 127,735.03 ________________ ________________
Subtotal of cash inflows from investing activities 171,826,801.60 476,597,799.08 ________________ ________________
Cash paid to purchase fixed assets,
intangible assets and other long-term assets 3,263,968.86 11,487,839.72
Cash paid to purchase investments 1,054,983,273.22 - ________________ ________________
Subtotal of cash outflows from investing activities 1,058,247,242.08 11,487,839.72 ________________ ________________
Net cash flow from investing activities (886,420,440.48) 465,109,959.36 ________________ ________________
Effect of exchange rate changes on cash and cash equivalents (10,236,919.04) (2,624,620.15) ________________ ________________
Net increase in cash and cash equivalents 281,277,628.28 181,051,315.08 ________________ ________________
Add: Cash and cash equivalents at the beginning of the year 42 481,590,187.71 300,538,872.63
Cash and cash equivalents at the end of the year 42 762,867,815.99 481,590,187.71 ________________ ________________ ________________ ________________
The accompanying notes are part of the financial statements.
137137

( )
Morgan Stanley Bank International (China) Limited
STATEMENT OF CHANGES IN OWNER’S EQUITY
FOR THE YEAR ENDED 31 DECEMBER 2010
2010
Retained
Paid in capital Surplus reserves General reserves earnings Total owner’s equity
RMB RMB RMB RMB RMB
(Note 27) (Note 28) (Note 29) (Note 30)
I. Balance as at 31 December 2009
and 1 January 2010 1,000,000,000.00 33,679,202.65 8,403,791.24 129,703,747.39 1,171,786,741.28
II. Current year movement - 5,823,960.12 12,673,954.65 39,741,686.40 58,239,601.17
(I) Net profit - - - 58,239,601.17 58,239,601.17
(II) Other comprehensive income - - - - - ___________ ____________ __________ ___________ ___________
Subtotal of (I) and (II) - - - 58,239,601.17 58,239,601.17 ___________ ____________ __________ ___________ ___________
(III) Distribution of profit - 5,823,960.12 12,673,954.65 (18,497,914.77) -
1. Appropriation to surplus reserves - 5,823,960.12 - (5,823,960.12) -
2. Appropriation to general reserves - - 12,673,954.65 (12,673,954.65) - ___________ ____________ __________ ___________ ___________
III. Balance as at 31 December 2010 1,000,000,000.00 39,503,162.77 21,077,745.89 169,445,433.79 1,230,026,342.45 ___________ ____________ __________ ___________ ___________ ___________ ____________ __________ ___________ ___________
2009
Retained
Paid in capital Surplus reserves General reserves earnings Total owner’s equity
RMB RMB RMB RMB RMB
(Note 27) (Note 28) (Note 29) (Note 30)
I. Balance as at 31 December 2008
and 1 January 2009 1,000,000,000.00 11,048,076.23 25,745,194.02 131,396,366.13 1,168,189,636.38
II. Current year movement - 22,631,126.42 (17,341,402.78) (1,692,618.74) 3,597,104.90
(I) Net profit - - - 3,597,104.90 3,597,104.90
(II) Other comprehensive income - - - - - ___________ ____________ __________ ___________ ___________
Subtotal of (I) and (II) - - - 3,597,104.90 3,597,104.90 ___________ ____________ __________ ___________ ___________
(III) Distribution of profit - 22,631,126.42 (17,341,402.78) (5,289,723.64) -
1. Appropriation to surplus reserves - 22,631,126.42 - (22,631,126.42) -
2. Appropriation to general reserves - - (17,341,402.78) 17,341,402.78 - ___________ ____________ __________ ___________ ___________
III. Balance as at 31 December 2009 1,000,000,000.00 33,679,202.65 8,403,791.24 129,703,747.39 1,171,786,741.28 ___________ ____________ __________ ___________ ___________ ___________ ____________ __________ ___________ ___________
The accompanying notes are part of the financial statements.
138138

( )
Morgan Stanley Bank International (China) Limited
NOTES TO THE FINANCIAL STATEMENTS
FOR THE YEAR ENDED 31 DECEMBER 2010
1. GENERAL
Morgan Stanley Bank International (China) Limited (the “Bank”), formerly known as Nan Tung
Bank Ltd., Zhuhai, was approved by the People’s Bank of China ( “PBOC”) and established on 19
October 1984, with an original operating period of 20 years, by Nan Tung Investment (Macao)
Limited which is wholly-owned by Bank of China Macau Branch. The Bank had a registered
capital of RMB 300 million, and obtained its business license on 14 December 1984. The Bank
mainly engaged in a full scope of foreign currency services to foreign entities, foreign invested
companies, foreign representative offices, Hong Kong, Macau, Taiwan representative offices in
China, foreigners and Hong Kong, Macau, Taiwan natives and partial foreign currency services to
non-foreign invested companies.
The Bank increased its registered capital by RMB 100 million to RMB 400 million on 22 August
2002 with the approval of the PBOC. The Bank was approved to engage in full-scope foreign
currency business in November 2002.
The Bank renewed its business license (Qi-Du-Yue-Zong-Zi No.003414) on 2 September 2004,
the operating period was extended from 14 December 1984 to 14 December 2024.
With the approval from the China Banking Regulatory Commission ( “CBRC”) on 8 September
2006, Morgan Stanley Bank International Limited (“MSBI”) took over 100% equity interest of the
Bank from Nan Tung Investment (Macao) Limited. The Bank obtained a new business license
(Qi-Du-Yue-Zong-Zi No.003573) after the change of shareholder on 21 September 2006, and the
operating period remained the same.
On 2 April 2007, MSBI injected RMB 600 million, the registered and paid-in capital of the Bank
increased to RMB 1 billion. With the approval from CBRC, the Bank changed its name to Morgan
Stanley Bank International (China) Limited on 14 May 2007. On 17 July 2007, with the approval
from CBRC, the Bank was approved to engage in Renminbi Dollars (“RMB”) business provided
to customers other than Chinese citizens within the territory of China and obtained a new business
license (register no. 440000400000859) on 19 July 2007. As of 31 December 2007, the registered
capital of the Bank is RMB 1 billion, the capital for RMB business is RMB 250 million and for
foreign currency business is Hong Kong Dollars (“HKD”) equivalent of RMB 750 million.
In June 2008, with the approval from State Administration of Foreign Exchange (“SAFE”), the
Bank converted HKD281,477,395.13 capital for foreign currency business to RMB 250 million
capital for RMB business. As of 31 December 2009, the total registered capital of the Bank is
RMB 1 billion, including RMB 500 million for RMB business and HKD equivalent of RMB 500
million for foreign currency business.
In January 2010, with the approval from SAFE, the Bank converted HKD167,803,891.84 capital
for foreign currency business to RMB 166 million capital for RMB business. As of 31 December
2010, the total registered capital of the Bank is RMB 1 billion, including RMB 666 million for
RMB business and HKD equivalent of RMB 334 million for foreign currency business. Details of
capital contribution by the investor are described in note 27.
139139

( )
Morgan Stanley Bank International (China) Limited
1. GENERAL - continued
The Bank was approved by CBRC on 10 June 2009 to establish a branch in Beijing and obtained
a branch business licence on 24 June 2009, with operating period from 24 June 2009 to 14
December 2024.
The registered address of the Bank is Room 2801-2807 and Room 2816, 28/F, Yuecai Building
No.188 Jingshan Road, Jida, Zhuhai, Guangdong, People’s Republic of China (“PRC”). The Bank
is formed as a limited liability company.
The Bank is permitted to provide the following services to any customers for foreign currency
business and to customers except for China citizens in the territory of China for RMB business:
accept public deposits; providing short-term, medium and long-term loans; undertaking
acceptance and discounting of negotiable instruments; buying and selling government bonds,
financial bonds, and other foreign currency securities except for shares; providing letters of credit
(L/C) service and guarantee; conducting domestic and international settlements; buying and
selling foreign currency for its own accounts or as agents; providing insurance service as agents;
inter-bank borrowing and lending; providing bank card service; providing safety box service;
providing credit investigation and consultancy service; and other businesses approved by CBRC.
2. BASIS OF PREPARATION OF FINANCIAL STATEMENTS
The Bank has adopted the Accounting Standards for Business Enterprises issued by the Ministry
of Finance on 15 February 2006 (hereinafter referred to as "new CASs").
3. STATEMENT OF COMPLIANCE WITH THE ACCOUNTING STANDARDS FOR BUSINESS
ENTERPRISES
The financial statements of the Bank have been prepared in accordance with new CASs, and
present truly and completely, the Bank's financial position as of 31 December 2010, and results of
operations and cash flows for the year then ended.
4. SIGNIFICANT ACCOUNTING POLICIES AND ACCOUNTING ESTIMATES
The following significant accounting policies and accounting estimates are determined in
accordance with the new CASs.
Accounting year
The Bank has adopted the calendar year as its accounting year, i.e. from 1 January to 31
December.
Functional currency
The Bank's functional currency is RMB, the currency of the primary economic environment in
which the Bank operates. The reporting currency of the financial statements is RMB.
140140
( )
Morgan Stanley Bank International (China) Limited
4. SIGNIFICANT ACCOUNTING POLICIES AND ACCOUNTING ESTIMATES - continued
Basis of accounting and principle of measurement
The Bank has adopted the accrual basis of accounting. Except for investment property and certain
financial instruments which are measured at fair value, the Bank has adopted the historical cost as
the principle of measurement of the financial statements. Where assets are impaired, provisions
for asset impairment are made in accordance with relevant requirements.
Cash and cash equivalents
Cash comprises cash on hand and the deposits which can be paid on demand. Cash equivalents are
short-term, highly liquid investments that are readily convertible to known amounts of cash and
which are subject to an insignificant risk of change in value.
Financial instruments
The Bank recognises a financial asset or a financial liability when the Bank becomes a party to the
contractual provisions of the financial instrument. Financial assets and financial liabilities are
initially recognised at fair value. For financial assets and financial liabilities classified as fair
value through profit or loss ("FVTPL"), related transaction costs are charged to the profit or loss
for the current period; for financial assets and financial liabilities classified as other categories,
related transaction costs are included in the initial recognition amounts.
Determination of financial instruments fair value
Fair value is the amount for which an asset could be exchanged, or a liability settled, between
knowledgeable, willing parties in an arm’s length transaction. The Bank chooses the quoted prices
from an active market if there is an active market for the financial instrument. If no active market
exists for a financial instrument, the Bank establishes fair value by using a valuation technique.
Valuation techniques include using recent market transactions between knowledgeable, willing
parties, reference to the current fair value of another instrument that is substantially the same,
discounted cash flow analysis and option pricing models.
The effective interest method
The effective interest method is a method of calculating the amortised cost of a financial asset or a
financial liability (or group of financial assets or financial liabilities) and of allocating the interest
income or interest expense over the relevant period, using the effective interest rate. The effective
interest rate is the rate that exactly discounts estimated future cash payments or receipts through
the expected life of the financial instrument or, when appropriate, a shorter period to the net
carrying amount of the financial asset or financial liability.
When calculating the effective interest rate, the Bank estimates the future cash flows considering
all contractual terms of financial assets and financial liabilities (without considering future credit
losses). The calculation includes all fees paid or received between the parties to the contract that
are an integral part of the effective interest rate, transaction costs, and all other premiums or
discounts.
141141

( )
Morgan Stanley Bank International (China) Limited
4. SIGNIFICANT ACCOUNTING POLICIES AND ACCOUNTING ESTIMATES - continued
Financial instruments - continued
Classification, recognition and measurement of financial assets
On initial recognition, financial assets are classified into the following categories: FVTPL,
‘held-to-maturity’ investments, ‘loans and receivables’ and ‘available-for-sale’ (AFS) financial
assets. For a financial asset traded in regular way, the Bank recognizes and derecognizes the
financial asset using trade date accounting.
The Bank’s financial assets are financial assets at FVTPL, loans and receivables and AFS
financial assets.
Financial assets at FVTPL
Financial assets are classified as at FVTPL where the financial asset is either held for trading or it
is designated as at FVTPL. The Bank's FVTPL is held for trading purpose.
A financial asset is classified as held for trading if: (1) it has been acquired principally for the
purpose of selling in the near future; or (2) it is part of a portfolio of identified financial
instruments that are managed together and for which there is evidence of a recent actual pattern of
short-term profit-taking; or (3) it is a derivative, except for a derivative that is a designated and
effective hedging instrument, or a financial guarantee contract, or a derivative that is linked to and
must be settled by delivery of an unquoted equity instrument (without a quoted price from an
active market) whose fair value cannot be reliably measured.
Held for trading financial assets are subsequently measured at fair value, with gains or losses
arising from changes in fair value as well as dividends and interest income related to such
financial assets recognised in profit or loss for the current period.
Loans and receivables
Loans and receivables are non-derivative financial assets with fixed or determinable payments
that are not quoted in an active market. Loans and receivables of the Bank include due to PBOC,
due to banks, placement with bank and other financial institutions, loans and advances to
customers, interest receivable and other receivables etc.
Loans and receivables are subsequently measured at amortised cost using the effective interest
method. Gains or losses arising from derecognition, impairment or amortisation are recognized in
profit or loss for the current period.
142142

( )
Morgan Stanley Bank International (China) Limited
4. SIGNIFICANT ACCOUNTING POLICIES AND ACCOUNTING ESTIMATES - continued
Financial instruments - continued
Classification, recognition and measurement of financial assets - continued
AFS financial assets
AFS financial assets are those non-derivative financial assets that are designated as available-for-
sale or are not classified as (1) financial assets at FVTPL, (2) loans and receivables, and (3)
held-to-maturity investments.
AFS financial assets are subsequently measured at fair value. Gains or losses arising from changes
in fair value (other than impairment losses and foreign exchange gains and losses resulted from
foreign currency monetary assets which are recognised in profit or loss for the current period) are
recognised directly in owner’s equity, and are reversed and recognised in profit or loss for the
period when such financial assets are derecognised.
Interest received during the period in which the Bank holds the AFS financial assets and cash
dividends declared by the investee are recognised as investment income.
Impairment of financial assets
The Bank assesses the carrying amount of financial assets, other than those at FVTPL, at each
balance sheet date. If there is objective evidence that financial assets are impaired the Bank
determines the amount of any impairment loss. Objective evidence that a financial asset is
impaired refers to one or more events that occurred after the initial recognition of the asset and
that event has an impact on the estimated future cash flows of the financial asset which can be
reliably estimated.
Objective evidences that financial asset are impaired includes evidences arising from the
following events:
(1) Significant financial difficulty of the issuer or obligor;
(2) A breach of contract by the borrower, such as a default or delinquency in interest or principal
payments;
(3) The lender, for economic or legal reasons relating to the borrower’s financial difficulty,
granting a concession to the borrower;
(4) It has become probable that the borrower will enter into bankruptcy or other financial
reorganization;
(5) The disappearance of an active market for that financial asset because of financial difficulties
of the issuer;
(6) Upon an overall assessment of a group of financial assets, observable data indicates that there
is a measurable decrease in the estimated future cash flows from the Bank of financial assets
since the initial recognition of those assets, although the decrease cannot yet be identified with
the individual financial assets in the Bank. Such observable data includes:
- adverse changes in the payment status of borrowers in the Bank;
- adverse changes in industry or country conditions of the borrowers that might affect the
repayment of the Bank of financial assets;
(7) Other objective evidence indicating there is an impairment of a financial asset.
143143

( )
Morgan Stanley Bank International (China) Limited
4. SIGNIFICANT ACCOUNTING POLICIES AND ACCOUNTING ESTIMATES - continued
Financial instruments - continued
Impairment of financial assets - continued
Impairment of financial assets carried at amortised cost
If financial assets carried at amortised cost are impaired, the carrying amount of the financial asset
shall be reduced to the present value of estimated future cash flows discounted at the financial
asset’s original effective interest rate (excluding future credit losses that have not been incurred).
The amount of reduction shall be recognised as an impairment loss in profit or loss. If, after the
recognition of impairment losses, the carrying amount of financial assets increases and the
increase can be related objectively to an event occurring after the impairment was recognised, the
previously recognised impairment losses are reversed through profit or loss to the extent that the
carrying amount of the financial assets at the date the impairment is reversed does not exceed
what the amortised cost would have been had the impairment not been recognised.
For a financial asset that is individually significant, the Bank assesses the asset individually for
impairment. For a financial asset that is not individually significant, the Bank assesses the asset
individually for impairment or includes the asset in a group of financial assets with similar credit
risk characteristics and collectively assesses them for impairment. For a financial asset that does
not need impairment after individual assessment (include individually significant and
non-significant financial asset), the Bank reassesses the asset collectively with a group of
financial assets with similar credit risk characteristics for impairment. The financial asset that has
impaired in individual assessment does not need to be included in collectively assessment for
impairment with a group of financial assets with similar credit risk characteristics.
Impairment of AFS financial assets
Where AFS financial assets are impaired, accumulated losses due to decreases in fair value
previously recognised directly in owner's equity are reversed and charged to profit or loss for the
current period. The reversed accumulated losses are the asset's initial acquisition costs after
deducting amounts recovered and amortised, current fair value and impairment losses previously
recognised in profit or loss.
If, in a subsequent period, the carrying amount of financial assets increases and the increase can
be related objectively to an event occurring after the impairment was recognised, the previously
recognised impairment losses are reversed. The reversal of impairment losses of AFS equity
instruments is recognised in equity, and the impairment losses of AFS debt instruments are
recognised in profit or loss for the current period.
144144

( )
Morgan Stanley Bank International (China) Limited
4. SIGNIFICANT ACCOUNTING POLICIES AND ACCOUNTING ESTIMATES - continued
Financial instruments - continued
Transfers of financial assets
The Bank derecognises a financial asset only when: (1) the contractual rights to receive the cash
flows from the financial asset expire; or (2) it transfers the financial asset and substantially all the
risks and rewards of ownership of the asset to the transferee; or (3) it transfers the financial asset,
neither transfers nor retains substantially all the risks and rewards of ownership but has not
retained control of the financial asset.
Where the Bank does not either transfer or retain substantially all of the risks and rewards related
to the ownership of a financial asset, and if the Bank does not relinquish control over the financial
asset, it shall, to the extent of its continuous involvement in the financial asset, recognize it as a
related financial asset and recognize the relevant liability accordingly. The term "continuous
involvement in the transferred financial asset" shall refer to the risk level that the Bank faces as a
result of any change in the value of the financial asset.
If the transfer of an entire financial asset satisfies the conditions relating to derecognition, the
difference between the amounts described in the following two items shall be recorded in the
profit or loss for the current period: 1) the book value of the transferred financial asset; and 2) the
sum of the total consideration received from the transfer and the cumulative amount of the change
in the fair value originally recorded in the owner's equity.
If the transfer of part of a financial asset satisfies the conditions for derecognition, the Bank shall
allocate the carrying amount of the financial asset between the part it continues to recognize under
continuing involvement, and the part it no longer recognize on the basis of the relative fair values
of those parts (under such circumstances, the service asset retained shall be deemed to be a
portion of the financial asset which continues to be recognized). And the difference between the
amounts described in the following two items shall be recorded in the profit or loss for the current
period: 1) the book value of the derecognized portion; and 2) the sum of the total consideration
paid for the derecognized portion and the portion of the cumulative amount of changes in the fair
value originally recorded in the owner's equity which corresponds to the derecognized portion (in
the event that the financial asset involved in the transfer is a financial asset available for sale).
A financial asset which sold with an agreement to repurchase in the near future, the Bank
continues to recognize it in the balance sheet. Proceeds from sales of such assets including the
interest are recognized as financial assets sold under repurchase agreement in the balance sheet.
The difference between selling price and repurchase price at the duration of the agreement is
recognized by the effective interest method as interest expense.
145145

( )
Morgan Stanley Bank International (China) Limited
4. SIGNIFICANT ACCOUNTING POLICIES AND ACCOUNTING ESTIMATES - continued
Financial instruments - continued
Classification, recognition and measurement of financial liabilities
The Bank recognizes the issued financial instruments as financial liabilities or equity instruments
according to the substance of the contractual provisions of the financial instrument and the
definition of financial liabilities or equity instruments.
On initial recognition, financial liabilities are classified as either financial liabilities at ‘fair value
through profit or loss’ (FVTPL) or ‘other financial liabilities’. The Bank's financial liabilities are
other financial liabilities.
Other financial liabilities
Derivative financial liabilities linked to and which must be settled by delivery of an unquoted
equity instrument (without a quoted price in an active market) whose fair value cannot be
measured reliably are subsequently measured at cost. Other financial liabilities are subsequently
measured at amortised cost using the effective interest method; gains or losses arising from
derecognition or amortisation are recognised in profit or loss for the current period.
Financial guarantee contracts
Financial guarantee contracts are contracts between a guarantor and a debtee that when the debtor
defaults, the guarantor should perform his obligations. Financial guarantee contracts that are not
designated as financial liabilities at FVTPL are initially recognised at fair value, and are
subsequently measured at the higher of the following two amounts: (1) the amount determined in
accordance with Accounting Standard for Business Enterprises No. 13 – Contingencies; and (2)
the amount initially recognised less cumulative amortisation recognised in accordance with the
principles set out in Accounting Standard for Business Enterprises No. 14 – Revenue.
Derecognition of financial liabilities
An enterprise shall derecognise a financial liability (or part of it) only when the underlying
present obligation (or part of it) is discharged. An agreement between the Bank (an existing
borrower) and an existing lender to replace the original financial liability with a new financial
liability with substantially different terms shall be accounted for as an extinguishment of the
original financial liability and the recognition of a new financial liability.
When the Bank derecognises a financial liability or a part of it, the Bank shall recognise the
difference between the carrying amount of the financial liability (or part of the financial liability)
derecognised and the consideration paid (including any non-cash assets transferred or new
financial liabilities assumed) in profit or loss for the period.
Offsetting a financial asset and a financial liability
Financial assets and liabilities are offset and the net amount is reported in the balance sheet if, and
only if, the Bank has a currently enforceable legal right to set off the recognized amounts and
intends to settle on a net basis, or to realize an asset and settle the liability simultaneously. In all
other situations they are presented separately in the balance sheet and are not offset. 146146

( )
Morgan Stanley Bank International (China) Limited
4. SIGNIFICANT ACCOUNTING POLICIES AND ACCOUNTING ESTIMATES - continued
Investment properties
Investment properties are properties held either to generate rental income or for capital
appreciation or both. The Bank's investment property is a building for rent.
There is an active property market in the location in which the Bank’s investment property is
situated. The Bank can obtain the market price and other relevant information with respect to the
same or similar types of properties from the property market so as to reasonably estimate the fair
value of the investment property. As a result, the Bank has adopted the fair value model for the
subsequent measurement of investment property, and the difference between the fair value and the
original carrying amount is recognized in profit or loss for the current period.
The Bank refers the market price and relevant information with respect to the same or similar
types of properties from the property market to determine the fair value of investment property.
When an investment property is sold, transferred, retired or damaged, the Bank recognizes the
amount of any proceeds on disposal net of the carrying amount and related taxes in profit or loss
for the current period.
Fixed assets
Fixed assets are tangible assets that are held for supply of services, or for administrative purposes
and have useful lives more than one accounting year. A fixed asset shall be recognised only when
it is probable that economic benefits associated with the asset will flow to the enterprise and the
cost of the asset can be measured reliably. A fixed asset is initially measured at cost.
Subsequent expenditure incurred on a fixed asset is included in the cost of the fixed asset, only if
it is probable that economic benefits associated with the asset will flow to the Bank and the
relevant cost can be measured reliably. Meanwhile the carrying amount of the replaced part is
derecognised. Other subsequent expenditure that fails to meet the capitalization criteria is charged
to profit or loss when incurred.
Depreciation is provided to write off the cost of each category of fixed assets over their estimated
useful lives from the month after they are brought to working condition for the intended use, using
the straight-line method. The useful lives, estimated net residual values rates and annual
depreciation rates of each class of fixed assets are as follows:
Estimated Net Annual
Classes Useful Life Residual Value Depreciation Rate
Motor vehicles 5years 10% 18%
Office equipment 5years - 20%
Estimated net residual value of a fixed asset is the estimated amount that the Bank would
currently obtain from disposal of the asset, after deducting the estimated costs of disposal, if the
asset were already of the age and in the condition expected at the end of its useful life.
147147

( )
Morgan Stanley Bank International (China) Limited
4. SIGNIFICANT ACCOUNTING POLICIES AND ACCOUNTING ESTIMATES - continued
Fixed assets - continued
The carrying amount of a fixed asset shall be derecognised when the asset is on disposal or when
no future economic benefits are expected to be generated from its use or disposal. When a fixed
asset is sold, transferred, retired or damaged, the Bank recognizes the amount of any proceeds on
disposal of the asset net of the carrying amount and related taxes in profit or loss for the current
period.
The Bank reviews the useful life and estimated net residual value of a fixed asset and the
depreciation method applied at least at each financial year-end. A change in the useful life or
estimated net residual value of a fixed asset or the depreciation method used is accounted for as a
change in an accounting estimate.
Intangible assets
Intangible assets of the Bank include software.
An intangible asset is initially measured at cost. An intangible asset with a finite useful life is
amortised using the straight-line method over its useful life when the asset is available for use. An
intangible asset with an indefinite useful life is not amortised.
For an intangible asset with a finite useful life, the Bank reviews the useful life and amortisation
method at least at each financial year-end and makes changes if necessary.
Long-term prepayments
Long-term prepayments are various expenditures incurred but that should be allocated over the
current and future periods of more than one year. Long-term prepayments are evenly amortized
over their respective beneficial period.
Impairment of non-financial assets other than goodwill
The Bank assesses at each balance sheet date whether there is any indication that fixed assets and
intangible assets with finite useful life may be impaired. If any indication that an asset may be
impaired, the recoverable amount is estimated.
The recoverable amount on impaired asset is estimated for the individual asset. If it is not possible
to estimate the recoverable amount of the individual asset, the Bank determines the recoverable
amount of the asset group to which the asset belongs. The recoverable amount of an asset is the
higher of its fair value less costs of disposal and the present value of the future cash flows
expected to be derived from the asset.
If the recoverable amount of an asset is less than its carrying amount, the difference is recognised
as an impairment loss and charged to profit or loss for the current period.
Once an impairment loss fixed assets and intangible assets with finite useful life is recognized, it
is not reversed in a subsequent period.
148148

( )
Morgan Stanley Bank International (China) Limited
4. SIGNIFICANT ACCOUNTING POLICIES AND ACCOUNTING ESTIMATES - continued
Employee benefits
In the accounting period in which the employee has rendered services, the Bank recognised the
employee benefits payables for those services as liability, except for the treatment of
compensations of employment termination.
The Bank participates in the social welfare system built by the government according to
regulations, including basic pension, medical insurance, housing accumulation fund and other
social welfare systems. Relevant expenses will be recorded in the profit and loss at the time of
occurrence.
When the Bank terminates the employment relationship with employees before the end of the
employment contracts or provides compensation as an offer to encourage employees to accept
voluntary redundancy, if the Bank has a formal plan for termination of employment relationship
or has made an offer for voluntary redundancy which will be implemented immediately, and at the
same time the Bank cannot unilaterally withdraw from the termination plan or the redundancy
offer, a provision is recognised for the compensation arising from termination of employment
relationship with employees, with a corresponding charge to the profit or loss for the current
period.
General reserves
Pursuant to CAIJIN [2005] No. 49 "Measures on General Provision for Bad and Doubtful Debts
for Financial Institutions" issued by the Ministry of Finance (“MOF”) and the related regulations,
financial institution should base on assets at the balance sheet date that bear risk and loss, which
include loans (e.g. collaterlized loans, pledged loans, guaranteed loans), bank card overdraft,
discount, credit advances (e.g. bank acceptance bill advances, letter of credit advances, guarantee
advances), export-import bills, equity investment and debt investment (excluding securities which
adopt lower of cost or market method or fair value method to determine the value at end of period
and principal and interest of treasury bonds purchased for investment), placements with banks and
other financial institutions, due from banks, interest receivable (excluding interest receivable of
loans and placements with banks and other financial institutions), dividend receivable, lease
payments receivable and other receivables. In principle, the general reserves should be provided at
not less than 1% of the risk assets from net profits as part of the owner's equity.
The Bank provides 1% of risk assets balance at the balance sheet date as the general reserves
effective from 1 January 2006. The provision of general reserves is considered as the current
distribution of profits and presented separately in the owner's equity.
Interest income and expenses
Interest income and expenses are determined at amortized costs of relevant financial assets and
financial liabilities using the effective interest rate, and recognised to profit or loss in the current
period. If the difference in amount between effective interest method and contract interest rate
method is small, the contract interest method is used.
Fee and commission income
Fee and commission income are recognized when the related services are delivered on an accrual
basis.
149149

( )
Morgan Stanley Bank International (China) Limited
4. SIGNIFICANT ACCOUNTING POLICIES AND ACCOUNTING ESTIMATES - continued
Government Grants
Government grants are the transfer of monetary assets or non-monetary assets from the
Government to the Bank at no consideration. A government grant is recognised when the Bank
complies with the conditions attaching to the grant and when the Bank is able to receive the grant.
If a government grant is in the form of a transfer of a monetary asset, the item is measured at the
amount received or receivable.
A government grant which relates to an asset is recognised as deferred income, and evenly
amortised to profit or loss over the useful life of the related asset.
For a government grant which relates to income, if the grant is a compensation for related
expenses or losses to be incurred in subsequent periods, the grant is recognised as deferred
income, and recognised in profit or loss over the periods in which the related costs are recognised;
if the grant is a compensation for related expenses or losses already incurred, the grant is
recognised immediately in profit or loss for the current period.
Income tax
Income tax expenses comprise current tax expense and deferred tax expense.
Current tax
At the balance sheet date, the current income tax liabilities (or assets) for the current period or
previous periods are measured at the amount expected to be paid (or recoverable) according to the
requirements of tax law.
Deferred tax
Temporary differences arising from the difference between the carrying amount of an asset or
liability and its tax base, or the difference between the tax base and the carrying amount of those
items that are not recognised as assets or liabilities but have a tax base that can be determined
according to tax laws, are recognized as deferred tax assets and deferred tax liabilities using the
balance sheet liability method.
The Bank recognizes a deferred tax asset for the carry forward of unused deductible losses and tax
credits to the extent that it is probable that future taxable profits will be available against which
the deductible losses and tax credits can be utilized.
At the balance sheet date, deferred tax assets and deferred tax liabilities are measured at the tax
rates that are expected to apply to the period when the asset is realized or the liability is settled,
according to the requirements of tax laws.
Current income tax and deferred tax is recognized in current year profit and loss, except when it
relates to items charged or credited directly to other comprehensive income or equity, in which
case the current tax is also dealt with in other comprehensive income or equity.
150150

( )
Morgan Stanley Bank International (China) Limited
4. SIGNIFICANT ACCOUNTING POLICIES AND ACCOUNTING ESTIMATES - continued
Income tax - continued
Deferred tax - continued
At the balance sheet date, the Bank reviews the carrying amount of any deferred tax asset. If it is
probable that sufficient taxable profits will not be available in future periods to allow the benefit
of the deferred tax asset to be utilized, the carrying amount of the deferred tax asset is reduced.
Any such reduction in amount is reversed to the extent that it becomes probable that sufficient
taxable profits will be available.
Tax asset and tax liability offset
When the Bank has a legal right to offset the recognized amounts and intends to either settle on a
net basis or realize the asset and settle the liability simultaneously, tax asset and tax liability of
current period are offset and the net amount is presented on the balance sheet.
When the Bank has a legal right to offset the current income tax assets and current income tax
liabilities, the deferred tax assets and the deferred tax liabilities relate to income taxes levied by
the same taxation authority on either the same taxable entity, or different taxable entities which
intend to either settle current tax liabilities and assets on a net basis, or to realise the assets and
settle the liabilities simultaneously, in each future period in which significant amounts of deferred
tax liabilities or assets are expected to be settled or recovered, are reported on a net basis.
Translation of transactions denominated in foreign currencies
On initial recognition, foreign currency transactions are translated by applying the spot exchange
rate at the dates of the transactions.
Monetary assets and liabilities denominated in foreign currencies are translated into functional
currency at the exchange rate prevailing at the balance sheet date. Exchange differences arising
from the differences between the exchange rate prevailing at the balance sheet date and the
exchange rates used on initial recognition or at the previous balance sheet date are recognized in
profit or loss for the current period.
Non-monetary assets and liabilities denominated in foreign currency are carried at historical cost
using the exchange rates at the dates of the transactions; non-monetary assets and liabilities
carried at fair value and denominated in foreign currency are translated using the exchange rates
at the date when the fair value was determined. Differences between the translated amount and the
original amount of functional currency are accounted for as changes in fair value (including
changes in exchange rates) in profit or loss for the period.
151151

( )
Morgan Stanley Bank International (China) Limited
4. SIGNIFICANT ACCOUNTING POLICIES AND ACCOUNTING ESTIMATES - continued
Leases
A finance lease is a lease that transfers in substance all the risks and rewards incidental to
ownership of an asset. Title may or may not eventually be transferred. An operating lease is a
lease other than a finance lease.
The Bank records operational lease as lessee
Lease payments under an operating lease are recognized on a straight-line basis over the lease
term to the cost of the assets or to profit or loss for the period in which they are incurred.
Contingent rents are charged to profit or loss in the period in which they are actually incurred.
Fiduciary assets
The Bank provides fiduciary services to grant loans to the borrowers and collect the repayments
on behalf of the Bank’s clients. The fund is entrusted and the condition of credit, including the
usage of loan, the principle and the interest rates, are designated by the client. The risk of the
fiduciary loan is taken by the client, the Bank charges commission only for agency activities.
Assets held in a fiduciary capacity are not reported in the Bank’s balance sheet.
152152

( )
Morgan Stanley Bank International (China) Limited
5. BASIS OF DETERMINING SIGNIFICANT ACCOUNTING POLICIES AND KEY
ASSUMPTIONS AND UNCERTAINTIES IN ACCOUNTING ESTIMATES
In the application of the Bank’s accounting policies, which are described in Note 4, the Bank is
required to make judgments, estimates and assumptions about the carrying amounts of items in
the financial statements that cannot be measured accurately. These judgments, estimates and
assumptions are based on historical experience of the Bank's management as well as other factors
that are considered to be relevant. Actual results may differ from these estimates.
The aforementioned judgements, estimates and assumptions are reviewed regularly on a going
concern basis. The effect of a change in accounting estimate is recognized in the period of the
change, if the change affects that period only; or recognized in the period of the change and future
periods, if the change affects both current and future periods.
At each balance sheet date, the Bank makes following key judgements, estimates and
assumptions:
Fair value of financial assets
For the financial instrument without active trading market, the Bank determines its fair value by
various valuation techniques. The valuation techniques that the Bank adopts include discounted
cash flow model. The Bank needs to make estimation such as the credit risks, market volatility
and correlation of itself and counterparties. Any changes in the assumptions made will impact the
fair values of the financial instruments.
Impairment losses of loans and advances
Besides the loan loss provision provided before each quarter-end, the Bank reviews its loan
portfolios to assess impairment on a quarterly basis. In determining whether an impairment loss
should be provided, the Bank makes judgments as to whether there is any objective evidence that
there is a measurable decrease in the estimated future cash flows from loan portfolios if there is no
such decrease identified with an individual loan in that portfolio. The objective evidence may
include observable data indicating that there has been an adverse change in the payment status of
borrowers in a Bank (e.g. payment delinquency or default), or national or local economic
conditions that correlate with defaults on assets in the Bank. The Bank uses estimates based on
historical loss experience for assets with credit risk characteristics and objective evidence of
impairment similar to those in the portfolio when estimating expected future cash flows. The
methodology and assumptions used for estimating both the amount and timing of future cash
flows are reviewed regularly to reduce any differences between loss estimates and actual loss
experience.
Income tax
There are a number of transactions for which the final tax determination and calculation is
uncertain during the ordinary course of business operation. In particular, the deductibility of
certain items is subjected to government approval. Where the final tax outcome is different from
the amount that was initially recorded, such differences will impact the income tax and deferred
income tax provisions in the period during which such a determination is made.
153153

( )
Morgan Stanley Bank International (China) Limited
5. BASIS OF DETERMINING SIGNIFICANT ACCOUNTING POLICIES AND KEY
ASSUMPTIONS AND UNCERTAINTIES IN ACCOUNTING ESTIMATES - continued
Deferred tax assets and liabilities
Deferred tax assets and liabilities, are measured at the tax rates that are expected to apply to the
period when the assets are realized or the liabilities are settled, according to the requirements of
tax laws. Within the limit of sufficient available taxable profits against which the loss can be
deductible, the Bank recognizes deferred tax assets against the deductible losses. This requires
management judgment to estimate the time of taxable profits and appropriate tax rate to determine
the amount of deferred tax assets and liabilities.
6. TAXATION
Income tax
According to “Enterprise Income Tax Law of the People’s Republic of China” (hereinafter called
as the “New Enterprise Income Tax Law”) issued on March 2007, the Bank is subjected to New
Enterprise Income Tax Law and relevant regulations effective from 1 January 2008.
According to “Notice on Implication of Enterprise Income Tax Transitional Preferential Tax
Policy Issued by the State Council” (Guo fai [2007] No. 39), the enterprises which entitle to the
preferential tax policy of the old tax law, regulation and other legal documents, will entitle to the
transitional preferential tax policy: From 1 January 2008, the tax rate of the enterprises which
entitle to the low preferential tax policy are allowed to transit to statutory tax rate gradually in 5
years after the implementation of New Enterprise Income Tax Law. The applicable tax rates are
that the enterprises which use 15% tax rate will implement 18% tax rate in year 2008, 20% tax
rate in year 2009, 22% tax rate in year 2010, 24% tax rate in year 2011, and 25% tax rate in year
2012. The Bank’s Zhuhai Head office belongs to the enterprises entitling to the preferential tax
policy mentioned above. The applicable tax rate for year 2010 is 22% (2009: 20%). The above
transitional preferential tax policy is not applicable to the Bank’s Beijing Branch.
Business tax
The business tax rate is 5%.
Other tax
According to the "Circular of the State Council on Extending the Urban Maintenance and Construction Tax and Education Surcharges to Foreign Enterprises and Nationals (Guofa [2010] No. 35)" and Circular on Levying Urban Maintenance and Construction Tax and Education Surcharge (CaiShui [2010] No.103), the Bank is liable for paying Urban Maintenance and Construction Tax and Education Surcharge at the rate of 7% and 3% for their turnover tax liability that occurs on or after 1 December 2010.
154154

( )
Morgan Stanley Bank International (China) Limited
7. CASH AND BALANCES WITH THE CENTRAL BANK
31/12/2010 31/12/2009
RMB RMB
Cash - 299,573.47
Statutory reserves with the Central Bank 32,675,197.96 34,733,462.40
Other deposits with the Central Bank 33,959,991.46 44,265,151.59 ______________ _____________
66,635,189.42 79,298,187.46 ______________ _____________ ______________ _____________
Statutory reserves are placed according to the relevant regulations promulgated by the PBOC. In
accordance with “Notice on Raising Reserve Rate for Foreign Currency Deposits Issued by the
People’s Bank of China” [YinFa(2007)No.134], reserve rate for all foreign currency deposits of
financial institutions was adjusted to 5% effective 15 May 2007. Statutory reserve for foreign
currency business is deposited at 5% of the month-end balances of the relevant deposit items.
Statutory reserve for foreign currency business is non-interest bearing. In accordance with “Notice
on Increasing Reserve Rate for RMB Currency Deposits Issued by the People’s Bank of China” of
PBOC Zhuhai Central Branch, reserve rate for all RMB deposits of financial institutions was
adjusted to 16.5% effective 20 December 2010. Statutory reserve for RMB business is deposited
at 16.5% based on the RMB deposit balance at the end of each ten days.
8. DUE FROM BANKS
31/12/2010 31/12/2009
RMB RMB
Due from domestic banks 5,354,311.69 12,772,705.01
Due from overseas banks 123,553,512.84 424,252,757.64 ______________ _____________
Total 128,907,824.53 437,025,462.65 ______________ _____________ ______________ _____________
9. PLACEMENTS WITH BANKS AND OTHER FINANCIAL INSTITUTIONS
31/12/2010 31/12/2009
RMB RMB
Placements with domestic banks 666,227,000.00 - ______________ _____________ ______________ _____________
155155

( )
Morgan Stanley Bank International (China) Limited
10. FINANCIAL ASSETS HELD FOR TRADING
31/12/2010 31/12/2009
RMB RMB
Government bonds and PBOC bills 211,599,030.00 52,218,660.00
Financial institution bonds 2,219,114,360.00 1,365,030,682.53
Corporate bonds 99,050,000.00 80,392,000.00 ______________ ______________
Total 2,529,763,390.00 1,497,641,342.53 ______________ ______________ ______________ ______________
As of balance sheet date, the face value of financial assets held for trading RMB1,212 million
(2009: RMB910 million) have been pledged for repurchase agreements (note 21).
11. INTEREST RECEIVABLE
(1) Movement in interest receivable is as follows:
31/12/2010 31/12/2009
RMB RMB
Opening balance 17,287,586.56 20,390,608.03
Addition during the year 93,807,794.60 75,870,461.20
Received during the year (86,081,460.69) (78,973,482.67) _____________ _____________
Closing balance 25,013,920.47 17,287,586.56 _____________ _____________ _____________ _____________
(2) Categorized by nature is as follows:
31/12/2010 31/12/2009
RMB RMB
Interest receivable from
- Balances with the Central Banks and due from banks 71,288.86 293,738.08
- Placements with banks and other financial institutions 1,462,982.93 -
- Loans and advances to customers 4,551,751.84 682,869.11
- Financial assets held for trading 18,927,896.84 16,257,879.37
- Available-for-sale financial assets - 53,100.00 _____________ _____________
Total 25,013,920.47 17,287,586.56 _____________ _____________ _____________ _____________
156156

( )
Morgan Stanley Bank International (China) Limited
12. LOANS AND ADVANCES TO CUSTOMERS
(1) Categorized by corporate and individual are as follows:
31/12/2010 31/12/2009
RMB RMB
Corporate loans and advances 968,681,000.00 265,077,094.51
Individual loans and advances - 3,557,543.31 _____________ _____________
Total 968,681,000.00 268,634,637.82 _____________ _____________
Less: Loan loss provision - - _____________ _____________
Net book value 968,681,000.00 268,634,637.82 _____________ _____________ _____________ _____________
(2) Categorized by industry are as follows:
31/12/2010 Proportion 31/12/2009 Proportion
RMB (%) RMB (%)
Manufacturing 100,000,000.00 10.32 101,200,294.51 37.68
Wholesale and retail 298,681,000.00 30.83 102,423,000.00 38.12
Metals mining 200,000,000.00 20.65 - -
Power production and supply 100,000,000.00 10.32 - -
Agriculture industry 100,000,000.00 10.32 - -
Construction Industry 170,000,000.00 17.56 - -
Rental industry - - 61,453,800.00 22.88
Individual loans - - 3,557,543.31 1.32 _____________ ______ _____________ ______
Total 968,681,000.00 100.00 268,634,637.82 100.00 _____________ ______ _____________ ______
Less: Loan loss provision - - _____________ _____________
Net book value 968,681,000.00 268,634,637.82 _____________ _____________ _____________ _____________
157157

( )
Morgan Stanley Bank International (China) Limited
12. LOAN AND ADVANCES TO CUSTOMERS - continued
(3) Categorized by registered location of the borrowers are as follows:
31/12/2010 Proportion 31/12/2009 Proportion
RMB (%) RMB (%)
Northern China 868,681,000.00 89.68 100,000,000.00 37.23
Southern China - - 102,423,000.00 38.13
Eastern China 100,000,000.00 10.32 - -
Overseas - - 66,211,637.82 24.64 _____________ ______ _____________ ______
Total 968,681,000.00 100.00 268,634,637.82 100.00 _____________ ______ _____________ ______
Less: Loan loss provision - - _____________ _____________
Net book value 968,681,000.00 268,634,637.82 _____________ _____________ _____________ _____________
(4) Categorized by contract agreement terms and guarantee pattern are as follows:
31/12/2010 31/12/2009
Within a year 1 year to 5 years Within a year 1 year to 5 years
(including 1year) (including 5 years) Over 5 years Total (including 1year) (including 5 years) Over 5 years Total
RMB RMB RMB RMB RMB RMB RMB RMB
Clean loans 500,000,000.00 200,000,000.00 - 700,000,000.00 100,000,000.00 - - 100,000,000.00
Guarantee loans 70,000,000.00 - - 70,000,000.00 - - - -
Collateralized loans 198,681,000.00 - - 198,681,000.00 163,876,800.00 4,757,837.82 - 168,634,637.82
Include: Collateral loans - - - - - 4,757,837.82 - 4,757,837.82
Pledged loans 198,681,000.00 - - 198,681,000.00 163,876,800.00 - - 163,876,800.00 _____________ _____________ _____________ ______________ ______________ ______________ _____________ ______________
Total 768,681,000.00 200,000,000.00 - 968,681,000.00 263,876,800.00 4,757,837.82 - 268,634,637.82 _____________ _____________ _____________ ______________ ______________ ______________ _____________ ______________
Less: Loan loss provision - - ______________ ______________
Net book value 968,681,000.00 268,634,637.82 ______________ ______________ ______________ ______________
158158

( )
Morgan Stanley Bank International (China) Limited
13. AVAILABLE-FOR-SALE FINANCIAL ASSETS
31/12/2010 31/12/2009
RMB RMB
Purchased loan - 100,000,000.00 _____________ _____________ _____________ _____________
14. INVESTMENT PROPERTY
Building
RMB
Opening fair value 18,418,859.00
Change in fair value during the year 1,069,928.00 ______________
Closing fair value 19,488,787.00 ______________ ______________
The investment property of the Bank is a building, valued at fair value. The fair value is based on
an active market price, and adjusted according to the specific asset's situation, location and
conditions if necessary. The Bank's investment property is not pledged.
15. FIXED ASSETS
Motor vehicles Office equipment Total
RMB RMB RMB
Cost
Opening balance 251,665.98 13,885,259.53 14,136,925.51
Addition during the year - 1,603,486.02 1,603,486.02
Disposal during the year - (682,325.33) (682,325.33) ____________ ____________ _____________
Closing balance 251,665.98 14,806,420.22 15,058,086.20 ____________ ____________ _____________
Accumulated depreciation
Opening balance 117,024.69 4,595,038.36 4,712,063.05
Charge for the year 45,299.88 2,642,461.55 2,687,761.43
Disposal during the year - (300,061.91) (300,061.91) ____________ ____________ _____________
Closing balance 162,324.57 6,937,438.00 7,099,762.57 ____________ ____________ _____________
Net book value
Opening balance 134,641.29 9,290,221.17 9,424,862.46 ____________ ____________ _____________ ____________ ____________ _____________
Closing balance 89,341.41 7,868,982.22 7,958,323.63 ____________ ____________ _____________ ____________ ____________ _____________
159159
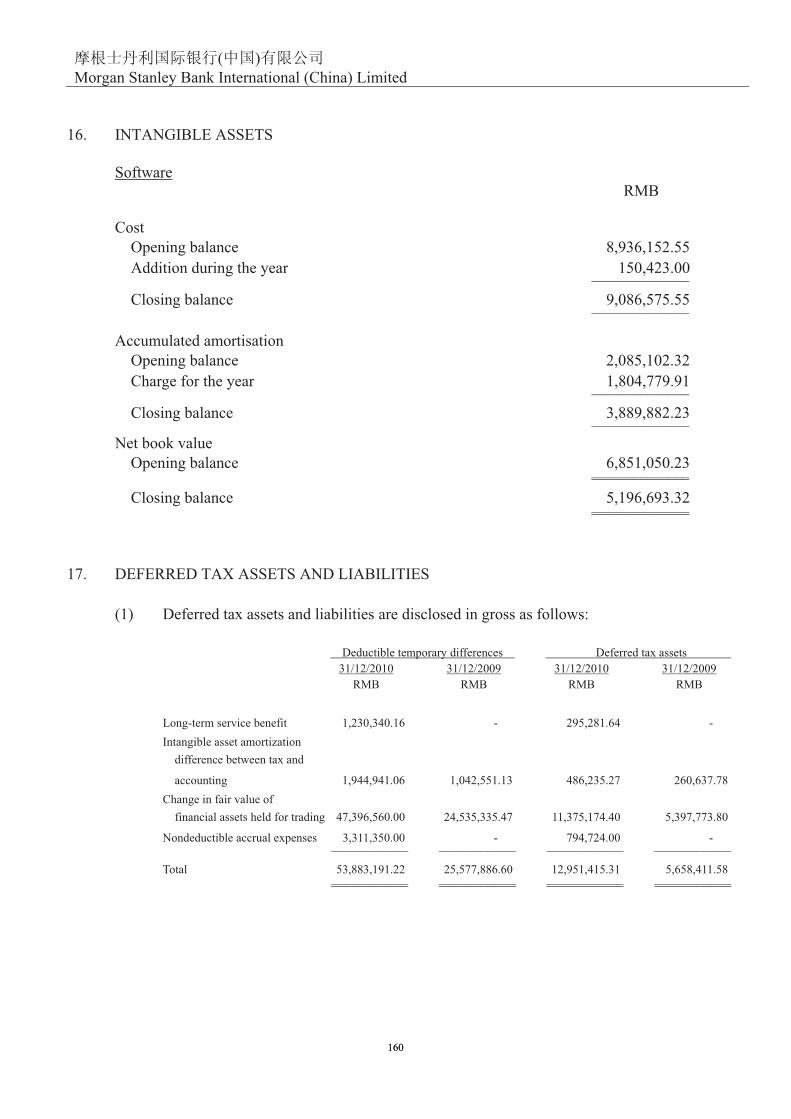
( )
Morgan Stanley Bank International (China) Limited
16. INTANGIBLE ASSETS
Software
RMB
Cost
Opening balance 8,936,152.55
Addition during the year 150,423.00 ______________
Closing balance 9,086,575.55 ______________
Accumulated amortisation
Opening balance 2,085,102.32
Charge for the year 1,804,779.91 ______________
Closing balance 3,889,882.23 ______________
Net book value
Opening balance 6,851,050.23 ______________ ______________
Closing balance 5,196,693.32 ______________ ______________
17. DEFERRED TAX ASSETS AND LIABILITIES
(1) Deferred tax assets and liabilities are disclosed in gross as follows:
Deductible temporary differences Deferred tax assets
31/12/2010 31/12/2009 31/12/2010 31/12/2009
RMB RMB RMB RMB
Long-term service benefit 1,230,340.16 - 295,281.64 -
Intangible asset amortization
difference between tax and
accounting 1,944,941.06 1,042,551.13 486,235.27 260,637.78
Change in fair value of
financial assets held for trading 47,396,560.00 24,535,335.47 11,375,174.40 5,397,773.80
Nondeductible accrual expenses 3,311,350.00 - 794,724.00 - ___________ ___________ ___________ ___________
Total 53,883,191.22 25,577,886.60 12,951,415.31 5,658,411.58 ___________ ___________ ___________ ___________ ___________ ___________ ___________ ___________
160160

( )
Morgan Stanley Bank International (China) Limited
17. DEFERRED TAX ASSETS AND LIABILITIES - continued
(1) Deferred tax assets and liabilities are disclosed in gross as follows: - continued
Taxable temporary differences Deferred tax liabilities
31/12/2010 31/12/2009 31/12/2010 31/12/2009
RMB RMB RMB RMB
Change in fair value of
investment property 19,488,787.00 18,418,859.00 4,872,196.75 4,604,714.75
Loan loss provision 16,349,080.00 3,686,346.38 3,923,779.20 810,996.20 ___________ ___________ ___________ ___________
Total 35,837,867.00 22,105,205.38 8,795,975.95 5,415,710.95 ___________ ___________ ___________ ___________ ___________ ___________ ___________ ___________
(2) The Bank nets off deferred tax assets and liabilities and presents in net basis.
Deferred tax assets and liabilities are disclosed net as follows:
31/12/2010 31/12/2009
RMB RMB
Deferred tax assets 12,951,415.31 5,658,411.58
Deferred tax liabilities (8,795,975.95) (5,415,710.95) _____________ _____________
Net total 4,155,439.36 242,700.63 _____________ _____________ _____________ _____________
(3) The New Enterprises Income Tax Law is implemented from 1 January 2008. According to
“Notice on Implementation of Enterprise Income Tax Transitional Preferential Tax Policy
Issued by the State Council” (Guo fai [2007] No. 39), the enterprises which entitled to the
preferential tax policy of the old tax law, regulation and other legal documents, will entitle
to the transitional preferential tax policy: From 1 January 2008, the tax rate of the
enterprises which entitle to the low preferential tax policy are allowed to transit to
statutory tax rate gradually in 5 years after the implementation of New Enterprises Income
Tax Law. The applicable tax rate are that the enterprises which use 15% tax rate will
implement 18% tax rate in year 2008, 20% tax rate in year 2009, 22% tax rate in year
2010, 24% tax rate in year 2011, and 25% tax rate in year 2012. The Bank’s Head office
belongs to the enterprises entitling to the preferential tax policy mentioned above. The
applicable tax rate for year 2010 is 22% (2009:20%). The preferential tax policy
mentioned above is not applicable to the Bank’s Beijing Branch.
(4) According to the expectation regarding future operations, the Bank believes that sufficient
taxable income will be obtained in the future periods to deduct deductible temporary
difference, and thus recognize the relevant deferred tax asset.
161161

( )
Morgan Stanley Bank International (China) Limited
18. OTHER ASSETS
31/12/2010 31/12/2009
RMB RMB
Security deposits 1,024,953.61 1,035,153.61
Prepaid expenses 679,777.65 -
Temporary payments 71,096.17 709,117.80
Long-term prepayments (1) 4,566,236.30 10,129,975.47
Commission fee receivables - 11,643,840.06
Consulting fee receivables 26,242,976.84 5,467,163.58
Foreign exchange contracts 297,676,000.00 -
Others 4,542,462.43 21,248.97 _____________ ______________
Total 334,803,503.00 29,006,499.49 _____________ ______________ _____________ ______________
(1) Long-term prepayments
Leasehold Improvement
RMB
Cost
Opening balance 16,275,024.26
Addition during the year 1,510,059.84
Transfer out during the year (1,047,474.01)
Disposal during the year (4,122,713.76) ______________
Closing balance 12,614,896.33 ______________
Amortisation
Opening balance 6,145,048.79
Charge for the year 6,026,325.00
Disposal during the year (4,122,713.76) ______________
Closing balance 8,048,660.03 ______________
Net Book Value
Opening balance 10,129,975.47 ______________ ______________
Closing balance 4,566,236.30 ______________ ______________
162162

( )
Morgan Stanley Bank International (China) Limited
19. DUE TO BANKS AND OTHER FINANCIAL INSTITUTIONS
31/12/2010 31/12/2009
RMB RMB
Due to domestic banks 173,175,536.74 2,652.38 ____________ ____________ ____________ ____________
20. PLACEMENTS FROM BANKS AND OTHER FINANCIAL INSTITUTIONS
31/12/2010 31/12/2009
RMB RMB
Placements from domestic banks 220,000,000.00 -
Placements from overseas banks 98,678,230.00 61,453,800.00 ______________ _____________
Total 318,678,230.00 61,453,800.00 ______________ _____________ ______________ _____________
21. REPURCHASE AGREEMENTS
Classified by collateralized assets:
31/12/2010 31/12/2009
RMB RMB
Bonds 1,212,000,000.00 910,000,000.00 ______________ ______________ ______________ ______________
22. CUSTOMER DEPOSITS
31/12/2010 31/12/2009
RMB RMB
Current deposits
Corporate 68,445,698.62 104,432,116.51
Individual 1,718,236.45 5,343,482.15
Time deposits
Corporate 1,709,880,001.28 168,910,080.00
Individual 5,725,558.16 6,707,075.46 ______________ _____________
Total 1,785,769,494.51 285,392,754.12 ______________ _____________ ______________ _____________
163163

( )
Morgan Stanley Bank International (China) Limited
23. EMPLOYEE BENEFIT PAYABLE
Accruals Payments
1/1/2010 for the year for the year 31/12/2010
RMB RMB RMB RMB
Salaries, bonuses,
allowances and subsidies 6,836,877.75 23,848,795.22 (26,766,271.39) 3,919,401.58
Staff welfare - 2,485,356.94 (1,662,501.91) 822,855.03
Social security contributions - 1,070,766.15 (1,070,766.15) -
Housing funds - 532,749.30 (532,749.30) -
Compensation to employees
for termination of
employment - 1,415,645.81 (1,405,800.31) 9,845.50 ___________ ____________ ____________ ____________
Total 6,836,877.75 29,353,313.42 (31,438,089.06) 4,752,102.11 ___________ ____________ ____________ ____________ ___________ ____________ ____________ ____________
24. CURRENT TAX PAYABLE
31/12/2010 31/12/2009
RMB RMB
Corporate income tax 7,714,696.74 18,445,325.84
Business tax and surcharge 4,148,735.15 3,741,518.22
Individual income tax 60,677.35 1,770,970.96
Others 102,271.15 21,308.93 ____________ ____________
Total 12,026,380.39 23,979,123.95 ____________ ____________ ____________ ____________
25. INTEREST PAYABLE
(1) Movement in interest payable is as follows:
31/12/2010 31/12/2009
RMB RMB
Opening balance 848,030.20 11,157,386.82
Addition during the year 33,918,672.51 17,938,609.79
Payment during the year (27,562,243.21) (28,247,966.41) ____________ ____________
Closing balance 7,204,459.50 848,030.20 ____________ ____________ ____________ ____________
164164

( )
Morgan Stanley Bank International (China) Limited
25. INTEREST PAYABLE - continued
(2) Categorized by nature is as follows:
0102/21/13 31/12/2009
BMR BMR
Interest payable from
77.248,135 38.679,435,2 stisoped remotsuC -
- Due to banks and other financial institutions 1,201,061.94 0.29
- Placements from banks and other financial institutions 844,422.96 215,719.91
32.764,001 77.799,326,2 stnemeerga esahcrupeR - ____________ ____________
02.030,848 05.954,402,7 latoT ____________ ____________ ____________ ____________
26. OTHER LIABILITIES
0102/21/13 31/12/2009
BMR BMR
88.247,103 88.247,103 stisoped ytiruceS
61.231,455,1 53.891,399,6 sesnepxe deurccA
11.433,576,1 08.385,309,5 selbayap rehtO ______________ ____________
51.902,135,3 30.525,891,31 latoT ______________ ____________ ______________ ____________
27. PAID-IN CAPITAL
The registered capital of the Bank is RMB 1,000,000,000.00, and was fully paid up as of 31
December 2010. Details of capital contribution from the investor according to the Bank's articles
are as follows:
0102/21/13
ycnerruC lanigirO Proportion Amount
tnelaviuqE BMR )%(
Morgan Stanley Bank International Limited RMB 67% 666,000,000.00
00.000,000,433 %33 DKH _______________
00.000,000,000,1 _______________ _______________
9002/21/13
ycnerruC lanigirO Proportion Amount
tnelaviuqE BMR )%(
Morgan Stanley Bank International Limited RMB 50% 500,000,000.00
00.000,000,005 %05 DKH _______________
00.000,000,000,1 _______________ _______________
165165

( )
Morgan Stanley Bank International (China) Limited
27. PAID-IN CAPITAL - continued
The above paid-in capital had been verified by capital verification report (2002) Heng De Zhu
Yan Zi No. 72 and (2007) Heng De Zhu Yan Zi No. 11 issued by Guangdong Hengxin Delv
Certified Public Accountants Co., Ltd.
28. SURPLUS RESERVES
31/12/2010 31/12/2009
RMB RMB
Opening balance 33,679,202.65 11,048,076.23
Addition during the year 5,823,960.12 22,631,126.42 ____________ ____________
Closing balance 39,503,162.77 33,679,202.65 ____________ ____________ ____________ ____________
29. GENERAL RESERVES
31/12/2010 31/12/2009
RMB RMB
Opening balance 8,403,791.24 25,745,194.02
Addition/(reversal) during the year 12,673,954.65 (17,341,402.78) ____________ ____________
Closing balance 21,077,745.89 8,403,791.24 ____________ ____________ ____________ ____________
166166

( )
Morgan Stanley Bank International (China) Limited
30. RETAINED EARNINGS
31/12/2010 31/12/2009
RMB RMB
Opening balance 129,703,747.39 131,396,366.13
Net profit for the year 58,239,601.17 3,597,104.90
Appropriation to surplus reserves (1) (5,823,960.12) (22,631,126.42)
(Appropriation to)/ reversal from general reserves (2) (12,673,954.65) 17,341,402.78 _____________ ____________
Closing balance 169,445,433.79 129,703,747.39 _____________ ____________ _____________ ____________
(1) Surplus reserves
According to the board meeting resolution, the Bank appropriates 10% of profit after tax to
the surplus reserves effective year 2007 until the board amends the distribution policy in the
future periods.
(2) General reserves
According to the board meeting resolution, the Bank appropriates 1% general provisions to
general reserves based on total risk assets as of year end balance effective year 2007 until the
board amends the distribution policy in the future periods.
31. NET INTEREST INCOME
2010 2009
RMB RMB
Interest income
- Due from banks 2,366,095.36 2,522,039.96
- Balances with the Central Bank 1,710,776.71 1,642,802.36
- Placements with banks and other financial institutions 2,864,229.79 1,567,867.51
- Financial assets held for trading 61,410,790.82 44,609,261.57
- Loans and advances to customers 22,030,951.92 25,475,389.80
- Available-for-sale financial assets 3,424,950.00 53,100.00 _____________ ____________
Subtotal 93,807,794.60 75,870,461.20 _____________ ____________
Interest expenses
- Due to banks and other financial institutions 1,201,071.01 107.57
- Placements from banks and other financial institutions 5,216,650.50 4,820,775.15
- Repurchase agreements 22,093,109.92 11,464,747.45
- Customer deposits 5,407,841.08 1,652,979.62 _____________ ____________
Subtotal 33,918,672.51 17,938,609.79 _____________ ____________
Net interest income 59,889,122.09 57,931,851.41 _____________ ____________ _____________ ____________
167167

( )
Morgan Stanley Bank International (China) Limited
32. NET FEE AND COMMISSION INCOME
2010 2009
RMB RMB
Fee and commission income
-Entrusted loans 1,640,000.00 200,000.00
-Arrangement fee for syndicated loans 29,218,787.03 22,796,765.80
-Consulting fee 66,227,089.09 39,463,179.21
-Settlement and clearing fee 34,907.80 23,625.98
-Agent business fee 760.50 153,759.38
-Fees related to credit business 1,930,628.65 775,485.54
-Others 99,697.45 121,253.51 _____________ ____________
Subtotal 99,151,870.52 63,534,069.42 _____________ ____________
Fee and commission expenses
-Syndicated loans 6,870,000.00 -
-Other fee expenses 767,307.16 673,829.19 _____________ ____________
Subtotal 7,637,307.16 673,829.19 _____________ ____________
Net fee and commission income 91,514,563.36 62,860,240.23 _____________ ____________ _____________ ____________
33. INVESTMENT INCOME
2010 2009
RMB RMB
Disposal of financial assets held for trading 9,635,143.22 33,154,153.93 _____________ ____________ _____________ ____________
34. (LOSSES)/GAINS FROM CHANGES IN FAIR VALUE
2010 2009
RMB RMB
Financial assets held for trading (22,861,225.75) (93,982,708.40)
Investment property 1,069,928.00 510,448.00 _____________ ____________
Total (21,791,297.75) (93,472,260.40) _____________ ____________ _____________ ____________
168168

( )
Morgan Stanley Bank International (China) Limited
35. OTHER OPERATING INCOME
2010 2009
RMB RMB
Credit assets transfer profit - 5,408,782.26
Investment property rental income 1,206,971.52 707,311.27 _____________ ____________
Total 1,206,971.52 6,116,093.53 _____________ ____________ _____________ ____________
36. BUSINESS TAX AND SURCHARGES
2010 2009
RMB RMB
Business tax 10,717,871.22 8,619,297.67
Surcharges 180,105.93 52,749.88 _____________ ____________
Total 10,897,977.15 8,672,047.55 _____________ ____________ _____________ ____________
37. OPERATING EXPENSES
2010 2009
RMB RMB
Staff salaries and welfare 29,353,313.42 29,351,320.37
Operating lease rentals and utilities expenses 6,701,715.85 7,548,488.35
Travelling expenses 1,073,836.45 671,229.43
Electrical equipment maintenance fees 5,610,792.02 4,990,819.57
Entertainment expenses 271,373.49 56,274.57
Fees to regulators 572,344.77 773,856.95
Taxes 205,185.64 125,421.84
Depreciation 2,687,761.43 2,358,863.52
Long-term prepayments amortization 6,026,325.00 3,939,112.60
Intangible assets amortization 1,804,779.91 1,787,230.56
Service fees 4,511,350.00 929,032.26
Others 5,689,571.22 4,524,840.81 _____________ ____________
Total 64,508,349.20 57,056,490.83 _____________ ____________ _____________ ____________
169169

( )
Morgan Stanley Bank International (China) Limited
38. IMPAIRMENT REVERSAL ON ASSETS
2010 2009
RMB RMB
Loans and advances to customers - (382,034.48) _____________ ____________ _____________ ____________
39. NON-OPERATING INCOME
2010 2009
RMB RMB
Government grants 1,148,700.00 -
Fees from withholding tax 6,254.92 24,381.43
Gain from fixed asset disposal - 74,868.55
Others 888.00 - _____________ ____________
Total 1,155,842.92 99,249.98 _____________ ____________ _____________ ____________
Government grants in 2010 represent mainly the repayment of office rent for Beijing Branch.
40. NON-OPERATING EXPENSES
2010 2009
RMB RMB
Loss from fixed assets disposal 357,106.44 949.80
Others 142.93 7,396.92 _____________ ____________
Total 357,249.37 8,346.72 _____________ ____________ _____________ ____________
41. INCOME TAX EXPENSES
2010 2009
RMB RMB
Income tax expenses 19,643,238.74 20,645,325.68
Deferred tax expenses (3,912,738.73) (18,448,895.12)
Adjustment for last year income tax 183,227.06 (5,116,865.20)
Include: Income tax expenses 183,227.06 (3,535,188.59)
Deferred tax expenses - (1,581,676.61) _____________ ____________
Total 15,913,727.07 (2,920,434.64) _____________ ____________ _____________ ____________
170170

( )
Morgan Stanley Bank International (China) Limited
41. INCOME TAX EXPENSES - continued
Reconciliation of income tax expenses to accounting profits is as follows:
2010 2009
RMB RMB
Accounting profit 74,153,328.24 676,670.26
Tax calculated at Head office tax rate 22%
in current year (20% in last year) 16,313,732.21 135,334.05
Expenses not deductible for tax purposes 305,940.50 727,717.78
Estimated effect of tax rate change (706,756.96) (137,073.75)
Adjustment for regional tax rate difference 416,115.67 -
Adjustment for last year income tax 183,227.06 (3,535,188.59)
Non-taxable income (598,531.41) (111,224.13) _____________ ____________
Income tax expenses 15,913,727.07 (2,920,434.64) _____________ ____________ _____________ ____________
42. CASH AND CASH EQUIVALENTS
2010 2009
RMB RMB
Cash and balances with the Central Bank 66,635,189.42 79,298,187.46
Statutory reserve (32,675,197.96) (34,733,462.40)
Original maturity within 3 months:
Due from banks 128,907,824.53 437,025,462.65
Placements with banks and
other financial institutions 600,000,000.00 - _____________ _____________
Total 762,867,815.99 481,590,187.71 _____________ _____________ _____________ _____________
171171

( )
Morgan Stanley Bank International (China) Limited
43. CASH FLOW STATEMENT SUPPLEMENTARY INFORMATION
2010 2009
RMB RMB
Reconciliation of net profit to cash flows from operating activities
Net profit 58,239,601.17 3,597,104.90
Add: Impairment reversal on assets - (382,034.48)
Depreciation of fixed assets 2,687,761.43 2,358,863.52
Amortization of intangible assets 1,804,779.91 1,787,230.56
Amortization of long-term prepayments 6,026,325.00 3,939,112.60
Losses/(Gains) on disposal of fixed assets 357,106.44 (73,918.75)
Investment income (9,635,143.22) (33,154,153.93)
Bond interest income (64,835,740.82) (44,609,261.57)
Losses from changes in fair value 21,791,297.75 93,472,260.40
Increase in deferred tax assets (3,912,738.73) (18,448,895.12)
(Increase)/decrease in operating receivables (1,079,584,682.87) 656,378,752.92
Increase/(decrease) in operating payables 2,244,996,421.74 (946,299,085.18) _______________ _______________
Net cash inflow from operating activities 1,177,934,987.80 (281,434,024.13) _______________ _______________
Cash and cash equivalents net increase
Cash as at 31 December - 299,573.47
Less: Cash as at 1 January 299,573.47 2,968,794.79
Add: Cash equivalents as at 31 December 762,867,815.99 481,290,614.24
Less: Cash equivalents as at 1 January 481,290,614.24 297,570,077.84 _______________ _______________
Cash and cash equivalents net increase 281,277,628.28 181,051,315.08 _______________ _______________ _______________ _______________
44. SEGMENT INFORMATION
According to the Bank's internal organizational structure, regulatory requirements and internal
reporting system, the Bank's businesses are divided into following reporting segments, which are
based on the Bank's operational location. The Bank's management periodically evaluates
operating results of these segments reporting to determine resources allocation and evaluates
operating results.
Information of segment reporting is disclosed based on the accounting policies and measurement
used when segments report is provided to the management. These measurement bases are
consistent with the accounting policies and measurement used when preparing the financial
statements.
172172

( )
Morgan Stanley Bank International (China) Limited
44. SEGMENT INFORMATION - continued
Segment report information:
2010
Head Office Beijing Branch Elimination Total
RMB RMB RMB RMB
Operating income 135,584,536.34 13,176,524.70 - 148,761,061.04
Net interest income 51,564,896.39 8,324,225.70 - 59,889,122.09
Include:
Net interest income
between segments 749,577.63 (749,577.63) - -
Net fee and commission income 86,684,570.06 4,829,993.30 - 91,514,563.36
Net other income (2,664,930.11) 22,305.70 - (2,642,624.41) _______________ _____________ ____________ _____________
Operating expenses 45,609,619.28 29,796,707.07 - 75,406,326.35 _______________ _____________ ____________ _____________
Operating profit/(loss) 89,974,917.06 (16,620,182.37) - 73,354,734.69 _______________ _____________ ____________ _____________
Segment assets 4,467,564,565.74 1,936,455,349.55 1,651,344,283.92 4,752,675,631.37 _______________ ______________ ______________ _____________ _______________ ______________ ______________ _____________
Segment liabilities 3,210,750,031.41 1,867,398,980.79 1,551,344,283.92 3,526,804,728.28 _______________ ______________ ______________ _____________ _______________ ______________ ______________ _____________
Additional information:
Depreciation and amortization 6,511,565.63 4,007,300.71 - 10,518,866.34
Capital expenditures 797,506.60 2,466,462.26 - 3,263,968.86
Include: Expenditures on
purchasing fixed assets 70,800.00 1,532,686.02 - 1,603,486.02
Expenditures on
long-term prepayments 576,283.60 933,776.24 - 1,510,059.84
Expenditures on
intangible assets 150,423.00 - - 150,423.00
173173

( )
Morgan Stanley Bank International (China) Limited
44. SEGMENT INFORMATION - continued
Segment report information: - continued
9002
eciffO daeH Beijing Branch Elimination Total
BMR BMR BMR BMR
Operating income 65,144,790.25 787,480.65 - 65,932,270.90
Net interest income 57,135,092.81 796,758.60 - 57,931,851.41
Include:
Net interest income
between segments (212,954.38) 212,954.38 - -
Net fee and commission income 62,869,685.73 (9,445.50) - 62,860,240.23
Net other income (54,859,988.29) 167.55 - (54,859,820.74) _____________ ____________ ____________ _______________
Operating expenses 52,549,490.81 12,797,013.09 - 65,346,503.90 _____________ ____________ ____________ _______________
Operating profit/(loss) 12,595,299.44 (12,009,532.44) - 585,767.00 _____________ ____________ ____________ _______________
Segment assets 2,547,088,331.38 92,430,274.11 175,687,416.66 2,463,831,188.83 _____________ ____________ ____________ _______________ _____________ ____________ ____________ _______________
Segment liabilities 1,363,292,057.66 4,439,806.55 75,687,416.66 1,292,044,447.55 _____________ ____________ ____________ _______________ _____________ ____________ ____________ _______________
Additional information:
Depreciation and amortization 5,188,872.34 2,896,334.34 - 8,085,206.68
Impairment loss
reversed for the year (382,034.48) - - (382,034.48)
Capital expenditures 3,100.00 11,484,739.72 - 11,487,839.72
Include: Expenditures on
purchasing fixed assets 3,100.00 3,503,482.52 - 3,506,582.52
Expenditures on
long-term prepayments - 7,981,257.20 - 7,981,257.20
(1) External revenue categorized by products or business
0102 2009
BMR BMR
20.905,275,45 61.872,538,63 gniknaB laicremmoC
88.167,953,11 88.287,529,111 gnidarT dna selaS _____________ _____________
09.072,239,56 40.160,167,841 latoT _____________ _____________ _____________ _____________
(2) External revenue categorized by regions
0102 2009
BMR BMR
26.025,534,6 61.996,330,26 eunever lanretxe citsemoD
82.057,694,95 88.163,727,68 eunever lanretxe saesrevO _____________ _____________
09.072,239,56 40.160,167,841 latoT _____________ _____________ _____________ _____________
(3) Non-current assets categorized by assets locations
The Bank's non-current assets are located in China.
174174

( )
Morgan Stanley Bank International (China) Limited
44. SEGMENT INFORMATION - continued
(4) Key client's dependency
The Bank does not have significant dependency relationship with non related party.
Inter-segment transfers are measured on the basis of actual transaction price for such transfers.
Segment revenue and segment expenses are determined on the basis of actual revenue and
expense of the segments respectively.
45. RELATED PARTIES RELATIONSHIP AND TRANSACTIONS
(1) Related party with controlling relationship:
Share proportionName Place of registration Principal business Registered capital in the Bank
Morgan Stanley Bank
International Limited United Kingdom Financial service GBP790,000,000.00 100%
There are no changes in registered capital and share proportion in the Bank occurred for the
shareholder of the Bank, Morgan Stanley Bank International Limited. The Bank’s ultimate
parent is Morgan Stanley.
(2) The following are other related parties which have transactions with the Bank with no
controlling relationship exists:
Name Place of registration Related party relationship
Morgan Stanley Asia Limited Hong Kong, China Subsidiary of the parent group
Morgan Stanley Properties (China) Co., Ltd Beijing, China Subsidiary of the parent group
Morgan Stanley Investment Consultancy
(Beijing) Company, Limited Beijing, China Subsidiary of the parent group
Morgan Stanley Information Technology Shanghai, China Subsidiary of the parent group
(Shanghai) Limited
Morgan Stanley Commodities Trading (China) Limited Shanghai, China Subsidiary of the parent group
Morgan Stanley Huaxin Fund Management Shenzhen, China Related party directly or indirectly
Company Limited controlled by parent group
The related parties of the Bank also includes key management personnel, their close family
members or entities which are subject to control, joint control or significant influence from
key management personnel’s close family members. Transactions between the Bank and the
related parties that are significant are disclosed separately and those that are not significant are
disclosed together.
175175

( )
Morgan Stanley Bank International (China) Limited
45. RELATED PARTIES RELATIONSHIP AND TRANSACTIONS - continued
(3) As of balance sheet date, the significant transactions between the Bank and the above related
parties for the year are as follows:
Interest income 2010 2009
Amount Proportion Amount Proportion
RMB (%) RMB (%)
Morgan Stanley Bank
International Limited 2,297,146.64 2.45 1,552,229.90 2.05 _____________ _____ _____________ _____ _____________ _____ _____________ _____
Interest expenses 2010 2009
Amount Proportion Amount Proportion
RMB (%) RMB (%)
Morgan Stanley Bank
International Limited 467,753.30 1.38 3,519,775.16 19.62
Morgan Stanley Properties
(China) Co., Ltd. 241,489.80 0.71 221,793.93 1.24 _____________ _____ _____________ _____
Total 709,243.10 2.09 3,741,569.09 20.86 _____________ _____ _____________ _____ _____________ _____ _____________ _____
Fee and commission income
2010 2009
Amount Proportion Amount Proportion
RMB (%) RMB (%)
Morgan Stanley Asia Limited 66,227,089.09 66.79 39,463,179.21 62.11
Morgan Stanley Commodities Trading
(China) Limited 1,590,000.00 1.60 - -
Morgan Stanley Huaxin Fund
Management Company Limited 25,000.00 0.03 100,000.00 0.16
Morgan Stanley Investment Consultancy
(Beijing) Company Limited 25,000.00 0.03 50,000.00 0.08
Morgan Stanley Information
Technology (Shanghai) Limited - - 50,000.00 0.08 _____________ _____ _____________ _____
Total 67,867,089.09 68.45 39,663,179.21 62.43 _____________ _____ _____________ _____ _____________ _____ _____________ _____
176176
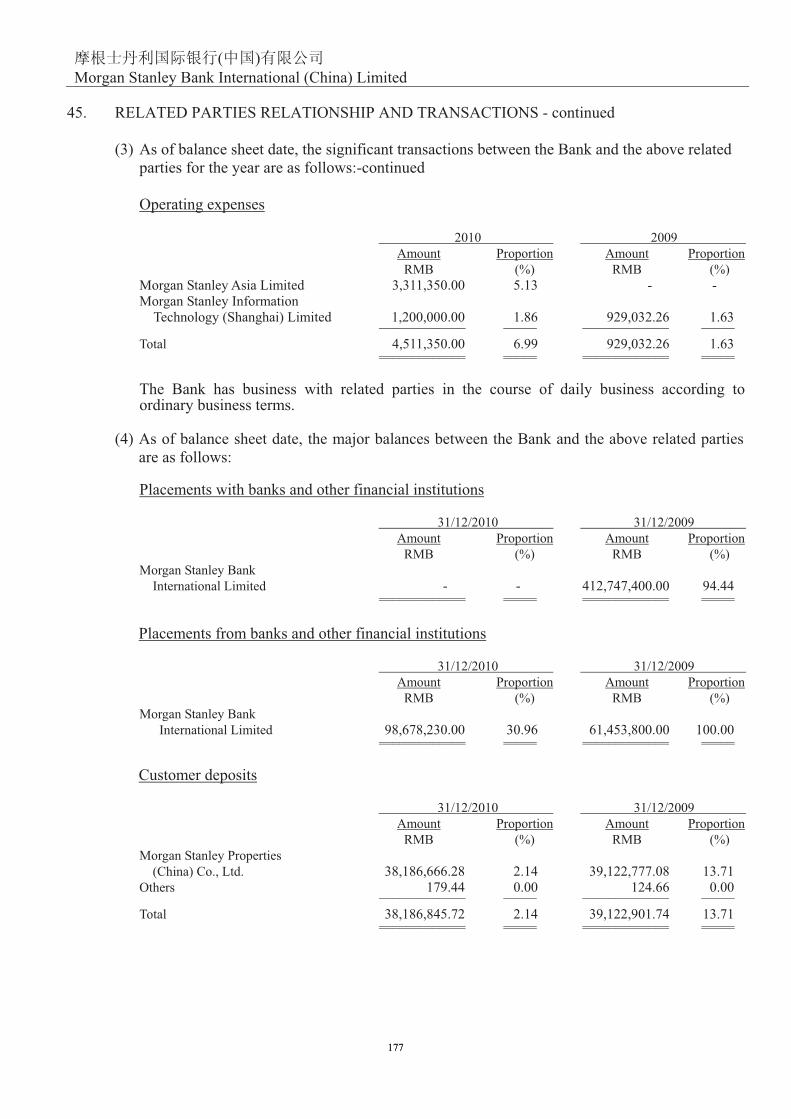
( )
Morgan Stanley Bank International (China) Limited
45. RELATED PARTIES RELATIONSHIP AND TRANSACTIONS - continued
(3) As of balance sheet date, the significant transactions between the Bank and the above related
parties for the year are as follows:-continued
Operating expenses
2010 2009
Amount Proportion Amount Proportion
RMB (%) RMB (%)
Morgan Stanley Asia Limited 3,311,350.00 5.13 - -
Morgan Stanley Information
Technology (Shanghai) Limited 1,200,000.00 1.86 929,032.26 1.63 _____________ _____ _____________ _____
Total 4,511,350.00 6.99 929,032.26 1.63 _____________ _____ _____________ _____ _____________ _____ _____________ _____
The Bank has business with related parties in the course of daily business according to ordinary business terms.
(4) As of balance sheet date, the major balances between the Bank and the above related parties
are as follows:
Placements with banks and other financial institutions
31/12/2010 31/12/2009
Amount Proportion Amount Proportion
RMB (%) RMB (%)
Morgan Stanley Bank
International Limited - - 412,747,400.00 94.44 _____________ _____ _____________ _____ _____________ _____ _____________ _____
Placements from banks and other financial institutions
31/12/2010 31/12/2009
Amount Proportion Amount Proportion
RMB (%) RMB (%)
Morgan Stanley Bank
International Limited 98,678,230.00 30.96 61,453,800.00 100.00 _____________ _____ _____________ _____ _____________ _____ _____________ _____
Customer deposits
31/12/2010 31/12/2009
Amount Proportion Amount Proportion
RMB (%) RMB (%)
Morgan Stanley Properties
(China) Co., Ltd. 38,186,666.28 2.14 39,122,777.08 13.71
Others 179.44 0.00 124.66 0.00 _____________ _____ _____________ _____
Total 38,186,845.72 2.14 39,122,901.74 13.71 _____________ _____ _____________ _____ _____________ _____ _____________ _____
177177

( )
Morgan Stanley Bank International (China) Limited
45. RELATED PARTIES RELATIONSHIP AND TRANSACTIONS - continued
(4) As of balance sheet date, the major balances between the Bank and the above related parties
are as follows: - continued
Interest receivable
31/12/2010 31/12/2009
Amount Proportion Amount Proportion
RMB (%) RMB (%)
Morgan Stanley Bank
International Limited - - 265,131.06 1.53 _____________ _____ _____________ _____ _____________ _____ _____________ _____
Interest payable
31/12/2010 31/12/2009
Amount Proportion Amount Proportion
RMB (%) RMB (%)
Morgan Stanley Bank
International Limited 52,409.07 0.73 215,719.91 25.44
Morgan Stanley Properties
(China) Co., Ltd. 1,909.32 0.03 1,793.15 0.21
Other 0.02 0.00 - - _____________ _____ _____________ _____
Total 54,318.41 0.76 217,513.06 25.65 _____________ _____ _____________ _____ _____________ _____ _____________ _____
Other assets
31/12/2010 31/12/2009
Amount Proportion Amount Proportion
RMB (%) RMB (%)
Morgan Stanley Asia Limited 26,242,976.84 7.84 5,467,163.58 18.85
Morgan Stanley Bank
International Limited 6,300.51 0.00 21,249.36 0.07 _____________ _____ _____________ _____
Total 26,249,277.35 7.84 5,488,412.94 18.92 _____________ _____ _____________ _____ _____________ _____ _____________ _____
Other liabilities
31/12/2010 31/12/2009
Amount Proportion Amount Proportion
RMB (%) RMB (%)
Morgan Stanley Asia Limited 3,442,064.44 26.08 268,040.51 7.59
Morgan Stanley Information
Technology (Shanghai) Limited 300,000.00 2.27 300,000.00 8.50 _____________ _____ _____________ _____
Total 3,742,064.44 28.35 568,040.51 16.09 _____________ _____ _____________ _____ _____________ _____ _____________ _____
178178

( )
Morgan Stanley Bank International (China) Limited
45. RELATED PARTIES RELATIONSHIP AND TRANSACTIONS - continued
(5) Compensation of key management personnel
2010 2009
Amount Proportion Amount Proportion
RMB (%) RMB (%)
Compensation of key
management personnel 4,650,391.10 15.84 6,866,451.30 23.39 _____________ _____ _____________ _____ _____________ _____ _____________ _____
Key management personnel are those who have the authority and responsibility for planning,
directing and controlling the activities of the Bank.
46. OFF-BALANCE SHEET ITEMS
31/12/2010 31/12/2009
RMB RMB
Letters of guarantee 4,550,200.00 4,733,200.00 ____________ ____________ ____________ ____________
47. FIDUCIARY ASSETS
31/12/2010 31/12/2009
RMB RMB
Entrusted Deposit 323,000,000.00 - ______________ _____________ ______________ _____________
Entrusted Loan 323,000,000.00 - ______________ _____________ ______________ _____________
48. CAPITAL ADEQUACY
The Bank calculated capital adequacy and core capital adequacy according to the “Rules Governing Commercial Bank’s Capital Adequacy Ratio” (CBRC Year 2004 No.2 regulation) are as follows
31/12/2010 31/12/2009
RMB’000 RMB’000
Risk weighted assets 876,284 353,940
Market risk capital 76,898 58,404
Capital net value 1,225,555 1,167,532
Include: Core capital 1,215,410 1,157,604
Subordinated capital 10,145 9,928
Core capital adequacy ratio 66.14% 106.79%
Capital adequacy ratio 66.70% 107.71%
179179

( )
Morgan Stanley Bank International (China) Limited
49. COMMITMENTS
Operating lease commitments
As of the balance sheet date, the Bank had the following commitments in respect of
non-cancellable operating leases:
31/12/2010 31/12/2009
RMB’000 RMB’000
The minimum lease payments under non-cancelable
operating leases:
Within one year 3,340 4,841
In the second year 69 3,583
In the third year - 133 _________ ________
Total 3,409 8,557 _________ ________ _________ ________
180180

( )
Morgan Stanley Bank International (China) Limited
50. RISK MANAGEMENT
(I) Overview of risk management
(1) Overview of risks
The Bank is exposed to various risks in its business operations, especially the use of financial
instruments, risks are becoming diversified and complicated. The key risks faced by the Bank
are credit risk, liquidity risk, market risk and operational risk. Market risks include foreign
exchange risk and interest rate risk.
The Bank's risk management objectives are to achieve proper balance between risks and yield,
minimize the adverse impacts of risks on the Bank's performance, and maximize the benefits
of the Bank. Based on these risk management objectives, the Bank's basic risk management
strategy is to identify and analyze the industry's exposure to various risks, establish appropriate
bottom line for risk tolerance, implement risk management, and monitor these exposures to
ensure appropriate measurements are implemented on a timely and effective manner.
The Board of Directors of the Bank is responsible for establishing the Bank's overall risk
management strategies, monitoring and evaluating the Bank's risk management and internal
control system by Risk Management Committee, Credit Management Committee,
Assets/Liabilities Committee, Compliance Committee, Senior Management Committee and
other committees.
(II) Credit risk
(1) Credit risk management
Credit risk arises when the borrower or counterparty fails to meet the required obligations in
the agreement on due date.
The Bank's credit risk mainly arises from credit business. Under the leadership of Risk
Management Committee, the Bank has implemented the lending and risks management
policies, carries out credit investigation and assessment before credit lending and grants credits
according to limit approved. The Bank has established policies related to daily loans and
post-lending management, credit classification, interest calculation and accrual, and loan
provision accrual and write-off (report on doubtful loans etc.). The Bank management team
monitors and supervises the above mentioned credit risks limit. The Bank controls credit risks
through credit investigation and evaluates counterparties financial and operational conditions.
The Bank assess the clients according to the internal's credit classification standards and
provides facility to clients, and the clients are permitted to borrow within the approved facility.
181181

( )
Morgan Stanley Bank International (China) Limited
50. RISK MANAGEMENT - continued
(II) Credit risk -continued
(2) Maximum credit risk exposure information
Without taking into account of any collateral held or any other credit enhancement, the
maximum credit risk exposure as of the balance sheet date is the carrying amount of financial
assets less impairment loss. The maximum credit risk exposure is disclosed below:
31/12/2010 31/12/2009
RMB RMB
On-balance sheet items
Loans and advances to customers 968,681,000.00 268,634,637.82
Available-for-sale financial assets - 100,000,000.00
Inter-banks receivable 795,134,824.53 437,025,462.65
Include: Due from banks 128,907,824.53 437,025,462.65
Placements with banks and other financial
institutions 666,227,000.00 -
Financial assets held for trading 2,529,763,390.00 1,497,641,342.53
Interest receivable 25,013,920.47 17,287,586.56
Other financial assets 324,959,578.75 18,167,406.22 _______________ ______________
Total on-balance sheet items 4,643,552,713.75 2,338,756,435.78 _______________ ______________
Total off-balance sheet items 4,550,200.00 4,733,200.00 _______________ ______________
Total 4,648,102,913.75 2,343,489,635.78 _______________ ______________ _______________ ______________
Other financial assets include security deposit, fees receivable etc.
Except for clean loans, certain credit enhancement measures such as guarantee, pledge are
taken by the Bank for other loans, off-balance sheet items etc, to mitigate credit risk exposure
to an acceptable level.
(3) Loans and advances to customers and inter-banks receivables
Overdue and impaired loans and advances to customers
(i) As of the year end of 2010, the Bank has nil overdue or impaired loans and advances to
customers. (2009: Nil)
182182

( )
Morgan Stanley Bank International (China) Limited
50. RISK MANAGEMENT - continued
(II) Credit risk - continued
(3) Loans and advances to customers and inter-banks receivables – continued
Over-due and impaired loans and advances to customers - continued
(ii) Neither overdue nor impaired
0102/21/13
lamroN Total
BMR BMR
Loans and advances to customers
00.000,186,869 00.000,186,869 snaoL - ______________ _____________ ______________ _____________
35.428,431,597 35.428,431,597 elbaviecer sknab-retnI ______________ _____________ ______________ _____________
9002/21/13
lamroN Total
BMR BMR
Loans and advances to customers
28.736,436,862 28.736,436,862 snaoL - ______________ _____________ ______________ _____________
56.264,520,734 56.264,520,734 elbaviecer sknab-retnI ______________ _____________ ______________ _____________
(4) Financial asset held for trading
0102/21/13 31/12/2009
BMR BMR
Neither overdue nor impaired
35.243,146,794,1 00.093,367,925,2 )i( gnidart rof dleh sdnoB ______________ ______________ ______________ ______________
(i) Bonds held for trading
0102/21/13 31/12/2009
BMR BMR
00.000,002,94 - 1A
- 00.030,995,112 3AA
35.243,144,844,1 00.063,461,813,2 )etoN( detar toN ______________ _______________
35.243,146,794,1 00.093,367,925,2 latoT ______________ _______________ ______________ _______________
The above ratings reference to Moody's bond rating.
Note: The "Not rated" investments in debt securities mainly include PBOC bills, financial
institution bonds and corporate bonds held by the Bank, all corporate bonds are rated as
AAA in China Bond rating.
183183

( )
Morgan Stanley Bank International (China) Limited
50. RISK MANAGEMENT - continued
(II) Credit risk - continued
(5) Available-for-sale purchased loans
31/12/2010 31/12/2009
RMB RMB
Normal - 100,000,000.00 _______________ ______________ _______________ ______________
(6) Analysis on credit risk concentration of financial assets
The Bank manages credit risk concentration of financial assets by industry, relevant analysis
can refer to note 12(2).
184184

( )
Morgan Stanley Bank International (China) Limited
50. RISK MANAGEMENT - continued
(III) Liquidity risk
Liquidity refers to the assets that have quick cash conversion ability without any value impaired.
Liquidity risk is the risk that no sufficient funds will be available for debt repayment when it falls
due.
(1) Liquidity risk management
According to the Law of the People's Republic of China on Commercial Bank and related
regulations, the Bank needs to maintain the liquidity ratio of no less than 25%. At the same
time, the Bank manages liquidity risk according to the maturity date of assets and liabilities.
To manage Bank's liquidity risk, the Bank implemented corresponding Liquidity and
Funding Risk Management Policy, which includes the following:
(i) Departments that manage treasury functions closely monitor the structure of RMB and
foreign currency position, term, limit, and cost of maintaining liquidity.
(ii) The Assets/Liabilities Committee holds meeting monthly to review liquidity risk,
market risk and credit risk, and discuss the optimization of assets and liabilities
structure.
(iii) The Assets/Liabilities Committee to review the assets and liabilities management
report (ALCO report) and business pipelines to ensure the appropriate liquidity and
funding structures are in place.
(2) Analysis on liquidity risk of non-derivative instruments
The following is the maturity analysis for assets and liabilities held by the Bank:
The following table presents the contractual maturity analysis of the Bank for non-derivative
financial assets and liabilities as at balance sheet date.
0102/21/13
Current Within
& overdue one month 1-3 months 3-12 months Over 1 year No maturity date Total
RMB’000 RMB’000 RMB’000 RMB’000 RMB’000 RMB’000 RMB’000
Financial assets
Cash and balances
with the Central Bank 33,960 - - - - 32,675 66,635
Due from banks 128,908 - - - - - 128,908
Placements with banks - 600,000 66,227 - - - 666,227
Financial assets held for trading - 2,328,371 201,392 - - 2,529,763
Interest receivable - 893 5,228 18,893 - - 25,014
Loans and advances
to customers - - 499,340 269,341 200,000 - 968,681
Other financial assets 198,336 125,593 - 6 - 1,025 324,960 ___________ __________ __________ __________ __________ _________ __________
Total financial assets 361,204 3,054,857 772,187 288,240 200,000 33,700 4,710,188 ___________ __________ __________ __________ __________ _________ __________
Financial liabilities
Due to banks and
other financial institutions 3 - - 173,173 - - 173,176
Placements from banks and
other financial institutions - - 220,000 98,678 - - 318,678
Repurchase agreements 192,000 820,000 200,000 - - - 1,212,000
Customer deposits 70,164 - 211,512 1,504,093 - - 1,785,769
Interest payable 93 1,808 1,800 3,504 - - 7,205
Other financial liabilities - 5,480 - - 2,041 301 7,822 ___________ __________ __________ __________ __________ _________ __________
Total financial liabilities 262,260 827,288 633,312 1,779,448 2,041 301 3,504,650 ___________ __________ __________ __________ __________ _________ __________
Net value 98,944 2,227,569 138,875 (1,491,208) 197,959 33,399 1,205,538 ___________ __________ __________ __________ __________ _________ __________ ___________ __________ __________ __________ __________ _________ __________
185185

( )
Morgan Stanley Bank International (China) Limited
50. RISK MANAGEMENT - continued
(III) Liquidity risk - continued
(2) Analysis on liquidity risk of non-derivative instruments - continued
31/12/2009
Current Within
& overdue one month 1-3 months 3-12 months Over 1 year No maturity date Total
RMB’000 RMB’000 RMB’000 RMB’000 RMB’000 RMB’000 RMB’000
Financial assets
Cash and balances
with the Central Bank 44,565 - - - - 34,733 79,298
Due from banks 24,278 - 412,747 - - - 437,025
Financial assets held for trading - 1,497,641 - - - - 1,497,641
Interest receivable 7 1,003 1,459 14,819 - - 17,288
Loans and advances
to customers 35 101 278 265,158 3,063 - 268,635
Available for sale financial asset - - - 100,000 - - 100,000
Other financial assets - 17,111 - 21 - 1,035 18,167 __________ _________ __________ __________ __________ __________ ___________
Total financial assets 68,885 1,515,856 414,484 379,998 3,063 35,768 2,418,054 __________ _________ __________ __________ __________ __________ ___________
Financial liabilities
Due to banks and
other financial institutions 3 - - - - - 3
Placements from banks and
other financial institutions - - - 61,454 - - 61,454
Repurchase agreements 100,000 810,000 - - - - 910,000
Customer deposits 109,811 - 1,855 173,727 - - 285,393
Interest payable 33 83 10 722 - - 848
Other financial liabilities - 2,244 445 - - 342 3,031 __________ _________ __________ __________ __________ __________ ___________
Total financial liabilities 209,847 812,327 2,310 235,903 - 342 1,260,729 __________ _________ __________ __________ __________ __________ ___________
Net value (140,962) 703,529 412,174 144,095 3,063 35,426 1,157,325 __________ _________ __________ __________ __________ __________ ___________ __________ _________ __________ __________ __________ __________ ___________
(IV) Market risks
Market risks refer to the risks of losses in the Bank’s on-balance sheet and off-balance sheet
business due to adverse changes in market prices. The Bank’s market risks mainly include foreign
exchange risk and interest rate risk. The Bank manages its market risk through limit management
(including trading limit, risk limit and stoploss limit), daily review of risk sensitivities bond market
value, and market risk capital management. Market risk manager is responsible for monitoring of
market risks and periodically reports to Assets/Liabilities Committee. The Bank has established
and enhanced market risk limit management system, specified and standardized the process and
reporting of market risk management. The internal audit department performs audit on market
risks management on a regular basis. The Bank has started stress testing to monitor the possible
market risk under specific adverse incident in order to improve market risk management.
(1) Foreign exchange risk
The Bank is set up and operates in China, the Bank’s foreign currency business is mainly in
USD and HKD. The Bank's loans to customers are mainly in RMB and USD.
The Bank monitors the foreign exchange risk mainly through the management of exposure
limits.
186186

( )
Morgan Stanley Bank International (China) Limited
50. RISK MANAGEMENT - continued
(IV) Market risks – continued
(1) Foreign exchange risk - continued
The following table presents the structure analysis of the Bank’s financial assets and
financial liabilities by currencies as at balance sheet date:
0102/21/13
seicnerruc rehtO DKH DSU
BMR in RMB eqv. in RMB eqv. in RMB eqv. Total
000’vqe BMR 000’vqe BMR 000’vqe BMR 000’vqe BMR 000’BMR
Financial assets
Cash and balances with
the Central Bank 61,182 5,232 221 - 66,635
809,821 74 185,02 629,201 453,5 sknab morf euD
Placements with banks 600,000 66,227 - - 666,227
Financial assets held for trading 2,529,763 - - - 2,529,763
Interest receivable 22,075 2,939 - - 25,014
Loans and advances to customers 770,000 198,681 - - 968,681
Other financial assets 100,024 224,930 6 - 324,960 ___________ _______ ________ _________ __________
Total financial assets 4,088,398 600,935 20,808 47 4,710,188 ___________ _______ ________ _________ __________
Financial liabilities
Due to banks and other
financial institutions 173,176 - - - 173,176
Placements from banks and
other financial institutions 220,000 98,678 - - 318,678
Repurchase agreements 1,212,000 - - - 1,212,000
Customer deposits 1,678,683 104,559 2,527 - 1,785,769
502,7 - - 051 550,7 elbayap tseretnI
Other financial liabilities 2,470 3,527 1,825 - 7,822 ___________ _______ ________ _________ __________
Total financial liabilities 3,293,384 206,914 4,352 - 3,504,650 ___________ _______ ________ _________ __________
,493 410,597 noitisop nepo teN 021 16,456 47 1,205,538 ___________ _______ ________ _________ __________ ___________ _______ ________ _________ __________
9002/21/13
seicnerruc rehtO DKH DSU
BMR in RMB eqv. in RMB eqv. in RMB eqv. Total
000’vqe BMR 000’vqe BMR 000’vqe BMR 000’vqe BMR 000’BMR
Financial assets
Cash and balances with
the Central Bank 76,619 1,967 708 4 79,298
520,734 281 083,383 714,14 640,21 sknab morf euD
Financial assets held for trading 1,497,641 - - - 1,497,641
Interest receivable 16,473 546 268 1 17,288
Loans and advances to customers 100,000 163,877 4,758 - 268,635
Available-for-sale
financial assets 100,000 - - - 100,000
Other financial assets 1,045 5,488 11,634 - 18,167 ___________ _______ ________ _________ __________
Total financial assets 1,803,824 213,295 400,748 187 2,418,054 ___________ _______ ________ _________ __________
Financial liabilities
Due to banks and other
financial institutions 3 - - - 3
Placements from banks and
other financial institutions - 61,454 - - 61,454
Repurchase agreements 910,000 - - - 910,000
Customer deposits 239,387 39,413 6,566 27 285,393
848 1 91 812 016 elbayap tseretnI
Other financial liabilities 3,006 24 - 1 3,031 ___________ _______ ________ _________ __________
Total financial liabilities 1,153,006 101,109 6,585 29 1,260,729 ___________ _______ ________ _________ __________
,211 818,056 noitisop nepo teN 186 394,163 158 1,157,325 ___________ _______ ________ _________ __________ ___________ _______ ________ _________ __________
187187

( )
Morgan Stanley Bank International (China) Limited
50. RISK MANAGEMENT - continued
(IV) Market risks – continued
(1) Foreign exchange risk - continued
The following table illustrates the impact of 5% appreciation or 5% depreciation of the spot
exchange rate and forward exchange rate of RMB against all foreign currencies on net profit
and owner's equity of the Bank.
2010 2009
Net profit Owner’s equity Net profit Owner’s equity
RMB’000 RMB’000 RMB’000 RMB’000
Appreciate by 5% (11,825) (11,825) (20,260) (20,260)
Depreciate by 5% 11,825 11,825 20,260 20,260
(2) Interest rate risks
Interest rate risk is the impact of change in market interest rate on fair value of financial
assets and liabilities of the balance sheet and interest income and expenses of the income
statement for the period. The Bank's foreign exchange business lending rates and large
amount deposit rates primarily fluctuates with the Bank’s funding cost while the RMB
business lending and deposit rates fluctuates within the permitted range provided by the
PBOC. The inter-bank placements and takings interest rates are determined by the market.
As of the balance sheet date, the interest-bearing assets and liabilities of the Bank are as
follows:
31/12/2010
Non-
Within 1 month 1-3 months 3-12 months 1-5 years Over 5 years interest bearing Total
RMB’000 RMB’000 RMB’000 RMB’000 RMB’000 RMB’000 RMB’000
Financial assets Cash and balances with the
Central Bank 61,182 - - - - 5,453 66,635
Due from banks 128,908 - - - - - 128,908
Placements with banks 600,000 66,227 - - - - 666,227
Financial assets held for trading - 793,584 300,779 512,143 923,257 - 2,529,763
Interest receivable - - - - - 25,014 25,014
Loans and advances to customers - 599,341 369,340 - - - 968,681
Available-for-sale financial assets - - - - - - -
Other financial assets - - - - - 324,960 324,960 _________ __________ _________ _________ _________ _________ _________
Total financial assets 790,090 1,459,152 670,119 512,143 923,257 355,427 4,710,188 _________ __________ _________ _________ _________ _________ _________
Financial liabilities Due to banks and
other financial institutions 3 - 173,173 - - - 173,176
Placements from banks and
other financial institutions 98,678 220,000 - - - - 318,678
Repurchase agreements 1,012,000 200,000 - - - - 1,212,000
Customer deposits 70,164 211,512 1,504,093 - - - 1,785,769
Interest payable - - - - - 7,205 7,205
Other financial liabilities - - - - - 7,822 7,822 _________ __________ _________ _________ _________ _________ _________
Total financial liabilities 1,180,845 631,512 1,677,266 - - 15,027 3,504,650 _________ __________ _________ _________ _________ _________ _________
Net open position (390,755) 827,640 (1,007,147) 512,143 923,257 340,400 1,205,538 _________ __________ _________ _________ _________ _________ _________ _________ __________ _________ _________ _________ _________ _________
188188

( )
Morgan Stanley Bank International (China) Limited
50. RISK MANAGEMENT - continued
(IV) Market risks - continued
(2) Interest rate risk - continued
31/12/2009
Non-
Within 1 month 1-3 months 3-12 months 1-5 years Over 5 years interest bearing Total
RMB’000 RMB’000 RMB’000 RMB’000 RMB’000 RMB’000 RMB’000
Financial assets
Cash and balances with the
Central Bank 76,583 - - - - 2,715 79,298
Due from banks 24,278 412,747 - - - - 437,025
Financial assets held for trading - - 43,202 209,537 1,244,902 - 1,497,641
Interest receivable - - - - - 17,288 17,288
Loans and advances to customers 4,758 - 263,877 - - - 268,635
Available-for-sale financial assets - - 100,000 - - - 100,000
Other financial assets - - - - - 18,167 18,167 _________ __________ _________ _________ _________ _________ _________
Total financial assets 105,619 412,747 407,079 209,537 1,244,902 38,170 2,418,054 _________ __________ _________ _________ _________ _________ _________
Financial liabilities
Due to banks and
other financial institutions 3 - - - - - 3
Placements from banks and
other financial institutions - - 61,454 - - - 61,454
Repurchase agreements 910,000 - - - - - 910,000
Customer deposits 109,811 1,855 173,727 - - - 285,393
Interest payable - - - - - 848 848
Other financial liabilities - - - - - 3,031 3,031 _________ __________ _________ _________ _________ _________ _________
Total financial liabilities 1,019,814 1,855 235,181 - - 3,879 1,260,729 _________ __________ _________ _________ _________ _________ _________
Net open position (914,195) 410,892 171,898 209,537 1,244,902 34,291 1,157,325 _________ __________ _________ _________ _________ _________ _________ _________ __________ _________ _________ _________ _________ _________
Interest rate sensitivity analysis
The following sensitivity analysis is based on the interest rates gap between the interest
bearing assets such as cash and balances with the Central Bank; due from banks and other
financial institutions; loans and other receivables and interest bearing liabilities such as
customer deposits as of the balance sheet date. The upward and downward change of 50
basis points is used by management in evaluating the possible changes in interest rates and
the corresponding interest rate risks.
The following table illustrates the impact of the increase or decrease of the interest rate of all
currencies by 50 basis points on the net profit and owner's equity of the Bank in next year,
based on the structure of interest-bearing assets and interest-bearing liabilities as of the
balance sheet date.
2010 2009
Net Profit Owner's equity Net Profit Owner's equity
RMB’000 RMB’000 RMB’000 RMB’000
Increase by 50 basis points 18 18 (1,877) (1,877)
Decrease by 50 basis points (18) (18) 1,877 1,877
189189

( )
Morgan Stanley Bank International (China) Limited
51. FAIR VALUE OF FINANCIAL INSTRUMENTS
The valuation of the fair value is determined based on market related information and financial
instruments related information at a specific time. When determining the fair value of financial
instruments, the Bank considers the market price as the best approximation of the fair value of the
financial instruments for which there is an active market. For financial instruments of which the
market does not exist, the Bank adopts other valuation techniques to determine the fair value of
these financial assets and financial liabilities (details please refer to note 4).
The fair values of financial assets and financial liabilities are determined as follows
! The fair values of financial assets and financial liabilities with standard terms and
conditions and traded on active liquid markets are determined with reference to quoted
market prices
! The fair values of other financial assets and financial liabilities (excluding derivative
instruments) are determined in accordance with generally accepted pricing models based
on discounted cash flow analysis or observable market prices
! The fair value of derivative instruments are calculated using quoted prices. Where such
prices are not available, a discount cash flow analysis is performed using the applicable
yield curve for the duration of the instruments for non-optional derivatives, and option
pricing models for optional derivatives.
The following table illustrates the fair values of the Bank’s financial assets and financial
liabilities:
31/12/2010 31/12/2009
eulav kooB Fair value Book value Fair value
BMR BMR BMR BMR
Financial assets
Cash and balances with the
Central Bank 66,635,189.42 66,635,189.42 79,298,187.46 79,298,187.46
Due from banks 128,907,824.53 128,907,824.53 437,025,462.65 437,025,462.65
Placements with banks and
other financial institutions 666,227,000.00 666,227,000.00 - -
Financial assets
held for trading 2,529,763,390.00 2,529,763,390.00 1,497,641,342.53 1,497,641,342.53
Interest receivable 25,013,920.47 25,013,920.47 17,287,586.56 17,287,586.56
Loans and advances to
customers 968,681,000.00 968,681,000.00 268,634,637.82 268,634,637.82
Available for sale
Financial assets - - 100,000,000.00 100,000,000.00
Other financial assets 324,959,578.75 324,959,578.75 18,167,406.22 18,167,406.22 ________________ ________________ ________________ ________________
Total financial assets 4,710,187,903.17 4,710,187,903.17 2,418,054,623.24 2,418,054,623.24 ________________ ________________ ________________ ________________ ________________ ________________ ________________ ________________
Financial liabilities
Due to banks and other
financial institutions 173,175,536.74 173,175,536.74 2,652.38 2,652.38
Placements from banks and
other financial institutions 318,678,230.00 318,678,230.00 61,453,800.00 61,453,800.00
Repurchase agreements 1,212,000,000.00 1,212,000,000.00 910,000,000.00 910,000,000.00
Customer deposits 1,785,769,494.51 1,785,769,494.51 285,392,754.12 285,392,754.12
Interest payable 7,204,459.50 7,204,459.50 848,030.20 848,030.20
Other financial liabilities 7,821,871.45 7,821,871.45 3,030,669.50 3,030,669.50 ________________ ________________ ________________ ________________
Total financial liabilities 3,504,649,592.20 3,504,649,592.20 1,260,727,906.20 1,260,727,906.20 ________________ ________________ ________________ ________________ ________________ ________________ ________________ ________________
190190

( )
Morgan Stanley Bank International (China) Limited
51. FAIR VALUE OF FINANCIAL INSTRUMENTS - continued
Level of fair value hierarchy
The following table provides an analysis of financial assets and financial liabilities that are
measured subsequent to initial recognition at fair value, grouped into Level 1 to 3 based on the
degree to which the fair value is observable:
Level 1: fair value measurements are those derived from quoted prices (unadjusted) in active
markets for identical assets and liabilities;
Level 2: fair value measurements are those derived from inputs other than quoted prices included
within Level 1 that are observable for the asset or liability, either directly (i.e. as prices) or
indirectly (i.e. derived from prices);
Level 3: fair value measurements are those derived from valuation techniques that include inputs
for the asset or liability that are not based on observable market data (unobservable inputs).
31/12/2010
1 leveL Level 2 Level 3 Total
tnelaviuqE BMR tnelaviuqE BMR RMB Equivalent RMB Equivalent
Held-for-trading financial assets - 2,529,763,390.00 - 2,525,720,890.00 ________________ ________________ ________________ ________________
Financial assets total - 2,529,763,390.00 - 2,529,763,390.00 ________________ ________________ ________________ ________________ ________________ ________________ ________________ ________________
31/12/2009
1 leveL Level 2 Level 3 Total
tnelaviuqE BMR tnelaviuqE BMR RMB Equivalent RMB Equivalent
Held-for-trading financial assets - 1,497,641,342.53 - 1,497,641,342.53
Available-for-sale assets - 100,000,000.00 - 100,000,000.00 ________________ ________________ ________________ ________________
Financial assets total - 1,597,641,342.53 - 1,597,641,342.53 ________________ ________________ ________________ ________________ ________________ ________________ ________________ ________________
There were no transfers between Level 1 and 2 in the years of 2010 and 2009.
The total change in fair value derived from the FVTPL held by the Bank is RMB 22,861,225.75 (2009: RMB 93,982,708.40), with RMB 0.00 booked in other comprehensive income.
The Bank employs control processes to validate the fair value of its financial instruments, including those derived from pricing models. These control processes are designed to assure that the values used for financial reporting are based on observable inputs wherever possible. In the event that observable inputs are not available, the control processes are designed to assure that the valuation approach utilised is appropriate and consistently applied and that the assumptions are reasonable. These control processes include reviews of the pricing model’s theoretical soundness and appropriateness by Morgan Stanley Group personnel with relevant expertise who are independent from the trading desks.
Additionally, groups independent from the trading divisions within the financial control, market risk and credit risk management departments participate in the review and validation of the fair values generated from pricing models, as appropriate. Where a pricing model is used to determine fair value, recently executed comparable transactions and other observable market data are considered for purposes of validating assumptions underlying the model.
191191

( )
Morgan Stanley Bank International (China) Limited
51. FAIR VALUE OF FINANCIAL INSTRUMENTS - continued
In the current year, the Bank’s financial assets measured at fair value comprise the government bonds, PBOC bills, financial institution bonds and corporate bonds. These financial assets are valued using quoted prices in active markets when available. To the extent quoted prices are not available, fair value is determined based on a valuation model that has as inputs interest rate yield curves, cross-currency basis index spreads, and country credit spreads for structures similar to the bond in terms of issuer, maturity and seniority. These financial assets are generally categorised in Levels 1 or 2 of the fair value hierarchy.
52. COMPARATIVE FIGURES
Certain comparative figures have been reclassified to conform to the current year's presentation.
53. APPROVAL OF FINANCIAL STATEMENTS
The financial statements of the Bank have been approved on 21 April 2011 by the Board of
Directors.
* * END OF FINANCIAL STATEMENTS * *
192192

( )
Morgan Stanley Bank International (China) Limited
ATTACHED APPENDIX IS NOT PART OF THE FINANCIAL STATEMENTS
193193

( )
Morgan Stanley Bank International (China) Limited
MORGAN STANLEY BANK INTERNATIONAL (CHINA) LIMITED
APPENDIX
CONTENTS
Appendix (I) Taxable Income Reconciliation
Appendix (II) Balance Sheet and Income Statement of Branches
Part (I) Balance Sheet and Income Statement of Head Office
Part (II) Balance Sheet and Income Statement of Beijing Branch
194194

( )
Morgan Stanley Bank International (China) Limited
Appendix (I)
MORGAN STANLEY BANK INTERNATIONAL (CHINA) LIMITED
Taxable Income Reconciliation
For the year ended at 31 December 2010
Total
RMB
Total profit before tax 74,153,328.24
Add:
1. Overseas employee offshore pension 586,936.30
2. Commercial insurance expenses 695,010.02
3. Penalty occurred for this year 142.92
4. Amortisation expenses on intangible assets
in excess of tax deductible amount 902,389.93
5. Entertainment expenses in excess of tax deductible amount 108,549.40
6. Loss from changes in fair values 22,861,225.75
7. Long term service fee and employee benefit 1,230,340.16
8. Nondeductible accrual expenses 3,311,350.00 _____________
29,695,944.48 _____________
Less:
1. Reversal of loan loss provision 12,662,733.62
2. Non taxable Government bonds interest income 2,720,597.33
3. Change in fair value arised from the investment property 1,069,928.00 _____________
16,453,258.95 _____________
Taxable income for the year 87,396,013.77 _____________ _____________
Remarks: The Bank prepares this “Taxable Income Reconciliation” according to the request from
Tax Bureau. This report is for reference only and does not form part of the audited
financial statements.
195195

( )
Morgan Stanley Bank International (China) Limited
Appendix (II)
Part (I)
MORGAN STANLEY BANK INTERNATIONAL (CHINA) LIMITED, THE HEAD OFFICE BALANCE SHEET
AT 31 DECEMBER 2010
31/12/2010 31/12/2009
RMB RMB
ASSETS
Cash and balances with the Central Bank 264,784,205.12 79,288,171.28
Due from banks 223,573,363.29 431,472,800.47
Due from inter-branch 167,946,552.79 235,603.69
Placements with banks and other financial institutions 600,000,000.00 -
Financial assets held for trading 2,529,763,390.00 1,497,641,342.53
Interest receivable 21,135,748.78 17,287,586.56
Loans and advances to customers 499,340,500.00 268,634,637.82
Available-for-sale financial instruments - 100,000,000.00
Investment property 19,488,787.00 18,418,859.00
Fixed assets 2,820,365.61 4,725,918.08
Intangible assets 5,196,693.32 6,851,050.23
Deferred tax assets 4,155,439.36 242,700.63
Other assets 33,514,959.83 22,289,661.09
Operating fund to Branch 100,000,000.00 100,000,000.00 ______________ ______________
TOTAL ASSETS 4,471,720,005.10 2,547,088,331.38 ______________ ______________ ______________ ______________
(Continued)
196196

( )
Morgan Stanley Bank International (China) Limited
Appendix (II)
Part (I)
MORGAN STANLEY BANK INTERNATIONAL (CHINA) LIMITED, THE HEAD OFFICE BALANCE SHEET - continued
AT 31 DECEMBER 2010
31/12/2010 31/12/2009
RMB RMB
LIABILITIES
Due to banks and other financial institutions 2,561.74 2,652.38
Due to inter-branch 1,383,397,731.13 75,451,812.97
Placements from banks and other financial institutions 318,678,230.00 61,453,800.00
Repurchase agreements 1,212,000,000.00 910,000,000.00
Customer deposits 268,970,919.90 285,292,927.67
Employee benefit payable 1,288,372.24 4,750,189.29
Current tax 8,550,404.00 23,979,113.92
Interest payable 5,529,120.84 848,019.22
Deferred tax liabilities - -
Other liabilities 12,332,691.56 1,513,542.21 ______________ ______________
TOTAL LIABILITIES 3,210,750,031.41 1,363,292,057.66 ______________ ______________
OWNER'S EQUITY
Paid-in capital 1,000,000,000.00 1,000,000,000.00
Surplus reserves 39,503,162.77 33,679,202.65
General reserves 21,077,745.89 8,403,791.24
Retained earnings 200,389,065.03 141,713,279.83 ______________ ______________
TOTAL OWNER'S EQUITY 1,260,969,973.69 1,183,796,273.72 ______________ ______________
TOTAL LIABILITIES AND OWNER'S EQUITY 4,471,720,005.10 2,547,088,331.38 ______________ ______________ ______________ ______________
197197

( )
Morgan Stanley Bank International (China) Limited
Appendix (II)
Part (I)
MORGAN STANLEY BANK INTERNATIONAL (CHINA) LIMITED, THE HEAD OFFICE INCOME STATEMENT
FOR THE YEAR ENDED 31 DECEMBER 2010
0102 2009
BMR BMR
52.097,441,56 43.635,485,531 emocni gnitarepO ______________ ______________
18.290,531,75 93.698,465,15 emocni tseretni teN ______________ ______________
50.916,682,57 27.428,449,28 emocni tseretnI
- 49.793,213,2 hcnarb retni -emocni tseretnI
68.175,839,71 69.505,921,23 sesnepxe tseretnI
Interest expenses- inter branch 1,562,820.31 212,954.38
Net fee and commission income 86,684,570.06 62,869,685.73 ______________ ______________
29.868,335,36 27.894,023,49 emocni noissimmoc dna eeF
Fee and commission expenses 7,635,928.66 664,183.19
39.351,451,33 22.341,536,9 emocni tnemtsevnI
Losses from changes in fair value (21,791,297.75) (93,472,260.40)
)53.579,756( 09.252,482,8 )sessol(/sniag egnahcxE
35.390,611,6 25.179,602,1 emocni gnitarepo rehtO ______________ ______________
18.094,945,25 82.916,906,54 sesnepxe gnitarepO ______________ ______________
25.730,276,8 57.928,461,01 segrahcrus dna xat ssenisuB
77.784,952,44 35.987,444,53 sesnepxe gnitarepO
)84.430,283( - stessa no lasrever tnemriapmI ______________ ______________
44.992,595,21 60.719,479,98 tiforp gnitarepO ______________ ______________
89.942,99 38.821,2 emocni gnitarepo-noN :ddA
27.643,8 73.942,753 sesnepxe gnitarepo-noN :sseL ______________ ______________
07.202,686,21 25.697,916,98 XAT EROFEB TIFORP ______________ ______________
)46.434,029,2( 55.690,644,21 sesnepxe xat emocnI :sseL ______________ ______________
43.736,606,51 79.996,371,77 TIFORP TEN ______________ ______________ ______________ ______________
OTHER COMPREHENSIVE INCOME - - ______________ ______________
TOTAL COMPREHENSIVE INCOME 77,173,699.97 15,606,637.34 ______________ ______________ ______________ ______________
198198

( )
Morgan Stanley Bank International (China) Limited
Appendix (II)
Part (II)
MORGAN STANLEY BANK INTERNATIONAL (CHINA) LIMITED, BEIJING BRANCH BALANCE SHEET
AT 31 DECEMBER 2010
31/12/2010 31/12/2009
RMB RMB
ASSETS
Cash and balances with the Central Bank 66,484.30 10,016.18
Due from banks 4,674,961.24 5,552,662.18
Due from the Head Office 1,383,397,731.13 75,451,812.97
Placements with banks 66,227,000.00 -
Interest Receivables 3,878,171.69 -
Loans and advances to customers 469,340,500.00 -
Fixed assets 5,137,958.02 4,698,944.38
Other assets 3,732,543.17 6,716,838.40 ______________
TOTAL ASSETS 1,936,455,349.55 92,430,274.11 ______________ ______________
LIABILITIES
Due to banks and other financial institutions 173,172,975.00 -
Due to the Head Office 167,946,552.79 235,603.69
Customer deposits 1,516,798,574.61 99,826.45
Employee benefit payable 3,463,729.87 2,086,688.46
Current tax 3,475,976.39 10.03
Interest payable 1,675,338.66 10.98
Other liabilities 865,833.47 2,017,666.94 ______________
TOTAL LIABILITIES 1,867,398,980.79 4,439,806.55 ______________
OWNER'S EQUITY
Operating fund 100,000,000.00 100,000,000.00
Retained earnings (30,943,631.24) (12,009,532.44) ______________
TOTAL OWNER'S EQUITY 69,056,368.76 87,990,467.56 ______________
TOTAL LIABILITIES AND OWNER'S EQUITY 1,936,455,349.55 92,430,274.11 ______________ ______________
199199

( )
Morgan Stanley Bank International (China) Limited
Appendix (II)
Part (II)
MORGAN STANLEY BANK INTERNATIONAL (CHINA) LIMITED, BEIJING BRANCH INCOME STATEMENT
FOR THE YEAR ENDED 31 DECEMBER 2010
2010 2009
RMB RMB
Operating income 13,176,524.70 787,480.65 ______________ ______________
Net interest income 8,324,225.70 796,758.60 ______________ ______________
Interest income 10,862,969.88 583,842.15
Interest income inter-branch 1,562,820.31 212,954.38
Interest expenses 1,789,166.55 37.93
Interest expenses inter-branch 2,312,397.94 -
Net fee and commission income/(expenses) 4,829,993.30 (9,445.50) ______________ ______________
Fee and commission income 4,831,371.80 200.50
Fee and commission expenses 1,378.50 9,646.00
Exchange gains 22,305.70 167.55 ______________ ______________
Operating expenses 29,796,707.07 12,797,013.09 ______________ ______________
Business tax and surcharges 733,147.40 10.03
Operating expenses 29,063,559.67 12,797,003.06 ______________ ______________
Operating loss (16,620,182.37) (12,009,532.44) ______________ ______________
Add Non-operating income 1,153,714.09 - ______________ ______________
LOSS BEFORE TAX (15,466,468.28) (12,009,532.44) ______________ ______________
Less: Income tax expenses 3,467,630.52 - ______________ ______________
NET LOSS (18,934,098.80) (12,009,532.44) ______________ ______________
OTHER COMPREHENSIVE INCOME - - ______________ ______________
TOTAL COMPREHENSIVE LOSS (18,934,098.80) (12,009,532.44) ______________ ______________ ______________ ______________
200200
Copyright © 2022 FDOKUMEN