State-by-State Investigation of Destructive Interference in Resonance Raman Spectra of Neutral...
12
State-by-State Investigation of Destructive Interference in Resonance Raman Spectra of Neutral Tyrosine and the Tyrosinate Anion with the Simplified Sum-over-States Approach Jerry B. Cabalo,* ,† Semion K. Saikin, ‡ Erik D. Emmons, § Dmitrij Rappoport, ‡ and Ala ́ n Aspuru-Guzik ‡ † U.S. Army ECBC, RDCB-DRI-I/BLDG E5951, 5183 Blackhawk Road, Aberdeen Proving Ground, Aberdeen, Maryland 21010, United States ‡ Department of Chemistry and Chemical Biology, Harvard University, 12 Oxford Street, Cambridge, Massachusetts 02138, United States § Leidos, Inc., P.O. Box 68, Gunpowder Branch, Aberdeen Proving Ground, Aberdeen, Maryland 21010-5424, United States ABSTRACT: UV resonance Raman scattering is uniquely sensitive to the molecular electronic structure as well as intermolecular interactions. To better understand the relationship between electronic structure and resonance Raman cross section, we carried out combined experimental and theoretical studies of neutral tyrosine and the tyrosinate anion. We studied the Raman cross sections of four vibrational modes as a function of excitation wavelength, and we analyzed them in terms of the contributions of the individual electronic states as well as of the Albrecht A and B terms. Our model, which is based on time-dependent density functional theory (TDDFT), reproduced the experimental resonance Raman spectra and Raman excitation profiles for both studied molecules with good agreement. We found that for the studied modes, the contributions of Albrecht’s B terms in the Raman cross sections were important across the frequency range spanning the L a,b and B a,b electronic excitations in tyrosine and the tyrosinate anion. Furthermore, we demonstrated that interference with high-energy states had a significant impact and could not be neglected even when in resonance with a lower-energy state. The symmetry of the vibrational modes served as an indicator of the dominance of the A or B mechanisms. Excitation profiles calculated with a damping constant estimated from line widths of the electronic absorption bands had the best consistency with experimental results. ■ INTRODUCTION UV resonance Raman scattering (RRS) spectroscopy is a powerful analytical technique permitting sensitive detection of hazardous materials as well as of structural change within biological systems. For example, RRS from aromatic amino acids such as tryptophan and tyrosine serves as an indicator of the local environment within a protein, 1 such as ligand binding. 2,3 UV-RRS was used to measure hydrophilic interactions, in particular, the H-bond strength between water solvent molecules and the polar groups on the aromatic side chain. 4−7 RRS has also been used to investigate the interactions between metal atoms in metalloenzymes 8−10 and nearby amino acid residues serving as coordinating ligands. 10−12 Moreover, RRS has been used for examining tertiary protein structure such as the α and ψ angles of the peptide linkages in proteins, 13 as well as the hydrophobicity around aromatic amino acid residues. 14 Clearly, the RRS signal is sensitive to intermolecular interactions or any process that affects the electronic structure. Because of the wide applicability of RRS for the study of interactions in biological environments, a fundamental under- standing of how the signal responses of vibrational modes within a molecule are impacted by the electronic structure is important. The impact can be reflected in both frequency shifts as well as subtle changes in Raman intensities. 13,15−17 The impact of molecular electronic structure on the resonance Raman signature can be seen through the antiresonance phenomenon, where the Raman intensity is much less than to be expected based on the optical absorption. Antiresonances are thought to occur 18−22 when preresonance of a strongly allowed electronic transition destructively interferes with the resonance with a weakly allowed electronic transition. Destructive interference in tryptophan results in a “window” at around 205 nm with reduced Raman return that enables studies of RRS of amide bonds with minimal interference. 20 Theoretical modeling is essential to the understanding of antiresonance phenomena in RRS spectra. While it is not experimentally possible to probe in detail the connection between the RRS and the electronic structure, in other words, detect electronic transitions deep in the vacuum UV or probe weakly allowed and unresolved transitions, it is possible to model the electronic structure in detail. The Received: July 11, 2014 Revised: September 17, 2014 Published: September 18, 2014 Article pubs.acs.org/JPCA © 2014 American Chemical Society 9675 dx.doi.org/10.1021/jp506948h | J. Phys. Chem. A 2014, 118, 9675−9686
Transcript of State-by-State Investigation of Destructive Interference in Resonance Raman Spectra of Neutral...

State-by-State Investigation of Destructive Interference in ResonanceRaman Spectra of Neutral Tyrosine and the Tyrosinate Anion withthe Simplified Sum-over-States ApproachJerry B. Cabalo,*,† Semion K. Saikin,‡ Erik D. Emmons,§ Dmitrij Rappoport,‡ and Alan Aspuru-Guzik‡
†U.S. Army ECBC, RDCB-DRI-I/BLDG E5951, 5183 Blackhawk Road, Aberdeen Proving Ground, Aberdeen, Maryland 21010,United States‡Department of Chemistry and Chemical Biology, Harvard University, 12 Oxford Street, Cambridge, Massachusetts 02138, UnitedStates§Leidos, Inc., P.O. Box 68, Gunpowder Branch, Aberdeen Proving Ground, Aberdeen, Maryland 21010-5424, United States
ABSTRACT: UV resonance Raman scattering is uniquely sensitive to the molecularelectronic structure as well as intermolecular interactions. To better understand therelationship between electronic structure and resonance Raman cross section, we carriedout combined experimental and theoretical studies of neutral tyrosine and the tyrosinateanion. We studied the Raman cross sections of four vibrational modes as a function ofexcitation wavelength, and we analyzed them in terms of the contributions of theindividual electronic states as well as of the Albrecht A and B terms. Our model, which isbased on time-dependent density functional theory (TDDFT), reproduced theexperimental resonance Raman spectra and Raman excitation profiles for both studiedmolecules with good agreement. We found that for the studied modes, the contributionsof Albrecht’s B terms in the Raman cross sections were important across the frequencyrange spanning the La,b and Ba,b electronic excitations in tyrosine and the tyrosinate anion.Furthermore, we demonstrated that interference with high-energy states had a significantimpact and could not be neglected even when in resonance with a lower-energy state. Thesymmetry of the vibrational modes served as an indicator of the dominance of the A or B mechanisms. Excitation profilescalculated with a damping constant estimated from line widths of the electronic absorption bands had the best consistency withexperimental results.
■ INTRODUCTION
UV resonance Raman scattering (RRS) spectroscopy is apowerful analytical technique permitting sensitive detection ofhazardous materials as well as of structural change withinbiological systems. For example, RRS from aromatic aminoacids such as tryptophan and tyrosine serves as an indicator ofthe local environment within a protein,1 such as ligandbinding.2,3 UV-RRS was used to measure hydrophilicinteractions, in particular, the H-bond strength between watersolvent molecules and the polar groups on the aromatic sidechain.4−7 RRS has also been used to investigate the interactionsbetween metal atoms in metalloenzymes8−10 and nearby aminoacid residues serving as coordinating ligands.10−12 Moreover,RRS has been used for examining tertiary protein structure suchas the α and ψ angles of the peptide linkages in proteins,13 aswell as the hydrophobicity around aromatic amino acidresidues.14 Clearly, the RRS signal is sensitive to intermolecularinteractions or any process that affects the electronic structure.Because of the wide applicability of RRS for the study ofinteractions in biological environments, a fundamental under-standing of how the signal responses of vibrational modeswithin a molecule are impacted by the electronic structure is
important. The impact can be reflected in both frequency shiftsas well as subtle changes in Raman intensities.13,15−17
The impact of molecular electronic structure on theresonance Raman signature can be seen through theantiresonance phenomenon, where the Raman intensity ismuch less than to be expected based on the optical absorption.Antiresonances are thought to occur18−22 when preresonanceof a strongly allowed electronic transition destructivelyinterferes with the resonance with a weakly allowed electronictransition. Destructive interference in tryptophan results in a“window” at around 205 nm with reduced Raman return thatenables studies of RRS of amide bonds with minimalinterference.20 Theoretical modeling is essential to theunderstanding of antiresonance phenomena in RRS spectra.While it is not experimentally possible to probe in detail theconnection between the RRS and the electronic structure, inother words, detect electronic transitions deep in the vacuumUV or probe weakly allowed and unresolved transitions, it ispossible to model the electronic structure in detail. The
Received: July 11, 2014Revised: September 17, 2014Published: September 18, 2014
Article
pubs.acs.org/JPCA
© 2014 American Chemical Society 9675 dx.doi.org/10.1021/jp506948h | J. Phys. Chem. A 2014, 118, 9675−9686

electronic structure of molecules can be simulated withexperimentally validated TDDFT models, and the influencesof the individual electronic states on the RRS intensity can bestudied in the model.The sum-over-states approach23 is a necessary framework for
understanding how the different electronic states affect theRaman cross sections of given normal modes, and it readilyexplains structure in the absolute Raman peak intensity as afunction of the excitation wavelength, that is, the excitationprofile. Excellent examples are demonstrated in the studies ofseveral systems, including benzene,22,24−26 substitute ben-zenes,27 formamide,18 ClO2,
28 and tryptophan.20 A number ofstudies has focused on analyzing the excitation profile in termsof the Albrecht A term. For benzene, which is the primarychromophore of tyrosine, the Albrecht A term preresonanceapproximation was used to demonstrate that contributionsfrom strongly allowed electronic states deep in the UV (∼119nm)19 dominated any contributions from the lowest-energyallowed transition at 183 nm. Hildebrandt et al.5 and Patapoffet al.28 evaluated the A term of the sum-over-states expressionusing vibrational wave functions to calculate the Franck−Condon overlap integrals in their sum of states calculation anddemonstrated interference effects. An analysis including the Bterm mechanism would be useful because nonsymmetric modescan have significant contributions to the RRS spectrum;however, the calculation of the Albrecht B term is theoreticallycomplicated. While the A term involves a single summationover the electronic states, the B term involves a doublesummation over both the electronic and vibronic states. Asimplified approach is desirable.To simulate the resonant Raman spectra with a reduced
computational burden while obtaining insight into the influenceof the electronic structure on the Raman intensities, we utilizedthe simplified sum-over-states approach that some of usintroduced in Rappoport et al.,29 where we replaced the doublesummation over vibronic and electronic states by a singlesummation over electronic states. It is based on an approximateclosure over the vibrational states belonging to each individualelectronic state. The only required properties of the excitedelectronic states are their excitation energies, transition dipolemoments, and respective gradients along the ground-statevibrational modes. The complicated calculation of the Franck−Condon factors is avoided, and the calculation of the resonanceRaman of amino acids in solution becomes much moretractable. It should also be noted that there are several othertheoretical approaches currently available, such as the methodof Gaff et al. based on the geometry differences between theexcited and ground states30 as well as the time-dependent shorttime approximation approach of Heller and co-workers31,32 asimplemented by Jensen et al. in the Amsterdam densityfunctional (ADF) code33−36 and NWCHEM.37 A similarapproach is implemented in Orca.38 We utilize the simplifiedsum-over-states approach of Rappoport because it enables us toanalyze the contributions of the Albrecht A and B terms to theexcitation profile separately as well as examine the contributionsfrom individual electronic transitions to the resonance Ramancross section. This is not possible in the time-dependent shorttime approximation approach, which makes use of the closureof the sum over electronic states.The focus of this study is the RRS of tyrosine for three
reasons. First, tyrosine is biologically very important in enzymefunction, as stated above. Second, tyrosine possesses anaromatic side chain that enables it to experience resonance
enhancement independently from most other amino acids, atreadily accessible UV wavelengths. Third, this amino acid hasbeen examined extensively with a number of experimentalstudies reported that can be used to validate modeling results.Therefore, a detailed theoretical analysis, including the B term,combined with experimental studies, helps to shed additionallight on the influence of dark or weakly allowed electronicstates. Using the experimental data from this work and previousstudies,39−42 we establish the accuracy of the simplified sum-over-states approach29 and use it to analyze the contributions ofthe individual electronic states as well as Albrecht A and Bterms23 to resonance Raman spectra and Raman excitationprofiles.
■ METHODSExperimental Section. The solution-phase samples for the
cross section measurements were prepared by dissolving thematerial of interest in ultrapure water. To mitigate thephotodegradation of the tyrosine solutions, the samples weremagnetically stirred in small glass cups during the measure-ments, so that the laser beam was continuously exposed to freshsample. The cups were covered with UV-transparent quartzcoverslips to prevent evaporation of the acetonitrile internalstandard.The UV resonance Raman spectroscopy measurements were
carried out with an in-house-built spectrometer system. TheUV laser light was generated with two different laser systems. ACoherent Sabre FreD frequency-doubled argon ion laser wasused to generate 229 and 244 nm CW excitation light. ACrystalaser frequency-quadrupled pulsed Nd:YLF laser wasused to generate 262 nm radiation with a high repetition rate(∼3 kHz) and low pulse energies. In all cases, the incident laserpower on the sample averaged ∼10−50 mW. The excitationradiation was weakly focused on the sample with a 150 mmfocal length lens. A 15× reflecting objective (Edmund OpticsReflX, N.A. = 0.5, working distance 24.5 mm) was used tocollect the Raman scattered light. A backscattering config-uration was used in which the laser beam was directed onto thesample by a right angle mirror attached to the centralobscuration of the reflecting objective. An additional 150 mmlens focused the Raman scattered light on the spectrometerentrance slit. The spectrometer slit width was set to 100 μm.UV-grade quartz lenses and aluminum mirrors were used in allcases to steer and focus the laser beam and collect the Ramanscattered light. The Rayleigh scattered excitation light wasfiltered by long-pass filters (Barr Associates) designed for eachexcitation wavelength. A Princeton Instruments SP2500 triplegrating spectrometer (0.5 m focal length, f/6.2) was used todisperse the Raman scattered light. For the measurementsdescribed here, a 2400 grooves/mm grating blazed at 300 nmwas used. The light was detected using a PI/Acton Pixis 2Kthermoelectrically cooled UV-enhanced CCD camera (2048 ×512 pixels). The Raman shift was calibrated for each excitationwavelength by measuring known bands of acetonitrile andcyclohexane. Blank spectra were collected at each excitationwavelength and subtracted from the RRS spectra.UV−vis absorption measurements were performed using a
Thermo Evolution 60 UV−vis spectrometer to obtain theabsorbance in the wavelength range from 190 to 800 nm. Thesamples were measured in a 1 cm path length quartz cell with aconcentration of 0.02 mg/mL for tyrosine and for thetyrosinate anion. The absorbance values obtained were thenconverted to molar absorptivities. In addition to general
The Journal of Physical Chemistry A Article
dx.doi.org/10.1021/jp506948h | J. Phys. Chem. A 2014, 118, 9675−96869676

guidance for the resonance Raman spectroscopy measurements,the absorption measurements provide parameters necessary tocorrect for absorption effects on the Raman cross sectionvalues.HPLC-grade acetonitrile (Sigma-Aldrich) was used as the
cross section standard, where the cross section values foracetonitrile were obtained from the work of Asher et al.43 Thecross sections for acetonitrile can be modeled in the deep-UVusing the modified Albrecht A term formula
σ ν ν νν νν ν
= −++
+⎡⎣⎢
⎤⎦⎥K K( )
( )R 1 0 0 j3 e
202
e2
02 2 2
2
(1)
where σR is the Raman cross section, ν0 is the laser frequency incm−1, νj is the mode vibrational frequency in cm−1, and K1, K2,and νe are empirically determined fitting parameters.43 For the919 cm−1 C−C stretching band of acetonitrile (CH3CN), theparameter values are K1 = 2.26 × 10⁻²⁵ cm2/sr, K2 = 0, and νe=390 000 cm−1. Using the internal standard technique, the crosssection for the material of interest can be determined using theformula44
σ σε εε ε
=−−
++
⎛⎝⎜
⎞⎠⎟⎛⎝⎜⎜
⎞⎠⎟⎟⎛⎝⎜
⎞⎠⎟⎛⎝⎜
⎞⎠⎟
II
E v v
E v vCC
( )
( )Rs
Rr
s
r0 j
r
0 js
r
ss exc
r exc (2)
where σR is the Raman cross section, I is the integrated Ramanband intensity, E is a factor that takes into account thecombined spectrometer and detector efficiencies as a functionof wavelength, C is the concentration, and ε is the molarabsorptivity of the resonant analyte of interest. Here, thesuperscripts r and s refer to the acetonitrile reference and thesample of interest, respectively. The subscript exc refers to theexcitation wavelength. The combined spectrometer anddetector efficiencies were determined using a calibrateddeuterium lamp (Ocean Optics DH-2000CAL). The last termin parentheses on the right-hand side of the equation is a factorthat is used to correct for wavelength-dependent UV self-absorption by the resonant analyte.Theoretical. Within the simplified sum-over-states ap-
proach, the resonance Raman cross section is represented asa sum over excited electronic states and is obtained bystraightforward differentiation of the sum-over-states expansionof the frequency-dependent polarizability with respect to avibrational normal mode.29 The differential Raman scatteringcross section for a given normal mode Q can be written as
σσ ω ωω
ω∂∂Ω
=−
|⟨ ⟩|⎜ ⎟⎛⎝
⎞⎠ c
( )
2( )
Q
Q
4
42
(3)
where ω is the excitation frequency, ωQ is the vibrationalfrequency of mode Q, c is the speed of light, and ⟨σQ(ω)⟩ is theangle-averaged Raman scattering tensor. The Cartesiancomponent mn of the Raman scattering tensor is computed as
∑σ ω μ μω γω γ
ω γω γ
μμ μ
μω
ω γ
γω γ
= −Ω − −Ω − +
+Ω −
Ω − +∂Ω∂
+∂∂
+∂∂
Ω −Ω − +
+Ω − +
⎡⎣⎢⎢
⎡⎣⎢⎢
⎤⎦⎥⎥
⎡⎣⎢
⎤⎦⎥⎡⎣⎢⎢
⎤⎦⎥⎥⎤⎦⎥⎥
Q
Q Q
( )( )
(( ) )
2i( )
(( ) )
( )
i
( )
Qmn
kk
mk
n k k
k k
k k
k k
k
km k
nk
m
kn k
k k
k
k k
0 0
2 2
2 2 2
2 2 2
00 0
0 2 2
2 2(4)
where Ωk is the electronic state excitation energy of the kthelectronic state, μ0k
m and μ0kn are the m and n components of
the 0 → k transition dipole moment, and γk is its line width.There are some key features in the above expression. First, thetwo terms in eq 4 are analogous to the Albrecht A and Bterms.23 As with the Albrecht A term, the first term in eq 4 hasthe derivative of the excitation energy Ωk with respect to thenormal coordinate Q, which is only nonzero for symmetricvibrational modes. Second, as the excitation frequency ωapproaches the excitation energy Ωk, there is resonance withone of the excited electronic states, and that state is expected todominate the Raman intensity, which potentially allows us torestrict the summation to the excited states near or below theexcitation frequency ω. The line width γk of the kth excitedelectronic state cannot be computed from first principles. Thus,we approximated γk in resonance Raman spectra by the linewidth fitted from the experimental absorption spectrum (γ =0.2 eV). To demonstrate the effect of line width, spectra werecalculated with 50, 100, 200, and 300 meV line width forneutral tyrosine. We optimized the ground-state structuresusing density functional theory with the B3LYP hybridfunctional45 and the triple-ζ basis sets TZVPP.46 The structureoptimizations included the conductor-like solvation model(COSMO) with the effective dielectric constant for water of ε= 80.47 Subsequently, vibrational modes, transition dipolederivatives, and excitation energy gradients were computed bynumerical differentiation of the ground-state energy gradients,transition dipoles,48,49 and excitation energies,50 respectively,including the effect of solvation, while the frequencies ofelectronic transitions and transition dipoles were computedanalytically without COSMO. All calculations were performedusing the Turbomole suite of programs, version 6.0.51,52 Inorder to compare computed sum-over-states RRS with anotherapproach, we calculated the RRS of neutral tyrosine using thetime-dependent approach of Jensen et al.33 as implemented inthe ADF code. Following the approach of Jensen and Schatz,we utilized the BP8653−55 functional and the TZP56 (triple ζplus polarization functions Slater-type orbitals basis set).Spectra were calculated with the AORESPONSE35,36 moduleusing line widths of 0.007 hartree as well as using the COSMOmodel to account for solvation in water.
■ RESULTS AND DISCUSSION
We used the simplified sum-over-states approach within theframework of TDDFT to investigate the influence of themolecular electronic structure on the RRS cross section. To thisend, we first established the accuracy of the simplified sum-over-states approach for tyrosine and tyrosinate by comparingthe theoretical predictions to experimental UV−vis absorption
The Journal of Physical Chemistry A Article
dx.doi.org/10.1021/jp506948h | J. Phys. Chem. A 2014, 118, 9675−96869677

spectra, RRS spectra measured with 229 and 244 nm excitation,and excitation profiles from this work and refs 40−42.UV−Vis Spectra. We compare the theoretical and
experimental UV−vis spectra of tyrosine and tyrosinate inFigure 1. For the neutral tyrosine, the form of the predicted
curve generally follows the experimental measurement, wherethere are three broad features that have been assigned to theBa,b, La, and Lb electronic transitions, with maxima at 193, 223,and 275 nm. Molar absorptivities of ε275 = 1370 L mol−1 cm−1
and ε223 = 8050 L mol−1 cm−1 were measured, which comparewell with literature values.57 From the full width at half-maximum (fwhm) of the features of the UV−vis absorptionspectrum, a damping constant of 0.2 eV (200 meV) wasdetermined and used in subsequent theoretical calculations.The largest difference between the theoretical and experimentalresults occurs in the predicted absorption of the Lb transition of∼0.4 eV, and differences of this magnitude are typical forTDDFT calculations. For the tyrosinate at pH 13, theagreement between theory and experiment is even better,where the differences are ∼0.1 eV for the La and Lb transitionsand ∼0.3 eV for the Ba,b transitions, at 293, 240, and 198 nm.The experimental UV−vis absorption spectrum replicates thered shift in the predicted electronic absorption curve. Molarabsorptivities of ε239 = 7390 L mol−1 cm−1 and ε293 = 2000 Lmol−1 cm−1 were measured for the tyrosinate anion.Resonance Raman Spectra. The second validation point
for the theoretical models of the two forms of tyrosine is thecomparison of theoretical and experimental RRS spectra. Figure2 shows the comparison of theoretical and experimental RRSspectra with 229 and 244 nm laser excitation. Excellentagreement in terms of relative intensities is obtained for neutraltyrosine with 229 nm excitation. Peaks are easily assigned to the8a, 8b, ring-O stretch, ring-C stretch, 9a, and a ring breathingmode. We attribute a shoulder at 1670 cm−1 in theexperimental spectra to water molecule H−O−H bending,sharing intensity with the 8a ring C−C stretching mode. Exceptfor the excited-state line width γ, which was fitted to theexperimental absorption spectrum, no empirical or scaling
factors were applied in the calculation of the RRS. Because ofthe harmonic approximation in the determination of vibrationalfrequencies, theoretical wavenumbers are typically 30−40 cm−1
greater than the experimental ones. Similarly, the theoreticalspectrum for the 244 nm excitation matches the experimentalspectrum very well. For tyrosinate with 244 nm excitation,similar agreement between theory and experiment is obtained.The removal of the phenoxy hydrogen produces a red shift ofthe 8a and 8b peaks, although the theoretical modeloverestimates the magnitude of the frequency shift for the 8bmode. The peak at 1667 cm−1 is again attributed to intensitysharing with solvent water molecules. For tyrosinate with 229nm, there is good agreement, except for a single peak at 1376cm−1, which corresponds to a ring-O stretch. Compared toneutral tyrosine, its frequency is predicted to be blue shifted byabout 100 cm−1, which is mostly due to the strengthening ofthe C−O bond. We assume that this mode is not observed inexperimental spectra due to its sensitivity to the localenvironment.For comparison to the time-dependent finite lifetime
approach, calculated RRS spectra from ADF with 229 and244 nm excitation for tyrosine are presented in Figure 2.Spectra calculated with ADF are generally similar to the resultsof the sum-over-states calculation, except the relative intensitiesof the 9a, ring-C, and ring-O modes are different, and a ringtwist mode at around 1294 cm−1 becomes prominent. The
Figure 1. Comparison of experimental UV−vis absorption spectra andTDDFT theoretical calculations for neutral tyrosine and tyrosinate atpH 13, on the same scale. Twenty electronic singlet transitions werecalculated. The general shapes of the theoretical curves follow thesame form as the experimental data. Data from experiment re shown inred, and data from TDDFT calculations are shown in black. As shownin the ball and stick models, the hydroxyl oxygen on the tyrosine ringand the carboxylate functional group are deprotonated at pH 13 for a−2 anion. At neutral pH, the amine group is protonated, thecarboxylate functional group is deprotonated, and the hydroxyl groupon the tyrosine ring is intact. The net molecular charge is neutral.
Figure 2. Comparison of theoretical and experimental RRS spectrawith 229 and 244 nm laser excitation. Red traces representexperimental measurements, the black traces represent the results ofthe simplified sum-over-states calculations for 20 electronic states, andthe blue dashed lines represent the results of the time-dependentapproach as implemented in the ADF code for comparison.
The Journal of Physical Chemistry A Article
dx.doi.org/10.1021/jp506948h | J. Phys. Chem. A 2014, 118, 9675−96869678

differences in the vibrational frequencies are due to the use ofthe nonhybrid BP86 functional with ADF. Although the sum-over-states results are truncated after summation over 20 statesdue to the similarity with the closed form finite lifetimecalculation, we conclude this is a reasonable number of states.We also note that the theoretical Raman spectra contain a
peak at the same position as the 825 cm−1 peak found in theexperimental spectrum. This peak is assigned in the literature toan overtone of the 16a mode in Fermi resonance with the ringbreathing mode at 854 cm−1.Raman Excitation Profiles. We compare theoretical
predictions for the absolute Raman cross sections toexperimental measurements from this study and refs 40−42.Figure 3 shows the excitation profiles, that is, theoretical
absolute Raman cross sections as a function of excitationwavelength to the experimental measurements, for the 9a, ring-C stretch, and 8a modes. The literature values come fromFodor,40 Ludwig,41 and Asher,42 and absolute cross sections aremeasured in this study at 229, 244, and 262 nm for tyrosine andtyrosinate. For the 8a vibration at 1613 cm−1 with 229 nm (thisstudy and Fodor) and 230 nm (Ludwig, 8a and 8b intensities
reported together), there is good agreement (5.1 × 10⁻²⁵, 3.4 ×10⁻²⁵, and 4.1 × 10⁻²⁵ cm2/sr·molecule, respectively). Althoughother overlapping data points from Fodor and Ludwig agreewell, the maximum value in the Ludwig data does not appear inthe measured trend in the Fodor data. The same can be said forthe 1180 cm−1 excitation profile. However, the data from Fodorshow a local minimum at around a 218 nm excitation and alocal maximum at 230 nm. For the neutral tyrosine, thetheoretical models follow the form of the experimentalexcitation profiles well, when the data points from all threestudies are considered. For example, there is excellentagreement on the crossover point with respect to thewavelength where the ring-C stretch mode at 1210 cm−1
comes to dominate the 9a mode at 1180 cm−1 (202 nmtheoretical versus 204 nm experiment). However, thetheoretical excitation profiles consistently underestimate theexperimental cross sections across the excitation wavelengthsconsidered. For the neutral tyrosine and wavelengths shorterthan 220 nm, the theoretical absolute cross section is less thanan order of magnitude less than the experimental value, and forwavelengths longer than 220 nm, the theoretical absolute crosssection underestimates the experiment by about a factor of 5.The experimental data compare well with each other, with
good agreement for overlapping values of Asher and Ludwig.The 229 and the 244 nm data points from this study follow theexperimental trend in the previous data very well, but the 262nm data points for tyrosinate, especially for the 1208 and 1601cm−1 peaks, vary significantly from the 260 nm excitation valuesfrom Asher. For the tyrosinate anion at pH 13, the theoreticalexcitation profiles compare well with the experimental data.Again, the experimental absolute cross sections follow theshapes of the theoretical excitation profile curves. On the basisof the good agreement between the theoretical andexperimental UV−vis spectra, RRS spectra, and Ramanexcitation profiles for both neutral tyrosine and tyrosinate, weconclude that the simplified sum-over-states approach providesa reasonable description for the Raman response in the twoforms of tyrosine and can be used to study the interferenceeffects in their resonance Raman spectra.
Destructive Interference. The crucial advantage of thesimplified sum-over-states approach is that it allows inves-tigation of the interference between contributions fromdifferent electronic states to the RRS excitation profiles. Figure4 shows the comparison of the theoretical electronic absorptioncurve to the RRS excitation profiles predicted from thesummation of 5, 10, 15, and 20 lowest-energy electronic statesfor the 9a, ring-C stretch, 8b, and 8a modes. The summationover the five lowest-lying electronic states includes the twotransitions at 253 and 221 nm that we assigned to the La and Lbtransitions in the TDDFT electronic excitation spectrum. Inaddition, the TDDFT calculations predict much weakertransitions between 190 and 205 nm, and the stronglyabsorbing Ba,b transitions are predicted to fall within the170−190 nm range. The effects of different electronic states onthe total predicted RRS cross section are clearly visible for theinvestigated modes. As with Figure 1, three absorption featuresare apparent in the electronic absorption spectrum even in logscale. For the 9a mode (1204 cm−1 harmonic frequency), theexcitation profile from summing the five lowest-lying electronicstates generally follows the two low-energy features of theelectronic absorption spectrum, although the profile is stronglydominated by the feature at around 220 nm. Both the
Figure 3. Comparison of experimental and theoretical excitationprofiles (Raman cross section as a function excitation wavelength inthe range of 180−280 nm) of neutral tyrosine and the tyrosinateanion. The solid curves represent the theoretical excitation profiles,labeled according to the calculated vibrational frequency, and thesymbols indicate experimental measurements. Lines joining exper-imental measurements are intended to aid the reader. The y axis forboth plots is in log scale.
The Journal of Physical Chemistry A Article
dx.doi.org/10.1021/jp506948h | J. Phys. Chem. A 2014, 118, 9675−96869679

Figure 4. Comparison of the excitation profiles of the 9a, ring-C stretch, 8b, and 8a modes of neutral tyrosine for summations of 5, 10, 15, and 20electronic states to the theoretical electronic absorption curve. All y axes are on the log scale.
Figure 5. Comparison of the excitation profiles of the 9a, ring-C stretch, 8b, and 8a modes of the tyrosinate anion for summations of 5, 10, 15, and20 electronic states to the theoretical electronic absorption curve.
The Journal of Physical Chemistry A Article
dx.doi.org/10.1021/jp506948h | J. Phys. Chem. A 2014, 118, 9675−96869680
electronic absorption spectrum and the excitation profile forfive states have a maximum at 220 nm.As five next-higher-lying electronic states are added to the
sum-over-states, the excitation profile increases, so that theexcitation profile generally matches the maximum absorption at∼185 nm, and the absorption feature at 220 nm is reflected as ashoulder in the excitation profile. However, when additionalexcited states deep in the UV are included in the sum for a totalof 15 states in the summation, two interesting observations canbe made. First, the excitation profile relative to that determinedfor the 10-state summation is reduced across the entireexcitation energy range considered. For excitation wavelengthsclose to the 220 nm feature that we attribute to the Laabsorption, the absolute cross sections are reduced by nearlya factor of 4. The reduction in cross section approaches 2orders of magnitude for excitation wavelengths far from the 220nm feature. This is a surprising result because high-energyelectronic states that are far from resonance with the opticalexcitation can have such a strong influence, even when theoptical excitation is in resonance with a lower-energy transition.The contribution of high-energy electronic states should not beneglected, especially when the oscillator strengths are muchgreater than the lower-energy transitions. The terms in thesum-over-states corresponding to higher-energy transitionshave a considerable effect on the calculated cross section.Without inclusion of at least 15 electronic states, the agreementbetween the experimental and theoretical excitation profiles isclearly unsatisfactory.Second, for additional electronic states, convergence seems
to be reached with respect to the number of electronic statesincluded in the sum because the excitation profile for 20 states
is nearly identical to that obtained for 15 electronic states.Similar observations can be made from the comparison of theelectronic absorption curve and the excitation profiles for thering-C stretch, the 8b, and the 8a modes. For the ring-C stretch,most suggestively, instead of a local maximum at 220 nm, alocal minimum at 217 nm appears for summations of 10, 15,and 20 states. This produces a shift of the local maximum forthe summations of 15 and 20 states to 223 nm. Although theexcitation profile for a summation of five states produces a localmaximum at 252 nm, which we attribute to resonance with theLb electronic transition, for summations of 15 states, a localminimum is produced. On the basis of the dependence of thepredicted excitation profile on the electronic states included inthe sum-over-states, we conclude that the theoretical model isshowing destructive interference between different transitiondipole moments to different electronic states. While excitationcan be in direct resonance with a given electronic state,interference from more strongly absorbing states deep in theUV can have a strong impact on the RRS cross section.Although it is possible that other states deeper in the UV maystill have an effect, the summation over the 20 lowest electronicstates including the La, Lb, and Ba,b transitions captures thebehavior of the RRS spectra and excitation profiles sufficientlywell. It should also be pointed out that the models give insighton the influence of very high energy transitions that cannot bemeasured experimentally due to their short wavelengths thatfall deep in the vacuum UV region of the spectrum.Figure 5 shows the comparison of the theoretical electronic
absorption curve and the excitation profiles for the 9a, ring-Cstretch, 8a, and 8b modes of the tyrosinate anion in the range of170−350 nm. As with the tyrosine, the two lowest-energy
Figure 6. A comparison of the contributions from the A and B terms to the theoretical excitation profiles for the 9a, ring-C stretch, 8b, and 8a modesof the neutral, zwitterionic form of tyrosine. The profiles that result from directly summing the A and B term polarizability tensor derivatives (A +B)2 and from summing the magnitudes while disregarding interference between A and B terms (A2 + B2) are plotted as well for each mode.
The Journal of Physical Chemistry A Article
dx.doi.org/10.1021/jp506948h | J. Phys. Chem. A 2014, 118, 9675−96869681
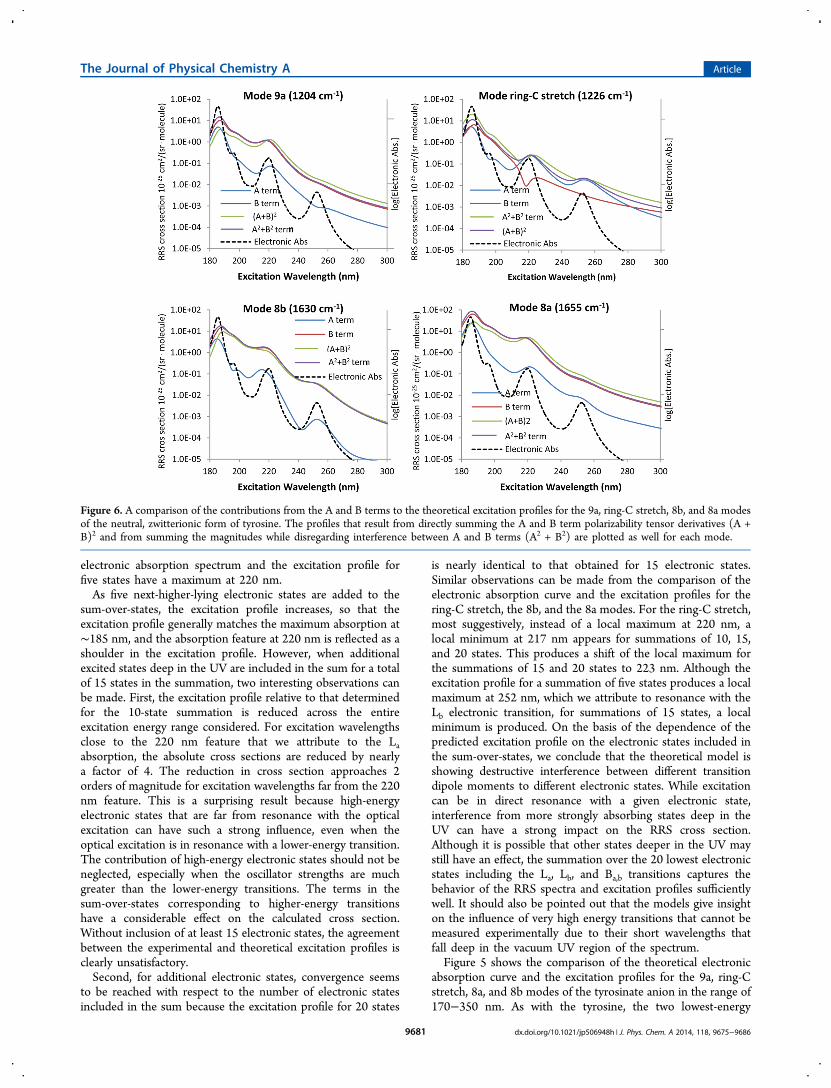
transitions to the first two excited states dominate the excitationprofiles for sums of 5 and 10 states for all four modesconsidered. Significant changes to the excitation profile acrossthe entire excitation wavelength range considered aredemonstrated when higher-energy states are included in thesum for 15 and 20 states. For all four modes, the maximumRaman cross section is obtained from the sum of 15 states, andthe reduction in Raman cross section between the sum for 15and 20 states demonstrates destructive interference. Unlike theresults for tyrosine, self-consistency was not obtained for sumsof 15 states. This is not surprising given the red shift of thetheoretical electronic absorptions as well as the increase inoscillator strength of the two lowest-energy transitions La andLb shown in the stick spectra in Figure 1. However, the sameconclusion drawn for the neutral tyrosine can be made, namely,that preresonance with states high in energy has a non-negligible contribution, even when in resonance with low-energy states.Contributions from the Albrecht A and B Terms. The
contributions from the A and B terms lend insight into theinfluence of the electronic structure on the RRS cross sectionand the Raman excitation profile. Figures 6 and 7 show theindividual contributions of the A and B terms to the total crosssections for the 9a, ring-C stretch, 8b, and 8a ring modes forneutral tyrosine and the tyrosinate anion. The y axes are shownin log scale to display the broad range of cross sections. Theexcitation profiles are overlaid with the electronic absorptionspectra to highlight the differences between the excitationprofiles and the excitation spectrum. For the 9a, 8b, and 8amodes, the B term dominates the RRS cross section for theexcitation wavelengths considered. The symmetry of the
vibrational modes can explain this observation because it isknown that symmetric vibrations dominate the contribution tothe A term and that B terms can receive contribution fromnonsymmetric modes. Figure 8 shows displacement vectorrepresentations of the neutral tyrosine, and it can be seen thatthe presence of the phenoxy hydrogen and oxygen greatly
Figure 7. A comparison of the contributions from the A and B terms to the theoretical excitation profiles for the 9a, ring-C stretch, 8b, and 8a modesof the tyrosinate anion. The profiles that result from directly summing the A and B term polarizability tensor derivatives (A + B)2 for each mode arealso shown.
Figure 8. Vector representations of the 9a, ring-C stretch, 8b, and 8amodes of zwitterionic, neutral tyrosine. Note that the phenoxyhydrogen breaks the symmetry of the ring motions, so that for the 8amode, the C−C ring stretches are skewed relative to the ring oxygen−carbon axis.
The Journal of Physical Chemistry A Article
dx.doi.org/10.1021/jp506948h | J. Phys. Chem. A 2014, 118, 9675−96869682

disrupts the symmetry of the vibrations. It should also be notedthat for the ring-C stretch, 8b, and 8a vibrational modes, the Aterm contributions faithfully follow the electronic absorptioncurve for neutral tyrosine, except for the 9a mode, which showssome destructive interference between the Lb and higher-energy electronic states. The B term contributions alsogenerally follow the electronic excitation spectrum, except forthe ring-C stretch mode, where strong destructive interferencebetween the La transition and other electronic states shows upas a local minimum.The effect of vibrational symmetry on the A and B terms is
more apparent in tyrosinate. As shown in Figure 9, removal of
the phenoxy hydrogen at high pH increases the symmetrysignificantly, and this is reflected in the relative contributions tothe excitation profiles from the A and B terms. For the 9a, ring-C stretch, and the 8a modes, Figure 7 shows that the A term isdominant when the excitation is close to resonance with the Laor Lb electronic transition. This is not the case for the 8b modewhere the B mechanism remains the largest contributor to theexcitation profile across all excitation wavelengths considered.An examination of the vibrational displacements for that modeshows the aromatic hydrogen bends on opposite sides of thephenoxylate oxygen point in opposite directions, making themode nonsymmetric. As a result, the A term contribution islimited for this particular mode.In Figure 7, there appears to be destructive interference
between the La transition and other excited electronic states inthe B term contribution to the ring-C stretch mode. Althoughthe TDDFT model has a transition at 220 and 216 nm, there isa local minimum in the excitation profile at 218 nm. However,the total RRS cross section is not greatly affected because the Aterm dominates at that wavelength, and the A term does notexperience destructive interference between different terms inthe sum-over-states. The excitation profile behavior for the 8bvibrational mode also displays interesting behavior. While the Aterm is sensitive to the Ba,b and La electronic transitions, itappears to get no contribution from the Lb transition. For the B
term, nearly the opposite is true, where the excitation profile isbarely affected by the La transition and clearly receivescontributions from the Lb and Ba,b transitions. A similarobservation can be made for the 8a vibrational mode, where theA term strongly dominates the B term when in resonance withthe transition to the Lb electronic state, yet both the A and Bterms experience enhancement when in resonance with thetransition to the La electronic state.
Considerations of the Effects of Broadening of theElectronic Transitions on the RRS Spectrum. It isnecessary to consider the effect of electronic transitionbroadening on the sum-over-states model in order to use thelatter to understand interference effects on the RRS spectrum.In using the experimental line width in the calculation of theRRS spectrum for the damping constant in the sum-over-statesapproach, we assume that the line width arises only fromhomogeneous broadening mechanisms and neglect inhomoge-neous broadening, such as solvent effects, or other mechanisms.As shown in eq 4, the simplified sum-over-states utilized in thisstudy only accounts for the effect of homogeneous broadeningto the electronic absorptions. If mechanisms other thanhomogeneous broadening make a significant contribution tothe experimental line width, then the true homogeneousbroadening factor would be smaller than the 0.2 eV used tocalculate RRS spectra. In addition, inhomogeneous broadeningalso can change the line shape of an electronic transition from aLorentzian to a Gaussian or Voigt shape. Outside of the fwhm,the Gaussian and Voigt line shapes go more rapidly to zerothan the Lorentzian line shape. Thus, the effect of a significantcontribution from an inhomogeneous broadening mechanismwould be to reduce interference between electronic states in thesum-over-states. In addition to a reduction of interferencebetween electronic transitions, a decrease in the homogeneousbroadening damping factor would be to increase the predictedRaman cross section. It was noted above that the theoreticalabsolute Raman cross sections consistently underestimate theexperimental values, and a smaller homogeneous dampingfactor may account for the consistent difference betweentheoretical prediction and experimental cross section values.To demonstrate the effect of a smaller contribution of
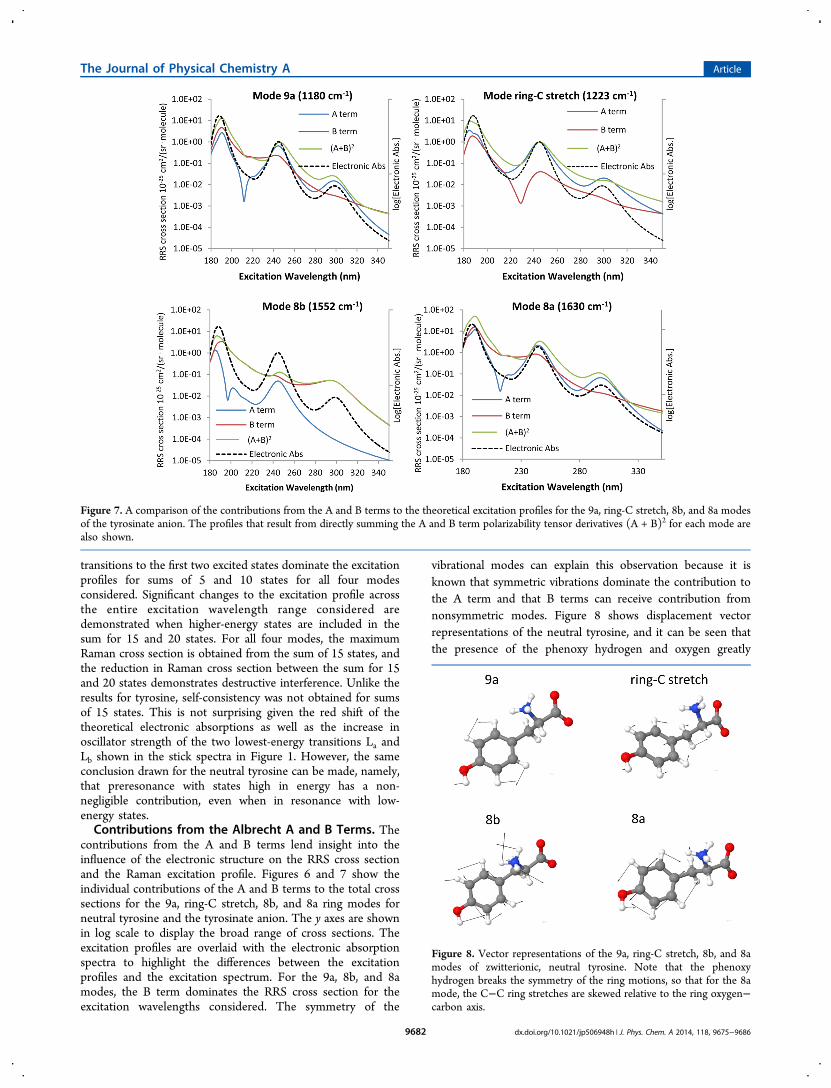
homogeneous broadening to the line width in the electronicspectrum on the sum-over-states model and to provide a basisfor comparison to experimental data, excitation profiles arecalculated for a progression of damping constants. Figure 10shows a comparison of calculated excitation profiles for the 8a,8b, 9a, and ring-C vibrational modes for the values of 0.05 and0.2 eV of homogeneous broadening. For the 0.2 and 0.3 eV linewidths, the excitation profiles are nearly identical, and theexcitation profile values for the 0.1 eV line width fall midwaybetween those for the 0.05 and 0.2 eV profiles. As expected, theresult of the reduction of the line width is to reduceinterference between contributions from individual electronicstates to the Raman cross section.The reduced interference shows itself in two ways. First,
when the line width is reduced to 0.05 eV, the Raman crosssection is enhanced by up to 2 orders of magnitude when inresonance with an electronic transition. Second, the excitationprofile starts to follow the absorption spectrum more closely inthat the Lb transition at 253 nm becomes significantly moreapparent in the excitation profile. However, this will have asignificant impact on the relative intensities between the ring-C,8a, and 9a peaks that is not consistent with experimental data.For the narrow 0.05 eV line width, the ring-C mode receives
Figure 9. Vector representations of the 9a, ring-C stretch, 8b, and 8amodes of the tyrosinate anion. Note that the symmetry of the ringmotions is increased by the removal of the phenoxy hydrogen, wherethe ring C−C stretch for the 8a mode is now parallel to the ringoxygen−carbon axis.
The Journal of Physical Chemistry A Article
dx.doi.org/10.1021/jp506948h | J. Phys. Chem. A 2014, 118, 9675−96869683
significant enhancement in the vicinity of the Lb electronictransition so that on resonance, it would be expected todominate the 8a peak by an order of magnitude and have equalintensity at ∼245 nm. For the same electronic line width, ourmodel also predicts that the ring-C mode should dominate the9a mode by nearly 2 orders of magnitude on resonance andshould have equal intensity at 240 nm. However, experimentalexcitation profile data for neutral tyrosine shown in Figure 3show that both the 8a and 9a intensities consistently dominatethe signal from the ring-C mode. The neutral tyrosine spectrumin Figure 2 from 244 nm excitation also shows that the 9a stillhas slightly greater intensity than the ring-C mode. The relativepeak intensities for the 8a, 9a, and ring-C modes predictedusing a damping factor of 0.2 eV are more consistent with theexperimental data than results obtained with damping factors of0.05 or 0.1 eV. We conclude that the assumption ofhomogeneous broadening as the dominant contributor to the
electronic transition line width and the γ = 0.2 eV line width arereasonable.With respect to the consistent underestimation of the
absolute RRS cross sections, it may be possible to adjust thedamping factor to make the theoretical cross sections consistentwith experimental ones. However, this is not justifiable withoutadditional experimental data that illuminates the contributionfrom other electronic transition broadening mechanisms.
■ CONCLUSIONSThe simplified sum-over-states approach has been used to studythe influence of high-energy electronic states on the RRSspectrum of neutral tyrosine and the tyrosinate anion at highpH with state-specific detail. Excellent agreement betweentheoretical calculations and experiment is obtained for not onlythe UV−visible electronic absorption spectrum but also theRRS spectra and excitation profiles for the four vibrationalmodes considered with the electronic state line width, which isfitted to the experimental UV−vis absorption spectrum. Weestablish the accuracy of the TDDFT model of tyrosine. Fromthat model, we are able to infer the influence of high-energyelectronic states on the RRS response from tyrosine. First,although the optical excitation can be in resonance with lower-energy electronic states, for some molecules, it may not beadvisible to neglect the contributions from high-energy states.For neutral tyrosine and the tyrosinate anion, even thoughtransitions to the Ba,b electronic states are nearly 2 eV greater inenergy than the transition to the Lb electronic state, thedestructive interference from these transitions can suppress theRRS response by orders of magnitude. Second, an examinationof the contributions from the A and B Albrecht terms to theRRS cross sections shows that the symmetries of the vibrationalmodes affect the RRS excitation profile. Lastly, we examine theinfluence of homogeneous broadening of the electronictransitions on the RRS excitation profiles. We demonstratethat the excitation profiles calculated with a damping constantof 0.2 eV are more consistent with the experimental data andthat our assumption of dominant homogeneous broadening isreasonable.
■ AUTHOR INFORMATIONCorresponding Author*Phone: 410-436-1760. Fax: 410-436-2742.NotesThe authors declare no competing financial interest.
■ ACKNOWLEDGMENTSJ.B.C. and E.D.E gratefully acknowledge funding provided bythe Edgewood Chemical Biological Center’s In-house Labo-ratory Independent Research (ILIR) program administered byDr. A. W. Fountain. S.K.S. and A.A.-G. acknowledge theDefense Threat Reduction Agency Grant HDTRA1-10-1-0046.D.R. and A.A.-G. acknowledge support through the Cyberdis-covery Initiative Type II (CDI2) grant of the National ScienceFoundation (NSF), Grant Number OIA-1125087. A.A.-G.acknowledges generous support from the Corning Foundation.
■ REFERENCES(1) Kochendoerfer, G. G.; Kaminaka, S.; Mathies, R. A. Ultravioletresonance Raman examination of the light-induced protein structuralchanges in rhodopsin activation. Biochemistry 1997, 36 (43), 13153−13159.
Figure 10. A comparison of the sum-over-states calculated excitationprofiles for 0.05 and 0.2 eV line widths for the 8a, 8b, 9a, and ring-Cmodes. The electronic spectrum calculated with TDDFT is includedfor comparison. The values for the excitation profiles for the 0.1 eVline width are midway between the values for the 0.05 and 0.2 eVexcitation profiles shown. The excitation profile values for the 0.3 eVline width are nearly identical to those calculated for 0.2 eV.
The Journal of Physical Chemistry A Article
dx.doi.org/10.1021/jp506948h | J. Phys. Chem. A 2014, 118, 9675−96869684
(2) Huang, S. C.; Huang, J.; Kloek, A. P.; Goldberg, D. E.; Friedman,J. M. Hydrogen bonding of tyrosine b10 to heme-bound oxygen inAscaris hemoglobin Direct evidence from UV resonance Ramanspectroscopy. J. Biol. Chem. 1996, 271 (2), 958−962.(3) Nagai, M.; Imai, K.; Kaminaka, S.; Mizutani, Y.; Kitagawa, T.Ultraviolet resonance Raman studies of hemoglobin quaternarystructure using a tyrosine-α 42 mutant: Changes in the α1β2 subunitinterface upon the T→R transition. J. Mol. Struct. 1996, 379, 65−75.(4) Couling, V. W.; Foster, N. W.; Klenerman, D. Ultravioletresonance Raman spectroscopic study of the average environment oftyrosine in native and denatured barnase. J. Raman Spectrosc. 1997, 28(1), 33−38.(5) Hildebrandt, P. G.; Copeland, R. A.; Spiro, T. G.; Otlewski, J.;Laskowski, M., Jr.; Prendergast, F. G. Tyrosine hydrogen-bonding andenvironmental effects in proteins probed by ultraviolet resonanceRaman spectroscopy. Biochemistry 1988, 27, 5426−5433.(6) Huang, S.; Huang, J.; Kloek, A. P.; Goldberg, D. E.; Friedman, J.M. Hydrogen bonding of tyrosine B10 to heme-bound oxygen inAscaris hemoglobin. Direct evidence from UV resonance Ramanspectroscopy. J. Biol. Chem. 1996, 271, 958−962.(7) Offenbacher, A. R.; Chen, J.; Barry, B. A. Perturbations ofaromatic amino acids are associated with iron cluster assembly inribonucleotide reductase. J. Am. Chem. Soc. 2011, 133 (18), 6978−6988.(8) Nagai, M.; Yoneyama, Y.; Kitagawa, T. Characteristics in tyrosinecoordinations of four hemoglobins M probed by resonance Ramanspectroscopy. Biochemistry 1989, 28, 2418−2422.(9) Asher, S. A.; Larkin, P. J.; Teraoka, J. Ultraviolet resonanceRaman and absorption difference spectroscopy of myoglobins:Titration behavior of individual tyrosine residues. Biochemistry 1991,30, 5944−5954.(10) Yeh, S. R.; Couture, M.; Ouellet, Y.; Guertin, M.; Rousseau, D.L. A cooperative oxygen finding hemoglobin from Mycobacteriumtuberculosis Stabilization of heme ligands by a distal tyrosineresidue. J. Biol. Chem. 2000, 275 (3), 1679−1684.(11) Das, T. K.; Couture, M.; Lee, H. C.; Peisach, J.; Rousseau, D. L.;Wittenberg, B. A.; Wittenberg, J. B.; Guertin, M. Identification of theligands to the ferric heme of chlamydomonas chloroplast hemoglobin:Evidence for ligation of tyrosine-63 (B10) to the heme. Biochemistry1999, 38, 15360−15368.(12) Nagai, M.; Nagatomo, S.; Nagai, Y.; Ohkubo, K.; Imai, K.;Kitagawa, T. Near-UV circular dichroism and UV resonance Ramanspectra of individual tryptophan residues in human hemoglobin andtheir changes upon the quaternary structure transition. Biochemistry2012, 51 (30), 5932−5941.(13) Ma, L.; Ahmed, Z.; Mikhonin, A. V.; Asher, S. A. UV resonanceraman measurements of poly-L-lysines’s conformational energylandscapes: Dependence on perchlorate concentration and temper-ature. J. Phys. Chem. B 2007, 111 (26), 7675−7680.(14) Clarkson, J.; Sudworth, C.; Masca, S. I.; Batchelder, D. N.;Smith, D. A. Ultraviolet resonance Raman study of the avidin biotincomplex. J. Raman Spectrosc. 2000, 31 (5), 373−375.(15) Nagatomo, S.; Nagai, M.; Kitagawa, T. A new way to understandquaternary structure changes of hemoglobin upon ligand binding onthe basis of UV-resonance raman evaluation of intersubunitinteractions. J. Am. Chem. Soc. 2011, 133 (26), 10101−10110.(16) Pieridou, G. K.; Hayes, S. C. UV resonance Raman spectroscopyof TTR(105−115): Determination of the pKa of tyrosine. Phys. Chem.Chem. Phys. 2009, 11, 5302−5309.(17) Huang, S. C.; Peterson, E. S.; Ho, C.; Friedman, J. M.Quaternary structure sensitive tyrosine interactions in hemoglobin: AUV resonance Raman study of the double mutant rHb (β99Asp→Asn,α42Tyr→Asp). Biochemistry 1997, 36 (20), 6197−6206.(18) Hildebrandt, P.; Tsuboi, M.; Spiro, T. G. Ultraviolet resonanceRaman spectroscopy of formamide: evidence for n−π* interferencesand intermolecular vibronic coupling. J. Phys. Chem. 1990, 94, 2274−2279.
(19) Asher, S. A.; Johnson, C. R. UV resonance Raman excitationprofile through the 1B2u state of benzene. J. Phys. Chem. 1985, 89,1375−1379.(20) Sweeney, J. A.; Asher, S. A. Tryptophan UV resonance Ramanexcitation profiles. J. Phys. Chem. 1990, 94, 4784−4791.(21) Avila Ferrer, F. J.; Barone, V.; Cappelli, C.; Santoro, F.Duschinsky, Herzberg-Teller, and multiple electronic resonanceinterferential effects in resonance Raman spectra and excitationprofiles. The case of pyrene. J. Chem. Theory Comput. 2013, 9 (8),3597−3611.(22) Ziegler, L.; Albrecht, A. C. Raman scattering of benzene in theultraviolet. J. Chem. Phys. 1977, 67, 2753−2757.(23) Albrecht, A. C. On the theory of raman intensities. J. Chem.Phys. 1961, 34 (1), 1476−1484.(24) Korenowski, G. M.; Ziegler, L. D.; Albrecht, A. C. Calculationsof resonance Raman cross sections in forbidden electronic transitions:Scattering of the 992 cm−1 mode in the 1B2u band of benzene. J. Chem.Phys. 1978, 68, 1248−1252.(25) Ziegler, L. D.; Albrecht, A. C. Preresonance Raman scattering ofovertones: The scattering of two overtones of benzene in theultraviolet. J. Raman Spectrosc. 1979, 8, 73−80.(26) Ziegler, L. D.; Hudson, B. Resonance Raman scattering ofbenzene and benzene-d6 with 212.8 nm excitation. J. Chem. Phys.1981, 74, 982−992.(27) Ziegler, L. D.; Hudson, B. S. Vibronic coupling activity in theresonance Raman spectra of alkyl benzenes. J. Chem. Phys. 1983, 79,1134−1137.(28) Patapoff, T. W.; Turpin, P. Y.; Peticolas, W. L. The use of aKramers−Kronig transform techniques to calculate the resonanceRaman excitation profiles of anharmonic molecular vibrations. J. Phys.Chem. 1986, 90, 2347−2351.(29) Rappoport, D.; Shim, S.; Aspuru-Guzik, A. Simplified sum-over-states approach for predicting resonance raman spectra. Application tonucleic acid bases. J. Phys. Chem. Lett. 2011, 2 (11), 1254−1260.(30) Gaff, J. F.; Franzen, S.; Delley, B. Ab initio calculation ofresonance raman cross sections based on excited state geometryoptimization. J. Phys. Chem. A 2010, 114 (43), 11681−11690.(31) Heller, E. J.; Sundberg, R.; Tannor, D. Simple aspects of Ramanscattering. J. Phys. Chem. 1982, 86, 1822−1833.(32) Lee, S.-Y.; Heller, E. J. Time-dependent theory of Ramanscattering. J. Chem. Phys. 1979, 71, 4777−4788.(33) Jensen, L.; Zhao, L. L.; Autschbach, J.; Schatz, G. C. Theory andmethod for calculating resonance Raman scattering from resonancepolarizability derivatives. J. Chem. Phys. 2005, 123 (17), 174110.(34) Zhao, L. L.; Jensen, L.; Schatz, G. C. Pyridine-Ag20 cluster: Amodel system for studying surface-enhanced Raman scattering. J. Am.Chem. Soc. 2006, 128 (9), 2911−2919.(35) van Gisbergen, S. J. A.; Snijders, J. G.; Baerends, E. J.Application of time-dependent density functional response theory toRaman scattering. Chem. Phys. Lett. 1996, 259, 599.(36) van Gisbergen, S. J. A.; Snijders, J. G.; Baerends, E. J.Implementation of time-dependent density functional response.Comput. Phys. Commun. 1999, 118 (2−3), 119−138.(37) Aquino, F. W.; Schatz, G. C. Time-dependent density functionalmethods for Raman spectra in open-shell systems. J. Phys. Chem. A2014, 118, 517−525.(38) Petrenko, T.; Neese, F. Analysis and prediction of absorptionband shapes, fluorescence band shapes, resonance Raman intensities,and excitation profiles using the time-dependent theory of electronicspectroscopy. J. Chem. Phys. 2007, 127, 164319/1−164319/15.(39) Rava, R. P.; Spiro, T. G. Resonance enhancement in theultraviolet Raman spectra of aromatic amino acids. J. Phys. Chem. 1985,89, 1856−1861.(40) Fodor, S. P. A.; Copeland, R. A.; Grygon, C. A.; Spiro, T. G.Deep-ultraviolet Raman excitation profiles and vibronic scatteringmechanisms of phenylalanine, tyrosine, and tryptophan. J. Am. Chem.Soc. 1989, 111 (15), 5509−5518.
The Journal of Physical Chemistry A Article
dx.doi.org/10.1021/jp506948h | J. Phys. Chem. A 2014, 118, 9675−96869685

(41) Ludwig, M.; Asher, S. A. Ultraviolet resonance raman excitationprofiles of tyrosine: Dependence of Raman cross sections on excited-state intermediates. J. Am. Chem. Soc. 1988, 110 (4), 1005.(42) Asher, S. A.; Ludwig, M.; Johnson, C. R. UV Resonance Ramanexcitation profiles of the aromatic amino acids. J. Am. Chem. Soc. 1986,108, 3186−3197.(43) Dudik, J. M.; Johnson, C. R.; Asher, S. A. Wavelengthdependence of the preresonance Raman cross-sections of CH3CN,SO4
2−, ClO4−, and NO3
−. J. Chem. Phys. 1985, 82 (4), 1732−1740.(44) Emmons, E. D.; Tripathi, A.; Guicheteau, J. A.; Fountain, A. W.;Christesen, S. D. Ultraviolet resonance Raman spectroscopy ofexplosives in solution and the solid state. J. Phys. Chem. A 2013, 117(20), 4158−4166.(45) Becke, A. D. Density-functional thermochemistry. III. The roleof exact exchange. J. Chem. Phys. 1993, 98, 5648−5652.(46) Weigend, F.; Ahlrichs, R. Balanced basis sets of split valence,triple zeta valence and quadruple zeta valence quality for H to Rn:Design and assessment of accuracy. Phys. Chem. Chem. Phys. 2005, 7,3297−3305.(47) Klamt, A.; Schueuermann, G. COSMO: A new approach todielectric screening in solvents with explicit expressions for thescreening energy and its gradient. J. Chem. Soc., Perkin Trans. 2 1993,799−805.(48) Furche, F.; Rappoport, D. Density functional methods forexcited states: Equilibrium structure and electronic spectra. Theor.Comput. Chem. 2005, 16, 93−128.(49) Bauernschmitt, R.; Ahlrichs, R. Treatment of electronicexcitations within the adiabatic approximation of time dependentdensity functional theory. Chem. Phys. Lett. 1996, 256, 454−464.(50) Furche, F.; Ahlrichs, R. Adiabatic time-dependent densityfunctional methods for excited state properties. J. Chem. Phys. 2002,117, 7433−7447.(51) TURBOMOLE V6.5 2013, a development of the University ofKarlsruhe and Forschungszentrum Karlsruhe GmbH, 1989−2007.http://www.turbomole.com (2013).(52) Furche, F.; Ahlrichs, R.; Haettig, C.; Klopper, W.; Sierka, M.;Weigend, F. Turbomole.Wiley Interdiscip. Rev.: Comput. Mol. Sci. 2014,4, 91−100.(53) Perdew, J. P. Erratum: Density-functional approximation for thecorrelation energy of the inhomogeneous electron gas. Phys. Rev. B1986, 34, 7406.(54) Perdew, J. P. Density-functional approximation for thecorrelation energy of the inhomogeneous electron gas. Phys. Rev. B1986, 33, 8822(R).(55) Becke, A. D. Density-functional exchange-energy approximationwith correct asymptotic behavior. Phys. Rev. A 1988, 38, 3098−3100.(56) Van Lenthe, E.; Baerends, E. J. Optimized Slater-type basis setsfor the elements 1−118. J. Comput. Chem. 2003, 24, 1142−1156.(57) Pace, C. N.; Vajdos, F.; Fee, L.; Grimsley, G.; Gray, T. How tomeasure and predict the molar absorption coefficient of a protein.Protein Sci. 1995, 4, 2411−2423.
The Journal of Physical Chemistry A Article
dx.doi.org/10.1021/jp506948h | J. Phys. Chem. A 2014, 118, 9675−96869686