Stakeholder Perspectives about Marine Oil Spill Response Objectives: A Comparative Q Study of Four...
13
Stakeholder Perspectives about Marine Oil Spill Response Objectives: A Comparative Q Study of Four Regions Seth Tuler and Thomas Webler Social and Environmental Research Institute Inc., 278 Main Street, Suite 404, Greenfield, MA 01301, USA. E-mails: [email protected], [email protected] Marine oil spills can cause major social, economic, and ecological disruptions. Spill response managers must weigh different options and objectives when deciding what to do. We investigated the ways in which preferences for spill response objectives vary among those who are responsible for oil spill contingency planning and response in Buzzards Bay, Delaware Bay, San Francisco Bay, and Washington State regions. We begin this paper with a discussion of the research method used in the study: the Q method. In Buzzards Bay, Delaware Bay, and San Francisco Bay three perspectives were identified in each case. In Washington State, two perspectives were identified. An analysis of the 11 case-specific perspectives reveals that they can be described by four ‘composite’ perspectives that describe how different stakeholders prioritize spill response objectives. These four perspectives are compared on several themes, including the emphasis they placed on mitigating economic impacts, protecting health and safety, mitigating ecolo- gical impacts, implementing a coordinated and timely response, addressing the needs and concerns of the affected public/communities, gaining public support for the response, mitigating cultural impacts, and mitigating social nuisance impacts. The implications for spill response planning and spill response evaluation are discussed. 1. Introduction M arine oil spills can cause major social, economic, and ecological disruptions. Recent experience with spills in the Mississippi River 1 and San Francisco Bay 2 underscores the point that even relatively small spills can result in significant impacts. As part of ongoing efforts to improve national, state, and local oil spill preparedness, extensive planning and coordinating ef- forts have been undertaken since the 1980s, culminating in the creation of the National Response Plan (NRP). In the case of oil spills, the NRP ‘describes the lead coordination roles, the division and specification of responsibilities among Federal agencies under antici- pated crisis scenarios and the national, regional, and onsite response organizations, personnel, and re- sources that may be used to support response actions’ (DHS, 2004, see also Caudle, 2005). Various approaches have been proposed to assess the quality of contingency plans, using expert input about the appropriate criteria and measures to use (Haynes & Ott, 2001; Abordaif, Harrald, & Mazzuchi, 1995; Harrald & Mazzuchi, 1993). The question of how best to assess response successes and shortcom- ings after actual events has received more limited atten- tion among planners (Kuchin & Hereth, 1999; Lindstedt-Siva, 1999). However, systematic assessment of contingency plans and evaluation of spill response performance are not easy tasks. First, establishing a baseline context to measure the effectiveness & 2009 Blackwell Publishing Ltd. Journal of Contingencies and Crisis Management Volume 17 Number 2 June 2009
Transcript of Stakeholder Perspectives about Marine Oil Spill Response Objectives: A Comparative Q Study of Four...

Stakeholder Perspectives aboutMarine Oil Spill ResponseObjectives: A ComparativeQ Study of Four Regions
Seth Tuler and Thomas Webler
Social and Environmental Research Institute Inc., 278 Main Street, Suite 404, Greenfield, MA 01301, USA.E-mails: [email protected], [email protected]
Marine oil spills can cause major social, economic, and ecological disruptions. Spill
response managers must weigh different options and objectives when deciding what to
do. We investigated the ways in which preferences for spill response objectives vary
among those who are responsible for oil spill contingency planning and response in
Buzzards Bay, Delaware Bay, San Francisco Bay, and Washington State regions. We begin
this paper with a discussion of the research method used in the study: the Q method. In
Buzzards Bay, Delaware Bay, and San Francisco Bay three perspectives were identified in
each case. In Washington State, two perspectives were identified. An analysis of the 11
case-specific perspectives reveals that they can be described by four ‘composite’
perspectives that describe how different stakeholders prioritize spill response objectives.
These four perspectives are compared on several themes, including the emphasis they
placed on mitigating economic impacts, protecting health and safety, mitigating ecolo-
gical impacts, implementing a coordinated and timely response, addressing the needs
and concerns of the affected public/communities, gaining public support for the response,
mitigating cultural impacts, and mitigating social nuisance impacts. The implications for
spill response planning and spill response evaluation are discussed.
1. Introduction
Marine oil spills can cause major social, economic,
and ecological disruptions. Recent experience
with spills in the Mississippi River1 and San Francisco
Bay2 underscores the point that even relatively small
spills can result in significant impacts. As part of ongoing
efforts to improve national, state, and local oil spill
preparedness, extensive planning and coordinating ef-
forts have been undertaken since the 1980s, culminating
in the creation of the National Response Plan (NRP). In
the case of oil spills, the NRP ‘describes the lead
coordination roles, the division and specification of
responsibilities among Federal agencies under antici-
pated crisis scenarios and the national, regional, and
onsite response organizations, personnel, and re-
sources that may be used to support response actions’
(DHS, 2004, see also Caudle, 2005).
Various approaches have been proposed to assess
the quality of contingency plans, using expert input
about the appropriate criteria and measures to use
(Haynes & Ott, 2001; Abordaif, Harrald, & Mazzuchi,
1995; Harrald & Mazzuchi, 1993). The question of
how best to assess response successes and shortcom-
ings after actual events has received more limited atten-
tion among planners (Kuchin & Hereth, 1999;
Lindstedt-Siva, 1999). However, systematic assessment
of contingency plans and evaluation of spill response
performance are not easy tasks. First, establishing
a baseline context to measure the effectiveness
& 2009 Blackwell Publishing Ltd.
Journal of Contingencies and Crisis Management Volume 17 Number 2 June 2009

of a response is extremely challenging (Grabowski
et al., 1997). Second, while there may be a general
agreement about the over-arching goals for spill re-
sponse, the objectives that define these goals in specific
incidents may vary and their relative priority may vary –
from spill to spill and among those with a stake in the
spill response (Abordaif et al., 1995; Lindstedt-Siva,
1999).
We investigated the ways in which preferences for
spill response objectives vary among those who are
responsible for planning and response in four regions:
Buzzards Bay (MA), Delaware Bay, San Francisco Bay,
and Washington State. We begin this paper with a
discussion of the research method used in the study.
This method allows the identification of perspectives
about the relative importance of spill response objec-
tives. An analysis of the case-specific perspectives
reveals that they can be described by four archetype
perspectives. These four perspectives are compared on
several themes, including the emphasis they placed on
mitigating economic impacts, protecting health and
safety, mitigating ecological impacts, implementing a
coordinated and timely response, addressing the needs
and concerns of the affected public/communities, gain-
ing public support for the response, mitigating cultural
impacts, and mitigating social nuisance impacts. We
conclude with a discussion of how understanding
competing perspectives can inform contingency plan-
ning and efforts to evaluate and learn from experience
with past spills.
2. Research methods
The purpose of this study was to identify perspectives
among diverse stakeholders about the objectives that
should drive oil spill response. Towards this end, we
used the Q method, which has been used to investigate
a variety of environmental and hazard management
issues (McKeown & Thomas, 1988; Niemeyer, Petts, &
Hobson, 2005; Tuler & Webler, 2006; Webler & Tuler,
2006). This is a type of discourse analysis that integrates
quantitative and qualitative analyses to understand, in
depth, the points of view on a subject that are present
in a population of interest. In this section, we describe
our choice of the four cases and our application of the
Q method.
We selected four regions to study for which marine
oil spills are a critical concern, and for which ecological
risk assessments had been recently completed (i.e.,
within the last several years) or there was recent
experience with an actual spill event. Ecological risk
assessment consensus workshops (ERA) have been
conducted in many regions of the United States (Aur-
and, Walko, & Pond, 2000; Walker, Scholz, Aurand,
Pond, & Clark, 2001). They are designed to enable
federal, state, and local spill managers, trustees, and
other stakeholders (e.g., local NGOs) to compare the
environmental risks of spill response options and
evaluate trade-offs. They typically involve three phases:
(1) problem formulation, in which stakeholders select
scenarios for further analysis,
(2) analysis, in which research is performed and data
are analysed to better characterize the scenarios,
and
(3) assessment and characterization of the ecological
risks associated with different response options for
the selected scenarios.
The four regional case studies were of
� Buzzards Bay, MA. Data for this case were gathered
from 12 individuals during July–September 2006. It
was chosen because the Bouchard-120 spill occurred
in this region during April 2003.
� San Francisco Bay. An ERA was completed for this
region in 2000. Data for this case were gathered
from 12 individuals during November 2006 (before
the Cosco Busan spill).
� Delaware Bay region. A spill caused by the Athos I
occurred during November 2004. An ERA was
conducted in 2006 (Aurand & Coelho, 2006a).
Data were gathered from 12 individuals during July
2007.
� Washington State. The Cape Flattery ERA was
conducted in 2005 (Aurand & Coelho, 2006b).
We call this the Washington state case study
because we asked people about their preferences
more broadly, not just in the Cape Flattery region.
The data for this case study were gathered during
September and October 2007. Thirteen people
participated in our study in this case.
In all of the cases, we selected individuals to partici-
pate in our research who
� have been actively involved in spill response plan-
ning and implementation;
� represented different institutional affiliations; and
� were likely to have different views about spill
response objectives.
In the Q method, researchers gain access to various
perspectives on a subject – what Q practitioners often
call ‘social perspectives’ – by having a small number of
people with different, but well-thought-out opinions,
sort a group of statements according to their personal
opinions (Webler, Tuler, & Danielson, 2009). Partici-
pants in our case study were handed a set of small cards
(about the size of a normal business card). Each card
had a statement printed upon it that described a single
objective that might be important to a spill response.
The statements sorted by the participants were
chosen to represent the fullest possible extent of
96 Seth Tuler and Thomas Webler
Journal of Contingencies and Crisis Management
Volume 17 Number 2 June 2009 & 2009 Blackwell Publishing Ltd.
content relative to the topic. As part of our earlier
work, we identified objectives from two sources. First,
we reviewed the relevant literature (e.g., Baker, 1999;
Kuchin & Hereth, 1999; Ornitz & Champ, 2002; Pond,
Aurand, & Kraly, 2000; USCG, 2005). Second, two case
studies of spill responses (Tuler, Seager, Kay, & Linkov,
2007):
� The Bouchard-120 spill occurred on 27 April 2003.
Approximately 98,000 gallons of No. 6 home heat-
ing fuel oil were spilled just at the entrance to
Buzzards Bay, MA.3
� The Chalk Point spill occurred on 7 April 2000,
when an intrastate pipeline that transports oil to
the Potomac Electric Power Company’s Chalk Point
electrical generating facility in Prince George’s
County released approximately 140,000 gallons of
No. 2 and No. 6 home heating fuel oil into Swanson
Creek and subsequently into the Patuxent River.
The spill has been recorded as the worst environ-
mental disaster in Maryland’s history affecting wild-
life, natural resources, and property owners.4
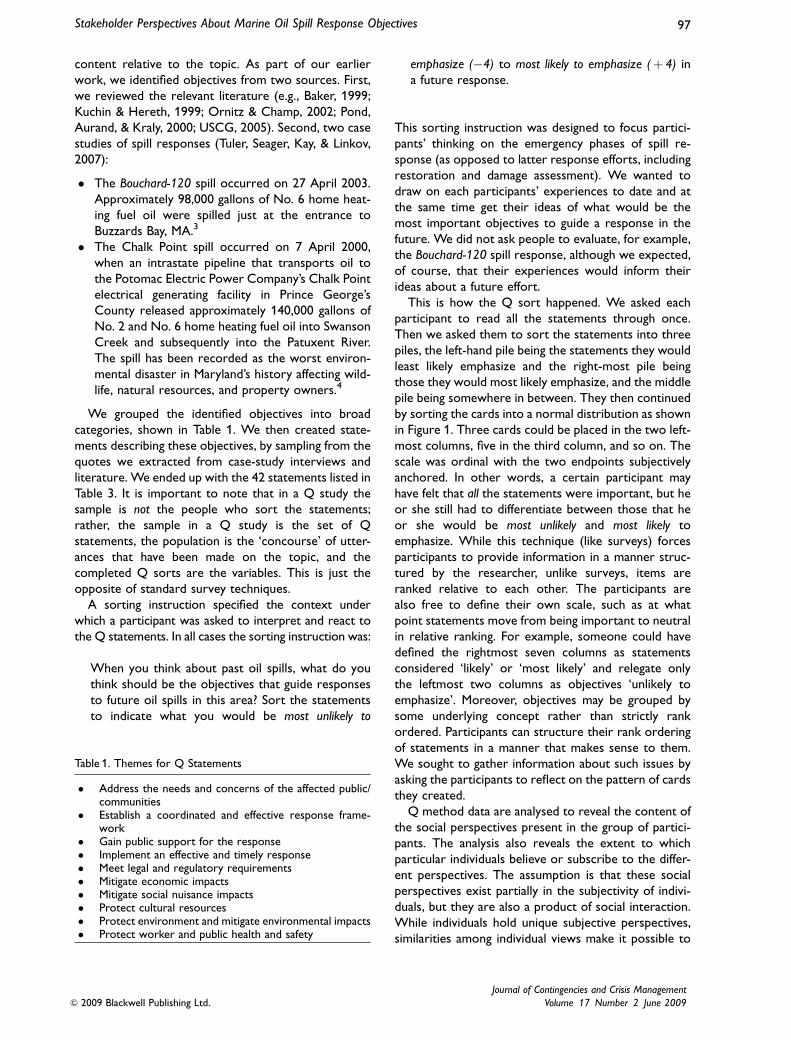
We grouped the identified objectives into broad
categories, shown in Table 1. We then created state-
ments describing these objectives, by sampling from the
quotes we extracted from case-study interviews and
literature. We ended up with the 42 statements listed in
Table 3. It is important to note that in a Q study the
sample is not the people who sort the statements;
rather, the sample in a Q study is the set of Q
statements, the population is the ‘concourse’ of utter-
ances that have been made on the topic, and the
completed Q sorts are the variables. This is just the
opposite of standard survey techniques.
A sorting instruction specified the context under
which a participant was asked to interpret and react to
the Q statements. In all cases the sorting instruction was:
When you think about past oil spills, what do you
think should be the objectives that guide responses
to future oil spills in this area? Sort the statements
to indicate what you would be most unlikely to
emphasize (�4) to most likely to emphasize (þ 4) in
a future response.
This sorting instruction was designed to focus partici-
pants’ thinking on the emergency phases of spill re-
sponse (as opposed to latter response efforts, including
restoration and damage assessment). We wanted to
draw on each participants’ experiences to date and at
the same time get their ideas of what would be the
most important objectives to guide a response in the
future. We did not ask people to evaluate, for example,
the Bouchard-120 spill response, although we expected,
of course, that their experiences would inform their
ideas about a future effort.
This is how the Q sort happened. We asked each
participant to read all the statements through once.
Then we asked them to sort the statements into three
piles, the left-hand pile being the statements they would
least likely emphasize and the right-most pile being
those they would most likely emphasize, and the middle
pile being somewhere in between. They then continued
by sorting the cards into a normal distribution as shown
in Figure 1. Three cards could be placed in the two left-
most columns, five in the third column, and so on. The
scale was ordinal with the two endpoints subjectively
anchored. In other words, a certain participant may
have felt that all the statements were important, but he
or she still had to differentiate between those that he
or she would be most unlikely and most likely to
emphasize. While this technique (like surveys) forces
participants to provide information in a manner struc-
tured by the researcher, unlike surveys, items are
ranked relative to each other. The participants are
also free to define their own scale, such as at what
point statements move from being important to neutral
in relative ranking. For example, someone could have
defined the rightmost seven columns as statements
considered ‘likely’ or ‘most likely’ and relegate only
the leftmost two columns as objectives ‘unlikely to
emphasize’. Moreover, objectives may be grouped by
some underlying concept rather than strictly rank
ordered. Participants can structure their rank ordering
of statements in a manner that makes sense to them.
We sought to gather information about such issues by
asking the participants to reflect on the pattern of cards
they created.
Q method data are analysed to reveal the content of
the social perspectives present in the group of partici-
pants. The analysis also reveals the extent to which
particular individuals believe or subscribe to the differ-
ent perspectives. The assumption is that these social
perspectives exist partially in the subjectivity of indivi-
duals, but they are also a product of social interaction.
While individuals hold unique subjective perspectives,
similarities among individual views make it possible to
Table 1. Themes for Q Statements
� Address the needs and concerns of the affected public/communities
� Establish a coordinated and effective response frame-work
� Gain public support for the response� Implement an effective and timely response� Meet legal and regulatory requirements� Mitigate economic impacts� Mitigate social nuisance impacts� Protect cultural resources� Protect environment and mitigate environmental impacts� Protect worker and public health and safety
Stakeholder Perspectives About Marine Oil Spill Response Objectives 97
& 2009 Blackwell Publishing Ltd.
Journal of Contingencies and Crisis Management
Volume 17 Number 2 June 2009

articulate a small number of archetype social perspec-
tives on a topic.
We arrive at the meaning of each of the social
perspectives by following two basic steps. First, we
enter Q sort data into a computer program called
MQMethod (this freeware program is available at http://
www.qmethod.org). This program computes a correla-
tional matrix among all the Q statements across sorts
and also factor analyses the results. Factor solutions are
expressed as idealized Q sorts, or social perspectives.
The researchers represent each factor as a short
narrative. Second, we asked the participant to interpret
their sort and to explain how he or she interpreted
specific Q statements. We used these comments to
help interpret the statistical output when composing
the perspective narratives.
Factor analysis lies at the heart of the Q method. A
factor analysis is a way of identifying a handful of
underlying variables that account for changes among a
much larger group of measured variables. In each of the
cases, the factor analysis reduced the complexity to
two or three perspectives, which are represented as
specific Q sorts. These represent ‘ideal types’ because
they are not necessarily held by any individual, but are
generated by studying the commonalities and differ-
ences among the sorts. Typically, the analysis reveals
that each individual contributes significantly to shaping
one perspective and has a minor influence over other
perspectives. Occasionally, an individual may signifi-
cantly shape two perspectives. The degree to which
an individual’s beliefs share features with a perspective
is represented by ‘factor loading scores’. A þ 1.00
indicates that a participant’s sort exactly matched the
factor, a 0 means there were no similarities at all, and a
�1.00 indicates that a participant’s sort was the exact
opposite of the factor sort.
The results obtained via the Q method depend
heavily on the statements included in the Q sorts. If
researchers do not include relevant and important
statements about the topic of interest, people may
not be able to express their specific points of view –
which may result in important social perspectives
remaining hidden from view. Our four case studies
provide some evidence that our 42 Q statements were
adequate. Here ‘adequate’ means that the statements
include the full range of objectives that stakeholders
might believe are important for the emergency phases
of oil spill response. To ensure the adequacy of our Q
statements, we asked individuals whether there were
any important objectives missing from the set of state-
ments. In the Buzzards Bay case three gaps in the
statements were suggested: (1) the importance of
meeting policy and regulatory requirements, (2) ad-
dressing the political aspect of response, and (3) getting
an estimate or a number (during the response) of the
amount of oil that hit the shoreline, so that this could
inform damage assessment later. In no other case did
any participant suggest additional objectives/considera-
tions that should have been included in the set of
statements.
To begin our analysis, we analysed the Q sorts from
each case separately (Tuler, Webler, & Kay, 2008
provides more details about the case-specific results).
In each case study, our analysis yielded two or three
factors/perspectives. We then treated each of these as
a single Q sort and analysed them as a group because
we wanted to investigate the similarities and differences
across case studies. In the jargon of the Q method, this
is called a ‘second-order composite analysis’. It is
second order, because it takes as input the factors/
perspectives from the first-order analysis. It is compo-
site because it uses all the project data.
3 3 5 6 8 6 5 3 3
(Number of statements per column)
Most unlikely to emphasize (–4) Most likely to emphasize (+4)
Figure 1. Layout for Q sort cards.
98 Seth Tuler and Thomas Webler
Journal of Contingencies and Crisis Management
Volume 17 Number 2 June 2009 & 2009 Blackwell Publishing Ltd.

3. Four archetype perspectives on oilspill response
Four second-order composite factors emerged from
our analysis, which represent four perspectives about
the objectives that should guide oil spill response (Table
2). The results show that Perspectives W and Y were
found in each one of the cases. Perspective X, however,
was only found in the Buzzards Bay and Delaware Bay
cases. Perspective Z was only found in San Francisco
Bay and Delaware Bay cases. Table 3 shows how each Q
statement is ranked in each of the four second-order
factors/perspectives.
The narrative descriptions of the perspective repre-
sented by each factor are:
Perspective W: Implement a rapid, coordinated response
guided by the contingency plan and gain public trust.
Perspective W prefers a response that is guided by
the contingency plan and swiftly implements a highly
coordinated response effort. This requires that local
Table 2. Second-Order Composite Factor Loading Scores for the Cross-Case Analysis
Case-specific perspective
Archetype perspectives (second-order factors)
Perspective W Perspective X Perspective Y Perspective Z
Buzzards Bay A .76 .12 .36 .34Buzzards Bay B .23 .10 .83 .03Buzzards Bay C .14 .80 .06 .24San Francisco D .65 .03 .64 .33San Francisco E .09 .33 �.06 .83San Francisco F �.03 .32 .79 �.19Delaware Bay J .85 .06 .38 .13Delaware Bay K .17 .80 .31 .10Delaware Bay L .37 .03 .63 .56Washington M .53 .10 .73 .28Washington N .85 .36 �.09 �.10% variance explained 27% 15% 27% 13%
Bold font indicates significance at the .05 level.
Table 3. Factor Array for Archetype Perspectives (Second-Order Composite Factors)
StatementPerspectiveW
PerspectiveX
PerspectiveY
PerspectiveZ
1. Economic impacts to towns from costs of cleanup should be mitigated �1 �2 0 02. Consumption of contaminated seafood should be prevented 0 �1 2 23. Get on with response efforts early for areas that have been pre-
identified as sensitive areas 3 1 3 04. Even if a species is not native to this area, mitigate impacts to the local
population �3 �1 �4 �15. When faced with a spill, it is most important to protect the adults of a
species at risk because the adults can come back next year andreproduce �3 0 0 2
6. Give priority to protecting those areas that have multiple resourcevalues, like those that are undeveloped, pristine, and that provide forrecreation 1 4 0 0
7. Attention should be focused on protecting species that are especiallycritical for the functioning of an impacted ecosystem 1 4 3 4
8. Health and ecological impacts from cleanup activities should bemitigated 1 0 2 �1
9. The response should remove enough oil so that impacted species,habitats, and local communities can return to the way they werebefore the spill in a reasonable amount of time 0 3 2 3
10. Damage to cultural artefacts (e.g., shipwrecks) from oil and itscleanup should be prevented �2 �2 1 �1
11. Economic impacts from lost recreation should be mitigated �2 �1 0 �112. Inconveniences to local residents and tourists should be mitigated �3 �3 �1 �213. The economic impacts to local commercial fishermen should be
reduced, including impacts that might arise from people’s perceptions(for example, about shellfish tainting) 0 �1 1 4
Stakeholder Perspectives About Marine Oil Spill Response Objectives 99
& 2009 Blackwell Publishing Ltd.
Journal of Contingencies and Crisis Management
Volume 17 Number 2 June 2009

responders/leaders be integrated quickly into the effort,
coordination be established among key organizations and
agencies, a well-organized unified command with a clear
chain of command be established, and cleanup crews
getting on-sight rapidly. There is little emphasis given to
mitigating socially disruptive impacts (e.g., economic,
aesthetic), but those responsible for implementing the
response should inform the local community about the
Table 3. (Contd.)
StatementPerspectiveW
PerspectiveX
PerspectiveY
PerspectiveZ
14. There should be no situations that threaten human health whatsoeverduring the response 0 �4 4 �3
15. Costs to the responsible party resulting from the response should beminimized �4 �4 �4 �3
16. Getting cleanup contractors on-scene should ramp up quickly, even ifthere is uncertainty about how many gallons have been spilled 2 1 2 1
17. The cleanup should address aesthetic concerns – like oil stains onrocks �4 �3 �4 �3
18. Get a good estimate of the amount of oil spilled �1 1 0 219. Local responders/leaders should be integrated quickly into response
planning because of their knowledge of local conditions, resources,etc. 4 2 1 2
20. Coordination among participating government agencies, contractors,etc. should be established rapidly 4 0 1 1
21. Establish meaningful ways of involving volunteers in the response �1 0 �2 022. A well-organized unified command with a clear chain of command
should be established 4 1 4 323. A well-coordinated expert scientific effort should drive the gathering
of decision-relevant information, not public concerns and perceptions 1 2 �1 424. Implement the contingency plan 3 �2 3 �425. There should be no residual oil or buried oil that is going to show up
later �4 1 1 �426. Restoration planning should be tightly integrated with the response
effort so that decisions are based on future restoration needs �2 3 �2 027. As much on-water recovery and removal of oil as possible should be
achieved 0 2 4 �428. Conduct monitoring of response activities, such as booming, to
actually see whether things are working 2 4 2 129. Clear definitions of what counts as ‘clean’ should be used so that
there is a clear end-point �1 1 0 330. Tell members of the public about the things they want to know about 0 �4 �2 �231. Responders should listen to the publics’ concerns, even if they cannot
be addressed to their complete satisfaction 1 0 �2 �132. Unified Command should gain public support for the response effort 0 �2 �1 �133. Unified Command should develop and maintain trust with members
of the public 2 2 �3 �234. Efforts to communicate with and engage with the community should
be proactive and timely 3 1 0 035. Consistent and accurate information should be provided to the public 2 3 �1 �236. Response efforts should direct oil to a ‘sacrificial area’ – such as a
sandy cove that will be easier to cleanup than other, more rockyareas 0 �1 �3 1
37. Unified Command should reconcile the preferences and points ofviews of all parties about what impacts are important to avoid. �2 �1 �2 1
38. Unified Command should manage expectations about the cleanup sothat they are reasonable 1 �4 �1 2
39. Responsible authorities should assign flexible and experienced deci-sion makers – who can implement contingency plans right away andthen step back and ask ‘what do we need?’ 2 �3 0 0
40. Response efforts need to avoid disrupting the integrity and culture oflocal communities �2 �1 �3 0
41. Subsistence fishing and shellfishing areas should be protected �1 0 1 �242. Make determinations of ‘clean’ with relevant stakeholders, including
local residents �1 0 �1 1
100 Seth Tuler and Thomas Webler
Journal of Contingencies and Crisis Management
Volume 17 Number 2 June 2009 & 2009 Blackwell Publishing Ltd.

response effort. They should do this in a way that both
enhances trust and manages expectations about what the
response can actually accomplish.
Perspective X: Protect ecological resources and gain
public trust.
Perspective X strongly emphasizes the importance of
mitigating adverse impacts to ecological resources that
may be impacted from the spill. Primary attention
should be paid to protecting those areas serving multi-
ple purposes or values or that are especially critical for
the functioning of an impacted ecosystem. The re-
sponse should be driven by long-term thinking, making
sure that recovery and restoration of impacted resources
will be promoted. Given the goal of protecting ecolo-
gical systems, it is vitally important to monitor response
efforts to ensure they are getting the job done. Unlike
Perspective W, following the contingency plan is not as
important as having a response be driven by a well-
coordinated expert scientific effort that gathers deci-
sion-relevant information. Like Perspective W, accurate
and timely information should be provided to the public
and trust should be developed with them, but there is
little emphasis given to mitigating socially disruptive
impacts (e.g., economic, aesthetic).
Perspective Y: Protect human health and safety by
implementing a rapid, coordinated response guided by
the contingency plan.
Perspective Y emphasizes many of the same features
for a good response as Perspective W: implement the
contingency plan, set up a clear chain of command, get
cleanup crews on-site rapidly. Like Perspective X, it
emphasizes the need to monitor the effectiveness of
response actions and protect important ecological
resources. But these are important so as to ensure
that the health and safety of individuals are protected.
Statements ranked more highly in here than in other
perspectives include avoiding situations that could
threaten health, lead to the consumption of contami-
nated seafood, cause additional harm from cleanup
activities, or harm subsistence fishing. Towards this
end, the response should be focused on recovery and
removal of oil offshore before it has a chance to impact
important local resources.
Perspective Z: Protect human communities using high-
quality information to support decision-making.
Perspective Z emphasizes the protection of human
communities and ecological resources. Alone among all
the perspectives, this view emphasizes that economic
impacts to local commercial fishermen should be
reduced, including impacts that might arise from peo-
ple’s perceptions (e.g., about shellfish tainting). In addi-
tion, consumption of contaminated seafood should be
prevented because this could significantly impact the
local fishing sector. The emphasis on community and
the local economy is different from the focus on
individuals’ health and safety, which receives rather
weak attention in this perspective (e.g., protection of
subsistence fishing areas). This view is distinguished from
Perspective Y because following the contingency plan is
not as important as having a response be driven by a
well-coordinated expert scientific effort that gathers
decision-relevant information. Good decision-making
requires good information (e.g., accurate estimate of
the amount of oil spilled) and clear definitions (e.g.,
about endpoints and what constitutes ‘clean’).
4. Comparison of archetypeperspectives
For each category of statements listed in Table 1, we
created an index. For each category we summed the Z-
scores of the statements included in the index and
divided by the number of statements comprising the
index. Z-scores are a relative measure of the impor-
tance of a statement in a factor/perspective. The indices
reveal the relative importance of a particular category
of objectives – or theme – across the four perspectives.
The values of each index for the archetype perspectives
are shown in Table 4 (in the following discussion
statements from Table 3 are referred to by the state-
ments numbers in parentheses).
4.1. Mitigate economic impacts
This index comprises three statements that address the
costs of cleanup, losses to the recreation sub-sector,
and losses to commercial fishing. Statement #15 about
costs to the responsible party was ranked consistently
very low. Because it was a consensus statement (there
was no variation across the factors), this statement
does not help distinguish the perspectives and is not
included in this index.
Economic costs were not a major theme in any of the
perspectives, except for one. Perspective Z stands out
for expressing the strongest, but still modest level of
concern about the economic impacts that may affect
local businesses and communities. Here the score is
completely driven by statement 13, mitigating economic
impacts to fishermen.
Perspective Z is only found in San Francisco and
Delaware Bay. In San Francisco, it is associated with
Perspective E, which emphasized mitigation of long-
term impacts to ‘foundational’ components of the
Stakeholder Perspectives About Marine Oil Spill Response Objectives 101
& 2009 Blackwell Publishing Ltd.
Journal of Contingencies and Crisis Management
Volume 17 Number 2 June 2009

human-environment system, including fisheries and
markets.
There is a remarkable parallel to a perspective in
Delaware Bay, Perspective L, which emphasizes the
need for a coordinated response supported by scien-
tific expertise that focuses on the protection of health
and safety and the long-term integrity of affected
ecosystems.
4.2. Protect health and safety
The index related to health and safety is based on
statements 2, 8, 14, and 41. These include direct threats
to people during the cleanup and indirect threats via
consumption of contaminated seafood (e.g., subsistence
fishing). Perspective Y placed the strongest emphasis on
this theme. It ranked every one of these statements
stronger than did the other perspectives.
Perspectives that emphasized health and safety were
found in Buzzards Bay (B), Delaware Bay (L), and
Washington State (M), suggesting that this is a widely
important, although not universal theme. One tricky
aspect of this theme is statement 14. This statement
asserts, unconditionally, that there should be no condi-
tions that threaten human health. In some case-specific
perspectives, this statement was ranked low sometimes,
not because people think safety is unimportant, but
because they felt that zero risk is unobtainable.
4.3. Mitigate ecological impacts
The index for ecological impacts is based on several
different ideas: setting priorities (5, 6, 7), mitigation (8),
initiation of action (3), and removing oil (9). Three of
the four perspectives gave this index strong emphasis. It
is not strongly emphasized in Perspective W, which is
defined by San Francisco D and Washington State M
case-specific perspectives. All three perspectives that
ranked this theme significant pointed to protecting
critical species (7) and removing oil so that ecosystem
functions are restored (9).
Addressing ecological impacts is especially important
to Perspective X. This gave high scores to setting
priorities to protect ecological resources, mitigation,
initiation of protective activities, and getting oil out of
the water. Statement #5 about focusing on saving adults
of a species was somewhat controversial. The low
score given to this by Perspective X reflects a disagree-
ment about the ecological justification for doing this.
4.4. Establish a coordinated response
Objectives related to establishing and implementing a
coordinated response were emphasized in many of the
case-specific perspectives. Although the index scores
are moderate in the second-order composite factors
associated with each perspective, there is widespread
agreement about the importance of establishing a
coordinated response. For example, there was often
strong emphasis given to establishing a well-organized
unified command with a clear chain of command (22).
On the other hand, there were important differences
among the perspectives within and across the cases on
other objectives. First, Perspectives W and Y strongly
emphasize implementing the contingency plan (24)
while Perspectives X and Z de-emphasize this objective.
Instead, Perspectives X and Z strongly emphasize
establishing a well-coordinated expert scientific effort
that drives the gathering of decision-relevant informa-
tion (23). Perspectives W and Y give slight emphasis to
this objective.
4.5. Implement a timely response
An associated index consists of statements related to
implementing a timely response. Some considerations
related to implementing a timely response turned out
to be important to all perspectives, such as integrating
Table 4. Index Scores for Each Archetype Perspective
PerspectiveW
PerspectiveX
PerspectiveY
PerspectiveZ
Economic impacts index score (statements 1, 11, and 13) �1.40 �1.54 �.14 1.35Health and safety risks index score (statements 2, 8, 14, and 41) �.05 �1.54 4.22 �1.80Ecological impacts index score (statements 3, 5, 6, 7, 8, and 9) .52 5.58 3.62 4.05Establish coordinated response index score (statements 22, 23,24, 26, 28, 29, and 39) 3.07 2.31 2.46 3.15Implement timely response index score (statements 3, 16, 19,and 20) 6.21 2.31 3.83 1.80Address community needs index score (statements 30, 31, 34,35, 37, 38, and 42) 1.86 �1.28 �4.39 �.45Public support and trust index score (statements 32, and 33) 1.10 .26 �1.71 �1.35Cultural impacts index score (statements 10, 40, and 41) �1.95 �1.79 �.53 �1.35Social nuisance impacts index score (statements 12 and 17) �2.85 �2.57 �2.29 �2.25
102 Seth Tuler and Thomas Webler
Journal of Contingencies and Crisis Management
Volume 17 Number 2 June 2009 & 2009 Blackwell Publishing Ltd.

local responders quickly (19). However, this theme was
rated very strongly by Perspective W. Perspective Z
ranks the objective of getting on with response efforts
early for areas that have been pre-identified as sensitive
areas (3) lowest among the four perspectives, which is
consistent with its lack of support for implementing the
contingency plan (24; this statement is part of the index
for establishing a coordinated response).
4.6. Address needs and concerns of the affectedpublic/communities
Addressing public concerns was almost always ranked
low. There were, however, some exceptions. In Per-
spective C from the Buzzards Bay case, it was very
important to ensure that consistent and accurate
information be provided to the public (32) and in San
Francisco Bay’s Perspective E it was important that
Unified Command manage expectations about the
cleanup so that they are reasonable (38). Perspective
N from Washington State strongly emphasizes a num-
ber of objectives related to public communications. In
general, the relative lack of emphasis on objectives
related to public opinion and public satisfaction stands
in contrast to the emphasis that they were given in
earlier work (Tuler et al., 2007) and in the literature
(e.g., Lindstedt-Siva, 1999).
This theme is not emphasized strongly in any of the
perspectives from the cross-case analysis. Perspective
W most strongly emphasizes this theme, although
weakly, while Perspective Z strongly de-emphasizes
this theme. In Perspective W, support is based on the
importance it places on proactive and timely efforts to
communicate with and engage with the community (34)
and providing consistent and accurate information to
the public (35). There is weak support for telling
members of the public about the things they want to
know about (30) in all factors. Perspective X rejects the
idea that Unified Command should manage expecta-
tions about the cleanup so that they are reasonable
(38), while Perspective Z supports it inspite of its low
overall rating for this theme.
4.7. Gaining public support and trust for theresponse
Perspective W also scores highest on the theme that
Unified Command should strive to gain public support
for the response effort, although the magnitude of the
score is zero, and so, comparatively, it is not a very
strongly emphasized theme. All other perspectives
ranked the statement about getting public support as
negative. It can be argued that gaining public support is
related to how well the public’s needs and concerns are
addressed, which helps to explain why both themes are
emphasized by the same perspective/factor. While
other perspectives rank some objectives related to
this theme highly, they do not give them the same
overall emphasis. Perspective X does not support
gaining public support for the response effort, but
stronger support for developing and maintaining trust
with the public. Both Perspectives Y and Z strongly
disagree with this objective.
4.8. Mitigate cultural impacts
Mitigating impacts to cultural resources was not very
salient in any case and it is not emphasized in any of the
four perspectives associated with the cross-case analy-
sis, as shown in Table 4. Statement 41 received mod-
erate support in Factor Y, and it is related to protecting
both health and cultural activities.
4.9. Mitigate social nuisance impacts
Two statements were related to objectives for reducing
the social nuisance impacts of oil spills:
12. Inconveniences to local residents and tourists
should be mitigated and
17. The cleanup should address aesthetic concerns,
such as oil stains on rocks.
Neither of these statements received much support
in the cross-case perspectives or in any of the case-
specific perspectives. These were not deemed impor-
tant objectives during the initial phases of a spill
response by those involved in our four case studies.
5. Discussion
Responses to marine oil spills necessarily involve a large
number of stakeholders. Federal officials from the
USCG and the USEPA, state environmental agency
personnel, and fire chiefs, harbourmasters, shellfish
wardens, and a host of other local government officials
need to coordinate their actions. The responsible party
and its contractors are also involved. Advocacy stake-
holders for environmental, business, and community
interests, as well as community residents, have vested
interests in the response and need to be consulted and
informed. With so many different kinds of people
involved the potential for conflicts about cleanup goals
and strategies is high.
Differences of opinion may arise over the response
goals, the objectives associated with each goal, and the
relative importance of the objectives. The context and
specifics of the spill also come into play. Spill impacts
and response strategies are determined by the char-
acteristics of the oil released, the weather, the location
Stakeholder Perspectives About Marine Oil Spill Response Objectives 103
& 2009 Blackwell Publishing Ltd.
Journal of Contingencies and Crisis Management
Volume 17 Number 2 June 2009

and timing of the release, and the kinds of resources in
harm’s way. Priorities for protection will vary with
seasonal changes in tourism and local economies.
When a spill occurs in the life cycle of sensitive species
will also determine how much priority should be
assigned to protective and remedial actions.
Our results show that people involved in oil spill
planning and response have different perspectives about
what objectives are most salient. This was true across
many different regions of the country and even within a
single case (Tuler et al., 2008). The four archetype
perspectives reported here reveal important similari-
ties and differences in the ways in which stakeholders
emphasize objectives associated with oil spill response.
For example, there were varying degrees of emphasis
on implementing the contingency plan, protecting eco-
logical resources, protecting public health and safety,
and interacting with the public. Abordaif et al. (1995)
and Lindstedt-Siva (1999) also found this to be the case.
We draw two conclusions from these findings that
can inform future oil spill response planning.
5.1. First, a small set of archetype perspectivesdescribe how a response effort should beimplemented
In our study involving 54 stakeholders in four diverse
regions that have experienced a range of spill events, we
found all four of these perspectives present. However, our
study does not allow us to remark on how widely held
these perspectives are within a population. First, the Q
method is not designed to gather data from a represen-
tative sample of individuals the way surveys do. Conse-
quently, we do not know whether community residents
had perspectives similar to the stakeholders we studied.
Second, although we endeavoured to include in our study
people with vastly different viewpoints, we may have
missed something. The relatively low priority given to
cultural resources may be an artefact of not including
more people with a concern about these resources.
Despite these qualifications, we have confidence in the
robustness of these findings because we gathered data
from a broad range of interested and engaged agency staff
and other stakeholders in four different sites across the
country. It seems likely that these perspectives would be
found in other regions as well.
5.2. Second, spill planners, managers, andresponders emphasize different componentsof contingency plans
Oil spill response contingency plans address issues of
human health and safety, the natural environment, eco-
nomic impact, public communication, stakeholder service
and support, and the quality and effectiveness of the
response organization. When people give different weight
to objectives, this can lead to them emphasizing different
aspects of a contingency plan. Our work provides addi-
tional empirical support for the claim made by others
‘that the elements of a contingency plan are of very
unequal importance’ (Abordaif et al., 1995), and elabo-
rates how they may rate relative to each other.
For example, we found that:
� No perspective rejected the need to convey infor-
mation to the public during a response, but they did
disagree about how much importance this activity
should get in the context of other pressing needs
(e.g., deploying cleanup crews). Perspective W
focused the most emphasis on this outcome.
� Each perspective emphasizes the need to mitigate
ecological impacts, but again, there are important
differences. For Perspective W, following the con-
tingency plan is thought to protect sensitive areas.
Perspectives X, Y, and Z emphasize other ways of
protecting sensitive species and habitats. For exam-
ple, Perspective Y protects the environment by
protecting local resource-based economic activities.
� Protection of health and safety is important for
all perspectives. While perspectives X and Z de-
emphasize the idea that ‘there should be no situa-
tions that threaten human health whatsoever during
the response’, we learned that many do not believe
all risk can be avoided by spill responders. By its
very nature, a spill response forces people into
situations that can threaten health. The imperative
for responders is to minimize the risks.
The four perspectives can be further distinguished by
the way they rank three particular statements (Table 5).
Two perspectives (W and Y) focus on implementing the
contingency plan. The other two perspectives (X and
Z) give negative scores to implementing the contin-
gency plan AND give positive emphasis to: obtaining a
Table 5. Comparison of Z Scores for Archetype Perspectives in Relation to Implementing the Contingency Plan vs. GatheringInformation to Inform Response Actions
Perspective W Perspective X Perspective Y Perspective Z
24. Implement the contingency plan 1.37 �1.03 1.23 �1.8018. Get a good estimate of the amount of oil spilled �.51 .51 .09 .9023. A well-coordinated expert scientific effort should drive
the gathering of decision-relevant information, notpublic concerns and perceptions .23 1.03 �.48 1.80
104 Seth Tuler and Thomas Webler
Journal of Contingencies and Crisis Management
Volume 17 Number 2 June 2009 & 2009 Blackwell Publishing Ltd.

good estimate of the amount of oil spilled (18) and
having a well-coordinated expert scientific effort, rather
than public concerns and perceptions, to drive the
gathering of decision-relevant information (23). Per-
spectives X and Y de-emphasize following the contin-
gency plan because they want to be very sensitive to the
specific, contextual features of a particular spill and
response. Thus, they emphasize the need for Unified
Command to be gathering decision-relevant informa-
tion in a timely way.
6. Conclusion: implications of findings forspill response planning and evaluation
We investigated how people involved with spill re-
sponse from varied organizations and government
agencies think about the objectives that should guide
responses to future oil spills. We used the same
research instrument in four locales: Buzzards Bay, San
Francisco Bay, Delaware Bay, and Washington State.
We identified the perspectives associated with spill
responders in each region, and then we assessed the
relationships among all of the perspectives. Generally
speaking, both the 11 case-specific and four cross-case
composite perspectives that emerged about oil spill
response objectives reflect the over-arching goals of oil
spill response as articulated in federal policy guidance:
(1) maintain safety of human life;
(2) stabilize the situation to preclude it from worsening
(e.g., through a well-run and rapid response that
seeks to remove oil before it reaches shore); and
(3) minimize adverse environmental and socioeco-
nomic impacts by coordinating all containment
and removal activities to carry out a timely, effec-
tive response.
This research also documents that there are impor-
tant differences about spill response objectives, a point
that has been made by others as well (e.g., Lindstedt-
Siva, 1999). Multiple perspectives about objectives were
identified in each of our cases. The second-order
composite analysis reveals important differences in
the ways in which people emphasize or define the goals
associated with oil spill response. While we have
proposed four archetype perspectives to describe
how a response effort should be implemented, they
necessarily reflect the views of those who participated
in our study. A different group of participants may have
revealed other perspectives or emphases. For example,
we did not study the viewpoints of the general public
and very few Native Americans participated in our
study. However, because these different perspectives
showed up nationwide, we believe these are significant.
These findings have implications for both spill re-
sponse planning and spill response evaluation. Our
findings point to a need for spill response managers
to pay close attention to building agreement about
objectives for spill response and for clarifying points of
agreement and disagreement among responders in
contingency planning. Following Alpaslan, Green, and
Mitroff’s (2008) discussion of a stakeholder theory of
crisis management in corporate governance, spill re-
sponse managers may benefit from adopting a more
broadly inclusive stakeholder model for spill response
planning, rather than a shareholder model wherein
participation is restricted to those with a legal and
regulatory responsibility (e.g., federal and state respon-
ders, trustees, and responsible parties). Such an ap-
proach is in line with the idea that contingency planning
and response evaluation should support development
of deeper understandings of agreements and differ-
ences to further consensus building.
Processes for spill response planning and evaluation
should be based on the following underlying principles.
First, the concerns of all stakeholders should be repre-
sented in the process. Second, the best available science
should guide deliberations and decisions. Third, an
atmosphere should be established that allows competing
preferences to be revealed and debated. Collaborative
planning has become a mainstay in many fields and it
should continue to mature in the area of oil spill
contingency planning. A wealth of advice exists to inform
and educate spill managers on how to clarify and work
through differences in perspective (Apostolakis & Pick-
ett, 1998; Arvai & Gregory, 2003; Bradbury, Branch, &
Malone, 2003; Daniels & Walker, 2001; Gregory &
Failing, 2002; National Research Council, 1996; Webler
& Tuler, 2008; Wood, Good, & Goodwin, 2002).
Finally, our work has implications for how spill
response evaluations are conducted. There are many
criteria on which judgements about the success or the
failure of a response can be made (Tuler et al., 2007).
Choices must be made about which criteria (or per-
formance metrics) are most relevant and meaningful.
Making these choices is not always easy, especially when
people disagree about what should be done. Just
because something can be measured does not mean
that it is relevant to the success of a spill response or
important to many stakeholders. The amount of boom
deployed is a case in point. By developing a clear
understanding of what matters most to people, better
systems can be devised for gathering relevant data that
will inform both response-related decision-making and
post-response assessments and evaluations. The critical
point is that in a context of competing perspectives and
uncertain knowledge, planning and evaluation should
respect the diversity of stakeholders’ opinions. Becom-
ing aware of stakeholder differences is but the first step
in a journey to build stronger plans out of the plurality
of the concerns, experiences, and knowledge of stake-
holders.
Stakeholder Perspectives About Marine Oil Spill Response Objectives 105
& 2009 Blackwell Publishing Ltd.
Journal of Contingencies and Crisis Management
Volume 17 Number 2 June 2009

1. See http://www.noaanews.noaa.gov/stories2008/20080724_
oilspill.html for a discussion of this spill.
2. See http://www.incidentnews.gov/incident/7708 for a dis-
cussion of this spill.
3. See http://www.darrp.noaa.gov/northeast/buzzard/index.
html
4. See http://www.darrp.noaa.gov/northeast/chalk_point/
index.html
References
Abordaif, F., Harrald, J. and Mazzuchi, T. (1995), ‘Evaluating Oil
Spill Contingency and Prevention Plans Using Measures of
Quality, Not Quantity’, Proceedings of the 1995 International
Oil Spill Conference, Washington, DC: American Petroleum
Institute.
Alpaslan, C., Green, D. and Mitroff, I. (2008), ‘Corporate
Governance in the Context of Crises: Towards a
Stakeholder Theory of Crisis Management’, Journal of
Contingencies and Crisis Management, Volume 17, Number
1, pp. 38–49.
Apostolakis, G.E. and Pickett, S.E. (1998), ‘Deliberation:
Integrating Analytical Results into Environmental Decisions
Involving Multiple Stakeholders’, Risk Analysis, Volume 18,
Number 5, pp. 621–634.
Arvai, J.L. and Gregory, R. (2003), ‘A Decision Focused
Approach for Identifying Cleanup Priorities at Contami-
nated Sites’, Environment, Science, and Technology, Volume 37,
pp. 1469–1476.
Aurand, D. and Coelho, G. (Compilers). (2006a), Ecological
Risk Assessment: Consensus Workshop. Environmental Trade-
offs Associated With Oil Spill Response Technologies. Delaware
Bay. A report to the US Coast Guard, Sector Delaware Bay,
Technical Report 06-01, Ecosystem Management & Associ-
ates Inc., Lusby, MD, 56pp.
Aurand, D. and Coelho, G. (Compilers). (2006b), Ecological
Risk Assessment Workshop: Environmental Tradeoffs Associated
With Oil Spill Response Technologies. Cape Flattery, Washing-
ton. A report to Regional Response Team X, Technical
Report 05-01, Ecosystem Management & Associates Inc.,
Lusby, MD, 32pp.
Aurand, D., Walko, L. and Pond, R. (2000), Developing
Consensus Ecological Risk Assessments: Environmental Protec-
tion In Oil Spill Response Planning A Guidebook, United States
Coast Guard, Washington, DC, 148pp.
Baker, J. (1999), ‘Ecological Effectiveness of Oil Spill Counter-
measures: How Clean is Clean?’, Pure Applied Chemistry,
Volume 71, Number 1, pp. 135–151.
Bradbury, J., Branch, K. and Malone, E. (2003), An Evaluation of
DOE-EM Public Participation Programs. Report Prepared for
the DOE Environmental Management Program (PNNL-
14200), Pacific Northwest National Laboratory, Washing-
ton, DC.
Caudle, S. (2005), ‘Homeland Security Capabilities-Based Plan-
ning: Lessons from the Defense Community’, Homeland
Security Affairs, Volume 1, Number 2, Article 2. http://
www.hasj.org/hsa.
Daniels, S. and Walker, G. (2001), Working Through Environ-
mental Conflict: The Collaborative Learning Approach, Praeger,
New York.
DHS (2004), Capabilities-Based Planning: Overview. DHS/SLGCP/
OPIA/Policy and Planning Branch, Department of Home-
land Security, Washington, DC. http://www.scd.state.hi.us/
grant_docs/Capabilities_Based_Planning_Overview_12_17.
pdf (accessed 30 March 2007).
Grabowski, M.R., Harrald, J.H. and Roberts, K.H. (1997),
‘Decision Support and Organizational Forms in a High
Velocity Environment: Responses to Catastrophic Oil
Spills’, in Grabowski, M.R. and Wallace, W.A. (Eds),
Advances in expert systems for management, Vol. 2. JAI Press,
Greenwich.
Gregory, R. and Failing, L. (2002), ‘Using Decision Analysis to
Encourage Sound Deliberation: Water Use Planning in
British Columbia, Canada’, Journal of Policy Analysis and
Management, Volume 21, Number 3, pp. 492–499.
Harrald, J. and Mazzuchi, T. (1993), ‘Planning for Success: A
Scenario-Based Approach to Contingency Planning Using
Expert Judgment’, Journal of Contingencies and Crisis Manage-
ment, Volume 1, Number 4, pp. 189–198.
Haynes, D. and Ott, G. (2001), Area Contingency Plan Scorecard:
Determining a Plan’s Ability to Achieve Critical Success Factors.
Paper Presented at the International Oil Spill Conference.
American Petroleum Institute, Washington, DC.
Kuchin, J. and Hereth, L. (1999), ‘Measuring Response: A
Balanced Response Scorecard for Evaluating Success’, Pro-
ceedings of the 1999 International Oil Spill Conference, Seattle,
WA, Washington, DC: American Petroleum Institute. pp.
685–690.
Lindstedt-Siva, J. (1999), Judging Oil Spill Response Performance:
The Challenge of Competing Perspectives. Issue Paper Pre-
sented at the 1999 International Oil Spill Conference,
Seattle, WA. Technical Report IOSC-008, American Petro-
leum Institute, Washington, DC.
McKeown, B. and Thomas, D. (1988), Q Methodology. Sage
University Paper Series on Quantitative Applications in the
Social Sciences 07-066, Sage, Beverly Hills, CA.
National Research Council (1996), Understanding Risk: Inform-
ing Decisions in a Democratic Society, National Academy
Press, Washington, DC.
Niemeyer, S., Petts, J. and Hobson, K. (2005), ‘Rapid Climate
Change and Society: Assessing Responses and Thresholds’,
Risk Analysis, Volume 25, Number 6, pp. 1443–1456.
Ornitz, B. and Champ, M. (2002), Oil Spill First Principles:
Prevention and Best Response, Elsevier, New York.
Pond, R., Aurand, D. and Kraly, J. (2000), Ecological Risk
Assessment Principles Applied to Oil Spill Response Planning in
the San Francisco Bay Area, California Office of Spill Preven-
tion and Response, Sacramento, CA.
Tuler, S., Seager, T., Kay, R. and Linkov, R. (2007), ‘The
Bouchard-120 and Chalk Point Oil Spill Responses: Objec-
tives and Performance Metrics’, in Linkov, I., Kiker, G. and
Wenning, R. (eds), Environmental Security in Harbors and
Coastal Areas, Springer, the Netherlands, pp. 175–191.
Tuler, S. and Webler, T. (2006), ‘Competing Perspectives on a
Process for Making Remediation and Stewardship Decisions
at the Rocky Flats Environmental Technology Site’, Research in
Social Problems and Public Policy, Volume 13, pp. 49–77.
Tuler, S., Webler, T. and Kay, R. (2008), Comparing stakeholders’
objectives for oil spill response: A Q study of four regions,
Technical report submitted to the Coastal Response
106 Seth Tuler and Thomas Webler
Journal of Contingencies and Crisis Management
Volume 17 Number 2 June 2009 & 2009 Blackwell Publishing Ltd.

Research Center, NOAA Grant number NA04NOS4
190063. Project number 05-983. Social and Environmental
Research Institute, Inc., Greenfield, MA. http://www.seri-us.
org/projects/oilspill.html.
USCG (2005), Long Island Sound Area Contingency Plan
DRAFT. http://www.uscg.mil/d1/units/seclis/acp/draft-acp.
html (accessed 19 December 2008).
Walker, A.H., Scholz, D., Aurand, D., Pond, R. and Clark, J.
(2001), Lessons Learned in Ecological Risk Assessment
Planning Efforts. Proceedings of the International Oil Spill
Conference, pp. 185–190.
Webler, T. and Tuler, S. (2006), ‘Four Perspectives on Public
Participation Process in Environmental Assessment and De-
cision Making: Combined Results from Ten Case Studies’,
Policy Studies Journal, Volume 34, Number 4, pp. 699–722.
Webler, T. and Tuler, S. (2008), ‘Organizing a Deliberative
Planning Process: What Does the Science Say?’, in Odug-
bemi, S. and Jacobson, T. (eds), Governance Reform Under
Real-World Conditions: Citizens, Stakeholders, and Voice, World
Bank, Washington, DC, pp. 125–160.
Webler, T., Tuler, S. and Danielson, S. (2009), Using Q Method
to Reveal Social Perspectives in Environmental Research. Report
number SERI 09-001. Social and Environmental Research
Institute, Greenfield, MA.
Wood, N., Good, J. and Goodwin, R. (2002), ‘Vulnerability
Assessment of a Port and Harbor Community to Earth-
quake and Tsunami Hazards: Integrating Technical Expert
and Stakeholder Input’, Natural Hazards Review, Volume 3,
Number 4, pp. 148–115.
Stakeholder Perspectives About Marine Oil Spill Response Objectives 107
& 2009 Blackwell Publishing Ltd.
Journal of Contingencies and Crisis Management
Volume 17 Number 2 June 2009