STAKEHOLDER MANAGEMENT AND THE INFLUENCE IN ...
132
UNIVERSIDADE NOVE DE JULHO PROGRAMA DE PÓS-GRADUAÇÃO EM ADMINISTRAÇÃO - PPGA ROGERIO ALVES SOARES STAKEHOLDER MANAGEMENT AND ITS INFLUENCE ON THE PERFORMANCE OF INFORMATION TECHNOLOGY PROJECTS São Paulo 2020
-
Upload
khangminh22 -
Category
Documents
-
view
1 -
download
0
Transcript of STAKEHOLDER MANAGEMENT AND THE INFLUENCE IN ...

UNIVERSIDADE NOVE DE JULHO
PROGRAMA DE PÓS-GRADUAÇÃO EM ADMINISTRAÇÃO - PPGA
ROGERIO ALVES SOARES
STAKEHOLDER MANAGEMENT AND ITS INFLUENCE ON THE
PERFORMANCE OF INFORMATION TECHNOLOGY PROJECTS
São Paulo
2020

Rogerio Alves Soares
GERENCIAMENTO DE PARTES INTERESSADAS E A INFLUÊNCIA NO
DESEMPENHO DE PROJETOS DE TECNOLOGIA DA INFORMAÇÃO
STAKEHOLDER MANAGEMENT AND ITS INFLUENCE ON THE
PERFORMANCE OF INFORMATION TECHNOLOGY PROJECTS
Tese apresentada ao Programa de Pós-Graduação em
Administração da Universidade Nove de Julho –
UNINOVE, como requisito parcial para obtenção do
grau de Doutor em Administração.
ORIENTADOR: PROF. DR. BENNY KRAMER
COSTA
São Paulo
2020

FICHA CATALOGRAFICA

STAKEHOLDER MANAGEMENT AND ITS INFLUENCE ON THE PERFORMANCE OF
INFORMATION TECHNOLOGY PROJECTS
POR
ROGERIO ALVES SOARES
Tese apresentada ao Programa de Pós-Graduação
em Administração - PPGA da Universidade Nove
de Julho – UNINOVE, como requisito parcial para
obtenção do título de Doutor em Administração,
sendo a banca examinadora formada por:
___________________________________________________________
Prof. Dr. Benny Kramer Costa – Universidade Nove de Julho – UNINOVE
___________________________________________________________
Profa. Dra. Marly Monteiro de Carvalho – Universidade São Paulo – USP
___________________________________________________________
Prof. Dr. Otávio Freire – Universidade São Paulo – USP
___________________________________________________________
Prof. Dr. Evandro Luiz Lopes – Universidade Nove de Julho – UNINOVE
___________________________________________________________
Prof. Dr. Roque Rabechini Jr. – Universidade Nove de Julho – UNINOVE
São Paulo, 04 de Dezembro de 2019.

DEDICATION
I dedicate this work to my wife Ana
Paula, my sons Rafael and Sofia
(in memorian). Your physical and
spiritual presence moves me with
each step.

ACKNOWLEDGMENTS
First, I want to thank God for my existence, my safe and perfect nature I received to execute
my work. I also thank all the spirituality for the opportunity on this existence, the inspiration,
and the positive vibrations.
I wish to express my deep appreciation to my advisor Professor Benny Kramer Costa, for
helping me in different ways in this journey. First, his posture was always giving me the
confidence to move on, even when I was utterly lost and thinking that I could not write a
thesis. Then as a friend giving me advice about how to balance studies, professional work,
and family life. The most important, as professor advisor sharing his knowledge, challenging
me for the best and improving myself.
I want to thank all my friends at Uninove that has an essential role in my academic life and in
this thesis. Thank you for all the time you have listened to me, helped me in different
manners. This journey was beautiful, aside from you.
I would also like to thank Univinove professors for excellent classes and knowledge you
transmit.

RESUMO
Nesta tese eu analiso e valido a relação do gerenciamento de partes interessadas com o
desempenho dos projetos de tecnologia da informação. Para isso, eu desenvolvo três estudos
sequenciais interconectados, sendo cada um deles com seu tema independente, método, coleta
de dados e análise dos resultados. No primeiro estudo realizo uma bibliometria sobre duas
décadas de estudos publicados sobre o tema gestão de partes interessadas, analisando área de
publicação, autores, coautores e principais clusters identificados. No segundo estudo investigo
o tema desempenho de projetos de tecnologia da informação (TI), realizando uma revisão
sistemática da literatura para identificar variáveis comprovadas empiracamente como
correlacionadas ao desempenho de projetos de TI e, identificar quais são as variáveis
utilizadas na literatura para se medir o construto desempenho de projetos de TI. No terceiro
estudo, investigo a moderação do engajamento das partes interessadas e da saliência das
partes interessadas, na relação entre atividades de gestão de projetos e o desempenho de
projetos de TI.
Palavras-chave: gerenciamento de partes interessadas, desempenho de projetos, engajamento
de partes interessadas, saliência de partes interessadas, gerenciamento de projetos de
tecnologia da informação

ABSTRACT
In this thesis, I am analyzing and validating the relationship between stakeholder management
and the performance of information technology (IT) projects. To this end, I develop three
interconnected, sequential studies, each with its independent theme, method, data collection,
and analysis of the results. In the first study, I am conducting a bibliometric analysis of two
decades of published studies about stakeholder management, analyzing the publication field,
authors, coauthors, and critical clusters. In the second study, I am investigating the topic of IT
project performance. Performing a systematic review to identify empirically validated
variables as correlated with IT project performance and to identify which variables are used in
the literature to measure the construct IT project performance. Thus, in the third study, I am
investigating the moderation role of stakeholder engagement and stakeholder salience in the
relation between project management activities and IT project performance.
Keywords: stakeholder management, project performance, stakeholder engagement,
stakeholder salience, information technology project management

SUMMARY
1 INTRODUCTION ................................................................................................... 13
1.1 RESEARCH PROBLEM .......................................................................................... 15
1.1.1 RESEARCH QUESTION ......................................................................................... 15
1.2 GOALS ...................................................................................................................... 16
1.2.1 GENERAL ................................................................................................................ 16
1.2.2 SPECIFICS ................................................................................................................ 16
1.3 STRUCTURE ............................................................................................................ 17
2 DEVELOPMENT .................................................................................................... 19
2.1 STUDY 1: STAKEHOLDERS AND PROJECT MANAGEMENT –
BIBLIOMETRIC ANALYSIS OF TWO DECADES OF PUBLICATIONS .......... 19
2.1.1 INTRODUCTION ..................................................................................................... 19
2.1.2 METHOD .................................................................................................................. 20
2.1.3 RESULTS .................................................................................................................. 23
2.1.4 CONCLUSIONS ....................................................................................................... 40
2.1.5 REFERENCES .......................................................................................................... 42
2.2 STUDY 2: INFORMATION TECHNOLOGY PROJECT PERFORMANCE:
WHAT HAS IMPACT ON RESULTS AND HOW SUCH IMPACT HAS BEEN
MEASURED ............................................................................................................. 50
2.2.1 INTRODUCTION ..................................................................................................... 50
2.2.2 LITERATURE REVIEW .......................................................................................... 52
2.2.3 METHOD .................................................................................................................. 54
2.2.4 RESULTS .................................................................................................................. 57
2.2.5 CONCLUSIONS ....................................................................................................... 67

2.2.6 REFERENCES .......................................................................................................... 67
2.3 STUDY 3: EFFECTS OF STAKEHOLDERS’ MANAGEMENT ON
INFORMATION TECHNOLOGY PROJECT RESULTS ....................................... 74
2.3.1 INTRODUCTION ..................................................................................................... 74
2.3.2 LITERATURE REVIEW .......................................................................................... 76
2.3.3 METHOD .................................................................................................................. 87
2.3.4 RESULTS .................................................................................................................. 91
2.3.5 DISCUSSIONS ....................................................................................................... 107
2.3.6 CONCLUSIONS ..................................................................................................... 111
2.3.7 REFERENCES ........................................................................................................ 113
3 DISCUSSIONS AND CONCLUSIONS .............................................................. 127
REFERENCES ..................................................................................................................... 130

TABLE INDEX
Table 1 - Collinearity statistics ................................................................................................. 89 Table 2 - Variance homogeneity test ........................................................................................ 90 Table 3 - One-sample Kolmogorov-Smirnov test .................................................................... 91 Table 4 - Control variables t-value ......................................................................................... 101 Table 5 - AVE ........................................................................................................................ 104
Table 6 - Validation of the main path hypothesis ................................................................... 104 Table 7 - Validation of the full path hypothesis ..................................................................... 106

FIGURE INDEX
Figure 1. Methodologic Matrix (MM) ...................................................................................... 18 Figure 2 - Research Design ...................................................................................................... 21
Figure 3 - Retrieved papers by year.......................................................................................... 22 Figure 4 - Subject co-occurrence network ................................................................................ 24 Figure 5 - Occurrence by subject category ............................................................................... 25 Figure 6 - Subject category time-zone ...................................................................................... 26 Figure 7 - Top 10 keywords by frequency ............................................................................... 27
Figure 8 - Keywords co-occurrence network ........................................................................... 28 Figure 9 - Keywords time-zone ................................................................................................ 30
Figure 10 - Journal co-citation network ................................................................................... 31 Figure 11 - Top 20 cited journals ............................................................................................. 32 Figure 12 - Author co-citation network .................................................................................... 33 Figure 13 - Top 30 cited authors .............................................................................................. 34 Figure 14 - Top 20 co-cited documents .................................................................................... 36
Figure 15 - Co-citation clusters network .................................................................................. 37 Figure 16 - Clusters’ Description ............................................................................................. 40 Figure 17 - Systematic Literature Review process ................................................................... 55 Figure 18 - Article selection steps ............................................................................................ 56
Figure 19 - Project performance relationship map ................................................................... 58 Figure 20 - Attributes relations matrix ..................................................................................... 66
Figure 21 - Study 3: Conceptual Framework ........................................................................... 87
Figure 22 - Respondents per country ........................................................................................ 88
Figure 23 - Control variables’ questions .................................................................................. 92 Figure 24 - Rating of control variables ..................................................................................... 93 Figure 25 - Project performance questions ............................................................................... 93
Figure 26 - Project performance rating..................................................................................... 94 Figure 27 - Human resource management questions................................................................ 94
Figure 28 - Human resources management rating .................................................................... 95 Figure 29 - Communication management questions ................................................................ 95 Figure 30 - Communication management rating ...................................................................... 96 Figure 31 - Risk management questions .................................................................................. 96
Figure 32 - Risk management rating ........................................................................................ 97 Figure 33 - Risk management questions .................................................................................. 97
Figure 34 - Quality management rating .................................................................................... 98 Figure 35 - Stakeholder engagement questions ........................................................................ 98 Figure 36 - Stakeholder engagement rating .............................................................................. 99 Figure 37 - Stakeholder salience questions .............................................................................. 99 Figure 38 - Stakeholder salience rating .................................................................................. 100
Figure 39 - Control variables in SmartPLS ............................................................................ 101 Figure 40 - Adjusted conceptual Framework ......................................................................... 102 Figure 41 - Main path model - SmartPLS ............................................................................. 103 Figure 42 - Full model SmartPLS .......................................................................................... 105 Figure 43 - Tested framework ................................................................................................ 110

13
1 INTRODUCTION
Stakeholders are made up of a wide range of groups who can affect or are affected by
an organization (Freeman, 1984). The primary stakeholder groups of an organization typically
are comprised of employees, shareholders, and investors, suppliers, and customers, together
with what is defined as the public stakeholder group, that is, the governments and
communities that provide infrastructures and markets, whose laws and regulations must be
obeyed, and to whom taxes and other obligations may be due (Hillman & Keim, 2001).
Essentially the stakeholder concept holds that an organization occupies the center of a
network of relationships that it has with various interested parties (Waligo, Clarke, &
Hawkins, 2013). A stakeholder approach emphasizes cooperation between companies and
their stakeholders as a more effective means of value creation (Strand & Freeman, 2015).
Stakeholder theory comprises a collection of expressions, ideas, and metaphors related to the
central thesis that the primary purpose of a company is to create as much value as possible for
its stakeholders (Strand & Freeman, 2015).
In the project context, stakeholders are individuals or groups who have an interest or
some aspect of rights or ownership in the project and can contribute to, or be impacted by, the
outcomes of a project (Bourne & Walker, 2005). Stakeholders can potentially affect the
activities and outcomes of a project, and therefore its likelihood of success (Olander &
Landin, 2005). The project manager must develop relationships with the stakeholders that are
of high quality and effective, aiming to enhance satisfaction with project outcomes (Mazur &
Pisarski, 2015). In general, the literature describes that effective stakeholder management can
improve the performance of the projects. In contrast, poor stakeholder management can lead
to low project performance in terms of schedule, cost, quality, environment, return on
investment, satisfaction, among others (Mazur & Pisarski, 2015; Mojtahedi & Oo, 2017; Di
Maddaloni & Davis, 2018).
In the past two decades, there has been significant progress in the literature on the
effects of stakeholder management on project context, regarding all lifecycle of the project.
Despite this notable progress, the direct correlation of stakeholder management and project
performance are not yet explored. Stakeholder management is being investigated as an

14
essential process to maximize positive inputs and minimize bad attitudes by taking into
account the needs and requirements of all project stakeholders (Di Maddaloni & Davis, 2018).
However, in the context of project management, the theory of stakeholders are not being
explored, journals of project management area like International Journal of Project
Management and Project Management Journal are publishing until this moment studies
practical bias, like how to classify stakeholders, change perceptions and identify attributes
(Waligo et al., 2013; Yang, Wang, & Jin, 2014; Mazur & Pisarski, 2015).
For this thesis, I use information technology projects as the empirical context of
stakeholder management's impact on project performance. The context of information
technology is relevant due to some reasons. First regards the plurality of contexts where
information technology projects are developed, almost 100 percent of the organizations in the
world has at least one information technology project, no matters in different sizes, industries,
costs, or complexity (Bakker, Boonstra, & Wortmann, 2010; De Bakker, Boonstra, &
Wortmann, 2011; Müller & Martinsuo, 2015). The second is about how critical are
information technologies for the sustainability of any organization, information systems,
hardware, and applications are intensively explored, and their efficiency is vital for many
organizations (Taylor, Artman, & Woelfer, 2012; McKay II & Ellis, 2015; González-Benito,
Venturini, & González-Benito, 2017). The third is about the need to enhance project results.
According to The McKinsey Global Institute (MGI), on average, large information
technology projects ran 45 percent over budget and 7 percent over time while delivering 56
percent less value than predicted. With these high failure rates, there have been several
attempts from practitioners and academics to reduce those failure rates (Pimchangthong &
Boonjing, 2017). In this regard, explore and understand theories that may contribute to
minimize project failures and enhance performance is relevant to figure out how organizations
and practitioners may explore additional options for project management.
I contribute to stakeholders theory and project management by providing a view about
how stakeholders management contributes to project performance. I contribute to stakeholders
theory, specifically stakeholder engagement and stakeholder salience, testing the moderation
effects of two different ways of stakeholder participation. These two ways of stakeholder
participation may affect project performance in various manners, and I will validate both
approaches' efficiency.
I contribute to project management by providing an additional activity for projects
aiming to enhance project success. I propose to test project management activities of human

15
resources management, communication management, risk management, and quality
management to impact stakeholder engagement positively. These relations may provide
additional focus to project management practitioners on current activities, to develop support
to stakeholders, and impact the results positively.
1.1 RESEARCH PROBLEM
More than 50 percent of large information technology project in the United States of
America has not accomplished planned time, scope, or cost in the year of 2015
(Pimchangthong & Boonjing, 2017). Organizations need to find out project management
practices to enhance this performance. In this thesis, I analyze if the engagement of
stakeholders or salient stakeholders can moderate project management activities and IT
project performance improving their results. I am investigating project performance not only
regarding the results of the project execution, like time, cost, and scope dimensions, but also
the dimension of the impact of the information technology project’s outcome and their
acceptance and usage by users, internal or external of the organizations. I investigate these
two dimensions as part of project performance, assuming stakeholder engagement and salient
stakeholders will affect that in different manners.
1.1.1 RESEARCH QUESTION
The analysis of stakeholder management in project management shows that managing
stakeholders is vital to successfully executing various standout projects (Xia, Zou, Griffin,
Wang, & Zhong, 2018). Many problems in projects can be avoided or reduced by observing
stakeholders, identifying their expectations, and thinking about how to fulfill them, since
stakeholders may define a project’s success (Eskerod, Huemann, & Savage, 2015).
Understanding stakeholders and analyzing their interests promotes better project management
results and helps the creation and development of products accordingly (Elias, Cavana, &
Jackson, 2002). Hence, to dive deeper in stakeholder management and their efficiency to
improve project results, the project question of this study is How stakeholder management
can improve project performance?

16
1.2 GOALS
1.2.1 GENERAL
The more general objective of this thesis is to analyze how efficient stakeholder
management activities can enhance project performance. This objective is developed in
the context of information technology project. Given the inefficiency of many projects to run
the entire lifecycle as planned and accomplish outcomes expectations, it becomes vital to
identify elements of project management that may diminish the inefficiency. With this
objective, it is possible to determine the current state of the art of stakeholder management,
the relations with project performance and propose new strategies to tackle part of the
inefficiency.
1.2.2 SPECIFICS
The three core-specific objectives of this thesis are:
• Identify the state of the art of stakeholder management in project management
context;
• Identify how the construct project performance is measured on literature and what
are their antecedents;
• Propose and test a framework about the mediation role of stakeholder engagement
and stakeholder salience and the relation between project management activities
and IT project performance.

17
1.3 STRUCTURE
RESEARCH QUESTION
How can stakeholder management improve project performance?
MAIN GOAL
Propose and test new relations between stakeholder management and project performance.
JUSTIFICATION OF DISTINCTION JUSTIFICATION OF INTERDEPENDENCE
Title of the studies Research
Question Specific Goals
Hypotheses and/or
propositions
Sequential or
simultaneous
searches
Single or
mixed method
Data collection
Procedures
Data Analysis
Procedures
Stakeholders and
Project
Management -
Bibliometric
analysis of two
decades of
publications
What are the
main studies
topics for
stakeholders
management
papers over the
last 20 years?
Execute longitudinal
analysis about
stakeholder
management scientific
literature in order to
find principal authors,
themes, and emerging
trends;
N/A Sequence Unique Researches on
Web of Science Bibliometric

18
Information
Technology Project
Performance: What
Impacts the Results
and How Are Being
Measured
How project
management
practices affect
project
performance,
according to the
literature?
To find on literature the
relationship project
management and
project performance;
N/A Sequence Unique
Researches on
Web of Science
and Scopus
Literature Review
Effects of
Stakeholders’
Management on
Information
Technology Project
Results
How
stakeholders may
positively
influence project
performance
To test improvements
in the PM/PP
association when
stakeholders are
engaged to projects and
whether salient
stakeholders can
positively contribute to
such an association
12 hypotheses
described in the
study
Sequence Unique Survey PLS Method
Figure 1. Methodologic Matrix (MM)

19
2 DEVELOPMENT
This chapter contains the three studies described in the introduction of this thesis.
2.1 STUDY 1: STAKEHOLDERS AND PROJECT MANAGEMENT –
BIBLIOMETRIC ANALYSIS OF TWO DECADES OF PUBLICATIONS
2.1.1 INTRODUCTION
The analysis of stakeholder management (SM) in the context of project management
shows that managing stakeholders is vital to the successful execution of various standout
projects (Xia, Zou, Griffin, Wang, & Zhong, 2018). Many problems in projects can be
avoided or reduced by observing stakeholders, identifying their expectations, and thinking
about how to fulfill them, since stakeholders may define a project’s success (Eskerod,
Huemann, & Savage, 2015). Understanding stakeholders and analyzing their interests
promotes better project management and helps products to be created and developed
accordingly (Elias, Cavana, & Jackson, 2002). Freeman (1984) published a book encouraging
a managerial team to consider and analyze groups or individuals who can affect or be affected
by a company’s objective. The concept of stakeholder analysis was embraced by project
management theorists and practitioners, and this field of research has been increasing since
then.
Stakeholder management does not only concern one specific project area, but several,
being applied widely in different kinds of projects. One important area applying SM is the
area of megaprojects, be it public or private; managing stakeholders can improve the results
and impact of projects for people and places (Di Maddaloni & Davis, 2018). The stakeholder
management theory, when applied to project research and development, can stimulate the
interaction among stakeholders and the project team, creating a better understanding in terms
of mutual interests and teaching the team how to address those interests when creating new
products (Elias et al., 2002). Non-governmental organizations deal with complex projects that
demand an increased project management maturity; the ability to manage stakeholders
increases this maturity, hence creating a path for the project’s success in the short and long

20
terms (Golini, Kalchschmidt, & Landoni, 2015). For projects involving software, the risks are
higher because of technological changes; the stakeholders’ expectations about software
technology need to be considered in order to build the bigger picture and manage risks
effectively (Vrhovec, Hovelja, Vavpotič, & Krisper, 2015). Therefore, managing stakeholders
entails a considerable amount of goals, applications and theories used by practitioners and
studied by researchers.
This study aims to provide academics and project management practitioners with an
in-depth understanding of the research area for stakeholder management for projects, as well
as its trends, its evolution through time, and structures of references. To achieve this result, I
will apply a bibliometric analysis of papers related to SM in projects. Bibliometric analysis is
a branch of research method that quantitatively analyzes patterns in scientific literature in
order to understand emerging trends and the knowledge structure of a research field (Chen,
Hu, Liu, & Tseng, 2012).
2.1.2 METHOD
In this study I applied bibliometric analysis, review and visualization to papers
published about the SM area. The use of this technique allows me to create a science map
about a specific area, aiming to reveal the structure and dynamics of a certain scientific field
(Zupic & Čater, 2015). Bibliometric analysis is described as one of the most used methods to
evaluate and examine the development of a research in a specific field.
The research design applied for this study is represented in Figure 2. All the papers
analyzed in this study were retrieved from the Web of Science’s (WOS) core collection
database. The WOS’s collection database contains the most important and influential journals
in the world (Zhao, 2017). The first step was to run the queries “stakeholder*” and “project
management*” from the period of 1998 to 2017. These queries resulted in 987 documents.
The second step was to select the papers, excluding proceeding papers, reviews, book reviews
and editorial material. After this exclusion, 480 papers were selected. The third step was to
export the papers’ information from the WOS’s database, load it in CiteSpace, and run
validation tests to check if all the data exported had been loaded successfully with the total
number of registers. After the data was loaded and successfully validated, I used bibliometric
analysis techniques to evaluate and discuss the results.

21
In this study, I used three distinctive bibliographic techniques: co-word analysis, co-
citation analysis and cluster analysis. All of them are based on co-occurrence analysis
techniques, which are used to measure the frequency of co-occurrence of keywords’ pairs or
noun phrases and other terms in the same document. Co-occurrence analysis assumes that
when two items appear in the same context, they are related to some degree. Keyword co-
word analysis is a content analysis technique. Co-cited cluster analysis is based on the
construction of a network of invisible colleagues that may or may not cite each other; as this
network develops and connects to co-cited authors, it defines how closely related the
documents are about a specific area.
Figure 2 - Research Design
The definition of the period for the retrieved papers was based on the results of query
tests over different periods. There were very few papers about stakeholder management in
projects before 1998, and they were not published on a regular basis. Figure 3 shows the
distribution of publications between 1998 and 2017. According to it, the distribution of papers
was divided into two stages: The first stage shows the beginning of publications about SM in
projects; over the years of 1998-2012, the number of studies increased in small proportions

22
annually. On the second stage, over the years of 2013-2017, we can see a quick and
significant growth in the number of studies published. Error! Reference source not found.
shows that the number of publications continues to increase annually and 63% of the total of
publications were published over last 3 years. This increase indicates the relevance of the
research field and the up-to-dateness of the theme.
Figure 3 - Retrieved papers by year
The software CiteSpace was used to support the analyses in this study. This software
helps researchers to analyze the contents of a scientific knowledge domain, allowing them to
capture the notion of a logically and cohesively organized body of knowledge (Chen, 2006).
Analyzing a scientific knowledge domain is an advantageous approach to discover the hidden
implications in a piece of information and to trace development frontiers (Song, Zhang, &
Dong, 2016). CiteSpace is adequate to map knowledge domains through the creation of
various graphs and relationship views (Chen, 2006). I used CiteSpace version 5.18R to
analyze the papers in this study.

23
2.1.3 RESULTS
2.1.3.1 Co-word analysis
2.1.3.1.1 Subject category co-occurrence
One or more subject categories are assigned for each article in the Thomson Reuters
WOS database based on a corresponding journal using a journal classification system. For
example, the International Journal of Project Management is assigned as “Management”.
Subject category co-occurrence analysis makes it possible to identify disciplines
regarding the intellectual development of a certain knowledge domain (Liu, Yin, Liu, &
Dunford, 2015). Figure 4 shows 31 nodes and 108 links, meaning that there are studies about
SM published in 31 different disciplines. The size of the node is proportional to its co-
occurrence frequency; the thickness of the ring, proportional to its co-occurrence time slice
(Chen, 2006). The colors represent time; blue for older occurrences, orange for more recent
ones. The colors of the links represent the first time co-occurrence happens between two
nodes, and the thickness of the node is proportional to the frequency of co-occurrence. The
purple ring around some nodes represents high betweenness centrality of the node; the thicker
the ring, the stronger the betweenness centrality. Studies have shown that betweenness
centrality can be used to identify potential turning points that may lead to transformative
changes in the area.
While “Engineering” is not the biggest node, it is the subject category with greater
betweenness centrality (0.79); this category contains 110 cited papers. Analyzing the top 5
most cited, we can find Baccarini, Salm and Love (2004), with 66 citations that affirm that
managing stakeholders’ expectations helps to manage and mitigate key IT. Barlow, Bayer and
Curry (2006), with 65 citations, analyzes the implementation of Telecare and how complex it
is to manage innovation technology in an environment of diverse stakeholders. Eadie et. al
(2013), with 64 citations, addresses the implementation of Building Information Modelling,
and points out that one of the benefits of project implementation is financial benefits for
stakeholders. Turner and Zolin (2012), with 61 citations, presents a study proposing a model
to identify how stakeholders perceive a project’s success during its lifetime. The last paper of
the top 5 most cited on the “Engineering” category is Faraj and Sambamurthy (2006),

24
presenting a paper about leadership in many circumstances; the authors address how to meet
the expectations of a diverse set of stakeholders.
Figure 4 - Subject co-occurrence network
While “Engineering” is not the biggest node, it is the subject category with greater
betweenness centrality (0.79); this category contains 110 cited papers. Analyzing the top 5
most cited, we can find Baccarini, Salm and Love (2004), with 66 citations that affirm that
managing stakeholders’ expectations helps to manage and mitigate key IT. Barlow, Bayer and
Curry (2006), with 65 citations, analyzes the implementation of Telecare and how complex it
is to manage innovation technology in an environment of diverse stakeholders. Eadie et. al
(2013), with 64 citations, addresses the implementation of Building Information Modelling,
and points out that one of the benefits of project implementation is financial benefits for
stakeholders. Turner and Zolin (2012), with 61 citations, presents a study proposing a model
to identify how stakeholders perceive a project’s success during its lifetime. The last paper of
the top 5 most cited on the “Engineering” category is Faraj and Sambamurthy (2006),
presenting a paper about leadership in many circumstances; the authors address how to meet
the expectations of a diverse set of stakeholders.
There are others subject categories with significant betweenness centrality; “Computer
Science” is the second greatest one (0.40), containing 42 co-occurrences. In third place is the
subject category “Engineering, Industrial” with betweenness centrality of 0.37. In fourth,

25
“Engineering, Civil” with betweenness centrality of 0.27. The other subject categories did not
present significant betweenness centrality.
Figure 5 shows the top 10 subject categories classified by frequency of co-occurrence.
Analyzing the numbers allows us to find the most recurring areas being cited on papers.
“Business & Economics” is the greatest one; according to WOS, this subject category
includes the topics of business ethics, business history, electronic business and commerce,
international business, developing economies, forecasting, economic statistics, monetary
economics, common market studies, and real estate economics.
Number of Occurrences Subject Category
192 BUSINESS & ECONOMICS
171 MANAGEMENT
110 ENGINEERING
56 ENGINEERING; CIVIL
54 ENGINEERING; INDUSTRIAL
42 BUSINESS
42 COMPUTER SCIENCE
20 CONSTRUCTION & BUILDING TECHNOLOGY
20 COMPUTER SCIENCE; SOFTWARE ENGINEERING
16 COMPUTER SCIENCE; INFORMATION SYSTEMS
Figure 5 - Occurrence by subject category
Time-zone view can be used to highlight temporal patterns analysis (Chen, 2006).
Figure 6 ows the time-zones for each subject category. For this chart, only the subject
categories with 7 or more co-occurrences are represented. Each grid represents a span of 2
years, starting from 2000 and going all the way to 2017. The placement of each node
represents the date the co-occurrence started. This view allows us to notice that SM in
projects began in 2002, in the categories “Engineering”, “Engineering, Civil”, “Business &
Economics” and “Management”. The most recent subject categories regarding SM in projects
are “Social Sciences” – ‘Other Topics’, ‘Social Sciences Interdisciplinary’ and ‘Engineering
Manufacturing’.

26
It is then possible to conclude that the multiple Engineering areas were the precursors
on publishing materials about SM in projects, and the most recent areas to do so are related to
Social Sciences. For engineering-related areas, SM studies cover the following topics: Risk
mitigation (Nielsen, 2004), financial return (Eadie et al., 2013), software development
(Baccarini et al., 2004; Jørgensen & Moløkken-Østvold, 2004; Patnayakuni, Rai, & Tiwana,
2007), etc. For social sciences, the topics covered are: Biology projects (Görg et al., 2014),
project learning using simulation (Geithner & Menzel, 2016) and multi-stakeholder
approaches for projects regarding tourism development (Hummel & van der Duim, 2016).
Figure 6 - Subject category time-zone
2.1.3.1.2 Keyword analysis
Analyzing keywords can help the researcher to find research frontiers and hot topics
regarding a specific area (Xie, 2015). Keywords are used to show the core contents of articles,
and analyzing these contents allows researchers to observe the development of research topics
over time (Zhao, 2017). There are two types of keywords in the WOS database: The first one,
keywords added by authors, called “Authors Keyword”; they are codified with DE. The
second one, keywords added by journals, called “Keyword Plus”; these are codified with ID.
For this analysis I am using both types, DE code and ID code.
To normalize the data, I applied an alias for similar keywords. The criteria used for the
alias was to use same words with different spellings, and different words with similar
meanings or spelling correction. Appendix 1 shows the list of aliases applied for the

27
keywords’ co-occurrence analysis. After applying the aliases, we were left with 98 different
keywords to analyze.
Figure 7 shows the top 10 most frequently used keywords on the scientific papers
researched. It is possible to notice that only 5 of the top 10 keywords were used for the first
time before 2008. After 2012, the frequency of usage for each keyword increased. The
keywords ‘project management’ and ‘information technology’ first appeared in 2004. In 2006,
the topics ‘organization’, ‘performance’ and ‘model’ show up. After 2008, ‘success’ followed
by ‘risk management’, ‘construction’, ‘management’ and ‘framework’ appear.
Figure 7 - Top 10 keywords by frequency
Keyword co-occurrence network analysis was used to identify the frequency,
betweenness centrality and relationship between the keywords. Figure 8 shows 98 nodes and
224 links; the size of the node represents keyword frequency and the colors of the links
represent when the linked keywords were first cited together. To scale down the network and
reduce redundant links I used the pathfinder utility. Among the pruning utilities available in
CiteSpace, pathfinder is regarded as the best option (Olawumi & Chan, 2018).

28
Figure 8 - Keywords co-occurrence network
The nodes with purple rings around them indicate betweenness centrality. This
centrality tends to be intellectual turning point documents, which act as bridges in the
development of a scientific field, linking researches from different time periods. Nodes with
high betweenness centrality values tend to identify boundary spanning potentials that may
lead to transformative discoveries (Chen, 2017). Turning point documents tend to be critical
in intellectual transitions from one timeframe to another. The thickness of the purple ring is
proportional to the intensity of centrality: the thicker the ring, the stronger the betweenness
centrality. Small nodes with thicker purple rings indicate that intellectual pivotal documents
do not necessarily have high citation scores (Liu et al., 2015).
The top 5 greatest betweenness centrality, in descending order, are: ‘software
development’, ‘model’, ‘design’, ‘organization’ and ‘indicator’. ‘Software development’, as
the name indicates, are papers regarding projects for software development. Papers about this
area describe how to get a hold of stakeholders’ expectations and share the information
among complex and diffused teams (Faraj & Sambamurthy, 2006; Parolia, Goodman, Li, &
Jiang, 2007; Patnayakuni et al., 2007). Papers containing the keyword ‘model’ are related to
different areas like construction, economy, and system management. These papers most
commonly propose models to identify, gather and distribute stakeholders’ requirements and
expectations (Oliveira, Lopes, Sousa, & Abreu, 2017; Turskis, 2008; Zavadskas, Turskis, &
Tamošaitiene, 2008). Most of the studies containing the keyword ‘design’ also contain the

29
keyword ‘model’. Both of these keywords are not added by authors, but by journals, to
identify papers proposing systems to gather, organize, classify, and distribute project
management and stakeholder information. The way these keywords are organized come from
papers adopting these keywords and applying project management theory and other theories
of strategy management to them. For example, project management and agency theories
(Biesenthal & Wilden, 2014), and project management and organization theories (Müller &
Lecoeuvre, 2014). Papers containing ‘indicator’ as a keyword present studies regarding
project performance or project success measurements (Carvalho & Rabechini Junior, 2015;
Rashvand & Zaimi Abd Majid, 2013).
Since keywords provide information about the core content of an article, analyzing
keywords over time can be useful to identify when new topics emerge on the field of SM
studies. Figure 9 shows the results obtained from the time-zone analysis; the placement of
each keyword indicates its first-time appearance and the size of each circle represents the
number of occurrences. From this figure, we can observe how the number of different topics
being studied for stakeholder management is increasing.
What is interesting about Figure 9 is that we can observe what the initial themes
discussed in SM articles were, and monitor the most recent ones. Topics concerning SM
studies started to be relevant in the area of application, such as information technology,
software development and constructions. These topics were given even greater relevance
through the application of SM in the measurement of project results and enhancement of
performance, occurring on themes like success, model, design, performance, and
organization. Analyzing the last 4 years of new keywords, it is possible to notice an
exponential increase of new themes. This timeframe is important because we can compare it
with the first studies, and observe the change in themes from specific SM applications and
performance measures to themes that discuss how to influence stakeholders, improve results,
and change negative aspects. These topics are discussed in studies containing keywords like
‘perception’, ‘collaboration’, ‘identification’, ‘leadership’, ‘satisfaction’, ‘resilience’,
‘stakeholder theory’, ‘relationship’ and ‘integration’.

30
Figure 9 - Keywords time-zone
2.1.3.2 Co-citation analysis
This section presents co-citation analysis. This analysis identifies three types of
relationships – co-cited journal, co-cited authors and co-cited papers – based on referenced
journals, authors and papers (Song et al., 2016). In addition to this, I performed cluster
analysis based on the results of the co-citation analysis. You can use co-citation analysis to
find papers, documents and journals that are related to each other on a same context, even
though they do not cite each other. A fundamental assumption of co-citation analysis is that
the more two items are cited together, the more likely it is that their content is related
(Batistič, Černe, & Vogel, 2017)
2.1.3.2.1 Journal co-citation
Journal co-citation analysis can be used to map journals that are the domain of a
specific area of knowledge. By identifying frequently cited journals, we can determine
important information and insights to create an intellectual base of a knowledge domain (Liu
et al., 2015). As already mentioned, the journal co-citation information presented on this
section is created based on the references of the analyzed papers.

31
As shown in Figure 10, there are 166 nodes, representing one journal per node,
followed by 518 links among the nodes, representing journal co-citations. The colors of the
links represent the years of the co-citations – blue for oldest, orange for newest.
Figure 10 - Journal co-citation network
Figure 11 shows two important pieces of information about journals concerning the
area of SM in projects. The first one is the top 20 cited journals, with The International
Journal of Project Management highlighted as the most cited one. The second, is the
betweenness centrality; journals with higher centrality have more links with other journals.
This centrality classifies journals that are not related to a niche and are cited from journals of
different areas. The journals with greater centrality are the International Journal of Project
Management, the Academy Management Journal, the Strategic Management Journal, the
Automation in Construction, and the Project Management Journal.
Citation Centrality Journal
Impact
Factor*
215 0.31 INTERNATIONAL JOURNAL OF PROJECT MANAGEMENT 4.328
157 0.05 CONSTRUCTION MANAGEMENT AND ECONOMICS 1.210
134 0.10 PROJECT MANAGEMENT JOURNAL 1.957
95 0.07 ACADEMY OF MANAGEMENT REVIEW 8.855
69 0.27 ACADEMY OF MANAGEMENT JOURNAL 6.700

32
68 0.02 JOURNAL OF CONSTRUCTION ENGINEERING AND
MANAGEMENT 2.201
64 0.08 JOURNAL OF MANAGEMENT ENGINEERING 1.560
63 0.23 STRATEGIC MANAGEMENT JOURNAL 5.482
61 0.05 MANAGEMENT SCIENCE 3.544
56 0.00 ORGANIZATION SCIENCE 3.027
52 0.14 IEEE TRANSACTIONS ON ENGINEERING MANAGEMENT 1.416
51 0.02 INTERNATIONAL JOURNAL OF MANAGING PROJECTS IN
BUSINESS 1.321
46 0.18 AUTOMATION IN CONSTRUCTION 4.032
41 0.02 ADMINISTRATIVE SCIENCE QUARTERLY 5.878
41 0.06 MIS QUARTERLY: MANAGEMENT INFORMATION SYSTEM 5.430
40 0.01 RESEARCH POLICY 4.661
40 0.01 HARVARD BUSINESS REVIEW 4.374
40 0.00 ENGINEERING, CONSTRUCTION AND ARCHITECTURE
MANAGEMENT 1.613
37 0.04 BUILDING RESEARCH & INFORMATION 3.468
34 0.10 COMMUNICATIONS OF THE ACM 3.063
Figure 11 - Top 20 cited journals
*Source: InCites Journal Citation Reports 2017
2.1.3.2.2 Author co-citation
Author co-citation analysis aims to identify interrelationships between individual
authors in a research field. By measuring the number of occurrences of co-citations, it is
possible to identify interconnections between individual works that may or not cite each other.
The more two authors are co-cited, the closer they are intellectually related (Liu et al., 2015).
This analysis offers important information for understanding and representing the intellectual
structure basis of the research on SM in projects.
Figure 12 shows the author co-citation network, containing 209 authors and 572 links
of co-citation. The top 30 co-cited authors are named in the network. The size of the letters
represents the frequency of citations of each author and, just like on the previous networks,
the links’ colors represent the dates of the co-citations.

33
Figure 12 - Author co-citation network
Figure 13 shows the level of influence of each author. They are ordered by frequency
of citation, betweenness centrality, the first year of each citation, and author name. The
betweenness centrality is an important aspect to be analyzed because, as mentioned before, it
represents the degree of where each node stands between each other. The more centrality on
the author co-citation network, the more influence he has on the analyzed area.
Citation Centrality Year Author
71 0.00 2006 PMI
52 0.14 2008 TURNER JR
52 0.00 2006 YIN R
45 0.03 2006 SHENHAR AJ
45 0.19 2006 PINTO JK
43 0.10 2012 MULLER R
41 0.16 2008 CRAWFORD L
36 0.01 2008 FLYVBJERG B
36 0.02 2008 FREEMAN RE
36 0.02 2014 AALTONEN K
36 0.00 2014 WALKER DHT
34 0.04 2012 MORRIS PWG
33 0.10 2002 EISENHARDT KM
28 0.00 2012 ATKINSON R
28 0.03 2014 MITCHELL RK
26 0.01 2014 OLANDER S

34
26 0.09 2008 BACCARINI D
25 0.00 2014 YANG J
24 0.08 2008 CLELAND DI
23 0.04 2007 WINCH GM
22 0.00 2008 KERZNER H
21 0.00 2011 WINTER M
20 0.00 2014 BOURNE L
20 0.01 2014 JEPSEN AL
19 0.10 2014 ESKEROD P
19 0.07 2007 HAIR JF
18 0.02 2008 COOKE-DAVIES T
18 0.00 2014 TOOR SUR
17 0.00 2014 DONALDSON T
Figure 13 - Top 30 cited authors
2.1.3.2.3 Document co-citation
Document co-citation is used to analyze the fundamentals of the intellectual structure
of a knowledge domain, demonstrating quantities and authorships of references cited by
publications. This analysis also enables us to visualize the most significant studies about a
specific area and the co-cited references derived from papers.
The collection of papers for this analysis contains 14,695 citations. Figure 14
demonstrates the top 20 most co-cited documents in the SM area retrieved from this
collection, according to the WOS citation metric. The Project Management Institute (2013) is
the most cited one; this document is a collection of processes, best practices, terminologies,
and guidelines that are accepted as standard within the project management industry. The
previous version of this document is the fourth most cited document. Papers about method are
also among the most cited ones. Eisenhardt (1989) is the fifth – this paper describes the
process of inducting a theory using a case study, like Yin (2003), whose main subject is
exactly case studies, and Fornell and Larcker (1981), who describe Structural Equation
Models. Mitchell et al. (1997) is the second most cited one; this document proposes a
typology of stakeholders, combining power, legitimacy and urgency. The third most cited one
is Freeman (1984); this book is known as the fundamental study on stakeholder management
theory.

35
Co-
Citations Centrality Author Year Title Source
Doc.
Type
33 0.00
Project
Management
Institute (Project Management Ins titu te, 2013)
2013
A Guide to the Project
Management Body of
Knowledge: PMBOK®
Guide
Project
Management
Institute
Book
28 0.01 Mitchell et
al. (Mitchell et al., 1997) 1997
Toward a theory of
stakeholder identification
and salience: Defining the
principle of who and what
really counts
Academy of
Management
Review
Journal
Article
27 0.07 Freeman (Freeman, 1984) 1984 Strategic management: A
stakeholder perspective Pitman Book
27 0.00
Project
Management
Institute (Project Management Ins titu te, 2008)
2008
A Guide to the Project
Management Body of
Knowledge: PMBOK(R)
Guide
Project
Management
Institute
Book
23 0.00 Eisenhardt (Eisenhardt,
1989) 1989
Building theories from case-
study research
Academy of
Management
Review
Journal
Article
22 0.22 Cooke-
Davies (Cooke-Davies, 2002) 2002
The “real” success factors
on projects
International
Journal of Project
Management
Journal
Article
20 0.07 Bourne and
Walker (Bourne & Walker, 2005) 2005
Visualising and mapping
stakeholder influence
Management
Decision
Journal
Article
19 0.21 Atkinson (Atkinson, 1999) 1999
Project management: cost,
time and quality, two best
guesses and a phenomenon,
it’s time to accept other
success criteria
International
Journal of Project
Management
Journal
Article
18 0.02 Olander and
Landin (Olander & Landin, 2005)
2005
Evaluation of stakeholder
influence in the
implementation of
construction projects
International
Journal of Project
Management
Journal
Article
17 0.03 Aaltonen et
al. (Aaltonen, Jaakko, & Tuomas, 2008) 2008
Stakeholder salience in
global projects
International
Journal of Project
Management
Journal
Article

36
17 0.02 Jepsen and
Eskerod (Jepsen & Eskerod, 2009) 2009
Stakeholder analysis in
projects: Challenges in
using current guidelines in
the real world
International
Journal of Project
Management
Journal
Article
16 0.00 Yin (Yin, 2003) 2003 Case Study Research:
Design and Methods SAGE Book
15 0.02 Aaltonen
and Sivonen (Aaltonen & Sivonen, 2009)
2009
Response strategies to
stakeholder pressures in
global projects
International
Journal of Project
Management
Journal
Article
15 0.00 Winter et. al. (Winter, Smith, Morris, & Cic mil, 2006)
2006
Directions for future
research in project
management: The main
findings of a UK
government-funded research
network
International
Journal of Project
Management
Journal
Article
14 0.21 Fornell and
Larcker (Fornell & Larcker, 1981) 1981
Evaluating Structural
Equation Models with
Unobservable Variables and
Measurement Error
Journal of
Marketing
Research
Journal
Article
14 0.09 Littau et al. (Littau,
Jujagiri, & Adlbrecht, 2010) 2010
25 Years of Stakeholder
Theory in Project
Management Literature
(1984-2009)
Project
Management
Journal
Journal
Article
14 0.03 Donaldson
and Preston (Donaldson & Preston, 1995)
1995
The Stakeholder Theory of
the Corporation: Concepts,
Evidence, and Implications
Academy of
Management
Review
Journal
Article
14 0.01 Shenhar and
Dvir (Shenhar & Dvir, 2007) 2007
Reinventing Project
Management: The Diamond
Approach To Successful
Growth And Innovation
Harvard Business
Review Press Book
13 0.11 Olander (Olander & Landin, 2005) 2007
Stakeholder impact analysis
in construction project
management
Construction
Management and
Economics
Journal
Article
13 0.05 Lim and
Mohamed (Lim & Mohamed,
1999)
1999
Criteria of project success:
an exploratory re-
examination
International
Journal of Project
Management
Journal
Article
Figure 14 - Top 20 co-cited documents

37
2.1.3.3 Document co-citation cluster
The cluster analysis technique is used in this study to analyze pertinent contexts and to
identify trends and their relationships with the SM research field. The network is designed
containing 480 documents, from 14,789 references cited by the papers analyzed in this study.
Figure 15 shows the network and the 8 clusters found. Figure 16 shows the clusters’ names,
descriptions, number of documents, and top 3 most relevant documents for each cluster.
Figure 15 - Co-citation clusters network
Cluster #1 incorporates the theme ‘stakeholder analysis’, which explores how to
understand and analyze stakeholders and their influence on projects’ results. Most of its
documents are specifically related to the area of construction projects. Elias et. al. (2002) is
the central author of this cluster and applies 3 levels of Freeman’s (1984) stakeholders’
analysis to understand the impact stakeholders’ interests have over R&D projects’ results.
Olander & Landin (2005) utilizes the power/interest matrix to investigate how stakeholders
can influence two cases of construction projects. Manowond & Ogunlana (2010) presents
several construction projects cases, advocating for stakeholder management and discussing

38
different aspects of this practice. The most recent document cited on this cluster is Mok et al.
(2015), analyzing the latest research development of SM in mega construction projects.
Cluster #2 talks about project success and contains documents that propose how to
measure or reach project success. De Wit (1988) presents a discussion about project success
and project management success; the author determines that finding the stakeholders’ goal
throughout the project lifecycle is an important measure for success. Belout & Gauvreau
(2004) present on their paper the impact of human resources management on a project’s
success, defining this management as a strategic role. Abalo et al. (2007) proposes a technique
to identify the most important attributes of products or services, and where costs can be cut
without affecting quality. The most recent document in this cluster is Alzahrani & Emsley
(2013); the authors conduct a survey for practitioners on the construction industry to identify
the impact of the contractor’s attributes on a project’s success.
Cluster #3 contains documents about how project management practices affect project
and/or company performances. Nunnally (1978) is the main document in this cluster because
it is used to support methods used for other papers in this and other clusters. The book talks
about psychometric theory. Jugdev & Müller (2007) assesses 40 years of project management
to discuss conditions for success and identify the use of program and portfolio management
and individual projects that impact on companies’ results. Golini et al. (2015) is the third most
important document in the cluster, as well as the most recent citation. The authors conduct a
survey for more than 500 practitioners to understand the impact of project management
practices on non-governmental organizations.
Cluster #4 contains documents presenting distinct approaches on stakeholder
management. Pernille Eskerod, a professor at the Webster Vienna Private University, is the
most important author in this cluster, having written 3 of the main documents. Eskerod &
Huemann (2013) analyzes how various approaches to stakeholder management are included
in internationally‐used project management standards. Eskerod & Jepsen (2013) is the second
main document, where the authors present ways to improve stakeholder management and
show how to adopt an analytical and structural approach to it. Eskerod & Vaagaasar (2014)
writes an in-depth case study on how to apply strategies to develop a favorable relationship
with each stakeholder. The most recent document in this cluster is Yang et al. (2014), where
the authors identify, from the practitioners’ perspective, three stakeholders’ attributes and four
stakeholders’ behaviors to deal with when balancing stakeholders’ claims.
Cluster #5 contains documents about elements that affect a project’s success. This
cluster presents themes that are close to cluster #2, focusing on two separate topics: project

39
success and project management success. Baccarini (2004) presents a logical framework
method containing four levels of project objectives, two regarding project success, and two
regarding project management success. Cooke-Davies (2002) investigates more than 70
organizations and identifies 12 factors that are critical to a project’s success. Atkinson (1999)
proposes a framework to evaluate a project success’ criteria for information technology
projects. The most recent document in this cluster is Mir & Pinnington (2014); this paper
presents a multi-dimensional framework to measure project management performance and its
correlation with project success.
Cluster #6 contains documents presenting computational models to evaluate project
results. Its main document is Fornell & Larcker (1981), where the authors present statistical
tests used in the analysis of structural equation models. This paper is about the area of
marketing studies, and it is the central document in the cluster due to its support method for
other papers. Wallace et al. (2004) developed and tested a model to measure software project
risks and their links with project performance. Henderson & Lee (1992) tests the coexistence
between management and team-member control, concluding that both affect the information
system project performance in a positive manner. The most recent document in this cluster is
Jiang et al. (2009), where the authors present a model to identify difference of perceptions
about users and developers in software development projects, and how to address difficulties
before a project starts.
Cluster #7 is about how leadership can influence and affect the project’s results.
Müller & Turner (2010) is the main and most recent document in this cluster, examining the
leadership competency profiles of successful project managers in different types of projects.
Keegan & Den Hartog (2004) compares the relationship between transformational leadership
style and employee motivation, as well as commitment and stress for employees. Brill et al.
(2006), using the Delphi web-based method, explores the competencies required for a project
manager to be effective in the project.
Cluster #8 contains documents about management theory and how to stablish project
governance. Its main document is Ouchi (1980); using the organization theory and transaction
costs approach, the authors evaluate organizations according to efficiency. In this book,
Muller (2009) provides a framework to explain the different preferences that organizations
have when it comes to setting goals, along with the best practices, roles and responsibilities
related to governance tasks. Clegg et al. (2002) reports an example of governmentality applied
to project management, combining transaction costs and resource dependence. The most
recent document is Müller et al. (2013); studying 9 qualitative cases, the authors investigate a

40
variety of ethical decisions made by project managers and their impact on corporate and
project governance structures.
ID Cluster Description Qty Top 3 Central
References
1 Stakeholder
Analysis and
Construction
Projects
Explore how to understand and
analyze stakeholders and their
influence on projects’ results.
43 Elias et. al. (2002)
Olander & Landin (2005)
Manowond & Ogunlana (2010)
2 Project Success This cluster contains documents that
propose how to measure or reach
project success.
42 De Wit (1988)
Belout & Gauvreau (2004)
Abalo et al. (2007)
3 Project Management
Practices
Documents about project management
practices and how to impact project
and/or company performances.
35 Nunnally (1978)
Jugdev & Müller (2007)
Golini et al. (2015)
4 Stakeholder
Management
Strategies
This cluster contains various
approaches on stakeholder
management
28 Eskerod & Huemann (2013)
Eskerod & Jepsen (2013)
Eskerod & Vaagaasar (2014)
5 Success Elements Documents about what are the
elements that affect a project’s success
21 Baccarini (2004)
Cooke-Davies (2002)
Atkinson (1999)
6 Information System
Projects
Documents presenting studies about
performances on Information System
projects.
18 Fornell & Larcker (1981)
Wallace et al. (2004)
Henderson & Lee (1992)
7 Leadership How leadership can influence and
affect projects’ results
11 Müller & Turner (2010)
Keegan & Den Hartog (2004)
Brill et al. (2006)
8 Project Governance This cluster contains documents about
management theory and how to
stablish project governance
11 Ouchi (1980)
Muller (2009)
Clegg et al. (2002)
Figure 16 - Clusters’ Description
2.1.4 CONCLUSIONS
Stakeholder management in projects has been receiving increasing attention from
academics and practitioners. This study explores 20 years of documents from this area
through a bibliometric analysis, reviewing a total of 480 papers from the WOS database. I

41
used co-word analysis and co-citation analysis to understand the status and trends of the SM
research area.
Applying longitudinal co-word analysis for subject categories and keywords using
data from Figure 6 and Figure 9, it is possible to observe the evolution of this theme. The first
discussions about this topic happened in the areas of engineering, management, and
construction. Two years after its starting point, SM started to be discussed in the areas of
computer science and software engineering, with focus on performance, model, success,
project and information technology, organization, and construction. Project, information
technology, construction, etc. are highlighted because before these topics appeared, SM was
not being discussed in journals for specific types of projects; because of this, the authors point
out on their journals that they were discussing SM from the projects’ perspective, as well as
their impact on projects of construction or information technology. After that, journals about
SM in the environment, economics, information science, and social sciences started being
published. With these publications, other areas started talking about SM, like communication,
complexity, identification, behavior, quality, collaboration, etc. The longitudinal co-word
analysis helps us to understand the evolution of SM studies and what the actual main topics in
the area are.
The results stemming from the co-word analysis show the evolution of the studies in
the SM area. From 1998 to 2010, most of the themes discussed like performance, knowledge
management, model, success, etc., came from a passive management perspective on
stakeholders. After 2010, these themes took on an active role on project management, like
leadership, communication, collaboration, perspective, relationship, coordination, etc. This
evolution shows that these studies started to focus more on how to understand stakeholders
and how they influence results. Most recent studies also show us the need of an active
relationship between management and stakeholders to achieve goals and success.
Applying co-citation analysis in this study reveals the most influential journals as
references for the SM area. Two of the most influential journals about the topic are related to
the area of project management: The International Journal of Project Management, and the
Project Management Journal. Due to active publishing regarding construction projects,
journals related to engineering are on the list of most influential, like the Construction
Management and Economics, the Journal of Engineering and Management, and the Journal of
Management Engineering. Other important journals related to strategic management are: The
Academy of Management Review, the Academy of Management Journal, and the Strategic
Management Journal.

42
Document co-citation analysis shows us the most influential papers about SM, like the
Project Management Institute (2013). This version of the guide added SM as a field of
knowledge for the first time. Mitchell et al. (1997) is the second most influential paper,
followed by Freeman (1984), who is a reference when it comes to the definition stakeholder
management.
Clustering co-cited documents allows us to organize references in same context and
find similarities between them. This study aggregated 8 distinct clusters, as described in
Figure 16, and with it we can identify the specific themes, main documents, and most recent
documents of each one. Cluster 2 and cluster 5 are similar – both of them approach the theme
of project performance. The documents on these clusters propose models to measure success,
identify factors that can bring risks, and test correlations for independent variables that can
affect a project’s success. Professor Pernille Eskerod has a high influence in cluster 4, which
involves papers about stakeholder management strategies.
We identify the most recent documents in each theme to understand what the recent
discussions about them are, and possible ways that these themes can evolve from now on. Due
to stakeholder management being a recent theme, with an increase in publications happening
only in 2012, none of the clusters are spent. Analyzing recent publications and references
allows us to find gaps for studies, comprehension, and further publications to develop the SM
area.
2.1.5 REFERENCES
Aaltonen, K., Jaakko, K., & Tuomas, O. (2008). Stakeholder salience in global projects.
International Journal of Project Management, 26(5), 509–516.
Aaltonen, K., & Sivonen, R. (2009). Response strategies to stakeholder pressures in global
projects. International Journal of Project Management, 27(2), 131–141.
Abalo, J., Varela, J., & Manzano, V. (2007). Importance values for Importance–Performance
Analysis: A formula for spreading out values derived from preference rankings.
Journal of Business Research, 60(2), 115–121.
Alzahrani, J. I., & Emsley, M. W. (2013). The impact of contractors’ attributes on
construction project success: A post construction evaluation. International Journal of
Project Management, 31(2), 313–322.

43
Atkinson, R. (1999). Project management: cost, time and quality, two best guesses and a
phenomenon, its time to accept other success criteria. International Journal of Project
Management, 17(6), 337–342.
Baccarini, D., Salm, G., & Love, P. E. D. (2004). Management of risks in information
technology projects. Industrial Management & Data Systems, 104(4), 286–295.
Barlow, J., Bayer, S., & Curry, R. (2006). Implementing complex innovations in fluid multi-
stakeholder environments: Experiences of ‘telecare.’ Technovation, 26(3), 396–406.
Batistič, S., Černe, M., & Vogel, B. (2017). Just how multi-level is leadership research? A
document co-citation analysis 1980–2013 on leadership constructs and outcomes. The
Leadership Quarterly, 28(1), 86–103.
Belout, A., & Gauvreau, C. (2004). Factors influencing project success: the impact of human
resource management. International Journal of Project Management, 22(1), 1–11.
Biesenthal, C., & Wilden, R. (2014). Multi-level project governance: Trends and
opportunities. International Journal of Project Management, 32(8), 1291–1308.
Bourne, L., & Walker, D. H. T. (2005). Visualising and mapping stakeholder influence.
Management Decision, 43(5), 649–660.
Brill, J. M., Bishop, M. J., & Walker, A. E. (2006). The competencies and characteristics
required of an effective project manager: A web-based Delphi study. Educational
Technology Research and Development, 54(2), 115–140.
Carvalho, M. M. de, & Rabechini Junior, R. (2015). Impact of risk management on project
performance: the importance of soft skills. International Journal of Production
Research, 53(2), 321–340.
Chen, C. (2006). CiteSpace II: Detecting and visualizing emerging trends and transient
patterns in scientific literature. Journal of the American Society for Information
Science and Technology, 57(3), 359–377.
Chen, C., Hu, Z., Liu, S., & Tseng, H. (2012). Emerging trends in regenerative medicine: a
scientometric analysis in CiteSpace. Expert Opinion on Biological Therapy, 12(5),
593–608.
Clegg, S. R., Pitsis, T. S., Rura-Polley, T., & Marosszeky, M. (2002). Governmentality
matters: designing an alliance culture of inter-organizational collaboration for
managing projects. Organization Studies, 23(3), 317–337.
Cooke-Davies, T. (2002). The “real” success factors on projects. International Journal of
Project Management, 20(3), 185–190.

44
de Wit, A. (1988). Measurement of project success. International Journal of Project
Management, 6(3), 164–170.
Di Maddaloni, F., & Davis, K. (2018). Project manager’s perception of the local
communities’ stakeholder in megaprojects. An empirical investigation in the UK.
International Journal of Project Management, 36(3), 542–565.
Donaldson, T., & Preston, L. E. (1995). The Stakeholder Theory of the Corporation:
Concepts, Evidence, and Implications. Academy of Management Review, 20(1), 65–
91.
Eadie, R., Browne, M., Odeyinka, H., McKeown, C., & McNiff, S. (2013). BIM
implementation throughout the UK construction project lifecycle: An analysis, 36,
145–151.
Eisenhardt, K. M. (1989). Building Theories from Case Study Research. Academy of
Management Review, 14(4), 532–550.
Elias, A. A., Cavana, R. Y., & Jackson, L. S. (2002). Stakeholder analysis for R&D project
management. R&D Management, 32(4), 301–310.
Eskerod, P., & Huemann, M. (2013). Sustainable development and project stakeholder
management: what standards say. International Journal of Managing Projects in
Business, 6(1), 36–50.
Eskerod, P., Huemann, M., & Savage, G. (2015). Project Stakeholder Management—Past and
Present. Project Management Journal, 46(6), 6–14.
Eskerod, P., & Jepsen, A. L. (2013). Project Stakeholder Management (1 edition). Burlington,
VT: Routledge.
Eskerod, P., & Vaagaasar, A. L. (2014). Stakeholder Management Strategies and Practices
During a Project Course. Project Management Journal, 45(5), 71–85.
Faraj, S., & Sambamurthy, V. (2006). Leadership of information systems development
projects. IEEE Transactions on Engineering Management, 53(2), 238–249.
Fornell, C., & Larcker, D. F. (1981). Evaluating Structural Equation Models with
Unobservable Variables and Measurement Error. Journal of Marketing Research,
18(1), 39–50.
Freeman, R. E. (1984). Strategic management: a stakeholder approach. Boston: Pitman.
Geithner, S., & Menzel, D. (2016). Effectiveness of learning through experience and
reflection in a project management simulation. Simulation & Gaming, 47(2), 228–256.

45
Golini, R., Kalchschmidt, M., & Landoni, P. (2015). Adoption of project management
practices: The impact on international development projects of non-governmental
organizations. International Journal of Project Management, 33(3), 650–663.
Görg, C., Spangenberg, J. H., Tekken, V., Burkhard, B., Thanh Truong, D., Escalada, M., …
Victor Bustamante, J. (2014). Engaging local knowledge in biodiversity research:
experiences from large inter-and transdisciplinary projects. Interdisciplinary Science
Reviews, 39(4), 323–341.
Henderson, J. C., & Lee, S. (1992). Managing I/S Design Teams: A Control Theories
Perspective. Management Science, 38(6), 757–777.
Hummel, J., & van der Duim, R. (2016). SNV’s modes of ordering: Organizing tourism as
development practice. Tourism Management, 57, 312–322.
Jepsen, A. L., & Eskerod, P. (2009). Stakeholder analysis in projects: Challenges in using
current guidelines in the real world. International Journal of Project Management,
27(4), 335–343.
Jiang, J. J., Klein, G., Wu, S. P. J., & Liang, T. P. (2009). The relation of requirements
uncertainty and stakeholder perception gaps to project management performance.
Journal of Systems and Software, 82(5), 801–808.
Jørgensen, M., & Moløkken-Østvold, K. (2004). Reasons for software effort estimation error:
Impact of respondent role, information collection approach, and data analysis method.
IEEE TRANSACTIONS ON SOFTWARE ENGINEERING, 30(12), 15.
Jugdev, K., & Müller, R. (2007). A retrospective look at our evolving understanding of
project success. Engineering Management Review, IEEE, 34, 110–110.
Keegan, A. E., & Den Hartog, D. N. (2004). Transformational leadership in a project-based
environment: a comparative study of the leadership styles of project managers and line
managers. International Journal of Project Management, 22(8), 609–617.
Lim, C. S., & Mohamed, M. Z. (1999). Criteria of project success: an exploratory re-
examination. International Journal of Project Management, 17(4), 243–248.
Littau, P., Jujagiri, N. J., & Adlbrecht, G. (2010). 25 Years of Stakeholder Theory in Project
Management Literature (1984-2009). Project Management Journal, 41(4), 17–29.
Liu, Z., Yin, Y., Liu, W., & Dunford, M. (2015). Visualizing the intellectual structure and
evolution of innovation systems research: a bibliometric analysis. Scientometrics,
103(1), 135–158.
Manowong, E., & Ogunlana, S. (2010). Strategies and tactics for managing construction
stakeholders. Construction Stakeholder Management, 121–137.

46
Mir, F. A., & Pinnington, A. H. (2014). Exploring the value of project management: Linking
Project Management Performance and Project Success. International Journal of
Project Management, 32(2), 202–217.
Mitchell, R. K., Agle, B. R., & Wood, D. J. (1997). Toward a Theory of Stakeholder
Identification and Salience: Defining the Principle of who and What Really Counts.
Academy of Management Review, 22(4), 853–886.
Mok, K. Y., Shen, G. Q., & Yang, J. (2015). Stakeholder management studies in mega
construction projects: A review and future directions. International Journal of Project
Management, 33(2), 446–457.
Muller, R. (2009). Project Governance (1 edition). Farnham, Surrey, England ; Burlington,
VT: Routledge.
Müller, R., Andersen, E. S., Kvalnes, Ø., Shao, J., Sankaran, S., Turner, J. R., … Gudergan,
S. (2013). The Interrelationship of Governance, Trust, and Ethics in Temporary
Organizations. Project Management Journal, 44(4), 26–44.
Müller, R., & Lecoeuvre, L. (2014). Operationalizing governance categories of projects.
International Journal of Project Management, 32(8), 1346–1357.
Müller, R., & Turner, R. (2010). Leadership competency profiles of successful project
managers. International Journal of Project Management, 28(5), 437–448.
Nielsen, K. R. (2004). Risk management: Lessons from six continents. In Pipeline
Engineering and Construction: What’s on the Horizon? (pp. 1–10).
Nunnally, J. C. (1978). Psychometric theory. McGraw-Hill.
Olander, S., & Landin, A. (2005). Evaluation of stakeholder influence in the implementation
of construction projects. International Journal of Project Management, 23(4), 321–
328.
Olawumi, T. O., & Chan, D. W. M. (2018). A scientometric review of global research on
sustainability and sustainable development. Journal of Cleaner Production, 183, 231–
250.
Oliveira, R. A., Lopes, J., Sousa, H., & Abreu, M. I. (2017). A system for the management of
old building retrofit projects in historical centres: the case of Portugal. International
Journal of Strategic Property Management, 21(2), 199–211.
Ouchi, W. G. (1980). Markets, Bureaucracies, and Clans. Administrative Science Quarterly,
25(1), 129–141.
Parolia, N., Goodman, S., Li, Y., & Jiang, J. J. (2007). Mediators between coordination and IS
project performance. Information & Management, 44(7), 635–645.

47
Patnayakuni, R., Rai, A., & Tiwana, A. (2007). Systems development process improvement:
A knowledge integration perspective. IEEE Transactions on Engineering
Management, 54(2), 286–300.
Project Management Institute. (2008). A Guide to the Project Management Body of
Knowledge: PMBOK(R) Guide (4 edition). Newtown Square, Pennsylvania: Project
Management Institute.
Project Management Institute. (2013). A Guide to the Project Management Body of
Knowledge: PMBOK(R) Guide (5 edition). Newtown Square, Pennsylvania: Project
Management Institute.
Rashvand, P., & Zaimi Abd Majid, M. (2013). Critical criteria on client and customer
satisfaction for the issue of performance measurement. Journal of Management in
Engineering, 30(1), 10–18.
Shenhar, A. J., & Dvir, D. (2007). Reinventing Project Management: The Diamond Approach
To Successful Growth And Innovation (Edição: 1). Boston, Mass: Harvard Business
Review Press.
Song, J., Zhang, H., & Dong, W. (2016). A review of emerging trends in global PPP research:
analysis and visualization. Scientometrics, 107(3), 1111–1147.
Turner, R., & Zolin, R. (2012). Forecasting success on large projects: Developing reliable
scales to predict multiple perspectives by multiple stakeholders over multiple time
frames: Forecasting success on large projects. Project Management Journal, 43(5),
87–99.
Turskis, Z. (2008). Multi-attribute contractors ranking method by applying ordering of
feasible alternatives of solutions in terms of preferability technique. Technological and
Economic Development of Economy, 14(2), 224–239.
Vrhovec, S. L. R., Hovelja, T., Vavpotič, D., & Krisper, M. (2015). Diagnosing
organizational risks in software projects: Stakeholder resistance. International Journal
of Project Management, 33(6), 1262–1273.
Wallace, L., Keil, M., & Rai, A. (2004). How Software Project Risk Affects Project
Performance: An Investigation of the Dimensions of Risk and an Exploratory Model*.
Decision Sciences, 35(2), 289–321.
Winter, M., Smith, C., Morris, P., & Cicmil, S. (2006). Directions for future research in
project management: The main findings of a UK government-funded research
network. International Journal of Project Management, 24(8), 638–649.

48
Xia, N., Zou, P. X. W., Griffin, M. A., Wang, X., & Zhong, R. (2018). Towards integrating
construction risk management and stakeholder management: A systematic literature
review and future research agendas. International Journal of Project Management,
36(5), 701–715.
Xie, P. (2015). Study of international anticancer research trends via co-word and document
co-citation visualization analysis. Scientometrics, 105(1), 611–622.
Yang, R. J., Wang, Y., & Jin, X.-H. (2014). Stakeholders’ Attributes, Behaviors, and
Decision-Making Strategies in Construction Projects: Importance and Correlations in
Practice. Project Management Journal, 45(3), 74–90.
Yin, R. K. (2003). Case Study Research: Design and Methods. SAGE.
Zavadskas, E. K., Turskis, Z., & Tamošaitiene, J. (2008). Contractor selection of construction
in a competitive environment. Journal of Business Economics and Management, 9(3),
181–187.
Zhao, X. (2017). A scientometric review of global BIM research: Analysis and visualization.
Automation in Construction, 80, 37–47.
Zupic, I., & Čater, T. (2015). Bibliometric Methods in Management and Organization.
Organizational Research Methods, 18(3), 429–472.

49
APPENDIX A – Keyword alias
ALIAS KEYWORD
construction
construction industry
construction project
construction project
construction management
governance governance of project
project governance
risk management Risk
success project success
Success
portfolio portfolio management
success project success
information technology
Technology
information system
System
software development global software development
decision decision tree
decision making
knowledge management Knowledge
project management knowledge
critical success factor success factor
success criteria
project lifecycle Lifecycle
importance performance analysis importance-performance analysis
performance project performance
project management project management
infrastructure infrastructure project
infrastructure delivery

50
2.2 STUDY 2: INFORMATION TECHNOLOGY PROJECT PERFORMANCE:
WHAT HAS IMPACT ON RESULTS AND HOW SUCH IMPACT HAS BEEN
MEASURED
2.2.1 INTRODUCTION
Information Technology Project performance (ITPP) has gained different definitions
in the literature. It has been traditionally defined based on scope, budget and schedule targets;
however, practitioners and researchers have suggested to broaden this definition in order to
include business value results in it (Reich, Gemino, & Sauer, 2014). Project performance can
be related to both processes (due to management practices) to project product results
(Gemino, Reich, & Sauer, 2008). Process performance describes how well processes set to
develop Information Technology (IT) projects, such as iron triangle scope, time and budget,
are undertaken by covering project management activity results (Liu, 2015). Product
performance describes the quality of products generated by IT, how such products are
evaluated by stakeholders, as well as add value to business and fit quality criteria (Liu &
Deng, 2015).
Measuring ITPP is challenging due to the diversity of factors related to planning,
controlling and measuring results. ITPP depends on factors other than just a single successful
or failed factor (Liu, 2015). Successful project outcomes depend on several factors affected by
project managers’ competences, by project teams comprising individual and group skills and
by organizational skills that create an environment that affects project activities and results
(Hadad, Keren, & Laslo, 2013). Many studies in the literature measure ITPP as success or
failure factor, as well as how project variables likely drive success or failure (Sewchurran &
Barron, 2008; Chen, Law, & Yang, 2009; Araújo & Pedron, 2015; Hidding & Nicholas, 2017;
Foote & Halawi, 2018). Other studies define project performance as dependent variable used
to test the effectiveness of any assessed construct in project results (Gemino et al., 2008;
Lechler & Dvir, 2010; Heim, Mallick, & Xiaosong Peng, 2012; Aubry & Brunet, 2016;
Nabelsi, Gagnon, & Brochot, 2017; Wei, Du, & Bao, 2018). It is possible finding many ways
to measure project performance and to relate it to project practices, human skills and
organizational factors. It is important taking into consideration that project performance

51
changes due to the degree of fitting to planned and expected results in order to achive
effective project performance mesurements (Sicotte & Langley, 2000).
The present systematic review on ITPP was run to identify how performance has been
measured and related to project management constructs. Data were collected at Web of
Science and Elsevier Scopus databases, based on retrieving blind review journals regarding IT
projects and performance results. The aim of the current study was to answer the question
about IT project practices identified in the literature as ITPP impacting and the variables used
to measure it. Connections between project practices and performance variables were
analyzed to draw a relationship-map by identifying four groups of antecedents and two groups
of results. The designed map made it possible identifying the IT project management practices
that have been measured and related to project performance, in addition to management
practices relating project IT performance to organizational factors, human resource skills and
IT tools.
Literature reviews can capture theoretical pluralism, offer some degree of integration
and combination, or parallel considerations on theoretical concepts, as well as foster new
ideas and the overall development of a given study field (Stingl & Geraldi, 2017). Actually,
different systematic review types have been conducted by researchers to better understand
project performance or project studies; however, these studies only investigate specific
project management practices or behaviors, rather than investigating and building broad
reviews about associations between project performance and project management (Brooks,
Waylen, & Borgerhoff Mulder, 2012; Sherman & Ford, 2014; Ahmad & Aibinu, 2017;
Jayatilleke & Lai, 2018; Lappi, Karvonen, Lwakatare, Aaltonen, & Kuvaja, 2018). The
present systematic review was based on the assumption that references are studies presenting
conceptual connections to project results identified as successful ITPP or IT projects.
The present study also aims at contributing to the ITPP subject by comparing articles
reporting empirical findings about the addressed topic by representing common conceptual
ties among them. While some articles report project management practices affecting ITPP
(Foote & Halawi, 2018; Keil, Rai, & Liu, 2013; Naqvi, Bokhari, Aziz, & Rehman, 2011),
others address the organizational factors influencing it (Sarif, Hamidi, Ramli, & Lokman,
2016; Gu, Hoffman, Cao, & Schniederjans, 2014; Sewchurran & Barron, 2008). There are
research focusing on different constructs as independent variables and variables dependent on
ITPP, namely: project cost (Keil et al., 2013; Gu et al., 2014; MacCormack & Mishra, 2015),
stakeholder’s satisfaction (Chung, Skibniewski, & Kwak, 2009; Ram, Corkindale, & Wu,
2013) and product performance (Liu, 2016; Liu & Deng, 2015), among others. A relationship

52
map was employed to identify the measured ITPP variables available in the literature, and the
constructs assessed by researchers as ITPP impacting. Hence, the study is an attempt to find
common factors on ITPP by identifying groups of variables linked to project managers’ skills,
project management practices and environmental factors.
The present article was divided into four sections. The next section introduces articles
on project performance and project success definitions, and on ITPP. The adopted literature
review method will be explained, including the search, selection and evaluation procedures, as
well as the list of included or excluded articles. The results section will analyze the literature,
find correlations among publications, draw the relationship map and present groups of ITPP
and antecedent variables. Conclusion section will recall the research question, and present the
addressed contributions and limitations of the present study.
2.2.2 LITERATURE REVIEW
Project performance measurement and project success atributions are traditionally
defined based on three criteria: budget, time and scope. In order for a project to be successful,
it must fullfil planned time, budget and scope constraints (Pinto & Mantel, 1990; Mitchell &
Zmud, 1999). Based on the literature, there are many other criteria and variables concerning
project performance; however, according to practitioners’ traditional understanding about a
successfully implemented IT project, success comes from project’s delivery in time, cost
budgets and compliance with specifications - these factors still prevail as paradigms in this
field (Müller & Martinsuo, 2015). As for most project managers, their job is successfully
complete when they finish the project within the expected budget, time and specifications
(Karlsen, Andersen, Birkely, & Ødegård, 2005). Results have been represented by the so-
called iron triangle, which encompasses cost, time and scope criteria. The cost criterion
concerns full project completion within expenses below the agreed maximum for it; time
criterion means its completion at the agreed date and (Mahaney & Lederer, 2010) the scope
criterion means delivering outcomes in compliance with the agreed specifications (Karlsen et
al., 2005). Some iron-triangle variances regard quality targets, which means that IT projects
must reach the perceived quality system (Keil et al., 2013). IT project quality means its
compliance with some pre-set technical and functional criteria or achieving acceptable user or
management satisfaction levels (Munns & Bjeirmi, 1996; Mahaney & Lederer, 2010). IT
projects are often divided into three groups based on the application of these criteria, namely:
53
failed, challenged and successful projects, which are intended at finding out common factors
affecting the final status of the project (Handzic, Durmic, Kraljic, & Kraljic, 2016).
Project results are not only measured through the iron triangle, since there are other
criteria applicable to that. They have been measured by criteria other than project time,
including the time of operations necessary to achieve project outcomes (Jugdev & Müller,
2005; Müller & Martinsuo, 2015). Actually, factors other than budget, schedule and scope are
acknowledged as influential to benefits brought from business (Reich et al., 2014).
Some researchers have divided the project performance definition in two different
parts: product and project performances. It is done to distinguish results from activities, from
projects put in place and from project outcomes, which are measured after the project is
concluded (Nidumolu, 1996; de Wit, 1988; Reich et al., 2014; González-Benito, Venturini, &
González-Benito, 2017; Engelbrecht, Johnston, & Hooper, 2017). Project and product
performances concern effective project management and the achievement of global project
outcomes (González-Benito et al., 2017). These two performances are interconnected and
interdependent, since project implementation procedures affect users’ satisfaction with project
outcomes (Mitchell & Zmud, 1999).
The project management performance has been thought in terms of whether it meets
pre-set constraints such as planned schedule, pre-set budget and agreed scope (Reich et al.,
2014). These three factors can also be used to measure project manager performance, which is
also addressed as process performance in the literature (Keil et al., 2013; Liu, 2016).
Although both terms are employed with the same meaning, project management performance
describes how well IT-project processes are undertaken (Liu, 2016). Project management
performance regards projects’ internal view and focuses on successful time, cost and quality
accomplishments, as well as on project management conduction, including the fulfilment of
stakeholders’ needs (Engelbrecht et al., 2017). Using project management performance
variables is a way to capture critical iron–triangle elements and to broaden project manager
performance analyses (Keil et al., 2013).
Product performance variables are applied to measure how a given project has
delivered reliable outcomes and met functional requirements (Reich et al., 2014). IT project
performance can be defined as a measurement applicable to a point in time set for benefits
resulting from information systems perceived by all groups of key users (Gable, Sedera, &
Chan, 2008). Project results cannot be measured while project is still running and before
outcomes are accomplished, but throughout project-outcome’s operational life (Mahaney &

54
Lederer, 2010). Product performance represents the external effectiveness of project
environment and regards long-term perspectives (Engelbrecht et al., 2017).
2.2.3 METHOD
The systematic literature review method is a way to combine a large body of
information and to help answering questions about studies in the literature that regard the
research topic, or not (Petticrew & Roberts, 2005). This method provides researchers with
specific tools to disclose core subjects, approaches, trends and results in a given research field
(von Danwitz, 2018). It can be used by researchers to gather evidences that fit pre-set
eligibility criteria in the literature in order to reach specific goals (Green & Higgins, 2005).
Systematic literature reviews allow researchers to collect, analyze and develop academic
contributions to a research topic in a transparent and reproducible manner (von Danwitz,
2018).
The systematic literature review was herein applied to address the research question
presented in the introduction section. The adopted process was adapted from Tranfield et al.
(2003), who used three steps to do so: Planning, Running and Reporting. Figure 17 shows the
steps taken during the current research and the procedures applied to each step.
Planning a systematic literature review is essential to define scopes, relevant research,
literature extension and to delimit the knowledge field (Tranfield et al., 2003). Planning
concerned identifying and justifying the need of the study. Searches about ITPP were carried
out in scientific databases to validate existing studies and topic comprehensiveness. A
research protocol to retrieve the literature about ITPP topic was developed. Search meshes
were defined based on the research question, namely: project management and performance,
and information technology - word success was added as synonym with the term
“performance”, as it is used by several researchers in the literature. Search meshes were
“project manage*", performance and "Information Technology", or "project manage*",
success and "Information Technology". The following databases were accessed: ISI Web of
Science and Scopus. Query concerned articles’ title, keywords and abstract. Creating a “must
have” validation to be applied to the selection stage was the last step in this phase. The
selected articles about IT Project were validated based on reports on project performance
results and on empirical data published for the first time.
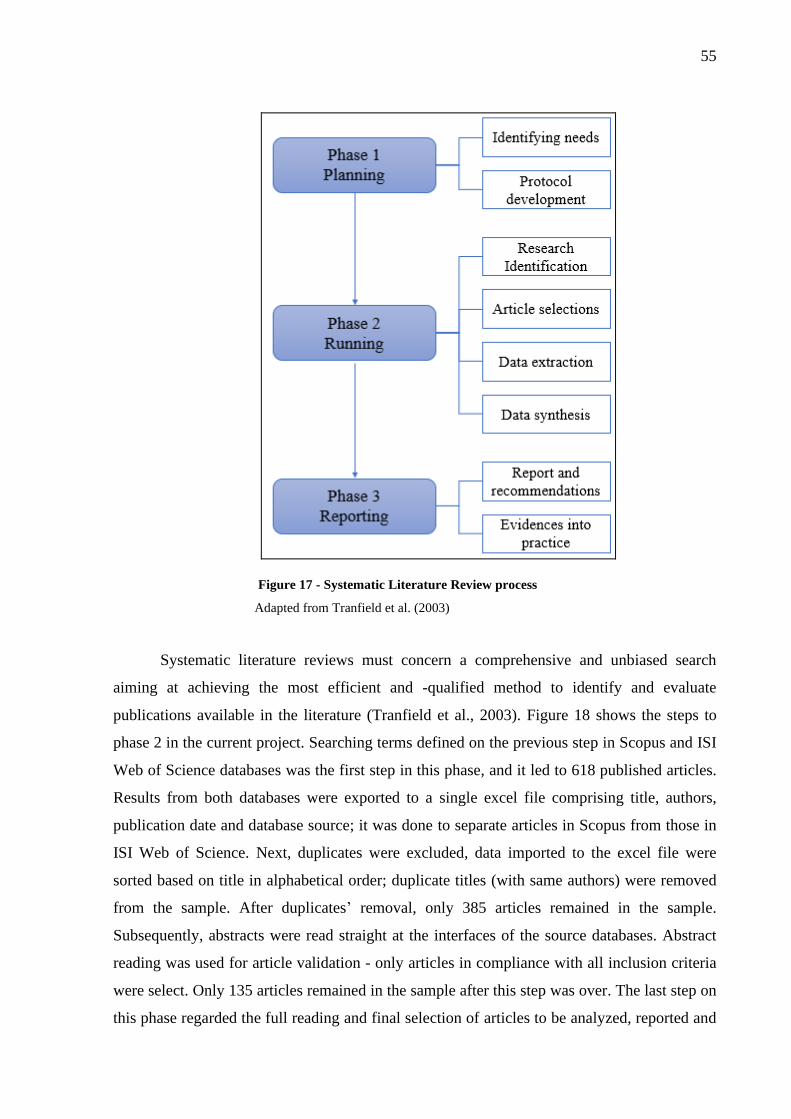
55
Figure 17 - Systematic Literature Review process
Adapted from Tranfield et al. (2003)
Systematic literature reviews must concern a comprehensive and unbiased search
aiming at achieving the most efficient and -qualified method to identify and evaluate
publications available in the literature (Tranfield et al., 2003). Figure 18 shows the steps to
phase 2 in the current project. Searching terms defined on the previous step in Scopus and ISI
Web of Science databases was the first step in this phase, and it led to 618 published articles.
Results from both databases were exported to a single excel file comprising title, authors,
publication date and database source; it was done to separate articles in Scopus from those in
ISI Web of Science. Next, duplicates were excluded, data imported to the excel file were
sorted based on title in alphabetical order; duplicate titles (with same authors) were removed
from the sample. After duplicates’ removal, only 385 articles remained in the sample.
Subsequently, abstracts were read straight at the interfaces of the source databases. Abstract
reading was used for article validation - only articles in compliance with all inclusion criteria
were select. Only 135 articles remained in the sample after this step was over. The last step on
this phase regarded the full reading and final selection of articles to be analyzed, reported and

56
criticized. All 135 articles were read to identify whether they concerned the research scope,
had high-quality empirical data, dependent and independent variables, and would validate the
proposed hypothesis. Articles not clearly related to project performance, lacking clear data
source and clear hypothesis validation or proposition were excluded. After all steps set for
this phase were over, only 76 articles remained in the sample to be analyzed and reported in
the next phase.
Figure 18 - Article selection steps
A good systematic literature review shall make it easier for other researchers or
practitioners to understand the research topic, since it must synthetize publications on primary
research used as source for derived studies (Tranfield et al., 2003). The reporting phase was
followed in order to introduce synthetized data from the 76 analyzed articles in order to
answer the present research question. Identifying antecedents reported as ITPP impacting
variables used to measure ITPP, relationships’ meanings and reported results were the criteria
adopted for articles’ analysis.
Results were reported in two parts; the first part aimed at identifying groups of
relationships and creating a relationship-map to provide the big picture of construct-
relationships about ITPP. The CMapTools software was used to create such big picture and to
interconnect relationships. The second part of them regarded the descriptive analysis of
relationships applied to identify groups based on similarities and on describing how a given
article would relate to each variable. The next section provides details on the recorded results.

57
2.2.4 RESULTS
2.2.4.1 Relationship map
Figure 19 shows the relationship-map plotting based on relationships reported in all
analyzed articles. Each article in this section provides reports on ITPP impacting constructs
and their empirical validation. Some of the articles have identified variables used to measure
results of a given construct and some others did not identify variables, but only addressed
construct concepts.
Four groups of antecedent constructs were identified in the literature and they were
defined based on similarities. The first group encompassed articles reporting Project
Managers’ Competences, it was called Project Mgr Competence Group and comprised
activity assets including knowledge, skills, abilities and personal features necessary for
successfully accomplishing project goals. The second group encompassed software used to
manage projects, which were called PM Tool, as well as information technologies used in
projects for different purposes, such as efficiency instrument for project managers. The third
group was called Firm Factors, its factors referred to events outside the project environment,
wich were determined by firms’ structure. The fourth group concerned project management
activities, also knonw as PM Activity; this group encompassed constructs focusing on
identifying activities carried out by project managers and teams during the lifecycle of a given
project.
Two groups of project performance were identified in the literature and they were
defined based on focus on results. The first performance group regarded project management
efficency, which was called PM Result; this group encompassed constructs set to measure
results from project activities in comparison to the planned numbers. The second performance
group focused on project outcomes, the so-called Product Result; this group encompassed
constructs regarding measurements set to evaluate the quality of a given product created by
the project in question and how this product is evaluated based on the use and enhancement of
firms’ results.

58
Figure 19 - Project performance relationship map

59
2.2.4.2 Information technology project performance antecedents
2.2.4.2.1 Project managers’ competences
There is not only one definition of competence, but it has been the object of debate and
remains a contentious topic in the organizational literature (Crawford, 2005). Some authors
identify technical and interpersonal skills to define competences (Geithner & Menzel, 2016;
Pant & Baroudi, 2008). Other authors identify competence as set of individual knowledge,
skills and personal features used to perform a specific task or activity. Oftentimes,
competence definition is disrupted into specific competences or skills.
Authors in some of the herein selected articles address hard and soft skills, and past
project performance as part of project managers’ competences (Sarantis, Smithson,
Charalabidis, & Askounis, 2010; Afzal, Khan, & Mujtaba, 2018; Wang, Chou, & Jiang, 2005;
Napier, Keil, & Tan, 2009), which, in their turn, are related to project performance. These
authors have tested and presented specific skills through empirical evidences about the
association between project results and project management performance (Hadad et al., 2013;
Araújo & Pedron, 2015; Pollack & Adler, 2016). Results of projects previously experienced
by project managers are also related to project performance (Sicotte & Langley, 2000; Hadad
et al., 2013).
The literature makes available a list of skills related to project performance. Napier
(2009) lists nine skill categories, namely: client management, communication, general
management, leadership, personal integrity, planning and control, problem solving, system
development and team development. These authors present evidences on how improvements
in this skill categories reflect on successful project management practices. Araújo and Pedron
(2015) addressed five skills essential for project managers - based on order of importance - for
project performance: team management, business domain knowledge, project management,
communication and individual skills. Pollack and Adler (2016) showed how technical project
management skills have significant effect on whether an organization reports profitability
increase. There are empirical evidences about the relevance of project managers’ soft skills,
but such relevance does not mean that hard skills are not important. Hard skills are described
by specialists as important skills to the establishment of clear communication with technical
teams and to make technical decision-making easier (Araújo & Pedron, 2015).

60
The literature also related project leadership to project performance. Formal leadership
is related to project performance, reduced uncertainty at acting as data transmission
connection between team members, and between team and top management (Sicotte &
Langley, 2000). These authors found evidences that empowered project leadership reduces
mistakes and uncertainty, since it has positive correlation to project performance. Afzal et. al
(2018) investigated transformational leadership and its positive association with project
performance. Transformational leadership tends to apply open communication and
progressive leadership styles. Transformational leaders are inspiring and encouraging, they
stand for their teams, motivate employees, show them the correct path and boost their
confidence; consequently, they achieve a responsive and pleasant environment to attain to
project goals (Afzal et al., 2018). Charismatic leadership is also relates to positive influence
on project performance. Project leaders following the charismatic leadership style
significantly influence team cohesiveness levels, which, in their turn, affect the overall
performance of project teams (Wang et al., 2005). These studies have shown different
leadership styles, although there is nobetter or worse style, but specific leadership styles that
can be related to specific project results.
2.2.4.2.2 Organizational factors
Organizational factors result from organization structures such as project environment.
Organizational factors must encompass activities such as task allocation, coordination and
supervision, which head towards organizations’ goal. Moreover, the environment and local
culture perspective can influence the formation and success of organizations’ structures (Sarif
et al., 2016). Sarif et al (2016) presents project management officie structure as an
organizational factor, the role of top management in project conduction, organizations’
features and capabilities. Some organizational factors are not directly related to effects on
project performance, but they moderate project management activities and project
performance relationships or act as antecedents affecting project management activities
related to project performance.
Organizational factors can have positive effect on project knowledge management and
their results can affect ITPP. Every organization has valuable intellectual material expressed
in data; documents; procedures; in people, organizational structure and process’ capabilities,
as well as in relationships with customers (Handzic et al., 2016). Handzic et al. (2016) found

61
positive influence of project-related intellectual assets on project success based on direct and
indirect project-success variables concerning team performance, process and customers.
These authors also confirmed the mediation role played by the intellectual capital in
exploiting team/customer's relationships in order to reach project success. Organizations
incentive and support to knowledge sharing is another important factor affecting knowledge
management. Knowledge sharing, development, reuse and outspread make it possible
reducing project time and costs and improving the quality of the project (Nabelsi et al., 2017).
Nabelsi et al (2017) found strong positive correlation between wiki quality and project
performance when wikis are used to register and share lessons learned from a given project.
Project managers must make sure to properly measure the intensity of knowledge needs in
order to motivate team members to share their knowledge about challenges set by the task to
be accomplished (Nabelsi et al., 2017). An important aspect of knowledge sharing lies on how
individuals learn from the outspread information. Organizations should make it easier for
individuals to learn from the development of systems and processes at corporate level
(McKay II & Ellis, 2015). McKay II and Ellis (2015) have shown the positive and significant
correlation between learning from projects and ITPP in their research. They also identified
organizational learning processes as project learning facilitators.
Top management teams play important role in projects and are directly associated with
project performance results. Collective and cooperative participation of top managers,
business managers and IT managers increases IT quality and reduces project implementation-
associated issues (Kearns & Sabherwal, 2007). Several factors influence project success, but
business managers’ IT can have substantial influence on IT PP (Engelbrecht et al., 2017). Top
managers’ participation effects on IT projects is vital to IT success; on the other hand, their
indifference towards IT could lead to poor performance (Kearns & Sabherwal, 2007).
Assessing IT Executive managers’ role in project results is essential, since they blame
themselves for failures, but acknowledge external factors for successful outcomes (Standing,
Guilfoyle, Lin, & Love, 2006). Top management support is an essential factor in all project
environments, and its importance is expected to remain in the mainstream (Rosacker & Olson,
2008).
The project management office deals with several projects at the same time and keeps
all of them under control and effective (Güngör & Gözlü, 2017). Public administrations
companies dealing with environmental projects, should adopt project management offices in
order to help project managers to anticipate changing needs, so that projects can be carried out
successfully (Aubry & Brunet, 2016). The internal structure of a project management office

62
does not have direct influence over project performance; support to project management’s
authority is more important than its structure in the way to project success (Lechler & Dvir,
2010). PMO success in managing project teams has positive effect on communication
management and on project performance results (Güngör & Gözlü, 2017).
2.2.4.2.3 Project management technologies
Bardhan, Krishnan and Lin (2007) investigated how Information technology
applications are translated into higher project performance. According to these authors, IT
applications, underlying project tasks and operating environments are associated with
improvements in project competencies. Their findings suggest that just measuring alignment
impact on project performance is not enough. It is more important assessing whether IT
project alignment is followed by corresponding improvements in operational project
competences. They have concluded that organizations bring significant benefits to project
outcomes when alignment is translated into measurable improvements in project
competences.
Other studies have investigated the impact of IT applications on project performance.
Bardhan, Krishnan and Lin (2013) found that high volume of information on IT projects help
mitigating the negative effect of team dispersion on project performance. Mitchell & Zmud
(1999) addressed that project performance improves due to tightly coupled IT and works as
process strategy when process inventions are implemented, as well as to strategies loosely
coupled when imitations are implemented. Heim et al (2012) described that IT tools
supporting design/validation phases are correlated to positive product performance, time-to-
market and responsiveness. Tools supporting high-quality communication in outsourced
information system projects also support internal control function and enhance project results
(Gantman & Fedorowicz, 2016)
2.2.4.2.4 Project management activities
Different project management activities are directly correlated to project performance.
This section describes correlations between project management activities and IT PP.

63
Risk management is a key part of project management because it provides project
managers with forward-looking view of both the threats and opportunities to improve project
success (Pimchangthong & Boonjing, 2017). Poor project risk management is negatively
associated with product project performance (Liu, 2016). Risk mitigation is a proactive
project management activity aiming at reducing risks’ negative impact on project performance
(Gemino et al., 2008). Liu and Wang (2014) observed strong correlation among performance,
social subsystem and project management risks in both internal and outsourced projects.
Knowledge management enables organizations to capture, store, transfer and retrieve
knowledge by ensuring the effective use of knowledge by employees to understand how, why
and what to accomplish (McKay II & Ellis, 2015). Reich et al. (2014) did not find evidences
to support correlation between knowledge management and project management
performance, but they found that lack of investment in knowledge management drives project
managers to significantly increase budget and schedule variances. Knowledge management
should also pay close attention to knowledge losses and focus on avoiding them to reduce
their negative effects on IT PP (Reich, Gemino, & Sauer, 2008). Information system projects
have evidenced effective knowledge management related to the creation of high-quality
software in the design and code review phase (Foote & Halawi, 2018).
Human resources management must focus on team-building development,
transformational leadership and effective communication (Bhoola & Giangreco, 2018).
Members of a project must effectively socialize with internal and external members in order
to ensure smooth inclusion of, and better contribution to, projects affecting their results
(Bhoola & Giangreco, 2018). Human resources management help projecting managers to
positively apply project performance monitoring over project results by creating clear
monitoring systems involving the whole team (Naqvi et al., 2011). Project status monitoring
through meetings makes it easier to broaden knowledge on project status and agents’
accomplishments - such a knowledge discourages agents from carrying out loafing and
poorly–focused activities (Mahaney & Lederer, 2010).
Communication management must promote deeper communication levels and lead to
higher levels of IT planning sophistication to increase the quality of IT plans and top
management participation in the selection of IT investments (Kearns & Sabherwal, 2007).
Project managers must pay attention to communication, and use it as tool to support conflict
solving, to monitor project performance and to pay attention on customers’ needs (Gantman
& Fedorowicz, 2016). Attention on communication enhances the perceived project results
(Gantman & Fedorowicz, 2016). Communication management is identified through managers

64
and customers’ practices as part of the top five critical success factors in small and mid-sized
IT companies (Singh, 2018).
Formal contracts are an important instrument for project governance, since they are the
way organizations adopt to control and compensate partners (MacCormack & Mishra, 2015).
Partners play an important role in many projects, since their activities have direct impact on
project results, mainly when it comes to costs and quality (MacCormack & Mishra, 2015).
These authors found that choices between fixed price and flexible contracts should be very
well analyzed - the choice for flexible contracts in mistaking project scenarios is associated
with cost increase. Vendor contract schemas have moderate effect on the association between
partnership quality and project performance (Wei et al., 2018). These authors stated that
knowledge protection contracts have negative effect on partnership quality.
Based on the literature, adopting a project management methodology has some impact
on ITPP. Formalized project management methodologies means standardizing project
activities affecting the whole project (Wells, 2012). According to Wells (2012), project
management office contributions to project results are not perceived by everyone in the
company in the same way. Project Management Body of Knowledge (PMBOK) can
contribute to project success by establishing principles to be reached by IT information
system projects (Hidding & Nicholas, 2017). There is a gap between PMMs’ perceived
contribution at strategic and organizational levels in comparison to benefits perceived at
project and operational levels. Project management methodology contribution to ITPP is more
clearly perceived at strategic level than at operational level in organizations (Wells, 2012).
2.2.4.3 Project performance
This section presents how IT PPs are measured, it is structured into two different
dimensions: the first one regards the project management performance dimension and the
second concerns project outcome performance.
65
2.2.4.3.1 Project management performance
Project management performance refers to accomplishing planned numbers regarding
time, scope and cost constraints. Meeting projects’ goals is another factor used to measure
project management performance (Pimchangthong & Boonjing, 2017; González-Benito et al.,
2017).
Based on the literature, project costs are measured according to two different
perspectives: one regards how to reduce project costs, increase project efficiency and payoff
(Lisburn & Baxter, 1994; Plaza, 2016; Spalek, 2014); the other concerns measuring project
success or performance by adopting cost compliance as variable for this construct (Sicotte &
Langley, 2000; Keil et al., 2013; Reich et al., 2014; Gu et al., 2014). Avoiding cost overrun
must be one of project managers’ primary concerns (Naqvi et al., 2011). Several variables
could have impact on PP, but, based on prior research, cost is identified as one of the
variables most likely influencing it (Keil et al., 2013).
Scope management is part of triple constraints applicable to projects, since these areas
are the primary functions of project management (Naqvi et al., 2011). Some studies have
suggested that project scope influences the outcome from efforts to develop an IT project; so,
the larger the project, the more likely for it to face performance issues (Keil et al., 2013).
Fulfilling the scope, customers and organizations’ needs are an important metric to be
followed during IT project conduction (Naqvi et al., 2011).
Project completion in time is part of the concept applied to successfully implement a
project; it can also be used to measure project results (Ram et al., 2013). It is a critical factor
for projects, but there are many factors likely influencing it; therefore, they should be
evaluated and tested (MacCormack & Mishra, 2015). Delayed project delivery is among the
main causes of customers’ dissatisfaction and complaints (Naqvi et al., 2011). Variable
“completion in time” must be taken into consideration and investigated when project
performance is analyzed (Sarif et al., 2016).
2.2.4.3.2 Project outcome performance
The performance of IT project products describes the quality generated by the
development process applied to an IT project and how the software is delivered to users
(Reich et al., 2014). Product performance refers to the quality of the developed system, and it

66
must include considerations about benefits brough by the delivered product (Gemino et al.,
2008). Based on the literature, this variable is used to validate reliable outcomes of a given
project when it comes to fulfilling functional requirements (Liu & Deng, 2015).
Project outcome performance was associated with different product aspects deriving
from the project itself and with their impact on organizations. The quality of an IT product is
measured through its adherence to pre-defined criteria, mainly through how software are
performing in terms of time-response, easiness to use and number of users in organizations
(Heim et al., 2012; Reich et al., 2014; MacCormack & Mishra, 2015). Software success
implies positive effects of software using on companies’ outcomes (González-Benito et al.,
2017). Companies expect to be benefited from software implementation, including improved
performance indicators (González-Benito et al., 2017). Market share increment is an
important dimension to be evaluated - projects can favor organization due to sales growth.
2.2.4.4 Project performance attributes and correlations
Based on Figure 19, it is possible identifying all attributes adopted by researchers to
measure project performance. Figure 20 shows the correlations between project performance
attributes (outcomes) and antecedent attributes (incomes) observed in the present literature
review. It enabled finding the existing research on the project management field and on the
impact of project performance attributes.
Figure 20 - Attributes relations matrix

67
2.2.5 CONCLUSIONS
The project management literature is deeply focused on results and on correlating
activities and events during projects’ life cycle to performance or success. The present
literature review made it possible seeing project performance and project success as
synonyms, in many cases. Some studies regard project success and adopt the iron triangle
(scope, time and cost) as dependent variable (Ram et al., 2013; Sarif et al., 2016; Engelbrecht
et al., 2017), whereas others concern project performance and adopt the same iron triangle as
dependent variable (Sicotte & Langley, 2000; Keil et al., 2013; Liu & Deng, 2015). IT PP
does not dependent on the iron triangle as the only variable to be measured. The literature has
bought other dimensions and other variables to be measured by means of identifying and
differentiating project management performance and the performance of a given product
developed during the project.
The fact of being a systematic review is a limitation of the present study, since project
management performance or studies on success were its starting points. Although it was the
aim of the study, such an aim can bring biases along such as studies with no direct effect on
performance. The adoption of the herein addressed dimensions allowed broadening the view
over projects and over their impact on organizations. Future studies can develop frameworks
to help better understanding events that have different impact on both project management
performance and product performance.
2.2.6 REFERENCES
Afzal, A., Khan, M. M., & Mujtaba, B. G. (2018). The impact of project managers’
competencies, emotional intelligence and transformational leadership on project
success in the information technology sector. Marketing and Management of
Innovations, (2), 142–154.
Ahmad, T., & Aibinu, A. A. (2017). Project delivery attributes influencing green building
project outcomes a review and future research directions. Built Environment Project
and Asset Management, 7(5), 471–489.
Araújo, C. C. S. de, & Pedron, C. D. (2015). The IT project manager competencies that
impact project success – A qualitative research. Organisational Project Management,
2(1), 53.

68
Aubry, M., & Brunet, M. (2016). Organizational design in public administration:
Categorization of project management offices. Project Management Journal, 47(5),
107–129.
Bardhan, I., Krishnan, V. V., & Lin, S. (2013). Team dispersion, information technology, and
project performance. Production and Operations Management, 22(6), 1478–1493.
Bardhan, I. R., Krishnan, V. V., & Lin, S. (2007). Project performance and the enabling role
of information technology: An exploratory study on the role of alignment.
Manufacturing & Service Operations Management, 9(4), 579–595.
Bhoola, V., & Giangreco, A. (2018). HR activities and practices for project success: A multi-
method approach from Indian IT firms. Australasian Journal of Information Systems,
22.
Brooks, J. S., Waylen, K. A., & Borgerhoff Mulder, M. (2012). How national context, project
design, and local community characteristics influence success in community-based
conservation projects. Proceedings of the National Academy of Sciences of the United
States of America, 109(52), 21265–21270.
Chen, C. C., Law, C., & Yang, S. C. (2009). Managing ERP implementation failure: A project
management perspective. IEEE Transactions on Engineering Management, 56(1),
157–170.
Chung, B., Skibniewski, M. J., & Kwak, Y. H. (2009). Developing ERP systems success
model for the construction industry. Journal of Construction Engineering and
Management, 135(3), 207–216.
Crawford, L. (2005). Senior management perceptions of project management competence.
International Journal of Project Management, 23(1), 7–16.
de Wit, A. (1988). Measurement of project success. International Journal of Project
Management, 6(3), 164–170.
Engelbrecht, J., Johnston, K. A., & Hooper, V. (2017). The influence of business managers’
IT competence on IT project success. International Journal of Project Management,
35(6), 994–1005.
Foote, A., & Halawi, L. A. (2018). Knowledge management models within information
technology projects. Journal of Computer Information Systems, 58(1), 89–97.
Gable, G. G., Sedera, D., & Chan, T. (2008). Re-conceptualizing information system success:
The IS-impact measurement model. Journal of the Association for Information
Systems, 9(7), 18.

69
Gantman, S., & Fedorowicz, J. (2016). Communication and control in outsourced IS
development projects: Mapping to COBIT domains. International Journal of
Accounting Information Systems, 21, 63–83.
Geithner, S., & Menzel, D. (2016). Effectiveness of learning through experience and
reflection in a project management simulation. Simulation & Gaming, 47(2), 228–256.
Gemino, A., Reich, B. H., & Sauer, C. (2008). A temporal model of information technology
project performance. Journal of Management Information Systems, 24(3), 9–44.
González-Benito, Ó., Venturini, W. T., & González-Benito, J. (2017). CRM technology:
Implementation project and consulting services as determinants of success.
International Journal of Information Technology & Decision Making, 16(02), 421–
441.
Green, S., & Higgins, J. (2005). Cochrane handbook for systematic reviews of interventions.
Version.
Gu, V. C., Hoffman, J. J., Cao, Q., & Schniederjans, M. J. (2014). The effects of
organizational culture and environmental pressures on IT project performance: A
moderation perspective. International Journal of Project Management, 32(7), 1170–
1181.
Güngör, D. Ö., & Gözlü, S. (2017). Investigating the relationship between activities of project
management offices and project stakeholder satisfaction. International Journal of
Information Technology Project Management, 8(2), 34–49.
Hadad, Y., Keren, B., & Laslo, Z. (2013). A decision-making support system module for
project manager selection according to past performance. International Journal of
Project Management, 31(4), 532–541.
Handzic, M., Durmic, N., Kraljic, A., & Kraljic, T. (2016). An empirical investigation of the
relationship between intellectual capital and project success. Journal of Intellectual
Capital, 17(3), 471–483.
Heim, G. R., Mallick, D. N., & Xiaosong Peng. (2012). Antecedents and consequences of
new product development practices and software tools: An exploratory study. IEEE
Transactions on Engineering Management, 59(3), 428–442.
Hidding, G. J., & Nicholas, J. M. (2017). A new way of thinking about IT project
management practices: Early empirical results. Journal of Organizational Computing
and Electronic Commerce, 27(1), 81–95.
Jayatilleke, S., & Lai, R. (2018). A systematic review of requirements change management.
Information and Software Technology, 93, 163–185.

70
Jugdev, K., & Müller, R. (2005). A retrospective look at our evolving understanding of
project success. Project Management Journal, 36(4), 19–31.
Karlsen, J. T., Andersen, J., Birkely, L. S., & Ødegård, E. (2005). What characterizes
successfull IT projects. International Journal of Information Technology & Decision
Making, 04(04), 525–540.
Kearns, G. S., & Sabherwal, R. (2007). Antecedents and consequences of information systems
planning integration. IEEE Transactions on Engineering Management, 54(4), 628–
643.
Keil, M., Rai, A., & Liu, S. (2013). How user risk and requirements risk moderate the effects
of formal and informal control on the process performance of IT projects. European
Journal of Information Systems, 22(6), 650–672.
Lappi, T., Karvonen, T., Lwakatare, L. E., Aaltonen, K., & Kuvaja, P. (2018). Toward an
improved understanding of agile project governance a systematic literature review.
Project Management Journal, 49(6), 39–63.
Lechler, T. G., & Dvir, D. (2010). An alternative taxonomy of project management structures:
Linking project management structures and project success. IEEE Transactions on
Engineering Management, 57(2), 198–210.
Lisburn, D., & Baxter, S. (1994). Applying business-process reengineering to IT project
development. International Journal of Project Management, 12(4), 205–208.
Liu, S. (2015). How team risk and planning and control risk moderate the effects of clan and
self control on the process performance of IT projects: The perspective of user
liaisons. Information Development, 31(1), 27–39.
Liu, S. (2016). How the user liaison’s understanding of development processes moderates the
effects of user-related and project management risks on IT project performance.
Information & Management, 53(1), 122–134.
Liu, S., & Deng, Z. (2015). How environment risks moderate the effect of control on
performance in information technology projects: Perspectives of project managers and
user liaisons. International Journal of Information Management, 35(1), 80–97.
Liu, S., & Wang, L. (2014). Understanding the impact of risks on performance in internal and
outsourced information technology projects: The role of strategic importance.
International Journal of Project Management, 32(8), 1494–1510.
MacCormack, A., & Mishra, A. (2015). Managing the performance trade-offs from partner
integration: Implications of contract choice in R&D projects. Production and
Operations Management, 24(10), 1552–1569.

71
Mahaney, R. C., & Lederer, A. L. (2010). The role of monitoring and shirking in information
systems project management. International Journal of Project Management, 28(1),
14–25.
McKay II, D. S., & Ellis, T. J. (2015). Measuring knowledge enablers and project success in
IT organizations. International Journal of Knowledge Management, 11(1), 66–83.
Mitchell, V. L., & Zmud, R. W. (1999). The effects of coupling IT and work process
strategies in redesign projects. Organization Science, 10(4), 424–438.
Müller, R., & Martinsuo, M. (2015). The impact of relational norms on information
technology project success and its moderation through project governance.
International Journal of Managing Projects in Business, 8(1), 154–176.
Munns, A. K., & Bjeirmi, B. F. (1996). The role of project management in achieving project
success. International Journal of Project Management, 14(2), 81–87.
Nabelsi, V., Gagnon, S., & Brochot, D. (2017). Increasing the impact of wikis on project
performance: Fine-tuning functional quality and knowledge sharing: Increasing the
impact of wikis on project performance. Knowledge and Process Management, 24(2),
96–113.
Napier, N. P., Keil, M., & Tan, F. B. (2009). IT project managers’ construction of successful
project management practice: A repertory grid investigation. Information Systems
Journal, 19(3), 255–282.
Naqvi, I. H., Bokhari, S. H. A., Aziz, S., & Rehman, K. ur. (2011). The impact of human
resource (HR) performance management on project outcome. African Journal of
Business Management, 5(21), 8491–8499.
Nidumolu, S. R. (1996). A comparison of the structural contingency and risk-based
perspectives on coordination in software-development projects. Journal of
Management Information Systems, 13(2), 77–113.
Pant, I., & Baroudi, B. (2008). Project management education: The human skills imperative.
International Journal of Project Management, 26(2), 124–128.
Petticrew, M., & Roberts, H. (2005). Systematic Reviews in the Social Sciences: A Practical
Guide (Edição: 1). Malden, MA ; Oxford: Blackwell Publishing Professional.
Pimchangthong, D., & Boonjing, V. (2017). Effects of risk management practices on IT
project success. Management and Production Engineering Review, 8(1), 30–37.
Pinto, J. K., & Mantel, S. J. (1990). The causes of project failure. IEEE Transactions on
Engineering Management, 37(4), 269–276.
72
Plaza, M. (2016). Balancing the costs of human resources on an ERP project. Omega, 59,
171–183.
Pollack, J., & Adler, D. (2016). Skills that improve profitability: The relationship between
project management, IT skills, and small to medium enterprise profitability.
International Journal of Project Management, 34(5), 831–838.
Ram, J., Corkindale, D., & Wu, M.-L. (2013). Implementation critical success factors (CSFs)
for ERP: Do they contribute to implementation success and post-implementation
performance? International Journal of Production Economics, 144(1), 157–174.
Reich, B. H., Gemino, A., & Sauer, C. (2008). Modeling the knowledge perspective of IT
projects. Project Management Journal, 39(S1), S4–S14.
Reich, B. H., Gemino, A., & Sauer, C. (2014). How knowledge management impacts
performance in projects: An empirical study. International Journal of Project
Management, 32(4), 590–602.
Rosacker, K. M., & Olson, D. L. (2008). An empirical assessment of IT project selection and
evaluation methods in state government. Project Management Journal, 39(1), 49–58.
Sarantis, D., Smithson, S., Charalabidis, Y., & Askounis, D. (2010). A Critical Assessment of
Project Management Methods with Respect to Electronic Government Implementation
Challenges. Systemic Practice and Action Research, 23(4), 301–321.
Sarif, S. M., Hamidi, S. R., Ramli, B. M., & Lokman, A. M. (2016). The influence of
organizational factors in the success of IT project management. Indian Journal of
Science and Technology, 9(S1).
Sewchurran, K., & Barron, M. (2008). An investigation into successfully managing and
sustaining the project sponsor — Project nanager relationship using soft systems
methodology. Project Management Journal, 39(1_suppl), S56–S68.
Sherman, M. H., & Ford, J. (2014). Stakeholder engagement in adaptation interventions: An
evaluation of projects in developing nations. Climate Policy, 14(3), 417–441.
Sicotte, H., & Langley, A. (2000). Integration mechanisms and R&D project performance.
Journal of Engineering and Technology Management, 37.
Singh, B. (2018). Identifying and implementing CSFs for transforming success rate in IT
project management. Int. J. Indian Culture and Business Management, 27.
Spalek, S. (2014). Does investment in project management pay off? Industrial Management &
Data Systems, 114(5), 832–856.
Standing, C., Guilfoyle, A., Lin, C., & Love, P. E. D. (2006). The attribution of success and
failure in IT projects. Industrial Management & Data Systems, 106(8), 1148–1165.

73
Stingl, V., & Geraldi, J. (2017). Errors, lies and misunderstandings: Systematic review on
behavioural decision making in projects. International Journal of Project
Management, 35(2), 121–135.
Tranfield, D., Denyer, D., & Smart, P. (2003). Towards a Methodology for Developing
Evidence-Informed Management Knowledge by Means of Systematic Review. British
Journal of Management, 14(3), 207–222.
von Danwitz, S. (2018). Managing inter-firm projects: A systematic review and directions for
future research. International Journal of Project Management, 36(3), 525–541.
Wang, E., Chou, H.-W., & Jiang, J. (2005). The impacts of charismatic leadership style on
team cohesiveness and overall performance during ERP implementation. International
Journal of Project Management, 23(3), 173–180.
Wei, Z., Du, Z., & Bao, Y. (2018). Outsourcer knowledge protection, psychological contract
schema, and project performance: A vendor’s perspective. IEEE Transactions on
Engineering Management, 65(1), 128–140.
Wells, H. (2012). How effective are project management methodologies? An explorative
evaluation of their benefits in practice. Project Management Journal, 43(6), 43–58.

74
2.3 STUDY 3: EFFECTS OF STAKEHOLDERS’ MANAGEMENT ON
INFORMATION TECHNOLOGY PROJECT RESULTS
2.3.1 INTRODUCTION
Over the years, researchers have been conducting studies to analyze factors affecting
project performance (PP) based on different aspects (Lisburn & Baxter, 1994; Reich et al.,
2008; Wells, 2012; Carvalho et al., 2015; Engelbrecht et al., 2017; Lu et al., 2019). Enhancing
the performance of Information Technology (IT) projects is essential for both industries and
the academia, mainly for the project management field (Haq et al., 2019). Despite the
relevance of this topic, and researchers and practitioners’ significant effort to reach the
expected project performance (PP), many IT projects still fail or underperform due to
different reasons (Johnson, 2018).
Project management (PM) is crucial to reach higher PP levels, since it encourages
project teams to develop common strategies, cooperation, straightforward processes and the
ability to adapt to both changes and new demands (Auinger et al., 2013). Project managers
must cover multidisciplinary topics in order to drive projects based on different aspects and
technologies and to be ready to put the project in place by applying such aspects and
techniques. Multidisciplinary aspects are expressed by bodies of knowledge, best practices,
and empirical evidences, as well as by the collection of practitioners’ opinions (IPMA, 2016;
Project Management Institute, 2017; Axelos, 2017).
More and more, companies are aware that they need to reconsider stakeholders’
management and find ways to make them engage to projects in order to avoid potentially
costly conflicts and societal exposure, as well as to get company or product legitimacy, or,
yet, to avoid legal challenges (Provasnek et al., 2018). Organizations can collaborate to
different groups, such as customers, representatives, non-governmental organizations, among
others, in order to develop new products and ideas, to collectively create or refine software, to
manage their reputation, among other reasons (Desai, 2018). The mechanisms to reach such a
collaboration process include partnerships, dialogue, employees’ volunteering, social media
communication, among others (Davila et al., 2018). The collaborative engagement by external
stakeholders opens room for the opportunity to develop organizations' legitimacy and to

75
assess how they balance their search for innovation in terms of how to keep stakeholders
informed and of risks related to such anexternal search (Desai, 2018). Stakeholders’
engagement (SE) means having them involved in projects’ planning, on decision-making and
on product implementation to reduce conflicts, establish clear priorities and gain market
advantages (Mok et al., 2015). Companies and project managers can decide to encourage
stakeholders to engage to their strategy in different ways, depending on what they need to get
from this relationship.
Project managers and teams often face the challenge of deciding which stakeholders
should be encouraged to engage to the project, or not. Mitchell et al. (1997) developed a
framework to classify stakeholders based on their power, legitimacy and on companies’
urgency and results. This classification system was called stakeholder salience (SS). Many
researchers have tested SS after its launching, as well as how to achieve performance
improvement based on other aspects, such as corporate social accountability, human
resources’ ethics, ecosystem impacts, among others, rather than just on better financial results
(Bec et al., 2019; Hersel et al., 2019; Neville et al., 2011; Phiri et al., 2019). This framework
was also applied to the project management field to reach positive power, legitimacy and
project results’ urgency , as well as to measure the impact of it on stakeholders (Hellström et
al., 2013; Turkulainen et al., 2015; Nguyen et al., 2019).
The literature on stakeholders’ management association with other PM activities and
on positive effects of PM improvement due to stakeholders’ engagement to projects still
highlights a gap in knowledge on this field. The first aim of the current study was to fill this
gap by analyzing the direct effects of PM activities on PP in order to validate the positive
association between them. Another aim of the study lied on contributing to the stakeholders’
theory by testing improvements in the PM/PP association when stakeholders are engaged to
projects and whether salient stakeholders can positively contribute to such an association.
The present study is an attempt to contribute to the analysis on SE action impacts on
project results. Contributions are twofold, they contribute to integrate actions taken by
practitioners to the literature by providing theoretical understanding on stakeholders’
management, mainly SE, and on its influence on IT PP. Although there are previous studies
about SE in projects (Missonier & Loufrani-Fedida, 2014; Butt et al., 2016), they focus on
project management practices and do not provide theoretical discussions and contributions.
They can further contribute to validate the effects of stakeholder management and previously
tested relationships, such as project management moderation relationships and customers’
satisfaction (Standing et al., 2006; Toor & Ogunlana, 2010; Aubry & Brunet, 2016; Güngör &

76
Gözlü, 2017; Singh, 2018). The current study was based on testing the moderate effect of SE
and SS on project management results and their effects on product outcomes. When it comes
to implication to practitioners, it tested the project management activities affecting SE actions
in order to contribute to positive incentive actions to enhance these activities.
This article also addresses the theoretical background, the developed hypotheses and
theoretically proposed framework. Study method, data analysis techniques and findings are
also approached. The theoretical and managerial implications, limitations and future research
suggestions are presented in the conclusion section.
2.3.2 LITERATURE REVIEW
The aim of the present study was to help better understanding SE and SS effects on IT
project results. Based on general consensus, project performance is a multidimensional
construct; however, there is no consensus on the dimensions better representing project
performance (Engelbrecht et al., 2017). Therefore, it is essential defining how project results
are measured and the project results dimensions to be adopted in this research. Next, project
management activities, SE and SS concepts and how these concepts are adopted in business
SE contexts - and narrowed to projects’ context - are presented.
2.3.2.1 Project performance
Many studies introduce different ways to measure PP (Shenhar et al., 2001;
Sewchurran & Barron, 2008; Handzic et al., 2016; Pimchangthong & Boonjing, 2017). The
traditional PP assessment lies on measuring how project results adhere to planning by being
within the following three dimensions: budget, schedule and specifications (J. K. Pinto &
Prescott, 1988; Karlsen et al., 2005; Bakker et al., 2010; Engelbrecht et al., 2017), which are
known as the 'Triple Constraint' or 'Iron Triangle' (Engelbrecht et al., 2017). This traditional
way of assessing PP has been challenged since the late 1990s. Atkinson (1999) argues that the
iron triangle is not enough to measure project performance and that successful iron triangle
outcomes can hide project issues, depending on project complexity. Project performance
measurements only based on iron triangle elements are inadequate, because they exclude

77
measurements taken of outcome-related elements such as value, adequacy and use
(Sewchurran & Barron, 2008).
The project management literature has been introducing new ways to measure PP and
new dimensions to be included in it. Besides the Iron-triangle criterion, alternative models
must include key performance indicators or financial-based indicators like IRR or NPV
evaluation model (Pimchangthong & Boonjing, 2017). Shenrar and Dvir (2007) proposed five
PP dimensions, namely: iron triangle, impact on customers, on team members, business
impact and preparation for the future. The IT project literature also presents criteria deriving
from the software project. Some results, such as performance, easy to use, adoption by users
and compliance with functional requirements must be measured after software
implementation (Karlsen et al., 2005; Gemino et al., 2008; S. Liu, 2016). It is important
stating that the literature on new ways to measure PP does not reject the adoption of the triple
constraint. Many researchers still use it to measure PP (Keil et al., 2013; Ram et al., 2013;
Engelbrecht et al., 2017).
The concept of project performance can be divided into two different concepts: project
management performance and product performance (Reich et al., 2014). Project management
performance refers to reaching planned triple constraint strategies and product performance
concerns fulfilling project outcome needs (Pimchangthong & Boonjing, 2017; González-
Benito et al., 2017). Product in IT projects points out quality rates accomplished due to IT
project development processes and to how a given software is delivered to users (Reich et al.,
2014). Project management performance measurements allow following all project lifecycles.
Product performance refers to the post-project time and to the performance of project
outcomes (Keil et al., 2013). Both project management performance and product performance
were herein adopted as part of the dependent variable PP, since the adoption of these two
dimensions can help better understanding the effect of dependent and moderator variables on
project lifecycles and on the performance of project outcome in order to achieve a more
extensive analysis of correlations.
2.3.2.2 Project Management Activities
Systematic PM can be seen as a method, toolkit and model applicable to tthe
structured sequence of a given process in order to institutionalize standard practices (Carvalho
et al., 2015). Defining a standard process enables team members to follow a common goal by

78
running similar or distinct activities in projects. Project management is a multidisciplinary
strategy that needs a holistic approach to integrate activities from initial planning to project
conclusion (Auinger et al., 2013).
2.3.2.2.1 Project Communication Management
Communication processes evolve at least two agents, namely: sender and receiver,
based on shared media, to transfer information between individuals (M. B. Pinto & Pinto,
1990). The receiver, in organizational context, can be one or several people composing
workgroups or, yet, the entire organization (Baguley, 1994). Communication is the route
allowing individuals to build trust and collaborative work values in organizations (Yap et al.,
2017). Although agents are defined as communication senders and receivers, effective
communication is not unidirectional and must flow both ways: receivers must transmit
feedback on the received information (Gopal et al., 2002). Getting communication feedback
helps understanding how well information has been transmitted and received, as well as
identifying barriers to be eliminated (Ejohwomu et al., 2017). Good communication is not
only used to transmit information but also to interpret signals among parts by reflecting their
feelings, such as enthusiasm, optimism and acceptance or, even, their bad feelings (Jarvenpaa
& Leidner, 1999).
Communication plays a pivotal role in projects. Project communication management
(CM) involves planning and performing activities to make information development,
distribution, reception and understanding easier (Yap et al., 2017). Communication planning
and performing must start at initial project stages in order to inform about project objectives,
requirements and priorities, and about constraints to be known by everyone in the project
team (Cheung et al., 2013). Communication is not only accountable for leaderships, team
members must understand the communication networks and use them to openly and
supportively send and receive information and messages from everyone (Hsu et al., 2012).
Effective CM planning encourages the collaboration culture and promotes team members’
participation in decision-making and project learning (Yap et al., 2017). Communication
systems applied to project conduction must mix formal and informal, written and verbal
communication, as well as synchronize and coordinate team members (Turner & Müller,
2004). Furthermore, formal and informal communication is essential in project conduction.
Formal communication can encourage formal relationships among team members. Informal

79
communication, which lies on lack of rigid rules and guidelines, can lead to confidence and
trust (Cheung et al., 2013). Efficiently and effectively communicating to the right people, at
the right time, in the right format to promote project success is CM’s most important goal
(Yap et al., 2017)
Defining how often communication occurs is challenging to CM planning. Project
managers must find and define communication frequency in each defined structure, and
balance informal communication among internal teams and between internal teams and
external members (Hsu et al., 2012). Controlling formal communication and interactions
between team members and external members is essential to reduce uncertainty and improve
project quality (Kannabiran & Sankaran, 2011). Project managers must define the frequency
of communication with stakeholders in order to give comfort to external members regarding
project progress and decision-making (Bond-Barnard et al., 2013). Frequent communication
leads to inter-organizational and trust relationships in projects, and it accounts for more
information and raises new ideas and solutions, as well as helps problem solving (Cheung et
al., 2013). Appropriate communication processes significantly contribute to project success
(Yap et al., 2017); thus, it opens room for hypothesis 1:
H1 - Project communication management has positive effect on Project Performance.
2.3.2.2.2 Human Resources Management
Human resources management (HRM) practices have been deeply assessed in the last
decades and their effective application is associated with past and current success and with
achieving goals in many organizations (Khan & Rasheed, 2015). Reaching HRM-related
outputs, such as to positively contribute to organizational outcomes, low turnover rates, high
cost-effectiveness, low absence rates and high job performance due to fully using employees’
potential, are expected to happen (Paauwe, 2009). Oftentimes, companies deal with changes
in business environment, and it can demand new human resources skills and require the
development of smooth human resources operations (Ahmadian Fard Fini et al., 2018). Based
on the literature, HRM is a practical approach for companies to define recruiting, selection,
training, development, career planning, performance evaluation, employees’ participation on
companies’ activities and compensation system structures (Khan & Rasheed, 2015).

80
Given the features of a time-limited activity within project contexts - which regard
employees’ dispersion after the job is finished -, it is demanding to have a well-prepared and
expert team to take the necessary actions (G. Chen et al., 2004). Projects’ time-limited
features lead to work environments that pose additional pressure over employees, and it
sometimes brings uncertainty and fluctuating workloads that demand multiple roles to be
played (Zwikael & Unger-Aviram, 2010). HRM practices sharpen teams’ future perspectives
and allows supporting individuals’ needs, as well as developing a secure and supportive
environment for everyone’s participation, and dismissing uncertainty about having a job after
the project is over (Popaitoon & Siengthai, 2014). Most projects require members from
different disciplines to work together towards a common goal. These different backgrounds
challenge companies and project managers to develop a cohesive team (Zwikael & Unger-
Aviram, 2010). HRM requires well-designed planning to deal with employment security, job
design and description, clear communication, teamwork stimulus, among other activities
within project contexts, in order to deal with such potential issues (Bhoola & Giangreco,
2018).
Several studies have investigated the association between HRM and PP (G. Chen et
al., 2004; Lin, 2011; Khan & Rasheed, 2015; Demirkesen & Ozorhon, 2017; Bhoola &
Giangreco, 2018; Popaitoon & Siengthai, 2014). However, the effects of such an association
remain unclear, but there are empirical evidences of HRM effects as activity moderator
correlated to PP (Imran et al., 2011; Popaitoon & Siengthai, 2014; Zhu & Cheung, 2017).
Some other studies address HRM as a factor mediated by other activities (Paauwe, 2009;
Khan & Rasheed, 2015; Ahmadian Fard Fini et al., 2018). HRM practices are related to
knowledge construction and to the contributions of positive effects on project innovation and
performance. They play the role of encouraging knowledge acquisition and its sharing with
members in the project team (Swart & Kinnie, 2010). A model is herein proposed to specify
the positive effect of HRM activities on PP, which leads to hypothesis 2:
H2 - Human resource management projects have positive effect on Project
Performance.

81
2.3.2.2.3 Risk Management
Project risk refers to any condition capable of posing serious threat to competition for
any project objective (Keil et al., 2013); however, risks may not be only related to adverse
events. Opportunities can come up and have positive impacts on project objectives or, yet,
bring extra gains to them. Project managers must be ready to identify these events and profit
on them (Yim et al., 2015). Different processes and sources can account for project risks.
Analyzing and understanding risk events can help project teams and managers to be aware of
possible threats and to be ready to apply countermeasures to reduce risks or their impact (De
Bakker et al., 2011). Risks can derive from organizational environments, work processes and
people, within project contexts. Overall, these factors are connected to the generation of the
aforementioned events (Boehm, 1991), consequently, project managers are challenged to
analyze risk factors associated with a given project and to track their origin and root causes
(Chen et al., 2018).
Project risk management is defined as a set of coordinated activities focusing on risk
identification, assess and prioritization. These procedures must be followed by economic
evaluations to develop a viable plan to minimize, monitor, and control the likelihood of risk
events to happen and to have impact on the project (Zhang, 2007; Li et al., 2008; Bakker et
al., 2010). Project managers must follow holistic approaches to manage risks, they need to
gather as much information as possible, from different sources, and organize it into
manageable data (Yim et al., 2015). Successful risk management demands support from the
top management in companies, which must provide the needed training to the project team,
give authority to project managers, and support technical and financial decisions (Zhao et al.,
2013). Although project risk management lies on evaluating and monitoring events likely
threatening project objectives, effective risk management must be the target of all
organization levels, as well as be based on a common risk-language (Shayan et al., 2019).
Risk management processes must systematically identify, evaluate, and mitigate risks
in order to improve the likelihood of project success (Maytorena et al., 2007). They are a step-
by-step procedure that must start from risk recognition and identification, effective
assessment of the likelihood of risk occurrence and impact, decision-making about risk
mitigation, control and management (Rasul et al., 2019). Risk identification must start at
initial project stages and aim at finding possible risks caused by stakeholders, aligning
information and recording any detail likely capable of helping to improve data accuracy

82
(Gibson Jr et al., 2006). Risk assessment activities enable identifying risk events and defining
priorities and responses to decisions regarding mitigation, transferring or acceptance, as well
as financial decisions (Perrenoud et al., 2017). The implementation of preemptive project
management strategies reduces the likelihood of facing risk events and their negative impact
on project results (Yim et al., 2015). This statement leads to hypothesis 3:
H3 - Project risk management has positive effect on Project Performance.
2.3.2.2.4 Quality Management
Quality is expressed through scope, organization structure and adaptation speed at
organizational level, depending on business needs and capabilities (Milunovic & Filipovic,
2013). Quality management refers to all business functions in a given organization and leads
all departments and people to common goals concerning improvements in processes, products
and relations (Bergman & Klefsjö, 2010). Quality management activities help enhancing the
quality of products, producing and reducing losses and rework, minimizing production costs
and saving time (Orwig & Brennan, 2000). Quality management includes helping and guiding
companies and individuals in the production chain in order to improve their potential, create
clear objectives, map improvement and cooperation opportunities, and reflect on
organizational performance (Lagrosen & Lagrosen, 2012).
Project quality planning deals with defining quality standards suitable for project goals
and limits, and with determining how to meet such standards. (Cao, 2018). Project managers
must plan project quality management to command, coordinate and control project activities
in order to meet the expected project quality (Chang & Ishii, 2013). Requirements of project
quality management planning shall not be limited to the complexity of process design, to
dynamics among project team members, as well as to product features and operation
standards in order to reach the final product (Flyvbjerg, 2014). Project quality management
must follow a set of standards and templates adopted for daily activities performed by team
members (Milunovic & Filipovic, 2013). Quality standards set to the project do not
necessarily have to follow organizational quality management standards. Sometimes, projects
can introduce quality management practices in the organization, change standards or their
focus at project level (Dahlgaard-Park, 2011). Project quality management actions control all
project activities, define how to perform them in a cost-effective way, follow customers’

83
needs and stakeholders’ expectations, in order to have direct impact on project performance
(Lu et al., 2019). This statement leads to hypothesis 4:
H4 - Project quality management has positive effect on Project Performance.
2.3.2.3 Stakeholders’ Engagement
According to the stakeholder theory (Freeman, 1984), developing a relationship with
stakeholders means companies’ acknowledgment that consumers’ must be heard and their
needs must be addressed. The stakeholder theory deals with how to manage different
stakeholders by taking into account decision-making processes in a given company (Lehtinen
et al., 2019). Companies encourage stakeholders’ engagement to positively involve them in
the search for consent, control, cooperation, accountability, trust, fairness or enhanced
corporate governance (Greenwood, 2007). The idea of engagement in business relationships is
not new, it has been calling the attention of several practitioners since the last decade (Brodie
et al., 2011) - the number of studies on SE activity practitioners has been increasing, since
then. The interest in SE has been growing among researchers who have been applying this
theory to different contexts, such as social corporate accountability, governance, shareholders’
management, among others (Desai, 2018; Dobele et al., 2014; Morsing & Schultz, 2006;
Sarkis et al., 2010; Vollero et al., 2019). Engagement activities give stakeholders and
companies the opportunity to learn about each other's interests, opinions and needs, which
results in benefits for one of them, or for both (Provasnek et al., 2018).
Many interpretations about the concept of engagement have emerged in the literature.
Engagement addresses connection, attachment, participation and social structure forms that
have been featured as the transient state observed within broader relevant engagement
processes that have developed over time (Brodie et al., 2011). The concept of engagement in
business is attachedto partnership, i.e., companies develop partnering activities to build
bridges to common goals (Provasnek et al., 2018).
The SE practice consists of activities set by an organization to positively involve
stakeholders in the search for consent, cooperation, control, accountability and trust, or to
enhance corporate governance (Greenwood, 2007). SE activities give companies and
stakeholders the opportunity to learn about each other's interests, to address potentially
negative impacts and even to bring benefits for one of them, or for both (Provasnek et al.,
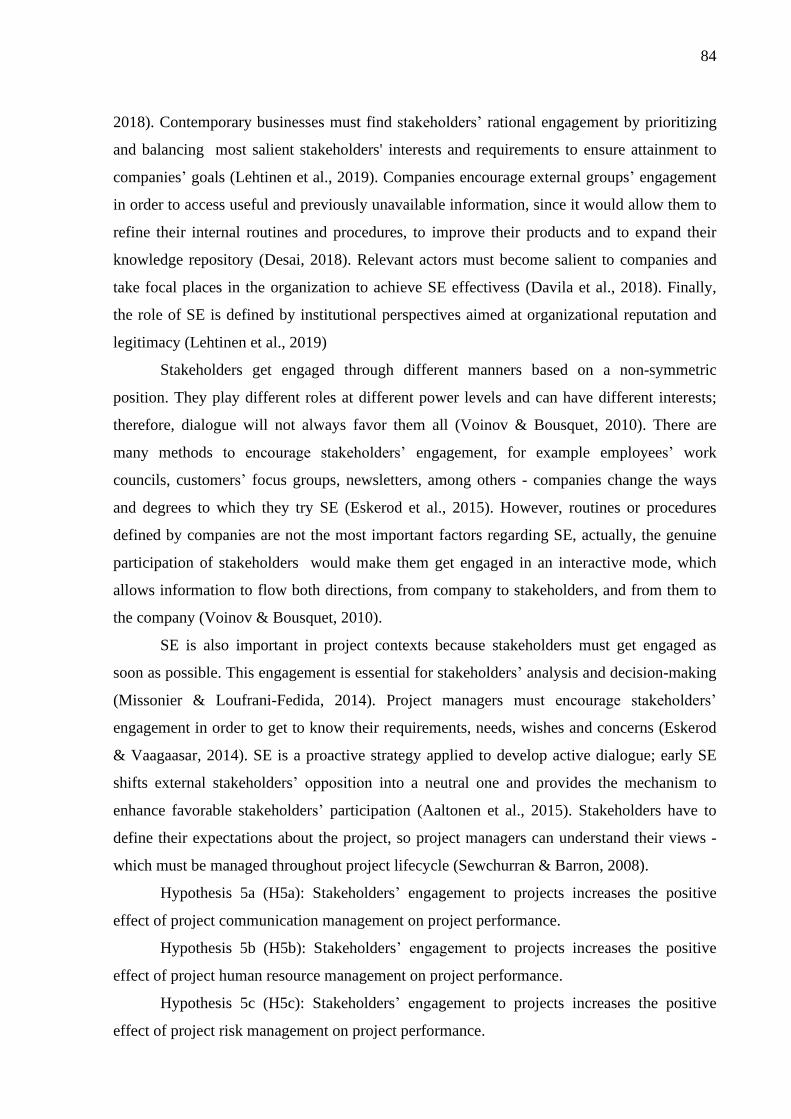
84
2018). Contemporary businesses must find stakeholders’ rational engagement by prioritizing
and balancing most salient stakeholders' interests and requirements to ensure attainment to
companies’ goals (Lehtinen et al., 2019). Companies encourage external groups’ engagement
in order to access useful and previously unavailable information, since it would allow them to
refine their internal routines and procedures, to improve their products and to expand their
knowledge repository (Desai, 2018). Relevant actors must become salient to companies and
take focal places in the organization to achieve SE effectivess (Davila et al., 2018). Finally,
the role of SE is defined by institutional perspectives aimed at organizational reputation and
legitimacy (Lehtinen et al., 2019)
Stakeholders get engaged through different manners based on a non-symmetric
position. They play different roles at different power levels and can have different interests;
therefore, dialogue will not always favor them all (Voinov & Bousquet, 2010). There are
many methods to encourage stakeholders’ engagement, for example employees’ work
councils, customers’ focus groups, newsletters, among others - companies change the ways
and degrees to which they try SE (Eskerod et al., 2015). However, routines or procedures
defined by companies are not the most important factors regarding SE, actually, the genuine
participation of stakeholders would make them get engaged in an interactive mode, which
allows information to flow both directions, from company to stakeholders, and from them to
the company (Voinov & Bousquet, 2010).
SE is also important in project contexts because stakeholders must get engaged as
soon as possible. This engagement is essential for stakeholders’ analysis and decision-making
(Missonier & Loufrani-Fedida, 2014). Project managers must encourage stakeholders’
engagement in order to get to know their requirements, needs, wishes and concerns (Eskerod
& Vaagaasar, 2014). SE is a proactive strategy applied to develop active dialogue; early SE
shifts external stakeholders’ opposition into a neutral one and provides the mechanism to
enhance favorable stakeholders’ participation (Aaltonen et al., 2015). Stakeholders have to
define their expectations about the project, so project managers can understand their views -
which must be managed throughout project lifecycle (Sewchurran & Barron, 2008).
Hypothesis 5a (H5a): Stakeholders’ engagement to projects increases the positive
effect of project communication management on project performance.
Hypothesis 5b (H5b): Stakeholders’ engagement to projects increases the positive
effect of project human resource management on project performance.
Hypothesis 5c (H5c): Stakeholders’ engagement to projects increases the positive
effect of project risk management on project performance.

85
Hypothesis 5d (H5d): Stakeholders’ engagement to projects increases the positive
effect of project quality management on project performance.
2.3.2.4 Stakeholder Salience
The number of stakeholders can significantly increase depending on project range and
impact. Project managers are challenged to decide who may be invited to collaborate to the
project, or not. Stakeholders with different expectations and interests in company
environments are among the challenges to be overcome in order to address the needs of
corporate executives based on proper stakeholders’ management (Elias, 2016). When
companies nominate new representatives for stakeholders’ networks or environments, the
chosen ones bring along their backgrounds and expertise in order to collaborate; however,
they also have their own needs, expectations and interests, although they think they will be
beneficial to the organization or to the group of stakeholders they represent (ElWakeel &
Andersen, 2019). The stakeholder theory presents concepts and frameworks to identify,
classify and categorize stakeholders by understanding their motivations and likely behaviors,
and by developing a stakeholder management plan (Aaltonen et al., 2008). Project managers
may apply procedural approaches to evaluate stakeholders, understand their demand dynamics
and background, and interactions to deal with heterogeneity (Chow & Leiringer, 2020).
Project managers face the challenge of meeting stakeholders’ needs and concerns.
However, they need to balance their decisions and claims based on project purposes,
limitations and constraints, since it is not possible meeting the claims of all stakeholers
(Aaltonen et al., 2015). Each stakeholder plays different roles in any given project. When
project managers analyzee stakeholders, their roles and claims, they must evaluate the impact
of these stakeholders based on their different attributes (Olander, 2007). Project managers
can evaluate stakeholders at a single point in time, or overtime, and use multidimensional data
to analyze projects’ impact on stakeholders and their respective impact on projects’ goals
(Abdollahi et al., 2019).
Mitchell et al. (1997) presented a stakeholder classification model called “stakeholder
salience model” to help project managers making decisions about which stakeholders to
involve in the project, or not, and about the claims to be addressed, or not. Salience is the
degree to which managers give priority to competing stakeholders. (Mitchell et al., 1997).
Mitchell et al. (1997) classify stakeholders in this model based on their power, legitimacy and

86
urgency attributes. Stakeholders get powerfull from their ability to mobilize political and
social forces and to control key resources to project conduction, as well as from their capacity
to withdraw their wishes concerning these resources (Aaltonen et al., 2015; Mojtahedi & Oo,
2017). Power lies on stakeholders’ ability to provide material, financial and symbolic
resources, or to exert their power to fulfill their wishes (Turkulainen et al., 2015). Legitimacy
is the overall perception that actions taken by a person or by an entity are proper, desirable or
appropriate based on a system of defined values, standards and beliefs (Mitchell et al., 1997).
Legitimacy gives stakeholders the opportunity to identify some beneficial or harmful risks in
their organization (Mojtahedi & Oo, 2017). The urgency of stakeholders refers to the degree
to which they claim for immediate attention (Mitchell et al., 1997). The evaluation of their
attributes helps project managers to choose their stakeholdersbased on the claims of
competing stakeholders (Shen & Yang, 2010; Vos et al., 2016; Yu et al., 2019). The efficient
capture and analysis of multiple links within a network of stakeholders, their dependence and
influence define stakeholder salience variability. This salience has direct effect on projects
(Chow & Leiringer, 2020); thus, adopting the attributes proposed by Mitchell (1997) means
developing hypothesis 6.
Hypothesis 6a (H6a) - The more salient the stakeholders, the more positive the effect
of project communication management on project performance
Hypothesis 6b (H6b): The more salient the stakeholders, the more positive the effect
of project human resource management on project performance
Hypothesis 6c (H6c): The more salient the stakeholders, the more positive the effect of
project risk management on project performance
Hypothesis 6d (H6d): The more salient the stakeholders, the more positive the effect
of quality management on project performance
Figure 21 shows the conceptual framework applied to analyze factors positively
influencing project performance. It gathers all aforementioned hypotheses and presents four
project management activities that can have positive impact on project performance, namely:
(i) communication management; (ii) human resources management; (iii) risk management;
and (iv) quality management. These frameworks also introduce stakeholders’ engagement as
positive moderator based on four previous relations. It also depicts the positive salient
stakeholders’ moderation in all associations between project management activity and project
performance.

87
Figure 21 - Study 3: Conceptual Framework
2.3.3 METHOD
The present research followed an explanatory design (Creswell, 2013) to explain
project performance based on the application of project management activities and on the
stakeholder theory. A survey model was adopted to collect quantitative data of IT
professionals in charge of any finished IT software project.
2.3.3.1 Data collection
IT project professionals were the target of the present study. An online survey was
opened in English, Spanish and Portuguese versions at mid 2020. Different ways were used to
ask professionals to participate in and answer the survey. Different social media were used at
the first research phase to introduce the survey and request online respondents to answer it.
Online groups of project management practitioners were contacted at the second research
phase; mass messages requesting answers to the survey were sent out. LinkedIn was used to
identify project managers in the third, and last, research phase; direct messages were sent to
each participant to explain the purpose of the research and to ask for their responses. After
five months, 519 answers, from participants in 13 countries, were collected. Figure 22 shows

88
the number of respondents per country. They were asked to fill out the online questionnaire
and to complete the survey. Appendix B shows the applied questionnaire.
Country Answers
Brazil 75.34%
United States 13.49%
Canada 2.12%
Mexico 2.12%
Argentina 1.93%
Belgium 0.96%
Chile 0.96%
Portugal 0.96%
Uruguay 0.58%
Arab Emirates 0.58%
Colombia 0.58%
Netherlands 0.19%
South Africa 0.19%
Figure 22 - Respondents per country
2.3.3.2 Database analysis
The collected data were subjected to preliminary statistical outlier, multicollinearity,
homoscedasticity and normality analyses, prior to the main analysis. It was done in order to
ensure that the statistical assumptions necessary for multivariate analysis were met.
2.3.3.2.1 Multivariate Outlier analysis
The Mahalanobis distance criterion for outlier detection was used in the analysis. It
refers to the distance of a case from the centroid of the remaining cases whose centroid is the
point created at the intersection of the means of all variables (Tabachnick et al., 2007).
Statistical multivariate outlier is a case presenting strange score combinations of two or more
variables that distort the statistics (Tabachnick et al., 2007). After this criterion was applied,
11 responses were discarded due to evidences of multivariate outliers. All database analyses
were carried out with 508 valid responses.
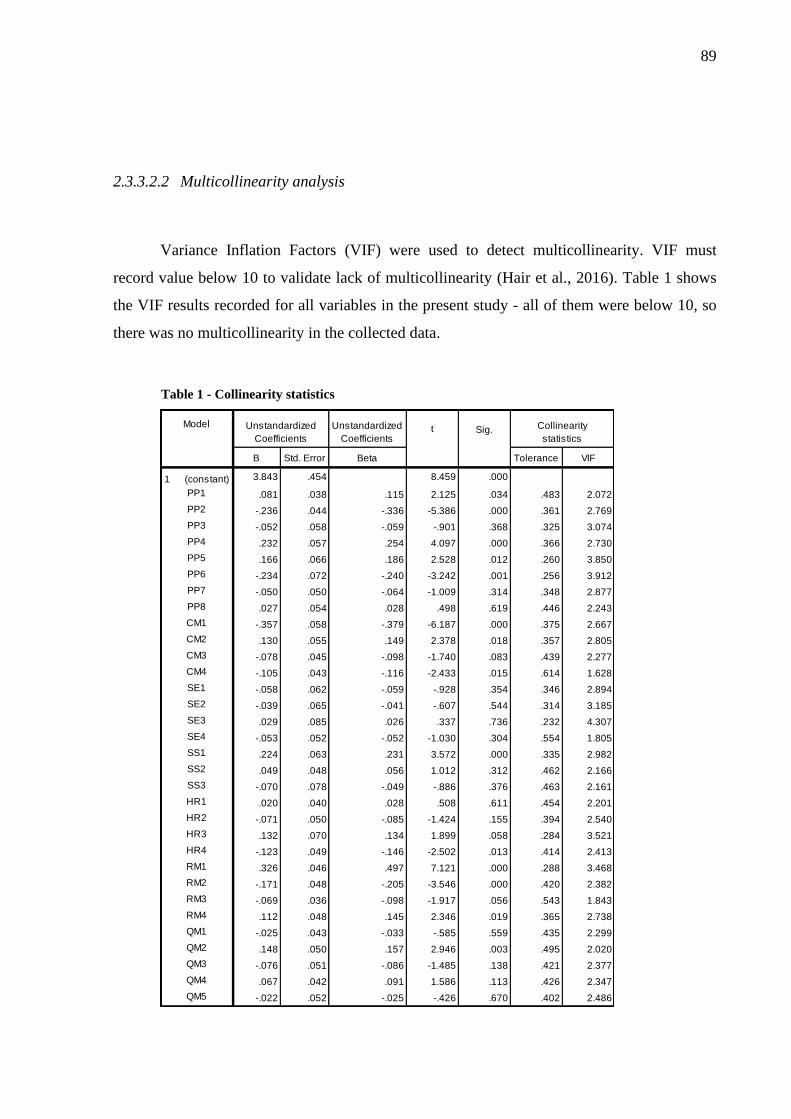
89
2.3.3.2.2 Multicollinearity analysis
Variance Inflation Factors (VIF) were used to detect multicollinearity. VIF must
record value below 10 to validate lack of multicollinearity (Hair et al., 2016). Table 1 shows
the VIF results recorded for all variables in the present study - all of them were below 10, so
there was no multicollinearity in the collected data.
Table 1 - Collinearity statistics
B Std. Error Beta Tolerance VIF
3.843 .454 8.459 .000
.081 .038 .115 2.125 .034 .483 2.072
-.236 .044 -.336 -5.386 .000 .361 2.769
-.052 .058 -.059 -.901 .368 .325 3.074
.232 .057 .254 4.097 .000 .366 2.730
.166 .066 .186 2.528 .012 .260 3.850
-.234 .072 -.240 -3.242 .001 .256 3.912
-.050 .050 -.064 -1.009 .314 .348 2.877
.027 .054 .028 .498 .619 .446 2.243
-.357 .058 -.379 -6.187 .000 .375 2.667
.130 .055 .149 2.378 .018 .357 2.805
-.078 .045 -.098 -1.740 .083 .439 2.277
-.105 .043 -.116 -2.433 .015 .614 1.628
-.058 .062 -.059 -.928 .354 .346 2.894
-.039 .065 -.041 -.607 .544 .314 3.185
.029 .085 .026 .337 .736 .232 4.307
-.053 .052 -.052 -1.030 .304 .554 1.805
.224 .063 .231 3.572 .000 .335 2.982
.049 .048 .056 1.012 .312 .462 2.166
-.070 .078 -.049 -.886 .376 .463 2.161
.020 .040 .028 .508 .611 .454 2.201
-.071 .050 -.085 -1.424 .155 .394 2.540
.132 .070 .134 1.899 .058 .284 3.521
-.123 .049 -.146 -2.502 .013 .414 2.413
.326 .046 .497 7.121 .000 .288 3.468
-.171 .048 -.205 -3.546 .000 .420 2.382
-.069 .036 -.098 -1.917 .056 .543 1.843
.112 .048 .145 2.346 .019 .365 2.738
-.025 .043 -.033 -.585 .559 .435 2.299
.148 .050 .157 2.946 .003 .495 2.020
-.076 .051 -.086 -1.485 .138 .421 2.377
.067 .042 .091 1.586 .113 .426 2.347
-.022 .052 -.025 -.426 .670 .402 2.486QM5
1 (constant)
Unstandardized
Coefficients
Unstandardized
Coefficientst
QM4
RM3
RM4
QM1
QM2
QM3
HR2
HR3
HR4
RM1
RM2
SE4
SS1
SS2
SS3
HR1
ModelSig. Collinearity
statistics
PP1
PP2
PP3
PP4
PP5
PP6
PP7
PP8
CM1
CM2
CM3
CM4
SE1
SE2
SE3

90
2.3.3.2.3 Homoscedascity analysis
Homoscedasticity is a situation whose variance in a criterion variable seems constant
over a range of predictor variables (Hair et al., 2016). Levene´s test was used to validate
variable homoscedasticity. Table 2 shows Levene´s test results; three variables (CM2, SE1,
QM5) presented slight heteroscedasticity (p>0.10). However, they were kept in the analysis
because they did not belong to the same construct.
Table 2 - Variance homogeneity test
Levene
statistics df1 df2 Sig.
CM1 6.013 4 503 .000
CM2 .645 4 503 .631
CM3 2.850 4 503 .023
CM4 1.966 4 503 .099
SE1 .382 4 503 .821
SE2 2.314 4 503 .056
SE3 3.492 4 503 .008
SE4 5.412 4 503 .000
SS1 7.315 4 503 .000
SS2 4.859 4 503 .001
SS3 16.794 4 503 .000
HR1 4.711 4 503 .001
HR2 8.840 4 503 .000
HR3 7.258 4 503 .000
HR4 3.724 4 503 .005
RM1 5.223 4 503 .000
RM2 2.038 4 503 .088
RM3 3.138 4 503 .014
RM4 8.109 4 503 .000
QM1 11.632 4 503 .000
QM2 7.106 4 503 .000
QM3 3.192 4 503 .013
QM4 12.283 4 503 .000
QM5 1.931 4 503 .104

91
2.3.3.2.4 Normality analysis
The Kolmogorov–Smirnov statistic was used to check data normality for dependent
variables. Table 3 shows results calculated for research sample. All observations recorded p <
0.5, which determines the model’s non-standard distribution it means that data significantly
differed from a normal distribution (Field, 2013).
Table 3 - One-sample Kolmogorov-Smirnov test
PP1 PP2 PP3 PP4 PP5 PP6 PP7 PP8
508 508 508 508 508 508 508 508
Mean 3.73 4.31 5.34 5.31 5.19 5.65 4.91 4.90
Std. Deviation 1.940 1.942 1.557 1.492 1.531 1.403 1.748 1.428
Absolute .230 .192 .256 .225 .233 .276 .211 .256
Positive .162 .125 .143 .129 .129 .168 .119 .149
Negative -.230 -.192 -.256 -.225 -.233 -.276 -.211 -.256
.230 .192 .256 .225 .233 .276 .211 .256
,000c
,000c
,000c
,000c
,000c
,000c
,000c
,000cAsymp. Sig. (2-tailed)
a. Test distribution is Normal.
b. Calculated from data.
c. Lilliefors Significance Correction.
N
Normal Parametersa,b
Most Exterme Differences
Kolmogorov-Smirnov Z
The PLS method was adopted to develop structural equation modeling (SEM) due to
the non-normality of the dependent construct. The analysis was run in IBM SPSS v.21 and
SmartPLS 2.0.M3 software (Ringle et al., 2015).
2.3.4 RESULTS
2.3.4.1 Univariate analysis
This section analyzes data of each construct and the distribution of responses given to
each variable.

92
2.3.4.1.1 Control Variables
There were four questions about project features. Figure 23 shows the questions about
each one of them.
Variable Project characteristics
CVD The time duration of the project was
CVC The total cost of the project was
CVS The company size where the project was implemented
CVT The total number of team members that worked on the project
Scale: CVD: 1 - up to 1 month; 2 - between 1 and 3 months;3 - between 3 and 6 months; 4 - between 6 and 12 months;5
- greater than 1 year
CVC: 1 - less than 20 thousand dollars; 2 - between 20 and 50 thousand dollars; 3 - between 50 and 100 thousand
dollar; 4 - between 100 and 500 thousand dollars; 5 - greater than 500 thousand dollars
CVS: 1 - up to 100 employees; 2 - between 100 and 500 employees; 3 - between 500 and 1000 employees;4 - between
1000 and 5000 employees; 5 - more than 5000 employees
CVT: 1 - up to 10 team members; 2 - between 10 and 20 team members; 3 - between 20 and 40 team members; 4 -
between 40 and 75 team members; 5 more than 75 team members
Figure 23 - Control variables’ questions
Figure 24 shows the rating of responses about control variables. Mean project time
duration ranged from 6 to 12 months, rates recorded for projects below 3 months were lower.
Most responses regarded long-term projects. Most responses on project costs ranged from 20
to 500 thousand dollars. The median size of companies where projects were perfomed in
ranged from 1 to 5 thousand employees. Based on these responses, approximately 50% of
projects were conducted in more comprehensible environments comprising thousands of
potential project stakeholders. The median size of project teams ranged from 10 to 20
members, most responses regarded project teams encompassing up to 40 members.
According to the collected data, mean project features regarded project duration
ranging from 6 to 12 months, project cost from 50 and 100 thousand dollars, project teams
with 10 to 20 members and projects ran in companies having from 1 to 5 thousand employees.

93
Figure 24 - Rating of control variables
2.3.4.1.2 Project Performance (PP)
Eight questions about project management performance and product performance were
developed to evaluate project performance. Figure 25 shows the questions about this topic.
Variables PP1, PP2, and PP3 regarded questions about project management performance, and
variables PP4 to PP8 concerned questions on product performance.
Variable Project performance
PP1 Project were completed on time.
PP2 Project met budget requirements.
PP3 Project met scope
PP4 The system’s intended functional requirements were met.
PP5 The overall quality of the developed application is high.
PP6 The application developed is reliable.
PP7 The system meets user expectations with respect to response time.
PP8 The application is easy to maintain.
Scale: 1 - Completely disagree; 2 - Mostly disagree; 3 - Slightlyt disagree; 4 - Neither agree nor disagree; 5 - Slightly
agree; 6 - Mostly agree; 7 - Completely agree
Figure 25 - Project performance questions
Figure 26 shows the rating of responses recorded for project performance. Time
performance was a neutral question, it recorded median 4. Responses about budget were
positive; projects met the planned costs. Answers given to scope, fulfillment of functional
requirements and overall quality were positive; they recorded median 6. Product reliability
was the most positive question, it recorded median 6. Product time response and easiness to
be maintained were also positive questions, they recorded median 5. Overall, respondents

94
answered the questions based on projects that have had positive performance and met the iron
triangle requirements - products have met users’ expectations and needs.
Figure 26 - Project performance rating
2.3.4.1.3 Human Resources Management (RH)
There were four questions about human resources management activities. Figure 27
shows the questions about each one of them.
Variable Human resources activities
HR1 Project team had a good career planning provided by leadership.
HR2 Members of the project team were allowed to make many decision.
HR3 Opportunities were given to the project team to suggest improvements related to
how things should be done.
HR4 The leaders often asked to the project team to participate in decision-making.
Scale: 1 - Completely disagree; 2 - Mostly disagree; 3 - Slightlyt disagree; 4 - Neither agree nor disagree; 5 - Slightly
agree; 6 - Mostly agree; 7 - Completely agree
Figure 27 - Human resource management questions
Figure 28 shows the rating of responses given to human resources management.
Career planning by leaderships was a negative question; it recorded median 3. Team
members’ permission to make decisions about projects was a positive question; it recorded
median 5. Permission to suggest project improvements was the most positive question; it
recorded median 6. Leaders asking team members to participate in decision-making was also
a positive question; it recorded median 5. The set of responses has emerged as positive when

95
it comes to team members’ participation in the project, in different ways (HR2, HR3, and
HR4), but it was negative in terms of leaderships’ ability to develop team members’ career
plans.
Figure 28 - Human resources management rating
2.3.4.1.4 Project Communication Management (CM)
There were four questions about communication management activities. Figure 29
shows the questions about each one of them.
Variable Communication management activities
CM1 The extent of communication between internal project parties is often optimal
CM2 The extent of communication between external project parties is often optimal
CM3 I rarely experienced conflicts and disputes between project parties resulting from
lack of communication.
CM4 Communication issues or conflicts were rarely caused by errors or defects in the
project documents.
Scale: 1 - Completely disagree; 2 - Mostly disagree; 3 - Slightlyt disagree; 4 - Neither agree nor disagree; 5 - Slightly
agree; 6 - Mostly agree; 7 - Completely agree
Figure 29 - Communication management questions
The set of responses about communication management was positive, all variables
recorded median 5. Figure 30 shows the response rating recorded for communication
management. This set of responses shows regular and positive communication in project
conduction among internal teams, and between internal and external stakeholders.

96
Figure 30 - Communication management rating
2.3.4.1.5 Risk Management (RM)
There were four questions about risk management activities. Figure 31 shows the
questions about each one of them.
Variable Risk management activities
RM1 The project had a risk management procedure.
RM2 Significant threats were identified.
RM3 Buffers were included on time and cost to absorb uncertainty.
RM4 Change request were registered and their impact on project were evaluated.
Scale: 1 - Completely disagree; 2 - Mostly disagree; 3 - Slightlyt disagree; 4 - Neither agree nor disagree; 5 - Slightly
agree; 6 - Mostly agree; 7 - Completely agree
Figure 31 - Risk management questions
The rating of responses for risk management is shown in Figure 32. There was neutral
rate for projects that counted on risk management procedures and for the adoption of buffers,
including time and cost to absorb uncertainties; both questions recorded median 4. Threat
identification and change requests’ impact evaluation were positive questions; they recorded
median 5. This data set shows that risk registration and evaluation are the most common
activities, even when risk management procedures are not in place.

97
Figure 32 - Risk management rating
2.3.4.1.6 Quality Management (QM)
There were five questions about quality management activities. Figure 33 shows the
questions about each one of them.
Variable Quality management activities
QM1 The project followed quality standards, a well-written working process and
detailed construction steps.
QM2 This project routinely carried out tests of various detection, including construction
process and the completed parts.
QM3 The project followed continuous control and improvements in the
development/implementation process.
QM4 The project quality diary were updated frequently.
QM5 The quality activities of this project could solve problems effectively.
Scale: 1 - Completely disagree; 2 - Mostly disagree; 3 - Slightlyt disagree; 4 - Neither agree nor disagree; 5 - Slightly
agree; 6 - Mostly agree; 7 - Completely agree
Figure 33 - Risk management questions
The rating of responses recorded for quality management activities is shown in Figure
34. The written quality standards had positive rate, they recorded median 5. Test routines
were the most positive questions, they recorded median 5. Continuous improvement process
was the most positive project activity, it recorded median 5. Daily quality update was neutral,
it recorded - median 4. Quality activities to help solving problems recorded positive rate -
median 5.
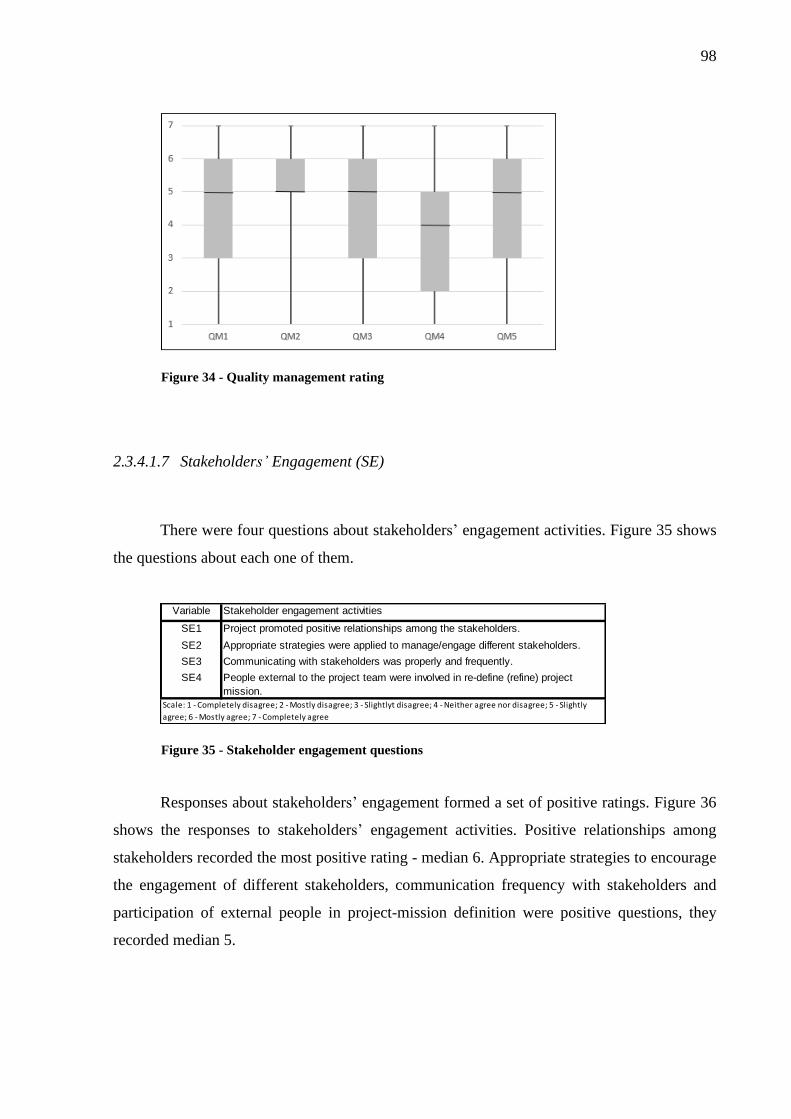
98
Figure 34 - Quality management rating
2.3.4.1.7 Stakeholders’ Engagement (SE)
There were four questions about stakeholders’ engagement activities. Figure 35 shows
the questions about each one of them.
Variable Stakeholder engagement activities
SE1 Project promoted positive relationships among the stakeholders.
SE2 Appropriate strategies were applied to manage/engage different stakeholders.
SE3 Communicating with stakeholders was properly and frequently.
SE4 People external to the project team were involved in re-define (refine) project
mission.
Scale: 1 - Completely disagree; 2 - Mostly disagree; 3 - Slightlyt disagree; 4 - Neither agree nor disagree; 5 - Slightly
agree; 6 - Mostly agree; 7 - Completely agree
Figure 35 - Stakeholder engagement questions
Responses about stakeholders’ engagement formed a set of positive ratings. Figure 36
shows the responses to stakeholders’ engagement activities. Positive relationships among
stakeholders recorded the most positive rating - median 6. Appropriate strategies to encourage
the engagement of different stakeholders, communication frequency with stakeholders and
participation of external people in project-mission definition were positive questions, they
recorded median 5.

99
Figure 36 - Stakeholder engagement rating
2.3.4.1.8 Stakeholder Salience (SS)
There were three questions about stakeholder salience qualification regarding
legitimacy, power and urgency attributes. Figure 37 shows the questions about each one of
them.
Variable Stakeholder salience qualification
SS1 People external to the project team engaged in the project were considered as
desirable or appropriate.
SS2 People external to the project team engaged in the project were considered as
able to apply social influence to obtain its will.
SS3 People external to the project team engaged in the project were considered as
pressing and requiring immediate attention.
Scale: 1 - Completely disagree; 2 - Mostly disagree; 3 - Slightlyt disagree; 4 - Neither agree nor disagree; 5 - Slightly
agree; 6 - Mostly agree; 7 - Completely agree
Figure 37 - Stakeholder salience questions
Responses about the three attributes of stakeholders were positive, they recorded
median 5. Stakeholders’ legitimacy and urgency did not get any response 1 (completely
disagree). Stakeholders’ urgency concentrated responses in 4 and 5. This set of responses
shows positive qualification for salient stakeholders’ engagement to project activities.

100
Figure 38 - Stakeholder salience rating
2.3.4.2 Measurement model analysis
2.3.4.2.1 Test applied to control variables
Model tests started with the statistical validation of control variables through
bootstrapping, which can be used in PLS path modeling to provide confidence intervals for all
estimated parameters by building statistical inference basis (Henseler et al., 2009). Student's t-
test was carried out through the bootstrapping technique by successively resampling the
original data through replacements in order to determine the model sample (Hair et al., 2016).
The SmartPLS 2.0.M3 software was used to assess 503 cases, with 503 repetition samples, to
determine the path coefficients for control and dependent variables applied to Student t-test
observation - t-value represents the real difference between groups, it took into account the
standard error (Figure 39). Table 4 shows the recorded results.

101
Figure 39 - Control variables in SmartPLS
The t-test showed significance for three control variables. Project total cost had
significant impact (t-value=2.782) on process performance, and it suggested that higher
planned costs have positive effect on project results. The size of the company where the
project is conducted also represented significant impact (t-value=2.643) on project
performance. This relationship suggested that bigger companies’ resource environments have
better effect on project performance than smaller companies. The number of members
working in a project had important significance (t-value=10.619) in project performance.
However, the relationship was negative, and it meant that the increasing number of people
working in a project can affect project performance. Project duration did not have significant
impact on project performance.
Table 4 - Control variables t-value
Original Sample Sample Mean Std. Deviation Std. Error T Statistics Sig
0.168 0.172 0.060 0.060 2.782 ***
0.010 0.009 0.049 0.049 0.209
0.124 0.125 0.047 0.047 2.643 ***
-0.439 -0.444 0.041 0.041 10.619 ***
Note: Critical limits for infinite sample t test (>=120)
1.65 = p -Value<0.10*
1.96 = p -Value<0.05**
2.53 = p -Value<0.01***
Structural path
Cost-> Performance
Duration -> Performance
Size -> Performance
Team -> Performance
Because duration did not have significant impact on the dependent variable, all other
statistical analyses were performed through the adjusted model. Figure 40 shows the adjusted
conceptual framework applied to analyze control variables: project cost, company size and
team size.

102
Figure 40 - Adjusted conceptual Framework
2.3.4.2.2 Main path analysis
The model analyses in this section were performed with variables directly related to
the dependent variable; they excluded the moderation effect. The two-stage PLS approach
allowed estimating the main effects of the PLS model at stage 1 and the interaction with
moderator variables in the model at stage 2 (Henseler & Fassott, 2010). The tests were
performed in SmartPLS 2.0.M3 software based on the model shown in Figure 41.
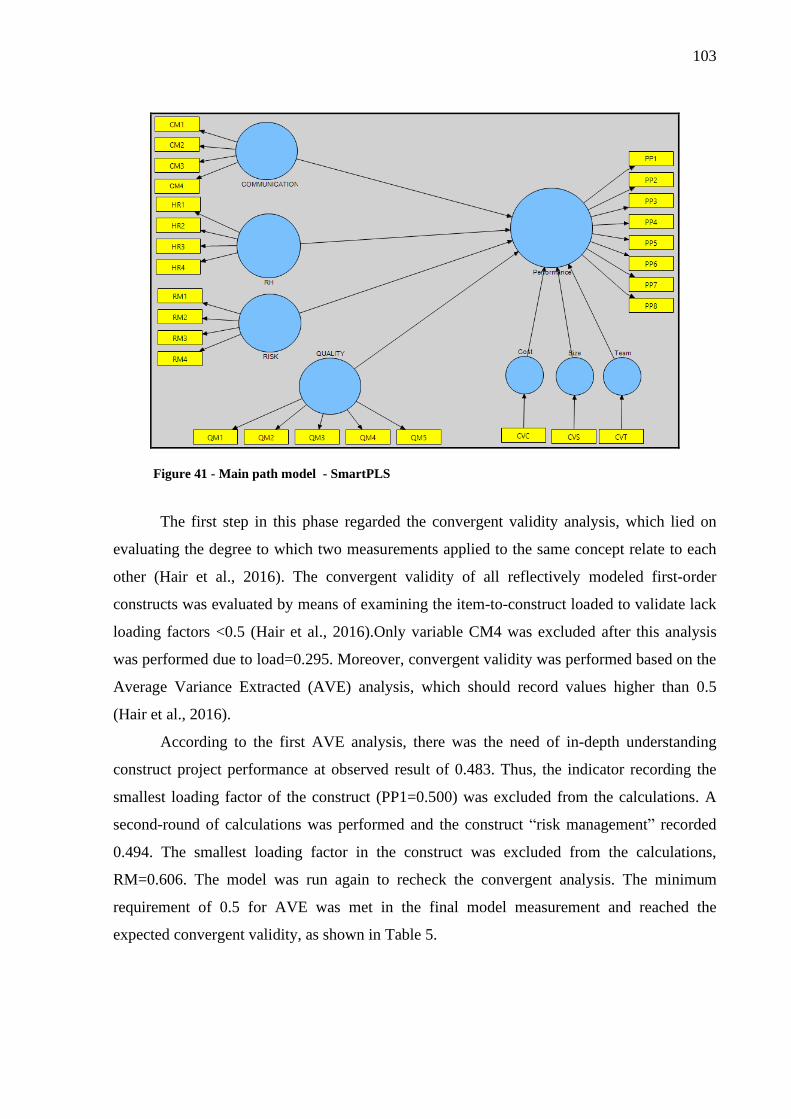
103
Figure 41 - Main path model - SmartPLS
The first step in this phase regarded the convergent validity analysis, which lied on
evaluating the degree to which two measurements applied to the same concept relate to each
other (Hair et al., 2016). The convergent validity of all reflectively modeled first-order
constructs was evaluated by means of examining the item-to-construct loaded to validate lack
loading factors <0.5 (Hair et al., 2016).Only variable CM4 was excluded after this analysis
was performed due to load=0.295. Moreover, convergent validity was performed based on the
Average Variance Extracted (AVE) analysis, which should record values higher than 0.5
(Hair et al., 2016).
According to the first AVE analysis, there was the need of in-depth understanding
construct project performance at observed result of 0.483. Thus, the indicator recording the
smallest loading factor of the construct (PP1=0.500) was excluded from the calculations. A
second-round of calculations was performed and the construct “risk management” recorded
0.494. The smallest loading factor in the construct was excluded from the calculations,
RM=0.606. The model was run again to recheck the convergent analysis. The minimum
requirement of 0.5 for AVE was met in the final model measurement and reached the
expected convergent validity, as shown in Table 5.

104
Table 5 - AVE
AVE Communication Performance QualityHuman
ResourcesRisk
Communication 0.611 0.781*
Performance 0.520 0.587 0.721*
Quality 0.526 0.470 0.520 0.725*
Human Resources 0.542 0.336 0.339 0.505 0.736*
Risk 0.540 0.500 0.464 0.592 0.465 0.735*
*AVE square root
Once the pre-set criteria for confirming model convergent validity were met, the next
step lied on ensuring model discriminant validity, which refers to the degree to which one
construct in the model is differentiated from other constructs in the same model (Hair et al.,
2016). The discriminant validity was evaluated through the square root of AVE, which must
be higher than the correlation between the construct and the other constructs (Fornell &
Larcker, 1981). The square root of the AVE in the model was greater than correlations
between the construct, and this finding suggested discriminant validity. The bold numbers in
Table 4 diagonally report the square roots of AVE - off-diagonal numbers are correlations
among constructs. Thereby, the main path model explained 48.4% variance in project
performance based on Pearson's determination coefficients: r2=0.484 (Cohen, 1988).
Evaluations assessed the main structural path model by following the structural
equation for analysis modeling. A resampling technique was performed based on Student's t-
test carried out through the bootstrapping technique (Hair et al., 2016). In total, 503 cases,
with 503 repetitions, were used in the Student t-test - the t value represented a real difference
between groups and the standard error was taken into account. Values were significant at
t=1.96 (Hair et al., 2016). Table 6 shows the results.
Table 6 - Validation of the main path hypothesis
Hypothesis Original Sample Sample Mean Std. Deviation Std. Error T Statistics Sig
H1 0.340 0.337 0.043 0.043 7.929 ***
H2 -0.043 -0.037 0.039 0.039 1.120
H3 0.174 0.172 0.056 0.056 3.100 ***
H4 0.229 0.231 0.059 0.059 3.890 ***
0.077 0.076 0.036 0.036 2.140 **
-0.291 -0.293 0.035 0.035 8.298 ***
0.089 0.089 0.039 0.039 2.301 **
Note: Critical limits for infinite sample t test (>=120)
1.65 = p -Value<0.10*
1.96 = p -Value<0.05**
2.53 = p -Value<0.01***
Structural path
Communication-> Performance
Risk -> Performance
Quality -> Performance
Size -> Performance
Team -> Performance
Cost -> Performance
Human Resources -> Performance

105
According to the Student's t=7.929 and p<0.001, the communication construct had
positive effect on performance. Thus, the analysis of risk effects on performance was
significantly positive: Student's t=3.100 and p<0.001. There was significant and positive
impact of quality: Student's t=3.890 and p<0.001. Human resources’ effect on performance
was not significant: Student's t=1.120 and p>0.10.
2.3.4.2.3 Full model analysis
The following analyses were tested and the full model was validated. Stage 2 of the
PLS effects lied on estimating interactions among moderator variables in the model (Henseler
& Fassott, 2010). The tests were performed in SmartPLS 2.0.M3 software based the model, as
shown in Figure 42.
Figure 42 - Full model SmartPLS
Evaluations of the structural full model followed the structural equation of the
modeling analysis. The Student's t-test carried out through the bootstrapping technique was
used in the study as resampling technique. In total, 503 cases, with 503 repetitions, were used

106
in the Student t-test - t value represented a real difference between groups and took into
account the standard error. Table 7 shows the results.
Table 7 - Validation of the full path hypothesis
Hypothesis Original Sample Sample Mean Std. Deviation Std. Error T Statistics Sig
0.181 0.197 0.241 0.241 0.751
0.209 0.222 0.187 0.187 1.120
0.186 0.190 0.174 0.174 1.073
0.216 0.212 0.288 0.288 0.748
H5a 0.114 0.127 0.366 0.366 0.313
H5b 0.799 0.763 0.244 0.244 3.272 ***
H5c -1.799 -1.800 0.264 0.264 6.812 ***
H5d 0.362 0.370 0.446 0.446 0.812
H6a -0.166 -0.194 0.363 0.363 0.458
H6b -1.068 -1.048 0.311 0.311 3.430 ***
H6c 1.524 1.517 0.313 0.313 4.869 ***
H6d -0.312 -0.317 0.408 0.408 0.765
0.068 0.064 0.034 0.034 1.973 **
-0.314 -0.311 0.036 0.036 8.613 ***
0.145 0.148 0.037 0.037 3.887 ***
Note: Critical limits for infinite sample t test (>=120)
1.65 = p-Value <0.10*
1.96 = p-Value <0.05**
2.53 = p-Value <0.01***
Structural path
Communication-> Performance
Risk -> Performance
Quality -> Performance
Size -> Performance
Team -> Performance
Cost -> Performance
Risk*Salience-> Performance
Quality*Salience-> Performance
Human Resources -> Performance
Communication*Engagement->
Performance
Human Resources*Engagement->
Performance
Risk*Engagement-> Performance
Quality*Engagement-> Performance
Communication*Salience->
Performance
Human Resources*Salience->
Performance
The t-test values were relevant because they reached values higher than the given
relevance level; this finding was indicative of causal relationship between some constructs.
Based on this analysis, there was positive effect of human resources management on
performance when it was moderated by stakeholder's engagement, according to the Student's
t-test results (3.272). There was significant effect of risk management on performance
moderated by stakeholders’ engagement, but such an effect was negative based on the
Student's t-test (6.812). Stakeholder's engagement had positive effect when it moderated the
effect of risk management on project performance, based on the Student's t-test (4.869). Thus,
there was significant human resources management effect on performance when it was
moderated by stakeholders’ engagement, based on the Student's t-test (3.430), although the
effect was negative. Moderator effects on other associations were not significant, based on the
Student's t-test <1.650. The total effect of project performance variation explained 62.1% of
project performance variance, based on Pearson's determination coefficient: r2=0.621 (Cohen,
1988). According to Cohen (1988), the minimum value for variance explanation or Pearson's
determination coefficient (R2) must be N=0.26; this number is endorsed by Hair et al.(2016).

107
Based on this parameter, R2 recorded for latent variables (dimensions or first-order
constructs) in the proposed model was high.
2.3.5 DISCUSSIONS
The aim of the current study was to validate stakeholder's participation in projects as a
positive practice to enhance project performance. Performance analyses should go beyond
revenue rates and companies should address additional aspects of performance measurements
(Freeman et al., 2020). The herein measured projects were assessed based on the financial
perspective, as well as on how good and adequate products generated by them were. Product
performance questions in the survey (Appendix A) asked respondents to analyze IT system
delivery according to reliability, ease of use, functional requirements, response time and
quality aspects (Diegmann et al., 2017).
The first relation test assessed the positive effect of communication management on
project performance (H1) and its results have supported the hypothesis about it, which
recorded significance p<0.01. This finding is in compliance with the study by Lindhard and
Larsen (2016), according to whom, communication is one of the key factors for project
performance in project construction. They extended the validation of communication effects
on project performance construction (Lindhard & Larsen, 2016; Xia et al., 2016) to IT
projects. The current results extend the validation of the study by Hsu et al. (2012), who have
validated communication effects on team performance, but who have not assessed their
impact on project performance. Respondents have observed effective communication with
internal and external teams as common practice (Figure 10), and such a profile corroborated
the research by Yap et al. (2017), who found lack of communication as a factor influencing
design changes in projects. Some challenges are faced at the time to validate the positive
effects of communication on IT projects; Kannabiran and Sankaran (2011) have tested such
an association and did not find significant results. The same happened in the present study,
since it was not possible recording any significant validation to communication management
effects on project performance moderated by engaged stakeholders. This outcome did not
support H5a. Moderation by salient stakeholders also did not support H6a. The combination
of communication effects and salient stakeholders was tested in previous studies (Kuruppu et
al., 2019; Uysal et al., 2018), although not in project contexts. Stakeholders’ engagement was

108
validated in the tourism context (Bec et al., 2019; Agacevic & Xu, 2020), but, yet, not in
project management context.
Human resources’ management recorded intriguing results in the model. Popaitoon &
Siengthai (2014) tested human resources’ management effects on long and short-term project
performance in the automotive industry. They adopted the IT context scale but did not find
significant HR effect on PP, and this finding did not support H2. On the one hand, the mean
answer by respondents about career planning (Figure 8) slightly disagreed with the statement
of having career planning for team members. The question about team accountability and
participation simulations was positive and in compliance with affirmative answers. The lack
of leadership by project managers (Afzal et al., 2018; Bhoola & Giangreco, 2018) and of top
management support were common explanations for the non-significant results regarding H2
confirmation (Rosacker & Olson, 2008). Lack of either project management leadership or top
management support can encourage team members to be autonomous and make decisions on
their own; however, such a non-supportive profile may lead to decisions that are not in
compliance with project goals.
The complexity of human resources’ project scenarios can be corroborated by
moderated human resources’ management path and project performance validation. When
stakeholders’ engagement moderates HR effects on PP, such a profile significantly supports
H5b. Customers’ engagement to activities can encourage positive participation and lead to
potentially positive results (Vivek et al., 2012). This positive potential can be explored
through project management performance, giving team member's autonomy and participation
in decisions in compliance with both expectations of system users and project goals. Calvo
and Calvo (2018) conducted a case study and suggested a framework based on adopting
human resources and stakeholders’ engagement practices to meet business strategies and
fulfill employees’ interest in order to improve operational performance. Although the present
study has supported positive stakeholders’ engagement moderation in HR and PP activities,
the same did not happen with salient shareholders’ moderation in HR and PP, since it was not
significant (p>0.10) and did not support H6b. Based on this finding, the salience of
stakeholders participating in HR activities was not significant concerning PP. Järlström et at.
(2018) performed a case study based on the top management perspective and found that some
stakeholders are more important than others depending on the HR management dimension;
this finding pointed out the importance of the stakeholders’ salience analysis. Thus, HR
management effects on PP can be potentiated by stakeholders’ engagement to its activities,
but their salience did not present significant results.

109
H3 regards the hypothesis that risk management has positive effects on project
performance. The present results have supported this hypothesis, which recorded significance
of p<0.01. This finding corroborated the vast number of studies relating RM activities from
different project performance dimensions. Carvalho and Rabechini Junior (2015) correlated
the hard and soft sides of risk management dimensions to project success in a field study
comprising 263 projects. It was possible evaluating the hard side of project risk management
by adopting this risk management dimension approach. Some previous studies, similarly to
the present one, have found evidences that efficient risk management leads to better project
performance (Bakker et al., 2012; Oehmen et al., 2014; J. Y.-C. Liu & Chiu, 2016; Crispim et
al., 2019; Rasul et al., 2019). According to respondents in the current survey, the mean answer
(Figure 12) positively agreed with statements about RM activities being performed in
projects. Thus, from the viewpoint of RM effects on PP validation-dimension, the present
project presented results similar to those in previous research.
The contribution of the present RM project study lies on the role played by
stakeholders in its activities. The moderation effect of stakeholder's engagement on RM and
PP was the first hypothesis to be tested. SE moderation effect was highly significant, p<0.01,
but negative, which meant that stakeholders’ engagement to RM activity participation could
lead to negative effects on PP. Effectively dealing with project risks is difficult and requires
managerial interventions that go beyond simple analytical approaches (Thamhain, 2013),
which may partially explain the aforementioned result. The simple stakeholders’ engagement
is not guarantee of better efficiency results. Wyk et al. (Wyk et al., 2008) conducted a case
study in a utility company and found that stakeholders played a key role in risk identification
activities; however, they also observed that the role played by experts is essential to reach
more sophisticated RM methods. Stakeholders’ classification can be substantiated by
stakeholders’ salience analysis (Mitchell et al., 1997). Salient stakeholders’ moderation
effects on the RM/PP association was herein tested and the result was significantly high
p<0.01; this finding has supported H6c. Based on this outcome, the higher the stakeholders’
salience in the project, the higher their contribution to RM. Stakeholders’ motivation and
reputation are essential to create a cooperative environment and to reach a good degree of
contribution to IT projects (Vos et al., 2016). This observation opens room for important
insights about how to make stakeholders and project team members’ cooperate to RM.
Engaged stakeholders were not enough to improve PP, and this finding was corroborated by
the mean evaluation of respondents (Figure 12). Stakeholders evaluated based on salience

110
could be selected to contribute to plan and monitor risk threats and responses throughout the
project.
Quality management results have confirmed the hypothesis about its positive effect on
project performance, since the recorded results showed high significance ( p<0.01) - this
finding has supported H4. The mean positive agreement by respondents with QM activities
(Figure 14) has confirmed that such activities have been performed in projects and have
positive impact on PP. Lu et al. (2019) validated quality management effects on project
performance construction due to individuals’ practices and to process definition and
conduction. Mature quality management leads to better results. Previous studies have analized
the degree of QM maturity based on project management success in different fields (Shieh &
Wu, 2002; Jung & Wang, 2006; Milunovic & Filipovic, 2013; Doneva et al., 2016).
Stakeholders’ engagement effects were herein assessed and results were not significant
(p>0.10) and did not support H5d. The same result was recorded for stakeholders’ salience,
which recorded significance of p>0.10 and did not support H6d. These outcomes have shown
that it is not possible validating stakeholders’ contribution to QM activities in order to achieve
better PP. Results of the tested hypotheses are shown in Figure 43
Figure 43 - Tested framework

111
2.3.6 CONCLUSIONS
2.3.6.1 Theoretical implications
The stakeholder theory often separates the theoretical from the real world of business.
There are several challenges to be overcome in order to connect intellectual to practical work
(Freeman et al., 2020). The current study has given important contributions to connect the
SM theory to the practical IT project management world. This theory has been dealing with
challenges to hear the voices and meet the different needs (sometimes conflicting) of many
people based on different aspects and in compliance with company goals. Mitchel et al.
(1997) provided a specific and measurable way to classify stakeholders by adding the degree
of salience to the stakeholder theory and helped understanding how they can have a
collaborative participation in projects. This theoretical classification was herein applied to
classify stakeholders who have collaborated to projects by listing the highest salience degree:
the higher their collaboration to project management activities, the higher the project
performance. The current study has given important contributions to connect the SM theory to
the practical world of IT project management.
First of all, it showed that stakeholders’ engagement to project management activities
is useful for IT projects and improves project performance. There was empirical evidence that
effective project management - CM, RM, QM – in IT projects has significant and positive
effect on PP. However, it was not possible finding significant evidence of HR effects on PP.
Nevertheless, SE potentiates the HR/PP association, whose empirical results can be measured,
as well. On the other hand, salient stakeholders may account for HR negative impact on PP.
Therefore, depending on the SS, the highest salience is not always the best choice, since
circumstantial needs can lead to negative results in projects, such as the case of HR
management.
The most significant contribution of the current study concerns risk management.
Similar to previous studies (Bakker et al., 2012; Oehmen et al., 2014; J. Y.-C. Liu & Chiu,
2016; Crispim et al., 2019; Rasul et al., 2019), the present one found evidences of positive
association between RM and PP. Its contribution lies on the role played by stakeholders in
RM. Significant threats may have strong impact on projects, and it must be evaluated, and
require process management and project team’s efforts (Keil et al., 2013). Based on the herein
presented empirical evidence, stakeholders’ engagement has negative impact on the RM/PP

112
association. But, the current research did not allow concluding that reducing SE is the best
decision to reduce negative impacts. When stakeholders were classified based on their
salience, there were empirical evidences about their positive contribution to the RM/PP
association. Therefore, stakeholders must be evaluated before they participate in RM
activities, which are essential for their positive contribution.
The present study added to the theory by helping to answer one of the many questions
presented by Freeman et al (2020). How deep stakeholders’ allocation and involvement in
coproduction must go over time? (Freeman et al., 2020). The model presented in this
conclusion (Figure 22) was validated by empirical evidences that the factual stakeholders’
participation in project activities is important, but not enough for the success of a project, as a
whole. Their engagement leads to better results in the short and long-term. Getting
stakeholders engaged to contribute overtime can be beneficial for projects.
2.3.6.2 Managerial Implications
The present study provided significant insight about IT projects and on project
practitioners and company leaderships’ participation in formulating strategies to manage
projects, to address IT users’ needs and participation, as well as to improve project results.
The concept of stakeholder theory will help developing a collaborative project environment
and addressing specific roles played by stakeholders in projects to avoid conflicts between
team members and external people (IT users).
Based on the current results, project managers and Top management support are
fundamental in terms of human resources. Although team members need autonomy to make
decisions, give opinions and participate in important decision-making, this autonomy is not
effective without support from the higher management spheres. External people contribute to
human resources when stakeholders are engaged to decision-making and RM results get
positive to IT projects; however, salient stakeholders can lead to negative impacts. Project
managers must support interactions between team members and stakeholders, since their
urgent needs or high power can influence the results and turn positive contributions into
negative ones.
Project managers and practitioners must apply RM practices to protect project from
threats and to find and explore opportunities. RM is performed throughout the whole project,

113
but external help to identify and monitor risks is important. Reponses to risks are sometimes
controversial, but well-prepared stakeholders give more positive contributions to such
activities. Therefore, project managers must work very close to collaborate and identify the
most and least prepared stakeholders among the salient ones to participate in each RM
activity.
2.3.6.3 Limitations and future research suggestions
Results are limited to IT software project context. This limitation opens room for
further studies to validate the theoretical or empirical model for specific business sectors, or
for non-software or non-IT projects. There are other stakeholder classification models that can
be used to classify them.
2.3.7 REFERENCES
Aaltonen, K., Jaakko, K., & Tuomas, O. (2008). Stakeholder salience in global projects.
International Journal of Project Management, 26(5), 509–516.
Aaltonen, K., Kujala, J., Havela, L., & Savage, G. (2015). Stakeholder dynamics during the
project front-end: The case of nuclear waste repository projects. Project Management
Journal, 46(6), 15–41.
Abdollahi, H. R., Hosseini, S. M., & Alimohammadzadeh, K. (2019). Stakeholder analysis
using the matrix interest-power in insurance industry: Case study of Hafez Atiehzasan
insurance. INTERNATIONAL TRANSACTION JOURNAL OF ENGINEERING
MANAGEMENT & APPLIED SCIENCES & TECHNOLOGIES.
Afzal, A., Khan, M. M., & Mujtaba, B. G. (2018). The impact of project managers’
competencies, emotional intelligence and transformational leadership on project
success in the information technology sector. Marketing and Management of
Innovations, 2, 142–154.
Agacevic, A., & Xu, M. (2020). Chinese tourists as a sustainable boost to low seasons in ex-
yugoslavia destinations. Sustainability (Switzerland), 12(2). Scopus.
https://doi.org/10.3390/su12020449

114
Ahmadian Fard Fini, A., Akbarnezhad, A., Rashidi, T. H., & Waller, S. T. (2018). Dynamic
programming approach toward optimization of workforce planning decisions. Journal
of Construction Engineering and Management, 144(2), 04017113.
Atkinson, R. (1999). Project management: Cost, time and quality, two best guesses and a
phenomenon, its time to accept other success criteria. International Journal of Project
Management, 17(6), 337–342.
Aubry, M., & Brunet, M. (2016). Organizational design in public administration:
Categorization of project management offices. Project Management Journal, 47(5),
107–129.
Auinger, A., Nedbal, D., & Hochmeier, A. (2013). An Enterprise 2.0 project management
approach to facilitate participation, transparency, and communication. International
Journal of Information Systems and Project Management, 1(2), 43–60.
Axelos. (2017). Managing Successful Projects with PRINCE2® 6th Edition. Norwich: The
Stationery Office.
Baguley, P. (1994). Effective communication for modern business. McGraw-Hill.
Bakker, K. de, Boonstra, A., & Wortmann, H. (2010). Does risk management contribute to IT
project success? A meta-analysis of empirical evidence. International Journal of
Project Management, 28(5), 493–503.
Bakker, K. de, Boonstra, A., & Wortmann, H. (2012). Risk managements’ communicative
effects influencing IT project success. International Journal of Project Management,
30(4), 444–457.
Bec, A., Moyle, B., Timms, K., Schaffer, V., Skavronskaya, L., & Little, C. (2019).
Management of immersive heritage tourism experiencs: A conceptual model. Tourism
Management, 72, 117–120. Scopus. https://doi.org/10.1016/j.tourman.2018.10.033
Bergman, B., & Klefsjö, B. (2010). Quality from customer needs to customer satisfaction.
Studentlitteratur AB.
Bhoola, V., & Giangreco, A. (2018). HR activities and practices for project success: A multi-
method approach from Indian IT firms. Australasian Journal of Information Systems,
22.
Boehm, B. W. (1991). Software risk management: Principles and practices. Software, IEEE,
8(1), 32–41.
Bond-Barnard, T. J., Steyn, H., & Fabris-Rotelli, I. (2013). The impact of a call centre on
communication in a programme and its projects. International Journal of Project
Management, 31(7), 1006–1016.

115
Brodie, R. J., Hollebeek, L. D., Jurić, B., & Ilić, A. (2011). Customer engagement:
Conceptual domain, fundamental propositions, and implications for research. Journal
of Service Research, 14(3), 252–271.
Butt, A., Naaranoja, M., & Savolainen, J. (2016). Project change stakeholder communication.
International Journal of Project Management, 34(8), 1579–1595.
Calvo, N., & Calvo, F. (2018). Corporate social responsibility and multiple agency theory: A
case study of internal stakeholder engagement. Corporate Social Responsibility and
Environmental Management, 25(6), 1223–1230. https://doi.org/10.1002/csr.1633
Cao, N. (2018). Application of project quality management to increase the successful rate of
car project: A case study in China. International Journal of Services Technology and
Management, 24(1–3), 246–262.
Carvalho, M. M. de, Patah, L. A., & Bido, D. de S. (2015). Project management and its effects
on project success: Cross-country and cross-industry comparisons. International
Journal of Project Management, 33(7), 1509–1522.
Carvalho, M. M. de, & Rabechini Junior, R. (2015). Impact of risk management on project
performance: The importance of soft skills. International Journal of Production
Research, 53(2), 321–340.
Chang, Y.-F., & Ishii, H. (2013). Fuzzy multiple criteria decision making approach to assess
the project quality management in project. Procedia Computer Science, 22, 928–936.
Chen, C. C., Nakayama, M., Shou, Y., & Charoen, D. (2018). Increasing Project Success in
China from the Perspectives of Project Risk, Methodology, Tool Use, and
Organizational Support. International Journal of Information Technology Project
Management.
Chen, G., Donahue, L. M., & Klimoski, R. J. (2004). Training Undergraduates to Work in
Organizational Teams. Academy of Management Learning & Education, 3(1), 27–40.
Cheung, S. O., Yiu, T. W., & Lam, M. C. (2013). Interweaving trust and communication with
project performance. Journal of Construction Engineering and Management, 139(8),
941–950.
Chow, V., & Leiringer, R. (2020). The practice of public engagement on projects: From
managing external stakeholders to facilitating active contributors. Project
Management Journal, 51(1), 24–37.
Cohen, J. (1988). Statistical power analysis for the behavioral sciences. Lawrence Erlbaum.
Hillsdale, NJ.

116
Creswell, J. W. (2013). Research design: Qualitative, quantitative, and mixed methods
approaches. Sage publications.
Crispim, J., Silva, L. H., & Rego, N. (2019). Project risk management practices: The
organizational maturity influence. International Journal of Managing Projects in
Business.
Dahlgaard-Park, S. M. (2011). The quality movement: Where are you going? Total Quality
Management & Business Excellence, 22(5), 493–516.
Davila, A., Rodriguez-Lluesma, C., & Elvira, M. M. (2018). Engaging stakeholders in
emerging economies: The case of multilatinas. Journal of Business Ethics, 152(4),
949–964.
De Bakker, K., Boonstra, A., & Wortmann, H. (2011). Risk management affecting IS/IT
Project success through communicative action. Project Management Journal, 42(3),
75–90. Scopus.
Demirkesen, S., & Ozorhon, B. (2017). Measuring project management performance: Case of
construction industry. Engineering Management Journal, 29(4), 258–277.
Desai, V. M. (2018). Collaborative stakeholder engagement: An integration between theories
of organizational legitimacy and learning. Academy of Management Journal, 61(1),
220–244.
Diegmann, P., Basten, D., & Pankratz, O. (2017). Influence of communication on client
satisfaction in information system projects: A quantitative field study. Project
Management Journal, 48(1), 81–99.
Dobele, A. R., Westberg, K., Steel, M., & Flowers, K. (2014). An examination of corporate
social responsibility implementation and stakeholder engagement: A case study in the
Australian mining industry. Business Strategy and the Environment, 23(3), 145–159.
Doneva, R., Gaftandzhieva, S., & Totkov, G. (2016). Fetch project: The maturity of quality
management through dynamic evaluation of the project progress. International
Journal on Information Technologies and Security, 29–38.
Ejohwomu, O. A., Oshodi, O. S., & Lam, K. C. (2017). Nigeria’s construction industry:
Barriers to effective communication. Engineering, Construction and Architectural
Management, 24(4), 652–667.
Elias, A. A. (2016). Analysing the stakes of stakeholders in research and development project
management: A systems approach. R&D Management, 46(4), 749–760.

117
ElWakeel, O., & Andersen, B. (2019). Stakeholder evolution: A study of stakeholder
dynamics in 12 Norwegian projects. International Journal of Managing Projects in
Business.
Engelbrecht, J., Johnston, K. A., & Hooper, V. (2017). The influence of business managers’
IT competence on IT project success. International Journal of Project Management,
35(6), 994–1005.
Eskerod, P., Huemann, M., & Ringhofer, C. (2015). Stakeholder inclusiveness: Enriching
project management with general stakeholder theory. Project Management Journal,
46(6), 42–53.
Eskerod, P., & Vaagaasar, A. L. (2014). Stakeholder Management Strategies and Practices
During a Project Course. Project Management Journal, 45(5), 71–85.
Field, A. (2013). Discovering statistics using IBM SPSS statistics. sage.
Flyvbjerg, B. (2014). What you should know about megaprojects and why: An overview.
Project Management Journal, 45(2), 6–19.
Fornell, C., & Larcker, D. F. (1981). Evaluating Structural Equation Models with
Unobservable Variables and Measurement Error. Journal of Marketing Research,
18(1), 39–50. https://doi.org/10.2307/3151312
Freeman, R. E. (1984). Strategic management: A stakeholder approach. Pitman.
Freeman, R. E., Phillips, R., & Sisodia, R. (2020). Tensions in Stakeholder Theory. Business
& Society, 59(2), 213–231.
Gemino, A., Reich, B. H., & Sauer, C. (2008). A temporal model of information technology
project performance. Journal of Management Information Systems, 24(3), 9–44.
Gibson Jr, G. E., Wang, Y.-R., Cho, C.-S., & Pappas, M. P. (2006). What is preproject
planning, anyway? Journal of Management in Engineering, 22(1), 35–42.
González-Benito, Ó., Venturini, W. T., & González-Benito, J. (2017). CRM technology:
Implementation project and consulting services as determinants of success.
International Journal of Information Technology & Decision Making, 16(02), 421–
441.
Gopal, A., Mukhopadhyay, T., & Krishnan, M. S. (2002). The role of software processes and
communication in offshore software development. Communications of the ACM, 8.
Greenwood, M. (2007). Stakeholder engagement: Beyond the myth of corporate
responsibility. Journal of Business Ethics, 74(4,), 315–327.
Gu, V. C., Hoffman, J. J., Cao, Q., & Schniederjans, M. J. (2014). The effects of
organizational culture and environmental pressures on IT project performance: A

118
moderation perspective. International Journal of Project Management, 32(7), 1170–
1181.
Güngör, D. Ö., & Gözlü, S. (2017). Investigating the relationship between activities of project
management offices and project stakeholder satisfaction. International Journal of
Information Technology Project Management, 8(2), 34–49.
Hair, J. F. J., Hult, G. T. M., Ringle, C., & Sarstedt, M. (2016). A primer on partial least
squares structural equation modeling (PLS-SEM). Sage publications.
Handzic, M., Durmic, N., Kraljic, A., & Kraljic, T. (2016). An empirical investigation of the
relationship between intellectual capital and project success. Journal of Intellectual
Capital, 17(3), 471–483.
Haq, S. U., Gu, D., Liang, C., & Abdullah, I. (2019). Project governance mechanisms and the
performance of software development projects: Moderating role of requirements risk.
International Journal of Project Management, 37(4), 533–548.
Hellström, M., Ruuska, I., Wikström, K., & J\aafs, D. (2013). Project governance and path
creation in the early stages of Finnish nuclear power projects. International Journal of
Project Management, 31(5), 712–723.
Henseler, J., & Fassott, G. (2010). Testing moderating effects in PLS path models: An
illustration of available procedures. In Handbook of partial least squares (pp. 713–
735). Springer.
Henseler, J., Ringle, C. M., & Sinkovics, R. R. (2009). The use of partial least squares path
modeling in international marketing. In New challenges to international marketing.
Emerald Group Publishing Limited.
Hersel, M. C., Helmuth, C. A., Zorn, M. L., Shropshire, C., & Ridge, J. W. (2019). The
corrective actions organizations pursue following misconduct: A review and research
agenda. Academy of Management Annals, 13(2), 547–585.
Hsu, J. S.-C., Shih, S.-P., Chiang, J. C., & Liu, J. Y.-C. (2012). The impact of transactive
memory systems on IS development teams’ coordination, communication, and
performance. International Journal of Project Management, 30(3), 329–340.
Imran, H. N., Syed, H. A. B., Shazia, A., & Kashif ur Rehman. (2011). The impact of human
resource (HR) performance management on project outcome. African Journal of
Business Management, 5(21), 8491–8499.
IPMA, I. P. M. A. (2016). IPMA “Project Excellence Baseline” Version 4.0. International
Project Management Association: Amsterdam, The Netherlands.

119
Järlström, M., Saru, E., & Vanhala, S. (2018). Sustainable human resource management with
salience of stakeholders: A top management perspective. Journal of Business Ethics,
152(3), 703–724.
Jarvenpaa, S. L., & Leidner, D. E. (1999). Communication and trust in global virtual teams.
Organization Science, 10(6), 791–815.
Johnson, J. (2018). CHAOS Report: Decision Latency Theory: It Is All About the Interval.
Lulu.com.
Jung, J. Y., & Wang, Y. J. (2006). Relationship between total quality management (TQM)
and continuous improvement of international project management (CIIPM).
Technovation, 26(5–6), 716–722.
Kannabiran, G., & Sankaran, K. (2011). Determinants of software quality in offshore
development – An empirical study of an Indian vendor. Information and Software
Technology, 53(11), 1199–1208.
Karlsen, J. T., Andersen, J., Birkely, L. S., & Ødegård, E. (2005). What characterizes
successfull IT projects. International Journal of Information Technology & Decision
Making, 04(04), 525–540.
Keil, M., Rai, A., & Liu, S. (2013). How user risk and requirements risk moderate the effects
of formal and informal control on the process performance of IT projects. European
Journal of Information Systems, 22(6), 650–672.
Khan, A. S., & Rasheed, F. (2015). Human resource management practices and project
success, a moderating role of Islamic Work Ethics in Pakistani project-based
organizations. International Journal of Project Management, 33(2), 435–445.
Kumar, K., Boesso, G., Batra, R., & Yao, J. (2019). Explicit and implicit corporate social
responsibility: Differences in the approach to stakeholder engagement activities of
U.S. and Japanese companies. Business Strategy and the Environment, 28(6), 1121–
1130. https://doi.org/10.1002/bse.2306
Kuruppu, S. C., Milne, M. J., & Tilt, C. A. (2019). Gaining, maintaining and repairing
organisational legitimacy: When to report and when not to report. Accounting,
Auditing & Accountability Journal, 32(7), 2062–2087.
Lagrosen, S., & Lagrosen, Y. (2012). Trust and quality management: Perspectives from
marketing and organisational learning. Total Quality Management & Business
Excellence, 23(1), 13–26.

120
Lehtinen, J., Aaltonen, K., & Rajala, R. (2019). Stakeholder management in complex product
systems: Practices and rationales for engagement and disengagement. Industrial
Marketing Management, 79, 58–70.
Li, J., Slyngstad, O. P. N., Torchiano, M., Morisio, M., & Bunse, C. (2008). A State-of-the-
Practice Survey of Risk Management in Development with Off-the-Shelf Software
Components. Software Engineering, IEEE Transactions On, 34(2), 271–286.
https://doi.org/10.1109/TSE.2008.14
Lin, K.-L. (2011). Human resource allocation for remote construction projects. Journal of
Management in Engineering, 27(1), 13–20.
Lindhard, S., & Larsen, J. K. (2016). Identifying the key process factors affecting project
performance. Engineering, Construction and Architectural Management, 23(5), 657–
673.
Lisburn, D., & Baxter, S. (1994). Applying business-process reengineering to IT project
development. International Journal of Project Management, 12(4), 205–208.
Liu, J. Y.-C., & Chiu, G. C.-T. (2016). Influence of project partnering on stakeholder role
ambiguity and project manager risk perception in information system projects. Project
Management Journal, 47(6), 94–110.
Liu, S. (2016). How the user liaison’s understanding of development processes moderates the
effects of user-related and project management risks on IT project performance.
Information & Management, 53(1), 122–134.
Lu, P., Cai, X., Wei, Z., Song, Y., & Wu, J. (2019). Quality management practices and inter-
organizational project performance: Moderating effect of governance mechanisms.
International Journal of Project Management, 37(6), 855–869.
Maytorena, E., Winch, G. M., Freeman, J., & Kiely, T. (2007). The influence of experience
and information search styles on project risk identification performance. IEEE
Transactions on Engineering Management, 54(2), 315–326.
Milunovic, S., & Filipovic, J. (2013). Methodology for quality management of projects in
manufacturing industries. Total Quality Management & Business Excellence, 24(1–2),
91–107.
Missonier, S., & Loufrani-Fedida, S. (2014). Stakeholder analysis and engagement in
projects: From stakeholder relational perspective to stakeholder relational ontology.
International Journal of Project Management, 32(7), 1108–1122.
Mitchell, R. K., Agle, B. R., & Wood, D. J. (1997). Toward a Theory of Stakeholder
Identification and Salience: Defining the Principle of who and What Really Counts.
121
Academy of Management Review, 22(4), 853–886.
https://doi.org/10.5465/amr.1997.9711022105
Mojtahedi, M., & Oo, B. L. (2017). The impact of stakeholder attributes on performance of
disaster recovery projects: The case of transport infrastructure. International Journal
of Project Management, 35(5), 841–852.
Mok, K. Y., Shen, G. Q., & Yang, J. (2015). Stakeholder management studies in mega
construction projects: A review and future directions. International Journal of Project
Management, 33(2), 446–457.
Molwus, J. J., Erdogan, B., & Ogunlana, S. (2017). Using structural equation modelling
(SEM) to understand the relationships among critical success factors (CSFs) for
stakeholder management in construction. Engineering, Construction and Architectural
Management, 24(3), 426–450.
Morsing, M., & Schultz, M. (2006). Corporate social responsibility communication:
Stakeholder information, response and involvement strategies. Business Ethics: A
European Review, 15(4), 323–338.
Neville, B. A., Bell, S. J., & Whitwell, G. J. (2011). Stakeholder salience revisited: Refining,
redefining, and refueling an underdeveloped conceptual tool. Journal of Business
Ethics, 102(3), 357–378.
Nguyen, T. H. D., Chileshe, N., Rameezdeen, R., & Wood, A. (2019). Stakeholder influence
strategies in construction projects. International Journal of Managing Projects in
Business.
Oehmen, J., Olechowski, A., Kenley, C. R., & Ben-Daya, M. (2014). Analysis of the effect of
risk management practices on the performance of new product development programs.
Technovation, 34(8), 441–453.
Olander, S. (2007). Stakeholder impact analysis in construction project management.
Construction Management and Economics, 25(3), 277–287.
Orwig, R. A., & Brennan, L. L. (2000). An integrated view of project and quality
management for project-based organizations. International Journal of Quality &
Reliability Management.
Paauwe, J. (2009). HRM and performance: Achievements, methodological issues and
prospects. Journal of Management Studies, 46(1), 129–142.
Perrenoud, A., Lines, B. C., Savicky, J., & Sullivan, K. T. (2017). Using best-value
procurement to measure the impact of initial risk-management capability on

122
qualitative construction performance. Journal of Management in Engineering, 33(5),
04017019.
Phiri, O., Mantzari, E., & Gleadle, P. (2019). Stakeholder interactions and corporate social
responsibility (CSR) practices: Evidence from the Zambian copper mining sector.
Accounting, Auditing & Accountability Journal, 32(1), 26–54.
Pimchangthong, D., & Boonjing, V. (2017). Effects of risk management practices on IT
project success. Management and Production Engineering Review, 8(1), 30–37.
Pinto, J. K., & Prescott, J. E. (1988). Variations in critical success factors over the stages in
the project life cycle. Journal of Management, 14(1), 5–18.
Pinto, M. B., & Pinto, J. K. (1990). Project team communication and cross-functional
cooperation in new program development. Journal of Product Innovation
Management: An International Publication of the Product Development &
Management Association, 7(3), 200–212.
Popaitoon, S., & Siengthai, S. (2014). The moderating effect of human resource management
practices on the relationship between knowledge absorptive capacity and project
performance in project-oriented companies. International Journal of Project
Management, 32(6), 908–920.
Project Management Institute. (2017). A Guide to the Project Management Body of
Knowledge (PMBOK® Guide)–Sixth Edition (Edição: Sixth Edition, Sixth edition).
Project Management Institute.
Provasnek, A. K., Schmid, E., & Steiner, G. (2018). Stakeholder engagement: Keeping
business legitimate in austria’s natural mineral water bottling industry. Journal of
Business Ethics, 150(2), 467–484.
Ram, J., Corkindale, D., & Wu, M.-L. (2013). Implementation critical success factors (CSFs)
for ERP: Do they contribute to implementation success and post-implementation
performance? International Journal of Production Economics, 144(1), 157–174.
Rasul, N., Malik, M. S. A., Bakhtawar, B., & Thaheem, M. J. (2019). Risk assessment of fast-
track projects: A systems-based approach. International Journal of Construction
Management, 1–16.
Reich, B. H., Gemino, A., & Sauer, C. (2008). Modeling the knowledge perspective of IT
projects. Project Management Journal, 39(1_suppl), S4–S14.
Reich, B. H., Gemino, A., & Sauer, C. (2014). How knowledge management impacts
performance in projects: An empirical study. International Journal of Project
Management, 32(4), 590–602.

123
Ringle, C., Da Silva, D., & Bido, D. (2015). Structural equation modeling with the SmartPLS.
Brazilian Journal Of Marketing, 13(2).
Rosacker, K. M., & Olson, D. L. (2008). An empirical assessment of IT project selection and
evaluation methods in state government. Project Management Journal, 39(1), 49–58.
Sarkis, J., Gonzalez-Torre, P., & Adenso-Diaz, B. (2010). Stakeholder pressure and the
adoption of environmental practices: The mediating effect of training. Journal of
Operations Management, 28(2), 163–176.
Sewchurran, K., & Barron, M. (2008). An investigation into successfully managing and
sustaining the project sponsor—Project nanager relationship using soft systems
methodology. Project Management Journal, 39(1_suppl), S56–S68.
Shayan, S., Pyung Kim, K., & Tam, V. W. (2019). Critical success factor analysis for
effective risk management at the execution stage of a construction project.
International Journal of Construction Management, 1–8.
Shen, Q. P., & Yang, J. (2010). Research on stakeholder management framework in
construction projects. Journal of Engineering Management, 4, 014.
Shenhar, A. J., & Dvir, D. (2007). Reinventing Project Management: The Diamond Approach
To Successful Growth And Innovation (Edição: 1). Harvard Business Review Press.
Shenhar, A. J., Dvir, D., Levy, O., & Maltz, A. C. (2001). Project success: A
multidimensional strategic concept. Long Range Planning, 34(6), 699–725.
Shieh, H.-M., & Wu, K.-Y. (2002). The relationship between total quality management and
project performance in building planning phase: An empirical study of real estate
industries in Taiwan. Total Quality Management, 13(1), 133–151.
Singh, B. (2018). Identifying and implementing CSFs for transforming success rate in IT
project management. Int. J. Indian Culture and Business Management, 27.
Standing, C., Guilfoyle, A., Lin, C., & Love, P. E. D. (2006). The attribution of success and
failure in IT projects. Industrial Management & Data Systems, 106(8), 1148–1165.
Swart, J., & Kinnie, N. (2010). Organisational learning, knowledge assets and HR practices in
professional service firms. Human Resource Management Journal, 20(1), 64–79.
Tabachnick, B. G., Fidell, L. S., & Ullman, J. B. (2007). Using multivariate statistics (Vol. 5).
Pearson Boston, MA.
Thamhain, H. (2013). Managing risks in complex projects. Project Management Journal,
44(2), 20–35.

124
Toor, S.-R., & Ogunlana, S. O. (2010). Beyond the ‘iron triangle’: Stakeholder perception of
key performance indicators (KPIs) for large-scale public sector development projects.
International Journal of Project Management, 28(3), 228–236.
Turkulainen, V., Aaltonen, K., & Lohikoski, P. (2015). Managing project stakeholder
communication: The Qstock festival case. Project Management Journal, 46(6), 74–91.
Turner, J. R., & Müller, R. (2004). Communication and co-operation on projects between the
project owner as principal and the project manager as agent. European Management
Journal, 22(3), 327–336.
Uysal, N., Yang, A., & Taylor, M. (2018). Shareholder communication and issue salience:
Corporate responses to ‘social’shareholder activism. Journal of Applied
Communication Research, 46(2), 179–201.
Vivek, S. D., Beatty, S. E., & Morgan, R. M. (2012). Customer engagement: Exploring
customer relationships beyond purchase. Journal of Marketing Theory and Practice,
20(2), 122–146.
Voinov, A., & Bousquet, F. (2010). Modelling with stakeholders. Environmental Modelling &
Software, 25(11), 1268–1281.
Vollero, A., Conte, F., Siano, A., & Covucci, C. (2019). Corporate social responsibility
information and involvement strategies in controversial industries. Corporate Social
Responsibility and Environmental Management, 26(1), 141–151.
Vos, J. F., Boonstra, A., & Achtercamp, M. C. (2016). Understanding the dyadic promoter-
stakeholder relations in complex projects. International Journal of Information
Systems and Project Management, 5–23.
Wells, H. (2012). How effective are project management methodologies? An explorative
evaluation of their benefits in practice. Project Management Journal, 43(6), 43–58.
Wyk, R. van, Bowen, P., & Akintoye, A. (2008). Project risk management practice: The case
of a South African utility company. International Journal of Project Management,
26(2), 149–163. http://dx.doi.org/10.1016/j.ijproman.2007.03.011
Xia, B., Xiong, B., Skitmore, M., Wu, P., & Hu, F. (2016). Investigating the impact of project
definition clarity on project performance: Structural equation modeling study. Journal
of Management in Engineering, 32(1), 04015022.
Yap, J. B. H., Abdul-Rahman, H., & Chen, W. (2017). Collaborative model: Managing design
changes with reusable project experiences through project learning and effective
communication. International Journal of Project Management, 35(7), 1253–1271.

125
Yim, R., Castaneda, J., Doolen, T., Tumer, I., & Malak, R. (2015). A study of the impact of
project classification on project risk indicators. International Journal of Project
Management, 33(4), 863–876.
Yu, T., Liang, X., Shen, G. Q., Shi, Q., & Wang, G. (2019). An optimization model for
managing stakeholder conflicts in urban redevelopment projects in China. Journal of
Cleaner Production, 212, 537–547.
Zhang, H. (2007). A redefinition of the project risk process: Using vulnerability to open up
the event-consequence link. International Journal of Project Management, 25(7),
694–701. http://dx.doi.org/10.1016/j.ijproman.2007.02.004
Zhao, X., Hwang, B.-G., & Low, S. P. (2013). Critical success factors for enterprise risk
management in Chinese construction companies. Construction Management and
Economics, 31(12), 1199–1214.
Zhu, L., & Cheung, S. O. (2017). Harvesting competitiveness through building organizational
innovation capacity. Journal of Management in Engineering, 33(5), 04017020.
Zwikael, O., & Unger-Aviram, E. (2010). HRM in project groups: The effect of project
duration on team development effectiveness. International Journal of Project
Management, 28(5), 413–421.

126
APPENDIX B
CVD The time duration of the project was
CVC The total cost of the project was
CVS The company size where the project was implemented
CVT
The total number of team members that worked on the project
PP1 Project were completed on time
PP2 Project met budget requirements.
PP3 Project met scope
PP4 The system’s intended functional requirements were met.
PP5 The overall quality of the developed application is high.
PP6 The application developed is reliable.
PP7 The system meets user expectations with respect to response
time.
PP8 The application is easy to maintain.
CM1 The extent of communication between internal project parties
is often optimal
CM2 The extent of communication between external project parties
is often optimal
CM3 I rarely experienced conflicts and disputes between project
parties resulting from lack of communication.
CM4 Communication issues or conflicts were rarely caused by errors
or defects in the project documents.
HR1 Project team had a good career planning provided by
leadership.
Zhu, LY; Cheung, SO 2017
HR2 Members of the project team were allowed to make many
decision.
HR3 Opportunities were given to the project team to suggest
improvements related to how things should be done.
HR4 The leaders often asked to the project team to participate in
decision-making.
RM1
The project had a risk management procedure.
RM2 Significant threats were identified.
RM3
Buffers were included on time and cost to absorb uncertainty.
RM4 Change request were registered and their impact on project
were evaluated.
QM1 The project followed quality standards, a well-written working
process and detailed construction steps.
QM2 This project routinely carried out tests of various detection,
including construction process and the completed parts.
QM3 The project followed continuous control and improvements in
the development/implementation process.
QM4 The project quality diary were updated frequently.
QM5 The quality activities of this project could solve problems
effectively.
SS1 People external to the project team engaged in the project
were considered as desirable or appropriate.
SS2 People external to the project team engaged in the project
were considered as able to apply social influence to obtain its
will.
SS3 People external to the project team engaged in the project
were considered as pressing and requiring immediate
attention.
SE1 Project promoted positive relationships among the
stakeholders.
SE2 Appropriate strategies were applied to manage/engage
different stakeholders.
SE3 Communicating with stakeholders was properly and
frequently.
SE4 People external to the project team were involved in re-define
(refine) project mission.
Mojtahedi, M; Oo, BL 2017
Chen et al. 2019
Molwus et al. 2019
Communication Management (CM)
Stakeholder Engagement
Control Variables (CV) Gu et al 2014
Stakeholder Salience
Gu et al 2014
Diegmann 2017
Lindhard, S; Larsen, JK 2016
Popaitoon; Siengthai 2013
Liu et al. 2016
Ortiz et al. 2019
Lu et al. 2019
Project Performance (PP)
Product Performance
Human Resources
Risk Management
Quality Management

127
3 DISCUSSIONS AND CONCLUSIONS
In this thesis, I investigated how efficient stakeholder management activities can
enhance IT project performance. Several factors may affect project performance, project
managers and top management team should identify them and influence positively (Hadad et
al., 2013). I analyzed how stakeholder management activities on IT projects may affect the
relations of project management activities of CM, HR, RM, and QM with PP, I used finished
project software implementations as the context for this analysis.
The results of the three studies in chapter 2 indicate some insights about the
application of stakeholder management in the project management field and how the
performance of the project may be affected. Study 1 shown 20 years of stakeholders’
management previous studies, how the publication in this area has been growing, and the
main clusters of these studies. Study 2 reviews empirical studies about IT projects related to
project performance, identifies several factors with empirical validation of affecting PP and,
how the construct of PP has been measured. Study 3 applies stakeholder theory, specifically
with stakeholder engagement and stakeholder salience, to analyze stakeholder managements'
contribution to the relations among project management activities and project performance.
The conjoint results of these studies are valuable to the discussion of stakeholder
management and stakeholder theory in the context of the project. First, the results of this
thesis show that stakeholder management is a study that is in expansion for project
management, and many of these studies has a practical approach with the possibility of further
studies applying stakeholder theory. Stakeholder theory helps to solve problems, and the
engagement of stakeholders brings useful solutions and results (Freeman et al., 2020). The
application of stakeholder theory to solve problems on projects may not only impact project
performance positively but also may create value for the company, employees, collaborators,
and society as well.
Second, the results bring similarities between the constructs project performance and
project success. Many of the studies applying one or another nomination are using the same
variables to measure these constructs. The use of the iron triangle scope, time, and the cost is
recurrent, but many years are not the only way to measure performance or success. More
comprehensive researchers have been analyzing the results of the project activities, comparing

128
the project plan with project finish results, and the final product created, and how this product
reaches the expected results.
This thesis has three main contributions. The first contribution regards the analyzes of
previous studies. I showed the main clusters of stakeholder management and projects. Theses
cluster shows the main topics of studies about this field with their more important studies and
authors. From these clusters, it is possible to identify ways to future studies based on their
combinations, limitations, and the application of stakeholders’ theory for a theoretical
perspective and solutions for challenges faced by companies and practitioners. I also have
shown a review of what impacts project performance. This view allows future studies to
explore new relations with a positive or negative effect on PP and expand this construct.
The second contribution has a theoretical approach regarding Stakeholder Theory. In
study 3, I have applied stakeholder salience and stakeholder engagement to evaluate the
contributions of stakeholders to IT projects. Stakeholder engagement allows to analyze the
participation of stakeholders in the long-term and validate their involvement in different
stages of an IT project. It was possible to find that this participation is not always positive and
evaluate this participation is mandatory for companies. It was also possible to assess
stakeholders according to their salience, and this classification showed positive and negative
contributions. The more salient is not always, the more contributor to PP.
Finally, the third contribution regards a managerial contribution. The contributions
come not only from the confirmations of the hypothesis presented in study 3 but also in the
negative results. These results showed that when participating in RM activities, stakeholders
may be a negative effect on the results. However, when the participation is analyzed by the
salience of the stakeholders, the contribution is positive, showing that project managers and
team members should evaluate stakeholders before requiring their involvement in RM
activities. An important result was presented about HR, give autonomy to team members to
participate, and making decisions showed positive results. The participation of stakeholders,
in general, has also demonstrated a positive contribution to HR. The negative effects were
presented when stakeholders were classified by salience, showing that delegation may have a
negative impact on activities with more salient stakeholders. The conclusions are that support
of top management and project manager are necessary when important stakeholders are
involved in activities.
As a conjoint is important to highlight the original research question of this thesis,
“how efficient stakeholder management activities can enhance IT project performance”.
129
Although it was possible to validate all the proposed hypotheses, the construction for this
thesis allows for evaluating many aspects of the contribution of stakeholders’ management to
enhance ITPP. Studying stakeholder management and stakeholder theory it is possible to
conclude that there are positive contributions, and companies and project practitioners can
explore them. This thesis showed previous studies with empirical validation of this
contribution, and many of these studies are not attached to a theory and shows the approach of
management guides. However, study 3 adopting the stakeholder theory could find empirical
evidence of the positive contribution to IT PP. Therefore, it is possible to affirm that
companies can adopt stakeholders theory and project management guides to enhance their
results in IT Projects.

130
REFERENCES
Bakker, K. de, Boonstra, A., & Wortmann, H. (2010). Does risk management contribute to IT
project success? A meta-analysis of empirical evidence. International Journal of
Project Management, 28(5), 493–503.
Bourne, L., & Walker, D. H. T. (2005). Visualising and mapping stakeholder influence.
Management Decision, 43(5), 649–660.
De Bakker, K., Boonstra, A., & Wortmann, H. (2011). Risk management affecting IS/IT
Project success through communicative action. Project Management Journal, 42(3),
75–90. Retrieved from Scopus.
Di Maddaloni, F., & Davis, K. (2018). Project manager’s perception of the local
communities’ stakeholder in megaprojects. An empirical investigation in the UK.
International Journal of Project Management, 36(3), 542–565.
Elias, A. A., Cavana, R. Y., & Jackson, L. S. (2002). Stakeholder analysis for R&D project
management. R&D Management, 32(4), 301–310.
Eskerod, P., Huemann, M., & Savage, G. (2015). Project Stakeholder Management—Past and
Present. Project Management Journal, 46(6), 6–14.
Freeman, R. E. (1984). Strategic management: A stakeholder approach. Boston: Pitman.
González-Benito, Ó., Venturini, W. T., & González-Benito, J. (2017). CRM technology:
Implementation project and consulting services as determinants of success.
International Journal of Information Technology & Decision Making, 16(02), 421–
441.
Hillman, A. J., & Keim, G. D. (2001). Shareholder value, stakeholder management, and social
issues: What’s the bottom line? Strategic Management Journal, 15.

131
Mazur, A. K., & Pisarski, A. (2015). Major project managers’ internal and external
stakeholder relationships: The development and validation of measurement scales.
International Journal of Project Management, 33(8), 1680–1691.
McKay II, D. S., & Ellis, T. J. (2015). Measuring knowledge enablers and project success in
IT organizations. International Journal of Knowledge Management, 11(1), 66–83.
Mojtahedi, M., & Oo, B. L. (2017). The impact of stakeholder attributes on performance of
disaster recovery projects: The case of transport infrastructure. International Journal
of Project Management, 35(5), 841–852.
Müller, R., & Martinsuo, M. (2015). The impact of relational norms on information
technology project success and its moderation through project governance.
International Journal of Managing Projects in Business, 8(1), 154–176.
Olander, S., & Landin, A. (2005). Evaluation of stakeholder influence in the implementation
of construction projects. International Journal of Project Management, 23(4), 321–
328.
Pimchangthong, D., & Boonjing, V. (2017). Effects of risk management practices on IT
project success. Management and Production Engineering Review, 8(1), 30–37.
Strand, R., & Freeman, R. E. (2015). Scandinavian Cooperative Advantage: The Theory and
Practice of Stakeholder Engagement in Scandinavia. Journal of Business Ethics,
127(1), 65–85.
Taylor, H., Artman, E., & Woelfer, J. P. (2012). Information technology project risk
management: Bridging the gap between research and practice. Journal of Information
Technology, 27(1), 17–34. Retrieved from Scopus.
Waligo, V. M., Clarke, J., & Hawkins, R. (2013). Implementing sustainable tourism: A multi-
stakeholder involvement management framework. Tourism Management, 36, 342–
353.

132
Xia, N., Zou, P. X. W., Griffin, M. A., Wang, X., & Zhong, R. (2018). Towards integrating
construction risk management and stakeholder management: A systematic literature
review and future research agendas. International Journal of Project Management,
36(5), 701–715.
Yang, R. J., Wang, Y., & Jin, X.-H. (2014). Stakeholders’ Attributes, Behaviors, and
Decision-Making Strategies in Construction Projects: Importance and Correlations in
Practice. Project Management Journal, 45(3), 74–90.