influence of supply chain management strategies in
64
INFLUENCE OF SUPPLY CHAIN MANAGEMENT STRATEGIES IN MITIGATING CHALLENGES IN SUPPLY OF ANTI RETROVIRALS IN KENYA HEALTH SECTOR MUKOLWE BETTY AWINJA A RESEARCH PROJECT SUBMITTED IN PARTIAL FULFILLMENT OF THE REQUIREMENTS FOR THE AWARD OF DEGREE OF MASTER OF BUSINESS ADMINISTRATION UNIVERSITY OF NAIROBI NOVEMBER, 2016
-
Upload
khangminh22 -
Category
Documents
-
view
1 -
download
0
Transcript of influence of supply chain management strategies in

1
INFLUENCE OF SUPPLY CHAIN MANAGEMENT STRATEGIES IN
MITIGATING CHALLENGES IN SUPPLY OF ANTI RETROVIRALS IN KENYA
HEALTH SECTOR
MUKOLWE BETTY AWINJA
A RESEARCH PROJECT SUBMITTED IN PARTIAL FULFILLMENT OF THE
REQUIREMENTS FOR THE AWARD OF DEGREE OF MASTER OF BUSINESS
ADMINISTRATION UNIVERSITY OF NAIROBI
NOVEMBER, 2016

ii
DECLARATION
This research project is my own original work and has never been presented to any other
university for the award of a degree.
Signed: Date:
Mukolwe Betty Awinja
D61/70092/2008
This project has been submitted for examination with my approval as the University
supervisor
Signed: Date:
Prof: Bitange Ndemo
School of Business
University of Nairobi

iii
DEDICATION
....... Thanks dad and mum

iv
ACKNOWLEDGEMENT
My first appreciation above all is to the Almighty God for his gift of life, knowledge and all
he has given.
Secondly, I acknowledge my supervisor, Prof: Bitange Ndemo, and moderator, Prof: Awino,
who guided me throughout the research process and the panel of lecturers that guided my
report during proposal defence stage.
I also acknowledge the support and cooperation given by the various health institutions that
gave the data used in this study
Special thanks to my husband, Hanns Munyefu, my study partner, and for the support
through paying my tuition fees; and my children for being beside me all the way and giving
me priceless support and encouragement.
I express my warm thanks to my friends; Wesonga and Duncan, for your endless support
and constructive criticism.
Thank you very much, sincere gratitude to all.
v
TABLE OF CONTENTS
DECLARATION .................................................................................................................... ii
DEDICATION ...................................................................................................................... iii
ACKNOWLEDGEMENT .................................................................................................... iv
LIST OF TABLES ............................................................................................................... vii
LIST OF FIGURES ........................................................................................................... viii
ABBREVIATIONS AND ACRONYMS ............................................................................. ix
ABSTRACT ............................................................................................................................ x
CHAPTER ONE: INTRODUCTION .................................................................................. 1
1.1 Background of the Study .................................................................................................... 1
1.1.1 Supply Chain Management Strategies ...................................................................... 2
1.1.2 Challenges of ARVs Supply Chain Management ..................................................... 4
1.1.3 Supply Chain Management Strategies and Challenges of ARVs Supply Chain
Management ............................................................................................................. 5
1.1.4 Health Sector in Kenya ............................................................................................. 6
1.2 Research Problem ............................................................................................................... 7
1.3 Research Objective ............................................................................................................. 8
1.4 Value of the Study .............................................................................................................. 9
CHAPTER TWO: LITERATURE REVIEW ................................................................... 10
2.1 Introduction ...................................................................................................................... 10
2.2 Theoretical Foundations ................................................................................................... 10
2.2.1 Resource Based View .............................................................................................. 10
2.2.2 Value Chain Analysis .............................................................................................. 10
2.3 Supply Chain Strategy and Practices ............................................................................... 11
2.4 Factors Affecting Supply Chain Management ................................................................. 12
2.5 ARVs Supply Chain Processes ........................................................................................ 13
2.6 Empirical Studies and Research Gaps .............................................................................. 15

vi
CHAPTER THREE: RESEARCH METHODOLOGY ................................................... 16
3.1 Introduction ...................................................................................................................... 16
3.2 Research Design ............................................................................................................... 16
3.3 Population of the Study .................................................................................................... 16
3.4 Sampling Design .............................................................................................................. 16
3.5 Data Collection ................................................................................................................. 17
3.6 Data Analysis ................................................................................................................... 17
CHAPTER FOUR: DATA ANALYSIS, RESULTS AND DISCUSSION ...................... 18
4.1 Introduction ...................................................................................................................... 18
4.2 Respondents Profiles ........................................................................................................ 18
4.2.1 Analysis of the Response Rate ................................................................................ 18
4.2.2 Number of Patients Served ...................................................................................... 18
4.2.3 Number of Satellites ................................................................................................ 19
4.2.4 Number of implementing partners .......................................................................... 20
4.3 Supply Chain Challenges ................................................................................................. 21
4.4 Supply Chain Strategic Options ....................................................................................... 23
4.5 Quality of Service Delivery Process ................................................................................ 25
CHAPTER FIVE: SUMMARY, CONCLUSION AND RECOMMENDATIONS ....... 28
5.1 Introduction ...................................................................................................................... 28
5.2 Summary of Findings ....................................................................................................... 28
5.3 Conclusions ...................................................................................................................... 31
5.4 Limitations of the Study ................................................................................................... 32
5.5 Recommendations ............................................................................................................ 32
5.6 Suggestions for Further Research .................................................................................... 33
REFERENCES ..................................................................................................................... 34
APPENDICES ...................................................................................................................... 37
Appendix I: Questionnaire .............................................................................................. 37
Appendix II: List of Health Institutions .......................................................................... 40

vii
LIST OF TABLES
Table 3.1: Sample Size Distribution ...................................................................................... 17
Table 4.1: Analysis of the Response Rate .............................................................................. 18
Table 4.2: Number of Satellites Affiliated to the Health Institutions .................................... 19
Table: 4.3: Number of Implementing Partners ....................................................................... 20
Table 4.3: Supply Chain Challenges ...................................................................................... 21
Table 4.4: Supply Chain Strategic Options ............................................................................ 24
Table 4.5: Quality of Service Process .................................................................................... 25

viii
LIST OF FIGURES
Figure 4.1: Average Number of Patients ............................................................................ 19
Figure 4.2: Number of Satellites affiliated to the Health Institution .................................. 20
Figure 4.3: Quality of Service Processes ............................................................................ 26

ix
ABBREVIATIONS AND ACRONYMS
AIDS : Acquired Immune Deficiency
ART: Antiretroviral Therapy
ARV: Antiretroviral
ESCM: Electronic Supply Chain Management system
FBO: Faith Based Organization
HIV: Human Immunodeficiency Virus
HMIS : Health Management Information System
IT : Information Technology
KEMSA : Kenya Medical Supplies Agency
LMIS : Logistics Management Information System
MDGs : Millennium development goals
MEDS : Mission for Essential Drugs and Supplies
NACC: National Aids Control Council
NGO : Non-governmental Organization
PEPFAR: President‟s Emergency Plan for AIDS Relief
PLWHA: People Living With HIV/AIDS
SCM: Supply Chain Management
UNAIDS: United Nations Programme on HIV/AIDS
UN: United Nations
USA: United States of America
USAID: United States Agency for International Development
WHO: World Health Organization

x
ABSTRACT
Approximately 1.6 million Kenyans are HIV Positive which poses both social and economic
challenges for the country. The HIV/AIDS target set by The Joint United Nations Program
states that 90% of all HIV positive people should be diagnosed, and 90 percent of those on
treatment virally suppressed. (Chemonics Final report, 2015). This implies availing
antiretroviral (ARV) drugs to approximately 1.3 million people. Use of Anti-retroviral
Therapy was found to be a more cost-effective intercession against HIV/AIDS. Despite
increase in donor funding towards the health sector, there exists challenges in the supply-
chain and also at the health institution which may be restricting access to ARVs. High cost
of commodities, and product quality concerns are some of the challenges affecting reliable
and effective delivery of ARVs. One patients‟ annual treatment costing an average of US$
248.00. In 1999, the government stated that HIV and AIDs was a national tragedy. It set up
the National Aids Control Council (NACC) to manage the multi-sectoral response to this
public health threat. The study aimed to determine the effectiveness of supply chain
management strategies in mitigating challenges in supply of ARVs in Kenya health. The
study reviewed theoretical and empirical literature on supply chain on health service
delivery institutions. Descriptive survey was used as the research design. Population of the
study comprised of 345 health institutions. A sample of 34 respondents was selected using
convenient random Sampling technique. A structured questionnaire was administered in the
collection of Primary data. Data analysis was done using descriptive statistics. The data was
presented in frequency tablets, analysed through frequency counts, percentages and
cumulative percentages. The study findings concluded that ARV supply chain challenges
have great negative impacts on the services of health sector in Kenya. The study concluded
that supply chain strategies have been used to a large extent in mitigating challenges in
supply of ARVs in the Kenyan health sector. Further, the study concluded that quality of
service delivery processes have been enhanced in the health sector in Kenya. The study
recommended that policy makers should obtain guidance from the study in designing
appropriate policies that can ensure effective logistics management especially in the health
and medical sector. The study recommends that the management of the Kenyan health sector
should address shortcomings in its service delivery; challenges experienced in the supply of
health care commodities, and provide guidance in the up scaling of its activities for
enhanced service delivery. The study recommends that scholars and academicians should
carry in-depth studies on ARV supply chain management and implementation both in the
public and private health care institutions

1
CHAPTER ONE: INTRODUCTION
1.1 Background of the Study
The Supply chain concepts and its management are progressively being looked upon as a
way attaining and remaining competitive in a globally demanding environment. As
established by De Kluyver and Pearce (2006), the objective of a strategy is to achieve the
long term, sustainable higher performance. This superior performance can only be achieved
by organization that is willing to be a fully integrated associate in a supply chain (Cooper et
al., 1997). In essence, this makes SCM to be a connecting link between fully-vertically –
integrated systems and those where each channel member functions autonomously.
Managing at the level of a supply chain requires a fresh focus coupled with a new
management philosophy that requires them to work together with their supply chain partners
as pointed out by Lambert et al (1998). According to Ho et al (2002), value creation,
combination of main businesses and collaboration are 3 core SCM elements. This is in
agreement with Stank et al (2005). According to him, supply chain is a strategic level
theory. Therefore, SCM can be defined as management, the co-ordination of selected set of
important business activities from end user to suppliers. All these joint works are focused
towards the provision of the products, relevant information, and offering services that are all
aimed to add value for the customers and stakeholders.
The resource based view proposed by Penrose (1959), Wernerfelt (1984), Rumelt (1984)
and Mwailu and Mercer (1983) opine that organizational competitiveness is contributed to
through the application of both tangible and intangible assets that a firm has at their
disposal. According to the value chain analysis framework, value is what buyers are
prepared to part with or pay for Porter (1985) According to Farrington & Lysons (1986), one
can offer higher product or service value thorough low prices. Alternatively, offer
comparable benefits or providing distinctive and imitable benefits that more than
compensate for the higher prices.
In the Kenyan health sector, the UNAIDS Gap report (2014) approximate that 1.6 million
Kenyans are HIV Positive which poses both social and economic challenges for the country.
Through partnerships with UNAIDS and other players in the global health sector, Kenya is

2
committed to reversing the frightening trends in HIV deaths and infections. The HIV/AIDS
target set by the Joint United Nations Program states that 90% of all HIV positive people
should be diagnosed, and 90 percent of those on treatment virally suppressed (UNAIDS Gap
report, 2014). This implies availing antiretroviral (ARV) drugs to approximately 1.3 million
people.
Through several global initiatives such as the Presidents Emergency Plan for Aids relief
(PEPFAR), Clinton Health Access Initiative, The Global Fund for AIDS, Tuberculosis and
Malaria, and the Columbia University, poor countries like Kenya, have had access to
financial and technical resources needed to provide ARVs. Despite increase in donor
funding towards the health sector, there exists challenges in the national supply-chain and
also at the health institution which may be restricting access to ARVs. It therefore becomes
urgent to work towards efficient and effective supply chain management systems. Ripin, et
al. (2014;Pg 77), in their work on Antiretroviral Procurement and Supply chain, state that an
effective supply chain, ensures the following six rights are achieved; right product, with
right order quantities placed to supplier, and stock on hand in right condition, and delivered
to the right customer and within the expected timelines. This will play a role in lowering
the cost of caring for the patient.
Supply of ARVs in the country is unique in that it‟s a service offered to the customers
(patients) by the governments in partnership with donor community at no cost, with very
little competition from the commercial sector due to the nature of the products. Yet the
challenge remains that the government has to plan accordingly to ensure that there is
constant supply of ARVs to the customers. This is how organizations like KEMSA the
government pipeline and Kenya Pharma, MEDs and others that are subcontracted by USAID
come into play.
1.1.1 Supply Chain Management Strategies
In their case study work of Assessing supply chain success factors, Tummala et al, (2006 :
pg 179), view Supply chain management concept as “the combination of all parties both
external ; (suppliers, partner orgnaisations) and internal to the organization, (internal
corporate business units). These parties are involved in meeting delivery of specified

3
customer requirement; inputs, outputs or outcomes. According to Lysons & Farrington
(2006), the flow of material withinn an organsation, from their procurement, to manucturing
of the products, the distribution, sales and disposal, together with the associated transport
and storage is reffered to as Supply Chain Management.
Supply chain refers to the linkages of an organization, involved in getting product from
suppliers to customers. These are personnel incharge of the works, the processes established
and systems in use. By virtue of being an all inclusive approach, SCM begins with material
preparation and organisation of materials from supplier, followed by the logistics of getting
the materials to the organisation. This is aided by services and flow of information from
suppliers to producers or service providers to the final customer. The management of these
business processes is SCM. If well managed, it can be the begining of important
transformation in business management. (Fantazy et al., 2010). As pointed out by Porter
(2002), operational efficacy is concerned with achieving superiority at an entity‟s activities
or functions, whereas supply chain strategy defines the linkages and combination of
activities and functions throughout the value chain.
Accordingly, as opined by Perez H.D (2013) in his work of “The Supply chain roadmap”,
there is an interrelation amongst four elements within an organisation. These are very key
on the growth and shaping of the supply chain strategy of an organization. The first one is
the industry framework which refers to the interface between the Manufacturers, and the
customer‟s technological developments. It also shapes the trade and industry elements that
impact industrial competition. This is followed by the organization's unique value
proposal.What unique value does the organisation have that makes the customers choose it
instead of its competitors. This is closely related to the Value chain analysis of the
organisation. The third element is the organisation‟s managerial focus. This elememnt is
important as its the link bewteen the execution, which is the supply chain process, and the
business unique value proposal, its strategy. If this element is not well executed, it can
easily lead to failure resulting the organisations‟ managment not taking into account its
competitive positioning while pursuing a different strategy. For example, being very focused
on using efficiency-oriented performance indicators without taking into account the defined
organisation competitive positioning. Lastly, is its internal processes. These are the same as

4
the supply chain processes which need to be reflected properly with the organisations‟
supply chain activities focused on a given customer group with specific characterisitics.
Koh et al. (2007) proposed that SCM practices should follow these perspectives: strategic
planning leading to good supply benchmarking, close partnership with few trusted
suppliers with whom you shared same values and understanding. In addition need just in
time supply that will enable the organsiation hold just enough safety stock and hence lower
costs. All thee will lead to good partnership with customers. This resonates very well
pharmaceutical industry practices
There are several benefits that organization can enjoy due to SCM. The sharing or
integration of business processes, beginning with a firm‟s primary goods and service
suppliers and extending it to the firm‟s most valued customers, allows each participant
within the supply chain to know of the various plans in progress hence leading to reduction
of costs, both production, inventory and delivery costs through proper planning, increase
production output, raised business profits.
Eventually, the aim of SCM is to achieve higher customer satisfaction by increasing
profitability through efficiency creation and value addition. (Stock and Boyer 2009, p.703).
Expected benefits that will accrue when the SCM is improved are: lower costs due to
reduced redundancies, shorter product lead time from suppliers, which in turn lead to lower
inventory levels as organisation is assured of getting supplies within agreed upon timelines.
It also leads to lessened demand uncertainties from the customers as they become assured of
product availability. This leads to improved product quality, with better target market
access, superior customer service and market responsiveness, (Fisher 1997; Lambert et al.
2005; Lee et al. 1997; McCarthy and Golicic 2002).
1.1.2 Challenges of ARVs Supply Chain Management
Kabiru (2012) explain that the challenges with ARVs supply chain management include
counterfeits, pricing, lack of adequate storage facilities by the user hospitals and poor
forecasting of the user needs and requirements. Njonjo (2013) underscore that healthcare
drugs supply chain is affected by lack of adoption of IT infrastructure.

5
The noted reduction in HIV prevalence in general population, globally, in Africa and Kenya,
was attributable to the interventions enlisted by the WHO in combating HIV/AIDS.
Amongst some of the interventions was antiretroviral therapy (ART) (WHO, 2009). Which
has become valuable in terms of lowering the patient care costs, enabling more people to be
put on treatment, leading to decreasing HIV prevalence, decreasing incidence of orphaned
children, and healthy nation has better economic performance (USAID, 2009). Anti-
retroviral were not affordable to majority of HIV/AIDS patients in the country a decade ago
but changes occurred once generic ARVs were allowed into the country (Industrial Property
Act of July 2001). The significantly reduced cost of ARVs made the drugs became available
and accessible to HIV patients through public health facilities (NASCOP, 2005).
1.1.3 Supply Chain Management Strategies and Challenges of ARVs Supply Chain
Management
For Kenya to reduce the gap between demand and supply and accelerate the availability of
ART services and commodities, ARV supply chains developed rapidly through set up of
various programs in 2003. This rapid scale up, unfortunately gave rise to challenges in
procurement and logistics of ARV supplies. These challenges needed to be managed in
order for them not become becoming a hurdler to reliable, effective treatment. High cost of
commodities with one patients‟ annual treatment costing an average of US$ 248.00, quality
of the medicinal product, untimely delivery of the commodity represent some of the key
challenges experienced in the ARV supply chain. In addition, quality of product (drug), not
only needs to be assured during manufacture but also during storage and dispensing at the
ARV dispensing facilities (ART report). The number of ARV regimens for prescribing is
high and sometimes coupled with changes in recommended ART regimens. Fragmentation
of demand, forecasting and quantification inaccuracies due to low data collection and
reporting of commodity use due to low use of information technology systems, production
and shipping delays, product shelf-life requirement and product registrations challenges. In
essence the above challenges cause interruptions of supply and hence shortages of critical
ART commodities in many public-sector programs (USAID, 2006). With approximately,
1200 facilities providing treatment, some of the facilities are far away from the patients
making them travel long distances to access the treatment.

6
Other challenges are multiple and often uncoordinated supply chains within Kenya leading
to parallel and duplicated activities. Inadequate personnel with skills in SCM and logistics,
high dependency on donor funding of the ARV supply chain. All the above lead to negative
public health impacts such as resistance to available medicines leading to worsenin of the
patients condition, extreme cases we get therapeutic failure and eventually lead to death.
Consequently, these lead to diminished confidence in the health system as a whole and
wastage of resources. There is critical need to manage predict and carefully manage
potential supply chain interruptions.
1.1.4 Health Sector in Kenya
Kenya based on the United Nations (UN) Millennium Declaration, to which it‟s a signatory,
has set time bound and measurable health related targets guided by the Millennium Goals
(MDGs); halting and turning around HIV/AIDS infection, and other major diseases like
Malaria by 2015, and to lower by two thirds the under-five mortality rate between 1990 and
2015.
Shortage of health care personnel, physicians, has been a challenge to Kenya. According to
the WHO, Kenya only has 4,500 physicians. Kenya, when compared to the United States,
has just one doctor per 10,000 residents. The United States has for the same number of
10,000 people, are seen by 26 physicians. As is the norm in many countries, over 50% of
Kenyan physicians are based in Nairobi, and other urban centres. Due to better pay in
private sector as compared to public has led to many trained health workers to move leaving
approximately 1,000 physicians to work in the public sector. This greatly impacts the level
of service offered. This sector serves the majority of Kenyans. This gap is filled by the
37,000 nurses, plus traditional midwives, pharmacist and community health workers. The
more serious migration is that of health personnel going to other countries. 51% of net
emigration rate for doctors, which is among the highest in the world, poses this as a big
challenge to challenge to Kenya.
Some of the challenges posed by few healthcare personnel are; government is not able to
carry out adequate disease surveillance, maintain accurate statistics regarding disease
outbreaks, and report relevant findings to neighbouring countries and international

7
organizations. To enhance collection of timely, accurate, and relevant data and information
collection, Kenya, through support of partners has developed of a Health Management
Information system, (HMIS).
Kenya‟s approach in meeting the supply challenges and demands for ARV‟s has been three
fold, based on creation of supply chain management system, the ARV drugs (inventory)
management and lastly and very important, the teamwork and alliance between the public,
Faith Based organizations (FBO), the private-for-profit, and lastly, non-governmental
organizations (NGO). (Guidelines for Antiretroviral drug therapy in Kenya; 3rd
edition;
2005)
1.2 Research Problem
Adoption of supply chain best practices, application of the techniques and methods has time
and again proved to be problematic for use by the many health organizations that would like
to. This is so because they were developed in the industrial setting. Organizations even with
most efficient internal processes do not facilitate supply chain management across borders.
Collaboration is minimized and other players resort to traditional methods of operations that
may not be cost effective (Muturi, 2010).
Approximately, 5.25 million people living with HIV in the world had been put on treatment
by 2009. Out of the 5.25 million patients, 3.9 million live in sub-Saharan Africa. (Schouten
et al, 2011). In 1999, the Kenyan government stated that HIV and AIDs was a national
tragedy. It created the National Aids Control Council (NACC), with role of managing the
multi-sectoral response to this public health threat. By 2013, 1.6 million people were HIV
positive, an increase from 1.4 million in 2009. (UNAIDS, Gap report, 2014). The challenge
here is that while it‟s acknowledged that the HIV prevalence has declined over the past
years, it‟s projected that due to reduced mortality rate attributed to the ART program, there
will be an increase in the number of people living with HIV.
In health sector, effective SCM can lead to efficient resource utilization and patients‟
satisfaction of the services offered. According to Chemonics final report (2015), the core
challenge to many patients is the continuous availability of ARVs at health facilities. For
many patients, due to health institutions being far from their residents, this commuting

8
sometimes proves to be unaffordable. Also obtaining ARV drugs carries with it the risk of
stigma. Health facilities commodity stock outs are a result of unsecure SC. To overcome this
challenge, Kenya Pharma through a number of best practices, were able to create a safe, and
consistent national pharmaceutical supply chain. (USAID, 2015).
Locally Kazi (2012) studied the practices and impact of Supply Chain Management on
Performance at Kenya Medical Supplies Agency and found that effective SCM impact
positively on the operational performance at KEMSA. Mwilu (2013), studies on Supply
chain management practices and Performance among public research institutions found that
the public research institutions had adopted some SCM best practices to a large extent and
some to a moderate extent which left gaps in the adoption of SCM practices, he also noted
strong positive relationships in logistics, lean suppliers and information technology have
with firm performance among the publicly funded research institutions. These researches
focused on SCM practices and general performance. Wambui (2013) studied effect of
counterfeit drugs on the pharmaceutical distribution and retailing in Mombasa County and
observed that counterfeit impact negatively to government collection of tax, they also led to
low rate of investors into the county; investor‟s funds were rated above average.
Counterfeits lead to low sales; loss of goodwill of the affected brand, and low product
innovation and advancement. Njojo (2012) studied challenges in distribution of ARVs
amongst the remand prisons and indicated that uncoordinated supply chain processes affect
uptake of the treatment. As evidenced by the above studies, a study purposely carried out to
establish the role of strategies of supply chain management in mitigating the challenges of in
supply of ARVs, has not been done. This research project therefore sought to fill this
research gap by answering the question: what is the influence of supply chain management
strategies in mitigating challenges in supply of ARVs in Kenya‟s health sector?
1.3 Research Objective
The research‟s objective was to determine the effectiveness of supply chain management
strategies in mitigating challenges in supply of ARVs in Kenya health sector.

9
1.4 Value of the Study
The information obtained from the study will aid the Kenyan health sector management to
address the weakness in its service delivery; improve on challenges that have been identified
in the supply of health care commodities, and offer direction in the up scaling of its activities
to improve provision service delivery.
Various policy makers such as the government will find the study invaluable in the
execution of guidelines with focus on making public organisation have effective supply
chain management practices.
The study is also useful to scholars and academicians. Future and current scholars of supply
chain will get information on execution of supply chain in various organizations. The
findings can be used a basis for further research by those who wish to do so.

10
CHAPTER TWO: LITERATURE REVIEW
2.1 Introduction
The chapter review of supply chain management work done by previous researchers
concerning supply chain management strategies in public and private set ups. Theoretical
and empirical reviews are done in this chapter. Theories that underpin the concept of
supply chain management strategy have been reviewed. The chapter then presents an
empirical review of both the factors affecting supply chain generally and specifically in the
health sector. The research gap is also identified and discussed.
2.2 Theoretical Foundations
The study looks at Supply Chain Management in two perspectives, namely: resource-based
view and value chain analysis. The perspectives are discussed as follows:
2.2.1 Resource Based View
Proponents of this theory, notably Mwailu and Mercer (1983), Wernerfelt (1984), and
Rumelt (1984) see SCM as a foundation for an organisation to develop an advantage or an
edge over its competitors. This lies in how the organisation is able to use the various
resources at its disposal to create and edge for itself. According to Barney (1991), SCM
can successfully generate valuable non imitable or substitutable resources without use of a
lot of effort.
Odeny (2015) explain that SCM impacts on effective resource utilization and realization of
organization goals and objectives. SC process become streamlined and eventually, guide
day-to-day product flows. Through tools and techniques available in SCM, data collection
improves and can be used to manage unforeseen natural disasters. It can be used to
accurately identify problems, solve disruptions and determine how to practically move
products to those in an emergency situation. Health Institutions require properly instituted
SCM with minimal bottlenecks.
2.2.2 Value Chain Analysis
This concept was developed by Porter (1985). According to Porter (1985), customers or
buyers are willing to pay for value. Farrington and Lysons (2006) defines value chain as
the means by which value is added to product or service through a process from conversion

11
of raw materials till finished product. This includes delivery and after service. They
visualised this as a linear map. For service organizations like hospitals, this would imply
mapping patients‟ needs correctly and offering satisfactory Medicare services. According
to Farrington and Lysons (2006), organisations should continuously strive to create value
addition to their customers by identifying what they can do best. In this way, they will be
able to lower costs of the products or services. Alternatively, they will be able to provide
equivalent benefits or unique benefits at a price the customer will be willing to pay for.
For an organisation to achieve a strategic fit, Chopra, et al. (2010), argues that it has to
ensure that all its supply chain capabilities are in sync with needs of the targeted customer
group. It thus follow that organization should continuously analyze activities along the
value chain systems to identify what they can uniquely deliver to the customer segments
and out-do their competitors.
2.3 Supply Chain Strategy and Practices
Lee (2002) explains that every specific supply chain has it objectives and goals; these are
reflected in SC strategy that they will adopt. Supply chain strategies can be classified based
on whether it‟s mainly focused on cost efficiencies and leanness, these are efficient supply;
on flexibility and quick response, these are responsive and agile supply chains; or on a
contingent mix of both. In addition we risk hedging supply chains Vonderembse, et al.
(2006)
According to Wang, et al (2004) and Vonderembse, et al. (2006) explain that a lean SC
strategy aims at improving the efficiency of the organisation by improving on commodity
lead times from the manufacturer or supplier and also generally reducing waste. This
eventually leads to cost reduction. Qi et al. (2009) opines that the strategy works well with
moderately stable and expected demand. The product variety in most cases should be
small. Gunasekaran et al. (2008) and Lin et al. (2006) advance that an Agile SC strategy is
designed at achieving elasticity in the face of shifting customer needs and increased rivalry
within the environments through rapid, and frequent responses. SCM practices involve a
set of processes undertaken in an organization to advance successful management of its
supply chain (Koh et al., 2007). SCM practices can be defined in various ways. Alvarodo
and Kotzab (2001) viewed SCM practices where the organisation focusing on its core

12
competencies and use inter-organizational standards such as activity-based costing or
electronic data interchange, and remove unwanted inventory level by postponing
customizations towards the end of the supply chain. Koh et al. (2007) proposed that SCM
practices should follow these perspectives: strategic planning leading to good supply
benchmarking, close partnership with few trusted suppliers with whom you shared same
values and understanding. In addition, need just in time supply that will enable the
organisation hold just enough safety stock and hence lower costs. All thee will lead to
good partnership with customers.
2.4 Factors Affecting Supply Chain Management
A study by Marien (2000), identified the following as main enablers for an organisation„s
SCM to be successful: organizational infrastructure, technology, strategic alliances and
human resource management. These are discussed as follows:
According to Macleod (1994), there is an increasing need by the supply chain managers
wanting to automate and link all the related activities. This forms the basis of and
integrated solution, which gives them view of the whole supply chain at once. According
to Cooper (2003), firms in supply chain can use Electronic Data Interchange (EDI)
technology to aid transactions and information exchanges.
Festus (2000), states that effective value chains generate profits. Value Chains, in their
many views are one that receives an order from a customer, one that process a customer
requirement. It has to define that product or service. A company‟s value chain success or
failure depends on its entire processes and functions. (Chopra et al., 2010).
Enterprises, more than ever before, are being faced with intricate and multifaceted tasks
and changing competitive environments. To sustain enhanced organisational performance,
firms must be able to align their organizational structure, to its business strategy, and
information system. (Bergeron, 2004; Sabherwal and Chan, 2001; Sanders, 2005; Stock et
al., 2000; Venkatraman and Prescott, 1990; pp 1003-1020).
The following dimensions impact heavily on environmental uncertainty. Supplier
uncertainty arises when the supplier is not able to process the order by either not supplying
it at all or not supplying within the agreed upon delivery timelines. Demand uncertainty is

13
from the customer perspective. Chopra and Meindl (2010) pointed out that if firms‟ order
is urgent and rapid, then firms will face the high level of implied demand uncertainty. In
opposite, if firms‟ order lead time is long orientation then the company face the implied
demand uncertainty is lower than emergency.
In view of the above, and as expressed by Giunipero et al 2009, an effective supply chain
will only be achieved when there is good collaboration among the partners, supported with
co-ordinated co-ordination of their internal activities. This calls for unqualified support and
commitment from management.
2.5 ARVs Supply Chain Processes
Supply chain processes for ARVs have been classified into six discrete steps namely;
quality monitoring, inventory management, serving customers, forecasting and
procurement, product selection and logistics information money people. To ensure an
efficient and uninterrupted supply chain of products, each process in the procurement cycle
should have its own monitoring and evaluation process throughout (Guidelines for
Antiretroviral Therapy in Kenya, 2005).
According to Ripin et al (2014), two main processes; strategic and operating processes
exist under the procurement and supply chain cycle management. Strategic processes
happen at expected planned intervals. The planning element is important and it provides
the basis for successful supply chain operations. Their strong supply market implications if
well used by organizations can strategically drive market shifts in prices. Examples of
strategic processes are: forecasting and quantification and supplier selection. These are key
processes as they determine the short and long term quantity of products needed to ensure
uninterrupted supply of any products. Any inaccuracy in the data collected in terms of
consumptions or stock on hand will have a major impact on the level of under-stocking or
overstocking of the product. The supplier also plays an important role as their performance
in executing an order with regards to delivery timeliness determines the stock level of the
organization. Operating processes are repeated in nature and in progress. They aid with
progress of drugs from manufacturers to customers. These are order placement to
suppliers, pre-shipment quality checks, primary transportation from suppliers, customs
clearance, and in country distribution to the customer (Guidelines for Antiretroviral
Therapy in Kenya, 2005).

14
The supply chain processes or functions are interdependent and may be performed by
different organizations necessitating a need for shared understanding by the organisations.
As pointed by Cohen and Roussel (2005), it‟s in the organisation‟s interest to ensure it
develops strategies that will enable it integrate the external business processes and at the
same time maximise on the internal process to help serve customers better and enhance
performance of individual partners. Strategies and efforts adopted to mitigate risks within a
process will have considerable effect on other processes. For example, while an
organization can adopt a pooled procurement strategy to mitigate supply risks and
maximize on both product availability, this same strategy will impact positively on cost
related risks by reducing shipping costs and through economies of scale, will also reduce
cost of drugs.
The ARV supply chain management system is made up of key components namely, the
patients requiring ART and hence being the source of demand, the medical facilities
offering ART, the local or national warehouses (affiliated to KEMSA and agents for donor
partners), ART program managers and policy makers and lastly the manufacturers
(Guidelines for Antiretroviral Therapy in Kenya, 2005). The management of ARVs in
Kenya follows as series of interdependent activities. The aim is to mitigate both the supply
risks in addition to the demand risk as explained in section 1.1.2 above. Supply risks,
which basically deals with production and shipping delays can be mitigated through use of
a number of strategies. These are use of numerous – source procurement, pooled
(collective) procurement based on proposed future demand and flexible specifications for
presentation of ARVs. All the above activities if well coordinated lead to economies of
scale, freight consolidation and hence reduction in cost of ARVs to both country and
patient.
This cycle is supported by management functions such as ART program organization,
financing of drugs procurement, trained staff, information management through use of
LMIS/ESCM, monitoring and evaluation all operating within a policy and legal
framework. The “buyer” responsibility for ARVs in various low income countries as well
as Kenya is divided between the financier who pays for the products and the beneficiary
who receives the products. They are supported by their procurement agents and

15
programme implementers who in most cases are usually nationalised HIV control
programs or designated partners. Ripin et al (2014). The collaboration and partnership
between the public, private for profit, NGO and FBO has been the turning point for ARV
distribution strategies in Kenya through creation of various ART task forces that have been
able to guide the country on various technical and non-technical issues.
2.6 Empirical Studies and Research Gaps
Nsimba (2008) studied on the effect of counterfeits and fake in both the developed and less
developing countries. He focused particularly on antiretroviral (ARVs), anti-malarias and
other drugs. He found out that counterfeit drugs can adversely affect the patient‟s life,
patients lose confidence in health care professionals, and the society is greatly affected not
only in terms of health but also in terms of trade relations and investment, and hence
affecting economy in various ways. Lastly, its causes of global pandemics.
Mungu (2013) assesed how the inventory levels of essential drugs in public health
institutions are impacted by various supply chain practices adopted. Market price
fluctuations were identified as the most challenging factor that could affect stock levels. He
concluded that based on the current public procurement practices, are not effectual in
reducing the cost of drugs at the institution. Therefore there is need to evolve to practices
and methods, like e-procurement which leads to cost reduction in the preparation and
transmission of paper purchase requests and invoices.
Odhiambo (2014) studied the SCM practices among public hospitals in Nairobi County
and found that SCM practices implemented to a large extent were; after procurement
service, specifications and specifications and the practice to be fully implemented was
relationship with suppliers. The research established a positive correlation between service
quality and SCM practices namely; relationship with suppliers, compatibility, standards
and specifications, delivery and after procurement services. No Study has thus focussed on
supply of ARVs and challenges thereon.

16
CHAPTER THREE: RESEARCH METHODOLOGY
3.1 Introduction
The chapter explains the definition of research design, its type, and justification for the
adopting it. It further describes how the population was identified, and target population,
sampling frame, sampling technique, research instrument, data collection procedure and data
processing and analysis.
3.2 Research Design
The study used a descriptive survey as it‟s the only means for collection of respondents‟
opinions, their attitudes, and views. This information is also used for suggestions of
improvement of practices collected. Koul (1992). The primary data‟s collection tool was by
way of a questionnaire. The descriptive survey was considered appropriate because
collection of data on same parameters from respondents.
3.3 Population of the Study
The study population was comprised of 345 health institutions spread across the country
supplied by KEMSA and Kenya Pharma as attached as appendix (II). The health institutions
largely fall into 7 categories, namely Level 4, Faith Based Organisation, Level 2, Non-
governmental organisations, Private Hospitals, Level 5 and 6, and lastly level 3. These were
the health institutions being supplied by KEMSA and Kenya Pharma as at May 2015.
3.4 Sampling Design
Sampling procedure is used by a researcher to assemble the objects of interest of the study.
They objects can be a varied as they come like people or places among others. Through this
process, a number of individuals or objects from population are selected ensuring that the
characteristics of elements of the selected group are a representation of the population. A
sample is a part of a statistical population. Sample properties are researched on with aim of
acquiring useful information that will inform about the population. (Orodho and Kombo,
2002).
This study used convenient Sampling. The population was segregated into homogenous
groups that were relevant. This was then followed by random selection of subjects from each
category. (Mbwesa, 2006). Mbwesa (2006) and Mugenda and Mugenda (2003) explain that
10% of the population is a representative sample.

17
Table 3.1: Sample Size Distribution
No. Type of Institution No. of Institutions Sample Size
(10%)
1. Level 4 125 12
2. Faith Based Organization 65 6
3. Level 2 75 7
4. Nongovernmental Organizations 25 3
5. Private Hospital 3 3
6. Level 6&5 10 3
7 Level 3 42 4
Total 345 34
3.5 Data Collection
The primary data collection was by way of a structured questionnaire set in a Likert scale
format as attached in appendix (I). The questionnaire was divided into two parts. Part A was
used to gather general information about the respondents. Part B was used to gather
information that enabled conclusion of the research.
The researcher administered the questionnaires using face to face guided interviews as well
as self-administered questionnaires. These methods enabled the respondent to read and
understand the questions before answering them. This raised the success of the number of
questionnaires filled and returned.
3.6 Data Analysis
Descriptive statistics was used to analyse data after editing for completeness. The data was
coded and entered into spreadsheet before being analysed. The data is presented in
frequency tablets, analysed through frequency counts, percentages and cumulative
percentages. The computed percentages were used to determine the; supply chain
management strategies applied for ARVs in Kenya, challenges faced while implementing
the supply chain strategies.

18
CHAPTER FOUR: DATA ANALYSIS, RESULTS AND DISCUSSION
4.1 Introduction
The objective of the study was to determine the effectiveness of supply chain management
strategies in mitigating challenges in supply of ARVs in Kenya‟s health sector. This
objective has been addressed by collecting correspondents opinions and perceptions on three
variables namely; challenges in supply of ARVs in Kenya, Supply Chain management
strategies and satisfactory supply of ARVs to the health institutions providing ART services
in Kenya
4.2 Respondents Profiles
4.2.1 Analysis of the Response Rate
The sample was 38 respondents from various health care institutions. Research
questionnaires of 31 respondents out of 34 questionnaires given out were returned. This
represented 91.17% of the sample hence the analysis was done using 31 questionnaires
received from the respondents.
Table 4.1 Analysis of the Response Rate
Frequency Percentage
Questionnaire sent 34 100
Questionnaire returned 31 91.17
Source: Primary data
4.2.2 Number of Patients Served
The researcher asked the respondents the number of patients that they serve on the ART
program per month. As presented in figure one below, 54% of the institutions serve
approximately 1000 patients, 18% of the institutions serve between 1,000 to 2,000 patients
per month, 22% of the institutions serve between 2,000 to 3,000 patients per month, 6% of
the institutions serve more than 3,000 patients per month. The health institutions serving
above 2000 patients in a month are the level 4, 5 and 6. Some established FBO institutions
also are in this category. While the ones serving 1000 and below patients numbers are level
3, and 2.

19
Figure 4.1: Average Number of Patients
4.2.3 Number of Satellites
The study sought to find out the number of satellites supported by the health institutions.
The satellites forward their patient data and ARV consumption reports to the health
institutions that in this case become the central sites. The central sites include the satellite
data and quantities of ARVs that have been requested for. It then supplies to the satellites
once the stock/inventory has been received. As depicted in the table. 4.2, majority of the
respondents 66.67% have satellites, while 33.33% don‟t have.
Table 4.2: Number of satellites affiliated to the health institutions
Number satellites Frequency Percent
0 9 33.33
Below 5 6 29.63
Below 10 8 7.41
Above 10 2 7.41
Total 27 100.0
Source: Research data

20
Figure 4.2: Number of satellites affiliated to the Health institution
Source: Research data
4.2.4 Number of implementing partners
Table: 4.3: Number of implementing partners
Number of implementing
Partners
Frequency Percent
1 17 54.84
2 6 19.35
3 3 9.68
Above 4 5 16.13
Total 31 100.0
Source: Research data
Table 4.3 above summarizes the researcher‟s findings on the number of implementing
partners the institutions collaborate with. From the findings, 54.84% of the respondents have
1 implementing partner, 19.35% have 2 implementing partners, and 9.68 % have 3 while
16.13% have more than 4 implementing partners. Implementing partners play a critical role
in provision of capacity building for personnel, addition of personnel, additional resources
like infrastructure depending on their focus and area of specialization.

21
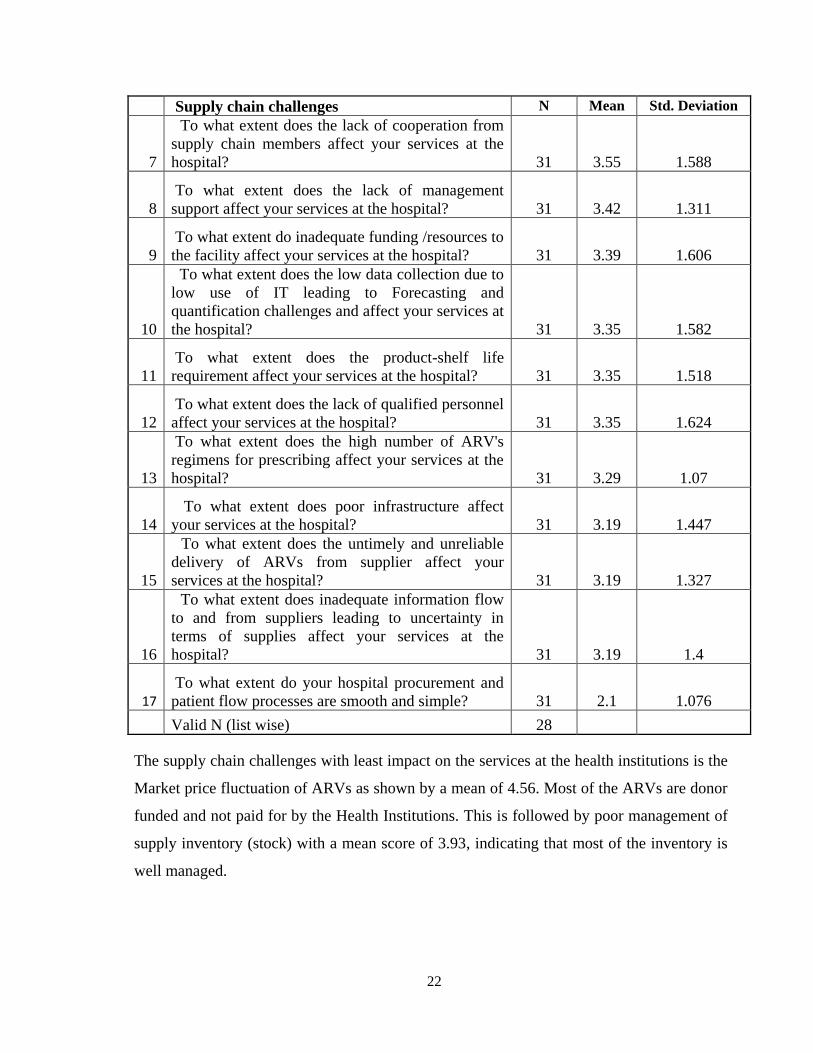
4.3 Supply Chain Challenges
The researcher sought to establish to what extent has ARV supply chain challenges impacted
on the services of hospitals in Kenya.
From the study, the supply chain challenge impacting the health institutions service delivery
to the largest extent were: The procurement and patient flow processes within the health
institutions which are not smooth and simple as shown by a mean score of pose the of 2.09.
This is followed by 3 challenges with the same mean score of 3.19; inadequate information
flow to and from suppliers leading to uncertainty in terms of supplies affect services at the
hospital, the untimely and unreliable delivery of ARVs from supplier affect services at the
hospital, and poor infrastructure affect services at the hospital. Large number of ARV‟s
regimens for prescribing as shown by mean score of 3.29. Low data collection due to low
use of IT leading to forecasting and quantification challenges affect services at the hospital,
the product-shelf life requirement affect services at the hospital, lack of qualified personnel
affect services at the hospital as shown by a mean of 3.35 each, lack of inadequate funding
/resources to the facility affect services at the hospitals as shown by a mean of 3.39 and lack
of management support affect services at the hospital as shown by a mean of 3.42. The
variation as evidenced by the low standard deviation shows that the supply chain challenges
to a large extent impact on the services of all the health institutions researched on. See table
4.4
Table 4.3: Supply Chain Challenges
Supply chain challenges N Mean Std. Deviation
1
To what extent does the market price fluctuation
of ARVs affect your services at the hospital? 31 4.36 1.253
2
To what extent does the poor management of
supply chain inventory affect your services at the
hospital? 29 3.93 1.33
3
To what extent does pilferage at the facility
affect your services at the hospital? 31 3.9 1.35
4
To what extent does the poor quality of drugs
supplied affect your services at the hospital? 30 3.83 1.642
5
To what extent does loyalty to certain products
by prescribers affect your services at the hospital? 31 3.68 1.492
6
To what extent does the uncertainty in terms of
demand affect your services at the hospital? 31 3.58 1.285
22
Supply chain challenges N Mean Std. Deviation
7
To what extent does the lack of cooperation from
supply chain members affect your services at the
hospital? 31 3.55 1.588
8
To what extent does the lack of management
support affect your services at the hospital? 31 3.42 1.311
9
To what extent do inadequate funding /resources to
the facility affect your services at the hospital? 31 3.39 1.606
10
To what extent does the low data collection due to
low use of IT leading to Forecasting and
quantification challenges and affect your services at
the hospital? 31 3.35 1.582
11
To what extent does the product-shelf life
requirement affect your services at the hospital? 31 3.35 1.518
12
To what extent does the lack of qualified personnel
affect your services at the hospital? 31 3.35 1.624
13
To what extent does the high number of ARV's
regimens for prescribing affect your services at the
hospital? 31 3.29 1.07
14
To what extent does poor infrastructure affect
your services at the hospital? 31 3.19 1.447
15
To what extent does the untimely and unreliable
delivery of ARVs from supplier affect your
services at the hospital? 31 3.19 1.327
16
To what extent does inadequate information flow
to and from suppliers leading to uncertainty in
terms of supplies affect your services at the
hospital? 31 3.19 1.4
17 To what extent do your hospital procurement and
patient flow processes are smooth and simple? 31 2.1 1.076
Valid N (list wise) 28
The supply chain challenges with least impact on the services at the health institutions is the
Market price fluctuation of ARVs as shown by a mean of 4.56. Most of the ARVs are donor
funded and not paid for by the Health Institutions. This is followed by poor management of
supply inventory (stock) with a mean score of 3.93, indicating that most of the inventory is
well managed.

23
Further the respondents indicated that to a moderate extent, lack of cooperation from supply
chain members affect services at the hospital as shown by a mean of 3.55 and the
uncertainty in terms of demand affects services at the hospital as shown by a mean of 3.58.
The respondents revealed that to a small extent loyalty to certain products by prescribers
affect services at the hospital as shown by a mean of 3.68, poor quality of drugs supplied
affect services at the hospital as shown by a mean of 3.83, pilferage at the facility affect
services at the hospital as shown by a mean of 3.90.
4.4 Supply Chain Strategic Options
The study sought to establish the extent to which the respondents‟ hospitals and medical
supply agencies use various strategic options presented in Table 4.5 below in mitigating
ARVs supply chain challenges. From the study majority of the respondents noted that clear
understanding of ARV drug regimens options were used to a very large extent as shown by a
mean of 1.35. Further, the researcher observed that various strategic options to mitigate
ARV supply chain challenges were used to a large extent including; presence of qualified
and competent workers as shown by a mean of 1.71, proper warehousing and inventory
practices as shown by a mean of 1.73, Use of health information management systems as
well as electronic supply chain management systems to collect, report and analyze data as
shown by a mean of 1.74, continuous information sharing with suppliers and clients as
shown by a mean of 1.79, creating an effective communication and information system with
suppliers and clients as shown by a mean of 1.84, availability of support and collaboration
from donor or implementing partners as shown by a mean of 1.90, Adherence to on time
delivery of ARVs from suppliers as shown by a mean of 1.97, monitoring and evaluation on
compliance with regulatory security issues, alerting customers on product availability and
also notifying them on when their next appointment is due as shown by a mean of 2.06 each,
involving all members of the hospital‟s supply chain in product planning and service
planning activities as shown by a mean of 2.26, on time delivery of ARVs to the hospitals
satellites as shown by a mean of 2.29 and extending supply chain to include close
collaboration with national programs, donor partners, suppliers and clients as shown by a
mean of 2.48.

24
Table 4.4 Supply Chain Strategic Options
Strategic Options N Mean Std.
Deviation
1
Contacting the client to get feedback on hospitals'
performance and customer service 31 3.06 1.481
2
Communicating customers strategic needs to your
suppliers 31 2.84 1.267
3
Improving integration of activities across your supply
chain 31 2.68 1.194
4
Extending your supply chain to include close
collaboration with national programs, donor partners,
suppliers and clients 31 2.48 1.15
5 Support from both national and county governments 31 2.39 1.174
6
Incorporation of quality assurance processes at the
facility 31 2.35 1.252
7 On time delivery of ARVs to your satellites 27 2.29 1.325
8
Involving all members of your hospital supply chain in
product/service/planning activities 31 2.26 0.893
9 Monitoring of compliance to regulatory security issues 31 2.06 1.152
10
Alerting customers on product availability and when their
next appointment is due 31 2.06 1.388
11 On time delivery of ARVs from your suppliers 31 1.97 0.836
12
Availability of support and collaboration from
donor/implementing partners 31 1.9 1.044
13
Creating an effective communication /information system
with your suppliers and clients 31 1.84 1.128
14 Information sharing with suppliers and clients 29 1.79 1.013
15
Use of health Information system / electronic supply
chain management system to collect , report and analyze
data 31 1.74 0.773
16 Proper warehousing and inventory practices 30 1.73 0.907
17 Presence of qualified and competent workers 31 1.71 1.006
18 Clear understanding of ARV drug regimens 31 1.35 0.877
Valid N (list wise) 24
The above findings are supported by a low standard deviation which was an indication that
the strategic options cut across to a large extent to all the health institutions researched on.
On the other hand, improving integration of activities across the supply chain as shown by a
mean of 2.68, communicating customers‟ strategic needs to the hospitals‟ suppliers as

25
shown by a mean of 2.84 and contacting the client to get feedback on hospitals' performance
and customer service as shown by a mean of 3.06 options were used to a moderate extent.
4.5 Quality of Service Delivery Process
The researcher sought to establish the extent to which the statements presented in table 4.6
below described the quality of service delivery processes in health institutions researched
on. From the results in table below, it‟s very clear that the health care revolves around those
elements patients perceive as providing quality service delivery. It‟s important for patient
confidentiality to be kept especially with the perceived stigma still associated with this
disease. The results showed that to very large extent, privacy and confidentiality of clients is
kept at the institutions facility as shown by a mean of 1.39 and the institutions focuses on
customer satisfaction as shown by a mean of 1.42. Further the study noted that to a large
extent, health institutions ensure that patients receive their drugs as and when required as
shown by a mean of 1.68, the hospitals have knowledgeable personnel as shown by a mean
of 1.77, the patient flow processes are smooth and simple as shown by a mean of 1.84 and
waiting time is minimal as shown by a mean of 2.32. The low standard deviation is an
indication that the statements described the quality of service delivery processes to a very
large extent and large extent across all the health institutions researched on.
Table 4.5 Quality of Service Process
N Mean Std.
Deviation
1. To what extent do you ensure waiting time is minimal 31 2.32 .832
2. To what extent are the patient flow processes smooth
and simple
31 1.84 1.128
3. To what extent do you have knowledgeable personnel 31 1.77 .990
4. To what extent do you ensure that patients receive their
drugs as and when required
31 1.68 .701
5. To what extent do you focus on customer satisfaction 31 1.42 .620
6. To what extent do you ensure privacy and
confidentiality of clients is kept at your facility
31 1.39 .715
Valid N (list wise) 31

26
This is summarized in Figure 4.3 below:
Figure 4.3: Quality of service processes
Source: Primary data
4.6 Interpretation of Findings
The study established that most health institutions serve approximately 1000 ARV patients
per month while others serve more than 3,000 ARV patients per month. This high rate of
ARV patients is a proof that a large number of Kenyans living with HIV have sought to a
proper medical attention. This is consistent with the UNAIDS Gap report (2014) which
reported that approximately 1.6 million Kenyans are HIV Positive and that 90% of all HIV
positive people should be diagnosed, and 90 percent of those on treatment virally suppressed
thus availing antiretroviral (ARV) drugs to approximately 1.3 million people. The
significantly reduced cost of ARVs made the drugs became available and accessible to HIV
patients through public health facilities (NASCOP, 2005).

27
The study established that ARV supply chain challenge has impacted on the services of
hospitals in Kenya the most in the procurement and patient flow processes while it had the
least impact on market price fluctuation of ARVs. The findings on the statements of supply
chain challenges partly do not concur with Kabiru (2012) who explained that the challenges
with ARVs supply chain management include counterfeits, and high pricing of
commodities.. It does however, concur with her conclusions on challenges of lack of
adequate storage facilities by the user hospitals and poor forecasting of the user needs.
Njonjo (2013) underscore that healthcare drugs supply chain is affected by lack of adoption
of IT infrastructure.
Clear understanding of ARV drug regimens options were used to a very large extent while
contacting the client to get feedback on hospitals' performance and customer service were
used to moderate extent. The findings on the statements of supply chain strategic options are
consistent with the findings of Koh et al. (2007) who proposed that SCM practices should
follow these perspectives: close partnership with suppliers, close partnerships with
customers, just-in-time supply, strategic planning, supply chain benchmarking, few
suppliers, holding safety stock and sub-contracting, e-procurement, outsourcing and many
suppliers
28
CHAPTER FIVE: SUMMARY, CONCLUSION AND RECOMMENDATIONS
5.1 Introduction
This chapter presents a summary of the key findings of the study as well as the conclusions,
limitations of the study, and recommendations for further research.
5.2 Summary of Findings
The study objective was to determine the effectiveness of supply chain management
strategies in mitigating challenges in supply of ARVs in the Kenya health sector.
The study sought to determine the effectiveness of supply chain management strategies in
mitigating challenges in supply of ARVs in the Kenya health sector. It finds that most health
institutions serve approximately 1,000 ARV patients per month while others serve more than
3,000 ARV patients per month. The significantly reduced cost of ARVs made the drugs
became available and accessible to HIV patients through public health facilities as outlined
in the publications by NASCOP (2005).
The study found that ARV supply chain challenges impacted on the services of hospitals in
Kenya from a large extent to a small extent. Hospital procurement and patient flow
processes are smooth and simple. The factors that affect services at the hospitals include;
inadequate information flow to and from suppliers leading to uncertainty in terms of
supplies, untimely and unreliable delivery of ARVs from suppliers, poor infrastructure, high
number of ARV's regimens for prescriptions, low data collection due to low use of IT
leading to forecasting and quantification challenges, the product-shelf life requirement, lack
of qualified personnel, lack of inadequate funding and or resources to the health facility,
lack of management support, lack of cooperation from supply chain members, uncertainty in
terms of demand, loyalty to certain products by prescribers, poor quality of drugs supplied,
pilferage at the facility, poor management of supply chain inventory and market price
fluctuation of ARVs. These findings concur with arguments by Kabiru (2012) who
explained that the challenges with ARVs supply chain management include counterfeits,
pricing, lack of adequate storage facilities by the user hospitals and poor forecasting of the
user needs and requirements.

29
On satellites, the study, established that 33% of the health institutions are stand alone. Many
level 2, some Faith Based and KNH hospital do not have satellites.29.63% have below 5
satellites, while 7.41% have more than 10 satellites, with one particular institution have 28
satellites. Satellites play a strong supportive role to the main health institutions and are able
to offer service to patients who are far from the main health institution. This indicates that a
lot of effort has been put in to bring services closer to the people.
The study also sought to know the number of implementing partners collaborating with the
health institution. All respondents acknowledged having partner support. 54.84% of the
respondents have one (1) implementing partner, while 16.13% have more than four (4)
partners. This means that the health institutions have other support apart from the
government. This support may be in terms of resources for infrastructure, I.T support,
capacity building and personnel support among others. This support from implementing
partners plays a key role in mitigating some of the supply chain challenges as indicated
above.
The study found that ARV supply chain challenges impacted on the services of hospitals in
Kenya from a large extent to a small extent. Hospital procurement and patient flow
processes pose the largest challenge with a mean score of 2.10. Yet these 2 factors are at the
core of any supply chain processes. Other challenges that affect services at the hospitals
include; inadequate information flow to and from suppliers leading to uncertainty in terms of
supplies, untimely and unreliable delivery of ARVs from suppliers. From 2009 –June 2015,
ARVs were supplied by Kenya Pharma (Chemonics) and KEMSA to health Institutions.
Currently all health institutions are getting their ARV commodities from KEMSA. These
two challenges if not well managed can lead to stock outs and patients not getting their
drugs.
The other challenges; poor infrastructure, high number of ARV's regimens for prescriptions,
low data collection due to low use of IT leading to forecasting and quantification challenges,
the product-shelf life requirement, lack of qualified personnel, lack of inadequate funding
and or resources to the health facility, lack of management support, lack of cooperation from
supply chain members, uncertainty in terms of demand, loyalty to certain products by
prescribers, also impact on ARV supply chain.
30
It was established that poor quality of drugs supplied pilferage at the facility, management of
supply chain inventory and lastly market price fluctuation of ARVs have been in a way
mitigated well. As indicated earlier, all ARVs are supplied by KEMSA; secondly, they are
procured with donor funds mostly from PEPFAR and Global Fund. The two bodies have
clearly set out and stringent guidelines of procurement and manufacturing standards guided
by the FDA. This means that quality of drugs is acceptable. This particular finding does not
concur with arguments by Kabiru (2012) who explained that the challenges with ARVs
supply chain management include counterfeits, pricing, lack of adequate storage facilities by
the user hospitals and poor forecasting of the user needs and requirements.
The study found that various strategic options were used from a very large extent to a
moderate extent by the health institutions in Kenya in mitigating ARVs supply chain
challenges. The strategic options starts with clear understanding of ARV drug regimens,
with having the largest impact, followed by presence of qualified and competent workers
proper warehousing and inventory practices, use of health management information systems
and or electronic supply chain management systems to collect, report and analyze data
Information sharing with suppliers and clients, creating an effective communication and or
information system with suppliers and clients, availability of support and collaboration from
donors and implementers, on time delivery of ARVs from suppliers. The above strategies
options have greatly mitigated the supply chain experienced by the health institutions as
expressed by the respondents. They are interconnected in a way. Understanding of the ARV
drug regimens ensure that the correct treatment is given to the patients and this can only be
executed by knowledgeable personnel. Most health institutions through collaboration with
the implementing partners are able to get this support in terms of capacity building and other
needed resources. The government also plays a role in this.
The other strategies being used to mitigate the challenges are monitoring of compliance to
regulatory security issues, alerting customers on product availability and when their next
appointment is due, involving all members of the hospital supply chain in product or service
or planning activities, on time delivery of ARVs to the hospitals, extending supply chain to
include close collaboration with national programs, donor partners, suppliers and clients,

31
improving integration of activities across the supply chain, communicating customers‟
strategic needs to the hospitals‟ suppliers, contacting the client to get feedback on hospitals'
performance and customer service.
This is in line with Koh et al. (2007) who proposed that SCM practices should follow these
perspectives: close partnership with suppliers, close partnerships with customers, just-in-
time supply, strategic planning, supply chain benchmarking, few suppliers, holding safety
stock and sub-contracting, e-procurement, and outsourcing.
The study found that the health facilities strive to improve the quality of the services and
their processes. This is attained through; First, ensuring privacy and confidentiality of clients
information that is kept at the health institutions, Secondly, the health institutions focus on
attaining customer satisfaction, Thirdly, health institutions ensure that patients receive their
drugs as and when required, Fourthly, hospitals have knowledgeable personnel, Fifth,
patient flow processes are smooth and simple and Lastly, waiting time is minimal.
5.3 Conclusions
The research revealed that ARV supply chain challenges impacted on the services of
hospitals in Kenya and the identified ARV supply chain challenges have great negative
impacts on the services of health sector in Kenya. The study found that strategic options
have been used from very large extent to a moderate extent by the health institutions in
mitigating ARVs supply chain challenges therefore the study concludes that supply chain
strategies have been used to a large extent in mitigating challenges in supply of ARVs in the
Kenyan health sector.
The study found that quality of service processes in health institutions have been observed
with respect to privacy and confidentiality of clients. Customer satisfaction is a
consideration in the ARV supply chain process taking into account matters of how patients
receive drugs, knowledgeable personnel, patient flow processes and considerable waiting
time. The study thus concludes that the quality of service delivery processes especially for
ARVs treatment has been enhanced in the health sector in Kenya.

32
5.4 Limitations of the Study
The issues concerning ARVs are considered sensitive and confidential especially when
looking at the instances of patient‟s stigmatization. Thus, some of the respondents
approached were reluctant in giving information for fear that the information sought would
be used without cautionary measures. This limitation affected the response rate and the
objectivity of the respondents as well.
The study was limited to a sample size of 34 respondents. This sample was very minimum in
to drawing conclusions the issues on ARV supply chain since HIV/Aids is considered to be
the largest epidemic in Kenya. The findings are therefore from the focus of the health
institutions and not the patients. Time and resources allocated to this study could not allow
the study to be conducted as deeply as possible. Being a descriptive research, the study was
exposed to the possibility of error and subjectivity of both the researcher and the
respondents.
5.5 Recommendations
The study recommends that policy makers should obtain guidance from this study in
designing appropriate policies that can ensure effective logistics management especially in
the health and medical sector. Due to the criticality of the drugs under supply, the identified
challenges and supply chain weaknesses should be reconsidered to ensure beneficiary
satisfaction and attainment of the sustainable development goal milestones.
The study recommends that the management of KEMSA and NASCOP should address
shortcomings in its service delivery, challenges experienced in the supply of ARV‟s
especially with respect to delivery timelines, to provide guidance in the up scaling of its
activities for enhanced service delivery and reduce staff turnover at the health institutions.
This may be through holistic adoption of Health information systems, data forecasting and
quantification.
The study also recommends that management of the health institutions should improve their
hospital procurement and patient flow processes by adopting the Quality Management
Systems. This can be achieved through partnering with stakeholders who can provide

33
support in terms of resources and capacity building as it has been seen above. Further close
collaboration and relationship with suppliers and customers is recommended for improved
information flow.
5.6 Suggestions for Further Research
This study did not examine the ART clients‟ perception of the quality of the services
examined in this study. The study thus recommends that scholars and academicians should
carry an in-depth investigation on ARV supply chain management and implementation with
respect to the client. Is it possible that even after all the effort is made to perfect the systems
of supply chain management, the beneficiaries of the ART program could still be
dissatisfied?
Further studies drawn on a large sample size should focus on the satisfaction of the patients
and the beneficiaries of the ARV supply chain. Attempts should focus on investigating any
deviations by matching the expectations with the observations of the service delivery.
34
REFERENCES
Bergonon, F., Raymond, L., & Rivard, S. (2004). Ideal patterns of Strategic alignment and
Business performance: Information and Management Journal, 41, 1003-1020.
Chandani, Y., Felling, B., Allers, C., Alt, D., Noguera, M. & Zuber, A. (2006). Supply
Chain Management of Antiretroviral Drugs: Considerations for Initiating and
Expanding National Supply chain, Arlington, VA: DELIVER for U.S. Agency for
International Development.
Chen, Y. Y., Tsai, M. C., Huang, H. L. & Liang, J. (2012) Supply Chain Integration and
Environment Uncertainty: A Conceptual Fit Model; orsc.edu.cn
Chopra S. & Meindl, T. (2001). Supply Chain Management Strategy Plan and Operations:
Upper Seattle River NJ Prentice Hall
Cooper, M. C., Lambert, M. D. & Pagh, J. D. (1997). Supply chain management: More than
a new name for logistics. 8, 1-4. The International Journal of Logistics Management
Davis, T. (1993). Effective Supply Chain Management: Sloan Management Review, PP 35-
46
Ghauri, P. & Gronhaug, K. (2005). Research Methods in Business Studies.
Guidelines for Antiretroviral drug therapy in Kenya, 2005; Nairobi (NASCOP)
Gunasekaran, A., Lai, K., Cheng, E., (2008). Responsive supply chain: a competitive
strategy in a networked economy. OMEGA 36 (4), 549–564.
Joel. D. & Stanley L, (2008); Process Management: Creating value along the supply chain,
South- Western Journal of Management Policy and Practice vol. 11(4) 2010
Kenya Pharma Final report (2015), www.chemonics.com
Krejcie, R. V., & Morgan, D. W. (1970). Table for determining sample size from a given
population. Educational and Psychological Measurement, 30(3), 607-610.
Lavani et al, (2010). Increasing Patient Access to Antiretrovirals. Recommended Actions
for a more Efficient Global Supply Chain

35
Lee, H.L., (2002). Aligning supply chain strategies with product uncertainties. California
Management Review, 44 (3), 105–119.
Lin, C., Chiu, H., Chu, P., (2006). Agility index in the supply chain. International Journal of
Production Economics 100 (2), 285–299.
Lysons, K. & Farrington, B. (2006). Purchasing and Supply Chain Management. Seventh
edition. Prentice Hall
Mbwesa, K. J. (2006). Introduction to management research, a student hand book. Jomo
Kenyatta Foundation, Nairobi, Kenya.
Mwenda J (2002); Managing health supply chains in Africa: www.africachap.org
Orodho, A.J & Kombo, D.K. (2002). Research Methods. Nairobi: Kenyatta University,
Institute of Open Learning
Perez, D. H, (2013), Strategy; CSCMP‟s Supply Chain Quarterly; Quarter 1 (2013)
www.supplychainquarterly.com
Perez, D. H, (2013). Supply Chain Roadmap: aligning supply chain with Business strategy,
Columbia
Porter, R. (2002), Arcs of integration: An international study of supply chain
Qi, Y., Boyer, K.K., Zhao, X., (2009). Supply chain strategy, product characteristics, and
performance impact: evidence from Chinese manufacturers. Decision Sciences 40
(4), 667–695.
Ripin, J., Jamison, D., Meyers, A., Warty, U., Dain, M. & Khams C. (2014). Antiretroviral
procurement and supply chain; Boston, Antiretroviral Therapy,19 Supply 3;79-80
Schoute, J., Jahn A.& Chimbwandira, F. (2011). Antiretroviral drug Supply chain in Era of
scaling up of ART in Malawi. Doi:10:1186/1758-2652-14-S1-S4
Tummala, R. V. M., Cheryl, L. M., Johnson, P., Johnson, P. (2006). Assessing supply chain
management success factors: A case study. Supply Chain Management: An
International Journal, 11(2), 179-92.

36
UNAIDS, GAP report 2014
USAID 2006 REPORT
Vonderembse, M.A., Uppal, M., Huang, S.H., & Dismukes, J.P. (2006). Designing supply
chains: towards theory development. International Journal of Production Economics
100 (2), 223–238.
Wang, G., Huang, S.H., Dismukes, J.P., (2004). Product-driven supply chain selection using
integrated multi-criteria decision-making methodology. International Journal of
Production Economics 91 (1), 1–15.
Yap, L. & Tan, C. (2012). The effect of Service Supply Chain Management Practices on
the Public Healthcare Organizational Performance, International Journal of Business
and Social Science, Vol, 3 No 16 special issue 213

37
APPENDICES
Appendix I: Questionnaire
PART 1: GENERAL BACKGROUND INFORMATION
1. What is the name of the Health Institution? ...............................................................
2. Name of Respondent……………………………………………………….(optional)
3. Title/Position of
Respondent…………………………………………………………………..
4. What is the approximate number of Patients you are serving on ART program per
month
0 – 1000
1000 – 2000
2000 – 3000
5. What is the number of Satellite centres affiliated to your Health Institution? -----------
6. What is the number of implementing support partners collaborating with your Health
institution? ................................
PART 2: SUPPLY CHAIN STRATEGIES AND CHALLENGES
1. To what extend do the following ARV supply chain challenges impact your services at
the hospital.
(Kindly indicate tick using the scale below: (1. Very large extent, 2. Large extent
3. Moderate Extent 4. Small Extent 5. No Extent)
1 2 3 4 5
Poor quality of drugs supplied
Product shelf-life requirement
Inadequate information flow to and from suppliers
leading to uncertainty in terms of supplies

38
Lack of cooperation from supply chain members
Market price fluctuations of ARVs
Inadequate funding/resources to the facility
High number of ARV‟s regimens for prescribing
Untimely and unreliable delivery of ARVs from
supplier
Poor management of supply chain inventory
(Stock)
Pilferage at the facility
Lack of qualified personnel
Low data collection due to low use of information
technology leading to Forecasting and
quantification challenges
Uncertainty in terms of demand
Loyalty to certain products by prescribers
Poor infrastructure
Lack of management support
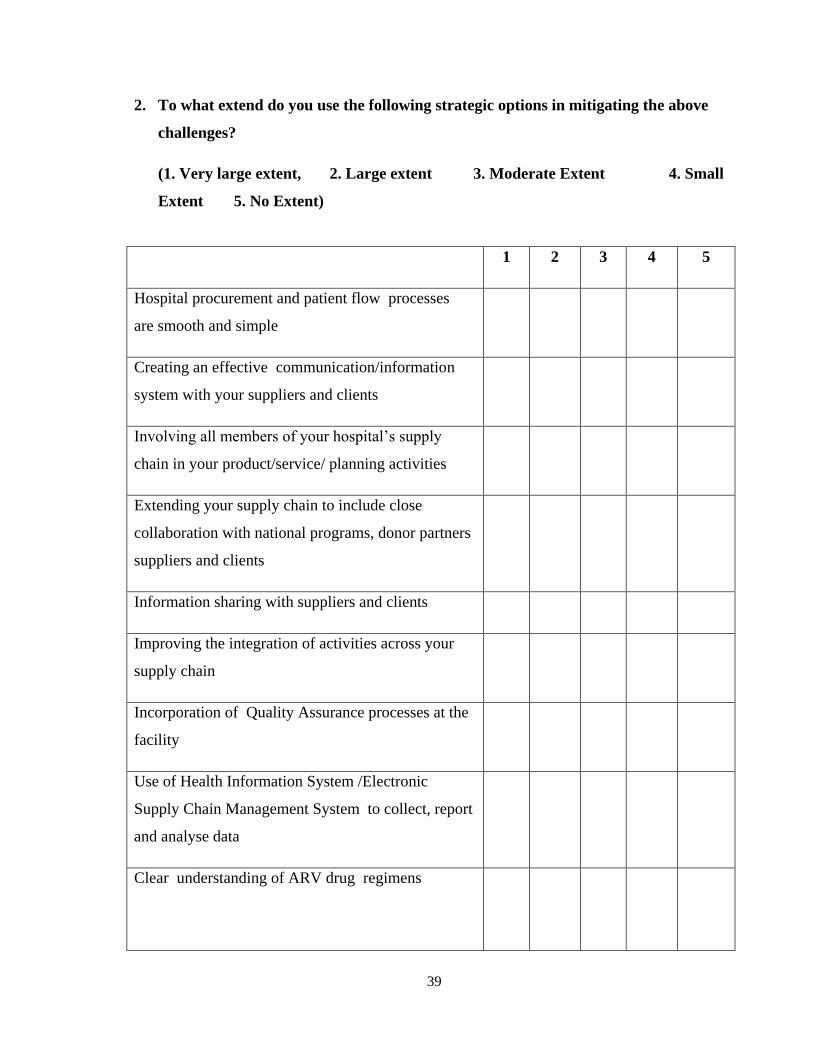
39
2. To what extend do you use the following strategic options in mitigating the above
challenges?
(1. Very large extent, 2. Large extent 3. Moderate Extent 4. Small
Extent 5. No Extent)
1 2 3 4 5
Hospital procurement and patient flow processes
are smooth and simple
Creating an effective communication/information
system with your suppliers and clients
Involving all members of your hospital‟s supply
chain in your product/service/ planning activities
Extending your supply chain to include close
collaboration with national programs, donor partners
suppliers and clients
Information sharing with suppliers and clients
Improving the integration of activities across your
supply chain
Incorporation of Quality Assurance processes at the
facility
Use of Health Information System /Electronic
Supply Chain Management System to collect, report
and analyse data
Clear understanding of ARV drug regimens

40
On time delivery of ARVs from your suppliers
Proper warehousing and inventory practices
On time delivery of ARVs to your satellites
Communicating customers strategic needs to your
suppliers
Contacting the clients to get feedback on hospitals‟
performance and customer service
Alerting customers on product availability and when
their next appointment is due
Presence of qualified and competent workers
Availability of support and collaboration from
donor/implementing partners
Support from both national and county governments
Monitoring of compliance to regulatory and
security issues

41
3. Indicate the extent to which the following statement describes the quality of your
service delivery processes:
(1. Very large extent, 2. Large extent 3. Moderate Extent 4. Small
Extent 5. No Extent
1 2 3 4 5
Focus on customer satisfaction
Privacy and Confidentiality of clients
Patient flow processes are smooth & simple
Knowledgeable personnel
Waiting time is minimal
Patients receive their drugs as and when required
Thank you

40
Appendix II: List of Health Institutions
No. Name Type Supplier County
1 Consolata Nkubu Mission
Hospital
Faith Based
Organisation
KEMSA Meru
2 Coptic Church Hospital - Nairobi
Central Site
Faith Based
Organisation
KEMSA Nairobi
3 Cottolengo Mission Hospital Faith Based
Organisation
KEMSA Meru
4 Holy Family Oriang Mission
Dispensary
Faith Based
Organisation
KEMSA Homa Bay
5 Kaplong Mission Hospital Faith Based
Organisation
KEMSA Bomet
6 Likoni Catholic Dispensary Faith Based
Organisation
KEMSA Mombasa
7 Mary Help of the Sick Mission
Hospital
Faith Based
Organisation
KEMSA Kiambu
8 Mugunda Catholic Dispensary (
Mugunda Mission Hospital)
Faith Based
Organisation
KEMSA Nyeri
9 Naro Moru Catholic Dispensary Faith Based
Organisation
KEMSA Nyeri
10 St. Mary's Mission Hospital -
Langata
Faith Based
Organisation
KEMSA Nairobi
11 St. Mathias Mulumba Mission
Hospital
Faith Based
Organisation
KEMSA Kiambu
12 AIC Litein Mission Hospital Faith Based
Organisation
KP Kericho
13 AIC Lokichogio Health Centre Faith Based
Organisation
KP Turkana
14 AMURT Health Centre Faith Based
Organisation
KP Nairobi
15 Asumbi Mission Hospital Faith Based
Organisation
KP Homa Bay
16 Baraka Dispensary (Nairobi) Faith Based
Organisation
KP Nairobi
17 Bomu Medical Hospital
(Changamwe)
Faith Based
Organisation
KP Mombasa
18 Chogoria (PCEA) Mission
Hospital
Faith Based
Organisation
KP Tharaka
Nithi
19 Consolata Hospital Kyeni Faith Based
Organisation
KP Embu
20 Consolata Mission Hospital
(Mathari)
Faith Based
Organisation
KP Nyeri
21 Cottolengo Children's Centre Faith Based
Organisation
KP Nairobi
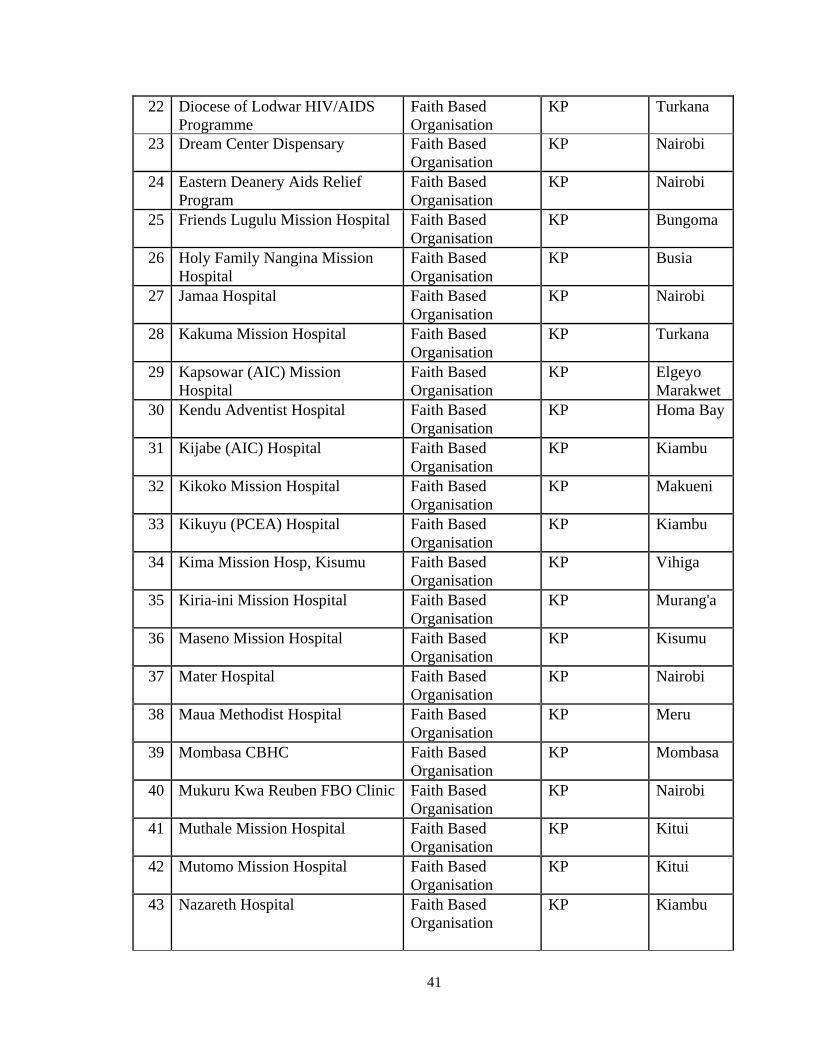
41
22 Diocese of Lodwar HIV/AIDS
Programme
Faith Based
Organisation
KP Turkana
23 Dream Center Dispensary Faith Based
Organisation
KP Nairobi
24 Eastern Deanery Aids Relief
Program
Faith Based
Organisation
KP Nairobi
25 Friends Lugulu Mission Hospital Faith Based
Organisation
KP Bungoma
26 Holy Family Nangina Mission
Hospital
Faith Based
Organisation
KP Busia
27 Jamaa Hospital Faith Based
Organisation
KP Nairobi
28 Kakuma Mission Hospital Faith Based
Organisation
KP Turkana
29 Kapsowar (AIC) Mission
Hospital
Faith Based
Organisation
KP Elgeyo
Marakwet
30 Kendu Adventist Hospital Faith Based
Organisation
KP Homa Bay
31 Kijabe (AIC) Hospital Faith Based
Organisation
KP Kiambu
32 Kikoko Mission Hospital Faith Based
Organisation
KP Makueni
33 Kikuyu (PCEA) Hospital Faith Based
Organisation
KP Kiambu
34 Kima Mission Hosp, Kisumu Faith Based
Organisation
KP Vihiga
35 Kiria-ini Mission Hospital Faith Based
Organisation
KP Murang'a
36 Maseno Mission Hospital Faith Based
Organisation
KP Kisumu
37 Mater Hospital Faith Based
Organisation
KP Nairobi
38 Maua Methodist Hospital Faith Based
Organisation
KP Meru
39 Mombasa CBHC Faith Based
Organisation
KP Mombasa
40 Mukuru Kwa Reuben FBO Clinic Faith Based
Organisation
KP Nairobi
41 Muthale Mission Hospital Faith Based
Organisation
KP Kitui
42 Mutomo Mission Hospital Faith Based
Organisation
KP Kitui
43 Nazareth Hospital Faith Based
Organisation
KP Kiambu
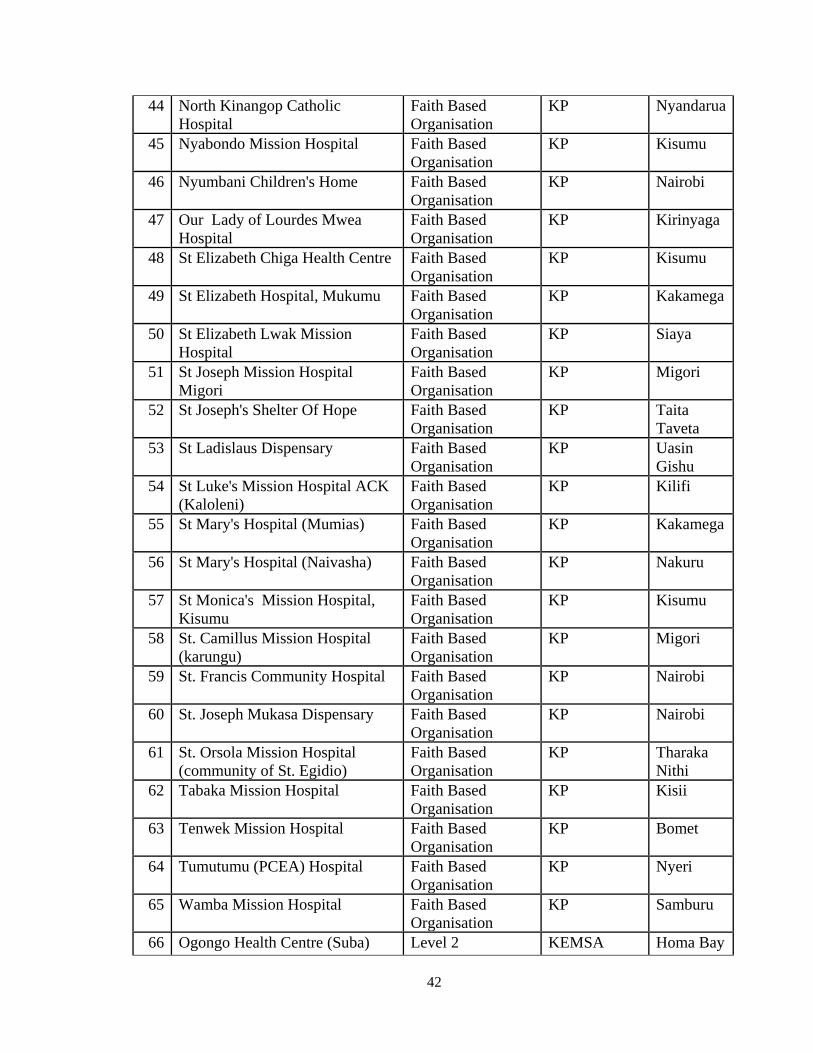
42
44 North Kinangop Catholic
Hospital
Faith Based
Organisation
KP Nyandarua
45 Nyabondo Mission Hospital Faith Based
Organisation
KP Kisumu
46 Nyumbani Children's Home Faith Based
Organisation
KP Nairobi
47 Our Lady of Lourdes Mwea
Hospital
Faith Based
Organisation
KP Kirinyaga
48 St Elizabeth Chiga Health Centre Faith Based
Organisation
KP Kisumu
49 St Elizabeth Hospital, Mukumu Faith Based
Organisation
KP Kakamega
50 St Elizabeth Lwak Mission
Hospital
Faith Based
Organisation
KP Siaya
51 St Joseph Mission Hospital
Migori
Faith Based
Organisation
KP Migori
52 St Joseph's Shelter Of Hope Faith Based
Organisation
KP Taita
Taveta
53 St Ladislaus Dispensary Faith Based
Organisation
KP Uasin
Gishu
54 St Luke's Mission Hospital ACK
(Kaloleni)
Faith Based
Organisation
KP Kilifi
55 St Mary's Hospital (Mumias) Faith Based
Organisation
KP Kakamega
56 St Mary's Hospital (Naivasha) Faith Based
Organisation
KP Nakuru
57 St Monica's Mission Hospital,
Kisumu
Faith Based
Organisation
KP Kisumu
58 St. Camillus Mission Hospital
(karungu)
Faith Based
Organisation
KP Migori
59 St. Francis Community Hospital Faith Based
Organisation
KP Nairobi
60 St. Joseph Mukasa Dispensary Faith Based
Organisation
KP Nairobi
61 St. Orsola Mission Hospital
(community of St. Egidio)
Faith Based
Organisation
KP Tharaka
Nithi
62 Tabaka Mission Hospital Faith Based
Organisation
KP Kisii
63 Tenwek Mission Hospital Faith Based
Organisation
KP Bomet
64 Tumutumu (PCEA) Hospital Faith Based
Organisation
KP Nyeri
65 Wamba Mission Hospital Faith Based
Organisation
KP Samburu
66 Ogongo Health Centre (Suba) Level 2 KEMSA Homa Bay

43
67 JKUAT Hospital Level 2 KEMSA Kiambu
68 Samburu Health Centre Level 2 KEMSA Kwale
69 Lungalunga Health Centre Level 2 KEMSA Kwale
70 Diani Health centre Level 2 KEMSA Kwale
71 Mkongani Model Health Centre Level 2 KEMSA Kwale
72 Kenya Ports Authority (KPA)
Health Centre
Level 2 KEMSA Mombasa
73 Magongo Health Centre Level 2 KEMSA Mombasa
74 Shimo La Tewa Prison Health
Centre
Level 2 KEMSA Mombasa
75 Tiwi Rural Training Health
Centre
Level 2 KEMSA Kwale
76 Athi River Health Centre Central
Site
Level 2 KEMSA Machakos
77 Mutomo Health Centre Central
Site
Level 2 KEMSA Kitui
78 Kiritiri Health centre Level 2 KEMSA Embu
79 Masii Health Centre Level 2 KEMSA Machakos
80 Nzeveni HC Level 2 KEMSA Makueni
81 Sa/Ahf Kithituni Health Clinic Level 2 KEMSA Makueni
82 Mathare North Health Centre
Central Site
Level 2 KEMSA Nairobi
83 Kibera D.O Dispensary Central
Site
Level 2 KEMSA Nairobi
84 Makadara Health Centre Central
Site
Level 2 KEMSA Nairobi
85 Bahati Health Centre-Nairobi Level 2 KEMSA Nairobi
86 Pumwani -Majengo Health
Centre
Level 2 KEMSA Nairobi
87 Kamiti Prison Health Centre Level 2 KEMSA Nairobi
88 Kariobangi Health Centre Level 2 KEMSA Nairobi
89 Kasarani Health Centre Level 2 KEMSA Nairobi
90 Uhuru AP Camp Dispensary Level 2 KEMSA Nairobi
91 Jericho Health Centre Level 2 KEMSA Nairobi
92 Lunga Lunga Health Centre
(Nairobi)
Level 2 KEMSA Nairobi
93 Nairobi Remand Prison Health
Centre
Level 2 KEMSA Nairobi
94 Dandora II Health Centre Level 2 KEMSA Nairobi
95 Ukwala Health Centre Central
Site
Level 2 KEMSA Siaya

44
96 Mbita Health Centre Central Site Level 2 KEMSA Homa Bay
97 Rwambwa Health Centre Central
Site
Level 2 KEMSA Siaya
98 Kodiaga Health Centre Level 2 KEMSA Kisumu
99 Port Florence Clinic Level 2 KEMSA Kisumu
100 Maseno University Clinic Level 2 KEMSA Kisumu
101 Chemelil Sugar Health Centre Level 2 KEMSA Kisumu
102 Kabondo Health Centre Level 2 KEMSA Homa Bay
103 Ewaso Ngiro Health Centre
Central Site
Level 2 KEMSA Narok
104 Sotik Health Centre Level 2 KEMSA Bomet
105 Rongai Health centre Level 2 KEMSA Kajiado
106 Njoro Health Centre Level 2 KEMSA Nakuru
107 Sabatia Health Centre Central
Site
Level 2 KEMSA Vihiga
108 Makunga RHDC Level 2 KEMSA Kakamega
109 Mumias Model Health centre Level 2 KEMSA Kakamega
110 Namasoli Health centre Level 2 KEMSA Kakamega
111 Shinyalu Model health centre Level 2 KEMSA Kakamega
112 Bungasi Health centre Level 2 KEMSA Kakamega
113 Mtongwe Health Centre Level 2 KP Mombasa
114 Kangemi Health Centre Level 2 KP Nairobi
115 STC Casino, Nairobi Level 2 KP Nairobi
116 Riruta Health Centre Central Site Level 2 KP Nairobi
117 GSU HQ Dispensary (Ruaraka) Level 2 KP Nairobi
118 Mathare Hospital Level 2 KP Nairobi
119 Ngaira Rhodes Dispensary Level 2 KP Nairobi
120 Pumwani Maternity Hospital Level 2 KP Nairobi
121 Ong'ielo Health Centre Level 2 KP Siaya
122 Sena Health Centre Level 2 KP Homa Bay
123 KEMRI Clinic Level 2 KP Kisumu
124 Matoso Health Clinic (Lalmba) Level 2 KP Migori
125 Sony Medical Centre Level 2 KP Migori
126 Burnt Forest RHDC (Eldoret
East)
Level 2 KP Uasin
Gishu
127 Chepkorio Health Centre Level 2 KP Elgeyo
Marakwet
128 Moi's Bridge Health Centre Level 2 KP Uasin
Gishu

45
129 Mosoriot RHDC Level 2 KP Nandi
130 Soy Health Centre Level 2 KP Uasin
Gishu
131 Turbo Health Centre Level 2 KP Uasin
Gishu
132 Amukura Health Centre Level 2 KP Busia
133 Khunyangu RHDC Level 2 KP Busia
134 Naitiri Health Centre Level 2 KP Bungoma
135 Nambale Health Centre Level 2 KP Busia
136 Matete Health Centre Level 2 KP Kakamega
137 Bumala A Health Centre Level 2 KP Busia
138 Bumala B Health Centre Level 2 KP Busia
139 Mabusi Health Centre Level 2 KP Kakamega
140 Mukhobola Health Centre Level 2 KP Busia
141 Kangema Sub District Hospital Level 3 KEMSA Murang'a
142 Kathiani Sub-District Hospital Level 3 KEMSA Machakos
143 Elburgon Sub-District Hospital Level 3 KEMSA Nakuru
144 Alupe Sub-District Hospital Level 3 KEMSA Busia
145 Kirwara Sub District Level 3 KEMSA Murang'a
146 Likoni Sub-District Hospital Level 3 KEMSA Mombasa
147 Mwatate Sub-District Hospital Level 3 KEMSA Taita
Taveta
148 Kibwezi SDH Central Site Level 3 KEMSA Makueni
149 Migwani SDH Central Site Level 3 KEMSA Kitui
150 Garbatullah Subcounty hospital Level 3 KEMSA Isiolo
151 Kilungu Subcounty hospital Level 3 KEMSA Makueni
152 Mtito Andei Subcounty hospital Level 3 KEMSA Makueni
153 Sultan Hamud Subcounty
hospital
Level 3 KEMSA Makueni
154 Ishiara Sub-District Hospital Level 3 KEMSA Embu
155 Nyamache Sub-District Hospital
Central Site
Level 3 KEMSA Kisii
156 Gesusu Sub-District Hospital
Central Site
Level 3 KEMSA Kisii
157 Ahero Sub-District Hospital
Central Site
Level 3 KEMSA Kisumu
158 Muhoroni Sub-District Hospital
Central Site
Level 3 KEMSA Kisumu
159 Kendu SDH Central Site
Level 3 KEMSA Homa Bay
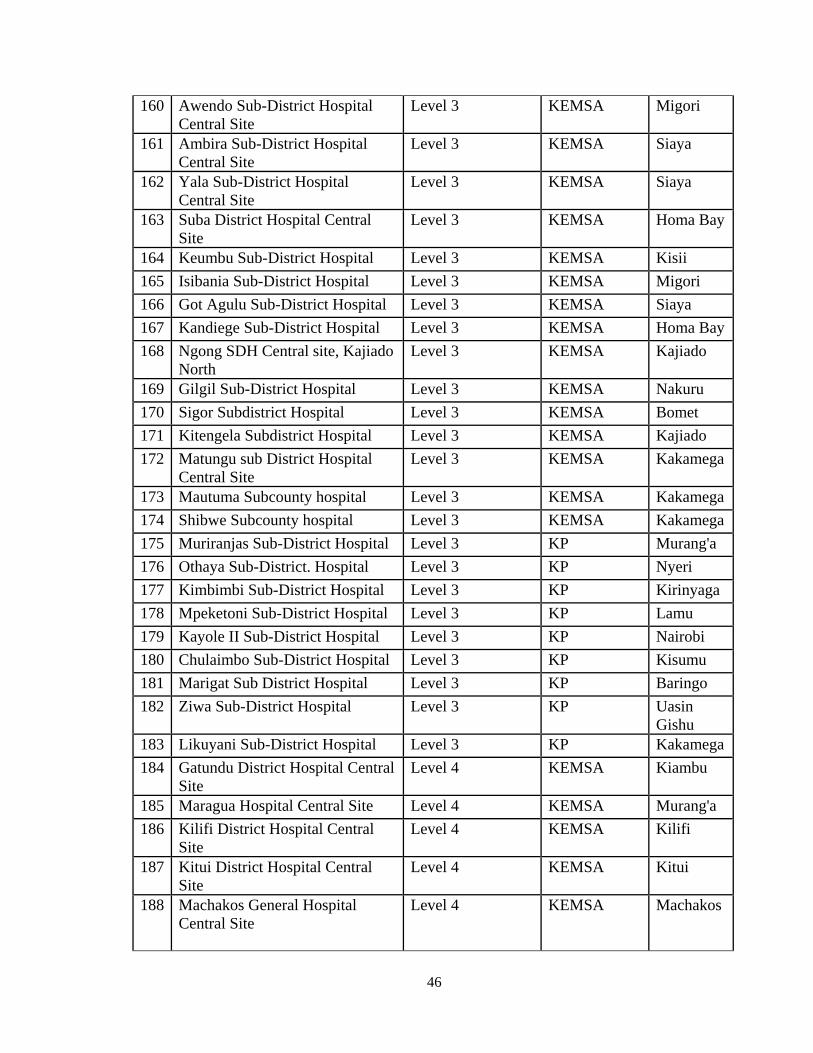
46
160 Awendo Sub-District Hospital
Central Site
Level 3 KEMSA Migori
161 Ambira Sub-District Hospital
Central Site
Level 3 KEMSA Siaya
162 Yala Sub-District Hospital
Central Site
Level 3 KEMSA Siaya
163 Suba District Hospital Central
Site
Level 3 KEMSA Homa Bay
164 Keumbu Sub-District Hospital Level 3 KEMSA Kisii
165 Isibania Sub-District Hospital Level 3 KEMSA Migori
166 Got Agulu Sub-District Hospital Level 3 KEMSA Siaya
167 Kandiege Sub-District Hospital Level 3 KEMSA Homa Bay
168 Ngong SDH Central site, Kajiado
North
Level 3 KEMSA Kajiado
169 Gilgil Sub-District Hospital Level 3 KEMSA Nakuru
170 Sigor Subdistrict Hospital Level 3 KEMSA Bomet
171 Kitengela Subdistrict Hospital Level 3 KEMSA Kajiado
172 Matungu sub District Hospital
Central Site
Level 3 KEMSA Kakamega
173 Mautuma Subcounty hospital Level 3 KEMSA Kakamega
174 Shibwe Subcounty hospital Level 3 KEMSA Kakamega
175 Muriranjas Sub-District Hospital Level 3 KP Murang'a
176 Othaya Sub-District. Hospital Level 3 KP Nyeri
177 Kimbimbi Sub-District Hospital Level 3 KP Kirinyaga
178 Mpeketoni Sub-District Hospital Level 3 KP Lamu
179 Kayole II Sub-District Hospital Level 3 KP Nairobi
180 Chulaimbo Sub-District Hospital Level 3 KP Kisumu
181 Marigat Sub District Hospital Level 3 KP Baringo
182 Ziwa Sub-District Hospital Level 3 KP Uasin
Gishu
183 Likuyani Sub-District Hospital Level 3 KP Kakamega
184 Gatundu District Hospital Central
Site
Level 4 KEMSA Kiambu
185 Maragua Hospital Central Site Level 4 KEMSA Murang'a
186 Kilifi District Hospital Central
Site
Level 4 KEMSA Kilifi
187 Kitui District Hospital Central
Site
Level 4 KEMSA Kitui
188 Machakos General Hospital
Central Site
Level 4 KEMSA Machakos

47
189 Matuu District Hospital Central
Site
Level 4 KEMSA Machakos
190 Nyahururu District Hospital
Central Site
Level 4 KEMSA Laikipia
191 Iguhu District Hospital Central
Site
Level 4 KEMSA Kakamega
192 Kiambu District Hospital Central
Site
Level 4 KEMSA Kiambu
193 Tigoni District Hospital Central
Site
Level 4 KEMSA Kiambu
194 Kerugoya District Hospital
Central Site
Level 4 KEMSA Kirinyaga
195 Thika District Hospital Central
Site
Level 4 KEMSA Kiambu
196 Olkalou District Hospital Central
Site
Level 4 KEMSA Nyandarua
197 Kwale District Hospital Central
Site
Level 4 KEMSA Kwale
198 Tudor District Hospital Central
Site
Level 4 KEMSA Mombasa
199 Msambweni District Hospital
Central Site
Level 4 KEMSA Kwale
200 Moi Voi District Hopsital Central
Site
Level 4 KEMSA Taita
Taveta
201 Ngao District Hospital Central
Site
Level 4 KEMSA Tana
River
202 Taveta District Hospital Central
Site
Level 4 KEMSA Taita
Taveta
203 Githongo District Hospital -
Meru Central Site
Level 4 KEMSA Meru
204 Runyenjes District Hospital
Central Site
Level 4 KEMSA Embu
205 Meru District Hospital Central
Site
Level 4 KEMSA Meru
206 Kanyakine District Hospital
Central Site
Level 4 KEMSA Meru
207 Isiolo District Hospital Central
Site
Level 4 KEMSA Isiolo
208 Makueni District Hospital Central
Site
Level 4 KEMSA Makueni
209 Chuka District Hospital Central
Site
Level 4 KEMSA Tharaka
Nithi
210 Mwingi District Hospital Central
Site
Level 4 KEMSA Kitui
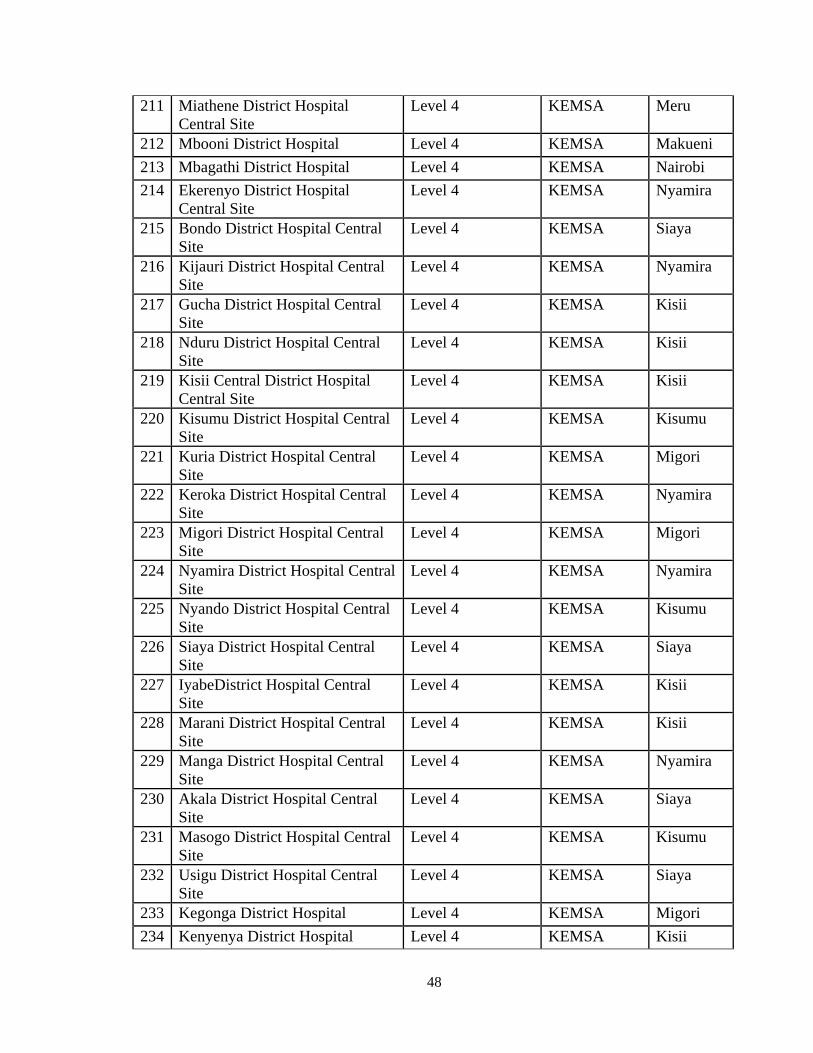
48
211 Miathene District Hospital
Central Site
Level 4 KEMSA Meru
212 Mbooni District Hospital Level 4 KEMSA Makueni
213 Mbagathi District Hospital Level 4 KEMSA Nairobi
214 Ekerenyo District Hospital
Central Site
Level 4 KEMSA Nyamira
215 Bondo District Hospital Central
Site
Level 4 KEMSA Siaya
216 Kijauri District Hospital Central
Site
Level 4 KEMSA Nyamira
217 Gucha District Hospital Central
Site
Level 4 KEMSA Kisii
218 Nduru District Hospital Central
Site
Level 4 KEMSA Kisii
219 Kisii Central District Hospital
Central Site
Level 4 KEMSA Kisii
220 Kisumu District Hospital Central
Site
Level 4 KEMSA Kisumu
221 Kuria District Hospital Central
Site
Level 4 KEMSA Migori
222 Keroka District Hospital Central
Site
Level 4 KEMSA Nyamira
223 Migori District Hospital Central
Site
Level 4 KEMSA Migori
224 Nyamira District Hospital Central
Site
Level 4 KEMSA Nyamira
225 Nyando District Hospital Central
Site
Level 4 KEMSA Kisumu
226 Siaya District Hospital Central
Site
Level 4 KEMSA Siaya
227 IyabeDistrict Hospital Central
Site
Level 4 KEMSA Kisii
228 Marani District Hospital Central
Site
Level 4 KEMSA Kisii
229 Manga District Hospital Central
Site
Level 4 KEMSA Nyamira
230 Akala District Hospital Central
Site
Level 4 KEMSA Siaya
231 Masogo District Hospital Central
Site
Level 4 KEMSA Kisumu
232 Usigu District Hospital Central
Site
Level 4 KEMSA Siaya
233 Kegonga District Hospital Level 4 KEMSA Migori
234 Kenyenya District Hospital Level 4 KEMSA Kisii

49
235 Kajiado Central District Hospital
Central Site
Level 4 KEMSA Kajiado
236 Eldama Ravine District Hospital
Central Site
Level 4 KEMSA Baringo
237 Loitokitok District Hospital
Central Site
Level 4 KEMSA Kajiado
238 Chebiemit District Hospital
Central Site-Marakwet
Level 4 KEMSA Elgeyo
Marakwet
239 Molo District Hospital Central
Site
Level 4 KEMSA Nakuru
240 Naivasha District Hospital
Central Site
Level 4 KEMSA Nakuru
241 Bahati District Hospital Central
Site-Nakuru North
Level 4 KEMSA Nakuru
242 Narok District Hospital Central
Site
Level 4 KEMSA Narok
243 Kapsara District Hospital Central
Site
Level 4 KEMSA Trans
Nzoia
244 Endebess District Hospital Level 4 KEMSA Trans
Nzoia
245 Ololunga District Hospital Level 4 KEMSA Narok
246 Bungoma District Hospital
Central Site
Level 4 KEMSA Bungoma
247 Butere District Hospital Central
Site
Level 4 KEMSA Kakamega
248 Malava District Hospital Central
Site
Level 4 KEMSA Kakamega
249 Vihiga District Hospital Central
Site
Level 4 KEMSA Vihiga
250 Emuhaya District Hospital
Central Site
Level 4 KEMSA Vihiga
251 Hamisi District Hospital Central
Site
Level 4 KEMSA Vihiga
252 Engineer District Hospital Level 4 KP Nyandarua
253 Karatina District Hospital Level 4 KP Nyeri
254 Mukurweini District Hospital Level 4 KP Nyeri
255 Muranga District Hospital Level 4 KP Murang'a
256 Hola District Hospital Level 4 KP Tana
River
257 Kinango District Hospital Level 4 KP Kwale
258 Lamu District Hospital Level 4 KP Lamu
259 Mariakani District Hospital
Level 4 KP Kilifi

50
260 Port Reitz Hospital - Kilindini
District Hospital
Level 4 KP Mombasa
261 Wesu District Hospital Level 4 KP Taita
Taveta
262 Malindi District Hospital Central
Site
Level 4 KP Kilifi
263 Kangundo District Hospital Level 4 KP Machakos
264 Kyuso District Hospital Level 4 KP Kitui
265 Makindu District Hospital Level 4 KP Makueni
266 Marsabit District Hospital Level 4 KP Marsabit
267 Mbeere District Hospital Level 4 KP Embu
268 Moyale District Hospital Level 4 KP Marsabit
269 Mwala District Hospital Level 4 KP Machakos
270 Nyambene District Hospital Level 4 KP Meru
271 Tharaka District Hospital Level 4 KP Tharaka
Nithi
272 Ijara District Hospital - Masalani Level 4 KP Garissa
273 Mandera District Hospital Level 4 KP Mandera
274 Wajir District Hospital Level 4 KP Wajir
275 Homa-Bay District Hospital Level 4 KP Homa Bay
276 Kombewa District Hospital Level 4 KP Kisumu
277 Macalder District Hospital Level 4 KP Migori
278 Madiany District Hospital Level 4 KP Siaya
279 Ndhiwa District Hospital Level 4 KP Homa Bay
280 Rachuonyo District Hospital Level 4 KP Homa Bay
281 Rongo District Hospital Level 4 KP Migori
282 Iten District Hospital Level 4 KP Elgeyo
Marakwet
283 Kabarnet District Hospital Level 4 KP Baringo
284 Kabartonjo District Hospital Level 4 KP Baringo
285 Kapenguria District Hospital Level 4 KP West
Pokot
286 Kapkatet District Hospital Level 4 KP Kericho
287 Kapsabet District Hospital Level 4 KP Nandi
288 Kericho District Hospital Level 4 KP Kericho
289 Kitale District Hospital Level 4 KP Trans
Nzoia
290 Lodwar District Hospital Level 4 KP Turkana
291 Londiani District Hospital Level 4
KP Kericho

51
292 Longisa District Hospital Level 4 KP Bomet
293 Maralal District Hospital Level 4 KP Samburu
294 Nandi Hills District Hospital Level 4 KP Nandi
295 Nanyuki District Hospital Level 4 KP Laikipia
296 Rumuruti District Hospital Level 4 KP Laikipia
297 Transmara District Hospital Level 4 KP Narok
298 Uasin Gishu District Hospital Level 4 KP Uasin
Gishu
299 Busia District Hospital Central
Site(Ampath clinic)
Level 4 KP Busia
300 Khwisero District Hospital Level 4 KP Kakamega
301 Kimilili District Hospital Level 4 KP Bungoma
302 Lugari District Hospital Level 4 KP Kakamega
303 Mt Elgon District Hospital Level 4 KP Bungoma
304 Port Victoria Hospital Level 4 KP Busia
305 Sio Port District Hospital Level 4 KP Busia
306 Teso District Hospital Level 4 KP Busia
307 Webuye District Hospital Level 4 KP Bungoma
308 Navakholo District Hospital
Central Site
Level 4 KP Kakamega
309 Embu PGH Central Site Level 5 KEMSA Embu
310 Kakamega PGH Central Site Level 5 KEMSA Kakamega
311 Nyeri Provincial General
Hospital (PGH)
Level 5 KP Nyeri
312 Coast Provincial General
Hospital
Level 5 KP Mombasa
313 Defence Forces Memorial
Hospital, Nairobi
Level 5 KP Nairobi
314 Garissa Provincial General
Hospital
Level 5 KP Garissa
315 Nyanza Provincial Hospital Level 5 KP Kisumu
316 Rift Valley Provincial General
Hospital
Level 5 KP Nakuru
317 Kenyatta National Hospital Level 6 KP Nairobi
318 AMPATH (Moi Teaching
Referral Hospital)
Level 6 KP Uasin
Gishu
319 SOS Medical Centre - Buru Buru NGO KEMSA Nairobi
320 Family Health Options (Kenya)
Clinic - Kibera
NGO KEMSA Nairobi
321 Ganjoni Women's Health Project NGO KP Mombasa
322 Tumaini Medical Centre NGO KP Turkana

52
323 AMREF Kibera Health Centre NGO KP Nairobi
324 Liverpool VCT NGO KP Nairobi
325 Nairobi Women's Hospital NGO KP Nairobi
326 UON/UOM Pumwani VCT
Centre
NGO KP Nairobi
327 AHF Mathare Clinic NGO KP Nairobi
328 Kayole Soweto PHC NGO KP Nairobi
329 KEMRI/CRDR FACES Program NGO KP Nairobi
330 Kibera South (MSF Belgium)
Dispensary
NGO KP Nairobi
331 Pumwani Majengo Dispensary
(UNITID)
NGO KP Nairobi
332 Refuge Point NGO KP Nairobi
333 Silanga (MSF Belgium)
Dispensary
NGO KP Nairobi
334 Tabitha Medical Centre NGO KP Nairobi
335 University Health Services
(UNITID)
NGO KP Nairobi
336 Uzima Health Centre NGO KP Nairobi
337 Faces Nyanza (Lumumba) NGO KP Kisumu
338 Homa Hills Health Centre NGO KP Homa Bay
339 KEMRI/Walter Reed Project
Kericho
NGO KP Kericho
340 Beacon of Hope Clinic (Kajiado) NGO KP Kajiado
341 IRC Kakuma Hospital NGO KP Turkana
342 Tumaini Childrens' Home
(Nanyuki)
NGO KP Laikipia
343 Jocham Hospital Private KEMSA Mombasa
344 Mewa Hospital Private KEMSA Mombasa
345 Gertrude Children‟s Hospital Private KP Nairobi