Staining and embedding the whole mouse brain for electron microscopy
15
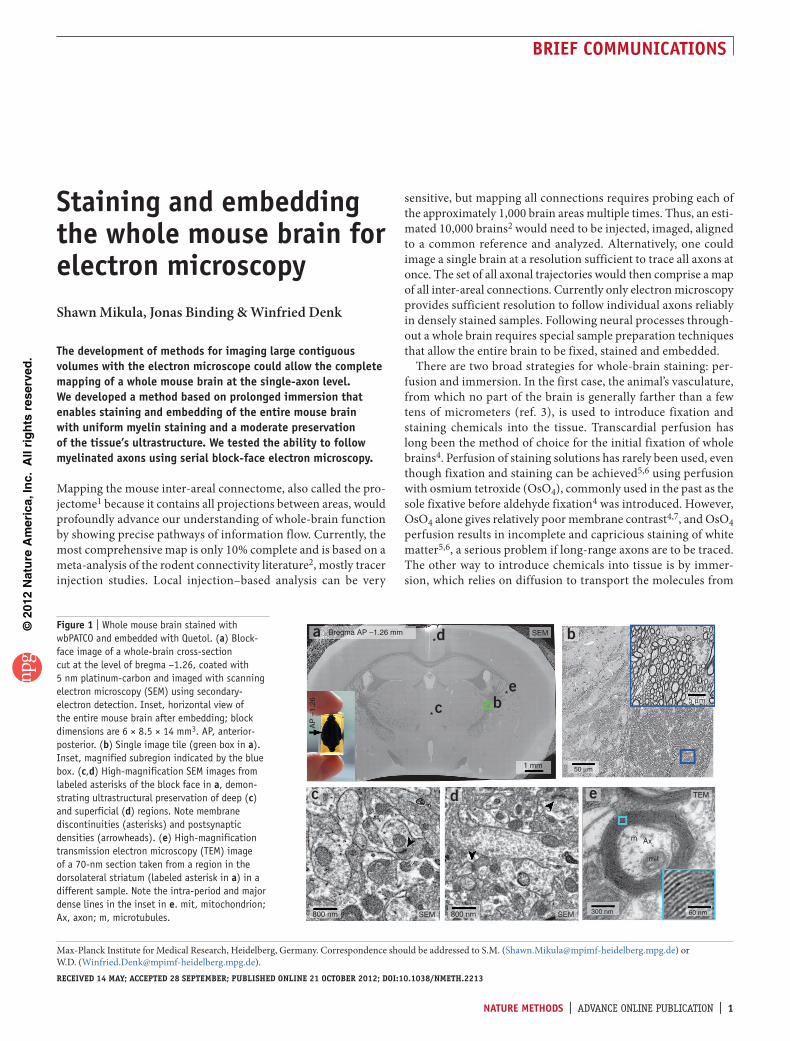
© 2012 Nature America, Inc. All rights reserved. BRIEF COMMUNICATIONS NATURE METHODS | ADVANCE ONLINE PUBLICATION | - sensitive,-but-mapping-all-connections-requires-probing-each-of- the-approximately-1,000-brain-areas-multiple-times.-Thus,-an-esti- mated-10,000-brains 2 -would-need-to-be-injected,-imaged,-aligned- to-a-common-reference-and-analyzed.-Alternatively,-one-could- image-a-single-brain-at-a-resolution-sufficient-to-trace-all-axons-at- once.-The-set-of-all-axonal-trajectories-would-then-comprise-a-map- of-all-inter-areal-connections.-Currently-only-electron-microscopy- provides-sufficient-resolution-to-follow-individual-axons-reliably- in-densely-stained-samples.-Following-neural-processes-through- out-a-whole-brain-requires-special-sample-preparation-techniques- that-allow-the-entire-brain-to-be-fixed,-stained-and-embedded. There-are-two-broad-strategies-for-whole-brain-staining:-per- fusion-and-immersion.-In-the-first-case,-the-animal’s-vasculature,- from-which-no-part-of-the-brain-is-generally-farther-than-a-few- tens-of-micrometers-(ref.-3),-is-used-to-introduce-fixation-and- staining- chemicals- into- the- tissue.- Transcardial- perfusion- has- long-been-the-method-of-choice-for-the-initial-fixation-of-whole- brains 4 .-Perfusion-of-staining-solutions-has-rarely-been-used,-even- though-fixation-and-staining-can-be-achieved 5,6 -using-perfusion- with-osmium-tetroxide-(OsO 4 ),-commonly-used-in-the-past-as-the- sole-fixative-before-aldehyde-fixation 4 -was-introduced.-However,- OsO 4 -alone-gives-relatively-poor-membrane-contrast 4,7 ,-and-OsO 4 - perfusion-results-in-incomplete-and-capricious-staining-of-white- matter 5,6 ,-a-serious-problem-if-long-range-axons-are-to-be-traced.- The-other-way-to-introduce-chemicals-into-tissue-is-by-immer- sion,-which-relies-on-diffusion-to-transport-the-molecules-from- Staining and embedding the whole mouse brain for electron microscopy Shawn Mikula, Jonas Binding & Winfried Denk The development of methods for imaging large contiguous volumes with the electron microscope could allow the complete mapping of a whole mouse brain at the single-axon level. We developed a method based on prolonged immersion that enables staining and embedding of the entire mouse brain with uniform myelin staining and a moderate preservation of the tissue’s ultrastructure. We tested the ability to follow myelinated axons using serial block-face electron microscopy. Mapping-the-mouse-inter-areal-connectome,-also-called-the-pro- jectome 1 -because-it-contains-all-projections-between-areas,-would- profoundly-advance-our-understanding-of-whole-brain-function- by-showing-precise-pathways-of-information-flow.-Currently,-the- most-comprehensive-map-is-only-10%-complete-and-is-based-on-a- meta-analysis-of-the-rodent-connectivity-literature 2 ,-mostly-tracer- injection- studies.- Local- injection–based- analysis- can- be- very- Max-Planck-Institute-for-Medical-Research,-Heidelberg,-Germany.-Correspondence-should-be-addressed-to-S.M.-([email protected])-or-- W.D.-([email protected]). RECEIVED 14 MAY; ACCEPTED 28 SEPTEMBER; PUBLISHED ONLINE 21 OCTOBER 2012; DOI:10.1038/NMETH.2213 a c d e b Bregma AP –1.26 mm AP –1.26 d * c 800 nm 800 nm 300 nm mit TEM Ax m 60 nm SEM SEM b 1 mm 50 μm 5 μm 5 μ m SEM * * * * * e * 5 μm Figure | Whole mouse brain stained with wbPATCO and embedded with Quetol. (a) Block- face image of a whole-brain cross-section cut at the level of bregma −1.26, coated with 5 nm platinum-carbon and imaged with scanning electron microscopy (SEM) using secondary- electron detection. Inset, horizontal view of the entire mouse brain after embedding; block dimensions are 6 × 8.5 × 14 mm 3 . AP, anterior- posterior. (b) Single image tile (green box in a). Inset, magnified subregion indicated by the blue box. (c,d) High-magnification SEM images from labeled asterisks of the block face in a, demon- strating ultrastructural preservation of deep (c) and superficial (d) regions. Note membrane discontinuities (asterisks) and postsynaptic densities (arrowheads). (e) High-magnification transmission electron microscopy (TEM) image of a 70-nm section taken from a region in the dorsolateral striatum (labeled asterisk in a) in a different sample. Note the intra-period and major dense lines in the inset in e. mit, mitochondrion; Ax, axon; m, microtubules.
Transcript of Staining and embedding the whole mouse brain for electron microscopy
©20
12 N
atu
re A
mer
ica,
Inc.
All
rig
hts
res
erve
d.
brief communications
nature methods | ADVANCE ONLINE PUBLICATION | �
sensitive,butmappingallconnectionsrequiresprobingeachoftheapproximately1,000brainareasmultipletimes.Thus,anesti-mated10,000brains2wouldneedtobeinjected,imaged,alignedtoacommonreferenceandanalyzed.Alternatively,onecouldimageasinglebrainataresolutionsufficienttotraceallaxonsatonce.Thesetofallaxonaltrajectorieswouldthencompriseamapofallinter-arealconnections.Currentlyonlyelectronmicroscopyprovidessufficientresolutiontofollowindividualaxonsreliablyindenselystainedsamples.Followingneuralprocessesthrough-outawholebrainrequiresspecialsamplepreparationtechniquesthatallowtheentirebraintobefixed,stainedandembedded.
Therearetwobroadstrategiesforwhole-brainstaining:per-fusionandimmersion.Inthefirstcase,theanimal’svasculature,fromwhichnopartofthebrainisgenerallyfartherthanafewtensofmicrometers (ref.3), isused to introduce fixationandstaining chemicals into the tissue. Transcardial perfusion haslongbeenthemethodofchoicefortheinitialfixationofwholebrains4.Perfusionofstainingsolutionshasrarelybeenused,eventhoughfixationandstainingcanbeachieved5,6usingperfusionwithosmiumtetroxide(OsO4),commonlyusedinthepastasthesolefixativebeforealdehydefixation4wasintroduced.However,OsO4alonegivesrelativelypoormembranecontrast4,7,andOsO4perfusionresultsinincompleteandcapriciousstainingofwhitematter5,6,aseriousproblemiflong-rangeaxonsaretobetraced.Theotherwaytointroducechemicalsintotissueisbyimmer-sion,whichreliesondiffusiontotransportthemoleculesfrom
staining and embedding the whole mouse brain for electron microscopyShawn Mikula, Jonas Binding & Winfried Denk
the development of methods for imaging large contiguous volumes with the electron microscope could allow the complete mapping of a whole mouse brain at the single-axon level. We developed a method based on prolonged immersion that enables staining and embedding of the entire mouse brain with uniform myelin staining and a moderate preservation of the tissue’s ultrastructure. We tested the ability to follow myelinated axons using serial block-face electron microscopy.
Mappingthemouseinter-arealconnectome,alsocalledthepro-jectome1becauseitcontainsallprojectionsbetweenareas,wouldprofoundlyadvanceourunderstandingofwhole-brainfunctionbyshowingprecisepathwaysofinformationflow.Currently,themostcomprehensivemapisonly10%completeandisbasedonameta-analysisoftherodentconnectivityliterature2,mostlytracerinjection studies. Local injection–based analysis can be very
Max-PlanckInstituteforMedicalResearch,Heidelberg,Germany.CorrespondenceshouldbeaddressedtoS.M.([email protected])orW.D.([email protected]).Received 14 May; accepted 28 SepteMbeR; pUbLiSHed ONLiNe 21 OctObeR 2012; dOi:10.1038/NMetH.2213
a
c d e
bBregma AP –1.26 mm
AP
–1.
26
d*
c
800 nm 800 nm 300 nm
mit
TEM
Axm
60 nmSEM SEM
b
1 mm 50 µm
5 µm5 µm
SEM
*
**
**
e*
5 µm
figure � | Whole mouse brain stained with wbPATCO and embedded with Quetol. (a) Block-face image of a whole-brain cross-section cut at the level of bregma −1.26, coated with 5 nm platinum-carbon and imaged with scanning electron microscopy (SEM) using secondary-electron detection. Inset, horizontal view of the entire mouse brain after embedding; block dimensions are 6 × 8.5 × 14 mm3. AP, anterior-posterior. (b) Single image tile (green box in a). Inset, magnified subregion indicated by the blue box. (c,d) High-magnification SEM images from labeled asterisks of the block face in a, demon-strating ultrastructural preservation of deep (c) and superficial (d) regions. Note membrane discontinuities (asterisks) and postsynaptic densities (arrowheads). (e) High-magnification transmission electron microscopy (TEM) image of a 70-nm section taken from a region in the dorsolateral striatum (labeled asterisk in a) in a different sample. Note the intra-period and major dense lines in the inset in e. mit, mitochondrion; Ax, axon; m, microtubules.

©20
12 N
atu
re A
mer
ica,
Inc.
All
rig
hts
res
erve
d.
� | ADVANCE ONLINE PUBLICATION | nature methods
brief communications
the sample’s surface to its interior. Thisapproach, which has been used to stainandembedwholemousebrainsforlight-microscopic observation8,9, scales unfa-vorably with sample size because diffu-sion times increase quadratically withdistance10,11. The brain is, therefore,commonlycutintopiecesatmostafewmillimetersinsizeaftertheinitialperfusionfixation12,13.Forwhole-brainconnectivityanalysis,thisisunsuitablebecausesuchcuttingalwaysleadstosurface damage, which in all likelihood precludes the reliabletracingofthinaxonsfromonepiecetotheadjacentone.Herewereportaprocedurethatisbasedmostlyonlongimmersionsteps and results in whole-brain samples that are stained andembeddedwellenoughtoreliablyfollowmyelinatedaxons.
Aside from the initial transcardial perfusion, we based ourapproachon sample immersion.Tocompensate for theabouttenfoldincreaseindiffusiondistanceduetothelargersizeofawhole-brainsample,weincreasedtheperiodsofimmersionto48hforeachstainingstep(Supplementary Protocol).Becausethe effective diffusion constants of the staining chemicals inbrain tissue cannot be larger than that for small solutes inaqueoussolutions,roughly10−9m2s−1(ref.14),diffusioncannotequilibrateconcentrationsoveradistanceofmuchmore than10mmin48h(thewholeadultmousebrainislessthan10mminwidthandheight).
Weinitiallyusedsingle-stepincubationsofbrainhemispheresinOsO4(0.5–4%),usingunbufferedandbuffered(phosphate,Tris,cacodylateorcollidine)solutions.Noneofthebuffersimprovedpenetrationcomparedtotheunbufferedcase.Whenusingunbuff-ered2%OsO4at20°C,thepenetrationdepthsatdifferentincu-bationtimes(datanotshown)wereconsistentwithaneffectivediffusionconstantofroughly2×10−10m2s−1,slowerthanfreediffusioninwaterbutmuchfasterthanthevalueofroughly10−11m2s−1reportedforliver10.ProvidedthatthequantityofOsO4wassufficientlyhigh(>250mg)andtheincubationtimessufficientlylong(>24h),stainingwasuniformthroughoutthewholehemi-sphere,butthecontrastwasgenerallypoorformembranesandmyelin(Supplementary Fig. 1a).Afurtherincreaseinincubation
time(>96h)causedadecreaseinmembranecontrast.Theinclu-sionoforganicsolventsdidnotfacilitatepenetrationandledtoaprecipitationandprogressivedarkeningofthestainingsolutions,presumablybyreducingOsO4(ref.15).
Toimprovecontrast,weexaminedenhancedstainingproto-cols,firstusingsmalltissuepieces(<1mm)andshortincubationtimes(90min).Guidedbytheresults,wethenusedhemispheresor whole brains and long incubation times (24–48 h). TheprotocolsandcomparativeresultsaregiveninSupplementary Tables 1 and 2. By combining a single OsO4 step with sub-sequentenhancementusinguranylacetateorleadaspartate,weslightlyincreasedmembranecontrast(Supplementary Fig. 1b).The OsO4-thiocarbohydrazide-OsO4 (OTO) method7 yieldedsampleswithhighmembranecontrastatshortincubationtimes,butwithincubationtimesof24–48hitsufferedfromcytosoldarkening (Supplementary Fig. 1c), which reduced mem-branecontrast,maskedsynapsesandresultedinbubbleforma-tion,possiblyduetoN2gasliberatedfromhydrazinogroupsintissue-boundthiocarbohydrazide(TCH)16.TherOTOmethod,whichusesferrocyanide-OsO4(‘reducedosmium’;refs.17,18)insteadofOsO4aloneinthefirstincubationstep,substantiallyincreasedmembranecontrastovertheOTOmethod,butstainpenetration was poor even at 48-h incubation time, and thetissueultrastructurewasdamaged(datanotshown).Byembeddingandimagingsamplesatvariouspointsofthestainingprotocol,we determined that the poor penetration resulted from thereduced-osmiumstep.
Because the OTO method, despite suffering from nonuni-formstainingandembeddingproblems,resultedingoodmem-branecontrastforshortincubationtimes,weexaminedsimilarstaining methods that also use TCH19. The periodic-acid–thiocarbohydrazide-OsO4(PATCO)19methodisaprecursorof
Lateral 0.5 mm
Corpus callosum
a
c
b
d
e
71 µ
m
72 µm82 µm
Center cube
y
x
x
y
z
z
y
5 µm 5 µm
ECCC
V1DHC
VPL
IC
Amyg
DpMe
EC
CC
V1
DHC
VPLIC
Amyg
DpMe
figure � | Traceability analysis of eight regions of interest (ROIs) in the mouse brain. (a) Parasagittal view showing projections of ROIs. (b) Horizontal view of ROIs through a transparent brain. (c) Serial block-face electron microscopy stack from the corpus callosum, cut down the middle, with 50 traced axons emerging, randomly colored. (d) Single xy image from the stack. (e) yz reslice from the center of a cube (same as in c) showing locations of the 50 seed tracings (cyan points) for the axons shown in c. Amyg, amygdala; CC, corpus callosum; DHC, dorsal hippocampal commissure; DpMe, deep mesencephalic nucleus; EC, external capsule; IC, internal capsule; V1, primary visual cortex (superficial layers); VPL, ventroposterolateral nucleus of the dorsal thalamus. Color coding in a and b denotes major brain subdivisions (cerebral cortex, olfactory bulb, cerebellum, brainstem, superior colliculus and so on).
©20
12 N
atu
re A
mer
ica,
Inc.
All
rig
hts
res
erve
d.
nature methods | ADVANCE ONLINE PUBLICATION | �
brief communications
theOTOmethodbutusesperiodicacidinstead of OsO4 in the first incubationstepandwasoriginallydesignedtostainglycogenandotherpolysaccharides.Wefoundthatitalsoenhancedmyelincon-trast at least twofold (Supplementary Fig. 1d), possibly because of the highlevelsofglycolipidsandcerebrosides inmyelin20.Byusingbufferedperiodic-acidandTCHsolutions,weobtaineduniformand complete staining throughout thebrain.Wewilluse‘wbPATCO’torefertothePATCOmethodthatweoptimizedforwhole-brainstaining.
Forembedding,wefirsttestedanEpon812substitute,glycidether100(Serva),andwefoundthatitbecameviscouswithinseveralhours,therebypreventingcompleteinfiltra-tion.Wenextexploredtheuseoflow-viscosityepoxiesandfoundthat,withanimmersiontimeof12hforeachdehydrationandepoxy-monomer infiltration step, both Spurr’s resin21 and Quetol22yieldedwhole-brainblocksofuniformmechanicalquality.Imagecontrastdidnotdependontheembeddingmedium.Embeddedsamples were about 3–4% larger (in length) than they werefollowingfixation.
Stainingqualityanduniformitywereassessedforthreebrainsprepared using the wbPATCO method. We acquired a set ofblock-face images at 80-nm pixel size that covered an entirecoronalcross-sectionthroughonewhole-brainsample(WB1405,Fig. 1). Upon close inspection of the individual image tiles(Fig. 1b),weobservedthatstainingandtissuepreservationwereuniformacrosstheentirecross-section.Ultrastructuralpreserva-tionwasmoderatelygoodandconsistentindeepandsuperficialregionsofthesample(Fig. 1).
To analyze traceability of myelinated axons in wbPATCOsamples, we acquired serial block-face electron microscopy(SBEM) stacks from several locations distributed widelythroughout the brain (Fig. 2a,b). No cutting problems wereapparent(Fig. 2c–eandSupplementary Video 1),thusindicating
thatepoxyinfiltrationandpolymerizationwerecompletethrough-outthesample.Todetermineaxontraceabilityasafunctionofimaging resolution, we traced the SBEM stacks at the native40-nmvoxelsizeanddown-sampledto80-nmand120-nmreso-lution(Figs. 2c and 3).
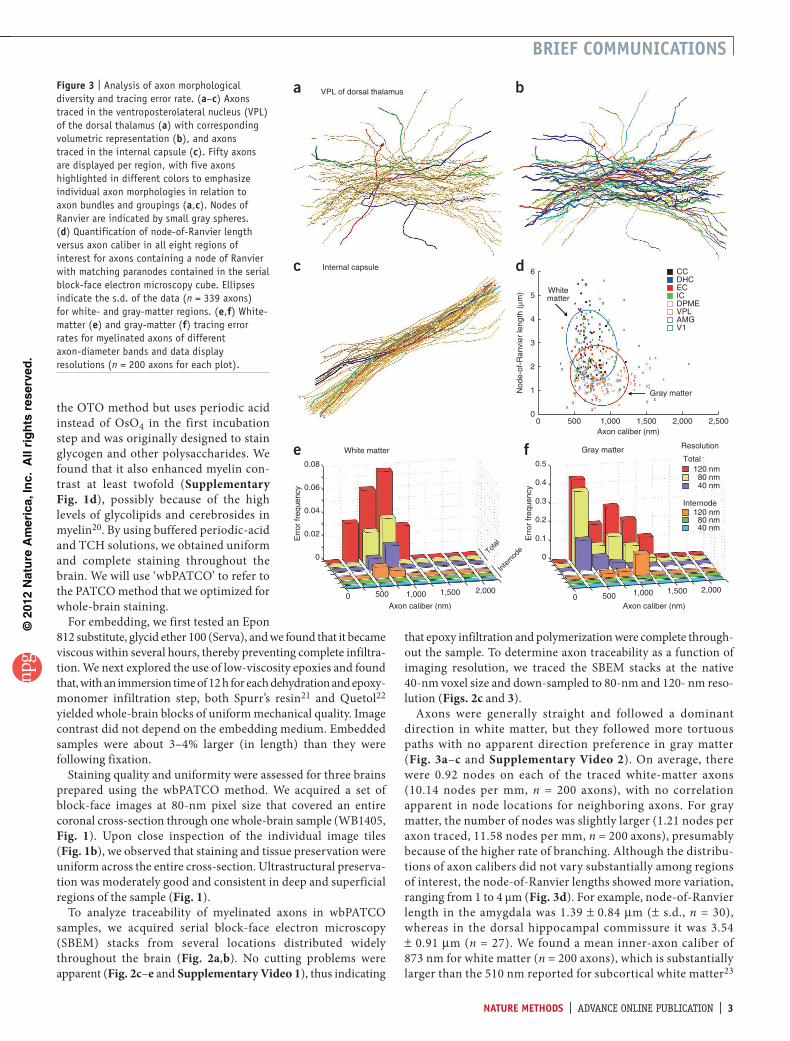
Axons were generally straight and followed a dominantdirection in white matter, but they followed more tortuouspaths with no apparent direction preference in gray matter(Fig. 3a–candSupplementary Video 2).Onaverage, therewere 0.92 nodes on each of the traced white-matter axons(10.14 nodes per mm,n = 200 axons), with no correlationapparent innode locations forneighboringaxons.Forgraymatter,thenumberofnodeswasslightlylarger(1.21nodesperaxontraced,11.58nodespermm,n=200axons),presumablybecauseofthehigherrateofbranching.Althoughthedistribu-tionsofaxoncalibersdidnotvarysubstantiallyamongregionsofinterest,thenode-of-Ranvierlengthsshowedmorevariation,rangingfrom1to4μm(Fig. 3d).Forexample,node-of-Ranvierlength intheamygdalawas1.39±0.84µm(± s.d.,n=30),whereas in thedorsalhippocampal commissure itwas3.54±0.91µm(n=27).Wefoundameaninner-axoncaliberof873nmforwhitematter(n=200axons),whichissubstantiallylargerthanthe510nmreportedforsubcorticalwhitematter23
VPL of dorsal thalamus
Internal capsule
ba
c 6
5
Nod
e-of
-Ran
vier
leng
th (
µm)
4
3
2
1
00 500 1,000
Axon caliber (nm)1,500
Gray matter
Whitematter
d CCDHCECICDPMEVPLAMGV1
2,000 2,500
Gray matter
0.5f
Total
Resolution
Internode
120 nm80 nm
120 nm80 nm
40 nm
40 nmE
rror
freq
uenc
y
Axon caliber (nm)0 500
1,500 2,0001,000
0.4
0.3
0.2
0.1
0
Axon caliber (nm)
White matter
0.08
e
0.06
0.04
Err
or fr
eque
ncy
0.02
0
500 1,50002,000
Total
Inte
rnod
e
1,000
figure � | Analysis of axon morphological diversity and tracing error rate. (a–c) Axons traced in the ventroposterolateral nucleus (VPL) of the dorsal thalamus (a) with corresponding volumetric representation (b), and axons traced in the internal capsule (c). Fifty axons are displayed per region, with five axons highlighted in different colors to emphasize individual axon morphologies in relation to axon bundles and groupings (a,c). Nodes of Ranvier are indicated by small gray spheres. (d) Quantification of node-of-Ranvier length versus axon caliber in all eight regions of interest for axons containing a node of Ranvier with matching paranodes contained in the serial block-face electron microscopy cube. Ellipses indicate the s.d. of the data (n = 339 axons) for white- and gray-matter regions. (e,f) White-matter (e) and gray-matter (f) tracing error rates for myelinated axons of different axon-diameter bands and data display resolutions (n = 200 axons for each plot).
©20
12 N
atu
re A
mer
ica,
Inc.
All
rig
hts
res
erve
d.
� | ADVANCE ONLINE PUBLICATION | nature methods
brief communications
and460nmforthecorpuscallosum24.Thisdiscrepancyfarexceeds the overall linear expansion of 3–4% seen in our sample, but it is possible that axons shrank more in theirpreparationorexpandedmoreinourpreparation,orthatthesampledareasweredifferent.
Errorratesfortracingdifferedforwhiteandgraymatterbutdidnotdependmuchonaxondiameterforaxonswithdiametersgreaterthan500nm(Fig. 3e,f).Atthe40-nmnativeresolution,tracingerrorswereconfinedtonodesofRanvier,withaboutoneerrorforevery80nodes(oneerrorper32and17nodesat80-and120-nmresolution,respectively,n=200axons)inwhitematterandoneerrorper30nodes(10and6nodesat80and120nm,n = 200 axons) in gray matter (Supplementary Table 3). At80-nmresolution,therewerestillnoerrorsininternodesegmentsforwhitematter,butoneerroroccurredforevery100mmofinternodelengthingraymatter.
We have demonstrated that the whole mouse brain can bestainedandembeddedinawaythatissuitableforultramicro-tomyandelectronmicroscopicimaging.Thecontrastisuniformandsufficient forserialblock-face imaging.Myelinatedaxonsaretraceablewithlowerrorrates.Afurtherreductioninerrorrateisexpectedifacompletemutualassignmentofparanodesisperformedonthebasisoftheirgeometricalparameters,suchasdirectionanddiameter.
At similaraxoncalibers,white-andgray-matter error ratesdiffer,possiblyowingtodifferencesintortuosity:ingraymatter,whenencounteringanodeofRanvier,thematchingparanodecannotbefoundbysimplycontinuingalongthesamedirection.
Theultrastructureinoursamplesispreservedwellenoughtopermittherecognitionofunmyelinatedprocessesandsynapses;however,lowmembranecontrastandexcessivecytosolstainingpreventthereliabletracingofunmyelinatedprocessesoverlongdistances,makingthewbPATCOmethodunsuitableformappingcompleteneuralcircuits.
Atthispointitisunclearwhatfractionoftheprojectomecanberecoveredbyfollowingonlymyelinatedaxonsbecausenotalllong-rangeaxonsaremyelinated.Themyelinationofmodula-toryprojectionsissparse(orabsent).Estimatesfromsubcorticalwhitematterintheadultmousebrainsuggestthataboutathirdofprojectionaxonsaremyelinated23.Anopenquestioniswhether,aside from dopaminergic projections, there are areas that areconnectedbyonlyunmyelinatedfibersorwhetherallinter-arealconnectionscontainamixtureofmyelinatedandunmyelinatedfibers.Ifthelatteristhecase,amapofallmyelinatedaxonsinasinglemousebrainwouldyieldarelativelycompletecatalogofallinter-arealprojections.
methodsMethodsandanyassociatedreferencesareavailableintheonlineversionofthepaper.
Note: Supplementary information is available in the online version of the paper.
acknoWledgmentsWe thank I. Sonntag and M. Helmstaedter for help with traceability analysis, S. Hillmer and U. Mersdorf for help with transmission electron microscopy, K. Briggman, S.K. Mikula and A. Scherbarth for help with staining procedures, B. Titze for help with conductive coating, J. Tritthardt for developing electronic circuits and M. Mueller for help with scanning electron microscopy–related software. We also thank the following student tracers: M. Diemer, C. Domnick, J. Hanne, P. Hofmann, A. Ivanova, H. Jakobi, A. Klein, J. Löffler, J. Nassel, J. Trendel and P. Weber. This work was supported by the Max Planck Society and the Deutsche Forschungsgemeinschaft (DFG).
author contributionsS.M. and W.D. designed the study and devised the analysis; S.M. carried out the experiments; J.B. and W.D. devised the aberration correction algorithm; S.M. analyzed the data; and S.M. and W.D. wrote the paper.
comPeting financial interestsThe authors declare competing financial interests: details are available in the online version of the paper.
Published online at http://www.nature.com/doifinder/�0.�0�8/nmeth.����. reprints and permissions information is available online at http://www.nature.com/reprints/index.html.
1. Kasthuri, N. & Lichtman, J.W. Nat. Methods �, 307–308 (2007).2. Bohland, J.W. et al. PLoS Comput. Biol. 5, e1000334 (2009).3. Tsai, P.S. et al. J. Neurosci. �9, 14553–14570 (2009).4. Sabatini, D.D., Bensch, K. & Barrnett, R.J. J. Cell Biol. �7, 19–58
(1963).5. Dalton, A.J., Kahler, H., Striebich, M.J. & Lloyd, B. J. Natl. Cancer Inst.
��, 439–461 (1950).6. Palay, S.L., McGee-Russell, S.M., Gordon, S. Jr. & Grillo, M.A. J. Cell Biol.
��, 385–410 (1962).7. Seligman, A.M., Wasserkrug, H.L. & Hanker, J.S. J. Cell Biol. �0, 424–432
(1966).8. Li, A. et al. Science ��0, 1404–1408 (2010).9. Chung, J.R. et al. Front. Neuroinform. 5, 29 (2011).10. Dempster, W.T. Am. J. Anat. �07, 59–72 (1960).11. Hagström, L. & Bahr, G.F. Histochem. Cell Biol. �, 1–4 (1960).12. Bozzola, J.J. & Russell, L.D. Electron Microscopy: Principles and Techniques
for Biologists. (Jones & Bartlett Learning, 1999).13. Hayat, M.A. Principles and Techniques of Electron Microscopy: Biological
Applications, 4th edn. (Cambridge University Press, 2000).14. Van Holde, K.E. J. Phys. Chem. 6�, 1574–1577 (1959).15. Bahr, G.F. Exp. Cell Res. 7, 457–479 (1954).16. Guha, P.C. & De, S.C. J. Chem. Soc. Trans. ��5, 1215–1218 (1924).17. De Bruijn, W.C. in Proc. 4th Eur. Reg. Conf. Electron Microsc. (ed.
Bocciarelli, D.S.) 11–65 (Rome: Tipografia Polyglotta Vaticana, 1968).18. Karnovsky, M.J. in Proc. 11th Meet. Am. Soc. Cell Biol. 146 (1971).19. Seligman, A.M., Hanker, J.S., Wasserkrug, H., Dmochowski, H. & Katzoff, L.
J. Histochem. Cytochem. ��, 629–639 (1965).20. Quarles, R.H., Macklin, W.B. & Morell, P. in Basic Neurochemistry:
Molecular, Cellular, and Medical Aspects, 7th edn. (eds. Siegel, G., Albers, R.W., Brady, S. & Price, D.) Ch. 4, 51–72 (Academic, 2006).
21. Spurr, A.R. J. Ultrastruct. Res. �6, 31–43 (1969).22. Kushida, H. J. Electron Microsc. (Tokyo) ��, 197 (1974).23. Partadiredja, G., Miller, R. & Oorschot, D.E. J. Neurocytol. ��, 1165–1179
(2003).24. Sturrock, R.R. Neuropathol. Appl. Neurobiol. 6, 415–420 (1980).

©20
12 N
atu
re A
mer
ica,
Inc.
All
rig
hts
res
erve
d.
nature methodsdoi:10.1038/nmeth.2213
online methodsAnimals used.Atotalof45adult(10-to36-week-old)wild-type(C57BL/6)malemice,maintainedata12-hdark-lightcycleunderstandardchow,wereused.Outofthese,three(10-week-old)micewereusedforwhole-brainblock-faceimagingandtraceabilityanalysis.Theremaininganimalswereusedforgeneralstaining-protocoltestingandoptimization.
Micewereanesthetizedwithisoflurane(Baxter)inhalationandkilledbytranscardiallyperfusedfixative.Onebrain(WB1405)wasusedforacquiringwhole-braincoronalblock-facemosaicsat80-nmpixelsizeforthepurposeofassessingstainingandembed-dingqualityanduniformity.Theremainingtwobrains(WB1406andWB1407)wereusedforextractingsmall(<1mm3)regionsof interest (ROIs) for SBEM imaging25. All procedures wereapprovedbythelocalanimalcareandusecommitteeandwereinaccordancewiththelawsofanimalexperimentationissuedbytheGermanfederalgovernment.
Sample preparation.Theoptimizedwhole-brainstainingpro-tocol,wbPATCO,wasperformedasfollows(themethodsusedforexploratorypreparations7,19,26–29aregiveninSupplementary Table 1).Afteranesthesia,themousewasplacedsupineandahorizontalcutwasmadeintotheupperabdomen.Firstthedia-phragmwascut,thentheribswerecutlaterallyandthechestflapwasfoldedbackusingahemostat.Theheartwasexposedandheldinplaceusingserratedcurvedforceps(MoriaMC31,FineScienceTools)whilea22-gaugecannulawascarefullyinsertedintotheleftventricleandsecuredusingananeurysmclamp(FineScienceTools).Therightauriclewaspierced,andthemousewasperfusedtranscardiallyatarateof0.5ml/swith40mlofa0.418M(10%)solutionofacrolein30(Sigma)in0.1Msodiumcacodylatebuffer(Serva),pH-adjustedto7.4withHClandchilledto2°C.Wechoseacroleinasthefixativebecausewithglutaraldehyde,butnotwithacrolein,weoccasionallysawartifactsintheformof densely stained spots inside the myelin sheath. The mousewassubsequentlydecapitated,themuscleandskintissuearoundthecraniumandthecervicalvertebraewereremovedwithsmallscissors (FineScienceTools),and, starting fromthevertebraeandworkingrostrally,thevertebraeandsmallbonefragmentswerecarefullyremovedusing#2forcepsuntil theentirebrainwasexposeddorsallyandlaterally.Duringthisprocedure,atrans-ferpipetwasperiodicallyusedtodropfixativesolutionontothebraintopreventdehydration.Thecranialnerveswerecutwithsmallscissorsbeforeweremovedthebrainandplaceditintoanacroleinsolutionforpost-fixation(48hat2°C)followedbyfive8-hrinseswith50mlof0.1Mcacodylatebuffer.Brainsweretheneitherusedforwhole-brainstaining,hemispherectomizedwithascalpelbladeandusedforhemispherestainingordicedintosmallcubes(<1mm3)forsmall-samplestaining.
Forallimmersionstepsthesampleswerekeptinclosedcen-trifugetubes(Sarstedt),whichwerediscardedaftereachstainingstep.Smallsampleswereincubatedin1mlofstainingsolutionfor90minin2-mlcentrifugetubes(Sarstedt)onarotator.Rinsecyclesconsistedofthree10-minimmersionsin2mlof0.1Mcacodylate,pH7.4,at20°C.Embeddingofsmallsampleswasperformedas described below except that volumes were 2 ml and dura-tionswere30mineach.Hemisphereswereincubatedin12.5mlof stainingsolution for24h in15-mlcentrifuge tubesduringgentleagitation.Rinsecyclesbetweensuccessivestainingsteps
consistedoffour4-himmersionsin25mlof0.1Mcacodylate,pH7.4,at20°C.Embeddingofhemisphereswasperformedasdescribedbelowexceptthatvolumeswere25mlanddurationswere6heach.Wholebrainswereincubatedin25mlofstainingsolutionfor48hin50-mlcentrifugetubesduringgentleagitation.Rinsecyclesbetweensuccessivestainingstepsconsistedoffour8-himmersionsin50mlof0.1Mcacodylate,pH7.4,at20°C.
ForthewbPATCOstain,thewholebrainwasfirstplacedintoa solution containing 90 mM periodic acid (Sigma) in 0.1 Mcacodylatebuffer(Serva)atpH7.4,at2°Cfor48h.Itwasthenrinsedfourtimes,immersedfor48hinasolutionof100mMTCH (Sigma) in 0.1 M cacodylate buffer at pH 7.4, held at50 °C, rinsed four timesand finally immersed for48h intoasolutionof80mM(2%)OsO4(ElectronMicroscopySciences)inwaterat20°C.
For embedding, brains were first dehydrated by immersingthemsequentiallyfor12heachinaseriesofacetone-watermix-tures (50%, 75%, 100% and again 100% acetone) followed byepoxy-monomer infiltrationby immersion(12h,25mleach)intomixturesofacetoneandepoxyresin(50%,100%and100%epoxy)withgentleagitation.Alldehydrationandinfiltrationstepswereperformedat20°C.EpoxyresinswereeitherSpurr’s21,usingERL-4221asareplacementforERL-4206,orQuetol22,andcon-sistedofthefollowingformulations:forSpurr’s,10gERL-4221(Serva),5gDER736(Serva),26gNSA(ElectronMicroscopySciences)and0.2gDMAE(Serva);forQuetol,10gQuetol651(ElectronMicroscopySciences),20gNSA,0.15gDMAE.Thebrainwasthenplacedintoacustom-maderectangularsiliconemoldofdimensions6mm×8.5mm×18mmor7mm×10mm×18mmandcuredat70°Cforatleast24h.WeusedSpurr’sforembeddingWB1406andQuetolforWB1405andWB1407.
Whole-brain block-face imaging.Onesample(WB1405)wasused for acquiring whole-brain coronal block-face mosaics at80-nmpixelsizetoassessstainingandultrastructuralpreserva-tion.Excessepoxyand theanteriorportionof thebrainwereremovedusinganEMsampletrimmer(EMTrim,Leica).Thecross-sectionalsurfacewasthensmoothedusingan8-mm-widediamondknife(JumboHisto,Diatome)ata3.5°–clearance-anglesettingonthemicrotome,advancesof70–100nmbetweencutsand1.0mm/scuttingspeed.Thesmoothedblockfacewasthencoated with a 5-nm-thick layer of platinum-carbon using anelectron-beam evaporator (MED 20, Bal-Tec) to allow chargedissipationduringimaging.
Thesmoothedcross-sectionalsurfacewasnotplanarfortworeasons.First,thesamplemovesinanarcontheultramicrotome,whichleadstoacylindricalshape;andsecond,thesamplecon-tinuestoshrinkundervacuumslightlybutunevenlyaftercuttingandcoating.Thismeans the focushas tobecorrectedduringmosaic acquisition. To provide approximately correct startingvaluesfortheautofocusalgorithmusedduringtheactualacqui-sition,wedeterminedthecorrectworkingdistance(WD)forallpointslyingonanevenlyspaced(1-mm)gridbymanualfocusing,andwetheninterpolatedbetweenpointswithcubicsplines.Next,weautomaticallyacquiredalltilesneededforthemosaicusingacustom-writtenMatlab(MathWorks)scriptthatcontrolledthescanningelectronmicroscopy(SEM,Merlin,Zeiss)andtheexter-nalscangenerator(Atlas,Fibics/Zeiss).Priortotheacquisitionofeachtile,thescript,afterdeterminingwhichpartofthetilehad
©20
12 N
atu
re A
mer
ica,
Inc.
All
rig
hts
res
erve
d.
nature methods doi:10.1038/nmeth.2213
thebestcontrast,calledacustomaberration-correctionproce-dure31forbothWDandastigmatism.
Imageswereacquiredusing5.0-keVlandingenergy,1-nAbeamcurrent,2-µspixeldwelltimeand6.0-mmWD.Secondaryelec-tronsweredetectedusingthebuilt-inEverhart-Thornley(ET)detector,withthegridvoltagesetto400V.Topreventsecondaryelectronsfrombeingdrawnintothecolumn,weinsertedacus-tomaperture(diameterof2mm)intotheendcap.Thetilesizewas4,000×4,000pixels,whichresultsina330-µmfield-of-view.Substantiallylargertilescouldnotbeusedwithoutincurringalossofresolutionat the imagecorners.Weuseda5%overlapbetweentiles,whichwasenoughtocalculatetileoffsetswithsub-pixelprecisionbycross-correlation.Theoffsetswerethenusedinaglobalalignmentandstitchingprocedurebasedoniterativelyminimizingtheweighted(bythereciprocalresiduals)sumofthesquaredresidualshifts32,33.Thedatasetcomprised975tilesthatwerecombinedintoafinalmosaic153,000×98,000pixelsinsize.AllimageprocessingwasperformedusingcustomMatlabcode.Thefinalmosaicisavailableforonlineviewing(http://homes.mpimf-heidelberg.mpg.de/~smikula/blockface/)usingacustomjavascript/dHTMLinterface34.
TEM imaging.Myelin-sheathandsynapticultrastructurewereassessedathighresolutionbytransmissionelectronmicroscopy(TEM). For this, a small cube from the dorsolateral striatumwasdissectedoutfromanembeddedwhole-brainsamplewithascalpelbladeandmountedonametalstub.Then,70-nm-thicksections were cut using an ultramicrotome (Ultracut, Leica),mountedonFormvar-coatedcopperTEMgrids(PlanoGmbH),post-stainedin2%(50mM)aqueousuranylacetate26andleadcitrate35 for10and5mineach,respectively,andimagedonatransmissionelectronmicroscope(JEM1400,JEOL)at80-keVelectronenergy,withimagesrecordedonaCCDcamera.
Serial block-face imaging.ForSBEMimaging,atotalofeightROIs were selected from WB1406 and WB1407. The randomselection of a white- or gray-matter ROI was performed bygeneratingpseudo-random3-tuplesuntil thebregma-referredcoordinatescorrespondingtothe3-tuplepointedto,respectively,awhite-orgray-matterlocationinsideofthebrain,asdeterminedbyconsultingthePaxinosmouseatlas36.Thiswasrepeateduntilcoordinates forallROIswereobtained.Wethen trimmedthesamplecoronally,startingfromtheanteriorendofthebraintotheapproximatelocationofthemostanteriorROI,smoothedandimagedtheblockface.OncetheROIhadbeenlocatedintheSEMusingvisualcues,itwasrepeatedlyimagedwithhighbeamcurrenttomarktheROIontheblockface.ThismarkwasthenusedtovisuallyidentifytheROIinadissectingscope,andasmallvolumeofsampleattheROIwascutoutwithascalpelblade,mountedonastubandimagedwithSBEMonaQuantaFEG200(FEI).Thewhole-brain samplewas thenretrimmed to thenextROIandtheprocesswasrepeated.ForeachROI,adatasetofapproxi-mately(80µm)3wasacquiredat40-nmisotropicvoxelsize.SBEMimagingparameterswere2.8-keVprimarybeamelectronenergy,155-pAbeamcurrent,8-µspixeldwell time,6.0-mmWDand20-Pawatervaporpressure.Backscatteredelectronsweredetected
using a custom silicon-diode detector (AXUV, InternationalRadiationDetectors)combinedwithacustomcurrentamplifier.
Traceability analysis.Foraxontraceabilityanalysis,SBEMdatasets(2,048×1,768×1,800voxels),originallyacquiredat40nm,werealsopreparedasdatasetsdown-sampledto80and120nmbyselecting,respectively,everysecondorthirdvoxelinx,yandz.Using a custom Matlab script, data sets were split into cubes(128 × 128 × 128 voxels) as needed for the Knossos software(www.knossostool.org/).UsingKnossos,50axonswererandomlychosenamongthosepassingthroughthecentralregionofthe40-nm-resolutiondataset.Eachofthoseaxonswasindependentlytracedbyfiveundergraduatetracersateachresolution.
Toquantifymyelinated-axontraceability,tracingerrorsweredetectedbymanuallycomparingeach individualaxontracingtothe40-nmconsensustracingofthesameaxon.Theconsen-sustracingwasthelargestsubsetoftracings(atleasttwo)that,inbothtracingdirections,agreedwitheachotheruntiltheyeitherreachedthesurfaceoftheSBEMdatasetoranodeofRanvierlocatedwithin10µmofthenearestdatasetsurface.ThelatterconditionaccountedmainlyforcasesinwhichanodeofRanvierextendedbeyondthedataset.Becausetheunmyelinatedstretchofaxonatanodehadlowcontrast,tracingreliedheavilyonfind-ingthematchingparanode.Ifnosuchnodecouldbefoundorifnotwotracersagreedonwhichparanodetoselect,thecorrectparanodewaslikelyoutsideofthedataset.Otherpossibilitiesarethatthetracinghadreachedaterminalbranchortheinitialsegment,bothofwhichareunmyelinated.
Althoughit istheoreticallypossibletoendupwithtwosetsof two tracings for each axon that are consistent within butinconsistentbetweensets,thiswasneverobserved.ErrorswereclassifiedbywhetherornottheyoccurredatnodesofRanvier.Consensus tracings of collaterals were not included in theanalysisbecausetheywere infrequent(3.5%oftotal tracings),occurringmainlyinV1.Wecomputederrorratespermillimeterbydividingthetotalnumberoferrorsbythecombinedtotalpathlengthsfortherespectiveaxons,usingthemedianpathlengthsoftheirrespective40nmtracings.Theaxondiameterwascomputedusingthemeanoftenmeasurementsrandomlyselectedalongtheinternodesoftheaxon.
25. Denk, W. & Horstmann, H. PLoS Biol. �, e329 (2004).26. Terzakis, J.A. J. Ultrastruct. Res. ��, 168–184 (1968).27. Walton, J. J. Histochem. Cytochem. �7, 1337–1342 (1979).28. Willingham, M.C. & Rutherford, A.V. J. Histochem. Cytochem. ��, 455–460
(1984).29. Deerinck, T.J. et al. Microsc. Microanal. �6 (suppl. 2), 1138–1139 (2010).30. Luft, J.H. Anat. Rec. ���, 305 (1959).31. Binding, J., Mikula, S. & Denk, W. Microsc. Microanal. (in the press).32. Holland, P.W. & Welsch, R.E. Commun. Stat. Theory Methods 6, 813–827
(1977).33. Baumann, M. et al. in Proc. 6th PIMS Ind. Problem Solving Workshop
(ed. Macki, J.) Ch. 1, 1–25 (PIMS, 2002).34. Mikula, S., Trotts, I., Stone, J.M. & Jones, E.G. Neuroimage �5, 9–15
(2007).35. Reynolds, E.S. J. Cell Biol. �7, 208–212 (1963).36. Franklin, K.B.J. & Paxinos, G. The Mouse Brain in Stereotaxic Coordinates
3rd edn. (Academic, 2008).
Staining and Embedding the Whole Mouse Brain for
Electron Microscopy
Shawn Mikula, Jonas Binding, Winfried Denk
Supplementary Item Title or Caption
Supplementary Figure 1 Comparison of white matter in hemispheres stained using different long-
incubation (24 hr) protocols
Supplementary Table 1 Staining protocols
Supplementary Table 2 Outcomes for various staining protocols
Supplementary Table 3 Nodal and internodal error rates for white and gray matter at different
resolutions
Supplementary Protocol Step-by-step whole-brain sample preparation protocol
Nature Methods: doi:10.1038/nmeth.2213

Supplementary Figure 1
Supplementary Figure 1. Comparison of white matter in hemispheres stained using different long-incubation (24 hr) protocols.
(a) Osmium tetroxide (Os) incubation. (b) Osmium tetroxide incubation followed by uranyl-acetate enhancement (Os->UA). (c)
Osmium tetroxide, followed by thiocarbohydrazide, and then by a second osmium tetroxide incubation (OTO). (d) Periodic acid,
followed by thiocarbohydrazide, and then by osmium tetroxide (wbPATCO). See text for details. Insets: magnified sub-regions.
Nature Methods: doi:10.1038/nmeth.2213
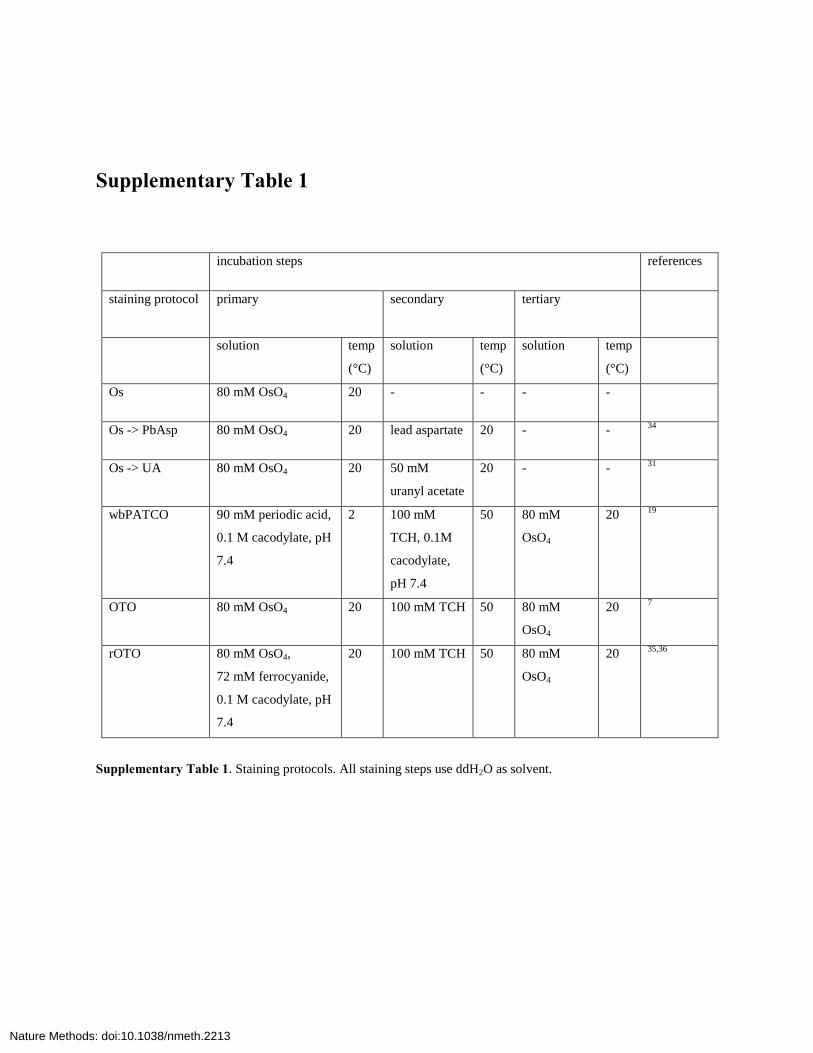
Supplementary Table 1
incubation steps references
staining protocol primary secondary tertiary
solution temp
(°C)
solution temp
(°C)
solution temp
(°C)
Os 80 mM OsO4 20 - - - -
Os -> PbAsp 80 mM OsO4 20 lead aspartate 20 - - 34
Os -> UA 80 mM OsO4 20 50 mM
uranyl acetate
20 - - 31
wbPATCO 90 mM periodic acid,
0.1 M cacodylate, pH
7.4
2 100 mM
TCH, 0.1M
cacodylate,
pH 7.4
50 80 mM
OsO4
20 19
OTO 80 mM OsO4 20 100 mM TCH 50 80 mM
OsO4
20 7
rOTO 80 mM OsO4,
72 mM ferrocyanide,
0.1 M cacodylate, pH
7.4
20 100 mM TCH 50 80 mM
OsO4
20 35,36
Supplementary Table 1. Staining protocols. All staining steps use ddH2O as solvent.
Nature Methods: doi:10.1038/nmeth.2213
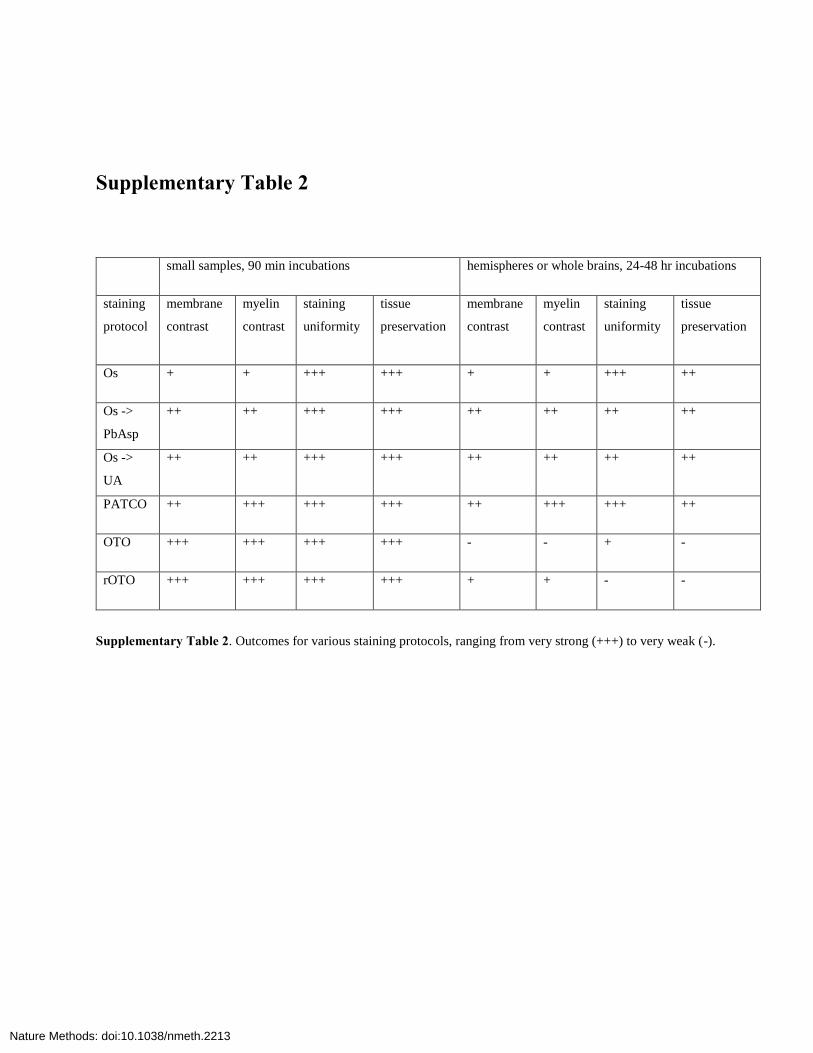
Supplementary Table 2
small samples, 90 min incubations hemispheres or whole brains, 24-48 hr incubations
staining
protocol
membrane
contrast
myelin
contrast
staining
uniformity
tissue
preservation
membrane
contrast
myelin
contrast
staining
uniformity
tissue
preservation
Os + + +++ +++ + + +++ ++
Os ->
PbAsp
++ ++ +++ +++ ++ ++ ++ ++
Os ->
UA
++ ++ +++ +++ ++ ++ ++ ++
PATCO ++ +++ +++ +++ ++ +++ +++ ++
OTO +++ +++ +++ +++ - - + -
rOTO +++ +++ +++ +++ + + - -
Supplementary Table 2. Outcomes for various staining protocols, ranging from very strong (+++) to very weak (-).
Nature Methods: doi:10.1038/nmeth.2213
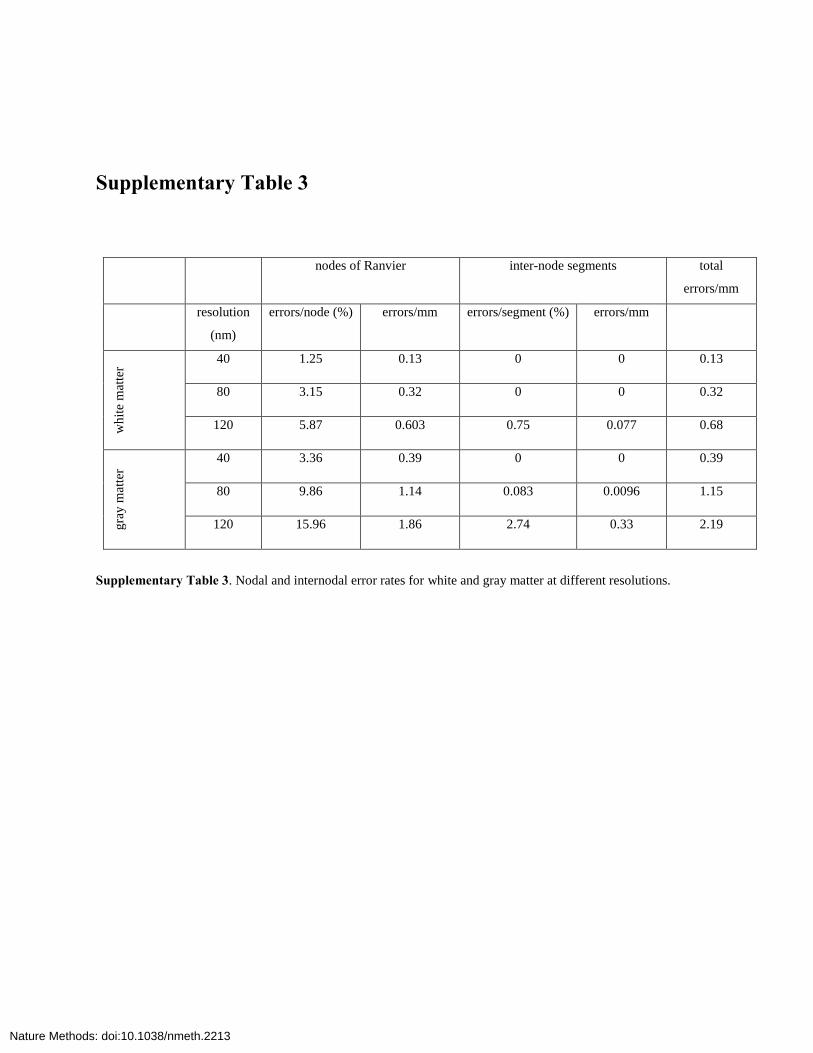
Supplementary Table 3
nodes of Ranvier inter-node segments total
errors/mm
resolution
(nm)
errors/node (%) errors/mm errors/segment (%) errors/mm
wh
ite
mat
ter
40 1.25 0.13 0 0 0.13
80 3.15 0.32 0 0 0.32
120 5.87 0.603 0.75 0.077 0.68
gra
y m
atte
r
40 3.36 0.39 0 0 0.39
80 9.86 1.14 0.083 0.0096 1.15
120 15.96 1.86 2.74 0.33 2.19
Supplementary Table 3. Nodal and internodal error rates for white and gray matter at different resolutions.
Nature Methods: doi:10.1038/nmeth.2213

Supplementary Protocol
Materials
Reagents
Sample Adult whole mouse brain.
Staining and fixation Isoflurane (Baxter)
Cacodylate buffer (Serva)
Acrolein (Sigma)
Periodic acid (Sigma)
Osmium tetroxide (Serva)
TCH (Sigma, cat. no. T-2137)
Dehydration and infiltration Water (double-distilled)
Acetone (Sigma)
Embedding o ERL-4221 (Serva)
o DER 736 (Serva)
o NSA (Electron Microscopy Sciences)
o DMAE (Serva)
Or
o Quetol 651 (Electron Microscopy Sciences)
o NSA (Electron Microscopy Sciences)
o DMAE (Serva)
Equipment
Perfusion #2 forceps (Fine Science Tools)
Coarse and fine scissors (Fine Science Tools)
Nitrile gloves
Plastic tray (generic)
Nature Methods: doi:10.1038/nmeth.2213
Hemostat (Fine Science Tools)
Serrated curved forceps (Moria MC31, Fine Science Tools)
22-gauge cannula with syringe attachment (use a needle and remove the sharp tip)
Aneurysm clamp (Fine Science Tools)
40 ml syringe
Transfer pipet (generic)
Razor blade (VWR)
50 ml centrifuge tubes
Lab rocker (VWR)
EM processing and embedding Centrifuge tubes (Sarstedt)
Embedding oven
Custom made silicone molds with dimensions 7 mm x 10 mm x 18 mm
Block trimming Leica EM trimmer
Reagent setup
Buffer Add 4.28 g sodium cacodylate per 50 ml water, and bring volume up to 100 ml with water, to get a final
concentration of 0.2 M sodium cacodylate buffer. Adjust the pH to 7.4 with hydrochloric acid and store in
the fridge. Add equal parts water to make up 0.1 M buffer as needed.
Fixative Add 20% acrolein to 50 ml of 0.2 M sodium cacodylate buffer and bring volume up to 100 ml with water.
Osmium tetroxide
Periodic acid Add 90 mM periodic acid to 0.1 M cacodylate buffer, as prepared above.
Thiocarbohydrazide Add 100 mM thiocarbohydrazide to 0.1M cacodylate buffer, as prepared above.
Procedure
Fixation by perfusion -- Time: < 5 min After anesthesia, place the mouse supine in a plastic tray and make a horizontal cut into the upper
abdomen. Cut into the diaphragm, then cut the ribs laterally. Fold the chest flap back using a hemostat.
The heart should then be exposed with visible auricles. Hold the heart in place gently using serrated,
curved forceps. Insert a 22-gauge cannula attached to the syringe into the left ventricle and secure it in
Nature Methods: doi:10.1038/nmeth.2213

place using an aneurysm clamp. Pierce or cut the right auricle using a needle or a pair of fine scissors.
Begin perfusing the mouse using the syringe at a rate of 0.5 ml / sec with 40 ml of a 0.418M (10%)
solution of acrolein in 0.1M sodiuim cacodylate buffer. When the fixative has all flowed through the
mouse, carefully dissect out the brain using scissors and forceps. Proceed to the post-fixation step.
Dissection – Time: 10 min Decapitate the mouse and remove the muscle and skin tissue around the cranium and cervical vertebrae
with small scissors and forceps. Remove skull bone with #2 forceps beginning at the back of the skull and
moving rostrally until the entire surface of the brain is exposed. Periodically drop fixative solution onto
the surface of the brain using a transfer pipet to prevent tissue dehydration and to facilitate quick fixation.
Invert the brain and, using small scissors, cut the cranial nerves to separate the brain from the remaining
skull tissue.
Post-fixation and rinses -- Time: 88 hrs Place the brain into 50 ml of acrolein solution (the same fixative used in the transcardial perfusion) for
post-fixation for 48 hrs at 2°C. Rinse the brain five times for eight hours using 50 ml of 0.1M cacodylate
buffer. If the brain is to be used for small samples, dice the brain into small cubes using a razor blade
during the rinses. For the procedure using small samples, shorten the staining times according to the
manuscript. Following is the procedure for whole brain staining.
Staining– Time: 208 hrs (between 8 and 9 days) 1. Place the whole mouse brain in a 50 ml tube containing 25 ml of 90 mM periodic acid in 0.1M
cacodylate buffer for 48 hrs at room temperature. Gently agitate by placing the tube on a
laboratory rocker on a slow speed.
2. Rinse the brain four times for eight hours each in 50ml of caocdylate buffer at room temperature,
as prepared above.
3. Transfer the brain to a fresh container and, for 48 hrs, immerse it in a solution of 100 mM
thiocarbohydrazide in 0.1 M cacodylate buffer at 50°C.
4. Rinse the brain again four times in buffer for eight hours each and change containers.
5. Immerse the brain in a solution of 2% osmium tetroxide in water at room temperature for 48 hrs.
6. Proceed to the embedding step.
Embedding – Time: 120 hrs (5 days)
Dehydration Step the tissue through a series of water / acetone mixtures (50%, 75%, 100%, 100% acetone) of 50 ml
each, with each step lasting 12 hrs at room temperature.
Infiltration Infiltrate the epoxy resin with 12 hr steps of 25 ml each (50%, 100%, 100% epoxy) with gentle agitation
on a lab rocker at room temperature.
For Spurr’s resin:
10g ERL-4221
5g DER 736
26g NSA
Nature Methods: doi:10.1038/nmeth.2213

0.2g DMAE
For Quetol resin:
10g Quetol 651
20g NSA
0.15g DMAE
Place the brain into a custom made silicone mold and cure in a laboratory oven at 70°C for at least 24 hrs.
When the block is hard, trim it according to desired dimensions with the EM Leica trimmer.
Nature Methods: doi:10.1038/nmeth.2213