Spruill Brent Diss edit DH (2) 8 Accepted Changes Updated Verison Edit (1) with approved abstract...
383
Walden Universit y College of Health Sciences This is to certify that the doctoral dissertation by Brent Spruill has been found to be complete and satisfactory in all respects, and that any and all revisions required by the review committee have been made. Review Committee Dr. Chester Jones, Committee Chairperson, Public Health Faculty Dr. Richard Jimenez, Committee Member, Public Health Faculty Dr. Robert DiLaura, University Reviewer, Public Health Faculty Chief Academic Officer
Transcript of Spruill Brent Diss edit DH (2) 8 Accepted Changes Updated Verison Edit (1) with approved abstract...

Walden University
College of Health Sciences
This is to certify that the doctoral dissertation by
Brent Spruill
has been found to be complete and satisfactory in all respects,
and that any and all revisions required by
the review committee have been made.
Review Committee
Dr. Chester Jones, Committee Chairperson, Public Health Faculty
Dr. Richard Jimenez, Committee Member, Public Health Faculty
Dr. Robert DiLaura, University Reviewer, Public Health Faculty
Chief Academic Officer

Eric Riedel, Ph.D.
Walden University
2014
Abstract
Association Among Bullying, Excessive Television Watching,
and Physical Activity Among Adolescents
by
Brent Spruill
MBA, American Intercontinental University, 2007
BA, American Intercontinental University, 2006
Dissertation Submitted in Partial Fulfillment
of the Requirements for the Degree of
Doctor of Philosophy
Public Health
Walden University
June 2014

Abstract
Increasing obesity rates among adolescents in the State of
Massachusetts are of concern to public-health professionals.
High bullying rates may contribute to obesity. Guided by
Maslow’s safety component and Bandura’s social-cognitive
theory, this study investigated a relationship between hours
spent television watching, bullying, and meeting physical-
activity guidelines among Massachusetts adolescents. The
association between the dependent variable—physical
inactivity—and the independent variables—hours spent
watching television and bullying—was explored using data
from the 2009 Massachusetts Youth Risk Behavior Survey.
Participants were 2,601 Massachusetts adolescents aged 13 to
18. Statistical analysis included chi-square, the Kruskal–
Wallis Test, Mann–Whitney U, and Spearman correlation.
Results revealed a significant negative correlation between
television watching and physical activity, suggesting that
the more hours students spent watching television, the less
active they tended to be. The Kruskal–Wallis test showed a

significant difference in hours of television watching by
level of physical activity. To determine where the
statistical differences lay, 3 pairwise Mann–Whitney U
tests were conducted; 2 were shown to be statistically
significant. Physical activity and bullying were
significantly associated. The results of the Mann–Whitney U
test were significant, indicating that levels of activity
for students who were not bullied were higher than those for
students who were bullied. The social-change potential of
this study is a better understanding of the relationship
between bullying and physical inactivity among public health
professionals in an increased effort to remove barriers to
physical inactivity, help limit bullying, and increase
health and welfare of adolescents.

Association Among Bullying, Excessive Television Watching,
and Physical Activity Among Adolescents
by
Brent Spruill
MBA, American Intercontinental University, 2007
BA, American Intercontinental University, 2006
Dissertation Proposal Submitted in Partial Fulfillment
of the Requirements for the Degree of
Doctor of Philosophy
Public Health, Specialization in Community Health
Walden University
June 2014

Dedication
I would like to dedicate the completion of my
dissertation to my wife Maureen, son Joshua, son Aaron, son
Bryan, son Shawn, and granddaughter Nicole for helping me
finish the journey, with their support and financial
backing. I would also like to thank my deceased brother
Brian for motivating me to be all I can be. I would like to
thank veterans of the Army and Air Force for helping me
complete my dissertation. I would also like to thank our
Lord and Savior Jesus Christ for guiding me along the way.

Acknowledgement
I would like to acknowledge the completion to several
individuals who have helped me along the way. I would like
to thank Dr. Chester Jones (chairperson), Dr. Richard
Jimenez (methods expert), Dr. Robert DiLaura (university
research reviewer), Sue and John Morris (editors), Dr. James
Lani, (statistical mentor), Kelsey Bain (quantitative
expert), and Jeanie Glazer (Biostatistician expert and
quantitative expert) for guiding and helping me present a
quality dissertation.

Table of Contents
List of Tables..........................................viii
List of Figures............................................x
List of Acronyms..........................................xi
Chapter 1: Introduction To The Study.......................1
Background..............................................1
New Physical-Activity Guidelines........................4
Physical Inactivity...................................4
Physical Safety.......................................7
New Excessive Television Watching Guidelines...........11
Excessive Television Watching........................11
Problem Statement......................................13
Purpose of the Study...................................14
Research Question......................................14
Theoretical Base.......................................15
Nature of the Study....................................17
Definition of Terms....................................19
Assumptions, Limitations, Scope, and Delimitations.....22
Assumptions..........................................22

Scope................................................23
Delimitations........................................23
Limitations..........................................23
Strengths............................................25
Significance of Study..................................25
Summary................................................26
Chapter 2: Literature Review..............................28
Introduction...........................................28
Review of Past Studies.................................28
Literature Search Strategy.............................30
Theoretical Base.......................................31
Key Variables or Concepts..............................38
Inactivity Among Massachusetts Adolescents...........38
Bullying and Violence Among Massachusetts Adolescents
.....................................................40
Sampling Strategy....................................40
Measurements.........................................41
Results..............................................42
Physical Activity and Inactivity.......................43

Physical Activity....................................43
Defining Inactivity..................................44
Association of Physical Activity to Inactivity.......44
Consequences of Inactivity.............................47
The Relationship Between Type-2 Diabetes and Inactivity
.....................................................47
Cardiovascular Disease Among Adolescents.............48
Stroke as an Indicator of Inactivity.................51
Inability to Pass Military Fitness Entrance Exams....52
Mental Health Issues May or May Not be a Consequence of
Inactivity...........................................55
Causes of Inactivity...................................60
Introduction.........................................60
Excessive Television Watching Contributes to Inactivity
.....................................................60
Physical Activity, Inactivity, and Socioeconomic Status
.....................................................64
Adolescent’s Inactivity and Parent’s Working Hours Have
Shown Association....................................65

Bullying...............................................67
Bullying Among Adolescents Introduced................67
Defining Bullying....................................68
Relationship Between Traditional and Electronic
Bullying.............................................70
Bullying and Victimization Among Minorities are
Increasing...........................................76
Psychological Issues From Bullying...................79
Quantitative Method....................................80
Measurements.........................................80
Results..............................................81
Qualitative Method.....................................82
Discussion...........................................82
Bullying Victims Who are Depressed are More Likely to
be Inactive..........................................83
Causes.................................................86
Peer Victimization...................................86
Parents Working Long Hours and No Supervision........91
Peer Pressures or Influence..........................92

Family Dysfunction and Lack of Cohesion and Structure
May Lead to Bullying Behaviors and Violence..........95
Relationship Between Bullying and Violence.............98
Bullying and Violence Are Related....................98
Minorities’ Injuries, Physical Fighting, Homicide, and
Suicide Rates are a Public Health Concern Among
Adolescents.........................................102
Life Expectancy, Injuries, and Rising Healthcare Costs
....................................................107
Causes of Being Bullied With a Weapon.................109
Sample Strategy.....................................109
Measurements........................................110
Results.............................................110
Discussion..........................................111
Youth Violence, Aggression, and Bullying..............112
Sampling Strategy...................................113
Measurements........................................113
Outcome Variable Measures...........................115
Low-Income Families.................................118

Safety and Bullying...................................119
Environmental Factors...............................119
Safe Places to Play.................................125
Analysis............................................126
Results.............................................127
Summary.............................................128
Excessive Television Watching.........................130
Defining Excessive Television Watching..............130
Combined Factors of Excessive Television Watching...130
Bullying and Television Watching....................134
Consequences..........................................138
Cardiovascular Disease Among Adolescents and Excessive
Television Usage....................................138
Type-2 Diabetes.....................................138
Low Academic Performance and Excessive Television
Watching............................................139
Summary of Literature Review..........................143
Chapter 3: Methodology...................................146
Research Design.......................................146

Population............................................148
Introduction to the Target Population...............148
Targeted Population.................................148
Eligibility.........................................149
Characteristics of the Study Population.............149
Variables in the Database...........................149
Sampling Method and Sampling Procedure................150
Sampling Method.....................................150
Sampling Procedure..................................150
Sampling Frame: The Available Data From the Original
Study...............................................152
Sample Size.........................................152
Instrumentation and Measurements......................155
Instrument..........................................155
Defending Survey Analysis...........................160
Survey Issues.......................................161
Measurement.........................................161
Controlled Variables..................................161
Race................................................161

Age.................................................162
Gender..............................................162
Grade...............................................162
Independent Variables.................................162
Bullying............................................162
Excessive Television Watching.......................163
Dependent Variable....................................163
Massachusetts Adolescent Inactivity.................163
Inactivity..........................................163
Data-Analysis Plan....................................164
Data Collection.....................................164
Software Used.......................................164
Research Question.....................................164
Hypotheses............................................165
Analysis..............................................165
Threats to Validity...................................166
External-Validity Threats...........................166
Internal-Validity Threats...........................167
Confidentiality and Participant Protection............168

Summary...............................................169
Chapter 4: Results.......................................170
Introduction..........................................170
Results...............................................170
Data Collection.....................................170
Descriptive Statistics..............................171
Research Question 1.................................174
Research Question 2.................................178
Summary...............................................181
Chapter 5: Interpretation and Discussion.................185
Introduction..........................................185
Interpretation of the Findings........................185
Inactivity..........................................185
Bullying............................................186
Excessive Television Watching.........................188
Theoretical Framework...............................190
Discussion..........................................191
Limitations...........................................192
Recommendations.......................................194

Social-Change Implications............................195
Conclusion............................................196
References...............................................198

List of Tables
Table 1. Inactive Ninth- Through 12th-Grade Adolescents
in Massachusetts and the United States.................4
Table 2. Ninth- Through 12th-Grade Adolescents in
Massachusetts and the United States Who Experienced
Bullying...............................................8
Table 3. Excessive Television Watching Ninth- Through
12th-Grade Adolescents in Massachusetts and the United
States................................................12
Table 4. Adjusted Odds Ratios for Middle School Bullies
and Victims...........................................42
Table 5. Frequencies and Percentages for Student
Demographics (N =2,601)..............................172
Table 6. Mean and Standard Deviation for Student Weight..173
Table 7. Frequencies and Percentages for Level of
Activity, Hours Watching TV, and Bullying............173
Table 8. Summary of the Statistical Analyses.............174
Table 9. Spearman’s Correlation Between Hours Spent
Watching TV and Physical Activity....................174

Table 10. Kruskal–Wallis Test for Levels of Physical
Activity by Hours of TV Watched......................175
Table 11. Mann–Whitney U on Physical Activity by Hours of
TV Watched (Less Than One vs. One to Two)............175
Table 12. Mann–Whitney U on Physical Activity by Hours of
TV Watched (Less Than One vs. Three or More).........176
Table 13. Mann–Whitney U on Physical Activity by Hours of
TV Watched (One to Two vs. Three or More)............176
Table 14. Ordinal Regression With Independent Variables
Predicting Physical Activity.........................178
Table 15. Chi-Square Results for Physical Activity and
Bullying.............................................180
Table 16. Mann–Whitney U of Physical Activity Versus
Bullying.............................................181

List of Figures
Figure 1. Self-perception theory postulates that an
individual’s behavior is determined by his or her
self-perception.......................................32
Figure 2. Social-cognitive theory postulates that through
observation and motivation an individual may change
behavior..............................................35

List of Acronyms
AAP American Academy of Pediatrics
ADHD attention deficit hyperactivity disorder
AOR adjusted odds ratio
BMI body-mass index
CDC Centers of Disease Control and Prevention
CVD cardiovascular disease
DHHS U.S. Department of Health and Human Services
FAP Fitness Aptitude Program
HBSC Health Behavior in School-Aged Children
HDL high-lipid density lipid protein
IRB Institutional Review Board
MDPH Massachusetts Department of Public Health
MPA moderate physical activity
NLYS National Longitudinal Survey Study
OR odds ratio
SCT social-cognitive theory
SES socioeconomic status
VPA vigorous physical activity

WHO World Health Organization
YRBS Youth Risk Behavior Survey
YRBSS Youth Behavioral Risk Surveillance System

1Chapter 1: Introduction to the Study
Increasing obesity rates among adolescents in the State
of Massachusetts are causes of concern. Low-income
neighborhoods with much crime and bullying may contribute to
adolescents being overweight or obese because adolescents
may feel unsafe (Centers for Disease Control and Prevention
[CDC], 2010b). These feelings could lead to reduced physical
activity and increased sedentary behaviors including
television viewing and video gaming. In this study, I
examined the relationship between excessive television
watching and bullying among Massachusetts adolescents and
levels of inactivity, measured against recommended levels by
the CDC. Identification of significant association between
these variables could lead to increased efforts to provide
safer environments to improve levels of physical activity
and thereby decrease the incidence of obesity among
adolescents in the urban environment.
The social-change component of this study is intended
to create knowledge and provide assistance to the targeted

2school districts where barriers and enablers may increase
childhood-obesity prevalence and sedentary behaviors. The
background of the study, the problem statement of the study,
the purpose of the study, the nature of the study, and the
research questions with hypotheses will be reviewed. In
addition, the theoretical base or conceptual framework of
the study, along with operational definitions, assumptions,
limitations, scope, delimitations, the significance of the
study, and an introduction to other chapters are presented.
Background
Obesity rates for adolescents are increasing in
Massachusetts. According to the Massachusetts Department of
Public Health (MDPH, 2007) website, adolescent obesity rates
have doubled in nearly 17 years. Obesity rates among
minorities in Massachusetts have increased even more
significantly. Hispanic and African American adolescents
show increases of 23% and 21% in obesity, respectively,
compared to 14% for non-Hispanic White adolescents (MDPH,
2007). An examination of the latest National Health and

3Nutrition Examination Survey (2008) showed that from the
years 1963 to 1970 and 2003 to 2004, national obesity rates
increased significantly among adolescents. In the time
period from 1963 to 1970, only 4.2% of children 2 through 11
years of age and 4.6% of those 12 through 19 years of age
were overweight or obese. In comparison, from 2003 to 2004,
overweight or obese children represented 18.6% of those in
the younger age group, an increase of 14.4%, and 17.4% in
the older group, an increase of 12.8%.
A significant contributor to this upward trend may be
decreased physical activity. The Morbidity and Mortality Weekly
Report noted that 6 of 10 adolescents aged 9 to 13 do not
participate in any organized sport activity or physical-
activity program (2006, as cited in Hewlings, 2010). The
MDPH website (2007) showed that only 41% of high school
adolescents surveyed actually engaged in 60 minutes or more
of physical activity each week. The study also found that
six of 10 high school students do not meet the physical-

4activity guidelines established for Massachusetts’
residents.
Sedentary behaviors like watching television and
playing video games may negatively affect the amount of
physical activity of adolescents in Massachusetts. The MDPH
website (2007) showed that an adolescent who watches
television 2 hours or more per day, in increments, was
associated with 23% (95% confidence interval (CI): 17, 30)
of increased obesity risk and 14% (95% CI: 5, 23) of
increased risk for Type-2 diabetes. These results suggest
that inactive adolescents are more likely to be overweight
or obese than their active counterparts. In addition, the
MDPH (2007) noted that 30% of Massachusetts adolescents who
watched 3 hours or more of television, played 2 hours or
more of video games, and used computers for 2 hours or more
were at high risk of being overweight or obese compared to
25% among adolescents nationally.
Although the increased availability of sedentary
activities has contributed to increased physical inactivity,

5high crime and violence in neighborhoods may also play a
role, due to adolescents feeling unsafe being out of doors
and therefore reluctant to engage in more vigorous
activities. A study by Kerr, Norman, Sallis, and Patrick
(2008) found female adolescents who perceived their
neighborhoods to be unsafe needed exercise aids (e.g.,
treadmills), as a result of not having exercised outside
(Odds ratio = 4.40, p < .01); however, for male adolescents,
the numbers were not significant. Whether bullying is a
cause of inactivity has not been studied. A second research
gap explains indicators of bullying in relationship to
inactivity among Massachusetts adolescents. Additional
detail is included in Chapter 2.
Low-income communities and school districts with high
crime and bullying may contribute to adolescents being
overweight or obese because adolescents may feel unsafe
(CDC, 2010c). These feelings could lead to reduced physical
activity and increased sedentary behaviors including
television viewing and video gaming. This study is needed to

6help reduce inactivity among Massachusetts adolescents,
promoting healthy well-being among Massachusetts
adolescents, and increasing life expectancy among
Massachusetts adolescents.
New Physical-Activity Guidelines
The new physical-activity guidelines include aerobics
with moderate or vigorous physical activity at least 3 days
a week and 60 minutes or more of daily physical activity
(CDC, 2010a). In addition, the CDC (2010a) website
recommended that muscle strengthening and bone-strengthening
exercises should be a part of a daily physical-activity
routine for children and adolescents. Table 1 shows
indicators that could predict the percentage of inactivity
among adolescents by race and gender.

7Table 1
Inactive Ninth- Through 12th-Grade Adolescents in Massachusetts and the United
States
United States (N =16,126)
Massachusetts (N =2,625)
Category PercentConfidenceinterval Percent
Confidence
intervalTotal 32.8 30.4–35.3
(90%)30.4 27.3–33.6
(95%)Race
Asian 23.8 19.2–29.1 27.1 19.6–36.3African American
55.5 53.3–57.7 51.6 45.7–57.5
Hispanic 41.9 39.0–44.9 42.3 36.4–48.4White 24.8 22.8–26.9 25.6 22.6–28.8
GenderFemales (n = 8,175)
32.1 28.1–37.1 29.1 25.0–33.3
Males (n = 7,887)
33.5 29.7–37.2 31.6* 28.1–35.3
Note. Adapted from 9th-Through-12th grade Students in Massachusetts and United States That Have Experienced Bullying. Youth Online Survey, by Centers for Disease Control and Prevention, 2009a, retrieved from http://apps.nccd.cdc.gov./youthonline/app/default.aspx) Copyright (2009)by Centers for Disease Control and Prevention. Reprinted [or adapted] with permission.
Physical Inactivity
Table 1 describes the rates of inactivity among various
groups in the United States and in Massachusetts. The

8percentages are described as indicators that explain the
amount of inactivity among adolescents in the United States
and in the State of Massachusetts. Sex and gender variables
describe differences between the groups so valid comparisons
may be made for empirical evidence of inactivity.
The CDC (2009a) randomly sampled 16,126 adolescents to
determine if they were physically inactive. Inactivity was
defined as fewer than 60 minutes of physical activity each
day and included those who watch 3 or more hours of
television each day. Hispanic and African American students
have the greatest risk of physical inactivity, both
nationally and in Massachusetts, whereas Asian and Caucasian
students had the lowest levels of risk in both localities.
Several factors have been shown to be related to
physical inactivity. Parents working more hours and children
who are home alone face issues with inactivity (CDC, 2010b).
Parents who work longer hours are absent from children’s
physical-activity behaviors; therefore, children who stay at
home without parental supervision may face issues caused by

9being physically inactive. Parents working more and children
spending more time at home alone may increase peer relations
and increase exposure to peer pressure. Peer pressure is
another factor in children’s inactivity. According to the
CDC website (2010b), children who have inactive peers may
become inactive themselves. Those who do not participate in
organized sports and physical-activity programs may have
greater amounts of idle time, making increased computer
usage, television watching, and video-game playing more
likely.
A major problem confronting adolescents, especially
those who are minorities, is identifying safe places and
sufficient resources to engage in vigorous physical activity
(Hewlings, 2010). The perception of feeling unsafe in low-
income neighborhoods, lack of safe places to play, and other
socioeconomic factors may contribute to inactivity among
minority adolescents. A central-Florida study (Hewlings,
2010) suggested that adolescents with parents who are lower
income and have lower educational attainment are less likely

10to participate in physical-activity programs or sports. In
addition, the study found a major contributing factor,
especially among minorities, was a lack of safe places to
play in their neighborhood. A study by Powell, Slater, and
Chaploupka (2004, as cited in Hewlings, 2010) found that
African American communities with higher percentages of
violence tended to have greater trends toward physical
inactivity and fewer resources. For instance, fewer parks,
green spaces, places to play sports, public schools, and
beaches were available for African American adolescents in
lower income neighborhoods.
The CDC (2010a) found that physical inactivity in
children and adolescents causes them to be unable to meet
physical-activity guidelines. Adolescents in Massachusetts
and in the United States do not meet these guidelines and
are considered to be physically inactive. Physical activity,
defined another way by the Pediatric Nutritional
Surveillance System, entails exercising 60 minutes or more

11daily with moderate to vigorous physical activity (CDC,
2010b).
Children and adolescents who are physically inactive
face the risk of developing Type 2 diabetes (CDC, 2010b),
congestive heart failure, arteriosclerosis, and high
cholesterol (CDC, 2010b). High blood pressure is a major
risk factor among children and adolescents who are
physically inactive and may lead to other health-risk issues
for those children and adolescents considered to be
physically inactive. Stroke is observed in children and
adolescents who are physically inactive, caused by high
blood pressure, high cholesterol, sedentary lifestyle, and
smoking (U.S. Department of Health and Human Services
[DHHS], 2010). Arthritis is another health consequence
associated with physical inactivity among children and
adolescents. Children and adolescents who are physically
inactive face issues with bone growth and maturation (CDC,
2010b). Furthermore, children and adolescents who are

12physically inactive and smoke frequently face the increased
possibility of contracting cancers (CDC, 2010b).
Another long-term consequence of increasing levels of
physical inactivity is the reduction of recruits eligible to
serve in the military. This has a potential impact on
national safety as well as public and individual health.
Those choosing to enter the military face problems due to an
inability to pass physical-fitness tests. Increasing numbers
of graduating high school students are overweight or obese,
and thus are unable to pass the physical-fitness test for
admittance into the U.S. armed forces (Bendo et al., 2010).
Physical Safety
Concerns about personal safety outdoors may increase
the risk of inactivity in youth. In this study, I consider a
variable in the discussion of personal safety: bullying.
Bullying. Bullying, including both traditional and
cyberbullying, encompasses teasing, threatening, spreading
rumors, hitting, shoving or hurting another student, or
physically threatening or causing bodily harm, and can be

13based on differences in race, gender or gender preference,
group associations, or personal antagonisms (CDC, 2011).
Children who fear being bullied or physically violated or
feel unsafe lack 60 minutes of physical activity, and
morbidities and mortalities among high school students and
peers increases with being bullied (CDC, 2011).
According to the DHHS (2010), 20% of high school
students reported being bullied on school premises. Bullying
creates victimization that may lead to adolescents having
poor self-esteem, difficulties maintaining friendships with
adolescent peers, and docile behaviors. Bullying may
contribute to poor academic performance, depression,
anxiety, poor school adjustment, substance abuse, and youth
violence.
Table 2 presents statistics from the Youth Behavioral
Risk Surveillance System (YRBSS, CDC, 2009d) on the number
of high school students in the United States who experienced
bullying.

14Table 2
Ninth- Through 12th-Grade Adolescents in Massachusetts and the United States
Who Experienced Bullying
United States Massachusetts
CategoryNumber
Percent
Confidence
interval
Number
Percent
Confidence
interval
RaceAsian 650 17.5 13.4–
22.6107 17.1 9.9–
28.0African American 2,72813.7 11.8–
15.8243 11.9 8.7–
16.1Hispanic 4,44018.5 16.8–
20.2436 20.0 16.5–
23.9White 6,75621.6 19.9–
23.41,70910.1 18.0–
22.5Gender
Females (n = 8,175)
7,83821.2 19.8–22.7
1,32719.8 17.5–22.3
Males (n = 7,887)
7,73418.7 17.4–20.1
1,35919.0 16.5–21.8
Note. Adapted from 9th- Through- 12th Grade Students in Massachusetts and United States That Have Experienced Bullying. Youth Online Survey, by Centers for Disease Control and Prevention, 2009a, retrieved from http://apps.nccd.cdc.gov./youthonline/app/default.aspx) Copyright (2009)by Centers for Disease Control and Prevention. Reprinted [or adapted] with permission.
Of note, African American adolescents are significantly less
likely to report feeling bullied than other racial and

15ethnic groups, whereas White and non-Hispanic students are
most likely to report these feelings (CDC, 2010c).
The CDC (2010c) suggested peer victimization is a major
concern because students targeted for bullying and violence
face injury and death caused by physical abuse (CDC, 2010c).
Physical abuse is a type of peer victimization.
Cyberbullying is also a major concern among children and
adolescents. Cyberbullying differs from traditional bullying
because of the use of technology, limiting physical abuse.
However, cyberbullying is equally dangerous. The CDC website
(2010c) noted cyberbullying presents far more abuse that is
psychological because cell phones, Internet usage, e-mails,
text messages, and chats are used to coerce, threaten, and
manipulate. Therefore, children and adolescents may feel
unsafe and psychologically challenged regardless of their
physical location (CDC, 2010c). Chapter 2 describes
cyberbullying in more detail.
Psychological abuse has a recurring effect among
children and adolescents, causing issues of depression and

16low self-esteem (DHHS, 2010). The CDC (2010c) noted the same
effect whether cyberbullying or traditional bullying takes
place. A detailed description of psychological abuse is
included in Chapter 2. Children and adolescents with high
access to the Internet, e-mail, and chat rooms are more
likely to coerce or threaten their peers. The challenge to
restrict access and hours on the computer are pertinent to
those children and adolescents who bully other children and
adolescents (CDC, 2010c).
Injuries may be a consequence of bullying. Bullying may
lead to physical violence and psychological abuse through
coercion and threatening. Both traditional and cyberbullying
may lead to violence that causes injury.
Disabilities are consequences of severe injuries.
According to the CDC (2010c), disabilities might incur high
healthcare costs and may be directly caused by bullying and
violence among children and adolescents. In addition,
decreased productivity may relate to bullying and violence
among children and adolescents (CDC, 2010c). Decreasing

17productivity creates lack of trust in school and support
systems of children and adolescents.
School suspensions strongly correlate with violence and
bullying (CDC, 2010c). For example, school-aged adolescents
being bullied for lunch money may decide to fight back. The
CDC (2010c) found that truancy might factor into the problem
of bullying and violence. Children and adolescents who are
bullied may feel unsafe and frustrated and may, therefore,
not attend school.
Low self-esteem is a strong consequence for children
and adolescents who face violent situations or encounter
bullying (CDC, 2010c). For example, adolescent high school
students who are harassed about sexual orientation or are
threatened or coerced into giving up lunch money may, over
time, lose self-esteem and become depressed. Depression is a
psychological consequence that may result in suicidal
ideation, as a result of bullying and violence among
adolescent peers (CDC, 2010c). Depression affects children
and adolescents differently at different stages, and may

18lead to suicidal ideation and separation from parents (CDC,
2010c). Chapter 2 explores this concept in greater detail.
Suicidal ideation is a major consequence of bullying
and violence among children and adolescents (CDC, 2010c).
Separation from parents can be a consequence. Children and
adolescents withdraw from parents when bullying occurs. This
creates a situation in which parents may not be able to
communicate effectively with their school-age child or
adolescent (CDC, 2010c).
New Excessive Television Watching Guidelines
The new excessive-television-watching guidelines from
the American Academy of Pediatrics (AAP, 2013) suggested
that children under 2 years of age should not watch any
television, and children of ages 8 to 18 should watch no
more than 1 to 2 hours of noncommercial television
entertainment geared to children per day.
Excessive Television Watching
Table 3 describes the rates of excessive television
watching among various groups in the United States and in

19Massachusetts. The percentages are described as indicators
that explain the amount of extensive television watching
among adolescents in the United States and in the State of
Massachusetts. Gender variables describe differences between
the groups, so valid comparisons may be made for empirical
evidence of excessive television watching.
The CDC (2009a) randomly sampled 16,126 adolescents to
determine if they watched television excessively. Those who
watch 3 or more hours of television each day and do not
physically exercise are known to have health issues.
Benaroch (2009) found adolescents who watched television
excessively had poor diet choices, more fast-food
consumption, poor sleep habits, and obesity issues. In
addition, adolescents who watched television excessively had
more risk for cardiovascular disease (CVD), Type-2 diabetes,
high blood pressure, and high risk for asthma (Benaroch,
2009). Hispanic and African American students have the
greatest risk of watching television excessively, both
nationally and in Massachusetts, whereas Asian and Caucasian

20students had the lowest levels of risk in both localities.
In fact, Blacks and Hispanics were more likely than Whites
to watch television excessively.
Table 3
Excessive Television Watching Ninth- Through 12th-Grade Adolescents in
Massachusetts and the United States
United States (N =16,126)
Massachusetts (N =2,625)
Category PercentConfidenceinterval Percent
Confidence
intervalTotal 32.8 30.4–35.3
(90%)30.4 27.3–33.6
(95%)Race
Asian 23.8 22.0–42.5 27.1 19.6–36.3African American
55.5 53.3–57.7 51.6 45.7–57.5
Hispanic 41.9 39.0–44.9 42.3 36.4–48.4White 24.8 22.8–26.9 26.0 23.4–28.9
GenderFemales (n =8,175)
32.1 29.9–34.4 29.1 25.0–33.3
Males (n = 7,887)
33.5 29.9–37.2 31.6* 28.1–35.3
Note. Adapted from 9th- Through- 12th Grade Students in Massachusetts and United States That Experienced Excessively Watching Television. Youth Online Survey, by Centers for Disease Control and Prevention, 2009a, retrieved from http://apps.nccd.cdc.gov./youthonline/app/default.aspx) Copyright (2009)by Centers for Disease Control and Prevention. Reprinted [or adapted] with permission.
21Several factors have been shown to be related to
excessively watching television. Parents working more hours
and children who are home alone face issues with excessive
television watching (CDC, 2010b). Parents who work longer
hours are absent from children’s physical-activity
behaviors; therefore, children who stay at home without
parental supervision may face issues caused by excessively
watching television. Parents working more and children
spending more time at home alone may increase peer relations
and increase exposure to television watching. High blood
pressure is a major risk factor among children and
adolescents who excessively watch television and may lead to
other health-risk issues for those children and adolescents
considered to be physically inactive. Another long-term
consequence of excessive television watching levels is the
reduction of recruits eligible to serve in the military.
Attention Deficit Hyperactivity Disorder (ADHD) is a
mental health consequence for those children and adolescents
who watch television excessively. Benaroch (2009) found that

22children and adolescents who watch television excessively
and have televisions in their rooms are more likely to be
associated with ADHD. Low academic performance is another
consequence of excessive television watching. Low academic
performance was indicated by adolescents who viewed 3 or
more hours of television per day.
Problem Statement
Morbidity among adolescents is increasing because of
the lack of physical activity (CDC, 2010c). In addition,
inactivity or physical-activity levels below the recommended
federal guidelines may contribute to obesity. Neighborhood
violence, including guns and bullying, may lead to reduced
opportunities to participate in physical activities, which
in turn makes inactivity more likely. Bullying and the
levels of physical activity are areas requiring additional
exploration. A better understanding of the relationship
between bullying and levels of physical activity could lead
to programs designed to increase feelings of safety and
activity. Ultimately, this could result in a reduced

23incidence of obesity among adolescents, thereby leading to
higher levels of physical activity.
The fear of walking to and from school creates a lack
of physical exercise because of violence and bullying, and
therefore may increase the incidence of television usage.
The lack of physical activity results in being overweight or
obese, in turn hindering the health of children and
adolescents (CDC, 2010b). In the studies reviewed, a
research gap was identified, discerning whether bullying is
a cause of inactivity; a second research gap was
understanding the relationship between bullying and
excessive television watching among Massachusetts
adolescents. Further detail will be offered in Chapter 2.
Purpose of the Study
The purpose of the study was to investigate the
relationship between excessive television watching, with
respect to bullying, and physical inactivity that impacts
obesity among Massachusetts’s adolescents. The focus was to
examine the effect feelings of vulnerability have on levels

24of activity. The independent variables were bullying and
excessive television watching, and the dependent variable
was inactivity. The covariables were race, gender, and age.
The variables were used to test the relationship between
bullying and the effects of extensive television watching on
an adolescents’ ability to meet physical-activity
guidelines.
Research Questions
R1: Does excessive television watching, as measured by
a Thurstone scale, have a significant relationship with
meeting minimum standards of physical activity among
Massachusetts adolescents?
R2: Does bullying, as measured by a Thurstone scale,
have a significant relationship with meeting minimum
standards of physical activity among Massachusetts
adolescents?
H10: There is not a significant positive relationship
between excessive television watching and the achievement of

25minimum standards of physical activity among Massachusetts
adolescents.
H1a: There is a significant positive relationship
between excessive television watching and the achievement of
minimum standards of physical activity among Massachusetts
adolescents.
H20: There is not a significant positive relationship
between bullying and the achievement of minimum standards of
physical activity among Massachusetts adolescents.
H2a: There is a significant positive relationship
between bullying and the achievement of minimum standards of
physical activity among Massachusetts adolescents.
Theoretical Base
The theoretical base informing this study is the safety
component of Maslow’s (1954) hierarchy theory. The feeling
of safety while traveling to and from school and while in
the community may affect physical-activity opportunities and
increase television watching because of bullying. In turn,
watching more television increases sedentary behaviors that
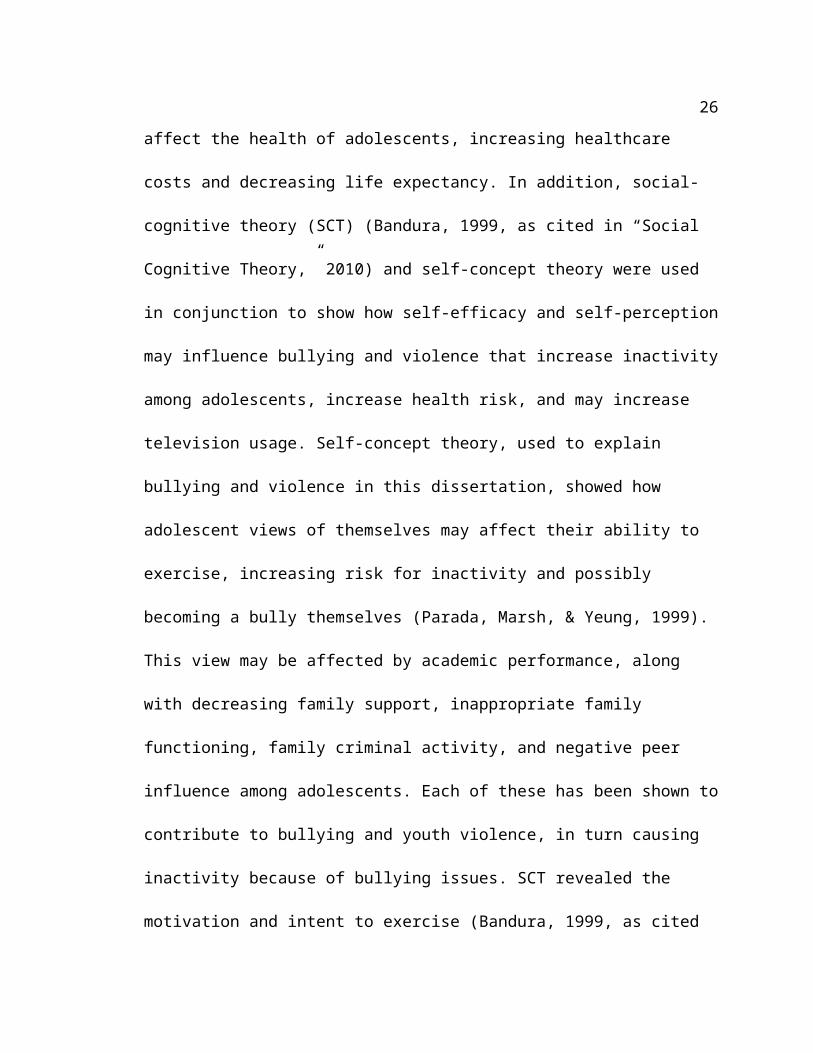
26affect the health of adolescents, increasing healthcare
costs and decreasing life expectancy. In addition, social-
cognitive theory (SCT) (Bandura, 1999, as cited in “Social
Cognitive Theory,” 2010) and self-concept theory were used
in conjunction to show how self-efficacy and self-perception
may influence bullying and violence that increase inactivity
among adolescents, increase health risk, and may increase
television usage. Self-concept theory, used to explain
bullying and violence in this dissertation, showed how
adolescent views of themselves may affect their ability to
exercise, increasing risk for inactivity and possibly
becoming a bully themselves (Parada, Marsh, & Yeung, 1999).
This view may be affected by academic performance, along
with decreasing family support, inappropriate family
functioning, family criminal activity, and negative peer
influence among adolescents. Each of these has been shown to
contribute to bullying and youth violence, in turn causing
inactivity because of bullying issues. SCT revealed the
motivation and intent to exercise (Bandura, 1999, as cited

27in “Social Cognitive Theory,” 2010). Extensive television
watching in the neighborhood or school district because of
bullying and violence may increase inactivity; the SCT
construct was used to query the creation of personal
efficacy (i.e., whether physical activity is given more
importance than violence). Adolescents were questioned by
the U.S. Department of Education (DOE) and the Massachusetts
Department of Elementary and Secondary Education about
amount of television watching in a 12-month period and about
bullying. The goals of the theories are to show how
excessive use of television watching, bullying and youth
violence, how one perceives oneself, family support,
academic performance, substance abuse, amount of hours using
computer, and video-game playing affect physical activity
and may contribute to inactivity among adolescents. Chapter
2 will describe these constructs in greater detail.
Nature of the Study
The nature of this study was to quantitatively describe
—using secondary analysis of archival data of an educational

28survey design among ninth- through 12th-grade students—a
possible relationship between excessive television watching
and the achievement of minimum standards of physical
activity among Massachusetts adolescents. In addition, I
examined the possible relationship between bullying and the
achievement of minimum standards of physical activity among
Massachusetts adolescents. I chose to use the quantitative
method because the secondary educational survey design
study, obtained from the Department of Education, and MDPH
in conjunction with the YRBSS of the CDC, and Massachusetts
Department of Elementary and Secondary Education, displayed
a greater statistical power for a quantitative analysis at
these sample sizes to identify significance or any
underlying associations than a qualitative study would have
done. The quantitative numbers described the excessive
amount of television usage among adolescents and bullying.
The outcome variable, inactivity, was described as well.
This descriptive correlation study assessed the relationship
between bullying and excessive television watching in

29relationship to inactivity. The outcome variable,
inactivity, was a result of excessive television watching
and bullying. The Spearman correlational coefficient was
used to calculate an r-statistic, which translates to a
degree of relation between the independent and dependent
variable. The Spearman correlation was used because the
questioning format of the dependent variable is ordinal. A
chi-square test was used to determine a significant
association between the rows and columns of the variables
(Gerstman, 2008). This test determined significant
associations between the independent variable bullying and
the dependent variable, inactivity. The covariates race,
age, and gender were used to examine different groups’
relationships between bullying and hours of watching
television to inactivity.
For my inferential analysis, I tested for predictors of
not meeting minimum standards of physical activity. I
compared those adolescents who were bullied to those
adolescents who were not bullied, and those who were

30physically active to those who were not physically active. I
used the inferential analysis as a predictor model for
testing. This included a test statistic that displayed
possible hypothetical significance for differences among the
independent variables and dependent variable. This process
provided data about whether a response was significantly
different for each race, age, and gender group among the
independent and dependent variables. The ordinal regression
analysis helped determine possible prediction of multiple
independent variables to the dependent variable. This was
determined through a regression line that helped determine
the relationship between two or more variables (Babbie,
2007). The ordinal regression helped determine the
relationship between excessive television watching and the
dependent variable (inactivity). The analysis included
standard of error, degrees of freedom, and a test statistic
p-value that translated to significance of association
between the independent and dependent variable (Gerstman,
2008).

31Assumption of parallel lines had to be met prior to
administering the test; if it was not significant, then the
assumption was met (Gerstman, 2008). If parallel lines were
significant, then the assumption was not met and the ordinal
logistic regression test was not performed. This was the
case for the independent variable, bullying. However, for
the independent variable, excessive television watching, the
test of parallel lines assumption assessed whether there was
a significant difference between the model where the
regression lines were constrained to be parallel for each
level of the dependent variable and the model where the
regression lines were allowed to be estimated without a
parallelism constraint. The test of parallel lines was
conducted and the results were not significant, thereby
indicating that the assumption was met. In addition, the
Kruskal–Wallis test was used to test significance among
differences in hours of television watching by level of
physical activity. A Mann–Whitney U test was used to

32determine where the differences lay among the levels of
physical activity.
Quantitative analysis was warranted because questions
designed in the survey attempted to quantify the
relationships between the independent variables of perceived
personal safety, bullying, and weapons violence, with
outcome variables of physical activity. The targeted
population was adolescents in Grades 9 through 12 in
Massachusetts school districts. The sampling unit was high
school students. The sampling frame was ninth- through 12th-
grade students in Massachusetts school districts.
Instrumentation used in the data collection was the survey
design. The Department of Education collected the primary
data and I provided secondary analysis using the archival
data to describe bullying, excessive television watching,
and physical activity. I am interested in adolescents in the
State of Massachusetts because of the increasing obesity
levels among adolescents. See Chapter 3 for additional
detail.

33Definition of Terms
Adolescence: The World Health Organization (WHO, 2010)
defined adolescence as persons between the years of 10 and
19. The CDC (2010c) defined early adolescence as 12 to 14
years of age, and middle adolescence as 15 to17.
Age: 13, 14, 15, 16, 17 and 18 years of age with
inclusion of being a ninth- to 12th-grade student.
Bullying: Bullying is threatening, intimidating,
humiliating, or causing bodily harm to an individual or
person by coercion or threatening, physical harm,
psychological harm using anatomy or any part of the body,
weapons, and manipulation to cause injury. In addition, it
is using Internet mobile phones to e-mail or text
threatening images without personally being present to cause
psychological harm (Blazer, 2005).
Bullying in the study is described as adolescents who
were teased, threatened, the target of rumors, hit, shoved,
or hurt by another adolescent repeatedly (CDC, 2009d).
Bullying is excluded if the student teased or fought in a

34friendly way or was of the same strength. In the YRBSS, this
item was coded alphabetically from a to b. In addition,
variables in this category were listed dichotomously as yes
or no responses.
Inactivity: Inactivity is measured by how many days the
adolescent was physically active for at least 60 minutes a
day that caused the adolescents to breathe vigorously,
sweat, or have an increased heart rate (CDC, 2009d). On the
YRBSS, the items were measured numerically from 0 to 7 days
and were alphabetically coded from a to h. In addition,
questioning about organized sports teams and community
physical groups and whether the adolescents participated in
such activities were presented. This section was meant to
show the intent and motivation to be on a sports team where
physical activity was warranted within the 12-month
timeframe for at least 60 minutes a day. The items were
measured numerically from 0 to 3 or more and coded from a to
d (CDC, 2009d).
Gender: Male or female.

35Obesity: A body-mass index that is equal to or above the
95th percentile among children of the same sex and age (CDC,
2010c).
Overweight: A body-mass index that is equal to or more
than the 85th percentile, but less than the 95th percentile
(CDC, 2010c).
Physical activity: Physical activity is defined by the CDC
(2010a) as exercising 60 minutes or more daily in exercise
that promotes either increased heart rate or increased
breathing.
Physical inactivity: Physical inactivity is defined by the CDC
(2010a) as physical activity with less than 60 minutes
exercise at least 5 days a week for children and
adolescents.
Race: Includes Black, White, Non-White Hispanic, and
Black Hispanic.
Safety: Safety is feeling security and trust, free from
danger, physical and psychological abuse, negative
environment, coercion, and injury (Datta, 2008). Safety was

36measured in the YRBSS (CDC, 2009d) by whether the adolescent
perceived being unsafe traveling to or from school or in
their neighborhood. The questions asked whether adolescents
in the past 30 days felt unsafe and did not go to school
(CDC, 2009d). This type of questioning may suffice for
neighborhood or school violence that affects physical
activity because of the perception of feeling unsafe. The
numerical variables were presented as discrete variables
listed from 0 to 6 or more and alphabetically coded from a
to e.
Sedentary behaviors: Sedentary behaviors are defined as
sitting or not moving and without physical exercise. This
includes playing video games, watching television, and using
a computer.
Television watching: Television watching was measured by
number of hours spent watching television on a school day
(CDC, 2009d). The discrete variable was presented from “I do
not watch television on an average school day” to “less than
1 hour per day” to “1 to 5 hours or more per day.” In

37addition, alphabetical coding of variables ranged from a to
g in the YRBSS (CDC, 2009d) study. Excessive television
watching is more than 1 to 2 hours per day of noncommercial
viewing (AAP, 2013).
Violence: The intent to use force, power, or bodily harm
to injure another individual or group or community, causing
psychological harm, or developing loss or deprivation
(Dahlberg & Krug, 2002). Violence was measured in the YRBSS
(CDC, 2009d) by questioning whether, within the last year,
the participant was threatened with a weapon or was injured
on school property. The items were measured numerically from
0 to 12 and were alphabetically coded from a to h. In
addition, how many times the participant was in a physical
confrontation on school property was measured numerically
from 0 to 12 discretely and alphabetically coded from a to h
(CDC, 2009d).

38Assumptions, Limitations, Scope, and Delimitations
Assumptions
The assumption of the YRBSS (CDC, 2009d) study was that
ninth- through 12th-grade participants chosen in the survey
study responded truthfully to questions asked. In addition,
hours spent watching television adequately represented the
level of inactivity and whether the standards of activity
were met and that the index established was based on
bullying and other forms of violence that adequately
represented an adolescent’s perceptions of safety. Some
participants in the survey had issues with bullying and
violence in their neighborhoods and schools and felt unsafe.
Scope
The scope of the study was to examine ninth- through
12th-grade adolescents to determine how hours of television
watching and bullying affected their ability to meet
physical-activity guidelines successfully. In addition, I
investigated how bullying and violence in schools and
communities or neighborhoods may have affected the amount of

39time spent watching television, which in turn affected the
amount of physical activity of ninth- through 12th-grade
adolescents.
Delimitations
The delimitations of this study are the intention to
include only adolescents and residents of Massachusetts. In
addition, determining causation between independent and
dependent variables is beyond the scope of this study. Only
associations between variables were described and tested.
Limitations
A secondary data analysis allows the investigator to
examine existing data and address research questions to
bring forth new content or research questions. However,
there are limitations to secondary analysis. Investigating
issues that may occur might be an issue in secondary data
analysis because of the difficulty in finding pertinent data
(Colorado State University, 2010). In addition, variables
could be controlled and altered. Another limitation of
secondary data is that with large data files, it is

40difficult to ensure that statistical software packages did
not influence validity of the research (Colorado State
University, 2010).
The self-reporting nature of the survey may create bias
where respondents did not answer questions truthfully, and
this may cause validity issues for the instrument (Babbie,
2007). In addition, the investigator may manipulate survey
questions to fit his or her criteria of research. For
example, a researcher may study a particular issue and
present survey questions that would induce a response to
what the researcher is thinking.
The survey questionnaire may lack validity due to
issues of reliability. For instance, questions asked about
gun violence in one neighborhood or community might change
over time because of community members moving to other areas
or mortalities, causing survey responses to differ each time
questions are answered. In addition, telephone interviews
bias the results because participants must have a land-line
telephone to participate and selection bias is based on

41participation of only those willing to participate. The
participants may have had inherent differences from
nonparticipants.
Another limitation might be mismatching of categorized
independent and dependent variables. For instance, among the
ninth- through 12th-grade students targeted by the school
district, did the questions presented in the survey conform
to Maslow’s (1954) hierarchy-theory construct? In other
words, did the questions presented fit the category of
meeting safety needs that affect physical activity or
fitness standards?
Another limitation of the survey method is a mismatch
in categorizing independent and dependent variables (Babbie,
2007). For instance, when questions about violence and
bullying are categorized, the researcher reduces the number
of potential responses, which could bias the results.
In addition, responses to surveys and missing data
might be an issue among minority students. Some African
American and Hispanic ninth- through 12th-grade students in

42Massachusetts might not respond to survey questions or
refuse to answer, which would affect the validity and
reliability of the study (MDPH, 2007).
Strengths
The strengths of the survey method are that it allows a
greater number of responses than is usual in quantitative
studies. The present study examined and described samples
essential to school districts in Massachusetts. Each school
district might have different response times and rates;
however, similarities and differences are noted in the
survey design.
Sampling a large database of adolescents provides the
survey methodology that encourages a great number of
responses, buoying the analysis process (Babbie, 2007). In
addition, the strength of the study is the flexibility of
the survey method, allowing a large number of questions to
be asked on a given topic. This aids in the analysis of the
independent variables, control variables, and dependent
variable (Babbie, 2007).

43Significance of Study
The goal of this study was to promote positive social
change by limiting the barriers and enablers that prevent
school-aged children from maintaining a healthy weight
through recommended levels of physical activity. Because
obesity is caused, at least in part, by inactivity, the
identification of risk factors associated with increased
inactivity could lead to interventions that will ultimately
assist in reducing adolescent obesity. In this study, I
hypothesized that inactivity is at least influenced by
bullying that leads to excessive hours of television
watching. The identification of a relationship between
bullying and threats of violence and inactivity could lead
to appropriate interventions.
Limited research has been done on bullying and violence
and their effect on the amount of television watching and
ultimately, extended periods of inactivity. Unhealthy weight
gain creates many health concerns among children and
adolescents. Many researchers have studied bullying but do
44not delve into the effect of bullying and violence on the
amount of television high school children and adolescents
watch. This study provides awareness and may serve as a
basis for the creation of programs for those who lack
resources to reduce obesity in the targeted school
districts. Based on the empirical evidence already focused
on bullying and violence issues, a literature review will
help in understanding the phenomenon of bullying and
violence on physical activity. Such a review lays a strong
foundation for the study at hand.
Summary
Chapter 1 included the introduction to the study, the
background of the study, the problem statement, and the
purpose and nature of the study. In addition, the research
questions and hypotheses were discussed, and the conceptual
theoretical framework was presented. Assumptions,
limitations, scope, strengths, delimitations, and
significance of study were described, as well as possible
social change.

45Chapter 2 includes a review of literature that
establishes empirical evidence of behaviors, physical
consequences, psychological consequences, physical-activity
guidelines, sedentary behaviors, and environmental
influences and their relationship to childhood-obesity
rates. In addition, the independent and dependent variables
are explained fully in Chapter 2.
Chapter 3 includes the methodology to be used in the
study, as well as the background, survey design, and data
analysis.
In Chapter 4, the method, data-analysis planning, and
results are analyzed. Chapter 4 includes results and
provides analysis of the methodology used in the study.
Chapter 5 concludes with a summary and interpretation
of the findings, implications for social change,
recommendations from findings, and recommendations for
further study.
46Chapter 2: Literature Review
Introduction
Morbidity is increasing among adolescents in the State
of Massachusetts because of a lack of physical activity
(CDC, 2010b). In addition, inactivity or physical-activity
levels below the recommended federal guidelines may
contribute to obesity. Neighborhood violence, including
bullying, may lead to reduced opportunities to participate
in physical activities, which, in turn, makes inactivity
more likely. The excessive use of television watching and
the levels of physical activity are areas requiring
additional exploration. A better understanding of the
relationship between excessive television watching and
levels of physical activity could lead to programs designed
to increase feelings of safety and therefore levels of
physical activity. Ultimately, this could result in a
reduced incidence of obesity among adolescents.
The fear of walking to and from school because of
bullying may reduce physical exercise. The lack of physical

47activity results in being overweight or obese, in turn
hindering the health of children and adolescents (CDC,
2010b). The purpose of this research was to investigate the
relationship between excessive television watching with
respect to bullying and physical activity, which impact
obesity among Massachusetts adolescents. The focus is the
effects of bullying on levels of activity. The variables are
used to test the relationship bullying and excessive
television usage have on adolescents’ ability to meet
physical-activity guidelines.
Review of Past Studies
In the first section, I review the recent literature on
the dependent variable for this study, physical activity.
Recent literature studied included physical-activity
guidelines, the association of physical activity and
inactivity, watching 3 hours or more of television, and
military-fitness-test failures. The second section examines
recent literature on the first independent variable,
bullying. The consequences of bullying examined include

48injuries, morbidities, self-esteem issues, suicidal
ideation, peer victimization, adverse peer relationships,
and depression, as well as their association with inactivity
and being overweight or obese among the targeted adolescent
population. This section will explore studies about
difficult peer relationships, gang violence, low academic
performance, and family criminal history that may guide
adolescents to inappropriate behaviors and may increase the
risk for bullying behaviors. In addition, I included recent
literature on the perception of safety among adolescents,
safety in schools, neighborhood safety, safe park access,
neighborhood violence, and safety among low-income residents
and minorities that may affect physical activity levels and
possibly increase levels of hours of television watching.
The third section of this review explores the second
independent variable, adolescent’s hours of television
watching, and the causes and consequences of excessive
television watching among adolescents.

49Furthermore, the review of studies included both
quantitative and qualitative methodologies of quantitative
studies, using different approaches and variables of
research design, measures, descriptive statistics, and
linear regression including an ANCOVA or an ANOVA and
predictor variables including betas, p-values, y-variable,
x-variable for possible prediction and significance, null
and alternative hypotheses, r-values for correlation, and t
test to determine significance of differences between groups
of race for the response variable. In addition, a chi-square
test was implemented to help determine possible significance
of association among bullying, excessive television
watching, and inactivity (Gerstman, 2008). The analysis was
contingent on the independent variables, bullying and
excessive television watching, and the dependent variable,
inactivity. The results depended on the independent or
dependent variables used in the studies. These approaches
may be longitudinal, cross-sectional, cohort, unvaried,
bivariate, or multivariate in nature (Babbie, 2007). All

50recent literature reviewed included research questions or
null or alternative hypotheses.
The qualitative studies focused on focus groups, key
interviewers, and case studies that used different
approaches. These approaches were narrative case studies,
grounded-theory studies, naturalism, and phenomenology
approaches in nature. All reviewed studies examined the
limitations and further research communicated by each
investigator of the selected literature targeted by my
choice of its relevance, along with discussion. In addition,
how the investigator dealt with the limitations was
presented in each case. Each study used the conceptual
framework I chose, including self-perception theory, SCT,
and Maslow’s (1954) component of safety. The final section
concludes with a summary of Chapter 2 and a description of
Chapters 3, 4, and 5.
Literature Search Strategy
I used databases from the Walden University library
(i.e., Health Sciences: Nursing and Allied Health, ProQuest,

51and MEDLINE), the online journal sources of Biomedical
Central, PUBMED Central, CDC, the Nutritional Examination
Health Survey, the Youth Health Survey, the MDPH website,
the Pediatric Nutritional Surveillance System, the YRBSS,
the Journal of Physical Activity Health, Clinical Practice and Epidemiology in
Mental Health, the Journal of Pediatrics, and the American Journal of
Pediatric Medicine. The strategy of selecting the databases was
based on scholarly journal reviews, and each journal
contained abstracts, introductions, methodology, results,
discussions, conclusions, and references.
I used key terms as adolescent obesity, sedentary behaviors, physical
activity, safety, bullying, weapons or youth violence, and environmental
factors. In the literature review, I used Excel to outline
terms, authors, and titles. The author, published year,
topic, methodology, and results were all required for an
evidence-based research study to make a smooth transition to
the writing process.
In addition, secondary resource searches included the
MDPH website, the CDC website, the DHHS website, the Youth

52Health Survey, and the YRBSS. The Biomedical Central journal
database contained peer-reviewed scholarly journals: Those
journals were the Nutrition Journal, the International Journal of
Behavioral Nutrition, Physical Activity, the American Dietetic Association
Journal, BMC Public Health Journal, the International Journal of Obesity,
and the American Journal of Public Health. I endeavored to collect
research on adolescent or school-aged child obesity,
bullying, youth and weapon violence, and physical activity.
The peer-reviewed journals were published within the last 5
years, unless the article was specifically pertinent to my
scope of study. In cases where there were limited journal
studies on a topic, I used different research engines with
keywords such as hours of television watching, bullying, physical activity,
and personal safety or neighborhood or community safety, came up
with similar topics, and was able to use them in the current
study.
Theoretical Base
SCT, and the safety component of Maslow’s (1954) theory
formed the foundation of the conceptual framework in the

53study. Self-perception theory is about how one views oneself
(Parada et al., 1999). Self- perceptions are not defined by
how other individuals may view an individual, but by
experiences formed with interpretation of one’s physical,
academic, and social environments (Parada et al., 1999).
Self-perception theory evaluates how adolescents may view
themselves, and if negative images or behaviors are found,
it is more likely the adolescent is socially impaired
(Parada et al., 1999). An example is a brother of an
adolescent who sells drugs in the neighborhood and the
observing brother begins to sell drugs in the same
neighborhood. The motivation to sell drugs may be the
observation and perception of the family member selling
drugs to gain profit. Figure 1 portrays the concept of self-
perception.

54
Figure 1. Self-perception theory postulates that an individual’s behavior is determined by his or her self-perception.
In addition, social factors and social-comparison
processes are very important in self-perception theory. As
an example, a student who scores high on academic tests may
view failing students as inferior and may not associate with
the failing students. This lack of association may create
low self-esteem and negative self-reflection for the failing
students. It may also create negative reinforcement because
this student may become angry and despondent, and the
failing adolescent’s behaviors may change adversely (Parada
et al., 1999). Anger and despondency may create a negative
self-perception such that the failing student may stop
trying academically, may become truant, and may contribute
to adverse peer relationships due to feelings of

55inferiority. In self-perception theory, perception is the
identity: failing adolescents may view themselves as
insufficient or inferior, which aligns with self-concept
theory. The negative perception or view of themselves that
failing students harbor or perceive may create negative
reinforcement.
Hattie and Marsh (1999, as cited in Parada et al.,
1999) noted that negative reinforcement is influenced by
idle talk and external agents that may affect adolescents.
This reinforcement may occur when a peer observes an
adolescent being bullied, tells other peers how that
adolescent is bullied, and repeats bullying behavior by the
observing peer. The negative reinforcement is the motivation
to bully. However, schools and communities play a part in
the self-perception of the adolescent being bullied. Parada
et al. (1999) noted a mystery occurs when bullying achieves
a sense of power and acceptance by the school community or
neighborhood as a natural phenomenon. Parada et al. found
bullies project a sense of false power through social

56reinforcement and adverse peer relationships, bullying
behaviors, and intimidation of their victims. Intimidation
of the bully victim may create a negative self-image of the
bully victim and negative perception among other peers.
Parada et al. noted schools, communities, and neighborhoods
that allow bullying to manifest in their midst create issues
where interventions are limited or unlikely to succeed.
I used self-perception theory to display how low self-
efficacy and negative self-perception may affect the bully
victim and influence bullying behaviors and violence among
the adolescent perpetrator and may also be an indicator of
victim inactivity. Some consequences of low self-esteem and
adverse relationships because of negative self-perceptions
among bully victims examined in this theory are low academic
performance, depression, suicidal ideation, increasing
injuries, increasing mortalities, increasing morbidities,
and adverse peer relationships that affect adolescents
(Parada et al., 1999).

57Social-cognitive theory. SCT is derived from the
social-learning theory proposed by Miller and Dollard (1999,
as cited in the “Social Cognitive Theory,” 2010). They noted
that if an individual is motivated to learn a particular
behavior, that behavior may be learned through observation
(see Figure 2). The individual observer’s imitation of those
behaviors may be positive or negative, according to what the
individual has observed. SCT is most commonly associated
with Bandura. Bandura (1999, as cited in the “Social
Cognitive Theory,” 2010) who noted that SCT is a learning
theory. The theory is based on what a person may learn from
watching others, and thought processes that are central to
understanding personality traits. Social cognitivists agree
that other individuals’ developments are learned through
behaviors displayed in environments in which one grows up
and may influence the belief of an individual person
(Bandura, 1999, as cited in the “Social Cognitive Theory,”
2010). Therefore, cognition has a marked impact on moral
development.

58
Figure 2. Social-cognitive theory postulates that through observation and motivation an individual may change behavior.
SCT emphasizes a major distinction between the
individual’s moral competence and moral performance. The
moral influence of others’ actions may bear on one’s
relationship with moral competence. Moral competence
involves the individual having the ability to perform a
moral behavior (Bandura, 1999, as cited in the “Social
Cognitive Theory,” 2010). An example is an adolescent of
sound mind and body committing a violent crime with the
knowledge of right and wrong. The adolescent has the ability
to perform morally and is not mentally impaired. The mental
capacity for morality is the concept of moral competence.

59Moral competence is what an individual may be capable of,
what an individual knows, what an individual’s skills are,
an individual’s awareness of moral rules and regulations,
and an individual’s cognitive ability to construct behaviors
(Bandura, 1999, as cited in the “Social Cognitive Theory,”
2010). Another example is adolescents who have knowledge of
drug law, but who continue to sell drugs in their respective
neighborhoods, communities, or schools, knowing the
consequences of their behavior may include imprisonment.
Educational background, family status, academic performance,
and self-perception of the adolescent may influence the
decision of the adolescent to sell drugs without moral
remorse or caring about imprisonment.
Part of the growth of cognitive-sensory processes is
moral competence; yet, there is still knowledge of right and
wrong. Moral performance is influenced by rewards and
possible incentives to act in a certain manner (Bandura,
1999, as cited in the “Social Cognitive Theory,” 2010). An
example would be a perpetrator extorting money from a victim

60because the extorting adolescent reinforces a monetary
reward. The reward of having monetary value causes the
adolescent to produce bullying behaviors. Bandura (1999, as
cited in the “Social Cognitive Theory,” 2010) illustrated
this portion of SCT, by showing how one observation of
violence and aggression may influence the observing
individual to be violent or aggressive. Youth violence,
aggression, and bullying are observed behaviors through
negative reinforcement that may influence another person
greatly (Bandura, 1999, as cited in the “Social Cognitive
Theory,” 2010).
The adolescent who watches violent programs and
observes rewards may want to repeat those same behaviors
(Bandura, 1999, as cited in the “Social Cognitive Theory,”
2010). In addition, adolescents may be frustrated with
parents because they will not listen to their problems, so
the frustrated adolescents may seek adverse peer
relationships (i.e., gang involvement or a bullying group).
This is the product of observed behaviors and false

61perceptions of belonging through the human-motivation effect
(Bandura, 1999, as cited in the “Social Cognitive Theory,”
2010).
SCT involves self-efficacy beliefs as proximal
determinants of the human-motivation affect (Bandura, 1999,
as cited in the “Social Cognitive Theory,” 2010). Human
motivations are actions in which motivation is learned
through intervening cognitive processes. An example is an
adolescent who wants to be part of a sports team, but fails
and turns instead to a gang. The gang allows a one-to-one
connection that meets the adolescent’s desire to be needed
(Bandura, 1999, as cited in the “Social Cognitive Theory,”
2010). Adolescents victimized by violent gang activity using
weapons and bullying behaviors may perceive feelings of
being unsafe.
SCT reinforced the present study by showing how
observations of adverse peer relationships, family criminal
activity, and inappropriate family functioning may influence
the observing individual to act in a certain manner. An

62example is an adolescent in the neighborhood observing a
family member or peer selling guns and receiving monetary
reward. The observing adolescent may try to replicate the
behavior. The replication of behavior creates safety
concerns. A safety concern that occurs from these behaviors
may create inactivity, unsafe feelings, obesity or an
overweight condition, possible homicide or weapons violence,
threatening with a weapon, and injuries. I used SCT to show
how observation of bullying and violent behaviors may
influence safety concerns and validate inactivity among
adolescents. The studies of Babey, Hastert, Yu, and Brown
(2008), Duncan, Johnson, Molnar, and Azrael (2009), and
McKenna, Hawk, Mullen, and Hertz (2011) supported this
concept.
Safety. The safety component of Maslow’s (1954) need
theory may explain the cause of inactivity: the perception
of feeling unsafe because of bullying. As a result of this
feeling, inactivity may appear to be the only choice, with
harmful consequences for adolescents: stroke, Type-2

63diabetes, heart disease, high blood pressure, high
cholesterol, obesity, and failing military physical-fitness
testing. The causes of these feelings may be bullying, youth
violence, and weapons violence. These causes violent
adolescents and create feelings of vulnerability, affecting
self-perceptions and motivation to exercise, and encouraging
excessive television watching. Maslow’s safety component is
used in the study to show how bullying may affect park
access and safe places in neighborhoods, communities, and
schools where exercise can occur. In addition, safety is a
variable because lack of safety may affect adolescents’
motivation to exercise. A study by Duncan et al. (2009)
supported this concept.
Key Variables or Concepts
In the State of Massachusetts, obesity rates among
adolescents have doubled in the last 17 years. In addition,
rising inactivity is raising concern for health status and
life expectancy among adolescents in the commonwealth of
Massachusetts.

64Inactivity Among Massachusetts Adolescents
The MDPH (2007) and CDC (2010b) used qualitative
narrative case studies that focused on rates of television
watching, inactivity, and Type-2 diabetes among adolescents.
The MDPH found that an adolescent who watches television 2
hours or more per day was associated with 23% (95% CI: 17–
30) increased risk of obesity and 14% (CI: 5–23) increased
risk of Type-2 diabetes. These statistics suggest that
inactive adolescents are more likely to have issues with
Type-2 diabetes and other health concerns including high
blood pressure, stroke, and heart disease. MDPH found that
nearly 49% of Massachusetts adolescents are inactive. The
MDPH noted that 49% of Hispanic, 46% of African American,
35% of Asian, and 27% of White Massachusetts adolescents
watch 2 hours or more of television daily. The study did
note that the percentage of adolescents who watched 3 or
more hours of television daily decreased over 7 years (35%
to 28%), but Hispanic and African American adolescents still

65showed increasing rates for watching 2 hours or more of
television daily.
The MDPH (2007) explored adolescents’ inactivity and
amount of television watching hours through the YRBSS, a
quantitative national research study from the CDC (2009d).
The results from the introductory phase were analyzed by the
MDPH using quantitative data from the YRBSS. Race was a
controllable variable in the study. The study did not
divulge all of the information from the YRBSS; yet, it
guided analyses in a quantitative manner to show readers how
the information was pertinent to bullying among
Massachusetts adolescents. The YRBSS study used samples from
all the high schools that contained ninth- through 12th-
grade students. The question asked for the dependent
variable of inactivity was as follows: “During the past 7
days were you physically active at least 60 minutes a day,
in which your heart rate increased and you breathed hard?”
Physical activity or inactivity variables were coded from a
to h for from 0 to 7 days. For the amount of television

66watching, the question asked was the following: “On the
average school day how many hours do you watch television?”
The responses were coded from a to g for the range from “I
do not watch television on an average school day” to “5 or
more hours a day.” The results were only described as rates
and were only from the introductory phase of the study.
Those rates were supplied earlier in the review.
The rates were presented as inactivity levels in the
YRBSS, as presented in Chapter 1, but the CDC supplied Type-
2 diabetes data and the MDPH used this information in the
current study. One limitation of the study was that only
Massachusetts students were included: middle school students
and high school students in other states were excluded.
Thus, the results may not apply to all middle and high
schools throughout the United States. However, only
Massachusetts high school students were included by design,
so selection bias is not a concern here.
I did not discuss further research and data in the
study, but did quantify the dependent variable, inactivity,

67and the independent variable, frequency of television
watching among Massachusetts adolescents. This study
introduced and demonstrated concern about inactivity among
adolescents in the State of Massachusetts, as well as its
effects and consequences.
Bullying and Violence Among Massachusetts Adolescents
As stated in Chapter 1, rates of bullying in the
Commonwealth among adolescents in Grades 9 through 12 have
increased in the last 10 years (CDC, 2009d). This is a cause
of concern because of injuries, mortalities, and
psychological manipulation that create depression, suicidal
ideation, and low self-esteem among adolescents. Bullying
with violence and coercion can be very dangerous to an
adolescent’s life expectancy and way of life (CDC, 2010c). A
study presented by McKenna et al. (2011) explored the
variable of bullying among Massachusetts middle and high
school students. Completed in 2009, the semiannual,
anonymous, paper-and-pencil Massachusetts Youth Health

68Survey was administered from January to June during one
class period (McKenna et al., 2011).
Sampling Strategy
McKenna et al. (2011) employed a survey research design
with a two-staged cluster sample. In the first stage,
schools were randomly selected to participate; the
probability of selection was proportional to the number of
students enrolled. In the second sampling stage, classes
were randomly selected to participate with the probability
of selection designed to ensure each adolescent had an equal
chance of being selected (Babbie, 2007). All students in the
selected classes were allowed to participate. The survey was
administered to 138 Massachusetts middle and high schools.
The sample included 2,859 students from middle schools and
2,948 students from high schools.
Measurements
McKenna et al. (2011) applied a measured weighted mean
to each survey record to adjust for school no response,
student no response, and distribution of students’ gender,

69age, and race/ethnicity. The survey asked questions directed
at students: “During the last 12 months how many times have
you been bullied at school?” Being bullied included being
repeatedly teased, threatened, hit, kicked, or excluded by
other students. The response categories ranged numerically
from 0 to 12 or more times. Adolescents who reported 12 or
more times being bullied were categorized as victims. In the
second stage, the survey asked, “Did you do any of following
in the last 12 months? (a) Bully or push someone around, or
(b) initiate or start a physical fight with someone.” Those
adolescents who responded yes to category (a) were
categorized as bullies; if category (b) was answered, the
targeted adolescent students were not considered, because
not enough information was known to display whether
initiating a fight may be considered bullying.
McKenna et al. (2011) noted the responses of the two
bullying questions were combined to create four mutually
exclusive categories: (a) bullies who responded they are
bullies, but themselves were not bullied, (b) victims who

70responded that they were bullied, but were not bullies
themselves, (c) victims who responded they were bullied and
they engaged in bullying themselves, and (d) those who
neither responded as bullies or victims. The questionnaires
for the middle schools and high school contained identical
questions regarding suicidal ideation, low academic
performance, family violence, being overweight or obese, and
tobacco and drug usage (McKenna et al., 2011).
Results
The results of the bivariate analysis showed the
percentages of each risk factor for the four mutually
exclusive categories: bullies, bully-victims, victims, and
neither. In addition, McKenna et al. (2011) noted
statistically significant differences among the weighted-
mean estimates, determined based on overlapping and
nonoverlapping 95% CI. The adjusted odds ratios (AORs)
controlled for age, race, group, and sex through logistic
regression. Also, noted by McKenna et al., the AORs were
considered not statistically significant if the CI was less

71than 1.0; any variable less than 1.0 would not have enough
value to be categorically significant for analysis. See
Table 4 for the detailed results.
Table 4
Adjusted Odds Ratios for Middle School Bullies and Victims
Variable Victims Bullies Bully-victims
Committing suicide with serious intentions
3.0 4.1 6.6
Being physically hurt 2.9 4.4 5.0Intentionally injuring oneself 2.3 3.1 7.4Witnessing violence in the family
2.6 2.9 3.9
Feeling sad or hopeless 2.3 2.1 4.2Needing to talk to someone otherthan a family member about feelings or problems
2.8 2.1 5.2
Note. Adapted from Bullying among middle school and high school students in Massachusetts, by M. McKenna, E. Hawk, J. Mullen, & M. Hertz, 2011, Morbidity and Mortality Weekly Report, 60, pp. 469. Similar patterns were observedamong high school students. Copyright (2011) by M. McKenna, E. Hawk, J. Mullen, & M. Hertz. Reprinted [or adapted] with permission.
Overall, the study gave pertinent data about risk
factors and showed a strong association between bullying and
family violence, substance abuse, witnessing family violence
encounters, low academic performance, depression, and
suicidal ideation. In fact, as noted by McKenna et al.
72(2011), the results differed from studies that found males
were more likely to be bullies and bully-victims. This study
suggested no significant differences were notable among
genders.
However, there were limitations in the study. The main
limitation noted by McKenna et al. (2011) was that the study
was cross-sectional so causal relationships could not be
identified. In addition, the lower response rate among
middle school students (55.8%) may have hampered
generalization, and the sample only included adolescents in
public schools, causing a possible selection bias: Students
in public schools are bullied more compared to private-
school adolescents. The investigator addressed this issue by
random sampling that limited generalization (McKenna et al.,
2011).
Additional studies should investigate causation between
variables. The purpose of studying bullying among
Massachusetts adolescents is to present issues that may
affect physical activity, thereby creating inactivity

73through feelings of being unsafe. Therefore, I examine
bullying and violence in relationship to physical activity
to observe if inactivity may be related to bullying among
Massachusetts adolescents.
Physical Activity and Inactivity
Physical Activity
In the United States, the CDC, WHO, and DHHS
established physical-activity guidelines for children and
adolescents: moderate-to-vigorous activity of 60 minutes or
more daily 5 days a week. A narrative case study presented
by WHO (2010) presented physical-activity guidelines for
children and adolescents in Canadian secondary schools.
Children and adolescents who engaged in 90 minutes of
moderate to vigorous physical activity per day met the
Canadian guidelines for physical activity. The Canadian
guidelines called for 30 minutes more than those in the
United States per day for physical activity, and the number
of days to meet the guidelines differs by 2 days. In both

74countries, moderate-to-vigorous activity is needed to meet
physical-activity guidelines.
Defining Inactivity
As defined by the WHO (2010), physical inactivity among
adolescents and children is a failure to exercise regularly
or failure to meet physical-activity guidelines including
moderate-to-vigorous activity (breathing hard, sweating, and
increased heart rates) at least 5 days a week for 60 minutes
or more per day.
Association of Physical Activity to Inactivity
The association between physical activity and
inactivity may be related to sedentary behaviors. Sedentary
behaviors, such as amount of time watching television,
amount of time playing video games, and amount of time using
computers or the Internet, adds to inactivity, causing
adolescents to be overweight or obese. Being overweight or
obese may create major health risks affecting adolescents’
life expectancy. Wong and Leatherdale (2009) presented a
quantitative analysis of 34,016 random sampled (n = 25,416

75actually completed the survey) students in Grades 9 through
12 from 76 secondary schools in Ontario, Canada. Students
were asked questions about the amount of time spent playing
video games, watching television, and surfing the Internet.
Students who did not finish the survey were excluded from
the study and were not part of the final data analyses. The
data were analyzed using SAS software and logistic
regression. Logistic regression analyses used in the study
tested physical activity in relationship to inactivity to
determine whether sedentary behaviors, sports participation
in school and out of school, and parental activity had a
relationship with adolescents being overweight or obese. The
sample students were categorized as high-active–low-
sedentary, high-active–high-sedentary, low-active–low-
sedentary, and low-active–high-sedentary. The differences
between the active scale and sedentary scale is that high
active adolescents met physical-activity guidelines and
sedentary adolescents did not meet the physical-activity
guidelines proposed by the investigator.

76Results. Wong and Leatherdale’s (2009) study showed
that more female adolescents in Grade 12 were low-active–
high-sedentary than students in the lower grades with
significance at p < .001. However, 11th-grade students
showed higher rates of inactivity, 54.8% compared to 35.7%
among ninth-grade students, 51.6% among 10th-grade students,
and 45.7% among 12th-grade students respectively. Inactivity
was strongly associated with sedentary behaviors (i.e.,
amount of time watching television, playing video games, and
using the Internet) in the low-active–high-sedentary
category. In fact, Wong and Leatherdale’s Table 2 showed
that low-active–high-sedentary behavior was higher among
adolescents than any other category. Alarmingly, their Table
2 showed higher body-mass index (BMI) among adolescent
students in the low-active–high-sedentary category. The low-
active–high-sedentary category may associate inactivity
among adolescents to being overweight or obese. However,
Wong and Leatherdale’s Table 2 showed that low-active–high-
sedentary adolescents were associated with three or more

77peers who were active. These results refuted the notion that
those who are inactive also have inactive peers. I examine
this issue in later sections.
Furthermore, Wong and Leatherdale’s (2009) Table 2
showed that adolescents who did not participate in
intramural activities, play organized sports, or participate
in sports outside of school were more likely to be in the
low-active–high-sedentary category. The lack of sports
participation and physical exercise after school was highly
associated with being overweight or obese among adolescents
in the study.
Wong and Leatherdale’s (2009) Table 3 displayed AOR by
gender, describing sampled overweight or obese male
adolescents (n = 268) and female adolescents (n = 225) in
comparison to underweight male and female adolescents. There
were 2,083 male adolescents and 1,526 female adolescents in
the total sample. The results showed, with significance at
the 95% confidence level (p = .45), that low-active–high-
sedentary males were more highly associated with being

78overweight than underweight or normal-weight male
adolescents (AOR = 1.60; CI: 1.01–2.58) compared to high-
active–high-sedentary male adolescents (AOR = 1.15; CI:
0.71–1.88); however, high-active–high-sedentary male
adolescents had less association than low-active–low-
sedentary male adolescents (AOR = 1.16; CI: 0.71–1.88). This
is a slight difference and may stem from the differences in
number of adolescent male responses. Low-active–high-
sedentary female adolescents had a significantly higher
association with overweight and obesity than male
adolescents (AOR = 2.24; CI: 1.23–4.09), and low-active–
high-sedentary female adolescents were more than likely to
be overweight than low-active–low-sedentary female
adolescents (OR = 1.53; CI: 0.78–2.99). The numbers clearly
suggest that inactivity may be associated with sedentary
behaviors, which may affect risk for being overweight or
obese.
Discussion. In summary, the study presented a strong
relationship between inactivity and sedentary behaviors.

79Low-active–high-sedentary male and female adolescents were
strongly associated with sedentary behaviors. The numbers
suggested inactivity among adolescents is detrimental to
health and increases risk for being overweight or obese. In
addition, the study had several limitations: Primarily, the
cross-sectional nature of the survey limited the ability to
make causal inferences. An example is that perceptions of
being overweight may predispose participants to high-
sedentary groups, or being in high-sedentary groups may lead
to overweight or obese perceptions (Wong & Leatherdale,
2009). The study also presented little data on ethnicity or
socioeconomic status (SES), hindering the ability to
determine whether physical activity varied by ethnic group.
Future studies should include ethnicity and SES to limit
selection bias and should validate causation between
physical activities and inactivity. I use this study to show
the relationship of physical activity and inactivity in
relationship to being overweight or obese among adolescents
in Grades 9 through 12.

80Consequences of Inactivity
The Relationship Between Type-2 Diabetes and Inactivity
Type-2 diabetes has been shown to be an important
consequence of inactivity. Type-2 diabetes, usually “an
adult onset,” is surfacing in the adolescent population
(CDC, 2010c). According to Shaibi (2008, as cited in Song
2008), Type-2 diabetes has a relationship with inactivity.
Song’s study was a qualitative narrative case study using
Shaibi’s experimental methodology to help present evidence-
based research between the variables Type-2 diabetes and
inactivity. Shaibi presented a clinical trial as an
experimental research design in which 40 adolescents with
Type-2 diabetes were evaluated for physical-fitness levels
and self-reported physical activity.
Results. None of the adolescent participants met age-
adjusted criteria for healthy fitness, and approximately 93%
of male adolescents and 94% of female adolescents scored
below the 10th percentile for maximal oxygen consumption. In
addition, the results described how adolescents who are

81physically inactive face issues, not only with early-onset
diabetes, but also with proper oxygenation and being
overweight or obese. The issue of proper oxygenation is
important because of the risk of CVD among adolescents.
Discussion. The study is limited because race and
gender were not mentioned. This may create selection bias,
as it was unknown whether the male and female adolescents
selected in the study were Caucasian, African American, or
Hispanic. The investigator suggested an ongoing study would
enhance validity and reliability. This may have been
suggested because the data and results may mature, creating
different results over a period of time. I used this study
to show how Type-2 diabetes is a consequence of being
inactive among adolescents.
Cardiovascular Disease Among Adolescents
A well-known sedentary behavior, excessive television
watching, may lead to CVD among adolescents who are
inactive. Little is known about CVD risk factors and
television watching among adolescents because CVD studies

82presented so far are geared to adults (Martinez-Gomez et
al., 2010). Martinez-Gomez et al. (2010) explored excessive
television watching, inactivity, and CVD and presented a
cross-sectional quantitative experimental design to relate
inactivity and CVD. The variable, time watching television,
was analyzed using a survey research design.
Sampling strategy. The survey’s framework consisted of
the Alimentación y Valoración del Estado Nutricional de los
Adolescentes [Food and Assessment of the Nutritional Status
of Spanish Adolescents]): 2,859 Spanish adolescents aged 8
to 18 were assessed in five different Spanish cities between
the years 2000 and 2002. The study also explored in more
detail a mainly Caucasian subsample of n = 214 male
adolescents and n = 211 female adolescents with complete and
valid anthropometry data and self-reported amount of time
watching television.
Measurements. Socioeconomic status was reported as the
educational achievement of the adolescents’ mothers. Parents
were informed and gave consent prior to the study. The study

83included measurements of BMI and television viewing. BMI was
measured by weight/height squared (kg/m2). Waist
circumference was measured using nonelastic tape around the
lowest rib margin and the pelvis. Martinez-Gomez et al.
(2010) noted the International Obesity Task Force’s age-
specific cutoffs. Television viewing among adolescents was
measured in hours/day. Adolescents were asked, “How many
hours a day do you spend watching television?” Response
categories included (a) none, (b) less than ½ hour, (c)
between ½ and 1 hour, (d) between 1 and 3 hours, (e) between
3 and 4 hours, and (f) more than 4 hours. Adolescents who
viewed less than 3 hours/day of television were classified
as low TV viewing, whereas adolescents who viewed more than 3
hours/day were classified as high TV viewing (Martinez-Gomez et
al., 2010).
The CVD variable was assessed by blood sampling.
Fasting blood samples were taken from participants. Blood
samples were tested for cholesterol, triglycerides, total
cholesterol, high-lipid density lipid protein (HDL), and

84glucose. Cholesterol levels, HDL levels, total cholesterol
levels, and glucose levels measured the CVD composite risk-
factor score. Analysis of differences among adolescents was
completed using an ANOVA (one-way analysis) for continuous
variables, and the chi-square test was used for categorical
data. The differences between nonoverweight and overweight
groups for CVD risk factors were assessed by an ANCOVA
(adjusted by age, sexual maturation, and race). In addition,
differences between weight status groups for continuous CVD
risk were assessed by ANOVA because the variables were
previously age, sex, sexual maturation, and race
standardization (Martinez-Gomez et al., 2010). Differences
between high-TV-viewing, and low-TV-viewing groups were
assessed by an ANCOVA adjusted by potential confounders, and
an ANOVA was used to assess continuous CVD risk score
(Martinez-Gomez et al., 2010).
Results. The results shown in Table 1 of Martinez-Gomez
et al. (2010) showed that male adolescents were taller and
heavier than were female adolescents, but there was no

85difference in BMI: 64.4 ± 13.3 for weight among male
adolescents and 1.7 ± 0.1 for height among male adolescents
versus 56.3 ± 10.6 and for weight among female adolescents
56.3 ± 10.6, and 1.6 ± 0.1 for height among female
adolescents was 1.6 ± 0.1. Values were assessed as means and
standard deviations as baseline characteristics of study
participants. Table 2 in Martinez-Gomez et al. (2010) showed
differences among weight-status groups: Adolescents
classified as overweight had less favorable values compared
to the nonoverweight group. Furthermore, Table 3 in
Martinez-Gomez et al. (2010) showed that adolescents in the
high-TV-viewing group were higher for waist circumference,
HDL, total cholesterol, glucose, and triglycerides. The
results presented in each table suggested that inactive,
overweight, or obese adolescents may have CVD risk factors,
including high glucose, high triglycerides, low HDL, and
high total cholesterol, compared to nonoverweight and active
adolescents.

86Discussion. The results give empirical evidence that
too much television watching and not enough activity are
harmful for any adolescent. A limitation of this study is
that its cross-sectional nature makes causal inferences
impossible. In addition, the one-time blood sample may not
be accurate enough to represent long-term lipid and
metabolic abnormalities (Martinez-Gomez et al., 2010).
Another limitation is that blood pressure was not assessed
in the study. Martinez-Gomez et al. (2010) noted that this
issue limited comparison with previous studies. This issue
was minimal because television viewing has been widely used
in studies, perhaps because objective measurements, such as
amount of time spent playing video games and TV management
are not usually feasible in population studies (Martinez-
Gomez et al., 2010). Future studies should investigate
causal relationships. I used this study to show how CVD risk
factors are associated with sedentary behaviors, such as
time watching television among adolescents.

87Stroke as an Indicator of Inactivity
Stroke is an early indicator of CVD among adults and is
becoming more prevalent among adolescents. The CVD issue is
related to overweight or obese adolescents. Notably, the CDC
(2010c) presented a qualitative study that used a narrative
case study and found children and adolescents have seen
increase in incidences of stroke, Type-2 diabetes, and
cardiovascular issues because of inactivity. The Stanford
University study website (2007) displayed a qualitative
narrative case study that explored stroke as an indicator to
inactivity because of physical activity levels of
adolescents and the consequences that ensued because of
inactivity. The consequences mentioned were Type-2 diabetes,
stroke, CVD, arthritis, asthma, and certain types of cancer
that were more likely observed in children and adolescent
that were severely overweight or obese. The Stanford
University report (2007) presented stroke as a major factor
because of inactivity and extra weight of an adolescent that
may cause pressure in the heart, and may affect the health

88of the adolescent severely. This was done by using key
informants and other qualitative studies to help present
evidence-based research. Overall, case studies may be
conducted in one time period and not provide enough
evidence, but the Stanford University provided quality
evidence from other studies to help support evidence. I used
this study to show how stroke is related to being inactive
and may affect the health status of adolescents.
Inability to Pass Military Fitness Entrance Exams
Inactive adolescents are more likely not to pass
military fitness entrance tests. Increasingly, adolescents
are failing entrance test into the military that may be
influenced by inactivity. According to Knapik et al. (2006),
a pretest–posttest cohort design that was quantitative in
nature was used to study three different groups of recruits.
Those three groups were a preconditioning group, a no
conditioning group, and a no-need preconditioning group.
Sampling strategy. The sampling units were basic
trainees and the sampling frame was randomly selected basic

89trainees of an army installation. The precondition group
consisted of 64 males and 94 females who failed the test,
but after training in the Fitness Assessment Program passed
the test (Knapik et al., 2006). The no-conditioning group
consisted of 32 males and 73 females who were allowed to
enter basic training even after failing the military fitness
testing. The no-need preconditioning group was those
recruits—1,078 males and 731 females—who actually passed the
entrance testing (Knapik et al., 2006). The measures of the
study were physical fitness, injury, and training. It was
noted in the initial setting of the preconditioning group
that recruits were overweight. Knapik et al. (2006)
introduced methodology by exploring age and gender data
obtained from the Warrior Training database.
Measurements. Height and weight data were obtained from
the reception center of each respective recruit home
designation. The BMI was calculated as weight/height
squared. Data analysis involved SPSS software 10.0 or 12.0
and was used for all analysis. Group differences from the

90posttest, which included proportions of graduates,
discharged, or newly started, were analyzed by a chi-square
test of proportions. The reason the investigator may have
used chi-square was to test for association of
characteristics among the groups based on the number of
recruits who failed the entrance testing compared to those
recruits who did not need physical preconditioning and those
recruits who were allowed into the military without physical
preconditioning (Triola, 2008). The pretest phase of the
study used a one-way ANOVA followed by the Tukey’s test. The
Tukey’s test is used in conjunction with an ANOVA to find
the means between each characteristic variable to show
significance of difference (Triola, 2008). The investigator
may want to show if significance of means was different
enough to discontinue the Fitness Aptitude Program (FAP).
Army officials used ANOVA and ANCOVA differently based on
significance. For instance, Weeks 5 and 7 ANOVAs were used
for army physical-fitness testing; but if there were no
significant differences, then an ANCOVA was used to analyze

91data. The reasoning was that the investigator did not have
to compare each group to a variable; if there were no
significant differences, the investigator would then just
have to compare groups (Knapik et al., 2006).
Results. The results, shown in Table 2 by Knapik et al.
(2006), indicated that no statistical test was performed
because of the lack of variance between push-up and sit-up
scores among recruits. The researchers’ Table 3 showed that
approximately half of the precondition group and no-
precondition male groups failed to perform the required
number of sit-ups in the initial phase and more than half of
the females failed their initial push-ups fitness testing
(χ2, 0.54); more than half the males failed the one-mile run
test (χ2, 0.79). Table 4 shown by Knapik et al. displayed
average means of years between 21 and 24, average means of
weight between 170 and 200, and average BMI means between
25.0 and 28.4 among males; and for females, means of 21–22
for age, and 137–146 means of weight, and the average means
for BMI was 23–25. In the precondition group significance

92was shown for extreme BMIs among male and female recruits
who did not initially pass the military fitness test (p <
0.001). The conclusion of the analysis showed that
overweight preconditioned recruits who initially failed the
entrance military fitness test and received FAP improved
dramatically over the nonconditioned group and the no-need
conditioning group. There were fewer discharges or injuries
at Week 7 of the army physical fitness testing. Knapik et
al. gave empirical evidence about how scores improved with
FAP. In fact, in Knapik et al. found more graduates and
fewer discharges were given to those who completed the
program among the preconditioned group over the
nonconditioned group.
Discussion. This study suggested that physical activity
is important to be successful in passing the entrance
fitness test in the military and those recruits who were
severely overweight and did not have an assessment program
were more likely not to graduate or were injured or
discharged. Recruits who received entry-level fitness

93testing and were provided FAP were less likely to be
discharged because of excessive weight or being unfit.
Investigators did not provide information about further
research, as this study was intended to do at one point in
time. This study showed inactive adolescents may have a hard
time passing military fitness entrance testing.
Mental Health Issues May or May Not be a Consequence of
Inactivity
Suicide and depression may be related to bullying and
violence, but the research on a relationship to inactivity
is limited. This is observed in the YRBSS among adolescents
in Grades 9 through 12. The YRBSS (2001, as cited in
Brosnahan, Steffen, Lytle, Patterson, & Boostram, 2004)
indicated that 28.3% of U.S. high school students felt sad
or depressed and 5% of adolescents ages 9 to 17 actually
developed chronic depression. In fact, based on YRBSS data
(2001, as cited in Brosnahan et al., 2004), there may be
detrimental consequences if mental health issues are left
alone and adolescents’ support system is weakened. An

94example is an adolescent who does not participate in any
sports activity before, during, and after school and whose
parents are working longer hours; the adolescent may face
feeling depressed. Depressed behaviors may be because of the
lack of peer relationships, perceptions of feeling unwanted,
and lack of guidance that may create screen-time behavioral
issues in relationship to the lack of supervision (CDC,
2010a).
Brosnahan et al. (2004) presented a quantitative cross-
sectional study using a survey design and logistic-
regression analyses to test the relationship between mental
health issues among Hispanic and non-Hispanic White
adolescents. The Nueces County Health District in Corpus-
Christi Texas conducted the study in collaboration with the
University Of Minnesota School Of Public Health. The
researchers used the survey of Healthy Youth/Healthy Adults.
The goal of the Healthy Youth/Healthy Adults study was to
increase awareness of the prevalence of overweight and obese

95adolescents in the Nueces School District in Corpus-Christi
Texas.
Sampling strategy. The sampling units were adolescent
students. The sampling frame was ninth- and 10th-grade
students in the Nueces School District. The actual samples
included 1,870 students who completed the survey at a 93.5%
response rate.
Measurements. Measurements used in the study were BMI,
YRBSS, physical activity (moderate-to-heavy physical
activity) and mental health (i.e., considering suicide,
planning suicide, and feelings of sadness or hopelessness).
The BMI was measured by height and weight using a physical-
balance scale and the measurement of YRBSS was analyzed by
demographics that included age, sex, and race/ethnicity
(Brosnahan et al., 2004). There were five sets of questions
about physical-activity participation and four questions
about feelings of depression and suicidal behaviors.
Examples of suicide questions were,

96• During the past 12 months, did you make a plan about
how you would attempt suicide?
• During the past 12 months, did you ever seriously
consider attempting suicide?
Feelings of sadness explored questions such as
• During the past 12 months, did you ever feel so sad
or hopeless almost every day for 2 weeks or more in
a row that you stopped doing some usual activities?”
Physical activity was measured by the amount of vigorous
activity and moderate activity. An example of a question
asked about vigorous activity was
• On how many of the past 7 days did you exercise or
participate in physical activity that made you
sweat, breathe hard, such as basketball, soccer,
running, swimming laps, fast bicycling, fast
dancing, or similar aerobic activities?
An example of a moderate-activity question was
• On how many of the past 7 days did you participate
in physical activity for at least 30 minutes that

97did not make you sweat or breathe hard, such as fast
walking, slow bicycling, skating, pushing a lawn
mower, or mopping floors?
Sports participation was measured by exploring the example
question:
• During the past 12 months, on how many sport teams
did you play (included were community or school
groups)?
These question provided validation of behaviors that
analyzed whether mental health issues may be related to
physical activity or inactivity.
Results. The analysis of data showed in Table 1 by
Brosnahan et al. (2004) revealed demographic characteristics
and physical-activity habits among adolescents according to
sex and ethnicity. Their Table 1 displayed that Hispanic
students had higher BMIs (p < 0.1) at 99% confidence than
non-Hispanic White students and all male adolescents showed
significance regardless of ethnicity/race for vigorous
physical activity and sports-team participation. However,

98Non-Hispanic White female adolescents reported greater
prevalence of frequent-to-moderate physical activity than
Hispanic female adolescents did (66 [44%] of 149 vs. 139
[29%] of 511). Also, noted in Brosnahan et al. Table 1 was
that there was no difference of frequency of vigorous
physical activity among non-Hispanic White and Hispanic male
and female teens. In addition, more non-Hispanic White
female teens than Hispanic female teens participated in
sports activity at their respective schools (88 [60%] of 149
vs. 228 [48%] of 511; p = 0.1). There was no difference of
ethnicity among male adolescents.
Brosnahan et al. (2004) presented Table 2 displaying
feelings of sadness and suicidal behaviors among adolescents
according to sex and ethnicity. Data displayed that more
Hispanic female teens reported feeling depressed or hopeless
than non-Hispanic White female teens (205 [40%] of 511 vs.
48[32%] of 149; P = 0.8) and non-Hispanic White male teens
considered suicide more than Hispanic male teens (28 [17%]
of 165 vs. 58 [10%] of 566; P = 0.2). Otherwise, no other

99differences were found. More female adolescents were likely
to feel sad or depressed compared to male adolescents, but
there were no significant differences for attempting suicide
(Brosnahan et al., 2004).
Table 3 by Brosnahan et al. described AORs of the risk
of sadness, considering suicide, and planning suicide among
Hispanic and non-Hispanic White adolescents participating in
physical activity. Table 3 by Brosnahan et al. results
showed that adolescents who engaged in more than six
sessions of physical activity compared to adolescents not
engaging in six sessions of physical activity were less
likely to consider suicide (OR 0.72; 95% CI: 0.65–0.79];
Brosnahan et al., 2004). In addition, Table 3 by Brosnahan
et al. displayed that adolescents who participated in sports
of highest vigorous activity significantly reduced the
chance of experiencing suicidal ideation (p < 0.05);
however, greater participation and physical education was
not significant for considering suicide among all
adolescents.

100Discussion. Overall, the study provided empirical
evidence that vigorous activity may help prevent planning
suicide, but does not have a causal relationship with
suicide among adolescent students in Nueces County. In fact,
physical-activity behaviors were inversely associated with
depression and considering and planning suicide. Brosnahan
et al. (2004) did note that other studies have found
associations between athletic involvement and risk for
suicide, as well as an association between moderate sport
activity and lower depression scores. The researchers also
noted other studies provided an independent but weak
association with lower depression scores and physical
activity. The assumptions made from this study are that
inactivity is not related to suicide or depression, but
moderate-to-heavy physical activity may help prevent
considering and planning suicide and depression or feelings
of sadness.
Brosnahan et al. (2004) found, based on the Youth Risk
Behavior Survey (YRBS, 2001) data, that adolescents who were

101inactive and did not participate on sports teams were more
likely to present characteristics such as low self-esteem,
fatigue, and poor physical fitness. These characteristics
may follow the adolescent into early adulthood making issues
of passing entrance military fitness testing an issue and
creating increasing health risk among adolescents.
Interventions involving suicide planning and depression
prevention may be enhanced by involving adolescents in
sports participation or some type of community and school
physical participation program along with physical
education, although direct causation is not noted. Future
studies of causation are warranted. I used this study to
provide evidence-based research about inactivity in
relationship to suicide behaviors and depression behaviors
among all ethnicities/races.
Causes of Inactivity
Introduction
Adolescents who have little supervision and resources
are more likely to be inactive. Inactivity yields many

102factors to consider: parents working more hours and children
left alone to supervise their own physical-activity
behaviors; increasing peer relations that may influence the
adolescent negatively; safety among minorities that reside
in unsafe environments; bullying and being threatened; and
extreme violence that includes weapons (CDC, 2011). A major
factor of inactivity among adolescents is sedentary
behaviors or screen-time behaviors that include the amount
of time watching television, playing video games, and
excessive usage of computers or the Internet.
Excessive Television Watching Contributes to Inactivity
Excessive television watching may contribute to
inactivity by limiting physical activity. Must and Strauss
(2005) noted that quality exercise is interchangeable
through frequency that includes time and sessions of
physical activity, and intensity that includes moderate-to-
vigorous exercise that requires sufficient energy
expenditure. A study by Loucaides, Jago, and Theophanous
(2011) used a quantitative methodology to analyze and

103describe the relationship between physical activity and
sedentary behaviors. Sedentary behaviors included television
watching, video (DVD) watching, playing video games, time in
front of the computer, studying or doing homework, talking
on the phone, listening to music, and the amount of time
traveling by car, bus, or motorcycle.
Measurement. Loucaides et al. (2011) noted physical
activity was measured by the YRBSS survey. The assessment
included four items modified from the YRBS (2009). Questions
asked intended to examine frequency of activity. Moderate
activity was measured by, “Physical activity that does not
make you sweat or breathe hard, such as, walking, slow
bicycling, and volleyball,” and vigorous by, “physical
activity that makes you sweat and breathe hard, such as,
running, playing basketball, or playing football” (Loucaides
et al., 2011, pg. 93). The responses were itemized on an 8-
point scale, and included responses ranging from, “no never
at all,” “up to one hour,” and “more than one and half
hours.” Loucaides et al. noted that the YRBS survey has good

104validity with congruent validity with accelerometry. This
meant the instrument was valid and reliable across the
instrument. Sedentary behaviors were measured by asking,
“The amount of time spent television watching, playing video
games, on the computer, on the phone, studying or doing
homework, talking on the phone, listening to music, and
amount of time traveling in car, bus or automobile.”
Response categories consisted of items on a 6-point scale
and ranged from, not at all to more than four times (Loucaides et
al., 2011).
Sampling strategy. The sampling strategy included
adolescent students from 25 school districts in the republic
of Cyprus. The sampling units were adolescent students. The
sampling frame included six students from nine elementary
schools (n = 448), Grade 7to 9, students from six middle
schools (n = 656), and Grades 10to 12 from five high schools
(n = 479) and from five technical schools (n = 383). Letters
were sent to head-teachers of each school for informed

105consent, and Loucaides et al. (2011) noted all head-teachers
gave their consent.
Results. The data analysis from Loucaides et al. (2011)
included Table 1, showing internal consistency after,
“deleting” the items per hour per day studying. The
investigators may have deleted this item, so internal
validity would not be compromised. The Cronbach’s alpha was
greater for screen-based sedentary behaviors (a = .712),
compared to nonscreen-based sedentary behaviors (i.e.,
talking on phone, listening to music, and traveling in bus,
car, or motorcycle; a = .674), and between two factors was
extracted to explain the 57.70 variance, with the Bartlett
Test of Sphericity χ2 (21) = 2,848, p < 0.1. These numbers
suggest the hypothesized association was unparallel and
significant at 99% confidence, and may measure overall value
without the independent or dependent variable (Triola,
2008).
Loucaides et al. (2011) noted students were classified
as physically active if they participated in moderate-to-

106vigorous physical activity for at least 60 minutes per day
for 7 days and were considered to satisfy the recommendation
for daily time watching television if they watched 2 or less
than 2 hours of television per day. Data analysis measured
independent samples ttests by examining potential
differences between male and female adolescents and
physically active and inactive students across the eight
sedentary behaviors and the weekly frequency of sports-club
attendance. Also noted by Loucaides et al. was that effect
sizes (Cohen’s d) were also calculated to examine the
practical significance of the differences between group
means; and chi-square tests were used to examine potential
differences in the percentages of adolescents across gender
and level of education that satisfied the physical activity
and television-viewing recommendations.
Loucaides et al. (2011) supplied Table 2, giving
specific results of descriptive statistics: on average more
male teens attended sports clubs compared to female teens,
who watched significant amounts of television, but female

107teens watched more television mean, 2.8 for male teens, and
2.6 for female teens (2.96 < 0.001). According to Loucaides
et al., their Table 4 showed that male and female
adolescents who attended sports clubs more than twice were
associated with watching less than 2 hours of television and
were more active (Unadjusted OR, 0.9; 95%, CI: 0.7–1.2 for
male teens (n = 937) and for female teens, (unadjusted OR,
1.6; CI: 1.2–2.1, AOR, 1.5; CI: 1.1–2.1). Loucaides et al.
showed, in Table 4, that they used logistic regression to
test each independent variable against each dependent
variable.
Discussion. In summary, the study provided prevalence
factors to test sedentary behaviors for a relationship to
physical activity and inactivity. The study showed that
empirical evidence of sedentary behaviors may be limited by
physical activity whether it is in sports clubs or other
sport organized activities. The results of the study suggest
that the amount of time watching television should be
reduced among adolescents. Loucaides et al. (2011) did note

108that less than half of adolescent met the guidelines for
physical activity (52.4%), and interventions need to be
implemented to achieve a healthy status among adolescents.
The limitations of the study were that race and SES
were not evident in the study. This could create bias for
race and family status, as it is unknown about how sedentary
behaviors are affected by race and family environment in
conjunction with the variable physical activity. In
addition, socioeconomic levels may have biased the results,
creating a viable reason why SES was not used in the study.
The tables provided strong empirical evidence quantifiably
and measured each variable sufficiently, as described in the
study. The investigators did not suggest further research in
the study. Although, the study was minimized to meet the
needs of the current variables in the study, and results
contrasted with other studies, the authors suggested that
there may be gender differences among sedentary behaviors
and physical activity or inactivity. I used this study to
show how sedentary behaviors may affect adolescent activity

109levels and how participation in sport clubs or sports
organization may help inactivity levels.
Physical Activity, Inactivity, and Socioeconomic Status
Adolescents who reside in lower income neighborhoods or
live in poverty and whose family structure is weak may
observe a decline in physical activity, resulting in the
adolescent becoming inactive. In addition, family-structure
factors such as parental educational levels, parental skill
level, and parenting style played a strong part in the
activity levels of the adolescent. The LaTorre et al.
collaborative group (2006) explored the relationship of
physical activity and SES among Italian adolescents. LaTorre
et al. using a quantitative study to describe the
relationship between physical activity and SES related to
the family structure of the adolescent participant. A survey
design was implemented to describe physical-activity levels
of male and female adolescents in the following regions:
Lazio, Abruzzo, Molise, Campania, and Puglia during the
school year 2002–2003.

110Sampling strategy. Approximately, 2,411 randomly
selected students participated in the study with a response
rate of 94.5%. Sample size was adequate.
Results. Table 1 from LaTorre et al. (2006) provided
evidence about the characteristics of the adolescents’
parents. Table 1 showed that parents, unskilled workers and
homemakers without a strong educational background, were
less likely to be active and their children were less likely
to be physically active. LaTorre et al. showed Figures 3 and
4 in the study, which also supported this contention. This
provides evidence that the families’ SES may affect their
child’s or adolescents’ ability to exercise.
Discussion. The meaning of this may be that
insufficient financial resources prevent the ability to
exercise outside the home or buy home equipment to exercise
properly. Most of the studies reviewed prior to this study
showed that minorities (e.g., African American and Hispanic
people) are limited by SES that affects inactivity levels.
Yet, this study provided strong evidence-based research

111about how socioeconomic levels may affect all races and
ethnicities.
Adolescent’s Inactivity and Parent’s Working Hours Have
Shown Association
According to LaTorre et al. (2006), parents working
longer hours may contribute to adolescents’ inactivity
behaviors. Unsupervised children are more likely to be
inactive (CDC, 2010a). LaTorre et al. explored the
relationship of inactivity to SES among Italian adolescents.
LaTorre et al. used a quantitative study to describe the
relationship between inactivity and SES related to the
family structure of the adolescent participant. For this
part of the study, a survey design was implemented to
describe physical-activity levels of male and female
adolescents in the following regions: Lazio, Abruzzo,
Molise, Campania, and Puglia during the school year 2002–
2003.

112Sampling strategy. Approximately, 2,411 randomly
selected students participated in the study with a response
rate of 94.5%. Sample size was adequate.
Results. The results showed the frequency of
extracurricular physical activity performed during the week
had strong association with the work level of both parents,
with a statistically significant difference between fathers
(χ2 = 8.229; p = .0048), and mothers (χ2 = 28.321; p
< .0001). These numbers suggest that parents with lower
educational attainment who work minimum-wage jobs may work
longer hours; however, parents with higher educational
attainment may work fewer hours, limiting inactivity among
children and adolescents. The LaTorre et al. (2006) group
presented Table 2, showing, through multiple logistic
regression, that father’s educational level had a direct
relationship with their children’s activity levels and
parents’ physical-activity levels (OR = 1.58; 95%, CI: 1.24–
2.02 for fathers, and OR = 1.33; 95%, CI: 1.04–1.71 for
mother’s activity levels).

113Discussion. This study provided strong evidence-based
research for how a family’s SES may affect the ability of
the adolescent and parent to exercise successfully. Notated
by LaTorre et al. (2006) was that the SES of the family,
parental educational levels, and low profitable work
activities may negatively influence adolescent participation
activity levels. This in turn affects the health status of
the adolescent. In addition, LaTorre et al. suggested that
Italian families with parents who have lower educational
attainment work longer hours and inactivity becomes evident.
Low-income Italian families working longer hours and more
than three occupations result in less time at home with
adolescents. In addition, LaTorre et al. found very strong
relationships between parent educational levels,
adolescents’ physical activity, and their BMI levels (being
overweight and obesity). In contrast, LaTorre et al. noted
that higher family incomes have an association with low
sedentary behaviors and family working hours in central
Italy. This may prove that families with higher educational

114levels and higher income levels are more likely to create
opportunities to exercise; therefore, are more equipped to
maintain health and limit sedentary behaviors.
The study had limitations. Those limitations were
concerns about internal validity because of randomly sampled
participants and use of a survey questionnaire. The
reasoning is that because misclassification of bias of
exposure (SES) and physical activity (outcome) are not
correctly identified. Another limitation is self-reported
responses may create bias where answers and perceptions of
those participants from previous experiences are influenced
in their responses. This was addressed by not biasing the
survey questions and testing for internal validity (LaTorre
et al., 2006). Further studies should consist of a
longitudinal study that examines SES levels over a period of
time. The reasoning is to provide validity and reliability
over a period. The study provided evidence that family SES
includes income levels, educational levels, and occupational
levels and may have a relationship to adolescents’ physical

115activity. I used this information to show how parents’
working hours, in turn, affect SES, and affect adolescents’
activity levels.
Bullying
Bullying Among Adolescents Introduced
Bullying is a strong form of youth violence. Bullying
includes physical attacks or harm caused by physical hitting
or punching and verbal abuse. The verbal nature of bullying
includes name-calling and teasing. The effects are
astronomical among adolescents. Adolescents bullied are more
likely to have psychological (depression and suicide) and
relational (rumors or social exclusion) problems that affect
the adolescent negatively (CDC, 2011). A recent survey by
the YRBS of 2009 displayed that 20% of adolescents reported
being bullied on school property or in the neighborhood in
the 12 months preceding the survey.
Defining Bullying
Scientific literature has several different terms for
aggressive peer relations: bullying, harassment, and

116victimization. Yet, all of these terms have a relationship
in defining bullying. Eisenberg and Aalsma (2005) noted
bullying refers to behavior that causes physical harm to an
individual by kicking, hitting, or punching that is
aggressive and intends to harm. In addition, the frequency
of bullying and interpersonal relationships caused by a
power imbalance of aggressiveness is a form of bullying.
There are distinctions between direct and indirect bullying.
Direct bullying is the form of bullying that includes
kicking, pushing, punching, or biting through aggression;
indirect bullying affects relationships as rumors create
depression or suicidal ideation among targeted individuals.
It affects adolescents in different ways: some adolescents
may become unsocial, others may become despondent,
depressed, or suicidal.
Types of bullying. Many different terms describe
bullying: direct and indirect bullying, cyberbullying,
racial bullying, and gender bullying are all forms of
bullying. These forms of bullying are encompassed in

117traditional and electronic bullying. A study by Raskauskas
and Stolz (2007) used a quantitative survey design that
examined the relationship between electronic bullying and
victimization and traditional bullying and victimization.
The hypotheses supported by Yarza and Mitchell (2004, as
cited in Raskauskas & Stolz, 2007) is that adolescents who
are victimized become increasingly likely to be perpetrators
of electronic bullying and traditional bullying.
Sampling strategy. The sample size was 84 adolescents
between 13 and 18 years of age (M = 15.35, SD = 1.26). The
sampled adolescents who participated were identified as
Caucasian (89.3%), Hispanic (3.6%), African American (3.6%),
Asian (2.4%) and other (1.2%).
Measurements. Computers with e-mail (90.5%), cell
phones with text messaging (64.3%), webpage building
software (34.5%), and picture phones (27.4%) were used as
measurements of electronic bullying. Other measurements
included demographic information and an Internet-experience
questionnaire. Demographic information collected from

118adolescents was age, grade, and ethnicity. Also included was
information about the adolescents’ access to the Internet,
e-mail, and cell phones. The questionnaire included 28 self-
reported items of different forms of Internet and
traditional bullying.
Results. Results shown from Raskauskas and Stolz (2007)
in their Table 1 described the incidence of traditional and
electronic bullying and victimization. The results showed
that fewer teens identified themselves as perpetrators of
electronic bullying (n = 18) compared to being victims of
electronic bullying (n = 41). The difference may be due to
underreporting of electronic-bullying behaviors. Electronic
bullying is not explored as much as traditional bullying
because electronic bullying is more likely to be related to
sedentary behaviors (i.e., frequency of watching television,
frequency of video-game playing, and frequency of computer
use) that is mainly affected by electronic bullying.
However, traditional bullying is likely to be related to
bullying and violence, which are variables of interest in my

119current study. Therefore, I examined these variables more
closely. Raskauskas and Stolz noted that traditional
bullying is often underestimated, caused by the minimizing
of involvement of bully’s victims who may not want to recall
such an event.
Relationship Between Traditional and Electronic Bullying
The relationship between electronic and traditional
bullying was evident with electronic bullying. Raskauskas
and Stolz’s (2007) Table 2 validated the relationship by
using a chi-square analysis that showed there are greater
numbers of electronic bullying victims than traditional
bullying victims and the number of traditional victims
involved in electronic bullying (n = 35) was larger than the
number of traditional victims not involved with electronic
bullying (n = 25; Raskauskas & Stolz, 2007). Raskauskas and
Stolz noted the chi-square analysis validated this concern
χ2 (1, N = 84) = .255, p = .61. The numerical variables
showed limited association between traditional and
electronic bullying. In addition, victims’ wanting to have

120revenge against the perpetrator was not supported. An
example is using the computer to attain revenge against a
traditional bully.
This is important to know because the notion that
electronic bullying may lead to violence is not observed in
the study. Raskauskas and Stolz’s (2007) Table 3 used the
phi correlation matrix, displaying that traditional and
electronic bullying was not correlated to victimization, but
is correlated to all other types or forms of bullying.
Conversely, all other forms were correlated to
victimization; however, traditional and electronic bullying
were not related. The correlation of the phi correlation
matrix was used to show whether correlation was warranted
between victims and forms of bullying. Raskauskas and
Stolz’s Table 4 tested the hypothesis that would predict
victimization in electronic bullying and the alternative
hypothesis that victims of traditional bullying would be
perpetrators’ of electronic bullying. The results showed
that the first hypothesis was warranted for traditional

121bullying, which would predict the same status as electronic
bullying; however, traditional victims do not tend to be the
same individuals as electronic bullies.
Discussion. Overall, the results showed that not all
bullies are involved with electronic bullying. Traditional
bullying was the preferred bullying style. Raskauskas and
Stolz (2007) did note that future studies should involve an
attempt to identify characteristics that separate
traditional bullying from electronic bullying. In addition,
future research of indicators of Internet victims should
identify the risk of the children or adolescents involved.
The reason may be the developmental stage of adolescents,
family supervision, and peer-group characteristics that may
predict the outcome of these differences (Raskauskas &
Stolz, 2007).
The limitation of the study was that the sample size
consisted of mostly Caucasians. Therefore, this issue could
create sample bias and affect the generalization of findings
(Raskauskas & Stolz, 2007). Sample bias is warranted because

122the sample was obtained from youth development events. Those
participants may have had a preconceived notion about a
prior experience; thereby biasing the findings. In addition,
different periods were used. For instance, traditional
bullying was queried for the last month, whereas electronic
bullying was for the last year. The researchers noted that
different periods would not affect the results. I used this
study to show that not all bullying behaviors are the same
in relationship to victimization, and different bullying
behaviors may produce different victimization results.
Consequences. Bullying has major consequences. Bullying
is among the most common form of violence in our society and
communities. Noted by Fight Crime: Invest in Kids (2003),
Harris and Willoughby (2003), Canter (2003), Bowman (2001),
and Northwest Regional Educational Laboratory (2001, all as
cited in Roskamp, 2008), 30% of adolescents in Grades 6
through 10 are either perpetrators or victims of bullying.
Bullying starts in the early adolescent stages and continues

123until it decreases right before high school graduation
(Roskamp, 2008).
Verbal abuse. Verbal abuse is the most prominent form
of bullying. Verbal abuse consists of comments about
physical appearance (Shelly, 2002 as cited in Roskamp,
2008). Verbal abuse is a form of bullying that creates
social isolation, teasing, and social exclusion of a child
or adolescent. Shelly presented a qualitative analysis in a
narrative format about verbal abuse that affects adolescents
in the form of bullying. Shelly noted other forms of
bullying: verbal abuse may lead to physical violence,
threats, theft, sexual and racial harassment, and public
humiliation. Male and female adolescents are both involved
in bullying. Bullies exhibit aggression toward their
intending victims. Bullies have positive attitudes toward
violence and more likely dominate their intended victims.
Issues arise when physical violence and other consequences
occur as a response to verbal abuse. Those consequences are

124low-academic performance, social isolation, depression,
suicidal ideation, morbidities, and possible mortalities.
Low academic performance. Children who experience
bullying tend to have difficulty concentrating on
schoolwork. Shellard (2002) and the Office of Juvenile
Justice and Delinquency Prevention (2001, as cited in
Roskamp, 2008) used a qualitative narrative case study that
explored the phenomenon of low academic performance and
bullying. Shellard used self-perception theory to show that
how an adolescent student views themselves in relationship
to bullying reflects on how they may perform in school
academically. Low academic performance had a relationship
with decreasing grade average, student absenteeism, dropout,
and a sign of loneliness (Roskamp, 2008) Low academic
performance was also associated with trouble making social
adjustments. An example is an adolescent being angry at a
family member or peer and behaving poorly as a response to
what they are experiencing from the bullying perpetrator.
Victims also have issues with difficulty making friends, and

125poor relationships with classmates. Low academic performance
may lead to victims becoming aggressive, replicating the
behavior of the perpetrator, and wanting revenge, thus
creating a situation where physical violence may manifest
itself. This issue may lead to higher health costs and
costly injuries to the adolescent victim. The limitation of
this study was that it was a single-time case study.
However, validity was not negated because of the empirical
evidence of how bullying may affect academic performance
among adolescents, and by undergirding the study with other
evidence-based research studies.
Bullying and injuries. The CDC (2010c) found that
increasing health costs and unwanted injuries are results of
physical violence. So far, in reviewed literature injuries
are more likely to occur with physical violence. Bullying
has a relationship with physical violence, and creates
unwanted injuries. This was evident in the study by Stein,
Dukes, and Warren (2007) who used a quantitative cross-
sectional survey design.

126Sampling strategy. The study sampled adolescents in
Grades 7 through 12 and examined the variables of delinquent
behaviors (e.g., brought weapons to school and frequency of
drug use), psychological behaviors (e.g., low self-esteem,
depression, and feelings of emptiness), and injuries (e.g.,
at school, going to school, at home, and in the
neighborhood) including frequency of injuries and numbers of
trips to doctors. Stein et al. (2007) presented research
that was formidable, describing many consequences of
bullying; however, I explored the injury part of the study
for this section.
Sampling. The sampling units were students. The
sampling frame was adolescents in Grades 9 through 12 in
four middle school and two high schools in suburban Colorado
school districts. The sample size was 2,902 adolescent
students, in which 1,451 were male. The sampling size was
adequate for this study based on analyzing testing supported
by investigators. The response rate was 67% and the basis of

127responses came from questions about bullying and
victimization.
Measurements. A table of questions was displayed.
Demographics showed four dichotomous variables for
race/ethnicity that included White, African American,
Hispanic, and mixed. An injury questionnaire was presented
in a scale format that included never, sometimes, neutral,
frequently, and always. Each category was coded from 1 to 5
with 1 = never. Questions about injuries in the neighborhood,
at school, going to school, at home, and coming from home
presented an idea about the severity and association of
injures from bullying, where they occurred, and the number
of hospital visits from injuries. Stein et al. (2007) noted
that four items indicated injury. Those items were “During
the last 12 months, how many time have you been injured by
someone enough to need bandages or a doctor?” Individual
questions included at school, going to school, or in my neighborhood.
Injury was a latent variable and the authors used

128correlation to compare injury to problem behavior,
psychosocial issues, school attitudes, and grades in school.
Results. Results showed that problem behavior was
significant at 99% confidence and correlated at r = .43 with
injury among bully-victims, and victims (r = 0.65). The
number suggests that victims of bullying who experienced
physical violence, including from weapons, were more likely
to be injured or frequently visit the doctor.
Discussion. This study results suggested that bullying
behaviors affect injuries and may increase health costs,
supporting the hypotheses of injuries having a relationship
with bullying. The study had several limitations. The first
limitation was that the United States was the only point of
reference; therefore, cultural bias could become an issue
(Stein et al., 2007). The investigators mitigated this
limitation by displaying the conduction of this phenomenon
in a variety of nations and cross-nationally. An example
noted by Stein et al. (2007) is that their findings
corroborated the findings of Kokkinos and Panayiotou (2004,

129as cited in Stein et al., 2007) in Cyprus; whereas other
results supported the findings of disadvantages of bully-
victims of Veenstra et al. (2005, as cited in Stein et al.,
2007) in The Netherlands and Kumpulainen and Rassanen (2000,
as cited in Stein et al., 2007) in Finland. However, noted
by Stein et al. was that weapon possession may be more
applicable in the United States compared to other countries.
In addition, Stein et al. noted that further research should
study relationships of bullying that are common among female
adolescents; additional measures should include social
shunning, verbal abuse, mocking, and snubbing that would
allow the investigator to examine both male and female
adolescents, and psychosocial variables. Overall, the study
offered strong evidence-based research about injuries and
bullying and the victims of those who experience bullying.
Although the study was male dominated, it gave empirical
evidence of the relationship of bullying and the whereabouts
of injuries and where they may occur. I used this study to

130show how bullying victims and injuries are correlated to
psychosocial behaviors of the bullying perpetrator.
Bullying and Victimization Among Minorities are Increasing
Bullies’ victims among minorities are increasing.
Minorities that are bullied face major consequences related
to being victimized: lack of health and even life
expectancy. Two minority groups that face issues with
bullying and victimization are African American and Hispanic
students. Peskin, Tortolero, and Markham (2006) examined the
relationship of bullying and victimization among Hispanic
and African American adolescents in five secondary schools
in Texas. Peskin et al. presented a quantitative study that
used a survey design.
Sampling strategy. There were eight secondary schools
sampled: three middle schools and five high schools. The
sampling strategy included sampling units of adolescent
students; the sampling frame was adolescent students in
Grades 6 through 12.

131Sampling. There were 1,566 surveys collected and
students missing values on at least three bullying and
victim questions were not analyzed (n = 51) leaving the
sample size at 1,413 (Peskin et al., 2006). The descriptive
statistics were computed first. The analyses of gender,
race/ethnicity, and grade level were computed for bullying
and victims, and an alpha of 0.05 was used for significance.
Of the overall sample size, 7% were classified as bullies,
12% as victims, and 5% as bully-victims.
Measurements. Measures used in the study consisted of
bullying and victims, as well as gender, race, ethnicity,
and grade level. Also included were general classifications
of bullies and measurements of covariates. The bullies and
victims included demographics such as age gender, race,
ethnicity, and grade level. Peskin et al. (2006) presented
Table 3, which listed behaviors and questions asked in the
survey. General classification consisted of victims
classified as those students who reported that at least one
of the “victim” behaviors happened to them at least three

132times in the past 30 days. Mutually exclusive categories
were constructed: (a) bullies, (b) victims, (c) those who
reported both bullying and being a victim (bully-victim),
(d) students reporting neither behavior. The covariates were
age and grade; however, for analysis 11th- to 12th-grade
students were combined due to their small number (Peskin et
al., 2006). In addition, other racial groups were excluded
because 95% of students classified themselves as African
American or Hispanic.
Results. The results described in Peskin et al. (2006)
displayed Table 1, showing that 60% of the sample was female
and 64% identified as Hispanic. Of the sample size, 60% were
sixth- to eighth-grade students; ninth-grade students
composed 11% of the sample and 11th–12th grade adolescents
made up one third of the sample. An issue with uneven
samples is that Scranton errors may occur. Scranton errors
examine four main types of analysis and data collection; an
error indicates data may become skewed (Triola, 2008). To
alleviate this issue noted by Peskin et al. (2006), quality-

133control checks were made to help resolve the problem.
Furthermore, Peskin et al. presented Table 2, showing
differences in race/ethnicity of their sample. An example
displayed was that although females and males were similar,
African American students were more likely to be bullies
than Hispanic students (8% vs. 6.5%), victims (15.3% vs.
10.1%), and bully-victims (8.6% vs. 3.7%). Among grade-level
differences ninth-grade students shown higher prevalence for
bullying (11.5%), and sixth-grade adolescents displayed a
higher prevalence for victimization, but prevalence
decreased through the 12th grade (from 13.1% to 7.5%). In
addition, Peskin et al. noted 4.5% to 9.4% of participants
were involved in bullying behaviors daily in the 30 days
prior to the survey. Males were more likely than females to
be involved with bullying and females were more likely to be
victims (11% to 7.4%). In addition, the results showed that
more African American students in low-income neighborhoods
were likely to be involved in bullying and victimization
than Hispanic adolescents. Although adolescent Hispanic

134students’ statistics were very significant, they were not as
prevalent as adolescent African American students. African
American adolescent students were likely to be victims of
name calling, being hit, or being pushed than Hispanic
students.
Discussion. The study gave empirical evidence that
bullying and victimization were evident among African
American adolescent students, Hispanic middle school
adolescents, and high school adolescents. Demaray and
Malecki (2003, as cited in Peskin et al., 2006) found few
studies reporting prevalence estimates for specific types of
bullying, limiting comparisons, and noting the research gap.
Demaray and Malecki did not find that similar behaviors such
as name-calling and making fun of others were prevalent
among 500 predominantly Hispanic students. In contrast, the
study found no significant differences among gender for
bullying and being victims. This contrasted with other
studies that presented significant differences among genders
for bullying and victimization.

135In addition, Peskin et al. (2006) noted limitations of
the study showed that higher risk students may have not
participated in the survey, creating selection bias; this
may have been due to not returning consent forms. In
addition, the existing scales may not have classified
bullies, victims, and bully-victims. The issues were dealt
with by using existing research that used the definition of
bullying to make these classifications. Peskin et al. noted
further studies should reinforce intervention to reduce
prevalence among minority urban youth. I used this study to
show that minorities in low-income neighborhoods face issues
with bullying and victimization. Bully-victims may have
psychological issues from being bullied.
Psychological Issues From Bullying
Psychological issues from bullying consist of
depression and social isolation (DHHS, 2010). These
variables may limit life expectancy and create issues among
adolescents that continue into early adulthood (CDC, 2010c).
Low self-esteem and depressive symptoms are more likely to

136have a relationship with bullying. Children and adolescents
who are victimized are more likely to be a risk for
depression and low self-esteem. Another variable, suicidal
ideation, is limited in research related to bullying.
Further research may include suicidal ideation in causal
relationship with bullying (CDC, 2010c).
A study presented by Guerra, Williams, and Sadek (2011)
used a sequential explanatory strategy of a mixed-method
approach to describe how suggestive depressive symptoms,
self-esteem, and normative beliefs among adolescents are
affected by being a bully-victim. The first phase of the
study was quantitative and the second phase was qualitative.
In the first phase, the survey research design was used to
predict whether self-esteem and depressive symptoms may have
a relationship with the variable bullying. The survey
measured different variables in relationship to bullying.
The different scales measured bullying perpetration,
victimization, and self-esteem, and suggested depressive
symptoms, normative beliefs about bullying, and perceptions

137of school climate in relationship to being a victim of
bullying.
Quantitative Method
Measurements
Bullying perpetration was measured by asking, “I teased
or said mean things to their face,” or “I spread rumors
about the student or adolescent behind their back” (Guerra
et al., 2011). The focus was to explore the targeted
population as weaker, and not than the bully perpetrator
(Guerra et al., 2011). This was established by questioning
examples, such as, “I picked fights with students I know are
weaker than me.” As a pretest item, the questionnaire
explored bullying perpetration in Year 1 of the study.
Guerra et al. (2011) measured these items as, “Mark how
often these things have happened in the previous year?”
Responses were itemized as, never, one, two times, several times,
or a lot, Guerra et al. noted another variable, victimization,
was adapted by using the 4-point scale from Hong and
Espelage (2003). This scale was designed to explore physical

138and verbal victimization. Guerra et al. noted the items,
time referent, and response categories were similar to the
variable of bully perpetration.
Self-esteem and a suggestive depressive-symptom
variable was measured using a 10-item scale adapted by
Rosenberg’s (1965, as cited in Guerra et al., 2011) self-
esteem model. This scale was a reliable and valid instrument
that measured studies over a period of years. The example of
questioning was not provided for this instrument in the
study; however, responses were categorized as, “I feel that
I have a number of good qualities,” and ranged on a 4-point
scale: strongly disagree, disagree, agree, and strongly agree (Guerra
et al., 2011). Guerra et al. noted the alpha coefficient was
.75. This number suggests there is a moderate amount of
internal consistency that hinges on reliability and validity
with the scale used for the selected variable (Triola,
2008).
Normative beliefs about bullying were measured using
the adapted version of the 6-item scale from Huessa and

139Guerra (1977, as cited in Guerra et al., 2011) called,
“Normative beliefs about aggression scale.” Students were
asked to indicate whether, right or wrong and responses were
on a 4-point scale: really wrong, wrong, ok, perfectly ok. School
climate was measured displaying a 9-item scale exploring
adolescent perceptions of school climate adapted by Furlong
et al. (2005, as cited in Guerra et al., 2011). Example of
questioning was, “This is a close-knit school where everyone
looks out for each other” and responses were strongly disagree,
disagree, agree, and strongly agree (Guerra et al., 2011).
Results
The survey was administered in English and Spanish, as
needed, with trained assistants using a wireless response
pad in classrooms to collect data, because targeted
adolescents needed passwords or access keys to log onto
computers. The results showed Time 1 (pretesting) and Time 2
(posttesting) were empirically evidenced by using the
hierarchy linear model. Guerra et al. (2011) noted that this
model was used because of the nesting of adolescent

140students. Statistical significance was set at (< 0.1). The
expectation was prenormative beliefs about bullying and
postvictimization was not significant. Time 1 and Time 2
seemed to change with approval of normative beliefs about
bullying among adolescents. In Guerra et al., Table 1
presented a pretest in which self-esteem was negatively
correlated, meaning that bully-victims may influence self-
esteem and depression, but after the posttest self-esteem
was positively correlated as the 10-item questions were
asked. In addition, Table 2 by Guerra et al. displayed that
bullying decreases self-esteem related to increased levels
of victimization. High school adolescents’ decreases in
self-esteem showed increased levels of victimization. Table
2 was suggestive that bullying is a predictor of low self-
esteem with victimization.
Qualitative Method
The qualitative-method design was used to initiate a
focus group that questioned adolescent students about
bullying with emotional issues: bullying (part of the youth

141culture), because it is fun, bullies have and want power,
bullies are jealous, whether bullies who are popular can
become popular. Correlates of variable victimization by
theme were that victims are weak and vulnerable, victims are
annoying, victims are different and stand out from others,
and female teens get bullied (Guerra et al., 2011). The
results from Table 3 by Guerra et al. (2011) showed that
bully-victims, according to bullies, are those adolescent
students who have low self-esteem or have depression. This
is the perception of other adolescent students.
Discussion
Overall, the study provided a mixed-method approach
(Guerra et al., 2011). The quantitative methodology
presented predictor variables of suggested self-esteem and
depression symptoms that may predict bullying victimization.
The qualitative design was used to show why the perception
of bully-victims is that they are weak or have low self-
esteem. The focus of the study was to explore school climate
in middle and high schools, the vulnerability of bully-

142victims, and the effects of influence of bullying on the
school climate. Guerra et al. (2011) provided strong
evidence for an association among the variables bullying and
low self-esteem with suggestive depression in the
quantitative methodology. The qualitative methodology
presented “why” themes involved in the study and the
reasoning for their choice. Guerra et al. also noted,
“normal esteem” or “regular self-esteem was normal”; especially if
peers were already powerful in the group. Two themes
repeated were “bullying is fun,” and “bullying is related to sexuality”
among adolescents.
Limitations were that responses may not be indicative
of all adolescent high school students and there may be
concerns about social desirability and group because the
survey part of the methodology was self-reported, which may
create bias. The investigators addressed this possibility by
providing unbiased samples and giving each individual an
opportunity to answer the questions in the focus group
without retaliation. Another limitation was validity of the
143focus-group instrument: it was negated the senior author,
who constructed all focus groups, and provided teachers and
students to ensure reflective assessment was made properly.
Guerra et al. (2011) noted that future research should
examine the mechanisms by which perceptions of school
bullying may affect school-climate influence among bullying
and victimization over the years. I used this study to show
that depressive symptoms include low self-esteem and may be
affected by victimization in relationship to bullying.
Bullying Victims Who are Depressed are More Likely to be
Inactive
Bully victims are more likely to be inactive. Bully
victims and peer victimization are a common cause of
inactivity. Peer victimization contributes to lack of
psychosocial function among adolescents (CDC, 2010c). The
physical abuse that adolescents endure may make victimized
adolescents depressed, angry, suicidal, or despondent. The
adolescent who is targeted and experiences peer aggressive
behavior may seek revenge and become violent. A study

144presented by Storch et al. (2006) employed a quantitative
survey design using multivariable scales.
Measurements. Questions were asked differently for each
scale of measurement. For an example, for the variable of
anxiety there was a Multidimensional Scale and Social
Physique Anxiety Scale. In the Multidimensional Scale, items
were rated on a 4-point scale and included responses, “0 =
never true about me, 1 = rarely true about me, 2 = sometimes true about
me, and 3 = often true about me with higher scores
corresponding to greater anxiety.” The social-physique
measure was rated on a 5-point scale and consisted of higher
scores showing greater social anxiety. The questions were
asked from a social-physique anxiety scale and consisted of
sample items, such as “It makes me uncomfortable to know
someone is evaluating my physique/figure, and I wish I was
not so uptight about my physique/figure.” The physical-
activity measure was reported on how many days the children
were “physically active for 60 minutes or more over the past
7 days, or how many days they were physically active for at

145least 60 minutes per day over a typical or usual work week”
(Storch et al., 2006). Peer victimization was measured using
the Schwartz Peer Victimization Scale. Schwatz, Fraver,
Change, and Lee-Shin (2002, as cited in Storch et al., 2006)
said the Schwartz Peer Victimization Scale measured
adolescents who were victimized by peers. Those adolescents
had relationships and focused on overt relational forms of
peer victimization. The measurement was obtained using a 5-
point scale. The Children’s Depression Inventory form
measured self-reported assessments of depression symptoms
among children and adolescents. There were 10 items that
assessed youth cognitive capacity, and affective or behavior
symptoms of the adolescent using a 3-point scale (Storch et
al., 2006).
Sampling. The sampling strategy consisted of
adolescents aged 8 to18 who scheduled an appointment at the
University of Florida Pediatric Lipid Clinic and were
diagnosed by a physician, psychiatrist, or clinical
psychologist. The sampling unit was adolescents and the

146sampling frame was 100 children and adolescents aged 8 to18
(M = 12.9, ±2.8).
Results. The results showed that some variables were
correlated and others differed from other variables
altogether. An example, is the Multiple Dimensional Anxiety
Scale for Children correlated strongly (r = .83) with Child-
Related Anxiety Emotional Disorders and Spence’s Children’s
Anxiety (r = .86), whereas physical activity showed similar
results (r = .10) to depression and loneliness, and was
significant at a 90% confidence level (0.1). Storch et al.
(2006) showed in Table 2 that physical activity was strongly
negatively correlated with amyotrophic lateral sclerosis and
peer victimization (r = –.32, r = –.33). This may suggest
that physical inactivity is not caused by adolescents who
are victimized and extremely lonely. Storch et al. noted
that hierarchal linear regression assessed measures of
psychosocial adjustments. However, results contrasted with
other studies that found being a bully victim who has few

147peer relationships and is lonely contributes to adolescent
inactivity.
Table 3 (Storch et al., 2006) showed mediated
regression predicting physical inactivity. The results
displayed that victimization depicted physical inactivity
based on depression symptoms (R2 = .10), F (1, 90) = 10.1, p
< 0.01 (Criterion 1) in relation to depressive symptoms R2 =
.16, (F (1, 90) = 16.1, p < 0.01 (Criterion 2). This may
suggest that bullying victims who are depressed are more
likely not to exercise.
Mediation after the initial responses decreased when
depressed mood was accounted for (R2 = 0.07, F (2, 89), =
7.3, p = 0.1). Even after the mediation from the clinical
psychologist or psychiatrist, the predicting value decrease
was modest. Regression analyses supported the variable of
loneliness in relationship to victimization and physical
inactivity (Storch et al., 2006). Criterion 1 and 2 were met
in the study. The numbers suggested depression (R2 = .01, F
(1, 90) = 10.1, p < .01), and loneliness (R2 = .39, F (1,

14890) = p < .1 (Storch et al., 2006). Overall, peer
victimization displayed negative association with physical
activity, but was positively associated with depression,
anxiety, and loneliness in relationship to physical
activity. Storch et al. (2006) noted this may be because
chronically victimized peers may internalize feelings,
causing the probability of attacks to have greater value;
but in relationship to physical activity, a bully victim may
perceive self-infliction of danger, making them afraid to
exercise; thus, decreasing opportunities to exercise.
Discussion. Storch et al. (2006) noted additional
studies of mediation analyses should shed light on the
relationship between peer victimization and physical
activity, in accordance with the role of depression and
loneliness. Limitations of the study are not noted. Yet, an
observed limitation of race may be a major factor, as it is
unknown whether race may play a major role in adolescents’
background and exercise opportunities. I used this study to
show that depressed and lonely adolescents who are

149victimized may not want to exercise; thereby creating an
issue of obesity or overweight among adolescents.
Causes
Peer Victimization
Peer victimization that relates with bullying is a
public health concern. Peer victimization is an increasing
public health concern. The frequency of bullying created by
victimization causes great concern when dealing with
injuries, increasing healthcare costs, low self-esteem, and
feelings of loneliness and depression (Graham, 2006). The
public health concern is that recent literature has shown
that victims of bullying are more likely to feel depressed,
lonely, and anxious more than their nonvictimized
counterparts. Graham (2006) presented a qualitative
phenomenology design using self- perception theory where
peer victimization and self-perception or blame creates
psychological adjustment. Graham found that diversity in
schools, classrooms, and neighborhoods may influence and
intervene in peer victimization. Graham noted in the case

150study that peer victimization includes name-calling,
intimidating gestures, racial slurs, spreading of rumors,
and exclusion or social avoidance from the peer group.
The sampling strategy included different ethnicities—
Latino, African American, Asian American and Caucasian—but
no ethnicities were more relevant than any other group and
no one ethnic group was less at risk for being targeted for
peer abuse. Graham (2006) used key interviews and other case
studies to help with the phenomenology of peer
victimization. The more diverse classrooms were, the less
peer victimization occurred in the targeted schools.
In contrast, a study presented by Vervoort, Scholte,
and Overbeek (2010) contradicted the concept that ethnicity
improves peer victimization in relationship to bullying
among adolescents. However, Vervoort et al. noted that
native Dutch adolescents are victimized in classes with high
proportions of minority pupils, and that ethnic-minority
adolescents are more victimized in classes with low
proportions of ethnic minorities.

151Sampling strategy. Vervoort et al. (2010) noted the
sampling strategy included 2,798 adolescents with a mean age
of 13 years and 10 months (SD = 6.77) months. The sampling
frame was 117 school classes in 43 secondary schools. Among
the adolescents, 51.9% were males, and all adolescents were
in eighth grade. Additionally, Vervoort et al. noted 68.3%
of the 2,798 sampled were of Dutch origin (n = 1,911), 17.0%
were non-Western ethnic minorities (n = 475), 7.5% (n = 209)
were Western minorities, and 203 adolescents (7.3%) had
unknown ethnic backgrounds. Among the non-Western minorities
40.8% were Turkish; 26.9% were Moroccan; 9.5% were Surinam,
Antillean or Aruban; and 22.7% had a different non-Western
ethnic backgrounds.
Measurements. Measures in the study included ethnicity,
proportion of ethnic minorities in class, and bullying and
victimization. Ethnicity included the birth country of both
parents, and responses included The Netherlands, Morocco,
Surinam, and Dutch Antilles or Aruba. The proportions ranged
from .00 to .91 with a mean of .17 (SD = .18). For bullying

152and victimization, Vervoort et al. (2010) used the
assessment of peer nominations that helped comprise an
increasingly objective measure based on multiple informants.
The questions of items measured were, “Which classmates are
being bullied by other classmates,” and “Which classmates
bully other classmates?” Data analysis was measured using
software called MLwIN that is used for analyzing
multivariables and tests different individual- and class-
level variables (Vervoort et al., 2010).
Results. Model 1 of Table 1 by Vervoort et al. (2010)
showed greater victimization between individual classes
(gender, age, and education) with a variance of .98 (.03),
and their Model 2 showed a lower probability of
victimization in an individual class, but showed strong
variance at the individual levels of .98 (.03). These data
may suggest that among race, age, and education there was
less probability that victimization was much different among
students in classes from regular individual students. In
addition, Model 2 of Vervoort et al. (2010) showed

153significance of negative proportions for individual
proportions and probabilities among individual levels for
the variables gender and education. However, Model 2 of
Vervoort et al. may suggest that individual levels of gender
and education did not show probability of victimization was
warranted in individual students.
Model 3 by Vervoort et al. (2010) displayed
significance at the 95% confidence level, negative for
proportions for individual-class level variables −0.2
(0.06), −0.16 (0.5) for educational level, −0.20 (0.6) for
ethnicity and minorities, and −0.5 (0.3) for number of
classmates. These numbers suggested peer victimization was
inversely related to gender, educational level, and
ethnicity, and unlike the study of Graham (2006) presented
above, contradict the observation that ethnicity improves
peer victimization. Unlike Models 1 and 2, Model 3 was
significant for class levels that were positive for
proportions of minorities .16 (.05), and .35 (0.9). Model 3
by Vervoort et al. demonstrated that for peer-reported

154bullying, higher value in numbers showed that bullying and
peer victimization have a strong relationship with the
proportion of minorities in in-groups in classes compared to
actual minorities in classrooms. This conflicts with the
earlier study by Graham showing that ethnicity and diversity
improve peer victimization.
Discussion. Vervoort et al. (2010) did find that ethnic
composition does have a relationship with peer victimization
and bullying. However, ethnic diversity alone in classes or
groups does not prevent higher levels of peer victimization
and bullying (Vervoort et al., 2010). In other words, Dutch
adolescents who were bullied are more likely to be victims
than minorities in the same Dutch sample. This issue may be
observed in the discussion of limitations.
The limitations in the study were the lack of
difference of ethnic minority groups, in accordance with
small sample size. An example is examining the hierarchy in
ethnic status among ethnic groups in Netherlands. There
could be more Caucasians in The Netherlands than minorities;

155thereby making sample sizes of a certain group an issue.
This may create lack of a sufficient sample size with a lack
of minority sample groups (Vervoort et al., 2010). This
issue could play a major role in describing bullying and
peer victimization among ethnic groups.
Among the gender and race variables, Vervoort et al.
(2010) displayed that males were more likely to encounter
bullying and victimization than females. The investigators
noted the reasoning, as previous studies did not examine the
relationship of ethnic school composition or examine the
relationship based on gender and race that included roles of
interaction with bullying and victimization. Vervoort et al.
did note that further studies should consist of different
informants (self-reports or peer nominations) used to
measure bullying and victimization. Overall, the study
showed empirical evidence that knowing ethnic composition
may help in understanding victimization among minorities,
but does not show that having minorities in the classroom
may decrease peer victimization. The study provided evidence

156that being a minority and male creates a risk for being
bullied or victimized. I use the study to contrast with the
study by Graham (2006) presented earlier that having a
minority ethnic composition may decrease peer victimization.
This study shows no matter what race or ethnicity, peer
victimization may be an issue among all adolescents.
Parents Working Long Hours and No Supervision
Parents working long hours and adolescents with no
supervision are more likely to have adverse peer
relationships; and lack of supervision may contribute to
being a bully victim. The study by Spriggs, Iannotti,
Nansel, and Haynie (2007) found that adverse peer
relationships were a strong determinant for bullying.
Parents working longer hours may create idle time for
adolescents and increase chances of adolescents becoming
bullies or becoming bullying victims (CDC, 2010c). Adverse
peer relationships are more profound in adolescents who have
parents working longer hours. Spriggs et al. found that
parental-monitoring issues increase with unsupervised

157adolescents and may lead to aggression and affiliation with
deviant peers. Spriggs et al. presented a quantitative
survey design that was cross-sectional in nature and
examined three variables of possible causes of bullying:
peer relationships, family structure, and family status.
Spriggs et al. used a survey called Health Behavior in
School-Aged Children (HBSC) that involved 36 countries. The
Institutional Review Board (IRB) at the National Institute
of Child and health approved the study.
Sampling strategy. The sampling strategy included an
overall sample of (n = 14,818) students with a sampling
frame of White, African American, and Hispanic students. The
analytic sample was 11,033 including those excluded from the
study due to not identifying their race. The sample size was
appropriate for this study using this large sample base.
Spriggs et al. (2007) suggested parents working longer hours
with relationship to peer factors (i.e., peer pressure) have
a strong influence on bullying behavior.

158Discussion. The reasoning is that adolescents want to
belong and bullying victims having fewer friends. Adverse
relationships are made with the fear of not having peer
approval (Spriggs et al., 2007). The issues among bully-
victims are that peers imitate bullies, creating negative
reinforcement. This opens the victim to other issues, such
as depression, suicide, low academic performance, and social
isolation. Parents working longer hours may result in
adverse relationships among adolescents with their peers
(Spriggs et al., 2007). The study continued, researching
peer pressure or peer influence.
Peer Pressures or Influence
The study by Spriggs et al. (2007) assessed peer
pressure through peer factors. Spriggs et al. noted that
bullies are not liked, but are less likely to be socially
isolated than victims. In addition, Spriggs et al. noted,
bully-victims are the most isolated and least likely to be
popular, making peer relationships more profound and peer
influence more noticeable. The measurement of peer pressure

159through social isolation, classmate relations, and
participation in extracurricular activities can be evidenced
in the Spriggs et al. study.
Measurements. Social isolation was measurable because
negative peer pressure may create social isolation among
adolescents from fear of not having friends or being liked.
Eight items questioned number of male and female friends,
communication issues with the same sex, opposite-sex
friends, frequency of weekly contact with friends, peer
pressure, and social isolation.
Spriggs et al. (2007) noted the items loaded on a
single item at 0.35 or higher with internal consistency at a
= 0.68. These numbers suggest strong internal validity of
the variables and instrument used. This was based on
respondents’ mean report of friendship engagement (high,
moderate, and low; Spriggs et al., 2007). Classmate
relations were measured by questions of despondent feelings,
enjoyment of classmate companionship, kindness and
helpfulness of classmates, and classmate acceptance of the

160respondent. All items were loaded on a single factor of 0.70
level or higher with good internal consistency (a = 0.76;
Spriggs et al., 2007). This was based on respondents’ mean
report of classmate relations (good, average, and poor).
Questions asked number of friends (0, 1, 2, and 3+), number
of female friends (0, 1, 2, and 3+), number of days/week
spent with friends (0, 1, 2, 3, 4, 5), number of evenings
per week with friends (0, 1, 2, 3, 4, 5, 6, and 7), and
number of days per week spent texting or e-mailing friends
(0, 1, 2, 3, 4, 5, 6, and 7). Analyses were related to low
isolation (bottom tertile), moderate isolation (middle
tertile), and high isolation (top tertile) that categorized
the responses into a formatting sequence. Spriggs et al.
stated that “extracurricular activity participation was
measured by a single item of number of days spent in the
selected activities. Questions asked were, “How many days were
you involved in any club or organization?” (p. 5). Items were
trichotomized by most (5/6 days a week), some (1–2 days/3–4
days a week), and few (once a week/not at all). Analyses

161were related with good being in the top tertile, average in
the middle tertile, and poor in the bottom tertile.
Results. The results showed differences among races.
For instance, for Caucasian students displayed in Table 3 of
Spriggs et al. (2007), bullying has a relationship with peer
pressure; social isolation showed among victims; those
uninvolved had the highest relative risk at 95% confidence
level (CI: 1.42, 1.12–1.18) and a moderate relative risk was
apparent among bullies compared to those who were uninvolved
(CI: 0.75, 0.61–0.93). In classmate relations, Caucasian
students scored more poorly among victims versus those who
were uninvolved (CI: 2.96, 2.20–3.39) and fewer of those
involved in extracurricular activities scored high in the
bully category or the uninvolved category (CI: 0.98, 0.58–
1.50). These numbers suggest that Caucasian adolescents are
less likely to become bully-victims and Caucasian
adolescents are more likely to exercise or encounter
physical activity.

162African American adolescent students showed a higher
relative risk for peer pressure and social isolation,
illustrated in Table 4 (Spriggs et al., 2007; CI: 1.98,
1.12–3.20) among victims versus those who were uninvolved;
however, African American adolescents differed from
Caucasian adolescents as bully-victims in the classroom-
relationship category (CI: 2.61, 1.52–5.62). In the
extracurricular-activity category, African American were
more likely to be victims (CI: 0.99, 0.64–1.53) than their
Caucasian counterparts. The numbers suggested African
Americans adolescents face higher risk for being socially
isolated and encounter more adverse peer pressure than their
Caucasians counterparts and victims are more likely to be
inactive than their Caucasian counterparts.
Hispanic adolescents, shown in Table 5 (Spriggs et al.,
2007), had a lower relative risk than African American and
Caucasian students for social isolation in the victim versus
uninvolved category (CI: 1.55–2.37). Nevertheless, Hispanic
students had higher relative risk in the victim versus

163uninvolved category for classmate relations, which was poor
(CI: 2.67, 1.46–4.88). In the extracurricular-activity
category, Hispanic students scored higher as bully-victims
(0.86, 0.40–1.86). These numbers may predict that bully-
victims are more likely to be inactive among Hispanic
students but are more inactive than African American and
less active than Caucasian adolescents.
Discussion. Overall, at least 21% of Caucasian, African
American, and Hispanic teenagers were bully-victims, and
although they varied by category, one common factor was that
the effects of bullying were harmful to adolescents in all
races. Social isolation, negative peer pressure, negative
classroom relationships, and poor family functioning may
have a relationship with being victims of bullying (Spriggs
et al., 2007).
The strength of the study was the diversity and
sufficient representation of all ethnic/racial groups.
Overall, the study gave strong empirical evidence about
parents working longer hours and its effects on peer

164pressure and bullying, and increasing minority rates among
adolescents for bullying behaviors. However, the study had
limitations: the cross-sectional nature of the study made
causal inferences regarding relationships unavailable, and
the complexity of the different models caused only main
effects to be examined. An example was multinomial results
across three strata of different races. The third factor was
the HBSC survey data was the only point of reference,
limiting interpersonal and school factors. Spriggs et al.
(2007) noted that further studies should include relational
characteristics and roles to understand bullying dynamics. I
used this study to show how peer pressure of being bullied
may create social isolation, and in turn may affect
relationships with peers in school, classrooms, or at home.
Related to being the victim of bullying may be inactivity
levels that increase risk for adolescents.

165Family Dysfunction and Lack of Cohesion and Structure May
Lead to Bullying Behaviors and Violence
Family structure is an important part of family
characteristics. Family characteristics that are
unstructured may have severe consequences. Hoof,
Raaijmakers, van Beek, Hale, and Aleva (2008) noted family
characteristics, such as, family functioning, family
behavioral activity, and family cohesion may affect the
adolescents’ ability to avoid violence or bullying behaviors
and create depressive symptoms among adolescents. Hoof et
al. presented a quantitative analysis that was a survey
design.
Sampling strategy. The sampling strategy included
approximately 194 high school students from The Netherlands
in Grades 9 to 11. Eight classrooms participated in the
study and parents were given the choice of whether their
adolescents would participate. The informed consent was
appropriate for research ethics. Of the 196 adolescent

166students, only two did not complete their surveys and were
excluded from the study.
Measurements. Measures in the study were bullying and
peer victimization, family cohesion, and family
disorganization. Bullying and peer victimization were
measured on a 5-point scale. The 5-point scale ranged from
totally not true to totally true. The Dutch KOP consisted of
questions on bullying indirectly and used statements such as
“Other students in the class call me names,” and “I
sometimes on purpose ignore other students” (Hoof et al.,
2008). Internal consistency was measured at .90 or greater
and was reliable and tested well for validity. The measure
of family disorganization and family cohesion was measured
on the Leuven Family Questionnaire scale. Hoof et al. (2008)
noted the subscale consisted of 13 items and measured the
extent to which the adolescent perceived the family as a
safe environment. The cohesion scale used statements like,
“I feel responsible for the other family members” (Hoof et al., 2008).
The subscale division measured the perception of affective

167family involvement and consisted of 11 items. An example of
a statement was, “Each of us lives our own life.” This allowed the
investigator to measure effectively if family
disorganization was involved.
Results. The results displayed in Figure 2 and Table 1
of Hoof et al. (2008) explained the correlation between the
variables in relationship to bullying, depressive symptoms,
and cohesion and family disorganization. The results showed
that family disorganization and bullying were negatively
correlated with family cohesion (r = –.64 and r = –.24), but
had a positive correlation for identity (r = .23) and all
variables were confident at 90%. Family disorganization was
positively correlated with bullying and bully-victims at 90%
confidence (r = .27, and r = .29) respectively. In addition,
family disorganization was positively correlated with
depression (r = .44) at 90% confidence. Bullying was
positively correlated with being a victim (r = .44) and
depression (r = .15). The hypothesis stated that family
characteristics were important to be correlated with

168adolescents being bullied or becoming bully-victims and
having depressive symptoms.
Discussion. A note made by Hoof et al. (2008) was that
bullying alone did not support adolescents being depressed.
This may have been observed among the perpetrators as well
as the bully-victims. Overall, the study supported the
hypothesis that family dysfunction, lack of family
structure, and family cohesion may predict whether the
adolescent will become a bully or a bully-victim.
A limitation of the study was the self-reporting of
depressive symptoms, victimization by peers, and personal
identity. This may have positively influenced the strong
relationships between the construct, and depressive
symptoms. For instance, self-reporting could bias the
descriptors of family disorganization or cohesion. Hoof et
al. (2008) noted that it was highly unlikely that results
could be attributed to just one method of variance. Analyses
avoided single-method variance by using peer reports to
study peer victimization and found a systematic relationship

169between peer victimization and depression. I used the study
to show how family dysfunction, lack of family structure,
and family cohesion may contribute to becoming a bully, and
for the bully-victim to encounter depression and peer
victimization.
Relationship Between Bullying and Violence
Bullying and Violence Are Related
The relationship between bullying and violence may be
observed among American adolescents. The relationship
between bullying and violence is a national concern among
adolescents in today’s society. Over the last decade, U.S.
governmental agencies have observed increasing violence and
aggressive behavior. This aggressive behavior, if formed
into bullying, may create a cause for concern (DHHS, 2010).
Nansel, Overpeck, Haynie, Ruan, and Scheidt (2003) employed
a quantitative research design that used the National
Institute of Child Health and Human Development national
survey. The HBSC was a collaborative survey in coordination
with the WHO (Nansel et al., 2003).

170Sampling strategy. The sampling strategy consisted of a
comprehensive list of secondary schools that included U.S.
public, Catholic and private-school students in Grades 6
through 10 or their equivalent (Nansel et al., 2003).
Classes were selecting using random sampling and all
students selected were asked to participate in the study.
Nansel et al. (2003) documented hesitation about completing
surveys during school hours; therefore, the investigators
documented expected rejections to the request and sampling
units of students that were not replaced in the study. Also,
excluded were schools with fewer than 14 students. Nansel et
al. noted many schools were drawn into the sampling frame
than were needed to obtain the precise weighted sample to
produce 95% confidence estimates of plus or minus 3% for
students in each grade. In addition, Nansel et al. noted
schools that had minority students were oversampled to
provide reliable estimates for African American and Hispanic
children, with weighting adjustments for national estimates
of the U.S. school enrollment. This would allow the

171investigators to make accurate and precise estimates. Also
noted by Nansel et al. is that 1,700 students responded,
resulting in a participation rate of 83%. For any records
that were missing for key variables (e.g., age or sex) or
had more than 75% of responses missing, records were
excluded, which precluded the ability to compare
participants and nonparticipants (Nansel et al., 2003).
Measurements. The school-based design used 1 class hour
for the questionnaire and measures were obtained from the
HBSC questionnaire, which was self-reporting and contained
102 questions. Variables of measurement included bullying,
weapon carrying, frequent fighting, and fighting injuries.
The variable bullying was measured by two parallel questions
and bullying was defined by self-reporting of another
student doing nasty or unpleasant things to him or her. It
was not bullying if two students of the same strength
quarreled or fought. The response categories were, “I have
not bullied,” “once or twice,” “sometimes,” and “several
times a week.” Weapons carrying was measured by asking

172participants the following question: “How many days did you carry
a gun, knife or club for self-defense in the last 30 days?” Statistical
analyses software SUDAAN was used to adjust variance
estimates to account for sample designing and clustering
(Nansel et al., 2003).
Nansel et al. (2003) noted that descriptive analyses
was conducted to obtain the percent distribution by sex for
each violence-related behavior (i.e., weapon carrying at
school, frequent fighting, or being injured in a fight) by
involvement in bullying behaviors. Logistic regression
analyses were used to estimate the odds ratio for
association with each measurable variable. However, Nansel
et al. noted that students may be involved with one of four
bullying behaviors: bullying others both in and away from
school and being a targeted victim in and away from school.
Results. The results showed in Nansel et al. (2003)
Table 1 that violent behaviors were observed more in male
than female adolescents. The range was from 23% to 13% of
male adolescents and 11% to 4% for female adolescents. In

173addition, Nansel et al. noted more than 16% of male and 11%
of female adolescents were found to have carried a weapon in
the last 30 days and more than 13.1% male and 6.0% of female
adolescents had been in more than four fights in the past
year, and more than 22% of male adolescents have been
injured in a physical fight. However, not known in the study
was whether adolescents have been injured with a carried
weapon. Nansel et al. showed Table 1 with prevalence
estimates of being bullied. Bullying others in school showed
the highest prevalence at 25.9 (95%, CI: 24.3–27.4) for male
teens, and 22.0 (CI: 20.5–23.4) for female teens, in
comparison to being bullied away from school 16.3 (CI: 14.8–
17.7) for male teens and 12.6 (CI: 11.4–13.1). In addition,
being bullied in school 23.2 (CI: 21.8–24.7) for male
adolescents was higher than being bullied away from school
among male adolescents 13.2 (CI: 11.6–14.7). Nansel et al.
noted among female adolescents 19.3 (CI: 17.9–20.8) were
bullied in school, and 10.7 (CI: 9.4–12.1) were bullied away
from school. Among the measured variable of carrying a

174weapon in the last 30 days, male teens were more likely to
carry a weapon than female teens: 22.7 (CI: 20.9–24.5) for
male teens, and 6.8 (5.4–7.8) for female teens.
In fact, Table 2 showed a strong relationship between
bullying others in school or away from school with about 70%
of male teens (CI: 64.4–77.8) and 30% to 40% (CI: 26.3–51.1)
for female teens. An alarming fact in Table 2 (Nansel et
al., 2003) showed that on a weekly basis male teens had the
highest prevalence of bullying others away from school with
a weapon 70.2 (CI: 61.7–78.7), and female teens showed
higher prevalence among bullying others away from school
with a weapon on a weekly basis 40.9 (CI: 28.5–53.4). These
numbers suggest that not only in school, but in
neighborhoods and communities, adolescent are victims of
bullying.
Table 3 by Nansel et al. (2003) displayed unadjusted
and AORs of violence-related behaviors with bullying. Their
Table 3 showed a high relationship for carrying a weapon and
carrying a weapon in school, and bullying other away from

175school on a weekly basis among male adolescents 15.0 (CI:
10.8–20.80) and 15.3 (11.8–20.0) respectively. In addition,
carrying a weapon, and carrying a weapon in school was
strongly associated with being bullied away from school
among male adolescents 10.7 (CI: 8.1–14.0), and 10.6 (CI:
8.3–13.5) on a weekly basis. This suggests why homicides and
injures may occur in neighborhoods and communities in the
United States. Table 3 (Nansel et al., 2003) also showed
among the variables frequent fighting and being injured in a
fight were highly associated with bullying, 38.7 (CI: 33.2–
44.2), and 45.7 (CI: 39.9–54.4). Overall, the numbers in the
study make a strong case for a relationship between bullying
and violence (i.e., carrying a weapon (knife, club, or gun),
frequent fighting, and being injured in a fight). Nansel et
al. did note that bullying is more likely to occur with lack
of supervision away from school; however, weapons being
carried in school may cause a problem among adolescent
bully-victims. The results gave more definitive evidence-
based reasoning and provided empirical evidence that

176bullying has a relationship with violence and aggression
among adolescents.
Discussion. The study had several limitations that were
noted by Nansel et al. (2003): the study was cross-sectional
making causal references an issue with self-reporting
measurement of bullying and violent behaviors. The study
authors displayed a relationship, but actual causal
relationship is limited because of the nature of the study.
Nansel et al. noted that causal relationship was not
warranted because no other studies specifically address the
relationship of bullying to violence-related behaviors.
Nansel et al. thought further research should consist of
violence-prevention efforts. I implemented this article into
the study to show the relationship between bullying and
violence and their effects among adolescents.
Minorities’ Injuries, Physical Fighting, Homicide, and
Suicide Rates are a Public Health Concern Among Adolescents
Youth violence is on the rise and minorities are seeing
increasing rates in homicide and suicide problems. According

177to the CDC website (2009d), among 10 to 24 year olds the
leading cause of death is homicide for African American
youth, and is the second leading cause of death for Hispanic
youth and the third leading cause of death for Asian/Pacific
Islander, American Indian, and Alaska Native youth. Homicide
rates among non-Hispanic, African American males aged 10 to
24 (62.2 deaths per 100,000) exceed those of Hispanic males
(21.5 deaths per 100,000) and non-Hispanic White males (3.4
deaths per 100,000).
A study by Cunningham et al. (2010) examined the
variables of weapon carrying/use, injuries, and violent
behaviors. Cunningham et al. presented a quantitative survey
research design that examined the frequency of weapon
carrying use, injuries, and violent behaviors among the
targeted adolescent population. The location used was the
emergency room of an inner-city hospital.
Sampling strategy. The computerized survey had a 56%
response rate that sampled 2,069 targeted adolescents in an
inner city. The inner city was not referenced in the study,

178but Cunningham et al. (2010) noted that the injuries,
violent behaviors, and weapon carrying/use was comparable to
cities like Detroit MI, Hartford CT, Camden, NJ, St. Louis,
MO, and Oakland, CA. Cunningham et al. did indicate that the
population was comprised of 50% African American people. The
targeted emergency room had a census of approximately 75,000
patients a year. The sampling frame was adolescents aged 14–
18 who entered the emergency room with either injury or
medical illness. The trained research staff assistants with
either bachelor’s or master’s degrees approached the
targeted adolescent population and those who met the
criteria were offered to participate in a computerized
research survey. Substance abuse and sexual violence were
other variables’ in the study, but for the purposes of this
review, I used the variables presented above.
Measurements. Measurements of variables of carrying a
weapon/use, violent behaviors, and injuries differed in
variation. An example is carrying a weapon/use was measured
using the YRBS, which questioned the frequency of carrying a

179weapon/use. One question asked, “In the past 3 months how
often did you carry a knife, razor or gun, or pull a gun on
someone?” The responses were measured using a scale, “never,
1 time, 2 times, 3–5 times, 6–10 times, 11–20 times, and more than 20
times.” Cunningham et al. (2010) noted for analysis purposes
that last year number of times weapons were carried was
displayed by midpoints (i.e., for the range of 3 to 5 times,
4 was used), as in the broader violence literature studies.
However, youth behavior was measured dichotomously (yes or
no responses) by self-report questions of “serious physical
fight,” and “took part in a group fight, where a group of my friends was
against another group” Injury was assessed dichotomously (yes or
no responses) using the adolescent injury list that was
suggestive of either a physical fight or use of a gun.
Questions asked the patient, if their injury required a
nurse/doctor’s intervention. The analyses of the study
displayed descriptive statistics for demographic and
behavioral characteristics and for three different outcome
variables (knife, razor, gun carriage, or pulled a knife or

180gun). The bivariate analyses were performed using chi-square
for Zero-inflated Poisson Zip (ZIP), and regression models
predicted both the past year as well as past-year frequency.
Cunningham et al. (2010) noted that ZIP was chosen
because the test allowed two types of predictions. One
prediction was whether a behavior occurred or did not occur,
and the second prediction was of interpretation of
association, with odds ratios predicting “zero” and
appearing in the Zero-Inflation column (Cunningham et al.,
2010). The independent variables were retained in the study
for the purposes of final regression based on theory. The
independent variables of demographic factors (age, race,
gender, and receipt of public assistance) were associated
with at least one of the weapon-related behaviors in the
bivariate analysis.
Results. The results showed there were 2,785
participants in the study; of those 86% (n = 2,387) were
approached. Among the adolescent participants approached,
2,069 actually completed the survey (86.7% responses, 13.3%

181refusal rate, and 14.3% [n = 398] were missed by the
research assistant; therefore only 72.4% was the actual
focus population). This was observed in Figure 1 of the
study (Cunningham et al., 2010). Screening between samples
and refusals were similar by gender (χ2 = 2.09, 0.15 males,
and χ2 = 1.15, 0.56 females). Table 1 displayed 55.1% were
female and 56.5% were African American, 34.6% were
Caucasian, and 8.8% were of other races (see Cunningham et
al., 2010, Table 1).
Concerning ethnicity, 6.0% of teens were identified as
of Hispanic/Latino ethnicity. Data in their Table 2 showed
that 20% of adolescents reported knife/razor carriage (21.9%
live with medical complaint, 16.7% of those injured), 7% of
adolescents reported carrying or using a weapon (n = 144),
and 68% (n = 98) of adolescents reported that within the
last 3 months prior to the survey a weapon was carried. In
addition, Cunningham et al.’s (2010) Table 2 showed that
only 3.1% of adolescents actually carried a knife and gun at
the same time (65/2,069) and nearly half of the adolescents

182(42%, 61/144) carried a weapon at least three times.
Cunningham et al. presented Table 2 displaying those
adolescents who carried a weapon 39% (n = 56), pulling a gun
or knife with threatening intent.
Based on the ZIP regression model, African-American
youth were more likely to carry a gun and non-African
American adolescents were likely to carry a knife.
Cunningham et al. (2010) also noted that poverty was not
associated with carrying a gun, but was associated with
increased frequency of gun carriage among adolescents who
reported carrying a weapon. In addition, ZIP regression
displayed a limited number of correlates of pulling a weapon
rather than weapon carriage. This may suggest that carrying
a weapon has a greater relationship to injuries or violence-
related behaviors than pulling a weapon. Many of the 39% of
adolescents who brandished a weapon intended to use the
weapon. Yet, the study did not provide how many adolescents
were injured and was suggestive of violent-behaviors of the
targeted adolescents. However, based on the research thus
183far, threatening with a weapon and carrying a weapon may
influence the adolescent to use the weapon.
Discussion. Overall, the study presented evidence-based
research that was suggestive of adolescents who are
threatening or carrying a weapon may be influenced to use
the weapon on another adolescent and increase injuries, or
visits the emergency room. This creates a problem in the
minority population as injures mount and healthcare costs
rise. These injuries were observed in the emergency room;
however, other studies may need to be implemented in other
emergency rooms in other inner cities to test reliability.
Being a study that used convenience sampling made the
investigators analyze data already given. Limitations were
that the study used a convenience sampling and perceptions
of the adolescents prior to this survey may have influenced
results. In addition, because this study was cross-sectional
in nature, causality was unknown. Cunningham et al. noted
that the strength of the study was inner-city emergency room
focuses; however, a logical future focus should be on future

184violence-prevention initiatives. In addition, findings may
not generalize to non–inner-city, suburban, or rural
emergency rooms. I used this study to show how threatening
with a weapon or carrying a weapon may predict injuries and
youth violent behaviors among adolescents, create more
visits to emergency rooms, and increase healthcare costs.
Life Expectancy, Injuries, and Rising Healthcare Costs
Life expectancy, injuries, and rising healthcare costs
may be influenced by violence and bullying, including
threatening, carrying, or use of a weapon among adolescents.
The way people live in their communities, school districts,
homes, and everyday lives are affected by violence.
According to the Robert Wood Johnson Foundation study
(Egerter, Barclay, Grossman-Kahn, & Braverman, 2011), 18,000
Americans or more were victims to homicide-related
activities. In addition, more and more adolescents are
becoming victims and injuries and healthcare costs are on
the rise. The study explored by the Robert Wood Johnson

185Foundation was a qualitative case study that used other case
studies to examine social factors that create violence.
Egerter et al. (2011) found that SES and exposure to
violence were highly related to life expectancy, injuries,
and rising healthcare costs among adolescents. Data obtained
in this study was from other case studies and surveys that
examined the population of low-income communities that
explored exposure. This exposure may have been a culprit in
rising death rates, nonfatal injury rates, and ascending
healthcare costs. In fact, loses from productivity and
injuries from violence-related deaths and nonfatal injuries
were estimated at $37 billion dollars in the year 2007
(Egerter et al., 2011). During the year 2005, more than
600,000 violent incidents occurred in schools among those
aged 12 to 18 (Egerter et al., 2011). In addition, Egerter
et al. noted that 7.9% of high school students reported
being threatened with a weapon or were involved in a
physical fight. Violence in the school system may take a
serious incline among adolescents, especially those

186adolescents who are exposed more to violent behaviors or
crime (Egerter et al., 2011).
In 2009, 5% of high school students self-reported
missing at least 1 day of school for fear of safety, and
160,000 adolescent students may leave school because of
successive bullying. In neighborhoods and communities, as
noted by Egerter et al. (2011), in 2009, approximately 4.3
million violent crimes were committed against individuals
ages 12 and up. An alarming fact showed that most of the
violent crimes were toward adolescents’ aged 10 to 24 in
low-income neighborhoods, communities, and schools, and more
than 650,000 youth received emergency-room treatment for
nonfatal injuries (Egerter et al., 2011).
Overall, the study showed that costs are staggering at
$4 million in healthcare cost, $33 billion in lost
productivity, and more than 24,000 hospital treatments for
nonfatal injuries. Egerter et al. (2011) provided empirical
evidence of how healthcare costs are rising because of
violence that includes being threatened with a weapon or use

187or carrying of a weapon, and life expectancy issues among
adolescents.
The limitations of this study were that it was a case
study of one period. The case study may not truly validate
what was going on in the demographic population. The
investigator refuted this notion by adding evidence of other
peer-reviewed journal articles. Egerter et al. (2011)
suggested further studies should examine, over a longer
period, violence among adolescents and its effects. Overall,
the study gave a valuable impression about how violence
affects neighborhoods, communities, and schools in low-
income populations and creates vulnerability among
adolescents. I used this study to show the rising trend of
healthcare costs, injuries, and life expectancy in
relationship to being bullied. I also used this study to
show SES is a cause of weapons violence among adolescents
aged 10 to 24.

188Causes of Being Bullied With a Weapon
Family support (including family influence), and family
intimacy (including neighborhood violence and family
criminal activity), may be associated with physical activity
or inactivity among adolescents. A study conducted by Kuo,
Voorhees, Haythornthwaite, and Young (2007) explored the
relationship between family support and family intimacy in
relationship to physical activity or inactivity among
adolescents. Kuo et al. examined female adolescents in
Baltimore, Maryland from an inner-city high school, through
a comprehensive physical-activity randomized trial. The
instrument used in the study was from Project Heart, using
subscales to determine the independent variables of family
support and family intimacy. In addition, family support was
also measured by family involvement with their adolescents’
physical activity. Closeness and emotional sharing among
family and exposure to violence among adolescents measured
family intimacy using a subscale (that included neighborhood
violence; Kuo et al., 2007). Kuo et al. obtained violence

189statistics that were measurable by variables of aggravated
assault (including being threatened with a weapon,
use/carrying of weapon, murder, rape, and robbery) reported
citywide during the year 2000. Kuo et al. noted that each
community statistical area had an average of 4,691
households.
Sample Strategy
Sample size (N = 221) included ninth-grade female
adolescents who were White and African American, in 10th,
11th, and 12th grades. Sample size was adequate for the
study; the software used was SAS version 9.1. Kuo et al.
(2007) noted that the analyses of indication between
variables of physical activity and neighborhood violence
were skewed; therefore, they performed regression analyses
to determine the association of physical activity to the
dependent variable. There were two models explored in the
study.

190Measurements
The first model was used to determine the association
of physical activity to perceived violence; the second model
was used to determine the association between the variables
physical activity and violent-crime rate (Kuo et al., 2007).
Baseline data were obtained prior to implementing the
methodology and after 7 days had passed there was a recall
to assess total energy expenditure. Kuo et al. (2007) noted
data were collected from 2000 to 2002 for Project Heart. The
collection of ability over time showed reliability among the
variables.
Results
The results from Kuo et al. (2007), shown on their
Table 1, indicated that 74% (n = 164) of female adolescents
in the study were 14 years of age. This suggests that most
of the female adolescents who participated in the study were
14 years of age. Among race/ethnicity, Afro-American youth
were 83% (n = 182), and White youth were 14% (n = 30). More
adolescents live with their mothers (56%, n = 123) than with

191both parents 32% (n = 71). In addition, the authors’ Table 1
displayed high rates of mother and father attending some
college (56%, n = 123 for mothers, and 36%, n = 80 for
fathers). This may suggest that more African American female
adolescents live with their mothers and face issues with
family status in relationship to education, and this issue
may create a lack of ability to exercise, creating a
vulnerability and exposure to being overweight or obese. Kuo
et al. noted that some totals did not measure 100% because
of lack of response. The inactive participants were measured
by total daily expenditure of 7.6 kj/kg/day (32 kj/kg/day).
Kuo et al. found, on average, that most of the female
adolescents were inactive. Family scales did correlate
significantly with each other (r = 0.34–0.42; p < .001) and
physical activity correlated significantly with family-
involvement activities (r = 0.17; p < 0.5), family support
(r = 0.18, p < 0.1), and perceived neighborhood violence
(r = 0.14, p < 0.5), and perceived neighborhood violence was
positively related to the rate of violent crime (r = 0.23, p

192= .01). In regression Model 1, family activities (p = 0.4),
family support (p = 0.3), and family intimacy (p = .004)
significantly predicted the dependent variable of physical
activity. Table 2 by Kuo et al. showed similar results,
predicting that objective violent crime rates were dependent
on physical activity. This suggests that family support and
family intimacy, which included neighborhood violence had a
predictable relationship and correlation to either
adolescents being physically active or physically inactive.
Discussion
Kuo et al. (2007) suggested that additional research
should examine family intimacy in association with
adolescent risk behaviors. In addition, aspects of the
adolescent family and neighborhood environments should be
explored as determinates of physical activity.
There were several limitations. The first limitation
was the study was self-reported, which could introduce bias
of favorable responses based on prior events. In addition,
the results may not generalize to a population beyond urban

193African American female teens. For instance, African
American female teens in rural areas may not have had
similar experiences. Hispanic adolescents were few in the
study; the reasoning may be that few Hispanic female
adolescents living in the demographic area of the study.
Overall, this study was strongly evidence based and provided
the necessary variables to show relationships between family
structure, violence, and physical activity and inactivity.
The study supported that inactive adolescents tend to have a
weakened family structure, family support, and family
intimacy influencing the amount of physical activity. I used
this study to show that a weakened family-support system and
exposure to neighborhood violence may predict the outcome of
physical-activity levels.
Youth Violence, Aggression, and Bullying
Delinquent peer influences, as well as nonviolent and
violent crimes, media violence, and family violence may
predict youth violence and aggression. Violent crimes such
as assault, intimidation, robbery, and homicide, along with

194bullying may be a predictor of youth violence and aggression
by use of weapons or threatening with a weapon among
adolescents (Ferguson, San Miguel, & Hartley, 2009).
Nonviolent crimes such as theft, stalking, and harassment
may be predictors of youth violence and aggression. These
variables may influence and have significant impact on
perpetrators and victims, including negative image impact on
schools, neighborhoods, communities, academic work,
behavioral problems, and social-activity participation among
adolescents (Ferguson et al., 2009). A study presented by
Ferguson et al. (2009) examined a multivariate analysis to
determine influences and predictors of youth violence and
aggression. Ferguson et al. used a quantitative survey
questionnaire design to determine multivariate risk factors
of violence and aggression among adolescents. The
independent variables were family violence and discord,
negative peer relationships, and media violence. The
dependent variables were aggression, bullying, and
delinquent behaviors.

195Sampling Strategy
The sample size was 603 Hispanic youths from a small
city in the South Texas region with children aged 10 to 14.
The sample units were adolescents with equal numbers of
males (n = 309, 51.2%) and females. Ferguson et al. (2009)
noted that the sampling frame was mostly Hispanic (96.8%).
However, many studies have studied Caucasian adolescents;
therefore, the investigator perceived this was appropriate
for this sample (Ferguson et al., 2009).
Measurements
Likert-scale items were used along with psychometric
properties that were suitable for multiple regression
analyses. There was IRB approval to conduct the study with
human participants. Measurements of the independent
variable, negative life events, examined neighborhood
problems, antisocial personalities, family attachment, and
delinquent peer relationships. Neighborhood problems were
measured by questions such as How much of a problem are each
of the following in your neighborhood? Vandalism, traffic,

196burglaries, (alpha = .87). This suggests strong reliability
of the questionnaire. Ferguson et al. (2009) studied
negative relationships with adults (e.g., My parent think I
break all the rules and get into trouble; alpha = .95).
Other variables included antisocial personality (e.g., It is
important to be honest with your parents, even if they
become upset or you get punished; to stay out of trouble, it
is sometimes necessary to lie to teachers; alpha = .70).
Additionally, they asked about family attachment (e.g., On
average, how many afternoons during the school week, from
the end of school or work to dinner, have you spent talking,
working or playing with your family; alpha = .87).
Delinquent peer relationships were measured (e.g., How many
of your close friends purposely damaged or destroyed
property that did not belong to them; alpha = .84). Most of
the variables were in the category of negative life events
and served predictor functions and as outcome variables.
Ferguson et al. noted there were no notable overlaps between
subscales. This was suggestive of strong predictor outcomes.

197The family environment was measured on a 90-item true–
false scale to assess family interactions, styles, and
communication. Ferguson et al. (2009) noted strong internal
consistency and test–retest reliability, as well as validity
in distinguishing between functional families and
dysfunctional families that experienced a variety of
dysfunctions. The dysfunctions included psychiatric and
substance-abuse problems and abuse. The family-conflict
subscale was used by Ferguson et al. (alpha = .57).
The family-violence variable was measured on the
Conflict Tactics Scale, which measured positive and negative
behaviors occurring in marital or dating relationships.
Ferguson et al. (2009) said the Conflict Tactics Scale
showed good internal validity and reliability to measure
conflict and aggression occurring between primary caregivers
and their spouses or romantic partners that may affect their
adolescent child. This scale gave an impression of the sense
of exposure to domestic violence and physical assault (alpha
= .88) and psychological aggression (alpha = .81). Ferguson

198et al. did report the significantly skewed distribution
among the variable family violence and this was approached
by conducting a square-root transformation to normalize the
distribution.
Child participants were questioned about three
different favorite television and video games, and asked to
rate the frequency of playing those games and watching
television or viewing the media (Ferguson et al., 2009). The
adolescent participants were also asked to “rate the media’s
violence level.” The measure of validity and reliability was
strong and with the video-game portion demonstrated a
coefficient alpha reliability of .83; television violence
demonstrated an alpha of .71. Depression was another
variable examined, but already because this was described
above, it is not explored in this section.
Outcome Variable Measures
Aggression. Ferguson et al. (2009) used the Child
Behavioral Checklist in a self-reporting questionnaire in
which parents and teachers reported problematic behaviors

199among their adolescent children. The Child Behavioral
Checklist was well-researched and had strong validity and
reliability; according to Ferguson et al. Caregivers filled
out the parental part of the form and the adolescent
participants filled out the youth self-report. The indexes
were used to indicate the outcomes related to delinquency
and aggressiveness. Ferguson et al. indicated all alphas
were above .70.
Bullying. The Olweus Bullying Questionnaire was used to
measure bullying behaviors in the study. Ferguson et al.
(2009) found validity and reliability to be strong in this
instrument with alpha = .85.
Delinquent behavior. Delinquent behavior was measured
in the Negative Life Events instrument that questioned
adolescent about peer relations and delinquent behaviors.
Questions asked, for example, how many times in the past
year have you stolen something worth more than $50. The
scale was further divided into nonviolent (alpha = .96) and
violent (alpha = .99) criminal activities.

200Statistical analyses. Statistical analyses used
multiple regression with separate hierarchies to show the
outcome of each measure related to pathological aggression,
according to Ferguson et al. (2009). Considered were parent
and adolescent versions of the Child Behavioral Checklist,
aggression, rule-breaking scales, and violent and nonviolent
crime commission as self-reported on the Negative Life
Events instrument, along with bullying behavior. Negative
Life Events variables (neighborhood, negative adult
relations, antisocial personality, family attachment, and
delinquent peers) were entered on the second step, and the
Family Environment conflict Scale was entered on the third
step. According to Ferguson et al., the in the Conflict
Tactics Scale psychological aggression and physical assault
were entered on the fourth step and television and video-
game violence exposure entered on the final step. Secondary
analyses involved the use of structural-equation modeling to
test the causal and predictive relationship to pathological
youth aggression.

201The investigators did not state what software was used
to analyze the data. The results of the statistical analysis
using seven bivariate correlations measured outcomes.
Ferguson et al. (2009) found all correlations to be
significant at the p < 0.1 level and ranged between .19
and .80. In addition, nonviolent and violent criminal
behaviors correlated highly with each other (r = .75);
however, they correlated less with other measures of
aggression (range .19 to .32).
Table 1 in Ferguson et al. (2009) presented a strong
correlation for Hispanic males who break rules (r = .10, CI:
95%: .02–.18), and the variable negative adult relationships
was significant for adolescents among aggression and rule-
breaking (r = .15, CI: .07–.23), and (r = .15, CI: .07–.23),
respectively. This may suggest that Hispanic males break
more rules, and negative relationships with adults were
significant among Hispanic males and females among
aggression and rule-breaking. In addition, for parents,
negative adult relationships were evident for aggression and

202rule-breaking (r = .016, CI: .08–.24; r = 0.11,
CI: .03–.19). Bullying behavior was also correlated with
negative adult relationships (r = .10, CI: .02–.18). Family
attachment was significantly negatively correlated with both
adolescents and parents (r = –.09, CI: –.01 to –.17), and
positively correlated with bullying behavior (r = .10,
CI: .02, .18). In addition, delinquent peer relationships
were strong correlated with the multiple variables of
adolescent aggression and rule-breaking at (r = .21,
CI: .13–.29; r = .30, CI: .23–.37), and parental view of
aggression and rule-breaking at (r = .09, CI: .01–.17;
r = .15, CI: .06–.22).
Unlike other predictor variables, delinquent peer
relations were significantly correlated with nonviolent
crimes and violent crimes at (r = .17, CI: .09–.25). On the
Conflict Tactics Scale, psychological aggression was
significantly correlated with child aggression (r = .12, CI:
.04–.20), and child rule-breaking (r = .08, CI: .00–.16). In
addition, parent aggression was significantly correlated

203with psychological aggression (r = .17, CI: .09–.25), and
parent perceptions on rule-breaking (r = .11, CI: .03–.19).
However, psychological aggression was not correlated with
nonviolent crimes and violent crimes. The data may suggest
that aggression alone does not predict influence on the
adolescent and this was perceived among parents of the
targeted adolescents. Video=game violence was significantly
correlated with bullying behavior (r = .15, CI: .03–.19);
however, television violence was not significantly
correlated. Overall, Table 1 presented that delinquent peer
relationships were significant in predicting adolescents’
and parents’ perceptions of nonviolent crimes and violent
crimes, and this included bullying behaviors. This is
suggestive of delinquent peer relationships creating
additional issues for adolescents and their parents.
Ferguson et al. (2009) presented Table 2 showing
bivariate correlations between all measures. Among the Table
2 variables using Pearson correlation, delinquent peer
relationships were significantly correlated with

204neighborhood violence, antisocial personality, conflict of
adolescents, parental physical assault, rule-breaking and
aggression, nonviolent crimes and violent crimes, and
bullying, whereas media violence was significantly
correlated with bullying, but not nonviolent and violent
crimes.
This is suggestive that media violence predicts
adolescents’ behavior between the perpetrator and victim for
bullying, but delinquent peer relationships are predictive
of conflict with adults and parental relationships, and may
influence the adolescents to react with violent crimes and
nonviolent crimes as reinforcement for their bullying
behavior toward other adolescents. Limitations of the study
were that only Hispanic adolescents were chosen for the
study, thereby making selection bias a possibility. The
investigator noted that other studies examine Caucasian-
majority samples; therefore, Hispanic adolescents were an
underserved population. Ferguson et al. (2009) thought that
additionally studies generalizing the results from this

205study should be used with caution. The reasoning may be that
their study looked toward intervention and future public-
policy approaches. I used this study to show that negative
peer relationships among adolescents may affect all of the
relationships around them and media violence is a major
contributor to bullying that is a predictor of violence
among adolescents.
Low-Income Families
Studies have shown vulnerability among adolescents who
live in poorer neighborhoods to violence. A study by Egerter
et al. (2011) presented a narrative qualitative case study
of how adolescents and families are vulnerable to violence;
thereby creating issues of hopelessness and strife. Egerter
et al. found that families with adolescents that have low-
incomes and parents who are less than college graduates are
encountering greater exposure to violence. Exposure is much
greater to violence with weapons, robbery, physical assault,
and murder. Social and economic disadvantage creates
disparities and increases doom among the adolescents and

206families who reside in those communities and neighborhoods
(Egerter et al., 2011).
Safety and Bullying
Environmental Factors
Neighborhood and community safety and gang violence.
Studies show neighborhood safety may be an important
determinant of environmental childhood obesity for certain
ethnicity/race groups. Duncan et al. (2009) presented a
quantitative study about how environmental safety can affect
adolescent obesity prevalence.
Measurements. Duncan et al. (2009) explained the
measurements of the studies’ calculations were defined by
self-reported height and weight data and computed BMI
(kg/m2) for adolescents’, based on CDC growth charts.
Sampling strategy. The 2006 Boston Youth Survey was
employed to show a perceived association and relationship
between neighborhood safety and being at-risk, or being
overweight or obese. Duncan et al. (2009) noted the Boston
Youth Survey participation was for students in Grades 9

207through 12 from Boston public-school districts. The sampling
frame was all of the 34 Boston public high schools. The
survey explored two stages of a stratified-sampling design.
Additionally, Duncan et al. indicated that the stratified
sampling-design instrumentation was developed by the study
staff and the instrument covered a wide range of topics
(e.g., health behaviors, use of school and community
resources, and indicators of positive youth development),
and emphasis was placed on violence. Duncan et al. defined
the violence items to address aggressive behavior,
victimization and assault, witnessed violence, fear of
violence, and weapon carrying. Surveys were not marked to
protect the confidentiality of the participants involved. In
addition, Duncan et al. mandated informed consent prior to
distribution of the survey, and 70 of the 1,323 student
participants declined. Duncan et al. selected the targeted
schools randomly with a probability of proportion to each
school’s enrollment size. Additionally, Duncan et al.
clarified that among the participating schools, 18 actually

208participated. Classrooms with five or fewer students were
not included because they didn’t meet the criteria of random
selection (Duncan et al., 2009). Therefore, the data
analysis showed there were 1,253 surveys collected in the 18
schools and the surveys excluded 38 students (3%) from data
analysis. The authors’ reasoning for exclusion was that 35
students left the area, at least 80% of questionnaire items
were unanswered by participating students, and because of
unusual answering patterns. In addition, Duncan et al. noted
that of the remaining 1,215 students, 75 student exclusions
were because height and weight items were not answered and
perceived neighborhood-safety items were not fully answered.
This resulted in an analytic sample size of 1,140 after
subtracting the excluded students.
Measurements. Duncan et al. (2009) used chi-square
statistics and equivalent p-values to compare perceived
neighborhood safety by several dimensions of association.
The researchers explored prevalence ratios with 95% CIs to
show relationships between perceived neighborhood safety and

209prevalence of risk, to being overweight or obese for
managing related covariates and school sites. The study
variables were given as three different variables; the
variables were the primary dependent variable, the primary
predictor variable, and the covariate. The primary dependent
variables were adolescent students who were overweight,
obese or highly at-risk. Duncan et al. noted the variables
of this calculation used BMI as the basis for respondent’s
answers by height and weight (e.g., weight in kilograms, and
height in centimeters). In addition, BMI was the basis of
classification for labeling, such as, underweight, healthy
weight, overweight, obese, or at-risk for being overweight.
These classifications were obtained by using age and sex-
specifics that had cut-offs based on the CDC Charts from the
year 2000 (Duncan et al., 2009). The 95th percentile or
above was classified as extremely overweight and 85th percentile
or above was classified as at-risk for being overweight (CDC, 2009,
as cited in Duncan et al., 2009).

210The primary predictor variable was the adolescents’
perceptions of neighborhood safety. Duncan et al. (2009)
noted the questions “Do you feel safe in the neighborhood”
and respondent answers were always, sometimes, rarely, and were
dichotomous (e.g., rarely/never or always/sometimes) for analyses.
The perceptions of neighborhoods is caused by safety
indicators that might evaluate an association between safety
with beliefs about seriousness of gang activity in the
neighborhood, community, or school districts, and witnesses
of those individuals in the neighborhood being attacked with
weapons (other than guns) within the last year. In addition,
individuals being physically attacked in the last year
(i.e., punched, kicked, choked, or beaten up), might be the
reason for decreasing activity among school-aged children in
the neighborhoods (Duncan et al., 2009). The covariates
included ages (i.e., less than or equal to 14 years of age
or greater than 18 years of age), grade levels were among
ninth- through 12th-grade students, and gender was

211calculated by male and female. Also, all races/ethnicities
were considered in analyzing statistical data.
Results. In Table 1 Duncan et al. (2009) presented
empirical evidence about the characteristics of those
participants who responded well. Table 1 showed that one
half of the students were overweight. In fact, 49.6% of
Hispanic adolescents were at risk, compared to 45.6% of
Black students, 39.3% of White students; and 33.9% of
students from other ethnic groups (Duncan et al., 2009).
Furthermore, Duncan et al. noted ninth-grade students
(50.29%) were more likely to be overweight or at-risk of
overweight or obesity compared to 10th grade students
(44.7%), 11th grade students (39.1%), and 12th grade
students (43.9%; Duncan et al., 2009). However, the chi-
square (χ2: 10.62) analysis supported a strong association
with race/ethnicity for neighborhood safety and at-risk for
being overweight. The least likely association was gender
(χ2: 1.02) for neighborhood safety and at-risk for being
overweight (Duncan et al., 2009).

212Table 2 by Duncan et al. (2009) presented dimensions of
neighborhood violence by perceptions of participants living
in those neighborhoods or communities. Duncan et al. showed
the perceptions of other race/ethnic groups (i.e., Asian,
Pacific Islander, and Alaskan participants): 35.6% of
participating students felt safe in their neighborhoods,
43.9% said they felt somewhat safe, 11.6% felt rarely safe,
and 8.9% never felt safe in the neighborhood. Duncan et al.
found there was no statistical correlation between students
who said they rarely felt safe and never felt safe and sex
and age. Additionally, participants who reported that they
never or rarely felt safe perceived that gang violence was a
serious issue in the community or school, and witnessed
someone being attacked by a weapon (other than a firearm) in
the past 12 months. In contrast, Duncan et al. validated
that adolescent participants who reported they rarely felt
safe or never felt safe in their neighborhoods or
communities were no more likely than those participants who
felt safe or sometimes safe to witness someone in their

213neighborhood physically assaulted in the past 12 months to
be overweight, obese, or at risk of overweight. This
response gave the impression that no matter in which
neighborhood an adolescent resides, seeing fights can become
an occurrence of violence. Also, among 25% of African
American students who never felt safe or rarely felt safe in
their neighborhoods, and Hispanic students, 17.8% are more
likely to feel unsafe in their respective neighborhoods
compared to White adolescents, and this is true of 9% of
students of other races or ethnic groups (Duncan et al.,
2009).
Table 3 showed great significance in estimating
overweight status among students who rarely felt safe or
never felt safe in their communities or neighborhoods
(Duncan et al., 2009). The first model displayed prevalence
ratios of those participating students who always and
sometimes felt safe in their respective neighborhoods
(Duncan et al., 2009). The difference by race is evident.
For instance, Duncan et al. (2009) showed White students

214were 1.42 times (95%, CI: 0.82, 2.46) more likely to feel
safe or sometimes feel safe in their neighborhoods than
African American and Hispanic students sense of safety in
their own neighborhoods: This gives significance and
validation to White students feeling safer in their
neighborhoods compared to African American and Hispanic
students. Duncan et al. (2009) noted Black adolescents were
1.09 times (CI: 0.88, 1.34) more likely to feel safe or
sometimes feel safe in their neighborhoods and Hispanic
students were 1.24 times (CI: 0.98, 1.59) more likely to
feel safe or sometimes feel safe in their neighborhood,
compared to White students. In addition, those of other
races/ethnicities were 1.54 times (CI: 0.90, 2.64) more
likely to feel safe in their neighborhoods than White
adolescents (Duncan et al., 2009). In comparing the data
above, Hispanic and Black students were more likely to feel
unsafe in their neighborhoods than White students. Black
students had the highest association between feeling unsafe
and physical inactivity.

215Model 2 also described by race the estimation of how
safe each ethnicity felt in their respective neighborhoods.
White students were 1.25 (CI: 0.71, 2.18) times more likely
to feel safe in their own neighborhoods, compared to Black
(1.10, CI: 0.99, 1.36), Hispanic (1.16, CI: 0.91, 1.49), and
students of other races/ethnicities (1.58, CI: 0.91, 2.73).
The surprise was that those of other races/ethnicities felt
safer than their White counterparts were. Likewise, the
third model displayed White students as 1.23 times more
likely, compared to Black (1.10, CI: 0.90, 1.34), Hispanic
(1.16, CI: 0.89, 1.51), and students of other
races/ethnicities (1.56, CI: 1.02, 2.40) to feel safe in
their respective neighborhoods. In addition, Hispanic
adolescents showed constant prevalence ratios across models
with Black adolescents feeling less safe in their
neighborhoods, displayed by the quantitative numbers
presented. Overall, White students felt safer in their
neighborhoods than Black and Hispanic students.

216Discussion. Duncan et al. (2009) found that Hispanic
and Black adolescents who never felt safe or rarely felt
safe in their neighborhoods were associated with risk to be
overweight, being overweight, or being obese. In addition,
studies showed empirical evidence that being overweight, at-
risk for being overweight, or obese may be associated with
neighborhood safety and violence for Hispanic and Black
youth.
There were several limitations to the study. The first
limitation was that the study was cross-sectional, limiting
causal relationships (e.g., whether exposure actually
preceded the outcome; Duncan et al., 2009). The investigator
communicated that the limitation was delimited because the
hypotheses and directionality of the study had intuitive
appeal from the other research studies (Duncan et al.,
2009). Another limitation was that the investigators did not
evaluate specific dimensions of neighborhood safety, because
they were particularly interested in perceived neighborhood
safety (Duncan et al., 2009). Third, the reliance on self-

217reported data may have created potential for
misclassification of inaccurate reporting of, for example,
BMI. The investigators found that all results of BMI were
significant with valid reports. In addition, residual
confounding may be a concern. The confounding variables
described by Duncan et al. (2009) having an association with
both the independent and dependent variables were household
income, parental education, and residential stability. The
investigators communicated that confounders were limited
because of the lack of accounting for those variables in
adjusted regression analyses, because these questions were
not asked in the Boston Youth Survey.
Overall, the study presents empirical evidence that
neighborhood safety may be associated with being at-risk,
being overweight, and being obese among certain
race/ethnicity urban adolescent groups. I used this study to
show how unsafe neighborhoods, communities, or schools may
limit physical activity among certain race/ethnicity urban
adolescent groups in the State of Massachusetts.

218Safe Places to Play
Safe places to play are becoming an issue with
sociodemographic and neighborhood characteristics.
Inactivity is a major issue in neighborhoods and communities
where safe places to play with access to parks, playgrounds,
and schoolyards are limited because of relationship to
violence-related behaviors (WHO, 2010). Babey et al. (2008)
presented a study that examined whether the relationship
between physical activity and access to parks among
adolescent is different, contingent on the sociodemographic
and neighborhood characteristics. Babey et al. hypothesized
that access to safe parks is associated positively with
regular physical activity and negatively associated with
inactivity for (a) adolescents who reside in urban areas,
(b) adolescent who live in apartments but not in houses, (c)
adolescents who reside in unsafe neighborhoods but not safe
neighborhoods, and (d) adolescents from low-income but not
higher income families. Because the variable physical
activity varies by race, the association between park access

219and activity was examined for different racial groups (Babey
et al., 2008).
Babey et al. (2008) used a quantitative telephone
survey that was randomly digitally dialed to 42,000
households designed to be representative of California’s
noninstitutionalized population. Babey et al. noted that
responses from 4,010 adolescents aged 12–17 were analyzed.
The analyses were indicative of two physical-activity
outcomes. Those outcomes outlined by Babey et al. defined
regular activity as, “either at least 20 minutes of vigorous
physical activity on 3 or more of the last 7 days or at
least 30 minutes of moderate activity on 5 or more of the
last 7 days.” Inactivity was defined as, “either less than
20 minutes of vigorous activity or 30 minutes of moderate
activity in the last 7 days.” Notable in the physical
activity and inactivity measures are the older standards
from the WHO (2010) and CDC (2010c).

220Analysis
Babey et al. (2008) conducted four sets of stratified
logistic regression to examine the relationship between
physical activity and access to a safe park among
adolescents in (a) urban versus rural areas, (b) apartment
building versus houses, (c) neighborhoods perceived as
unsafe versus safe, and (d) lower versus higher income
families. A fifth set of analyses examined the relationship
among Hispanic, Afro-American, Asian, and White adolescents.
Babey et al. noted that logistic regression of regular
activity and inactivity interactions included access to safe
parks, and each of the five factors mentioned above. The
reasoning was to determine each variable for validity
purposes and to provide empirical evidence of a relationship
between each related variable. All of the represented models
consisted of variables—age, race, gender, urbanicity, and
park access—that were self-reported by the adolescent
participant, unless the characteristic was used as a
stratifying variable. The possible reasoning was because the

221investigators wanted true validity of the study and
adolescents who were not stratified may have hindered the
validity of the study. Variables such as housing type,
neighborhood safety, and family income were self-reported by
the adults of the adolescent participant. Additionally,
noted by Babey et al., was urbanicity was based on the
population density of the adolescents’ geographical zip
code.
Results
The results of the study showed, from Table 1 presented
by Babey et al. (2008), that one quarter (25%) reported no
safe access to park or playground, and 71% actually engaged
in physical activity, but 7% were inactive among adolescents
(Babey et al., 2008). In addition, Table 1 showed N = 3,269
(81.52%) out of N = 4,010 households displayed significant
relative risk odds ratios for adolescent physical activity
in urban areas (AOR = 1.10, 95%, CI: 1.01–1.17), and
adolescent inactivity in urban areas (AOR = 0.58, 99%, CI:
0.39–0.86). The number suggests that physical activity,

222inactivity among adolescents from urban areas and rural
areas were not significant. Other results in Table 1 showed
that N = 869 (21.67%) out of 4,010 showed physical
inactivity was significant among adolescent residing in
multiunit buildings than in houses (AOR = .052, CI: 0.28,
0.96). Physical activity among this variable was not
significant. The numbers suggests that more inactive
adolescents live in multidwelling units. Additionally, other
adolescents who live in unsafe neighborhoods were found to
be inactive (AOR = 0.47, CI: 0.23–0.93). Among the variable
of adolescents in families with income below 300% federal
poverty level N = 1,973 (49.20%) out of 4,010, statistics
were significant for physical activity (AOR = 1.10, 90%, CI:
0.99–1.19), and inactivity (AOR = 0.62, 0.39–0.97). In
summing up Table 1, it is notable that adolescents who live
in multidwelling units, who live far below the poverty line,
and who reside in unsafe neighborhoods are more likely to be
inactive.

223So far, in the review of research, African American
adolescents encounter greater violence, bullying, and
inactivity; however, in Table 2, Babey et al. (2008)
explored the association of access to safe parks in
relationship to physical activity. The results presented in
Table 2 showed significance among races: Asian (AOR = 0.36
95%, CI: 0.14–0.97) and White (AOR = 0.57, CI: 0.31–0.99)
adolescents’ numbers were significant and African American
and Hispanic students’ numbers were not.
Summary
The results of the study showed differences may be seen
between physical activity and access to safe parks based on
sociodemographic, housing, and neighborhood characteristics.
Babey et al. (2008) noted that previous research provided
limited evidence, in studies of safe park access, of an
association to physical activity. In contrast, Babey et al.
found there are some studies that showed no consistent
association between physical activity and recreational
facilities. Based on the evidence of recent studies, results

224were consistent with the concept that families with limited
resources who live in poverty or low-income areas are more
likely to encounter exposure to violence that limits the
ability to exercise and creates vulnerability to health
risks among adolescents. The surprising part of the study
was the significance among adolescents that were White and
Asian. This may be because mostly Asian and White youths
were part of the stratified areas of analyses.
This study differed for the race/ethnicity variable
from other studies. Other studies explored minorities and
found African American and Hispanic youth perceived being
unsafe, but in this study White and Asian youth were more
likely to perceive themselves as being unsafe. This may
suggest that not only African American and Hispanic students
who live in underserved areas and are poor have limited
access to safe parks, but all adolescents of low-income
neighborhoods, communities, and households that are below
the poverty line may encounter limited access to safe parks
or playgrounds. Babey et al. (2008) noted a limitation of

225the study was that the self-reported nature may have not
allowed full understanding of having a park near home and
safety of parks and may be indicative of perceived rather
than objective access and safety.
The investigators of the study did not mention
additional research. Yet, the results of the study provided
evidence that health-promotion policies should consist of
promoting safe physical activity among all youths. I used
this study to show that low-income adolescents who live in
poor areas may encounter unsafe park access that limits
their ability to exercise and increases inactivity levels
that create vulnerability to health risk among adolescents.
Excessive Television Watching
Defining Excessive Television Watching
The AAP (2013) defined excessive television watching as
meaning that children under the age of 2 years should have
no access to television, and children ages 8 to 18 should
not view more than 1to 2 hours per day of noncommercial
entertainment television. Excessive television watching may

226contribute to CVD, Type-2 diabetes, high blood pressure, and
increase risk for asthma, inactivity, obesity, and poor
academic performance among adolescents. In addition,
Attention Hyperactivity Deficit Disorder (ADHD), depression,
and antisocial behavior are other factors to which excessive
television viewing may contribute (AAP, 2013).
Combined Factors of Excessive Television Watching
The indication may be strong for excessive television
watching and lack of inactivity that may cause obesity among
adolescents. Eisenmann, Bartee, Smith. and Welk (2008)
presented a cross-sectional study that used quantifiable
measures on the combined influence of excessive television
watching and physical activity in relationship to being
overweight and obese.
Measures. Students were enrolled in the YRBS (2001) by
the CDC. The instrumentation used was a survey analysis that
measured all public, Catholic, and private secondary
educational schools in the United States. The survey design
included three-stage cluster sampling to produce a national
227sample (Eisenmann et al., 2008) including counties and
classes. The first stage included large counties, or groups
of smaller adjacent counties. The second stage included
schools, and the third stage included classes. Blacks and
Hispanics were sampled at relatively higher rates than all
other students (Eisenmann et al., 2008). Trained research
collectors helped to protect the confidentiality of the
sample.
Sampling. The sampling units were recoded with their
own strata (Eisenmann et al., 2008), as was necessary for
counties with larger enrollments. The sample schools that
comprised the main school-sampling strata were treated as
the primary sample in those sampling strata. The sampling
units were high school students and the sampling frame
included 12,464 adolescents ages 14 to 18.
Analyses. Prevalence rates were calculated by sex.
Also, logistic regression was used to display odd ratios
(OR) and confidence intervals for the variable of being
overweight. The variables of race/ethnicity and age were

228controlled in the study. The SUDAAN software package was
used for the parameter estimates because it used the Taylor
series linearization to adjust for the complex survey design
of the YRBS (2001) survey design.
Results. Table 1 in Eisenmann et al. (2008) described
descriptive characteristics from the YRBS (2001); those
characteristics showed that of 6,080 male adolescents, 29.2%
were overweight (95% CI: 27.3–31.1). Of 6,384 female
adolescents, 6.9% were overweight (CI: 15.6–16.84). The
characteristics for obesity among male adolescents was more
prevalent 15.6 (CI: 14.2–17.0). Female adolescents showed
less prevalence for obesity than their male counterparts:
8.2 (CI: 7.2–9.4). Meeting the moderate physical activity
guidelines (MPA) 3–5 days per week for 60 minutes was less
prevalent among male teens 24.5 (CI: 22.8–26.2) than female
teens 26.4 (CI: 25.0–27.9). However, female teens were more
likely to not have MPA < 2 days 58.0 (CI: 56.3–59.7)
compared to male teens 54.5 (CI: 52.6–56.5). Among the
characteristic of vigorous physical activity (VPA), 6–7 days

229per week for 60 minutes each, male adolescents displayed
more prevalence to exercise 38.1 (CI: 35.8–40.4) than female
adolescents 21.6 (CI: 20.–23.3). In addition, female teens
43.0 (CI: 40.5–45.4) were less likely to partake of VPA less
than 2 days per week than male adolescents 27.4 (CI: 25.2–
29.2). Among the characteristic of television watching, male
teens 41.9 (CI: 40.0–43.7) were more likely to watch
television excessively more than 1–2 hours per day compared
to female teens 39.5 (CI: 37.7–41.5).
Table 2 in Eisenmann et al. (2009) described
characteristics of association between television watching,
physical activity, and being overweight or obese among the
14 to 18 year old participants of the YRBS (2001). The
results showed that female adolescents (n = 1043; OR = 2.03,
95% CI: 1.41, 3.04) who had higher levels of extensive
television watching and lower levels of MPA had a stronger
association with being overweight or obese. Female teens
(n = 788; OR = 3.11, CI: 2.17, 4.46) also showed a stronger
association between being overweight or obese and having

230higher television-viewing levels and lower VPA levels. In
contrast, female teens with low television viewing and MPA
had the lowest odds of being overweight (OR = 0.60, CI:
0.44, 0.82).
Discussion. This study gave empirical evidence of a
strong association between high levels of excessive
television watching and low levels of MPA and VPA and being
overweight and obese. Female adolescents were more likely to
have lower levels of physical activity and higher levels of
television viewing. Eisenmann et al. (2008) noted that there
was a graded association between the level of MPA and risk
of overweight among adolescents who watched more than 4
hours of television per day. Eisenmann et al. also noted
that physical activity, measured on the basis of a
relationship between adiposity and physical activity,
depends on specificity/sensitivity of the instrument that
measures physical activity. Because of the self-reported
questioning and single-item assessment, the measure of dose
of physical activity in days per week was a less sensitive

231measurement than was used for television hours per day
(Eisenmann et al., 2008).
Limitations. A limitation to the study was its self-
reporting nature. Self-report could allow biases because
researchers could use their own thought process and
experiences to create a questionnaire. In addition, the
self-reporting nature of the survey may allow validity
issues because physical activity on self-reporting surveys
are limited and indicate modest validity (Eisenmann et al.,
2008). Another limitation is self-report height and weight.
However, addressed by adjusting height and weight before
calculating the BMI, based on correction factors developed
from age-to-sex-race specific questions (Eisenmann et al.,
2008). Another limitation is that the study was cross-
sectional in nature and cause and effect could not be
inferred.
Conclusion. This study gave empirical evidence about
the combined influence of television watching and physical
activity and their relationship to obesity and being

232overweight for school-aged children. The researchers gave
evidence that adolescent girls are more likely than male
adolescents to have issues with excessive television
watching and moderate and vigorous activity, evident among
the high levels of television watching and low physical
activity. Female students who were inactive and excessively
watched television were more likely to be overweight or
obese. The self-reporting nature of this study created
limitations, but the author met each limitation with an
answer. Eisenmann et al. (2008) noted that to better
understand associations, one might want to replicate the
findings using different samples and different measures. I
used this study to show that excessive television watching
and inactivity may associate with being overweight or obese.
Bullying and Television Watching
Children and adolescents who view violent programs on
television that contain guns, knives, and physical fighting
may be influenced to be bullies in their respective schools.
Zimmerman, Glen, Christakis, and Katon (2005) used a cross-

233sectional survey design that used quantitative measures to
describe early cognitive stimulation, emotional support, and
television watching as predictors of subsequent bullying
among grade-school children.
Measures. The authors used data information from the
National Longitudinal Survey Study (NLYS, 1979) of children
and young adults, sponsored by the Department of Labor.
Information for the NLYS (1979) and Child-NLYS were obtained
from mother and child, depending on the age of the child.
Child–mother data were linked via the sample’s mother
identification number. Data from the NLYS and Child-NLYS
were drawn for this study using CHRR Database Investigator
Software.
Sampling. The sampling frame was 6 to 11 year-old
female children at the time of the survey interview. The
sampling units were grade-school girls. The covariates in
the study were race, age, and sex (Zimmerman et al., 2005).
Analysis. Zimmerman et al. (2005) used multivariate
logistic regression to show that watching violent television

234programs predicted bullying at later stages of life. They
used two different subscales to predict the variables of
cognitive stimulation and emotional support. The cognitive-
stimulation variable was measured by the Home Observation
for Measurement of the Environment subscale. This subscale
was used to describe variable cognitive stimulation because
the cognitive-stimulation score generally includes items
related to outings, reading, playing, and the parental role
in teaching a child. The same subscale was used for the
variable emotional support, but measured different
characteristics, such as eating meals with both parents and
parents talking with the child while working. The third
predictor variable was the number of hours of television
watched (Zimmerman et al., 2005).
Results. Table 1 in Zimmerman et al. (2005) described
descriptive statistics of variables of bullying in grade
school. The results showed that cognitive stimulation at 4
years of age (6.23±1.00, p < .01) and emotional support at 4
years of age (6.34±1.00, p < .01) levels were higher among

235nonbullies (n = 1094); consequently, African American girls’
(n = 172) bullying levels were higher (13.4, p = .28) than
those of White girls. Among the variable of television
watching, bullies (5.86±1.00, p = 0.04) showed higher levels
than nonbullies. The quantitative statistical data displayed
that nonbullies were more susceptible to higher cognitive
stimulation and emotional support. This statistic shows that
children of parents who take time to read to their children
and support them are unlikely to become bullies later.
African American girls showed a higher probability of being
bullies with much television viewing of violent programs.
Table 2 in Zimmerman et al. (2005) described regression
of bullying on early predictors. One of the higher level of
predictors was for the variable of television watching and
showed a strong association (OR = 1.06, 95% CI: 1.02–1.11)
at 4 hours per day. This statistic means girls who watched a
larger amount of television per day were more susceptible to
being bullies later on. Also, cognitive development
(OR = 0.67, CI: 0.54–0.82) and emotional support (OR = 0.67,

236CI: 0.54–0.84) were high predictors and showed an
association. This may indicate that children of parents who
do not take time to provide cognitive development and
quality emotional support for their children, may become
bullies later on.
Table 3 of Zimmerman et al. (2005) described the
regression of bullying in grade school on early predictors
and bullying. Once again, television viewing at 4 hours per
day showed strong association (OR = 1.09, 95% CI: 1.01–107)
to possible bullying later on. A cognitive-development score
at 4 years of age (OR = 0.81, CI: 0.62–1.05), and emotional
support (OR = 0.75, CI: 0.56–0.99), showed strong
association with bullying at 4 years of age (OR = 5.94,
3.47–10.15). The statistical data illustrated that high
amounts of television watching per day and children’s
cognitive development and emotional support from parents may
determine whether a child becomes a bully early in life,
even at 4 years of age.

237Discussion: The study authors queried whether emotional
support and cognitive development and television watching
are associated with subsequent bullying. The results of the
study provided empirical evidence of the association between
cognitive development and emotional support and how those
may predict bullying behaviors in girls aged 6 to 11.
However, boys were not tested in this survey, which may lead
to possible gender bias. Also, Whites were not mentioned in
the study.
Limitations. The role of television watching was
directed to violent media, and not media or television in
general. The authors noted that this was addressed by the
numbers of hours of television watching per day correlated
with all hours of violent television viewed. Another
limitation was that the study used maternal reports, whereas
the initial study was self-reported. In addition, the study
did not define bullying, so the reading audience may think
it pertains to all bullying, including cyberbullying. Also,
mothers could report children as bullies if the child fought

238with the mother frequently. Although, this is an antisocial
behavior, it may not be defined as bullying. In this sense a
Type-II error or “false positive” in the bullying measures
used were substantial (Zimmerman et al., 2005).
Thus, a mother’s perception was a limitation. Zimmerman
et al. (2005) noted that the way a mother viewed the label
could affect how she responded to the survey questions,
making the identifiable sample of children bullying a
possible Type-1 error. Finally, the authors did not explain
how they addressed limitations, and did not mention where
the data was for content of television watching. However,
the authors did note that findings would need to be
replicated to establish a causal relationship.
Conclusion. The study provided strong evidence on
cognitive development and emotional support in relationship
to bullying. However, several factors were noted. First, the
study did not define excessive television viewing, nor did
the study define bullying. Second, the study was done as a
maternal study from an original self-reported study. This

239study provided evidence on how much one watches violent
media and possible bullying later. However, without defining
bullying, how would one know what bullying outcome the
independent variable may affect? Overall, this study was
efficient in associating bullying with television watching,
but without defining each variable, further studies are
needed to confirm results. I used this study to show the
amount of television watched and the possible prediction of
bullying.
Consequences
Cardiovascular Disease Among Adolescents and Excessive
Television Usage
The Martinez-Gomez (2010) study, described earlier,
showed that male teens were taller and heavier than female
teens, but there was no difference in BMI. In contrast,
there were differences in weight-status groups: Adolescents
classified as overweight had less favorable values compared
to the nonoverweight group. Furthermore, adolescents in the
high-TV-viewing group were higher for waist circumference,

240HDL, total cholesterol, glucose, and triglycerides. The
results presented in each table suggested that inactive,
overweight, or obese adolescents may have CVD risk factors,
including high glucose, high triglycerides, low HDL, and
high total cholesterol compared to nonoverweight and active
adolescents.
Type-2 Diabetes
The University of Southern Denmark and Harvard School
of Public Health (2013) presented a case study that was
qualitative in nature about overindulging in television
watching and the association of higher risk of Type-2
diabetes and CVD. The study became important because Western
culture is commonly becoming less active and more sedentary
throughout the Western world. The study researchers noted
that inactivity is often associated with long hours spent in
front of a television set. The authors found an association
between excessive television watching, Type-2 diabetes, and
CVD (The University of Southern Denmark and Harvard School
of Public, 2013). The study researchers analyzed data from

241eight previous investigators who examined the relationship
between television viewing and health problems. They
observed four studies that linked high television viewing to
Type-2 diabetes of 176,000 participants and four studies of
34,000 individuals for heart problems. I used this study to
show the relationship or association between Type-2 diabetes
and CVD with excessive television watching.
Low Academic Performance and Excessive Television Watching
Low academic performance. Low academic performance may
be associated with watching longer hours of television per
day. Hancox, Milne, and Poulton (2005) presented a cross-
sectional study that used quantitative measures to describe
the association of television watching during childhood with
poor educational achievement. The authors presented a cohort
study that needed follow up during adulthood.
Measures. The study participants were born in Dunedin,
New Zealand. All the children at 3 years of age who lived in
the province of Ortega were invited to participate in the
study (Hancox et al., 2005). In the first follow-up, Hancox

242et al. (2005) used an educational-attainment survey and
Wechsler Intelligence Scale-revised for children to describe
the educational levels of children at each follow-up stage
and at 26 years of age.
Sampling. Hancox et al. (2005) noted 1,037 children
(91% of eligible births; 52 male), constituted the base
samples for the remainder of the study. Follow-ups were
performed at age 5 (n = 991), 7 (n = 954), 9 (n = 955), 11
(n = 925), 13 (n = 850), 15 (n = 976), 18 (n = 993), 21
(n = 992), and most recently, 26 years of age. At the age of
26 follow-up, the author noted the assessment of 980 (96%)
of the 1,019 study members were still living.
Methodology. The design of the study was a prospective
birth-cohort study that used quantitative measures. Hancox
et al. (2005) noted television viewing data was collected at
ages 5, 7, 9, 11, 13, and 15. Among those aged 5 to11,
parents were asked how much television their child watched
on weekdays. Children aged 13 and 15 were asked how many
hours of television they watched on weekdays and weekends.

243Hancox et al. noted the summary variable was a composite of
child and adolescent viewing that was calculated as mean
viewing per weekday between 5 and 15 years of age. Hancox et
al. noted additional analyses examined the associations
between television viewing in the following epochs:
childhood television viewing was calculated as the mean
viewing hours per weekday reported at 5 to 11 years of age.
Adolescent viewing was calculated as the mean viewing hours
per weekday reported at 13 and 15 years of age. Measurement
of educational attainment was achieved using a 4-point
scale: 1 indicated no qualification, 2 was any school, 3
meant having a higher level school qualification, and 4
indicated bachelor’s degree or higher. In addition, at 7, 9,
11, and 13 years of age, the Wechsler Intelligence Scale for
Children-Revised was administered.
Analyses. The goal of the study was to examine the
association of television viewing and educational attainment
by 26 years of age, and between television viewing and
attainment of a university degree by the age of 26 (Hancox

244et al., 2005). The statistical analyses consisted of a
logistic regression adjusted for sex and intelligence. Risk
ratios and 95% CI were estimated for each outcome using log-
binomial regression models. Hancox et al. (2005) noted that
additional regression models examined the association
between television viewing and education outcomes with
additional adjustment for childhood economic status and
childhood behavioral problems.
Results. Table 1 of Hancox et al. (2005) displayed the
highest qualification achieved by 26 years of age and
television viewing time during childhood and adolescence,
according to education outcome. The measurement of this
variable was in means toward television hours per weeknight
reported between 5 and 15 years of age. Hancox et al. noted
p = .001 significance for trends across groups. Results
showed that men 18.0 (n = 490) were more likely than women
11.5 (n = 477) to have no qualification of education that
were associated with watching high amounts of television per
weeknight. Also, the possibility of not graduating from high

245school by 26 years of age was more prevalent among this
category for the variable 2.76 hours of television watching
(SD = 0.93). Among the post-high school and university
degree category, women (n = 490) with 47.2 and 25.0
television hours displayed higher levels than men (n = 477)
with 47.1 and 19.0 television hours. Those with educational
attainment at the degree level had the lowest level and
watched the fewest hours of television 1.95 (SD = 0.77).
Those children who watched the least amount of television
had a greater chance of obtaining a degree by 26 years of
age.
Table 2 in Hancox et al. (2005) showed risk ratios from
regression of educational outcomes against childhood and
adolescent television viewing. The results showed that
childhood viewing (n = 947) among sex and I.Q. (OR = 1.43,
95% CI: 1.24–1.65) was a better predictor than adolescent
viewing (n = 835; OR = 1.37, CI: 1.21–1.55), and among I.Q.,
socioeconomic status, and behavioral problems at 5 years of
age (OR = 1.34, CI: 1.10–1.62), childhood viewing had a

246great impact than adolescent viewing (OR = 1.33, CI: 1.16–
1.54) for obtaining a university degree, making reverse
causation implausible. These results offer empirical
evidence that high amounts of television lower education-
outcome achievement.
Discussion. Hancox et al. (2005) noted that the results
of the study showed that excessive television watching
during childhood and adolescence was associated with lower
educational outcomes. However, these effects were
independent of socioeconomic status, intelligence, family
status, and childhood-behavior problems. The results gave
strong evidence that excessive television watching can have
a negative impact on educational achievement. However, to
say this outcome may reach to early adulthood and beyond is
beyond the purview of this study, because causal
relationship was not established. Hancox et al. noted the
study does fulfill many of the other requirements often used
to infer causality in an observational study, including
temporal sequence, dose-response relationship, and

247biological plausibility. Hancox et al. did not rule out
reverse causality because of the strong association between
adolescent television viewing and leaving school without any
qualifications.
Limitations. The authors did not discern whether
television viewing was significantly different according to
sex and socioeconomic status (Hancox et al., 2005). The
self-reporting nature of this study may have provided
responses of prior experiences; however, the authors claimed
there was no coercion to respond in certain ways, limiting
the likelihood of answering untruthfully. Another limitation
is that estimates of viewing television from early childhood
were not presented. Therefore, the authors could not address
the impact of preschool television viewing on educational
attainment. The cause of these limitations is that the
authors had no way of averaging viewing estimates at certain
ages. This lack of data makes it hard to establish cause.
The authors did note that because the target comparing

248childhood and adolescent television viewing to educational
attainment, some limitations would exist.
Conclusion. Overall, this study provided empirical
evidence that excessive television watching and educational
attainment were associated. The authors provided quality
methodology and results were precise (Hancox et al., 2005).
A weakness is that the authors should have attained
estimates for preschool children, to help in establishing
averages over the course of years. However, the authors were
trying to find indicators rather than cause; therefore, the
methodology used was justified. I used this study to show
how excessive television watching may lead to poor academic
performance or low educational attainment.
Summary of Literature Review
In summary of Chapter 2, I found studies on dependent-
variable physical activity, independent-variable bullying
and independent-variable excessive television watching.
Among the dependent variable physical activity, the evidence
of research provided that Massachusetts adolescents are

249inactive with increased risk of Type-2 diabetes, stroke, and
heart disease. Additional issues stemming from inactivity
were reviewed in Chapter 2. The relationship between
physical activity and inactivity found by investigators
showed a strong relationship between the two variables. The
studies were of a qualitative, experimental, and
quantitative nature, described earlier in the review.
I started the second section by defining bullying and
displaying the different types of bullying (including
traditional and electronic bullying). The differences
between the two were significant as traditional bullying was
explored more in this case, but electronic bullying was more
likely to have a relationship with sedentary behaviors.
Bullying was related to inactivity, but limited studies have
addressed this concept. The consequences of bullying were
peer victimization, low academic performance, injuries, and
increasing violence among minorities, and psychological
issues showed that bullying resulted in depression and low
self-esteem. Studies reviewed found that bully-victims are

250more likely to experience violence. Peer victimization,
parents working longer hours and thus providing less or no
supervision, peer functioning and influence, and family
cohesion and family structure influence and are influenced
by bullying. These variables showed that bullying has a
relationship among adolescents who are victimized, encounter
peer pressure from victimization, and have limited parental
supervision. The second independent variable excessive
television watching showed factors of media influence,
possible bullying, although undefined, parents working
longer hours and inactivity. Consequences of excessive
television were Type-2 diabetes, CVD, low academic
performance, ADHD, and being overweight and obesity. One
thing I noticed is studies did not mentioned excessive
television watching and bullying together as a cause or
indicator for inactivity among Massachusetts adolescents.
The methodology explored in most of the studies used a
survey design that was descriptive in nature and provided no
causal effect. In fact, a gap in the research found in most

251studies was causation limited in research. One study
explored the self-perception theory in a case-study
qualitative design that was descriptive in nature.
I noticed that many studies share a similar format to
the Chapter 3 framework I used with the YRBS and the
descriptive nature of the studies. Predictors or indicators
of bullying were established by the research design I used.
In Chapter 3 I describe similar instruments and methodology
to the reviewed studies presented here. Many studies used a
quantitative survey-design methodology; one study used a
mixed-method approach. SCT was the theoretical framework I
describe in Chapter 3, but was not used in any of the
studies reviewed. Chapter 2 prepared me for Chapter 3, as I
examined studies that used the YRBS as secondary data, with
convenience sampling. Convenience sampling allowed
multivariate and bivariate analyses of all studies.
Much of the software used in the studies was the SAS,
and logistic regression and multiple regression were part of
the analyses. This was evident in the predictable nature of

252studies that used correlation (r), beta (b), AOR, and CIs of
.05 (95%), and .01 (99%), and .1 (90%) for analyses of data
presented.
Overall, the different studies provided empirical
evidence showing that adolescent victims of bullying are
more at risk for depression, suicide, short life expectancy,
poor health (i.e., Type-2 diabetes, stroke, and heart
disease), and low academic performance in relationship to
lack of family structure, supervision issues, and parents
working longer hours. In Chapter 3, I will explore these
issues with the theoretical framework of Maslow’s (1954)
component of safety, and SCT.

253Chapter 3: Methodology
Research Design
The research design was quantitative, including
descriptive correlation analysis and inferential analysis of
predictor variables. The survey design was the data-
collection method via secondary analysis of archival data. I
examined possible predictors for the outcome variable of not
meeting minimum standards of physical activity for the
inferential analysis. I performed a descriptive correlation
study comparing bullying and excessive television watching
in relationship to inactivity. The outcome was a result of
excessive television watching and bullying. The
correlational component included a Spearman Correlation
coefficient that was translated into an R-value to determine
whether there is a significant relationship between the
independent and dependent variables. The inferential
statistics included a Kruskal–Wallis (nonparametric) test to
discern the significance among differences in hours of
television watching by level of physical activity, a Mann–

254Whitney U (nonparametric) test to determine where the
differences lay among the levels of physical activity, and
an ordinal regression analysis to test the relationship
between excessive television watching and the dependent
variable, inactivity. The analysis included standard of
error, degrees of freedom, and p-value to determine whether
there was a significant relationship between the independent
variable and dependent variables (Gerstman, 2008). In
addition, among the variable bullying, a chi-square test
helped determine the possibility of an association between
the row and columns of the variables (Gerstman, 2008). This
test determined a significant association of the independent
variable, bullying, to the dependent variable, inactivity. A
chi-square test was used to test for a significant
association between bullying and inactivity.
The survey design was warranted because it provided
justification to determine whether predictors were
significant for each variable. For instance, predictors of
significance using the survey design validated the

255independent variable of bullying in relationship to
inactivity. I described predictors of association between
the variables for the descriptive bivariate/correlational
component. For my inferential analysis plan, I compared
those adolescents who were bullied, inactive, and physically
threatened to those adolescents who were not bullied, were
physically active, and not physically threatened, using a
multivariate analysis. Ordinal logistic regression was not
tested among the variable bullying because of the prior
testing of the parallel lines. The test of parallel lines
assumption assesses whether there is a significant
difference between the model where the regression lines are
constrained to be parallel for each level of the dependent
variable and the model where the regression lines are
allowed to be estimated without a parallelism constraint.
The test of parallel lines was conducted and the results
were significant, indicating that the assumption was
violated. Due to this assumption violation, the ordinal
regression could not be conducted. The Mann–Whitney U test

256showed where those differences lay in the variable bullying.
The covariates were used to help distinguish between
different races, ages, and genders.
There may be an increased cost constraint with the
survey design. According to Babbie (2007), the cost of a
survey design may increase because of increasing the sample
size. The sample size may require additional resources that
affect cost and may become an expensive resource for the
researcher. In addition, the additional sample size may
increase budget capacity, where cost may affect the ability
to complete the research (Babbie, 2007). The cost of my
study was minimal because I used archival data already
completed by the authors. The only cost was providing the
analytic software needed to complete the necessary analysis
for my study. The survey design selected has been used in
many healthcare-survey studies. According to the YRBSS
survey cited in the CDC (2009d), the instrument has been
used in several studies over a period of time, assuring
validity and reliability of this instrument. I analyzed

257survey data that had already been collected. This is
important because the CDC and Department of Education data
obtained from the surveys has increased the knowledge of
public health and healthcare professionals all over the
world.
Population
Introduction to the Target Population
Massachusetts residents are experiencing increasing
obesity rates. Obesity rates among adolescents have doubled
in the last 17 years. In addition, rising inactivity is
raising concerns about health status and life expectancy
among adolescents in the Commonwealth of Massachusetts. The
age range in my study was participants 13 to 18 years of
age. The adolescents who were subjects of the original
survey were currently enrolled in the Commonwealth of
Massachusetts school districts in Grades 9 through 12.
Targeted Population
The targeted population was ninth- through 12th-grade
students in the State of Massachusetts who were male,

258female, and racially diverse adolescents who were bullied
and inactive compared to those adolescents who were
physically active and not bullied. In addition, those
adolescents who watched more than 1 to 2 hours per day of
television were compared to those adolescents who did not
watch more than 1 to 2 hours of television per day.
Eligibility
In the original survey study, adolescents in Grades 9
through 12 who resided in the State of Massachusetts and
were currently enrolled were eligible to participate in the
study. This included adolescents who were bullied, not
bullied, inactive, and physically active, and watched more
than 1 to 2 hours of television per day, and those
adolescents who did not watch 1 to 2 hours of television per
day.
Characteristics of the Study Population
Races/ethnicities included in the original study were
Black, White, non-Hispanic White, and Black Hispanic
adolescent students in Grades 9 through 12 in the

259Commonwealth of Massachusetts. Male and female genders were
included. The ages of participants who were surveyed were 13
through 18. Eligible participants in the selected period
were eligible to participate in the original study and were
given a survey to complete with a response. The responses
were coded from a to h, and questions asked, “How many times”
using a Thurstone scale to survey the targeted adolescents
about being threatened with a weapon; there were “yes” and
“no” dichotomous responses for bullying. Each coded response
was given definition by the original investigators’ codebook
and databases from the YRBSS of the CDC and Department of
Education.
Variables in the Database
Nominal variables like person, class, and school were
generated by the Center for Survey Research for case,
school, and class identification. The independent variable,
bullying, was dichotomous as a response variable with a
three-digit field. However, in Question 33, bullying was
measured in an interval format with a 9-digit field for

260response. The variable, excessive television watching, was
measured in an interval format with 9-digit fields for
responses. Inactivity was measured in an interval format
with a 9-digit field for response. Usually the last digit in
the field was for missing data.
Sampling Method and Sampling Procedure
Sampling Method
The sampling method was convenience sampling. This
sampling method was chosen because investigators already
compiled the data. Babbie (2007) found that convenience
sampling is the choice of sampling method when secondary
data is used.
Sampling Procedure
The sampling procedure included a random selection of
ninth- through 12th-grade students in the State of
Massachusetts who were studied in the original survey
database. I did not analyze all data for all students in the
database, only the minimum sample size that I needed to
conduct my analysis. Based on Coe (2002), the effect size is

261the ([mean of the experimental group] − [mean of the control
group])/standard deviation. The effect size for the study
was based on the calculations [(703-37)19–18 (702-
37)/1 = 1]. Therefore, in knowing my effect size, and given
that the study used a Spearman correlation, Mann-Whitney U
tests, Kruskal–Wallis tests, and ordinal regressions,
multiple sample size calculations were conducted. G*Power
was used to calculate an empirically valid sample size for
the study. For the two-tailed Spearman’s rho correlation,
using a medium effect size (rs = .30; Cohen, 1988), an alpha
of .05, and a generally accepted power of .80 (Howell,
2010), the sample size was calculated to be 84 participants.
The Kruskal–Wallis and Mann–Whitney U tests are both
nonparametric equivalent analyses. The Kruskal–Wallis is the
nonparametric equivalent of the between-measures ANOVA, and
the Mann–Whitney U test is the nonparametric equivalent of
the independent sample t test. Lehmann (2006) recommended
that when using a nonparametric test, the researcher should

262first compute the sample size required and then add 15% as
an adjustment.
For the ANOVA with three groups, using a medium effect
size (f = .25; Cohen, 1988), an alpha of .05, and a generally
accepted power of .80 (Howell, 2010), the recommended
minimum sample size was calculated to be 159. After adding
the 15% adjustment, the revised calculated sample size is
183 participants.
For a two-tailed independent sample t test, using a
medium effect size (d = .30), alpha of .05, and a generally
accepted power of .80 (Howell, 2010), the recommended
minimum sample size was calculated to be 128. After making
the 15% adjustment, the calculated minimum sample size was
148 or approximately 74 participants for each group.
For the ordinal logistic regression, LeBlanc and
Fitzgerald (2000) suggested a minimum of 30 participants per
predictor variable in the analysis. With five predictors,
the minimum calculated sample size is set at 150

263participants to achieve empirical validity for the logistic
regression.
Of all the analyses conducted, the Kruskal–Wallis
requires the most stringent sample size. After correcting
for the nonparametric analyses, the minimum sample size
required to achieve empirical validity was calculated to be
183 participants, or 61 participants per group. Sample size
and effect size may affect the hypothesis.
Sampling Frame: The Available Data From the Original Study
The selected sample frame was the original database of
eligible ninth- through 12th-grade adolescents from
Massachusetts school districts who met eligibility criteria.
The available database from the original study was the
source for the sampling frame.
Sample Size
According to Cochran (1963, as cited in Israel, 1992),
sample sizes of large populations are noted from the
equation N0 = Z2 x pq/e2, where N0 is the sample size. In
addition, the variable Z2 is the “the abscissa of the normal

264curve that cuts off an area at the tails (1 equals the
desired confidence level, e.g., 95%, p. 2).” E is the
desired level of precision, and p is the estimated level of
proportion—q = 1 - p—and Z is the value of the variable
usually found in statistical tables that contains area under
the normal curve (Israel, 1992).
Therefore, an example of possible sample sizes for a
large adolescent population, assuming 95% confidence level
is 1.962 × (.5) × (.5) / (.05)2, where 1.96 is the critical
area under the curve from the statistical table and the .5
is the proportion and 1 − .5 = .5 is the q variable (Israel,
1992). The equation shows current statistical numbers as
(3.8416) × (.5) × (.5) / 0.0025 = 384.16. After all the
calculations, using the formula equation, the suggested
sample size is 384 adolescents at 95% confidence (Israel,
1992). For 99% confidence, using the above equation where
2.575 squared is the critical area under the curve from the
statistical table and .1 is the proportion value and 1
− .1 = .09 is the q variable. Using the formula for

265calculation provides (6.630625) (.1) (.9)/(0.0001) = 5967.56
rounded off to 5,968 for suggested sample size at 99%
confidence (Israel, 1992). For 90% confidence, the same
equation is applied where 1.645 is the critical area under
the curve from the statistical table, .9 is the proportion
value, and 1 − .9 = .1 is the q variable (Israel, 1992).
Using the formula for calculation displays (2.706025) × (.1)
× (.9)/0.01 = 24.4., the suggested sample size is 24 at 90%
confidence (Israel, 1992). Therefore, the sample size of 200
to 400 participants at 95% confidence is known, with a
participation rate of 40 to 50%. However, one must equate
the power and effect size to solve for the minimum sample
size needed for the current study. Lenth (2006) noted that
defining the power is a probability that is associated with
noncentral distribution. Therefore, in solving for the
minimum sample size needed, I equated the power, effect
size, and standard deviation to help solve for minimum
sample size. Because I am assuming these quantifiable
numbers, I started with the effect size. Based on Coe

266(2002), the effect size is the [mean of the experimental
group]-[mean of the control group]/standard deviation. In
knowing the effect size, and given that the study used
Spearman’s correlation, Mann-Whitney U tests, Kruskal–
Wallis tests, and ordinal regressions, multiple sample size
calculations were conducted. G*Power was used to calculate
an empirically valid sample size for the study. For the two-
tailed Spearman’s rho correlation, using a medium effect
size (rs = .30; Cohen, 1988), an alpha of .05, and a
generally accepted power of .80 (Howell, 2010), the sample
size was calculated to be 84 participants.
Miles (2011) found the probability of accepting the
null hypothesis is based on 1 − alpha, which is fixed, and
the probability of rejecting the null hypothesis is 1-beta,
which is presented as a power. Miles found the alpha
presents the possibility of rejecting the null hypothesis,
whereas the beta presents the possibility of accepting a
false null hypothesis. If p = alpha, then this can be a
Type-I error that emphasizes that the null hypothesis may

267have been falsely rejected when it is actually true (Miles,
2011). An example is for the assumed population, p = .37,
which is less than an alpha of .05 based on 1 − .95 = 0.05.
Then 0.37 > .05 suggests that rejecting the null hypothesis
was correct. However, if the p-value was .05, there is
likely a Type-I error of falsely rejecting the null
hypothesis when it is actually true. If the p-value equals
the beta, p = b, for instance, 1 − 0.95 = .05 , and the p-
value equals .5, the null hypothesis is true, and one fails
to reject the null hypothesis, then they made the correct
decision. However, if the p-value is .37 for the assumed
population, which is more than .05 for the beta, 0.37 > .05,
then there is a possibility of failing to reject a false
null hypothesis. If the null hypothesis has no relationship
between excessive television watching and bullying then the
achievement of minimum standards of physical activity among
Massachusetts adolescents would be falsely rejected. If the
alpha and p-value were equal, and if the p-value was less

268than the beta, then we would accept a false null hypothesis
that would be a Type-II error.
To reduce the chance of a Type-II error, a larger
sample size helps to lessen the chance of rejecting the null
hypothesis when it is actually false (Triola, 2008). The
dependent variable, physical activity, was used in six
different analyses, thereby increasing likelihood of Type-I
error. To control for the likelihood of committing a Type-I
error, a Bonferroni correction was applied (Tabachnick &
Fidell, 2012). To determine the correction, the original
alpha value (.05) was divided by the number of analyses (6)
conducted on the same dataset that used the same dependent
variable. This resulted in a more stringent alpha value
of .008 to be used for analyses.
Instrumentation and Measurements
Instrument
Name of instrument. The name of the instrument used is
the YRBS. This survey was taken by the MDPH and incorporated
into the CDC in 2009. It lists questions about the

269independent (i.e., bullying and excessive television),
dependent (i.e., inactivity) variables, and other
confounding variables, such as safety among the targeted
adolescent population. Permission was received from
Gonzalez, a public health official in the MDPH. The
instrument was found to be scientifically valid and reliable
(CDC, 2009e). There were several ways the instrument was
validated:
Comparison of YRBS Data With Data From Other
Surveys—The CDC (2009e) noted that the particular
survey of interest was compared with other surveys
with similar variables, and the results were
generally quite similar, particularly in
differences of sample selection, survey
administration, and survey questioning.
Consistency Over Time—Over 22 years the instrument
has provided consistent results. Although the
prevalence of behaviors may have increased and
decreased over time, most changes have been gradual

270either up or down and results have not bounced
around (CDC, 2009e).
Edit Checks—The instrument was edited for
inconsistent responses. It was noted by the CDC
(2009e) more than 100 edit checks were performed on
each YRBSS data set for inconsistencies. An example
is an adolescent who was threatening with a weapon
on school property; that adolescent must have
reported carrying a weapon anywhere. The small
percentages of inconsistencies found were removed
from the data sets.
Logic Within Groups of Questions—Responses to the
survey questions had to be logical. For instance,
questions asked about bullying were offered logical
responses of “yes or no.” This response would allow
the investigator to observe if the adolescent was
not bullied also.
Psychometric Studies—The CDC (2009e) noted the
conduction of a series of psychometric studies.

271These tests were done to better understand the
quality of questions and data collected. The CDC
(2009e) noted the YRBSS instrument was
scientifically, credible, reliable, and valid. The
psychometric studies were done in focus groups, and
in regular classrooms. Over a 20-year period there
was a conduction of reliability studies to measure
the stability of responses in 2-week intervals
(CDC, 2009e). As noted by the CDC (2009e), over a
2-year period there was a conduction of different
methodological studies to examine other factors
affecting the reliability of the YRBSS data.
Survey Environment—The survey administration
procedures were conducted to protect the privacy
and confidentiality of participants (CDC, 2009e).
The CDC (2009e) noted students were asked to sit
apart as far as possible, and cover their
responses, and neither the survey nor the classroom
administrator walked around the room while

272participants were taking the survey. In addition,
the CDC (2009e) noted participants were informed
about being truthful about their responses and
informed that their confidentiality would not be
breached. Students were also informed that
information from the survey would be used to
improve programs and policies for students. Make-up
testing was only provided with the understanding
that privacy and confidentiality of the participant
would continue.
The instrument is valid and scientific and
described above. According to the Department of
Education the above criteria were implemented by
the CDC and validated to be scientific and
reliable.
A comparable methodology. A well-known sedentary
behavior, excessive television watching, may lead to CVD
among adolescents who are inactive. Little is known about
CVD risk factors and television watching among adolescents

273because, as noted by Martinez-Gomez et al. (2010), CVD
studies presented so far are geared to adults. Martinez-
Gomez et al. explored excessive television watching,
inactivity, and CVD and presented a cross-sectional
quantitative experimental design to relate inactivity and
CVD. The variable, time watching television, was analyzed
using a survey research design.
Sampling strategy. The survey’s framework consisted of
the Alimentación y Valoración del Estado Nutricional de los
Adolescentes [Food and Assessment of the Nutritional Status
of Spanish Adolescents]): 2,859 Spanish adolescents aged 8
to 18 were assessed in five different Spanish cities between
the years 2000 and 2002. The study also explored in more
detail a mainly Caucasian subsample of n = 214 male
adolescents and n = 211 female adolescents with complete and
valid anthropometry data and self-reported amount of time
watching television.
Measurements. Socioeconomic status was reported as the
educational achievement of adolescents’ mothers. Parents

274were informed and gave consent prior to the study. The study
included measurements of BMI and television viewing. BMI was
measured by weight/height squared (kg/m2). Waist
circumference was measured using nonelastic tape around the
lowest rib margin and the pelvis. Martinez-Gomez et al.
noted the International Obesity Task Force’s age-specific
cutoffs. Television viewing among adolescents was measured
in hours/day. Adolescents were asked, “How many hours a day
do you spend watching television?” Response categories
included (a) none, (b) less than ½ hour, (c) between ½ and 1
hour, (d) between 1 and 3 hours, (e) between 3 and 4 hours,
and (f) more than 4 hours. Adolescents who viewed less than
3 hours/day of television were classified as low TV viewing,
whereas adolescents who viewed more than 3 hours/day were
classified as high TV viewing (Martinez-Gomez et al., 2010).
The CVD variable was assessed by blood sampling.
Fasting blood samples were taken from participants. Blood
samples were tested for cholesterol, triglycerides, total
cholesterol, HDL, and glucose. Cholesterol levels, HDL

275levels, total cholesterol levels, and glucose levels
measured the CVD composite risk-factor score. Analysis of
differences among adolescents was completed using an ANOVA
(one-way analysis) for continuous variables, and the chi-
square test was used for categorical data. The differences
between nonoverweight and overweight groups for CVD risk
factors were assessed by an ANCOVA (adjusted by age, sex
maturation, and race). In addition, differences between
weight-status groups for continuous CVD risk was assessed by
ANOVA because the variables were previously age, sex, sexual
maturation, and race standardization (Martinez-Gomez et al.,
2010). Differences between high-TV-viewing, and low-TV-
viewing groups were assessed by an ANCOVA adjusted by
potential confounders, and an ANOVA was assessed for
continuous CVD risk score (Martinez-Gomez et al., 2010).
Results. The results shown in Table 1 of Martinez-Gomez
et al. (2010) showed that male adolescents were taller and
heavier than were female adolescents, but there was no
difference in BMI: 64.4 ± 13.3 for weight among male teens

276and 1.7 ± 0.1 for height among male teens versus 56.3 ± 10.6
and for weight among female teens 56.3 ± 10.6, and 1.6 ± 0.1
for height among female teens was 1.6 ± 0.1. Values were
assessed as means and standard deviations as baseline
characteristics of study participants. Table 2 in Martinez-
Gomez et al. showed differences among weight-status groups:
Adolescents classified as overweight had less favorable
values compared to the nonoverweight group. Furthermore,
Table 3 in Martinez-Gomez et al. showed that adolescents in
the high-TV-viewing group were higher for waist
circumference, HDL, total cholesterol, glucose, and
triglycerides. The results presented in each table suggested
that inactive, overweight, or obese adolescents may have CVD
risk factors, including high glucose, high triglycerides,
low HDL, and high total cholesterol compared to
nonoverweight and active adolescents.
Discussion. The results offered empirical evidence that
too much television watching and not enough activity are
harmful for any adolescent. A limitation of this study was

277that its cross-sectional nature made causal inferences
impossible. In addition, the one-time blood sample may not
be accurate enough to represent long-term lipid and
metabolic abnormalities (Martinez-Gomez et al., 2010).
Another limitation is that blood pressure was not assessed
in the study. Martinez-Gomez et al. (2010) noted that this
issue limited comparison with previous studies. This issue
was minimal because television viewing has been widely used
in studies, perhaps because objective measurements, such as
amount of time spent playing video games and television
management are not usually feasible in population studies
(Martinez-Gomez et al., 2010). Future studies should
investigate causal relationships. I used this study to show
how CVD risk factors are associated with sedentary
behaviors, such as time watching television among
adolescents.
Defending Survey Analysis
The data-collection instrument used in this study is a
survey. Babbie (2007) found that surveys may be descriptive,
278explanatory, and used for exploratory purposes, such as a
study about adolescents with legionaries’ disease and the
effects of self-esteem among ninth- and 10th-grade students.
The unit of analysis is the ninth- and 10th-grade students
in the study. Surveying the ninth- and 10th-grade students
as the unit of analysis allows the individual person to
respond or be informed. The survey instrument in this case
was used to sample a very large population of adolescents
that is too large to observe directly, making the survey
instrument the preference of choice.
In my study, the survey instrument required the
individual person to respond; the investigators were
informed of the larger population of adolescents in Grades 9
through 12. Because all school districts in Massachusetts
were surveyed, the instrument was required because the
population of adolescent students sampled was too large a
base to observe. Therefore, the survey was the most
efficient way to collect the data from the entire ninth-
through 12th-grade population in the Commonwealth of

279Massachusetts. I randomly sampled from the data in my
referenced surveys.
Survey Issues
Surveys are self-reporting. The self-reporting nature
of surveys may introduce bias. An example is that an
adolescent who answers survey questions may have a
preconceived idea because of prior experiences (Babbie,
2007). Therefore, the adolescent may not answer the
questions truthfully. In addition, surveys may allow
researcher bias as researchers may seek their own ideas and
concepts and organize those ideas and concepts into a
questionnaire. One way to deal with the issues of bias is to
limit biased wording in the survey (Babbie, 2007).
Measurement
The YRBS (CDC, 2009b) measured adolescent responses to
excessive television watching and bullying. In addition,
control variables of race, age, and grade were allowable
measures in the survey.

280Controlled Variables
Race
Questions of race were queried by, “What is your race?”
Adolescents were prompted to respond with several choices
coded alphabetically from a to e. Response choices to answer
that questions were Black or African American, Asian, Native
Hawaiian or other Islander Pacifier, and White. The Hispanic
or Latino category was of a dichotomous nature, coded
alphabetically from a to b with a response of “yes” or “no”
(YRBSS; CDC, 2009d).
Age
The question of age was explored by the question, “How
old are you?” The range of responses was from 13 to 18 years
of age. The variable was coded alphabetically from a to g.
Gender
The question of gender was questioned by, “What is your
sex?” The alphabetically coded responses were a and b with a
dichotomous response of “male” or “female.”

281Grade
The question of grade was explored with, “In what grade
are you?” Responses ranged from ninth through 12th grade and
provided another response of “ungraded or other grade.”
Race was controlled by only selecting those races of
Massachusetts adolescents who are members of the targeted
population used in the study, and are not from other states.
Age was controlled by only selecting those adolescents aged
13 to 18 from Massachusetts and not from other states.
Gender was controlled by selecting only those students from
Massachusetts and no other states. The variable grade was
controlled by selecting only those adolescents who are
students in Grades 9 through 12 in the State of
Massachusetts.
Independent Variables
Bullying
Bullying in the survey was presented as a dichotomous
variable in the study and asked adolescents, “During the
past 12 months have you ever been bullied on school

282property?” The responses were coded from a to b with answers
“yes” or “no” (YRBS; CDC, 2009b).
Excessive Television Watching
Bullying may be the result of excessive television
watching and inactivity in adolescents’ communities or
neighborhoods. The independent variable in the study
described by the authors was, “On an average school day, how
many hours do you watch TV?” The responses were coded from a to
e with answers, such as, 0 days, 1 day, 2 or 3 days, 4 or 5
days, and 6 or more days. The variable nine was listed as
the missing data variable. The intention was to show how
many hours per day television was watched.
Dependent Variable
Massachusetts Adolescent Inactivity
Wong and Leatherdale (2009) examined adolescents in
Grades 9 through 12 in the country of Canada and found
inactivity was related to amount of video-game watching,
increased television watching, and frequency of Internet
surfing. Physical activity was a concern. In the study, the
283targeted adolescents did not meet the guidelines of being
physically active.
The MDPH website (2007) described that 49% of
adolescents among ninth- through 12th-grade students are
inactive. The cause of concern is increasing in the State of
Massachusetts for adolescents and further examination helps
provide interventions to help parents, teachers,
communities, and neighborhoods of involved adolescents.
Inactivity
Inactivity was measured by the YRBS (CDC, 2009c) and
the survey questioned, “During the past 7 days, on how many
days were you physically active for a total of at least 60
minutes per day? (Add up the time the participant may have
spent in physical exercise that increased heart rate, and
made the participant breathe hard), pg. 93.” The question
was alphabetically coded from a to h, and numerically ranged
from 0 days to 7 days. Time less than 60 minutes per day and
less than 5 days per week was considered inactive.

284Data-Analysis Plan
Data Collection
Data were collected in the original study by the
authors and I am conducting a primary analysis of their
archival data. The YRBSS (CDC, 2009d) study will provide the
framework of data.
Institutional Review Board
My Institutional Review Board (IRB) approval number is 06-
07-13-0049240
Software Used
SPSS version 21 is the business analytic software used
in the analysis of primary data, and secondary analysis of
independent variables to the dependent variable. The
software tested for significance.
Research Question
R1: Does excessive television watching as measured by a
Thurstone scale have a significant relationship with meeting
minimum standards of physical activity among Massachusetts
adolescents?

285R2: Does bullying as measured by a Thurstone scale have
a significant relationship with meeting minimum standards of
physical activity among Massachusetts adolescents?
Hypotheses
H10: There is not a significant positive relationship
between excessive television watching and the achievement of
minimum standards of physical activity among Massachusetts
adolescents.
H1a: There is a significant positive relationship
between excessive television watching and the achievement of
minimum standards of physical activity among Massachusetts
adolescents.
H20: There is not a significant positive relationship
between bullying and the achievement of minimum standards of
physical activity among Massachusetts adolescents.
H2a: There is a significant positive relationship
between bullying and the achievement of minimum standards of
physical activity among Massachusetts adolescents.

286Analysis
The analysis strategy was to use Spearman’s correlation
and ordinal regression to test each independent variable to
the dependent variable for predictors and relationships
among the targeted adolescent population (Triola, 2008). The
descriptive statistics showed frequencies, means, mode,
normal distribution, and confidence levels of significance.
The Spearman’s correlation was conducted to determine if
there was a relationship between television watching and
physical activity. The Kruskal–Wallis was used to test
significance among difference in hours of TV watching by
level of physical activity A Mann–Whitney U test was used
to determine where the differences lie among the levels of
physical activity. The ordinal-regression analysis was used
to test the relationship between excessive television
watching and the dependent variable (inactivity). The
analysis included standard of error, degrees of freedom, and
p-value for significance (Gerstman, 2008). In addition,
among the variable, bullying, a chi-square test helped

287determine the possibility of association between the row and
columns of the variables (Gerstman, 2008). This test
determined significant association of the independent
variable, bullying, to the dependent variable, inactivity.
Ordinal regression was not tested for the variable bullying.
The test of parallel lines assumption assesses whether there
is a significant difference between the model where the
regression lines are constrained to be parallel for each
level of the dependent variable and the model where the
regression lines are allowed to be estimated without a
parallelism constraint. The test of parallel lines was
conducted and the results were significant, thereby
indicating that the assumption was violated. Due to this
assumption violation, the ordinal regression could not be
conducted. The Mann–Whitney U test showed where those
differences lay for the variable bullying. The covariates
were used to help distinguish differences between races,
ages, and gender.

288Threats to Validity
External-Validity Threats
External-validity threats are quite important in
determining a relationship that may be contributed to
settings, places, or times (Steckler & McLeroy, 2008).
Oftentimes, generalization of these threats may create bias
(Steckler & McLeroy, 2008). It is very important to limit
external-validity threats when trying to determine the
relationship of variables. Steckler and McLeroy (2008)
described that external-validity threats may affect
outcomes, which is important to practitioners, health
professionals, and healthcare decision makers. The effects
of external validity may affect healthcare costs and levels
of consistency in implementing programs according to place,
time, and setting (Steckler & McLeroy, 2008).
Therefore, a threat to validity, whether external or
internal, may be enough to limit the validity of the
research. In my survey design, a major threat to external
validity was the two-way interaction effects to selection

289biases and the experimental variable, because generalization
of a variable may occur when prior thoughts and ideas are
considered (Yu & Ohlund, 2010). An example is an adolescent
who has not been bullied in a while because the parents
moved into a more affluent neighborhood; however, that same
adolescent may recall prior experiences, and those prior
experiences may influence how that adolescent may respond to
questions in the survey. To limit this issue, I did not
involve selection bias in my target population and did not
involve manipulation of any kind in the survey questions
that were presented to participants (Yu & Ohlund, 2010).
Internal-Validity Threats
The survey design included the internal-validity threat
of testing. Babbie (2007) suggested that a testing threat
may occur, especially if the researcher does not pretest the
questionnaire, because participants may input their prior
life experiences and may not answer the question directly.
This was not an issue in the YRBS survey because students
were informed to be honest and their privacy would not be

290compromised (CDC, 2009e). Another issue with the testing
threat of the survey design is posttesting; students may
answer according to their knowledge of the pretest question,
allowing manipulation of the survey instrument (Babbie,
2007). This was not an issue because students were not
rehearsed to answer questions and facilitators of the test
were not involved with students and were not allowed to walk
around during the testing (CDC, 2009e). These procedures
would limit any biased responses to the survey.
The instrumentation threat may cause internal-validity
issues. The issue may arise when a survey is given to all
the participants in Massachusetts school districts; however,
the same test is not given and an alternate form is
presented. This change in form would affect the internal
validity because the results will be different and cause and
effect will be a concern (Babbie, 2007). This was limited in
the study because the survey administration procedures were
performed to protect the privacy and confidentiality of
participants (CDC, 2009e). In addition, the CDC (2009e)

291noted students were asked to sit apart as far as possible
and cover their responses, and neither the survey nor the
classroom administrator walked around the room while
participants were taking the survey. In addition, the CDC
(2009e) noted participants were informed about being
truthful about their responses and also informed that their
confidentiality would not be breached. Also, students were
informed that information from the survey would be used to
improve programs and policies for the students. Make-up
testing was only provided with the understanding that
privacy and confidentiality of the participant would
continue.
Confidentiality and Participant Protection
Protection and confidentiality of all data included
Institutional Review Board (IRB) approval. Furthermore, any
violation would have been reported to the IRB and committee
members immediately. A representative of the School Health
Unit, Bureau of Community Health Access and Prevention
Massachusetts Department of Public Health and Secondary

292Education certifies the data is secure and no names are
attached to the data. In addition, for the YRBSS (CDC,
2009d) the electronic database may be found at
http://www.cdc.gov./yrbss/2009. I will continue to protect
the confidentiality of the participants by not discussing,
describing, or presenting any of the data to unauthorized
individuals, friends, family members, or colleagues. Only
colleagues and academic supervisors with informed consent
may review data.
Summary
In Chapter 3, I presented the methodology of the study;
the data-analysis plan for the study; and threats to
validity, confidentiality, and ethics for all participants
in the research. My methodology presented the sample target
population, sample size, sampling frame, and
instrumentation, and measures of the selected
instrumentation. In addition, the data-analysis plan was
described and its method of presentation was explained. In

293addition, threats to validity were described and how to
limit those threats was presented.
In Chapter 4 the method, data-analysis planning, and
results are analyzed. Chapter 4 includes results and
provides analysis of the methodology used in the study.
Chapter 5 contains a summary, interpretation, and conclusion
of findings, implications for social change, recommendations
from findings, and recommendations for further study.

294Chapter 4: Results
Introduction
The purpose of the study was to investigate the
relationships between excessive television watching and
bullying among Massachusetts’s adolescents and their effects
on physical inactivity, which impacts obesity. The focus was
to examine the associations among hours spent watching
television, bullying, and physical inactivity. The
independent variables were bullying and television watching,
and the dependent variable was inactivity. The covariables
were race, gender, and age. The variables were used to test
the relationship between bullying and extensive television
watching and their effects on an adolescents’ ability to
meet physical-activity guidelines. Chapter 4 presents the
data-collection method, descriptive statistics, the
quantitative statistical analysis of Research Question 1
with the hypothesis and tables, the quantitative statistical
analyses of Research Question 2 with the hypothesis and
tables, and a summary.

295Results
Data Collection
I used archival data gathered in the original survey by
the Massachusetts Department of Elementary and Secondary
Education and the CDC during the spring semester of 2009.
The survey data were input into SPSS by the original
researchers. I obtained the data by informed consent on July
10, 2013. Therefore, because the data were already in SPSS,
I only had to analyze the data using SPSS. I extracted the
data from the original survey on July 13, 2013 and analyzed
them on July 15, 2013 for 2,707 students, assessing for
missing cases on the variables of interest. I removed 82
participants for not responding to how many hours they watch
TV (Q81). I removed 11 students for not responding to the
question pertaining to physical activity (Q80) and 13
students for not responding to the question that pertained
to bullying (Q22). I conducted the final analyses on 2,601
participants.

296Descriptive Statistics
Of the 2,601 participants included in the dataset, most
were between the ages of 15 and 17 (2,035, 78%). Male and
female participants were equally represented. Slightly more
participants from the 11th grade (723, 28%) responded than
from other grade levels. A majority of students were not
Hispanic or Latino, 2,160 (84%), with 1,765 (68%) identified
as White. Frequencies and percentages are presented in Table
5. The students’ weights ranged from 34 kilograms to 158
kilograms with a mean of 66.44 and a standard deviation of
15.62 (see Table 6).
I divided students’ physical activity into eight
levels: zero days, 1 day, 2 days, 3 days, 4 days, 5 days, 6
days, and 7 days per week. I divided hours of watching TV
into seven levels: no TV, less than 1 hour per day, 1 hour
per day, 2 hours per day, 3 hours per day, 4 hours per day,
and 5 hours or more per day. Bullying occupied two levels,
either yes or no (see Table 7).

297Prior to conducting the analyses, I assessed the data
for potential covariates of race, sex, and age. I conducted
chi-square analyses to detect statistically significant
relationships between race, sex, and age, and the dependent
variable of physical activity (Q80). Race, sex, and age were
all found to be statistically related to physical activity.
I controlled for all three covariates in the analysis.
I used the dependent variable, physical activity, in
six different analyses, thereby increasing the likelihood of
a Type I error. To control for the likelihood of committing
a Type I error, I applied a Bonferroni correction
(Tabachnick & Fidell, 2012). To determine the correction, I
divided the original alpha value (.05) by the number of
analyses (6) conducted on the same dataset with the same
dependent variable. This resulted in a more stringent alpha
value of .008 to be used in the analyses. The results of the
statistical analyses are presented in Table 8.

298Table 5
Frequencies and Percentages for Student Demographics (N =2,601)
Demographic n %Age
12 years or younger
5 <1
13 years 1 <114 years 244 915 years 618 2416 years 720 2817 years 697 2718 years 315 12
GenderFemale 1297 50Male 1299 50
Grade Level9th grade 666 2610th grade 614 2411th grade 723 2812th grade 577 22Ungraded or othergrade
5 <1
Hispanic or LatinoYes 411 16No 2160 84
RaceWhite 1765 68Other 634 24Missing 202 8
Note. Due to rounding error, total percentages may not sum to 100%.

299Table 6
Mean and Standard Deviation for Student Weight in Kilograms
Variable M SD
Weight 66.44 15.62

300Table 7
Frequencies and Percentages for Level of Activity, Hours Watching TV, and
Bullying
Characteristic n %Physical activity level
0 days 610 241 day 311 122 days 291 113 days 288 114 days 246 105 days 261 106 days 168 77 days 426 16
Hours watching TVNo TV 289 11Less than 1 hour perday
446 17
1 hour per day 479 182 hours per day 581 223 hours per day 422 164 hours per day 179 75 hours or more per day
205 8
Bullied in the last 12 months
Yes 492 19No 2109 81

301Table 8
Summary of the Statistical Analyses
Researchquestion Analysis p Significance
1 Spearman’s rho .001 Significant1 Kruskal-Wallis .001 Significant1 Ordinal
regression.001 Significant
2 Chi square .003 Significant2 Mann-Whitney U .005 Significant2 Ordinal
regressionNot conducted
Research Question 1
Does excessive television watching, as measured by a
Thurstone scale, have a significant relationship with
meeting minimum standards of physical activity among
Massachusetts adolescents?
To assess the research question, I conducted a
Spearman’s correlation, a Kruskal–Wallis analysis, and an
ordinal regression. An alpha of .05 were used for the
analyses, indicating a 95% confidence interval. The analyses
were two-tailed tests. The Spearman’s correlation helped
detect a relationship between television watching and

302physical activity. The analysis showed a significant
negative correlation (rs = −.07, p < .001), suggesting that
the more hours students spent watching TV, the less active
they tended to be. The result of the correlation is
presented in Table 9.
Table 9
Spearman’s Correlation Between Hours Spent Watching TV and Physical Activity
Variable Hours TVPhysical activity −.07*
Note. * p < .008.
I conducted the Kruskal–Wallis test with physical
activity (Q80) as the dependent variable and hours of TV
watching (Q81) as the independent variable. I divided hours
spent watching TV into three groups: less than 1 hour, 1 to
2 hours, and more than 2 hours. The Kruskal–Wallis test
showed a significant difference in hours of TV watching by
level of physical activity, χ2(2) = 33.98, p = .001 (Table
10). To determine where the statistical differences lay, I
conducted three pairwise Mann–Whitney U tests; two were
shown to be statistically significant (p < .008).

303Table 10
Kruskal–Wallis Test for Levels of Physical Activity by Hours of TV Watched
Source
Less than1 hour
mean rank
1 to 2hours mean
rank
More than 2hours mean
rank χ2(2) p
Physical activity
1,297.23 1,389.76 1,187.70 33.98 .001
The Mann–Whitney U test helped assess differences in
physical activity by those who watched less than 1 hour of
TV versus those who watched TV 1 to 2 hours; results were
not significant at the .008 level, U = 361627.00, z = −2.61, p
= .009. The results are presented in Table 11.
Table 11
Mann–Whitney U on Physical Activity by Hours of TV Watched (Less Than One vs.
One to Two)
TVwatching U z p n
Meanrank
Sum ofranks
< 1 hour 361627.00
−2.61 .009 735 860.01 632107.00
1–2 hours 1,060924.34 979803.00
The Mann–Whitney U test conducted to assess differences
in physical activity by those who watched less than 1 hour

304of TV versus those who watched TV 3 or more hours was
significant, U = 271051.50, z = −2.93, p = .003, indicating
those participants who watched less than 1 hour of
television participated in more physical activity than those
who watched 3 or more hours of television a day. The results
are presented in Table 12.
Table 12
Mann–Whitney U on Physical Activity by Hours of TV Watched (Less Than One vs.
Three or More)
TV watching U z p nMeanRank
Sum ofranks
< 1 hour 271051.50 2.93 .003 735 995.92 591838.50
3 or more hours
806 851.41 596272.50
The Mann–Whitney U test conducted to assess differences
in physical activity by those who watched TV 1 to 2 hours
versus those who watched TV 3 or more hours was significant,
U = 361016.50, z = −5.81, p < .001, indicating those
participants who watched 1 to 2 hours of television
participated in more physical activity than those who

305watched 3 or more hours of television a day. The results are
presented in Table 13.
Table 13
Mann–Whitney U on Physical Activity by Hours of TV Watched (One to Two vs.
Three or More)
TV watching U z p nMeanRank
Sum ofranks
1to 2 hours 361016.50
−5.81 .001 1,060995.92 1055673.50
3 or more hours
806 851.41 686237.50
I conducted the ordinal regression with physical
activity (Q80) as the dependent variable, hours of TV
watching (Q81) as the independent variable, and age, sex,
and race (White vs. other) as the covariates. I divided
hours spent watching TV into three groups: less than 1 hour,
1 to 2 hours, and more than 2 hours. Prior to analysis, I
assessed the assumptions of the ordinal regression—
statistical relationships between the covariates and the
dependent variable, test of parallel lines, and adequate
cell count. Examining the statistical relationships between

306the dependent variable (physical activity) and the control
variables (age, sex, and race), I found statistical
significance. I used age, sex, and race as covariates in the
regression analysis. The test of parallel lines assumption
assesses whether there is a significant difference between
the model with the regression lines constrained to be
parallel for each level of the dependent variable and the
model with the regression lines are unconstrained. The
results of test of parallel lines were not significant,
indicating that the assumption was met. Adequate cell count
assumes 80% of the cells between the levels of the dependent
and independent variables have a count of five or more. No
cell had a count of less than five, so the assumption was
met.
The results of the ordinal regression were significant
at the .008 level, χ2(5) = 159.62, p < .001, Cox and Snell
R2 = .06, Nagelkerke R2 = .07, McFadden R2= .02, indicating a
small effect. The results indicated that for every
participant who watches TV for less than 1 hour, there is

3070.29 unit increase in the log odds of being in a higher
level of physical activity. The results also indicated that
for every participant who watches TV for 1 to 2 hours, there
is 0.45 unit increase in the log odds of being in a higher
level of physical activity. I rejected the null hypothesis—
excessive television watching, as measured by a Thurstone
scale, does not have a significant relationship with meeting
minimum standards of physical activity among Massachusetts
adolescents. The results of the regression are summarized in
Table 14.

308Table 14
Ordinal Regression With Independent Variables Predicting Physical Activity
ModelEstimat
e SE Wald df p
[Physical activity = 1] −0.64 0.20 10.69 1 .001[Physical activity = 2] −0.02 0.20 0.01 1 .907[Physical activity = 3] 0.48 0.20 5.98 1 .014[Physical activity = 4] 0.94 0.20 22.75 1 .000[Physical activity = 5] 1.36 0.20 47.35 1 .000[Physical activity = 6] 1.89 0.20 89.29 1 .000[Physical activity = 7] 2.32 0.20 132.27 1 .000Age −0.12 0.03 15.23 1 .000Gender 0.73 0.07 98.26 1 .000Race −0.39 0.08 22.34 1 .000< 1 hour (reference: 3 or more hours)
0.29 0.10 9.06 1 .003
1–2 hours (reference: 3 or more hours)
0.45 0.09 26.30 1 .000
Note. χ2(5) = 159.62, p < .001.
Research Question 2
Does bullying, as measured by a Thurstone scale, have a
significant relationship with meeting minimum standards of
physical activity among Massachusetts adolescents?
To assess this question, I proposed a chi-square
analysis, a Mann–Whitney U test, and an ordinal regression.
An alpha of .05 were used for the analyses, indicating a 95%

309confidence interval. The analyses were two-tailed tests. A
chi-square analysis could detect a relationship between
bullying and physical activity. Prior to the analysis, I
assessed the assumptions of chi-square analysis. For a chi-
square analysis to operate properly, data must come from
random samples of a mutually exclusive multinomial
distribution, and the expected frequencies should not be too
small. The traditional caution in a chi-square examination
is that expected frequencies below five should not comprise
more than 20% of the cells, and no cell should have an
expected frequency of less than one (Pagano, 2009).
Observations should be independent of one another, and each
participant can contribute only one observation to the data
(the row and column totals should be equal to the number of
participants; Howell, 2010). There were no assumptions
violations.
The chi-square analysis conducted to assess the
relationship between physical activity and bullying was
significant at .008, χ2(7) = 21.54, p = .003. Fewer

310participants than expected indicated they were not bullied
and participated in zero days of physical activity. More
participants than expected indicated they were bullied and
participated in zero days of physical activity. Fewer
participants than expected indicated they were bullied and
participated in 6 days of physical activity. There were more
participants who indicated they were not bullied and that
they participated in 6 days of physical activity (see Table
15).
Table 15
Chi-Square Results for Physical Activity and Bullying
Bullied in the last 12months
Physical activitypast week Yes No χ2(7) p
0 Days 134 [115] 476 [495] 21.54 .0031 Day 66 [59] 245 [252]2 Days 60 [55] 231 [236]3 Days 45 [55] 243 [234]4 Days 55 [47] 191 [200]5 Days 34 [49] 227 [211]6 Days 19 [32] 149 [136]7 Days 79 [81] 347 [345]
Note. Values in brackets represent the expected values of each cell.

311A Mann–Whitney U test helped detect differences in
physical activity by bullying (yes vs. no). The results of
the Mann–Whitney U test were significant at the .008 level,
U I conducted the Kruskal–Wallis test with physical
activity (Q80) as the dependent variable and hours of TV
watching (Q81) as the independent variable. I divided hours
spent watching TV into three groups: less than 1 hour, 1 to
2 hours, and more than 2 hours. The Kruskal–Wallis test
showed a significant difference in hours of TV watching by
level of physical activity, χ2(2) = 33.98, p = .001 (Table
11). To determine where the statistical differences lay, I
conducted three pairwise Mann–Whitney U tests; two were
shown to be statistically significant (p < .008), U =
476818.00, z = −2.83, p = .005, indicating that unbullied
students’ activity levels were higher than those for bullied
students (see Table 16).

312Table 16
Mann–Whitney U of Physical Activity Versus Bullying
Bullied in past 12months U z p n
Meanrank
Sum ofranks
Yes 476818.00
−2.83 .005 492 1215.64 598096.00
No 2109 1320.91 2785805.00
I proposed an ordinal regression with physical activity
(Q80) as the dependent variable, bullying (yes vs. no) as
the independent variable, and age, sex, and race (White vs.
other) as the covariates. Prior to analysis, I assessed the
assumptions of the ordinal regression—statistical
relationships between the covariates and the dependent
variable, test of parallel lines, and adequate cell count.
Examining the statistical relationships between the
dependent variable (physical activity) and the control
variables (age, sex, and race) yielded statistically
significant findings. Age, sex, and race were appropriate as
covariates in the regression analysis. The test of parallel
lines assumption assesses whether there is a significant

313difference between the model with the regression lines
constrained to be parallel for each level of the dependent
variable and the model with the regression lines are
unconstrained. The results of the test of parallel lines
were significant, indicating an assumption violation.
Consequently, the ordinal regression could not be conducted.
The null hypothesis—bullying, as measured by a Thurstone
scale, does not have a significant relationship with meeting
minimum standards of physical activity among Massachusetts
adolescents—can be rejected.
Summary
Research Question 1 was the following: “Does excessive
television watching, as measured by a Thurstone scale, have
a significant relationship with meeting minimum standards of
physical activity among Massachusetts adolescents?” To
assess the research question, I conducted a Spearman’s
correlation, a Kruskal–Wallis analysis, and an ordinal
regression. I conducted the Spearman’s correlation to detect
a relationship between television watching and physical

314activity. The analysis showed a significant negative
correlation, suggesting that students who spent more hours
watching TV tended to be less active.
I conducted the Kruskal–Wallis analysis to detect
differences in physical activity by the hours of TV
watching. The Kruskal–Wallis test showed a significant
difference in hours of TV watching by level of physical
activity. To determine where the statistical differences
lay, I used three pairwise Mann–Whitney U tests, two of
which were statistically significant (p < .008). I conducted
the Mann–Whitney U test to assess differences in physical
activity by those who participated in less than 1 hour of TV
watching versus those who watched TV 3 or more hours. The
test was significant indicating those participants who
watched less than 1 hour of television participated in more
physical activity than those who watched 3 or more hours of
television a day. Additionally, I conducted the Mann–Whitney
U test to assess differences in physical activity by those
who watched TV 1 to 2 hours versus those who watched TV 3 or

315more hours. This test was also significant, indicating those
participants who watched 1 to 2 hours of television
participated in more physical activity than those who
watched 3 or more hours of television a day.
I conducted the ordinal regression with physical
activity as the dependent variable, hours of TV watching as
the independent variable, and age, sex, and race as the
covariates. This test was significant, indicating that,
after controlling for age, sex, and race, hours of TV
watching predicted physical activity. For every participant
who watches TV for less than 1 hour, there is an increase in
the log odds of being in a higher level of physical
activity. The results also indicated that for every
participant who watches TV for 1 to 2 hours, there is an
increase in the log odds of being in a higher level of
physical activity. I rejected the null hypothesis—excessive
television watching, as measured by a Thurstone scale, does
not have a significant relationship with meeting minimum

316standards of physical activity among Massachusetts
adolescents.
Research Question 2 was the following: “Does bullying,
as measured by a Thurstone scale, have a significant
relationship with meeting minimum standards of physical
activity among Massachusetts adolescents?” To assess this
question, I proposed a chi-square analysis, a Mann–Whitney
U test, and an ordinal regression. I used the chi-square
analysis to detect a relationship between bullying and
physical activity. The chi-square analysis conducted to
assess the relationship between physical activity and
bullying was significant. Fewer participants than expected
indicated they were not bullied and participated in zero
days of physical activity. More participants than expected
indicated they were bullied and participated in zero days of
physical activity. Fewer participants than expected
indicated they were bullied and participated in 6 days of
physical activity. There were more participants indicating

317they were not bullied and that they participated in 6 days
of physical activity.
I conducted a Mann–Whitney U test to detect
differences in physical activity by bullying (yes vs. no).
The results of the Mann–Whitney U test were significant,
indicating that unbullied students’ activity levels were
higher than those for bullied students.
I proposed an ordinal regression with physical activity
as the dependent variable, bullying (yes vs. no) as the
independent variable, and age, sex, and race as the
covariates. Prior to analysis, I assessed the assumptions of
the ordinal regression. The results of the test of parallel
lines were significant, indicating an assumption violation,
so the ordinal regression could not be conducted. Therefore,
I rejected null hypothesis—bullying, as measured by a
Thurstone scale, does not have a significant relationship
with meeting minimum standards of physical activity among
Massachusetts adolescents.

318Chapter 5 contains a summary and interpretation of
findings, and concludes with implications for social change
and recommendations for further study.

319Chapter 5: Interpretation and Discussion
Introduction
The purpose of the study was to investigate the
relationship between excessive television watching with
respect to bullying and physical activity that impacts
obesity among Massachusetts adolescents. The focus was to
examine the association between bullying and levels of
physical activity. The independent variables were bullying
and excessive television watching, and the dependent
variable was inactivity. The covariables were race, gender,
and age. The variables were used to test the relationship
between bullying and the effects of extensive television
watching on adolescents’ ability to meet physical-activity
guidelines.
The nature of this study was to quantitatively describe
—using secondary analysis of archival data of an educational
survey design among ninth- through-12th grade students—a
possible relationship between excessive television watching,

320bullying, and the achievement of minimum standards of
physical activity among Massachusetts adolescents.
Interpretation of the Findings
Inactivity
Comparing the findings to previous literature showed a
summary effect of inactivity such as watching television.
Wong and Leatherdale (2009) showed that physical activity
had a strong association with inactivity among adolescents
in Grades 9 through 12. Adolescents were more likely to be
inactive who had higher levels of watching television and
more than 3 hours of video gaming. My findings confirmed the
previous studies. The findings showed a significant negative
correlation (rs = −.07, p < .001), suggesting that the more
hours students spent watching television, the less active
they tended to be. Although the findings did not show a
relationship with adolescents being obese or overweight and
those who could not pass military physical-entrance
examinations (Knapik et al., 2006), and mental health and
health-related issues (Martinez-Gomez et al., 2010), the

321result of being inactive in the study supported the notion
of being obese and overweight, thereby creating the
likelihood of not passing military physical-entrance
examinations, and having mental health and health-related
issues. My findings confirmed results from studies I
reviewed in Chapter 2.
Bullying
Comparing the findings to previous literature described
in Chapter 2, there is a clear relationship for the variable
bullying with inactivity. Although the findings did not show
a relationship for adolescents with poor academic
performance, suicidal ideation, injuries, depression, high
drug use, family dysfunction and low self-esteem, the
results of being bullied decreased perceptions of safety
already impacted by the notion of being obese or overweight,
thereby creating the likelihood of high drug use, low self-
esteem, depression, suicidal ideation, and being physically
inactive. Eisenberg and Aalsma (2005) showed that bullying
refers to behavior that causes physical harm to an

322individual by kicking, hitting, and punching that is
aggressive and tends to harm. In addition, Eisenberg and
Aalsma noted the frequency of bullying and that
interpersonal relationships caused by a power imbalance of
aggressiveness is a form of bullying. Raskauskas and Stolz
(2007) showed that bullying, whether traditional or
electronic, had different relationships when it came to
victimization. Shellard (2002) noted that bullying has a
relationship with low academic performance. Validity was
negated because of empirical evidence of how bullying may
affect academic performance. Stein et al. (2007) showed that
adolescents in Grades 7 through 12 who brought weapons to
school and had high drug use, and bullying perpetrators who
had low self-esteem, depression, and feelings of emptiness
were factors in bully-victims’ injuries on the way to
school, coming home from school, and at home. Stein et al.
displayed that bullying victims and injuries are correlated
to psychosocial behaviors of the bullying perpetrator.
Peskin et al. (2006) showed that Hispanics and African

323Americans were more likely to be victims of bullying than
Caucasians. Although Graham (2006) slightly contradicted the
findings of Peskin et al., noting that no matter what race
or ethnicity one may be, victimization and bullying are
related by bullying and victimization of the individual,
confirmed by the findings of an association between bullying
and race. However, Spriggs et al. (2007) found race is not
an issue when it comes to being a bully-victim. Although the
majority of bullying victims were White in my study, a
significant proportion of minorities also were bullied.
Duncan et al. (2009) noted that unsafe bullying in
neighborhoods, communities, or schools may limit physical
activity among certain race or ethnicity urban adolescent
groups in the state of Massachusetts.
Demaray and Malecki (2003, as cited in Peskin et al.,
2006) noted few studies reporting prevalence estimates for
specific types of bullying, limiting comparisons and noting
research gaps. Also, Spriggs et al. (2007) showed that peer
pressure of being bullied may create social isolation, and

324in turn may affect relationships with peers in school,
classrooms, or at home. Related to being the victim of
bullying may be inactivity levels that increase risk for
obesity and poor health outcomes among adolescents. The null
hypothesis—bullying, as measured by a Thurstone scale, does
not have a significant relationship with meeting minimum
standards of physical activity among Massachusetts
adolescents—was rejected.
My findings showed an association between bullying and
inactivity. For the independent variable, bullying,
displayed in Table 14, the relationship between physical
activity and bullying was significant at .008, χ2(7) =
21.54, p = .003. Fewer participants than expected indicated
they were not bullied and participated in zero days of
physical activity. More participants than expected indicated
they were bullied and participated in zero days of physical
activity. Fewer participants than expected indicated they
were bullied and participated in 6 days of physical
activity. More participants indicated they were not bullied

325and that they participated in 6 days of physical activity
than indicated they were bullied and participated in 6 days
of physical activity. This suggests that there is an
association between adolescents who are bully-victims and
inactivity. It also shows that those adolescents who were
not bullied can be associated with being physically active
and meeting physical-activity guidelines in the State of
Massachusetts. Storch et al. (2006) confirmed that bully-
victims who are depressed and isolated are more likely to be
inactive. The Storch et al. results are confirmed my
findings that adolescents who are bullied are more likely to
be inactive. My study confirms results from studies
mentioned in Chapter 2 of the relationship of the variable,
bullying, with inactivity.
Excessive Television Watching
This study confirms findings of studies described in
Chapter 2 that a relationship between excessive television
watching, inactivity, and being bullied are more likely to
make the other variables likely. Excessive television

326watching may contribute to CVD, Type-2 diabetes, high blood
pressure, and risk for asthma, inactivity, obesity, and poor
academic performance among adolescents. In addition,
excessive television watching contributes to ADHD,
depression, and antisocial behavior. Eisenmann et al. (2008)
found an empirical relationship for the combined influence
of television watching and physical inactivity and its
relationship to obesity and being overweight. Eisenmann et
al. displayed that excessive television watching and
inactivity may associate with being overweight or obese.
Zimmerman et al. (2005) showed that excessive television
watching of violent media programs may lead to bullying
behaviors. However, the Zimmerman et al. study was limited
in that it did not define bullying. Without defining
television watching, it was hard to predict a relationship
for possible bullying; therefore, the authors could only
suggest possible bullying. Also, the authors only examined
media violence and not the whole spectrum of bullying. These

327authors did not address the detrimental effects on health
risk that arise with excessive television usage.
Martinez-Gomez et al. (2010) showed that CVD risk
factors are associated with sedentary behaviors, such as
time watching television among adolescents. The University
of Southern Denmark and Harvard School of Public Health
(2013) presented a study that showed the relationship
between Type-2 diabetes and CVD among excessive television-
watching adolescents. Poor academic performance was an issue
among adolescents who watched excessive amounts of
television. Hancox et al. (2005) suggested that excessive
television watching may lead to poor academic performance or
low educational attainment. The present study did not
quantify the relationship among excessive television
watching and media violence, CVD, asthma, obesity, and
academic performance. The findings could suggest that a
relationship between excessive television watching,
inactivity, and being bullied are more likely to make the
other variables likely. The null hypothesis—excessive

328television watching, as measured by a Thurstone scale, does
not have a significant relationship with meeting minimum
standards of physical activity among Massachusetts
adolescents—was rejected.
The findings from this study showed that excessive
television watching has a significant negative correlation
with activity (rs = −.07, p < .001), suggesting that the
more hours students spent watching TV, the less active they
tended to be. Based on these findings, Massachusetts
adolescents who excessively watch television tend to perform
less physical activity. Another key finding was that for
every participant who watches television for less than 1
hour, there is .29 unit increase in the log odds of being at
a higher level of physical activity. The results also
indicated that for every participant who watches television
for 1 to 2 hours, there is .45 unit increase in the log odds
of being at a higher level of physical activity. This
finding suggested that the more hours an adolescent watches
television, the less likely that individual is to be

329physically active. The findings confirmed previous research
findings that suggest that excessive television and
inactivity have a relationship.
Theoretical Framework
Maslow’s safety component, used as the theoretical
framework for this study, may suggest that an adolescent who
is bullied severely may feel threatened; therefore, the
adolescent may watch excessive amounts of television to
avoid unsafe conditions. Those conditions, from the previous
literature, would be safe places to play and a safe school
environment. Bandura’s (1999, as cited in the “Social
Cognitive Theory,” 2010) SCT suggested that an adolescent
who observes bullying is more likely to bully. The findings
relate bullying and peer-victimization in this theory.
Although the study did not quantify peer victimization; the
likelihood of an adolescent being bullied and becoming a
bully themselves are more likely, according to this theory.
This relationship may only exist by accepting studies of
those bully-victims who have become bullies themselves.
330Discussion
The findings from this study confirmed that the
variables, excessive television watching and bullying, are
related to inactivity among Massachusetts adolescents. The
literature described that excessive television watching
affects one’s ability to exercise and increases the chances
an adolescent will be inactive. A major factor was the
amount of television watching and health complications that
occur. The health risks of CVD, Type 2-diabetes, and
depression were prevalent among adolescents who excessively
watched television (Eisenmann et al., 2008). Another factor
was low academic performance and ADHD among those
adolescents who watched television excessively. A major
issue aligned with excessively watching television and being
inactive was that adolescents are more likely to fail
military physical-entrance examinations (Knapik et al.,
2006)
Although this study did not quantify the possible
health issues, the findings suggested that excessive

331television watching and its relationship to inactivity makes
CVD, Type-2 diabetes, depression, low academic performance,
and ADHD more likely. I can only infer this by accepting the
studies that link inactivity to adverse health outcomes. For
the variable bullying, the literature displayed that
violence and being threatened with a weapon has its effects
on adolescents’ ability to exercise efficiently, along with
safe places to play, and increasing health issues. Those
health issues mean more visits to emergency rooms because of
injuries. The possibility of adolescents not wanting to
exercise for fear of being injured increases the possibility
of not meeting physical-activity guidelines. In addition,
literature showed adolescents who were bully-victims were
more likely to be depressed and not exercise (Eisenmann et
al., 2008). Increased levels of activity and a relationship
to bullying was shown for those adolescents who were not
bullied. However, for those adolescents who were bully-
victims, the likelihood of inactivity increased.

332The study did not quantify violence, injuries,
mortalities, depression, low academic performance, safe
places to play, and failing entrance to military physical
examinations because of bullying, but the findings suggested
the issues that come from being bullied are more likely. The
theoretical base of the study, Maslow’s (1954) safety
component, may suggest from the findings that an adolescent
who is bullied severely may feel threatened; therefore, the
adolescent may watch excessive amounts of television because
of unsafe conditions. Bandura’s (1999, as cited in the
“Social Cognitive Theory,” 2010) SCT suggested that an
adolescent who observes bullying is more likely to also
bully. This behavior may lead to injuries, depression, and
low academic performance for the adolescent. Although in the
study I only quantified the variable bullying, the
possibility of one learning how to bully and imitating those
behaviors are more likely from the findings. In fact, a
major limitation of the study was that only adolescents who
resided in Massachusetts were sampled; adolescents from

333other states may have different results. Causation between
the independent variables and dependent variable was not
demonstrated in this study.
Limitations
Secondary data analysis allows an investigator to
examine existing data and address research questions to
bring forth new content or research questions. However,
there are limitations to secondary analysis. Investigating
issues that may occur might be an issue in secondary data
analysis because of the difficulty in finding pertinent data
(Colorado State University, 2010). An example is a variable
that is needed to complete a study, but because the survey
question is not asked in the archival data, the study may
not be completed. In addition, variables could be controlled
and altered. Another limitation of secondary data is that
with large data files, it is difficult to ensure that
statistical software packages did not influence the validity
of the research (Colorado State University, 2010).

334The self-reporting nature of the survey may create bias
where respondents did not answer questions truthfully, and
this may cause validity issues for the instrument (Babbie,
2007). In addition, the investigator may manipulate survey
questions to fit their criteria of research. For example, a
researcher may study a particular issue and present survey
questions that would induce a response to what the
researcher is thinking.
The survey questionnaire may lack validity due to
issues of reliability. For instance, questions asked about
gun violence in one neighborhood or community might change
over time because community members move to other areas or
mortalities may increase or decrease, causing survey
responses to differ each time they are given. In addition,
telephone interviews bias the results because participants
must have a land-line telephone to participate, and
selection bias is based on participation of only those
willing to participate. Participants may have had inherent
differences from nonparticipants.

335Another limitation might be mismatching of categorized
independent and dependent variables. For instance, among
ninth- through 12th-grade students targeted by the school
district, the questions presented in the survey may have
conformed to Maslow’s (1954) hierarchy-theory construct. In
other words, the questions presented may have fit the
category of meeting safety needs that affect physical
activity or fitness standards.
Another limitation of the survey method is a mismatch
in categorizing independent and dependent variables (Babbie,
2007). For instance, when questions about violence and
bullying are categorized, the researcher reduces the number
of potential responses, which could bias the results. In
addition, responses to surveys and missing data might be an
issue among minority students. Some African American and
Hispanic ninth- through 12th-grade students in Massachusetts
might not respond to survey questions or refuse to answer,
which would affect the validity and reliability of the study
(MDPH, 2007).

336Recommendations
Based on the findings and literature, one
recommendation for further study is to establish a causal
relationship between excessive television watching,
bullying, and meeting physical-activity guidelines among
adolescents. Neither previously reviewed literature nor this
study showed evidence of a causal relationship between the
research variables; therefore, showing a causal relationship
would be effective in creating empirical evidence of
consequences and causes of excessive television watching and
bullying, and their relationship in meeting physical-
activity guidelines. A qualitative focus-group study might
help in understanding why people bully others. Additional
studies to more fully describe the relationship between
excessive television watching and bullying to meeting
physical-activity program requirements is recommended.
Social-Change Implications
The social-change potential of this study is that
understanding the relationship between physical inactivity

337and bullying may help efforts to prevent childhood obesity.
As previously stated, obesity rates for adolescents are
increasing in Massachusetts. According to the MDPH (2007)
website, adolescent obesity rates have doubled in nearly 17
years. Obesity rates among minorities in Massachusetts have
increased even more significantly. Hispanic and African
American adolescents show increases of 23% and 21%,
respectively, compared to 14% for non-Hispanic White
adolescents (MDPH, 2007).
The aim of this study was to show that bullying may led
to excessive television watching, and in turn, reduce
physical activity among adolescents. Bullying would more
likely reduce physical activity, thereby making the
adolescent less likely to meet physical-activity guidelines.
Reducing inactivity and obesity rates among adolescents is a
major concern. The social-change implication here would be
to alert schools, families, and communities to allow
physical-activity programs to help adolescents meet
physical-activity guidelines (MDPH, 2007), and reduce

338barriers and enablers that may cause the adolescent not to
exercise. An example is that an adolescent being bullied or
threatened may not participate in athletic programs, because
the adolescent perceives safety issues in coming home and
going to school. The social-change implication is that
interventions would help reduce that safety concerns and
create more physical activity among adolescents. A higher
police presence around the schools and communities where
violence and bullying exist may help increase safety. A
police presence would deter bullying, providing safe places
to play, and less violence would help in allowing physical
exercise (MDPH, 2007). Higher physical activity levels would
help adolescents pass military physical-entrance
examinations. A social-change implication would be that more
successful candidates pass their military-entrance
examinations and are retained in the military.
Conclusion
This study confirmed the significant relationship
between hours of television, and bullying to meeting

339physical-activity guidelines among Massachusetts
adolescents. The findings provided evidence of a significant
association between bullying and meeting physical-activity
guidelines, and a significant correlation between hours of
television watching and meeting physical-activity guidelines
among Massachusetts adolescents. The findings confirmed that
the fewer hours adolescents spend watching television the
more active they are, and the less adolescents are bullied
the more active they are. The published literature confirms
that bullying-victims are more likely to be depressed, have
low academic performance, feel isolated, have low self-
esteem and low motivation because of safety issues, and are
more likely to not exercise. This lack of exercise, in turn,
creates issues of excessive television watching and
increasing obesity rates that adversely affect adolescents’
health. Previous studies demonstrated that obesity issues
were shown to affect adolescents’ ability to pass military
physical-entrance examinations, decrease physical activity,
and mitigate feelings of personal safety. To improve safety

340issues for adolescents being bullied, one must have social
change: schools, families, and communities should be
encouraged to develop more physical-activity programs to
help adolescents meet physical-activity guidelines while
addressing the problem of bullying.
Additional research should include study causation
rather than simple association. This is especially true
because there are complex estimated independent and
dependent variables. Although there may have been
correlation, there may be little or no causation. Another
suggestion for an area of future research is intervention. A
suggested possible intervention is putting a treadmill in
homes to see if that increases physical activity, even
though there is no decrease in bullying. In addition,
further research may include cyberbullying, because if
someone is afraid to go outside due to physical bullying,
and they stay inside, their inactivity and subsequent
increase in cybercommunication (i.e., Internet, e-mails, and
texts) may complicate and magnify the level of bullying they

341experience. A social-change implication of addressing
bullying and promoting safer environments where adolescents
can be physically active would improve the health and well-
being of young people.

342References
American Academy of Pediatrics. (2013). Children, adolescents, and
television. Retrieved from
http://pediatrics.aappublications.org/content/107/2/423
.full
Babbie, E. (2007). The practice of social research (11th ed.).
Belmont, CA: Thomson Higher Education.
Babey, S. H., Hastert, T. A., Yu, H., & Brown, R. (2008).
Physical activity among adolescents: Where do parks
matter? American Journal of Preventive Medicine, 34, 345–348.
doi:10.1016/j.amepre.2008.01.020
Benaroch, R. (2009). Television, ADHD, and other bad things. Retrieved
from http://
pediatricinsider.wordpress.com/2009/09/28/television-
adhd-and-other-bad-things/

343Bendo, S. A., Lang, C. E., Daniell, W. E., Weisen, A. R.,
Datu, B., & Niebur, D. W. (2010). Association of weight
at enlistment with enrollment in the army weight
control program (AWCP) and subsequent attrition in the
assessment of recruit motivation and strength study.
Journal of Military Medicine, 175, 188–195.
Blazer, C. (2005). Literature review on bullying. Retrieved from
http://www.drs
.dadeschools.net/Reports/Bullying.pdf
Brosnahan, J., Steffen, L. M., Lytle, L., Patterson, J., &
Boostram, A. (2004). The relation between physical
activity and mental health among Hispanic and non-
Hispanic White adolescents. American Medical Association, 158,
818–823.
Centers for Disease Control and Prevention. (2009a). 9th-
through-12th grade students in Massachusetts and United States that
have experienced bullying. Youth online survey. Retrieved from
http://apps.nccd.cdc.gov/youthonline/app/results

344Centers for Disease Control and Prevention. (2009b). 9th-
through-12th grade students in Massachusetts and United States who
were threatened with a weapon. Youth online survey. Retrieved from
http://apps.nccd.cdc.gov/youthonline/app/results
Centers for Disease Control and Prevention. (2009c). Inactive
9th-through-12th grade students. Youth online survey. Retrieved
from http://apps.nccd.cdc.gov
/youthonline/app/results
Centers for Disease Control and Prevention. (2009d). Youth
risk behavior surveillance system (YRBSS). Retrieved from
http://www.cdc.gov/HealthyYouth/yrbs
/index.htm
Centers for Disease Control and Prevention. (2009e). Do
students tell the truth on Youth Risk Behavior Survey (YRBS). Retrieved
from http://www.dpi.state.nd.us/health
/yrbs/truth.pdf

345Centers for Disease Control Prevention. (2010a). How much
physical activity do children need? Retrieved from
http://www.cdc.gov/physicalactivity/everyone/guidelines
/children.html
Centers for Disease Control and Prevention. (2010b). Youth
physical activity guidelines toolkit. Retrieved from
http://www.cdc.gov/healthyyouth/physicalactivity
/guidelines.htm
Centers for Disease Control and Prevention. (2010c). Youth
risk behavior surveillance—United States, 2009. Retrieved from
http://www.cdc.gov/mmwr/pdf/ss/ss5905.pdf
Centers for Disease Control and Prevention. (2011).
Understanding bullying: Fact sheet. Retrieved from
http://www.cdc.gov/ViolencePrevention/pdf/Bullying_Fact
sheet
-a.pdf
Coe, R. (2002). It is the effect size, stupid: What effect size is and why it is
important? Retrieved from
http://www.uccs.edu/faculty/becker.

346Colorado State University. (2010). Advantages and disadvantages of
using secondary analysis. Retrieved from
http://writing.colostate.edu/guides/research/survey
/com4c2a.cfm
Cunningham, R. M., Resko, S. M., Harrison, S. R., Zimmerman,
M., Stanley, R., Chermack, S. T., & Walton, M. A.
(2010). Screening adolescents in the emergency
department for weapon carriage. American Emergency Medicine,
17, 168–176. doi:10.1111/j.1553-2712.7009.00639x
Dahlberg, L. L., & Krug, E. (2002). About injury and violence
prevention. Retrieved from
http://www.vahealth.org/Injury/documents/2009/pdf
/aboutinjuryandviolenceprevention_011909.pdf
Datta, Y. (2008). Maslow’s hierarchy of basic needs—An ecological view.
Retrieved from http://www.gcbc.us_GCBE/data/Y.Datta.doc
Duncan, D. T., Johnson, R. M., Molnar, B. E., & Azrael, D.
(2009). Association between neighborhood safety and
overweight status. BMC Public Health, 9, 289–302.
doi:10.1186/1471-2458-9-289

347Egerter, S., Barclay, C., Grossman-Kahn, R., & Braverman, P.
(2011). How social factors shape health: Violence, social disadvantage
and health (Issue Brief). Princeton, NJ: Robert Wood
Johnson Foundation.
Eisenberg, M .E., & Aalsma, M. C. (2005). Bullying and peer
victimization: Position of paper of the Society for
Adolescent Medicine. Journal of Adolescent Health, 36, 99–91.
doi:10.1016/j.jadohealth.2004.09.004
Eisenmann, J. C, Bartee, R. T., Smith, D. T., & Welk, G. T.
(2008). Combined influence of physical activity and
television viewing on the risk of overweight in U.S.
youth. International Journal of Obesity, 32, 613–618.
doi:10.1038/sj.ijo.08303800
Ferguson, C. J., San Miguel, C., & Hartley, R. D. (2009). A
multivariate analysis of youth violence and aggression:
The influence of family, peers, depression and media
violence. The Journal of Pediatrics, 6, 1–6.
doi:10.1016/j.jpeds2009.06
.021

348Gerstman, B. B. (2008). Basic biostatistics: Statistics for public health
practice. Sudbury, MA: Jones and Bartlett.
Graham, S. (2006). Peer victimization in school: Exploring
the ethnic context. Current Directions in Psychological Science, 15,
317–321.
Guerra, N. G., Williams, K. R., & Sadek, S. L. (2011).
Understanding bullying and victimization during
childhood and adolescence: A mixed method study. Child
Development, 82, 295–310.
Hancox, R. J., Milne, B. J., & Poulton, R. (2005).
Association of television viewing during childhood with
poor educational achievement. Archives of Pediatric & Adolescent
Medicine, 159, 614–618. doi:10.1001/archpedi.159.7.614
Hewlings, S. J. (2010). Confronting the childhood obesity epidemic: A
University of Central Florida study. Retrieved from
http://ucf.org/obesitystudy/pdf

349Hong, J. S., & Espelage , D. L. (2003). A review of research
on bullying and peer victimization in school: An
ecological system analysis. Aggression and Violent Behavior,
17, 311–324. doi:10.1016/j.avb.2012.03.003
Hoof, A. V., Raaijmakers, Q. A. W., van Beek, Y., Hale, W.
W., III, & Aleva, L. (2008). A multi-mediation model on
relations of bullying, victimization, identity, and
family issues with adolescent depressive symptoms.
Journal of Youth Adolescence, 37, 772–782. doi:10.1007/s10964-
007-9621-8
Howell, D. C. (2010). Statistical methods for psychology (7th ed.).
Belmont, CA: Wadsworth Cengage Learning.
Israel, G. D. (1992). Sampling evidence of an extension program.
Retrieved from http://
edis.ifas.ufl.edu/pd005

350Kerr, J., Norman, G. J., Sallis, J. F., & Patrick, K.
(2008). Exercise aids, neighborhood safety, and
physical activity in adolescents and parents. Journal of
Medicine, Science in Sports and Exercise, 40, 1244–1248.
doi:10.1249/
MSSobo13e31816b8797
Knapik, J. J., Darakjy, S., Hauret, K. G., Canada, S.,
Scott, S., Rieger, W., … Jones, B. H. (2006).
Increasing the physical fitness of low-fit recruits
before basic combat training: An evaluation of fitness,
injuries, and training outcomes. Journal of Military Medicine,
171, 45–52.
Kuo, J., Voorhees, C. C., Haythornthwaite, J. A., & Young,
D. R. (2007). Associations between family support,
family intimacy and neighborhood violence and physical
activity in urban adolescent girls. American Journal of
Public Health, 97, 101–103.

351LaTorre, G., Masala, D., DeVito, E., Langiano, E., Capelli,
G., Ricciardi, W., & PHASES collaborative group.
(2006). Extra-curricular physical activity and
socioeconomic status in Italian adolescents. BMC Public
Health Journal, 6, 22–31.
LeBlanc, M., & Fitzgerald, S. (2000). Logistic regression
for school psychologists. School Psychology Quarterly, 15,
344–358. doi:10.1037/h0088791
Lehmann, K. L. (2006). Statistical methods based on ranks.
Bull. Amer. Math. Soc., 83 (3), 967–973.
Lenth, R. V. (2006). Java applets for power and sample size [Computer
software] Retrieved from
http://www.stat.uiowa.edu/tenthpower
Loucaides, C. A., Jago, R., & Theophanous, M. (2011).
Physical activity and sedentary behaviors in Greek-
Cypriot children and adolescents: A cross-sectional
study. International Journal of Behavior Nutrition and Physical Activity,
8(90), 1–11.

352Martinez-Gomez, D., Rey-Lopez, J. P., Chillion, P., Gomez-
Martinez, S., Vicente-Rodriguez, G., Martin-Matillas,
M., … AVENA Study Group. (2010). Excessive TV viewing
and cardiovascular disease risk factors in adolescents.
The AVENA cross-sectional study. BMC Public Health, 10, 274–
282. doi:10.1186/1471-2458
-10-274
Maslow (1954). Hierarchy of needs. Retrieved from
http://www.simplypsychology.org
/maslow.html
Massachusetts Department of Public Health. (2007). Health risks
and behaviors of Massachusetts youth: The report. Retrieved from
http://www.doe.mass.edu/cnp
/hprograms/yrbs/2007YRBS.pdf
McKenna, M., Hawk, E., Mullen, J., & Hertz, M. (2011).
Bullying among middle school and high school students
in Massachusetts, 2009. Morbidity and Mortality Weekly Report,
60, 465–471.

353Miles, J. (2011). Getting the sample size right: A brief introduction.
Retrieved from http://www.jermeymiles.co.uk/index.html
Must, A., & Strauss, R. S. (2005). Risks and consequences of
childhood and adolescent obesity. International Journal of
Obesity, 2, S2–S11.
Nansel, T. R., Overpeck, M. D., Haynie, D. L., Ruan, J., &
Scheidt, P. C. (2003). Relationships between bullying
and violence. Journal of the American Medical Association, 157,
348–353.
National Health and Nutrition Examination Survey. (2008).
Obesity among adolescents. Retrieved from
http://www.cdc.gov/nchs/nhanes.htm
Pagano, R. R. (2009). Understanding statistics in the behavioral sciences
(9th ed.). Belmont CA: Wadsworth Cengage Learning.
Parada, R. H., Marsh, H. W., & & Yeung, A. S. (1999,
November). Bullying in schools: Can self-concept theory shed any light?
Paper presented at the Australian Association for
Research in Education Conference, Melbourne, AU.

354Peskin, M. F., Tortolero, S. R., & Markham, C. M. (2006).
Bullying and victimization among Black and Hispanic
adolescents. Adolescence, 41, 467–484.
Raskauskas, J., & Stolz, A. D. (2007). Involvement in
traditional and electronic bullying among adolescents.
Developmental Psychology, 43, 564–575. doi:10.1037/0012
-1649.43.3.564
Roskamp, J. T, (2008). Cyberbullying in Illinois public schools.
Retrieved from
https://play.google.com/store/books/details/Tami_Jo_Ros
kamp_Cyberbullying_in_Illinois_Public_S?id=IUyO_9rZzS8C
Shellard, E. (2002). Recognizing and preventing bullying. The informed
educator series. Arlington, VA: Educational Research
Service.
Social cognitive theory. (2010). Gale Encyclopedia of Public Health.
Retrieved from http://www.answers.com/topic/social-
cognitive-theory-1

355Song, S. (2008). Early-onset type 2 diabetes mellitus:
Epidemiology. British Journal of Diabetes and Vascular Disease,
8(2), 61–65.
Spriggs, A. L., Iannotti, R. J., Nansel, T. R., & Haynie, D.
L. (2007). Adolescent bullying involvement and
perceived family, peer and school relations:
Commonalities and differences across race/ethnicity.
Journal of Adolescent Health, 4, 283–293.
doi:10.1016/j.jadohealth.2007.04.009
Stanford University. (2007). Building generation play and addressing
the crisis of inactivity among America’s children. Retrieved from
http://www
.outdoorfoundation.org/pdf/StanfordReport.pdf
Steckler, A. & McLeroy, K. R. (2008). The importance of
external validity. American Journal of Public Health, 98, 9–10.
doi:10.2105/AJPH.2007.126847

356Stein, J. A., Dukes, R. L., & Warren, J. I. (2007).
Adolescent male bullies, victims and bully-victims: A
comparison of psychosocial and behavioral
characteristics. Journal of Pediatric Psychology, 32, 273–283.
doi:10.1093/jspepsy/jslo23
Storch E. A., Milsom V. A., DeBraganza N., Lewin A. B.,
Geffken G. R., & Silverstein, J. H. (2006). Peer
victimization, psychosocial adjustment, and physical
activity in overweight and at-risk-for overweight
youth. Journal of Pediatric Psychology, 32, 80–89.
doi:10.1093/jpepsy/jsj113
Tabachnick, B. G., & Fidell, L. S. (2012). Using multivariate
statistics (6th ed.). Boston, MA: Pearson.
Triola, M. F. (2008). Essentials of statistics (3rd ed.). Boston,
MA: Pearson Education.

357University of Southern Denmark and Harvard School of Public
Health. (2013). Excessive TV viewing may be linked to increased
type-2 diabetes risk. Retrieved from http://
www.endocrineweb.com/news/obesity/6109-excessive-tv-
viewing-may-be-linked
-increased-type-2-diabetes-risk
U.S. Department of Health and Human Services. (2010).
Weapons violence among adolescents. Retrieved from
http://www.mchb.hrsa.gov/chusa10/hstat/hsa/pages
/224v.html
Vervoort, M. H. M., Scholte, R. H. J., & Overbeek, G.
(2010). Bullying and victimization among adolescents:
The role of ethnicity and ethnic composition of school
class. Journal of Youth and Adolescence, 39, 1–11.
doi:10.1007/s10964-008-9355
Wong, S. L., & Leatherdale, S. T. (2009). Association
between sedentary behavior, physical activity, and
obesity: Inactivity among kids. Prevention of Chronic Disease,
6(1), A26.

358World Health Organization. (2010). Youth violence fact sheet.
Retrieved from http://www
.who.int/mediacentre/factsheets/fs356/en/index.html
Youth Risk Behavior Survey. (2001). Youth behavior
surveillance. Retrieved from http://
www.cdc.gov/mmwr/preview/mmwrhtml/ss5104a1.htm
Youth Risk Behavior Survey. (2009). Data users manual.
Retrieved from http://www.cdc
.gov/HealthyYouth/YRBS/pdf/national_usersmanual_yrbs.pd
f
Yu, C., & Ohlund, B. (2010). Threats to validity of research design.
Retrieved from
http://www.creative-wisdom.com/teaching/WBI/threat.shtm
l

359Zimmerman, F., Glen, G. M., Christakis, D. A., & Katon, W.
(2005). Early cognitive stimulation, emotional support
and television watching as predictors of subsequent
bullying among grade-school children. Archives of Pediatric &
Adolescent Medicine, 159, 384–388.
doi:10.1001/archpedi.159.4.384

360Curriculum Vitae
Brent Spruill530 Main Street | West Newbury, MA 01985 | (978)363-5291
OBJECTIVE
A professorship in an online college or university.
EDUCATION
Ph.D. Student Walden University, Public HealthExpected June 2014 Epidemiology/Community Health
June 2007 American InterContinental University
June 2006 MBA/Health Care Management/Human Resource Management
April 2002 United States Air Force School of Allied Health
PROFESSIONAL LICENSES
2003-current Licensed Practical Nurse, New York State1998–2006 Emergency Medical Technician1997–2002 Medical Assistant1997–2002 Nursing Assistant
PROFESSIONAL AFFILIATIONS
American Public Health AssociationGlobal Public Health AssociationInfectious Disease Public Health AssociationBio-Statically and Epidemiology Public Health AssociationsListed in Stanford Who’s Who 2010
EMPLOYMENT

361
April 1986–May 1996 United States ArmyAdministration Tech and Supply Specialist E-4
June 11, 1996 United States Air Force
January 13, 2009 Medical Technician E-6, Medically Retired