Spreading gossip in social networks
10
Spreading gossip in social networks Pedro G. Lind, 1, 2 Luciano R. da Silva, 3 Jos´ e S. Andrade Jr., 4 and Hans J. Herrmann 4, 5 1 Institute for Computational Physics, Universit¨ at Stuttgart, Pfaffenwaldring 27, D-70569 Stuttgart, Germany 2 Centro de F´ ısica Te´ orica e Computacional, Av. Prof. Gama Pinto 2, 1649-003 Lisbon, Portugal 3 Departamento de F´ ısica Te´ orica e Experimental, Univ. Federal do Rio Grande do Norte, Campus Universit´ ario, 59072-970 Natal-RN, Brazil 4 Departamento de F´ ısica, Universidade Federal do Cear´ a, 60451-970 Fortaleza, Brazil 5 Computational Physics, IfB, HIF E12, ETH H¨ onggerberg, CH-8093 Z¨ urich, Switzerland (Dated: May 22, 2007) We study a simple model of information propagation in social networks, where two quantities are introduced: the spread factor, which measures the average maximal fraction of neighbors of a given node that interchange information among each other, and the spreading time needed for the information to reach such fraction of nodes. When the information refers to a particular node at which both quantities are measured, the model can be taken as a model for gossip propagation. In this context, we apply the model to real empirical networks of social acquaintances and compare the underlying spreading dynamics with different types of scale-free and small-world networks. We find that the number of friendship connections strongly influences the probability of being gossiped. Finally, we discuss how the spread factor is able to be applied to other situations. PACS numbers: 89.75.Hc,89.65.Ef,87.23.Ge Keywords: network dynamics, social networks, information spreading I. INTRODUCTION AND MODEL In every-days life probably everyone has already experi- enced the annoying situation of telling some personal secret to some friend and ending with a naive “please, do not tell that to anyone, ok?” and after short time all our friends sud- denly know the secret. What happened? Is this common phenomenon a consequence of a natural instinct that friends have to conspire and slander against each other? Or is this a phenomenon which can hardly be avoid by human trust and respect being closely related to the net of acquaintances that people naturally tend to form? Such kind of questions can be easily addressed by repre- senting the social system, composed by individuals and the interactions among them, as a network, i.e., as a collection of nodes and links. While networks have been widely used by physicists to study e.g. porous media [1] or a system of inter- acting spins [2–4], they can also be used to study social sys- tems. Social networks have helped to further understand the structure and evolution of social systems, where people and their acquaintances are represented by the nodes and links of the network respectively. In particular, propagation of infor- mation in social systems is easily reproduced in such networks and has been addressed in recent physical literature [5–7] due to its importance in epidemiology [8], where information is related to the contagious of diseases, to understand social in- fluence, beliefs and extremism [9–12], to understand the evo- lution of financial markets [13], to study econophysical net- works underlying e.g., electrical supply systems or road webs among airports or cities. Here we put emphasizes on how far the information can spread when particular constraints, of in- terest for social systems, are taken into account. The way information spreads over the network depends on its content. A rumour or an opinion concerning some topic which is not directly connected to the social network structure (political opinion, etc) can be of interest to any of the neigh- bors of a certain node, regardless their topological features. FIG. 1: (Color online) Spreading of information about a target-node shown as the grey (red) open circle on part of a real school friendship network [15]. If the spreading starts from one of the white squared neighbors, no propagation occurs (f =0). If instead, one of the grey (yellow) squared neighbors starts the spreading, in τ =3 time- steps, five neighbors will know it, giving f =5/7. The information spreads over the dashed (blue) lines. The information can be seen as a gossip about the target-node or the victim (see text). Note that the clustering coefficient of the victim has a different value, namely C = 10/42. However, as opposed to rumors, a gossip always targets the details about the behavior or private life of a specific person, i.e., of a specific node. This node will be called henceforth the target-node or the victim. Therefore, due to this particu- lar content, it is reasonable to assume as a first approach that the information spreads only over people directly connected to the victim. A simple model recently introduced [14] for such kind of
-
Upload
uni-oldenburg -
Category
Documents
-
view
0 -
download
0
Transcript of Spreading gossip in social networks

Spreading gossip in social networks
Pedro G. Lind,1, 2 Luciano R. da Silva,3 Jose S. Andrade Jr.,4 and Hans J. Herrmann4,5
1Institute for Computational Physics, Universitat Stuttgart, Pfaffenwaldring 27, D-70569 Stuttgart, Germany2Centro de Fısica Teorica e Computacional, Av. Prof. Gama Pinto 2, 1649-003 Lisbon, Portugal
3Departamento de Fısica Teorica e Experimental, Univ. Federal do Rio Grande do Norte, Campus Universitario, 59072-970 Natal-RN, Brazil4Departamento de Fısica, Universidade Federal do Ceara, 60451-970 Fortaleza, Brazil
5Computational Physics, IfB, HIF E12, ETH Honggerberg, CH-8093 Zurich, Switzerland(Dated: May 22, 2007)
We study a simple model of information propagation in socialnetworks, where two quantities are introduced:the spread factor, which measures the average maximal fraction of neighbors of a given node that interchangeinformation among each other, and the spreading time neededfor the information to reach such fraction ofnodes. When the information refers to a particular node at which both quantities are measured, the model canbe taken as a model for gossip propagation. In this context, we apply the model to real empirical networksof social acquaintances and compare the underlying spreading dynamics with different types of scale-free andsmall-world networks. We find that the number of friendship connections strongly influences the probability ofbeing gossiped. Finally, we discuss how the spread factor isable to be applied to other situations.
PACS numbers: 89.75.Hc,89.65.Ef,87.23.GeKeywords: network dynamics, social networks, informationspreading
I. INTRODUCTION AND MODEL
In every-days life probably everyone has already experi-enced the annoying situation of telling some personal secretto some friend and ending with a naive “please, do not tellthat to anyone, ok?” and after short time all our friends sud-denly know the secret. What happened? Is this commonphenomenon a consequence of a natural instinct that friendshave to conspire and slander against each other? Or is this aphenomenon which can hardly be avoid by human trust andrespect being closely related to the net of acquaintances thatpeople naturally tend to form?
Such kind of questions can be easily addressed by repre-senting the social system, composed by individuals and theinteractions among them, as a network, i.e., as a collectionofnodes and links. While networks have been widely used byphysicists to study e.g. porous media [1] or a system of inter-acting spins [2–4], they can also be used to study social sys-tems. Social networks have helped to further understand thestructure and evolution of social systems, where people andtheir acquaintances are represented by the nodes and links ofthe network respectively. In particular, propagation of infor-mation in social systems is easily reproduced in such networksand has been addressed in recent physical literature [5–7] dueto its importance in epidemiology [8], where information isrelated to the contagious of diseases, to understand socialin-fluence, beliefs and extremism [9–12], to understand the evo-lution of financial markets [13], to study econophysical net-works underlying e.g., electrical supply systems or road websamong airports or cities. Here we put emphasizes on how farthe information can spread when particular constraints, ofin-terest for social systems, are taken into account.
The way information spreads over the network depends onits content. A rumour or an opinion concerning some topicwhich is not directly connected to the social network structure(political opinion, etc) can be of interest to any of the neigh-bors of a certain node, regardless their topological features.
����
����
����
����
����
����
����
����
����
����
����
����
����
����
����
����
����
����
����
����
����
����
����
����
����
����
����
����
����
����
����
����
����
����
FIG. 1: (Color online) Spreading of information about a target-nodeshown as the grey (red) open circle on part of a real school friendshipnetwork [15]. If the spreading starts from one of the white squaredneighbors, no propagation occurs (f = 0). If instead, one of thegrey (yellow) squared neighbors starts the spreading, inτ = 3 time-steps, five neighbors will know it, givingf = 5/7. The informationspreads over the dashed (blue) lines. The information can beseenas a gossip about the target-node or the victim (see text). Note thatthe clustering coefficient of the victim has a different value, namelyC = 10/42.
However, as opposed to rumors, a gossip always targets thedetails about the behavior or private life of a specific person,i.e., of a specific node. This node will be called henceforththe target-node or the victim. Therefore, due to this particu-lar content, it is reasonable to assume as a first approach thatthe information spreads only over people directly connectedto the victim.
A simple model recently introduced [14] for such kind of

2
information spreading is described as follows. Selecting ran-domly a victim, the gossip about him or her is created attime t = 0 by an originator which shares a bond with thevictim. At t = 1 the originator only spreads the gossip toother nodes, which are connected to him-/herself and the vic-tim. The spread continues until all reachable acquaintances ofthe victim know it, as illustrated by the squares connected bydashed lines in Fig. 1 for a real friendship network [15]. Ourdynamics is therefore like a burning algorithm [16], startingat the originator but limited to sites that are neighbors of thevictim.
To measure how effectively the gossip - or, in general, theinformation - attains the acquaintances of the victim, we de-fine the spreading factor asf = nf/k, wherenf is the to-tal number of people who eventually hear the gossip andk isthe degree of the the victim. In addition, we also define thespreading timeτ which defines the minimum time it takes toreach this fractionf of acquaintances, giving a measure ofhow far these connected acquaintances are from each other. Itis important to note thatf and the standard definition of clus-tering coefficientC [17, 18] are different quantities, since thelater only measures the number of bonds between neighborsand contains no information about how such bonds distributeamong the victim’s acquaintances.
We start in Sec. II by studying how such kind of infor-mation spreads in different networks, namely in scale-freeand in small-world networks. Some analytical considerationswill be present for the particular case of the Apollonian net-work [1]. The results of such artificial networks are alsocompared to the ones obtained with an empirical network ofsocial contacts recently obtained from an U.S. School sur-vey [15], where friendship acquaintances were rigorously de-fined [15, 19]. There are also situations where the informationabout the target-node can be of interest beyond the first neigh-bors, like the case where the victim is a movie star, yieldinga scenario similar to the one of usual rumour propagation oreven epidemic spreading [20]. These cases will be consid-ered in Sec. III. Since the tendency for spreading informationdoes not always implies that its transmission will be certain,we introduce in Sec. IV a probability for each node to spreadthe information and study the main effects on the spreadingdynamics. Discussion and conclusions are given in Sec. V.
II. SPREADING INFORMATION OVER FIRSTNEIGHBORS
We consider first a Barabasi-Albert (BA) scale-free net-work [21]: starting with a small numberm of nodes fullyconnected to each other one adds iteratively one new nodewith m initial links attached to the nodes of the network witha probability proportional to the node degree.
In Fig. 2a we show the average spreading timeτ as a func-tion of the degreek in a scale-free network withN = 104
nodes andm = 3, 5 and7. In all cases, for large values ofk,τ scales logarithmically with the degree
τ = A + B log k (1)
10 100 1000
k0
1
2
3
4
5
6
τ
10 100 1000
k0
0.1
0.2
0.3
f
0.02
0.04(a)
(b)
k0
20 200
FIG. 2: (a) Spreading timeτ in a Barabasi-Albert scale-free networkand (b) the spreading factorf , both as a function ofk: m = 3(circles),m = 5 (squares) andm = 7 (triangles). The dashed linein (b) indicatesf = 1/k. The inset in (b) is a zoom of the plotfor m = 5 emphasizing the optimal degreek0 which minimizes thegossip spreading (see text). In all cases,N = 104 nodes, averagesover500 realizations are considered, and logarithmic binning ink isused.
where for this caseA = −10.77 andB = 2.433 defines thedashed line in Fig. 2a.
For the same values ofm we plot in Fig. 2b the depen-dence of the spread factor with the degree. Curiously, onesees an optimal degreek0 for which the spreading factor at-tains a minimum (see inset). This optimal value lies typicallyin the middle range of the degree spectrum showing that thetwo extreme situations of having either few or many neighborsenhance the relative broadness of the information spreading.Further, a closer look shows that for small degrees the valuesof f coincide withf = 1/k (dashed line) while for larger de-greesf deviates from1/k with a deviation which increaseswith m. Thus, while initially (t = 0) the spread factor is al-waysf = 1/k (dashed line), for the subsequent time-stepsone observes that nodes with small degrees remain on averageatf = 1/k while for large degrees the spread factor increasesup to a maximal value.
The dependence of the optimal valuek0 on the two param-etersN andm is studied in Fig. 3. Here, we observe that theoptimal degreek0 yields approximately
k0 ∝(log N)a
(log m)b. (2)
The scale-free networks considered above are probabilistic.In other contexts, deterministic scale-free networks havebeenproposed [1, 22], as a way to construct perfect hierarchicalnetworks. One of such networks is the Apollonian network.The Apollonian network is constructed in a purely determin-istic way [1, 23] as illustrated in Fig. 4a: one starts with threeinterconnected nodes, defining a triangle; atn = 0 (gener-ation 0) one inserts a new node at the center of the triangle

3
1.9 2 2.1 2.2 2.3 2.4
log(log N)2.5
3
3.5
4
4.5
5
5.5lo
g k
0
0 0.2 0.4 0.6 0.8
log(log m)3.6
3.8
4
4.2
4.4
4.6
log
k0
(a) (b)
FIG. 3: The optimal degreek0 in a BA network as a function(a)of N fixing m = 5 initial outgoing connections and(b) of m forN = 104 nodes. The average degree is〈k〉 = 2m. The dotted lineshave slopes ofa = 4.64 and−b = −1.34 (see Eq. (2)).
(a)
10 100 1000
k
2
4
6
8
10
12
τ
(b)
FIG. 4: (a) Illustration of the first three generations of an Apolloniannetwork (see text).(b) Spreading timeτ for the spreading factorto attain the maximal valuef = 1 where the dashed line can beobtained analytically (see text) yielding an expression asin Eq. (1)with A = −0.28 andB = 1.1.
and joins it to the three other nodes (white circles in Fig. 4a),thus defining three new smaller triangles; at iterationn = 1one adds at the center of each of these three triangles a newnode (squares), connected to the three vertices of the triangle,defining nine new triangles and then for generationn = 2 onenode (black circles) at the center of each of these nine trian-gles and henceforth. The number of nodes and the number ofconnections are given respectively byNn = 1
2 (3n+1 + 5)
and Ln = 32 (3n+1 + 1). The distribution of connections
obeys a power-law, since the number of nodes with degreek = 3, 3 · 2, 3 · 22, . . . , 3 · 2n−1, 3 · 2n and2n+1 is equal to3n, 3n−1, 3n−2, . . . , 32, 3, 1 and3, respectively. Thus one hasP (k) ∝ k−γ with γ = ln 3/ ln 2.
One main difference from the BA network is that, for Apol-lonian networksf = 1 independently ofk, due to the hier-archical structure shown in Fig. 4a. In Fig.4b one observesthe logarithmic behavior ofτ similar to the BA case. In the
1 10
k1
2
3
4
5
τ 10 20 30k
0.0001
0.001
0.01
0.1
1 10
k0.4
0.5
0.6
0.7
0.8
0.9
1
f1 10
k
6
8
10
12
14
(a) (b)
P(k)
k0
knn
FIG. 5: Propagation of information on a real friendship network ofAmerican students [15] averaged over 84 schools. In(a) we showthe spreading timeτ as function of degreek, plotting in the inset,the average degreeknn of neighbors of nodes with degreek. In (b)the spread factorf , both as a function of degreek, with the insetshowing the degree distributionP (k).
Apollonian case the logarithmic behavior can even be derivedanalytically as follows. From Fig. 4a one sees that verticesbelonging to thenth generation communicate with each otherthroughn steps thusτ ∝ n. Since the degree of thenth gen-eration is given by [1]k = 3×2n−1, one obtains the logarith-mic dependence ofτ shown in Fig. 4c, where the dashed lineyields the expression in Eq. (1) withA = −0.28 andB = 1.1.
Next, we show that the main results obtained for the scale-free networks above are also characteristic of real empiricalsocial networks. For that, we study the model for informa-tion propagation on a real social network, namely, the oneextracted from empirical data obtained in an extensive studydone within the National Longitudinal Study of AdolescentHealth (AddHealth) [15] at the Carolina Population Center.The data comprehends a survey done between 1994 and 1995in 84 American schools evaluating an in-school questionnaireto 90118 students. The students are separated by the schoolthey belong to and therefore there are84 networks with sizesranging from∼ 100 to ∼ 2000 students. The aim is to al-low social network researchers interested in general structuralproperties of friendship networks to study the structural andtopological properties of social networks [24]. In previousstudies [19, 25], it has been shown that the main propertiescharacterizing the underlying networks from these data canbe easily reproduced with a mobile agent model.
As shown in Fig. 5a, while for smallk the spreading timegrows linearly, for largek it follows a logarithmic law givenby Eq. (1) withA = −2.84 andB = 1.98. Here, the log-arithmic growth ofτ with k follows the same dependence ofthe average degreeknn of the nearest neighbors [26], as il-lustrated in the inset of Fig. 5a. Further, the non-trivial effectof having an optimal degreek0 is also observed in Fig. 5b.For these schools one obtainsk0 ∼ 7 neighbors as an optimalvalue for whichf ∼ 0.42, meaning that less than half of the

4
first neighbors are reached. In other words, with less friends(k < k0), the information is more able to reach a larger frac-tion of them. But, contrary to intuition, the same occurs forthe nodes having a larger number of friends.
Interestingly, information spreads in the same way eitherthrough these empirical networks as on scale-free networks,although the corresponding topological and statistical featuresare known to be quite distinct [19, 25]. For instance, as shownin the inset of Fig. 5b, the degree distributionP (k) of theschool networks is typically exponential and not power-law.Since the same optimal degree appears in BA networks, oneargues that the existence of this optimal number is not nec-essarily related to the degree distribution of the network,butrather to the degree correlations. However, the relation be-tween degree correlations, measured byknn, and the loga-rithmic behavior of the spreading time is not straightforward.While in the empirical network we find the same distributionfor both knn and τ , in BA and APL networksknn followsa power-law withk. In the case of uncorrelated networks,two and three-point correlations reduce to simple expressionsof the moments of the degree distribution. Therefore,f isindependent of the degree, similarly to what is observed forthe density of particles as derived by Catanzaro et al [27] indiffusion-annihilation processes on complex networks.
To go further with the characterization of informationspreading on networks, we next study the distributions,P (τ)andP (f). In Fig. 6a we see that for the Apollonian networkthe distributionP (τ) of the spreading time decays exponen-tially. This behavior can be understood if we consider thatP (τ)dτ = P (k)dk and use Eq. (1) together with the degreedistribution,P (k) ∝ k−γ , to obtain
P (τ) ∝ exp τ(1−γ)B
, (3)
for largek. The slope in Fig. 6a is precisely(1 − γ)/B =−0.17 using B = 1.1 from Fig. 4c andγ = 2.58 fromRef. [1].
For the school networkP (τ) follows an exponential decayfor largeτ , as shown in Fig. 6b, and has a maximum for smallτ . For comparison, we also plot in Fig. 6b the distributionP (τ) for the BA network withm = 9, which has a very sim-ilar shape but is shifted to the right, due to the larger minimalnumber of connections. In both cases, the distribution is wellfitted by an exponential. The reason for the similiarities be-tween empirical networks and BA networks at the particularvaluem = 9 may be related to the way the questionnaire wasmade at the schools: each student should name their friendsout of a maximal number of10 acquaintances. From the simi-larities we could now argue that in fact on average the studentselected9 acquaintances each.
Figure 6c shows the distributionP (f) for a scale-free BAnetwork, while Fig. 6d shows the same distribution for theempirical networks. Before studying such distributions thefollowing remarks should be taken into account. The spread-ing factor depends on the numberk of neighbors and con-sequently depends also on the network size, since the largerthe network the larger the maximal numberkmax of neigh-bors a node may have. Furher, the spread factor varies al-ways between the minimal value0 and the maximal value
1 3 5 7 9τ
0.01
0.1
1
P(τ)
1 3 5 7 9 11τ
1e-05
0.0001
0.001
0.01
0.1
1
(a)
(b)
0 0.2 0.4 0.6 0.8 1
f0
0.02
0.04
0.06
P(f)
0.2 0.4 0.6 0.8 1
f0
0.02
0.04
0.06
0.08
0.1
0.4 0.45 0.5 0.55 0.60
0.005
0.01
0.015
0 0.2 0.4 0.6 0.8 10
0.01
0.02
0.03
(c)
(d)
(e)
FIG. 6: DistributionP (τ ) of spreading timesτ for (a) the Apollo-nian network of 8 generations, and(b) the real school network (cir-cles) and the BA network withm = 9 andN = 1000 (solid line).The dashed lines indicate the best fit to the data for largeτ valuesof Eq. (3), with parameters(1 − γ)/B = −0.45 and−1.26 for theAPL in (a) and the real school network in (b), respectively. Below,the distributions off are shown for(c) the BA network with the sameparameter values (inset magnifies the rangef ∈ [0.4, 0.6]), for (d)the schools and for(e) an artificial distribution of all possible frac-tionsf among the same number of nodes and neighbors. The highlypositive skewness inP (f) of both BA and schools networks are instrong deviation with the artificial distribution, indicating a structureamong the way neighbors connect with each other (see text).
1 and for a given node withk neighbors the possible valuesaref = 0, 1/k, 2/k, . . . , (k − 1)/k, 1. Consequently, if fora specific network all the possiblef -values appear with thesame probability one should expect the distributionP (f) tobe symmetric aroundf = 1/2 with discrete peaks atn/k forn = 0, 1, . . . , k andk = 1, . . . , kmax. This artificial distribu-tion is shown in Fig. 6e, obtained from all possible fractionsconstructed with all integers fromN = 1 to 1000.
For BA networks, there is also a symmetry in the vicinityof f = 1/2 (Fig. 6a). However, different from an uniformdistribution, one finds a strong asymmetry between small andlarge values off : the most pronounced peaks are observedfor f . 0.1. This same behavior is observed for the em-pirical school networks, as shown in Fig. 6d, which is also

5
-4 -3 -2 -1 0
log p0
0.5
1
1.5
2
2.5
3
C/C0
fτL/L
0
0 0.2 0.4 0.6 0.8 1
k*
0
0.2
0.4
0.6
0.8
1
f0 0.2 0.4 0.6 0.8 1
k*0
2
4
6
8
τ
(a)
(b)
FIG. 7: (a) Propagation of information in small-world networks:Spreading timeτ , clustering coefficientC/C0 and spread factorfas a function of the logarithm of the rewiring probabilityp for thesmall-world lattice withN = 104 sites. C0 = 1/2 is the cluster-ing coefficient of a regular lattice. In all cases we average over 100configurations andk0 = 4 (see text).(b) Dependence of the spreadfactorf onk∗ = (k− kmin)/(kmax − kmin), for the random graphwith N = 103 sites andp = 0.02 (circles),0.04 (squares) and0.08(triangles). In the inset: the spreading timeτ of the random networksfor the same parameter values.
strongly asymmetric when compared with the correspondinguniform distribution of all possible values off sketched inFig. 6e. The positive skewnesses indicate a higher frequencyof low f -values than of larger ones, which indicates in factthat the neighbors of nodes tend to form small separated setsof linked neighbors. Consequently, one is able to address howthe connections between neighbors are groupped only by mea-suring the spreading factor for the central node. For the dis-tribution P (f) of the Apollonian network one trivially findsP (f) = δ(1 − f) since the hierarchical structure of the net-work always yieldsf = 1, as mentioned before.
Social networks are usually small-world [28], i.e., they arecharacterized by a high clustering coefficient and a low av-erage shortest path length. Since we are interested in socialsystems we will next study the propagation of information onartificial small-world networks, constructed as follows [28].One starts with a regular lattice where each node is attachedtok0 neighbors symmetrically displaced. Such regular networkis characterized by a clustering coefficientC0 and a shortestpath lengthL0. In this regular network, all links are short-range. Then, sweeping over all nodes one rewires with prob-ability p each link to a randomly chosen node. By doing thisthere will be on averagepk0N/2 long-range links.
Forp = 0 the network is a regular structure where no long-range links exist, yielding a large average path length and clus-tering coefficient. Forp = 1 all links are long-range produc-ing a random graph structure where both average path lengthand clustering coefficient are small. Increasingp from 0 to1, one first observes the decrease of the shortest path lengthL, when compared toL0, and only for larger values ofp the
decrease of the clustering coefficientC, as shown in Fig. 7a.Therefore, in the middle range between the decrease ofL andthe decrease ofC one obtains the small-world effect whereL/L0 is small andC/C0 is large [29]. As shown in Fig. 7athis range is approximatelly−2 . log p . −1. In Fig. 7a onealso sees that both the spread factorf starts to decrease at ap-proximately the same value ofp as the normalized clusteringcoefficientC/C0.
Figure 7b illustrates the variation of the spread factor asa function of the degree in the particular case of a randomnetwork. Instead of the above procedure withp = 1 fixed,random networks can also be constructed by starting withN nodes and introducing with probabilityp′ one link be-tween each pair of nodes. Typically, in random networksthere is a thresholdp′c beyond which different structure anddynamical features appear. This is also the case for gos-sip propagation. Figure 7b shows the behavior off in ran-dom networks for three illustrative values ofp′ = 0.02, 0.04and 0.08, while the inset shows the corresponding spread-ing time. Since in random networks the average degree in-creases withp′, we choose to computef andτ as functions ofk∗ = (k−kmin)/(kmax−kmin) in order to facilitate compari-son. Forp′ = 0.02 and lower values both the spread factor andspreading time remain approximately constant, withf ∼ 1/kandτ ∼ 1. Increasing the probability top′ = 0.04 increasesthe average degree per node and also the spread factor beyondits initial valuef = 1/k, and consequently the correspondingspreading time,τ > 1, increases withk. Increasing even fur-ther the probability top′ = 0.08 and beyond, more and moreconnections are introduced throughout the network, in partic-ular among the neighbors of each node, which enables morenearest neighbors to know about the gossip. Consequently,on average one obtainsfmax = 1 independently ofk. Thismaximal value for such values ofp′ means that the spreadingattains all the neighbors of the victim. Therefore one shouldexpect that the time to reach complete spreading should de-crease withk∗, which is what one observes in the inset ofFig. 7b.
As a preliminary conclusion of this section one can statethat, although different in their structure, empirical social net-works behave similarly to scale-free networks when subjectto propagation of information over the first neighborhood ofaparticular target-node.
III. BEYOND THE FIRST NEIGHBORS
In this Section we will study howf and τ change whenthe information is able to propagate beyond first neighbors.For that, we consider two different regimes of informationspreading. In the first regime, it spreads among the first andsecond neighbors of the victim, and in the second it spreadsthroughout the entire network. For the latter, there are twoother quantities of interest that we introduce here. One is thetotal fractionFN of nodes who know and transmit the infor-mation, defined as
FN =Ng
N, (4)
6
0 10 20 30
k0
1
2
3
4
5
6
τ
0 10 20 30
k
0.75
0.8
0.85
0.9
0.95
1
f
(a) (b)
FIG. 8: Information or gossip propagation through the first twoneighborhoods in American schools:(a) Spreading timeτ as a func-tion of k and(b) the spread factorf as a function ofk. As one seesthe optimal numberk0 for whichf attains a minimum decreases sig-nificantly compared with the previous situation (see text).
whereNg is the maximal number of nodes in the entire net-work which already know the information andN is the totalnumber of nodes. Second, the maximal spreading timeτmax
defined as the number of time-steps necessary to attain thefractionFN .
Figure 8 shows the spreading dynamics in the Americanschools when it spreads among the two first neighborhoodsof the victim. The behavior is significantly different from theone observed previously (compare with Fig. 5). From Fig. 8aone sees that the spreading time becomes independent onkfor large values deviating from the logarithmic dependenceobserved previously.
As for the spread factorf shown in Fig. 8b, one still ob-serves an optimal value minimizing the spreading of the gos-sip, but this value is now much lower than the one found forpropagation only among common neighbors of the originatorand the victim. Probably here, contrary to what happens inthe previous case, the optimal value vanishes when the net-work size or the number of connections increase. This con-jecture will be reinforced next by studying artificial scale-freenetworks.
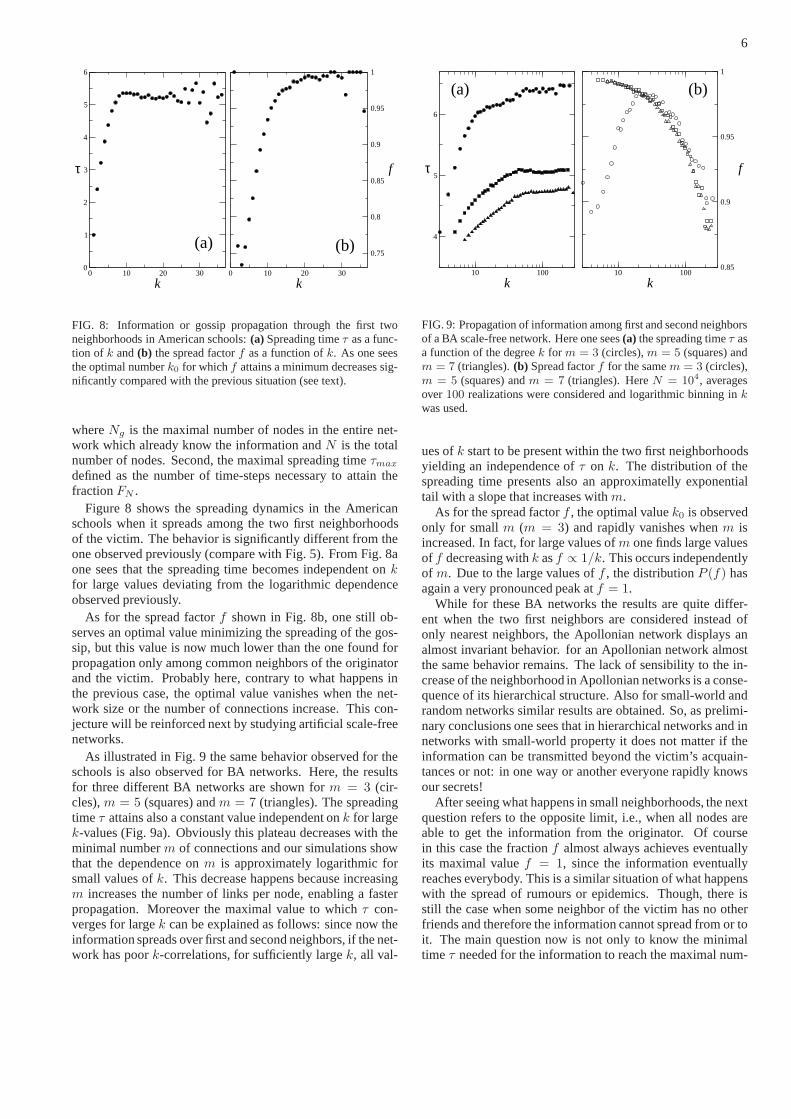
As illustrated in Fig. 9 the same behavior observed for theschools is also observed for BA networks. Here, the resultsfor three different BA networks are shown form = 3 (cir-cles),m = 5 (squares) andm = 7 (triangles). The spreadingtimeτ attains also a constant value independent onk for largek-values (Fig. 9a). Obviously this plateau decreases with theminimal numberm of connections and our simulations showthat the dependence onm is approximately logarithmic forsmall values ofk. This decrease happens because increasingm increases the number of links per node, enabling a fasterpropagation. Moreover the maximal value to whichτ con-verges for largek can be explained as follows: since now theinformation spreads over first and second neighbors, if the net-work has poork-correlations, for sufficiently largek, all val-
10 100
k
4
5
6
τ
10 100
k0.85
0.9
0.95
1
f
(a) (b)
FIG. 9: Propagation of information among first and second neighborsof a BA scale-free network. Here one sees(a) the spreading timeτ asa function of the degreek for m = 3 (circles),m = 5 (squares) andm = 7 (triangles).(b) Spread factorf for the samem = 3 (circles),m = 5 (squares) andm = 7 (triangles). HereN = 104, averagesover100 realizations were considered and logarithmic binning inkwas used.
ues ofk start to be present within the two first neighborhoodsyielding an independence ofτ on k. The distribution of thespreading time presents also an approximatelly exponentialtail with a slope that increases withm.
As for the spread factorf , the optimal valuek0 is observedonly for smallm (m = 3) and rapidly vanishes whenm isincreased. In fact, for large values ofm one finds large valuesof f decreasing withk asf ∝ 1/k. This occurs independentlyof m. Due to the large values off , the distributionP (f) hasagain a very pronounced peak atf = 1.
While for these BA networks the results are quite differ-ent when the two first neighbors are considered instead ofonly nearest neighbors, the Apollonian network displays analmost invariant behavior. for an Apollonian network almostthe same behavior remains. The lack of sensibility to the in-crease of the neighborhood in Apollonian networks is a conse-quence of its hierarchical structure. Also for small-worldandrandom networks similar results are obtained. So, as prelimi-nary conclusions one sees that in hierarchical networks andinnetworks with small-world property it does not matter if theinformation can be transmitted beyond the victim’s acquain-tances or not: in one way or another everyone rapidly knowsour secrets!
After seeing what happens in small neighborhoods, the nextquestion refers to the opposite limit, i.e., when all nodes areable to get the information from the originator. Of coursein this case the fractionf almost always achieves eventuallyits maximal valuef = 1, since the information eventuallyreaches everybody. This is a similar situation of what happenswith the spread of rumours or epidemics. Though, there isstill the case when some neighbor of the victim has no otherfriends and therefore the information cannot spread from ortoit. The main question now is not only to know the minimaltime τ needed for the information to reach the maximal num-

7
10 20 30
k
4
6
8
10
10 20 30
k0
0.2
0.4
0.6
0.8
1
τmax
τ
f
FN
(a)
(b)
FIG. 10: The spread of information through the entire schoolnet-works. (a) Spreading timeτ and maximal spreading timeτmax asfunction of degreek. (b) Spread factorf and total affected fractionFN as a function ofk.
ber of nearest neighbors of the victim, but also to compareit with the maximal timeτmax needed for the information toachieve the maximal fractionFN (see Eq. (4)) of nodes whichare reached.
10 100
k3
4
5
6
7
τ, τ
ma
x
10 100
k0.75
0.8
0.85
0.9
0.95
1
FN
(a) (b)
FIG. 11: The propagation of information throughout an entire BAnetwork.(a) the spreading timeτ and maximal spreading timeτmax
as a function of the degreek for m = 3 (circles),m = 5 (squares)andm = 9 (triangles). The total fractionFN of nodes that get theinformation is plotted in(b). In all cases,f = 1 always (see text).HereN = 103, averages over100 realizations were considered, andlogarithmic binning ink was used.
For the school networks, the behavior is illustrated inFig. 10. From Fig. 10a one sees that the behavior ofτ is al-most the same as in Fig. 8a. The maximal time decreases withk before attaining an approximatelly constant value. The largefluctuation fork > 25 is due to poor statistics. The decreaseof τmax for smallk occurs, since for victims with less friendsthe successive neighborhoods through which the informationspreads comprehend a smaller amount of neighbors than when
starting with a larger number of friends.As explained above the spread factor is approximatelly one
independently ofn, yielding a delta distributionP (f) ∼ δ(1−f), while the maximal fractionFN increases fast for smallkand rapidly attains a more or less constant value aroundFN ∼
0.6. Therefore, no optimal number of friends is observed.Figure 11 shows what happens in the BA case. As one sees
from Fig. 11a, bothτ and τmax decrease withm. Further,for both quantities,τ (black symbols) andτmax (white sym-bols), a fast convergence to a logarithmic dependence onk isobserved whenk increases. Interestingly, while the slope as afunction of log k differs betweenτ andτmax, in each case itis approximately independent ofm, being apparently a featureof the scale-free topology.
In this situation one has alwaysf = 1. As for FN , verylarge values are now observed (FN > 0.7) independently ofk andFN increases very fast attainingFN ∼ 1 for k > 10neighbors (see Fig. 11b). In other words, on BA networks, inorder that all neighbors of a certain victim get the information,it must spread throughout the entire network.
10 100
k2
3
4
5
6
7
8
9
τ, τ
ma
x
10 100
k0
0.2
0.4
0.6
0.8
1
FN
(a)
(b)
FIG. 12: Propagation of information on an Apollonian network withn = 8 generations:(a) Minimal time τ and maximal timeτmax and(b) the fractionFN between the total number of nodes which arereached by the information and the total numberN of nodes, both asfunctions ofk. Here,P (τ ) ∝ P (τmax) ∝ P (k) ∝ k−γ (see text).
Figure 12 illustrates the case of the Apollonian network.The value ofτmax ≥ τ increases more slowly withk, beingboth quantities equal for very largek values. This similaritybetween both spreading timesτ ∼ τmax is in fact another ev-idence for the fact that in order to enable the information toreach all neighbors it must spread throughout the entire net-work. In fact, from Fig. 12c one also sees that in the rangewhereτmax > τ , FN < 1, being equal to one only in therangeτ = τmax.
Finally, we examine the case of small-world networks il-lustrated in Fig. 13. From Fig. 13a one sees that the spread-ing time τ increases almost linearly with the rewiring prob-ability p except at the end for large values ofp (randomnetwork). The maximal spreading timeτmax is very largefor low rewiring probabilities, due to a large average pathlength, and decreases one order of magnitude in the range

8
-4 -3 -2 -1 0
log p1
10
100
-4 -3 -2 -1 0
log p
0.01
0.1 FN
τmax
τ
(a) (b)
FIG. 13: Information propagation in small-world networks when itspreads over the entire network.(a) Spreading timeτ and maximaltime τmax and (b) total fractionFN as a function of the rewiringprobabilityp. HereN = 103 nodes and averages over100 realiza-tions were considered.
−2 < log p < −1 corresponding to small-world networks. Infact, τmax follows the dependence of the average path lengthonp.
As for the total fractionFN illustrated in Fig. 13b one findsthe opposite dependence onp than the one found forτmax:for low (large) values ofp one finds low (large) values ofFN ,and a pronounced increase is observed throughout the entiresmall-world regime. To explain this behavior one must useboth the average path length and the clustering coefficient,L/L0 and C/C0 shown in Fig. 7a. For random networks(p = 1) the total fraction attainsFN = 1 very fast due tothe very short average path length. For small values ofp, al-though regular networks have an average path length that islarger than in random networks, the spreading time needed toattainFN = 1 is now proportional toL. In the small-worldregime however, the average path length is small but the waythe neighbors are connected isolates in some few cases nodesfrom the information spreading process. So, although small-world networks have large cluster coefficients as in regularnetworks, the long-range connections change significantlythelocal topology of a given node-neighborhood.
IV. INTRODUCING A TRANSMISSION PROBABILITY
In all the previous results each friend will surely spread thegossip further. Fortunately people are on average not as nastyas that. One should expect that only a certain fractionq < 1of our friends are not worth to be trusted. In this Section weaddress this more realistic situation.
Since we do not have any sociological information aboutthe topological features of the ‘good’ friends we introduceqas a probability that a node has to spread the gossip. For theparticular caseq = 1 one reduces to the situations studiedpreviously.
Two possible ways of propagation may then occur. One
1 10
k0
2
4
6
8
10
τ
1 10
k0
0.2
0.4
0.6
0.8
1
f10 100k
0
5
10
15
20
10 100k
00.20.40.60.8
1
(a) (b)
FIG. 14: Information or gossip propagation among first neighborswith probability q on a real friendship network of American stu-dents [15] averaged over 84 schools. In (a) we show the spreadingtime τ and in (b) the spread factorf , both as function of degreek.The insets show the same data for the BA network withm = 9 andN = 1000. At each time-step each node which knows the gossiptries to spread it. In all plots one hasq = 0 (◦), q = 0.2 (•), q = 0.4(�), q = 0.6 (�), q = 0.8 (△) andq = 1 (N).
concerns a scenario where friendships connections are relatedto contacts between the nodes at a given instant. In this situ-ation a certain individual tries only once, with probability q,to spread the information to its friends. Therefore, if the gos-sip is not ‘accepted’ once it will never be. Another scenariois of course when the spread is tried repeatedly at each time-step. We will start with this latter scenario and end with themore pleasant one where gossip is only able to spread fromthe nodes which heard it most recently.
Introducing the new parameterq in the model we go backto the first information spreading model studied in Section IIwhere the gossip only spreads to friends of the victim. At eachtime-step the neighbors which already know the gossip repeat-edly try to spread it to other friends of the victim. Therefore,one expects to attain the same value off that one measuredfor q = 1, but this time only after a larger spreading time,namelyτ ′ = τ/q. Figure 14 shows the result of such infor-mation propagation regime for the school networks. and forseveral values ofq. The corresponding curves off are plottedin Fig. 14b.
Of course forq = 0 the spreading time is alwaysτ = 0and the spread factor equalsf = 1/k since only the nodestarting the gossip will know it. As expected, for all othervalues the spread factor coincides with the one forq = 1,while the spreading time preserves its logarithmic dependenceonk for large degrees, and the exponent increases with1/q,asexplained below.
In the insets of both plots in Fig. 14 we show for compari-son the spreading timeτ and spread factorf for a BA networkwith N = 1000 andm = 9. A strong deviation from the log-arithmic dependence of the spreading time is observed, due tothe high number of initial outgoing connections (m = 9).

9
1 10 100 1000
k
10
20
30
40
50
60
70
τ0.1 1
q1
10
B
FIG. 15: Gossip propagation in an Apollonian network withn = 8generations, for10 values of probabilityq = 0, 0.1, 0.2, . . . , 0.9and 1. The slopeB of the dashed lines which fit the data de-creases withq as shown in the inset where the line yieldsB =exp (0.23 − 0.88 log q) ∼ 1/q (see text).
10 100k
1
2
3
4
5
τ
1 10
k0
1
2
3
4
5
τ10 100
k0
0.2
0.4
0.6
0.8
1
f
10
k0
0.2
0.4
0.6
0.8
1
f
(a)
(b)
FIG. 16: Propagation of gossip among first neighbors on a realfriendship network of American students [15], when personstowhich a gossip did not spread at the first attempt will never get it.In (a) we show the spreading timeτ and in (b) the spread factorf ,both as a function of degreek. The insets show the same data for theBA network withm = 9 andN = 1000. After knowing the gossipeach node tries to spread it only once (see text). In all plotsone hasq = 0 (◦), q = 0.25 (•), q = 0.5 (�), q = 0.75 (�) andq = 1 (△).
The logarithmic dependence of the spreading time can bemore easily seen when studying the Apollonian network asshown in Fig. 15. Here we plot the spreading time for10different values ofq and fit all of them with a logarithmicfunction as the one in Eq. (1). The corresponding slopeB asa function ofq is plotted in the inset of Fig. 15 and follows
closely a hyperbolic behavior,B ∼ 1/q. Thus, Eq. (1) can bewritten more generally as
τ ∝1q
log k. (5)
Finally, we can also assume that the person to which a gos-sip did not spread at the first attempt, will never get it. Inthis way, the gossip is a quantity which percolates through thesystem.
In Fig. 16 we see the behavior ofτ andf for different valuesof q for the school networks and in the inset for the BA net-work. When the spreading probabilityq decreases, the min-imum in f first shifts to largerk and finally disappears. Theasymptotic logarithmic law ofτ for largek remains for allprobabilitiesq. As in previous cases, the BA network has asimilar behavior as the school friendships. The Apolloniannetwork, however, behaves quite differently:τ first increaseswith q and then eventually falls off to zero so that there existsa special valueqmax ≈ 0.75 for which the spreading timeτ ismaximized.
V. DISCUSSION AND CONCLUSIONS
In this paper, we studied a general model of informationspreading suited for different kinds of social information. Inthe usual case of rumour or opinion propagation the informa-tion spreads throughout the network, and all nodes are equallycapable of transmiting the information to their neighbors.Twomeasures were proposed to characterize the spreading of suchmodel, namely, the spreading factor measuring the accessi-ble neighborhood around each node which can be reached bythe information spreading, and the spreading time which com-putes the minimum time to reach such neighborhood.
Further, we have shown that by computing these quantitiesfor each node the resulting distributions give additional insightto the underlying network structure on which the spreadingtakes place. More precisely, the magnitude of the skewnessof the distribution of the spreading factor gives a measure ofhow difficult it is to access one neighbor, starting from anotherone. For positive values of the skewness, most of the pairs ofneighbors are connected by some path of connections, whilefor negative values of the skewness, neighbors are more likelygroupped in separated connected pairs.
In the particular case that the information is about a certaintarget-node and thus is of interest to a restricted neighbor-hood around it, one yields a minimal model to study gossipspreading. Applying such a scheme to artifical and empiricalnetworks, we found that, although different in their statisticalproperties, information on empirical social networks seems tospread similarly to what is observed in scale-free networks.In both cases, the spreading time shows a logarithmic depen-dence on the degree, indicating small-world effect within thenearest neighborhood of the nodes. Further, from the compu-tation of the spreading factor we observed that there is a non-trivial optimal number of friends which minimizes the dangerof being gossipped that depends on the size of the networkand on total number of acquaintances in it. We also showed
10
that this optimal value is characteristic of either scale-free net-works or real social networks, but is not observed in small-world networks, rising the question of what network proper-ties may give rise to the emergence of such an optimal value.
However, when the information spreads beyond the near-est neighbors, in a similar way as for propagation of rumoursand epidemics, this optimal value disappears with the spread-ing factor rapidly converging tof = 1. Also the logarithmicdependence of the spreading time no longer holds in this case.
Since one person does not in general spread information toall its neighbors, neither at the same time nor with completecertainty, we also studied regimes of information propagationwhere the spreading from one node to another occurs withsome probabilityq.
Due to their particular features and assumptions, our con-cepts and measures to address the propagation of informationin networks could be suited to other situations. For instance,
in the case of the Internet, some trojan horses need to connectto a specific host to download some data in order to becomeeffective. For them the spread factor should be a good mea-sure to assess the vulnerability to the spreading of this virusattack. In this situation probably an experimental test of theemergence of the optimal degree found in the cases stated herecould be easier to be implemented.
Acknowledgements
The authors profitted from discussions with ConstantinoTsallis, Marta C. Gonzalez and Ana Nunes. We thankthe Deutsche Forschungsgemeinschaftand the Max PlanckPrize (Germany) and CAPES, CNPq and FUNCAP (Brazil-ian Agencies) for support.
[1] J. S. Andrade Jr., H.J. Herrmann, R.F.S. Andrade, L.R. daSilva,Phys. Rev. Lett.94, 018702 (2005).
[2] A.D. Sanchez, J.M. Lopez and M.A. Rodrıguez,Phys. Rev. Lett.88, 048701 (2002).
[3] P.L. Krapivsky and S. Redner, Phys. Rev. Lett.90, 238701(2003).
[4] M. Mobilia and S. Redner, Phys. Rev. E68, 046106 (2003).[5] S. Boccaletti, V. Latora, Y. Moreno, M. Chavez and D.-
U. Hwang, Physics Reports424, 175-308 (2006).[6] C.G. Shao, Z.Z. Liu, J.F. Wang and J. Luo, Phys. Rev. E68,
016120 (2003).[7] P.G. Lind, M.C. Gonzalez and H.J. Herrmann Phys. Rev. E72,
056127 (2005).[8] P.S. Dodds and D.J. Watts, Phys. Rev. Lett.92, 218701 (2004).[9] C. Castellano, M. Marsili, A. Vespignani, Phys. Rev. Lett. 85,
3536-3539 (2000).[10] A. Pluchino, V. Latora and A. Rapisarda, Int. J. Mod. Phys. C
16(4), 515-531 (2005).[11] S. Galam, Phys. Rev. E71, 046123 (2005).[12] M. He, H. Xu and Q. Sun, Int. J. Mod. Phys. C15(7), 947-953
(2004).[13] V.M. Eguıluz and M.G. Zimmermann, Phys. Rev. Lett.85,
5659-5662 (2000).[14] P.G. Lind, J.S. Andrade Jr., L.R. da Silva, H.J. Herrmann,
Eur. Phys. Lett. accepted (2007); cond-mat/0603824.[15] Add Health program designed by J.R. Udry, P.S. Bearman and
K.M. Harris funded by National Institute of Child and Human
Development (PO1-HD31921).[16] H.J. Herrmann, D.C. Hong and H.E. Stanley, J.Phys.A17, L261
(1984).[17] D.J. Watts and S.H. Strogatz,Nature393, 440-442 (1998).[18] L.A.N. Amaral, A. Scala, M. Barthelemy and H.E. Stanley,
Proc. Nat. Acad. Sci. USA97, 11149 (2000).[19] M.C. Gonzalez, P.G. Lind and H.J. Herrmann
Phys. Rev. Lett.96, 088702 (2006); cond-mat/0602091.[20] M.M. Telo da Gama and A. Nunes, Eur. Phys. J. B,50, 205
(2006).[21] A.-L. Barabasi and R. Albert, Science286, 509-512 (1999).[22] S.N. Dorogovtsev, A.V. Goltsev and J.F.F. Mendes Phys.Rev. E
65, 066122 (2002).[23] P.G. Lind, J.A.C. Gallas and H.J. Herrmann, Phys. Rev. E70,
056207 (2004).[24] P.S. Bearman, J. Moody and K. Stovel, Am.J. of Soc.110, 44
(2004).[25] M.C. Gonzalez, P.G. Lind and H.J. Herrmann Physica D224
137 (2006).[26] M. Cantazaro, M. Boguna and R. Pastor-Satorras, Phys.Rev. E
71 027103 (2005).[27] M. Cantazaro, M. Boguna and R. Pastor-Satorras, Phys.Rev. E
71, 056104 (2005).[28] D.J. Watts and S.H. Strogatz, Nature393, 440-442 (1998).[29] R. Albert and A.-L. Barabasi, Rev. Mod. Phys.74, 47-97
(2002).