Spotlight on differentially expressed genes in urinary bladder cancer vs. healthy tissue, as well as...
17
Spotlight on Differentially Expressed Genes in Urinary Bladder Cancer Apostolos Zaravinos 1 , George I. Lambrou 2 , Dimitrios Volanis 1,3 , Dimitris Delakas 3 , Demetrios A. Spandidos 1 * 1 Laboratory of Virology, Medical School, University of Crete, Heraklion, Crete, Greece, 2 First Department of Pediatrics, Choremeio Research Laboratory, University of Athens, Athens, Greece, 3 Department of Urology, Asklipieio General Hospital, Voula, Athens, Greece Abstract Introduction: We previously identified common differentially expressed (DE) genes in bladder cancer (BC). In the present study we analyzed in depth, the expression of several groups of these DE genes. Materials and Methods: Samples from 30 human BCs and their adjacent normal tissues were analyzed by whole genome cDNA microarrays, qRT-PCR and Western blotting. Our attention was focused on cell-cycle control and DNA damage repair genes, genes related to apoptosis, signal transduction, angiogenesis, as well as cellular proliferation, invasion and metastasis. Four publicly available GEO Datasets were further analyzed, and the expression data of the genes of interest (GOIs) were compared to those of the present study. The relationship among the GOI was also investigated. GO and KEGG molecular pathway analysis was performed to identify possible enrichment of genes with specific biological themes. Results: Unsupervised cluster analysis of DNA microarray data revealed a clear distinction in BC vs. control samples and low vs. high grade tumors. Genes with at least 2-fold differential expression in BC vs. controls, as well as in non-muscle invasive vs. muscle invasive tumors and in low vs. high grade tumors, were identified and ranked. Specific attention was paid to the changes in osteopontin (OPN, SPP1) expression, due to its multiple biological functions. Similarly, genes exhibiting equal or low expression in BC vs. the controls were scored. Significant pair-wise correlations in gene expression were scored. GO analysis revealed the multi-facet character of the GOIs, since they participate in a variety of mechanisms, including cell proliferation, cell death, metabolism, cell shape, and cytoskeletal re-organization. KEGG analysis revealed that the most significant pathway was that of Bladder Cancer (p = 1.5 6 10 231 ). Conclusions: The present work adds to the current knowledge on molecular signature identification of BC. Such works should progress in order to gain more insight into disease molecular mechanisms. Citation: Zaravinos A, Lambrou GI, Volanis D, Delakas D, Spandidos DA (2011) Spotlight on Differentially Expressed Genes in Urinary Bladder Cancer. PLoS ONE 6(4): e18255. doi:10.1371/journal.pone.0018255 Editor: I. King Jordan, Georgia Institute of Technology, United States of America Received October 13, 2010; Accepted March 1, 2011; Published April 5, 2011 Copyright: ß 2011 Zaravinos et al. This is an open-access article distributed under the terms of the Creative Commons Attribution License, which permits unrestricted use, distribution, and reproduction in any medium, provided the original author and source are credited. Funding: The authors have no support or funding to report. Competing Interests: The authors have declared that no competing interests exist. * E-mail: [email protected] Introduction Urinary bladder cancer (BC) is the most common malignancy of the urinary tract, responsible for significant mortality and morbi- dity worldwide. In Europe, an estimated 105,000 new cases of bladder cancer are diagnosed annually, while approximately 30,000 patients die from bladder cancer each year [1]. Its incidence directly increases with age, being rare before the age of 50, and it is three to four times more common in men compared to women. Nearly all bladder cancers are carcinomas, arising from the transitional epithelium. The behaviour of transitional cell carcinoma (TCC) is highly diverse and defined by two separate, but related processes: tumor recurrence and progression. At presentation, 75–85% of tumors are restricted to the mucosa, or invade the lamina propria mucosae. The remainder present with invasion of the muscular layer of the bladder wall or extend to perivesical tissue, adjacent organs and the pelvic wall. More than 60% of the superficial tumors will recur at least once and progress to less differentiated or invasive neoplasms with worse prognosis in a significant percentage of patients [2]. The most useful prognostic parameters are tumor grade, stage, size, prior recurrence rate and the synchronous presence of CIS [3]. Nevertheless, better understanding of the natural history of TCC can be expected upon the elucidation of the molecular mechanisms of TCC. We previously identified common differentially expressed (DE) genes in urinary BC [4]. In the present study, our interest was focused on the analysis of various groups of DE genes, such as genes involved in the control of the cell cycle, DNA damage repair, apoptosis, signal transduction, transcription factors, angiogenesis, cellular proliferation, invasion and metastasis. We explored the expression profile in BC vs. healthy tissue, in non-muscle-invasive (stage T1) vs. muscle-invasive tumors (stage T2-T4), and in low vs. high grade tumors by microarray analysis. Our results were further validated by immunohistochemistry, qPCR and Western blotting. Moreover, we performed GEO computational analysis in microarray data extracted from other publicly available datasets, and compared them with our results. PLoS ONE | www.plosone.org 1 April 2011 | Volume 6 | Issue 4 | e18255
Transcript of Spotlight on differentially expressed genes in urinary bladder cancer vs. healthy tissue, as well as...

Spotlight on Differentially Expressed Genes in UrinaryBladder CancerApostolos Zaravinos1, George I. Lambrou2, Dimitrios Volanis1,3, Dimitris Delakas3, Demetrios A.
Spandidos1*
1 Laboratory of Virology, Medical School, University of Crete, Heraklion, Crete, Greece, 2 First Department of Pediatrics, Choremeio Research Laboratory, University of
Athens, Athens, Greece, 3 Department of Urology, Asklipieio General Hospital, Voula, Athens, Greece
Abstract
Introduction: We previously identified common differentially expressed (DE) genes in bladder cancer (BC). In the presentstudy we analyzed in depth, the expression of several groups of these DE genes.
Materials and Methods: Samples from 30 human BCs and their adjacent normal tissues were analyzed by whole genomecDNA microarrays, qRT-PCR and Western blotting. Our attention was focused on cell-cycle control and DNA damage repairgenes, genes related to apoptosis, signal transduction, angiogenesis, as well as cellular proliferation, invasion andmetastasis. Four publicly available GEO Datasets were further analyzed, and the expression data of the genes of interest(GOIs) were compared to those of the present study. The relationship among the GOI was also investigated. GO and KEGGmolecular pathway analysis was performed to identify possible enrichment of genes with specific biological themes.
Results: Unsupervised cluster analysis of DNA microarray data revealed a clear distinction in BC vs. control samples and lowvs. high grade tumors. Genes with at least 2-fold differential expression in BC vs. controls, as well as in non-muscle invasivevs. muscle invasive tumors and in low vs. high grade tumors, were identified and ranked. Specific attention was paid to thechanges in osteopontin (OPN, SPP1) expression, due to its multiple biological functions. Similarly, genes exhibiting equal orlow expression in BC vs. the controls were scored. Significant pair-wise correlations in gene expression were scored. GOanalysis revealed the multi-facet character of the GOIs, since they participate in a variety of mechanisms, including cellproliferation, cell death, metabolism, cell shape, and cytoskeletal re-organization. KEGG analysis revealed that the mostsignificant pathway was that of Bladder Cancer (p = 1.5610231).
Conclusions: The present work adds to the current knowledge on molecular signature identification of BC. Such worksshould progress in order to gain more insight into disease molecular mechanisms.
Citation: Zaravinos A, Lambrou GI, Volanis D, Delakas D, Spandidos DA (2011) Spotlight on Differentially Expressed Genes in Urinary Bladder Cancer. PLoSONE 6(4): e18255. doi:10.1371/journal.pone.0018255
Editor: I. King Jordan, Georgia Institute of Technology, United States of America
Received October 13, 2010; Accepted March 1, 2011; Published April 5, 2011
Copyright: � 2011 Zaravinos et al. This is an open-access article distributed under the terms of the Creative Commons Attribution License, which permitsunrestricted use, distribution, and reproduction in any medium, provided the original author and source are credited.
Funding: The authors have no support or funding to report.
Competing Interests: The authors have declared that no competing interests exist.
* E-mail: [email protected]
Introduction
Urinary bladder cancer (BC) is the most common malignancy of
the urinary tract, responsible for significant mortality and morbi-
dity worldwide. In Europe, an estimated 105,000 new cases of
bladder cancer are diagnosed annually, while approximately
30,000 patients die from bladder cancer each year [1]. Its
incidence directly increases with age, being rare before the age of
50, and it is three to four times more common in men compared to
women. Nearly all bladder cancers are carcinomas, arising from
the transitional epithelium. The behaviour of transitional cell
carcinoma (TCC) is highly diverse and defined by two separate,
but related processes: tumor recurrence and progression. At
presentation, 75–85% of tumors are restricted to the mucosa, or
invade the lamina propria mucosae. The remainder present with
invasion of the muscular layer of the bladder wall or extend to
perivesical tissue, adjacent organs and the pelvic wall. More than
60% of the superficial tumors will recur at least once and progress
to less differentiated or invasive neoplasms with worse prognosis in
a significant percentage of patients [2]. The most useful prognostic
parameters are tumor grade, stage, size, prior recurrence rate and
the synchronous presence of CIS [3]. Nevertheless, better
understanding of the natural history of TCC can be expected
upon the elucidation of the molecular mechanisms of TCC.
We previously identified common differentially expressed (DE)
genes in urinary BC [4]. In the present study, our interest was focused
on the analysis of various groups of DE genes, such as genes involved
in the control of the cell cycle, DNA damage repair, apoptosis, signal
transduction, transcription factors, angiogenesis, cellular proliferation,
invasion and metastasis. We explored the expression profile in BC vs.
healthy tissue, in non-muscle-invasive (stage T1) vs. muscle-invasive
tumors (stage T2-T4), and in low vs. high grade tumors by microarray
analysis. Our results were further validated by immunohistochemistry,
qPCR and Western blotting. Moreover, we performed GEO
computational analysis in microarray data extracted from other
publicly available datasets, and compared them with our results.
PLoS ONE | www.plosone.org 1 April 2011 | Volume 6 | Issue 4 | e18255

Our results focused on genes which play a significant role in the
most important cellular processes and demonstrated a large
difference in their expression patterns between BC and control
samples. Genes with at least 2-fold differential expression in BC vs.
controls, as well as in non-muscle-invasive vs. muscle-invasive
tumors, and in low vs. high grade tumors, were identified and
ranked.
Materials and Methods
Study design and clinicopathological dataPaired tumor and normal tissue samples from a consecutive
series of 30 patients with newly diagnosed BCs undergoing
transurethral bladder tumor resection at the Department of
Urology, ‘‘Asklipieio’’ General Hospital, Athens, were acquired
after the amount of tissue necessary for routine pathology
examination had been removed (Table 1). All tumor specimens
were classified and graded by the same pathologist. Cancer
patients were categorized accordingly into muscle-invasive (T2, T3
or T4) and non-invasive tumors (Ta, T1, and CIS). For
comparative purposes with previous reports, the 1973 World
Health Organization (WHO) grading system [low grade (grades 1–
2) and high grade (grade 3)] was used in this study which is still the
most commonly used system despite being superseded by the 2004
WHO/International Society of Urologic Pathology (ISUP)
classifications [5]. Written informed consent was obtained from
all patients included in this study. The study protocol was
approved by the Ethics Committee of the University of Crete.
Eligibility criteria used were electively resected primary BCs and
the availability of DNA from normal and tumor tissue for
biomolecular analyses. Exclusion criteria were a history of
previous neoplasms and chemotherapy or radiation therapy prior
to surgery.
Tissue samples were obtained at surgery from the tumor and the
following three grossly normal selected sites (cold cup biopsies):
posterior wall, trigone, and the area adjacent to the tumor. Parts of
the resected normal samples were sent for histopathological
analysis. Tumor and normal tissues were frozen immediately in
liquid nitrogen, transported and stored at 280uC until DNA
extraction.
Patients with non-muscle-invasive BCs were followed up with
periodical cystoscopic examinations and intravesical treatment as
indicated. Patients with invasive BCs were offered radical
cystectomy with or without systemic chemotherapy. After a mean
follow-up of 2463 months, 8 (26.6%) patients had recurrent
tumors. In Ta/T1 tumors the frequency of recurrence was 29.4%
(5/17) compared with 23% (3/13) of T2-T3 tumors. In patients
with non-muscle-invasive BCs, the progression rate was 11.1%
and 22.2% for grade 2 and grade 3 tumors, respectively. All
recurrences were proven by biopsy.
ImmunohistochemistrySections, 3-mm thick, of formalin-fixed, paraffin-embedded
tissue were cut and placed on slides coated with 3-aminopropyl-
triethoxysilone. Slides were dried at 56uC for 1 h before
immunohistochemical staining. Tissue sections were deparaffi-
nized in xylene before rehydration in graded alcohols, and
endogenous peroxidase activity was blocked by treatment with 3%
H2O2 at room temperature for 15 min. Antigen unmasking was
performed by 30 min of incubation at 80uC in 10 mM trisodium
citrate (pH 6.1). Immunostaining and revelation were performed
on a Dako automate. Slides were incubated at room temperature
with primary polyclonal goat antibodies against anti-ErbB2 (1:800;
Dako), cyclin D1 (1:100; SP4; Epitomics), monoclonal antibody
against anti-p53 (1:250; E26; Epitomics) and monoclonal antibody
against anti-Ki-67 (1:100; SP6; Epitomics). Epitopes of the
primary antibody were localized by the immunoperoxidase
technique using the secondary antibody avidin-biotin complex
and peroxidase substrate kit (kit 5001, Dako), according to the
manufacturer’s protocol. The sections were then treated with
Chromagen 30-30 diaminobenzidene tetrahydrochloride to iden-
tify sites of immunoprecipitation by light microscopy. Finally,
sections were washed, counterstained with hematoxylin, and
mounted under coverslips. No specific staining was observed
when the primary antibody was omitted from the protocol
(negative control). Specificity of the immunostaining was addi-
tionally controlled by simultaneous staining of breast cancer
samples with known ErbB2, cyclin D1, p53 and Ki67 expression
patterns. An experienced pathologist scored the staining intensity
at four levels (negative, weak, moderate and strong), considering
both color intensity and number of stained cells. In brief, the
proportion score represented the estimated percentage of positive-
stained tumor cells (0 = 0%; 1 = 1%; 2 = 1 to 10%; 3 = 10 to 33%;
Table 1. Clinicopathological characteristics of the patients.
Subjects (n) 30*
Sex
Male 27
Female 3
Age (years)
mean 72.2
range 44–86
Smoke{
NS 4
FS 8
S 18
Occupational exposure{
yes 19
no 11
Stage
Ta 1
T1 12
T1a 4
T1b 1
T2 2
T2a 1
T2b 5
T2+in situ 3
T3a 1
Grade (WHO 1973)
I 0
II 10
III 20
Grade (WHO/ISUP 2004)
Low 8
High 22
*30 TCCs and 30 adjacent normal tissue.{NS, non-smoker; FS, former smoker; S, smoker.{Exposure to chemicals, paints, pesticides, petroleum, ink, etc.doi:10.1371/journal.pone.0018255.t001
Multiple Pathway Analysis in Bladder Cancer
PLoS ONE | www.plosone.org 2 April 2011 | Volume 6 | Issue 4 | e18255

4 = 33 to 66%; 5$ 67%), and the intensity score represented the
depths of the tumor cell staining (1 = weakly positive; 2 = moder-
ately positive; 3 = strongly positive).
RNA purification and cDNA preparationWe isolated total RNA from crude tumor biopsy samples using
a power homogenizer and the TRIzolH reagent (Invitrogen,
Carlsbad, CA), as previously described [6,7]. We used 2 mg total
RNA as starting material for the cDNA preparation. We carried
out the first and second-strand cDNA synthesis using the
StrataScript First-Strand Synthesis System, as previously described
[8].
Microarray analysisOligos microarray chips (,57K genes) were obtained from GE
HealthCare (IL) and AppliedMicroarrays (MA) (CodeLink 57K
Human Whole Genome). Hybridization was performed with the
CodeLink RNA amplification and Labeling kit, utilizing the Cy5
fluorescent dye. Slides were scanned with a microarray scanner
(ScanArray 4000XL). Images were generated with ScanArray
microarray acquisition software (GSI Lumonics, USA). cRNAs
from three experimental setups were used in single experiments
with internal spikes as controls. The experimental setups consisted
of 10 urinary BC samples of different histologies (T1/2-grade 3,
T1-grade 1/2, T3-grade 3) and 5 control samples. The scanned
images were further processed with the CodeLink Expression
Analysis Software v5.0 from Amersham Biosciences. The
experimental setup was analyzed based on the reference design
as described previously [9,10,11]. All tumor samples were
compared against the mean value of the control samples.
Background correction was performed by subtracting the median
global background from the median local background from the
signal intensity. A threshold of 2 was set as cut-off, meaning that
spot intensity for at least one channel should be twice as much as
that of the background. Microarray data were normalized by
dividing spot intensities by the global median. Normalized data
were extracted, pre-processed and sorted with Microsoft ExcelH.
Array data are available at the Gene Expression Omnibus
(National Center for Biotechnology Information) with accession
numbers GSM678186 through GSM678385 (http://www.ncbi.
nlm.nih.gov/geo/query/acc.cgi?acc=GSE27448). Furthermore,
each gene was tested for its significance in differential expression
using a z-test. Genes were considered to be significantly
differentially expressed if they obtained a p-value ,0.05. The
False Discovery Rate was calculated as described previously
[12,13,14]. Genes were further classified using two-way (genes-
against samples) average-linkage hierarchical clustering with
Euclidian distance using the Genesis 1.7.2 software (Technische
Universitaet-Graz, Austria) [15].
Real-time PCR validationTranscribed products were subjected to real-time PCR assay
with SYBR Green I in an Mx3000P programmable thermal
controller apparatus (Stratagene, La Jolla, CA). The primer pairs
were designed to span at least one intron in order to avoid
amplification of the contaminating genomic DNA along with
cDNA. Their sequence and the corresponding PCR product sizes
are listed in Table S1. GAPDH and ACTB genes were used as
internal controls [16].
One microliter of cDNA from normal or TCC samples,
respectively, was amplified in a PCR reaction with 2x Brilliant
SYBRH Green QPCR Master Mix (containing 2.5 mM MgCl2),
300 nM of each primer and 30 mM Rox passive reference dye in a
final volume of 20 ml. After initial denaturation at 95uC for
10 min, samples were subjected to 40 amplification cycles
comprising denaturation at 95uC for 30 sec, annealing at 60uCfor 30 sec, and elongation at 72uC for 30 sec. Amplification and
elongation steps were followed by a melt curve analysis in which
the temperature was increased from 55uC to 95uC at a linear rate
of 0.2uC/sec. Data collection was performed during both
annealing and extension, with two measurements at each step
and at all times during melt curve analysis. To verify the results of
the melt curve analysis, qPCR products were analyzed by
electrophoresis on 2% agarose gel, stained with ethidium bromide
and photographed on a UV light transilluminator (Figure S1). In
each qPCR reaction two negative controls were included, one with
no cDNA template and one with no reverse transcription
treatment. All samples were treated in duplicate. Gene transcrip-
tion levels were calculated using the DDCt method, as previously
described [17,18].
Total protein extraction and Western blot analysisAfter addition of 250 ml ice-cold GST-Fish lysis buffer (10%
glycerol, 50 mM Tris (pH 7.4), 100 mM NaCl, 1% (v/v) Nonidet
P-40, 2 mM MgCl2, and a protease inhibitor cocktail (Roche
Diagnostics GmbH, Germany), the homogenized tissue samples
were centrifuged at 14,000 x g for 15 min at 4uC, to remove
insoluble material, and the supernatant was collected and stored at
280uC. Protein concentration of each sample was determined by
the method of Bradford using a protein assay dye reagent (Bio-
Rad, Hercules, CA). Samples were dissolved in LDS sample buffer
(Invitrogen) and heated at 70uC for 7 min. Equal amounts of the
samples (20–30 mg) were electrophoresed in NuPAGE 4–12% Bis-
Tris gel (Invitrogen) and transferred to a 0.45- mm nitrocellulose
membrane (Bio-Rad Laboratories, Inc.). The membrane was
immersed in 5% nonfat milk or BSA, 0.1% Tween 20 and
dissolved in Tris-buffered saline to block the nonspecific binding.
The membranes were incubated overnight at 4uC with the
following primary antibodies: mouse polyclonal anti-HRAS
(diluted 1:1,000; Abnova, CA), mouse monoclonal anti-CDKN2A
(diluted 1:500; Abnova, CA), mouse monoclonal anti-p53 (diluted
1:500; clone DO-7; BD Transduction Laboratories), mouse
monoclonal anti-VEGFA (diluted 1:500; Santa Cruz Biotechnol-
ogy, CA), rabbit polyclonal anti-TGFb1 (diluted 1:1000; Novus
Biologicals, CO) and mouse monoclonal anti-OPN (diluted 1:500;
Santa Cruz Biotechnology, CA). The membranes were then
washed and incubated for 90 min. at RT with a secondary
antibody that included horseradish peroxidase-conjugated goat
anti-rabbit or anti-mouse IgG (diluted 1:1,500; Santa Cruz
Biotechnology). Western blots were normalized using a monoclo-
nal anti-b-actin antibody (diluted 1:5,000; Sigma Chemicals, St.
Louis, MO). The specific signals were visualized by ECL reagent
(GE Healthcare Bio-Sciences, Piscataway, NJ) after exposition to
ECL film. The relative density of the polypeptide bands detected
on the ECL film was determined using the spot denso tool of the
AlphaEaseFC software.
GEO Dataset computational analysisComputational analysis was performed to further investigate the
differences in the OPN, VEGFA, TGFb1, FGF2, EGFR, EGF,
p14ARF, p16INK4A, p53, KRAS, HRAS, NRAS, ARAF, BRAF,
RAF1, RKIP, MMP2, MMP9, TIMP1, TIMP2 and CyclinD1
transcript levels among different urinary bladder cancer types, its
metastatic counterpart and the relative normal tissue. Four
publicly available Gene Expression Omnibus (GEO) datasets were
analyzed for this reason, with GEO series accession numbers
GSE89, GSE7476, GSE3167 and GSE12630 [19,20,21]. Expres-
sion patterns of the genes were extracted from the normalized
Multiple Pathway Analysis in Bladder Cancer
PLoS ONE | www.plosone.org 3 April 2011 | Volume 6 | Issue 4 | e18255

datasets and were expressed as mean levels of the log2 intensity
(Table S2).
Gene ontology (GO) and Kyoto Encyclopedia of Genesand Genomes (KEGG) analysis
Gene ontology (GO) and Kyoto Encyclopedia of Genes and
Genomes (KEGG) molecular pathway analysis were performed to
identify possible enrichment of genes with specific biological
themes (http://www.genome.jp/kegg/pathway.html).
Statistical analysisMicroarray data were normalized by the global median of the
spot intensities. Each gene was tested for its significance in
differential expression using a z-test. GOI expression levels were
first evaluated by the one-sample Kolmogorov-Smirnov Goodness-
of-Fit test, in order to determine whether they followed a normal
distribution pattern. The non-parametric Spearman rank correla-
tion was used to examine pair-wise correlations between the mRNA
levels and their association with continuous variables (age, smoking,
tumor stage/grade). The Mann-Whitney U test was used to
examine the expression status of the genes with the various
clinicopathological parameters after stratification. The Kaplan-
Meier method was used to estimate overall survival as a function of
time. Survival differences were assessed by Log-rank (Mantel Cox)
and Gehan-Breslow-Wilcoxon tests. Numerical values are expressed
as the mean6standard deviation (SD), and medians. Data extracted
from the GEO databases were statistically compared by the Mann-
Whitney U test. Statistical significance was set at the 95% level
(p,0.05). All statistical analyses were performed with SPSS 11.5
(SPSS, Chicago, IL).
Results
Immunohistochemical resultsTumor samples were stained with antibodies for ErbB2, cyclin
D1, p53 and Ki-67 (Figure 1). If present, anti-ErbB2 staining in
tumor samples is a membrane staining, diffuse in the urothelium.
All BC samples (100%) showed moderate/strong (++, +++)
immunostaining, whereas no BC sample showed no/weak
immunostaining (0, +) for ErbB2. Thresholds for high labeling
indices were set for Ki-67 at $10% positive tumor nuclei and for
p53 at 10 and 20%. T1-grade 1/2 tumors showed weak staining
for anti-Ki-67 (7.5% and 40%, respectively), whereas T1/2-grade
3 tumors exhibited the strongest immunostaining (+++, .70%).
Similarly, T1-grade 1/2 tumors showed weak staining for anti-p53
(10% and 35%, respectively), whereas T1/2-grade 3 tumors
exhibited the strongest immunostaining (53–70%). Regarding
Cyclin D1, all tumors showed intense staining for anti-Cyclin D1,
whereas those of a higher grade exhibited comparatively lower
immunostaining. For T1-grade 1/2 tumors, staining for anti-
Figure 1. Representative immunohistochemical analysis for tumors of T1/grade 2, T1/grade 3, T2/grade 3. Tumors were stained withanti-cerbB2, anti-Ki67, anti-p53 and anti-Cyclin D1. H&E, Representative hematoxylin-eosin slides.doi:10.1371/journal.pone.0018255.g001
Multiple Pathway Analysis in Bladder Cancer
PLoS ONE | www.plosone.org 4 April 2011 | Volume 6 | Issue 4 | e18255

Cyclin D1 was 80%; whereas for T1/2-grade 3 tumors
immunostaining was 50%.
Microarray expression and clustering on a 22-gene setWe previously identified 831 genes that were differentially
expressed in all 10 BC samples, simultaneously. Of these, 33 genes
were up-regulated and 85 genes were down-regulated in all
bladder cancer samples compared to the 5 normal tissues,
simultaneously (data not shown). In the present study, we
performed two-way average-linkage hierarchical clustering with
Euclidian distance for a 22-gene set that included the following
genes: VEGFA, ARAF, BRAF, OPN (SPP1), MMP2, KRAS,
NRAS, TGFb1, AKT1, HRAS, TIMP1, EGF, RKIP (PBP),
FGF2, EGFR, RAF1, CDKN2D, TP53, CDKN2A (p14ARF/
p16INK4A), MMP9 and MKI67, in 10 BC samples vs. 5 controls. A
detailed view of the sample cluster dendrogram is displayed in
Figure 2A. We analyzed the log2 transformed fold expression
pattern of the GOI and partitioned the tumors into 3 main groups
based on the differential expression of these 22 genes: The first
principle branch contained T1-grade 3, T2-grade 3, T1-grade 2
and T3-grade 3 tumors. The second branch consisted of T1-grade
2 and T2-grade 3 tumors. The third branch consisted of tumors
with in situ carcinoma, T2-grade 3 (CIS). The 22-gene set was
divided into two main clusters. The first cluster was composed of
genes that were over-expressed (VEGFA, ARAF, BRAF, OPN,
MMP2, KRAS, NRAS, TGFb1, AKT1, HRAS and TIMP1) and
Figure 2. Two-way average-linkage hierarchical clustering with Euclidian distance for the genes of interest (GOIs) in 10 TCCsamples vs. 5 controls. Each row in the diagram represents a gene and each column a tumor sample. The color saturation represents differences ingene expression across the tumor samples; red indicates expression higher than the median (black), and green indicates expression lower than themedian. The color intensity indicates degree of gene regulation (A). Fold expression of the GOIs with respect to tumor histology, as detected bymicroarray analysis (B).doi:10.1371/journal.pone.0018255.g002
Figure 3. The Scatter Plot graphs the expression level (2‘-DCt) of each gene in BC samples versus the control samples. The black lineindicates fold changes of 1. The pink lines indicate the threshold in gene expression fold-change (2-fold difference). qPCR revealed up- and down-regulated genes in urinary bladder cancer. Total RNA from the normal adjacent tissue and urinary bladder cancer were characterized in technicaltriplicates, and the relative expression levels for each gene in the two tissue types were plotted against each other in the Scatter Plot. VEGFA, OPN,p14INK4A, p6CDKN2A, NRAS and TGFb1 were up-regulated, while FGF2 and EGF were down-regulated by at least two-fold (outside the purple lines). Thegenes KRAS, MMP2, AKT1, p53, EGFR, MMP9 and HRAS exhibited equal expression between bladder cancer and normal tissue (A). The Volcano Plotgraphs the log2 of the fold change in expression of each gene between the BC samples versus its p-value from the t-test. The black line indicates foldchanges of 1. The pink lines indicate the threshold in gene expression fold-change (2-fold difference). The blue line indicates the threshold for the p-value of the t-test (0.01) (B).doi:10.1371/journal.pone.0018255.g003
Multiple Pathway Analysis in Bladder Cancer
PLoS ONE | www.plosone.org 5 April 2011 | Volume 6 | Issue 4 | e18255
the second cluster contained genes that were equally or under-
expressed (EGF, RKIP/PBP, FGF2, EGFR, RAF1, CDKN2D,
TP53, CDKN2A, MMP9 and MKI67) in TCC vs. normal tissue.
The relative expression levels of the GOIs in each tumor group
were expressed as a ratio of the normalized expression levels from
the tumor group to the mean levels of the normal tissues, which
was set to 1.0 (Figure 2B and Table S2).
The fold expression (mean6SD) of the GOIs in each one of the
three tumor groups compared to the normal tissue, as acquired by
our microarray analysis, is depicted in (Figure S2).
Verification of mRNA and protein expression relative toclinicopathological characteristics
The mRNA expression of the genes: VEGFA, ARAF, BRAF,
OPN (SPP1), MMP2, KRAS, NRAS, TGFb1, AKT1, HRAS,
EGF, RKIP (PBP), FGF2, EGFR, RAF1, TP53, CDKN2A
(p14ARF/p16INK4A), MMP9 was determined by qPCR in both
bladder cancer and normal tissue (Table S3). Scatter plots were
constructed for better visualization of the genes that were up-
regulated (.2-fold), down-regulated (,2-fold) or equally expressed
(2-fold difference threshold) between BC and controls. Volcano
plots graphing the log2 of the fold change in the expression of each
gene between BC samples vs. its p-value from the t-test, were also
constructed (Figure 3).
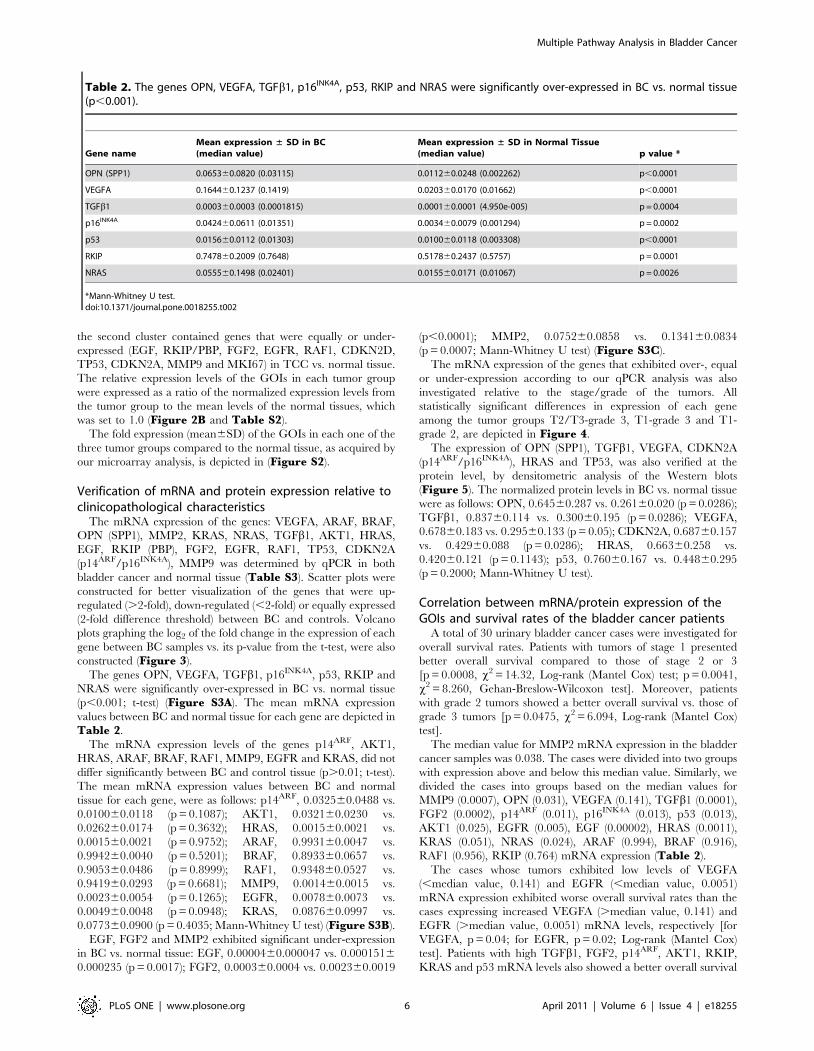
The genes OPN, VEGFA, TGFb1, p16INK4A, p53, RKIP and
NRAS were significantly over-expressed in BC vs. normal tissue
(p,0.001; t-test) (Figure S3A). The mean mRNA expression
values between BC and normal tissue for each gene are depicted in
Table 2.
The mRNA expression levels of the genes p14ARF, AKT1,
HRAS, ARAF, BRAF, RAF1, MMP9, EGFR and KRAS, did not
differ significantly between BC and control tissue (p.0.01; t-test).
The mean mRNA expression values between BC and normal
tissue for each gene, were as follows: p14ARF, 0.032560.0488 vs.
0.010060.0118 (p = 0.1087); AKT1, 0.032160.0230 vs.
0.026260.0174 (p = 0.3632); HRAS, 0.001560.0021 vs.
0.001560.0021 (p = 0.9752); ARAF, 0.993160.0047 vs.
0.994260.0040 (p = 0.5201); BRAF, 0.893360.0657 vs.
0.905360.0486 (p = 0.8999); RAF1, 0.934860.0527 vs.
0.941960.0293 (p = 0.6681); MMP9, 0.001460.0015 vs.
0.002360.0054 (p = 0.1265); EGFR, 0.007860.0073 vs.
0.004960.0048 (p = 0.0948); KRAS, 0.087660.0997 vs.
0.077360.0900 (p = 0.4035; Mann-Whitney U test) (Figure S3B).
EGF, FGF2 and MMP2 exhibited significant under-expression
in BC vs. normal tissue: EGF, 0.0000460.000047 vs. 0.0001516
0.000235 (p = 0.0017); FGF2, 0.000360.0004 vs. 0.002360.0019
(p,0.0001); MMP2, 0.075260.0858 vs. 0.134160.0834
(p = 0.0007; Mann-Whitney U test) (Figure S3C).
The mRNA expression of the genes that exhibited over-, equal
or under-expression according to our qPCR analysis was also
investigated relative to the stage/grade of the tumors. All
statistically significant differences in expression of each gene
among the tumor groups T2/T3-grade 3, T1-grade 3 and T1-
grade 2, are depicted in Figure 4.
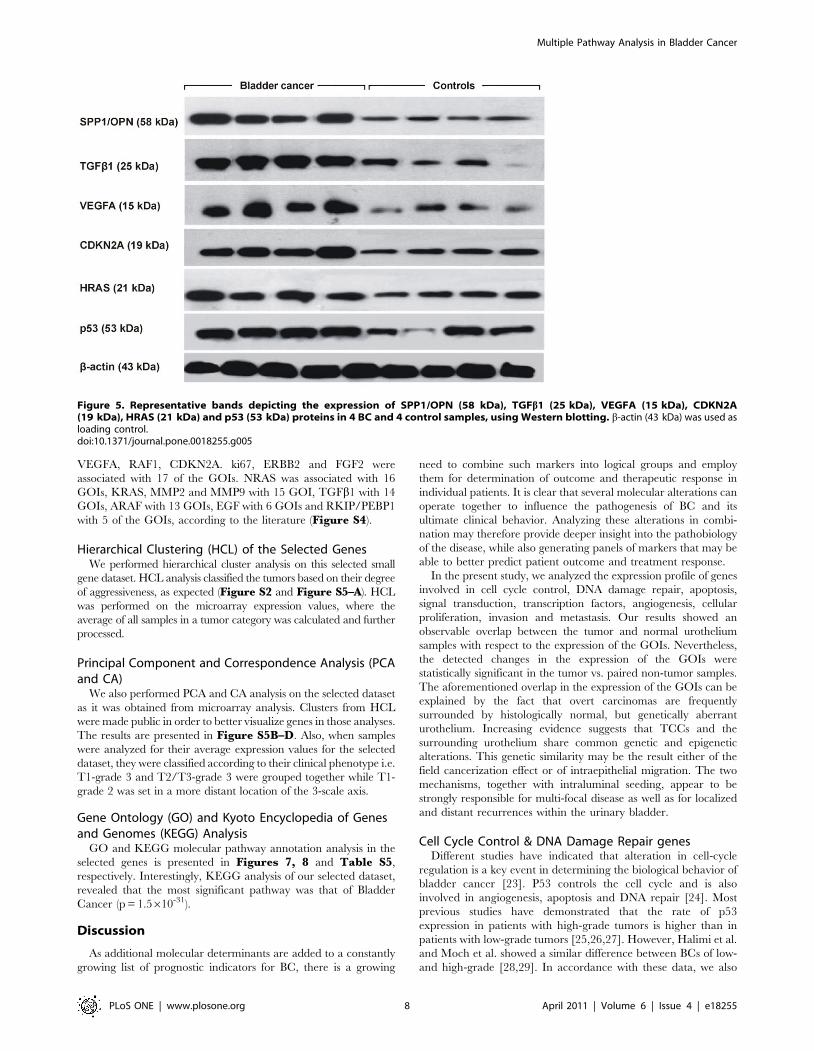
The expression of OPN (SPP1), TGFb1, VEGFA, CDKN2A
(p14ARF/p16INK4A), HRAS and TP53, was also verified at the
protein level, by densitometric analysis of the Western blots
(Figure 5). The normalized protein levels in BC vs. normal tissue
were as follows: OPN, 0.64560.287 vs. 0.26160.020 (p = 0.0286);
TGFb1, 0.83760.114 vs. 0.30060.195 (p = 0.0286); VEGFA,
0.67860.183 vs. 0.29560.133 (p = 0.05); CDKN2A, 0.68760.157
vs. 0.42960.088 (p = 0.0286); HRAS, 0.66360.258 vs.
0.42060.121 (p = 0.1143); p53, 0.76060.167 vs. 0.44860.295
(p = 0.2000; Mann-Whitney U test).
Correlation between mRNA/protein expression of theGOIs and survival rates of the bladder cancer patients
A total of 30 urinary bladder cancer cases were investigated for
overall survival rates. Patients with tumors of stage 1 presented
better overall survival compared to those of stage 2 or 3
[p = 0.0008, x2 = 14.32, Log-rank (Mantel Cox) test; p = 0.0041,
x2 = 8.260, Gehan-Breslow-Wilcoxon test]. Moreover, patients
with grade 2 tumors showed a better overall survival vs. those of
grade 3 tumors [p = 0.0475, x2 = 6.094, Log-rank (Mantel Cox)
test].
The median value for MMP2 mRNA expression in the bladder
cancer samples was 0.038. The cases were divided into two groups
with expression above and below this median value. Similarly, we
divided the cases into groups based on the median values for
MMP9 (0.0007), OPN (0.031), VEGFA (0.141), TGFb1 (0.0001),
FGF2 (0.0002), p14ARF (0.011), p16INK4A (0.013), p53 (0.013),
AKT1 (0.025), EGFR (0.005), EGF (0.00002), HRAS (0.0011),
KRAS (0.051), NRAS (0.024), ARAF (0.994), BRAF (0.916),
RAF1 (0.956), RKIP (0.764) mRNA expression (Table 2).
The cases whose tumors exhibited low levels of VEGFA
(,median value, 0.141) and EGFR (,median value, 0.0051)
mRNA expression exhibited worse overall survival rates than the
cases expressing increased VEGFA (.median value, 0.141) and
EGFR (.median value, 0.0051) mRNA levels, respectively [for
VEGFA, p = 0.04; for EGFR, p = 0.02; Log-rank (Mantel Cox)
test]. Patients with high TGFb1, FGF2, p14ARF, AKT1, RKIP,
KRAS and p53 mRNA levels also showed a better overall survival
Table 2. The genes OPN, VEGFA, TGFb1, p16INK4A, p53, RKIP and NRAS were significantly over-expressed in BC vs. normal tissue(p,0.001).
Gene nameMean expression ± SD in BC(median value)
Mean expression ± SD in Normal Tissue(median value) p value *
OPN (SPP1) 0.065360.0820 (0.03115) 0.011260.0248 (0.002262) p,0.0001
VEGFA 0.164460.1237 (0.1419) 0.020360.0170 (0.01662) p,0.0001
TGFb1 0.000360.0003 (0.0001815) 0.000160.0001 (4.950e-005) p = 0.0004
p16INK4A 0.042460.0611 (0.01351) 0.003460.0079 (0.001294) p = 0.0002
p53 0.015660.0112 (0.01303) 0.010060.0118 (0.003308) p,0.0001
RKIP 0.747860.2009 (0.7648) 0.517860.2437 (0.5757) p = 0.0001
NRAS 0.055560.1498 (0.02401) 0.015560.0171 (0.01067) p = 0.0026
*Mann-Whitney U test.doi:10.1371/journal.pone.0018255.t002
Multiple Pathway Analysis in Bladder Cancer
PLoS ONE | www.plosone.org 6 April 2011 | Volume 6 | Issue 4 | e18255

pattern, however the correlation was not statistically significant.
Kaplan-Meier curves for all the GOIs are depicted in Figure 6.
Comparison of GEO DatasetsWe further compared our qPCR results to 4 publicly available
BC microarray GEO datasets: GSE89 by Dyrskjot et al. (2003)
[19]; GSE7476 by Mengual et al. (2009) [21]; GSE3167 by
Dyrskjot et al. (2004) [20] and GSE12630 by Monzon et al. (2009)
[22]. All mean log2 transformed ratios of BC samples vs. controls
are depicted in Table S2.
Dataset GSE12630 contained data only from transitional cell
carcinoma of urinary bladder and metastatic urothelial carcinoma.
Since no data from the normal tissue were available for this
dataset, we extracted normal tissue data from dataset GSE89, and
computed the mean log2 transformed ratios of BC vs. these
extracted data, which we used as controls (Table S2).
Correlation analysisWe explored the correlation of the mRNA levels of the GOIs
in BC as well as in normal tissue, performing the Spearman rank
test (Table S4). In BC, MMP2 was significantly correlated
with BRAF (p = 0.032), RAF1 (p = 0.039) and RKIP (p = 0.014).
MMP9 correlated with VEGFA (p = 0.005) and FGF2 (p = 0.016).
OPN correlated with NRAS (p = 0.027). VEGFA correlated with
FGF2 (p = 0.019). TGFb1 correlated with p53 (p = 0.033), EGFR
(p = 0.048) and RKIP (p = 0.032). FGF2 correlated with EGFR
(p = 0.015), HRAS (p = 0.005) and KRAS (p = 0.029). p14ARF
correlated with p16INK4A (p,0.0001), KRAS (p = 0.016), NRAS
(p = 0.009) and ARAF (p = 0.044). p16INK4A correlated with EGF
(p = 0.017) and NRAS (p = 0.002). p53 correlated with AKT1
(p,0.0001), EGFR (p = 0.002) and RAF1 (p = 0.041). AKT1
correlated with EGFR (p,0.0001) and RKIP (p = 0.022). EGF
correlated with NRAS (p = 0.027). HRAS correlated with NRAS
(p = 0.007) and ARAF (p = 0.030). KRAS correlated with RKIP
(p = 0.035). NRAS correlated with ARAF (p = 0.003) and BRAF
(p = 0.004). ARAF correlated with BRAF (p = 0.001) and RAF1
(p = 0.001). BRAF correlated with RAF1 (p = 0.040). All positive
and negative interactions among the genes, indicating their
synergism in bladder tumorigenesis, can be deduced from the
correlation coefficient values depicted in Table S4.
Moreover, we used the BioNetwork Tools from www.pubgene.
org, in order to investigate the relationships between the GOIs.
HRAS confirmed its role as a key molecule, since it presented
interaction with the majority of the GOIs (nineteen interactions).
OPN, TP53, BRAF and EGFR exhibited the second highest
number of significant interactions (18 of the GOIs), whereas
Figure 4. Scatterplot depicting the mRNA levels of the genes that were over-expressed in various urinary bladder cancers ofdifferent stage/grade, versus normal tissue. Groups pairs were statistically compared using the Mann-Whitney U test. Bars depict the medianvalues (A). Scatterplot depicting the mRNA levels of the genes that were equally expressed among urinary bladder cancers of various stage/grade,and normal tissue. Groups pairs were statistically compared using the Mann-Whitney U test. Bars depict the median values (B). Scatterplot depictingthe mRNA levels of the genes that were under-expressed in various urinary bladder cancers of different stage/grade, versus normal tissue. Group pairswere statistically compared using the Mann-Whitney U test. Bars depict the median values (C).doi:10.1371/journal.pone.0018255.g004
Multiple Pathway Analysis in Bladder Cancer
PLoS ONE | www.plosone.org 7 April 2011 | Volume 6 | Issue 4 | e18255
VEGFA, RAF1, CDKN2A. ki67, ERBB2 and FGF2 were
associated with 17 of the GOIs. NRAS was associated with 16
GOIs, KRAS, MMP2 and MMP9 with 15 GOI, TGFb1 with 14
GOIs, ARAF with 13 GOIs, EGF with 6 GOIs and RKIP/PEBP1
with 5 of the GOIs, according to the literature (Figure S4).
Hierarchical Clustering (HCL) of the Selected GenesWe performed hierarchical cluster analysis on this selected small
gene dataset. HCL analysis classified the tumors based on their degree
of aggressiveness, as expected (Figure S2 and Figure S5–A). HCL
was performed on the microarray expression values, where the
average of all samples in a tumor category was calculated and further
processed.
Principal Component and Correspondence Analysis (PCAand CA)
We also performed PCA and CA analysis on the selected dataset
as it was obtained from microarray analysis. Clusters from HCL
were made public in order to better visualize genes in those analyses.
The results are presented in Figure S5B–D. Also, when samples
were analyzed for their average expression values for the selected
dataset, they were classified according to their clinical phenotype i.e.
T1-grade 3 and T2/T3-grade 3 were grouped together while T1-
grade 2 was set in a more distant location of the 3-scale axis.
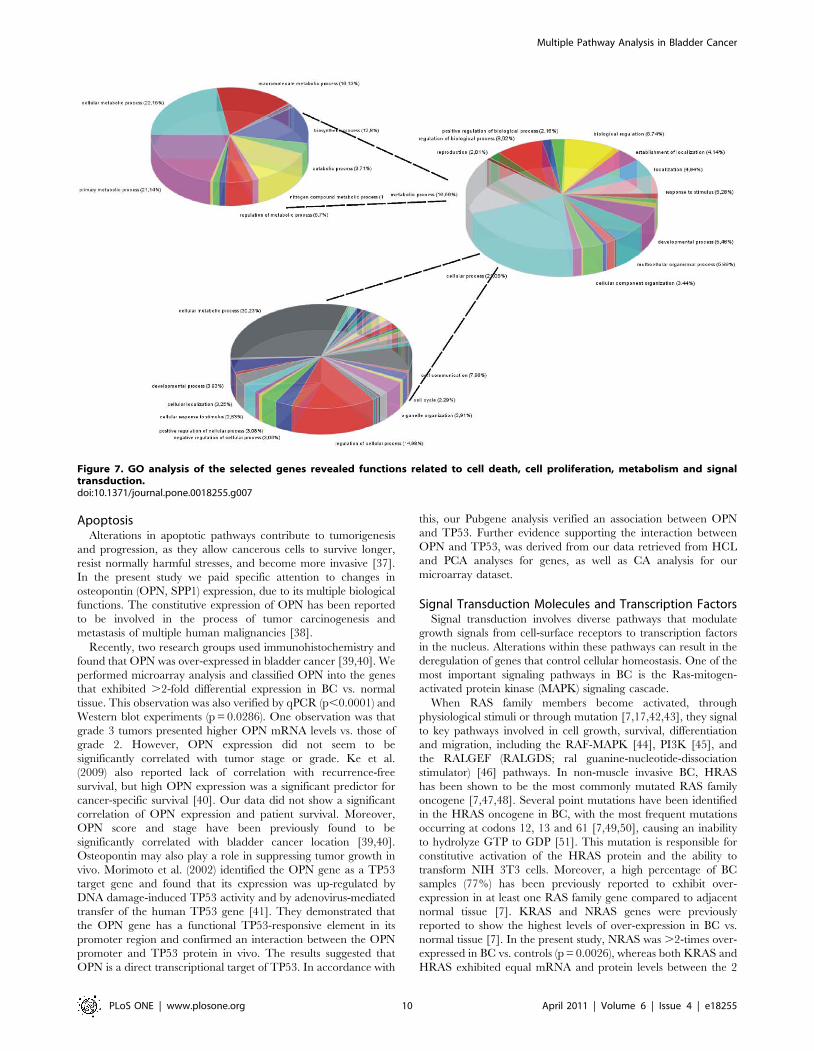
Gene Ontology (GO) and Kyoto Encyclopedia of Genesand Genomes (KEGG) Analysis
GO and KEGG molecular pathway annotation analysis in the
selected genes is presented in Figures 7, 8 and Table S5,
respectively. Interestingly, KEGG analysis of our selected dataset,
revealed that the most significant pathway was that of Bladder
Cancer (p = 1.5610-31).
Discussion
As additional molecular determinants are added to a constantly
growing list of prognostic indicators for BC, there is a growing
need to combine such markers into logical groups and employ
them for determination of outcome and therapeutic response in
individual patients. It is clear that several molecular alterations can
operate together to influence the pathogenesis of BC and its
ultimate clinical behavior. Analyzing these alterations in combi-
nation may therefore provide deeper insight into the pathobiology
of the disease, while also generating panels of markers that may be
able to better predict patient outcome and treatment response.
In the present study, we analyzed the expression profile of genes
involved in cell cycle control, DNA damage repair, apoptosis,
signal transduction, transcription factors, angiogenesis, cellular
proliferation, invasion and metastasis. Our results showed an
observable overlap between the tumor and normal urothelium
samples with respect to the expression of the GOIs. Nevertheless,
the detected changes in the expression of the GOIs were
statistically significant in the tumor vs. paired non-tumor samples.
The aforementioned overlap in the expression of the GOIs can be
explained by the fact that overt carcinomas are frequently
surrounded by histologically normal, but genetically aberrant
urothelium. Increasing evidence suggests that TCCs and the
surrounding urothelium share common genetic and epigenetic
alterations. This genetic similarity may be the result either of the
field cancerization effect or of intraepithelial migration. The two
mechanisms, together with intraluminal seeding, appear to be
strongly responsible for multi-focal disease as well as for localized
and distant recurrences within the urinary bladder.
Cell Cycle Control & DNA Damage Repair genesDifferent studies have indicated that alteration in cell-cycle
regulation is a key event in determining the biological behavior of
bladder cancer [23]. P53 controls the cell cycle and is also
involved in angiogenesis, apoptosis and DNA repair [24]. Most
previous studies have demonstrated that the rate of p53
expression in patients with high-grade tumors is higher than in
patients with low-grade tumors [25,26,27]. However, Halimi et al.
and Moch et al. showed a similar difference between BCs of low-
and high-grade [28,29]. In accordance with these data, we also
Figure 5. Representative bands depicting the expression of SPP1/OPN (58 kDa), TGFb1 (25 kDa), VEGFA (15 kDa), CDKN2A(19 kDa), HRAS (21 kDa) and p53 (53 kDa) proteins in 4 BC and 4 control samples, using Western blotting. b-actin (43 kDa) was used asloading control.doi:10.1371/journal.pone.0018255.g005
Multiple Pathway Analysis in Bladder Cancer
PLoS ONE | www.plosone.org 8 April 2011 | Volume 6 | Issue 4 | e18255

detected higher p53 mRNA and protein levels by qPCR and
Western blotting in BC vs. normal tissue (p,0.0001). However,
qPCR did not reveal differences between high and low-grade
tumors. The fold differential expression rate also did not differ
significantly among tumors of low or high grade, as acquired by
our microarray analysis. Immunohistochemistry on the other
hand, showed higher p53 staining for grade 3 tumors vs. those of
grade 2.
The most common genetic damage in BC is partial loss of
chromosome 9. The area surrounding 9p21 where the CDKN2A/
ARF gene is located is one of the major sites for deletion. p16INK4a
over-expression has been previously detected in urothelial
carcinomas [30,31,32,33]. Moreover, the expression of p16INK4A
has been statistically associated with disease stage but not with
either tumor grade or disease progression [31]. p16INK4A
expression has also been related to recurrence and survival [34].
In the present study, the mRNA levels of p16INK4A were higher in
BC vs. normal tissue, as assessed by qPCR. Western blot analysis
verified the higher protein expression for CDKN2A in BC vs.
normal tissue. Tumors of T2/T3-grade 3 exhibited higher
p16INK4A mRNA levels vs. those of lower stage/grade. Finally,
we could not relate p16INK4A expression to survival, probably due
to the small sample number. p14ARF did not show any significant
differences between BC and normal tissue, or among tumors of
different histology. In contrast, high p14ARF expression showed a
tendency to correlate with favorable prognosis.
Cyclin D1 plays an important role in the cell cycle, binds to
cyclin-dependent kinases (CDK4/6), and promotes phosphoryla-
tion of RB1, orchestrating progression through the G1 restriction
point. Recently, Del Rey et al. found that CCND1 amplification in
homogeneously staining regions was present in 6 out of 14 CIN-
positive tumors; 3 of them also showed amplification of this gene in
double minutes [35]. Moreover, Levidou et al. used IHC and
showed that Cyclin D1 expression decreased with increasing
grade, tumor T-category and in muscle-invasive carcinomas [36].
In the present study, we also performed IHC in order to
investigate the expression pattern of Cyclin D1 in BC. Our data
showed intense staining for anti-Cyclin D1 in all tumors,
corroborating that the gene CCND1 is frequently amplified in
bladder cancer. Notably, in accordance with the results of Levidou
et al. [36], our data found that T1-grade 1/2 tumors exhibited
more intense immunostaining compared to T1/2-grade 3 tumors,
suggesting that Cyclin D1 over-expression is more important
during early stages of bladder carcinogenesis.
Figure 6. Kaplan-Meier curves depicting overall survival (%) of the urinary bladder cancer patients, regarding the mRNAexpression of the GOIs. The cases whose tumors exhibited low levels of VEGFA (,median value, 0.141) and EGFR (,median value, 0.0051) mRNAexpression, exhibited worse overall survival rates, than the cases expressing increased VEGFA (.median value, 0.141) and EGFR (.median value,0.0051) mRNA levels [for VEGFA, p = 0.04; for EGFR, p = 0.02; Log-rank (Mantel Cox) test]. Differences in survival were assessed using Log-rank (MantelCox) test. Statistical significance was set at the 95% level (p,0.05).doi:10.1371/journal.pone.0018255.g006
Multiple Pathway Analysis in Bladder Cancer
PLoS ONE | www.plosone.org 9 April 2011 | Volume 6 | Issue 4 | e18255
ApoptosisAlterations in apoptotic pathways contribute to tumorigenesis
and progression, as they allow cancerous cells to survive longer,
resist normally harmful stresses, and become more invasive [37].
In the present study we paid specific attention to changes in
osteopontin (OPN, SPP1) expression, due to its multiple biological
functions. The constitutive expression of OPN has been reported
to be involved in the process of tumor carcinogenesis and
metastasis of multiple human malignancies [38].
Recently, two research groups used immunohistochemistry and
found that OPN was over-expressed in bladder cancer [39,40]. We
performed microarray analysis and classified OPN into the genes
that exhibited .2-fold differential expression in BC vs. normal
tissue. This observation was also verified by qPCR (p,0.0001) and
Western blot experiments (p = 0.0286). One observation was that
grade 3 tumors presented higher OPN mRNA levels vs. those of
grade 2. However, OPN expression did not seem to be
significantly correlated with tumor stage or grade. Ke et al.
(2009) also reported lack of correlation with recurrence-free
survival, but high OPN expression was a significant predictor for
cancer-specific survival [40]. Our data did not show a significant
correlation of OPN expression and patient survival. Moreover,
OPN score and stage have been previously found to be
significantly correlated with bladder cancer location [39,40].
Osteopontin may also play a role in suppressing tumor growth in
vivo. Morimoto et al. (2002) identified the OPN gene as a TP53
target gene and found that its expression was up-regulated by
DNA damage-induced TP53 activity and by adenovirus-mediated
transfer of the human TP53 gene [41]. They demonstrated that
the OPN gene has a functional TP53-responsive element in its
promoter region and confirmed an interaction between the OPN
promoter and TP53 protein in vivo. The results suggested that
OPN is a direct transcriptional target of TP53. In accordance with
this, our Pubgene analysis verified an association between OPN
and TP53. Further evidence supporting the interaction between
OPN and TP53, was derived from our data retrieved from HCL
and PCA analyses for genes, as well as CA analysis for our
microarray dataset.
Signal Transduction Molecules and Transcription FactorsSignal transduction involves diverse pathways that modulate
growth signals from cell-surface receptors to transcription factors
in the nucleus. Alterations within these pathways can result in the
deregulation of genes that control cellular homeostasis. One of the
most important signaling pathways in BC is the Ras-mitogen-
activated protein kinase (MAPK) signaling cascade.
When RAS family members become activated, through
physiological stimuli or through mutation [7,17,42,43], they signal
to key pathways involved in cell growth, survival, differentiation
and migration, including the RAF-MAPK [44], PI3K [45], and
the RALGEF (RALGDS; ral guanine-nucleotide-dissociation
stimulator) [46] pathways. In non-muscle invasive BC, HRAS
has been shown to be the most commonly mutated RAS family
oncogene [7,47,48]. Several point mutations have been identified
in the HRAS oncogene in BC, with the most frequent mutations
occurring at codons 12, 13 and 61 [7,49,50], causing an inability
to hydrolyze GTP to GDP [51]. This mutation is responsible for
constitutive activation of the HRAS protein and the ability to
transform NIH 3T3 cells. Moreover, a high percentage of BC
samples (77%) has been previously reported to exhibit over-
expression in at least one RAS family gene compared to adjacent
normal tissue [7]. KRAS and NRAS genes were previously
reported to show the highest levels of over-expression in BC vs.
normal tissue [7]. In the present study, NRAS was .2-times over-
expressed in BC vs. controls (p = 0.0026), whereas both KRAS and
HRAS exhibited equal mRNA and protein levels between the 2
Figure 7. GO analysis of the selected genes revealed functions related to cell death, cell proliferation, metabolism and signaltransduction.doi:10.1371/journal.pone.0018255.g007
Multiple Pathway Analysis in Bladder Cancer
PLoS ONE | www.plosone.org 10 April 2011 | Volume 6 | Issue 4 | e18255

tissues. Finally, RAS expression levels did not correlate with
patient survival.
Another oncogene implicated in BC is the epidermal growth
factor receptor (EGFR). It’s over-expression has been described
in several tumors including bladder [52,53]. Pathological
expression of EGFR leads to uncontrolled cell proliferation. It
also results in increased angiogenesis and reduced apoptosis,
processes necessary for continued malignant growth. Preclinical
studies in bladder cancer cell lines confirm that EGFR inhibitors
can inhibit the growth of urothelial cancer cells in vitro [54]. In
addition, there is a correlation between high EGFR expression
and adverse clinical and pathologic characteristics including poor
outcome, advanced stage and high grade [55]. In bladder cancer,
the over-expression of EGFR has been widely reported
[55,56,57,58,59] and several studies have shown EGFR positivity
to be associated with high tumor stage, tumor progression, and
poor clinical outcome [55,57]. In accordance with this, our data
showed moderate immunostaining for T1-grade 3 and strong
immunostaining for T2-grade 3 tumors, whereas no BC sample
showed no/weak immunostaining. Furthermore, our qPCR
analysis revealed a significant difference in the expression of
EGFR, only between T2/T3-grade 3 and normal tissue
(p = 0.0166). Low EGFR mRNA levels were associated with
poor prognosis (p = 0.0296), contrasting previous reports [60].
AKT1 is one of three family members of the serine-threonine
kinases that are activated by phosphorylation of Thr308 by
PDK1 and Ser473 by TORC2 [61,62]. AKT occupies a key
regulatory node in the PI3K pathway, below which the pathway
branches significantly to influence a wide range of cellular
processes that promote cell cycle progression, cell growth,
energy metabolism and resistance to apoptosis. Apart from
mutations activating AKT1 in several cancers, including bladder
[63,64], there are limited data regarding its expression in
urinary bladder cancer. In the present study, AKT1 showed .2-
fold expression in BC using microarrays, however, this was not
verified by qPCR, where we detected equal mRNA levels
between BC and normal tissue. Moreover we did not detect a
significant change between tumors of low vs. high grade. Also,
AKT1 mRNA expression levels did not correlate with patient
overall survival.
The RAF (ARAF, BRAF and RAF1) and MEK (MEK1/
MAP2K1 and MEK2/MAP2K2) family of proteins are critical
downstream mediators of the RAS and other oncogenic signaling
pathways [8,65,66,67]. The RAF family of proteins are respon-
sible for phosphorylating MEK, which results in its activation
[68]. Involvement of BRAF mutations in the development of
transitional cell carcinoma of the bladder has been reported to be
rather infrequent [67]. RKIP, also known as phosphatidyletha-
Figure 8. Further resolution of GO functions showed that the majority of genes (,30%) are related to metabolism. However, despitethe small size of the dataset that we used, it appeared that those selected genes participate significantly in a variety of cellular functions.doi:10.1371/journal.pone.0018255.g008
Multiple Pathway Analysis in Bladder Cancer
PLoS ONE | www.plosone.org 11 April 2011 | Volume 6 | Issue 4 | e18255

nolamine-binding protein 1 (PEBP-1) or prostatic binding protein
(PBP), was initially characterized to be involved in many different
physiologic activities, including reproduction and neurophysiolo-
gy [69]. Previous findings, however, have identified RKIP as a
modulator of apoptosis and metastasis through regulation of
important signaling cascades, i.e., the RAF-MEK-ERK kinase
cascade, G protein-coupled receptors, and the NF-kb pathway
[70,71]. RKIP expression has been reported to be diminished in
many tumors and completely absent in metastases [72,73,74]. We
recently reported a significant reduction in RKIP expression in
BC vs. normal tissue, followed by elevated levels of BRAF gene
expression [6]. In the present study, low RKIP expression in BC
was verified only by microarray analysis. Our PCR analysis
revealed high expression for RKIP (p = 0.001) and equal
expression for BRAF between BC and normal tissue, perplexing
thus the elucidation of its expression profile in BC. Notably, high
RKIP expression levels showed a trend for favorable overall
patient survival, whereas high BRAF expression levels tended to
be more frequent in patients with worse overall survival. However,
the correlations were not statistically significant. We have
previously reported positive correlations among all 3 RAF genes
and negative correlation between the expression of BRAF and
RKIP in BC [6]. The present study corroborates our previous
results, both by pubgene analysis and Spearman’s bivariate
correlation-coefficient test.
AngiogenesisAngiogenesis is essential for tissue development, wound healing
and reproduction [75] and is an indispensable requirement for
tumor progression, invasiveness and metastasis [76].
Of the angiogenic factors, VEGF has been identified as a crucial
regulator of normal and pathological angiogenesis. VEGF
produces a number of important biological effects such as
endothelial mitogenesis and migration, extracellular matrix
remodeling via induction of proteinases, increased vascular
permeability and maintenance of newly formed vasculature [77].
There is substantial evidence to suggest that the essential role of
VEGF is to act as a prognostic marker for the aggressiveness of
TCC. Bladder tumors are characterized by markedly increased
angiogenesis when compared with the normal urothelium from
which they are derived. Thus, VEGF is a crucial growth factor
mediating tumor angiogenesis, and its expression has been
associated with advanced grade, stage, and recurrence of TCC
[78,79,80]. VEGF protein has been found to be significantly over-
expressed in all grades and stages of TCC [81,82,83]. Further-
more, VEGF over-expression has been found to be correlated with
the grade, stage, and recurrence of tumors indicating that VEGF-
positive tumors are biologically aggressive [81]. Innoue et al.
reported that the expression of VEGF in biopsy specimens was
correlated with the prognosis of patients with advanced bladder
cancer undergoing neoadjuvant chemotherapy and cystectomy
[79]. In the present study, VEGFA expression was significantly
higher in BC vs. normal tissue, both by microarray analysis (,10-
fold over-expression), qPCR (p,0.0001), and Western blotting
(p = 0.05). VEGFA over-expression has been found to be a good
indicator of poor survival in patients with TCC [78,79].
Interestingly enough, our data suggest that high mRNA levels of
VEGFA are correlated with favorable overall patient survival
(p = 0.0448). Such contradictory results could probably be
attributed to the relatively small sample number used for the
survival test.
At the early stage of tumor growth, FGF2 expression plays an
important role in the regulation of angiogenesis, tumorigenicity
and subsequent metastases of human bladder cancer [84]. It has
been hypothesized that during wound healing and tumor
development the action of heparan sulfate degrading enzymes
activates FGF2, thus mediating the formation of new blood
vessels. FGF2 may behave as a transforming/oncogenic factor
inducing cell proliferation and motility. The interaction with
specific receptors leads to unchecked proliferation via the RAS-
MAPK pathway. The most common oncogenes and some of the
tumor-suppressor genes relevant to BC are components of this
pathway [85]. FGF2 protein levels have been reported to be
significantly increased in BC tissues [82,83,86,87,88], and its
expression is positively correlated with tumor grade [87]. FGF2
was also reported to be a predictor for recurrence when residual
disease was present in the cystectomy specimen [79]. On the
contrary, our data suggest a significant down-regulation of FGF2
mRNA levels in BC vs. normal tissue, detected both by
microarray (,0.3-fold) and qPCR (p,0.0001) analysis. This
could be attributed to possible experimental error or to the
relatively small sample number. We also detected a negative
correlation between VEGFA and FGF2 RNA levels (p = 0.019) in
BC.
TGFb1 is regarded as a negative growth regulator because of its
potent anti-proliferative effects on many cell types, such as
endothelial and epithelial cells and various cell types of
haematopoietic origin in vitro [89]. In contrast, over-expression
of TGFb1 has been described in several tumors in vivo
[18,90,91,92] and has also been associated with tumor progression
and metastasis [93,94]. In the tumorigenesis of urinary bladder
carcinoma, TGFb1 is also considered a crucial molecule [95].
Recently, Helmy et al. used immunocytochemistry to show that
TGFb1 is significantly increased in BC vs. normal tissue (p,0.01)
[96]. Several groups have also found similar results by protein and
RNA expression studies [80,97,98,99]. On the other hand, Eder
et al. found reduced TGFb1 mRNA expression in BC vs. normal
tissue and elevated TGFb1 protein levels in superficial forms of BC
(Ta-T1) and moderate levels in invasive BCs of stages T2-T3,
compared with normal urothelium [99]. We also detected a
significant over-expression of TGFb1 both by microarray and
qPCR analysis (p,0.0004), and our data were further validated by
western-blotting (p = 0.0286). Moreover, elevated TGFb1 mRNA
levels were noted in BCs irrespective of grade or stage, in good
agreement with previous reports [100]. Overall, these data suggest
that TGFb1 protein could be used as an attractive target for
anticancer therapy.
Despite the reported over-expression of EGFR in bladder
cancer, leading to uncontrolled cell proliferation, increased
angiogenesis and reduced apoptosis, to our knowledge, this is
the first report regarding the expression of EGF in urinary bladder
cancer. Our data imply significantly low levels of EGF, both by
microarray and qPCR analysis (p = 0.0017).
Angiogenesis-related molecular markers are commonly altered
in urothelial carcinoma of the bladder, making them a target for
therapy. Understanding the mechanisms of invasion, metastasis
and angiogenesis in BC sets the stage for the development of novel
targeted agents.
Cellular proliferation, Invasion and MetastasisThe gene MKI67 encodes Ki-67, a nuclear protein that is
associated with and may be necessary for cellular proliferation.
In cancer cells, Ki-67 plays an important role as an index for the
replication and the prognosis and is well associated with tumor
grade, stage and recurrence [101]. In the present study, T1-
grade 1/2 tumors showed weak staining for anti-Ki-67, whereas
T1/2-grade 3 tumors exhibited the strongest immunostaining.
Our microarray data for MKI67 did not show a .2-fold
Multiple Pathway Analysis in Bladder Cancer
PLoS ONE | www.plosone.org 12 April 2011 | Volume 6 | Issue 4 | e18255

difference in its expression levels, however T2/T3-grade 3
tumors also showed higher MKI67 expression vs. T1-grade 2
and T1-grade 3 tumors. These results are in agreement with
previous studies [102,103] which showed that Ki-67-positive
immunostaining was correlated with tumor grade and muscle
invasion.
The matrix metalloproteinases (MMPs) are a family of
proteolytic enzymes present in both normal and pathological
tissues in which matrix remodelling is involved, including
embryonic development, wound healing, arthritis, angiogenesis,
tumor invasion and metastasis [104,105]. The MMPs degrade the
components of the extracellular matrix, with MMP1 degrading
fibrillar collagen and the gelatinases (MMP2 and MMP9) being
important in degrading the basement membrane [106,107,108].
MMPs play a role in the invasion of normal tissues by tumors and
their subsequent metastatic spread.
Most studies have previously determined MMP2 and MMP9
activity levels in urine or tissue from patients with BC, using
gelatin zymography or ELISA [109]. Margulies et al. [110]
reported that MMP2 was elevated in the urine of patients with
BC, and Ozdemir et al. [111] and Hanemaaijer et al. [112]
reported the same for MMP9. More recently, Gerhards et al.
[113] found significantly increased MMP2 and MMP9 excretions
in patients with bladder cancer, depending on tumor stage and
grade. In one of the few studies measuring MMP9 and MMP2 by
ELISA in urine, Sier et al. [114] revealed an increased level of
both markers in the malignant group compared with a control
group that did not include patients with benign urologic disease.
Choi et al. found that MMP2 and MMP9 were significantly up-
regulated in recurrent BC cases [80]. In the present study, we
explored MMP2 and MMP9 activity, measuring their mRNA
expression levels by microarray analysis. Our data suggest MMP2
up-regulation in BC vs. normal tissue. However, qPCR did not
validate this up-regulation. On the contrary, we noticed MMP2
down-regulation (p = 0.0007) in BC vs. normal tissue. Moreover,
in accordance with Gerhards et al. [113], our data show that T2/
T3-grade 3 tumors exhibited significantly higher MMP9 levels
compared to the control tissue (p = 0.0267). Similarly, MMP9
levels were higher in T1-grade 3 vs. T1-grade 2 tumors
(p = 0.0151). Furthermore, MMP9 was correlated both with
VEGFA and FGF2 in BC, whereas it has been previously
reported to be induced by EGF [115]. This marked increase in
MMPs in the malignant group was expected since MMP2 is
synthesized by tumor cells or quite commonly by host response to
tumor as in fibroblasts, macrophages, and vascular endothelial
cells. However, MMP9 was found to be strongly expressed in
intravascular and tissue-infiltrating leucocytes [111], and their
implication in the pathogenesis of BC has been documented
[114].
Apart from MMPs, TIMP expression has also been previously
reported in BC [116]. Eissa et al. were the first to use TIMP2,
MMP2/TIMP2 ratio, and MMP9/TIMP2 ratio as novel urine
markers for BC [117]. Our microarray analysis also showed that
TIMP1 was .2-fold up-regulated in T1-grade 2 tumors
(2.8061.29), whereas its expression was ,2-fold in T1-grade 3
and T2/T3-grade 3 tumors vs. normal tissue. On the contrary,
TIMP2 exhibited low expression levels. Its fold expression in T1-
grade 2 tumors was 0.4460.14, whereas in T1-grade 3 and T2/
T3-grade 3 tumors, it was 0.7460.52 and 1.1460.56, respectively.
Low TIMP2 expression levels in BC vs. benign and control tissues
have been previously reported [118,119], indicating that TIMP2
down-regulation with abundant MMP activation, represents a
mechanism of tumor invasion and could be used as a novel
prognostic indicator in BC.
Comparison of GEO DatasetsRegarding Dataset GSE89, TGFb1, p16INK4A, p53, AKT1,
HRAS, Cyclin D1, RAF1 and RKIP, exhibited significant over-
expression in BC vs. normal tissue. OPN (SPP1), VEGFA, p14ARF
and BRAF, exhibited equal expression levels between BC and
normal tissue, whereas MMP2, MMP9, TIMP1, TIMP2, FGF2,
EGFR, EGF, Ki-67, KRAS, NRAS, and ARAF showed
significantly lower expression levels in BC vs. normal tissue.
As for Dataset GSE7476, the genes that exhibited significant
over-expression in BC vs. normal tissue were the following:
VEGFA, p16INK4A, p53, EGFR, EGF, Ki-67, KRAS, NRAS, and
cyclin D1. The genes, MMP9, OPN (SPP1), TIMP1, TIMP2,
TGFb1, p14ARF, AKT1, HRAS, BRAF, and RKIP, presented
equal expression levels between BC and normal tissue; whereas
genes that presented significantly lower expression levels in BC vs.
normal tissue were MMP2, FGF2, ARAF and RAF1.
Regarding Dataset GSE3167, OPN (SPP1), VEGFA, p53,
AKT1, KRAS, HRAS, cyclin D1, RAF1, and RKIP exhibited
significant over-expression in BC vs. normal tissue. The genes,
MMP2, TIMP1, TIMP2, TGFb1, Ki-67, NRAS, and ARAF
exhibited identical expression between BC and normal tissue;
whereas MMP9, FGF2, p14ARF, p16INK4A, EGFR, EGF and
BRAF showed significantly lower expression in BC vs. normal
tissue (Table S2).
Expression of the majority of the genes demonstrated good
agreement among all GEO Datasets. Small differences detected
among the 5 GEO Datasets were expected to occur due to
divergence in the methodology used in the experimental
procedures and in the analysis of each gene. However, log2
transformation of the fold-expression rates minimized these
differences and provided us with a more definite understanding
of the expression profile of the GOIs in BC.
Gene ontology (GO) and Kyoto Encyclopedia of Genesand Genomes (KEGG) analysis
Furthermore, we performed GO and KEGG molecular
pathway annotation analysis in the selected genes. Since the
dataset was small, we expected a small number of significant
functions to be represented in gene ontology. To our surprise, GO
analysis manifested a large variety of functions for the GOIs. The
variety of gene functions that were revealed implies the multi-facet
character of the selected genes. It appears that they participate in a
variety of mechanisms including cell proliferation, cell death
(particularly negative regulation of cell death), metabolism and
very importantly these same genes participate in cell shape and
cytoskeletal re-organization.
Importantly, when we performed an analysis for KEGG
pathway participation of our selected dataset, the most significant
pathway appeared to be the Bladder Cancer Pathway
(p = 1.5610231). When the certain group of genes was isolated
for further processing from microarray experimentation, tumor
types were successfully classified based only on these specific genes.
This implies that the genes on which our interest was focused for
further study, probably characterize bladder neoplasias. Looking
further into the functions of the selected genes it appears that, in
their majority, they participate in metabolic processes. This was on
one hand expected, since tumors are known to be very active
metabolically, and on the other hand it was interesting since it
confirms the hypotheses stated in recent years that metabolic
pathways could be used as therapeutic targets. The participation in
many functions of the GOIs in the present study makes them good
therapeutic targets. Since these specific genes appear to have key
cellular functions and characterize tumor type and grade, future
Multiple Pathway Analysis in Bladder Cancer
PLoS ONE | www.plosone.org 13 April 2011 | Volume 6 | Issue 4 | e18255

investigations as far as their potency as therapeutic targets are
warranted.
Bladder cancer is a disease involving distinct and multiple
molecular pathologies. Several of these alterations have been
characterized, and yet many more are being discovered.
Moreover, great effort has been given towards the possibility of
determining subtypes of urological tumors, which in turn would
benefit diagnosis, therapy and prognosis. The present work adds to
the current knowledge of molecular signature identification of BC.
Genes with at least 2-fold differential expression in BC vs. normal
tissue, as well as in non-muscle invasive vs. muscle invasive tumors
and in low vs. high grade tumors, were identified and ranked. We
paid specific attention to alterations in OPN expression, due to its
multiple biological functions. GO analysis revealed the multi-
functional character of the GOIs, since they participate in a
variety of processes, including cell proliferation, cell death,
metabolism, cell shape, and cytoskeletal re-organization. Further-
more, KEGG analysis identified the Bladder Cancer pathway as
the most significant pathway, in which the selected GOIs
participate, providing support for the accuracy of our analysis.
Therefore, further research should be undertaken in order to gain
more insight into the disease molecular mechanisms underlying
the biology of BC which may aid in the administration of more
efficacious treatments in clinical practice.
Supporting Information
Figure S1 Upper panel: Melting curves used for product
specificity of the genes MMP2, MMP9, OPN, VEGFA, TGFb1,
FGF2, p14ARF, p16INK4A, p53, AKT1, EGFR and EGF. NTC,
non-template control. Lower panel: Representative examples of
PCR products after analysis by electrophoresis on 2% agarose gel.
(TIF)
Figure S2 Differential fold expression of the genes of interest in
10 BC samples vs. 5 controls, as detected by microarray analysis.
The Mann-Whitney test was performed to examine statistically
different expression patterns between groups with p,0.05
considered statistically significant.
(TIF)
Figure S3 Scatterplot depicting the mRNA levels of the genes that
were over-expressed in urinary bladder cancer (BC) versus normal
tissue. Groups pairs were statistically compared using the Mann-
Whitney U test. Bars depict the median values. B. Scatterplot depicting
the mRNA levels of the genes that were equally expressed among
urinary bladder cancer and normal tissue. Groups pairs were
statistically compared using the Mann-Whitney U test. Bars depict
the median values. C. Scatterplot depicting the mRNA levels of the
genes that were under-expressed in urinary bladder cancer versus
normal tissue. Groups pairs were statistically compared using the
Mann-Whitney U test. Bars depict the median values.
(TIF)
Figure S4 Using the BioNetwork Tools from www.pubgene.org,
relationships between the GOIs were investigated. HRAS
confirmed its role as a key molecule, since it presented interaction
with all the GOIs (19 interactions). OPN, TP53, BRAF and EGFR
exhibited the second highest number of significant interactions (18
of the GOIs), whereas VEGFA, RAF1, CDKN2A. ki67, ERBB2
and FGF2 were associated with 17 of the GOIs. NRAS was
associated with 16 GOIs, KRAS, MMP2 and MMP9 with 15
GOIs, TGFb1 with 14 GOIs, ARAF with 13 GOIs, EGF with 6
GOIs and RKIP/PEBP1 with 5 of the GOIs.
(TIF)
Figure S5 HCL (A), PCA for experiments (B) and genes (C) as
well as CA analyses (D) for the microarray dataset selected to
be the same with the genes tested with qPCR. Colours of
clusters in HCL correspond to the gene colours in all other
analyses.
(TIF)
Table S1 Information of the primer sequences used for qPCR
and the corresponding PCR product sizes.
(DOC)
Table S2 Gene expression analysis in urinary bladder cancer
was performed on data extracted from the following publicly
available datasets: GSE89, GSE3167, GSE7476 and GSE12630.
T, tumor; M, metastasis, N, normal tissue; sTCC with CIS,
superficial transitional cell carcinoma (sTCC) with surrounding
carcinoma in situ (CIS); sTCC without CIS, superficial transitional
cell carcinoma (sTCC) without surrounding carcinoma in situ
(CIS); mTCC, muscle-invasive carcinomas (mTCC). Results were
expressed as mean levels of the log2 intensity and statistically
compared by the Mann-Whitney U test (p-values are reported for
each comparison between expression levels in the tumor and
normal cases).
(DOC)
Table S3 Fold differential change of each gene in BC vs. the
control tissues. Red color indicates .2-fold expression; black color
indicates equal expression with a threshold of 2; blue indicates ,2-
fold expression. T-test was performed between the expression
levels of BC and control samples. The fold up- or down-regulation
in BC vs. Control, was also explored using the mathematical
formula: IF(Fold Difference.1; Fold Difference;-1/Fold Differ-
ence). If the fold change is positive or negative, it means up-or
down-regulation, respectively.
(DOC)
Table S4 Spearman’s bivariate correlation-coefficient test in
order to detect correlations among the expression levels of all the
genes studied in transitional cell carcinomas of the urinary bladder
(A) and control tissue (B).
(DOC)
Table S5 Enriched KEGG pathways. This table lists the
enriched KEGG pathways, number of Entrez IDs in the data
set for the pathway, the corresponding Entrez IDs, and the
statistics for the enrichment of the pathway. The statistics column
lists the number of reference genes in the category (C), number of
genes in the gene set and also in the category (O), expected
number in the category (E), Ratio of enrichment (R), p value from
hypergeometric test (rawP), and p value adjusted by the multiple
test adjustment (adjP). The most significant pathway revealed, was
the Bladder Cancer pathway. Interestingly, the most significant
pathway revealed was Bladder Cancer pathway.
(DOC)
Acknowledgments
We would like to thank Dr. Stavroula Chrianioti for her contribution with
the immunohistochemistry experiments, as well as all patients participating
in the study.
Author Contributions
Conceived and designed the experiments: AZ GIL DAS. Performed the
experiments: AZ GIL. Analyzed the data: AZ GIL. Contributed reagents/
materials/analysis tools: DV DD. Wrote the paper: AZ GIL.
Multiple Pathway Analysis in Bladder Cancer
PLoS ONE | www.plosone.org 14 April 2011 | Volume 6 | Issue 4 | e18255
References
1. Ferlay J, Autier P, Boniol M, Heanue M, Colombet M, et al. (2007) Estimatesof the cancer incidence and mortality in Europe in 2006. Ann Oncol 18:
581–592.
2. van Rhijn BW, Burger M, Lotan Y, Solsona E, Stief CG, et al. (2009)
Recurrence and progression of disease in non-muscle-invasive bladder cancer:
from epidemiology to treatment strategy. Eur Urol 56: 430–442.
3. Sylvester RJ, van der Meijden AP, Oosterlinck W, Witjes JA, Bouffioux C,
et al. (2006) Predicting recurrence and progression in individual patients with
stage Ta T1 bladder cancer using EORTC risk tables: a combined analysis of
2596 patients from seven EORTC trials. Eur Urol 49: 466–465; discussion
475-467.
4. Zaravinos A, Lambrou GI, Boulalas I, Delakas D, Spandidos DA (2011)
Identification of Common Differentially Expressed Genes in Urinary BladderCancer. PLOS ONE.
5. Lopez-Beltran A, Montironi R (2004) Non-invasive urothelial neoplasms:
according to the most recent WHO classification. Eur Urol 46: 170–176.
6. Zaravinos A, Chatziioannou M, Lambrou GI, Boulalas I, Delakas D, et al.Implication of RAF and RKIP Genes in Urinary Bladder Cancer. Pathol
Oncol Res.
7. Boulalas I, Zaravinos A, Karyotis I, Delakas D, Spandidos DA (2009)
Activation of RAS family genes in urothelial carcinoma. J Urol 181:
2312–2319.
8. Zaravinos A, Bizakis J, Spandidos DA (2008) RKIP and BRAF aberrations in
human nasal polyps and the adjacent turbinate mucosae. Cancer Lett 264:
288–298.
9. Altman NS, Hua J (2006) Extending the loop design for two-channel
microarray experiments. Genet Res 88: 153–163.
10. Churchill GA (2002) Fundamentals of experimental design for cDNA
microarrays. Nat Genet 32(Suppl): 490–495.
11. Townsend JP (2003) Multifactorial experimental design and the transitivity of
ratios with spotted DNA microarrays. BMC Genomics 4: 41.
12. Storey JD, Tibshirani R (2003) Statistical significance for genomewide studies.
Proc Natl Acad Sci U S A 100: 9440–9445.
13. Storey JD, Tibshirani R (2003) Statistical methods for identifying differentially
expressed genes in DNA microarrays. Methods Mol Biol 224: 149–157.
14. Klipper-Aurbach Y, Wasserman M, Braunspiegel-Weintrob N, Borstein D,Peleg S, et al. (1995) Mathematical formulae for the prediction of the residual
beta cell function during the first two years of disease in children and
adolescents with insulin-dependent diabetes mellitus. Med Hypotheses 45:
486–490.
15. Sturn A, Quackenbush J, Trajanoski Z (2002) Genesis: cluster analysis of
microarray data. Bioinformatics 18: 207–208.
16. Vandesompele J, De Preter K, Pattyn F, Poppe B, Van Roy N, et al. (2002)
Accurate normalization of real-time quantitative RT-PCR data by geometric
averaging of multiple internal control genes. Genome Biol 3: RE-
SEARCH0034.
17. Zaravinos A, Bizakis J, Soufla G, Sourvinos G, Spandidos DA (2007) Mutations
and differential expression of the ras family genes in human nasal polyposis.Int J Oncol 31: 1051–1059.
18. Zaravinos A, Soufla G, Bizakis J, Spandidos DA (2008) Expression analysis of
VEGFA, FGF2, TGFbeta1, EGF and IGF1 in human nasal polyposis. Oncol
Rep 19: 385–391.
19. Dyrskjot L, Thykjaer T, Kruhoffer M, Jensen JL, Marcussen N, et al. (2003)Identifying distinct classes of bladder carcinoma using microarrays. Nat Genet
33: 90–96.
20. Dyrskjot L, Kruhoffer M, Thykjaer T, Marcussen N, Jensen JL, et al. (2004)
Gene expression in the urinary bladder: a common carcinoma in situ gene
expression signature exists disregarding histopathological classification. Cancer
Res 64: 4040–4048.
21. Mengual L, Burset M, Ars E, Lozano JJ, Villavicencio H, et al. (2009) DNA
microarray expression profiling of bladder cancer allows identification of
noninvasive diagnostic markers. J Urol 182: 741–748.
22. Monzon FA, Lyons-Weiler M, Buturovic LJ, Rigl CT, Henner WD, et al.
(2009) Multicenter validation of a 1,550-gene expression profile for identifica-
tion of tumor tissue of origin. J Clin Oncol 27: 2503–2508.
23. Cordon-Cardo C (1995) Mutations of cell cycle regulators. Biological and
clinical implications for human neoplasia. Am J Pathol 147: 545–560.
24. Mitra AP, Lin H, Datar RH, Cote RJ (2006) Molecular biology of bladder
cancer: prognostic and clinical implications. Clin Genitourin Cancer 5: 67–77.
25. Underwood MA, Reeves J, Smith G, Gardiner DS, Scott R, et al. (1996)
Overexpression of p53 protein and its significance for recurrent progressive
bladder tumours. Br J Urol 77: 659–666.
26. Li B, Kanamaru H, Noriki S, Fukuda M, Okada K (1998) Numeric aberration
of chromosome 17 is strongly correlated with p53 overexpression, tumorproliferation and histopathology in human bladder cancer. Int J Urol 5:
317–323.
27. Ye DW, Zheng JF, Qian SX, Ma YJ (1993) Expression of p53 product in
Chinese human bladder carcinoma. Urol Res 21: 223–226.
28. Halimi M, Salehi A, Baybordi H, Nezami N (2009) Immunohistochemicalpositive stained p53 protein in bladder transitional cell carcinoma.
Indian J Pathol Microbiol 52: 155–158.
29. Moch H, Sauter G, Moore D, Mihatsch MJ, Gudat F, et al. (1993) p53 anderbB-2 protein overexpression are associated with early invasion and metastasis
in bladder cancer. Virchows Arch A Pathol Anat Histopathol 423: 329–334.
30. Nakazawa K, Murata S, Yuminamochi T, Ishii Y, Ohno S, et al. (2009)
p16(INK4a) expression analysis as an ancillary tool for cytologic diagnosis of
urothelial carcinoma. Am J Clin Pathol 132: 776–784.
31. Raspollini MR, Nesi G, Baroni G, Girardi LR, Taddei GL (2006) p16(INK4a)
expression in urinary bladder carcinoma. Arch Ital Urol Androl 78: 97–100.
32. Yin M, Bastacky S, Parwani AV, McHale T, Dhir R (2008) p16ink4
immunoreactivity is a reliable marker for urothelial carcinoma in situ. Hum
Pathol 39: 527–535.
33. Quentin T, Henke C, Korabiowska M, Schlott T, Zimmerman B, et al. (2004)
Altered mRNA expression of the Rb and p16 tumor suppressor genes and of
CDK4 in transitional cell carcinomas of the urinary bladder associated with
tumor progression. Anticancer Res 24: 1011–1023.
34. Vallmanya Llena FR, Laborda Rodriguez A, Lloreta Trull J, Cortadellas
Angel R, Placer Santos J, et al. (2006) [Immunohistochemical expression ofp53, p21, p16, and cyclin D1 in superficial bladder cancer. A tissue microarray
study]. Actas Urol Esp 30: 754–762.
35. Del Rey J, Prat E, Ponsa I, Lloreta J, Gelabert A, et al. (2010) Centrosome
clustering and cyclin D1 gene amplification in double minutes are common
events in chromosomal unstable bladder tumors. BMC Cancer 10: 280.
36. Levidou G, Saetta AA, Karlou M, Thymara I, Pratsinis H, et al. D-type cyclins
in superficial and muscle-invasive bladder urothelial carcinoma: correlation
with clinicopathological data and prognostic significance. J Cancer Res Clin
Oncol 36: 1563–1571.
37. Reed JC (1999) Dysregulation of apoptosis in cancer. J Clin Oncol 17:
2941–2953.
38. Oates AJ, Barraclough R, Rudland PS (1997) The role of osteopontin in
tumorigenesis and metastasis. Invasion Metastasis 17: 1–15.
39. Coppola D, Szabo M, Boulware D, Muraca P, Alsarraj M, et al. (2004)
Correlation of osteopontin protein expression and pathological stage across a
wide variety of tumor histologies. Clin Cancer Res 10: 184–190.
40. Ke HL, Chang LL, Yang SF, Lin HH, Li CC, et al. (2009) Osteopontin
overexpression predicts poor prognosis of upper urinary tract urothelial
carcinoma. Urol Oncol.
41. Morimoto I, Sasaki Y, Ishida S, Imai K, Tokino T (2002) Identification of the
osteopontin gene as a direct target of TP53. Genes Chromosomes Cancer 33:
270–278.
42. Zaravinos A, Kanellou P, Spandidos DA (2010) Viral DNA detection and RAS
mutations in actinic keratosis and nonmelanoma skin cancers. Br J Dermatol
162: 325–331.
43. Symvoulakis EK, Zaravinos A, Panutsopulos D, Zoras O, Papalambros E, et al.
(2007) Highly conserved sequence of exon 15 BRAF gene and KRAS codon 12mutation among Greek patients with colorectal cancer. Int J Biol Markers 22:
12–18.
44. Herrera R, Sebolt-Leopold JS (2002) Unraveling the complexities of the Raf/
MAP kinase pathway for pharmacological intervention. Trends Mol Med 8:
S27–31.
45. Jiang BH, Liu LZ (2009) PI3K/PTEN signaling in angiogenesis and
tumorigenesis. Adv Cancer Res 102: 19–65.
46. Rusanescu G, Gotoh T, Tian X, Feig LA (2001) Regulation of Ras signaling
specificity by protein kinase C. Mol Cell Biol 21: 2650–2658.
47. Fujita J, Yoshida O, Yuasa Y, Rhim JS, Hatanaka M, et al. (1984) Ha-ras
oncogenes are activated by somatic alterations in human urinary tract tumours.
Nature 309: 464–466.
48. Feinberg AP, Vogelstein B, Droller MJ, Baylin SB, Nelkin BD (1983) Mutation
affecting the 12th amino acid of the c-Ha-ras oncogene product occurs
infrequently in human cancer. Science 220: 1175–1177.
49. Visvanathan KV, Pocock RD, Summerhayes IC (1988) Preferential and novel
activation of H-ras in human bladder carcinomas. Oncogene Res 3: 77–86.
50. Saito S, Hata M, Fukuyama R, Sakai K, Kudoh J, et al. (1997) Screening of H-
ras gene point mutations in 50 cases of bladder carcinoma. Int J Urol 4:
178–185.
51. Reddy EP, Reynolds RK, Santos E, Barbacid M (1982) A point mutation is
responsible for the acquisition of transforming properties by the T24 human
bladder carcinoma oncogene. Nature 300: 149–152.
52. Villares GJ, Zigler M, Blehm K, Bogdan C, McConkey D, et al. (2007)
Targeting EGFR in bladder cancer. World J Urol 25: 573–579.
53. Nicholson RI, Gee JM, Harper ME (2001) EGFR and cancer prognosis.
Eur J Cancer 37(Suppl 4): S9–15.
54. Dominguez-Escrig JL, Kelly JD, Neal DE, King SM, Davies BR (2004)
Evaluation of the therapeutic potential of the epidermal growth factor receptor
tyrosine kinase inhibitor gefitinib in preclinical models of bladder cancer. ClinCancer Res 10: 4874–4884.
55. Neal DE, Sharples L, Smith K, Fennelly J, Hall RR, et al. (1990) The
epidermal growth factor receptor and the prognosis of bladder cancer. Cancer
65: 1619–1625.
56. Mellon JK, Lunec J, Wright C, Horne CH, Kelly P, et al. (1996) C-erbB-2 inbladder cancer: molecular biology, correlation with epidermal growth factor
receptors and prognostic value. J Urol 155: 321–326.
Multiple Pathway Analysis in Bladder Cancer
PLoS ONE | www.plosone.org 15 April 2011 | Volume 6 | Issue 4 | e18255

57. Mellon K, Wright C, Kelly P, Horne CH, Neal DE (1995) Long-term outcome
related to epidermal growth factor receptor status in bladder cancer. J Urol
153: 919–925.
58. Neal DE, Marsh C, Bennett MK, Abel PD, Hall RR, et al. (1985) Epidermal-
growth-factor receptors in human bladder cancer: comparison of invasive and
superficial tumours. Lancet 1: 366–368.
59. Chow NH, Liu HS, Lee EI, Chang CJ, Chan SH, et al. (1997) Significance of
urinary epidermal growth factor and its receptor expression in human bladder
cancer. Anticancer Res 17: 1293–1296.
60. Colquhoun AJ, McHugh LA, Tulchinsky E, Kriajevska M, Mellon JK (2007)
Combination treatment with ionising radiation and gefitinib (‘Iressa’, ZD1839),
an epidermal growth factor receptor (EGFR) inhibitor, significantly inhibits
bladder cancer cell growth in vitro and in vivo. J Radiat Res (Tokyo) 48:
351–360.
61. Sarbassov DD, Guertin DA, Ali SM, Sabatini DM (2005) Phosphorylation and
regulation of Akt/PKB by the rictor-mTOR complex. Science 307:
1098–1101.
62. Bozulic L, Surucu B, Hynx D, Hemmings BA (2008) PKBalpha/Akt1 acts
downstream of DNA-PK in the DNA double-strand break response and
promotes survival. Mol Cell 30: 203–213.
63. Carpten JD, Faber AL, Horn C, Donoho GP, Briggs SL, et al. (2007) A
transforming mutation in the pleckstrin homology domain of AKT1 in cancer.
Nature 448: 439–444.
64. Askham JM, Platt F, Chambers PA, Snowden H, Taylor CF, et al. (2009)
AKT1 mutations in bladder cancer: identification of a novel oncogenic
mutation that can co-operate with E17K. Oncogene 29: 150–155.
65. Davies H, Bignell GR, Cox C, Stephens P, Edkins S, et al. (2002) Mutations of
the BRAF gene in human cancer. Nature 417: 949–954.
66. Zaravinos A, Kanellou P, Baritaki S, Bonavida B, Spandidos DA (2009) BRAF
and RKIP are significantly decreased in cutaneous squamous cell carcinoma.
Cell Cycle 8: 1402–1408.
67. Boulalas I, Zaravinos A, Delakas D, Spandidos DA (2009) Mutational analysis
of the BRAF gene in transitional cell carcinoma of the bladder. Int J Biol
Markers 24: 17–21.
68. Williams NG, Roberts TM (1994) Signal transduction pathways involving the
Raf proto-oncogene. Cancer Metastasis Rev 13: 105–116.
69. Simister PC, Banfield MJ, Brady RL (2002) The crystal structure of PEBP-2, a
homologue of the PEBP/RKIP family. Acta Crystallogr D Biol Crystallogr 58:
1077–1080.
70. Odabaei G, Chatterjee D, Jazirehi AR, Goodglick L, Yeung K, et al. (2004)
Raf-1 kinase inhibitor protein: structure, function, regulation of cell signaling,
and pivotal role in apoptosis. Adv Cancer Res 91: 169–200.
71. Park S, Yeung ML, Beach S, Shields JM, Yeung KC (2005) RKIP
downregulates B-Raf kinase activity in melanoma cancer cells. Oncogene 24:
3535–3540.
72. Fu Z, Smith PC, Zhang L, Rubin MA, Dunn RL, et al. (2003) Effects of raf
kinase inhibitor protein expression on suppression of prostate cancer metastasis.
J Natl Cancer Inst 95: 878–889.
73. Keller ET, Fu Z, Yeung K, Brennan M (2004) Raf kinase inhibitor protein: a
prostate cancer metastasis suppressor gene. Cancer Lett 207: 131–137.
74. Fu Z, Kitagawa Y, Shen R, Shah R, Mehra R, et al. (2006) Metastasis
suppressor gene Raf kinase inhibitor protein (RKIP) is a novel prognostic
marker in prostate cancer. Prostate 66: 248–256.
75. Folkman J (1990) What is the evidence that tumors are angiogenesis
dependent? J Natl Cancer Inst 82: 4–6.
76. Carmeliet P, Jain RK (2000) Angiogenesis in cancer and other diseases. Nature
407: 249–257.
77. Folkman J (1995) Angiogenesis in cancer, vascular, rheumatoid and other
disease. Nat Med 1: 27–31.
78. Campbell SC, Volpert OV, Ivanovich M, Bouck NP (1998) Molecular
mediators of angiogenesis in bladder cancer. Cancer Res 58: 1298–
1304.
79. Inoue K, Slaton JW, Karashima T, Yoshikawa C, Shuin T, et al. (2000) The
prognostic value of angiogenesis factor expression for predicting recurrence and
metastasis of bladder cancer after neoadjuvant chemotherapy and radical
cystectomy. Clin Cancer Res 6: 4866–4873.
80. Choi YD, Cho NH, Ahn HS, Cho KS, Cho SY, et al. (2007) Matrix
metalloproteinase expression in the recurrence of superficial low grade bladder
transitional cell carcinoma. J Urol 177: 1174–1178.
81. Al-Abbasi DS, Al-Janabi AA, Al-Toriahi KM, Jabor TA, Yasseen AA (2009)
Expression of VEGF in urinary bladder transitional cell carcinoma in an Iraqi
population subjected to depleted uranium: an immunohistochemical study.
Appl Immunohistochem Mol Morphol 17: 307–311.
82. Shariat SF, Youssef RF, Gupta A, Chade DC, Karakiewicz PI, et al.
Association of angiogenesis related markers with bladder cancer outcomes and
other molecular markers. J Urol 183: 1744–1750.
83. Guo ZH, Mei H, Huang J, Li SY (2003) [Vascular endothelial growth factor
(VEGF) and basic fibroblast growth factor (bFGF) expression in superficial
transitional cell bladder carcinoma]. Ai Zheng 22: 307–309.
84. Chikazawa M, Inoue K, Fukata S, Karashima T, Shuin T (2008) Expression of
angiogenesis-related genes regulates different steps in the process of tumor
growth and metastasis in human urothelial cell carcinoma of the urinary
bladder. Pathobiology 75: 335–345.
85. Wolff EM, Liang G, Jones PA (2005) Mechanisms of Disease: genetic andepigenetic alterations that drive bladder cancer. Nat Clin Pract Urol 2: 502–510.
86. Marzioni D, Lorenzi T, Mazzucchelli R, Capparuccia L, Morroni M, et al.
(2009) Expression of basic fibroblast growth factor, its receptors and syndecans
in bladder cancer. Int J Immunopathol Pharmacol 22: 627–638.
87. Gan Y, Wientjes MG, Au JL (2006) Expression of basic fibroblast growth factor
correlates with resistance to paclitaxel in human patient tumors. Pharm Res 23:
1324–1331.
88. Gravas S, Bosinakou I, Kehayas P, Giannopoulos A (2004) Urinary basicfibroblast growth factor in bladder cancer patients. Histopathological
correlation and clinical potential. Urol Int 73: 173–177.
89. Roberts AB, Flanders KC, Heine UI, Jakowlew S, Kondaiah P, et al. (1990)Transforming growth factor-beta: multifunctional regulator of differentiation
and development. Philos Trans R Soc Lond B Biol Sci 327: 145–154.
90. Gorsch SM, Memoli VA, Stukel TA, Gold LI, Arrick BA (1992)Immunohistochemical staining for transforming growth factor beta 1 associates
with disease progression in human breast cancer. Cancer Res 52: 6949–6952.
91. Thompson TC, Truong LD, Timme TL, Kadmon D, McCune BK, et al.(1992) Transforming growth factor beta 1 as a biomarker for prostate cancer.
J Cell Biochem(Suppl 16H): 54–61.
92. Steiner MS, Zhou ZZ, Tonb DC, Barrack ER (1994) Expression oftransforming growth factor-beta 1 in prostate cancer. Endocrinology 135:
2240–2247.
93. Weidner N, Semple JP, Welch WR, Folkman J (1991) Tumor angiogenesis andmetastasis–correlation in invasive breast carcinoma. N Engl J Med 324: 1–8.
94. Gajdusek CM, Luo Z, Mayberg MR (1993) Basic fibroblast growth factor and
transforming growth factor beta-1: synergistic mediators of angiogenesis invitro. J Cell Physiol 157: 133–144.
95. Hung TT, Wang H, Kingsley EA, Risbridger GP, Russell PJ (2008) Molecular
profiling of bladder cancer: involvement of the TGF-beta pathway in bladder
cancer progression. Cancer Lett 265: 27–38.
96. Helmy A, Hammam OA, El Lithy TR, El Deen Wishahi MM (2007) The role
of TGF-beta-1 protein and TGF-beta-R-1 receptor in immune escape
mechanism in bladder cancer. MedGenMed 9: 34.
97. Zhang G, Cao Y, Xu Y, See WA (2005) Micro-array analysis of the effect ofpost-transurethral bladder tumor resection urine on transforming growth
factor-beta1 dependent gene expression in transitional cell carcinoma. UrolOncol 23: 413–418.
98. De Boer WI, Houtsmuller AB, Izadifar V, Muscatelli-Groux B, Van der
Kwast TH, et al. (1997) Expression and functions of EGF, FGF and TGFbeta-growth-factor family members and their receptors in invasive human
transitional-cell-carcinoma cells. Int J Cancer 71: 284–291.
99. Eder IE, Stenzl A, Hobisch A, Cronauer MV, Bartsch G, et al. (1997)Expression of transforming growth factors beta-1, beta 2 and beta 3 in human
bladder carcinomas. Br J Cancer 75: 1753–1760.
100. Izadifar V, de Boer WI, Muscatelli-Groux B, Maille P, van der Kwast TH,et al. (1999) Expression of transforming growth factor beta1 and its receptors in
normal human urothelium and human transitional cell carcinomas. Hum
Pathol 30: 372–377.
101. Masliukova EA, Pozharisskii KM, Karelin MI, Startsev V, Ten VP (2006)[Role of Ki-67, mutated gene-suppressor p53 and HER-2neu oncoprotein in
the prognosis for the clinical course of bladder cancer]. Vopr Onkol 52:643–648.
102. Nakopoulou L, Vourlakou C, Zervas A, Tzonou A, Gakiopoulou H, et al.
(1998) The prevalence of bcl-2, p53, and Ki-67 immunoreactivity intransitional cell bladder carcinomas and their clinicopathologic correlates.
Hum Pathol 29: 146–154.
103. Pfister C, Moore L, Allard P, Larue H, Lacombe L, et al. (1999) Predictivevalue of cell cycle markers p53, MDM2, p21, and Ki-67 in superficial bladder
tumor recurrence. Clin Cancer Res 5: 4079–4084.
104. Matrisian LM (1990) Metalloproteinases and their inhibitors in matrixremodeling. Trends Genet 6: 121–125.
105. Liotta LA, Steeg PS, Stetler-Stevenson WG (1991) Cancer metastasis and
angiogenesis: an imbalance of positive and negative regulation. Cell 64:
327–336.
106. Ria R, Loverro G, Vacca A, Ribatti D, Cormio G, et al. (2002) Angiogenesis
extent and expression of matrix metalloproteinase-2 and -9 agree with
progression of ovarian endometriomas. Eur J Clin Invest 32: 199–206.
107. Murphy G, Cockett MI, Ward RV, Docherty AJ (1991) Matrix metallopro-teinase degradation of elastin, type IV collagen and proteoglycan. A
quantitative comparison of the activities of 95 kDa and 72 kDa gelatinases,stromelysins-1 and -2 and punctuated metalloproteinase (PUMP). Biochem J
277(Pt 1): 277–279.
108. Woessner JF, Jr. (1991) Matrix metalloproteinases and their inhibitors inconnective tissue remodeling. Faseb J 5: 2145–2154.
109. Staack A, Badendieck S, Schnorr D, Loening SA, Jung K (2006) Combined
determination of plasma MMP2, MMP9, and TIMP1 improves the non-invasivedetection of transitional cell carcinoma of the bladder. BMC Urol 6: 19.
110. Margulies IM, Hoyhtya M, Evans C, Stracke ML, Liotta LA, et al. (1992)
Urinary type IV collagenase: elevated levels are associated with bladdertransitional cell carcinoma. Cancer Epidemiol Biomarkers Prev 1: 467–474.
111. Ozdemir E, Kakehi Y, Okuno H, Yoshida O (1999) Role of matrix
metalloproteinase-9 in the basement membrane destruction of superficial
urothelial carcinomas. J Urol 161: 1359–1363.
Multiple Pathway Analysis in Bladder Cancer
PLoS ONE | www.plosone.org 16 April 2011 | Volume 6 | Issue 4 | e18255

112. Hanemaaijer R, Sier CF, Visser H, Scholte L, van Lent N, et al. (1999) MMP-9
activity in urine from patients with various tumors, as measured by a novelMMP activity assay using modified urokinase as a substrate. Ann N Y Acad Sci
878: 141–149.
113. Gerhards S, Jung K, Koenig F, Daniltchenko D, Hauptmann S, et al. (2001)Excretion of matrix metalloproteinases 2 and 9 in urine is associated with a
high stage and grade of bladder carcinoma. Urology 57: 675–679.
114. Sier CF, Casetta G, Verheijen JH, Tizzani A, Agape V, et al. (2000) Enhanced
urinary gelatinase activities (matrix metalloproteinases 2 and 9) are associatedwith early-stage bladder carcinoma: a comparison with clinically used tumor
markers. Clin Cancer Res 6: 2333–2340.115. Nutt JE, Durkan GC, Mellon JK, Lunec J (2003) Matrix metalloproteinases
(MMPs) in bladder cancer: the induction of MMP9 by epidermal growth factorand its detection in urine. BJU Int 91: 99–104.
116. Chaffer CL, Thomas DM, Thompson EW, Williams ED (2006) PPARgamma-
independent induction of growth arrest and apoptosis in prostate and bladdercarcinoma. BMC Cancer 6: 53.
117. Eissa S, Ali-Labib R, Swellam M, Bassiony M, Tash F, et al. (2007)
Noninvasive diagnosis of bladder cancer by detection of matrix metallopro-teinases (MMP-2 and MMP-9) and their inhibitor (TIMP-2) in urine. Eur Urol
52: 1388–1396.118. Wood M, Fudge K, Mohler JL, Frost AR, Garcia F, et al. (1997) In situ
hybridization studies of metalloproteinases 2 and 9 and TIMP-1 and TIMP-2
expression in human prostate cancer. Clin Exp Metastasis 15: 246–258.
119. Vasala K, Turpeenniemi-Hujanen T (2007) Serum tissue inhibitor ofmetalloproteinase-2 (TIMP-2) and matrix metalloproteinase-2 in complex with
the inhibitor (MMP-2:TIMP-2) as prognostic markers in bladder cancer. ClinBiochem 40: 640–644.
Multiple Pathway Analysis in Bladder Cancer
PLoS ONE | www.plosone.org 17 April 2011 | Volume 6 | Issue 4 | e18255