
Spontaneous Regeneration of Tropical Dry Forest in Madagascar: The Social–Ecological Dimension
78
297 H. Nagendra and J. Southworth (eds.), Reforesting Landscapes: Linking Pattern and Process, Landscape Series 10, DOI 10.1007/978-1-4020-9656-3_13, © Springer Science+Business Media B.V. 2010 T. Elmqvist (*), M. Pyykönen, and M. Tengö Department of Systems Ecology, Stockholm University, Stockholm, Sweden and Stockholm Resilience Centre, Stockholm, Sweden e-mail: [email protected] Chapter 13 Spontaneous Regeneration of Tropical Dry Forest in Madagascar: The Social–Ecological Dimension Thomas Elmqvist, Markku Pyykönen, and Maria Tengö
Transcript of Spontaneous Regeneration of Tropical Dry Forest in Madagascar: The Social–Ecological Dimension
297H. Nagendra and J. Southworth (eds.), Reforesting Landscapes: Linking Pattern and Process, Landscape Series 10, DOI 10.1007/978-1-4020-9656-3_13, © Springer Science+Business Media B.V. 2010
T. Elmqvist (*), M. Pyykönen, and M. Tengö Department of Systems Ecology, Stockholm University, Stockholm, Sweden and Stockholm Resilience Centre, Stockholm, Sweden e-mail: [email protected]
Chapter 13Spontaneous Regeneration of Tropical Dry Forest in Madagascar: The Social–Ecological Dimension
Thomas Elmqvist, Markku Pyykönen, and Maria Tengö
298 T. Elmqvist et al.
13.1 Introduction
Loss of tropical forests and changes in land use/land cover affect climate and environmental change at global scales and are of growing concern worldwide (e.g. Achard et al. 2002; Lambin et al. 2003). Although most focus had been on deforestation, regrowth of tropical forest may be widespread. Achard et al. (2002) estimated that at a global level, the annual regrowth area of humid tropical forest is 1 million hectares compared with the annual forest loss of 5.8 million hectares. In other words, annual regeneration may correspond to roughly 20% of the total area of deforestation (see also Chapter 2 in this volume).
In spite of this, we know surprisingly little about regeneration in terms of func-tional aspects of biodiversity and generation of ecosystem services for local and regional human consumption and use (e.g. Grau et al. 2003; Dunn 2004). This is particularly true for dry tropical forests (see review by Vieira and Scariot 2006; Sánchez-Azofeifa et al. 2005). Further, the role of the institutional context is increasingly emphasized in disentangling drivers of forest dynamics (Lambin et al. 2001; Dietz et al. 2003). Although we have some knowledge about the institutional context in which tropical forest loss is embedded (Gibson et al. 2000; Lambin et al. 2001, 2003), we know very little about the role social institutions may have in influencing rates of tropical forest regeneration, especially at the local scale (Tucker et al. 2005; Nagendra 2007).
In Madagascar, the southern dry forest harbors the highest level of plant endemism with 48% of the genera and 95% of the species endemic (Koechlin 1972; Rabesandratana 1984), and is listed as one of the 200 most important ecological regions in the world (Olson and Dinerstein 2002). The dry forest has long been considered to be the most intact vegetation type in all of Madagascar (Du Puy and Moat 1996) and it has also been suggested that deforestation here may have much more severe consequences as com-pared to moist forests due to a limited regeneration capacity (Green and Sussman 1990; Du Puy and Moat 1996). Arid conditions have resulted in a historically less intensive slash and burn agriculture and natural fires are infrequent in this system (Koechlin 1972). Despite global recognition of the value of the southern dry forest, there have been surprisingly few studies on forest cover changes or effects of anthropogenic impacts (Elmqvist 2004, but see Elmqvist et al. 2007).
In contrast to other types of forests in Madagascar there are only a few, very small areas formally under protection (Fenn 2003). Informal institutions, however, play an important role in southern Madagascar in protecting forest ecosystems and maintaining their capacity to generate valuable ecosystem services (Tengö et al. 2007). Other studies have shown the value of existing institutions and customary authority and values for the success of conservation (Lingard et al. 2003; Horning 2003a, 2008; McConnell and Sweeney 2005; Schachenmann 2006). Few studies have, however, linked the existence of a social capital (sensu Pretty 2003) related to forest management with spatial analysis of forest dynamics.
In this study, we used Landsat images from southern Madagascar from three different years (1986, 1993, and 2000) for a time series analysis of dry forest cover change.
29913 Spontaneous Regeneration of Tropical Dry Forest in Madagascar
We performed field surveys, interviews and analyses of local institutions to inter-pret the observed forest cover changes in a social institutional context.
13.2 Study Area and Methodology
The Androy region is situated in the southernmost part of Madagascar between Lat 24° 13¢ and 25° 24¢ S and Lon 45° 20¢ and 46° 26¢ E (Fig. 13.1). The area is char-acterized by semi-arid climatic conditions with irregular rainfall averaging less than 500 mm per year. The annual rainfall declines from north to south and from north-east to southwest (Battistini and Richard-Vindard 1972). The dry season usually lasts eight to nine months, between March–October/November, but locally it can extend over several years (Dewar and Wallis 1999; Richard et al. 2002). The mean temperature is generally between 23°C and 26°C but the daily amplitude may be as large as 22°C during the cold season, May–October.
The dry forest of southern Madagascar is characterized by drought tolerant woody species of Didiereaceae and Euphorbiaceae (Rabesandratana 1984). The most common species of the Didiereaceae, Alluaudia procera, dominates forest stands in central and northern Androy, while in southern Androy, forest stands are dominated by Euphorbiaceae, mainly Euphorbia decorsei. The southernmost part of Androy is a sandy area with paleodunes while the northern part is a hilly upland on Precambrian crystalline bedrock (Battistini and Richard-Vindard 1972). Since the early 1970s, the dry forest cover has been reported to be in decline, principally due to clearing for agriculture, cattle herding, timber harvest and charcoal produc-tion (Sussman et al. 1994; Sussman and Rakotozafy 1994; Sussman et al. 2003).
Technically, all non-private forested land in Madagascar is state property (Kull 2004).The traditional land claims inherited from the ancestors (tanin-drazana) related to clans and lineages are however still effective in Androy, representing a common property regime with collective owners that organize to exclude or regulate non-owners and their use of resources (Hanna et al. 1996). Customary institutions are however often challenged or weakened by top down interventions, the local formal government and modernization through institutions such as schools and churches that contradict authority based on lineage and traditional belief systems (Gezon 2006; Tengö et al. 2007). A recent legislation scheme of Madagascar, the GELOSE (Gestion Locale Sécurisée or secured local management) from 1996, allows for decentraliza-tion of management rights of renewable natural resources, including forest (Antona et al. 2002; Kull 2004), but this is not yet effective in Androy.
13.2.1 Analyses of Landsat Images
Satellite images from three different years were used for time series analysis of forest cover changes. The images from 25 June 1984, 15 April 1993, and 28 May
300 T. Elmqvist et al.
2000 respectively, were all dry season synoptic views from path/row 159/77 with 30 m resolution. The 1984 and 1993 scenes were Landsat 5 TM and the 2000 scene was a Landsat 7 ETM+. The software ERDAS 9.0 was utilised for all processing of the satellite images.
Since a classification of a whole Landsat scene covering 180 by 180 km would introduce considerable error and thereby cause misinterpretations, a subset was used from each scene, approximately 87 by 63 km (Lat 24° 47¢ and 25° 24¢ S, Lon 45° 36¢ and 46° 26¢E) (Fig. 13.1). These sub-scenes were rectified to one pixel accuracy relative to each other. An unsupervised classification containing 250 classes was performed for each of the images including the 6 bands with 30 m reso-lution. A preliminary reclassification was based on initial fieldwork in 2001, while the final classification was based on surveys carried out in May 2002 and January 2004. From the classified images, the class for dense/mature forest was extracted for further analysis.
A change detection function, utilizing ArcGIS (ESRI), was applied on the three classified forest images to show changes that had occurred between 1984, 1993, and 2000. Within the study area of 243,600 ha, we calculated the areas covered by the following classes:
Loss of forest cover:(a) Forest 84/--/--Forest in 1984 only (loss of forest after 1984)(b) Forest 84/93/--Forest in 1984 and 1993 (loss of forest after 1993)
Stable forest cover:Forest 84/93/00 Forest during 1984, 1993, and 2000
Increased forest cover:
(a) Forest --/93/00 Forest in 1993 and 2000 (increase of forest cover after 1984)(b) Forest --/--/00 Forest in 2000 only (increase of forest cover after 1993)
13.2.2 Ground-Truthing of Forest Classification
Surveys to verify forest classification were carried out in May 2002 and January 2004. We selected four areas corresponding to the three forest classes for detailed field investigations (Fig. 13.1) DEF = loss of forest cover (10,000 ha), REG = regen-erating forest (15,000 ha), STF = stable forest (22,000 ha), FAD = forest protected by fady (taboo)(13,000 ha). Criteria for selection were: (1) large and contiguous representations of each of the forest classes and (2) accessibility of these areas. The four finally selected areas were mapped using a mobile GIS system, ArcPad from ESRI, run on handheld computers/GPS. In the analyses here, we focus on stable and regenerating forests in Northern and Central Androy (areas REG and STF in Fig. 13.1). The detailed analyses of forest cover loss in area DEF and stable forest in area FAD are given in Elmqvist et al. (2007) and Tengö et al. (2007). In REG and STF we used 20 × 20 m plots to verify the classes of dense stable forest and increasing
30113 Spontaneous Regeneration of Tropical Dry Forest in Madagascar45
°50'
E46
°0'E
46°1
0'E
46°2
0'E
25 20'S25 10'S25°0'S24 50'S
010
1520
5K
mP
aleo
lake
Riv
ers
Roa
ds
For
est 8
4/93
/00
For
est -
-/93
/00
For
est -
-/--
/00
For
est 8
4/93
/--
For
est 8
4/--
/--
No
fore
stL
egen
d
Ant
anim
ora
Ifot
aka
Am
boas
ary
Sud
AM
BO
VO
MB
EA
mbo
ndro
Indi
anO
cean
RE
G
STF
DE
F
FA
D
N
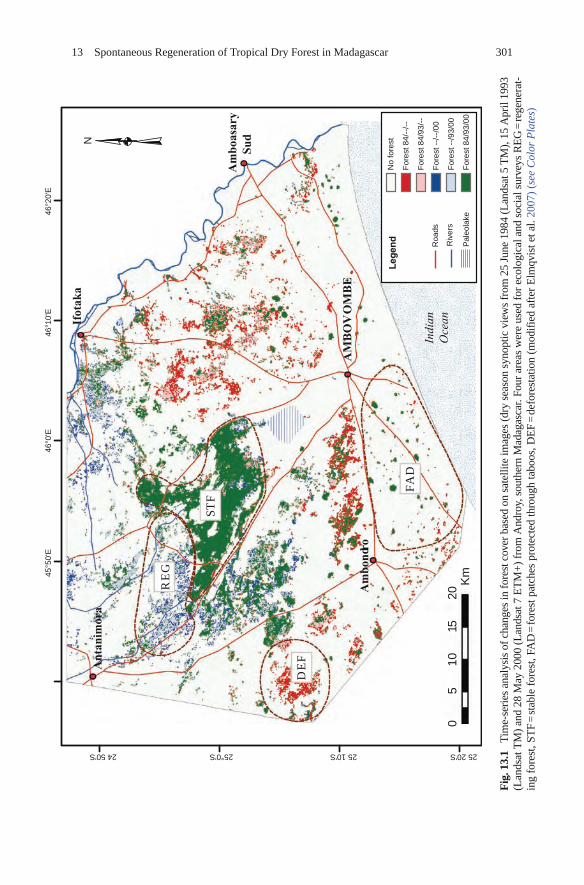
Fig
. 13.
1 T
ime-
seri
es a
naly
sis
of c
hang
es in
for
est c
over
bas
ed o
n sa
telli
te im
ages
(dr
y se
ason
syn
optic
vie
ws
from
25
June
198
4 (L
ands
at 5
TM
), 1
5 A
pril
1993
(L
ands
at T
M)
and
28 M
ay 2
000
(Lan
dsat
7 E
TM
+) f
rom
And
roy,
sou
ther
n M
adag
asca
r. Fo
ur a
reas
wer
e us
ed f
or e
colo
gica
l and
soc
ial s
urve
ys R
EG
= re
gene
rat-
ing
fore
st, S
TF
= st
able
for
est,
FAD
= fo
rest
pat
ches
pro
tect
ed th
roug
h ta
boos
, DE
F =
defo
rest
atio
n (m
odif
ied
afte
r E
lmqv
ist e
t al.
2007
) (s
ee C
olor
Pla
tes)
302 T. Elmqvist et al.
forest cover. Five plots were located in the area classified as regenerating and four plots in the area classified as stable and dense forest cover. Plots were located ran-domly within stands of Alluaudia procera.
In all plots, individual trees and shrubs were identified to the species level. Each individual’s height was estimated using a metered stick. Diameter at breast height (dbh = 130 cm) was measured for all individuals over 150 cm height. Tests of statistically significant differences in densities, height, and dbh were performed using non-parametric tests (Mann–Whitney U-test). Analyses of species richness in relation to sampling effort using the Chao index revealed that sampling efforts were adequate for the regenerating forest, but larger samples were needed in the stable forest where variation between plots was larger.
13.2.3 Analyses of Trends in Aridity
Trends in precipitation as a driver of forest change were analyzed using a national dataset (annual resolution, 1963–2005) from Direction de la Meteorologie Nationale et de l’Hydrologie in Madagascar. In order to capture the ecophysiological effects of variable precipitation, we analyzed trends in aridity expressed as no. of con-secutive days with rainfall <1 mm. Rainfall patterns in the study area are extremely variable with locally high precipitation over short periods of time and, unfortu-nately, reliable local precipitation data were unavailable for the time period 1963–2005. We compiled available data on severe arid conditions in southern Madagascar using EM-DAT: The OFDA/CRED International Disaster Database www.em-dat.net.
13.2.4 Social Surveys
Information on local views on forest cover change, drivers, and local institutions, for example the rules-in-use including property right schemes and enforcement characteristics, was obtained through interviews in all four areas. To avoid applying preconceived ideas of local institutions, we used a qualitative interview approach described by, for example, Kvale (1996) rather than a predefined questionnaire, and held semi-structured open ended interviews with a checklist. The checklists included the following questions: (a) who has access to forest resources, (b) which rules regulate access, (c) which authority is responsible for rule enforcement, and (d) to what extent are the rules actually followed and enforced. Further, we also discussed with all informants their view on forest cover changes, drivers of change and how people have responded to temporary drought conditions.
Informants included the forest officials active in Ambovombe and Antanimora, and key informants as well as other villagers in the four areas. Key informants were persons with authority in relation to forest resources at the village level, either as
30313 Spontaneous Regeneration of Tropical Dry Forest in Madagascar
representatives of the official local government, fanjakana, village presidents and counselors, or of customary authority, the fokonolona, village elders and clan leaders. These were all men of various ages. Official representatives were generally younger than persons representing the customary authority.
To supplement and triangulate their opinion, interviews were also held with women and younger persons in the villages. In total, 26 informants were inter-viewed in 10 local communities (DEF: Mareñy, Lahabe, Bemonzola n = 8; REG: Manave and Mitsoriake n = 8; STF: Ankilivalo and Belaza n = 3; FAD: Amboanaivo, Ambazoa, Marolamainty n = 7). The interviews with the forest officials had a broader geographical focus compared to the community interviews, but the foresters were also asked site specific questions for triangulation of the interview information from the local key informants.
13.3 Ecological and Social Dimensions of Forest Cover Change
13.3.1 The Ecological Dimension
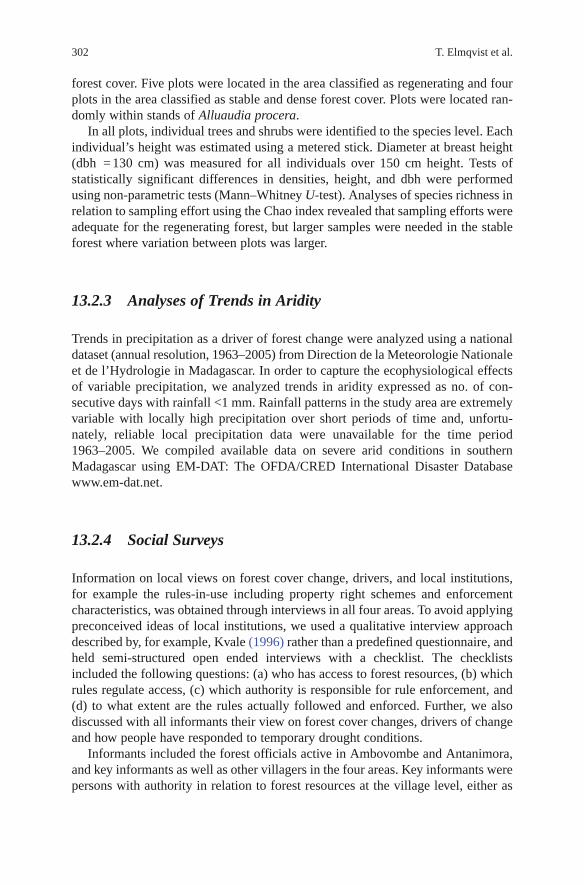
The overall results of the remote sensing analysis are shown in Fig. 13.1. Overall there was a total decrease of 7% of forest cover between 1984 and 2000 but during 1993–2000 forest cover increased by 4%. The REG area had a high density of juvenile (<2 m height) A. procera and Cedrelopsis grevei (Ptaeroxylaceae) and significantly higher densities than in the STF area (Mann–Whitney U-test, P < 0.02, Fig. 13.2).
a b c
Fig. 13.2 Analyses of (a) DBH, (b) tree height, and (c) density of juvenile plants in plots (20 × 20 m) in REG = regenerating forest (n = 5 plots) and STF = stable forest cover (n = 4 plots). Box plots – 95% confidence interval
304 T. Elmqvist et al.
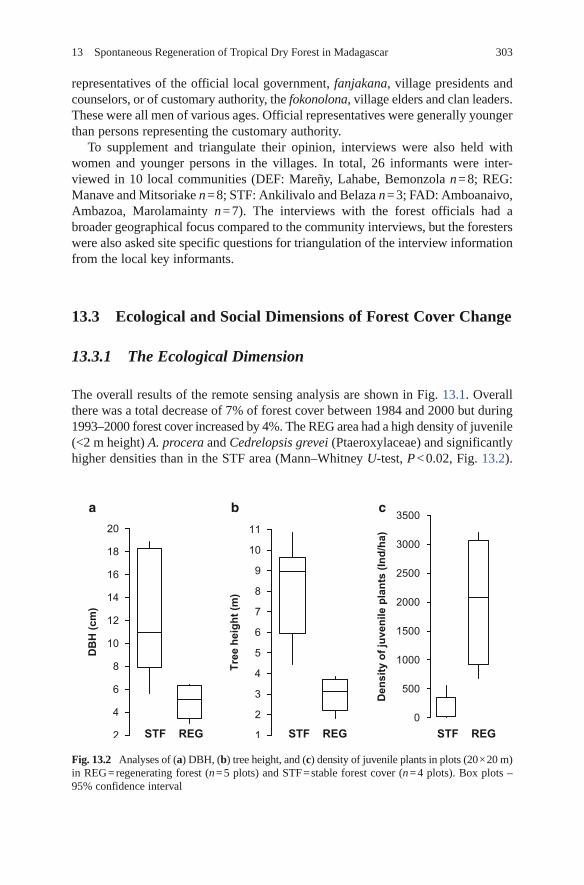
Mean height and diameter (dbh) of A. procera was significantly larger in STF than in the REG area (Mann–Whitney U-test, P < 0.02 and P < 0.05 respectively) (Fig. 13.2). Species number of woody plants >1 m height were similar in the two areas but variation in the regeneration forests was less (range 17–24, n = 5 plots) compared to the forest with stable cover (range 8–19, n = 4 plots). In the DEF area, deforestation seems to have occurred mostly in the period 1984–1993 with 1,177 ha lost and only 253 ha in the period 1994–2000 (Fig. 13.3). The pattern of increase in forest cover in REG was a more continuous process throughout the whole period (Fig. 13.3).
Previous theoretical analyses of arid and semi-arid ecosystems and degradation have emphasized that human population growth and over-grazing have led to a process of degradation, moving these ecosystems away from a natural single equilibrium state (e.g. Swift 1996), as a consequence of dry forests having a low regeneration potential (e.g. Green and Sussman 1990). This view has been increasingly challenged and recent studies have emphasized that semi-arid systems exhibit large spatial and temporal variations and are far better described in terms of non-equilibrium systems (e.g. Leach et al. 1999; Holmgren and Scheffer 2001) with different alternative states (Holmgren and Scheffer 2001). Rather than gradual responses to changing conditions, semi-arid systems may experience sudden transitions from one state to another triggered for instance by manage-ment and climatic conditions (Westoby et al. 1989; Holmgren and Scheffer 2001). Rapid recovery of vegetation in semi-arid areas, as observed in this study, has been observed elsewhere when grazing pressure falls below a low critical value (Holmgren and Scheffer 2001).
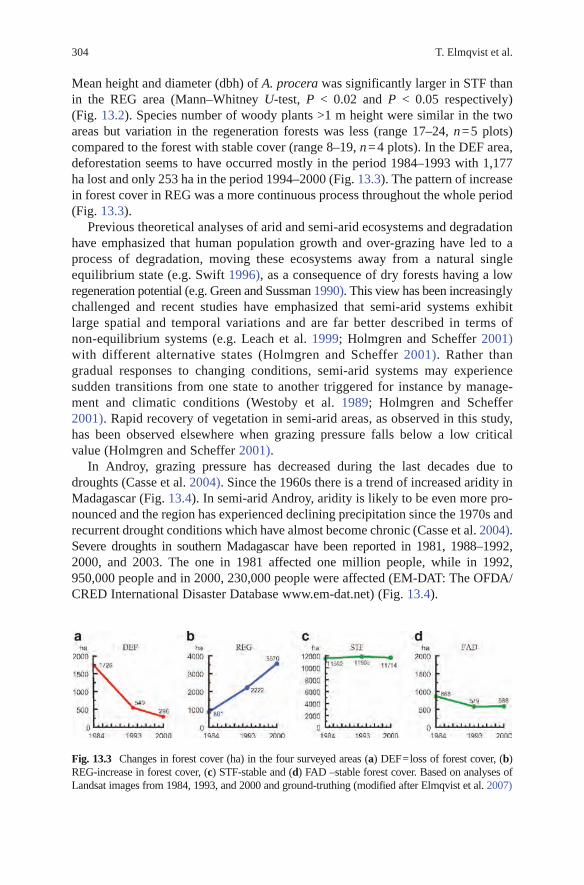
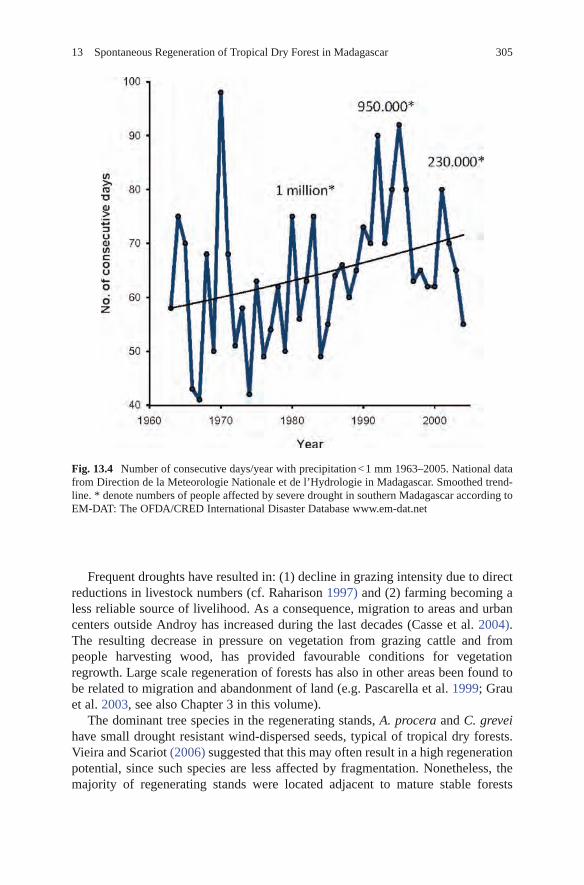
In Androy, grazing pressure has decreased during the last decades due to droughts (Casse et al. 2004). Since the 1960s there is a trend of increased aridity in Madagascar (Fig. 13.4). In semi-arid Androy, aridity is likely to be even more pro-nounced and the region has experienced declining precipitation since the 1970s and recurrent drought conditions which have almost become chronic (Casse et al. 2004). Severe droughts in southern Madagascar have been reported in 1981, 1988–1992, 2000, and 2003. The one in 1981 affected one million people, while in 1992, 950,000 people and in 2000, 230,000 people were affected (EM-DAT: The OFDA/CRED International Disaster Database www.em-dat.net) (Fig. 13.4).
Fig. 13.3 Changes in forest cover (ha) in the four surveyed areas (a) DEF = loss of forest cover, (b) REG-increase in forest cover, (c) STF-stable and (d) FAD –stable forest cover. Based on analyses of Landsat images from 1984, 1993, and 2000 and ground-truthing (modified after Elmqvist et al. 2007)
30513 Spontaneous Regeneration of Tropical Dry Forest in Madagascar
Frequent droughts have resulted in: (1) decline in grazing intensity due to direct reductions in livestock numbers (cf. Raharison 1997) and (2) farming becoming a less reliable source of livelihood. As a consequence, migration to areas and urban centers outside Androy has increased during the last decades (Casse et al. 2004). The resulting decrease in pressure on vegetation from grazing cattle and from people harvesting wood, has provided favourable conditions for vegetation regrowth. Large scale regeneration of forests has also in other areas been found to be related to migration and abandonment of land (e.g. Pascarella et al. 1999; Grau et al. 2003, see also Chapter 3 in this volume).
The dominant tree species in the regenerating stands, A. procera and C. grevei have small drought resistant wind-dispersed seeds, typical of tropical dry forests. Vieira and Scariot (2006) suggested that this may often result in a high regeneration potential, since such species are less affected by fragmentation. Nonetheless, the majority of regenerating stands were located adjacent to mature stable forests
Fig. 13.4 Number of consecutive days/year with precipitation < 1 mm 1963–2005. National data from Direction de la Meteorologie Nationale et de l’Hydrologie in Madagascar. Smoothed trend-line. * denote numbers of people affected by severe drought in southern Madagascar according to EM-DAT: The OFDA/CRED International Disaster Database www.em-dat.net

306 T. Elmqvist et al.
(Fig. 13.1) but it is notable that the regenerating forest was as species rich, or richer, than the mature forests. The latter suggests that the regeneration process was not severely limited by seed dispersal.
Large-scale regeneration of tropical forests has been argued to be greatly over-looked (Grainger 2008), but represents an important economic potential as well as a potential for conservation of biodiversity (e.g. Chazdon 1998; Bawa and Siedler 1998) and carbon sink services (Ramirez et al. 2002). Vieira and Scariot (2006) concluded in their review that contrary to the common perceptions about dry forests there is a high potential for regeneration due to: (i) high proportion of small seeded wind-dispersed species, (ii) high ability of sprouting after disturbance and (iii) rela-tively simple community diversity and structure. Whether or not an area will regen-erate may perhaps therefore, in many areas, be less a question of ecological constraints, and instead determined by social variables.
13.3.2 The Social Dimension
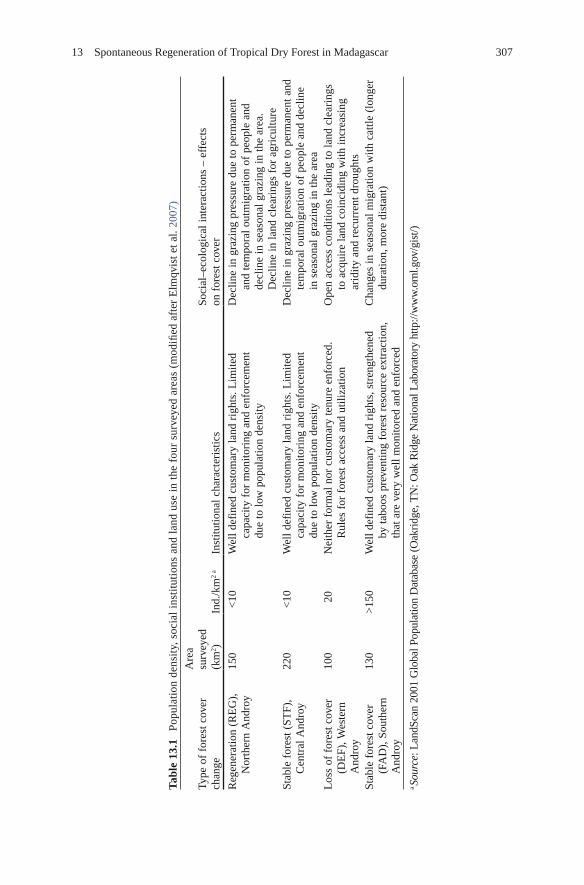
The four areas are within 50 km of each other but still display considerable differ-ence in terms of rules-in-use. The DEF area, characterized by loss of forest cover was found to have insecure property rights and failing rule enforcement whereas the REG, STF and FAD areas with stable or regenerating forest cover all were found to have well defined property rights (Table 13.1). Across all four areas, the formal national rules regarding land clearing or tree cutting were not efficiently enforced. This was repeatedly confirmed by the forest officers, stating lack of fund-ing as the main reason. The most strict and well reinforced rule was the informal taboo against harvesting in certain portions of forest in all four areas, which applied to all forest patches in southern Androy (see Table 13.1).
In the DEF area in western Androy, local informants and the forest officer in charge described a situation where the transition from forest to cleared or partly cleared land had occurred as a response to insecure property rights. Customary rules were not enforced as the tompon-tany, the land owners by ancestral laws, had migrated from the area during early nineteenth century (Heurtebize 1986). The present inhabitants settled around the 1950s, and in an analysis of aerial photos from this period, the forest was found to as regenerate in abandoned fields. Following the more limited governmental forest control after independence 1960 (see Duffy 2006), forest clearing was used during the 1980s to secure individual land rights as the collective rights enforced by customary authority was no longer in place. Several recent clearings and signs of extensive cutting were observed in May 2003 and January 2004.
In REG and STF in northern and central Androy, settlements are currently small and scattered. The forest is utilized as a seasonal resource for cattle herding by people from the more densely populated south and southwest, and informants claim well defined property rights (Table 13.1). For example, seasonal dwellers need to pay respect to the tompon-tany, and generally do so and the procedure is well
30713 Spontaneous Regeneration of Tropical Dry Forest in Madagascar
Tab
le 1
3.1
Pop
ulat
ion
dens
ity,
soc
ial
inst
itut
ions
and
lan
d us
e in
the
fou
r su
rvey
ed a
reas
(m
odifi
ed a
fter
Elm
qvis
t et a
l. 20
07)
Type
of
fore
st c
over
ch
ange
Are
a su
rvey
ed
(km
2 )In
d./k
m2
aIn
stitu
tiona
l cha
ract
eris
tics
Soci
al–e
colo
gica
l int
erac
tions
– e
ffec
ts
on f
ores
t cov
er
Reg
ener
atio
n (R
EG
),
Nor
ther
n A
ndro
y15
0 <
10W
ell d
efin
ed c
usto
mar
y la
nd r
ight
s. L
imite
d ca
paci
ty f
or m
onito
ring
and
enf
orce
men
t du
e to
low
pop
ulat
ion
dens
ity
Dec
line
in g
razi
ng p
ress
ure
due
to p
erm
anen
t an
d te
mpo
ral o
utm
igra
tion
of p
eopl
e an
d de
clin
e in
sea
sona
l gra
zing
in th
e ar
ea.
Dec
line
in la
nd c
lear
ings
for
agr
icul
ture
Stab
le f
ores
t (ST
F),
Cen
tral
And
roy
220
<10
Wel
l def
ined
cus
tom
ary
land
rig
hts.
Lim
ited
ca
paci
ty f
or m
onito
ring
and
enf
orce
men
t du
e to
low
pop
ulat
ion
dens
ity
Dec
line
in g
razi
ng p
ress
ure
due
to p
erm
anen
t and
te
mpo
ral o
utm
igra
tion
of p
eopl
e an
d de
clin
e in
sea
sona
l gra
zing
in th
e ar
eaL
oss
of f
ores
t cov
er
(DE
F), W
este
rn
And
roy
100
20
Nei
ther
for
mal
nor
cus
tom
ary
tenu
re e
nfor
ced.
R
ules
for
for
est a
cces
s an
d ut
iliza
tion
Ope
n ac
cess
con
ditio
ns le
adin
g to
land
cle
arin
gs
to a
cqui
re la
nd c
oinc
idin
g w
ith in
crea
sing
ar
idity
and
rec
urre
nt d
roug
hts
Stab
le f
ores
t cov
er
(FA
D),
Sou
ther
n A
ndro
y
130
>15
0W
ell d
efin
ed c
usto
mar
y la
nd r
ight
s, s
tren
gthe
ned
by
tabo
os p
reve
ntin
g fo
rest
res
ourc
e ex
trac
tion,
th
at a
re v
ery
wel
l mon
itore
d an
d en
forc
ed
Cha
nges
in s
easo
nal m
igra
tion
with
cat
tle (
long
er
dura
tion,
mor
e di
stan
t)
a Sou
rce:
Lan
dSca
n 20
01 G
loba
l Pop
ulat
ion
Dat
abas
e (O
akri
dge,
TN
: Oak
Rid
ge N
atio
nal L
abor
ator
y ht
tp://
ww
w.o
rnl.g
ov/g
ist/)
308 T. Elmqvist et al.
recognized by the formal village authority. However, the informants claimed rule enforcement was challenging as the area is vast and scarcely populated, and poten-tially some undetected logging could occur. Both of the dominant species in the regeneration area, A. alluaudia and C. grevei, have a high economic value mainly as source for charcoal production. There is therefore a high risk of future loss of forest cover if the current social institutions fail in rule enforcement, and outsiders start logging in the area.
13.3.3 The Social–Ecological Dimension
This volume clearly shows that insights into the social and ecological context in which reforestation may occur are required to enhance forest management and human livelihoods. We found in this study that local communities and the existence of social capital, expressed as shared norms and rules within communities, can contribute to favorable conditions for forest regeneration. Human presence is often routinely seen by external observers as a threat to forest ecosystems and biodiver-sity. While this may be true in a general sense, the view that separates people and ecosystems provides no constructive means to move forward and also overlooks essential dynamics that underlies the patterns and trends of biodiversity and resource use that emerge in a landscape.
Patterns of forest loss and regeneration have long been shaped by human activi-ties in Madagascar (Kull 2004). In the south, Dawson and Ingram (2008) demon-strate that environmental change in south-eastern Madagascar is highly variable in space and time, and that cover, quality, and composition of the littoral forest is related to human activities such as timber harvest, coppicing for fuel wood, and harvest of medicinal plants and indirect drivers such as population density. Kaufmann and Tsirahamba (2006) provide a detailed account of how the Mahafaly pastoralists view the dry forests of the southwest as essential reserves for browse and fodder in times of drought. The herders open up areas of pasture in the forest by grazing animals, and plant and encourage species that provide sources of water and fodder for cattle, such as the endemic Euphorbia stenoclada.
We find that a key factor driving changes in forest cover patterns and dynamics are human responses to social and ecological drivers, as mediated by local institu-tions. Corroborating this, several authors describe spiritual values assigned to forests by local people in Madagascar, values that in some instances have been formally recognized as an asset for conservation (Horning 2003b; McConnell and Sweeney 2005; Schachenmann 2006; Tengö et al. 2007). For example, the detailed study of the patchy forest landscape in southern Androy reveal that the scattered patches are created and maintained by cultural practices and well enforced religious taboos (Tengö et al. 2007). Thus, we argue that forest ecosystems where human presence is significant are best described and understood as social–ecological systems, where social and ecological processes interact and reinforce each other, creating situations favoring forest loss, stable cover or regeneration (Berkes and Folke 1998).
30913 Spontaneous Regeneration of Tropical Dry Forest in Madagascar
A key insight from the studies mentioned above is that not only do we need to see human activities as intrinsic to ecosystem dynamics; we also need to acknowledge that they are not always detrimental for goals such as high biodiversity or capacity of forest ecosystems to regenerate. Some practices may enhance the capacity of an ecosystem to generate services that human rely upon (Tengö M 2004) while enhanc-ing diversity and building resilience in the social–ecological system (Berkes and Folke 1998; Berkes et al. 2003). Fairhead and Leach (1996) showed how farmers’ everyday activities in the forest-savanna transition zone of West Africa increased the density of woody vegetation and positively influenced the formation of forests in fallow and savanna areas. By controlling fire, and influencing soil fertility and tree regeneration, farmers managed to move the system across thresholds between vegetation states of grass or woody species dominance.
The taboo forests in southern as well as other parts of Androy, ranging in size up to ~ 100 ha, are often old growth forests that may serve as important propagule sources for dispersal and colonization of the surrounding areas (cf. Chazdon 2003). Even though our data cannot show a clear linkage between the areas of forests protected by taboos and forest regeneration, these areas are likely to add to the capacity of the system to regenerate through providing (a) propagule sources for dispersal and colonization of the other areas, and (b) undisturbed habitat for “mobile links” (Lundberg and Moberg 2003) such as lemurs (i.e. Lemur catta) and forest birds that act as vectors for seed dispersal (see Bodin et al. 2006). Dawson and Ingram (2008) show empirically that harvest intensity of forest products in southeastern Madagascar are not necessarily associated with lower diversity or conservation values. The adaptive and seasonal use of forest resources by the pas-toralist Mahafaly west of Androy (Kaufmann 2008) may create opportunity for regeneration, and introduces small scale disturbances that add to the heterogeneity of the forest, thus increasing resilience (cf. Bengtsson et al. 2003).
The relationship between human presence and density, and biodiversity and poten-tial for regeneration is not necessarily negative but clearly complex. In general, change may be driven by external factors but manifests itself locally and the scale of agency – the direct causation of action – is often intrinsically localized (Wilbanks and Kates 1999). As a consequence, processes that are of a similar type can lead to dif-ferent outcomes in areas separated by only short geographical distances. In Androy, human responses to increasing aridity had very different consequences. In the north, outmigration, decreased grazing pressure and stability of property regimes, contrib-uted to conditions for forest regeneration. However, in Western Androy, previous migration and abandonment contributed to a situation with insecure property rights, insufficient monitoring and enforcement of local rules, and degrading forest (cf. Sheperd 1992; Seddon et al. 2000; Horning 2003b; Casse et al. 2004). There is thus an urgent need for a greater understanding of the positive and negative feedback interactions in an interlinked social–ecological system.
The role of social institutions in mediating human responses to change has proven to be a useful framework for understanding the outcome of social–ecological interactions and the consequences for forest ecosystems and the services they generate (Gibson et al. 2000; Berkes and Folke 1998; Lambin et al. 2001).

310 T. Elmqvist et al.
Corresponding to the findings of this study, Nagendra (2007) reports from an analy-sis of 55 forests in Nepal, that type of land tenure and degree of monitoring were the most important factors for understanding forest regeneration. In particular, monitoring and rule enforcement have been identified as key aspects of institutions for sustainable resource use (Ostrom 1990; Gibson et al. 2005). Hayes (2006) recently argued that rather than formal legal definitions of forest protection (e.g. parks), it was the informal rules acknowledged and made by forest users, that influ-enced forest conditions in both parks and formally unprotected forests. More research is urgently needed regarding how legitimate norms and rules develop in relation to local role of local ecological knowledge and understanding, how such rules may be adaptive and responsive to ecosystem dynamics, and in what contexts they create conditions beneficial for forest regeneration (cf. Sánchez-Azofeifa et al. 2005).
In conclusion, we want to emphasize that interpretation of patterns of forest regeneration need to include simultaneous studies of changing environmental factors and existing and changing characteristics of social institutions. Our study points to the large, but often neglected, capacity of a semi-arid system to spontaneously regenerate given a window triggered by changing precipita-tion and grazing pressure. The outcome however, is critically dependent on functioning social institutions that develop along with an understanding of the local ecosystem.
Acknowledgments We thank Chantal Radimilahy, Elisabeth Rabakonandrianina, Paul Sinclair and Jean-Aimé Rakotoarisoa for help, advice and support throughout this study. We thank Jean-Aimé Andriamaherilala for fieldwork guidance and translation. We also thank Mark Fenn, WWF Madagascar, and the villagers in Manave, Mitsoriake, Mareñy, Lahabe and Amboanaivo for assistance during fieldwork. The study was supported by grants from Sida/Sarec and Formas. The analyses presented here builds on and is an extension of analyses published by the authors in PLoSONE (Elmqvist et al. 2007)
References
Achard FHD, Eva HJ, Stibig P et al (2002) Determination of deforestation rates of the world’s humid tropical forests. Science 297:999–1002
Antona M, Motte E, Salles J-M et al (2002) Property rights transfer in Madagascar biodiversity policies. Paper presented at BioEcon Rome meeting, Rome, 30–31 May 2002
Battistini R, Richard-Vindard G (1972) Biogeography and ecology in Madagascar. Dr. W Junk B.V. Publishers, Hague
Bawa KS, Siedler R (1998) Natural forest management and conservation of tropical biodiversity. Conserv Biol 12:46–55
Bodin Ö, Tengö M, Norman A et al (2006) The value of small size: loss of forest patches and thresholds in southern Madagascar. Ecol Appl 16:440–451
Bengtsson J, Angelstam P, Elmqvist T et al (2003) Reserves, resilience, and dynamic landscapes. Ambio 32:389–396
Berkes F, Colding J, Folke C, eds. (2003) Navigating Social-Ecological Systems: Building Resilience for Complexity and Change. Cambridge: Cambridge University Press
31113 Spontaneous Regeneration of Tropical Dry Forest in Madagascar
Berkes F, Folke C, eds. (1998) Linking Social and Ecological Systems. Management Practices and Social Mechanisms for Building Resilience. Cambridge: Cambridge University Press.
Casse T, Milhoj A, Ranaivoson S et al (2004) Causes of deforestation in southwestern Madagascar: what do we know? Forest Policy Econ 6:33–48
Chazdon RL (1998) Tropical forests – log ’em or leave ’em? Science 281:1295–1296Chazdon RL (2003) Tropical forest recovery: legacies of human impact and natural disturbances.
Perspect Plant Evol Syst 6:51–71Dewar RE, Wallis JR (1999) Geographical patterning of interannual rainfall variability in the trop-
ics and near tropics: an L-moments approach. J Clim 12:3457–3466Dietz T, Ostrom E, Stern PC (2003) The struggle to govern the commons. Science
302:1907–1912Dunn RR (2004) Recovery of faunal communities. Conservation Biology 18:302–309.Du Puy D, Moat J (1996) A refined classification of the primary vegetation in Madagascar based
on the underlying geology: using GIS to map its distribution and to assess its conservation status. In: Lourenco WR (ed) Biogéographe de Madagascar. Editions ORSTROM, Paris
Duffy R (2006) Non-governmental organisations and governance states: The impact of transna-tional environmental management networks in Madagascar. Environ Polit 15:731–749
Elmqvist T (2004) The forgotten dry forest of southern Madagascar. Plant Talk 35:29–31Elmqvist T, Pyykönen M, Tengö M et al (2007) Patterns of loss and regeneration of tropical dry
forest in Madagascar: The social institutional context. PLoS ONE 2(5):e402. doi:10.1371/journal.pone.0000402
Fairhead J, Leach M (1996) Misreading the African landscape; Society and ecology in a forest-savanna mosaic. Cambridge University Press, Cambridge
Fenn M (2003) The spiny forest ecoregion. In: Goodman SM, Benstead JP (eds) The natural his-tory of Madagascar. University of Chicago Press, Chicago, IL
Gezon L (2006) Global visions, local landscapes. A political ecology of conservation, conflict, and control in Northern Madagascar. Altamira Press, Lanham, MD
Gibson C, McKean MA, Ostrom E (2000) People and forests. Communities, institutions and governance. The MIT Press, Cambridge, MA
Gibson CC, Williams JT, Ostrom E (2005) Local enforcement and better forests. World Development 33:273–284
Grainger A (2008) Difficulties in tracking the long-term global trend in tropical forest area. Proc Natl Acad Sci U S A, 10.1073/pnas.0703015105
Grau HR, AideTM ZJK et al (2003) The ecological consequences of socioeconomic and land-use changes in postagriculture Puerto Rico. Bioscience 53:1159–1168
Green GM, Sussman RW (1990) Deforestation history of eastern rain forests of Madagascar from satellite images. Science 248:212–215
Hanna S, Folke C, Mäler K-G (1996) Rights to nature. Island Press, Washington, DCHayes TM (2006) Parks, people, and forest protection: an institutional assessment of the effective-
ness of protected areas. World Dev 34:2064–2075Heurtebize G (1986) Histoire des Afomarolahy (Extrême-Sud de Madagascar). CNRS, ParisHolmgren M, Scheffer M (2001) El Niño as a window of opportunity for the restoration of
degraded arid ecosystems. Ecosystems 4:151–159Horning NR (2003a) How rules affect conservation outcomes. In: Goodman SM, Benstead JP
(eds) The natural history of Madagascar. Chicago University Press, Chicago, IL, pp 146–153Horning NR (2003b) The cost of ignoring rules: how Madagascar’s biodiversity and rural liveli-
hoods have suffered from institutional shortcomings. Paper presented at The International Conference on Rural Livelihoods, Forests and Biodiversity, Bonn, Germany, 19–23 May 2003
Horning NR (2008) Madagascar’s biodiversity conservation challenge: from local- to national-level dynamics. Environ Sci 5:109–128
Kaufmann JC (2008) The non-modern constitution of famines in Madagascar’s spiny forests: “water-food” plants, cattle and Mahafale landscape praxis. Environ Sci 5:73–89
Kaufmann JC, Tsirahamba S (2006) Forests and thorns: conditions of change affecting Mahafale pastoralists in Southwestern Madagascar. Conserv Soc 4:231–261
312 T. Elmqvist et al.
Koechlin J (1972) Flora and vegetation of Madagascar. In: Battistini R, Richard-Vindard G (eds) Biogeography and ecology in Madagascar. Dr. W Junk B.V. Publishers, Hague
Kull CA (2004) Isle of fire. The political ecology of landscape burning in Madagascar. The University of Chicago Press, Chicago, IL
Kvale S (1996) Interviews: an introduction to qualitative research interviewing. Sage, Thousand Oaks, CA
Lambin E, Geist HJ, Lepers E (2003) Dynamics of land-use and land-cover change in tropical regions. Annu Rev Environ Res 28:205–241
Lambin EF, Turner BL, Geist HJ et al (2001) The causes of land-use and land-cover change: moving beyond the myths. Global Environ Change-Hum Policy Dimens 11:261–269
Leach M, Mearns R, Scoones I (1999) Environmental entitlements: dynamics and institutions in community-based natural resource management. World Dev 27:225–247
Lingard M, Raharison N, Rabakonandrianina E et al (2003) The role of local taboos in conserva-tion and management of species: the Sokake or radiated tortoise (Geochelone radiata) in southern Madagascar. Conserv Soc 1:223–246
Lundberg J, Moberg F (2003) Mobile link organisms and ecosystem functioning: implications for ecosystem resilience and management. Ecosystems 6:87–98
McConnell WJ, Sweeney SP (2005) Challenges of forest governance in Madagascar. Geogr J 171:223–238
Nagendra H (2007) Drivers of reforestation in human-dominated forests. PNAS 104:15218–15223Olson DM, Dinerstein E (2002) The global 200: priority ecoregions for global conservation. Ann
Missouri Bot Gard 89:199–224Ostrom E (1990) Governing the commons. The evolution of institutions for collective action.
Cambridge University Press, CambridgePascarella JB, Aide TM, Serrano MI et al (1999) Land use history and forest regeneration in the
Cayey mountains, Puerto Rico. Ecosystems 3:217–228Pretty J (2003) Social capital and the collective management of resources. Science 302:1912–1914Rabesandratana R (1984) Flora of the Malagasy southwest. In: Jolly A, Oberlé P, Albignac R (eds)
Madagascar. Pergamon Press, Oxford, pp 55–74Raharison L-JR (1997) Effets et conséquences sur le régime des aquifères des anomalies clima-
tiques dans l’extreme sud de Madagascar: cas du bassin endoréique d’Ambovombe. Cachiers Sécheresse 8:129–137
Ramirez OA, Carpio CE, Ortiz R (2002) Economic value of the carbon sink services of tropical secondary forests and its management implications. Environ Res Econ 21:23–46
Richard AF, Dewar RE, Schwartz M et al (2002) Life in the slow lane? Demography and life histories of male and female sifaka (Propithecus verreauxi verreauxi). J Zool 256:421–436
Sánchez-Azofeifa G et al (2005) Research priorities for neotropical dry forests. Biotropica 37:477–485Schachenmann P (2006) Spiritual values in Madagascar – the starting point for endogenous con-
servation initiatives. Mount Res Dev 26:323–327Seddon N, Tobias J, Yount JW et al (2000) Conservation issues and priorities in the Mikea forest
of south-west Madagascar. Oryx 34:287–304Sheperd G (1992) Managing Africa’s tropical dry forests. A review of indigenous methods.
Overseas Development Institute, LondonSussman RW, Rakotozafy A (1994) Plant diversity and structural-analysis of a tropical dry forest
in Southwestern Madagascar. Biotropica 26:241–254Sussman RW, Green GM, Sussman LK (1994) Satellite imagery, human-ecology, anthropology,
and deforestation in Madagascar. Hum Ecol 22:333–354Sussman RW, Green GM, Porton I et al (2003) A survey of the habitat of Lemur catta in
Southwestern and Southern Madagascar. Primate Conserv 19:32–57Swift J (1996) Desertification, narratives, winners and losers. In: Leach M, Mearns R (eds) The
lie of the land: challenging received wisdom in African environmental change. James Currey/International African Institute, London, pp 73–90
Tengö M (2004) Management practices for dealing with uncertainty and change-Social-ecological systems in Tanzania and Madagascar [PhD-thesis]. Stockholm, Sweden: Stockholm University

31313 Spontaneous Regeneration of Tropical Dry Forest in Madagascar
Tengö M, Johansson K, Rakotondrasoa F et al (2007) Taboos and forest governance: informal protection of hot spot dry forest in southern Madagascar. Ambio 36:683–691
Tucker CM, Munroe DK, Nagendra H et al (2005) Comparative spatial analyses of forest conser-vation and change in Honduras and Guatemala. Conserv Soc 3:174–200
Vieira D, Scariot A (2006) Principles of natural regeneration of tropical dry forests for restoration. Restor Ecol 14:11–20
Westoby M, Walker B, Noy-Meir I (1989) Opportunistic management for rangelands not at equi-librium. J Range Manag 42:266–274
Wilbanks TJ, Kates RW (1999) Global change in local places: how scale matters. Clim Change 43:601–628

315H. Nagendra and J. Southworth (eds.), Reforesting Landscapes: Linking Pattern and Process, Landscape Series 10, DOI 10.1007/978-1-4020-9656-3_14, © Springer Science+Business Media B.V. 2010
P. Meyfroidt () and E.F. Lambin Department of Geography, University of Louvain, Louvain-La-Neuve, Belgium e-mail: [email protected]
Chapter 14Forest Transition in Vietnam and Bhutan: Causes and Environmental Impacts
Patrick Meyfroidt and Eric F. Lambin
14.1 Introduction
Prospects for a forest transition in Tropical Asia would have wide implications for global environmental change. Data from the latest Forest Resources Assessment (FAO 2006) showed a net increase in forest cover between 1990 and 2005 in four Asian countries: Bhutan, India, China, and Vietnam (Kauppi et al. 2006; Mather 2007, Chapters 7 and 15). Vietnam had been severely deforested during the previous
316 P. Meyfroidt and E.F. Lambin
decades (FAO 1993). Since the mid-1990s, however, the deforestation trend has been largely reversed and forest cover has increased notably, although not every-where in the country.
This reforestation was accompanied by political and economic changes in favour of decentralisation and liberalisation (i.e., the Doi Moi reforms initiated in the 1980s, as a response to the economic stagnation of the country). These changes induced rapid economic growth and the development of the industrial and service sectors, and also strongly affected the agricultural and forestry sectors (Kerkvliet and Porter 1995; Pingali et al. 1997). Forestry policies and reforestation programs were also the government’s response to the increasing scarcity of forests. Farmers also responded to land degradation and scarcity by changing their agricultural practices.
In this chapter we describe the forest transition that took place in Vietnam. We then analyse it by reference to the main pathways of reforestation proposed in the emerging theory of forest transition (Rudel et al. 2005, Chapter 3). We also evaluate the impacts of this forest transition on two of the main environmental attributes of forests: biomass carbon stock, and changes in habitat quality and fragmentation. Finally, we present more briefly what is known on the forest transi-tion in Bhutan.
14.2 Methods
14.2.1 Study Areas
14.2.1.1 Vietnam
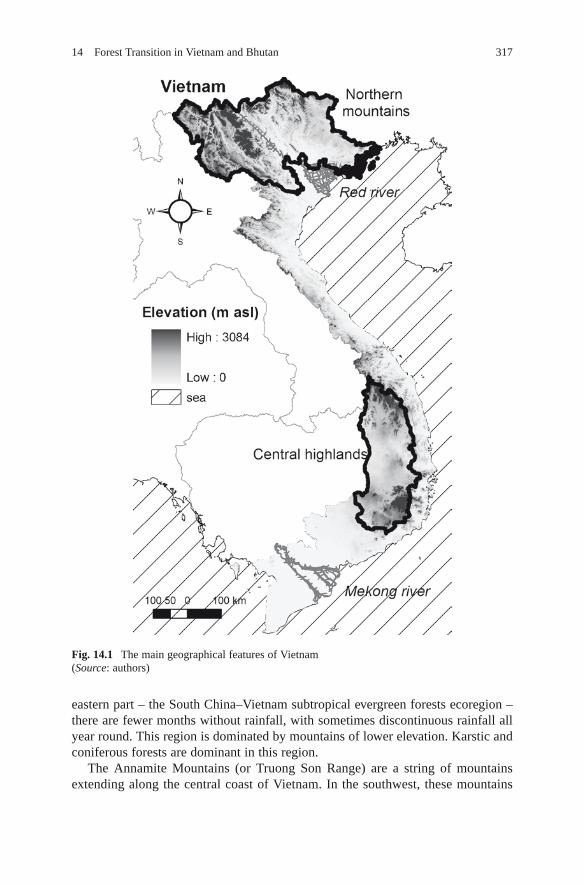
Vietnam is characterised by a large range of biophysical conditions due to its longitudinal extension, topography and location at the southeastern edge of mainland Asia (Sterling et al. 2006). It is therefore divided in highly diverse ecore-gions (Wikramanayake et al. 2001). One fourth of the country lies below 20 m of elevation, corresponding mainly to the deltas of the two major rivers, the Mekong and the Red River (Fig. 14.1). These two regions are densely populated and mostly covered by agriculture. Another fourth of the country lies above 625 m, while the remaining half is covered by hills, lower slopes, and plateaus.
The northern mountains – the largest mountainous area – are characterized by a relatively colder and more seasonal climate than the rest of Vietnam. This region marks the transition between the northern distributional limit of tropical plants and the southern distributional limit of subtropical and temperate ones. The dominant formation is evergreen forests of broad-leaved and coniferous trees, with pockets of semi-evergreen forests and specific communities of limestone forests. The western part – the Northern Indochina subtropical forests ecoregion – has a more pronounced dry season due to a winter westerly wind. The cool winter temperatures and higher elevation bring a montane flora with a noticeable Himalayan component. In the
31714 Forest Transition in Vietnam and Bhutan
eastern part – the South China–Vietnam subtropical evergreen forests ecoregion – there are fewer months without rainfall, with sometimes discontinuous rainfall all year round. This region is dominated by mountains of lower elevation. Karstic and coniferous forests are dominant in this region.
The Annamite Mountains (or Truong Son Range) are a string of mountains extending along the central coast of Vietnam. In the southwest, these mountains
Fig. 14.1 The main geographical features of Vietnam (Source: authors)
318 P. Meyfroidt and E.F. Lambin
extend into a series of high plateaus composing a region usually called the central highlands. The Annamite Mountains and central highlands have a generally wetter and hotter climate than the north, especially as one moves southward. The forests are mainly evergreen with tropical families, although temperate families begin to dominate as elevation increases. Coniferous trees are an important component of these forests. In the south, lower elevations and especially eastern slopes in the rain shadow of the mountains are drier and characterised by semi-evergreen or deciduous forests – the Southeastern Indochina dry evergreen forests ecoregion. The central region also comprises, at the border with Cambodia, a dry plain of deciduous dipterocarp forests – the Central Indochina dry forests ecoregion.
After decades of war, Vietnam was officially reunified under socialist rule in 1976. A socialist economic model, including collectivised farming, was imple-mented in the south of Vietnam as it had been already the case in the north. However, from the 1980s, the economic and food crisis, and the spread of an informal economy triggered reforms towards liberalisation, de-collectivisation and decentralisation (Kerkvliet 1995; Irvin 1995).
This study covers roughly the whole country, although some data and state-ments apply primarily to the main forested regions – that is the upland regions described above.
14.2.1.2 Bhutan
Bhutan is a Buddhist kingdom that lies in the eastern Himalayas, at an altitude ranging from 200 m to almost 8,000 m. The country is dominated in the north by the Himalayas. Most of the population is concentrated in isolated valleys in the highlands. This region is characterised by many rivers and large forests. The extreme south of the country consists mostly of tropical plains where agricultural land is concentrated. Centuries of isolationism, the Buddhist culture, a small popu-lation, and the rugged topography have helped Bhutan to preserve rather intact ecosystems. The country harbors a very high richness of species per unit area. Bhutan has enjoyed political stability over the long term. Government policies have pursued sustainable development objectives for several decades. Bhutan was only opened to foreigners in the 1970s, and to technologies allowing communication with the outside world even more recently.
14.2.2 Data and Methods
14.2.2.1 Vietnam
Meyfroidt and Lambin (2008b) assembled all available land cover maps of Vietnam derived by remote sensing, and homogenised their thematic content and spatial details. These maps were compared with the official forest cover maps from the
31914 Forest Transition in Vietnam and Bhutan
government of Vietnam for the early and late 1990s. The spatial patterns of these maps were compared using Fuzzy Kappa, Kappa Location and other indicators (Hagen-Zanker et al. 2005). The most consistent maps were then compiled with other available statistics of forest cover to build a time series of forest cover for Vietnam for the last few decades.
The causes of the reforestation during the 1990s were assessed using statistical analyses (Meyfroidt and Lambin 2008a). Two multivariate spatial lag regres-sions were performed, using data at the district level over the whole country, to explain respectively the changes in natural and planted forest cover. All analyses of the pathways of forest transition (Section 14.3.3) were based on these results, supported and interpreted by a review of local case studies (Meyfroidt and Lambin 2008a).
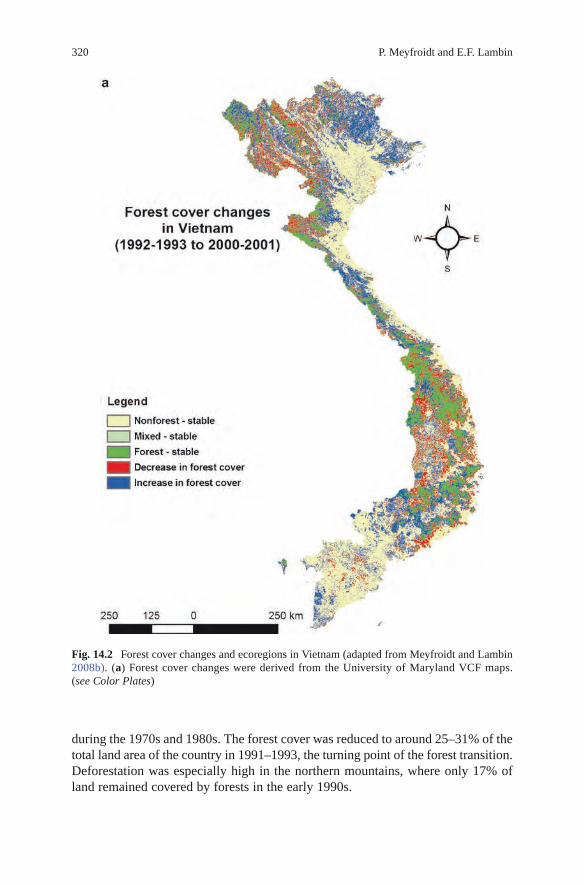
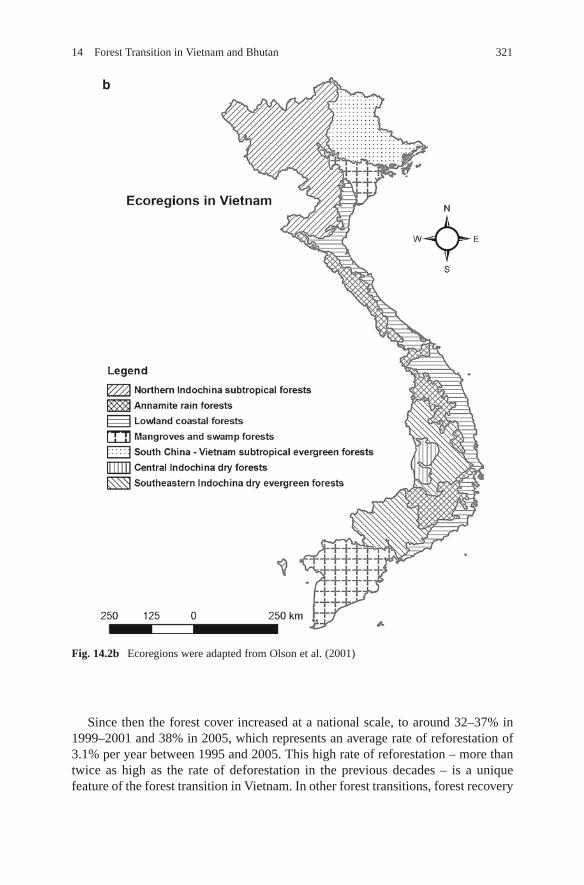
Finally, the environmental impacts of the forest transition were assessed. Meyfroidt and Lambin (2008b) evaluated the changes in forest fragmentation for the different ecore-gions of the country. The Vegetation Continuous Fields data of 1992–1993 and 2000–2001, produced by University of Maryland (DeFries et al. 2000; Hansen et al. 2003), which were among the most consistent datasets identified during the reconstruction of time series of forest cover, were used (Fig. 14.2a). These were the only pair of data produced by the same methodology, thus minimizing spurious effects on landscape indices. Ecoregion maps were adapted from Olson et al. (2001) (Fig. 14.2b).
Forest cover data from the Forest Inventory and Planning Institute of Vietnam (FIPI), available for 1980, 1992–1993, 1995, and 2005, were also among the most consistent datasets. Estimates of biomass carbon density (aboveground and below-ground) for the different forest types and densities present in these data were based on the literature. Based on these parameters, Meyfroidt and Lambin (2008b) esti-mated the total biomass carbon stock and average values of carbon density for dif-ferent years and forest categories.
14.2.2.2 Bhutan
No formal data analysis was conducted for Bhutan as we only offer here a preliminary and more superficial analysis compared to Vietnam. We relied on a review of the literature and data from the successive FAO Forest Resource Assessments. A more in-depth study is forthcoming.
14.3 Results
14.3.1 The Pattern of Forest Transition in Vietnam
The reconstructed time series confirm unambiguously that a forest transition took place in Vietnam (Fig. 14.3). Vietnam experienced several decades of deforestation at least since the 1930s, with the highest rates – averaging 1.4% per year – reached
320 P. Meyfroidt and E.F. Lambin
Fig. 14.2 Forest cover changes and ecoregions in Vietnam (adapted from Meyfroidt and Lambin 2008b). (a) Forest cover changes were derived from the University of Maryland VCF maps. (see Color Plates)
during the 1970s and 1980s. The forest cover was reduced to around 25–31% of the total land area of the country in 1991–1993, the turning point of the forest transition. Deforestation was especially high in the northern mountains, where only 17% of land remained covered by forests in the early 1990s.
32114 Forest Transition in Vietnam and Bhutan
Fig. 14.2b Ecoregions were adapted from Olson et al. (2001)
Since then the forest cover increased at a national scale, to around 32–37% in 1999–2001 and 38% in 2005, which represents an average rate of reforestation of 3.1% per year between 1995 and 2005. This high rate of reforestation – more than twice as high as the rate of deforestation in the previous decades – is a unique feature of the forest transition in Vietnam. In other forest transitions, forest recovery

322 P. Meyfroidt and E.F. Lambin
Fig. 14.3 Forest cover in Vietnam at several dates according to different sources (adapted from Meyfroidt and Lambin 2008b)
is slower than the earlier deforestation (Mather and Needle 1998; Rudel et al. 2005) (see Satake and Rudel 2007 for a discussion of possible implications).
The forest cover at the turning point was higher than for nineteenth or early twentieth centuries forest transitions in Europe (between 0% and 25%), which corresponds to what was hypothesized by Rudel et al. (2005). This reforestation was due in similar proportions to natural forest regeneration and to planted forests. Planted forests were almost non-existent until the 1980s, and then increased continu-ously to reach 7–8% of the total land area in 2005.
Forest cover changes were not homogeneous geographically (Fig. 14.2). Most of the forest cover remaining in 1991–1993 was located in the Annamite mountains (along the central coast of Vietnam) and the central highlands. The regions with the largest net reforestation were the highly deforested northeastern mountains, the northern Annamite range and, to a lesser extent, the northwestern mountains, mainly due to natural regeneration. In the central highlands, reforestation occurred in some places but the region as a whole experienced a net deforestation. In the lowlands, few forests remained in the early 1990s and reforestation was small: a few scattered plantations and mangrove rehabilitation in the south.
Tree plantations were more scattered geographically than natural forest regen-eration and located mainly in midlands and along coasts, where the road network is more developed. At the local scale, changes in forest cover were also not homogenous. Reforestation mostly took place on mountain slopes while valley bottoms and lower slopes were increasingly converted to permanent agriculture.
32314 Forest Transition in Vietnam and Bhutan
14.3.2 The Causes of Deforestation in Vietnam
Although there are few comprehensive studies of deforestation in Vietnam, evidence suggests that deforestation in the 1970s and 1980s was mainly caused by agricultural expansion and wood exploitation in the uplands (De Koninck 1999). These processes were driven mainly by population growth, due to natural growth and migration from the lowlands, which was encouraged by policies to relieve pressure on the already densely populated river deltas (Lundberg 2004). Timber demand for urban and industrial needs also contributed to forest clearing, especially during the post-war reconstruction of the country (McElwee 2004). Traditional shifting culti-vation practiced by ethnic minorities has been and is still often blamed by the Vietnamese government for causing deforestation, but the evidence for this is not convincing (Do 1994; Fox et al. 2000).
During the 1980s, agricultural policies also caused rapid deforestation in the mountains (Castella and Dang 2002). Cooperatives had been established since 1954 in the north and 1975 in the south of the country. Paddy lands were managed by the cooperatives and, as work on these collective farms was mandatory, little labour was left available for upland shifting cultivation. The productivity in the paddy lands was low due to an inefficient management of the cooperatives – for example, the fertiliser distribution networks – and because farmers had few incentives to intensify production (Pingali et al. 1997).
In 1981, the policy known as “Decree 100” introduced land contracts between farmers and cooperatives, to increase incentives for increasing production (Kerkvliet and Porter 1995; Pingali et al. 1997). The farmers were allowed to keep surpluses above a fixed contracted quantity. However, the short-term contracts encouraged unsustainable land exploitation and the investments were still managed by the coop-eratives. Furthermore, the land was distributed according to the number of mouths to feed in the household rather than according to the agricultural labour force. Some families had therefore to manage areas too large for their labour capacity. Yields in the paddy lands thus remained low and food shortages were severe in the mountains.
Throughout the 1980s, as the cooperatives were progressively dismantled and farmers were increasingly free to allocate their labour, families with little paddy lands but abundant labour turned to slash-and-burn cultivation on hillsides to maxi-mise labour returns while growing their own food (Castella et al. 2002; Sikor and Dao 2002). During this period, forests disappeared in the mountains and hillsides were increasingly eroded. Several authors warned of the deepening environmental and development crisis in Vietnam’s mountains (Jamieson et al. 1998).
During the 1990s and 2000s, deforestation was high in the central highlands (De Koninck 1999; Muller 2003) due to the large-scale development of perennial crops, mainly coffee but also tea, rubber and other crops. This was spurred by mar-ket growth (urban markets in Vietnam and external trade following the liberalisa-tion of the economy), road building, and government-supported colonisation (Hardy 2000; D’haeze et al. 2005). In this region, perennial crops are often the main crops cultivated by households, contrary to the other regions of Vietnam where perennial crops are part of a diversification strategy.

324 P. Meyfroidt and E.F. Lambin
14.3.3 The Forest Transition Pathways in Vietnam
14.3.3.1 Economic Reforms and Agricultural Development
A forest transition according to the economic development path occurs when, after a period of deforestation, large areas of land marginally suitable for agriculture are abandoned and left to forest regeneration (Rudel et al. 2005). Because of economic expansion, labour force is driven from agriculture to other economic sectors and from rural to urban areas. At the same time, due to market development, agricul-tural intensification is concentrated in the most suitable regions.
This pathway was partially at work in Vietnam during the 1990s. Agricultural development occurred when input and output markets were progressively liberalised and land was allocated to households (Kerkvliet and Porter 1995; Pingali et al. 1997). The “Resolution 10” policy in 1988 was a correction to “Decree 100”. It further liberalised rice and input prices, land rights and crop choices. Households were also allowed to own all their production after subtracting taxes and charges (Kerkvliet and Porter 1995). The Land Law of 1993 introduced long-term rights to use, transfer, exchange, inherit, rent and mortgage land (Do and Iyer 2003).
These changes created incentives for the farmers to intensify agriculture and invest more labour in paddy lands (Fatoux et al. 2002), invest in land improvements (Do and Iyer 2003), and produce surpluses for new market outlets (Minot and Goletti 2000; Luu 2003). Yield-increasing inputs such as improved seed varieties and fertilisers also became available to farmers with the emergence of market networks (Pingali et al. 1997; Tran and Kajisa 2006). The intensification occurred mainly for paddy rice and maize. Maize cultivation developed following the introduction of high-yielding varieties and as demand for maize, used as fodder for livestock, increased (Sikor 2001; Wezel et al. 2002; Minot 2003; Sikor and Pham 2005). Maize develop-ment was particularly important in the northwest of Vietnam.
Farmers also increasingly developed perennial crops (fruit trees, tea, and other), although this remained a marginal and often unsuccessful activity in the mountains. Livestock raising activities, mainly cattle and pigs, also developed.
According to the statistical analyses by Meyfroidt and Lambin (2008a), few of these changes contributed to the regeneration of natural forests, except for maize intensification and, for a small part, livestock development. During the 1990s, maize increasingly replaced upland rice and cassava on hillsides. Households that had poor access to paddies after agricultural land allocation often adopted maize on short fallow fields or on permanent fields with fertilisers to maintain a viable upland cultivation system (Sikor 2001; Castella and Erout 2002). As this intensive maize cultivation replaced upland rice that used to be cultivated without fertilisers and with a long fallow cycle, forest encroachment decreased (Sikor 2006).
As livestock and upland crops compete for space (Eguienta et al. 2002; Sikor 2006; Clement and Amezaga 2008a), the development of livestock may have led locally to the abandonment of cultivated land and regeneration of forest on extensively-managed pastures. However, animal grazing has also had a deteriorating effect on the quality of forests.
32514 Forest Transition in Vietnam and Bhutan
The increase in rice yields being mainly dependent on capital rather than labour inputs, it did not affect directly the capacity of households to engage in shifting cultiva-tion in the uplands. Perennial crop plantations were usually created on degraded upland fields. These changes therefore did not contribute to natural forest restoration.
Nevertheless, increases in rice yields and development of perennial crops were associated with and contributed to the increase in planted forests. The conditions that allowed farmers to modernise agriculture – accessibility to market for inputs and outputs, surplus of capital and/or government subsidies – were the same condi-tions that allowed them to invest in forest plantations activities (Sikor 2001; Tachibana et al. 2001; Muller 2003; Castella et al. 2005). Farmers in Vietnam are often reluctant to diversify their activities before they achieve food self-sufficiency, so increases in rice yields may have been a pre-condition to the development of perennial crops and forest plantations (Fatoux et al. 2002; Castella and Erout 2002; Alther et al. 2002). Furthermore, capital gained in any one of these activities could be invested in the other, so that these activities reinforced each other (Fatoux et al. 2002; Minot 2003; Sikor and Pham 2005). On the contrary, increases in cattle were associated with a decrease in forest plantations (Meyfroidt and Lambin 2008a), suggesting that – as for upland crops – cattle competes with forestry.
There was no rural exodus from the mountains to the cities during the start of the forest transition, in the 1990s. During this period, the rural population density in the mountains increased from 70 to 74 inhabitants per km², and from 67 to 73 inhabitants per km² in the northern mountains, where reforestation was the greatest. The share of rural households primarily dependent on farm activities in the moun-tains remained constant – 87% of the households.
Outmigration from the uplands was low because of its high cost (Sikor and Pham 2005; Castella et al. 2006) and of policies restricting free migration that were only progressively relaxed during the 1990s (Hardy 2000; Lundberg 2004). Despite rapid economic growth, the demand for labour in the industrial sector remained low (Jenkins 2004). The relaxation of constraints on migrations increased rural to urban migration, but these were mostly drawn from the lowlands around the cities (Adger 2002; Dang et al. 1997). According to the 1999 Population and Housing Census (General Statistical Office 2001), only around 10% of the migrants to Hanoi between 1994 and 1999 came from northern mountains.
Government-supported or spontaneous migration to the central highlands could have contributed to the decrease in population growth rates in the other mountainous regions, but this has not affected forest regrowth according to statistical analyses. During the 1990s, no depopulation and/or de-agrarianisation of marginal regions took place. These processes could not have contributed to the increase in forest area.
Evidence in support of the economic development path is therefore ambiguous. The economic growth rate in Vietnam was one of the highest in the world during the 1990s (Fritzen 2002). However, there were geographic disparities in this growth rate, and the income gap between the upland and other regions has widened (Poverty Working Group 1999). The population of the reforested uplands benefited less from this economic growth. Urbanisation and industrialisation did not signifi-cantly attract manpower away from agriculture in these areas. There is no evidence either that agricultural intensification in the high potential regions or increasing
326 P. Meyfroidt and E.F. Lambin
trade of agricultural products from mountain regions (fruits, livestock) led to the abandonment of cropland and forest regeneration, except for maize. Economic growth did however encourage the development of forest plantations.
In the future, and possibly already since 2000, the economic development path of forest transition may become more important. A geographic redistribution of land use was initiated at a regional scale with the development of maize for fodder and of timber plantations in suitable regions. Perennial crops and livestock are likely to increase in mountains, while rice from the lowlands is likely to reach upland markets. In recent years, urban migration greatly increased and may start to affect populations from the mountain regions. The non-farm sector is playing an increasing role in the economy of mountain regions (Rigg 2001; Sikor and Pham 2005; Castella et al. 2005), notably by providing capital to farmers for agricultural improvements (Reardon et al. 1994; Fatoux et al. 2002).
14.3.3.2 Policy Responses to Forest Scarcity
The forest scarcity path to forest transition posits that political and economic changes will arise as a response to the growing scarcity of forest products and decrease in the provision of ecosystem services following deforestation. In Vietnam many policy changes indeed emerged during the 1990s to halt deforestation and promote forest regrowth. Because of a rather poorly organised civil society in Vietnam, the main actors in the forestry arena during the transition were the government and administra-tions at different levels, the State Forest Enterprises (the formerly monopolistic forest exploitation organisations), and the households (Clement and Amezaga 2008b).
The Forest Protection and Development Law of 1991 and the Land Law of 1993 introduced the zoning of land according to its current or planned purpose. Forestry land was defined as land covered by forest or planned for forestry uses. Three sub-divisions were also introduced: protection forests (for protection of watersheds and from desertification), production forests, and special-use forest (forests of high biological or cultural value). These policies were aimed at protecting forests and restricting shifting cultivation in the uplands.
The 1993 Land Law also introduced a system for the allocation of forestry land to households (Sikor 2001). The purpose of this policy was to restrict slash-and-burn cultivation on forestry lands, and to provide incentives and responsibilities for protection and a sound management of allocated land by households. The implemen-tation of this policy varied locally. The rights and duties of households depended on the status and planning of land use (Nguyen et al. 2004a). Households had a responsibility to preserve existing forests and to manage forest regrowth on bare lands. They had some rights to cultivate crops on bare lands and production forests, and to exploit wood and forest products under some restrictions. According to several programs, they also received small cash payments in return for their commitment to preserve and protect forests, and sometimes to plant trees (Ministry of Agriculture and Rural Development 2001; Sowerwine 2004; McElwee 2004; Sikor 2006). Several authorities (forest management boards, national park administra-
32714 Forest Transition in Vietnam and Bhutan
tions, state forest enterprises) also signed forest protection contracts with house-holds, which imposed more restrictions on household rights on forestry land than for allocated land.
Allocation of forestry land to communities had been implemented in several prov-inces during the 1990s – for example, Son La in the north and Dak Lak in the central highlands (Nguyen 2006a; Clement and Amezaga 2008b). This was, however, given a legal status only through the new Land Law of 2003 and Forest Law of 2004 (Nguyen 2006a). In many villages, areas that were not allocated were de facto managed by the communities (Nguyen et al. 2004a). Indeed, some of the payments were given not to households but to villages to preserve natural forests that were not allocated.
Although several case studies have described shortcomings in the enforcement of the forestry land allocation policy (Sikor 2001, 2006), other case studies (Tachibana et al. 2001; Castella et al. 2006; Jakobsen et al. 2007) and a national-level statistical analysis (Meyfroidt and Lambin 2008a) have showed that this pol-icy had a positive impact on natural forest cover. So far, official community-based forest management schemes represents only a small fraction of the allocated land, and there is no conclusive evidence that they contributed significantly to forest cover changes, although under some conditions they may constitute a sustainable way to manage forests (Nguyen et al. 2004a; Nguyen 2006a).
Several tree planting programs were also undertaken by the government, mainly via Decree 327 (in 1992) and its successor, Decree 661 (or the “Five Million Hectare Reforestation Programme”, started in 1998) (De Jong et al. 2006). Most of these programs were implemented by the State Forest Enterprises, often with capital from international donors and with contributions of labour provided by farmers. The suc-cess of these programs was limited, due to the combination of several factors. In the mountains, farmers lacked labour, capital and technical knowledge about forestry, and the absence of a well-organised market and transportation infrastructure also decreased the profitability of forestry activities (Sunderlin and Huynh 2005; Dinh 2005). The complexity of regulations, frequent and arbitrary changes in regulations, and the long time needed to yield benefits created an uncertain environment for investing in forestry (Dinh 2005). For the same reasons, the forestry land allocation policy was not sufficient to stimulate forest plantations in the mountains during the 1990s. Forest plantations were therefore mainly concentrated in the more accessible midlands and lowlands, where farmers had the production assets to engage in forestry. Reforestation programs, based on monospecific exotic plantations (Acacia, Eucalyptus, Teak), are criticised for not having beneficial – or even having detrimental – effects on biodiversity, soils and hydrology (Clement and Amezaga 2008a, 2008b).
The Vietnamese government also developed plans to extend protected areas and strengthen their enforcement after signing the Convention on Biological Diversity in 1994 and approving a Biodiversity Action Plan in 1995 (World Bank 2005). Some case studies showed positive effects of protected areas (Muller 2003), while others suggest that they were not effective (Sowerwine et al. 1998; Zingerli et al. 2002). According to Meyfroidt and Lambin (2008a), protected areas did not contribute notably to forest regeneration or protection in terms of the area affected. However, they may have contributed to preserve small ecosystems rich in biodiversity.
328 P. Meyfroidt and E.F. Lambin
The Vietnamese government also enacted a partial ban on logging exports in 1993, modified in 1997, but its impact on forests was likely to be small (McElwee 2004). Information campaigns to increase awareness about the impor-tance of forest protection were also launched. The effects of such measures are difficult to assess.
The forest transition in Vietnam fits several aspects of the forest scarcity pathway. New policies, mostly based on land planning and allocation, were implemented to address the perceived degradation of forest resources. Increasing demand from urban and remote markets also contributed to the growth of the forestry sector and of forest plantations, but only in economically suitable places. The scarcity of natural forests and new policies securing land tenure made investments in forestry more profitable. Meyfroidt and Lambin (2008a) provided national-scale statistical evi-dence that local scarcity of forests may also have contributed to the reforestation in Vietnam, as has been the case elsewhere (Hyde et al. 1996; Foster and Rosenzweig 2003). However, the perception of this scarcity by rural households remains to be investigated at a local level (Meyfroidt and Lambin, forthcoming).
14.3.3.3 Smallholder Agricultural Intensification
The case of Vietnam suggests the existence of a third forest transition path, associ-ated with agricultural intensification à la Boserup by smallholders in marginal regions. Rapid deforestation in mountainous regions combined with a high popula-tion density led to a reduction in fallows, soil erosion on hillsides and a shortage of land suitable for shifting cultivation (Pandey and Dang 1998; Sikor 2001; Wezel et al. 2002). The relative profitability of slash-and-burn cultivation in the uplands declined in comparison to the cultivation in valleys (Sikor and Dao 2002). Forty percent of the farmers interviewed by Clement and Amezaga (2008a) mention soil degradation as a reason for ending annual upland cultivation.
Farmers therefore intensified paddy rice cultivation by shifting labour to the plots with the highest agro-ecological potential. Mountain farmers progressively added a second (or third) crop on irrigated plots and slowly expanded terraced fields (Castella and Erout 2002; Sikor 2006). Mechanisation being limited in the mountains because of a lack of capital (Henin 2002; Castella et al. 2006), little labour force was left for slash-and-burn agriculture. The upland plots were thus either abandoned or planted with trees, depending on resource endowments and opportunities. In sum, land scarcity triggered agricultural intensification in the paddy lands that, in turn, led to a shortage of labour for upland cultivation. These changes contributed significantly to the increase in natural forest area in mountain-ous regions of Vietnam (Meyfroidt and Lambin 2008a).
This pathway is more likely to occur in geographic contexts with poor land suit-ability for agriculture. In such regions, agricultural intensification on plots previ-ously used extensively is costly. It is the case for example in mountains where irrigated agriculture is restricted to valley bottoms. Farmers therefore invest their labour to improve the management of plots already under intensive cultivation and
32914 Forest Transition in Vietnam and Bhutan
extend them slowly, for example by constructing new terraces (Tachibana et al. 2001; Reid et al. 2006, Chapter 10).
This third forest transition path is consistent with studies by Netting (1993) and others, for example in the Philippines (Shively and Martinez 2001). This pathway is more likely to occur in densely populated regions, such as in many parts of Southeast Asia. In these regions, the initial steps of a forest transition will not result from depopulation and the decline of agriculture in marginal regions, as it would require a massive rural exodus that urban labour markets would not be able to absorb rapidly.
14.3.4 Environmental Impacts of the Forest Transition in Vietnam
14.3.4.1 Forest Density and Carbon Stocks
Between 1980 and 2005, the density of forest declined (Meyfroidt and Lambin 2008b) due to the degradation of old-growth forests (Muller 2003; McElwee 2004) and the increasing proportion of young forests regenerating from abandoned fallows. This was particularly significant for broadleaf forests (which, not including dry dip-terocarp woodlands, make around 50–60% of the total forest area). Around 43% of broadleaf forests in 1980 were low density compared to around 66% in 2005. The percentage of land covered by medium density and rich broadleaf forests on one hand, and poor forests on the other hand, increased by, respectively, 2% and 7% between 1991–1993 and 2005. Correspondingly, the average biomass carbon stock per hectare of forest declined between 1980 and the 1990s. For broadleaf forests, for which the data are the most accurate, it declined from 147 (125–169) MgC/ha in 1980 to 115 (99–133) MgC/ha in 2005. Most of the rich broadleaf forests remaining in the country are located in the central highlands.
Despite the above, the total carbon stock in forests in Vietnam followed a transi-tion pattern. It decreased from 1314 (993–1716) TgC in 1980 to 903 (770–1307) TgC in 1991–1993, and then increased to 1374 (1058–1744) TgC in 2005. The growth rate was therefore around 2.5% per year since 1995. In agreement with changes in forest area, carbon stocks experienced a net increase in the northern mountains but a net decrease in the central highlands, where deforestation and forest degradation continues.
The fallow area increased from 1980 to 1991–1993 and then declined. The total carbon stock in fallows declined steadily from 321 (273–430) TgC in 1993 to 168 (131–212) TgC in 2005. When forest cover was at its lowest in the early 1990s, fallows were important reservoirs of carbon (26% of the total stock of forests and fallows). Fallows then declined with reforestation and the increase in permanent agriculture, to represent 11% of the total carbon stock of forests and fallows in 2005. Given the high rate of forest plantations, carbon accumulated in planted forests in 2005 may have been equivalent to the carbon added in natural
330 P. Meyfroidt and E.F. Lambin
forests between 1991–1993 and 2005 (respectively, 245 (180–323) and around 245 TgC). Although the overall environmental benefits of plantations are dis-puted by some, these forests made a significant contribution to the total increase in carbon stocks.
Due to the continuing decrease in biomass density, the annual growth rate of total carbon stock between 1995 and 2005 was lower than the rate of change in forest area during the same period. While the forest area in 2005 was 20% above that in 1980, the total carbon stock in 2005 was similar to that of 1980 and the total stock of forests and fallows was lower. Young forests have a low carbon stock but constitute a large annual sink during the first 20 years (Silver et al. 2000; Houghton 2005). Forests in Vietnam constituted a net carbon sink of around 36 TgC per year since the turning point of the forest transition. This sink was, therefore, larger than the annual carbon emissions from fossil fuels of Vietnam (that increased from 6.1 TgC in 1992 to 26.9 TgC in 2004, Marland et al. 2007).
14.3.4.2 Habitat Fragmentation and Biodiversity
The potential impacts of forest cover change on biodiversity vary across regions. Habitat loss is the main factor responsible for the loss of species (Fahrig 2003), and secondary forests can constitute viable habitats for generalist species (Laurance 1997; Dunn 2004; Ewers and Didham 2006). The increase in area of natural forests in Vietnam is thus likely to have a positive effect on biodiversity. As described above, however, the density of forests still declined during the 1990s. In 2005, approximately half of the forests had a low tree density. Primary forests, undis-turbed by human activities, were still declining rapidly, from 384,000 ha in 1990 to 187,000 ha in 2000 (FAO 2006). Areas planted with exotic species such as Teak, Acacia and Eucalyptus do not constitute viable habitats for most animal species.
Changes in spatial pattern of habitats may also constitute an obstacle to rehabili-tation of forest biodiversity or even contribute to its degradation. Changes in forest fragmentation during the 1990s differed between regions. In the south China-Vietnam subtropical evergreen forest ecoregion (northeastern Vietnam), the net reforestation during the 1990s was the highest nationwide. Along with the refores-tation, forest patches became larger and better connected, with greater core areas, although their shapes increased in complexity. Habitat fragmentation thus decreased during the 1990s. In this region, the trends in landscape change were therefore favourable for biodiversity. However, at the turning point of the forest transition, the forest cover was low and fragmented and, in 2000–2001, forests were still highly fragmented compared to the other mountainous regions of Vietnam. Rehabilitation of biodiversity would thus take time in this ecoregion.
By contrast, in the northern Indochina subtropical forests ecoregion (north-western Vietnam), reforestation led to an increasingly fragmented landscape, with smaller and more isolated forest patches having more complex shapes and smaller core areas. Despite reforestation, biodiversity might therefore still decrease in this region. Edge effects on birds (Turner 1996; Fahrig 2003) and
33114 Forest Transition in Vietnam and Bhutan
mammals (Woodroffe and Ginsberg 1998) are particularly worrying for this ecoregion, which has the highest bird and third highest mammal biodiversity of the Indo-Pacific area (Wikramanayake et al. 2001). In these two regions, human disturbance of forests started long ago. Natural successions and species recolonisation is likely to be slow in forest remnants that have been isolated for a long time (Laurance 1997; Chazdon 2003).
In the Annamite ecoregions, forest patches increased in size and connectivity, but also in shape complexity, so that the proportion of core areas remained stable. In the Annamite mountains, forest cover remained large, well connected and with well-preserved core areas. Secondary forests are thus likely to recover more rapidly. In the southern Indochina dry evergreen forests, almost the opposite was observed: patches became smaller and more isolated but their shapes simpler, and the proportion of core areas increased. The central Indochina dry forest area decreased, the proportion of core areas decreased, but the connectivity of patches increased. Dry forests in the highlands of southern Vietnam still hold large unfragmented forests but are threatened by recent deforestation. The lowland forests became fragmented in smaller patches with smaller core areas and increased isolation. The core area of mangroves increased due to a small number of large patches that did not affect the average patch size. The restoration of several areas of mangroves, although insignificant compared to the total forest cover of the country, is important for biodiversity as Indochina man-groves are among the most diverse in Tropical Asia (Wikramanayake et al. 2001).
In the fragmentation analysis, plantations were generally not included. The scat-tered spatial distribution of plantations decreases their detectability with coarse reso-lution remote sensing data. With the 60% forest cover threshold used here to identify forest pixels, most plantations were not included in the forest class. Plantations are concentrated in midlands and lowlands where few natural forests remain.
Despite reforestation, forest density declined, and forests in some regions became more fragmented and subjected to edge effects, while the opposite occurred in other areas. The effects of the forest transition on biodiversity are thus likely to vary between ecoregions. To sum up, habitat fragmentation generally decreased in the northeastern region and in the Annamite mountains but increased in the north-western region and in the lowlands. Because of the long history of human distur-bance, the low forest cover at the turning point, the continuing degradation or clearing of old-growth forests, and landscape fragmentation, biodiversity is most likely still threatened in Vietnam despite reforestation in some ecoregions.
14.3.5 Forest Transition in Bhutan
Much less is known on the forest transition in Bhutan compared to that in Vietnam. The vegetation cover of Bhutan has been mapped for the first time based on a Landsat image dating from 1978 combined with field sampling (Sargent et al. 1985). This study estimated the forest cover at 55% of the country area. Closed or partially-closed forests occupied 22% of the country. These forests were undisturbed by
332 P. Meyfroidt and E.F. Lambin
human activity and were most probably primary forests. Open forests represented 33% of the land area. Note that the Landsat image only covered 70% of the country and that 20% of the image was at least partially shaded and therefore could not be interpreted. The above forest cover estimates should therefore be taken with cau-tion. At the time of their survey, in 1983, these authors noted pressures to clear forests due to increased commercial falling, overgrazing that caused a failure of forest regeneration, and increasing human population leading to a rise in the demand for fuelwood and building material (Sargent et al. 1985).
FAO’s Forest Resource Assessment estimates of forest and other wooded land in Bhutan for 1990 are much larger, at 76.6% of the land area (FAO 1993). Most of this area was classified as forest rather than “other wooded land”. Subsequent esti-mates by FAO for 2000 and 2005 display a clear increase in forest cover, with respectively 79.8% and 81% of the forest and other wooded land category (FAO 2006). Forests represented 64.6%, 66.8%, and 68% of the country area in 1990, 2000, and 2005, respectively. Most of this increase is associated with semi-natural forests. Another national estimate of forest cover for Bhutan for the year 2000 put it at 72.5% of the country area (NEC 2000).
Forest cover increase took place in Bhutan despite an average population growth rate of 3%, with only 21% of the total population living in urban areas in 2003. The rest of the population depends on agriculture, with the agricultural sector still representing 33% of GDP in 2002. Fuelwood accounts for over three-quarters of total energy consumption and nearly all non-commercial energy consumption (Uddin et al. 2007). Private and commercial forest users can extract small amounts of wood from government-owned forests at no charge, which creates a risk of unsustainable forest exploitation. The population also derives a range of non-wood forest products that contribute to the livelihood of rural households.
In 1969, a forestry department was created in Bhutan. Private commercial tree felling was prohibited. The forestry department, who was empowered to release timber for the needs of the local population, controlled all timber extraction (Uddin et al. 2007). Grazing was restricted to certain areas. Free ranging by goats was prohibited but grazing by yak herds was still allowed. Forest plantations were developed. Large areas, mostly in low population density regions, were conserved through the establishment of protected areas. The most significant national park in Bhutan was created as early as in 1962. More than 27% of the country’s area was managed within protected areas in 2005.
The forest legislation of Bhutan declares that a minimum forest cover of 60% be maintained permanently at a national scale. Among several Forest Acts, Policies and Royal Decrees, the Forest Policy of Bhutan 1991 and Bhutan Forest and Nature Conservation Act 1995 legislate principles of sustainable management of forests, biodiversity conservation, and social forestry (Uddin et al. 2007). Institutions for community participation in conservation and forestry activities were formally implemented in 2002. These forest policies provide a role for traditional forest users in managing forest activities on publicly-owned land, including community lands. Most forests fall under this category of land ownership rights. Tree planting and forest management is also encouraged on privately-owned land.
33314 Forest Transition in Vietnam and Bhutan
Underlying these forest policies is the unique philosophy of development in Bhutan that pursues Gross National Happiness as a main goal. In particular, the pro-motion of the happiness of the people is viewed as being more important than eco-nomic prosperity, in a quest to balance spiritualism and materialism. As part of this policy, preservation and sustainable use of the environment is one of the key objec-tives consistently pursued by Bhutan over the last 50 years (the other three objectives being economic self-reliance, cultural promotion and good governance). It is inspired by the Buddhist culture of harmony and compassion, and its representation of the place of human beings within the complex web of interdependent relationships between all forms of existence. This underlies a strong ethic of nature conservation that has long predated the international focus on sustainable development.
The path of forest transition in Bhutan is therefore unique, as it is neither caused by a scarcity of forest resources, nor by a modernisation of the economy through market development and rural depopulation. Rather, it is motivated by a development philosophy that assigns a high value to environmental preservation. The policies that implement this Buddhist-inspired worldview are strongly pro-moted by the central government, through a forest ownership regime of mostly publicly-owned forest land.
14.4 Discussion and Conclusion
14.4.1 Interactions Between Pathways and Local Diversity
The three pathways described for Vietnam in Section 14.3.3 are not independent and interact in several ways. Maize intensification was induced not just by the liber-alisation of agricultural markets but also by the scarcity of land suitable for rotational shifting cultivation, due to land degradation, high population densities and the forest land allocation policy. Intensification in paddy fields was caused by a combination of “push and pull” factors. On one hand, economic liberalisation, paddy land allo-cation, and market integration increased profitability of cultivation in lowlands. On the other hand, land degradation and scarcity in hillsides diminished the returns to shifting cultivation. Forestland allocation and zoning policies reinforced land scar-city (Castella et al. 2006; Jakobsen et al. 2007; Clement and Amezaga 2008a) and prohibited newcomers from claiming degraded land abandoned by farmers. So far, the relative contributions of the “push” and “pull” factors remain unclear. The inter-play between socio-economic changes and land degradation in agricultural intensi-fication has still to be investigated further (Lambin and Meyfroidt 2008).
Forest policies were not only a response to forest scarcity at a national level, but also the result of broader reforms towards liberalisation and decentralisation in the forestry sector that triggered economic development (Lambin and Meyfroidt 2008). The local effectiveness of forestland allocation policies was also influenced by economic and agricultural changes: where paddy lands were abundant and paddy rice cultivation intensive, farmers had an alternative to shifting cultivation.
334 P. Meyfroidt and E.F. Lambin
These policies were therefore more easily accepted. Where paddy lands were scarce, policy restrictions on shifting cultivation in forestlands were less strongly enforced. Forestland allocation by itself was not sufficient to stimulate forestry activities and forest planting. Market outlets and capital investments were also necessary.
There were local and regional variations in the process of forest transition in Vietnam. Northwestern Vietnam, with soils suitable for maize cultivation but deep valleys with little paddy lands, experienced a large increase of maize cultivation on permanent fields. Northeastern Vietnam, with smaller valleys and less fertile soils, was more affected by intensification in paddy lands. The midlands closer to the deltas were more influenced by forestry activities and forest plantations. There were also regional differences in landscape fragmentation and varying impacts on hydrology and soils.
14.4.2 Social and Economic Issues in the Forest Transition
The forest transition in Vietnam occurred during a rapidly changing socio-economic context of political reforms and transition from socialism to market economy. Changes in land tenure and property rights had large impacts not only on forests but also on people’s livelihood.
By restricting the rotation of upland fields, the forestry land allocation policy diminished returns on shifting cultivation. However, poor households lacking access to paddy lands had few other options. They had to continue upland cultiva-tion by reducing the length of fallow and increasing the cultivation frequency of their plots, with detrimental effects on labour time, crop yields and livelihoods (Scott 2000; Nguyen et al. 2004b; Castella et al. 2006; Jakobsen et al. 2007). This affected mainly some minority ethnic groups (e.g., the Hmong and Dao) who had a long tradition of shifting cultivation and had few paddy lands.
The land allocation process was not always equitable, with the well-positioned households (village leaders, commune civil servants) often taking up the most desirable lands before the official land allocation (Dinh 2005). Notwithstanding legal rights, the actual benefits derived from allocated forests also depended on the wealth, political position and labour capacity of households (Nguyen 2006b). A lack of infrastructure and forestry skills, and an uncertain political context also made it difficult for many households to benefit from forestry (Dinh 2005).
When land allocation was initiated, privatisation and individualisation of rights was praised in Vietnam for being the most appropriate way to manage resources. Recently, community-based forest management has emerged as an alternative. Although no comprehensive study of the effectiveness of community forestry exists in Vietnam, some case study evidence shows that, under some conditions, this provides an efficient way to improve livelihoods and manage forests sustainably (Nguyen et al. 2004a; Nguyen 2006a). However, community-based forest management cor-responds to a diversity of actual land tenure and land use arrangements, and their actual impact on forest management remains to be investigated.
33514 Forest Transition in Vietnam and Bhutan
14.4.3 Conclusion
The critical analysis of available forest over data demonstrates unambiguously that a forest transition occurred in Vietnam, with the turning point around 1991–1993 at around 25–31% of land covered by forest. The forest cover then increased to around 32–37% in 1999–2001. The reforestation was due, in similar proportions, to natural forest regeneration and plantations. The rate of reforestation was higher than the rate of deforestation during the previous decades.
According to insights from national-scale statistical modelling and local case studies, forest regrowth in Vietnam was not due to a single process or policy but to a combi-nation of economic and political responses to forest and land scarcity, economic growth, and market integration at the scale of the country. The distribution of forestry land to households, new forest management practices, and food crop intensification were combined in “push and pull” effects to decrease the footprint of agriculture on hill-sides. Land scarcity provided strong incentives for agricultural intensification and the sound management of forests. These processes partly correspond to the two pathways described in the emerging forest transition theory – the economic development path and the forest scarcity path – and also to a smallholder agricultural intensification pathway linked to the theory of agricultural intensification of Boserup.
This transition had complex social and economic impacts. The benefits of forestry activities for local land managers, although potentially significant, did not fully materialise so far. Forest issues in Vietnam remain rapidly changing, with the current emergence of community-based forest management and the development of forestry activities by households.
Despite a decreasing density of biomass due to the degradation of forests and the increasing proportion of young trees, the total carbon stock in forests also followed a pattern of transition. Forests in Vietnam represented a net carbon sink of around 36 TgC per year since the beginning of the 1990s. Yet, forests in some regions became more fragmented and subjected to edge effects, while the opposite occurred in other regions. The effects of the forest transition on biodiversity are thus likely to vary between ecoregions. Biodiversity is most likely still threatened in Vietnam. The local scale impacts of different pathways of reforestation on forest composition and spatial pattern, and the associated effects on habitats, carbon stocks, soils and hydrology require more in-depth investigation.
Other forest transitions exist in the region, notably in the Kingdom of Bhutan, where a development philosophy that assigns a high value to environmental preser-vation promotes forest policies on the mostly publicly-owned forest land. This case demonstrates that net reforestation can take place even in regions with a high rate of population growth and a population living mostly in rural areas. Good governance and a cultural system assigning a high value to nature are essential elements for a successful forest transition. Moreover, contrasting the case of Bhutan with that of Vietnam highlights the diversity of forest transition pathways even within the same world region. Knowledge about the causes, pattern and environmental impacts of the forest transition in these countries is important to understand possible emerging regional trends that would have implications for global environmental change.
336 P. Meyfroidt and E.F. Lambin
Acknowledgments The authors thank the anonymous reviewers and the editors for their useful comments.
References
Adger WN, Kelly PM, Winkels A, Luong QH, Locke C (2002) Migration, Remittances, Livelihood Trajectories, and Social Resilience. Ambio 31 (4): 358–366
Alther C, Castella JC, Novosad P, Rousseau E, Tran TH (2002) Impact of accessibility on the range of livelihood options available to farm households in mountainous areas of northern Vietnam. In: Castella JC, Quang DD (eds) Doi Moi in the mountains land use changes and farmers’ liveli-hood strategies in Bac Kan province, Vietnam. The Agricultural Publishing House, Ha Noi, pp 121–146
Castella JC, Dang DQ (2002) Doi Moi in the mountains: Land use changes and farmer’s livelihood strategies in Bac Kan province, Viet Nam. The Agricultural Publishing House, Hanoi
Castella JC, Erout A (2002) Montane paddy rice: the cornerstone of agricultural production sys-tems in Bac Kan Province Vietnam. In: Castella JC, Quang DD (eds) Doi Moi in the mountains land use changes and farmers’ livelihood strategies in Bac Kan province, Vietnam. The Agricultural Publishing House, Ha Noi, pp 175–195
Castella JC, Manh PH, Kam SP, Villano L, Tronche NR (2005) Analysis of village accessibility and its impact on land use dynamics in a mountainous province of northern Vietnam. Appl Geogr 25(4):308–326
Castella JC, Boissau S, Hai Thanh N, Novosad P (2006) Impact of forest land allocation on land use in a mountainous Province of Vietnam. Land Use Policy 23(2):147–160
Chazdon RL (2003) Tropical forest recovery: legacies of human impact and natural disturbances. Perspect Plant Ecol Evol Syst 6(1/2):51–71
Clement F, Amezaga JM (2008a) Linking reforestation policies with land use change in northern Vietnam: why local factors matter. Geoforum 39(1):265–277
Clement F, Amezaga JM (2008b) Afforestation and forestry land allocation in northern Vietnam: analysing the gap between policy intentions and outcomes. Land Use Policy, in press.
Dang A, Goldstein S, McNally J (1997) Internal migration and development in Vietnam. Int Migr Rev 31(2):312–337
DeFries RS, Hansen MC, Townshend JRG, Janetos AC, Loveland TR (2000) A new global 1-km dataset of percentage tree cover derived from remote sensing. Global Change Biol 6(2):247–254
De Jong W, Sam DD, Hung TV (2006) Forest rehabilitation in Vietnam: histories, realities and future. Center for International Forestry Research (CIFOR), Bogor
De Koninck R (1999) Deforestation in Vietnam. International Development Research Center (IDRC), Ottawa
D’haeze D, Deckers J, Raes D, Phong TA, Loi HV (2005) Environmental and socio-economic impacts of institutional reforms on the agricultural sector of Vietnam: land suitability assess-ment for Robusta coffee in the Dak Gan region. Agric Ecosyst Environ 105(1–2):59–76
Dinh DT (2005) Forestry, poverty reduction and rural livelihoods in Vietnam. Labour and Social Affair Publishing House, Hanoi
Do DS (1994) Shifting cultivation in Vietnam: its social, economic and environmental values rela-tive to alternative land use. International Institute for Environment and Development, London
Do QT, Iyer L (2003) Land rights and economic development: evidence from Vietnam — Policy Research Working Paper 3120. Technical Report, World Bank, Washington, DC
Dunn RR (2004) Recovery of faunal communities during tropical forest regeneration. Conserv Biol 18(2):302–309
Ewers RM, Didham RK (2006) Confounding factors in the detection of species responses to habitat fragmentation. Biol Rev 81(1):117–142
33714 Forest Transition in Vietnam and Bhutan
Eguienta YK, Martin C, Lecomte P, Husson O, Castella JC (2002) Crop-livestock interactions in northern Vietnam: issues diversity of farmer’s responses and alternatives for sustainable inte-gration of animals in upland agricultural systems. In: Castella JC, Quang DD (eds) Doi Moi in the mountains. Land use changes and farmers’ livelihood strategies in Bac Kan province, Vietnam. The Agricultural Publishing House, Ha Noi, pp 221–248
Fahrig L (2003) Effects of habitat fragmentation on biodiversity. Annu Rev Ecol Evol Syst 34(1):487–515
FAO (1993) Forest Resources Assessment 1990 – Tropical countries. FAO Forestry paper 112. FAO, Rome
FAO (2006) Global Forest Resources Assessment 2005. FAO Forestry paper 147. FAO, RomeFatoux C, Castella JC, Zeiss M, Manh PH (2002) From rice cultivator to agroforester within a
decade: the impact of Doi Moi on agricultural diversification in a mountainous commune of Cho Moi district, Bac Kan province, Vietnam. In: Castella JC, Quang DD (eds) Doi Moi in the mountains. Land use changes and farmers’ livelihood strategies in Bac Kan province, Vietnam. The Agricultural Publishing House, Ha Noi, pp 73–98
Foster AD, Rosenzweig MR (2003) Economic growth and the rise of forests. Q J Econ 118(2):601–637
Fox J, Dao MT, Rambo AT, Nghiem PT, Le TC, Leisz S (2000) Shifting Cultivation: A New Old Paradigm for Managing Tropical Forests. Bioscience 50(6):521–528
Fritzen S (2002) Growth, inequality and the future of poverty reduction in Vietnam. J Asian Econ 13(5):635–657
General Statistical Office (2001) Results of the 1999 Population and Housing Census. Statistical Publishing House, Ha Noi
Hagen-Zanker A, Straatman B, Uljee I (2005) Further developments of a fuzzy set map compari-son approach. Int J Geogr Info Sci 19(7):769–785
Hansen MC, DeFries RS, Townshend JRG, Carroll M, Dimiceli C, Sohlberg RA (2003) Global percent tree cover at a spatial resolution of 500 meters: first results of the MODIS vegetation continuous fields algorithm. Earth Interact 7(10):1–15
Hardy A (2000) Strategies of migration to upland areas in contemporary Vietnam. Asia Pacific Viewpoint 41(1):23–34
Henin B (2002) Agrarian change in vietnam’s Northern Upland Region. Journal of Contemporary Asia 32(1):3–28
Houghton RA (2005) Aboveground forest biomass and the global carbon balance. Global Change Biol 11(6):945–958
Hyde WF, Amacher GS, Magrath W (1996) Deforestation and forest land use: theory, evidence and policy implications. World Bank Res Obs 11(2):223–248
Irvin G (1995) Vietnam: assessing the achievements of Doi Moi. J Dev Stud 31(5):725–750Jakobsen J, Rasmussen K, Leisz S, Folving R, Quang NV (2007) The effects of land tenure policy
on rural livelihoods and food sufficiency in the upland village of Que, North Central Vietnam. Agric Syst 94(2):309–319
Jamieson NL, Cuc LT, Rambo TA (1998) The development crisis in Vietnam’s mountains. East-West Cent Spec Rep 6:1–32
Jenkins R (2004) Why has employment not grown more quickly in Vietnam? J Asia Pacific Econ 9(2):191–208
Kauppi PE, Ausubel JH, Fang J, Mather AS, Sedjo RA, Waggoner PE (2006) Returning forests analyzed with the forest identity. Proc Natl Acad Sci U S A 103(46):17574–17579
Kerkvliet BJT (1995) Village-state relations in Vietnam: the effect of everyday politics on decol-lectivization. J Asian Stud 54(2):396–418
Kerkvliet BJ, Porter DJ (eds) (1995) Vietnam’s rural transformation. Westview Press, Boulder, CO
Lambin EF, Meyfroidt P (2009) Land use transitions: ecological feedback versus socio-economic change. In revision for Land Use Policy
Laurance WF (1997) Tropical forest remnants: ecology, management and conservation of frag-mented communities. The University of Chicago Press, Chicago, IL
338 P. Meyfroidt and E.F. Lambin
Lundberg M (2004) Kinh settlers in Vietnam’s northern highlands: natural resources management in a cultural context. Ph.D. Thesis, Linköping University, Linköping
Luu TDH (2003) The organization of the liberalized rice market in Vietnam. Ph.D. Thesis, Rijksuniversiteit Groningen, Groningen
Marland G, Boden T, Andres RJ (2007) National CO2 emissions from fossil-fuel burning, cement manufacture, and gas flaring: 1751–2004. Carbon Dioxide Information Analysis Center, US Department of Energy, Oak Ridge National Laboratory, Oak Ridge, TN
Mather AS (2007) Recent Asian forest transitions in relation to forest-transition theory. Int For Rev 9(1):491–502
Mather AS, Needle CL (1998) The forest transition: a theoretical basis. Area 30:117–124McElwee P (2004) You say illegal, I say legal: the relationship between ‘illegal’ logging and land
tenure, poverty, and forest use rights in Vietnam. J Sustainable For 19(1–3):97–135Meyfroidt P, Lambin EF (2008a) The causes of the reforestation in Vietnam. Land Use Policy
25(2):182–197Meyfroidt P, Lambin EF (2008b) Forest transition in Vietnam and its environmental impacts.
Global Change Biol 14(6):1319–1336Ministry of Agriculture and Rural Development (2001) Five million hectare reforestation program
partnership. Synthesis report. Technical Report, Ministry of Agriculture and Rural Development, Ha Noi
Minot N (2003) Income diversification and poverty in the northern uplands of Vietnam—patterns, trends and policy implications. Technical Report, International Food Policy Research Institute (IFPRI), Washington, DC
Minot N, Goletti F (2000) Rice market liberalization and poverty in Vietnam—Research Report 114. Technical Report, International Food Policy Research Institute (IFPRI), Washington, DC
Muller D (2003) Land-use change in the central highlands of Vietnam. Ph.D. Thesis, Georg-August-Universität, Göttingen
NEC (2000) First greenhouse gas inventory. Technical Report, National Environment Commission, Thimphu
Netting RM (1993) Smallholders, householders. Farm families and the ecology of intensive, sustainable agriculture. Stanford University Press, Stanford, CA
Nguygen HD, Ho MT, Soriaga R, Walpole P (2004) The return of limestone forests. Northeastern Vietnam. Research network report no. 11. Asian Forestry Network
Nguyen QT (2006a) Trends in forest ownership, forest resources tenure and institutional arrange-ments: are they contributing to better forest management and poverty reduction? Case studies from Vietnam. In Understanding forest tenure in South and Southeast Asia. Forestry Policy and Institutions Working Paper 14. FAO, Rome
Nguyen QT (2006b) Forest devolution in Vietnam: differentiation in benefits from forest among local households. For Policy Econ 8(4):409–420
Nguyen TL, Patanothai A, Rambo AT (2004) Recent changes in the composite swidden farming system of a Da Bac Tay ethnic minority community in Vietnam’s northern mountain region. Southeast Asian Stud 42(3):273–293
Olson DM, Dinerstein E, Wikramanayake ED et al (2001) Terrestrial ecoregions of the world: a new map of life on Earth. BioScience 51(11):933–938
Pandey S, Dang VM (1998) A socio-economic analysis of rice production systems in the uplands of northern Vietnam. Agric Ecosyst Environ 70(2–3):249–258
Pingali PL, Nguyen TK, Gerpacio RV, Xuan VT (1997) Prospects for sustaining Vietnam’s reacquired rice exporter status. Food Policy 22(4):345–358
Poverty Working Group (1999) Vietnam Development Report 2000: attacking poverty–country economic memorandum. World Bank, Washington, DC
Reardon T, Crawford E, Kelly V (1994) Links between nonfarm income and farm invest-ment in African households: adding the capital market perspective. Am J Agric Econ 76(5):1172–1176
Reid RS, Tomich TP, Xu JC, Geist H, Mather AS (2006) Linking land-change science and policy: current lessons and future integration. In: Lambin EF, Geist HJ (eds) Land-use and land-cover change. Local processes and global impacts. Springer, Berlin
33914 Forest Transition in Vietnam and Bhutan
Rigg J (2001) More than the soil. Rural changes in Southeast Asia. Prentice-Hall, LondonRudel TK, Coomes OT, Moran E, Achard F, Angelsen A, Xu J, Lambin E (2005) Forest
transitions: towards a global understanding of land use change. Global Environ Change Part A 15(1):23–31
Sargent C, Sargent O, Parsell R (1985) The forest of Bhutan: a vital resource for the Himalayas? J Trop Ecol 1:265–286
Satake A, Rudel TK (2007) Modeling the forest transition: forest scarcity and ecosystem service hypotheses. Ecol Appl 17(7):2024–2036
Scott S (2000) Changing rules of the game: local responses to decollectivisation in Thai Nguyen, Vietnam. Asia Pacific Viewpoint 41(1):69–84
Shively G, Martinez E (2001) Deforestation irrigation, employment and cautious optimism in southern Palawan, the Philippines. In: Angelsen A, Kaimowitz D (eds) Agricultural technologies and tropical deforestation. CAB International, Wallingford, UK, pp 335–346
Sikor T (2001) The allocation of forestry land in Vietnam: did it cause the expansion of forests in the northwest? For Policy Econ 2(1):1–11
Sikor T, Dao MT (2002) Agricultural policy and land use changes in a Black Thai commune of northern Vietnam, 1952–1997. Mount Res Dev 22(3):248–255
Sikor T (2006) Politics of rural land registration in post-socialist societies: contested titling in villages of Northwest Vietnam. Land Use Policy 23(4):617–628
Sikor T, Pham TTV (2005) The dynamics of commoditization in a Vietnamese uplands village, 1980–2000. J Agrarian Change 5(3):405–428
Silver WL, Ostertag R, Lugo AE (2000) The potential for carbon sequestration trough reforestation of abandoned tropical agricultural and pasture lands. Restor Ecol 8(4):394–407
Sowerwine JC (2004) Territorialisation and the politics of highland landscapes in Vietnam: nego-tiating property relations in policy, meaning and practice. Conserv Soc 2(1):97–137
Sowerwine J, Nguyen HD, Poffenberger M (1998) Ba Vi national park and the Dzao. In: Poffenberger M (ed) Stewards of Vietnam’s upland forests. Research network report n° 10. Asian Forestry Network
Sterling EJ, Hurley MM, Le Duc Minh (2006) Vietnam: a natural history. Yale University Press, New Haven, CT
Sunderlin WD, Huynh TB (2005) Poverty alleviation and forests in Vietnam. Center for International Forestry Research (CIFOR), Bogor
Tachibana T, Nguyen TM, Otsuka K (2001) Agricultural intensification versus extensification: a case study of deforestation in the northern-hill region of Vietnam. J Environ Econ Manag 41(1):44–69
Tran TU, Kajisa K (2006) The impact of green revolution on rice production in Vietnam. Dev Econ 44(2):167–189
Turner IM (1996) Species loss in fragments of tropical rain forest: a review of the evidence. J Appl Ecol 33(2):200–209
Uddin SN, Taplin R, Xiaojiang Y (2007) Energy, environment and development in Bhutan. Renew Sustainable Energy Rev 11:2083–2103
Wezel A, Luibrand A, Le QT (2002) Temporal changes of resource use, soil fertility and economic situation in upland northwest Vietnam. Land Degrad Dev 13:33–44
Wikramanayake E, Dinerstein E, Loucks C et al (2001) Terrestrial ecoregions of the Indo-Pacific: a conservation assessment. Island Press, Washington, DC
Woodroffe R, Ginsberg JR (1998) Edge effects and the extinction of populations inside protected areas. Science 280(5372):2126–2128
World Bank (2005) Vietnam environment monitor 2005: Biodiversity. World Bank, Washington, DCZingerli C, Castella JC, Pham HM, Pham VC (2002) Contesting policies: rural development
versus biodiversity in the Ba Be National Park area, Vietnam. In: Castella JC, Quang DD (eds) Doi Moi in the mountains. Land use changes and farmers’ livelihood strategies in Bac Kan province, Vietnam. The Agricultural Publishing House, Ha Noi, pp 249–276
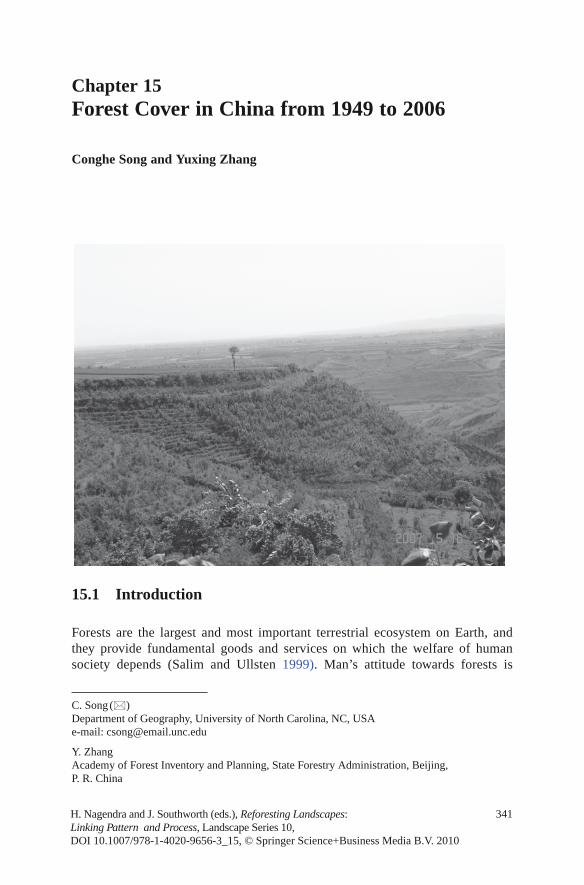
341
C. Song () Department of Geography, University of North Carolina, NC, USAe-mail: [email protected]
Y. Zhang Academy of Forest Inventory and Planning, State Forestry Administration, Beijing, P. R. China
Chapter 15Forest Cover in China from 1949 to 2006
Conghe Song and Yuxing Zhang
H. Nagendra and J. Southworth (eds.), Reforesting Landscapes: Linking Pattern and Process, Landscape Series 10,DOI 10.1007/978-1-4020-9656-3_15, © Springer Science+Business Media B.V. 2010
15.1 Introduction
Forests are the largest and most important terrestrial ecosystem on Earth, and they provide fundamental goods and services on which the welfare of human society depends (Salim and Ullsten 1999). Man’s attitude towards forests is
342 C. Song and Y. Zhang
evolving with human civilization, ranging from venerating them as sacred for their immensity, fearing them due to dangers associated with forests, finding them as impediments to agricultural development, to seeing them as sources of economic value (Vogt et al. 2007). Laarman and Sedjo (1992) summarized the goods and services that forests can provide for human welfare in five categories: (1) protective services and influences, such as soil and water conservation, climate regulation as well as conservation of biodiversity; (2) educational and scientific services, where forests are used in research and teaching to obtain and transmit basic knowledge; (3) psycho-physiological influences, including tour-ism, recreation, inspiration for art, religion and philosophy, etc.; (4) consumption of plants, animals and derivatives, referring to timber, fuelwood, and other derived products from forests; (5) source of land and living space. Traditional forest practice is primarily aimed at extraction of direct and derivative products from forests to maximize economic gains, while other goods and services that forests offer are frequently not adequately valued. As a result, large areas of forests are cut for timber or fuelwood every year. In addition, due to the rapid growth of human population, large areas of forests are either converted to cropland for food production or to developed area.
About a third of the world’s forests have been lost due to human activities. Current forest areas in the world are 3.95 billion hectares (FAO 2006). Deforesta tion is at the core of most contemporary forestry problems (Hyde et al. 1996). Deforestation contributed approximately a third of the extra CO
2 in the atmosphere since the indus-
trial revolution (Watson et al. 2000; Foley et al. 2005). As forests provide habitats for many other plants and animals, deforestation poses a great threat to biodiversity (Dobson et al. 1997). Due to forest decline, about 12.5% of the world 270,000 plant species and 75% of the world’s mammals are under threat of disappearing from the Earth for good (Salim and Ullsten 1999).
Forest cover is one of the most important indicators for forest resources in a country. The change in forest cover in a country is closely related to its economic status (Ewers 2006). Forest cover in a country generally decreases as the econ-omy grows when the gross domestic production (GDP) is low, and forest cover increases as the economy continues to grow at a higher GDP. Some characterize the nonlinear development of forest cover with the economic growth as environ-mental Kuznets curve (Stern et al. 1996; Mather and Needle 1998; Ehrhardt-Martinez et al. 2002). Therefore, countries with the highest rate of deforestation are found among the poorest countries in the world. During 2000–2005, 4.3 mil-lion hectares of forest were lost each year in South America, followed by 4.0 million hectares in Africa (FAO 2006). The top 10 countries that lost the most forests during 2000–2005 are all developing countries, including Brazil (3,103,000 ha/year), Indonesia (1,871,000 ha/year), Sudan (589,000 ha/year), Myanmar (466,000 ha/year), Zambia (445,000 ha/year), Tanzania (412,000 ha/year), Nigeria (410,000 ha/year), Democratic Republic of Congo (319,000 ha/year), Zimbabwe (313,000 ha/year), and Venezuela (288,000 ha/year) (FAO 2006). In contrast, many developed countries saw an increase in forest areas in recent years (Kauppi et al. 2006). For example, forest areas increased 296,000 ha/year
34315 Forest Cover in China from 1949 to 2006
for Spain and 195,000 ha/year for the United States during 2000–2005. Forest areas in China and Vietnam, two fast growing economies, also increased signifi-cantly during the same period (FAO 2006).
As the biggest developing country in the world, changes in the forest ecosystems in China not only impact the environment in the country, but significantly influence the global environment as well. Most of the forests in China were lost before 1949 (Xiong 1989). China’s forest cover was merely 8.6% in 1949 (Chinese Government Documents 1977–2005). China managed to increase its forest cover to 18.2% in 2003, and their experience in doing so may be valuable for forestry in other devel-oping countries. In this chapter, we plan to understand the processes that are responsible for China’s forest cover change based on data from six national forest inventories (NFI) (Chinese Government Documents 1977–2005), the recent refor-estation and afforestation statistics (China State Forestry Administration 2000–2007), along with remotely sensed images (Tucker et al. 2005) and economic growth data (China National Bureau of Statistics 2005). Our goals are to understand how reforestation, afforestation and deforestation contributed to the change in China’s forest cover; what the driving forces are for reforestation and afforestation; what the current status of forests in China is; and what potential challenges are for sustainable forest development in the future.
15.2 The Natural Environment
China is the biggest country by population in the world, and the third largest country by area. Its land area spans from 3°51¢N to 53°31¢N in latitude, and from 73°22¢E to 135°03¢E in longitude, constituting 9.6 million square kilometers with Hong Kong (1,100 km2), Taiwan (36,000 km2) and Macao (29 km2) included. The large land area contains complex landforms, including mountains (33%), high plateaus (26%), basins (19%), plains (12%), and hilly areas (10%). The overall landforms constitute a three-step terrace flowing from the west to the east, as indicated by the dashed lines in Fig. 15.1. The first terrace consists of the Himalayas and the Qinghai-Tibet Plateau with elevation above 4,000 m. The line that separates the second and the third terraces is marked by a series of mountains from the north to the south: the Greater Xingan Mountains, the Yan Mountains, the Taihang Mountains, the Wu Mountains, the Wuling Mountains and the Xuefeng Mountains. The third terrace is to the east of this line with elevation generally below 1,000 m, where most of the fertile agricultural lands are located.
The large land area with complex terrains inevitably sustains complex climatic conditions for China. The country can be divided into three major climatic regions: the eastern monsoon moist region (EMMR), the northwestern dry region (NWDR) and the Qinghai-Tibet high and cold region (QHCR). The EMMR roughly overlaps with the third (lowest) terrace of the country. During the summer the southeast monsoon supplies EMMR with sufficient precipitation, synchronizing the heat and moisture conditions. The southeast monsoon brings moisture from the Pacific
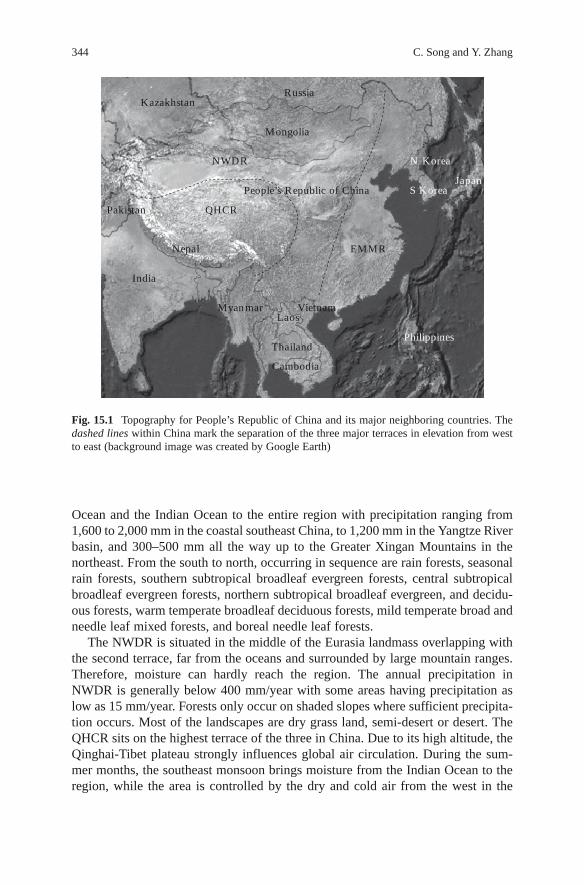
344 C. Song and Y. Zhang
Ocean and the Indian Ocean to the entire region with precipitation ranging from 1,600 to 2,000 mm in the coastal southeast China, to 1,200 mm in the Yangtze River basin, and 300–500 mm all the way up to the Greater Xingan Mountains in the northeast. From the south to north, occurring in sequence are rain forests, seasonal rain forests, southern subtropical broadleaf evergreen forests, central subtropical broadleaf evergreen forests, northern subtropical broadleaf evergreen, and decidu-ous forests, warm temperate broadleaf deciduous forests, mild temperate broad and needle leaf mixed forests, and boreal needle leaf forests.
The NWDR is situated in the middle of the Eurasia landmass overlapping with the second terrace, far from the oceans and surrounded by large mountain ranges. Therefore, moisture can hardly reach the region. The annual precipitation in NWDR is generally below 400 mm/year with some areas having precipitation as low as 15 mm/year. Forests only occur on shaded slopes where sufficient precipita-tion occurs. Most of the landscapes are dry grass land, semi-desert or desert. The QHCR sits on the highest terrace of the three in China. Due to its high altitude, the Qinghai-Tibet plateau strongly influences global air circulation. During the sum-mer months, the southeast monsoon brings moisture from the Indian Ocean to the region, while the area is controlled by the dry and cold air from the west in the
Mongolia
RussiaKazakhstan
People’s Republic of China
India
Myanmar
Thailand
JapanS Korea
N Korea
Philippines
Vietnam
Cambodia
Laos
Pakistan
Nepal
QHCR
NWDR
EMMR
Fig. 15.1 Topography for People’s Republic of China and its major neighboring countries. The dashed lines within China mark the separation of the three major terraces in elevation from west to east (background image was created by Google Earth)
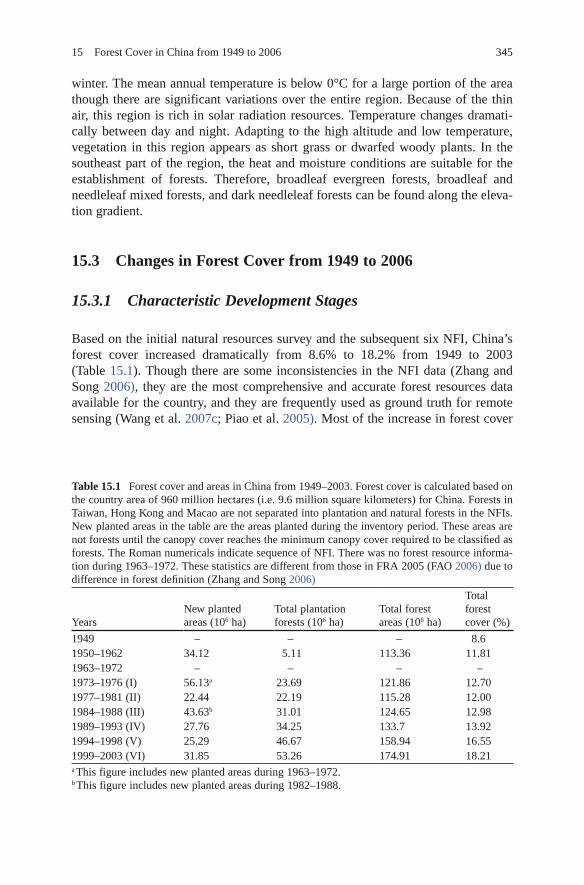
34515 Forest Cover in China from 1949 to 2006
winter. The mean annual temperature is below 0°C for a large portion of the area though there are significant variations over the entire region. Because of the thin air, this region is rich in solar radiation resources. Temperature changes dramati-cally between day and night. Adapting to the high altitude and low temperature, vegetation in this region appears as short grass or dwarfed woody plants. In the southeast part of the region, the heat and moisture conditions are suitable for the establishment of forests. Therefore, broadleaf evergreen forests, broadleaf and needleleaf mixed forests, and dark needleleaf forests can be found along the eleva-tion gradient.
15.3 Changes in Forest Cover from 1949 to 2006
15.3.1 Characteristic Development Stages
Based on the initial natural resources survey and the subsequent six NFI, China’s forest cover increased dramatically from 8.6% to 18.2% from 1949 to 2003 (Table 15.1). Though there are some inconsistencies in the NFI data (Zhang and Song 2006), they are the most comprehensive and accurate forest resources data available for the country, and they are frequently used as ground truth for remote sensing (Wang et al. 2007c; Piao et al. 2005). Most of the increase in forest cover
Table 15.1 Forest cover and areas in China from 1949–2003. Forest cover is calculated based on the country area of 960 million hectares (i.e. 9.6 million square kilometers) for China. Forests in Taiwan, Hong Kong and Macao are not separated into plantation and natural forests in the NFIs. New planted areas in the table are the areas planted during the inventory period. These areas are not forests until the canopy cover reaches the minimum canopy cover required to be classified as forests. The Roman numericals indicate sequence of NFI. There was no forest resource informa-tion during 1963–1972. These statistics are different from those in FRA 2005 (FAO 2006) due to difference in forest definition (Zhang and Song 2006)
YearsNew planted areas (106 ha)
Total plantation forests (106 ha)
Total forest areas (106 ha)
Total forest cover (%)
1949 – – – 8.61950–1962 34.12 5.11 113.36 11.811963–1972 – – – –1973–1976 (I) 56.13a 23.69 121.86 12.701977–1981 (II) 22.44 22.19 115.28 12.001984–1988 (III) 43.63b 31.01 124.65 12.981989–1993 (IV) 27.76 34.25 133.7 13.921994–1998 (V) 25.29 46.67 158.94 16.551999–2003 (VI) 31.85 53.26 174.91 18.21a This figure includes new planted areas during 1963–1972.b This figure includes new planted areas during 1982–1988.
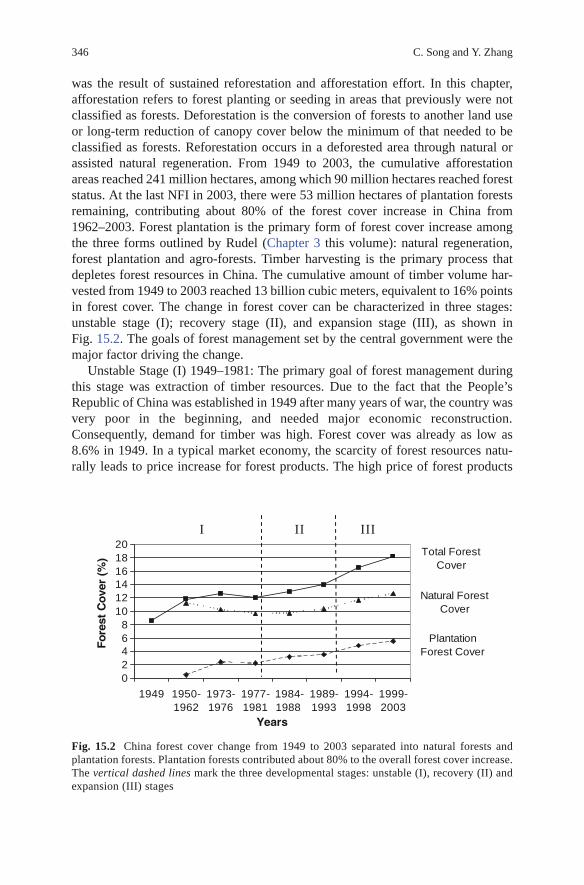
346 C. Song and Y. Zhang
Total Forest Cover
Plantation Forest Cover
Natural Forest Cover
02468
101214161820
1949 1950-1962
1973-1976
1977-1981
1984-1988
1989-1993
1994-1998
1999-2003
Years
Fo
rest
Co
ver
(%)
I II III
Fig. 15.2 China forest cover change from 1949 to 2003 separated into natural forests and plantation forests. Plantation forests contributed about 80% to the overall forest cover increase. The vertical dashed lines mark the three developmental stages: unstable (I), recovery (II) and expansion (III) stages
was the result of sustained reforestation and afforestation effort. In this chapter, afforestation refers to forest planting or seeding in areas that previously were not classified as forests. Deforestation is the conversion of forests to another land use or long-term reduction of canopy cover below the minimum of that needed to be classified as forests. Reforestation occurs in a deforested area through natural or assisted natural regeneration. From 1949 to 2003, the cumulative afforestation areas reached 241 million hectares, among which 90 million hectares reached forest status. At the last NFI in 2003, there were 53 million hectares of plantation forests remaining, contributing about 80% of the forest cover increase in China from 1962–2003. Forest plantation is the primary form of forest cover increase among the three forms outlined by Rudel (Chapter 3 this volume): natural regeneration, forest plantation and agro-forests. Timber harvesting is the primary process that depletes forest resources in China. The cumulative amount of timber volume har-vested from 1949 to 2003 reached 13 billion cubic meters, equivalent to 16% points in forest cover. The change in forest cover can be characterized in three stages: unstable stage (I); recovery stage (II), and expansion stage (III), as shown in Fig. 15.2. The goals of forest management set by the central government were the major factor driving the change.
Unstable Stage (I) 1949–1981: The primary goal of forest management during this stage was extraction of timber resources. Due to the fact that the People’s Republic of China was established in 1949 after many years of war, the country was very poor in the beginning, and needed major economic reconstruction. Consequently, demand for timber was high. Forest cover was already as low as 8.6% in 1949. In a typical market economy, the scarcity of forest resources natu-rally leads to price increase for forest products. The high price of forest products
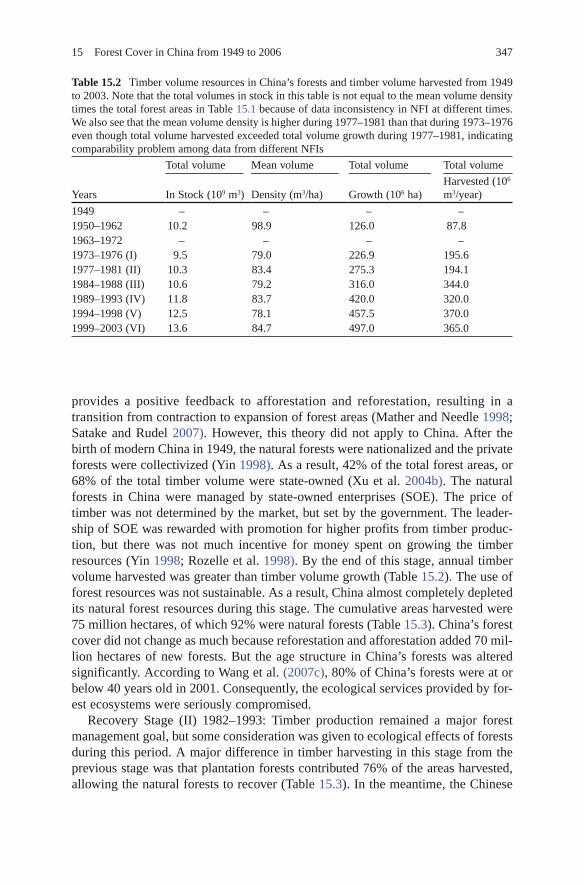
34715 Forest Cover in China from 1949 to 2006
provides a positive feedback to afforestation and reforestation, resulting in a transition from contraction to expansion of forest areas (Mather and Needle 1998; Satake and Rudel 2007). However, this theory did not apply to China. After the birth of modern China in 1949, the natural forests were nationalized and the private forests were collectivized (Yin 1998). As a result, 42% of the total forest areas, or 68% of the total timber volume were state-owned (Xu et al. 2004b). The natural forests in China were managed by state-owned enterprises (SOE). The price of timber was not determined by the market, but set by the government. The leader-ship of SOE was rewarded with promotion for higher profits from timber produc-tion, but there was not much incentive for money spent on growing the timber resources (Yin 1998; Rozelle et al. 1998). By the end of this stage, annual timber volume harvested was greater than timber volume growth (Table 15.2). The use of forest resources was not sustainable. As a result, China almost completely depleted its natural forest resources during this stage. The cumulative areas harvested were 75 million hectares, of which 92% were natural forests (Table 15.3). China’s forest cover did not change as much because reforestation and afforestation added 70 mil-lion hectares of new forests. But the age structure in China’s forests was altered significantly. According to Wang et al. (2007c), 80% of China’s forests were at or below 40 years old in 2001. Consequently, the ecological services provided by for-est ecosystems were seriously compromised.
Recovery Stage (II) 1982–1993: Timber production remained a major forest management goal, but some consideration was given to ecological effects of forests during this period. A major difference in timber harvesting in this stage from the previous stage was that plantation forests contributed 76% of the areas harvested, allowing the natural forests to recover (Table 15.3). In the meantime, the Chinese
Table 15.2 Timber volume resources in China’s forests and timber volume harvested from 1949 to 2003. Note that the total volumes in stock in this table is not equal to the mean volume density times the total forest areas in Table 15.1 because of data inconsistency in NFI at different times. We also see that the mean volume density is higher during 1977–1981 than that during 1973–1976 even though total volume harvested exceeded total volume growth during 1977–1981, indicating comparability problem among data from different NFIs
Years
Total volume Mean volume Total volume Total volume
In Stock (109 m3) Density (m3/ha) Growth (106 ha)Harvested (106 m3/year)
1949 – – – –1950–1962 10.2 98.9 126.0 87.81963–1972 – – – –1973–1976 (I) 9.5 79.0 226.9 195.61977–1981 (II) 10.3 83.4 275.3 194.11984–1988 (III) 10.6 79.2 316.0 344.01989–1993 (IV) 11.8 83.7 420.0 320.01994–1998 (V) 12.5 78.1 457.5 370.01999–2003 (VI) 13.6 84.7 497.0 365.0

348 C. Song and Y. Zhang
government started a series of ecological programs aimed at environmental protection. China achieved increases in both forest area and timber volume stock-ing by the end of this stage. The reversion of forest area contraction in China was not the result of market forces as seen in other countries in south Asia (Nagendra, Chapter 3 this volume), but more of central government efforts to mitigate increas-ing adverse ecological impacts due to severe deforestation earlier. The increase in forest cover also partly benefited from a new forest management policy. The Chinese government adopted a higher standard for afforestation in 1985, raising the survival rates from 40% to 85% in the south and to 70% in the north in order to pass afforestation inspection (Chinese Government Documents 1977–2005). Although the timber volume harvested continued to increase with time during this period, it was controlled below the annual timber volume growth (Table 15.2).
Expansion Stage (III) 1994–: Forest cover in China expanded rapidly during this stage. Timber production was no longer the primary goal of forest management. China adopted a new forest policy in 1998 (Zhang et al. 2000), which prioritized environmental protection and sustainable use of forest resources over timber production. By 1998, China’s economy had grown at a double-digit rate for two decades, allowing the Chinese government to make a significant investment in forestry. The Chinese government started six key forestry programs with a committed investment of over 700 billion yuan (approximately US$85 billion at the time) by the end of 2010. These programs include (1) natural forest protection, (2) returning agricultural lands to forests/grasses, (3) shelter forest systems for the three-north (northeast, north, and northwest) and middle-to-upper reaches of Yangtze River, (4) controlling dust and sand sources from blowing to Beijing and Tianjin, (5) wildlife
Table 15.3 Change in forest areas caused by afforestation, deforestation and reforestation in China from 1949 to 2003. Units in all columns are in 106 ha. Net Forest Change is the sum of the preceding four columns with discrepancies explained
Years
New Plantation Natural Natural Net
Forests planted
Forests harvested
Forests regenerated
Forests harvested Forest change
1949 – – – – –1950–1962 5.1 0.0 11.3 −22.8 +30.8a
1963–1972 – – – – –1973–1976 (I) 18.6 0.0 24.8 −34.8 +8.61977–1981 (II) 4.3 −5.8 6.6 −11.8 −6.71984–1988 (III) 20.5 −11.7 5.8 −5.2 +9.41989–1993(IV) 12.9 −9.6 7.0 −1.2 +9.11994–1998 (V) 13.6 −3.4 10.4 −7.1 +25.2b
1999–2003 (VI) 15.0 −8.5 7.5 −2.2 +15.9c
a The net increase in forest cover does not match the survey results, indicating that China forest cover in 1949 might have been underestimated.b The net increase includes 11.7 million hectares of forests due to change in forest definition from 30% to 20% in minimum canopy cover in 1994.c This number includes 3.7 million hectares of special purpose scrubs that were recently classified as forests and 0.5 million hectares of forests from Taiwan, Hong Kong and Macao.

34915 Forest Cover in China from 1949 to 2006
protection and natural resources conservation, and (6) the development of fast growth and high yield plantations in key regions. Due to the unprecedented effort in reforestation and afforestation, China’s forest cover reached 18.2% according to the sixth NFI in 2003. It is important to note that timber volume harvested during 1999–2003 remained very close to the highest level in history (Table 15.2), indicating timber harvesting remains a threat to forest development.
15.3.2 The 1998 Record Flooding and Forest Restoration Efforts
Years of intensive timber harvesting severely compromised the ecological functions of forest ecosystems in China, particularly for soil and water conservation. The prolonged degradation of the natural environment led to a series of natural disasters. An unprecedented flood occurred in China over almost all the major rivers in 1998. The flooding caused 250 billion Yuan (approximately $31 billion USD in 1998) in damage and a loss of 4,150 human lives (Sun et al. 2002). The alarming phenom-enon was that the total precipitation in the Yangtze River basin was lower and lasted longer in 1998 compared to the previous record flooding in 1954, yet the Yangtze River experienced record flooding with eight peaks within 2 months, indicating a severe reduction of soil water retention capacity within the basin. Sun et al. (2002) reported that every year 2.4 billion tons of soil eroded from the Yangtze River basin. As a result, the height of the riverbed in the main stream of Yangtze River increases by a meter every decade. The sediment discharge from erosion in the Yangtze River exceeds the combined discharges from the world’s two longest rivers, the Nile and the Amazon (Liu and Diamond 2005). The major lakes along the Yangtze River, which used to provide critical diversions for flood water, have shrunk significantly. The total lake area in the middle to low reaches of Yangtze River declined from 17,000 km2 in 1949 to 6,000 km2 in 1998 (Sun et al. 2002).
After a national reflection on the record flooding in 1998 (e.g. commentary appeared in People’s Daily on September 3, 1998), the central government realized the flooding was due to the long-term deforestation and poor agricultural practices that caused serious soil erosion and reduction in soil water retention capacity. The Chinese government issued a series of new policies later in the year, including the ban of log-ging in the upper and middle reaches of the Yangtze River basin. In the meantime, a new proactive measure was taken to mitigate the problem: returning agricultural lands to forests. These lands included croplands, barren mountains/lands, and mountains with regenerating forests. Among them, returning croplands to forests required the most investments as the livelihoods of the farmers needed to be settled first.
This idea was tested in Sichuan, Shanxi and Gansu provinces with success in 1999 (China State Forestry Administration 2000–2007). Returning cropland to forests was adopted as a national project shortly in 2000. The program was further advanced by being included into the tenth Five-Year Plan for the Socio-Economic Development of the People’s Republic of China in 2001. The program for returning agricultural lands to forests officially started nationwide in 2002, involving 25 provinces, 32 million

350 C. Song and Y. Zhang
households, and 124 million people (China State Forestry Administration 2000–2007). After 2004, the restoration efforts were focused on lands with slopes greater than 25°, areas with serious desertification, riparian zones, or land with low yield potential. The total investment budgeted for the project was 430 billion Yuan (approximately $58 billion USD). By the end of 2006, 9.3 million hectares of croplands were converted to forests (Table 15.4). Given the current moratorium on timber harvesting in the natural forests and the rapid increase in total afforestation areas, forest cover in China is expected to increase significantly in the next NFI.
15.3.3 Economic Growth and Forest Cover
The rapid growth of forest cover along with the growth of economy in China led some to argue that forest resources in China are currently in the later stage of the environmental Kuznets curve (Zhang et al. 2006). We examined the relationship between economic growth and increase in vegetation abundance in China based on remotely sensed images. We used increase in GDP as the measure for economic growth, and the change in normalized difference vegetation index (NDVI) as the measure of change in vegetation abundance (Song et al. 2008). NDVI is calculated from remotely sensed data as
NIR RED
NIR RED
NDVIr -r
=r + r (1)
where rNIR
and rRED
are reflectance values in the near-infrared and red spectrum, respectively. NDVI varies within [−1, 1] with a higher value indicating more abun-dance of green vegetation.
The NDVI data used in this study is from the Advanced Very High Resolution Radiometer (AVHRR) on board the NOAA-series satellites from 1982 to 2000 with a spatial resolution of 8 × 8 km (Tucker et al. 2005). AVHRR provides daily NDVI
Table 15.4 Overall afforestation efforts in China from 1999 to 2006 and areas of crop-lands converted to forest at the same time (China State Forestry Administration 2000–2007). The effort returning croplands to forests peaked in 2003 and winded down in 2006. Note: Total afforestation also included other types of lands, such as barren mountains or regenerating mountains
Year Croplands to forests (103 ha) Total afforestation (103 ha)
1999 381 4,2772000 405 5,1052001 420 4,9532002 2,586 7,7712003 3,367 9,1192004 667 5,5982005 1,111 3,6382006 267 2,718Total 9,204 43,179

35115 Forest Cover in China from 1949 to 2006
images for the entire globe. However, NDVI can be contaminated by aerosols and clouds in the atmosphere. The dataset used in this study is a 15 day composite NDVI, which takes the maximum NDVI from the 15 daily values for each pixel to minimize the contamination from clouds and aerosols in the atmosphere. Therefore, there are 24 AVHRR NDVI images each year. We used the annual total NDVI (ATN) as a measure of vegetation abundance in this study. ATN is calculated as
24
i1
ATN NDVIi=
= å (2)
where NDVIi is the 15 day composite NDVI for a pixel, and the subscript indexes
the 24 NDVI image series in a year. To minimize the random variation in NDVI in a given year, we used the mean ATN during the first six (1982–1987) and last 6 years (1995–2000) to characterize average vegetation abundance for the corresponding periods. We took the difference between the mean ATN for each province or autonomous region between the two periods as the measure of change in vegetation abundance as seen in Fig. 15.3, where bright areas indicate increase
NDVI2000-NDVI1982
High:4.762
Low:−4.9774
Fig. 15.3 The difference image between the mean annual total NDVI of 1982–1987 and 1995–2000. The bright areas indicate increase in vegetation abundance, and the dark areas indicate decrease in vegetation abundance
352 C. Song and Y. Zhang
in vegetation, dark areas indicate decrease in vegetation from 1982–1987 to 1995–2000. We overlaid the provincial boundaries on Fig. 15.3 and calculated the average value for the difference in the mean ATN for each province or autonomous region. We then calculated the difference in the mean annual GDP for each province or autonomous region for 1982–1987 and 1995–2000, respectively (China’s National Bureau of Statistics 2005). Assuming an annual inflation rate of 3%, the GDP during 1982–1987 was converted to 1995–2000 value before taking the difference. Figure 15.4 shows how economic growth related to change in veg-etation abundance in China from 1982–1987 to 1995–2000. Similar to the conclu-sion reached by Wang et al. (2007b), our empirical data do not support the argument that forest resources in China are in the later stage of an environmental Kuznets curve. According to the trend in Fig. 15.4, economic growth generally reduces vegetation cover. Contrary to what Zhang et al. (2006) argued, forest resources in China are still in the early stage on the Kuznets curve if we look at the relationship at the provincial scale. The increase in the overall forest cover in China is not the result of feedbacks from the economic development in each province. It is the result of the central government’s mandate for afforestation and reforestation. Therefore, the forest cover in China may cease to expand if the government sponsored programs end.
−4
−3
−2
−1
0
1
2
3
4
5
0 100 200 300 400 500 600 700 800
Provincial GDP Growth (x109 Yuan)
Mea
n A
nn
ual
To
tal N
DV
I Dif
fere
nce
Fig. 15.4 The relationship between economic growth and vegetation abundance as measured by the provincial average value of the difference in mean annual total NDVI from 1995–2000 to 1982–2987(shown in Fig. 15.3). Note that we excluded Beijing, Shanghai, and Tianjin from the analysis due to their overwhelming urban settings. We also combined Chongqing with Sichuan province and Hainan with Guangdong province as they were part of the corresponding provinces during 1982–1987

35315 Forest Cover in China from 1949 to 2006
15.4 Discussion
Increase in forest cover in China was witnessed both on the ground via NFI (Nei 2005) and from space via remote sensing (Fang et al. 2004). However, it remains low compared with the average of 30% forest cover in the world. The per capita forest area is even less with 0.1 ha/person in China, compared with the world aver-age of 0.62 ha/person (FAO 2006). The low forest cover in China is partly due to the fact that the vast northwestern region is not suitable for forest growth, and partly due to the high population that demand large agricultural area for food production. The recent unprecedented investment by the Chinese government in forestry led to significant progress in afforestation (Wang et al. 2007a). The Chinese government set an ambitious goal for the forest cover to reach 26% by 2050. However, several recent studies revealed serious problems for the natural forest protection program and the program of returning agricultural land to forests, two of the six key forestry programs (Trac et al. 2007). Control of logging remains a problem, particularly for large state forests under control of local managers (Xu et al. 2004b). The “top-down” style administration from the central government lacks mechanisms for efficient engagement of local people (Xu et al. 2006). Many participants in the program of returning agricultural lands to forests have not been properly compensated (Xu et al. 2004a). There has also been a lack of long-term planning for how to preserve the newly established forests. Uchida et al. (2005) found that participating farmers may reconvert the forested land back to cultivation after the program ends. The initial success, resulting from the unprecedented investment from the central government, may not last without careful long-term planning.
It is important to note that increase in forest cover does not necessarily signify an increase in forest resources, nor does it bring immediate improvement to the environment (Meyfroidt and Lambin, Chapter 14 this volume). Though the rapid increase in China’s forest cover should be applauded, the future of the ecological environments in China remains bleak in the foreseeable future. Improvements of ecological conditions in China require sustained efforts for several generations (Song 2000). China almost completely wiped out its natural old-growth forests. Most of the increase in forest cover is from plantations, which are known for low biodiversity (Rudel, Chapter 3 this volume). The aggregate statistics for China’s forest cover may create a false sense of ecological security (Rozelle et al. 1998) as forest successional stages are not accounted for in forest cover. A young plantation forest is counted the same as an old-growth natural forest in forest cover. However, the ecological functions of the two forests cannot be compared. The unique eco-logical niches that an old-growth forest provides for many other plants and ani-mals cannot be found in any young stands. Soils under an old-growth canopy that have been accumulating organic matter for centuries do not exist under new plantation forests. Banning of logging in the upper and middle reaches of Yangtze River and the new plantations created in the area through the various forestry programs will certainly help reduce soil erosion. However, we cannot expect much alleviation in flooding in the near future should the 1998 rain storms hit China again. The forest ecosystems need many decades, even centuries, of development

354 C. Song and Y. Zhang
before they can provide the ecological services we hope for. Some lost habitats may never recover.
Due to both its size and population, improvement of China’s environment will affect the most people in the world and contribute significantly to the improvement of the global environment. The reversion of declining forest cover in China offers hope for forestry in developing countries. Though the expansion of forest areas through reforestation and afforestation does little to preserve biodiversity, they do conserve soil and sequester carbon (Rudel et al. 2005). Enhanced vegetation activi-ties were already detected in China from Space (Xiao and Moody 2004; Fang et al. 2004). Several recent studies found that forestry in China has become a significant carbon sink (Zhang and Xu 2003; Piao et al. 2005; Fang et al. 2007). If the ambi-tious goal of 26% forest cover is achieved, the forest ecosystems in China will play an increasingly bigger role in carbon sequestration in the foreseeable future.
15.5 Conclusions
Forest cover in China increased from approximately 8.6% in 1949 to 18.2% in 2003, experiencing three development stages: unstable, recovery, and expansion stages. Government sponsored plantation forests contributed about 80% of the increase from 1962 to 2003. Forest cover in China is expected to increase significantly in the next NFI. In the meantime, China harvested 13 billion cubic meters of timber, equivalent to 16% points in forest cover. Though forest cover in China did not decrease as much, forest age structure shifted dramatically toward the young end. As a result, the ecological functions of forest ecosystems were seriously compro-mised. The unprecedented flood in 1998 shocked the government into action. The Chinese government dramatically adjusted its forest management policy and started six key forestry programs with unprecedented investment, aiming at improv-ing China’s ecological environment. Though China’s forest cover increased rapidly, we found China’s forest resources are still in the early stage in the environmental Kuznets curve. Therefore, the possibility still exists for China’s forest to degrade with economic growth without the mandate from the central government. Though the young forests in China are playing an increasingly greater role in carbon sequestration, the ecological functions of mature and old-growth natural forests cannot be replaced with the young forests in the short-term. Timber harvesting remains a threat to the development of forest ecosystems. Numerous emerging problems in implementing the new forest policy need to be resolved, and long-term planning is urgently needed for the forest ecosystems to reach sustainable development.
Acknowledgments This work was partly supported by NASA grant NNX06AE28G. The authors thank Jackson Lord for help collecting provincial GDP data for China, and Limin Zhou for provid-ing the NDVI data.

35515 Forest Cover in China from 1949 to 2006
References
China National Bureau of Statistics (2005) China compendium of Statistics 1949–2004. China Statistics Press, Beijing
China State Forestry Administration (2000–2007) Annals of Forestry in China. China Forestry Press, Beijing, China
Chinese Government Documents (1977–2005) Chinese Ministry of Forestry, 1977, National Forest Resource Statistics: 1973–1976; Chinese Ministry of Forestry, 1993, National Forest Resource Statistics: 1977–1981; Chinese Ministry of Forestry, 1989, China Forest Resource Statistics: 1984–1988; Chinese Ministry of Forestry, 1994, National Forest Resource Statistics: 1989–1993; Division of Forest Resources, Policy and Management, Chinese Ministry of Forestry, 1996, Forest Resources of Contemporary China: 1949–1993; China State Forestry Administration, 2000, National Forest Resource Statistics: 1994–1998; State Forestry Administration, 2005, Report of China Forest Resources in 2005, China Forestry Press
Dobson AP, Bradshaw AD, Baker JM (1997) Hopes for the future: restoration ecology and con-servation biology. Science 277:515–522
Ehrhardt-Martinez K, Crenshaw EM, Jenkins JC (2002) Deforestation and the environmental Kuznets curve: a cross-national investigation of intervening mechanisms. Soc Sci Q 83:226–243
Ewers RM (2006) Interaction effects between economic development and forest cover determine deforestation rates. Global Environ Change 16:161–169
Fang JY, Piao SL, He JS et al (2004) Increasing terrestrial vegetation activity in China, 1982–1999. Sci China (Ser C) 47(3):229–240
Fang JY, Guo ZD, Piao SL et al (2007) Terrestrial vegetation carbon sinks in China, 1981–2000. Sci China Ser D-Earth Sci 50:1341–1350
Food and Agricultural Organization of United Nations (FAO) (2006) Global Forest Resources Assessment 2005: progress toward sustainable forest management. FAO Forestry Paper 147. ISBN 92-5-105481–9.
Foley JA, DeFries R, Asner GP et al (2005) Global consequences of land use. Science 309:570–574Hyde WF, Amacher GS, Magrath W (1996) Deforestation and forest land use: theory, evidence
and policy implications. World Bank Res Obs 11:223–248Kauppi PE, Ausubel JH, Fang J et al (2006) Returning forests analyzed with the forest identity.
PNAS 103:17574–17579Laarman JG, Sedjo RA (1992) Global forests: issues for six billion people. McGraw-Hill, New
YorkLiu J, Diamond J (2005) China’s environment in a globalizing world. Nature 435:1179–1186Mather AS, Needle CL (1998) The forest transition: a theoretical basis. Area 30:117–124Nei J (2005) Forest resources of China. China Forestry Press, Beijing, P. R. ChinaPiao SL, Fang JY, Zhu B et al (2005) Forest biomass carbon stocks in China over the past 2
decades: estimated based on integrated inventory and satellite data. J Geophys Res 110 (G01006). doi:10.1029/2005JG000014
Rozelle S, Albers H, Li G et al (1998) Forest resources under economic reform in China. China Info 13:106–125
Rudel TK, Coones OT, Moran E et al (2005) Forest transitions: toward a global understanding of land use change. Global Environ Change 15:23–31
Salim E, Ullsten O (1999) Our forests our future. Cambridge University Press, Cambridge, UKSatake A, Rudel TK (2007) Modeling the forest transition: forest scarcity and ecosystem service
hypotheses. Ecol Appl 17:2024–2036Song C (2000) Comments on China’s forest policy for the 21st century. Science. Edebate. http://
www.sciencemag.org/cgi/eletters/288/5474/2135Song C, Lord WJ, Zhou L et al (2008) Empirical evidence for impacts of internal migration on
vegetation dynamics in China from 1982 to 2000. Sensors 8:5069–5080
356 C. Song and Y. Zhang
Stern DI, Common MS, Barbier EB (1996) Economic growth and environmental degradation: the environmental kuznets curve and sustainable development. World Dev 24:1151–1160
Sun J, Zhao C, Wang L (2002) The long march of green: the chronicle of returning agricultural land to forests in China. China Modern Economics Press, Beijing
Trac CJ, Harrell S, Hinckley TM et al (2007) Reforestation programs in Southwest China: reported success, observed failure, and the reasons why. J Mount Sci 4:275–292
Tucker CJ, Pinzon JE, Brown ME et al (2005) An extended AVHRR 8-km NDVI dataset compat-ible with MODIS and SPOT vegetation NDVI data. Int J Remote Sens 26(20):4485–4498
Uchida E, Xu J, Rozelle S (2005) Grains for green: cost-effectiveness and sustainability of China’s conservation set-aside program. Land Econ 81:247–264
Vogt KA, Gara RI, Honea JM et al (2007) Historical perceptions and uses of forests. In: Vogt KA, Honea JM, Vogt DJ et al (eds) Forests and society: sustainability and life cycles of forests in human landscapes. Cromwell, Trowbridge, UK
Wang G, Innes JL, Lei J et al (2007a) China’s forestry reforms. Science 318:1556–1557Wang S, Liu C, Wilson B (2007b) Is China in a later stage of a U-shaped forest resource curve?
A re-examination of empirical evidence. Forest Policy Econ 10:1–6Wang S, Chen JM, Ju WM et al (2007c) Carbon sinks and sources in China’s forests during
1901–2001. J Environ Manage 85:524–537Watson RT, Noble IR, Bolin B et al (2000) Land use, land-use change, and forestry. Cambridge
University Press, Cambridge, UKXiao J, Moody A (2004) Trends in vegetation activity and their climatic correlations: China
1982–1998. Int J Remote Sens 25:5669–5689Xiong D (1989) Recent history of forestry in China: 1840–1949. China Forestry Press, BeijingXu Z, Bennett MT, Tao R et al (2004a) China’s sloping land conversion programme four years on:
current situation and pending issues. Int Forestry Rev 6(3–4):317–326Xu J, Tao G, Amacher GS (2004b) An empirical analysis of China’s state-owned forests. Forest
Policy Econ 6:379–390Xu J, Yin R, Li Z et al (2006) China’s ecological rehabilitation: unprecedented efforts, dramatic
impacts, and requisite policies. Ecol Econ 57:595–607Yin R (1998) Forestry and the environment in China: the current situation and strategic choices.
World Dev 26:2153–2167Zhang and Xu 2003: Zhang XQ, Xu DY (2003) Potential carbon sequestration in China’s forests.
Environ Sci & Pol 6(5): 421–432Zhang Y, Song C (2006) Impacts of afforestation, deforestation and reforestation on forest cover
in China from 1949 to 2003. J For 104(7):383–387Zhang P, Shao GF, Zhao G et al (2000) Ecology – China’s forest policy for the 21st century.
Science 288:2135–2136Zhang Y, Tachibana S, Nagata S (2006) Impact of socio-economic factors on the changes in forest
areas in China. For Policy Econ 9:63–76
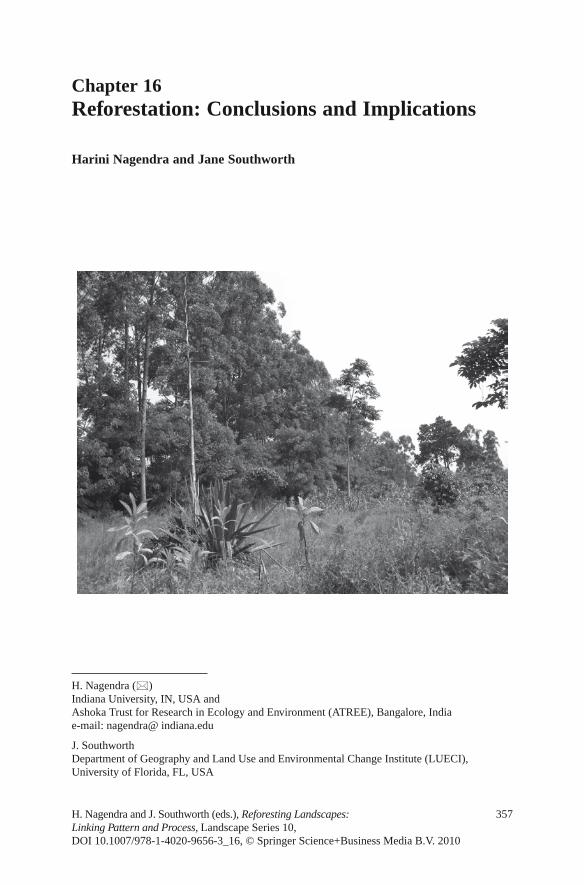
357
H. Nagendra (*) Indiana University, IN, USA and Ashoka Trust for Research in Ecology and Environment (ATREE), Bangalore, India e-mail: nagendra@ indiana.edu
J. Southworth Department of Geography and Land Use and Environmental Change Institute (LUECI), University of Florida, FL, USA
Chapter 16Reforestation: Conclusions and Implications
Harini Nagendra and Jane Southworth
H. Nagendra and J. Southworth (eds.), Reforesting Landscapes: Linking Pattern and Process, Landscape Series 10, DOI 10.1007/978-1-4020-9656-3_16, © Springer Science+Business Media B.V. 2010
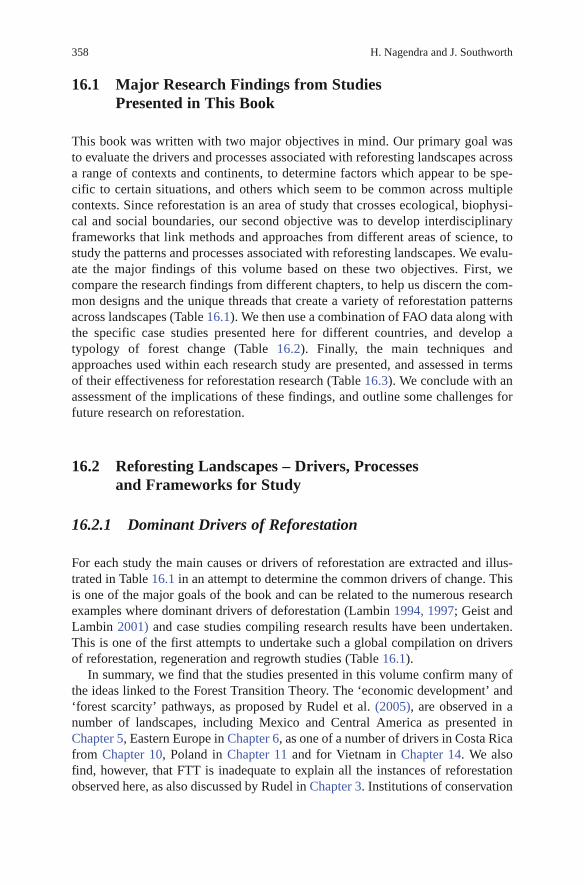
358 H. Nagendra and J. Southworth
16.1 Major Research Findings from Studies Presented in This Book
This book was written with two major objectives in mind. Our primary goal was to evaluate the drivers and processes associated with reforesting landscapes across a range of contexts and continents, to determine factors which appear to be spe-cific to certain situations, and others which seem to be common across multiple contexts. Since reforestation is an area of study that crosses ecological, biophysi-cal and social boundaries, our second objective was to develop interdisciplinary frameworks that link methods and approaches from different areas of science, to study the patterns and processes associated with reforesting landscapes. We evalu-ate the major findings of this volume based on these two objectives. First, we compare the research findings from different chapters, to help us discern the com-mon designs and the unique threads that create a variety of reforestation patterns across landscapes (Table 16.1). We then use a combination of FAO data along with the specific case studies presented here for different countries, and develop a typology of forest change (Table 16.2). Finally, the main techniques and approaches used within each research study are presented, and assessed in terms of their effectiveness for reforestation research (Table 16.3). We conclude with an assessment of the implications of these findings, and outline some challenges for future research on reforestation.
16.2 Reforesting Landscapes – Drivers, Processes and Frameworks for Study
16.2.1 Dominant Drivers of Reforestation
For each study the main causes or drivers of reforestation are extracted and illus-trated in Table 16.1 in an attempt to determine the common drivers of change. This is one of the major goals of the book and can be related to the numerous research examples where dominant drivers of deforestation (Lambin 1994, 1997; Geist and Lambin 2001) and case studies compiling research results have been undertaken. This is one of the first attempts to undertake such a global compilation on drivers of reforestation, regeneration and regrowth studies (Table 16.1).
In summary, we find that the studies presented in this volume confirm many of the ideas linked to the Forest Transition Theory. The ‘economic development’ and ‘forest scarcity’ pathways, as proposed by Rudel et al. (2005), are observed in a number of landscapes, including Mexico and Central America as presented in Chapter 5, Eastern Europe in Chapter 6, as one of a number of drivers in Costa Rica from Chapter 10, Poland in Chapter 11 and for Vietnam in Chapter 14. We also find, however, that FTT is inadequate to explain all the instances of reforestation observed here, as also discussed by Rudel in Chapter 3. Institutions of conservation
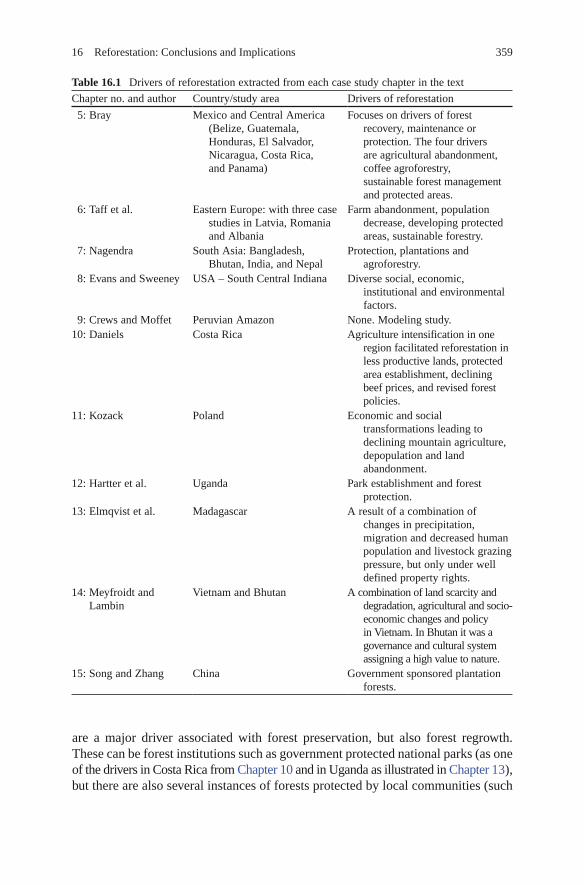
35916 Reforestation: Conclusions and Implications
Table 16.1 Drivers of reforestation extracted from each case study chapter in the text
Chapter no. and author Country/study area Drivers of reforestation
5: Bray Mexico and Central America (Belize, Guatemala, Honduras, El Salvador, Nicaragua, Costa Rica, and Panama)
Focuses on drivers of forest recovery, maintenance or protection. The four drivers are agricultural abandonment, coffee agroforestry, sustainable forest management and protected areas.
6: Taff et al. Eastern Europe: with three case studies in Latvia, Romania and Albania
Farm abandonment, population decrease, developing protected areas, sustainable forestry.
7: Nagendra South Asia: Bangladesh, Bhutan, India, and Nepal
Protection, plantations and agroforestry.
8: Evans and Sweeney USA – South Central Indiana Diverse social, economic, institutional and environmental factors.
9: Crews and Moffet Peruvian Amazon None. Modeling study.10: Daniels Costa Rica Agriculture intensification in one
region facilitated reforestation in less productive lands, protected area establishment, declining beef prices, and revised forest policies.
11: Kozack Poland Economic and social transformations leading to declining mountain agriculture, depopulation and land abandonment.
12: Hartter et al. Uganda Park establishment and forest protection.
13: Elmqvist et al. Madagascar A result of a combination of changes in precipitation, migration and decreased human population and livestock grazing pressure, but only under well defined property rights.
14: Meyfroidt and Lambin
Vietnam and Bhutan A combination of land scarcity and degradation, agricultural and socio-economic changes and policy in Vietnam. In Bhutan it was a governance and cultural system assigning a high value to nature.
15: Song and Zhang China Government sponsored plantation forests.
are a major driver associated with forest preservation, but also forest regrowth. These can be forest institutions such as government protected national parks (as one of the drivers in Costa Rica from Chapter 10 and in Uganda as illustrated in Chapter 13), but there are also several instances of forests protected by local communities (such
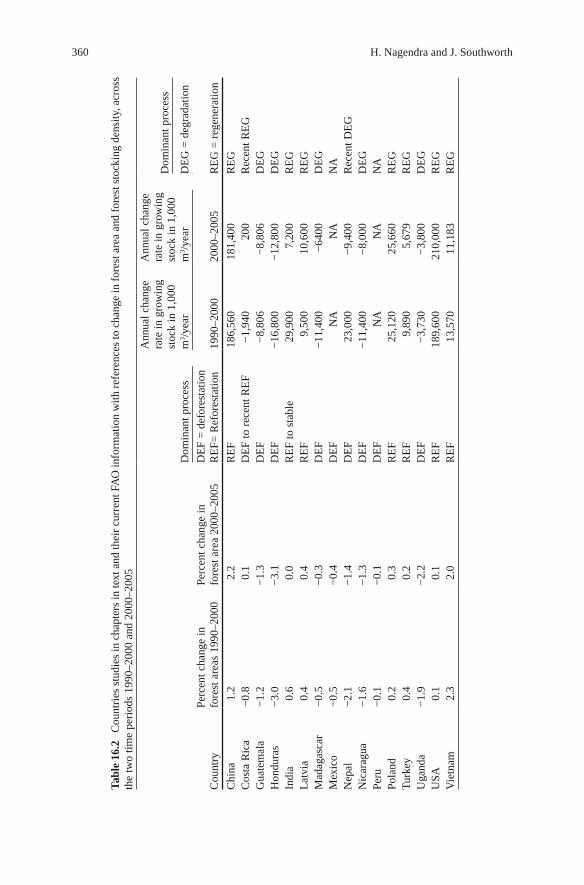
360 H. Nagendra and J. Southworth
Tabl
e 16
.2
Cou
ntri
es s
tudi
es in
cha
pter
s in
text
and
thei
r cu
rren
t FA
O in
form
atio
n w
ith r
efer
ence
s to
cha
nge
in f
ores
t are
a an
d fo
rest
sto
ckin
g de
nsity
, acr
oss
the
two
time
peri
ods
1990
–200
0 an
d 20
00–2
005
Cou
ntry
Perc
ent c
hang
e in
fo
rest
are
as 1
990–
2000
Perc
ent c
hang
e in
fo
rest
are
a 20
00–2
005
Ann
ual c
hang
e ra
te in
gro
win
g st
ock
in 1
,000
m
3 /ye
ar
Ann
ual c
hang
e ra
te in
gro
win
g st
ock
in 1
,000
m
3 /ye
arD
omin
ant p
roce
ss
Dom
inan
t pro
cess
DE
G =
deg
rada
tion
DE
F =
def
ores
tatio
nR
EF=
Ref
ores
tatio
n19
90–2
000
2000
–200
5R
EG
= r
egen
erat
ion
Chi
na1.
2 2
.2R
EF
186,
560
181,
400
RE
GC
osta
Ric
a−
0.8
0.1
DE
F to
rec
ent R
EF
−1,
940
200
Rec
ent R
EG
Gua
tem
ala
−1.
2−
1.3
DE
F−
8,80
6−
8,80
6D
EG
Hon
dura
s−
3.0
−3.
1D
EF
−16
,800
−12
,800
DE
GIn
dia
0.6
0.0
RE
F to
sta
ble
29,9
007,
200
RE
GL
atvi
a0.
4 0
.4R
EF
9,50
010
,600
RE
GM
adag
asca
r−
0.5
−0.
3D
EF
−11
,400
−64
00D
EG
Mex
ico
−0.
5−
0.4
DE
FN
AN
AN
AN
epal
−2.
1−
1.4
DE
F23
,000
−9,
400
Rec
ent D
EG
Nic
arag
ua−
1.6
−1.
3D
EF
−11
,400
−8,
000
DE
GPe
ru−
0.1
−0.
1D
EF
NA
NA
NA
Pola
nd0.
2 0
.3R
EF
25,1
2025
,660
RE
GT
urke
y0.
4 0
.2R
EF
9,89
05,
679
RE
GU
gand
a−
1.9
−2.
2D
EF
−3,
730
−3,
800
DE
GU
SA0.
1 0
.1R
EF
189,
600
210,
000
RE
GV
ietn
am2.
3 2
.0R
EF
13,5
7011
,183
RE
G
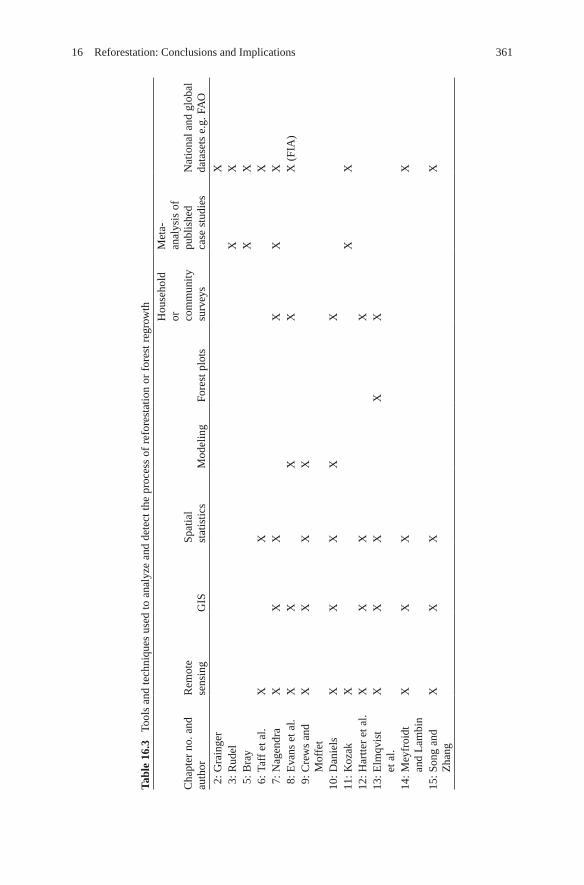
36116 Reforestation: Conclusions and Implications
Tabl
e 16
.3
Tool
s an
d te
chni
ques
use
d to
ana
lyze
and
det
ect t
he p
roce
ss o
f re
fore
stat
ion
or f
ores
t reg
row
th
Cha
pter
no.
and
au
thor
Rem
ote
sens
ing
GIS
Spat
ial
stat
istic
sM
odel
ing
Fore
st p
lots
Hou
seho
ld
or
com
mun
ity
surv
eys
Met
a-an
alys
is o
f pu
blis
hed
case
stu
dies
Nat
iona
l and
glo
bal
data
sets
e.g
. FA
O
2: G
rain
ger
X 3
: Rud
elX
X 5
: Bra
yX
X 6
: Taf
f et
al.
XX
X 7
: Nag
endr
aX
XX
XX
X 8
: Eva
ns e
t al.
XX
XX
X (
FIA
) 9
: Cre
ws
and
Mof
fet
XX
XX
10: D
anie
lsX
XX
XX
11: K
ozak
XX
X12
: Har
tter
et a
l.X
XX
X13
: Elm
qvis
t et
al.
XX
XX
X
14: M
eyfr
oidt
an
d L
ambi
nX
XX
X
15: S
ong
and
Zha
ngX
XX
X
362 H. Nagendra and J. Southworth
as in Nepal, Chapter 7 or Madagascar, Chapter 13, or even as in Chapter 14, Bhutan, where it was a governance and cultural system assigning a high value to nature). The discussions in these chapters clearly indicate that people do not only protect forests from a utilitarian perspective, driven by perceived scarcity of forest products, as proposed by Rudel et al. (2005) – but in addition, there is a basic human tendency towards conservation that makes itself powerfully shown even in cases where extreme poverty and forest dependence coexist with high population densities. Rudel also raises some of these issue is Chapter 3 of this volume.
Plantations and Agroforestry systems are also increasingly common pathways to reforestation and dominate in some cases, such as in China (Chapter 15), where government replanting schemes have created widespread reforestation in the form of plantations. Agroforestry generally occurs on a much smaller scale than govern-ment led plantation programs, but can also be a significant reforestation process, as illustrated in Central America and Mexico (Chapter 5 – both coffee agroforestry and sustainable forestry programs) and in South Asia (Chapter 8). With increasing concern about environmental services and the development of payment for environ-mental services provided, we may well see an increase in these smaller scale refor-estation and agroforestry systems and so a better understanding of these systems is warranted. Ultimately, as stated Section 10.6, this volume: in
context-specific case studies must be linked to broader global forest cover trends and the supply/demand of forest goods in order to appropriately contextualize regional or national-level forest recovery, its driving forces, and its degree of permanence. ….As of now, the issues of land development pressure, the timber trade and deforestation displace-ment are not explicitly addressed in the forest transition literature for developing countries. (Daniels, page 249)
This is an important addition to this body of literature and these forces of plantation forests, forestry and agroforestry will lead an increasingly important role if payment for environmental services programs continue (see Chapter 10 for more discussion) and also larger programs such as REDD (Reducing emissions from defores-tation and degradation) which are policy programs linked to the post-Kyoto climate change agreements (see later for more discussion) which may link payments to reforestation.
16.2.2 Typologies of Forest Change
Before 1990 there was much debate on the quality of the FAO database. However, for the 1990–2000, and 2005 datasets recalculations were undertaken, in which a single forest definition was used (10% canopy closure), and along with the advent of the use of coarse scale remote sensing as a means of collecting the data to sup-plement expert opinion for each country, these data are now more useable and more accurate (Grainger 2008; FAO 2006; Rudel et al. 2005). By using FAO databases some basic national-level information on the various countries can be discerned for the same time period (FAO 2006).

36316 Reforestation: Conclusions and Implications
FAO data and location of the research countries within the FAO database and trends of change are given below for the main countries discussed within the text. For each country the dominant processes of reforestation or deforestation at the national level are given based on the change in forest area values, followed by the change in stocking density values, which is used as an indication of within cover processes of forest degradation or regeneration processes. Such processes may also be a precursor to future changes or shifts in forest area, with continued degradation and thinning of forest areas often occurring as a precursor to deforestation, and forest regeneration and increasing biomass within existing stands as a possible precursor to continued forest expansion and reforestation processes. Such an approach allows us to categorize different countries and regions into broad types, and develop a typology of forest change (Table 16.2).
If we review the trends illustrated in Table 16.2 we can see that there are four basic types of groupings occurring here at these national levels. (For a larger discus-sion of these types see Kauppi et al. (2006), which discusses the top 50 nations in terms of growing stock.) Here we are looking only at the countries highlighted within this volume and placing these countries within this larger discussion. As such we can see the following eight groups are possible outcomes here: (1) reforestation via the addition of new land in forest cover, shown by an increase in the percent area but not in growing stock or density; (2) deforestation via the loss of land in forest cover, but no real change in growing stock on the remaining land; (3) regeneration and increased density of existing forest lands, without additional area in forest cover; (4) degradation and thinning of existing forest areas, without the loss of actual forest cover extent; (5) processes of both reforestation and regeneration occurring together on the landscape; (6) deforestation and degradation occurring on the landscape; (7) reforestation occurring but with degradation within those, shown by decreasing stocking numbers; and (8) deforestation occurring but regeneration on remaining forested areas.
From the table we can see in reality we only have two main groups as the processes of reforestation and regeneration go together and deforestation and degradation. As such, we have China, Costa-Rica from 2000 to 2005, India, Latvia, Poland, Turkey, USA and Vietnam where reforestation is the dominant process occurring on the landscape as evidenced by an increasing area of land in forest cover, but hand in hand is the process of regeneration with increased stocking densities being found on the already forested lands. On the other hand we have Guatemala, Honduras, Madagascar, Nepal, Nicaragua and Uganda where deforestation or loss of land area in forest cover is occurring, and also a decrease in stocking or density on remaining for-est lands. The two remaining countries of Peru and Mexico have deforestation as the dominant process, but data on stocking number changes are unavailable and so we do not know if these would also show the degradation trend. It is of interest to note then, that for those countries covered in this book, only half have reforestation and regen-eration as the dominant national process occurring on the landscape. The remaining half of the locations has deforestation and most probably degradation occurring nationally, and yet here in this volume, we have highlighted regions or areas where the reverse process is occurring, in terms of reforestation or regeneration.
364 H. Nagendra and J. Southworth
16.2.3 Tools for Reforestation Studies
The tools used in each of the research sites are highlighted in Table 16.3 and discussed below.
The use of interdisciplinary tools and techniques, as illustrated in Table 16.3, highlights how reforestation crosses social and natural boundaries both in topic and in the range of tools and techniques used in its study. Even with this plethora of information and case studies as illustrated here though, it still seems there are gaps in some areas, as more studies need to directly measure and add an ecological dimension (Chapter 13 provides an example of this integration), and more studies need to add an economic dimension (Chapter 14 provides an example of this). The available case studies in the literature also provide a fruitful base for data mining, and this is growing rapidly with more people waking up to the idea that reforesta-tion is a land cover trend in need of more research. As such this current volume represents timely information and serves to fill a void in the literature.
16.3 Continued and Future Challenges for Reforestation Research
Through this book, our endeavor is to map our current state of knowledge on refor-estation, to outline the gaps in our understanding, and to identify the major chal-lenges for reforestation research. Based on discussions with all authors contributing to this volume, we have identified major challenges critical to reforestation studies, which are not addressed in this volume, but which we feel are critical to address in future research. These are listed and discussed below.
16.3.1 Definitions of Reforestation
A common language needs to be developed and agreed upon across the different scientific communities involved in this work, to consolidate the different terms used within this field. Generally speaking we have found that regeneration implies a natural process often occurring after land abandonment, and if left alone, usually leads to reforestation on the landscape. The point at which a regenerating landscape becomes reforested may be uncertain and is usually a function of the ecosystem in question. This process can be hard to ‘see’ or ‘measure’ with many of the interdis-ciplinary methods currently used (such as remote sensing, see Table 16.3) but links well to the need for more ecological measures and data collection as part of these studies. This implies a natural process and no additional role of humans, beyond the abandonment of the land. Additional forms of reforestation are those which come about as a process of planting trees, such as for agroforestry or plantations,
36516 Reforestation: Conclusions and Implications
also termed afforestation within the forestry community. Given the very different processes and pathways which can be followed a consolidation of the terminology currently in use, to create ‘set definitions’ would help studies crossing such disci-plinary boundaries to communicate much more easily, and facilitate data exchange and comparison of studies.
16.3.2 Need Long-Term Assessments of Change
Just like the long term ecological research sites (LTER) and other long term assessments, we also need these longer term research sites to study the issues of land cover change, including those related to reforestation. These studies should link the social and ecological processes together, and be at multiple temporal and spatial scales. They should incorporate a multitude of available methodologies (Table 16.3) and also emphasize repeat measures and the potential role of remote sensing, not just in terms of land cover classifications and conversions but also to emphasize the ‘within-class’ changes and modifications which are so key for us to evaluate and understand (Southworth et al. 2004). Such studies could be tied in with some major, key issues which we will be addressing in the coming years, specifically those of Carbon/REDD and Climate Change. This is important as issues of reforestation are long term processes that may be difficult to study in single date snapshots or shorter duration field studies (unlike the abrupt changes brought about immediately upon deforestation) and so to gain spotlight or the attention deserved we should link the issues associated with reforestation and the research needs, to those larger and more critical topics such as ‘Carbon’ and ‘Climate Change’.
16.3.3 Drivers of Future Change
There are a few drivers which we pick up as currently only influencing a small part of our study landscapes, but which are likely to play an increasingly significant role in the future. These drivers link to future research directions, and specifically are linkages between the environment and our existing social, political, and economic systems. As such we will mention these areas briefly in this section as these may well provide future mechanisms by which reforestation will occur. These areas are: climate change; carbon sequestration and REDD; and payment for environmental services.
Climate change has the potential to drive land cover change as people seek to sequester more carbon in our ecosystems (such as via reforesting landscapes) and so decrease the atmospheric carbon dioxide concentrations. While there is still much current debate on the role of forests and potential gains of reforestation schemes (Clark 2004; IPCC 2007), this debate seems likely to continue and the potential for reforestation schemes to increase globally (though there are projected
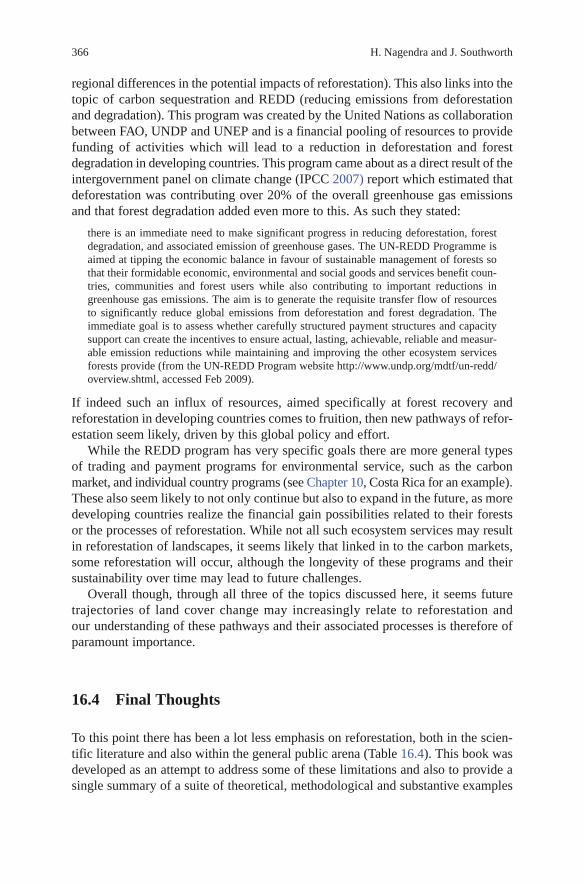
366 H. Nagendra and J. Southworth
regional differences in the potential impacts of reforestation). This also links into the topic of carbon sequestration and REDD (reducing emissions from deforestation and degradation). This program was created by the United Nations as collaboration between FAO, UNDP and UNEP and is a financial pooling of resources to provide funding of activities which will lead to a reduction in deforestation and forest degradation in developing countries. This program came about as a direct result of the intergovernment panel on climate change (IPCC 2007) report which estimated that deforestation was contributing over 20% of the overall greenhouse gas emissions and that forest degradation added even more to this. As such they stated:
there is an immediate need to make significant progress in reducing deforestation, forest degradation, and associated emission of greenhouse gases. The UN-REDD Programme is aimed at tipping the economic balance in favour of sustainable management of forests so that their formidable economic, environmental and social goods and services benefit coun-tries, communities and forest users while also contributing to important reductions in greenhouse gas emissions. The aim is to generate the requisite transfer flow of resources to significantly reduce global emissions from deforestation and forest degradation. The immediate goal is to assess whether carefully structured payment structures and capacity support can create the incentives to ensure actual, lasting, achievable, reliable and measur-able emission reductions while maintaining and improving the other ecosystem services forests provide (from the UN-REDD Program website http://www.undp.org/mdtf/un-redd/overview.shtml, accessed Feb 2009).
If indeed such an influx of resources, aimed specifically at forest recovery and reforestation in developing countries comes to fruition, then new pathways of refor-estation seem likely, driven by this global policy and effort.
While the REDD program has very specific goals there are more general types of trading and payment programs for environmental service, such as the carbon market, and individual country programs (see Chapter 10, Costa Rica for an example). These also seem likely to not only continue but also to expand in the future, as more developing countries realize the financial gain possibilities related to their forests or the processes of reforestation. While not all such ecosystem services may result in reforestation of landscapes, it seems likely that linked in to the carbon markets, some reforestation will occur, although the longevity of these programs and their sustainability over time may lead to future challenges.
Overall though, through all three of the topics discussed here, it seems future trajectories of land cover change may increasingly relate to reforestation and our understanding of these pathways and their associated processes is therefore of paramount importance.
16.4 Final Thoughts
To this point there has been a lot less emphasis on reforestation, both in the scien-tific literature and also within the general public arena (Table 16.4). This book was developed as an attempt to address some of these limitations and also to provide a single summary of a suite of theoretical, methodological and substantive examples
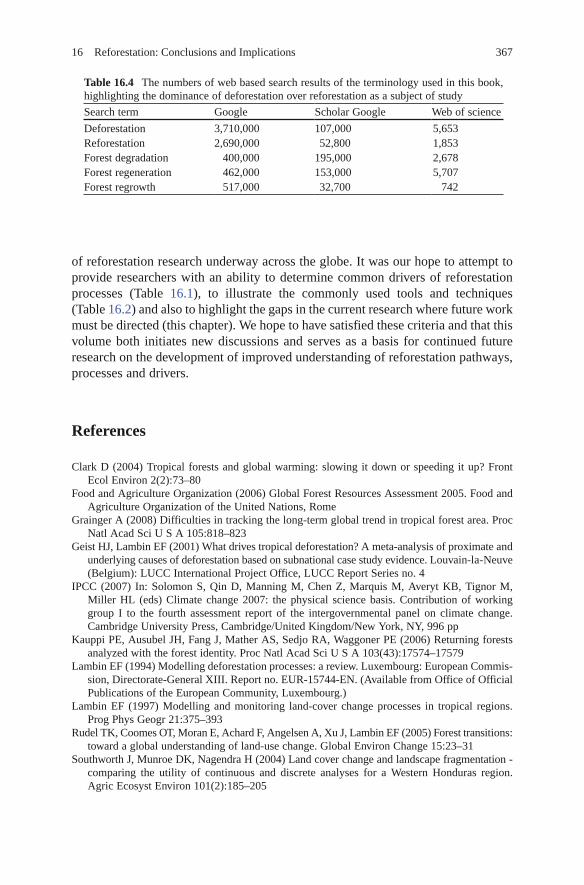
36716 Reforestation: Conclusions and Implications
Table 16.4 The numbers of web based search results of the terminology used in this book, highlighting the dominance of deforestation over reforestation as a subject of study
Search term Google Scholar Google Web of science
Deforestation 3,710,000 107,000 5,653Reforestation 2,690,000 52,800 1,853Forest degradation 400,000 195,000 2,678Forest regeneration 462,000 153,000 5,707Forest regrowth 517,000 32,700 742
of reforestation research underway across the globe. It was our hope to attempt to provide researchers with an ability to determine common drivers of reforestation processes (Table 16.1), to illustrate the commonly used tools and techniques (Table 16.2) and also to highlight the gaps in the current research where future work must be directed (this chapter). We hope to have satisfied these criteria and that this volume both initiates new discussions and serves as a basis for continued future research on the development of improved understanding of reforestation pathways, processes and drivers.
References
Clark D (2004) Tropical forests and global warming: slowing it down or speeding it up? Front Ecol Environ 2(2):73–80
Food and Agriculture Organization (2006) Global Forest Resources Assessment 2005. Food and Agriculture Organization of the United Nations, Rome
Grainger A (2008) Difficulties in tracking the long-term global trend in tropical forest area. Proc Natl Acad Sci U S A 105:818–823
Geist HJ, Lambin EF (2001) What drives tropical deforestation? A meta-analysis of proximate and underlying causes of deforestation based on subnational case study evidence. Louvain-la-Neuve (Belgium): LUCC International Project Office, LUCC Report Series no. 4
IPCC (2007) In: Solomon S, Qin D, Manning M, Chen Z, Marquis M, Averyt KB, Tignor M, Miller HL (eds) Climate change 2007: the physical science basis. Contribution of working group I to the fourth assessment report of the intergovernmental panel on climate change. Cambridge University Press, Cambridge/United Kingdom/New York, NY, 996 pp
Kauppi PE, Ausubel JH, Fang J, Mather AS, Sedjo RA, Waggoner PE (2006) Returning forests analyzed with the forest identity. Proc Natl Acad Sci U S A 103(43):17574–17579
Lambin EF (1994) Modelling deforestation processes: a review. Luxembourg: European Commis-sion, Directorate-General XIII. Report no. EUR-15744-EN. (Available from Office of Official Publications of the European Community, Luxembourg.)
Lambin EF (1997) Modelling and monitoring land-cover change processes in tropical regions. Prog Phys Geogr 21:375–393
Rudel TK, Coomes OT, Moran E, Achard F, Angelsen A, Xu J, Lambin EF (2005) Forest transitions: toward a global understanding of land-use change. Global Environ Change 15:23–31
Southworth J, Munroe DK, Nagendra H (2004) Land cover change and landscape fragmentation - comparing the utility of continuous and discrete analyses for a Western Honduras region. Agric Ecosyst Environ 101(2):185–205
369
Index
AAccess, 29, 55, 67, 75, 76, 160, 276, 287, 289,
290, 292, 302, 324, 334Actors, 17–19, 25, 61, 63–69, 72, 81, 114,
154, 160, 161, 176–179, 192, 194, 195, 197, 199, 200, 267, 326
Adaptive cycles, 60, 62, 67–74, 79, 80Administrative boundaries, 254Advanced Spaceborne Thermal Emission and
Reflection Radiometer (ASTER), 136Advanced Very High Resolution Radiometer
(AVHRR), 350, 351Aerial photography, 3, 9, 142, 176, 185, 189,
190, 283Aesthetic value, 126, 193Affluence, 150, 152, 172Afforestation, 1, 2, 4, 206, 223, 254, 256, 260,
265, 267–269, 277, 343, 346–350, 352–354, 365
Africa, 3, 25, 30, 48, 50, 52–54, 280, 342Agent based models (ABMs), 81, 192Agricultural abandonment, 87, 89, 96, 97,
103, 104, 107, 111, 114, 139, 140, 177, 190, 194
Agricultural census data, 231, 266, 268Agricultural extensification, 214Agricultural frontier, 88, 229, 250Agricultural intensification, 101, 103, 107,
198, 248, 324, 325, 328–329, 333, 335Agricultural matrix, 103, 127, 285, 288Agroforestry, 9, 89, 94, 100, 103, 107, 109,
110, 152, 154, 161, 166, 171, 362, 364Aid agencies, 154, 160, 165Albania, 122, 125–127, 134–137, 139-142Amazon, 1, 4, 10, 51, 60, 63, 65–67, 69, 72,
73, 77, 78, 80, 86, 205–223, 289, 349Animal husbandry, 132, 161Anniversary date imagery, 207Arable land, 265, 281Aridity, 302, 304, 309
Asia, 3, 11, 25, 50, 52, 178, 315, 316, 331AVHRR. See Advanced Very High Resolution
Radiometer
BBangladesh, 150, 152, 154, 170Baseline, 211, 234, 282Beef prices, 107, 244, 246Belize, 91, 92, 98–99, 101, 110, 111Bhutan, 3, 4, 150, 152, 154, 315–335, 362Biodiversity, 2, 8, 13, 25, 51, 89, 97, 127, 131,
132, 140, 142, 153, 171, 178, 227, 266, 267, 276, 277, 290, 291, 298, 306, 308, 309, 327, 330–332, 335, 342, 353, 354
Biofuels, 197, 198Biophysical change, 292Biophysical factors, 66, 76, 115, 179, 194, 264Biophysical indicators, 80, 281Borlaug hypothesis, 50Bottomland forest, 281, 285Broadleaf forests, 98, 102, 103, 329Buddhist, 318, 333Buffer zones, 89, 100, 106, 108, 164, 165Building poles, 277, 278, 281, 289, 290Bush fallow, 48
CCapital investments, 334Capital Mechanization, 188Capitalization of agriculture, 177Carbon emissions, 45, 55, 115, 254, 330Carbon stock, 316, 319, 329–330, 335Case study, 17, 22, 23, 31–33, 128–138, 162,
208, 210–219, 229, 257–258, 260–264, 278–281, 334, 359
Cattle, 69, 78, 95, 106, 107, 109, 110, 161, 169, 229, 230–232, 234, 235, 239, 244–248, 299, 305, 306, 308, 324, 325
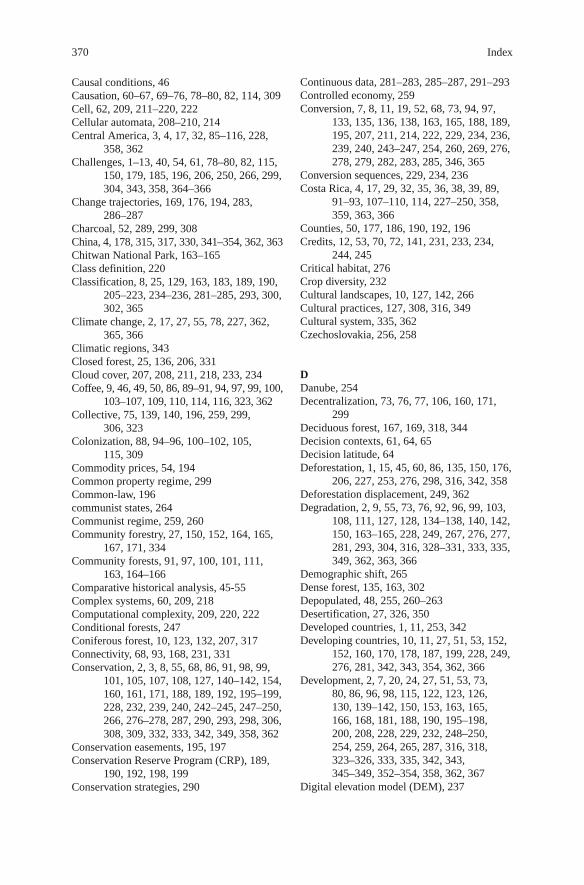
370 Index
Causal conditions, 46Causation, 60–67, 69–76, 78–80, 82, 114, 309Cell, 62, 209, 211–220, 222Cellular automata, 208–210, 214Central America, 3, 4, 17, 32, 85–116, 228,
358, 362Challenges, 1–13, 40, 54, 61, 78–80, 82, 115,
150, 179, 185, 196, 206, 250, 266, 299, 304, 343, 358, 364–366
Change trajectories, 169, 176, 194, 283, 286–287
Charcoal, 52, 289, 299, 308China, 4, 178, 315, 317, 330, 341–354, 362, 363Chitwan National Park, 163–165Class definition, 220Classification, 8, 25, 129, 163, 183, 189, 190,
205–223, 234–236, 281–285, 293, 300, 302, 365
Climate change, 2, 17, 27, 55, 78, 227, 362, 365, 366
Climatic regions, 343Closed forest, 25, 136, 206, 331Cloud cover, 207, 208, 211, 218, 233, 234Coffee, 9, 46, 49, 50, 86, 89–91, 94, 97, 99, 100,
103–107, 109, 110, 114, 116, 323, 362Collective, 75, 139, 140, 196, 259, 299,
306, 323Colonization, 88, 94–96, 100–102, 105,
115, 309Commodity prices, 54, 194Common property regime, 299Common-law, 196communist states, 264Communist regime, 259, 260Community forestry, 27, 150, 152, 164, 165,
167, 171, 334Community forests, 91, 97, 100, 101, 111,
163, 164–166Comparative historical analysis, 45-55Complex systems, 60, 209, 218Computational complexity, 209, 220, 222Conditional forests, 247Coniferous forest, 10, 123, 132, 207, 317Connectivity, 68, 93, 168, 231, 331Conservation, 2, 3, 8, 55, 68, 86, 91, 98, 99,
101, 105, 107, 108, 127, 140–142, 154, 160, 161, 171, 188, 189, 192, 195–199, 228, 232, 239, 240, 242–245, 247–250, 266, 276–278, 287, 290, 293, 298, 306, 308, 309, 332, 333, 342, 349, 358, 362
Conservation easements, 195, 197Conservation Reserve Program (CRP), 189,
190, 192, 198, 199Conservation strategies, 290
Continuous data, 281–283, 285–287, 291–293Controlled economy, 259Conversion, 7, 8, 11, 19, 52, 68, 73, 94, 97,
133, 135, 136, 138, 163, 165, 188, 189, 195, 207, 211, 214, 222, 229, 234, 236, 239, 240, 243–247, 254, 260, 269, 276, 278, 279, 282, 283, 285, 346, 365
Conversion sequences, 229, 234, 236Costa Rica, 4, 17, 29, 32, 35, 36, 38, 39, 89,
91–93, 107–110, 114, 227–250, 358, 359, 363, 366
Counties, 50, 177, 186, 190, 192, 196Credits, 12, 53, 70, 72, 141, 231, 233, 234,
244, 245Critical habitat, 276Crop diversity, 232Cultural landscapes, 10, 127, 142, 266Cultural practices, 127, 308, 316, 349Cultural system, 335, 362Czechoslovakia, 256, 258
DDanube, 254Decentralization, 73, 76, 77, 106, 160, 171,
299Deciduous forest, 167, 169, 318, 344Decision contexts, 61, 64, 65Decision latitude, 64Deforestation, 1, 15, 45, 60, 86, 135, 150, 176,
206, 227, 253, 276, 298, 316, 342, 358Deforestation displacement, 249, 362Degradation, 2, 9, 55, 73, 76, 92, 96, 99, 103,
108, 111, 127, 128, 134–138, 140, 142, 150, 163–165, 228, 249, 267, 276, 277, 281, 293, 304, 316, 328–331, 333, 335, 349, 362, 363, 366
Demographic shift, 265Dense forest, 135, 163, 302Depopulated, 48, 255, 260–263Desertification, 27, 326, 350Developed countries, 1, 11, 253, 342Developing countries, 10, 11, 27, 51, 53, 152,
152, 160, 170, 178, 187, 199, 228, 249, 276, 281, 342, 343, 354, 362, 366
Development, 2, 7, 20, 24, 27, 51, 53, 73, 80, 86, 96, 98, 115, 122, 123, 126, 130, 139–142, 150, 153, 163, 165, 166, 168, 181, 188, 190, 195–198, 200, 208, 228, 229, 232, 248–250, 254, 259, 264, 265, 287, 316, 318, 323–326, 333, 335, 342, 343, 345–349, 352–354, 358, 362, 367
Digital elevation model (DEM), 237
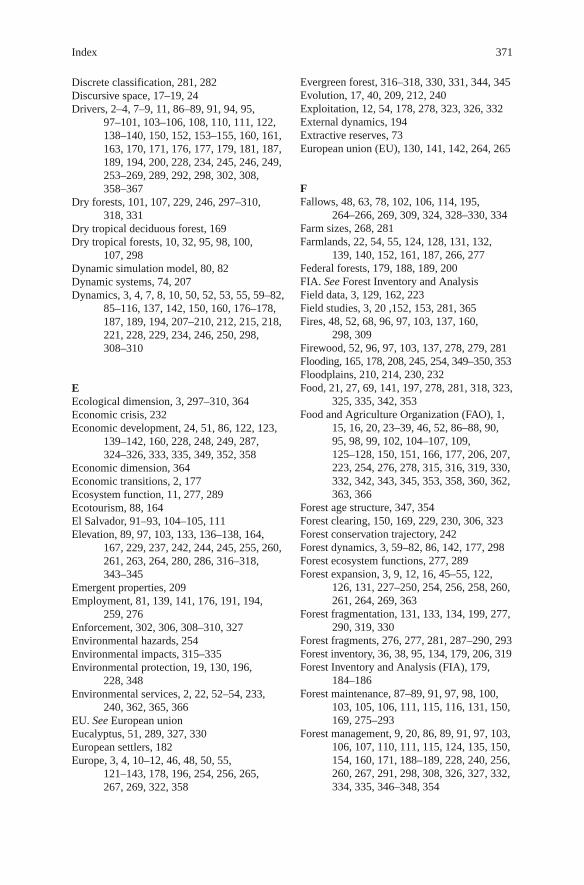
371Index
Discrete classification, 281, 282Discursive space, 17–19, 24Drivers, 2–4, 7–9, 11, 86–89, 91, 94, 95,
97–101, 103–106, 108, 110, 111, 122, 138–140, 150, 152, 153–155, 160, 161, 163, 170, 171, 176, 177, 179, 181, 187, 189, 194, 200, 228, 234, 245, 246, 249, 253–269, 289, 292, 298, 302, 308, 358–367
Dry forests, 101, 107, 229, 246, 297–310, 318, 331
Dry tropical deciduous forest, 169Dry tropical forests, 10, 32, 95, 98, 100,
107, 298Dynamic simulation model, 80, 82Dynamic systems, 74, 207Dynamics, 3, 4, 7, 8, 10, 50, 52, 53, 55, 59–82,
85–116, 137, 142, 150, 160, 176–178, 187, 189, 194, 207–210, 212, 215, 218, 221, 228, 229, 234, 246, 250, 298, 308–310
EEcological dimension, 3, 297–310, 364Economic crisis, 232Economic development, 24, 51, 86, 122, 123,
139–142, 160, 228, 248, 249, 287, 324–326, 333, 335, 349, 352, 358
Economic dimension, 364Economic transitions, 2, 177Ecosystem function, 11, 277, 289Ecotourism, 88, 164El Salvador, 91–93, 104–105, 111Elevation, 89, 97, 103, 133, 136–138, 164,
167, 229, 237, 242, 244, 245, 255, 260, 261, 263, 264, 280, 286, 316–318, 343–345
Emergent properties, 209Employment, 81, 139, 141, 176, 191, 194,
259, 276Enforcement, 302, 306, 308–310, 327Environmental hazards, 254Environmental impacts, 315–335Environmental protection, 19, 130, 196,
228, 348Environmental services, 2, 22, 52–54, 233,
240, 362, 365, 366EU. See European unionEucalyptus, 51, 289, 327, 330European settlers, 182Europe, 3, 4, 10–12, 46, 48, 50, 55,
121–143, 178, 196, 254, 256, 265, 267, 269, 322, 358
Evergreen forest, 316–318, 330, 331, 344, 345Evolution, 17, 40, 209, 212, 240Exploitation, 12, 54, 178, 278, 323, 326, 332External dynamics, 194Extractive reserves, 73European union (EU), 130, 141, 142, 264, 265
FFallows, 48, 63, 78, 102, 106, 114, 195,
264–266, 269, 309, 324, 328–330, 334Farm sizes, 268, 281Farmlands, 22, 54, 55, 124, 128, 131, 132,
139, 140, 152, 161, 187, 266, 277Federal forests, 179, 188, 189, 200FIA. See Forest Inventory and AnalysisField data, 3, 129, 162, 223Field studies, 3, 20 ,152, 153, 281, 365Fires, 48, 52, 68, 96, 97, 103, 137, 160,
298, 309Firewood, 52, 96, 97, 103, 137, 278, 279, 281Flooding, 165, 178, 208, 245, 254, 349–350, 353Floodplains, 210, 214, 230, 232Food, 21, 27, 69, 141, 197, 278, 281, 318, 323,
325, 335, 342, 353Food and Agriculture Organization (FAO), 1,
15, 16, 20, 23–39, 46, 52, 86–88, 90, 95, 98, 99, 102, 104–107, 109, 125–128, 150, 151, 166, 177, 206, 207, 223, 254, 276, 278, 315, 316, 319, 330, 332, 342, 343, 345, 353, 358, 360, 362, 363, 366
Forest age structure, 347, 354Forest clearing, 150, 169, 229, 230, 306, 323Forest conservation trajectory, 242Forest dynamics, 3, 59–82, 86, 142, 177, 298Forest ecosystem functions, 277, 289Forest expansion, 3, 9, 12, 16, 45–55, 122,
126, 131, 227–250, 254, 256, 258, 260, 261, 264, 269, 363
Forest fragmentation, 131, 133, 134, 199, 277, 290, 319, 330
Forest fragments, 276, 277, 281, 287–290, 293Forest inventory, 36, 38, 95, 134, 179, 206, 319Forest Inventory and Analysis (FIA), 179,
184–186Forest maintenance, 87–89, 91, 97, 98, 100,
103, 105, 106, 111, 115, 116, 131, 150, 169, 275–293
Forest management, 9, 20, 86, 89, 91, 97, 103, 106, 107, 110, 111, 115, 124, 135, 150, 154, 160, 171, 188–189, 228, 240, 256, 260, 267, 291, 298, 308, 326, 327, 332, 334, 335, 346–348, 354
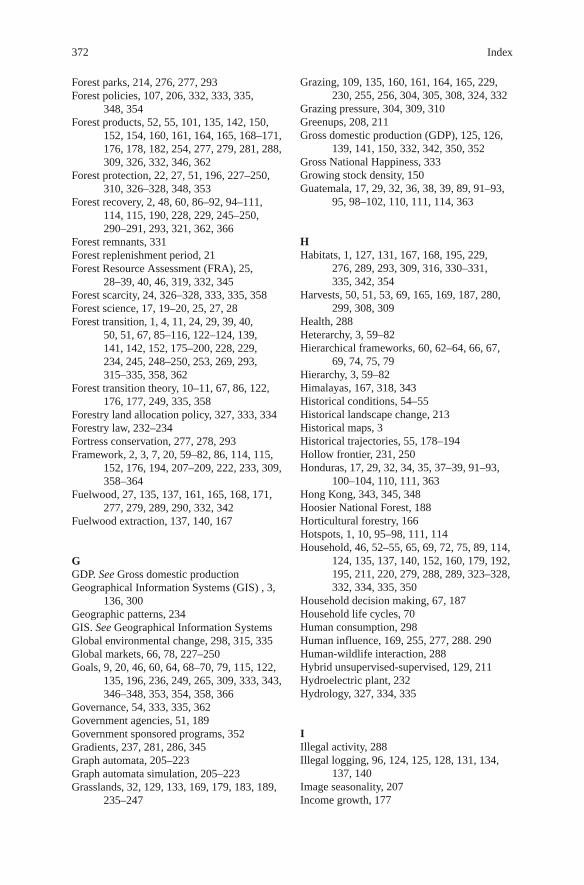
372 Index
Forest parks, 214, 276, 277, 293Forest policies, 107, 206, 332, 333, 335,
348, 354Forest products, 52, 55, 101, 135, 142, 150,
152, 154, 160, 161, 164, 165, 168–171, 176, 178, 182, 254, 277, 279, 281, 288, 309, 326, 332, 346, 362
Forest protection, 22, 27, 51, 196, 227–250, 310, 326–328, 348, 353
Forest recovery, 2, 48, 60, 86–92, 94–111, 114, 115, 190, 228, 229, 245–250, 290–291, 293, 321, 362, 366
Forest remnants, 331Forest replenishment period, 21Forest Resource Assessment (FRA), 25,
28–39, 40, 46, 319, 332, 345Forest scarcity, 24, 326–328, 333, 335, 358Forest science, 17, 19–20, 25, 27, 28Forest transition, 1, 4, 11, 24, 29, 39, 40,
50, 51, 67, 85–116, 122–124, 139, 141, 142, 152, 175–200, 228, 229, 234, 245, 248–250, 253, 269, 293, 315–335, 358, 362
Forest transition theory, 10–11, 67, 86, 122, 176, 177, 249, 335, 358
Forestry land allocation policy, 327, 333, 334Forestry law, 232–234Fortress conservation, 277, 278, 293Framework, 2, 3, 7, 20, 59–82, 86, 114, 115,
152, 176, 194, 207–209, 222, 233, 309, 358–364
Fuelwood, 27, 135, 137, 161, 165, 168, 171, 277, 279, 289, 290, 332, 342
Fuelwood extraction, 137, 140, 167
GGDP. See Gross domestic productionGeographical Information Systems (GIS) , 3,
136, 300Geographic patterns, 234GIS. See Geographical Information SystemsGlobal environmental change, 298, 315, 335Global markets, 66, 78, 227–250Goals, 9, 20, 46, 60, 64, 68–70, 79, 115, 122,
135, 196, 236, 249, 265, 309, 333, 343, 346–348, 353, 354, 358, 366
Governance, 54, 333, 335, 362Government agencies, 51, 189Government sponsored programs, 352Gradients, 237, 281, 286, 345Graph automata, 205–223Graph automata simulation, 205–223Grasslands, 32, 129, 133, 169, 179, 183, 189,
235–247
Grazing, 109, 135, 160, 161, 164, 165, 229, 230, 255, 256, 304, 305, 308, 324, 332
Grazing pressure, 304, 309, 310Greenups, 208, 211Gross domestic production (GDP), 125, 126,
139, 141, 150, 332, 342, 350, 352Gross National Happiness, 333Growing stock density, 150Guatemala, 17, 29, 32, 36, 38, 39, 89, 91–93,
95, 98–102, 110, 111, 114, 363
HHabitats, 1, 127, 131, 167, 168, 195, 229,
276, 289, 293, 309, 316, 330–331, 335, 342, 354
Harvests, 50, 51, 53, 69, 165, 169, 187, 280, 299, 308, 309
Health, 288Heterarchy, 3, 59–82Hierarchical frameworks, 60, 62–64, 66, 67,
69, 74, 75, 79Hierarchy, 3, 59–82Himalayas, 167, 318, 343Historical conditions, 54–55Historical landscape change, 213Historical maps, 3Historical trajectories, 55, 178–194Hollow frontier, 231, 250Honduras, 17, 29, 32, 34, 35, 37–39, 91–93,
100–104, 110, 111, 363Hong Kong, 343, 345, 348Hoosier National Forest, 188Horticultural forestry, 166Hotspots, 1, 10, 95–98, 111, 114Household, 46, 52–55, 65, 69, 72, 75, 89, 114,
124, 135, 137, 140, 152, 160, 179, 192, 195, 211, 220, 279, 288, 289, 323–328, 332, 334, 335, 350
Household decision making, 67, 187Household life cycles, 70Human consumption, 298Human influence, 169, 255, 277, 288. 290Human-wildlife interaction, 288Hybrid unsupervised-supervised, 129, 211Hydroelectric plant, 232Hydrology, 327, 334, 335
IIllegal activity, 288Illegal logging, 96, 124, 125, 128, 131, 134,
137, 140Image seasonality, 207Income growth, 177
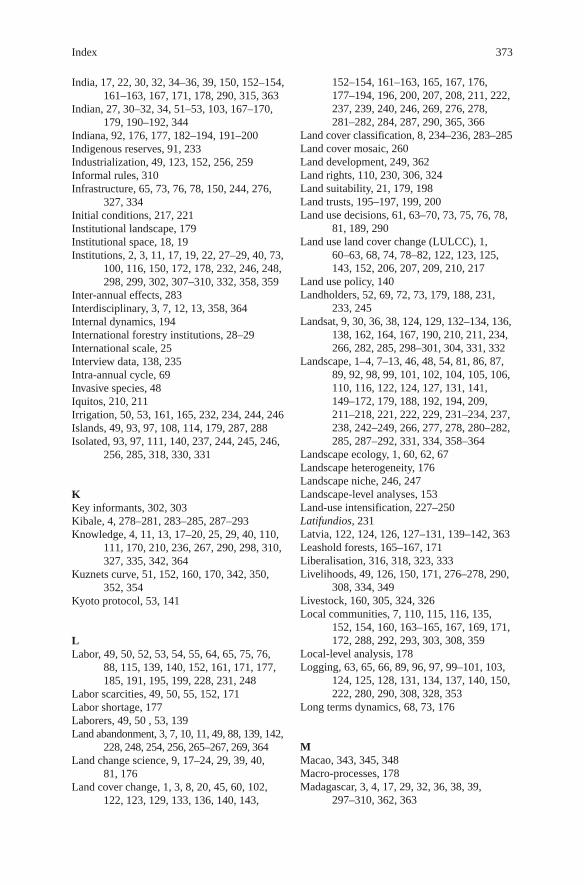
373Index
India, 17, 22, 30, 32, 34–36, 39, 150, 152–154, 161–163, 167, 171, 178, 290, 315, 363
Indian, 27, 30–32, 34, 51–53, 103, 167–170, 179, 190–192, 344
Indiana, 92, 176, 177, 182–194, 191–200Indigenous reserves, 91, 233Industrialization, 49, 123, 152, 256, 259Informal rules, 310Infrastructure, 65, 73, 76, 78, 150, 244, 276,
327, 334Initial conditions, 217, 221Institutional landscape, 179Institutional space, 18, 19Institutions, 2, 3, 11, 17, 19, 22, 27–29, 40, 73,
100, 116, 150, 172, 178, 232, 246, 248, 298, 299, 302, 307–310, 332, 358, 359
Inter-annual effects, 283Interdisciplinary, 3, 7, 12, 13, 358, 364Internal dynamics, 194International forestry institutions, 28–29International scale, 25Interview data, 138, 235Intra-annual cycle, 69Invasive species, 48Iquitos, 210, 211Irrigation, 50, 53, 161, 165, 232, 234, 244, 246Islands, 49, 93, 97, 108, 114, 179, 287, 288Isolated, 93, 97, 111, 140, 237, 244, 245, 246,
256, 285, 318, 330, 331
KKey informants, 302, 303Kibale, 4, 278–281, 283–285, 287–293Knowledge, 4, 11, 13, 17–20, 25, 29, 40, 110,
111, 170, 210, 236, 267, 290, 298, 310, 327, 335, 342, 364
Kuznets curve, 51, 152, 160, 170, 342, 350, 352, 354
Kyoto protocol, 53, 141
LLabor, 49, 50, 52, 53, 54, 55, 64, 65, 75, 76,
88, 115, 139, 140, 152, 161, 171, 177, 185, 191, 195, 199, 228, 231, 248
Labor scarcities, 49, 50, 55, 152, 171Labor shortage, 177Laborers, 49, 50 , 53, 139Land abandonment, 3, 7, 10, 11, 49, 88, 139, 142,
228, 248, 254, 256, 265–267, 269, 364Land change science, 9, 17–24, 29, 39, 40,
81, 176Land cover change, 1, 3, 8, 20, 45, 60, 102,
122, 123, 129, 133, 136, 140, 143,
152–154, 161–163, 165, 167, 176, 177–194, 196, 200, 207, 208, 211, 222, 237, 239, 240, 246, 269, 276, 278, 281–282, 284, 287, 290, 365, 366
Land cover classification, 8, 234–236, 283–285Land cover mosaic, 260Land development, 249, 362Land rights, 110, 230, 306, 324Land suitability, 21, 179, 198Land trusts, 195–197, 199, 200Land use decisions, 61, 63–70, 73, 75, 76, 78,
81, 189, 290Land use land cover change (LULCC), 1,
60–63, 68, 74, 78–82, 122, 123, 125, 143, 152, 206, 207, 209, 210, 217
Land use policy, 140Landholders, 52, 69, 72, 73, 179, 188, 231,
233, 245Landsat, 9, 30, 36, 38, 124, 129, 132–134, 136,
138, 162, 164, 167, 190, 210, 211, 234, 266, 282, 285, 298–301, 304, 331, 332
Landscape, 1–4, 7–13, 46, 48, 54, 81, 86, 87, 89, 92, 98, 99, 101, 102, 104, 105, 106, 110, 116, 122, 124, 127, 131, 141, 149–172, 179, 188, 192, 194, 209, 211–218, 221, 222, 229, 231–234, 237, 238, 242–249, 266, 277, 278, 280–282, 285, 287–292, 331, 334, 358–364
Landscape ecology, 1, 60, 62, 67Landscape heterogeneity, 176Landscape niche, 246, 247Landscape-level analyses, 153Land-use intensification, 227–250Latifundios, 231Latvia, 122, 124, 126, 127–131, 139–142, 363Leashold forests, 165–167, 171Liberalisation, 316, 318, 323, 333Livelihoods, 49, 126, 150, 171, 276–278, 290,
308, 334, 349Livestock, 160, 305, 324, 326Local communities, 7, 110, 115, 116, 135,
152, 154, 160, 163–165, 167, 169, 171, 172, 288, 292, 293, 303, 308, 359
Local-level analysis, 178Logging, 63, 65, 66, 89, 96, 97, 99–101, 103,
124, 125, 128, 131, 134, 137, 140, 150, 222, 280, 290, 308, 328, 353
Long terms dynamics, 68, 73, 176
MMacao, 343, 345, 348Macro-processes, 178Madagascar, 3, 4, 17, 29, 32, 36, 38, 39,
297–310, 362, 363
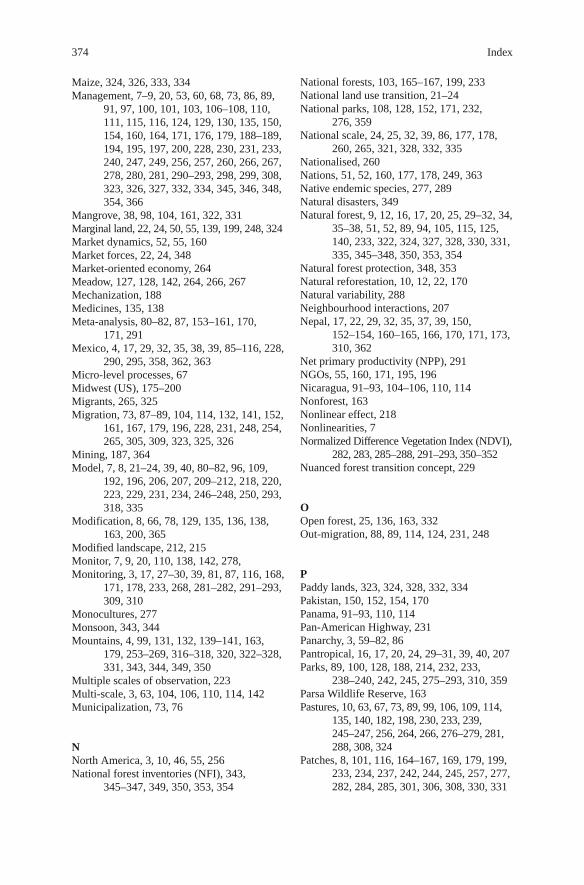
374 Index
Maize, 324, 326, 333, 334Management, 7–9, 20, 53, 60, 68, 73, 86, 89,
91, 97, 100, 101, 103, 106–108, 110, 111, 115, 116, 124, 129, 130, 135, 150, 154, 160, 164, 171, 176, 179, 188–189, 194, 195, 197, 200, 228, 230, 231, 233, 240, 247, 249, 256, 257, 260, 266, 267, 278, 280, 281, 290–293, 298, 299, 308, 323, 326, 327, 332, 334, 345, 346, 348, 354, 366
Mangrove, 38, 98, 104, 161, 322, 331Marginal land, 22, 24, 50, 55, 139, 199, 248, 324Market dynamics, 52, 55, 160Market forces, 22, 24, 348Market-oriented economy, 264Meadow, 127, 128, 142, 264, 266, 267Mechanization, 188Medicines, 135, 138Meta-analysis, 80–82, 87, 153–161, 170,
171, 291Mexico, 4, 17, 29, 32, 35, 38, 39, 85–116, 228,
290, 295, 358, 362, 363Micro-level processes, 67Midwest (US), 175–200Migrants, 265, 325Migration, 73, 87–89, 104, 114, 132, 141, 152,
161, 167, 179, 196, 228, 231, 248, 254, 265, 305, 309, 323, 325, 326
Mining, 187, 364Model, 7, 8, 21–24, 39, 40, 80–82, 96, 109,
192, 196, 206, 207, 209–212, 218, 220, 223, 229, 231, 234, 246–248, 250, 293, 318, 335
Modification, 8, 66, 78, 129, 135, 136, 138, 163, 200, 365
Modified landscape, 212, 215Monitor, 7, 9, 20, 110, 138, 142, 278,Monitoring, 3, 17, 27–30, 39, 81, 87, 116, 168,
171, 178, 233, 268, 281–282, 291–293, 309, 310
Monocultures, 277Monsoon, 343, 344Mountains, 4, 99, 131, 132, 139–141, 163,
179, 253–269, 316–318, 320, 322–328, 331, 343, 344, 349, 350
Multiple scales of observation, 223Multi-scale, 3, 63, 104, 106, 110, 114, 142Municipalization, 73, 76
NNorth America, 3, 10, 46, 55, 256National forest inventories (NFI), 343,
345–347, 349, 350, 353, 354
National forests, 103, 165–167, 199, 233National land use transition, 21–24National parks, 108, 128, 152, 171, 232,
276, 359National scale, 24, 25, 32, 39, 86, 177, 178,
260, 265, 321, 328, 332, 335Nationalised, 260Nations, 51, 52, 160, 177, 178, 249, 363Native endemic species, 277, 289Natural disasters, 349Natural forest, 9, 12, 16, 17, 20, 25, 29–32, 34,
35–38, 51, 52, 89, 94, 105, 115, 125, 140, 233, 322, 324, 327, 328, 330, 331, 335, 345–348, 350, 353, 354
Natural forest protection, 348, 353Natural reforestation, 10, 12, 22, 170Natural variability, 288Neighbourhood interactions, 207Nepal, 17, 22, 29, 32, 35, 37, 39, 150,
152–154, 160–165, 166, 170, 171, 173, 310, 362
Net primary productivity (NPP), 291NGOs, 55, 160, 171, 195, 196Nicaragua, 91–93, 104–106, 110, 114Nonforest, 163Nonlinear effect, 218Nonlinearities, 7Normalized Difference Vegetation Index (NDVI),
282, 283, 285–288, 291–293, 350–352Nuanced forest transition concept, 229
OOpen forest, 25, 136, 163, 332Out-migration, 88, 89, 114, 124, 231, 248
PPaddy lands, 323, 324, 328, 332, 334Pakistan, 150, 152, 154, 170Panama, 91–93, 110, 114Pan-American Highway, 231Panarchy, 3, 59–82, 86Pantropical, 16, 17, 20, 24, 29–31, 39, 40, 207Parks, 89, 100, 128, 188, 214, 232, 233,
238–240, 242, 245, 275–293, 310, 359Parsa Wildlife Reserve, 163Pastures, 10, 63, 67, 73, 89, 99, 106, 109, 114,
135, 140, 182, 198, 230, 233, 239, 245–247, 256, 264, 266, 276–279, 281, 288, 308, 324
Patches, 8, 101, 116, 164–167, 169, 179, 199, 233, 234, 237, 242, 244, 245, 257, 277, 282, 284, 285, 301, 306, 308, 330, 331
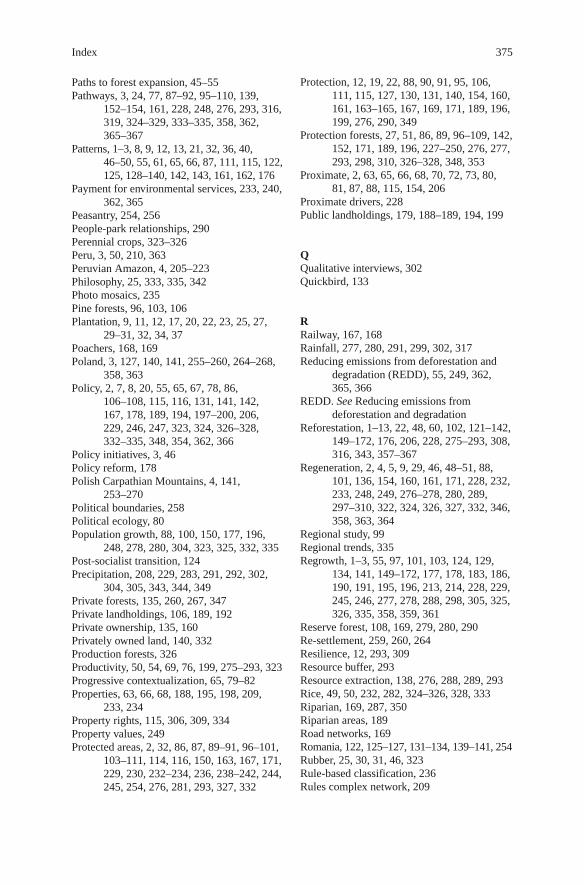
375Index
Paths to forest expansion, 45–55Pathways, 3, 24, 77, 87–92, 95–110, 139,
152–154, 161, 228, 248, 276, 293, 316, 319, 324–329, 333–335, 358, 362, 365–367
Patterns, 1–3, 8, 9, 12, 13, 21, 32, 36, 40, 46–50, 55, 61, 65, 66, 87, 111, 115, 122, 125, 128–140, 142, 143, 161, 162, 176
Payment for environmental services, 233, 240, 362, 365
Peasantry, 254, 256People-park relationships, 290Perennial crops, 323–326Peru, 3, 50, 210, 363Peruvian Amazon, 4, 205–223Philosophy, 25, 333, 335, 342Photo mosaics, 235Pine forests, 96, 103, 106Plantation, 9, 11, 12, 17, 20, 22, 23, 25, 27,
29–31, 32, 34, 37Poachers, 168, 169Poland, 3, 127, 140, 141, 255–260, 264–268,
358, 363Policy, 2, 7, 8, 20, 55, 65, 67, 78, 86,
106–108, 115, 116, 131, 141, 142, 167, 178, 189, 194, 197–200, 206, 229, 246, 247, 323, 324, 326–328, 332–335, 348, 354, 362, 366
Policy initiatives, 3, 46Policy reform, 178Polish Carpathian Mountains, 4, 141,
253–270Political boundaries, 258Political ecology, 80Population growth, 88, 100, 150, 177, 196,
248, 278, 280, 304, 323, 325, 332, 335Post-socialist transition, 124Precipitation, 208, 229, 283, 291, 292, 302,
304, 305, 343, 344, 349Private forests, 135, 260, 267, 347Private landholdings, 106, 189, 192Private ownership, 135, 160Privately owned land, 140, 332Production forests, 326Productivity, 50, 54, 69, 76, 199, 275–293, 323Progressive contextualization, 65, 79–82Properties, 63, 66, 68, 188, 195, 198, 209,
233, 234Property rights, 115, 306, 309, 334Property values, 249Protected areas, 2, 32, 86, 87, 89–91, 96–101,
103–111, 114, 116, 150, 163, 167, 171, 229, 230, 232–234, 236, 238–242, 244, 245, 254, 276, 281, 293, 327, 332
Protection, 12, 19, 22, 88, 90, 91, 95, 106, 111, 115, 127, 130, 131, 140, 154, 160, 161, 163–165, 167, 169, 171, 189, 196, 199, 276, 290, 349
Protection forests, 27, 51, 86, 89, 96–109, 142, 152, 171, 189, 196, 227–250, 276, 277, 293, 298, 310, 326–328, 348, 353
Proximate, 2, 63, 65, 66, 68, 70, 72, 73, 80, 81, 87, 88, 115, 154, 206
Proximate drivers, 228Public landholdings, 179, 188–189, 194, 199
QQualitative interviews, 302Quickbird, 133
RRailway, 167, 168Rainfall, 277, 280, 291, 299, 302, 317Reducing emissions from deforestation and
degradation (REDD), 55, 249, 362, 365, 366
REDD. See Reducing emissions from deforestation and degradation
Reforestation, 1–13, 22, 48, 60, 102, 121–142, 149–172, 176, 206, 228, 275–293, 308, 316, 343, 357–367
Regeneration, 2, 4, 5, 9, 29, 46, 48–51, 88, 101, 136, 154, 160, 161, 171, 228, 232, 233, 248, 249, 276–278, 280, 289, 297–310, 322, 324, 326, 327, 332, 346, 358, 363, 364
Regional study, 99Regional trends, 335Regrowth, 1–3, 55, 97, 101, 103, 124, 129,
134, 141, 149–172, 177, 178, 183, 186, 190, 191, 195, 196, 213, 214, 228, 229, 245, 246, 277, 278, 288, 298, 305, 325, 326, 335, 358, 359, 361
Reserve forest, 108, 169, 279, 280, 290Re-settlement, 259, 260, 264Resilience, 12, 293, 309Resource buffer, 293Resource extraction, 138, 276, 288, 289, 293Rice, 49, 50, 232, 282, 324–326, 328, 333Riparian, 169, 287, 350Riparian areas, 189Road networks, 169Romania, 122, 125–127, 131–134, 139–141, 254Rubber, 25, 30, 31, 46, 323Rule-based classification, 236Rules complex network, 209
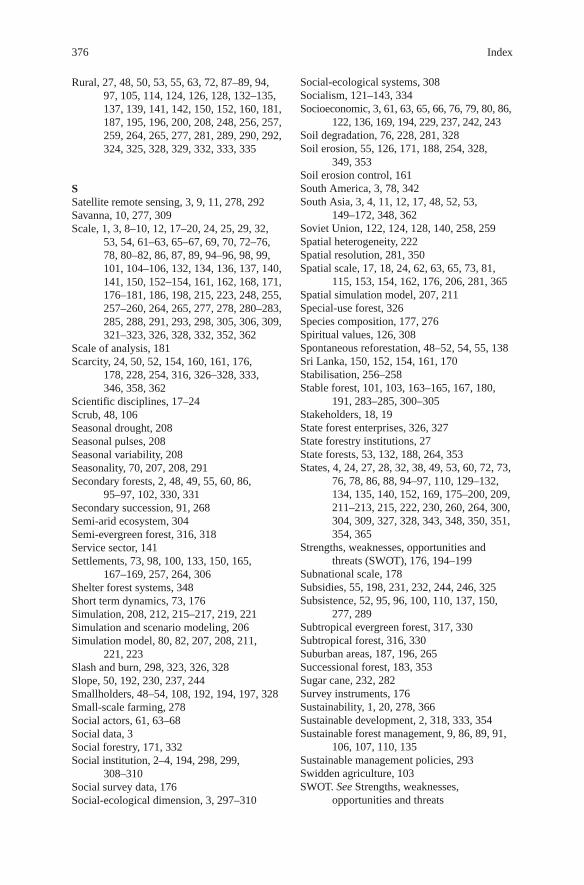
376 Index
Rural, 27, 48, 50, 53, 55, 63, 72, 87–89, 94, 97, 105, 114, 124, 126, 128, 132–135, 137, 139, 141, 142, 150, 152, 160, 181, 187, 195, 196, 200, 208, 248, 256, 257, 259, 264, 265, 277, 281, 289, 290, 292, 324, 325, 328, 329, 332, 333, 335
SSatellite remote sensing, 3, 9, 11, 278, 292Savanna, 10, 277, 309Scale, 1, 3, 8–10, 12, 17–20, 24, 25, 29, 32,
53, 54, 61–63, 65–67, 69, 70, 72–76, 78, 80–82, 86, 87, 89, 94–96, 98, 99, 101, 104–106, 132, 134, 136, 137, 140, 141, 150, 152–154, 161, 162, 168, 171, 176–181, 186, 198, 215, 223, 248, 255, 257–260, 264, 265, 277, 278, 280–283, 285, 288, 291, 293, 298, 305, 306, 309, 321–323, 326, 328, 332, 352, 362
Scale of analysis, 181Scarcity, 24, 50, 52, 154, 160, 161, 176,
178, 228, 254, 316, 326–328, 333, 346, 358, 362
Scientific disciplines, 17–24Scrub, 48, 106Seasonal drought, 208Seasonal pulses, 208Seasonal variability, 208Seasonality, 70, 207, 208, 291Secondary forests, 2, 48, 49, 55, 60, 86,
95–97, 102, 330, 331Secondary succession, 91, 268Semi-arid ecosystem, 304Semi-evergreen forest, 316, 318Service sector, 141Settlements, 73, 98, 100, 133, 150, 165,
167–169, 257, 264, 306Shelter forest systems, 348Short term dynamics, 73, 176Simulation, 208, 212, 215–217, 219, 221Simulation and scenario modeling, 206Simulation model, 80, 82, 207, 208, 211,
221, 223Slash and burn, 298, 323, 326, 328Slope, 50, 192, 230, 237, 244Smallholders, 48–54, 108, 192, 194, 197, 328Small-scale farming, 278Social actors, 61, 63–68Social data, 3Social forestry, 171, 332Social institution, 2–4, 194, 298, 299,
308–310Social survey data, 176Social-ecological dimension, 3, 297–310
Social-ecological systems, 308Socialism, 121–143, 334Socioeconomic, 3, 61, 63, 65, 66, 76, 79, 80, 86,
122, 136, 169, 194, 229, 237, 242, 243Soil degradation, 76, 228, 281, 328Soil erosion, 55, 126, 171, 188, 254, 328,
349, 353Soil erosion control, 161South America, 3, 78, 342South Asia, 3, 4, 11, 12, 17, 48, 52, 53,
149–172, 348, 362Soviet Union, 122, 124, 128, 140, 258, 259Spatial heterogeneity, 222Spatial resolution, 281, 350Spatial scale, 17, 18, 24, 62, 63, 65, 73, 81,
115, 153, 154, 162, 176, 206, 281, 365Spatial simulation model, 207, 211Special-use forest, 326Species composition, 177, 276Spiritual values, 126, 308Spontaneous reforestation, 48–52, 54, 55, 138Sri Lanka, 150, 152, 154, 161, 170Stabilisation, 256–258Stable forest, 101, 103, 163–165, 167, 180,
191, 283–285, 300–305Stakeholders, 18, 19State forest enterprises, 326, 327State forestry institutions, 27State forests, 53, 132, 188, 264, 353States, 4, 24, 27, 28, 32, 38, 49, 53, 60, 72, 73,
76, 78, 86, 88, 94–97, 110, 129–132, 134, 135, 140, 152, 169, 175–200, 209, 211–213, 215, 222, 230, 260, 264, 300, 304, 309, 327, 328, 343, 348, 350, 351, 354, 365
Strengths, weaknesses, opportunities and threats (SWOT), 176, 194–199
Subnational scale, 178Subsidies, 55, 198, 231, 232, 244, 246, 325Subsistence, 52, 95, 96, 100, 110, 137, 150,
277, 289Subtropical evergreen forest, 317, 330Subtropical forest, 316, 330Suburban areas, 187, 196, 265Successional forest, 183, 353Sugar cane, 232, 282Survey instruments, 176Sustainability, 1, 20, 278, 366Sustainable development, 2, 318, 333, 354Sustainable forest management, 9, 86, 89, 91,
106, 107, 110, 135Sustainable management policies, 293Swidden agriculture, 103SWOT. See Strengths, weaknesses,
opportunities and threats
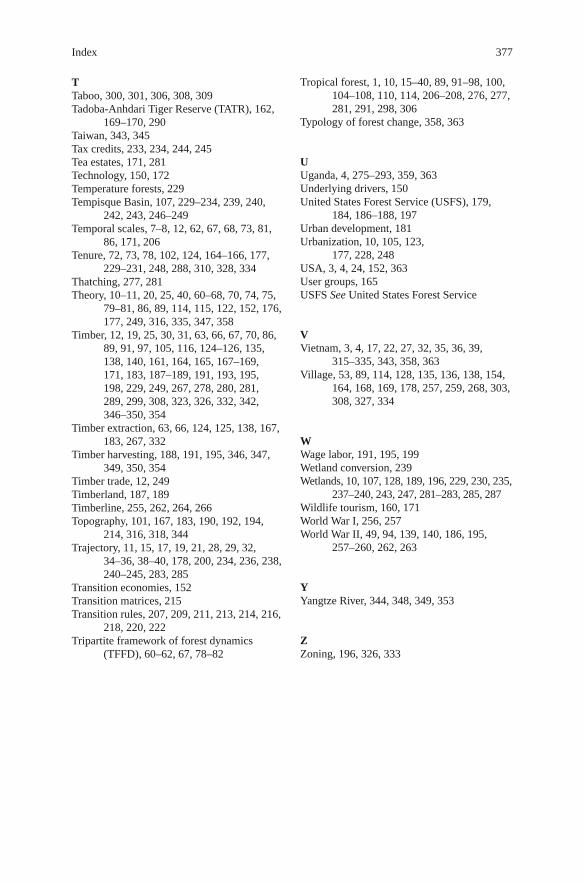
377Index
TTaboo, 300, 301, 306, 308, 309Tadoba-Anhdari Tiger Reserve (TATR), 162,
169–170, 290Taiwan, 343, 345Tax credits, 233, 234, 244, 245Tea estates, 171, 281Technology, 150, 172Temperature forests, 229Tempisque Basin, 107, 229–234, 239, 240,
242, 243, 246–249Temporal scales, 7–8, 12, 62, 67, 68, 73, 81,
86, 171, 206Tenure, 72, 73, 78, 102, 124, 164–166, 177,
229–231, 248, 288, 310, 328, 334Thatching, 277, 281Theory, 10–11, 20, 25, 40, 60–68, 70, 74, 75,
79–81, 86, 89, 114, 115, 122, 152, 176, 177, 249, 316, 335, 347, 358
Timber, 12, 19, 25, 30, 31, 63, 66, 67, 70, 86, 89, 91, 97, 105, 116, 124–126, 135, 138, 140, 161, 164, 165, 167–169, 171, 183, 187–189, 191, 193, 195, 198, 229, 249, 267, 278, 280, 281, 289, 299, 308, 323, 326, 332, 342, 346–350, 354
Timber extraction, 63, 66, 124, 125, 138, 167, 183, 267, 332
Timber harvesting, 188, 191, 195, 346, 347, 349, 350, 354
Timber trade, 12, 249Timberland, 187, 189Timberline, 255, 262, 264, 266Topography, 101, 167, 183, 190, 192, 194,
214, 316, 318, 344Trajectory, 11, 15, 17, 19, 21, 28, 29, 32,
34–36, 38–40, 178, 200, 234, 236, 238, 240–245, 283, 285
Transition economies, 152Transition matrices, 215Transition rules, 207, 209, 211, 213, 214, 216,
218, 220, 222Tripartite framework of forest dynamics
(TFFD), 60–62, 67, 78–82
Tropical forest, 1, 10, 15–40, 89, 91–98, 100, 104–108, 110, 114, 206–208, 276, 277, 281, 291, 298, 306
Typology of forest change, 358, 363
UUganda, 4, 275–293, 359, 363Underlying drivers, 150United States Forest Service (USFS), 179,
184, 186–188, 197Urban development, 181Urbanization, 10, 105, 123,
177, 228, 248USA, 3, 4, 24, 152, 363User groups, 165USFS See United States Forest Service
VVietnam, 3, 4, 17, 22, 27, 32, 35, 36, 39,
315–335, 343, 358, 363Village, 53, 89, 114, 128, 135, 136, 138, 154,
164, 168, 169, 178, 257, 259, 268, 303, 308, 327, 334
WWage labor, 191, 195, 199Wetland conversion, 239Wetlands, 10, 107, 128, 189, 196, 229, 230, 235,
237–240, 243, 247, 281–283, 285, 287Wildlife tourism, 160, 171World War I, 256, 257World War II, 49, 94, 139, 140, 186, 195,
257–260, 262, 263
YYangtze River, 344, 348, 349, 353
ZZoning, 196, 326, 333