Shot Classification of Field Sports Videos Using AlexNet ...
Upload
independentCategory
view
1download
0
Available online at www.sciencedirect.com
Magnetic Resonance Imaging 28 (2010) 1270–1282
Spin-echo SS-PARSE: a PARSE MRI method to estimate frequency,R2 and R2′ in a single shot
Ningzhi Lia, Mark Boldingb,c, Donald B. Twiega,b,⁎aDepartment of Biomedical Engineering, University of Alabama at Birmingham, Birmingham, AL, 35294-4440, USA
bCenter for Development of Functional Imaging, University of Alabama at Birmingham, Birmingham, AL 35294-4440, USAcDepartment of Vision Science, University of Alabama at Birmingham, Birmingham, AL 35294-4440, USA
Received 11 May 2010; accepted 11 June 2010
Abstract
Spin-echo signals allow separate measurements of irreversible and reversible relaxation rates in MRI. A spin-echo version of single-shotparameter assessment by retrieval from signal encoding (SE-SS-PARSE) method has been developed to quantitatively and accurately maptransverse magnetization magnitude, frequency, irreversible and reversible relaxation rates in a single shot. These image parameters can beapplied to fMRI research as well as a number of neuroimaging applications. Following a description of the signal model, this articledemonstrates the performance of SE-SS-PARSE in simulations with different noise levels and in phantom experiments. By solving aninverse problem, the estimated irreversible and reversible relaxation rates in SE-SS-PARSE are highly correlated with the referencerelaxation rates from a standard technique (correlation coefficients: r1=0.9636 for reversible relaxation rate, r2=0.9788 for irreversiblerelaxation rate). The rapid SE-SS-PARSE technique has the potential to monitor transient changes in R2 and R2′ while minimizing motionartifacts and also is free of geometric and ghosting errors. It is expected that this fast scan technique will find applications in both scientificresearch and clinical diagnosis.© 2010 Elsevier Inc. All rights reserved.
Keywords: Single-shot MRI; Spin echo; Transverse relaxation rate; Rapid MRI
1. Introduction
Fast scan MRI techniques have been highly developedand widely applied in both scientific research and clinicaldiagnosis for their ability to obtain images within a shorttime. Rapid data acquisition is in demand to minimizemotion and undesirable flow artifacts as well as reduce thetime and expense for both patients and hospitals. Single-shotparameter assessment by recovery from signal encoding(SS-PARSE) [1] is a novel quantitative parameter-based fastMRI technique. With the use of a continuous signal model,SS-PARSE promises improved accuracy and robustness inthe estimation of local signal parameters (local transversemagnetization magnitudes Mxy0, transverse relaxation rates
⁎ Corresponding author. University of Alabama at BirminghamBiomedical Engineering, Birmingham, AL 35294-4440, USA. Tel.: +1205 934 8794.
E-mail address: [email protected] (D.B. Twieg).
0730-725X/$ – see front matter © 2010 Elsevier Inc. All rights reserved.doi:10.1016/j.mri.2010.06.012
,
R2* (1/T2*) and frequencies (f). The total observabletransverse relaxation rate R2* depends on both macroscopicmagnetic field inhomogeneities and pure spin–spin relaxa-tion. The field inhomogeneities lead to the reversible signaldephasing characterized by the reversible relaxation rate,R2′(1/T2′), while the pure molecular effects cause theirreversible signal dephasing characterized by the irrever-sible relaxation rate, R2 (1/T2).
A spin-echo signal permits separate measurements ofR2 and R2′. This combined measurement is significant forboth neuroscience research and clinical studies. In functionalMRI (fMRI), separate measurement of R2 and R2′ has beenrecognized as an approach to distinguish BOLD responses inparenchyma from responses in large draining veins [2]. Also,the blood R2 values can be useful to measure tissue oxygenextraction fractions, while the changes in R2′ are approxi-mately linearly related to the changes in blood oxygenationlevel [3]. Clinically, the measure of R2, R2′ values arevaluable to quantify iron deposition in neurological dis-orders, such as Parkinson's disease, Huntington's disease
1271N. Li et al. / Magnetic Resonance Imaging 28 (2010) 1270–1282
and Alzheimer's disease [4–8]. The excess iron in certainareas of the human brain causes the MR signal decay, whichleads to the signal loss in the T2-weighted images for suchdiseases. It has been demonstrated that brain iron measure-ment can also be used to assess the stage of stroke [9–11] andHIV-infected patients [12].
The conventional approach to separate R2 and R2′ valuesis to first measure R2* from multi-echo gradient-echo imagesand R2 from spin-echo data, then derive R2′ by subtractingR2 from R2*. Numbers of methods have been proposed formapping R2 (T2) values. The commonly used multi-echoCarr-Purcell-Meiboom-Gill (CPMG) method [13,14] is mostaccurate, but not suited for rapid monitoring of dynamicchanges in relaxation rates. Recently, some fast scan MRImethods have been proposed to reduce the data acquisitiontime in mapping R2, R2′ and R2* values. A single-scanmethod, gradient-echo sampling of the free induction decayand echo (GESFIDE), was proposed by Ma and Wehrli [15].In this method, R2 and R2′ maps are obtained by finding thedifferential evolution of the transverse magnetizationbetween the ascending side and the descending side of aHahn echo. Another R2 mapping technique, fast acquisitionrelaxation mapping (FARM), has been introduced byMcKenzie et al. [16]. In this technique, quantitative R2
mapping can be reconstructed directly from k-space dataobtained within 3 s. However, both imperfect refocusingpulses and eddy currents can disturb the R2 decay, andmaximum gradient amplitude and slew rates need to be
controlled to minimize the eddy current effects. The single-shot echo planar imaging (EPI) technique [17] has beenwidely used in modern functional studies. It is capable ofproducing a set of whole brain images at video rates, which isuseful in functional neuroimaging. However, EPI-basedimaging is vulnerable to geometric distortion artifacts[18–22]. Chen et al. [23] have recently proposed a lessfield inhomogeneity-sensitive method, line-scan echo planarspectroscopic imaging (LSEPSI). However, the 30-s dataacquisition time for a two-dimensional slice image is toolong to monitor rapidly changing signals, such as the BOLDfMRI responses.
Here we propose a fast scan MRI method that canmeasure R2 and R2′ separately with a data acquisition timemuch less than a second. The spin-echo SS-PARSE tech-nique (SE-SS-PARSE) extends the FID-only SS-PARSEtechnique to provide estimation of four image parameters,Mxy0, f, R2 and R2′. Through use of an iterative optimizationalgorithm [24], these image parameters can be estimatedsimultaneously and quantitatively. The SE-SS-PARSEmethod is based on the PARSE technique and is free ofgeometric errors and N/2 ghosting artifacts that commonlyoccur in single-shot techniques, such as EPI [24]. Moreover,the rapid data acquisition of SE-SS-PARSE eliminatesthe motion artifacts effectively. In general, SE-SS-PARSEmay be well suited for several types of MRI studies,especially for tracking dynamic changes such as BOLDresponses in fMRI.
2. Theory
The theory of using the SS-PARSE technique to estimate magnetization parameters from a FID signal has beenpreviously described [1]. Each sample point in the PARSE acquisition is recognized as a point in the (k, t, b) space, where trefers to the time and b is an encoding parameter. The signal model of SS-PARSE considers both transverse magnetizationdecay and phase evolutions, and, thus, in principle, it can provide more robust and reliable image parameter estimatesquantitatively. The parameter estimation in SS-PARSE employs a progressive length conjugate gradient (PLCG) algorithm,which works by iteratively searching the parameter space to minimize the sum square error between experimental signal andmodel signal [24].
In the SE-SS-PARSE method, a spin-echo rf sequence is applied to produce both FID and echo signals. From these twosignals, four image parameters, complex magnetization Mxy0, frequency f, and relaxation rates R2 and R2′, can be modeled andestimated. The observed local signal Sc at time tn during the data acquisition time can be modeled as:
Sc tnð Þ =
R RMxy0 xð Þ � e− R0
2 xð Þ + 2pif xð Þð Þ + R2 xð Þð Þ� tn + s0ð Þ � e−2pik tnð Þxdx; 0btnbTE2
− s1R R
Mxy0 xð Þ � e− R02 xð Þ + 2pif xð Þ + R2 xð Þð Þ� tn + s1 + s2ð Þ � e−2pik tnð Þxdx;
TE2
− t1btnbTE − s0 + s1 + s2ð ÞR R
Mxy0 xð Þ � e− R02 xð Þ + 2pif xð Þ + R2 xð Þð Þ� tn + s1 + s2ð Þ � e−2pik tnð Þxdx; TE − s0 + s1 + s2ð Þbtn
8>>><>>>:
9>>>=>>>;
ð1Þ
which is the integral of the individual pixel signal at location x over the space. The last part of the integral e−2pikðtnÞx representsthe spatial phase modulation imposed by the gradients [1] at time tn. Here τ0 refers to the time between the effective center of the90° pulse and the beginning of data acquisition. τ1 and τ2 are delays before and after the middle of the 180° pulse, respectively,during which the signal is not sampled. The timing diagram of the SE-SS-PARSE sequence is shown in Fig. 1. Themagnetization parameter Mxy0 is estimated at t=0. In Eq. (1), the first part corresponds to the FID signal, while the second andthird parts correspond to the ascending and descending section of the echo signal. The PLCG algorithm was employed toestimate image parameters as in the SS-PARSE technique.
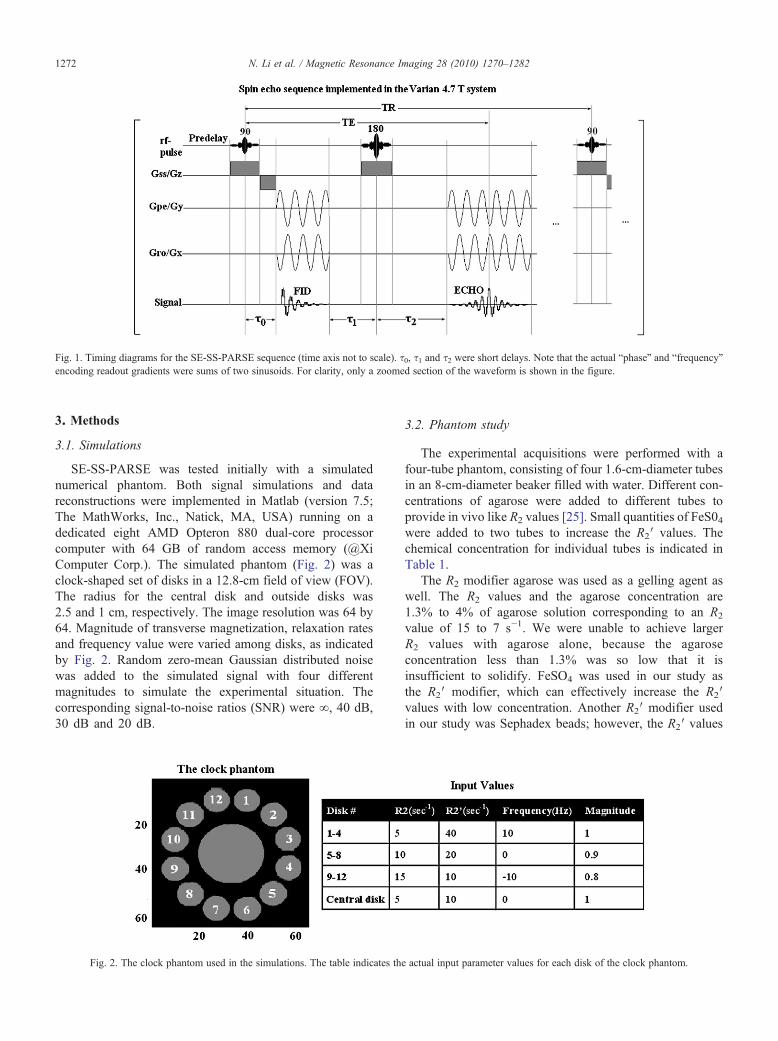
Fig. 1. Timing diagrams for the SE-SS-PARSE sequence (time axis not to scale). τ0, τ1 and τ2 were short delays. Note that the actual “phase” and “frequency”encoding readout gradients were sums of two sinusoids. For clarity, only a zoomed section of the waveform is shown in the figure.
1272 N. Li et al. / Magnetic Resonance Imaging 28 (2010) 1270–1282
3. Methods
3.1. Simulations
SE-SS-PARSE was tested initially with a simulatednumerical phantom. Both signal simulations and datareconstructions were implemented in Matlab (version 7.5;The MathWorks, Inc., Natick, MA, USA) running on adedicated eight AMD Opteron 880 dual-core processorcomputer with 64 GB of random access memory (@XiComputer Corp.). The simulated phantom (Fig. 2) was aclock-shaped set of disks in a 12.8-cm field of view (FOV).The radius for the central disk and outside disks was2.5 and 1 cm, respectively. The image resolution was 64 by64. Magnitude of transverse magnetization, relaxation ratesand frequency value were varied among disks, as indicatedby Fig. 2. Random zero-mean Gaussian distributed noisewas added to the simulated signal with four differentmagnitudes to simulate the experimental situation. Thecorresponding signal-to-noise ratios (SNR) were ∞, 40 dB,30 dB and 20 dB.
Fig. 2. The clock phantom used in the simulations. The table indicates the
3.2. Phantom study
The experimental acquisitions were performed with afour-tube phantom, consisting of four 1.6-cm-diameter tubesin an 8-cm-diameter beaker filled with water. Different con-centrations of agarose were added to different tubes toprovide in vivo like R2 values [25]. Small quantities of FeS04were added to two tubes to increase the R2′ values. Thechemical concentration for individual tubes is indicated inTable 1.
The R2 modifier agarose was used as a gelling agent aswell. The R2 values and the agarose concentration are1.3% to 4% of agarose solution corresponding to an R2
value of 15 to 7 s−1. We were unable to achieve largerR2 values with agarose alone, because the agaroseconcentration less than 1.3% was so low that it isinsufficient to solidify. FeSO4 was used in our study asthe R2′ modifier, which can effectively increase the R2′values with low concentration. Another R2′ modifier usedin our study was Sephadex beads; however, the R2′ values
actual input parameter values for each disk of the clock phantom.
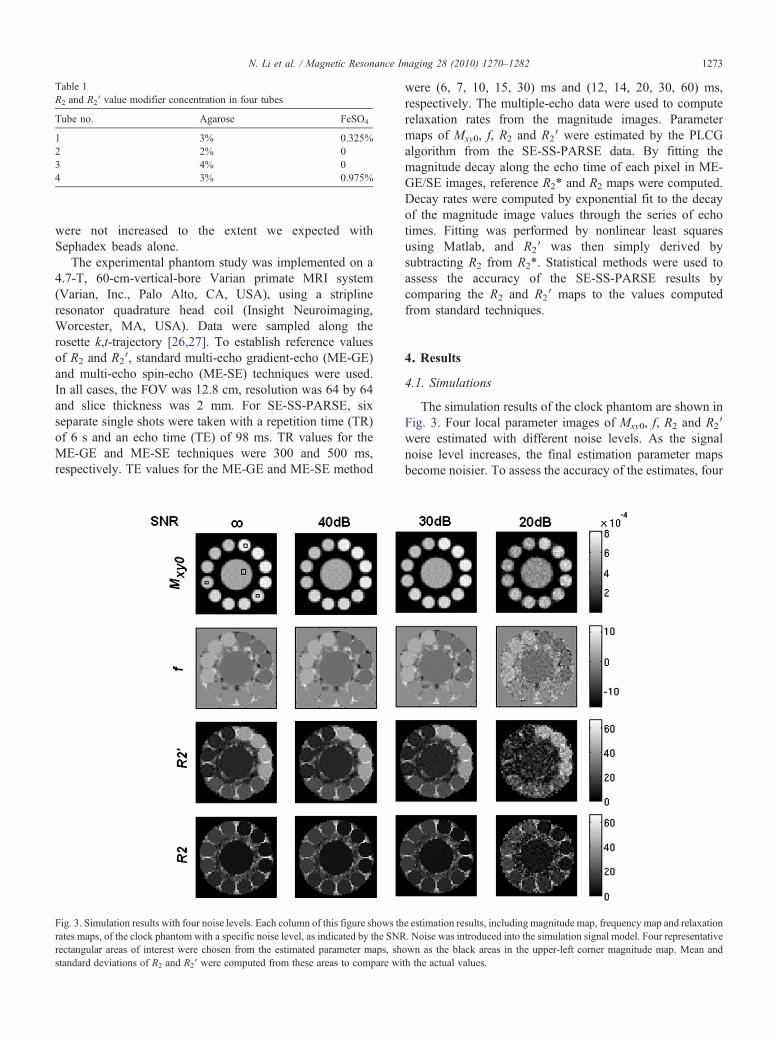
Table 1R2 and R2′ value modifier concentration in four tubes
Tube no. Agarose FeSO4
1 3% 0.325%2 2% 03 4% 04 3% 0.975%
Fig. 3. Simulation results with four noise levels. Each column of this figure srates maps, of the clock phantom with a specific noise level, as indicated byrectangular areas of interest were chosen from the estimated parameter mstandard deviations of R2 and R2′ were computed from these areas to com
1273N. Li et al. / Magnetic Resonance Imaging 28 (2010) 1270–1282
were not increased to the extent we expected withSephadex beads alone.
The experimental phantom study was implemented on a4.7-T, 60-cm-vertical-bore Varian primate MRI system(Varian, Inc., Palo Alto, CA, USA), using a striplineresonator quadrature head coil (Insight Neuroimaging,Worcester, MA, USA). Data were sampled along therosette k,t-trajectory [26,27]. To establish reference valuesof R2 and R2′, standard multi-echo gradient-echo (ME-GE)and multi-echo spin-echo (ME-SE) techniques were used.In all cases, the FOV was 12.8 cm, resolution was 64 by 64and slice thickness was 2 mm. For SE-SS-PARSE, sixseparate single shots were taken with a repetition time (TR)of 6 s and an echo time (TE) of 98 ms. TR values for theME-GE and ME-SE techniques were 300 and 500 ms,respectively. TE values for the ME-GE and ME-SE method
hows ththe SNRaps, shpare wi
were (6, 7, 10, 15, 30) ms and (12, 14, 20, 30, 60) ms,respectively. The multiple-echo data were used to computerelaxation rates from the magnitude images. Parametermaps of Mxy0, f, R2 and R2′ were estimated by the PLCGalgorithm from the SE-SS-PARSE data. By fitting themagnitude decay along the echo time of each pixel in ME-GE/SE images, reference R2* and R2 maps were computed.Decay rates were computed by exponential fit to the decayof the magnitude image values through the series of echotimes. Fitting was performed by nonlinear least squaresusing Matlab, and R2′ was then simply derived bysubtracting R2 from R2*. Statistical methods were used toassess the accuracy of the SE-SS-PARSE results bycomparing the R2 and R2′ maps to the values computedfrom standard techniques.
4. Results
4.1. Simulations
The simulation results of the clock phantom are shown inFig. 3. Four local parameter images of Mxy0, f, R2 and R2′were estimated with different noise levels. As the signalnoise level increases, the final estimation parameter mapsbecome noisier. To assess the accuracy of the estimates, four
e estimation results, including magnitude map, frequency map and relaxation. Noise was introduced into the simulation signal model. Four representativeown as the black areas in the upper-left corner magnitude map. Mean andth the actual values.
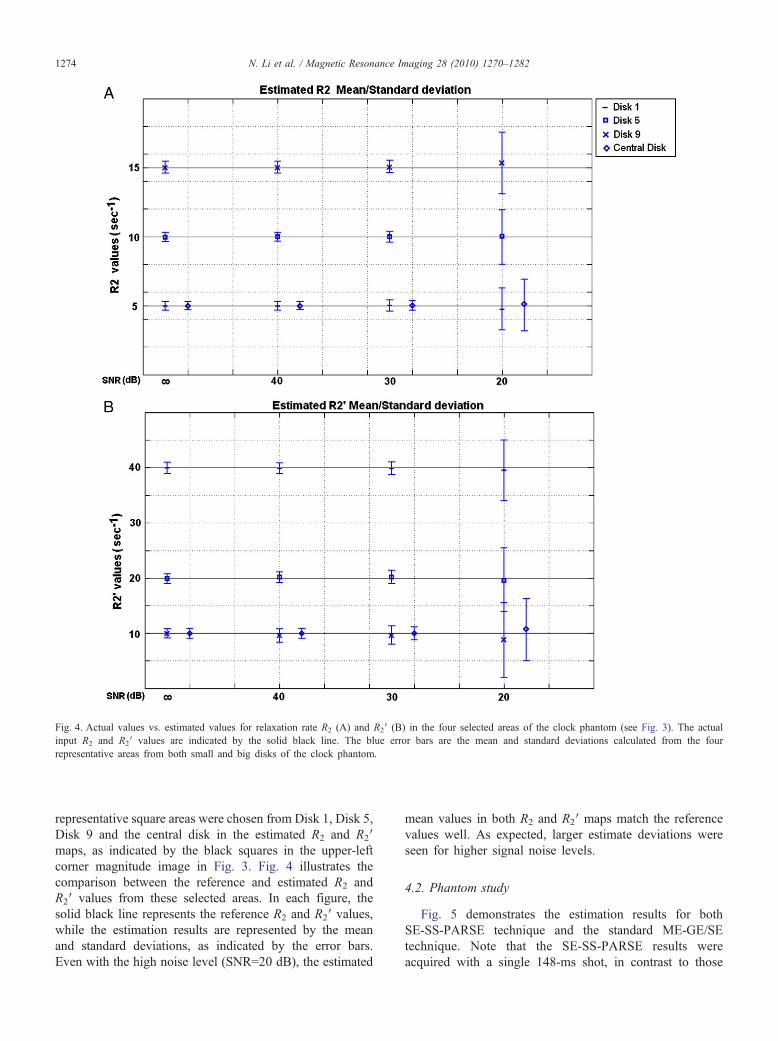
Fig. 4. Actual values vs. estimated values for relaxation rate R2 (A) and R2′ (B) in the four selected areas of the clock phantom (see Fig. 3). The actualinput R2 and R2′ values are indicated by the solid black line. The blue error bars are the mean and standard deviations calculated from the fourrepresentative areas from both small and big disks of the clock phantom.
1274 N. Li et al. / Magnetic Resonance Imaging 28 (2010) 1270–1282
representative square areas were chosen from Disk 1, Disk 5,Disk 9 and the central disk in the estimated R2 and R2′maps, as indicated by the black squares in the upper-leftcorner magnitude image in Fig. 3. Fig. 4 illustrates thecomparison between the reference and estimated R2 andR2′ values from these selected areas. In each figure, thesolid black line represents the reference R2 and R2′ values,while the estimation results are represented by the meanand standard deviations, as indicated by the error bars.Even with the high noise level (SNR=20 dB), the estimated
mean values in both R2 and R2′ maps match the referencevalues well. As expected, larger estimate deviations wereseen for higher signal noise levels.
4.2. Phantom study
Fig. 5 demonstrates the estimation results for bothSE-SS-PARSE technique and the standard ME-GE/SEtechnique. Note that the SE-SS-PARSE results wereacquired with a single 148-ms shot, in contrast to those
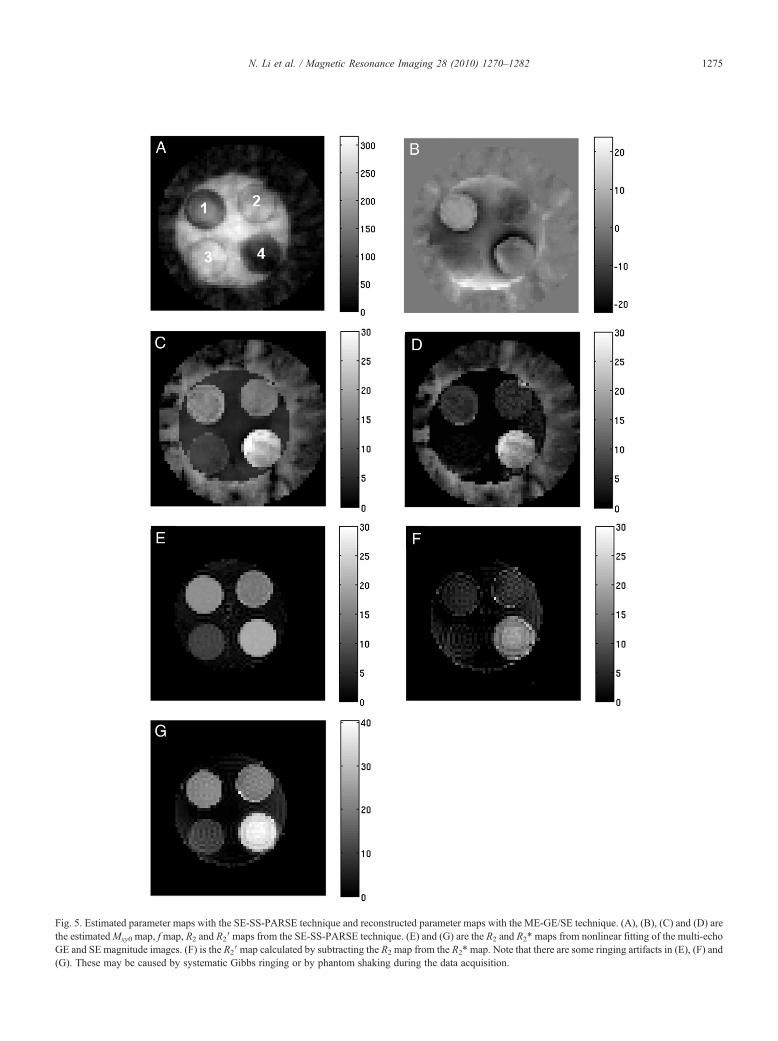
Fig. 5. Estimated parameter maps with the SE-SS-PARSE technique and reconstructed parameter maps with the ME-GE/SE technique. (A), (B), (C) and (D) arethe estimatedMxy0 map, fmap, R2 and R2′maps from the SE-SS-PARSE technique. (E) and (G) are the R2 and R2* maps from nonlinear fitting of the multi-echoGE and SE magnitude images. (F) is the R2′map calculated by subtracting the R2 map from the R2* map. Note that there are some ringing artifacts in (E), (F) and(G). These may be caused by systematic Gibbs ringing or by phantom shaking during the data acquisition.
1275N. Li et al. / Magnetic Resonance Imaging 28 (2010) 1270–1282
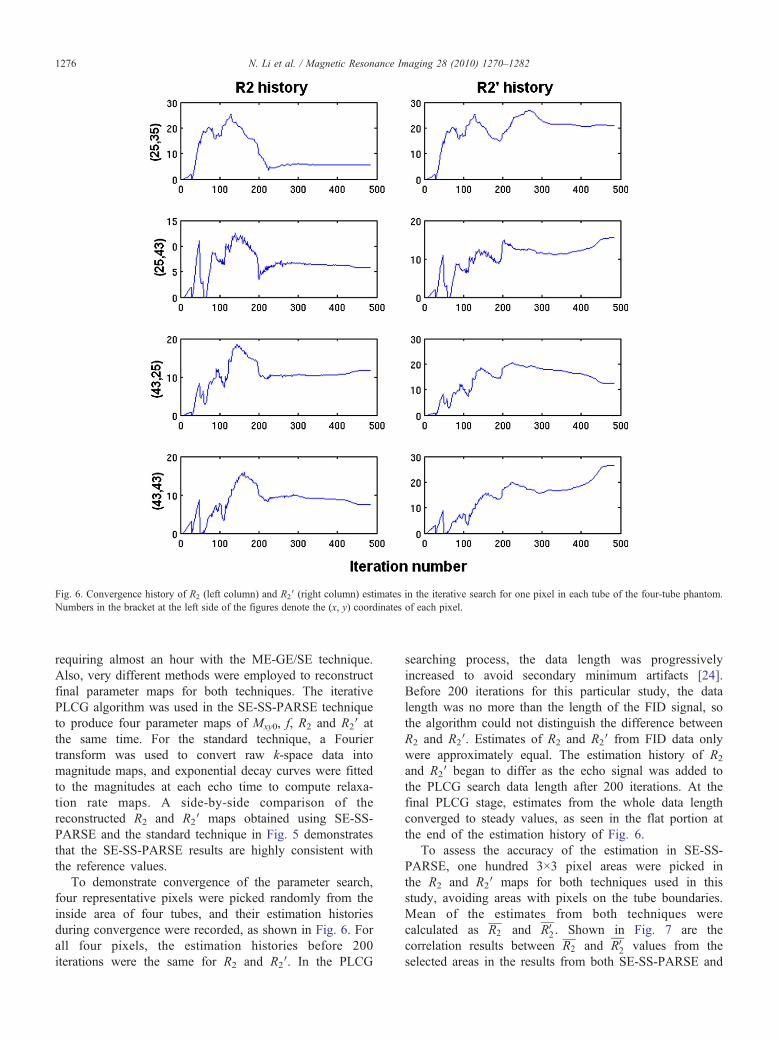
Fig. 6. Convergence history of R2 (left column) and R2′ (right column) estimates in the iterative search for one pixel in each tube of the four-tube phantom.Numbers in the bracket at the left side of the figures denote the (x, y) coordinates of each pixel.
1276 N. Li et al. / Magnetic Resonance Imaging 28 (2010) 1270–1282
requiring almost an hour with the ME-GE/SE technique.Also, very different methods were employed to reconstructfinal parameter maps for both techniques. The iterativePLCG algorithm was used in the SE-SS-PARSE techniqueto produce four parameter maps of Mxy0, f, R2 and R2′ atthe same time. For the standard technique, a Fouriertransform was used to convert raw k-space data intomagnitude maps, and exponential decay curves were fittedto the magnitudes at each echo time to compute relaxa-tion rate maps. A side-by-side comparison of thereconstructed R2 and R2′ maps obtained using SE-SS-PARSE and the standard technique in Fig. 5 demonstratesthat the SE-SS-PARSE results are highly consistent withthe reference values.
To demonstrate convergence of the parameter search,four representative pixels were picked randomly from theinside area of four tubes, and their estimation historiesduring convergence were recorded, as shown in Fig. 6. Forall four pixels, the estimation histories before 200iterations were the same for R2 and R2′. In the PLCG
searching process, the data length was progressivelyincreased to avoid secondary minimum artifacts [24].Before 200 iterations for this particular study, the datalength was no more than the length of the FID signal, sothe algorithm could not distinguish the difference betweenR2 and R2′. Estimates of R2 and R2′ from FID data onlywere approximately equal. The estimation history of R2
and R2′ began to differ as the echo signal was added tothe PLCG search data length after 200 iterations. At thefinal PLCG stage, estimates from the whole data lengthconverged to steady values, as seen in the flat portion atthe end of the estimation history of Fig. 6.
To assess the accuracy of the estimation in SE-SS-PARSE, one hundred 3×3 pixel areas were picked inthe R2 and R2′ maps for both techniques used in thisstudy, avoiding areas with pixels on the tube boundaries.Mean of the estimates from both techniques werecalculated as R2 and R0
2 . Shown in Fig. 7 are thecorrelation results between R2 and R0
2 values from theselected areas in the results from both SE-SS-PARSE and
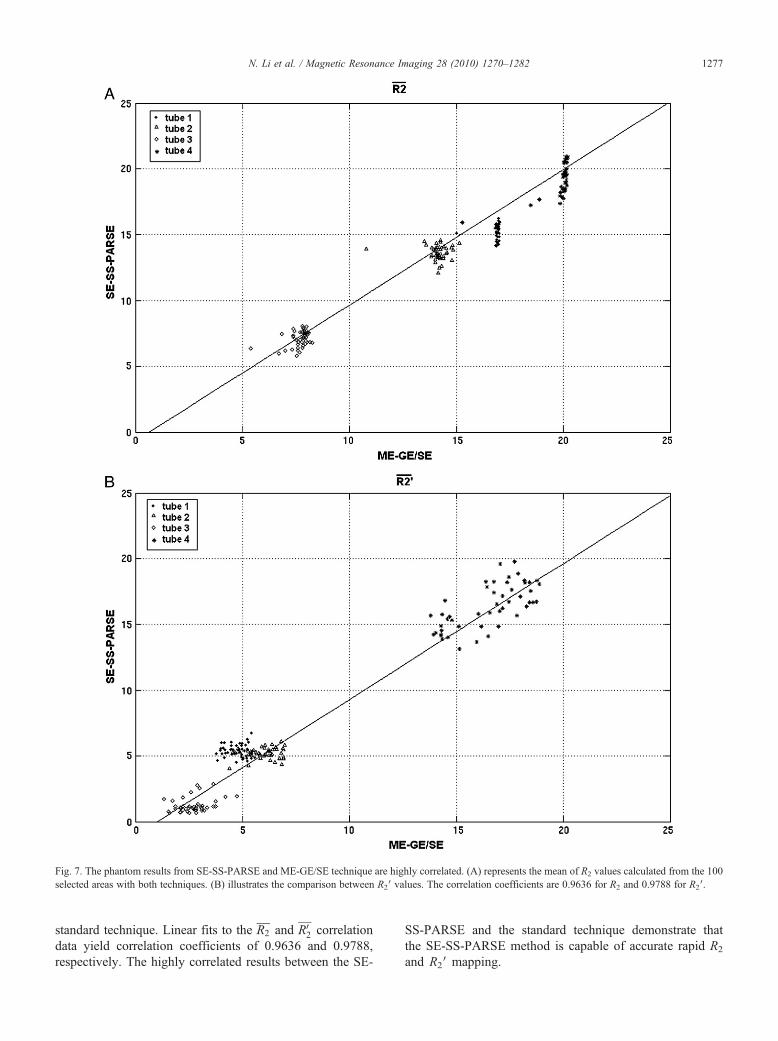
Fig. 7. The phantom results from SE-SS-PARSE and ME-GE/SE technique are highly correlated. (A) represents the mean of R2 values calculated from the 100selected areas with both techniques. (B) illustrates the comparison between R2′ values. The correlation coefficients are 0.9636 for R2 and 0.9788 for R2′.
1277N. Li et al. / Magnetic Resonance Imaging 28 (2010) 1270–1282
standard technique. Linear fits to the R2 and R02 correlation
data yield correlation coefficients of 0.9636 and 0.9788,respectively. The highly correlated results between the SE-
SS-PARSE and the standard technique demonstrate thatthe SE-SS-PARSE method is capable of accurate rapid R2
and R2′ mapping.
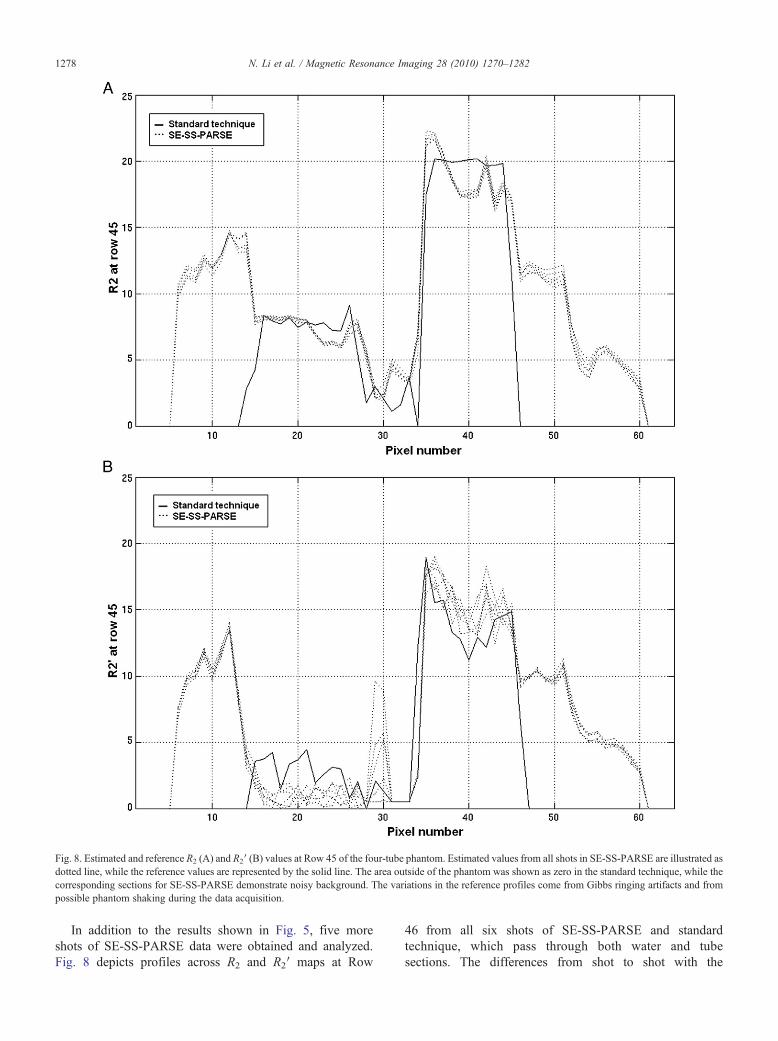
Fig. 8. Estimated and reference R2 (A) and R2′ (B) values at Row 45 of the four-tube phantom. Estimated values from all shots in SE-SS-PARSE are illustrated asdotted line, while the reference values are represented by the solid line. The area outside of the phantom was shown as zero in the standard technique, while thecorresponding sections for SE-SS-PARSE demonstrate noisy background. The variations in the reference profiles come from Gibbs ringing artifacts and frompossible phantom shaking during the data acquisition.
1278 N. Li et al. / Magnetic Resonance Imaging 28 (2010) 1270–1282
In addition to the results shown in Fig. 5, five moreshots of SE-SS-PARSE data were obtained and analyzed.Fig. 8 depicts profiles across R2 and R2′ maps at Row
46 from all six shots of SE-SS-PARSE and standardtechnique, which pass through both water and tubesections. The differences from shot to shot with the
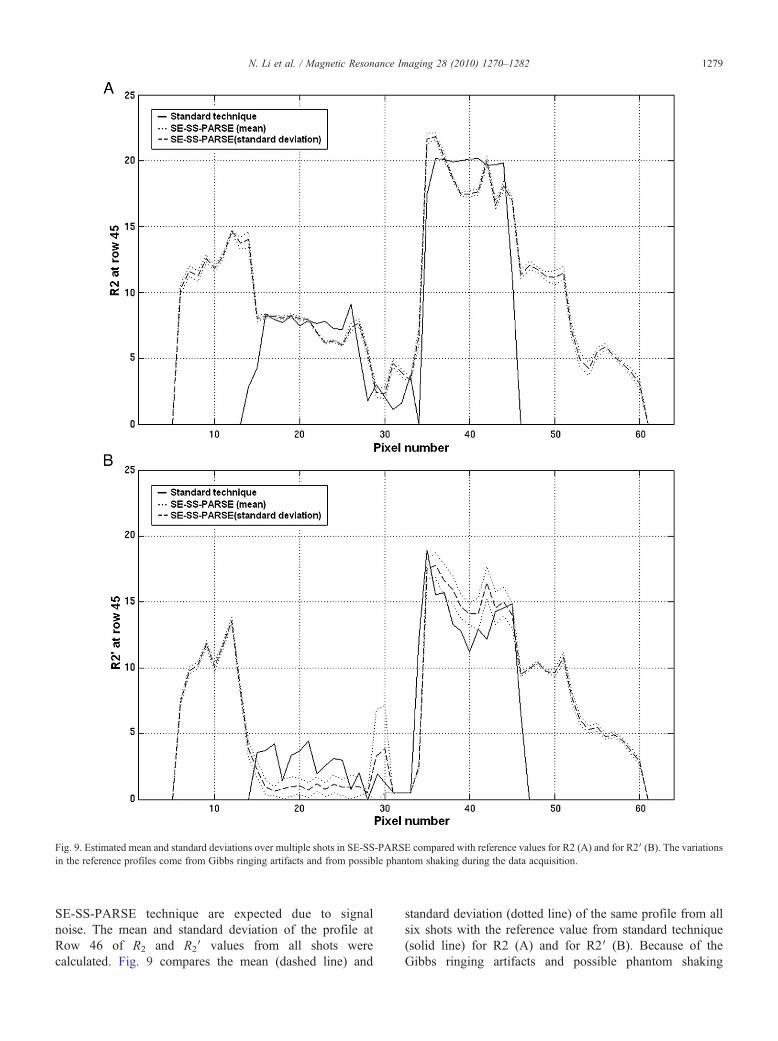
Fig. 9. Estimated mean and standard deviations over multiple shots in SE-SS-PARSE compared with reference values for R2 (A) and for R2′ (B). The variationsin the reference profiles come from Gibbs ringing artifacts and from possible phantom shaking during the data acquisition.
1279N. Li et al. / Magnetic Resonance Imaging 28 (2010) 1270–1282
SE-SS-PARSE technique are expected due to signalnoise. The mean and standard deviation of the profile atRow 46 of R2 and R2′ values from all shots werecalculated. Fig. 9 compares the mean (dashed line) and
standard deviation (dotted line) of the same profile from allsix shots with the reference value from standard technique(solid line) for R2 (A) and for R2′ (B). Because of theGibbs ringing artifacts and possible phantom shaking
1280 N. Li et al. / Magnetic Resonance Imaging 28 (2010) 1270–1282
during the data acquisition, reference R2 and R2′ valuesexhibited spatial variations, especially noticeable in R2′.The variations could be decreased by averaging R2 and R2′values from neighborhood profiles. Here we did notaverage reference R2 or R2′ values, in order to make apixel-by-pixel-based comparison with SE-SS-PARSE. Themean difference may come from bias errors arising frommodel discrepancies [24]. As noted above, the standarddeviation in Fig. 9 reflects the random noise differenceamong different shots.
5. Discussion
A fast single-shot MRI technique, SE-SS-PARSE, hasbeen described in this article. Although obtaining data withinonly 200 ms, SE-SS-PARSE is able to produce quantitativemultiple parameter estimate images at the same time. Thesignal model in SE-SS-PARSE models the decay andprecession of the local transverse magnetization during thedata acquisition time, which enables more precise and robustestimation for local image parameters. More importantly, byusing the dynamic signal model, SE-SS-PARSE is free ofgeometric and blurring artifacts, and, in principle, is lesssensitive to large susceptibility gradients in vivo [1]. Becausea spin-echo signal is used in SE-SS-PARSE, the two imageparameters R2 and R2′ can be computed in addition to theMxy0, f and R2* estimated using the SS-PARSE technique.Measurements of R2 and R2′ values in both simulations andexperiments from the SE-SS-PARSE technique are in goodagreement with those from standard techniques, suggestingthe reliability of this method.
Accurate timing plays an important role in the SE-SS-PARSE technique. The previously developed SS-PARSEtechnique measures all the data points within an uninter-rupted time period. The estimation algorithm for SS-PARSE simply models this single signal. In contrast, theSE-SS-PARSE measures data in two separate time periodsafter the 90° and 180° rf pulses. Spoiler gradients have beenapplied on both sides of 180° pulses to eliminate any FIDsignal from an imperfect refocusing pulse. The intervalbetween the FID signal and the echo signal includes thetime for the 180° pulse along with these spoiler gradients.The time durations of rf pulses and spoiler gradients need tobe noted precisely and represented in the signal model.These time durations can be measured once in thecalibration process [28] and will only change if the rfpulses or gradients change. Because the reconstruction inSE-SS-PARSE uses a signal that is a spliced combination ofFID and echo signals, the difference between the twosignals should be noted, such as the small net phase changein the echo induced by imperfect 180° pulse. In principle,and as verified in our results, this system-dependentdifference in phase angle needs to be measured only oncefor a given refocusing pulse.
Although the SE-SS-PARSE results were highly corre-lated to the “gold standard” results, there are several aspectsof the comparison that merit discussion. The differencebetween the estimated parameters and the actual parameters,here represented by the reference values, can be character-ized as estimation errors. For the SE-SS-PARSE technique,estimation errors include both bias errors arising fromsignal model discrepancies and random errors caused bythe measurement noise. Random errors in our phantomstudies are characterized by the standard deviations inFig. 9. Due to the space limit, only random errors inselected locations were presented. By implementingmultiple shots, averaged estimates of R2 and R2′ wereobtained. The difference between the average and referencevalues can be characterized by bias errors coming fromvarious sources [24], especially (1) the local signal modelin SE-SS-PARSE did not measure the nonexponentialeffects of dephasing across the voxel that exist in the actualobject (these effects may become worse with largersusceptibility variation increases in human tissue); and(2) the mismatch between evaluation k-band (square) andthe acquisition k-band (disc) in the SE-SS-PARSE maylead to under- or overestimates of high spatial frequenciesfrom the gap between two k-bands. These sources of biaserrors may be reduced and minimized by multiple solutionsproposed in another report [24].
The reconstruction accuracy and efficiency in SE-SS-PARSE depend on the convergence behaviors of the PLCGalgorithm. The typical convergence time for the spin-echofour-tube phantom data on our computational platform isaround 30 min to an hour, which is very slow compared tothe fast Fourier transform. The algorithm may be optimizedby (1) reducing the progressive data lengths over whichsuccessive estimation are performed, which may speed theestimation (however, the number of lengths must besufficient to prevent convergence to a secondary minimum);(2) increasing the stopping tolerance for each PLCG datalength (this can accelerate the searching process but canreduce estimation accuracy); and (3) adjusting weightingfactors that scale the magnitude of the decay rate parametersrelative to the other parameters. The weighting factors playan important role in the speed of convergence, especiallywhen R2 and R2′ are significantly different. Proper weightingfactors can effectively balance the size of the searchgradients for R2 and R2′, and thus accelerate the algorithm.Faster computing hardware (e.g., graphical processing units)may offer substantial acceleration.
In comparison with many R2 (or T2) and R2′ measure-ment methods [13–23], SE-SS-PARSE has several potentialbasic advantages. In conventional methods, R2′ values aremeasured by subtracting R2 from R2* values. The precisionof the R2′ measurements is then limited by the errorsintroduced by both R2 and R2* measurements. In contrast,the SE-SS-PARSE technique estimates R2′ values directlyfrom the sampled data. In the past few decades, many fastscan R2 mapping methods based on a single-shot method
1281N. Li et al. / Magnetic Resonance Imaging 28 (2010) 1270–1282
such as EPI have been introduced to reduce the acquisitiontime. However, such single-shot methods suffer from geo-metric errors due to the field inhomogeneities as well asto ghosting artifacts. Although sacrificing computationalconvenience, SE-SS-PARSE is totally free of such geometricor ghosting errors. Moreover, SE-SS-PARSE is capable ofproducing quantitative image parameter measurements. Itshould be emphasized that the amount of the data sampledin SE-SS-PARSE is associated with TE. Longer TE(consistent with expected T2 values) allows for more datapoints and, thus, theoretically more accurate estimations.Optimal choices of TE for estimation accuracy remain tobe determined.
SE-SS-PARSE may be of significant value in fMRIresearch. The BOLD fMRI signal induced by the neuralactivities consists of a change in the local T2* values. Asingle-shot GE technique is normally used to obtain thedynamically changing T2*-weighted images in fMRI. TheGE method is easy to implement and has high sensitivityin detecting local signal changes. However, the GEtechnique is also sensitive to field inhomogeneities inducedby large draining veins. At high magnetic field, favored forincreased sensitivity for fMRI, the field inhomogeneityproblems such as through-slice dephasing become worse,limiting the applications of GE methods. On the otherhand, in the SE sequence, the 180° rf pulse refocuses thestatic intravoxel dephasing around large vessels and hencereduces their contribution to the BOLD response [2]. Byproducing R2 values instead of R2* values with rapid dataacquisition, SE-SS-PARSE is well suited to detect BOLDeffects in fMRI studies.
In summary, a spin-echo version of SS-PARSE (SE-SS-PARSE) technique has been developed and validated withtissue-equivalent phantom. It was shown that the simula-tion results were close to the actual values, even at highnoise level with SNR of 20 dB. The experimental resultson a four-tube phantom were also highly correlated withthe results from standard reference techniques. Future workwill include application and development of the techniquefor in vivo studies, and acceleration of the offlinereconstruction algorithm.
Acknowledgment
The authors gratefully acknowledge support from NIHEB003292 and the Alabama Eyesight Foundation.
References
[1] Twieg DB. Parsing Local signal evolution directly from a single-shotMRI signal: a new approach for fMRI. Magn Reson Med 2003;50:1043–52.
[2] Yablonskiy DA, Haacke EM. Theory of NMR signal behavior inmagnetically inhomogeneous tissues: the static dephasing regime.Magn Reson Med 1994;32(6):749–63.
[3] Ogawa S, Menon RS, Tank DW, Kim SG, Merkle H, Ellermann JM,et al. Functional brain mapping by blood oxygenation level-dependent
contrast magnetic resonance imaging. A comparison of signalcharacteristics with a biophysical model. Biophys J 1993;64(3):803–12.
[4] Wallis IW, Paley MNJ, Graham JM, Grunewald RA, Wignall EL,Joy HM, et al. MRI assessment of basal ganglia iron deposition inParkinson's disease. J Magn Reson Imag 2008;28:1061–7.
[5] Lerch JP, Carroll JB, Dorr A, Spring S, Evans AC, Hayden MR, et al.Cortical thickness measured fromMRI in the YAC128mouse model ofHuntington's disease. NeuroImage 2008;41(2):243–51.
[6] Steffens DC. Magnetic resonance imaging signal hypointensity andiron content of putamen nuclei in elderly depressed patients. PsychiatryRes 1998;83:95–103.
[7] Bakshi R. MRI T2 shortening (black T2) in multiple sclerosis:frequency, location and clinical correlation. NeuroReport 2000;17:15–21.
[8] Allkemper T, Schwindt W, Maintz D, Heindel W, Tombash B.Sensitivity of T2-weighted FSE sequences towards physiological irondepositions in normal brains at 1.5 and 3.0T. Eur Radiol 2004;14:1000–4.
[9] Grune M, Pillekamp F, Schwindt W, Hoehn M. Gradient echo timedependence and quantitative parameter maps for somatosensoryactivation in rats at 7T. Magn Reson Med 1999;42:118–26.
[10] Siemonsen S, Fitting T, Thomalla G, Horn P, Finsterbusch J, SummersP, et al. T2′ imaging predicts infarct growth beyond the acutediffusion-weighted imaging lesion in acute stroke. Radiology2008;248(3):979–86.
[11] Jensen UR, Liu JR, Eschenfelder C, Meyne J, Zhao Y, Deuschl G, et al.The correlation between quantitative T2′ and regional cerebral bloodflow after acute brain ischemia in early reperfusion as demonstratedin a middle cerebral artery occlusion/reperfusion model of the rat.J Neurosci Methods 2009;178(1):55–8.
[12] Miszkiel KA. The measurement of R2, R2* and R2′ in HIV-infectedpatients using the prime sequence as a measure of brain irondeposition. Magn Reson Imaging 1997;15(10):1113–9.
[13] Carr HY, Purcell EM. Effects of diffusion on free precession in nuclearmagnetic resonance experiments. Physiol Rev 1954;94:630.
[14] Meiboom S, Gill D. Modified spin-echo method for measuring nuclearrelaxation times. Rev Sci Instrum 1998;29:688.
[15] Ma JF, Wehrli FW. Method for image-based measurement of thereversible and irreversible contribution to the transverse-relaxationrate. J Magn Reson Imag 1995;111:61–9.
[16] McKenzie CA, Chen Z, Drost DJ, Prato FS. Fast acquisition ofquantitative T2 maps. Magn Reson Med 1999;41:208–12.
[17] Bruder H, Fischer H, Reinfelder HE, Schmitt F. Image reconstructionfor echo planar imaging with nonequidistant k-space sampling. MagnReson Med 1992;23:311–23.
[18] Crawley AP, Henkelman RM. Errors in T2 estimation using multislicemultiple-echo imaging. Magn Reson Med 1987;4(1):34–47.
[19] Jezzard P, Balaban RS. Correction for geometric distortion inecho planar images from B0 field variations. Magn Reson Med1995;34(1):65–73.
[20] Andersson JL, Skare S. A model-based method for retrospectivecorrection of geometric distortions in diffusion-weighted EPI. Neuro-Image 2002;16(1):177–99.
[21] Li Y, Xu N, Fitzpatrick JM, Pickens DR, Dawant BM. Accounting forsignal loss due to dephasing in the correction of distortions in gradient-echo EPI via nonrigid registration. IEEE Trans Med Imaging 2007;26(12):1698–707.
[22] Stevick J, Harding S, Paquet U, Ansorge R, Carpenter A, Williams G.Gaussian process modeling for image distortion correction in echoplanar imaging. Magn Reson Med 2008;59(3):598–606.
[23] Chen N, Oshio K, Panych L, Rybicki F, Mulkern R. Spatially selectiveT2 and T2* measurement with line-scan echo-planar spectroscopicimaging. J Magn Reson 2004;171(1):90–6.
[24] Twieg DB, Reeves S. Basic properties of SS-PARSE para-meter estimates. IEEE Trans Med Imaging 2010 [Epub aheadof print].

1282 N. Li et al. / Magnetic Resonance Imaging 28 (2010) 1270–1282
[25] Gelman N, Gorell JM, Barker PB, Savage RM, Spickler EM,WindhamJP, et al. MR imaging of human brain at 3T: preliminary report ontransverse relaxation rates and relation to estimate iron content.Radiology 1999;210(3):759–67.
[26] Noll DC. Multishot rosette trajectories for spectrally selective MRimaging. IEEE Trans Med Imag 1997;16(4):372–7.
[27] Noll DC, Peltier SJ, Boada FE. Simultaneous multislice acquisitionusing rosette trajectories (SMART): a new imaging method forfunctional MRI. Magn Reson Med 1998;39:709–16.
[28] Zhang Y, Hetherington HP, Stokely EM, Mason GF, Twieg DB. Anovel k-space trajectory measurement technique. Magn Reson Med1998;39:999–1004.
Copyright © 2022 FDOKUMEN