Spices Monthly Research Report - Agriwatch
18
Spices-Monthly-Research-Report 05 April, 2019 Contents Spices Wholesale Price Index /Monthly Arrivals Scenario Spot Market Prices Spot price Outlook International Prices Domestic Stock Position Agriwatch Red Chilli and Turmeric Production Estimate 2019-20 (Second Advance) Red Chilli Sown in Rabi Season Agriwatch Coriander and Jeera Production Estimate 2019-20 (Second Advance) Domestic Market Fundamentals Technical Analysis (Futures Market) Spices Monthly Research Report
-
Upload
khangminh22 -
Category
Documents
-
view
0 -
download
0
Transcript of Spices Monthly Research Report - Agriwatch
Spices-Monthly-Research-Report 05 April, 2019
Contents
Spices Wholesale Price Index /Monthly
Arrivals Scenario
Spot Market Prices
Spot price Outlook
International Prices
Domestic Stock Position
Agriwatch Red Chilli and Turmeric Production Estimate 2019-20 (Second Advance)
Red Chilli Sown in Rabi Season
Agriwatch Coriander and Jeera Production Estimate 2019-20 (Second Advance)
Domestic Market Fundamentals
Technical Analysis (Futures Market)
Spices Monthly Research Report

Spices-Monthly-Research-Report 05 April, 2019
Pepper price index in Feb 136.4 compared to 136.6 in Jan, Red Chilli 117.4 in Feb down from 119.3
in Jan, Turmeric in Feb 111.9 compared to 115.6 in Jan, Coriander 149.3 in Feb from 151.7 in Jan,
Jeera 123.5 in Feb compared to 127.5 in Jan and Cardamom in Feb 138.5 up from 134.3 in Jan.

Spices-Monthly-Research-Report 05 April, 2019
RED CHILLI
Spot Market Recap
By and large firm sentiment witnessed in Chilli domestic market during the period.
Continued export demand reported well from China, Sri Lanka, Malaysia, Bangladesh and
UAE etc.
New crop supply continued in the major spot market. Current year chilli quality reported
affected due to lower rainfall in Andhra Pradesh, some chilli growing areas affected by virus
infection.
We expect Andhra Pradesh (36% production share in India’s total production) chilli production
likely to come 434,449 MT, last year it was 341,671 MT. In Andhra Pradesh acreage to rise by
45% from last year’s 87,608 hectares to 127,032 hectares.
As chilli prices already moving at higher levels some minor price correction expected in
coming days. However, overall sentiment is good as carry forward stocks reported lower from
normal quantity.
We expect Chilli prices to trade range bound in coming days.
Monthly Red Chilli (Dry) Arrival Scenario
Market Current Month Last Month Previous Year % Change Over
Previous month 19-Mar 19-Feb 18-Mar
Guntur (Andhra Pradesh) 14,30,000 15,70,000 11,20,000 -8.92
Warangal (Andhra Pradesh) 8,75,000 6,72,000 6,00,000 30.21
Total 23,05,000 22,42,000 17,20,000 2.81 Units – Bags (1 bag = 45 kgs)
Red chilli supply reported up by 34.01% in the spot market from last year as new crop supply
continued in the spot market and increased production.
Red Chilli Arrivals Scenario
Current year total red chilli supply in Guntur market from 1st January 2019 to 28th March 2019,
stands at around 184,050 MT as compared to 143,775 MT in the corresponding period last year,
supply up by 28% an expectation of higher production current year.
Chilli Cold storage stocks
As per trade information, chilli cold storage stocks as on date (including old and new crops) in Guntur
stood at 157,500 to 162,000 MT and in Andhra Pradesh around 184,500 to 189,000 MT according to
various trade estimates.
Agriwatch Red Chilli Production Estimate 2019-20
As per Agriwatch’s second advance production estimate, Red Chilli production for 2019-20 is
estimated at 12.22 lakh MT. Previous year’s production was 10.50 lakh MT.
Red Chilli Rabi Sown during Rabi Season:
In Telangana, Chilli sowing for the Rabi season as of 13th Mar reported at 12,634 hectare as
compared to 10,547 hectare in the corresponding period last year. Normal area reported 16,336
hectare. Chili is at 4th picking stage.
Overall, the average rainfall received in Telangana State from 1-6-2018 to 13.3.2019 is recorded as
722.6 mm as against the Normal as on date of 861.1 mm showing a deviation of -16%.
In Andhra Pradesh, Chilli sowing for the Rabi season as of 13th Mar reported at 14,385 hectare as
compared to 20,453 hectare in the corresponding period last year. Normal area reported 25,950
hectare. Chili is at flowering to picking stage.
Overall, the average rainfall received in Andhra Pradesh from 1-6-2018 to 13-03-2019 is recorded as
594.9 mm as against the Normal as on date of 873.8 mm showing by Deficit – 31.9 percent.

Spices-Monthly-Research-Report 05 April, 2019
Due to lower production in 2018 chilli prices reported up. Current year (2019) chilli prices reported
downward correction from January and monthly average prices till March end closed at Rs.7,784/-
qtl as compared to previous month (Feb) Rs.8,220/-qtl, as increasing new crop supply reported in
the market and higher production current year. Red Chilli prices last year March reported at
Rs.8,447 /-qtl.
Red Chilli Price Outlook
Currently, Chilli (NCDEX quality) in Guntur is trading at Rs.7,200 – 7,800 per quintal. We expect that
prices may not fall much further from current levels, as currently lower quality new chilli supply
coming to the market. We expect prices to move in a range between Rs.7,000 – 8,500/-qtl in
coming days.
Red Chilli Spot Price Outlook (Guntur, 334 variety)
Candlestick chart formation indicates prices downward correction in the market. Currently Red Chilli 334
variety prices are moving at Rs.7,800 - 8,300/-qtl. Initial support level is Rs.7,500/-qtl for short term, if it
breaks, prices may come down to Rs.7,200/-qtl. We expect prices to move in a range between Rs.7,500 –
8,800/-qtl. in coming days.

Spices-Monthly-Research-Report 05 April, 2019
Spot Prices Monthly Change
Red Chilli (Dry) Spot Market Prices: (Rs/Qtl)
Grade Centre 30-Mar-19 28-Feb-19 31-Mar-18 % Change Over Previous month
NCDEX Quality
Guntur (A.P.) Benchmark market
7800 8000 8800 -2.50
LCA 334 8300 8500 9100 -2.35
Teja 9300 9300 9600 Unch
No. 273 8300 8000 9800 3.75
No. 5 8200 8500 9500 -3.53
Fatki 4500 4500 6000 Unch
Byadgi 9000 8700 9300 3.45
US 341 9200 9000 10800 2.22
Denvor Delux 8000 8300 10000 -3.61
Indam 5 8500 8500 10000 Unch
Teja
Warangal (Telangana)
9300 9100 10600 2.20
Wonder Hot 9900 9600 11600 3.13
341 9100 8800 11500 3.41
Denvor Delux 8900 8200 11300 8.54
Paprika 11700 NA NA -
Fatki 4000 4500 6000 -11.11
No. 12
Bedia (M.P.)
12000 9000 NA 33.33
Indu 2070 12000 9000 12500 33.33
MICO (Teja) 13500 9500 12000 42.11
Jhankar 12000 9000 NA 33.33
Ganesh NA 8500 NA -
Teja (Khamam)
New Delhi
11500 10100 12500 13.86
M.P. Maco Teja NA NA NA -
Pala 12 NA NA NA -
LCA 334 10000 10000 11500 Unch
Fatki 5500 4500 6000 22.22
Packing 10000 10000 11500 Unch
TURMERIC
Spot Market Recap
Mixed sentiment witnessed in Turmeric spot market during the period.
Due to closing financial year buyers reported unresponsive in the spot market.
In Warangal market new Turmeric likely to enter after 15th April.
In Erode mandi new Turmeric supply reported around on an average daily basis 5,250 – 6,750
quintals.
In Andhra Pradesh, Duggirala market new turmeric likely to enter from April first week and
after Lok Sabha election (11th April) quantity likely to increase.
Local traders are likely to become active in coming days at lower price levels as Maharashtra
production n estimate reported lower as a result of drought condition.
We expect Turmeric prices to trade range bound in coming days.

Spices-Monthly-Research-Report 05 April, 2019
Monthly Turmeric (Dry) Arrival Scenario
Market Current Month Last Month Previous Year % Change Over
Previous month 19-Mar 19-Feb 18-Mar
Nizamabad (Telangana) 348,000 266,000 334,000 30.83
Duggirala (AP)* 64,100 55,900 100,000 14.67
Salem (TN)* 1870 828 206 125.66
Erode (TN) 106,900 34,900 93,000 206.30
Sangli (Mah.) 279,600 208,500 353,900 34.10
Warangal(Telangana) NA NA 1,565 -
Total 800,470 566,128 882,671 41.39
Units – Bags (1 bag = 75 kgs), * qtl.
Turmeric supply reported down by 9.31% in the spot market from last year as stockists were holding
back their stocks on expectations of higher prices in coming days.
Arrivals Scenario
In Nizamabad, current season new Turmeric arrivals reported around 45,500 MT till 28th March
compared to last year same period 43,610 MT, 4.3% reported up from last year. In Nizamabad spot
market, turmeric supply last season it was (from 15th January 2018 to 18th January 2019) reported
around 86,415 MT compared to 82,831 MT in the corresponding period last year, 4.3% reported up
from last year.
In Erode market, Turmeric supply current year reported around 8,615 MT till 29th March.
Agriwatch Turmeric Production Estimate 2019-20
As per Agriwatch’s Second advance production estimate, Turmeric production for 2019-20 is
estimated at 532,353 MT (basis dry crop) compared to previous year’s 476,771 MT. Turmeric
production may go down further as Maharashtra standing crop is at very crucial stage.
Turmeric final sown:
In Andhra Pradesh, Turmeric final sowing reported 18,737 hectares as compared to 14,841 hectares
in the corresponding period last year, 104% sowing completed from season normal.
In Telangana, turmeric sowing was reported at 47,888 hectares as compared to 44,956 hectares in
the corresponding period last year. Normal area reported 54,878 hectares.
All India Stocks
As per trade information, currently, all India Turmeric stocks are reported around 15 - 18 lakh bags in
the spot market.
In the benchmark market, Turmeric monthly average prices during March ended with at Rs.6,269/-qtl
compared to previous month Rs.6,471/-qtl. Turmeric prices last year March reported at Rs.6,838/-qtl.
Moisture content Turmeric new crop supply and higher production expectations compared to last year
put some pressure on prices from higher levels, however buyers likely to active from lower levels
(Rs.6,000 – 6,200/-qtl) in coming days.
Spices-Monthly-Research-Report 05 April, 2019
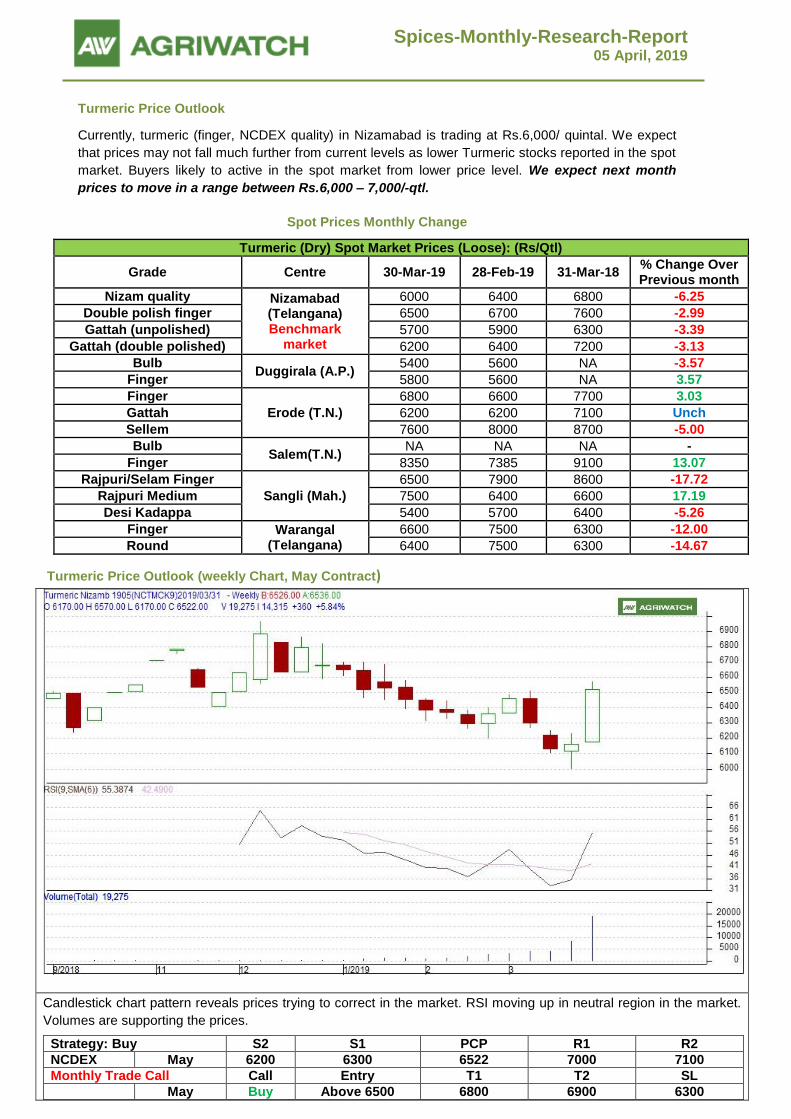
Turmeric Price Outlook
Currently, turmeric (finger, NCDEX quality) in Nizamabad is trading at Rs.6,000/ quintal. We expect
that prices may not fall much further from current levels as lower Turmeric stocks reported in the spot
market. Buyers likely to active in the spot market from lower price level. We expect next month
prices to move in a range between Rs.6,000 – 7,000/-qtl.
Spot Prices Monthly Change
Turmeric (Dry) Spot Market Prices (Loose): (Rs/Qtl)
Grade Centre 30-Mar-19 28-Feb-19 31-Mar-18 % Change Over Previous month
Nizam quality Nizamabad (Telangana) Benchmark
market
6000 6400 6800 -6.25
Double polish finger 6500 6700 7600 -2.99
Gattah (unpolished) 5700 5900 6300 -3.39
Gattah (double polished) 6200 6400 7200 -3.13
Bulb Duggirala (A.P.)
5400 5600 NA -3.57
Finger 5800 5600 NA 3.57
Finger
Erode (T.N.)
6800 6600 7700 3.03
Gattah 6200 6200 7100 Unch
Sellem 7600 8000 8700 -5.00
Bulb Salem(T.N.)
NA NA NA -
Finger 8350 7385 9100 13.07
Rajpuri/Selam Finger
Sangli (Mah.)
6500 7900 8600 -17.72
Rajpuri Medium 7500 6400 6600 17.19
Desi Kadappa 5400 5700 6400 -5.26
Finger Warangal (Telangana)
6600 7500 6300 -12.00
Round 6400 7500 6300 -14.67
Turmeric Price Outlook (weekly Chart, May Contract)
Candlestick chart pattern reveals prices trying to correct in the market. RSI moving up in neutral region in the market.
Volumes are supporting the prices.
Strategy: Buy S2 S1 PCP R1 R2
NCDEX May 6200 6300 6522 7000 7100
Monthly Trade Call Call Entry T1 T2 SL
May Buy Above 6500 6800 6900 6300

Spices-Monthly-Research-Report 05 April, 2019
CORIANDER SEED
Spot Market Recap
Firm sentiment witnessed in Coriander major market during the month.
Current year Coriander area down by 12.7% due to lower prices.
Coriander sowing reported lower in Andhra Pradesh. In Andhra Pradesh, Coriander sowing for
the Rabi season as of 27.02.2019 reported at 1,866 hectare as compared to 1,080 hectare in
the corresponding period last year. Normal area reported 16,247 hectare.
As per Final Gujarat state govt. data, Coriander progressive area of Rabi 2018-19 is 29,630
hectares as on 11-02-2019 which is lower than 69,888 hectares during corresponding period
last year. Till now 31.79% sowing completed from Normal area 93,196 hectares.
Agriwatch estimates lower ending stocks for 2019-20 likely to support Coriander prices in
coming days.
Coriander prices are expected to firm in coming days.
Monthly Coriander Arrival Scenario
Market Current Month Last Month Previous Year % Change Over
Previous month 19-Mar 19-Feb 18-Mar
Guna (MP) 82,500 25,200 84,700 227.38
Neemuch (MP) 42,150 30,400 30,400 38.65
Kota (RJ) 70,900 32,800 135,500 116.16
Ramganj (RJ) 429,000 100,500 567,000 326.87
Baran (RJ) 62,100 33,000 111,000 88.18
Bhawani (RJ) 52,800 16,950 61,500 211.50
Gondal (GUJ) 259,100 84,600 62,615 206.26
Total 998,550 323,450 1,052,715 208.72
Units – Bags (1 bag = 40 kgs)
In Kota benchmark market, arrivals current year reported down by 47.7% from corresponding
period last year due to lower production current year and stockists were holding back their stocks
(both old and new) on expectations of higher prices in coming days. During March, Coriander total
supply reported down by 5.1% from last year same period.
Current year coriander supplies reported down from January to till date at Kota mandi due to lower
production current year. In 2019, Coriander new crop supply reported 1,568 MT from 12th March to
30th March compared to same period last year 4,060 MT, down by 61.4%.
In Kota spot market, last season from 15th February to 31
st December 2018, supply reported around
25,520 MT compared to 33,140 MT in the corresponding period last year, down by 23%.

Spices-Monthly-Research-Report 05 April, 2019
Due to lower sowing production current year prices took support from January onwards and in March
move up to Rs.5,500/-qtl last year same period it was Rs.4,886/-qtl, up by around 12.6%. Coriander
carry forward stocks also reduce day by day and lower sowing area expected lower production likely
to support Coriander prices in future.
Agriwatch Coriander Production Estimate 2019-20
As per Agriwatch second advance production estimate, Coriander production for 2019-20 is
estimated at 268,957 MT compared to previous year’s 333,348 MT.
Agriwatch Coriander Price Outlook
Coriander import reported higher in 2018-19 as current year (2019-20) production expected lower due
to lower sowing area. Stockists already buying good amount of stocks earlier an expectation of higher
prices. We expect, this higher imported (above from normal) coriander stocks may cap coriander
prices from higher levels as expected earlier. Overall sentiment is bullish.
Domestic buyers reported active at current price levels. In Kota mandi, ‘loose Badami’ prices are
currently trading at Rs.5,800/-qtl and Eagle variety at Rs.6,200/-qtl.
At these price levels, prospective buyers may start accumulating. We expect that prices may not fall
further from current levels.
We expect Coriander prices to go up in coming days. Coriander Badami prices are expected to
gradually improve to a range of Rs.6,300 – Rs.6,600/- and Eagle variety is expected to increase to
Rs.6,600 – Rs.7,000/-qtl.

Spices-Monthly-Research-Report 05 April, 2019
Spot Prices Monthly Change
Coriander Spot Market Prices (Loose): (Rs/Qtl)
Grade (New) Centre 30-Mar-19 28-Feb-19 31-Mar-18 % Change Over Previous month
Badami
Guna (M.P.)
6000 5300 4400 13.21
Eagle 6400 5600 4700 14.29
Scooter 6800 5800 5200 17.24
Badami Neemuch
(M.P.)
6000 3800 4400 57.89
Eagle 6400 4800 4800 33.33
Scooter 7300 5400 NA 35.19
Eagle Kota (Raj.) Benchmark
market
6200 5300 4800 16.98
Eagle(Split) 6200 5300 4800 16.98
Badami 5800 5000 4500 16.00
Badami(Split) 5800 5000 4500 16.00
Eagle(Split)
Ramganj (Raj.)
6300 5100 4400 23.53
Eagle 6300 5100 4400 23.53
Badami 5700 4800 4100 18.75
Badami(Split) 5700 4800 4100 18.75
Scooter 7300 5600 5000 30.36
Eagle Baran (Raj.)
5800 5250 4450 10.48
Badami 5200 5100 4150 1.96
Eagle
Bhawani (Raj.)
5900 4100 4300 43.90
Badami 5700 3900 3900 46.15
Scooter 6200 4400 4400 40.91
Double Paroot NA NA NA -
Badami Gondal (Guj.)
5000 5000 3555 Unch
Eagle 5375 5250 4355 2.38
Coriander Price Outlook (weekly Chart, May Contract)
Candlesticks chart pattern reveals bullish sentiment in the market.RSI moving up in neutral zone in the market
indicates prices may go up in coming days. Volumes are supporting the prices.
Strategy: Buy S2 S1 PCP R1 R2
NCDEX May 6400 6500 7285 8400 8500
Monthly Trade Call Call Entry T1 T2 SL
May Buy Above 7200 8000 8200 6500

Spices-Monthly-Research-Report 05 April, 2019
JEERA (CUMIN SEED)
Spot Market Recap
Mixed sentiment witnessed in Jeera major domestic market during the period. No major
movement reported last week as mostly market closed due to closing financial year.
At higher prices buyers reported unresponsive in the spot market. Due to favorable weather
condition during maturity stage in Gujarat major Jeera growing regions expected good yield.
Jeera crop quality reported lower in Rajasthan. In Rajasthan mainly in Jaisalmer growing
regions Jeera crop quality reported lower by 10 – 15% due to heavy rainfall at the time of
maturity to harvesting stage and in some areas due to delayed sowing affected on yield.
Current year in Rajasthan, some new area has come up. Earlier various market sources
expected Jeera production in India current year will go up to 73 lakh to 75 lakh bags and now
they are decrease their estimate.
As per Final Gujarat state govt. data, Jeera progressive area of Rabi 2018-19 is 347,539
hectares as on 11-02-2019 which is lower than 382,677 hectares during corresponding
period last year. Till now 108.97% sowing completed from Normal area 318,926 hectares.
We expect Jeera NCDEX quality prices to trade in a range between Rs.16,200 – 16,500/-qtl
in coming days.
Monthly Jeera Arrival Scenario:
Market Current Month Last Month Previous Year % Change Over
Previous month 19-Mar 19-Feb 18-Mar
Unjha (Gujarat) 596,000 55,300 657,000 977.76
Rajkot (Gujarat) 62,150 19,435 54,230 219.78
Patan (Gujarat) 32,541 161 21,358 20111.80
Dhrol (Gujarat) 3782 205 8,801 1744.88
Gondal (Gujarat) 68,600 25,470 30,907 169.34
Jodhpur (Rajasthan) 18,660 855 55,300 2082.46
Merta City (Nagaur)(Raj.) 12,000 NA 52,000 -
Nagaur (Raj.) 8,000 NA 34,550 -
Anandpur Kalu (Raj.) NA NA 7950 -
Total 801,733 101,426 922,096 690.46
Units – Bags (1 bag = 55 kgs)
Increasing supply reported from last month as new crop supply slowly entered to the market.
However, Jeera arrivals were down by 13.1% during the current period compared to corresponding
period of last year due to delayed sowing by 15 – 20 days and stockists also holding back their stocks
on expectations of higher prices level in coming days. In Unjha benchmark market, Jeera supply
down by 9.3% from last year.
Jeera Arrivals Scenario
The above chart shows, Jeera supply in Unjha benchmark market. During March 2019 supply
reported up by 978% compared to previous month. During February Jeera supply reported lower as
new crop reported delay by 20 – 25 days due to late sowing as result of lower rainfall.

Spices-Monthly-Research-Report 05 April, 2019
Current year total Jeera supply from 1st January to 30
th March 2019, reported 37,483 mt as compared
to same period last 56,582 mt, down by 33.8%.
Last year total Jeera supply at Unjha benchmark market from January 2018 to 31st December 2018,
around 174,559 mt as compared to 140,975 mt in the corresponding period last year, up by 24%.
Jeera Price Scenario
In March 2019, Jeera monthly average prices reported at Rs.16,220/-qtl down by 4.8% from previous
month, due to increasing new crop supply continued to the market. Last year in spite of higher
production Jeera prices moving at higher levels due to good export demand.
We expect Jeera NCDEX quality prices (monthly average) likely to take support in the spot market
from lower price level.
Agriwatch Jeera Production Estimate 2019-20 (Second Advance)
As per Agriwatch second advance production estimate Jeera production for 2019-20 is estimated at
385,334 MT (around 70 lakh bags,{1 bag = 55 kgs}) compared to previous year’s 363,000 MT (66
lakh bags).
Spot Prices Monthly Change
Jeera(Cumin Seed) Spot Market Prices(Loose): (Rs/Qtl)
Grade Centre 30-Mar-19 28-Feb-19 31-Mar-18 % Change Over Previous month
Local Unjha (Guj.)
Benchmark market
14600 15100 14300 -3.31
NCDEX Quality 15800 16600 15300 -4.82
Poojari type /Machine Cut 17000 16600 17300 2.41
Local Rajkot (Guj.) 15000 15750 15050 -4.76
Local Patan (Guj.) 14525 14010 14380 3.68
Local Dhrol (Guj.) 14150 14450 12825 -2.08
Local Gondal (Guj.) 14750 16000 14205 -7.81
Local Jodhpur (Raj.) 15500 14200 14000 9.15
Local Merta City (Nagaur) (Raj.) 16500 NA* 17000 -
Local Nagaur (Raj.) 15500 NA* 14500 -
Local Anandpur Kalu (Raj.) 15000 15000 15000 Unch
Ganesh New Delhi
16300 16800 15500 -2.98
Poojari type / Machine Cut 17400 17800 16500 -2.25
* Seasonal mandi
Cumin Seed FOB Prices (Rs/Qtl)
Market Variety Current Month
(30-Mar-19) Last Month (28-Feb-19)
% Change Over Previous month
Unjha (Mundra Port) (Guj.)
1% Singapore 15050 15500 -2.90
2% Singapore 14800 15250 -2.95
1 % European 15550 16000 -2.81
2% European 15300 15750 -2.86

Spices-Monthly-Research-Report 05 April, 2019
Jeera (Cumin Seed) Technical Analysis (weekly Chart, May Contract)
Candlesticks chart pattern indicates bullish sentiment in the market. RSI moving up in neutral zone indicates prices may go up in the market. Volumes are supporting the prices. 1900
Strategy: Buy S2 S1 PCP R1 R2
NCDEX May 15500 15800 16280 16900 17000
Monthly Trade Call Call Entry T1 T2 SL
May Buy Above 16200 16600 16800 15800
BLACK PEPPER
Spot Market Recap
Mixed sentiment witnessed in Pepper market during the period.
As per market sources, Indian pepper prices remain low due to weak demand, especially in
the northern region of this country. This is the area with a lot of cheap smuggled pepper,
putting pressure on domestic pepper prices.
In India 2017-18, pepper production was at around 65,000 tons. Current year pepper
production may go down to 45,000 tons due to crop damaged.
Monthly Black Pepper Arrival Scenario
Market Current Month Last Month Previous Year % Change Over
Previous month 19-Mar 19-Feb 18-Mar
Kochi (Kerala) 719 801 337 -10.24
Total 719 801 337 -10.24
Unit – Ton
Black pepper supply reported up by 113.4% during the month compared to the corresponding period
of last year.
Current year, pepper supply reported from January to 30th March around 1,971 mt as compared to
last year same period 1,226 mt, up by 60.8%.
Last year Black pepper supply in Kochi market from January 2018 to December reported 3,814 tons
compared to 3,753 tons in the corresponding period previous year, up by 1.6%.

Spices-Monthly-Research-Report 05 April, 2019
Pepper supply reported up by 10.24% in Kochi spot market in March compared to last year same
period as stockists and planters were releasing their stocks.
Current marketing year starts from December 2018, prices were Rs.38,695/-qtl (Garbled) and
Rs.36,695/-qtl (Ungarbled) to in March 2019 Rs.34,647/-qtl (Garbled) and Rs.32,647/-qtl (Ungarbled)
due to higher availability of imported pepper at lower prices compared to Indian price.
We expect buyers likely to active from current lower price level due to lower current year production
as a result of crop damaged in Kerala and Karnataka.
International Scenario
Vietnam Pepper prices today in the Central Highlands and the South all fell by VND 500 in Gia Lai
and Binh Phuoc provinces. For the whole region, pepper prices range from 43,500 to 46,000 VND /
kg.
According to the General Department of Customs, pepper exports in the first half of March 2019
reached 17.7 thousand tons, worth USD 44.6 million, up 50.2% in volume and 2.4% in value
compared to first half of March 2018. From the beginning of the year to March 15, 2019, pepper
exports reached 53.4 thousand tons, worth USD 144.72 million, up 27.9% in volume, but down 8.9%
in value with the same period of 2018.
In the first half of March 2019, the average export price of pepper reached USD 2,512 / ton, down
31.8% compared to the first half of March 2018. Accumulated from the beginning of the year to the
middle of March 2019, the average export price of pepper reached 2,709 USD / ton, down 28.8%
compared to the same period in 2018.
Vietnam will end up exporting 70,000 mts of pepper by end of March and another 50.000 mts is
already committed by exporters mainly for 2 nd quarter of the year besides some quantities for 3 rd
and 4th quarter. According to General Department of Vietnam Customs data, by end of February,

Spices-Monthly-Research-Report 05 April, 2019
Vietnam exported 34,794 tons of pepper, including 31,253 tons of black pepper and 3,541 tons of
white pepper.
The International Pepper Community (IPC) said total global pepper production in 2019 is forecast at
4.9 million tons, down from 5.2 million tons in 2018.
Spot Prices Monthly Change
Black Pepper Spot Market Prices: (Rs/Qtl)
Grade Centre 30-Mar-19 28-Feb-19 31-Mar-18 % Change Over Previous month
Ungarbled Kochi (Ker.) Benchmark market
32900 32600 38300 0.92
Garbled 34900 34600 40300 0.87
Ungarbled Chikmagalur (Kar.) 29500 32500 37500 -9.23
Unpolished New Delhi
36000 38500 43500 -6.49
Number 11.5 NA NA NA -
Black Pepper FOB Prices (USD/MT)
Date (W-o-W)
Brazil ASTA 570
Kochi (India) ASTA
Lampung (Indonesia) ASTA 570
Kuching (Sarawak,
Malaysia) ASTA
Ho Chi Minh (Vietnam)
500g/l
Ho Chi Minh 550g/l
28/02/19 2250 4888 2604 3038 2025 2150
01/03/19 2250 - 2588 3037 2125 2275
12/03/19 2250 4957 2569 3030 2175 2275
21/03/19 2250 - 2596 3045 2200 2300
29/03/19 2250 5045 2570 3030 2175 2275 N.B. if anyone need daily prices please contact us. Here we mentioned February closing prices and March weekly prices.
Black Spot Price Outlook (Kochi, Garbled)
Candlestick chart formation indicates prices downward correction from higher levels in the market. Currently
black pepper (Garbled) prices are moving at Rs.34,900/-qtl. Initial support level is Rs.34,500/-qtl for short
term. RSI moving down in neutral zone indicates prices may go down in the market. We expect prices to
move in a range between Rs.34,500 – 36,000/-qtl. for next month.

Spices-Monthly-Research-Report 05 April, 2019
CARDAMOM
Spot Market Recap
Firm sentiment witnessed in small Cardamom market during the month.
Buyers reported active in the spot market as quality supply increased, buyers only active at
higher supply in the spot market.
In Kerala growing regions, current prevailing dry weather condition may affect coming crop.
Next season will start from August.
Exportable variety arrivals coming to the market. Lower production expectations likely to
support the prices in the spot market.
Cardamom buyers likely to active further as production expected lower.
Agriwatch estimate, for 2018 -19 productions likely to be around 24,000 – 26,000 MT as a
result of massive loss in heavy rainfall, in 2017-18 it was around 30,000 – 32,000 MT.
Monthly Cardamom Arrival Scenario:
Market Current Month Last Month Previous Year % Change Over
Previous month 19-Mar 19-Feb 18-Mar
Kerala (Kochi) Benchmark market
16,49,167 18,34,949 9,84,251 -10.12
Total 16,49,167 18,34,949 9,84,251 -10.12
Unit - Kgs
Cardamom arrivals reported up by 67.6% during the period from corresponding period of last year as
planters were releasing their stocks at higher prices level. Fifth round picking activity started in Kerala
growing regions.
The current season, officially began from August 1. From 1st Aug to 30th March arrivals reported
15,883 tons and sales 15,474 tons.
Last season total arrivals reported up to 30th July 2018 were at 16,760 tons and the sales were at
16,321 tons.
Current year (2018-19 marketing year) increasing arrivals reported owing to arrival of new crop
supply at the market and planters were releasing their old stocks as Cardamom price reported higher
from last year due to crop damaged.
Due to crop damage in Kerala Cardamom production likely to go down by 20 - 25%. Cardamom
supply slowly decreases in the spot market as picking activity come to an end.

Spices-Monthly-Research-Report 05 April, 2019
Current year 2018-19, Cardamom average prices reported all time high (March monthly average) at
Rs.1,472/-kgs which is up by around 54% from corresponding period last year due to crop damage in
Kerala as a result of heavy rainfall and expects lower rainfall.
All India Cardamom average prices in coming days likely to move in a range between
Rs.1,400– 1,500/-kg.
Prices Monthly Change
Cardamom Spot Market Prices: (Rs/Kg)
Auction Price 30-Mar-19 28-Feb-19 31-Mar-18 % Change Over Previous month
Vandanmedu, Thekkady,Kochi, Kumily, Nedumkandam, Santhanpara &
Bodinayakanur
Max price 1873 1724 1256 8.64
Avg. Price 1643 1399 960 17.44
New Delhi
Medium 1525 1425 900 7.02
6.5 (Bold) 1550 1425 950 8.77
7 (Bold) 1700 1575 1025 7.94
7.5 (Bold) 1800 1675 1125 7.46
8 (Bold) 1925 1825 1375 5.48
Large Cardamom Spot Market Prices: (Rs/Kg)
Center Type 30-Mar-19 28-Feb-19 31-Mar-18 Change
Singtam, Sikkim Badadana NA NA 590 -
Singtam Chotadana NA NA 538 -
Gangtok,Sikkim Badadana NA NA 575 -
Gangtok Chotadana NA NA 525 -
Siliguri, West Bengal Badadana NA NA 775 -
Siliguri Chotadana NA NA 575 -
Spices-Monthly-Research-Report 05 April, 2019
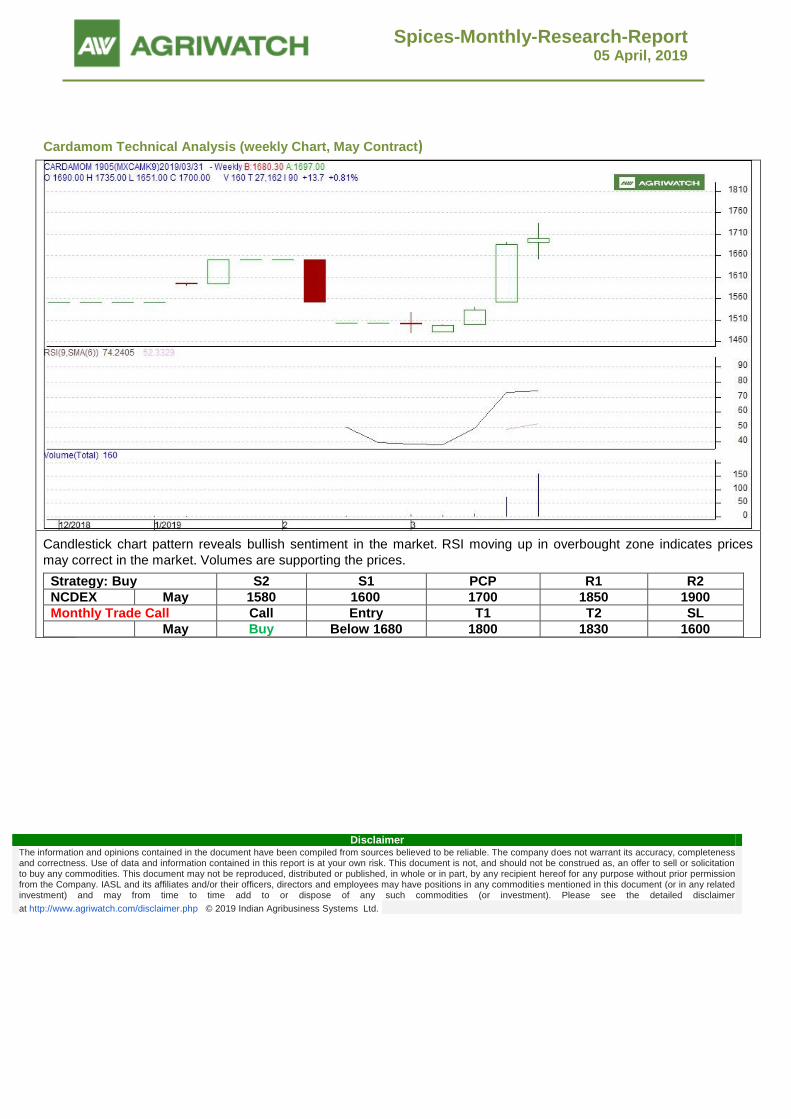
Cardamom Technical Analysis (weekly Chart, May Contract)
Candlestick chart pattern reveals bullish sentiment in the market. RSI moving up in overbought zone indicates prices
may correct in the market. Volumes are supporting the prices.
Strategy: Buy S2 S1 PCP R1 R2
NCDEX May 1580 1600 1700 1850 1900
Monthly Trade Call Call Entry T1 T2 SL
May Buy Below 1680 1800 1830 1600
Disclaimer The information and opinions contained in the document have been compiled from sources believed to be reliable. The company does not warrant its accuracy, completeness and correctness. Use of data and information contained in this report is at your own risk. This document is not, and should not be construed as, an offer to sell or solicitation to buy any commodities. This document may not be reproduced, distributed or published, in whole or in part, by any recipient hereof for any purpose without prior permission from the Company. IASL and its affiliates and/or their officers, directors and employees may have positions in any commodities mentioned in this document (or in any related investment) and may from time to time add to or dispose of any such commodities (or investment). Please see the detailed disclaimer
at http://www.agriwatch.com/disclaimer.php © 2019 Indian Agribusiness Systems Ltd.