
Speed to Market for Innovative Products: Blessing or Curse?
15
Speed to Market for Innovative Products: Blessing or Curse?* Michael A. Stanko, Francisco-Jose Molina-Castillo, and Jose-Luis Munuera-Aleman The relationships among speed to market, quality, and costs are important to managers as they attempt to best establish incentives and set goals for new product development teams, allocate resources for new product development, or create positional advantage in the market. The existing literature suggests that the economic consequences of being late to the market are significant, including higher development and manufacturing costs, lower profit margins, and lessening of the firm’s market value. Therefore, traditional logic has held that new product development managers need to manage the trade-offs among speed to market, quality, and costs. While both scholars and managers have often acquiesced to performance trade-offs among “faster, better, and cheaper,” this research attempts to improve understanding of the interrelationships between these objectives, and ultimately profit. Based on a survey of 197 managers, faster speed to market is shown to be related to better quality and lower costs; it is not necessary to sacrifice one of these outcomes. Further, the moderating roles of two dimensions of innovativeness (innovativeness to the firm and to the market) are examined on the relationships between speed and quality, as well as speed and profit. Both dimensions of innovative- ness positively moderate the relationship between speed to market and quality. For more innovative products (both to the firm and the market), there is a stronger positive relationship between speed and quality than for less innovative products. Further, innovativeness to the firm negatively moderates the relationship between speed and profit. Thus, speed has a less positive impact on profit for highly innovative-to-the-firm products compared with less innovative-to- the-firm products. By being conscious of the projects’ levels of innovativeness (along with prioritizing various performance measures), managers can more rationally decide when to emphasize speed to market based on this study’s findings. Introduction T he success of new product development efforts is judged by a variety of interrelated internal out- comes such as development team performance (Montoya, Massey, Hung, and Crisp, 2009) or project survival rates (Schmidt, Sarangee, and Montoya, 2009), and externally focused outcomes such as customer accep- tance (Klink and Athaide, 2010) or sales from new prod- ucts (Bremser and Barsky, 2004). This research examines the relationships among speed to market, quality, costs, and profitability (Langerak, Hultink, and Griffin, 2008). The relationships among these outcomes are important to managers as they attempt to best establish incentives and set goals for new product development teams (Swink, 2003), allocate resources for new product development (Griffin, 2002), or create positional advantage in the market (Carbonell and Rodriguez, 2006). The existing literature suggests that the economic consequences of being late to the market are significant, including higher development and manufacturing costs, lower profit margins, and lessening of the firm’s market value (Hen- dricks and Singhal, 1997). However, the line of reasoning that firms should always speed new products to market is not without controversy (Bayus, 1997; Langerak, Griffin, and Hultink, 2010). While both scholars and mana- gers have often acquiesced to performance trade-offs among “faster, better, and cheaper” (Swink, Talluri, and Pandejpong, 2006), this research attempts to improve understanding of the interrelationships between these objectives, and ultimately profit. Several researchers have addressed the question of how to develop products more quickly (Chen, Damampour, and Reilly, 2010; Cooper and Kleinschmidt, 1994; Kessler and Chakra- barti, 1999), but the relationships among speed, quality, and costs require further attention (Chen, Reilly, and Lynn, 2005). Speed to market is prized by managers as one of the hallmarks of well-managed new product development (NPD) teams. Here, the traditionally held notion that there must be trade-offs made among speed to market, quality, Address correspondence to: Francisco-Jose Molina-Castillo, Depart- ment of Marketing, University of Murcia, Campus de Espinardo, 30100 Murcia, Spain. E-mail: [email protected]. Tel: 34 868887826. *We acknowledge the funding received from the Education and Science Ministry (research project SEJ2006-08854/ECON), Fundacion Cajamurcia and the Seneca Foundation—Science and Technology Agency from the Region of Murcia (research project 03119/PHCS/05) to undertake this research. The authors are grateful to Erik Jan Hultink for his valuable comments and suggestions, and to the editor of JPIM and anonymous reviewers for their help in improving this article. J PROD INNOV MANAG 2012;29(5):751–765 © 2012 Product Development & Management Association DOI: 10.1111/j.1540-5885.2012.00943.x
Transcript of Speed to Market for Innovative Products: Blessing or Curse?
Speed to Market for Innovative Products: Blessing or Curse?*Michael A. Stanko, Francisco-Jose Molina-Castillo, and Jose-Luis Munuera-Aleman
The relationships among speed to market, quality, and costs are important to managers as they attempt to best establishincentives and set goals for new product development teams, allocate resources for new product development, or createpositional advantage in the market. The existing literature suggests that the economic consequences of being late to themarket are significant, including higher development and manufacturing costs, lower profit margins, and lessening ofthe firm’s market value. Therefore, traditional logic has held that new product development managers need to managethe trade-offs among speed to market, quality, and costs. While both scholars and managers have often acquiesced toperformance trade-offs among “faster, better, and cheaper,” this research attempts to improve understanding of theinterrelationships between these objectives, and ultimately profit. Based on a survey of 197 managers, faster speed tomarket is shown to be related to better quality and lower costs; it is not necessary to sacrifice one of these outcomes.Further, the moderating roles of two dimensions of innovativeness (innovativeness to the firm and to the market) areexamined on the relationships between speed and quality, as well as speed and profit. Both dimensions of innovative-ness positively moderate the relationship between speed to market and quality. For more innovative products (both tothe firm and the market), there is a stronger positive relationship between speed and quality than for less innovativeproducts. Further, innovativeness to the firm negatively moderates the relationship between speed and profit. Thus,speed has a less positive impact on profit for highly innovative-to-the-firm products compared with less innovative-to-the-firm products. By being conscious of the projects’ levels of innovativeness (along with prioritizing variousperformance measures), managers can more rationally decide when to emphasize speed to market based on this study’sfindings.
Introduction
T he success of new product development efforts isjudged by a variety of interrelated internal out-comes such as development team performance
(Montoya, Massey, Hung, and Crisp, 2009) or projectsurvival rates (Schmidt, Sarangee, and Montoya, 2009),and externally focused outcomes such as customer accep-tance (Klink and Athaide, 2010) or sales from new prod-ucts (Bremser and Barsky, 2004). This research examinesthe relationships among speed to market, quality, costs,and profitability (Langerak, Hultink, and Griffin, 2008).The relationships among these outcomes are important tomanagers as they attempt to best establish incentives andset goals for new product development teams (Swink,2003), allocate resources for new product development
(Griffin, 2002), or create positional advantage in themarket (Carbonell and Rodriguez, 2006). The existingliterature suggests that the economic consequences ofbeing late to the market are significant, including higherdevelopment and manufacturing costs, lower profitmargins, and lessening of the firm’s market value (Hen-dricks and Singhal, 1997). However, the line of reasoningthat firms should always speed new products to market isnot without controversy (Bayus, 1997; Langerak, Griffin,and Hultink, 2010). While both scholars and mana-gers have often acquiesced to performance trade-offsamong “faster, better, and cheaper” (Swink, Talluri, andPandejpong, 2006), this research attempts to improveunderstanding of the interrelationships between theseobjectives, and ultimately profit. Several researchershave addressed the question of how to develop productsmore quickly (Chen, Damampour, and Reilly, 2010;Cooper and Kleinschmidt, 1994; Kessler and Chakra-barti, 1999), but the relationships among speed, quality,and costs require further attention (Chen, Reilly, andLynn, 2005).
Speed to market is prized by managers as one of thehallmarks of well-managed new product development(NPD) teams. Here, the traditionally held notion that theremust be trade-offs made among speed to market, quality,
Address correspondence to: Francisco-Jose Molina-Castillo, Depart-ment of Marketing, University of Murcia, Campus de Espinardo, 30100Murcia, Spain. E-mail: [email protected]. Tel: 34 868887826.
*We acknowledge the funding received from the Education and ScienceMinistry (research project SEJ2006-08854/ECON), Fundacion Cajamurciaand the Seneca Foundation—Science and Technology Agency from theRegion of Murcia (research project 03119/PHCS/05) to undertake thisresearch. The authors are grateful to Erik Jan Hultink for his valuablecomments and suggestions, and to the editor of JPIM and anonymousreviewers for their help in improving this article.
J PROD INNOV MANAG 2012;29(5):751–765© 2012 Product Development & Management AssociationDOI: 10.1111/j.1540-5885.2012.00943.x
and costs is challenged. Researchers have shown bothpositive and negative outcomes from speed to market.Some have argued that speed can lead to cost overruns asresources may be reallocated (Mansfield, 1988), keyinformation-gathering activities may be omitted (Cooperand Kleinschmidt, 1994), and quality can suffer withincreased haste (Chen et al., 2005; Sethi, 2000). On thecontrary, other scholars have found that speed keeps costsin check (Langerak and Hultink, 2005), is associated withhigh-quality products (Kessler and Bierly, 2002; Lukasand Menon, 2004), and is imperative to ensuring longersales cycles, early entrant advantages, and overall profit-ability (Chen et al., 2005; Kessler and Bierly, 2002). Here,speed to market is thought to lead to higher quality andlower costs, meaning that all three of these goals (speed,low costs, and quality) can be obtained simultaneously.
This research also examines the roles of innovative-ness to the firm as well as innovativeness to the market indetermining the interrelationships among the three newproduct development outcomes. Examining these twodistinct dimensions may also prove necessary to under-standing the relationships among speed to market,quality, and costs. Innovativeness to the firm may alter theprofit impact of long development cycles since new capa-bilities must be developed for this type of project (Chenet al., 2005). Similarly, innovativeness to the market mayaffect the role of speed in determining quality and prof-itability due to higher levels of uncertainty in these devel-
opment efforts (Calantone, Chan, and Cui, 2006).Langerak and Hultink (2006) have shown that innovative-ness moderates the relationship between speed and newproduct profitability. However, because these researchersrelied on a single dimension of innovativeness, the poten-tially differing impacts of both dimensions of innovative-ness are yet to be examined. Thus, the recommendationsof Henard and Szymanski (2001) are followed by inves-tigating the contextual role of innovativeness on newproduct success determinants. More specifically, thisresearch analyzes whether these two dimensions of inno-vativeness moderate the set of relationships among speed,quality, and costs. This study intends to add depth to thebulk of studies that have shaped this discussion, thus farexamining only a single dimension of innovativeness(Allocca and Kessler, 2006; Calantone et al., 2006; Choand Pucik, 2005).
The balance of this study is organized as follows.First, the conceptual background and hypotheses are pre-sented. Following this, the research methods employed totest the hypotheses are described. Finally, the article con-cludes with a discussion of the findings and managerialimplications, as well as the limitations of this research.
Conceptual Background
Different terms such as time-to-market (Chen et al., 2005),cycle time (Ittner and Larcker, 1997), innovation speed(Kessler and Chakrabarti, 1996), and speed to market(Meyer and Utterback, 1995) have been used to refer to thepace of new product development. This research focuseson speed to market, which is defined as “the pace ofactivities between idea conception and product implemen-tation” (Menon, Chowdhury, and Lukas, 2002).
As noted by Kessler and Bierly (2002), and Chen et al.(2005), most studies on speed to market focus on itsantecedents. The smaller number of studies focused onthe impact of speed on performance outcomes (such asquality and profit) have not been consistent in their find-ings, with studies finding positive, negative, and nonsig-nificant relationships (Table 1).
Recent innovativeness research demonstrates the needto distinguish between innovativeness to the firm andinnovativeness to the market when examining the newproduct performance implications of market orientation(Atuahene-Gima, 1995), preannouncement strategy (Leeand O’Connor, 2003), and cross-functional integration(Song and Montoya-Weiss, 2001). These two dimensionsof innovativeness also seem critical to understanding theproposed relationships among speed to market, costs,quality, and profitability. Innovativeness to the firm is
BIOGRAPHICAL SKETCHES
Dr. Michael A. Stanko is an assistant professor of marketing at theJenkins Graduate School of Management at North Carolina State Uni-versity. His research interests include new product development (spe-cifically innovation outside traditional firm boundaries) as well asbusiness-to-business marketing. He has published previously in Journalof Product Innovation Management, R&D Management, and IndustrialMarketing Management.
Dr. Francisco-Jose Molina-Castillo is an assistant professor of market-ing at the Faculty of Management at University of Murcia. His researchinterests include new product launch activities as well as electronicmarketing. He has been a visiting professor at Delft University (2005)and Michigan State University (2008). Since 2008, he has been thesecretary of the Spanish Marketing Association (AEMARK). He haspublished previously in Journal of Product Innovation Management,Industrial Marketing Management, Technovation, and Information &Management.
Dr. Jose-Luis Munuera-Aleman is Professor of Marketing at the Facultyof Management at University of Murcia (Spain). He has been a VisitingProfessor at the University of Texas in Austin (2002). His work has beenpublished in Industrial Marketing Management, Journal of BusinessResearch, Marketing Letters, Journal of Advertising, and in EuropeanJournal of Marketing.
752 J PROD INNOV MANAG M. A. STANKO ET AL.2012;29(5):751–765

“the degree of similarity between the new product andthose already marketed by the firm” (Atuahene-Gima,1995, p. 279), whereas innovativeness to the marketrefers to “the extent to which the new product is compat-ible with the experiences and consumption patterns ofpotential customers” (Atuahene-Gima, 1995, p. 278). It isimportant to be clear that in this research, new productsare independently assessed on both these dimensionsrather than classifying projects as belonging to particularproduct strategies (Griffin and Page, 1996).
New product costs include all costs associated with thedevelopment effort, from the idea stage through launch(Langerak et al., 2010). New product quality is defined asthe degree to which a product satisfies customer require-ments (Kessler and Bierly, 2002). New product profitabil-ity concerns the extent to which the new product meetsmarket-based performance objectives (Lee and O’Connor,2003).
Hypothesis Development
Speed and Costs
Arguments can be made to support the existence of eithera positive or negative relationship between speed tomarket and costs. Speed can potentially lead to cost dis-advantages by forcing an early commitment to first-generation technology (Golder and Tellis, 1993), and byrequiring greater resource allocation in order to achievethe desired speed to market (Mansfield, 1988). Generallythough, reduced time to market (high speed to market) isthought to be associated with lowered costs. Getting
products to market quickly allows firms to reduce coststhrough experience effects (Kessler and Chakrabarti,1996), as well as building economies of scale beforecompetitors (Rosenau, 1990). Also, a shorter develop-ment cycle leads to less rework and fewer man-hours indevelopment (Rust, Moorman, and Dickson, 2002). Thus,speed places a limit on possible man-hours and overhead(i.e., fixed costs) allocated to the development project(Langerak and Hultink, 2005).
H1: Speed to market is negatively related to new productcosts.
Speed and Quality
Again, there are possible arguments for both positive andnegative impacts of speed to market on quality. Too muchemphasis on speed to market may result in developersfailing to consider all possible technology options due totime pressure, thus potentially reducing the quality of theend product (Sethi, 2000) and raising the level of organi-zational stress (Lukas, Menon, and Bell, 2002). Further,development teams may have to reduce performancetargets in order to meet development deadlines (Chenet al., 2005), and are likely to place less emphasis ontesting and quality assurance due to increased time pres-sure (Crawford, 1992).
On the other hand, getting products to market quicklyallows for the inclusion of the most up-to-date compo-nents possible from technology vendors, meaning thatproducts will be more current, and thus be perceived asbeing of higher quality (Kessler and Bierly, 2002). Also,having a shorter development cycle allows for more
Table 1. Studies Relating Speed to Market, Profitability, and Quality
Positive RelationshipNegative
RelationshipInverse U-shaped
Relationship Lack of Relationship
Impact of speedto market onprofitability
Ali, Krapfel, and LaBahn (1995)Baum and Wally (2003)Calantone, Garcia, and Dröge (2003)Carbonell and Rodriguez (2006)Chen et al. (2005)Cohen, Eliashberg, and Ho (1996)Cooper and Kleinschmidt (1994)Gupta and Souder (1998)Hendricks and Singhal (1997)Kessler and Bierly (2002)Langerak and Hultink (2005)Lynn, Skov, and Abel (1999)
Langerak andHultink (2006)
Davis, Dibrell, and Janz (2002)Droge, Jayaram, and Vickery
(2004)Griffin (2002)Ittner and Larcker (1997)Meyer and Utterback (1995)
Impact of speedto market onquality
Kessler and Bierly (2002) Crawford (1992)Karau and Kelly (1992)Chen et al. (2005)Sethi (2000)
Lukas and Menon (2004)
SPEED TO MARKET FOR INNOVATIVE PRODUCTS J PROD INNOV MANAG 7532012;29(5):751–765
recent customer feedback to be considered, allowing forgreater customer responsiveness and adding to custom-ers’ perceptions of quality (Brucks, Zeithaml, and Naylor,2000). Thus, it is argued that companies with short newproduct development cycles are likely to produce high-quality products. Conversely, allowing too much slack ina development schedule can lead to a lack of focus andlessened discipline in the development effort, leading to alower quality product being developed (Lukas andMenon, 2004; Nohria and Gulati, 1996).
H2: Speed to market is positively related to new productquality.
Longer development cycles typically involve fewerdedicated resources (Chen et al., 2010). Generally, man-agers cannot allocate resources to a single project forlengthy periods of time and are forced to assign develop-ers across multiple projects. For lengthy new-to-the-firmdevelopment projects, this lack of dedicated resourcescan be of serious detriment to quality (Lukas and Menon,2004). When team members are shuttled betweenprojects, this will result in increased time spent forgettingand relearning, compromising quality (Rust et al., 2002).For innovative-to-the-firm projects, learning is even morecritical as employees likely possess little experience inrelevant development activities, and the developmentprocess as a whole may differ substantially from pastprojects (Gatignon, Tushman, Smith, and Anderson,2002). Extending this type of uncertain project increasesthe chances that employees cannot be dedicated to theproject and will result in quality concerns as employeesstruggle to develop new skillsets while being shuttled inand out of various projects (Hoegl, Weinkauf, andGemuenden, 2004; Zirger and Hartley, 1996). Con-versely, for more routine (i.e., not new to the firm) devel-opment efforts, quality is harmed less by longer projectdurations, since employees can likely be shuttled betweenprojects without a great deal of relearning due to theprojects’ similarity.
Aside from the allocation of developers acrossprojects, innovative-to-the-firm projects will be morelikely to have changing scopes as the project time lineextends. The firm’s inexperience managing similarprojects makes it more likely that the original projectscope will need to be expanded or shifted in focus. Asthe scope of this type of project changes over a (length-ening) development cycle, quality will be negativelyimpacted to an even greater degree. Product conceptswhich change over time can result in greaterconflict—particularly under the heightened uncertaintyand complexity of this type of innovative development
project—which further encroaches on quality (Chenet al., 2010; Swink, 2003).
H3: The positive relationship between speed to marketand new product quality is stronger for products that arehighly innovative to the firm.
For new-to-the-market products, speed to market playsan even larger role in determining quality as it allowsfirms to include the latest components from vendors(Kessler and Chakrabarti, 1996). This is of increasedimportance as this type of substantial innovation may bepart of a larger cluster of innovations—from suppliersand customers as well. Especially in a climate of substan-tial innovative change (Gatignon et al., 2002), newlydeveloped products will be viewed as being of superiorquality when competitive offerings are unable to makeuse of these recently developed components (Cho andPucik, 2005). Speed to market also ensures that a newproduct contains the most recent market ideas and tech-nological advances compared with competing products(Atuahene-Gima, 2003), and will be perceived by cus-tomers as being more current than competitors (Lee andO’Connor, 2003).
Customers are more likely to view this type of new-to-the-market product as being of superior quality if itreaches the market before competitors. Conversely,slower development for substantial innovations to themarket may lead to customers being less impressed withthe quality (i.e., the degree to which a product satisfiescustomer requirements) if competitive offerings havealready emerged with similar functionality.
H4: The positive relationship between speed to marketand new product quality is stronger for products that arehighly innovative to the market.
Speed and Profit
Being the first to market allows firms to establish industrystandards and set pricing expectations, thus achievingincreased margins, customer loyalty, strong marketplacepositioning, and a reputation as a leader (Calantone et al.,2003; Carbonell and Rodriguez, 2006; Kessler andBierly, 2002; Lieberman and Montgomery, 1988).Reduced speed to market allows for an extended period ofproduct sales, and time to develop efficiencies in manu-facturing (Chen et al., 2005; Lynn et al., 1999). Reducingspeed to market also aids profitability by reducing over-head, as well as lowering necessary inventory levels(Langerak and Hultink, 2005). Further, Moorman andMiner (1998) show that reducing cycle time allows firmsto learn more quickly than competitors, since reduced
754 J PROD INNOV MANAG M. A. STANKO ET AL.2012;29(5):751–765
cycle time may allow more opportunities to conduct theentire business cycle associated with development. Con-versely, products that are late to market have been shownto have substantially lower profits (Carbonell and Rod-riguez, 2006). Even superior products can only rarelyovercome the damage to profitability brought by productdelays (Menon et al., 2002). Beyond damage to profit-ability, product launch delay has also been shown tosignificantly decrease the market value of the firm (Hen-dricks and Singhal, 1997).
H5: Speed to market is positively related to new productprofitability.
New product development efforts that are highly inno-vative to the firm face heightened levels of uncertainty(Danneels and Kleinschmidt, 2001), meaning that effortsto speed products to market may result in developmentproblems (Bayus, 1997). This type of new-to-the-firminnovation requires greater experimentation and morenumerous iterations in development (Kessler and Chakra-barti, 1999). Rushing through this type of innovativedevelopment process can result in developing less com-petitive new products (Cho and Pucik, 2005). As shownby Kessler and Bierly (2002), speed has a stronger rela-tionship with financial performance when the technologyinvolved in the development effort is well understoodinternally. When the technology is well understood, prod-ucts can be developed quickly with diminished risk. Con-versely, speed is of less value when the technology is notwell understood—too much emphasis on speed in anuncertain development effort is likely to result in com-mercial failure. Attempting to innovate quickly in new-to-the-firm areas can also lead the organization awayfrom its core competencies (Gatignon et al., 2002),leading to poor execution, negative customer response,and ultimately less profitable innovation (Simpson,Siguaw, and Enz, 2006).
H6: The positive relationship between speed to marketand new product profitability is weaker for products thatare highly innovative to the firm.
Projects that are innovative to the market will poten-tially reap greater gains from launching before competi-tors (Danneels and Kleinschmidt, 2001). This means thatthe faster a product considered innovative to customersgets to market, the greater its financial benefits whencompared with later entering competitors (Liebermanand Montgomery, 1988). Early entrants with this type ofnew-to-market product should be able to establish pricingexpectations since consumers have not yet establishedreference prices for similar products. Also, by entering
before competitors, it is easier to gain market share,create customer loyalty, and establish channels of distri-bution (Ali et al., 1995). Allocca and Kessler (2006)found that for small and medium-sized companies, thereis a stronger relationship between speed and sales successfor more innovative products. Similarly, Tatikonda andMontoya-Weiss (2001) show that speed to market enablesfirms to keep in close touch with customers and beresponsive to their needs. Thus, firms reaching the marketfirst with innovative new products are rewarded withincreased sales (Carbonell and Rodriguez, 2006).
Conversely, for those projects that are not innovative tothe market, the benefits of speed to market are decidedlyreduced. Without potential early entrant advantages(setting industry standards, establishing customer loyalty,price premiums, etc.), there is less potential financialupside to speeding products to market. In this case, firmsstill benefit from having their products on the marketlonger, but the financial benefits of speed to market aredramatically reduced.
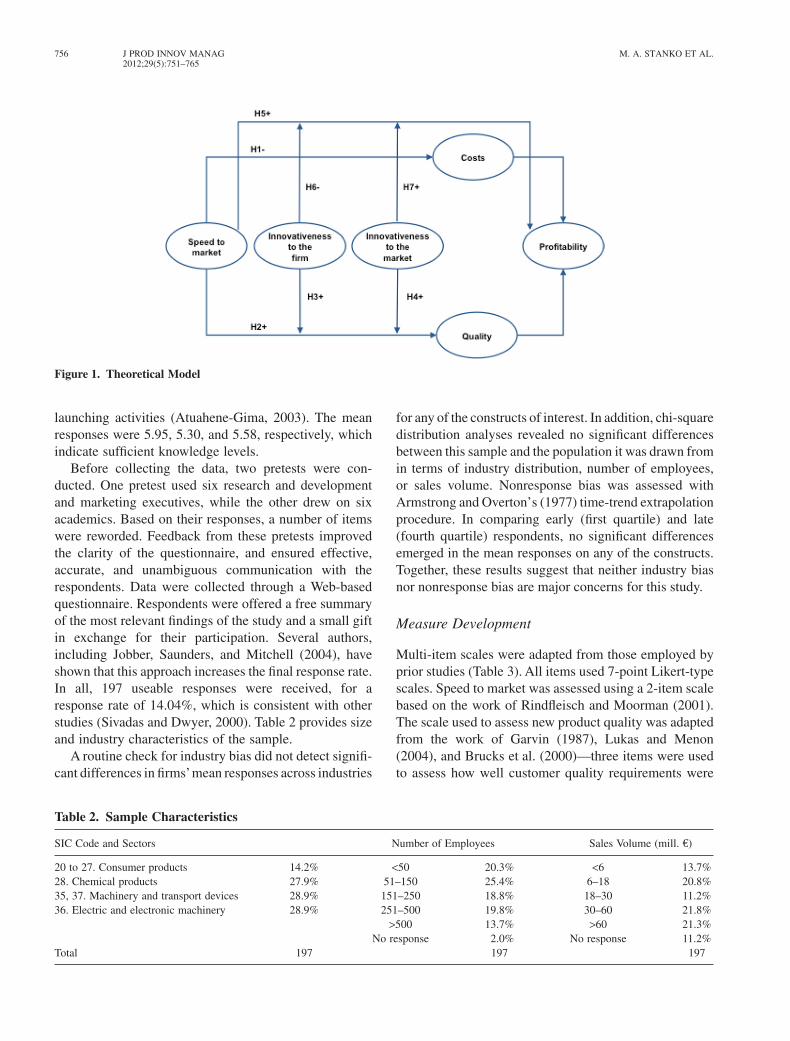
H7: The positive relationship between speed to marketand new product profitability is stronger for productsthat are highly innovative to the market (Figure 1).
Methodology
Data Collection and Sampling Issues
Data were collected using a cross-sectional survey meth-odology. The initial sampling frame included 1403 inno-vative Spanish firms operating in different sectors:consumer products, chemical products, machinery andtransport devices, and electric and electronic machinery.To be eligible, firms had to meet two criteria. First, thefirm must have developed and launched a new product inthe last three years (Lee and O’Connor, 2003). Also, theproduct must have been on the market for at least 12months to ensure that sufficient time had elapsed to beable to evaluate the product and its performance(Langerak et al., 2008).
Data were obtained through a key informant tech-nique, which is consistent with prior studies (Calantoneet al., 2003). The informants had input into innovationactivities and were familiar with the overall strategies intheir organization. Nevertheless, their familiarity with thesubject matter was assessed through the data collectioninstrument. Thus, to assess the suitability of the infor-mants, respondents used a 7-point Likert-type scale toindicate their degree of knowledge (1 = “very limitedknowledge,” 7 = “very substantial knowledge”) about thenew product, the new product development process, and
SPEED TO MARKET FOR INNOVATIVE PRODUCTS J PROD INNOV MANAG 7552012;29(5):751–765
launching activities (Atuahene-Gima, 2003). The meanresponses were 5.95, 5.30, and 5.58, respectively, whichindicate sufficient knowledge levels.
Before collecting the data, two pretests were con-ducted. One pretest used six research and developmentand marketing executives, while the other drew on sixacademics. Based on their responses, a number of itemswere reworded. Feedback from these pretests improvedthe clarity of the questionnaire, and ensured effective,accurate, and unambiguous communication with therespondents. Data were collected through a Web-basedquestionnaire. Respondents were offered a free summaryof the most relevant findings of the study and a small giftin exchange for their participation. Several authors,including Jobber, Saunders, and Mitchell (2004), haveshown that this approach increases the final response rate.In all, 197 useable responses were received, for aresponse rate of 14.04%, which is consistent with otherstudies (Sivadas and Dwyer, 2000). Table 2 provides sizeand industry characteristics of the sample.
A routine check for industry bias did not detect signifi-cant differences in firms’mean responses across industries
for any of the constructs of interest. In addition, chi-squaredistribution analyses revealed no significant differencesbetween this sample and the population it was drawn fromin terms of industry distribution, number of employees,or sales volume. Nonresponse bias was assessed withArmstrong and Overton’s (1977) time-trend extrapolationprocedure. In comparing early (first quartile) and late(fourth quartile) respondents, no significant differencesemerged in the mean responses on any of the constructs.Together, these results suggest that neither industry biasnor nonresponse bias are major concerns for this study.
Measure Development
Multi-item scales were adapted from those employed byprior studies (Table 3). All items used 7-point Likert-typescales. Speed to market was assessed using a 2-item scalebased on the work of Rindfleisch and Moorman (2001).The scale used to assess new product quality was adaptedfrom the work of Garvin (1987), Lukas and Menon(2004), and Brucks et al. (2000)—three items were usedto assess how well customer quality requirements were
Figure 1. Theoretical Model
Table 2. Sample Characteristics
SIC Code and Sectors Number of Employees Sales Volume (mill. €)
20 to 27. Consumer products 14.2% <50 20.3% <6 13.7%28. Chemical products 27.9% 51–150 25.4% 6–18 20.8%35, 37. Machinery and transport devices 28.9% 151–250 18.8% 18–30 11.2%36. Electric and electronic machinery 28.9% 251–500 19.8% 30–60 21.8%
>500 13.7% >60 21.3%No response 2.0% No response 11.2%
Total 197 197 197
756 J PROD INNOV MANAG M. A. STANKO ET AL.2012;29(5):751–765
met. New product costs are assessed using a three-itemmeasure adapted from the work of Langerak and Hultink(2006), and Storey and Easingwood (1999). Both dimen-sions of innovativeness (to the firm and to the market)were assessed using separate three-item measures adaptedfrom Danneels and Kleinschmidt (2001), and Calantone
et al. (2006). Finally, new product profitability was mea-sured using three items adapted from recent studies(Calantone et al., 2006; Huang, Soutar, and Brown, 2004).
Common Method Variance
Most researchers agree that common method variance isa potentially serious biasing threat in behavioral research.Several procedures were employed to empiricallyexamine the possibility that common method bias threat-ens interpretation of these results: (1) the Harman one-factor test; (2) a confirmatory factor-analytic approach toHarman’s one-factor test; and (3) the single methodfactor approach.
The rationale for the first test is that if commonmethod bias poses a serious threat to the analysis andinterpretation of the data, a single latent factor wouldaccount for all manifest variables, or one general factorwill account for the majority of the covariance among themeasures. Principal components analysis revealed severalfactors in the unrotated factor solution. However, as sug-gested by Podsakoff, Mackenzie, Lee, and Podsakoff(2003), this is considered a weak test. More recently,some researchers using this technique have used confir-matory factor analysis (CFA) as a more sophisticated test.A worse fit for the one-factor model would suggest thatcommon method variance does not pose a serious threat.The one-factor model yielded a c2 = 1832.71 with 119degrees of freedom (compared with the c2 = 171.83 with104 degrees of freedom for the measurement model). Thefit is considerably worse for the unidimensional modelthan for the measurement model, suggesting thatcommon method bias is not a serious threat in the study.
However, there are several limitations of the previousprocedure. Therefore, additional statistical remedies arerecommended for this purpose. One of these approachesis the use of latent variable models (Podsakoff et al.,2003). This method involves adding a first-order factorwith all of the measures as indicators to the measurementmodel. The single method factor approach yielded ac2 = 1832.70 with 98 degrees of freedom (compared withthe c2 = 171.83 with 104 degrees of freedom for the mea-surement model). The fit is considerably worse for thesingle method factor approach than for the measurementmodel, suggesting that common method bias is not aserious threat in the study. Overall, common method biasdoes not threaten the interpretation of these results.
Measurement Model
CFA was conducted using LISREL 8.8 to determine thevalidity and reliability of our measures. As can be
Table 3. Measurement Model: Constructs, Items,Loadings, and Reliability Estimates
#Construct Construct, items SCR Standardized l
1 Speed to market .80The new product development
team used time efficiently.88
The new product was launchedon time
.73
2 Innovativeness to the firm .87It was technologically complex
for the firm to develop thisproduct
.84
A new-to-the-firm technologywas used to develop the newproduct
.84
The new product developmentprocess was large andcomplicated
.78
3 Innovativeness to the market .87The product includes
improvements over existingtechnologies
.83
It is based on a revolutionarychange of technology for themarket
.82
It is a radical advance overexisting products in themarket
.82
4 New product costs .90New product development costs
were more than the estimatedbudget
.80
New product launch costs weremore than the estimatedbudget
.83
The new product developmentteam was not cost-effective
.93
5 New product quality .80Product reliability was better
than competitors.67
The product has performed as itwas supposed to
.86
The product met qualitystandards
.70
6 New product profitability .95Sales objectives .94Growth objectives .94Market share objectives .91
Notes: c2(104) = 171.83, comparative fit index = .98, root mean squareerror of approximation (RMSEA) = .05, RMSEA RANGE = (.04–.06).SCR, scale compose reliability.
SPEED TO MARKET FOR INNOVATIVE PRODUCTS J PROD INNOV MANAG 7572012;29(5):751–765
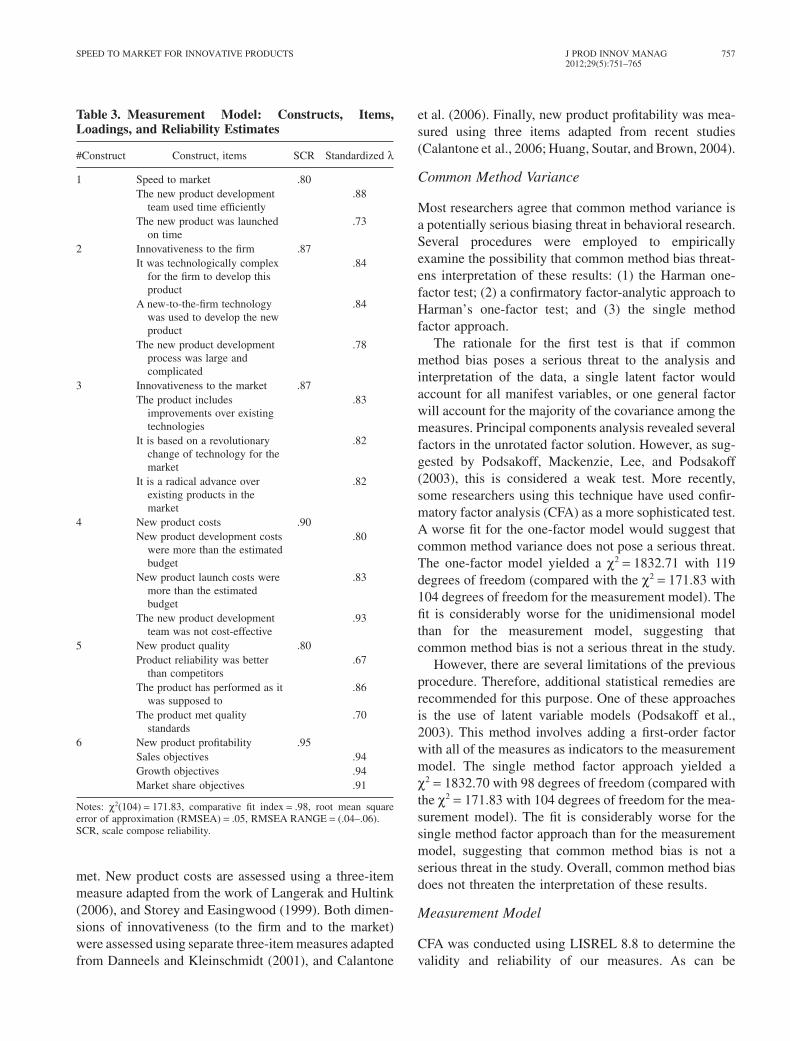
observed from Table 3, the results of the six-factor modelprovided an acceptable fit (c2[104] = 171.83, compara-tive fit index [CFI] = .98, root mean square error ofapproximation [RMSEA] = .05, RMSEA RANGE =[.04–.06]). The factor loadings for each individual indi-cator on their respective construct were all statisticallysignificant (p < .001), establishing convergent validity.Since this research uses several multi-item reflectivescales, the psychometric properties of these measureswere examined through the composite reliability index(Bagozzi and Yi, 1988) and average variance extracted(AVE) (Fornell and Larcker, 1981). Both indexesexceeded the recommended benchmarks of .60 and .50,respectively. Evidence of discriminant validity among thedimensions was provided by three different proceduresrecommended in the literature as follows: (1) the 95%confidence interval constructed around the correlationestimate between two latent variables never includes thevalue 1 (Anderson and Gerbing, 1988); (2) the compari-son of the square root of the AVE (diagonal in Table 4)with the correlations among constructs (i.e., off-diagonalelements) reveals that the square root of the AVE for eachcomponent is greater than the correlation between com-
ponents, in support of discriminant validity (Fornell andLarcker, 1981); and (3) the hypothesized six-factor modelhas a significantly better fit with the data than an alterna-tive model in which the correlation estimate betweenlatent constructs is constrained to the value 1 (Andersonand Gerbing, 1988). Overall, these results provideadequate evidence of both convergent and discriminantvalidity as well as reliability.
Empirical Testing of Hypothesized Model
Structural Model
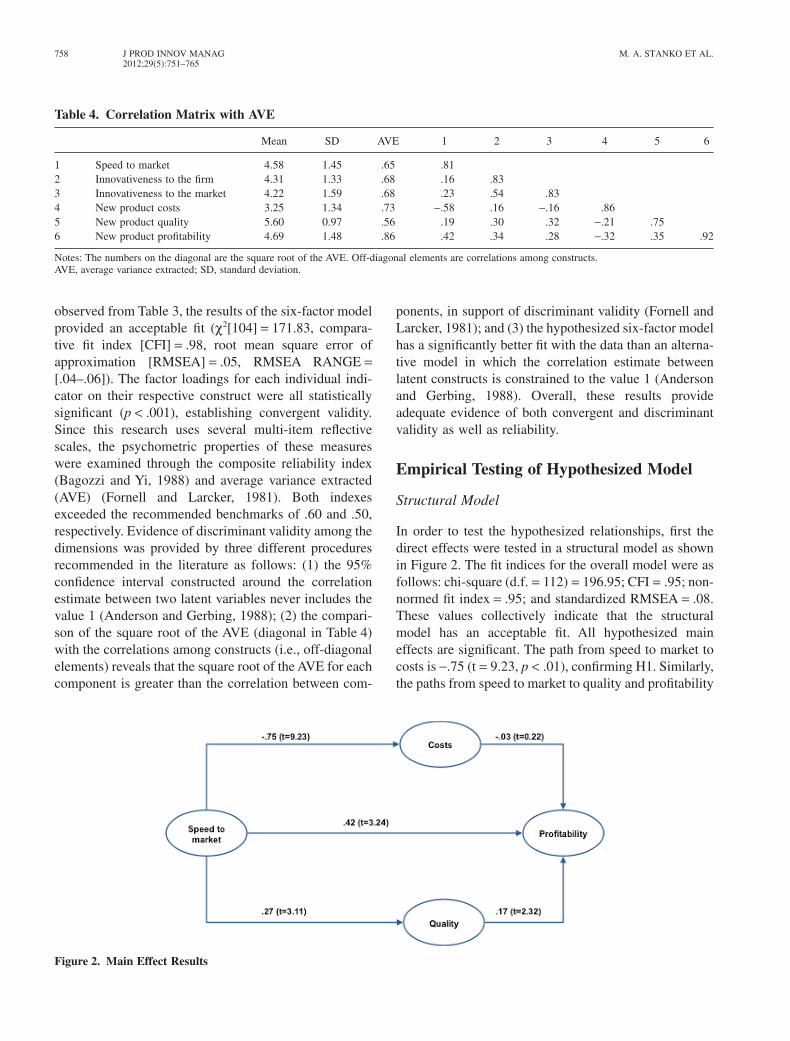
In order to test the hypothesized relationships, first thedirect effects were tested in a structural model as shownin Figure 2. The fit indices for the overall model were asfollows: chi-square (d.f. = 112) = 196.95; CFI = .95; non-normed fit index = .95; and standardized RMSEA = .08.These values collectively indicate that the structuralmodel has an acceptable fit. All hypothesized maineffects are significant. The path from speed to market tocosts is -.75 (t = 9.23, p < .01), confirming H1. Similarly,the paths from speed to market to quality and profitability
Table 4. Correlation Matrix with AVE
Mean SD AVE 1 2 3 4 5 6
1 Speed to market 4.58 1.45 .65 .812 Innovativeness to the firm 4.31 1.33 .68 .16 .833 Innovativeness to the market 4.22 1.59 .68 .23 .54 .834 New product costs 3.25 1.34 .73 -.58 .16 -.16 .865 New product quality 5.60 0.97 .56 .19 .30 .32 -.21 .756 New product profitability 4.69 1.48 .86 .42 .34 .28 -.32 .35 .92
Notes: The numbers on the diagonal are the square root of the AVE. Off-diagonal elements are correlations among constructs.AVE, average variance extracted; SD, standard deviation.
Figure 2. Main Effect Results
758 J PROD INNOV MANAG M. A. STANKO ET AL.2012;29(5):751–765
are .27 (t = 3.11, p < .01) and .42 (t = 3.24, p < .01),respectively. Thus, these two significant, positive rela-tionships suggest that H2 and H5 are supported.
One of the two nonhypothesized relationships testedalso proved significant. These relationships wereincluded in order to test a more comprehensive model.The path coefficient from quality to profitability is .17(t = 2.32, p < .01). However, the path coefficient cost toprofitability is -.03 (t = 0.22, p > .10), failing to supportthis relationship.
Since other scholars have found an inverse U-shapedrelationship between speed and profit (Langerak andHultink, 2006), as well as speed and quality (Lukas andMenon, 2004), supplementary analyses were conductedto determine whether these nonlinear relationships existhere as well. However, neither of these nonlinear rela-tionships were found in the present study.
The structural model explains 56% and 8%, respec-tively, of the variance in costs and quality (see Table 7).The structural model also explains 35% of the variance inthe final dependent variable, profitability.
The results of the structural model (Figure 2) indicatethat quality partially mediates the relationship betweenspeed to market and profitability, whereas costs do notmediate the relationship between speed to market andprofitability.
The Moderating Effect of Innovativeness on theRelationship between Speed to Market and Quality
Two-group structural equation modeling (Calantoneet al., 2003) was used to test the moderating effects ofinnovativeness to the firm and innovativeness to themarket on the relationship between speed to market andquality.
First, the sample was split into two groups based onthe mean of innovativeness to the firm, creating a highinnovativeness to the firm group and low innovativenessto the firm group. Two-group comparison was, then, per-formed to examine whether there were any differences instructural parameters between these two groups. In thefirst step, the parameter from speed to quality was con-strained to be equal. In the second step, the parameter wasnot constrained (allowing it to be free). The difference inthe two tests was significant (chi-square differ-ence = 7.12, d.f. = 1, p < .01), which supports the propo-sition that innovativeness to the firm moderates thisrelationship.
The test of the moderating effect of innovativeness tothe market on the relationship between speed to marketand quality followed the same procedure. The differencein the two tests was significant (chi-square differ-ence = 9.18, d.f. = 1, p < .01), which supports the propo-sition that innovativeness to the market has a moderatingeffect here. The results are summarized in Figure 3.
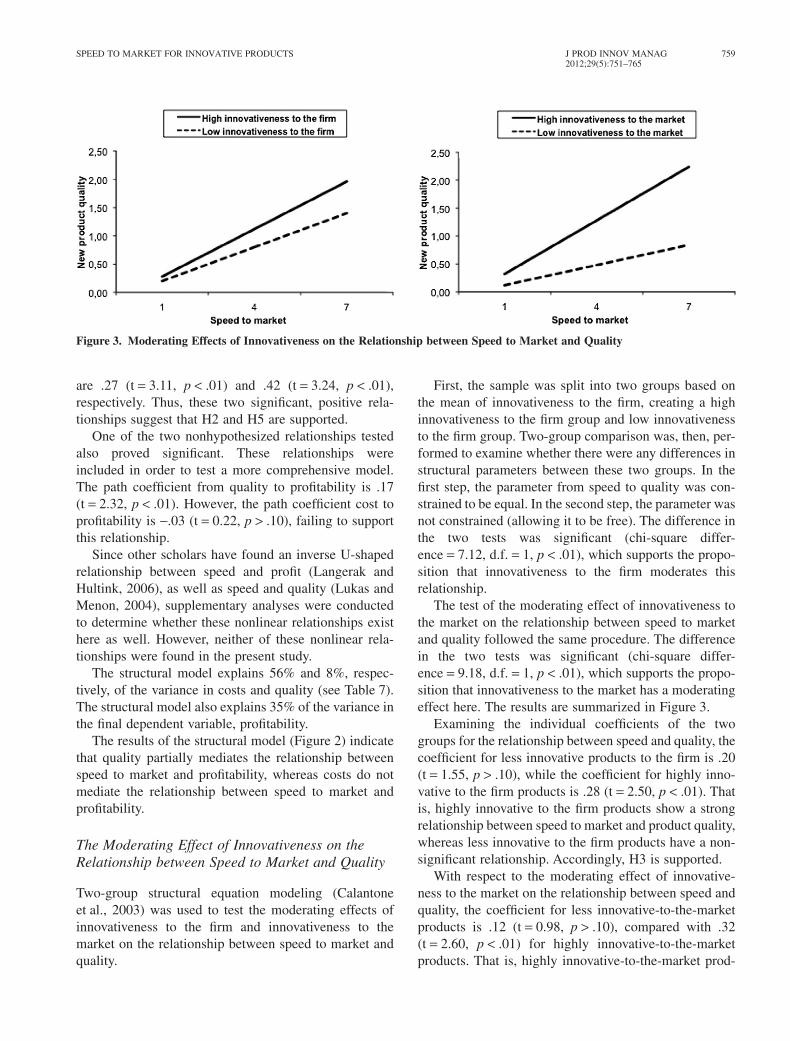
Examining the individual coefficients of the twogroups for the relationship between speed and quality, thecoefficient for less innovative products to the firm is .20(t = 1.55, p > .10), while the coefficient for highly inno-vative to the firm products is .28 (t = 2.50, p < .01). Thatis, highly innovative to the firm products show a strongrelationship between speed to market and product quality,whereas less innovative to the firm products have a non-significant relationship. Accordingly, H3 is supported.
With respect to the moderating effect of innovative-ness to the market on the relationship between speed andquality, the coefficient for less innovative-to-the-marketproducts is .12 (t = 0.98, p > .10), compared with .32(t = 2.60, p < .01) for highly innovative-to-the-marketproducts. That is, highly innovative-to-the-market prod-
Figure 3. Moderating Effects of Innovativeness on the Relationship between Speed to Market and Quality
SPEED TO MARKET FOR INNOVATIVE PRODUCTS J PROD INNOV MANAG 7592012;29(5):751–765
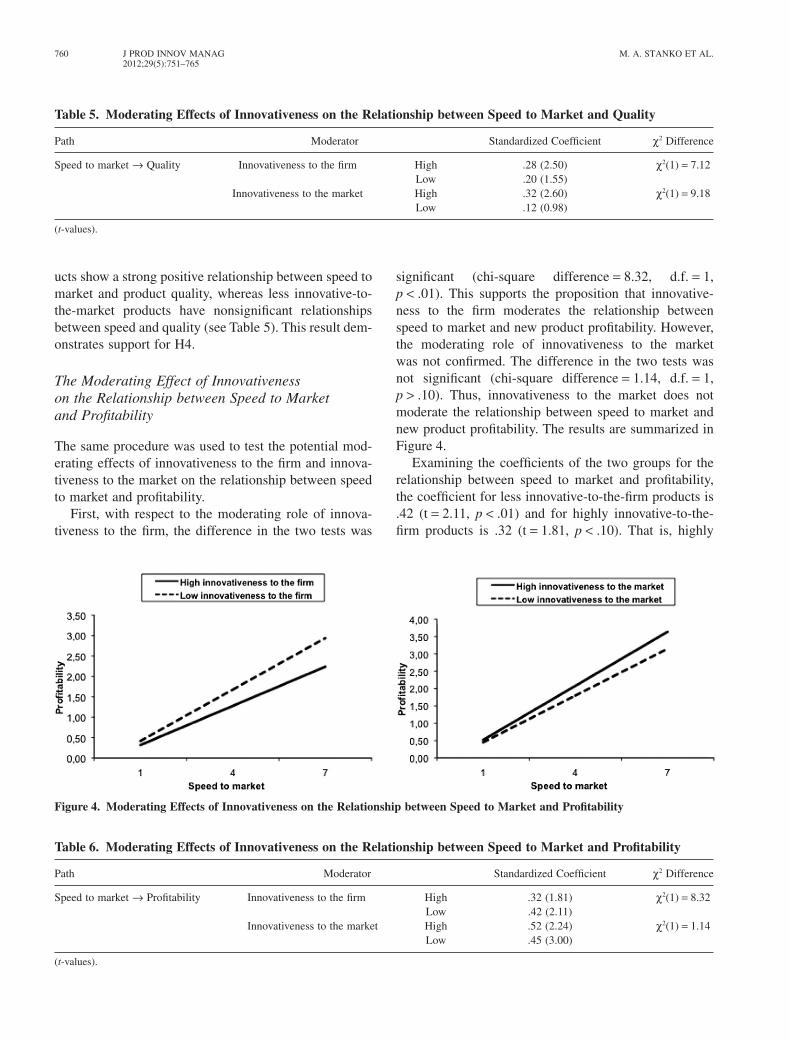
ucts show a strong positive relationship between speed tomarket and product quality, whereas less innovative-to-the-market products have nonsignificant relationshipsbetween speed and quality (see Table 5). This result dem-onstrates support for H4.
The Moderating Effect of Innovativenesson the Relationship between Speed to Marketand Profitability
The same procedure was used to test the potential mod-erating effects of innovativeness to the firm and innova-tiveness to the market on the relationship between speedto market and profitability.
First, with respect to the moderating role of innova-tiveness to the firm, the difference in the two tests was
significant (chi-square difference = 8.32, d.f. = 1,p < .01). This supports the proposition that innovative-ness to the firm moderates the relationship betweenspeed to market and new product profitability. However,the moderating role of innovativeness to the marketwas not confirmed. The difference in the two tests wasnot significant (chi-square difference = 1.14, d.f. = 1,p > .10). Thus, innovativeness to the market does notmoderate the relationship between speed to market andnew product profitability. The results are summarized inFigure 4.
Examining the coefficients of the two groups for therelationship between speed to market and profitability,the coefficient for less innovative-to-the-firm products is.42 (t = 2.11, p < .01) and for highly innovative-to-the-firm products is .32 (t = 1.81, p < .10). That is, highly
Table 5. Moderating Effects of Innovativeness on the Relationship between Speed to Market and Quality
Path Moderator Standardized Coefficient c2 Difference
Speed to market → Quality Innovativeness to the firm High .28 (2.50) c2(1) = 7.12Low .20 (1.55)
Innovativeness to the market High .32 (2.60) c2(1) = 9.18Low .12 (0.98)
(t-values).
Figure 4. Moderating Effects of Innovativeness on the Relationship between Speed to Market and Profitability
Table 6. Moderating Effects of Innovativeness on the Relationship between Speed to Market and Profitability
Path Moderator Standardized Coefficient c2 Difference
Speed to market → Profitability Innovativeness to the firm High .32 (1.81) c2(1) = 8.32Low .42 (2.11)
Innovativeness to the market High .52 (2.24) c2(1) = 1.14Low .45 (3.00)
(t-values).
760 J PROD INNOV MANAG M. A. STANKO ET AL.2012;29(5):751–765

innovative-to-the-firm products show a weaker relation-ship between speed to market and new product profitabil-ity, whereas less innovative-to-the-firm products have astronger relationship (Table 6). This supports H6. As forthe moderating effect of innovativeness to the market,since the chi-square difference was not significant, H7was not supported.
Discussion and Managerial Implications
As noted by Chen et al. (2005), the relationships amongspeed to market, innovativeness, and new product profit-ability are not straightforward. This study makes threemain contributions to our understanding of these relation-ships. First, this research has shown that speed to marketleads to higher quality and lower costs—these goals arenot mutually exclusive. Second, innovativeness to thefirm negatively moderates the relationship between speedto market and profitability, and positively moderates therelationship between speed to market and quality. Finally,innovativeness to the market positively moderates therelationship between speed to market and quality. Distin-guishing between the two dimensions of innovativenessis shown here to be important in explaining the relation-ships among speed, quality, and profitability, given thediffering moderating effects of these two dimensions. Theimplications of each of these findings will be explicatedin turn.
Effects of Speed to Market
Overall, speed to market leads to both improved productquality and lower development costs. The oldadage—“speed, costs, quality—pick any two” simplydoes not hold true here. These findings suggest thatspeed to market limits potential man-hours (and thuscosts) in development projects. Further, speed is alsoshown to be positively related to new productquality—speed to market leads to superior new productquality as firms are able to leverage fast cycle timesby including the most up-to-date components in theirproducts. Conversely, where new product developmentefforts are slow, costs tend to rise as more man-hours arespent in development, and quality suffers due to lack offocus and an inability to include the latest componentsfrom suppliers. Speed to market may be even moreimportant than had been thought previously. Here, speedto market has been shown to play a crucial role in deter-mining product quality, keeping costs in check, andensuring profitability.
Moderating Effects of Innovativeness onthe Relationship between Speed to Marketand Profitability
The second important contribution of this study is toshow that innovativeness to the firm negatively moderatesthe relationship between speed to market and profitabil-ity. Speed to market plays less of a role in determiningprofitability for new-to-firm innovations. New-to-the-firm innovations inherently have a higher degree ofuncertainty in the development effort, with our resultsindicating that speeding this type of new product tomarket has a less positive impact on profitability (Kesslerand Bierly, 2002). Conversely, where the developmenteffort is well understood internally (i.e., low innovative-ness to the firm), speed will have an even stronger posi-tive impact on profit. Presumably, for new-to-the-firminnovations, the necessary learning requires time, andthere is limited benefit from reducing the length of thislearning cycle. More familiar (to the firm) NPD projectsappear to be the best candidates for speeding to market, asthese projects receive the most substantial profit premiumfor speed to market. It is plausible that this type of famil-iar product development efforts may represent changebased on customer feedback to previous iterations. In thiscase, speed to market may represent responsiveness tocustomer demands, as well as an accurate understandingof customer needs, both of which are likely to aid prof-itability (Atuahene-Gima, 1995).
The hypothesized moderating effect of innovativenessto the market on the relationship between speed and profitwas found nonsignificant—there is no extra profit incen-tive to developing innovative to the market productsquickly. H7 predicted that new-to-the-market productswould profit more from speed to market since a speedadvantage could enable potential first-mover advantagesfor this sort of product offering. Given our nonsignificantresult for this particular hypothesized moderation, itappears that the potential costs (increased resource allo-cation, reduced time for testing, and customer feedback,etc.) of forcing development teams quickly through theuncertainty associated with innovative-to-the-marketdevelopment efforts counterbalance any added gain toprofitability from speed to market.
Moderating Effects of Innovativeness on theRelationship between Speed to Market and Quality
Both dimensions of innovativeness positively moderatethe relationship between speed to market and quality,supporting H3 and H4. Importantly, the shorter the
SPEED TO MARKET FOR INNOVATIVE PRODUCTS J PROD INNOV MANAG 7612012;29(5):751–765
duration of an NPD project, the more likely it is that theteam responsible can focus solely on the given project.For innovative projects (of either variety), this focus isextremely important in ensuring a quality deliverable. Aswell, the ability to use the latest components from sup-pliers is improved as development time is reduced. Wherea new product development effort is accompanied bysupplier innovations, speed to market becomes moreimportant as customers associate the latest features andcomponents with quality. For less innovative products(both to the market and the firm), there is no significantrelationship between speed to market and quality (seeTable 6). For projects that are not innovative to themarket, customers do not perceive these products asnovel or as being superior to (likely similar) competitiveofferings, regardless of speed to market. For those prod-ucts that are not innovative to the firm, the similarity ofthe firm’s existing products makes customers less likelyto perceive new offerings as being of superiorquality—regardless of how fast they replace or augmentexisting products on the market.
There were also two unhypothesized relationshipsthat warrant discussion. First, although no relationshipbetween costs and profit was hypothesized, the nonsig-nificant result is noteworthy for two reasons. First, thisindicates that cost does not mediate the relationshipbetween speed and profit. That is, the positive impact ofspeed on profit is not achieved only by limiting develop-ment costs. The strategic and quality advantages ofspeed to market have greater profit implications than doeslimiting costs. Second, although a relationship betweenlow costs and profit appears fairly intuitive, there arelikely opposing effects on the relationship between costsand profitability that make for this nonsignificanteffect. Where costs are extremely low, the developmenteffort is likely very incremental, and is unlikely to gen-erate dramatic revenue growth. On the other hand, orga-nizations will tend to have higher revenue expectationsfor more costly projects in order to recoup the initial
investment. These higher expectations make it lesslikely for these more expensive projects to be thought ofas highly profitable. Second, although no moderatingeffect of either variety of innovativeness was hypoth-esized on the relationship between speed and costs, ouranalysis did detect a significant moderating effect ofinnovativeness to the market. The negative effect of speedto market on costs is stronger for products that are moreinnovative to the market. Thus, slow innovative-to-the-market development projects will be even more costly.The extensive learning and exploratory research involvedin this type of development effort will likely lead to evengreater cost overruns when the project’s duration isextended.
Managerial Implications
In terms of managerial implications, this research hasshown that speed to market is associated both withheightened quality and lower costs—these goals areindeed compatible. Further, the relationship betweenspeed and quality is more positive for products that arehighly innovative (to the market or the firm). Finally, forless innovative-to-the-firm products, there is a strongerrelationship between speed and profit. By being con-scious of the projects’ levels of innovativeness (alongwith prioritizing various performance measures), manag-ers can more rationally decide when to emphasize speedto market based on this study’s findings.
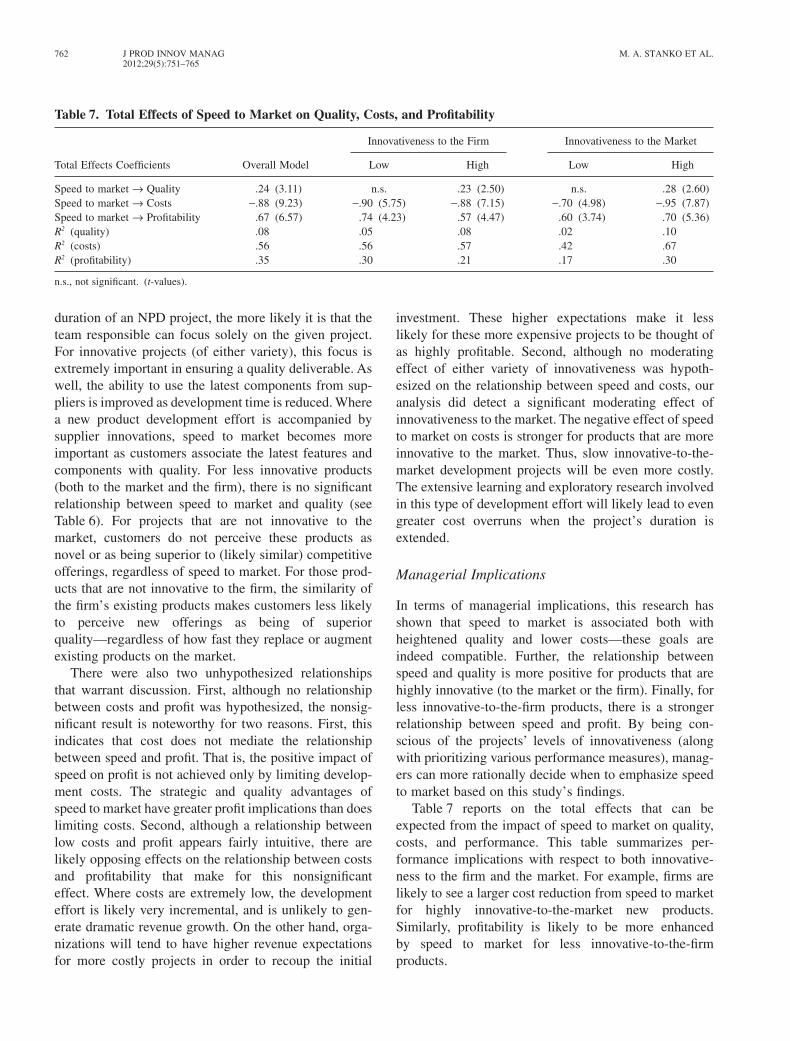
Table 7 reports on the total effects that can beexpected from the impact of speed to market on quality,costs, and performance. This table summarizes per-formance implications with respect to both innovative-ness to the firm and the market. For example, firms arelikely to see a larger cost reduction from speed to marketfor highly innovative-to-the-market new products.Similarly, profitability is likely to be more enhancedby speed to market for less innovative-to-the-firmproducts.
Table 7. Total Effects of Speed to Market on Quality, Costs, and Profitability
Total Effects Coefficients Overall Model
Innovativeness to the Firm Innovativeness to the Market
Low High Low High
Speed to market → Quality .24 (3.11) n.s. .23 (2.50) n.s. .28 (2.60)Speed to market → Costs -.88 (9.23) -.90 (5.75) -.88 (7.15) -.70 (4.98) -.95 (7.87)Speed to market → Profitability .67 (6.57) .74 (4.23) .57 (4.47) .60 (3.74) .70 (5.36)R2 (quality) .08 .05 .08 .02 .10R2 (costs) .56 .56 .57 .42 .67R2 (profitability) .35 .30 .21 .17 .30
n.s., not significant. (t-values).
762 J PROD INNOV MANAG M. A. STANKO ET AL.2012;29(5):751–765
Limitations and Future Research Directions
This study is subject to some caveats that need to beacknowledged. The study draws upon subjective mea-sures based on the perceptions of managers. Despite theextensive use of such perceptual data in strategy research(and particularly in new product research), the shortcom-ings associated with subjective measures should not beruled out. Future researchers may wish to replicate thisstudy using objective measures. Our “retrospective”survey approach does not allow for investigating devel-opment projects outside what is typically observed (forinstance, shortening project duration to near zero), andthis is left to future researchers using other approachessuch as simulation. Further, although a sample of firms ina varied set of industries allows for the generalization ofthe results beyond individual industries, single-industrystudies may be useful for validating the results.
Second, one key informant provided the data for eachcompany. Aviolo, Yammarino, and Bass (1991) note thatstudies employing single-source methodology may bebiased by artificially high intercorrelations because of anoverall positive or negative response bias. They alsoobserve, however, that simply assuming that single-source data are less valid than multisource data is overlysimplistic. Without minimizing the importance ofcommon method bias, multiple analyses conducted heredo not support a significant role of this bias in the currentstudy.
The model proposed in this article is not comprehen-sive. Clearly, much more can be learned from expandingand refining the relationships under investigation. First, itwould be interesting to include broader quality typologiesand measures (Brucks et al., 2000; Zeithaml, 1988), suchas internal and external quality, to generate additionalinsight. Using a global measure provides somewhat lessguidance for managing quality and forces respondents to(likely unconsciously) combine multidimensionalratings. Another way of enhancing the proposed model isto differentiate between short-term and long-term profit-ability (Molina-Castillo and Munuera-Alemán, 2009).Findings of this sort may help managers to more accu-rately understand the potentially differing performanceimplications of speed to market over both the short- andlong-term. Finally, considering more complex three-wayinteractions may enhance researchers’ understanding ofthe effect of speed on various outcomes. For instance,how is quality impacted by speeding products to marketthat are both innovative to the firm and the market?
In terms of future research possibilities, here, speed tomarket was viewed as being antecedent to quality and
costs, but these may be interrelated. For instance, cost-cutting initiatives may impact speed to market. It is alsopossible that speed may have differing impacts on qualityand profit at different stages in the NPD process. Forinstance, it is possible that speeding through the ideationstage may be of additional benefit to profitability forinnovation projects that are familiar to the firm, but prof-itability may actually be harmed for those projects thatare innovative to the market where necessary creativitymay be limited during a hurried ideation period. Byunderstanding the implications of speeding through eachindividual stage of the NPD process, managers may makemore educated choices as they allocate time to each activ-ity. Both managers and researchers will be interested infurther learning surrounding how to achieve speed tomarket, high quality, and low costs—all three.
References
Ali, A., R. Krapfel, and D. LaBahn. 1995. Product innovativeness and entrystrategy: Impact on cycle time and break-even time. Journal of ProductInnovation Management 12 (1): 54–69.
Allocca, M., and E. H. Kessler. 2006. Innovation speed in small andmedium-sized enterprises. Creativity and Innovation Management 15(3): 279–95.
Anderson, J. C., and D. W. Gerbing. 1988. Structural equation modelling inpractice: A review and recommended two-step approach. PsychologicalBulletin 103 (3): 411–23.
Armstrong, J. S., and T. S. Overton. 1977. Estimating nonresponse bias inmail surveys. Journal of Marketing Research 14 (3): 396–402.
Atuahene-Gima, K. 1995. An exploratory analysis of the impact of marketorientation on new product performance: A contingency approach.Journal of Product Innovation Management 12 (4): 275–93.
Atuahene-Gima, K. 2003. The effects of centrifugal and centripetal forceson product development speed and quality: How does problem solvingmatter? Academy of Management Journal 46 (3): 359–73.
Aviolo, B. J., F. J. Yammarino, and B. M. Bass. 1991. Identifying commonmethods variance with dates collected from a single source: An unre-solved sticky issue. Journal of Management 17 (4): 571–87.
Bagozzi, R. P., and Y. Yi. 1988. On the evaluation of structural equationmodels. Journal of the Academy of Marketing Science 16 (1): 74–94.
Baum, J., and S. Wally. 2003. Strategic decision speed and firm perfor-mance. Strategic Management Journal 24 (11): 1107–29.
Bayus, B. L. 1997. Speed-to-market and new product performance trade-offs. Journal of Product Innovation Management 14 (4): 485–97.
Bremser, W. G., and N. Barsky. 2004. Utilizing the balanced scorecard forR&D performance measurement. Journal of Product Innovation Man-agement 34 (3): 229–38.
Brucks, M., V. A. Zeithaml, and G. Naylor. 2000. Price and brand name asindicators of quality dimensions for consumer durables. Journal of theAcademy of Marketing Science 28 (3): 359–74.
Calantone, R., K. Chan, and A. S. Cui. 2006. Decomposing product inno-vativeness and its effects on new product succes. Journal of ProductInnovation Management 23 (4): 408–21.
Calantone, R., R. Garcia, and C. Dröge. 2003. The effects of environmentalturbulence on new product development strategy planning. Journal ofProduct Innovation Management 20 (2): 90–103.
Carbonell, P., and A. I. Rodriguez. 2006. The impact of market character-istics and innovation speed on perceptions of positional advantage andnew product performance. International Journal of Research in Mar-keting 23 (1): 1–12.
SPEED TO MARKET FOR INNOVATIVE PRODUCTS J PROD INNOV MANAG 7632012;29(5):751–765
Chen, J., F. Damampour, and R. Reilly. 2010. Understanding antecedents ofnew product development speed: A meta-analysis. Journal of Opera-tions Management 28 (1): 17–33.
Chen, J., R. Reilly, and G. S. Lynn. 2005. The impacts of speed to marketon new product success: The moderating effects of uncertainty. IEEETransactions on Engineering Management 52 (2): 199–212.
Cho, H., and V. Pucik. 2005. Relationship between innovativeness quality,growth, profitability, and market value. Strategic Management Journal26 (6): 555–75.
Cohen, M. A., J. Eliashberg, and T. H. Ho. 1996. New product develop-ment: The performance and time-to-market tradeoff. ManagementScience 42 (2): 173–86.
Cooper, R. G., and E. J. Kleinschmidt. 1994. Determinants of timeliness inproduct development. Journal of Product Innovation Management 11(5): 381–96.
Crawford, C. M. 1992. The hidden costs of accelerated product develop-ment. Journal of Product Innovation Management 9 (3): 188–89.
Danneels, E., and E. J. Kleinschmidt. 2001. Product innovativeness fromthe firm’s perspective: Its dimensions and their relation with projectselection and performance. Journal of Product Innovation Manage-ment 18 (6): 357–73.
Davis, P., C. Dibrell, and B. Janz. 2002. The impact of time on the strategy-performance relationship: Implications for managers. Industrial Mar-keting Management 31 (4): 339–47.
Droge, C., J. Jayaram, and S. Vickery. 2004. The effects of internal versusexternal integration practices on time-based performance and overallfirm performance. Journal of Operations Management 22 (4): 557–73.
Fornell, C., and D. F. Larcker. 1981. Evaluating structural equation modelswith unobservable variables and measurement error. Journal of Mar-keting Research 18 (1): 39–50.
Garvin, D. A. 1987. Competing on the eight dimensions of quality. HarvardBusiness Review 6 (1): 101–9.
Gatignon, H., M. L. Tushman, W. Smith, and P. Anderson. 2002. A struc-tural approach to assessing innovation: Construct development of inno-vation locus, type, and characteristics. Management Science 48 (9):1103–22.
Golder, P. N., and G. J. Tellis. 1993. Pioneer advantage: Marketing logic ormarketing legend? Journal of Marketing Research 30 (2): 158–70.
Griffin, A. 2002. Product development cycle time for business-to-businessproducts. Industrial Marketing Management 31 (4): 291–304.
Griffin, A., and A. L. Page. 1996. PDMA success measurement project:Recommended measures for product development success and failure.Journal of Product Innovation Management 13 (6): 478–96.
Gupta, A. K., and W. E. Souder. 1998. Key drivers of reduced cycle time.Research Technology Management 41 (4): 38–43.
Henard, D. H., and D. M. Szymanski. 2001. Why some new products aremore successful than others? Journal of Marketing Research 38 (3):362–75.
Hendricks, K. B., and V. R. Singhal. 1997. Delays in new product intro-ductions and the market value of the firm: The consequences of beinglate to the market. Management Science 43 (4): 422–36.
Hoegl, M., K. Weinkauf, and G. Gemuenden. 2004. Interteam coordination,project commitment, and teamwork in multiteam R&D projects: Alongitudinal study. Organization Science 15 (1): 38–55.
Huang, X., G. N. Soutar, and A. Brown. 2004. Measuring new productsuccess: An empirical investigation of Australian SMEs. IndustrialMarketing Management 33 (2): 117–23.
Ittner, C. D., and D. F. Larcker. 1997. Product development cycle time andorganizational performance. Journal of Marketing Research 34 (1):13–23.
Jobber, D., J. Saunders, and V. W. Mitchell. 2004. Prepaid monetary incen-tive effects on mail survey response. Journal of Business Research 57(1): 21–25.
Karau, S. J., and J. R. Kelly. 1992. The effects of time pressure and timeabundance on group performance quality and interaction process.Journal of Experimental Social Psychology 28 (4): 542–71.
Kessler, E. H., and P. E. Bierly. 2002. Is faster really better? An empiricaltest of the implication of innovation speed. IEEE Transactions onEngineering Management 49 (1): 2–12.
Kessler, E. H., and A. K. Chakrabarti. 1996. Innovation speed: A conceptualmodel of context, antecedents, and outcomes. Academy of ManagementReview 21 (4): 1143–91.
Kessler, E. H., and A. K. Chakrabarti. 1999. Speeding up the pace of newproduct development. Journal of Product Innovation Management 16(3): 231–47.
Klink, R. R., and G. A. Athaide. 2010. Consumer innovativeness and theuse of new versus extended brand names for new products. Journal ofProduct Innovation Management 27 (1): 23–32.
Langerak, F., A. Griffin, and E. J. Hultink. 2010. Balancing developmentcosts and sales to optimize the development time of product line addi-tions. Journal of Product Innovation Management 27 (3): 336–48.
Langerak, F., and E. J. Hultink. 2005. The impact of new product develop-ment acceleration approaches on speed and profitability: Lesson forpioneers and fast followers. IEEE Transactions on Engineering Man-agement 52 (1): 30–42.
Langerak, F., and E. J. Hultink. 2006. The impact of product innovativenesson the link between development speed and new product profitability.Journal of Product Innovation Management 23 (3): 203–14.
Langerak, F., E. J. Hultink, and A. Griffin. 2008. Exploring mediating andmoderating influences on the links among cycle time, proficiency inentry timing, and new product profitability. Journal of Product Inno-vation Management 25 (4): 370–85.
Lee, Y., and G. C. O’Connor. 2003. The impact of communication strategyon launching new products: The moderating role of product innovative-ness. Journal of Product Innovation Management 20 (1): 4–21.
Lieberman, M. B., and D. B. Montgomery. 1988. First-mover advantages.Strategic Management Journal 9: 41–58.
Lukas, B., and A. Menon. 2004. New product quality: Intended and unin-tended consequences of new product development speed. Journal ofBusiness Research 57 (11): 1258–64.
Lukas, B., A. Menon, and S. Bell. 2002. Organizing for new productdevelopment speed and the implications for organizational stress.Industrial Marketing Management 31 (3): 349–55.
Lynn, G. S., R. B. Skov, and K. D. Abel. 1999. Practices that support teamlearning and their impact on speed to market and product success.Journal of Product Innovation Management 16 (4): 439–54.
Mansfield, E. 1988. The speed and costs of industrial innovation in Japanand the United States. Management Science 34 (10): 1157–68.
Menon, A., J. Chowdhury, and B. Lukas. 2002. Antecedents and outcomesof new product development speed: An interdisciplinary conceptualframework. Industrial Marketing Management 31 (4): 317–28.
Meyer, M. H., and J. M. Utterback. 1995. Product development cycle timeand comercial success. IEEE Transactions on Engineering Manage-ment 42 (4): 297–304.
Molina-Castillo, F. J., and J. L. Munuera-Alemán. 2009. New productperformance indicators: Time horizon and importance attributed bymanagers. Technovation 29 (10): 714–24.
Montoya, M. M., A. Massey, Y.-T. Hung, and C. Crisp. 2009. Can you hearme now? Communication in virtual product development teams.Journal of Product Innovation Management 26 (2): 139–55.
Moorman, C., and A. S. Miner. 1998. The convergence of planning andexecution: Improvisation in new product development. Journal of Mar-keting 62 (1): 1–20.
Nohria, N., and R. Gulati. 1996. Is slack good or bad for innovation?Academy of Management Journal 39 (4): 1245–64.
Podsakoff, P. M., S. B. Mackenzie, J. Lee, and N. P. Podsakoff. 2003.Common method biases in behavioral research: A critical review of theliterature and recommended remedies. Journal of Applied Psychology20 (5): 879–903.
764 J PROD INNOV MANAG M. A. STANKO ET AL.2012;29(5):751–765
Rindfleisch, A., and C. Moorman. 2001. The acquisition and utilization ofinformation in new product alliances: A strength-of-ties perspective.Journal of Marketing 65 (2): 1–18.
Rosenau, M. 1990. Faster new product development. New York:AMACOM.
Rust, R. T., C. Moorman, and P. T. Dickson. 2002. Getting return on quality:Revenue expansion, cost reduction, or both? Journal of Marketing 66(4): 7–24.
Schmidt, J. B., K. R. Sarangee, and M. M. Montoya. 2009. Exploring newproduct development project review practices. Journal of Product Inno-vation Management 26 (5): 520–35.
Sethi, R. 2000. New product quality and product development teams.Journal of Marketing 64 (2): 1–14.
Simpson, P., J. Siguaw, and C. Enz. 2006. Innovation orientation outcomes:The good and the bad. Journal of Business Research 59 (10): 1133–41.
Sivadas, E., and F. R. Dwyer. 2000. An examination of organizationalfactors influencing new product success in internal and alliance-basedprocesses. Journal of Marketing 64 (1): 31–49.
Song, X. M., and M. M. Montoya-Weiss. 2001. The effect of perceivedtechnological uncertainty on Japanese new product development.Academy of Management Journal 44 (1): 61–80.
Storey, C., and C. J. Easingwood. 1999. Types of new product performance:Evidence from the consumer financial services sector. Journal of Busi-ness Research 46 (2): 193–203.
Swink, M. 2003. Completing projects on-time: How project accelerationaffects new product development. Journal of Engineering and Technol-ogy Management 20 (4): 319–44.
Swink, M., S. Talluri, and T. Pandejpong. 2006. Faster, better, cheaper: Astudy of NPD project efficiency and performance tradeoffs. Journal ofOperations Management 24 (5): 542–62.
Tatikonda, M. V., and M. M. Montoya-Weiss. 2001. Integrating operationsand marketing perspectives of product innovation: The influence oforganizational process factors and capabilities on development perfor-mance. Management Science 47 (1): 151–72.
Zeithaml, V. A. 1988. Consumer perceptions of price, quality and value: Ameans-end model and synthesis of evidence. Journal of Marketing 52(2): 2–22.
Zirger, B. J., and J. L. Hartley. 1996. The effect of acceleration techniqueson product development time. IEEE Transactions on Engineering Man-agement 43 (2): 143–52.
SPEED TO MARKET FOR INNOVATIVE PRODUCTS J PROD INNOV MANAG 7652012;29(5):751–765