Spectroscopic and Computational Studies of a Series of High-Spin Ni(II) Thiolate Complexes
24
Spectroscopic and Computational Studies of a Series of High- Spin Ni(II) Thiolate Complexes Katherine M. Van Heuvelen † , Jaeheung Cho §,‡ , Timothy Dingee † , Charles G. Riordan § , and Thomas C. Brunold †,* † Department of Chemistry, University of Wisconsin-Madison, Madison, Wisconsin 53706 § Department of Chemistry and Biochemistry, University of Delaware, Newark, Delaware 19716 Abstract The electronic structures of a series of high-spin Ni(II)-thiolate complexes of the form [PhTt tBu ]Ni(SR) (R = CPh 3 , 2; C 6 F 5 , 3; C 6 H 5 , 4; PhTt tBu = phenyltris((tert- butylthio)methyl)borate) have been characterized using a combined spectroscopic and computational approach. Resonance Raman (rR) spectroscopic data reveal that the ν Ni–SR vibrational feature occurs between 404 and 436 cm −1 in these species. The corresponding rR excitation profiles display a striking de-enhancement behavior due to interference effects involving energetically proximate electronic excited states. These data were analyzed in the framework of time-dependent Heller theory to obtain quantitative insight into excited state nuclear distortions. The electronic absorption and magnetic circular dichroism spectra of 2 – 4 are characterized by numerous charge transfer (CT) transitions. The dominant absorption feature, which occurs at ~18,000 cm −1 in all three complexes, is assigned as a thiolate-to-Ni CT transition involving molecular orbitals that are of π-symmetry with respect to the Ni–S bond, reminiscent of the characteristic absorption feature of blue copper proteins. Density functional theory computational data provide molecular orbital descriptions for 2 – 4 and allow for detailed assignments of the key spectral features. A comparison of the results obtained in this study to those reported for similar Ni-thiolate species reveals that the supporting ligand plays a secondary role in determining the spectroscopic properties, as the electronic structure is primarily determined by the metal–thiolate bonding interaction. 1. Introduction While only a relatively small number of nickel metalloenzymes are known, acetyl-coenzyme A synthase/carbon monoxide dehydrogenase (ACS/CODH), 1 [NiFe] hydrogenase, 2–4 and Ni superoxide dismutase (NiSOD) 5,6 each contain Ni–S(cysteine) bonds at their active sites. Ni–thiolate bonds may also be formed in the catalytic cycle of methyl-coenzyme M reductase, though this has not yet been definitively established. 7 Active site thiolate moieties appear to play a crucial role in tuning the redox potentials and, thus, controlling the reactivity of these metalloenzymes. 8 The nature of Ni–thiolate bonding interactions has been investigated primarily through the preparation and characterization of synthetic compounds. Examples of such synthetic Ni(II)-thiolate species include the five-coordinate complexes [Ni(tmc)SR]OTf, (tmc = 1,4,8,11- tetramethyl-1,4,8,11-tetraazacyclotetradecane, R = C 6 H 5 , * CORRESPONDING AUTHOR FOOTNOTE: [email protected]. ‡ Present address: Department of Chemistry and Nano Science, Ewha Womans University, Seoul 120-750, Korea Supporting Information. Atomic coordinates of the geometry-optimized models 2 – 4 (Tables S1–S3), rR excitation profiles of 2 and 3 (Figures S1, S2), rR spectra collected at 77 K and 273 K (Figures S3, S4), and frontier MOs of 2 and 3 (Figure S5). This material is available free of charge via the Internet at http://pubs.acs.org NIH Public Access Author Manuscript Inorg Chem. Author manuscript; available in PMC 2011 July 19. Published in final edited form as: Inorg Chem. 2010 July 19; 49(14): 6535–6544. doi:10.1021/ic100362q. NIH-PA Author Manuscript NIH-PA Author Manuscript NIH-PA Author Manuscript
Transcript of Spectroscopic and Computational Studies of a Series of High-Spin Ni(II) Thiolate Complexes

Spectroscopic and Computational Studies of a Series of High-Spin Ni(II) Thiolate Complexes
Katherine M. Van Heuvelen†, Jaeheung Cho§,‡, Timothy Dingee†, Charles G. Riordan§, andThomas C. Brunold†,*
†Department of Chemistry, University of Wisconsin-Madison, Madison, Wisconsin 53706§Department of Chemistry and Biochemistry, University of Delaware, Newark, Delaware 19716
AbstractThe electronic structures of a series of high-spin Ni(II)-thiolate complexes of the form[PhTttBu]Ni(SR) (R = CPh3, 2; C6F5, 3; C6H5, 4; PhTttBu = phenyltris((tert-butylthio)methyl)borate) have been characterized using a combined spectroscopic andcomputational approach. Resonance Raman (rR) spectroscopic data reveal that the νNi–SRvibrational feature occurs between 404 and 436 cm−1 in these species. The corresponding rRexcitation profiles display a striking de-enhancement behavior due to interference effectsinvolving energetically proximate electronic excited states. These data were analyzed in theframework of time-dependent Heller theory to obtain quantitative insight into excited state nucleardistortions. The electronic absorption and magnetic circular dichroism spectra of 2 – 4 arecharacterized by numerous charge transfer (CT) transitions. The dominant absorption feature,which occurs at ~18,000 cm−1 in all three complexes, is assigned as a thiolate-to-Ni CT transitioninvolving molecular orbitals that are of π-symmetry with respect to the Ni–S bond, reminiscent ofthe characteristic absorption feature of blue copper proteins. Density functional theorycomputational data provide molecular orbital descriptions for 2 – 4 and allow for detailedassignments of the key spectral features. A comparison of the results obtained in this study tothose reported for similar Ni-thiolate species reveals that the supporting ligand plays a secondaryrole in determining the spectroscopic properties, as the electronic structure is primarily determinedby the metal–thiolate bonding interaction.
1. IntroductionWhile only a relatively small number of nickel metalloenzymes are known, acetyl-coenzymeA synthase/carbon monoxide dehydrogenase (ACS/CODH),1 [NiFe] hydrogenase,2–4 andNi superoxide dismutase (NiSOD)5,6 each contain Ni–S(cysteine) bonds at their active sites.Ni–thiolate bonds may also be formed in the catalytic cycle of methyl-coenzyme Mreductase, though this has not yet been definitively established.7 Active site thiolate moietiesappear to play a crucial role in tuning the redox potentials and, thus, controlling thereactivity of these metalloenzymes.8 The nature of Ni–thiolate bonding interactions has beeninvestigated primarily through the preparation and characterization of synthetic compounds.Examples of such synthetic Ni(II)-thiolate species include the five-coordinate complexes[Ni(tmc)SR]OTf, (tmc = 1,4,8,11- tetramethyl-1,4,8,11-tetraazacyclotetradecane, R = C6H5,
*CORRESPONDING AUTHOR FOOTNOTE: [email protected].‡Present address: Department of Chemistry and Nano Science, Ewha Womans University, Seoul 120-750, KoreaSupporting Information. Atomic coordinates of the geometry-optimized models 2 – 4 (Tables S1–S3), rR excitation profiles of 2 and 3(Figures S1, S2), rR spectra collected at 77 K and 273 K (Figures S3, S4), and frontier MOs of 2 and 3 (Figure S5). This material isavailable free of charge via the Internet at http://pubs.acs.org
NIH Public AccessAuthor ManuscriptInorg Chem. Author manuscript; available in PMC 2011 July 19.
Published in final edited form as:Inorg Chem. 2010 July 19; 49(14): 6535–6544. doi:10.1021/ic100362q.
NIH
-PA Author Manuscript
NIH
-PA Author Manuscript
NIH
-PA Author Manuscript

C2H5)9, and [L8py2Ni(S-C6H4-p-CH3)]BPh4 (L8py2 = 1,5-bis(2-pyridylmethyl)-1,5-diazacyclooctane),10 pseudo-tetrahedral species of the form PhB(CH2PPh2)3NiX (X = I, Cl,N3, OR, SR),11 and LNi(II) (L = R,R'-N,N'-bis(1-carboxy-2-mercaptoethyl)-1,2-diaminoethane or N,N'-bis(2-methyl-2-mercaptoprop-1-yl)-1,3-diamino-2,2-dimethylpropane), which resembles the distal nickel site of ACS/CODH.12
A major difficulty in preparing synthetic active-site models involves enforcing thecoordination environments observed in biological systems. Steric constraints in a protein,such as those imposed by the polypeptide backbone and amino-acid residues adjacent to theactive site, can force metal centers to adopt unexpected geometries. For example, the metalcenter in plastocyanin and other blue copper proteins adopts a distorted tetrahedral geometryinstead of the square planar coordination commonly observed for four-coordinate Cu(II)complexes.13,14 The presence of both thiolate and thioether ligation of the Cu ion in bluecopper proteins (originating from cysteine and methionine residues, respectively) poses anadditional challenge in the preparation of synthetic model compounds. Tuning the steric andelectronic properties of the supporting ligand is instrumental in overcoming thesedifficulties. Notably, synthetic compounds that mimic the structural and spectroscopicproperties of plastocyanin have recently been reported, such as a Cu(II) species with a ligandset containing both a thioether and a thiolate.15
Recently, the Okamoto group reported the synthesis of a series of metal-thiolate complexesof the form [TpiPr2]M(II)SC6F5 (TpiPr2 = hydrotris(3,5-diisopropyl-1-pyrazolyl)borate; M =Mn, Fe, Co, Ni (1), Cu, Zn), with the copper-containing species serving as a model forplastocyanin.16 The tripodal supporting ligand imposes a four-coordinate, distortedtetrahedral geometry and stabilizes the M(II) oxidation state. Intense S(thiolate)→M(II)charge transfer transitions dominate the electronic absorption (Abs) spectra of thesecomplexes, and the covalency of the M–thiolate bond increases with the increasing effectivenuclear charge of the metal from Mn(II) to Cu(II).17,18
A four-coordinate, distorted tetrahedral geometry similar to that observed for[TpiPr2]M(II)SC6F5 can also be enforced by the tripodal thioether supporting ligand PhTttBu
(phenyltris((tert-butylthio)methyl)borate). The presence of bulky substituents (here tBu)leaves an empty coordination site that can be occupied by a wide range of ligands, such ashalides ([PhTttBu]NiCl),19 carbon monoxide ([PhTttBu]NiCO),20 or thiolates([PhTttBu]NiSR).21 The PhTttBu ligand has also been shown to allow for the formation ofnickel dimers with bridging ligands from the oxygen group, namely [{(PhTttBu)Ni}2(μ−O)2]and [{(PhTttBu)Ni}2(μ−η2:η2−S2)].22–25 Notably, the use of a methyl group in place of thebulky tert-butyl moiety leads to the formation of six-coordinate monomers of the form[PhTt]2M (M = Fe, Co, Ni).26
Recently, some of us reported the preparation and preliminary spectroscopic characterizationof a series of four-coordinate, high-spin Ni(II)-thiolate species, [PhTttBu]Ni(SR) (R = CPh3,2; C6F5, 3; C6H5, 4) (Figure 1).21 All of these species contain the same thioether supportingligand but differ with respect to the electron-withdrawing ability of the R group, thusallowing for a detailed analysis of the Ni–S(thiolate) bonding interaction and its dependenceon the nature of R. In the present study we have employed Abs, magnetic circular dichroism(MCD), and resonance Raman (rR) spectroscopies in conjunction with density functionaltheory (DFT) and time-dependent DFT (TD-DFT) computational methods to investigate theelectronic structures of these Ni-thiolate complexes.
Van Heuvelen et al. Page 2
Inorg Chem. Author manuscript; available in PMC 2011 July 19.
NIH
-PA Author Manuscript
NIH
-PA Author Manuscript
NIH
-PA Author Manuscript

2. ExperimentalA. Spectroscopy
Compounds 2 – 4 were synthesized according to a previous report,21 and samples suitablefor low temperature studies were prepared in 1:1 solutions of CHCl3:toluene (2, 0.7 mM; 3,1.0 mM; 4, 1.2 mM). Room temperature Abs spectra were collected on a spectrophotometer(Hewlett Packard 8453) equipped with a circulating water bath. Low temperature Abs andMCD spectra of 2 – 4 were obtained using a spectropolarimeter (Jasco J-715) in conjunctionwith a magnetocryostat (Oxford Instruments SM-4000 8T). To eliminate contributions fromglass strain to the MCD data, the −7 T spectrum was subtracted from the +7 T spectrum.
For rR studies, samples of 2 – 4 in CHCl3 (2, 10 mM; 3, 5 mM; 4, 5 mM) were prepared inNMR tubes. An Ar+ ion laser (Coherent I-305), a Kr+ ion laser (Coherent I-302C), and a dyelaser (Coherent 599-01, equipped with rhodamine 6G dye) pumped by the Ar+ laser wereused as the excitation sources, maintaining a power of 20–30 mW at the sample. Sampleswere placed in an EPR dewar filled with liquid nitrogen to minimize photodecomposition.The scattered light was collected at a ~135° backscattering angle from the surface of thesample and dispersed by a triple monochromator (Acton Research) with 1200 or 2400grooves/mm gratings. Data were accumulated using a CCD camera (Princeton InstrumentsSpec X: 100 BR deep depletion, back-thinned, 1340 × 100 pixels). The 669 and 370 cm−1
peaks of the CHCl3 solvent were used as internal standards for calibrating the frequenciesand intensities, respectively, of the rR features of 2 – 4.
B. Electronic Structure CalculationsB1. Geometry Optimizations—All density functional theory (DFT) geometryoptimizations were performed on a cluster of Intel Xeon processors (ACE computers) usingthe Amsterdam Density Functional (ADF) 2006 suite of programs.27–30 For all atoms, theADF basis set IV (a triple-ζ basis set) was employed and core orbitals were frozen through1s for C, N, and O, and through 2p for Ni and S. The integration constant was set to 5.0, andthe Vosko-Wilk-Nusair local density approximation (VWN-LDA)31 was used along with thenonlocal gradient corrections of Becke for exchange32 and Perdew for correlation.33 Initialmodels for geometry optimization studies were derived from the X-ray crystal structures of2 – 4 and included the complete structure of each species.21 The SCF convergence criterionwas set at 1 × 10⁻⁵ hartrees, and the geometry was considered converged when themaximum gradient fell below 0.0065 hartrees/Å.
B2. Single Point and Time-Dependent DFT Calculations—The ORCA 2.6.35software package developed by Dr. Frank Neese34 was used to perform single point DFTand time-dependent DFT (TD-DFT) calculations on models of 2 – 4. For each complex, theenergy-minimized structure obtained from geometry optimization studies was truncated byreplacing the tert-butyl and phenyl moieties of the PhTttBu supporting ligand with methylgroups. Becke's three-parameter hybrid functional for exchange35,36 and the Lee-Yang-Parrfunctional for correlation37 (B3LYP/G) were used with the polarized split valence (SV(P))basis38 and the SV/C auxiliary basis39 for all atoms except Ni and S, for which Ahlrichs'polarized triple-ζ valence polarization (TZVP)38 and double-ζ valence polarization (DZP)40
basis sets were employed, respectively. Fifty excited states were considered in all TD-DFTcalculations.
The results from TD-DFT calculations were used to simulate Abs spectra by assuming thateach electronic transition gives rise to a Gaussian band with a full width at half maximumcorresponding to that determined via Gaussian deconvolution of the experimental Abs andMCD data (2, ν1/2 = 1,680 cm−1; 3, ν1/2 = 2,110 cm−1; 4, ν1/2 = 1,850 cm−1). In each case
Van Heuvelen et al. Page 3
Inorg Chem. Author manuscript; available in PMC 2011 July 19.
NIH
-PA Author Manuscript
NIH
-PA Author Manuscript
NIH
-PA Author Manuscript

the calculated Abs intensity was scaled by a factor of 4 to facilitate a direct comparison withthe experimental spectra. Isosurface plots of key molecular orbitals (MOs) and electrondensity difference maps (EDDMs) were generated with the gOpenMol program developedby Laaksonen41 using isodensity values of 0.03 au and 0.003 au, respectively.
C. Abs and rR excitation profile data simulationsThe relevant portions of the 4 K Abs spectrum and 77 K rR excitation profiles of 4 weresimulated using time-dependent Heller theory42,43 as implemented in a MathCAD script.44
A damping factor of Γ = 500 cm−1 was used for all three excited states considered.
3. Results and AnalysisA. Spectroscopy
A.1. Abs and MCD—Previous studies revealed that the room temperature electronicabsorption (Abs) spectrum of 3 is dominated by a broad feature in the visible region (νmax =19,610 cm−1, ε = 4,800 M−1 cm−1) that was assigned as a ligand-to-metal charge transfer(LMCT) transition. The Abs spectra of 2 and 4 are qualitatively similar, each displaying abroad feature that is red-shifted relative to that of 3 by ~ 800 cm−1 and ~ 2,000 cm−1,respectively (2, νmax = 18,800 cm−1, ε = 7,500 M−1 cm−1; 4, νmax = 17,575 cm−1, ε = 4,100M−1 cm−1).21 This trend in relative Abs energies was rationalized previously in terms of thedifferent electronic properties of the thiolate substituent R. Specifically, it was proposed thatan increase in the electron-withdrawing ability of the R group stabilizes the thiolate S 3p-based orbitals and therefore increases νmax.21
Upon changing the solvent from CHCl3 to a 1:1 mixture of CHCl3:toluence and loweringthe temperature to 4 K, the dominant Abs feature of each species undergoes a blue-shift of ~250 cm−1 and displays a slight apparent decrease in intensity (2, νmax = 19,050 cm−1, ε =7,375 M−1 cm−1; 3, νmax = 19,920 cm−1, ε = 4,360 M−1 cm−1; 4, νmax = 17,840 cm−1, ε =3,020 M−1 cm−1) (Figure 2). Importantly, however, the trends in both the relative energies(3 > 2 > 4) and intensities (2 > 3 > 4) of the dominant Abs feature observed at highertemperature are preserved at 4 K. Lowering the temperature also causes a significantsharpening of the Abs features, leading to the appearance of fine structure not observable at298 K.
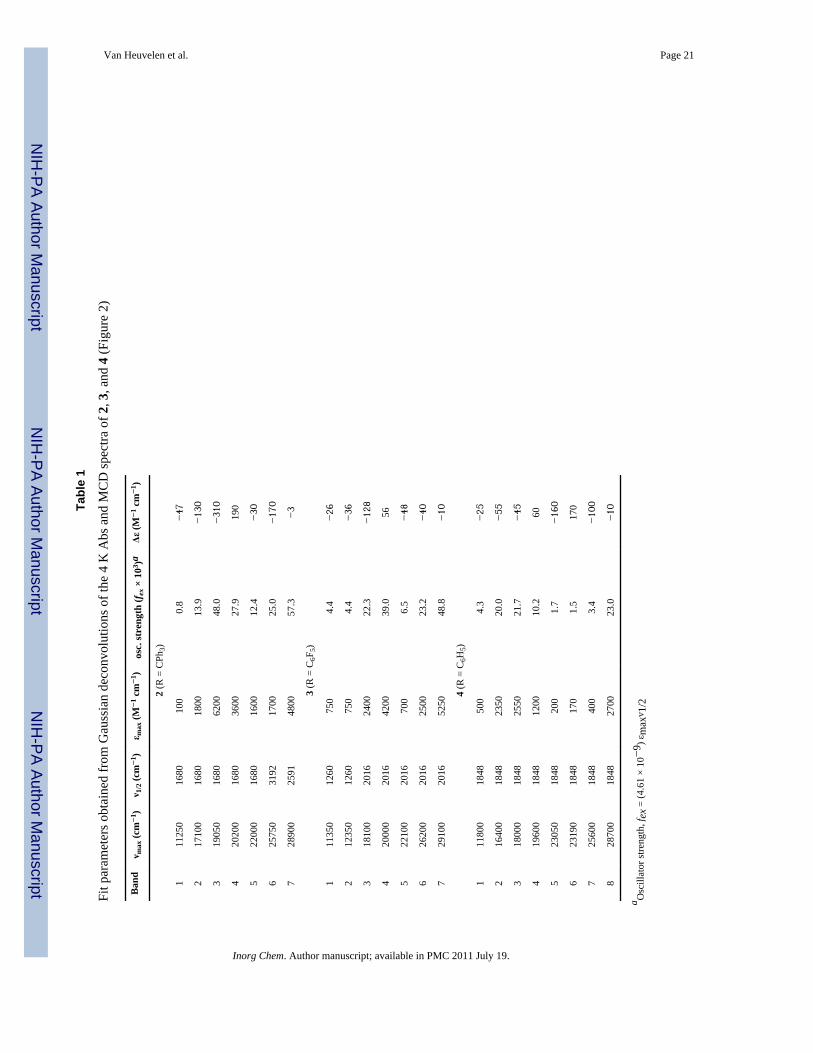
To obtain further insight into the electronic structures of 2 – 4, magnetic circular dichroism(MCD) spectroscopy was used. In each case the MCD signal intensities displayed thetemperature-dependent C-term behavior characteristic of high-spin Ni(II) species (data notshown), consistent with previously reported NMR and magnetic susceptibility data.21 TheMCD spectra of all three complexes (Figure 2) exhibit a derivative-shaped feature at ~19,000 cm−1 that can be attributed to a pseudo-A term derived from overlapping, oppositely-signed C-terms based on its temperature dependence. To determine the number of electronictransitions contributing to the 4 K Abs and MCD spectra of each Ni-thiolate species, thespectra were subjected to simultaneous Gaussian deconvolutions. This analysis revealed thata minimum of seven electronic transitions occur between 9,000 and 33,300 cm−1 for 2 and3, while an eighth Gaussian band was necessary to properly reproduce the Abs and MCDspectra of 4. The relative Abs and MCD intensities of the individual features suggest that thespectra of all three species are dominated by LMCT transitions above ~ 12,500 cm−1, whilethe lower-energy features are attributable to Ni d→d transitions. In support of these bandassignments, the Ni d→d transitions of pseudo-tetrahedral Ni(II) species containing sulfurligands typically occur between 6,500 and 12,500 cm−1·16,45 More detailed spectralassignments are provided in section 3.B.3.
Van Heuvelen et al. Page 4
Inorg Chem. Author manuscript; available in PMC 2011 July 19.
NIH
-PA Author Manuscript
NIH
-PA Author Manuscript
NIH
-PA Author Manuscript

A.2. Resonance Raman—The resonance Raman (rR) spectrum of 2 obtained with 531nm laser excitation (Figure 3, top) is characterized by an intense peak at 415 cm−1 that isassigned as the Ni–S(thiolate) stretching mode, νNi–SR, based on its energy and observedenhancement behavior (vide infra); the first overtone of this feature is apparent at 820 cm−1.As shown in Figure 3, similar vibrational features are observed in the rR spectra of 3 (νNi–SR= 404 cm−1) and 4 (νNi–SR = 436 cm−1, 2νNi–SR = 871 cm−1). For comparison, theanalogous Ni–S(thiolate) stretch of 1, which contains the same -SC6F5 moiety as 3, wasobserved at 410 cm−1.17 In addition to the intense νNi–SR band, the rR spectra of 2 – 4exhibit several weakly enhanced features at 312, 338, 388, 412, and 424 cm−1. Our previousinvestigations of [{(PhTttBu)Ni(II)}2(μ−η2:η2−S2)] revealed Ni–S(thioether) vibrationalmodes at 289, 348, and 411 cm−1.23,24 This comparison suggests that many of the weaklyenhanced features apparent in the rR spectra of 2 – 4 arise from Ni–S(thioether) vibrationsinvolving the PhTttBu supporting ligand.
The νNi–SR features in the rR spectra of 3 and 4 are significantly sharper than the 415 cm−1
band of 2, which contains both low- and high-energy shoulders. To this end, it is interestingto note that two distinct conformers of 2 were observed by X-ray crystallography, termed 2αand 2β (the latter, observed at a higher resolution than 2α, served as the basis for ourcomputational studies described below).21 Small differences in Ni–S(thiolate) bond lengthsand Ni–S–C angles between the two conformations would likely cause the energies of thecorresponding νNi–SR modes to differ slightly. However, rR spectra of 2 collected at 273 K,where a rapid interconversion between different conformations should occur, show asimilarly broad, asymmetric νNi–SR feature (see Figure S3, Supporting Information).Therefore, the 415 cm−1 rR feature of 2 is presumably a composite of several overlappingbands associated with the Ni–S(thiolate) stretch and multiple Ni–S(thioether) vibrations thatoccur in this region.
The rR excitation profile for the νNi–SR = 436 cm−1 vibrational feature of 4 is shown inFigure 4. Surprisingly, the shape of this excitation profile deviates significantly from theAbs envelope. Typically, maximum rR enhancement is observed when λex coincides withthe Abs peak position (λmax) such that the excitation profile roughly mirrors the Absspectrum. However, in the case of 4, the intensity of νNi–SR displays pre-resonanceenhancement and then falls off sharply as λex approaches λmax. The low laser power andshort scan times employed during the rR data collection suggest that this peculiar behaviordoes not originate from sample decomposition. Additionally, the use of an internal standard,namely the solvent band at 370 cm−1, in close energetic proximity to the 436 cm−1
vibrational feature and the low concentration (5 mM) of the sample ensured thatreabsorption did not distort the excitation profile. Instead, the rR excitation profile behaviorof 4 is characteristic of a de-enhancement phenomenon resulting from destructiveinterference between the Raman scattering cross sections associated with energeticallyproximate electronic excited states.42,43 Qualitatively similar, though somewhat lessdramatic, de-enhancement behavior was observed for 2 and 3 (Figures S1 and S2); therefore,only the results obtained for 4 were examined in detail (see Section 3.C).
B. ComputationsB.1. Geometry Optimizations—DFT geometry optimizations were conducted usinginitial atomic coordinates derived from the X-ray crystal structures of 2 – 4.21 As shown inTable 2, the agreement between experimental and DFT-optimized bond lengths and angles isexcellent. Importantly, the degree of distortion from ideal tetrahedral geometry observedcrystallographically, as expressed in terms of the pyramidalization parameter τ (as defined inTable 2, with τ = 0 and τ = 1 describing tetrahedral and trigonal pyramidal limitinggeometries),46 is accurately reproduced in the optimized models.
Van Heuvelen et al. Page 5
Inorg Chem. Author manuscript; available in PMC 2011 July 19.
NIH
-PA Author Manuscript
NIH
-PA Author Manuscript
NIH
-PA Author Manuscript

B.2. DFT-Computed Bonding Descriptions—Quantitative bonding descriptions for 2– 4 were generated by carrying out spin-unrestricted DFT calculations with the three-parameter B3LYP/G hybrid functional. Atomic coordinates used for these single pointcalculations were derived from the geometry-optimized models, and the supporting ligandwas truncated for computational practicality as described in section 2.B.2.
To interpret the computed molecular orbital (MO) diagrams for 2 – 4, it is useful to considerfirst the thiolate (SR) fragment orbitals participating in metal–ligand bonding.47 Thehighest-energy MOs of the SR fragments of 4 (Figure 5, top) and 3 are derived from the twosulfur 3p orbitals that are oriented perpendicular to the S–C bond vector. These orbitals arereferred to as π(ip) and π(op) based on their orientation with respect to the plane of thearomatic ring, where ip and op stand for in-plane and out-of-plane, respectively. The natureof the bonding interactions between the SR fragment orbitals and the Ni 3d orbitals isdetermined by the Ni–S–R bond angle and the pyramidalization parameter τ. The Ni–S–Rangles of 110–122° and relatively large values of τ (0.69–0.9) for 2 – 4 (Table 2) areindicative of a distorted trigonal pyramidal geometry. Consequently, the SR π(op) fragmentorbital is perpendicular with respect to the Ni–SR bond vector and interacts with the Ni3d(x2−y2) orbital in a π fashion, as illustrated by the HOMO of 4 in Figure 6. In contrast, theSR π(ip) fragment orbital is oriented roughly parallel to the Ni–SR bond and thus forms a σbond with the Ni 3d(xy) orbital (Figure 6). Comparable Ni–S π and σ interactions also occurin 2 and 3; however, in the case of 2 the delocalization of electron density over the SRmoiety is different than in 3 and 4, as the sulfur atom is not directly bound to an aromaticring (Figure 5, bottom). The implications of this difference are discussed below.
Isosurface plots of the relevant spin-down (β) MOs of 2 and 4 are plotted in Figure 6, andthe compositions of the frontier orbitals for all three complexes investigated are listed inTable 3. In each case, the lowest-energy unoccupied molecular orbital (LUMO) is derivedprimarily from the Ni 3d(x2−y2) orbital, which is π-antibonding with the SR π(op) fragmentMO and σ-antibonding with the thioether supporting ligand. The Ni 3d(z2)-derived MO(LUMO+1) is destabilized relative to the LUMO because it is strongly σ-antibonding withrespect to the Ni–thioether bonds. The highest-energy occupied MO (HOMO) is composedprimarily of the SR π(op) orbital, which is π-bonding with the Ni 3d(x2−y2) orbital. TheHOMO-1, which has predominant SR π(ip) orbital character, is stabilized relative to theHOMO because it is σ-bonding with respect to the Ni–SR bond. Toward lower energy, MOsprimarily derived from the thioether supporting ligand separate the thiolate-based HOMOand HOMO-1 from the occupied Ni 3d(xy, xz, yz)-based MOs, which are significantlystabilized relative to the unoccupied Ni 3d(x2−y2, z2) MOs.
B.3. TD-DFT Results and Spectral Assignments—The TD-DFT computed Absspectra for truncated models of 2 – 4 (section 3.B.2.) along with the correspondingexperimental spectra are shown in Figure 7. Importantly, TD-DFT properly reproduces thetrend in relative peak positions of the dominant Abs features of 2 – 4 observedexperimentally, thus warranting a more detailed analysis of the computational results.
The experimental Abs spectrum of 4 is dominated by a broad feature at 17,840 cm−1 thatwas initially assigned as a LMCT transition; this feature is well-reproduced in the TD-DFTcalculated spectrum (note that the higher energy of the calculated band relative to itsexperimental counterpart reflects the tendency of TD-DFT to overestimate the energies ofelectronic transitions48,49). An analysis of the electron density difference map (EDDM)associated with this transition reveals that electron density is transferred primarily from theSR π(op) HOMO to the Ni 3d(x2−y2)-derived LUMO (Figure 7, panels b and c). Thisassignment is consistent with the predominant enhancement of the νNi–SR vibrational modein the rR spectrum of 4 obtained with laser excitation in this region (Figure 3). The TD-DFT
Van Heuvelen et al. Page 6
Inorg Chem. Author manuscript; available in PMC 2011 July 19.
NIH
-PA Author Manuscript
NIH
-PA Author Manuscript
NIH
-PA Author Manuscript

computed Abs spectrum also permits the assignment of the weak, low-energy featureobserved experimentally (band 1 in Table 1) as a ligand-field transition and identifies thedonor and acceptor orbitals as the Ni 3d(xz + yz)- and Ni 3d(x2−y2)-based MOs,respectively (Figure 7, panel a). Due to the close energetic proximity of the SR andS(thioether) frontier orbitals, the features between ~ 25,000 and 30,000 cm–1 arise fromLMCT transitions involving both the PhTttBu supporting ligand and the SR moiety.Computations predict that intraligand electronic transitions dominate the Abs spectrumabove ~ 30,000 cm−1 (Figure 7, panel e).
The TD-DFT results for 2 and 3 indicate that similar electronic transitions occur in all threecomplexes (Figure 7), consistent with the experimental Abs spectra (Figure 2). The reducedadmixture of S(thiolate) orbital character to the Ni 3d(xz + yz)-based MO in 2 and 3 relativeto 4 leads to a decreased stabilization of this orbital and, thus, a decrease in the calculatedenergy and intensity of the low-energy ligand field transition, which is nicely verifiedexperimentally by the blue-shift of band 1 from 2 and 3 to 4 (Table 1).
C. rR Excitation Profile AnalysisThe peculiar rR excitation profile of the νNi–SR mode obtained for 4 (Figure 4) was analyzedusing time-dependent (TD) Heller theory to gain insight into the origin of this apparent de-enhancement behavior. In general, the intensity of a vibrational feature in a rR spectrum(IrR) is proportional to the square of the Raman scattering cross section (α), IrR ∝ α2,resulting in resonance enhancement behavior in which the excitation profile roughly mirrorsthe Abs spectrum in that region. However, if multiple excited states exist in close energeticproximity, which is the case for complexes 2 – 4, the Raman intensity becomes proportionalto the square of the sum of the scattering cross-sections, IrR ∝ [Σα]2.50–53 As a result, anunexpected loss of rR intensity can occur due to constructive and destructive interferencebetween the cross-sections associated with different excited states. Such interference effectscan lead to de-enhancement behavior, as observed in the case of 4.
To analyze the 4 K Abs and 77 K rR excitation profile data of 4 using TD Heller theory,42,43
we considered the excited states associated with bands 2 – 4 (Table 1, Figure 2) andincluded the Ni–S(thiolate) vibrational band, νNi–SR, at 436 cm−1 and the Ni–S(thioether)vibrational band at 411 cm−1. The zero-phonon transition energies, E0n, of the three excitedstates were estimated from the Gaussian-resolved experimental Abs spectrum and the valueof the dimensionless displacement of each state, n, in relation to the ground state along modek, (Δn,k) was systematically varied to achieve the best simultaneous fit of the experimentalAbs and rR excitation profile data (Figure 8). The optimized parameters from this analysisare presented in Table 4.
Using the parameters obtained from the TD Heller analysis of the Abs and rR excitationprofile data of 4 (Table 4), the Ni–SR bond length in the excited states corresponding toGaussian bands 2 and 3 can be estimated by treating the Ni–SR unit as a diatomic harmonicoscillator with effective masses of 58.7 and 109 g/mol for Ni and the SR moiety,respectively. This is a reasonable assumption considering that the SR moiety of 3 is 90 g/mol heavier than that of 4, which should lower νNi-SR from 436 cm−1 in 4 to 400 cm−1 in 3(exp. νNi-SR = 404 cm− in 3). The Ni–PhTttBu moiety was also treated as a diatomicharmonic oscillator with effective masses of 58.69 and 397.60 g/mol, respectively. Thegeneral formula to convert the dimensionless displacement parameters listed in Table 4 tothe nuclear distortions in each excited state is given in equation 1.53
Van Heuvelen et al. Page 7
Inorg Chem. Author manuscript; available in PMC 2011 July 19.
NIH
-PA Author Manuscript
NIH
-PA Author Manuscript
NIH
-PA Author Manuscript

(1)
Here, μ is the effective reduced mass associated with the vibrational mode considered, ω isthe energy of the vibrational mode in cm−1, and c is the speed of light in cm·s−1. To estimatethe magnitude of the Ni–S(thioether) bond length change in each excited state, δn,411 wasdivided by √3, since δn,411 = 1/√3 · (Δr1 + Δr2 + Δr3) and Δr1 = Δr2 = Δr3 (hence, Δr = δn,411/√3). The results of the excited state distortion analysis are summarized in Figure 9. Note thatbecause the first and second excited states have the same Δ values (i.e., Δ1,k ≡ Δ2,k) thenuclear distortions in these excited states are identical. The ~ 0.09 Å elongation of the Ni–SR bond in the first and second excited states is consistent with the TD-DFT-derivedassignment of the dominant Abs feature as a thiolate-to-Ni charge transfer transition (videsupra); excitation into this feature transfers electron density from the Ni–SR π-bonding SRπ(op)-based MO to the π-antibonding Ni 3d(x2−y2)-based spin-down LUMO (Figure 6).This reduces the overall bond order, which weakens and, thus, lengthens the Ni–SR bond(Figure 9). The DFT-computed bonding description for 4 predicts negligible contributions tothese MOs from the thioether supporting ligand, a finding that is corroborated by theminimal molecular distortions along the Ni–S(thioether) bonds in excited states 1 and 2.Analogous to the first and second excited states, the major distortion in the third excitedstate occurs along the Ni–SR bond (Figure 9).
4. DiscussionA. Influence of Thiolate Substituent on Electronic Properties
The structural and electronic properties of the thiolate substituent (R) strongly modulate theNi–SR bonding interactions and, thus, the observed spectroscopic properties of 2 – 4. Therelative intensities of the dominant Abs feature that arises from thiolate-to-Ni charge transfertransitions (2 > 3 > 4) clearly reflect the different electronic properties of the R groups. Incompounds 3 and 4, the sulfur is directly bound to an aryl group. Significant π interactionsbetween the S 3p atomic orbitals and the frontier orbitals of the aromatic ring result in thedelocalization of electron density onto the R moiety, thereby causing a decrease in theintensity of the dominant Abs feature. In contrast, the sulfur atom of the SR ligand of 2 isbound to an sp3-hybridized carbon atom. As a result, electron density remains morelocalized in the S 3p orbitals, and 2 exhibits the most intense thiolate-to-Ni charge transfertransition in this series of compounds. While differences in the structural parameter τ mayalso exert a small influence on the relative intensities of the observed Abs features (an idealtrigonal pyramidal geometry would improve the Ni–SR orbital overlap and thus increase theobserved molar absorptivity),21 the DFT calculations presented herein suggest that therelative intensities of the LMCT bands in these complexes are largely determined by theelectronic properties of the thiolate substituent.
On the basis of mass considerations alone, 2 with its heavy thiolate SR group should exhibitthe lowest νNi–SR frequency, followed by 3 and then 4. However, our rR data indicate thatνNi–SR of 3 occurs at a lower frequency than that of 2, consistent with the fact that thecrystallographically determined Ni–SR bond length in 3 is longer than in 2 and 4. Thisfinding indicates that several factors affect the Ni–SR stretching frequency. In fact, inaddition to the reduced mass and bond strength, mechanical coupling between nuclearmotions may also influence the frequencies of vibrational modes.54 The broadening of the415 cm−1 vibrational band observed in the rR spectrum of 2 reveals that considerable
Van Heuvelen et al. Page 8
Inorg Chem. Author manuscript; available in PMC 2011 July 19.
NIH
-PA Author Manuscript
NIH
-PA Author Manuscript
NIH
-PA Author Manuscript

mixing of Ni–S(thiother) and Ni–SR stretching motions can indeed occur in thesecompounds.
B. Influence of Supporting Ligand: Thioether versus PyrazoleThe influence of the supporting ligand on the electronic structure of Ni-thiolate compoundscan be assessed on the basis of a comparison between 1 and 3. Both are four-coordinateNi(II) species that contain a pentafluorophenyl thiolate ligand, differing only with respect totheir supporting ligands (tripodal pyrazole and thioether in 1 and 3, respectively).
Despite this latter difference, the spectroscopic properties of 1 and 3 are qualitativelysimilar. rR spectroscopic studies revealed that the νNi–SR stretching mode of 1 occurs at 410cm−1, as compared to 404 cm−1 for 3.17 Likewise, features that arise from ligand-field andcharge transfer transitions dominate the Abs and MCD spectra of each compound below andabove 13,000 cm−1, respectively.17 Nonetheless, the intense SR π(op)→Ni 3d(x2−y2)transition that dominates the Abs spectrum is blue-shifted considerably in 1 (νmax = 23,200cm−1, ε = 3,060 M−1 cm−1) versus 3 (νmax = 19,920 cm−1, ε = 4,360 M−1 cm−1). Thisdifference can be understood by noting that the PhTttBu thioether-based frontier orbitals of 3are in close energetic proximity to the fragment orbitals derived from the thiolate moiety,thereby destabilizing the SR π(op) and π(ip) orbitals and causing a red-shift of the SR π(op)→Ni transition in 3 relative to 1.
The spectroscopic similarities between 1 and 3 are also reflected in the DFT-computedelectronic structure descriptions for these two compounds. The spin-down LUMO andLUMO+1 have predominantly Ni 3d(x2−y2) and Ni 3d(z2) orbital character, respectively,while the HOMO and HOMO-1 are derived from the SR π(op) and SR π(ip) fragmentorbitals, respectively. The Ni–S(thiolate) bond covalency, as judged from the DFT-computed compositions of the LUMO, is comparable in 1 and 3 (the LUMO of eachcompound contains 8% and 12% S 3p orbital character, respectively).17 Collectively, theseresults demonstrate that, while the substitution of a thioether for a pyrazole supportingligand slightly stabilizes the SR fragment orbitals and causes a red-shift of the dominantLMCT transition, the spectroscopic properties and electronic structures of 1 and 3 arequalitatively very similar.
This finding, namely that the Ni-thiolate interaction is the principle contributor to theelectronic structures of 1 and 3, agrees with our current understanding of Ni-containingenzymes. Ni–S(cysteine) ligation is a common feature in the active sites of redox-active Nimetalloenzymes,8 and in the case of NiSOD this highly covalent bonding interaction isthought to tune the Ni(III/II) redox potential such as to provide access to the Ni(III) state inthe catalytic cycle.55,56 The influence of the thiolate ligand on redox potential is evident inthe previously reported Ni(II/I) redox couples of 2 – 4, which vary by ~140 mV as afunction of the electron withdrawing properties of the R group (E1/2 = −1.03 V, 3; −1.11 V,2; −1.17 V, 4, vs. Fc(+/0).21
5. ConclusionsIn this study, we have employed a combination of spectroscopic and computational methodsto characterize a series of high-spin Ni(II)-thiolate complexes and obtained significant newinsight into the nature of their Ni–S(thiolate) bonding interactions. The rR excitation profiledata of 2 – 4 exhibit de-enhancement behavior characteristic of interference effectsinvolving multiple electronic excited states, which were analyzed for 4 in the framework ofTD Heller theory. The calculated 0.09 Å elongation of the Ni–SR bond in the excited stateassociated with the dominant Abs feature supports the TD-DFT-based assignment of thisfeature as a thiolate-to-Ni charge transfer transition. A comparison of the spectroscopic data
Van Heuvelen et al. Page 9
Inorg Chem. Author manuscript; available in PMC 2011 July 19.
NIH
-PA Author Manuscript
NIH
-PA Author Manuscript
NIH
-PA Author Manuscript
obtained for 2 – 4 demonstrates that the nature of the thiolate substituent has a profoundinfluence on the electronic properties of Ni(II) thiolate compounds.
Supplementary MaterialRefer to Web version on PubMed Central for supplementary material.
AcknowledgmentsThis work has been supported by the NIH (GM 64631 to T.C.B.), the NSF Graduate Research Fellowship program(K.M.V.H.), and by the NSF (CHE-0518508 and CHE-0809603 to C.G.R.). We thank Professor Frank Neese,Universität Bonn, for providing us with a free copy of ORCA.
References and Notes1. Darnault C, Volbeda A, Kim EJ, Legrand P, Vernede X, Lindahl PA, Fontecilla-Camps JC. Nat.
Struct. Biol. 2003; 10:271–279. [PubMed: 12627225]2. Higuchi Y, Yagi T, Yasuoka N. Structure. 1997; 5:1671–1680. [PubMed: 9438867]3. Volbeda A, Charon MH, Piras C, Hatchikian EC, Frey M, Fontecilla-Camps JC. Nature. 1995;
373:580–587. [PubMed: 7854413]4. Volbeda A, Garcin E, Piras C, de Lacey AL, Fernandez VM, Hatchikian EC, Frey M, Fontecilla-
Camps JC. J. Am. Chem. Soc. 1996; 118:12989–12996.5. Barondeau DP, Kassmann CJ, Bruns CK, Tainer JA, Getzoff ED. Biochemistry. 2004; 43:8038–
8047. [PubMed: 15209499]6. Wuerges J, Lee JW, Yim YI, Yim HS, Kang SO, Carugo KD. Proc. Nat. Acad. Sci. U.S.A. 2004;
101:8569–8574.7. Harmer J, Finazzo C, Piskorski R, Ebner S, Duin EC, Goenrich M, Thauer RK, Reiher M,
Schweiger A, Hinderberger D, Jaun B. J. Am. Chem. Soc. 2008; 130:10907–10920. [PubMed:18652465]
8. Maroney MJ. Curr. Opin. Chem. Biol. 1999; 3:188–199. [PubMed: 10226043]9. Ram MS, Riordan CG, Ostrander R, Rheingold AL. Inorg. Chem. 1995; 34:5884–5892.10. Fox DC, Fiedler AT, Halfen HL, Brunold TC, Halfen JA. J. Am. Chem. Soc. 2004; 126:7627–
7638. [PubMed: 15198611]11. MacBeth CE, Thomas JC, Betley TA, Peters JC. Inorg. Chem. 2004; 43:4645–4662. [PubMed:
15257594]12. Stibrany RT, Fox S, Bharadwaj PK, Schugar HJ, Potenza JA. Inorg. Chem. 2005; 44:8234–8242.
[PubMed: 16270960]13. Holm RH, Kennepohl P, Solomon EI. Chem. Rev. 1996; 96:2239–2314. [PubMed: 11848828]14. Solomon EI, Szilagyi RK, DeBeer George S, Basumallick L. Chem. Rev. 2004; 104:419–458.
[PubMed: 14871131]15. Holland PL, Tolman WB. J. Am. Chem. Soc. 2000; 122:6331–6332.16. Matsunaga Y, Fujisawa K, Ibi N, Miyashita Y, Okamoto K.-i. Inorg. Chem. 2005; 44:325–335.
[PubMed: 15651879]17. Gorelsky SI, Basumallick L, Vura-Weis J, Sarangi R, Hodgson KO, Hedman B, Fujisawa K,
Solomon EI. Inorg. Chem. 2005; 44:4947–4960. [PubMed: 15998022]18. Chattopadhyay S, Deb T, Ma H, Petersen JL, Young VG, Jensen M,P. Inorg. Chem. 2008;
47:3384–3392. [PubMed: 18345601]19. Schebler PJ, Riordan CG, Guzei IA, Rheingold AL. Inorg. Chem. 1998; 37:4754–4755. [PubMed:
11670635]20. Craft JL, Mandimutsira BS, Fujita K, Riordan CG, Brunold TC. Inorg. Chem. 2003; 42:859–867.
[PubMed: 12562200]21. Cho J, Yap GPA, Riordan CG. Inorg. Chem. 2007; 46:11308–11315. [PubMed: 18001122]
Van Heuvelen et al. Page 10
Inorg Chem. Author manuscript; available in PMC 2011 July 19.
NIH
-PA Author Manuscript
NIH
-PA Author Manuscript
NIH
-PA Author Manuscript

22. Cho J, Van Heuvelen KM, Yap GPA, Brunold TC, Riordan CG. Inorg. Chem. 2008; 47:3931–3933. [PubMed: 18410087]
23. Schenker R, Mandimutsira BS, Riordan CG, Brunold T. J. Am. Chem. Soc. 2002; 124:13842–13855. [PubMed: 12431115]
24. Van Heuvelen KM, Cho J, Riordan CG, Brunold TC. Inorg. Chem. 2010; 49:3113–3120.[PubMed: 20199100]
25. Mandimutsira BS, Yamarik JL, Brunold TC, Gu W, Cramer SP, Riordan CG. J. Am. Chem. Soc.2001; 123:9194–9195. [PubMed: 11552841]
26. Ohrenberg C, Ge PH, Schebler P, Riordan CG, Yap GPA, Rheingold AL. Inorg. Chem. 1996;35:749–754.
27. Baerends EJ, Ellis DE, Ros P. Chem. Phys. 1973; 2:41.28. Guerra CF, Snijders JG, te Velde G, Baerends EJ. Theor. Chem. Acc. 1998; 99:391–403.29. Velde GT, Baerends EJ. Journal of Computational Physics. 1992; 99:84–98.30. Versluis L, Ziegler T. J. Chem. Phys. 1988; 88:322–328.31. Vosko SH, Wilk L, Nusair M. Can. J. Phys. 1980; 58:1200–1211.32. Becke AD. J. Chem. Phys. 1986; 84:4524–4529.33. Perdew JP. Physical Review B. 1986; 33:8822–8824.34. Neese, F. ORCA 2.6.35, an ab initio, density functional, and semiempirical program package.
Max-Planck-Institut für Bioanorganische Chemie; Mülheim an der Ruhr, Germany: 2008.35. Becke AD. J. Chem. Phys. 1993; 98:5648–5652.36. Becke AD. J. Chem. Phys. 1993; 98:1372–1377.37. Lee CT, Yang WT, Parr RG. Physical Review B. 1988; 37:785–789.38. Schafer A, Horn H, Ahlrichs R. J. Chem. Phys. 1992; 97:2571–2577.39. Weigend F, Haser M. Theor. Chem. Acc. 1997; 97:331–340.40. The Ahlrichs DZ basis set was obtained from the TurboMole basis set library under
ftp.chemi.uni-karlsruhe.de/pub/basen41. Laaksonen L. Journal of Molecular Graphics. 1992; 10:33–34. [PubMed: 1504051]42. Bailey SE, Cohan JS, Zink JI. J. Phys. Chem. B. 2000; 104:10743–10749.43. Kim Shin KS, Zink JI. J. Am. Chem. Soc. 1990; 112:7148–7157.44. MathCAD, Professional 2001i. MathSoft Engineering & Education, Inc.; Cambridge, MA: 2001.45. Lever, ABP. Inorganic Electronic Spectroscopy. 2nd ed.. Elsevier Science Publishing Co., Inc.;
New York: 1984.46. Vela J, Stoian S, Flaschenriem CJ, Munck E, Holland PL. J. Am. Chem. Soc. 2004; 126:4522–
4523. [PubMed: 15070362]47. The MOs described herein are derived from a Löwdin population analysis48. Craft JL, Horng YC, Ragsdale SW, Brunold TC. J. Biol. Inorg. Chem. 2004; 9:77–89. [PubMed:
14663648]49. Schenker R, Kieber-Emmons MT, Riordan CG, Brunold TC. Inorg. Chem. 2005; 44:1752–1762.
[PubMed: 15762702]50. Heller EJ, Sundberg RL, Tannor D. J. Phys. Chem. 1982; 86:1822–1833.51. Lee S-Y, Heller EJ. J. Chem. Phys. 1979; 71:4777–4788.52. Tannor DJ, Heller EJ. J. Chem. Phys. 1982; 77:202–218.53. Zink, JI.; Kim Shin, K-S. Molecular Distortions in Excited Electronic States Determined From
Electronic and Resonance Raman Spectroscopy. In: Volman, DH.; Hammond, GS.; Neckers, DC.,editors. Advances in Photochemistry. Vol. Vol. 16. Wiley; New York: 1991.
54. Brunold TC, Tamura N, Kitajima N, Moro-oka Y, Solomon EI. J. Am. Chem. Soc. 1998;120:5674–5690.
55. Choudhury SB, Lee J-W, Davidson G, Yim Y-I, Bose K, Sharma ML, Kang S-O, Cabelli DE,Maroney MJ. Biochemistry. 1999; 38:3744–3752. [PubMed: 10090763]
56. Johnson OE, Ryan KC, Maroney MJ, Brunold TC. J. Biol. Inorg. Chem. 2010; 15:777–793.[PubMed: 20333422]
Van Heuvelen et al. Page 11
Inorg Chem. Author manuscript; available in PMC 2011 July 19.
NIH
-PA Author Manuscript
NIH
-PA Author Manuscript
NIH
-PA Author Manuscript

Figure 1.Structures of compounds 2, 3, and 4. H atoms are omitted for clarity. Note that the Ni-S(thiolate) bond vector roughly bisects the x- and y-axes of the molecular coordinate systemshown in the bottom left corner.
Van Heuvelen et al. Page 12
Inorg Chem. Author manuscript; available in PMC 2011 July 19.
NIH
-PA Author Manuscript
NIH
-PA Author Manuscript
NIH
-PA Author Manuscript

Figure 2.Abs and 7 T MCD spectra collected at 4 K of 2 (top), 3 (middle), and 4 (bottom), along withthe individual Gaussian bands (---) and their sums (…) as obtained from combined fits ofthese data sets. The fit parameters are summarized in Table 1.
Van Heuvelen et al. Page 13
Inorg Chem. Author manuscript; available in PMC 2011 July 19.
NIH
-PA Author Manuscript
NIH
-PA Author Manuscript
NIH
-PA Author Manuscript
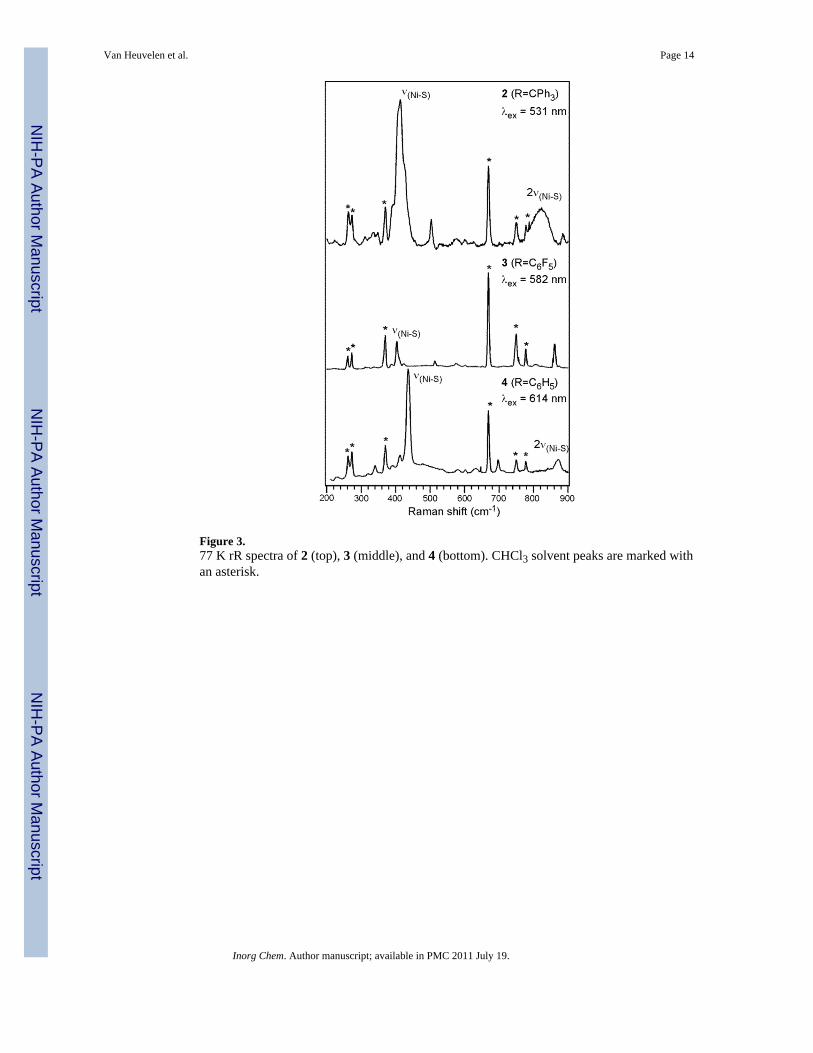
Figure 3.77 K rR spectra of 2 (top), 3 (middle), and 4 (bottom). CHCl3 solvent peaks are marked withan asterisk.
Van Heuvelen et al. Page 14
Inorg Chem. Author manuscript; available in PMC 2011 July 19.
NIH
-PA Author Manuscript
NIH
-PA Author Manuscript
NIH
-PA Author Manuscript

Figure 4.rR excitation profile of the νNi–SR vibrational mode (▲) along with the 4 K Abs spectrum(solid line) of 4.
Van Heuvelen et al. Page 15
Inorg Chem. Author manuscript; available in PMC 2011 July 19.
NIH
-PA Author Manuscript
NIH
-PA Author Manuscript
NIH
-PA Author Manuscript

Figure 5.Isosurface plots of the highest-energy occupied MOs of the SR fragments of 4 (top) and 2(bottom). Note that the π(ip) and π(op) nomenclature is somewhat arbitrary in the case of 2.
Van Heuvelen et al. Page 16
Inorg Chem. Author manuscript; available in PMC 2011 July 19.
NIH
-PA Author Manuscript
NIH
-PA Author Manuscript
NIH
-PA Author Manuscript

Figure 6.Partial MO energy diagrams for 2, 3, and 4 obtained from spin-unrestricted DFTcalculations, along with isosurface plots of the key MOs for 2 and 4. Only the spin-down (β)MOs are shown, and their energies are given relative to that of the corresponding LUMO.The relevant MOs are labeled according to their primary contributors.
Van Heuvelen et al. Page 17
Inorg Chem. Author manuscript; available in PMC 2011 July 19.
NIH
-PA Author Manuscript
NIH
-PA Author Manuscript
NIH
-PA Author Manuscript

Figure 7.Top: TD-DFT-predicted (dashed line) and experimental 4 K (solid line) Abs spectra of 2(top), 3 (middle), and 4 (bottom). The calculated intensities were scaled by a factor of 1/4 tofacilitate a direct comparison with the experimental spectra. Bottom: Electron densitydifference maps (EDDMs) showing the loss and gain of electron density (gray and green,respectively) for select transitions of 4.
Van Heuvelen et al. Page 18
Inorg Chem. Author manuscript; available in PMC 2011 July 19.
NIH
-PA Author Manuscript
NIH
-PA Author Manuscript
NIH
-PA Author Manuscript
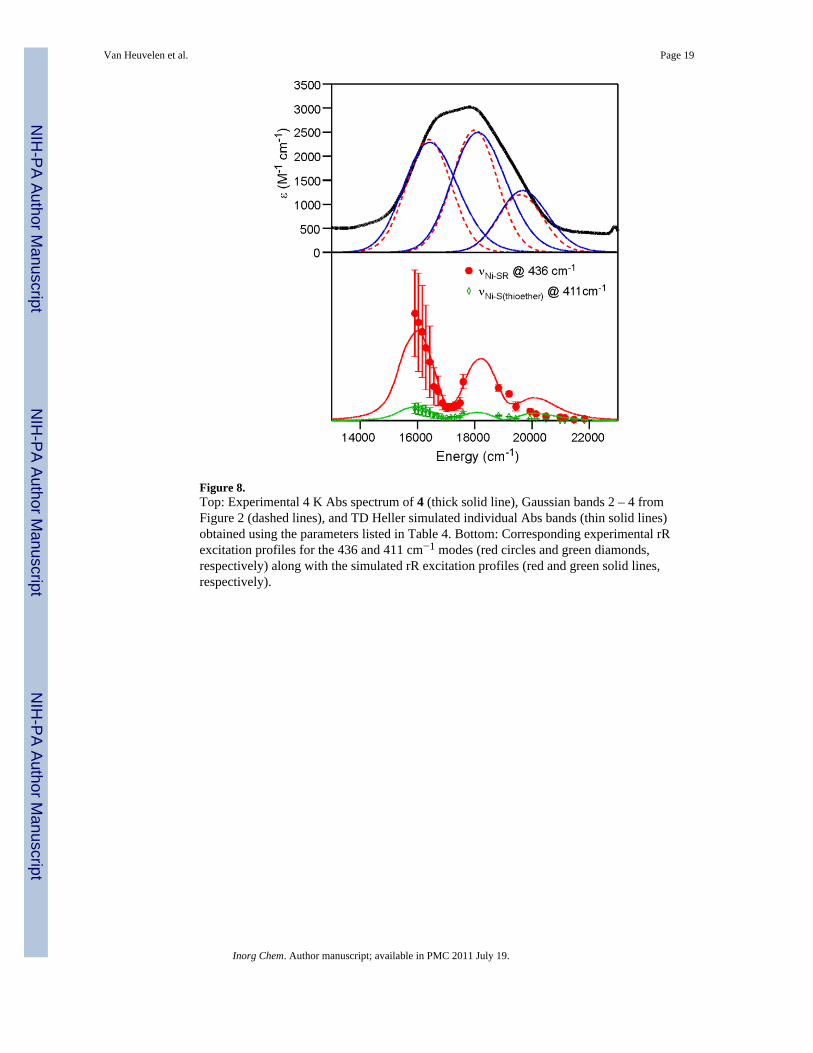
Figure 8.Top: Experimental 4 K Abs spectrum of 4 (thick solid line), Gaussian bands 2 – 4 fromFigure 2 (dashed lines), and TD Heller simulated individual Abs bands (thin solid lines)obtained using the parameters listed in Table 4. Bottom: Corresponding experimental rRexcitation profiles for the 436 and 411 cm−1 modes (red circles and green diamonds,respectively) along with the simulated rR excitation profiles (red and green solid lines,respectively).
Van Heuvelen et al. Page 19
Inorg Chem. Author manuscript; available in PMC 2011 July 19.
NIH
-PA Author Manuscript
NIH
-PA Author Manuscript
NIH
-PA Author Manuscript

Figure 9.Experimentally derived nuclear distortions of 4 in the first, second, and third excited statescorresponding to Gaussian bands 2, 3, and 4 in Figures 2 and 8.
Van Heuvelen et al. Page 20
Inorg Chem. Author manuscript; available in PMC 2011 July 19.
NIH
-PA Author Manuscript
NIH
-PA Author Manuscript
NIH
-PA Author Manuscript
NIH
-PA Author Manuscript
NIH
-PA Author Manuscript
NIH
-PA Author Manuscript
Van Heuvelen et al. Page 21
Tabl
e 1
Fit p
aram
eter
s obt
aine
d fr
om G
auss
ian
deco
nvol
utio
ns o
f the
4 K
Abs
and
MC
D sp
ectra
of 2
, 3, a
nd 4
(Fig
ure
2)
Ban
dν m
ax (c
m−
1 )ν 1
/2 (c
m−
1 )ε m
ax (M
−1 c
m−
1 )os
c. st
reng
th (f
ex ×
103 )
aΔε
(M−
1 cm
−1 )
2 (R
= C
Ph3)
111
250
1680
100
0.8
−47
217
100
1680
1800
13.9
−130
319
050
1680
6200
48.0
−310
420
200
1680
3600
27.9
190
522
000
1680
1600
12.4
−30
625
750
3192
1700
25.0
−170
728
900
2591
4800
57.3
−3
3 (R
= C
6F5)
111
350
1260
750
4.4
−26
212
350
1260
750
4.4
−36
318
100
2016
2400
22.3
−128
420
000
2016
4200
39.0
56
522
100
2016
700
6.5
−48
626
200
2016
2500
23.2
−40
729
100
2016
5250
48.8
−10
4 (R
= C
6H5)
111
800
1848
500
4.3
−25
216
400
1848
2350
20.0
−55
318
000
1848
2550
21.7
−45
419
600
1848
1200
10.2
60
523
050
1848
200
1.7
−160
623
190
1848
170
1.5
170
725
600
1848
400
3.4
−100
828
700
1848
2700
23.0
−10
a Osc
illat
or st
reng
th, f
ex =
(4.6
1 ×
10−
9 ) ε
maxν 1
/2
Inorg Chem. Author manuscript; available in PMC 2011 July 19.

NIH
-PA Author Manuscript
NIH
-PA Author Manuscript
NIH
-PA Author Manuscript
Van Heuvelen et al. Page 22
Tabl
e 2
Expe
rimen
tal a
nd c
alcu
late
d st
ruct
ural
par
amet
ers f
or 2
– 4
2 (R
= C
Ph3)
3 (R
= C
6F5)
4 (R
= C
6H5)
Exp
.C
alc.
Exp
.C
alc.
Exp
.C
alc.
Ni–
SR (Å
)2.
184
2.19
62.
235
2.23
82.
186
2.21
0
Ni–
S(Ph
TttB
u ) (Å
)2.
312
2.35
82.
329
2.31
42.
295
2.31
3
2.29
42.
302
2.28
42.
290
2.30
02.
284
2.34
72.
332
2.29
22.
336
2.28
52.
319
Ni–
S-R
122.
0°12
4.2°
110.
5°11
3.2°
111.
6°11
3.4°
τ a0.
900.
820.
740.
740.
690.
69
a τ =
[Σ∠
(Lba
sal−
M−
L bas
al) −
Σ∠
(Lax
ial−
M−
L bas
al)]
/90°
, see
ref.
46.
Inorg Chem. Author manuscript; available in PMC 2011 July 19.

NIH
-PA Author Manuscript
NIH
-PA Author Manuscript
NIH
-PA Author Manuscript
Van Heuvelen et al. Page 23
Tabl
e 3
Ener
gies
(in
eV) a
nd c
ompo
sitio
ns (%
) of t
he re
leva
nt N
i 3d-
and
SR
π-b
ased
spin
-dow
n (β
) MO
s (se
e Fi
gure
6 fo
r MO
plo
ts)
E (e
V)
MO
aO
cc.b
Ni
S(th
iola
te)
Rph
TttB
u
2 (R
= C
Ph3)
−2.62
Ni 3
d(LU
MO
+1)
057
x2 −
y2 , 2
z220
318
−2.68
Ni 3
d (L
UM
O)
063
z2 ,
5 xy
12
29
−5.79
SR π
(op)
(HO
MO
)1
7 x2 −
y252
1526
−5.89
SR π
(ip) (
HO
MO−
1)1
4 xz
, 4 x
y54
1226
3 (R
= C
6F5)
−2.95
Ni 3
d(LU
MO
+1)
068
z2 ,
3 yz
11
27
−3.05
Ni 3
d (L
UM
O)
060
x2 −
y2 , 1
z211
622
−6.05
SR π
(op)
(HO
MO
)1
5 x2 −
y246
3019
−6.63
SR π
(ip) (
HO
MO−
1)1
6 xz
, 9 x
y47
335
4 (R
= C
6H5)
−2.68
Ni 3
d (L
UM
O+1
)0
50 z
2 , 14
x2 −
y25
526
−2.71
Ni 3
d (L
UM
O)
042
x2 −
y2 , 14
z2
126
16
−5.50
SR π
(op)
(HO
MO
)1
10 x
2 −y2
4134
15
−6.16
SR π
(ip) (
HO
MO−
1)1
7 xz
, 2 y
z, 8
xy
534
26
a prin
cipa
l orb
ital c
ontri
buto
r
b occu
panc
y of
cor
resp
ondi
ng M
O
Inorg Chem. Author manuscript; available in PMC 2011 July 19.

NIH
-PA Author Manuscript
NIH
-PA Author Manuscript
NIH
-PA Author Manuscript
Van Heuvelen et al. Page 24
Table 4
Excited-state parameters determined by simultaneous fitting of the Abs and rR excitation profile data of 4using TD Heller theory
Parameter State 1 State 2 State 3
E0n (cm−1)a 15,100 17,050 18,950
Δ 411 0.8 0.8 1.0
Δ 436 1.9 1.9 1.3
aE0n is the energy of the zero-phonon transition between the ground state and excited state n.
Inorg Chem. Author manuscript; available in PMC 2011 July 19.