Species diversity and community structure in sal (Shorea robusta) forests of two different rainfall...
16
1 23 Biodiversity and Conservation ISSN 0960-3115 Volume 21 Number 5 Biodivers Conserv (2012) 21:1215-1228 DOI 10.1007/s10531-012-0264-8 Species diversity and community structure in sal (Shorea robusta) forests of two different rainfall regimes in West Bengal, India Satya Prakash Singh Kushwaha & Subrata Nandy
Transcript of Species diversity and community structure in sal (Shorea robusta) forests of two different rainfall...

1 23
Biodiversity and Conservation ISSN 0960-3115Volume 21Number 5 Biodivers Conserv (2012) 21:1215-1228DOI 10.1007/s10531-012-0264-8
Species diversity and community structurein sal (Shorea robusta) forests of twodifferent rainfall regimes in West Bengal,India
Satya Prakash Singh Kushwaha &Subrata Nandy

1 23
Your article is protected by copyright and
all rights are held exclusively by Springer
Science+Business Media B.V.. This e-offprint
is for personal use only and shall not be self-
archived in electronic repositories. If you
wish to self-archive your work, please use the
accepted author’s version for posting to your
own website or your institution’s repository.
You may further deposit the accepted author’s
version on a funder’s repository at a funder’s
request, provided it is not made publicly
available until 12 months after publication.

ORI GIN AL PA PER
Species diversity and community structure in sal(Shorea robusta) forests of two different rainfallregimes in West Bengal, India
Satya Prakash Singh Kushwaha • Subrata Nandy
Received: 16 November 2011 / Accepted: 17 February 2012 / Published online: 4 March 2012� Springer Science+Business Media B.V. 2012
Abstract Knowledge on the structure and composition of the plant communities has
enormous significance in conservation and management of forests. The present study aimed
to assess the community attributes, viz., structure, composition and diversity in the moist
and dry sal (Shorea robusta) forests in the West Bengal province of India and compare them
with the other sal forests of India. The phytosociological data from these forests were
quantitatively analysed to work out the species richness, diversity, evenness, dominance,
importance value, stand density and the basal area. The analysis showed that plant richness
and diversity in moist sal forests of northern West Bengal are higher than the dry sal forests
of south-west Bengal; a total of 134 tree (cbh C30 cm), 113 shrub and 230 herb species were
recorded in the moist sal forest compared to 35 tree, 41 shrub and 96 herb species in dry sal
forest. Papilionaceae was observed to be the dominant family. Dry sal forests had higher
tree dominance (0.81) and stand density (1,006 stems ha-1) but lower basal area (19.62
m2ha-1) while moist sal forest had lower tree dominance (0.18) and stand density (438
stems ha-1) but higher basal area (56.52 m2ha-1). Tree species richness and stem density
across girth classes in both the types decreased from the smallest to largest trees, while the
occurrence rate of species increased with increase in girth class. A t-test showed significant
differences in species richness, basal area and the stand density at 95% confidence level
(p = \0.05) in the two forest types. The CCA indicated very low overall match (canonical
correlation value = 0.40) between the two sets of variables from moist and dry sal types.
The differences in these forests could be attributed to the distinct variations in climatic
conditions- mainly the rainfall, disturbance regimes and the management practices.
Keywords Diversity � Dominance � Rainfall � Sal forest � Species occurrence
Electronic supplementary material The online version of this article (doi:10.1007/s10531-012-0264-8)contains supplementary material, which is available to authorized users.
S. P. S. Kushwaha (&) � S. NandyForestry and Ecology Department, Indian Institute of Remote Sensing, Indian Space ResearchOrganisation, Dehradun 248001, Indiae-mail: [email protected]
S. Nandye-mail: [email protected]
123
Biodivers Conserv (2012) 21:1215–1228DOI 10.1007/s10531-012-0264-8
Author's personal copy

Introduction
Sal (Shorea robusta) is one of the most important timber trees in India. Sal forest is widely
distributed in tropical India and covers approx. 13.30 per cent of the total forest area of the
country (Satya and Nayaka 2005). As per Champion and Seth (1968), it is one of the
dominant tree species in the tropical moist as well as dry deciduous forests in India. The
leaf phenology of sal has been debated in past due to its evergreen versus deciduous
paradox (Troup 1921). Sal has been described by several workers as a deciduous species
(Cooke 1958; Kirtikar and Basu 1975; Tiwari 1995), semi-deciduous species (Bor 1953),
an evergreen species (Krishnaswamy and Mathauda 1954; Singh and Singh 1992; Borchert
2000), and deciduous or borderline between evergreen and deciduous (Joshi 1980). Sal
occurs generally as gregarious formation and tends to form pure stands to mixed forests in
the Himalayan foothills and central India (Troup 1921). In the Himalayan foothills, it
extends from Kangra area of Himachal Pradesh to Assam valley (including Meghalaya and
Tripura provinces) in the eastern Himalaya through Uttarakhand, Uttar Pradesh, Nepal,
Bihar and northern West Bengal (Satya and Nayaka 2005) up to approx. 1,000 m elevation.
Sal forests have been under selective logging for the timber over time.
To meet the timber demand of an ever-increasing population over the past few decades,
large natural habitats of sal were converted into agricultural, industrial or urban landscapes,
leading to habitat fragmentation and loss of the biodiversity (Jacquemyn et al. 2003). The
structure and composition of forests are strongly related to the climate and topography
(Schall and Pinaka 1978; Wright 1983; Currie 1991). However, the knowledge on the
structure, composition or dynamics of tropical forests is still inadequate (Hubbell and
Foster 1992). Phytosociological analysis helps in understanding the structure and com-
position of plant communities (Braun-Blanquet 1965). Quantitative inventories also help in
the identification of economically useful species as well as the species of special concern,
i.e. rare, endangered, endemic, threatened or vulnerable species (Keel et al. 1993) and thus
have enormous implications in the conservation and management of tropical forests
(Campbell 1994). Various workers have studied Indian sal forests (Gupta and Shukla 1991;
Singh et al. 1995). Uma Shankar et al. (1998a) compared the natural sal forest of Dar-
jeeling Himalaya with regard to habitat alteration, species loss and the ecosystem recovery
related to taungya plantation. Changes in the diversity and the community pattern in
relation to the degree of disturbance were studied by Pandey and Shukla (1999). Uma
Shankar (2001) studied phytosociological attributes in a sal-dominated lowland forest of
eastern Himalaya. In a recent study using remote sensing, GIS and field investigations,
IIRS (2007) reported high biological richness in moist and low biological richness in dry
sal forests. It also indicted lower forest fragmentation in moist sal compared to dry sal
forest, thereby indicating an inverse relationship between the forest fragmentation and
biological richness.
Sal forests in West Bengal can be differentiated into two extreme types- the dry and the
moist sal (Troup 1921). Champion and Seth (1968) have classified moist sal forests as
Northern Tropical Moist Deciduous Forest (3C) and dry sal forests as Northern TropicalDry Deciduous Forest (5B). Moist sal areas are confined to the Sub-Himalayan West
Bengal in Darjeeling and Jalpaiguri districts with deep, moist, nutrient-rich terai soil,
whereas dry sal forests are restricted to the south-western West Bengal in the districts of
West Medinipur, Bankura, Purulia, Bardhaman and Birbhum with dry, denuded or hard
ground shallow lateritic soil (Chakravarty and Chakravarty 1957). In dry type, the com-
monest companions of the sal are Buchanania lanzan, Diospyros tomentosa and D. mel-anoxylon. The average stand height of the moist sal in northern West Bengal is *35 m
1216 Biodivers Conserv (2012) 21:1215–1228
123
Author's personal copy

while the same in dry sal forest of south-western Bengal is *20 m. The moist type is
characterized by higher rainfall combined with relatively lower temperature and consid-
erably higher humidity. The moist sal is associated with various evergreen species.
Both the categories of forests are fire climaxes. The moist sal, if protected from fire, will
succeed to evergreen forest beneath whose canopy sal seedlings fail to regenerate
(Champion and Seth 1968). Moist sal, therefore, has an understorey of evergreens, which
includes canopy species juveniles, while dry sal does not. Cattle grazing and an increased
human-induced fire frequency have led to vast areas appearing to meet the dry sal criterion
through extinction of evergreens, though these usually persist in swales and along rivers.
As stated earlier, the climatic, anthropogenic factors as well as management practices seem
to regulate the species diversity and community structure in these forests. During one of
our earlier studies spanning over entire West Bengal province, we noticed considerable
physiognomic differences in the moist and dry sal forests. So far, no study has been carried
out on the diversity and community structure in these two climatically distinct sal forests.
We, therefore, undertook the present study to analyze the structure, composition, pattern of
distribution and the diversity in two sal forests of West Bengal and compare them with the
other sal forests in India.
Study area
The West Bengal province (21�450–27�160N and 85�550–89�560E), covers a geographical
area of 88,752 km2 in India (Fig. 1). With 2.70 per cent of the country’s geographical area,
the province supports 7.81 per cent of the India’s population and holds highest average
population density record of 904 persons per km2 in the country. The rising population
density sounds an alarm as it tends to make more demand on the limited forest and other
natural resources of the State. The State is bounded in the north by Sikkim province and the
Bhutan, in the east by Assam province and the Bangladesh, in the south by Bay of Bengal,
in the west by Jharkhand and Orissa provinces and in the northwest by Bihar province and
the Nepal. The State is a unique biogeographic area from biodiversity point of view as it
stretches between the Bay of Bengal in the south and high Himalayas in the north i.e. from
mean sea level to 3,685 m elevation (sea to snow). The state is endowed with the
impressive littoral forests of the Sunderbans (largest mangrove formation in India), moist
deciduous forests of the Himalayan foothills, to temperate forests and alpine grasslands in
the north.
Climate in West Bengal varies from moist tropical in the southeast and the Sub-Hima-
layan Northern West Bengal to dry tropical in the south-west, and from sub-tropical to
temperate in the mountains of north. Annual rainfall varies from 1,400 mm in south-west to
2,800 mm in the north. The temperature ranges from sub-zero in the north during the winter
to about 45�C in the south during summer. The average annual rainfall (India Meteoro-
logical Department 25-year mean) is 2,739 mm in the northern West Bengal and 1,439 mm
in the Gangetic West Bengal (including south-western area). In a recent study, Samanta
et al. (2011) worked out the annual rainfall distribution pattern in West Bengal using data
from Climatic Research Unit of East Anglia, U.K. and India Meteorological Department
(IMD) for 1901–2002 period. They concluded that northern Bengal receives an annual
rainfall of 2,600–2,800 mm while south-western Bengal receives 1,400–1,600 mm annual
rainfall. Thus, the northern and the south-western sal forests have considerably different
rainfall, temperature and edaphic conditions and this contrast in climatic conditions is
attributed to the development of the moist and dry sal forests.
Biodivers Conserv (2012) 21:1215–1228 1217
123
Author's personal copy

The Province can be divided into five broad agro-ecological zones, viz., the Darjeeling
Himalayas, Sub-Himalayan West Bengal, the Central Alluvial Tract, the Laterite Tract,
and the Coast. The forests of the state are mainly concentrated in three regions; the north,
the south and the south-west. The moist sal forests are found on the lowest slopes of outer
Himalayas from around 1,000 m in the hills to plains of ‘duar’. Word ‘terai’ is used for
Fig. 1 Location of the study area in India
1218 Biodivers Conserv (2012) 21:1215–1228
123
Author's personal copy
similar land in Sub-Himalayan Indo-Gangetic region in northern India. The south-western
part of the state is an extension of the Chotanagpur Plateau with dry sal forests in West
Bengal, Jharkhand and the adjoining Bihar. The biodiversity of the state is under severe
threat due to an ever-increasing demand for fodder, medicinal plants, land for agriculture,
industry, settlements and the hydroelectric projects. Excessive extraction of forest pro-
duces, over-grazing and the man-made forest fires are also responsible for forest degra-
dation and depletion (IIRS 2007). No natural fires are reported from the area.
Methods
The stratified random sampling approach was followed for phytosociological survey in the
present study. Sampling was done in all the strata i.e. trees, shrubs and herbs. The size of
the quadrat for sampling of trees, shrubs and herbs was determined by species-area-curve
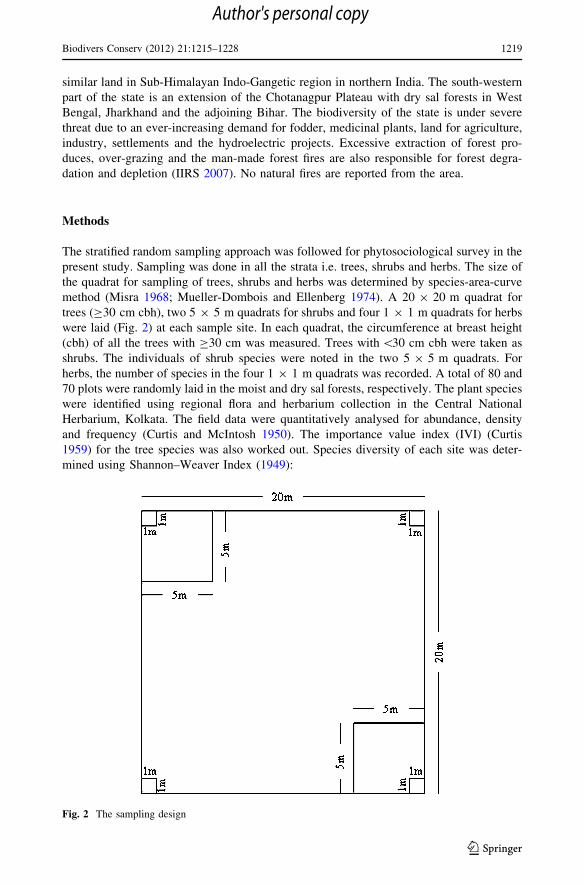
method (Misra 1968; Mueller-Dombois and Ellenberg 1974). A 20 9 20 m quadrat for
trees (C30 cm cbh), two 5 9 5 m quadrats for shrubs and four 1 9 1 m quadrats for herbs
were laid (Fig. 2) at each sample site. In each quadrat, the circumference at breast height
(cbh) of all the trees with C30 cm was measured. Trees with \30 cm cbh were taken as
shrubs. The individuals of shrub species were noted in the two 5 9 5 m quadrats. For
herbs, the number of species in the four 1 9 1 m quadrats was recorded. A total of 80 and
70 plots were randomly laid in the moist and dry sal forests, respectively. The plant species
were identified using regional flora and herbarium collection in the Central National
Herbarium, Kolkata. The field data were quantitatively analysed for abundance, density
and frequency (Curtis and McIntosh 1950). The importance value index (IVI) (Curtis
1959) for the tree species was also worked out. Species diversity of each site was deter-
mined using Shannon–Weaver Index (1949):
Fig. 2 The sampling design
Biodivers Conserv (2012) 21:1215–1228 1219
123
Author's personal copy

H ¼ �X
ni=Nð Þ logn ni=Nð Þ½ � ð1Þ
where, ni is the total number of individuals of species i and N is the total number of
individuals of all species in that stand; log implies to natural log.
The concentration of dominance (Cd), known as Simpson index, was measured
according to Simpson (1949):
Index of dominance ðCdÞ ¼X
ni�N2
� �ð2Þ
The equitability or evenness (e) refers to the degree of relative dominance of each
species in that area. It was calculated according to Pielou (1966) as:
Equitability eð Þ ¼ �H=log S ð3Þ
where H̄ = Shannon–Weaver index and S = number of species.
A t-test was run using independent variables viz., species richness, basal area and stand
density from two sal forest types. The canonical correspondence analysis (CCA) was also
carried out to work out the differences in the two sal forests using same parameters.
Results
The study revealed interesting information on the diversity and community structure in
moist and dry sal forests of West Bengal.
Species richness, diversity, evenness and dominance
Dry sal forest showed poor representation of trees, shrubs and herbs compared to moist sal
forests. In dry sal forest 35 tree, 41 shrub and 96 herb species were encountered, while 134
tree, 113 shrub and 230 herb species were recorded in moist sal forests. Shannon–Weaver
index of diversity also showed higher values in moist sal than in dry sal forests. Higher tree
diversity (3.10) was observed in moist sal forests. In both the forests, herb diversity was
found to be higher than trees and shrubs. The same pattern was noticed in evenness index.
The trees in the moist sal forest showed higher evenness (0.59) than in dry sal forest (0.17).
The dominance of trees in both the forests was higher for trees than for shrubs and herbs.
Tree species had highest dominance (0.81) in dry sal forests (Table 1).
Taxonomic diversity
The 134 tree species, found in moist sal forest, belonged to 44 families and 82 genera.
Meliaceae was the dominant family (14 spp.), followed by Mimosaceae (9 spp.) and
Euphorbiaceae (9 spp.). In addition to that, 113 species of shrubs belonging to 88 genera
and 39 families, and 230 species of herbs representing 170 genera and 56 families were
recorded in the moist sal forest. Among the tree species, Combretaceae was found to be the
dominant family representing 4 species, followed by Flacourtiaceae (3 spp.) and Ana-
cardiaceae (3 spp.). Among the shrubs, the dominant families were Euphorbiaceae (6 spp.),
Rubiaceae (5 spp.) and Combretaceae (3 spp.). Asteraceae (7 spp.), Papilionaceae (7 spp.)
and Acanthaceae (6 spp.) were found to be the dominant families among herbs in dry sal
forests. Papilionaceae with 15 species and Asteraceae with 23 species were the dominant
families representing shrubs and herbs, respectively in the moist sal forest.
1220 Biodivers Conserv (2012) 21:1215–1228
123
Author's personal copy

The co-dominant shrub families were Euphorbiaceae (10 spp.) and Rubiaceae (10 spp.) and
for herbs it were Poaceae (18 spp.) and Papilionaceae (14 spp.). In dry sal forests, 35 tree
species representing 31 genera and 19 families, 41 species of shrubs belonging to 38 genera
and 18 families and 96 herb species representing 83 genera and 38 families were recorded.
Density, basal area and importance value
The stand density (stems ha-1) was observed to be higher in dry sal (1,006) compared to
moist sal forests (438) but the trees were represented by higher basal area in moist sal
(56.52 m2ha-1) than in the dry sal forests (19.62 m2ha-1). The S. robusta had highest IVI
(150.31), followed by Schima wallichii (18.44) and Terminalia bellirica (10.12) in moist
sal forests. In dry sal forest the S. robusta had an IVI value of 221.78. Other associates
were Buchanania lanzan (10.85) and Madhuca longifolia var. latifolia (10.31). Clero-dendrum viscosum (43.47), Coffea benghalensis (28.24) and Eupatorium odoratum (20.44)
were the dominant shrub species in moist sal while Holarrhena pubescens (48.21), Fla-courtia indica (23.74) and Combretum decandrum (16.42) were dominants in dry sal
forest. Among the herbs, Oplismenus burmanii (15.19), Peperomia pellucida (9.22) and
Clerodendrum viscosum (8.45) were found to be the dominant species in moist sal.
Hemidesmus indicus (22.42) and Oxalis corniculata (9.46) were the dominant species in
dry sal forest (Fig. 3).
Stand density and forest structure
Tree species richness and stem density across girth classes in both the forest types
decreased from the smallest to largest trees, while the occurrence rate of species increased
with tree size class (Table 2). The same trend was observed by Mani and Parthasarathy
(2006) in tropical dry evergreen forests of peninsular India. The species occurrence rate of
almost all the girth classes was higher in moist sal than in dry sal. In the 150–180 and
210–240 cm girth classes, the species occurrence rate was found to be slightly higher in
dry sal forests. Tree size class distribution of both the categories of forests followed a
reverse J-pattern (Fig. 4). In dry sal forest, the mean tree density in the lower girth classes
i.e. 30–60 and 60–90 cm was found to be higher than the moist sal forests. In the lowest
girth class, i.e. 30–60 cm, the stem density in dry sal was almost five times more than the
moist sal forests, indicating disturbance. The mean basal area (12.07 m2ha-1) contribution
Table 1 Summary of the species inventory in moist and dry sal forests
Variable Moist sal Dry sal
Tree Shrub Herb Tree Shrub Herb
Species richness (No. of spp.) 134 113 230 35 41 96
Number of genera 82 88 170 31 38 83
Number of families 44 39 56 19 18 38
Basal area (m2/ha) 56.52 – – 19.62 – –
Stand density (stems/ha) 438 – – 1,006 – –
Shannon–Weaver’s index 3.10 3.08 4.36 0.62 2.80 3.40
Simpson’s index 0.18 0.12 0.03 0.81 0.10 0.07
Pileou’s index 0.59 0.65 0.80 0.17 0.75 0.74
Biodivers Conserv (2012) 21:1215–1228 1221
123
Author's personal copy

in the lowest girth class was higher than the other girth classes in dry sal, whereas in moist
sal, the mean basal area was found to be highest (10.44 m2ha-1) in the middle girth class
i.e. 210–240 cm. Except for the lower girth classes, mean basal area in all the intermediate
and higher girth classes was represented by higher values in moist sal than dry sal forests.
The t-test showed that species richness, basal area and stand density differ significantly at
95% confidence level in both the forest types (p = \0.05). The canonical correspondence
analysis (CCA) indicated very low overall match (canonical correlation value = 0.40)
between two sets of variables from moist and dry sal types. Figure 5 shows the canonical
correlation between two sets of variables from moist and dry sal forests.
Fig. 3 Ten dominant species of trees, shrubs and herbs in moist and dry sal forests
1222 Biodivers Conserv (2012) 21:1215–1228
123
Author's personal copy

Discussion and conclusions
The study indicated that there are considerable differences between moist and dry sal
forests of West Bengal in terms of diversity, composition, and the stand structure. The
differences could be attributed chiefly to variations in the climatic conditions (especially
the rainfall), biotic interference and the management practices. According to Beard (1955),
the annual rainfall and edaphic factors are responsible for the differences in forest structure
among various tropical forest formations. As mentioned earlier, the sal forest in northern
West Bengal is markedly different from the sal forest in south-western West Bengal and its
counterparts in central Himalaya and elsewhere in India. The proportion of sal in the moist
forest in northern West Bengal is lesser than other sal forests in India. Being evergreen is a
characteristic feature of northern West Bengal sal forest. Although foliage is markedly thin
during summer; simultaneous leaf flushing never renders the canopy totally leafless during
summer. The floristic composition indicates the presence of many evergreen species in
moist sal forest of north Bengal. The dry sal forests, on the other hand, experience a long
dry spell when leaves are shed and thus the forest floor becomes dry and hot during
summer. It is the duration of dry period, rainfall and the humidity that influences the
floristic composition in both the forest types. This was also observed in the dry deciduous
forests of Western Ghats by Sukumar et al. (1992), Murali et al. (1996) and Uma Shankar
et al. (1998b).
The present study highlights that the moist sal is fairly rich in species number in all the
strata (trees, shrubs and herbs). The number of tree species in moist sal (134) is four times
more than that of dry sal forests (35) of south-west Bengal. The overall species richness in
moist sal forest in northern West Bengal is even greater than the sal forests in central
Himalaya (Singh and Singh 1992) and central India (Jha and Singh 1990; Prasad and
Pandey 1992) and deciduous forests of the Western Ghats (Sukumar et al. 1992; Murali
et al. 1996; Sukumar et al. 1998; Sundarapandian and Swamy 1997; Uma Shankar et al.
1998a; Ghate et al. 1998) and Eastern Ghats (Reddy et al. 2007; Sahu et al. 2007).
Table 2 Mean tree species richness and density (ha-1), occurrence rate of species in moist and dry salforests
Girthclass(cm)
Moist sal Dry sal
Mean speciesrichness ± SD(ha-1)
Mean stemdensity ± SD(ha-1)
Speciesoccurrencerate (speciesrichness/stemdensity)
Mean speciesrichness ± SD(ha-1)
Mean stemdensity ± SD(ha-1)
Speciesoccurrencerate (speciesrichness/stemdensity)
30–60 94.53 ± 3.26 181.25 ± 7.94 0.52 66.67 ± 1.68 883.80 ± 17.24 0.08
60–90 41.80 ± 1.61 67.97 ± 3.59 0.61 27.78 ± 1.37 95.83 ± 4.97 0.29
90–120 25.00 ± 1.11 38.28 ± 1.66 0.65 7.87 ± 0.89 15.28 ± 1.76 0.52
120–150 23.44 ± 0.97 32.81 ± 1.52 0.71 4.17 ± 0.80 7.41 ± 1.46 0.56
150–180 21.88 ± 0.86 33.20 ± 1.54 0.66 1.85 ± 0.33 2.78 ± 0.50 0.67
180–210 16.41 ± 0.65 28.52 ± 1.83 0.58 0.46 ± 0.14 – –
210–240 17.19 ± 0.73 26.17 ± 1.17 0.66 0.46 ± 0.14 0.46 ± 0.14 1.00
240–270 10.94 ± 0.61 15.23 ± 0.94 0.72 – – –
270–300 6.64 ± 0.57 7.81 ± 0.71 0.85 – – -
300–330 3.13 ± 0.33 4.30 ± 0.46 0.73 – – –
[330 2.34 ± 0.29 2.34 ± 0.34 1.00 0.46 ± 0.14 0.46 ± 0.14 1.00
Biodivers Conserv (2012) 21:1215–1228 1223
123
Author's personal copy

Supplementary Table S1 facilitates comparison of the moist and dry ends of the ecological
gradient with the sal dominated deciduous forests of India. Shannon–Weaver’s index of
diversity was also found to be higher in moist than in the dry sal forests. The index value of
3.10 for trees was slightly lower than the sal dominated forests (3.59) in the eastern
Himalayan lowlands of the Mahananda Sanctuary, Darjeeling (Uma Shankar 2001). But it
was found to be on the higher side of values (1.98–3.53) recorded for the old sal plantations
in Gorakhpur (Pandey and Shukla 1999). Species diversity is an important attribute of a
natural community that influences functioning of an ecosystem (Hengeveld 1996). High
species content per unit area is largely due to the presence of synusiae in the forest
(Richards 1996). Greater diversity leads to higher community stability (MacArthur 1955).
The neotropical deciduous forests are dominated by the family Leguminosae followed by
Bignoniaceae (Gentry 1995), whereas Leguminosae is the prominent family in Indian
0
20
40
60
80
100
120
140
160
180
200
30-60 60-90 90-120 120-150 150-180 180-210 210-240 240-270 270-300 300-330 >3300
2
4
6
8
10
12
0
100
200
300
400
500
600
700
800
900
1000
30-60 60-90 90-120 120-150 150-180 180-210 210-240 240-270 270-300 300-330 >3300
2
4
6
8
10
12
14
(a) Moist Sal
(b) Dry Sal
Bas
al a
rea
(m2 ha
-1)
Tre
e de
nsity
(st
ems
ha-1
)
Girth class (cm)
Tre
e de
nsity
(st
ems
ha-1
)
Bas
al a
rea
(m2 ha
-1)
Fig. 4 Stand structure based on the tree density (solid line) and basal area (dotted line) in moist and dry salforests
1224 Biodivers Conserv (2012) 21:1215–1228
123
Author's personal copy

deciduous forests (Sukumar et al. 1992; Murali et al. 1996; Uma Shankar et al. 1998a). In
the present study also the Papilionaceae was found to be the dominant family in both moist
and the dry sal forests, followed by Euphorbiaceae, Asteraceae and the Rubiaceae. So far as
tree species are concerned, the dominant family is Meliaceae followed by Euphorbiaceae,
Mimosaceae and Lauraceae in the moist sal forests. Almost same trend was observed in sal
dominated forests of Mahananda Sanctuary, Darjeeling by Uma Shankar (2001), where
Euphorbiaceae stands first followed by Lauraceae and Meliaceae. The moist sal forest was
characterized by the presence of more tree species (134 species) compared to 76 species in
the sal forests of Mahananda Sanctuary (Uma Shankar 2001). In the dry sal forest of south-
west Bengal, 35 tree species were recorded. In Siwalik sal forest of central Himalaya, Singh
and Singh (1992) recorded only 13 tree species- 5 in the outgrowth sal forest and 8 in the
coppice sal forests. In 24 stands of Gorakhpur old sal plantations 29 tree species were found
and most of them were shrub form (Pandey and Shukla 1999) indicating high disturbance.
A basal area of 56.52 m2 ha-1 in moist sal is higher than the one observed by Uma
Shankar (2001) in sal-dominated forest in the eastern Himalayan lowland (26.3 m2ha-1).
The basal area in dry sal forests (19.62 m2ha-1) falls within the range compiled for the dry
tropical forests by Murphy and Lugo (1986). The stand density (stems ha-1) was observed
to be higher in dry sal forests (1,006) than in moist sal forest (438). The stand density of 438
stems ha-1 in the moist sal forest in the present study is close to 484 stems ha-1 recorded for
sal forests in Himalayan lowland by Uma Shankar (2001). Pande (1999) recorded high stand
density in the sal forests of central Himalaya, which is more than the dry sal forests (1,006
stems ha-1) of studied by us. Understanding the forest structure is a pre-requisite to describe
various ecological processes and also to model the functioning and dynamics of forest
(Elouard et al. 1997). The tree density in different size classes showed a reverse J-shaped
pattern in both moist and dry sal forests, which suggests that it is climax or stable forest
(Mishra et al. 2005). High tree density in lower girth class could be attributed to the repeated
disturbance, rapid colonization and turnover of gaps in the forest (Whitmore 1975).
Sal forest in the northern West Bengal are mostly restricted to the protected areas viz.,
Mahananda Wildlife Sanctuary, Gorumara National Park, Jaldapara Wildlife Sanctuary,
Fig. 5 Canonical correlation between two sets of variables from moist and dry sal forests
Biodivers Conserv (2012) 21:1215–1228 1225
123
Author's personal copy

Buxa Wildlife Sanctuary, Buxa National Park, Buxa Tiger Reserve and several reserve
forests. The Wildlife (Protection) Act 1972 of India prohibits any kind of extraction from
protected areas and thus, moist sal is better protected than dry sal. This together with high
rainfall is responsible for the significant difference in the plant diversity and the com-
munity structure in the two sal forests in West Bengal. Vast tracts of forests in the
Himalayan lowland as well as in the south-western part have been cleared in past for
agriculture, human settlements and other developmental activities. Besides, sizeable for-
ested land has also been diverted for tea plantation in the early part of 20th century and
forest plantations through taungya. The ever-increasing anthropogenic pressure continues
to degrade the natural forest patches both in northern and south-western West Bengal in
spite of the stringent forest laws and rigorous conservation and the management policy.
The analysis reveals that the moist sal forest is extremely important ecosystem by virtue of
high species diversity. The same in the dry sal forest is low due to drier climate and high
disturbance. As evident from the present study, the dry sal forests in West Bengal need
protection for recovery. In fact, some of the patches, which are adequately protected, have
shown good regeneration.
Both temperature and the rainfall in eastern Himalaya including the study area are
projected to undergo considerable upward change under B2 and A2 climate change sce-
narios, and sal forests are expected to undergo significant changes (Ravindranath et al.
2006). As per the projection, the dry sal forest in the eastern part of central India including
south-west part of the West Bengal would receive an increased mean annual rainfall of
348.3 mm by 2085 (B2 scenario) from current mean annual rainfall of 1,435 mm. An
increase of 2.7�C in the mean annual temperature from current mean annual temperature of
24.6�C is expected during same period. A similar scenario of increased rainfall and tem-
perature is projected for entire eastern Himalayan region of India including sub-Himalayan
moist sal forest of northern West Bengal. A warmer and wetter climate is also expected to
result in increased net primary production by an average of 30.3 per cent by 2035 and by
56.2 per cent by 2085 over India (A1B scenario) and the eastern Himalaya is expected to
have higher productivity than average of India (Gopalalkrishnan et al. 2011). Such a
climate would also enhance biodiversity in both types of sal forests in the study area.
Acknowledgments The authors are thankful to Dr. P.S. Roy, Director, Indian Institute of Remote Sensing,Dehradun for encouragement and the support throughout this study. The authors wish to acknowledge thefinancial support for this study from Department of Biotechnology and the Department of Space, Gov-ernment of India. Grateful thanks are due to Dr. P.K. Hajra, former Director, Botanical Survey of India forspecies identification and nomenclature as also to Central National Herbarium, Botanical Survey of India,Kolkata for species identification. Thanks are also due to Dr. A.K. Raha, Principal Chief Conservator ofForests, Government of West Bengal and the officers and staff of West Bengal Forest Department forproviding field support.
References
Beard JS (1955) The classification of tropical American vegetation types. Ecol 36:89–100Bor NL (1953) Manual of Indian forest botany. Oxford University Press, BombayBorchert R (2000) Organismic and environmental controls of bud growth in tropical trees. In: Viemont JD,
Crabbe J (eds) Dormancy in plants: from whole plant behavior to cellular control. CAB International,Wallingford, pp 87–107
Braun-Blanquet J (1965) Plant sociology: the study of plant communities. Hafner, LondonCampbell DG (1994) Scale and patterns of community structure in Amazonian forests. In: Edwards PJ, May
RM, Webb NR (eds) Larger-scale ecology and conservation biology. Blackwell, OxfordChakravarty P, Chakravarty S (1957) Soils of West Bengal. Report. Agricultural Research Institute, Kolkata,
pp 93–101
1226 Biodivers Conserv (2012) 21:1215–1228
123
Author's personal copy

Champion HG, Seth SK (1968) A revised survey of the forest types of India. Manager of Publications, NewDelhi
Chauhan DS, Dhanai CS, Singh B, Chauhan S, Todaria NP, Khalid MA (2008) Regeneration and treediversity in natural and planted forests in a Terai-Bhabhar forest in Katarniaghat Wildlife Sanctuary.India Trop Ecol 49(1):53–67
Cooke T (1958) Flora of Bombay, vol I. Botanical Survey of India, CalcuttaCurrie DJ (1991) Energy and large-scale patterns of animal and plant-species richness. Am Nat
137(1):27–49Curtis JT (1959) The vegetation of Wisconsin: an ordination of plant communities. University of Wisconsin
Press, MadisonCurtis JT, McIntosh RP (1950) The interrelations of certain analytic and synthetic phytosociological
characters. Ecol 31:434–455Elouard C, Pascal JP, Pelissier R, Ramesh BR, Houllier F, Durand M, Aravajy S, Moravie MA, Gimaret-
Carpentier C (1997) Monitoring the structure and dynamics of a dense moist evergreen forest in theWestern Ghats (Kodagu district, Karnataka, India). Trop Ecol 38:193–214
Gentry AH (1995) Diversity and floristic composition of neotropical dry forests. In: Bullock SH, MooneyHA, Medina E (eds) Seasonally dry tropical forests. Cambridge University Press, Cambridge
Ghate U, Joshi NV, Gadgil M (1998) On the patterns of tree diversity in the Western Ghats of India. Curr Sci75(6):594–603
Gopalalkrishnan R, Jayaraman M, Bala G, Ravindranath NH (2011) Climate change and Indian forests. CurrSci 101(3):348–355
Gupta OP, Shukla RP (1991) The composition and dynamics of associated plant communities of salplantations. Trop Ecol 32:296–309
Hengeveld R (1996) Measuring ecological biodiversity. Biodivers Lett 3:58–65Hubbell SP, Foster RB (1992) Short-term dynamics of a neotropical forest: why ecological research matters
to tropical conservation and management. Oikos 63:48–61IIRS (2002) Biodiversity characterization at landscape level in western Himalayas using satellite remote
sensing and geographic information system. Indian Institute of Remote Sensing, DehradunIIRS (2007) Biodiversity characterization at landscape level in central India and West Bengal using satellite
remote sensing and geographic information system. Indian Institute of Remote Sensing, DehradunJacquemyn H, Butaye J, Hermy M (2003) Influence of environmental and spatial variables on regional
distribution of forest plant species in a fragmented and changing landscape. Ecogr 26:768–776Jha CS, Singh JS (1990) Composition and dynamics of dry tropical forest in relation to soil texture. J Veg
Sci 1(5):609–614Joshi HB (1980) The silviculture of Indian trees. Controller of Publications, New DelhiKeel S, Gentry AH, Spinzi L (1993) Using vegetation analysis to facilitate the selection of conservation sites
in Eastern Paraguay. Conserv Biol 7:66–75Kirtikar KR, Basu BD (1975) Indian medicinal plants, vol I. Jayyed Press, New DelhiKrishnaswamy VS, Mathauda GS (1954) Phenological behaviour of a few forest spp. at New forest,
Dehradun. Indian For 80:3–4MacArthur RH (1955) Fluctuation of animal population, and a measure of community stability. Ecol
36:533–536Mani S, Parthasarathy N (2006) Tree diversity and stand structure in inland and coastal tropical dry
evergreen forests of peninsular India. Curr Sci 90(9):1238–1246Mishra BP, Tripathi OP, Laloo RC (2005) Community characteristics of a climax subtropical humid forest
of Meghalaya and population structure of ten important tree species. Trop Ecol 46(2):241–251Misra R (1968) Ecology work book. Oxford and IBH Publishing Co Pvt Ltd, New DelhiMueller-Dombois D, Ellenberg H (1974) Aims and methods of vegetation ecology. Wiley, New YorkMurali KS, Shankar Uma, Uma Shaanker R, Ganeshaiah KN, Bawa KS (1996) Extraction of forest products
in the forests of Biligiri Rangan Hills. India Econ Bot 50(3):252–269Murphy PG, Lugo AE (1986) Ecology of tropical dry forest. Ann Rev Ecol Evol Syst 17:67–88NRSA (2002) Biodiversity characterization at landscape level in Western Ghats India using satellite remote
sensing and geographic information system. National Remote Sensing Agency, HyderabadNRSA (2007) Biodiversity characterization at landscape level in Eastern Ghats and east coast using satellite
remote sensing and geographic information system. National Remote Sensing Agency, HyderabadPande PK (1999) Comparative vegetation analysis and sal (Shorea robusta) regeneration in relation to their
disturbance magnitude in some sal forests. Trop Ecol 40:51–61Pandey SK, Shukla RP (1999) Plant diversity and community patterns along the disturbance gradient in
plantation forests of sal (Shorea robusta Gaertn). Curr Sci 77:814–818
Biodivers Conserv (2012) 21:1215–1228 1227
123
Author's personal copy

Pandey SK, Shukla RP (2005) Plant community and diversity patterns within the forested landscape ofnorth-western U.P. Indian For 131(9):1217–1226
Pielou EC (1966) The measurement of diversity in different types of biological collections. J Theor Biol13:131–144
Prasad R, Pandey RK (1992) An observation on plant diversity of sal and teak forests in relation to intensityof biotic impact at various distances from habitation in Madhya Pradesh: a case study. Trop Ecol8(1):62–83
Rana BS, Singh SP, Singh RP (1988) Biomass and productivity of central Himalayan sal (Shorea robusta)forest. Trop Ecol 29:1–7
Ravindranath NH, Joshi NV, Sukumar R, Saxena A (2006) Impact of climate change on forests in India.Curr Sci 90(3):354–361
Rawat GS, Bhainsora NS (1999) Woody vegetation of Shivaliks and outer Himalaya in north-western India.Trop Ecol 40:119–128
Reddy CS, Pattanaik C, Mohapatra A, Biswal AK (2007) Phytosociological observations on tree diversity oftropical forest of Similipal Biosphere Reserve, Orissa, India. Taiwania 52(4):352–359
Richards PW (1996) The tropical rain forest: an ecological study, 2nd edn. Cambridge University Press,London
Sahu SC, Dhal NK, Reddy CS, Pattanaik C, Brahmam M (2007) Phytosociological study of tropical drydeciduous forest of Boudh district, Orissa, India. Res J For 1(2):66–72
Samanta S, Pal DK, Lohar D, Pal B (2011) Modeling of temperature and rainfall of West Bengal throughremote sensing and GIS techniques. Int J Geoinform 7(2):31–40
Satya Upreti DK, Nayaka S (2005) Shorea robusta—an excellent host tree for lichen growth in India. CurrSci 89(4):594–595
Schall JJ, Pinaka ER (1978) Geographical trends in numbers of species. Sci 201:679–686Shannon CE, Weaver W (1949) The mathematical theory of communication. Urbana University Press,
IllinoisShukla RP (2009) Patterns of plant species diversity across Terai landscape in north-eastern Uttar Pradesh,
India. Trop Ecol 50(1):111–123Shukla RP, Pandey SK (2000) Plant diversity and community features of the forested landscape adjacent to
foot-hills of Central Himalayas. In: Tiwari SC, Dabral PP (eds) Natural Resources, Conservation andManagement for Mountain Development. International Book Distributors, Dehradun, pp 15–37
Simpson EH (1949) Measurement of diversity. Nat 163:688Singh JS, Singh SP (1992) Forests of Himalaya. Gyanodaya Prakashan, NainitalSingh A, Reddy VS, Singh JS (1995) Analysis of woody vegetation of Corbett National Park, India. Veg
120:69–79Sukumar R, Dattaraja HS, Suresh HS, Radhakrishnan J, Vasudeva R, Nirmala S, Joshi NV (1992) Long-
term monitoring of vegetation in a tropical deciduous forest in Mudumalai, southern India. Curr Sci62(9):608–616
Sukumar R, Suresh HS, Dattaraja HS, Joshi NV (1998) Dynamics of a tropical deciduous forest: Populationchanges (1988 through 1993) in a 50-hectare plot at Mudumalai, southern India. In: Dallmeier F,Comiskey JA (eds) Forest Biodiversity Research, Monitoring and Modeling: Conceptual Backgroundand Old world Case Studies, vol I. Parthenon Publishing, pp 529-540
Sundarapandian SM, Swamy PS (1997) Plant biodiversity at low-elevation evergreen and moist deciduousforests at Kodayar (Western Ghats, India). Int J Ecol Environ Sci 23(4):363–379
Tiwari DN (1995) A monograph on sal (Shorea robusta Gaertn.f.). Vedams eBooks (P) Ltd, New DelhiTroup RS (1921) The silviculture of Indian trees, vol I. Clarendon Press, OxfordUma Shankar (2001) A case of high tree diversity in a sal (Shorea robusta)—dominated lowland forest of
eastern Himalaya: floristic composition, regeneration and conservation. Curr Sci 81(7):776–786Uma Shankar, Lama SD, Bawa KS (1998a) Ecosystem reconstruction through ‘taungya’ plantations fol-
lowing commercial logging of a dry, mixed deciduous forest in Darjeeling Himalaya. For Ecol Manag102:131–142
Uma Shankar, Murali KS, Uma Shaanker R, Ganeshaiah KN, Bawa KS (1998b) Extraction of non-timberforest products in the forests of Biligiri Rangan Hills, India. 4. Impact on floristic diversity andpopulation structure in a thorn scrub forest. Econ Bot 52:302–315
Whitmore TC (1975) Tropical rain forest of far east. Oxford University Press, OxfordWorldClim–Global Climate Data (2005). http://www.worldclim.org. Cited 18 Sept 2011Wright DH (1983) Species-energy theory: an extension of species-area theory. Oikos 41:496–506
1228 Biodivers Conserv (2012) 21:1215–1228
123
Author's personal copy


![Synthesis, characterization and X-ray crystal structures of [Ni(Me-sal) 2dpt] and [Ni(Me-sal)dpt]Cl](https://static.fdokumen.com/doc/165x107/63171c928ebcb731770b81b7/synthesis-characterization-and-x-ray-crystal-structures-of-nime-sal-2dpt-and.jpg)